This report was researched and written by economists Shamubeel Eaqub and Rosie Collins.
The consumer perceptions of the construction industry survey was conducted by Primary Purpose and the summary report is available in PDF format on request.
The New Zealand Chinese Building Industry Association(NZCBIA) is a non-profit professional organisation. The Association represents a wide range of businesses and professionals in the building industry in New Zealand including the Kiwi business and professionals that have close working relationship with the Chinese building industry.
FOR FURTHER INFORMATION ON NZCBIA
Visit: www.nzcbia.org.nz
Email: info@nzcbia.org.nz
CITATION & LICENCE
This report may be cited as Eaqub S. & Collis R (2024). New Zealand’s Building Construction Sector: 2024. NZCBIA
This report is licensed under a Creative Commons Attribution-NoncommercialSharealike
4.0 International License.
CONTACT
All contact regarding this report can be made via:
Email: info@multimarketing.co.nz
Wechat:


I am grateful to NZCBIA for the leadership they display within our building sector, including through this important report. The Association is guiding many discussions about how we can build better in New Zealand and its membership represents the prominent Chinese-Kiwi element of our industry.
From the perspective of government, three areas of the report hold particular interest.
First, it has some fascinating insights about the size of building sector. Understanding just how much is at stake, including the proportion of our economy directly employed, makes reform of the system an urgent proposition.
The second area I would particularly recommend relates to consumer insight. Policy makers and practitioners in the building sector should feel confronted by ordinary Kiwis’ experiences, as shared in this report.

The third and final area of challenge relates to the labour market. Clearly there are huge opportunity costs for NZ Inc in failing to engage more societal groups with the exciting task of building our nation.
I congratulate NZCBIA for their vision in commissioning such high quality research and writing. The report should inform and inspire everyone wanting to create a better built environment in which Kiwis can live, work and play.
Best wishes

– CHRIS PENK, MP Minister of Building and Construction August 2024


I have the privilege of serving as the founding President of the New Zealand Chinese Building Industry Association (NZCBIA).
Ours is a close-knit community who build and develop properties with a passion for collaboration and sustainability and a strong commitment to social responsibility.
NZCBIA is a non-profit professional organisation that represents a wide range of businesses and professionals in the building, construction and property industry in New Zealand, including Kiwi business and professionals who have close working relationships in the New Zealand Chinese building and construction community.
NZCBIA has grown because the Chinese New Zealand companies involved in this industry are committed to learning from their experiences and helping each other get better at what they are most committed to – building better, safer communities in New Zealand.
A premier event initiated by NZCBIA is the New Zealand International Building Expo & Summit. This event is dedicated to fostering connections within one of the fastest-growing segments in our country – the New Zealand Chinese building, construction and property community. To be held in Auckland and Christchurch later this year, the programme involves a gala dinner and industry awards event on the back on a 2-day building, construction and property expo.
NZCBIA commissioned and funded this report along with some key sponsors, in particular BCITO and Brilliance Steel. We invested in this research because, in these challenging times, information and market intelligence is often one of the least appreciated but most important assets for our members, for companies and for all related industries.

Much of the information and data generated for this report has been possible because of the open mandate given to the author, Shamubeel Eaqub. The approach chosen means that much of the information is original, obtained from a wide range of statistical sources as well as interviews and surveys. The consumer research segment is the first time the views of New Zealand consumers have been sought for this sector. This alone is valuable because the information helps companies understand what’s important to consumers, which in turn identifies gaps and opportunities.
This report also contains some impressive numbers for the sector – $99.4 billion in annual sales, 306,000 people directly employed with total direct and indirect employment of 576,000, $70 billion spent annually on suppliers in New Zealand and $17.5 billion spent annually on wages. These are important numbers for the New Zealand economy and the people of New Zealand.
This is also not a one-off snapshot. NZCBIA’s plan, supported by our members and sponsors, is to produce this report on an annual basis. We also plan to update and refine key parts of the report to provide the wider industry with better and more detailed information to help them form their business strategies and market responses.
Thank you for your support and for the participation of the New Zealand Chinese Building Industry Association’s membership, programmes and projects. This all comes together to build a better, stronger sector for us all.
– FRANK XU President of New Zealand Chinese Building Industry Association
NZCBIA commissioned this independent report to better understand and articulate the role and key performance of the construction sector and opportunities for progress.
We surveyed New Zealanders to understand their perception of the construction sector. New Zealanders appreciate the importance of the sector, recognising its role in fixing our gaping shortages in housing and other infrastructure, but they are also concerned about costs, efficiency and timeliness –productivity.
We surveyed a select group of industry experts who also highlighted productivity as a major theme alongside boom-bust cycles and regulation not keeping up with changing needs of the sector and community.
Productivity is a long-standing issue afflicting every OECD country. While it may seem intractable, improving business systems and processes, investing in skills and adopting innovative technologies are possible ways to make progress. Not every approach requires government involvement – significant improvements can be made by businesses and sector bodies.
The industry is feeling the brunt of recession in 2024. As some businesses close and people lose their jobs, there will be a loss of capacity and capability that will take time to recover but cycles always turn. When this cycle turns, the need for more homes and infrastructure will still be there and we will want an industry that is fighting fit.
Ideas in this paper on improving productivity are perennial. Some will be harder than others to implement, but it is a handy checklist to work on over the coming years. Most importantly, there are actions firms can take on their own in three domains to improve their productivity:
Reduce ambiguity:
Firms can invest in contracting and planning processes that are better suited to their segment and risks. This may include alternative contracting strategies, upfront planning and scoping, efforts to support ease of business for other SMEs and more complete and firmed-up designs.
Streamline:
Firms can streamline processes internally and support collaborations across industry by encouraging transparency and making efforts to reduce informality, which can seem easier but lead to poor outcomes. This may include establishing internal training academies, making investments in standardisation of design and supply chain and inventory capabilities, moving to digitalised procurement processes and introducing rigorous integrated planning and collaborative performance management approaches. Firms can increase the number of direct workers and supervision on sites and deploy new technologies and materials such as wearables and AI.
Upskill:
Firms can upskill the current workforce by developing frontline training, ensuring knowledge retention and management within the firm, introducing e-enabled micro-training for frontline workers and running field and forum type trainings to support effective field-based and classroom learning.
306,000
576,000 $17.5b SPENT ANNUALLY ON SUPPLIERS IN NZ TOTAL ANNUAL SALES PEOPLE DIRECTLY EMPLOYED TOTAL JOBS SUPPORTED SPENT ANNUALLY ON WAGES
The building and construction industry is large and diverse
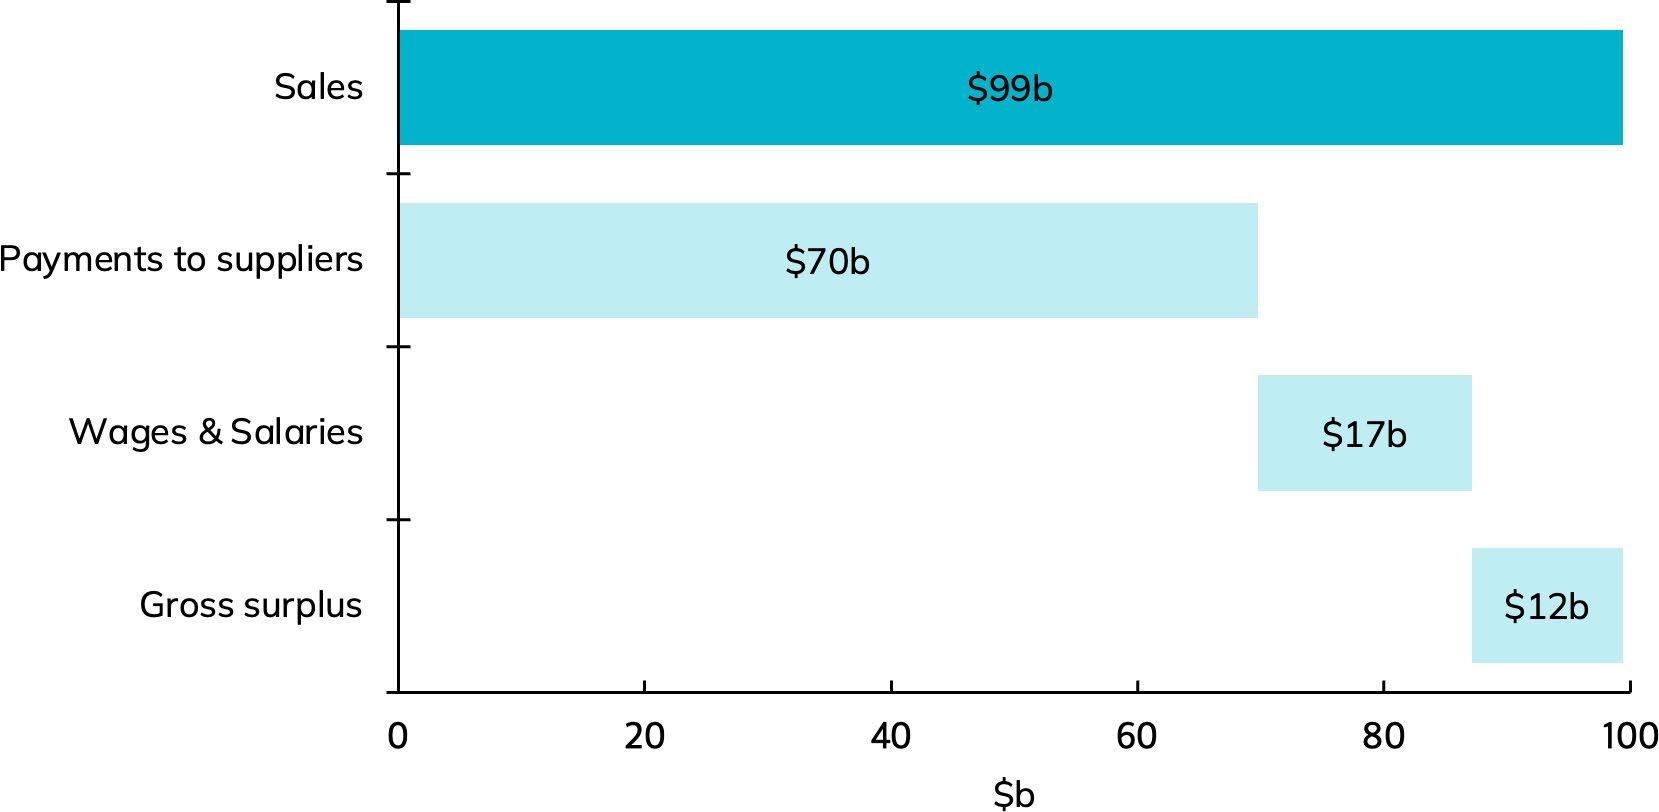
In the year to March 2024, sales by the sector totalled $99.4b. Revenue is a useful lens to understand how the sector affects the economy, as is understanding where that revenue is spent – the other side of ledger.
Figure 1 shows these key metrics:
• Revenue is predominantly spent on suppliers to the tune of $70b. That means $7 in $10 of sales are used to buy products and services from suppliers, sustaining a large pool of industries and workers. This is true of every industry, as no business is an island and each business operates in a web of interconnections with other businesses – for example, materials suppliers for key inputs or banks for financial services.
However, this is much higher than the economy-wide average where 52% of revenue is spent on materials and suppliers.
• The sector paid wages of $17.5b to its 306,000 workers who are employed in a diverse set of subindustries and specialisations – like concrete layers, glaziers, air-conditioning and ventilation installers and more.
The remaining $12.2b of gross profits were used to pay taxes, repay debt, fund reinvestment in businesses and distribute dividends to owners, including owner operators and shareholders. The sector has a lower profit margin than the economy as a whole – gross profits are 14% of sales compared to an economy average of 25%.
Source: Author estimates from Stats NZ source data
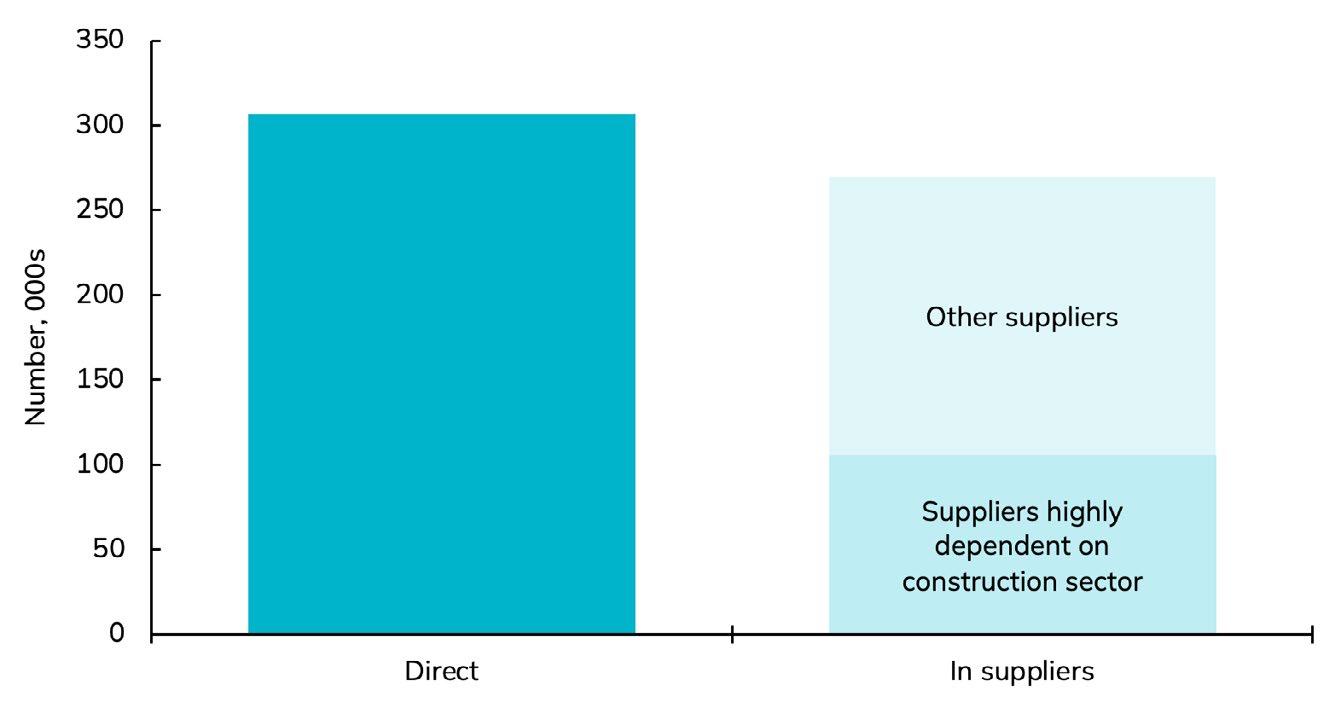
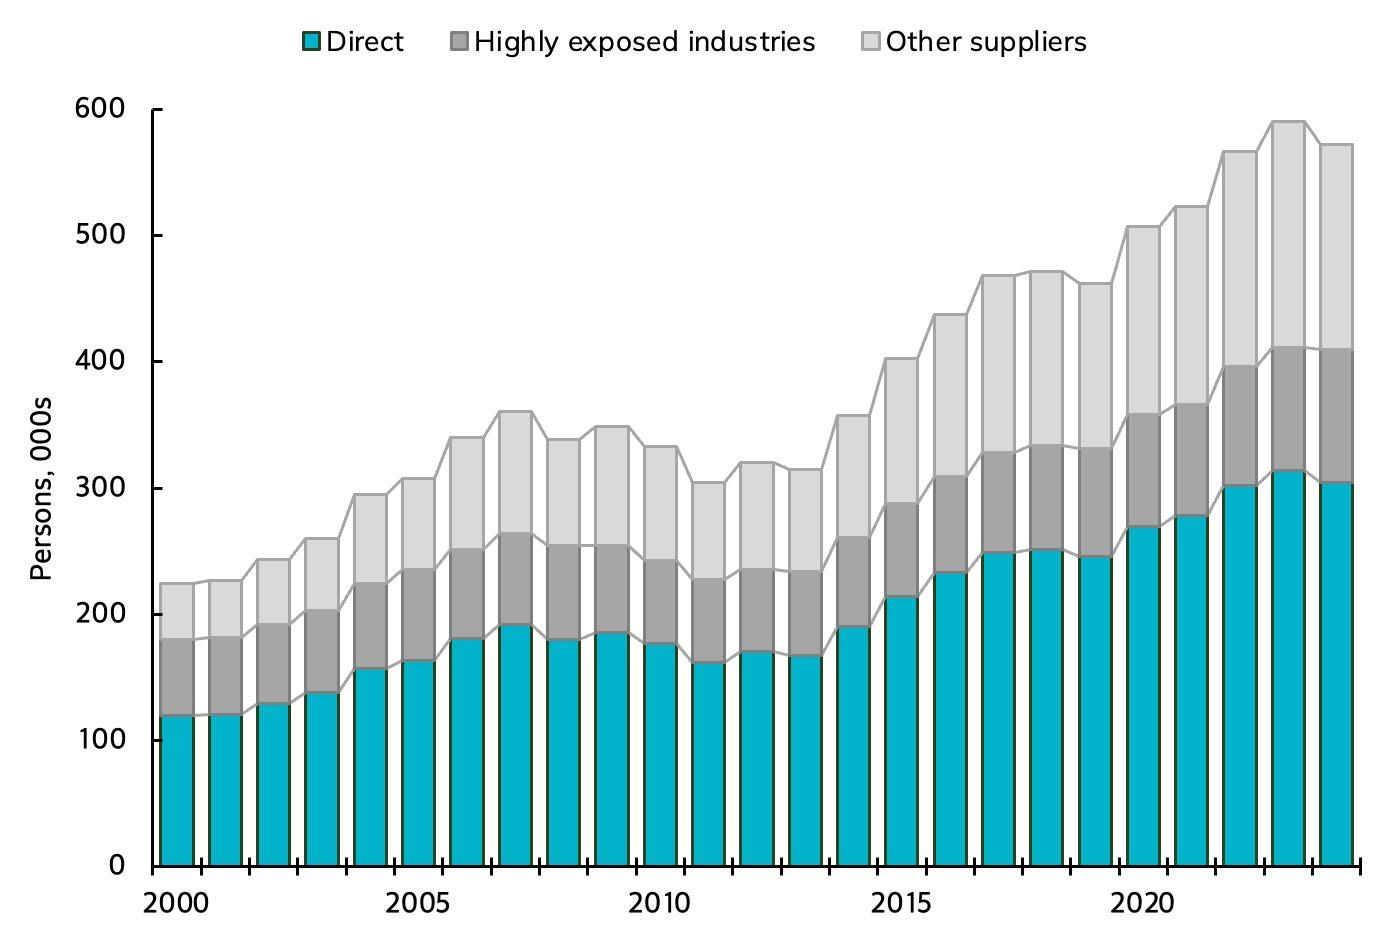
Sector revenue supports 576,000 jobs in the construction industry directly and its suppliers – 20% of 2.9 million jobs across New Zealand (Figure 2). The sector directly employed 306,600 people in the March 2024 year. Because it is such a large purchaser of materials and services, it also supported another 269,400 jobs across a range of suppliers.
Some suppliers are heavily reliant on the construction industry – for example, architects, quarries and aggregates, and wood products
(Figure 3), which account for 105,500 jobs. The other 163,900 jobs are supported in a much wider set of industries that supply to the construction sector but not as a large part of their total sales – for example, the banking and investment sector sells 3% of its products to the construction sector.
This does not count all the possible jobs that could be supported by the construction sector (which is done in multiplier analysis and regarded with some suspicion by serious thinkers). Rather, this only looks at how a dollar spent in the construction sector supports jobs in the economy directly in the construction industry and its suppliers.
Highly* construction reliant suppliers: jobs supported
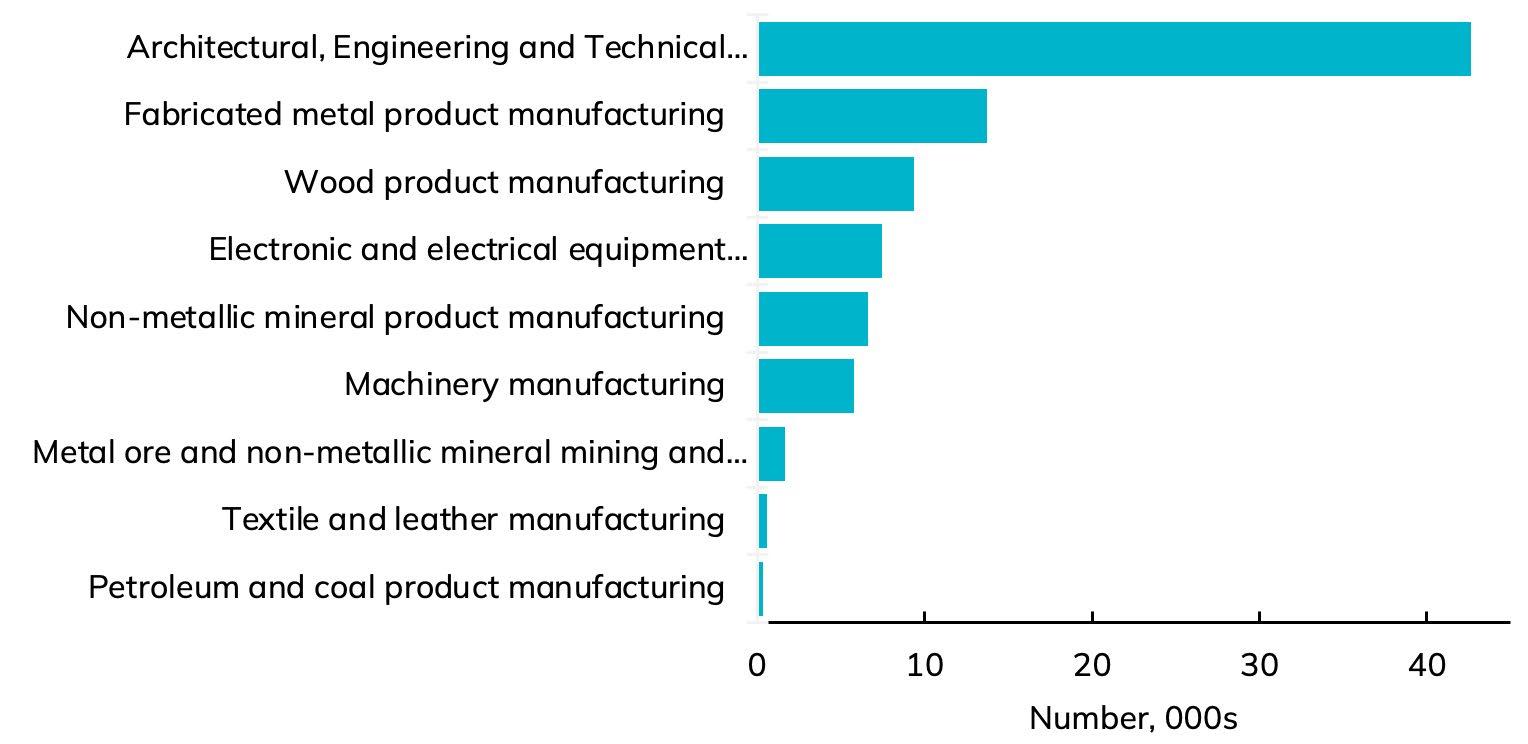
* Greater than 25% of sales to construction sector
Source: Author estimates from Stats NZ source data
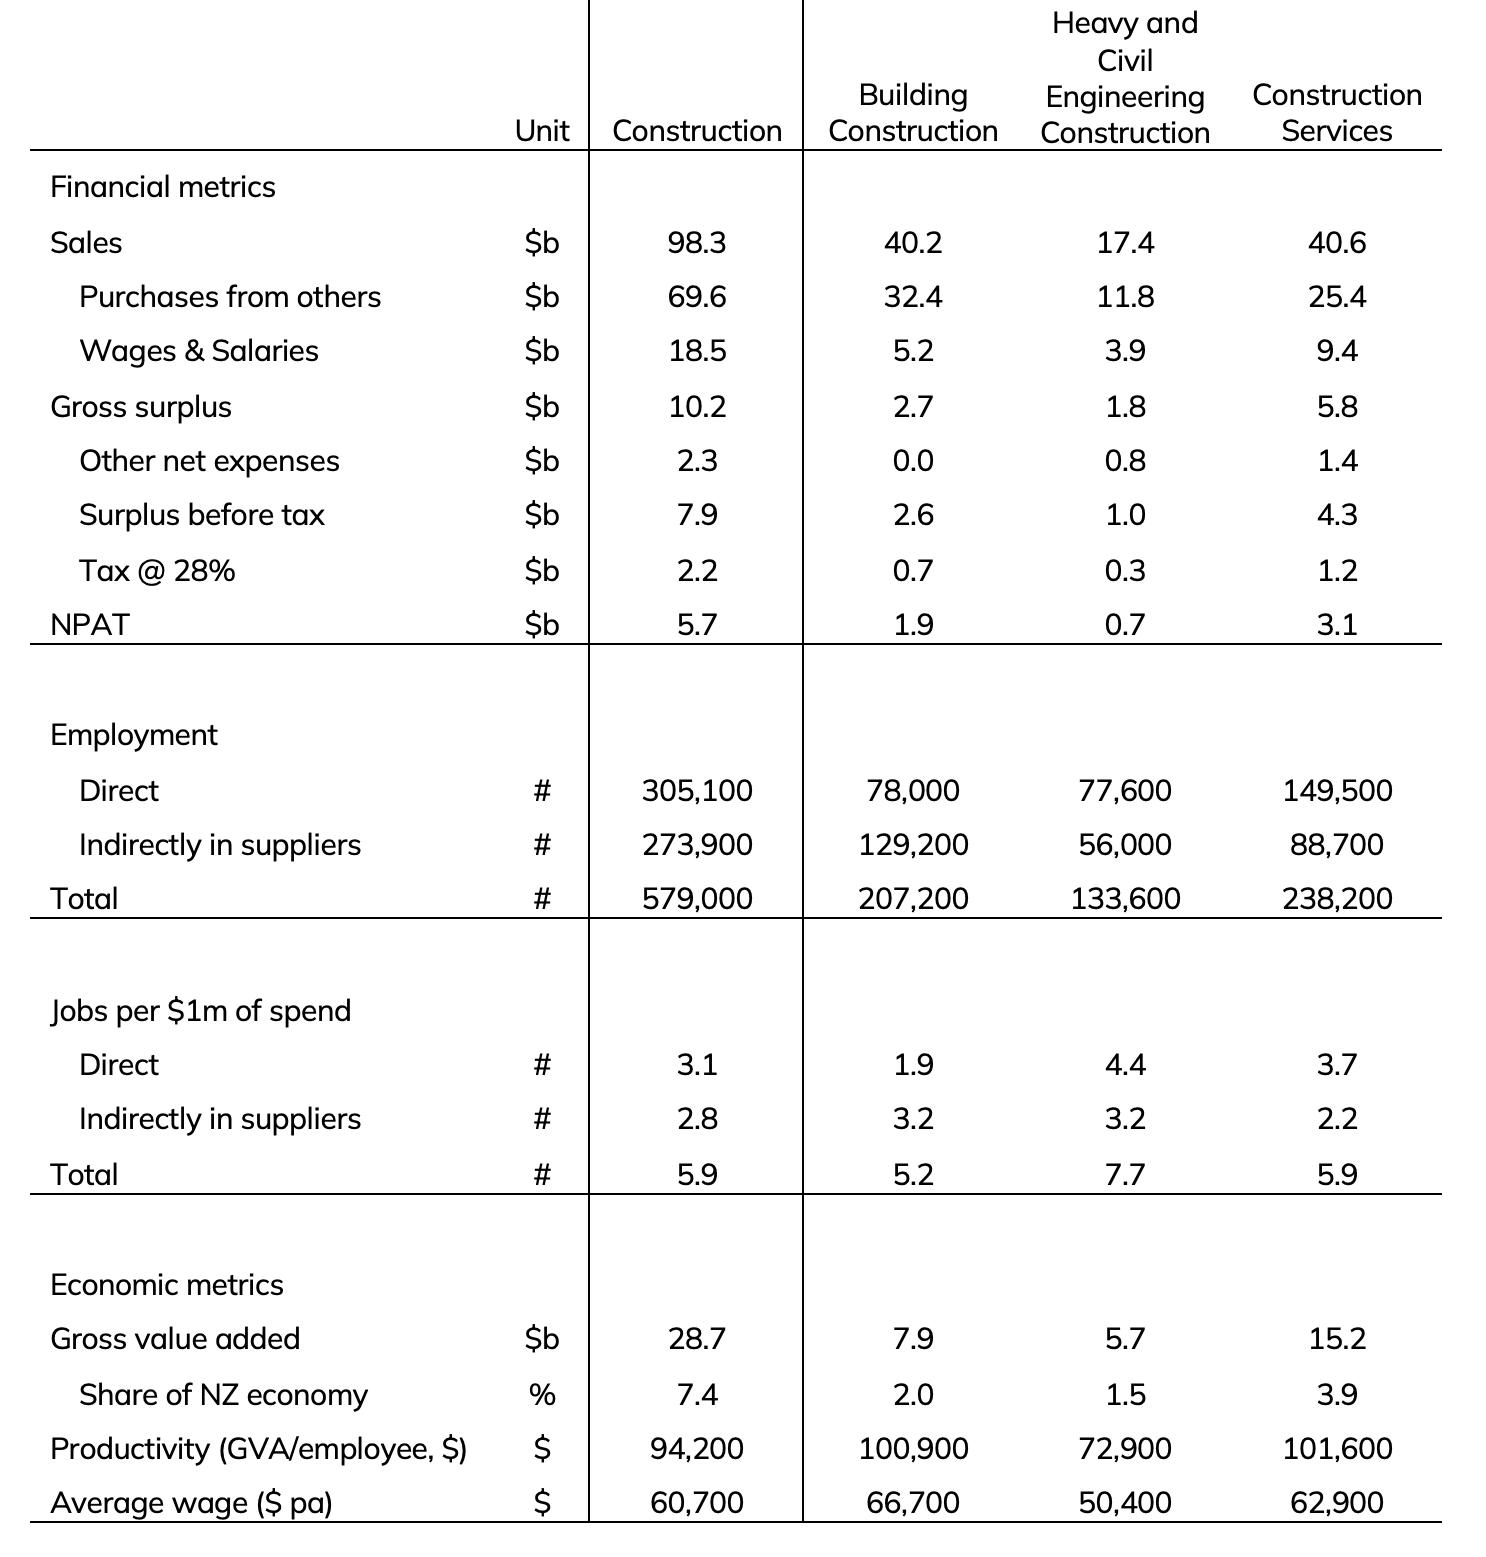
The construction is sector is large. Figure 4 summarises key financial, employment and economic metrics to put these in context for the 2023 financial year – the most recent detailed data available. (Note the above high-level data is the latest available for the March 2024 year.)
The financial metrics give a high-level overview of the revenue of the sector (and subindustries) and how that revenue is spent on purchases from suppliers, wages and salaries and flowing through to profits. Figure 4 shows notional tax paid – it is an estimate and should be seen as indicative.
The employment metrics show the number of people employed directly in the construction industry in 2023 and estimated number of jobs
Financial and economic metrics for Construction, 2023
supported among suppliers. A total of 579,000 jobs were supported by construction in 2023. The following block shows the employment effect of each $1m of sales. For every $1m of spend, a total of 5.9 jobs will be supported for a year, including 3.1 in the construction sector and 2.8 among suppliers. Spending in the infrastructure sector (heavy and civil engineering construction) has the biggest employment bang for buck – this is the reason why infrastructure investment is often favoured by governments to boost the economy during a recession.
The economic metrics show the contribution of the construction sector to GDP (which adds up the wages and salaries and gross surplus, not the purchases from others), share of the economy and resulting labour productivity and average wage measures. When we presented these statistics to the public in a survey, over 80% were impressed by the sheer size and scale of the industry (see next section).
Source: Author estimates from Stats NZ source data

NZCBIA commissioned Primary Purpose to conduct a survey of New Zealanders to measure public perceptions of the New Zealand building and construction industry. The purpose is to independently measure public perception of the sector, issues and strengths.
These are some highlights:
• Public knowledge of the building and construction sector is low compared to other sectors. Males and higher-income households knew more about the sector.
• Expensive was the most common description of the sector.
• The sector’s contribution to economic growth and job creation is recognised but there are perceived shortfalls in looking after people, community and environment.
• Positive experiences with the industry in the last 5 years correlate with more positive views overall, but half or more are not satisfied with quality, timeliness and value for money.
We surveyed across a range of different issues to understand how people perceive the sector and implications for the sector.
When asked about their knowledge of the industry, 36% of respondents said a lot or a fair amount. In comparison, this level of knowledge was 59% for health and 57% for retail. This means that people do not feel they understand the sector well (Figure 6). The purpose of this report and project is to add to the body of knowledge and improve public engagement.
Know a lot or a fair amount about the following industries
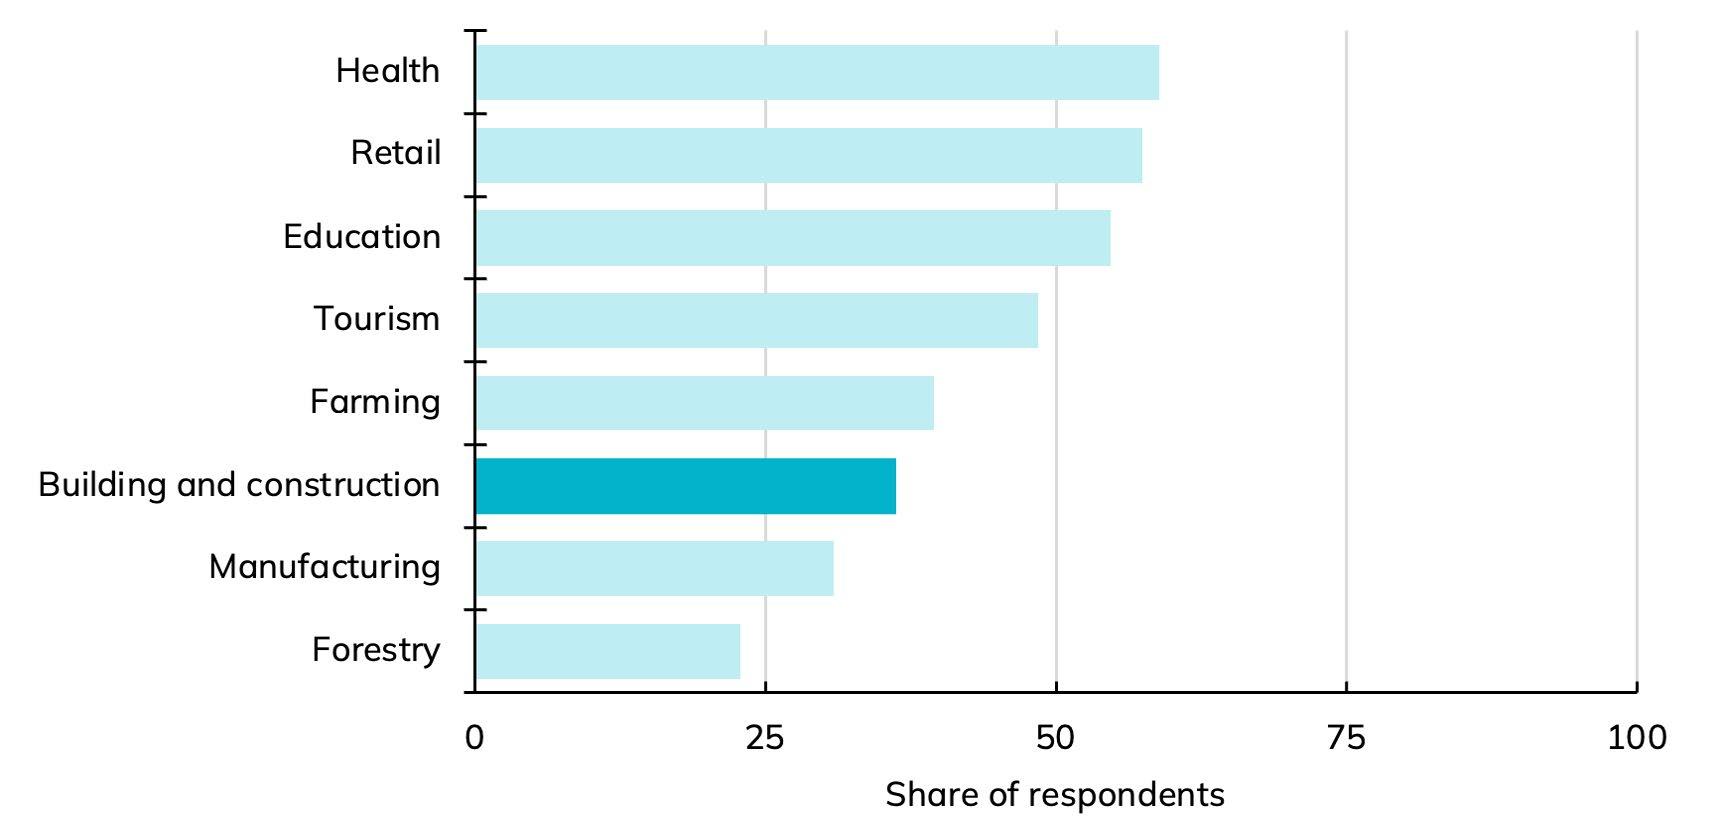
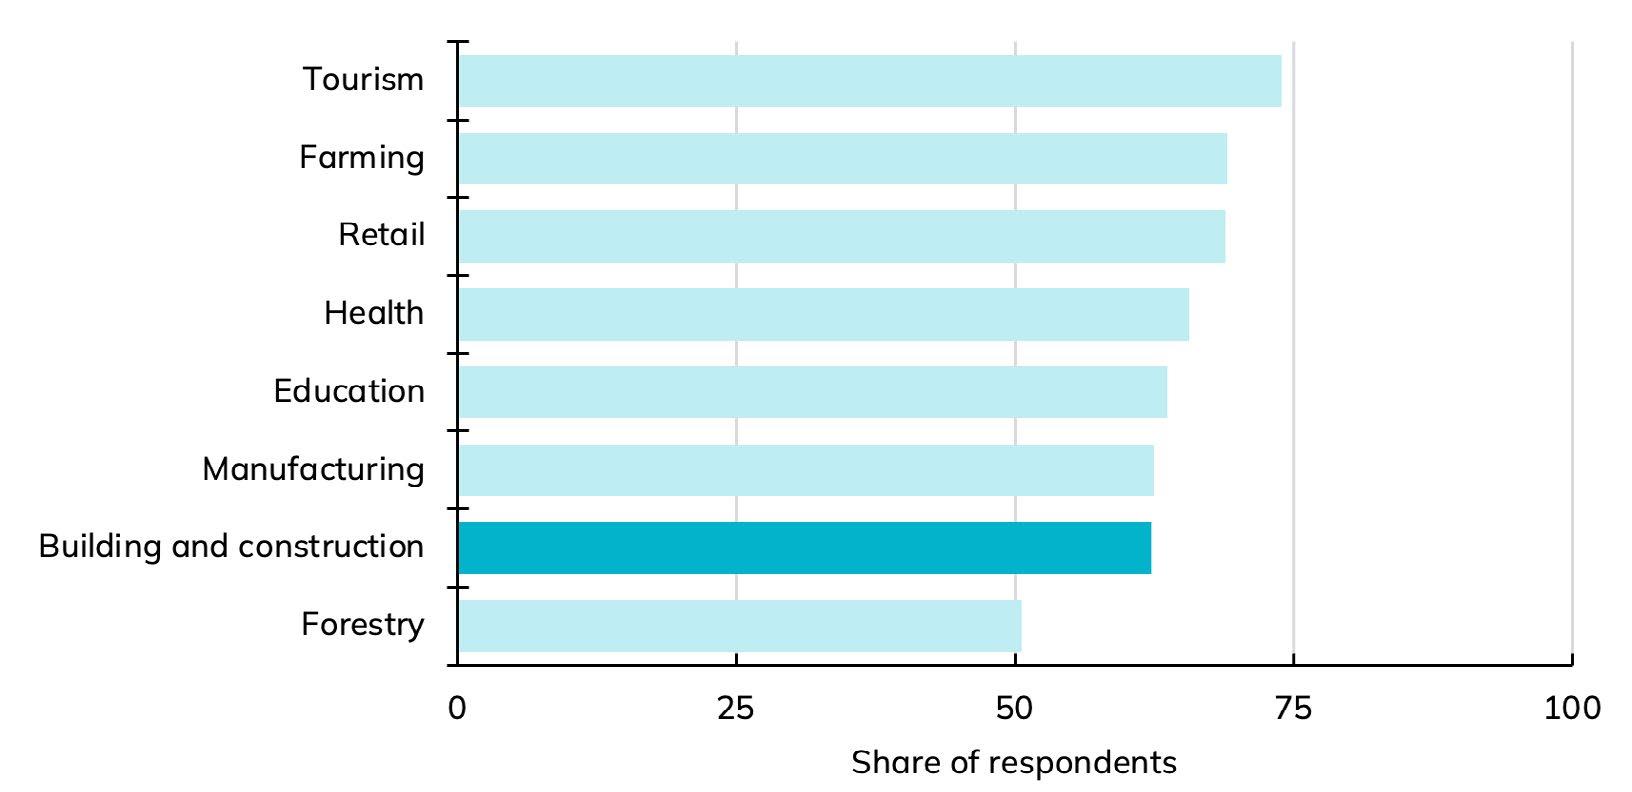
Figure 7: Majority of the public feel positively disposed to the sector but could do better
Feel favourably towards the following industries
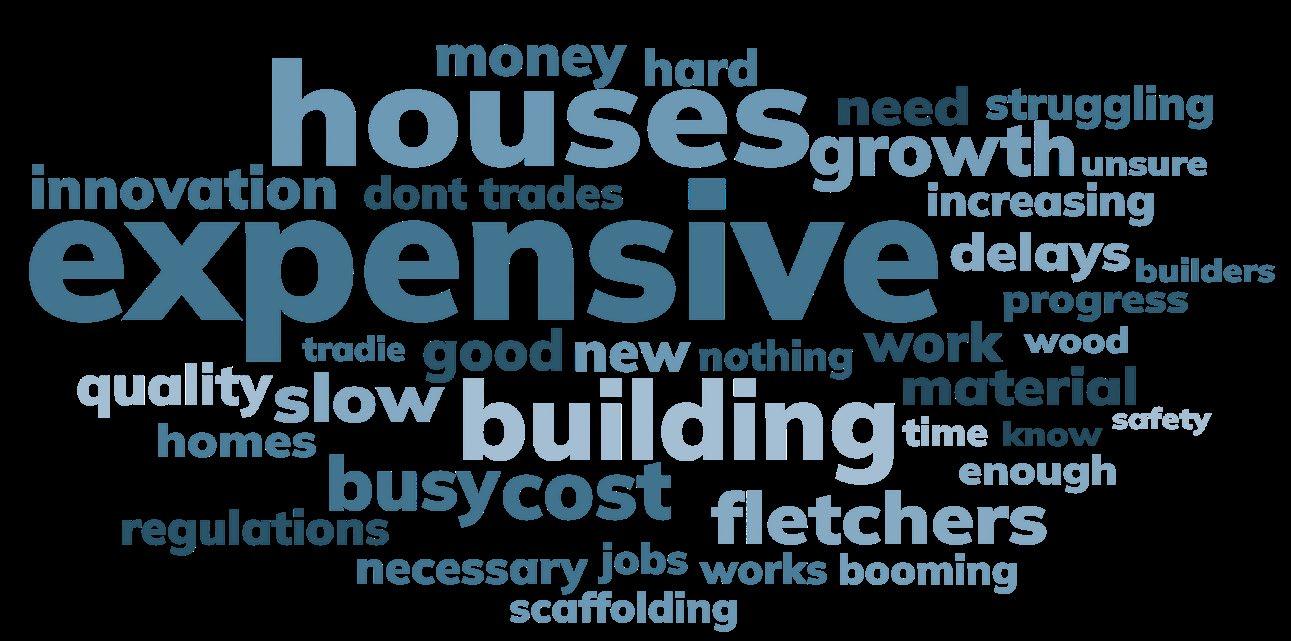
When asked to describe the sector with one word, the most common was expensive (Figure 8). There was a theme of cost, expense, building. There is a wider map of public understanding of the need and value of the sector, but also the flipside of expensive houses, disruption due to construction activity and high costs are all important factors.
Figure 8: Word cloud of the first word that people associate with building and construction
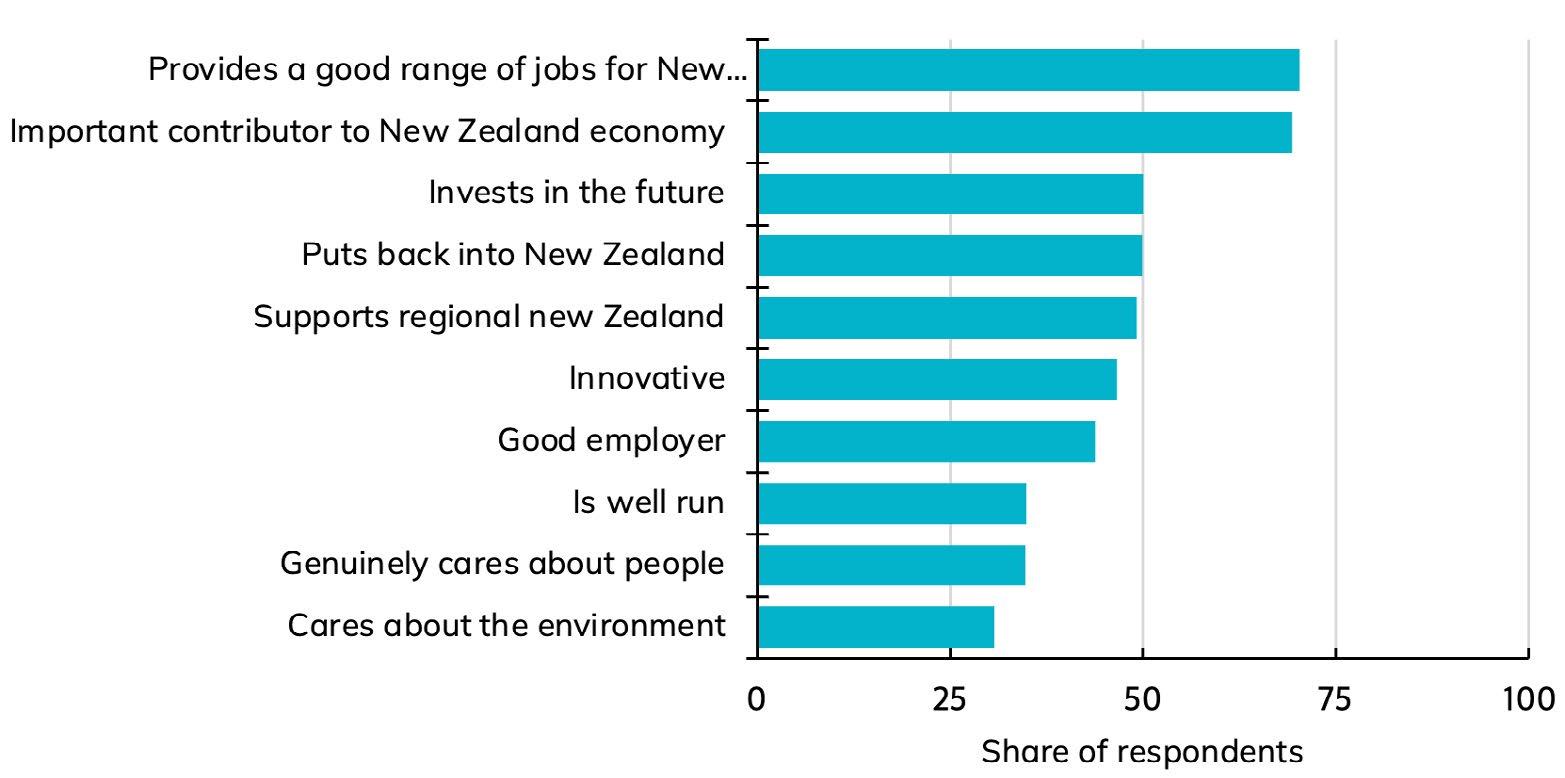
When asked about attributes of the industry, people rightly recognised its contribution to the economy and jobs but felt less favourably about its contribution to the local economy, investing in the future, innovation, good business practice or looking after people and planet (Figure 9). This means the sector has a lot of work to do in lifting its performance and storytelling on how it looks after people, invests in businesses and communities and performs on environmental issues.
Figure 9: New Zealanders understand the economic and employment contributions of the sector but see shortfalls in other areas – especially how businesses are run, how the sector looks after people and how it looks after the community and environment
Attributes that apply to the construction industry
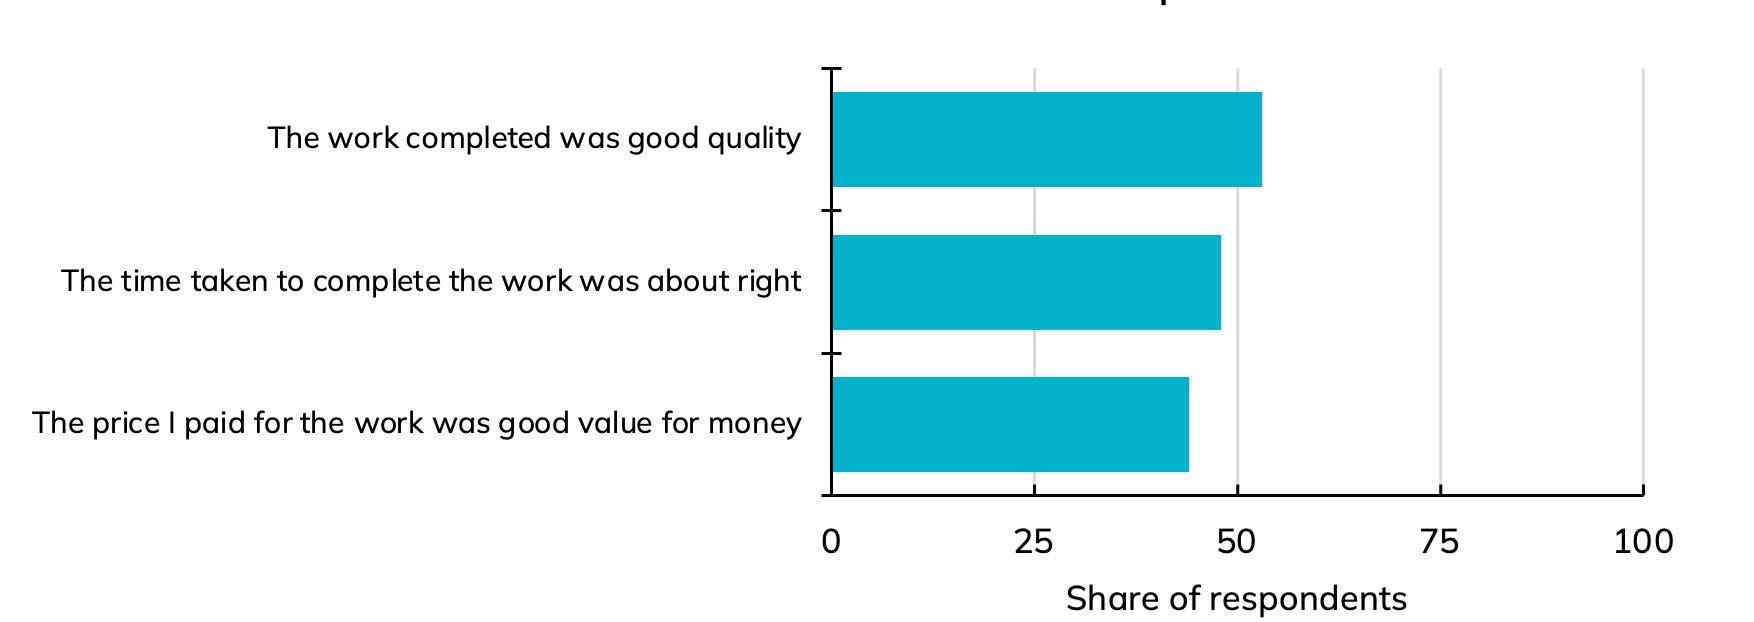
We asked those who have engaged with the construction industry in the last 5 years about their experience of quality, timeliness and value for money – 53% said the work was completed to a good quality, 48% said the work was done in the expected time and 44% said the work was value for money (Figure 10).
This suggests there is room for improvement. Nearly half or more were not fully satisfied with quality, timeliness or value for money. This can be improved by improving work quality and better communication to set clear expectations and to manage those expectations should they change for any reason. As the other survey components show, public perception is generally favourable, but the sector needs to earn it with its work and its interactions with the public.
Figure 10: Half or more did not have a positive experience with quality, timeliness or value for money
Satisfaction with recent construction experience
The results in this section are based on a Primary Purpose nationwide online omnibus survey of a nationally representative sample of 1,010 New Zealanders aged 18 or over.
• The margin of error is ±3.1%.
• The survey was undertaken 15–25 March 2024.
• The report from Primary Purpose is available on request.
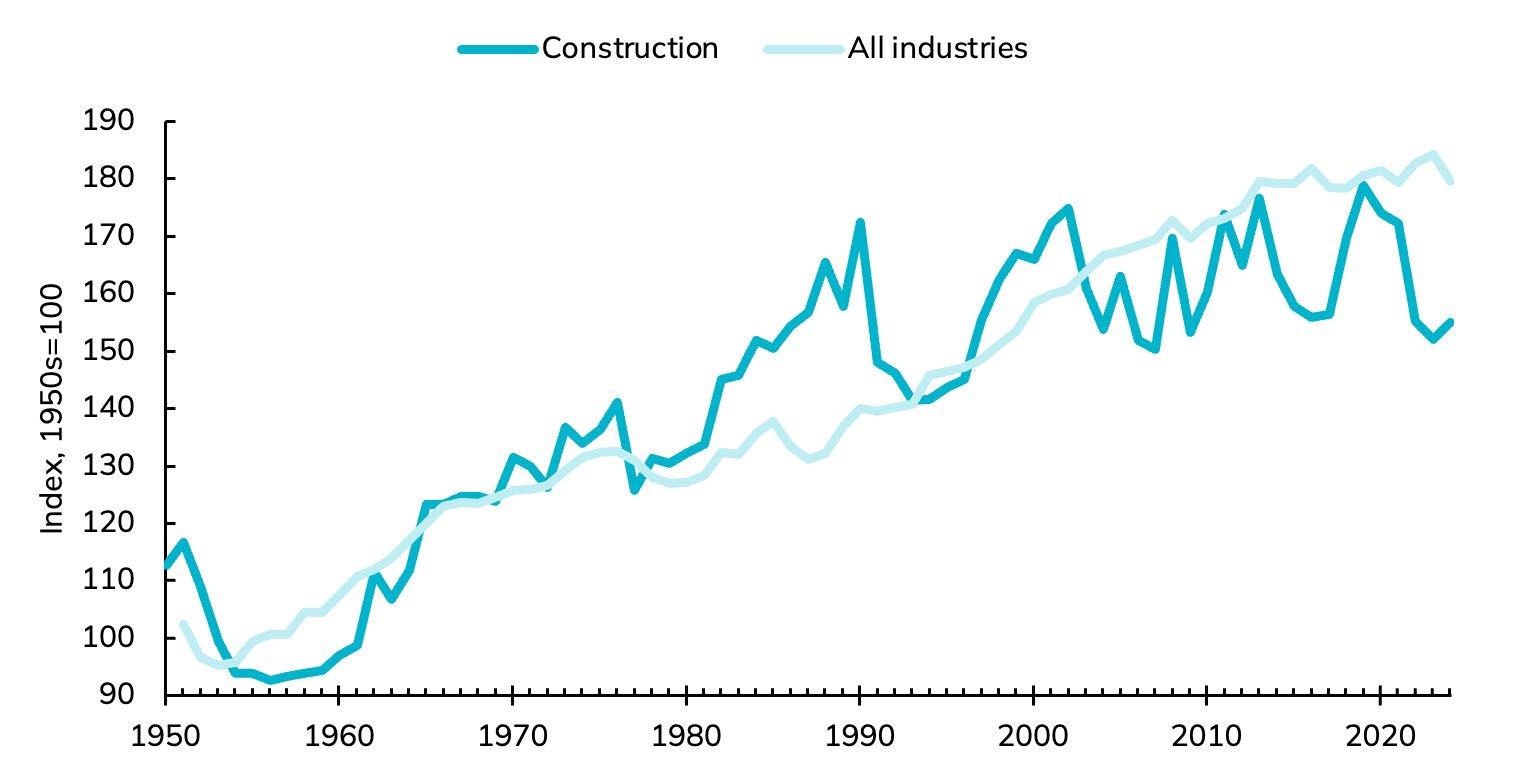
Construction productivity – namely a lack of improvement – is the key underlying issue facing the sector. While productivity growth is a challenge across New Zealand, construction productivity has barely improved since the early 1990s and is a common issue of concern across OECD countries. Importantly, it is possible to improve – with the levers in the hands of government, industry and firms.
Construction productivity is not a new issue for New Zealand. After improving from the late 1950s to a peak in 1990, progress has stalled (Figure 11). The current level of productivity is similar to what it was in 1985.
Productivity (GDP per Worker)
Source: Author estimates from Stats NZ source data
Source: Author estimates from Stats NZ source data

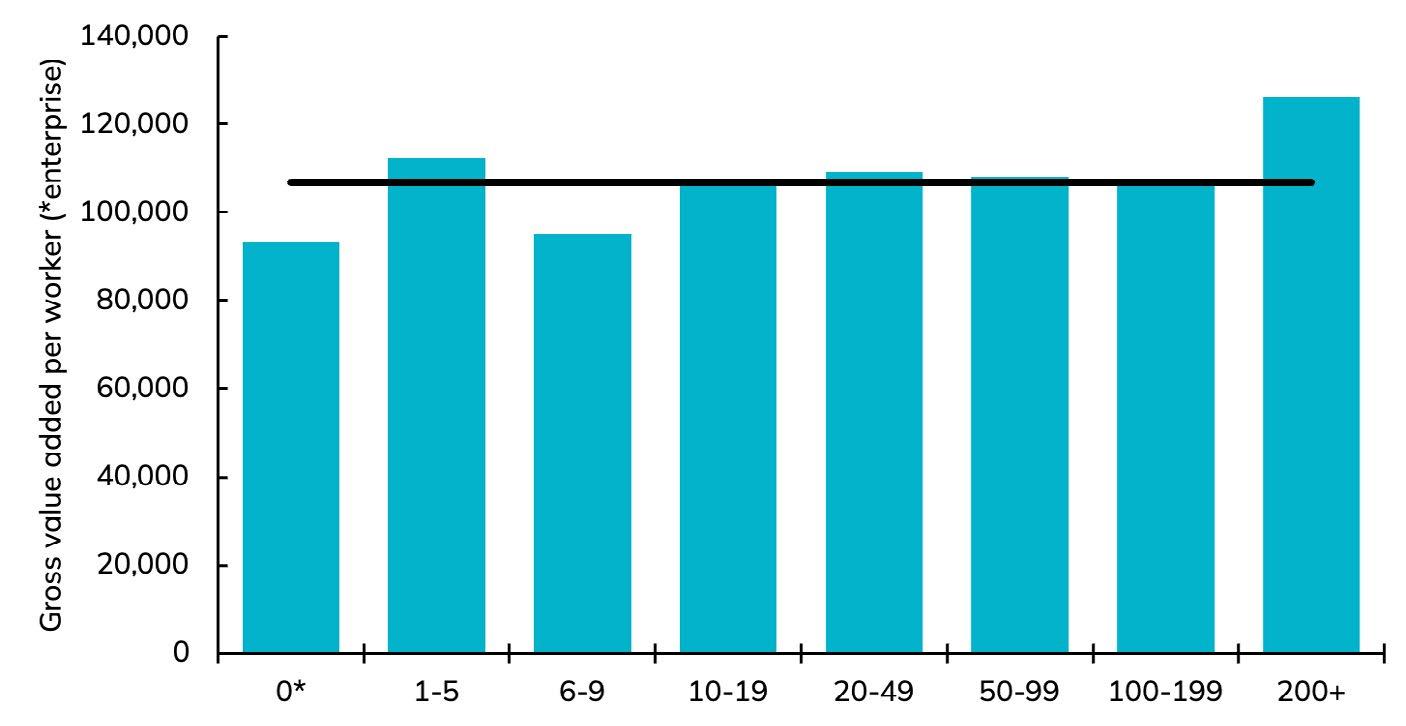
A known issue for the sector is reliance on a large number of small firms where productivity gains through investments in new technology, training, systems and processes can be difficult. People are too busy working in the business and do not have time for work on the business.
Productivity is lower among some – but not all – small businesses (Figure 12). In 2023, construction sector productivity was consistent across most firms with two exceptions:
• Very large businesses (with over 200 employees) are nearly 20% more productive than the average business.
• Businesses with no employees (owner operators) and businesses with 6–9 employees are less productive by more than 10%. For context, this lower productivity equates to employing 11,000 additional people (out of over 300,000 who work in construction) for the same volume of work.
Source: Author estimates from Stats NZ source data
New Zealand’s construction productivity experience is not unique. In fact, this is an issue affecting most countries in the OECD. Figure 13 shows New Zealand’s construction productivity relative to selected countries, and Figure 14 shows it relative to the OECD (interquartile) range and median. Both figures show that the New Zealand experience is not unique.
This speaks to factors that affect construction everywhere – construction is highly variable in location, site, timing, weather, methods and materials. How we build is often shaped by highly variable sites, and many tasks are labour intensive.
Many uncontrollable variables can slow production –workers move across a range of sites between jobs, staging and set-up processes are continuous and work is often highly technical, dangerous and bespoke.
The dynamic nature of construction can make it hard to identify and improve productivity shortfalls. The interrelated nature of work can also escalate issues. For instance, poor supervision can reduce worker morale, leading to high turnover and rework, or supply chain issues can balloon costs and lead to financing delays. These variables can affect productivity of work or productivity of the financial model. This means it is important to understand the issues in a more structured way.
Construction productivity: selected countries
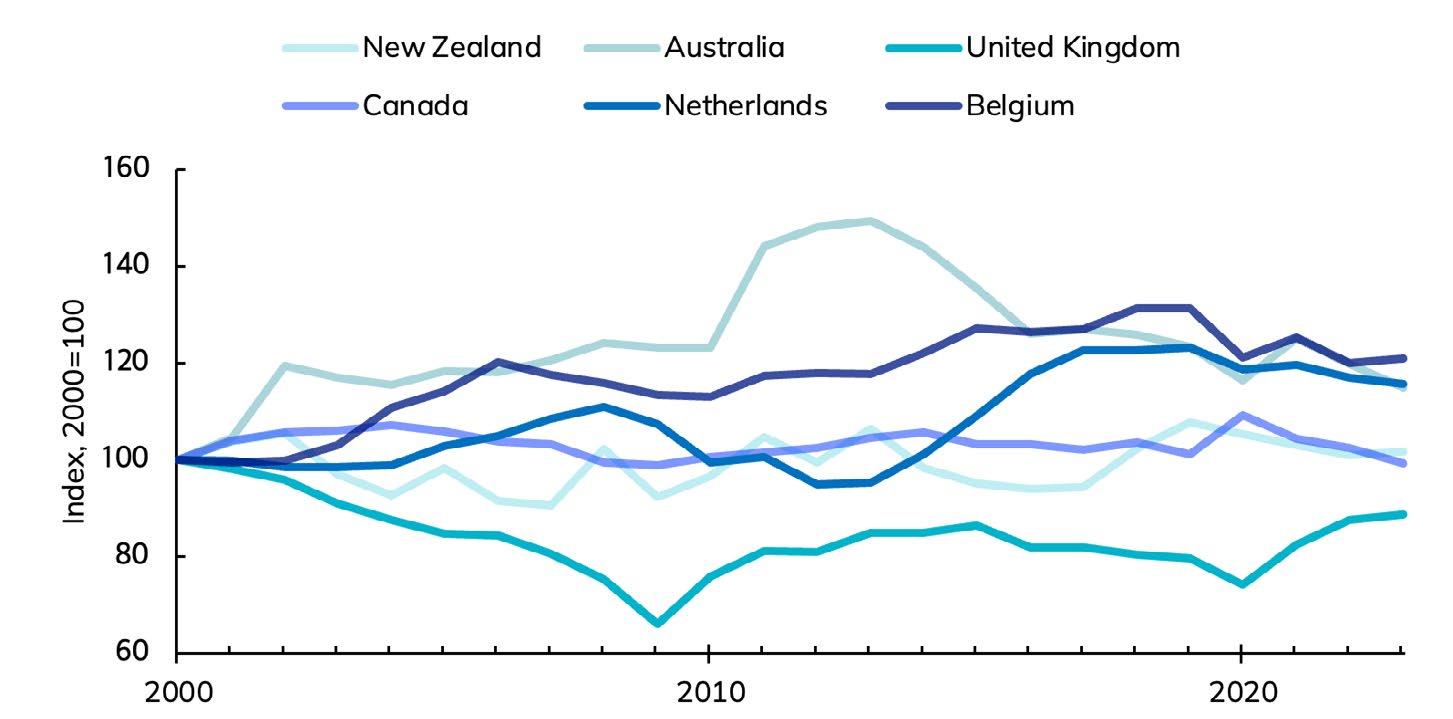
Source: Author estimates from Stats NZ source data
Construction productivity: OECD countries
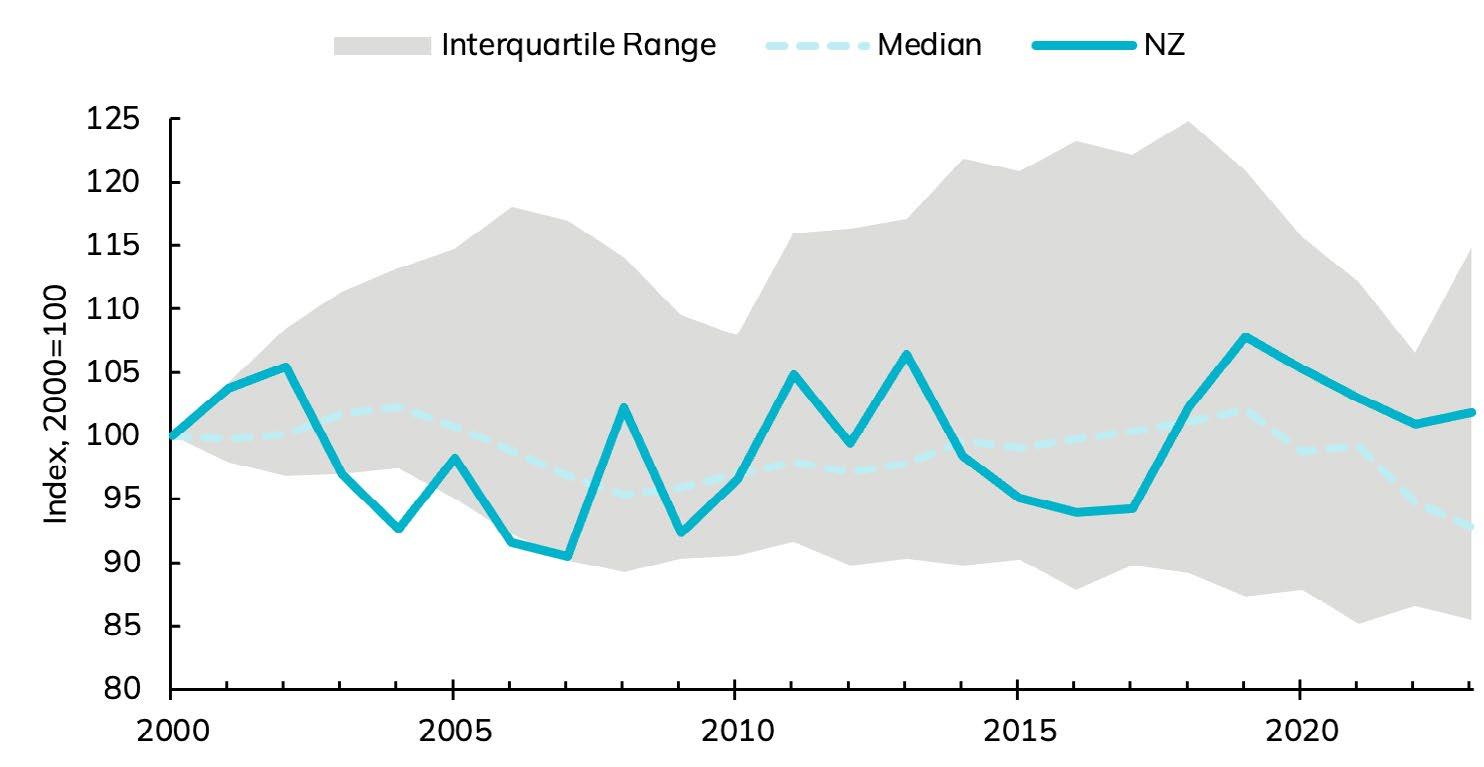
Source: Author estimates from Stats NZ source data
Productivity can be affected at different levels:
• Proximate – tasks and processes.
• Intermediate – project and company.
• Fundamental – industry-wide and interindustry.
Figure 15 summarises the most common risks to productivity we identified in a broad literature review. It’s a handy list to consider and can support a project owner or manager to get a handle on the varied and interlinked risks.
• Adverse weather
• Unforeseen ground conditions
• Automation, suitability of equipment, technology, tools & machinery
• Design and production information
• Delay
• Planning & scheduling
• Poor site layout
• Information system
• Standardisation, prefabrication and off-site production
• Turnover/Sales volume
• Contracts
• Financing
• Availability of skilled workers
• Workers’ education and level of skill
• Workers’ age
• Insurance and medical care for workers
• Labour union agreements
• Owner characteristics
• Management control
• Experience and training of workers
• Poor communication
• Changes orders/ Variation
• Project scale and complexity
• Materials availability
• Buildability and constructability
• Procurement method
• Rework
• Work environment
• Poor estimates
• Restrictive work practices
• Regulations, permitting, codes and standards
• Subcontractors
• Team integration
• Coordination and communication
• Absenteeism
• Inadequate supervision
• Labour motivation
Figure 16: Most commonly cited issues globally and locally
• Materials shortages
• Inadequate supervision
• Skills shortage
• Lack of proper tools and equipment
• Incomplete drawing and specifications
• Poor communication
• Rework
• Poor site layout
• Adverse weather conditions
• Hange orders
• Rework
• Poor estimates
• Labour skills
• Labour motivation
• Suitability of plant and equipment employed
• Construction method
• Buildability issues
• Project complexity
• Upervision
• Clients’ overt influence on the construction process
• Unforeseen ground conditions
• Weather
The complex nature of construction and the complex of nature of productivity shortfall have frustrated policy success to date. Nevertheless, approaches internationally have lessons for us that fall into three buckets:
• Reducing ambiguity in the system. Better information, coordination and quality policy signals make it safe for those in the construction system to make commitments to scale up or commission work. These efforts influence the scope to build for value rather than low cost. Policies at this scale tend to work at system and industry levels.
• Streamlining processes. These interventions reduce decision factors and load on workers via interventions such as standardisation, faster permitting processes and investment in automation. Policies at this scale tend to work across system and site levels with some industry-level support.
• Improving skills. These efforts increase the education and skills of workers who are currently active and part of the future workforce. Basics like reading literacy and verbal language skills can be important factors when migrant workers are increasingly relied upon to meet critical skills gaps. Interventions at this scale tend to occur across the system and take a long-term view.
These are broad buckets of activities, but as we address these issues, we will see maturity in management systems and reductions in rework, staff turnover and delays at a site level. Across industry, skills and scale may increase. From policy, we would expect evidence of increased confidence in government as a procurer (via effective use of an infrastructure pipeline) and as regulator of planning and permitting processes. But how should we go about it? Below is a breakdown of how key stakeholders can make progress. We outline the approach for government, for industry and clients and for firms.
Government has a dual role as procurer and regulator– both areas need action.
Figure 17: Strategies for government
Reducing ambiguity
Government’s role is to reduce land fragmentation and support confidence in capital utilisation. Policies might include planning reform, Net Zero coordination, and better contractual frameworks that support ease of business and prompt payments within the industry.
Government’s role is to support capital investment by building confidence in the public infrastructure pipeline and procurement strategies. Government can make clear commitments on policy targets for Net Zero, support better contractual frameworks by adding incentives to traditional contracts, allow longer construction periods and invest in upfront planning and scoping with early contractor and expert input from multiple sources. Strategies to support prompt payments to SMEs can also be led by government.
Streamlining processes Government can reshape regulation and promote industry competition and standardisation by making regulatory efficiency a key performance target. Australia’s streamlining of permitting and approvals processes, for instance, established single-window clearance for permits and approvals (see Box 3). Policies can also promote standardisation by aligning regulations for more extensive use of prefabrication and incentivising innovation and investment in new materials (e.g. via R&D Tax credits).
Improving skills
Government has a systemic influence over the skills of the future workforce, more so than other stakeholders. It can support productivity by developing a flexible skills system through favourable immigration settings and investment in adult learning such as apprenticeship schemes.
Government can use procurement settings to increase standardisation of process and materials on heavy infrastructure and other government projects, such as requiring the use of building information modelling on all public sector projects, encouraging repeatability of design across projects and investing in a central procurement organisation.
How the industry is set up and how clients operate sets the tone for operations and work dynamics at site level.
Figure 18: Strategies for firms
STRATEGIES Role for industry
Reducing ambiguity Industry has a supportive role in coordinating policy with government. It can take concrete steps to collaborate on government with Net Zero, support the rewiring of contractual frameworks by promoting alternative contracting strategies and prompt payment from clients and advocate for policy and practice changes that support ease of business for SMEs.
Streamlining processes
Improving skills
Industry can take a leading role in supporting industry-wide training and transparency to combat informality. It can promote standardisation, pushing for changes that allow the more extensive use of prefabrication and support efforts to reduce waste and variability at site level.
Industry has a role in reskilling the current workforce by coordinating and developing frontline training on behalf of firms and promoting efforts to support knowledge retention within the industry.
Role for clients
Clients can support site-level productivity to a limited extent by taking steps to negotiate and contract for value beyond cost, adding incentives to traditional contracts, making prompt payments, allowing for longer construction periods and ensuring early collaboration from all parties involved in a design.
These strategies are the most important for business as they are within their immediate control and will pay dividends. Firms can invest in technology and processes to shore up the construction process amid wide-ranging and at times uncontrollable variables and focus on their people, who are their biggest asset and risk.
STRATEGIES Role for firms
Reducing ambiguity
Streamlining processes
Firms can have unique responsibilities and points of control in contracting and planning processes, but this is easier for larger firms. They may make investments in alternative contracting strategies, upfront planning and scoping, efforts to support ease of business for other SMEs and more complete and firmed-up designs.
Firms can streamline processes internally and support collaborations across industry by encouraging transparency across the industry and making efforts to reduce informality. Efforts to institutionalise best practice might include establishing internal training academies, making investments in standardisation of design and supply chain and inventory capabilities, moving to digitalised procurement processes and introducing rigorous integrated planning and collaborative performance management approaches. Firms can increase the number of direct workers and supervision on sites and deploy new technologies and materials such as using drones for scanning, monitoring, and mapping and making investments in near-field communication, sensors and wearables technologies.
Improving skills
Firms can support reskilling in the current workforce by developing frontline training, ensuring knowledge retention and management within the firm, introducing e-enabled micro-training for frontline workers and running field and forum type trainings to support effective field-based and classroom learning.

The UK’s construction sector transformation plan has lessons for NZ. It is focusing on technological innovation, sustainability and regulatory changes to enhance efficiency and productivity. The key aim is to enhance productivity and innovation across various industries, including construction. The government committed £170 million, which was matched by £250 million from the industry to support the adoption of new technologies and innovative practices in the construction sector.
A key priority is significant investment to embed new approaches such as artificial intelligence, digital design and offsite manufacturing. These technologies aim to improve project planning, reduce costs and increase productivity. For example, AI and algorithms are being used to better predict and schedule construction projects, while offsite manufacturing aims to reduce defects and improve overall efficiency.
Sustainability is another major focus. The industry still faces challenges in terms of guidance and implementation of green technologies. The Building Safety Levy and Biodiversity Net Gain initiatives are part of efforts to ensure environmental sustainability and safety in construction projects.
Several regulatory changes are also being introduced. The new UK Procurement Act 2023 introduces more flexible and transparent procurement processes. This includes requirements for larger contracting authorities to publish their pipeline of work and allows more flexibility in designing procurement processes. The Building Safety Act and the associated levy aim to address fire safety defects, reflecting lessons learned from the Grenfell Tower disaster.
Success is being evaluated against four aims:
• An increase in research and development (R&D) investment, including further additional followon R&D investments.
• Adoption of new business models and acceleration in technology adoption such as new digital manufacturing approaches and better information management frameworks to reduce misalignments across different phases of construction. The Challenge is also working to encourage firms to put energy efficiency and reducing whole-life costs at the centre of their design strategy.
• Shifts away from lowest-cost procurement, working closely with clients, especially in the public sector, to shift the focus from lower cost to whole-life value’.
• An expansion of research and increased knowledge dissemination – the Challenge funds R&D projects designed to demonstrate, at scale, the benefits of adopting new construction methods and supports the development and diffusion of academic knowledge.
Australia has undertaken several initiatives to streamline permitting processes in the construction sector, particularly to facilitate the development of renewable energy projects and large infrastructure projects.
Measures include one-stop shops and digital tools, priority and fast-track consenting systems and national and state-level coordination efforts.
One-stop shops are where developers can manage all their permit applications through a single portal. This approach is complemented by the digitalisation of the permitting process, utilising tools such as digital spatial mapping and environmental data banks to aid in deployment planning. This simplifies the process but also reduces the time needed for approvals.
Certain projects, especially those related to renewable energy, have been given the option to apply under priority status. These projects then benefit from fast-tracked permit approvals. Additionally, there are measures in place to automatically grant permit applications if a specific period elapses without a decision. Finally, efforts have been made to streamline the interaction between federal and state regulations. For instance, the Australian Government encourages states to align their permitting guidelines with federal standards to create a more unified and less bureaucratic process and reduce the effects of patchwork regulation.
Following these measures, regulatory procedures reduced from 14 to 10 and permit approval time reduced by 38 days to 112 days – 25% lower than the global median.
The construction sector directly employs over 300,000 people and supports another 270,000 jobs in suppliers. Construction sector employment has grown strongly since the early 2000s (Figure 21) and supported jobs in across suppliers (Figure 22).
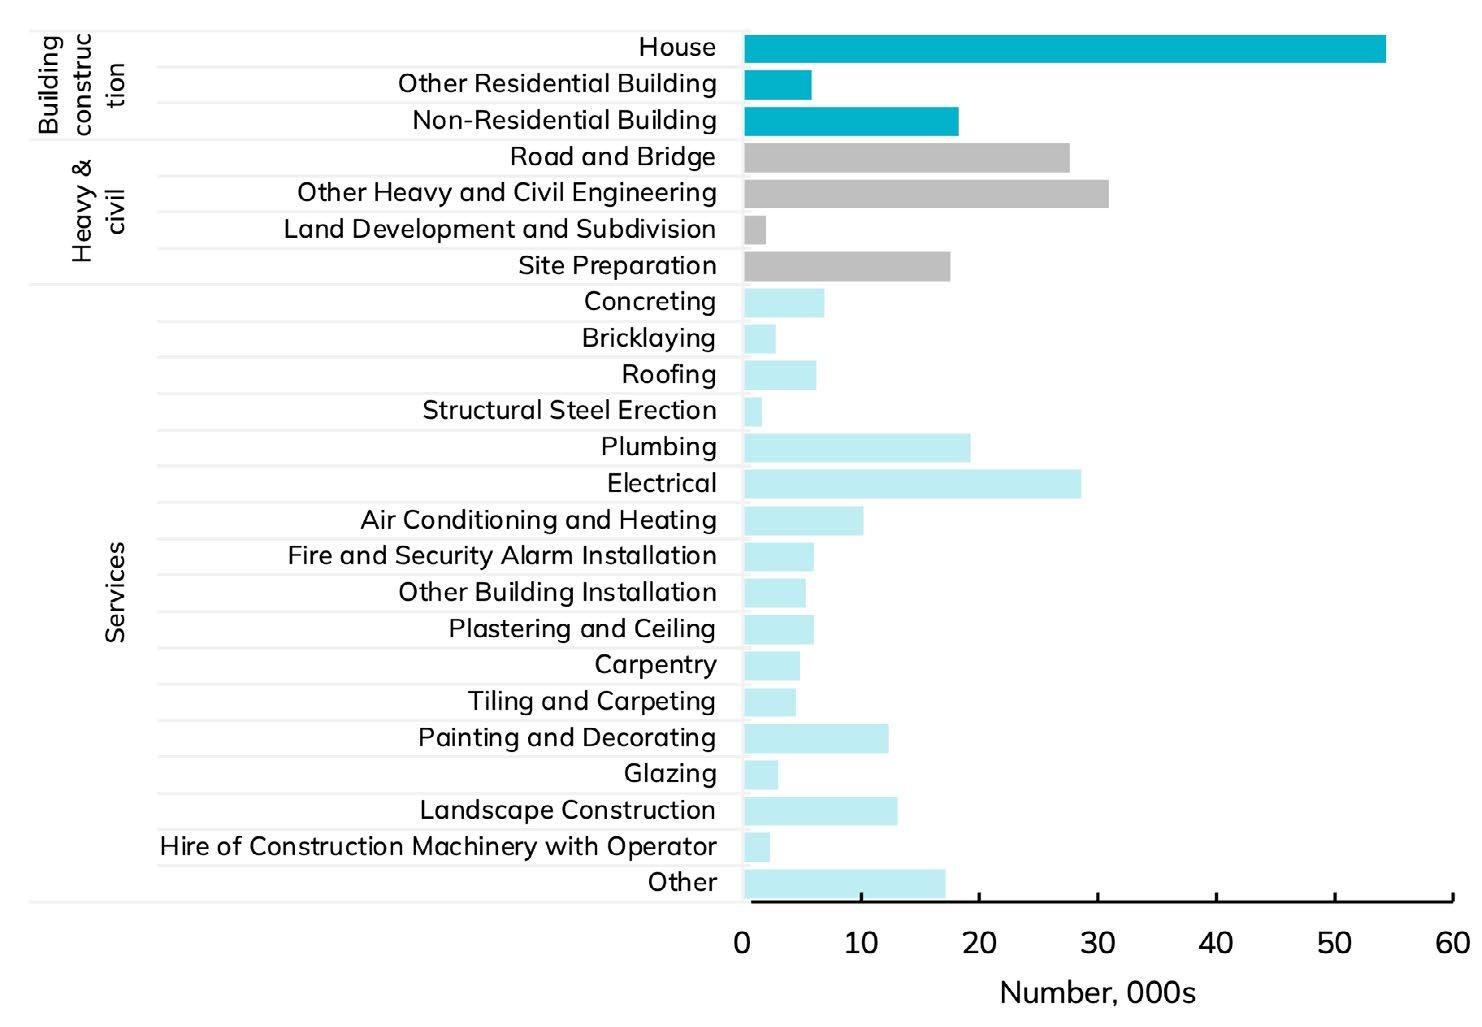
The construction sector however is broad. There are different ways to think about the range of subsectors. There are those who build buildings, build infrastructure or provide services such as plumbing and plastering (Figure 23). A more detailed breakdown shows that house building is the largest segment but also that the sector is very diverse across a large range of specialisations (Figure 24).
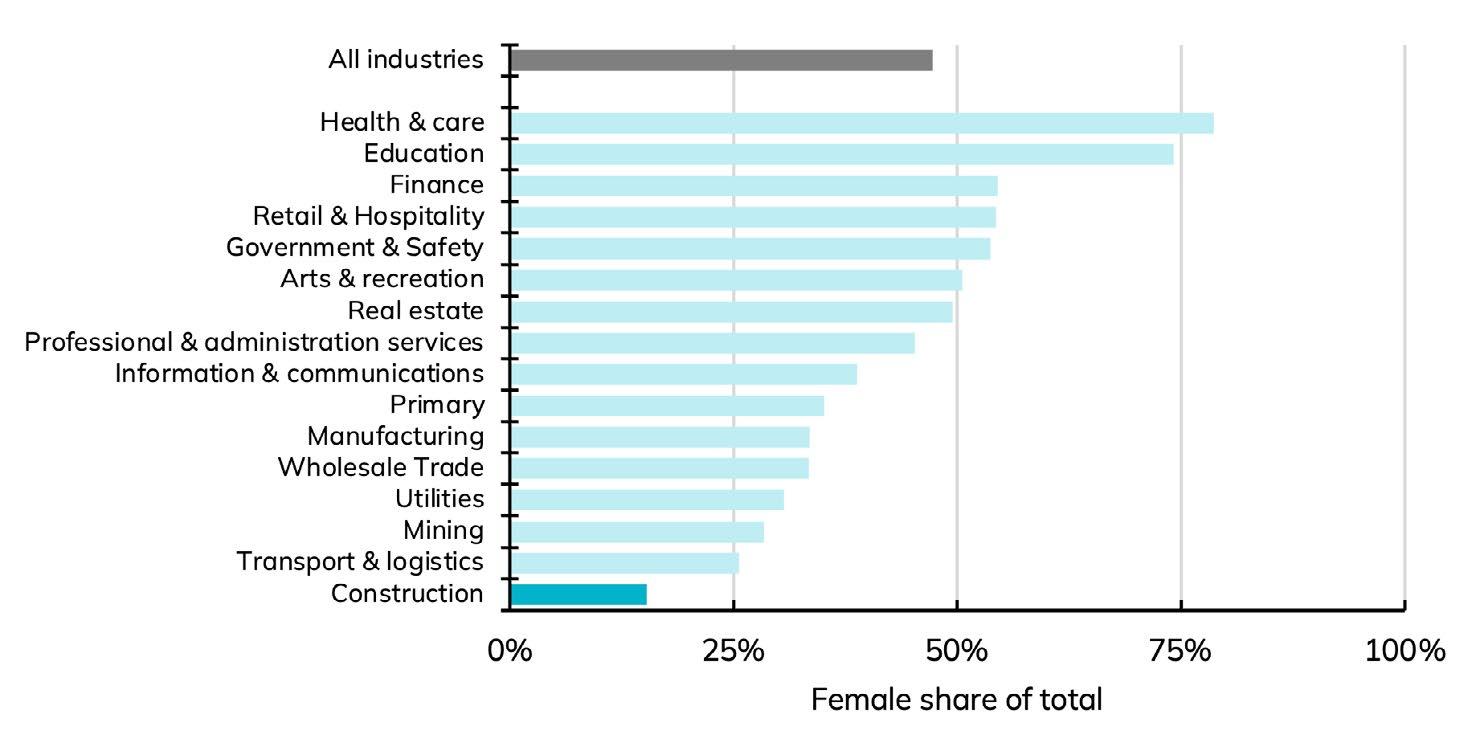
The construction sector remains heavily male dominated – 15% of workers are female compared to 47% across all industries (Figure 25). The construction sector faces intense labour shortages and retention issues, mirroring similar issues across all industries, which will intensify with an ageing population. That means future recruitment needs to tap into previously underutilised segments of the labour market – namely females. This will require investment in leadership and culture by firms to recruit and retain a more diverse workforce.
The sector is also unusual in having many owner operators. This could be a plumber in a van or a builder who uses subcontractors (Figure 26). This is double edged – it creates employment opportunities for a wide range of people but also slows innovation adoption and diffusion, with very small businesses exhibiting lower productivity.
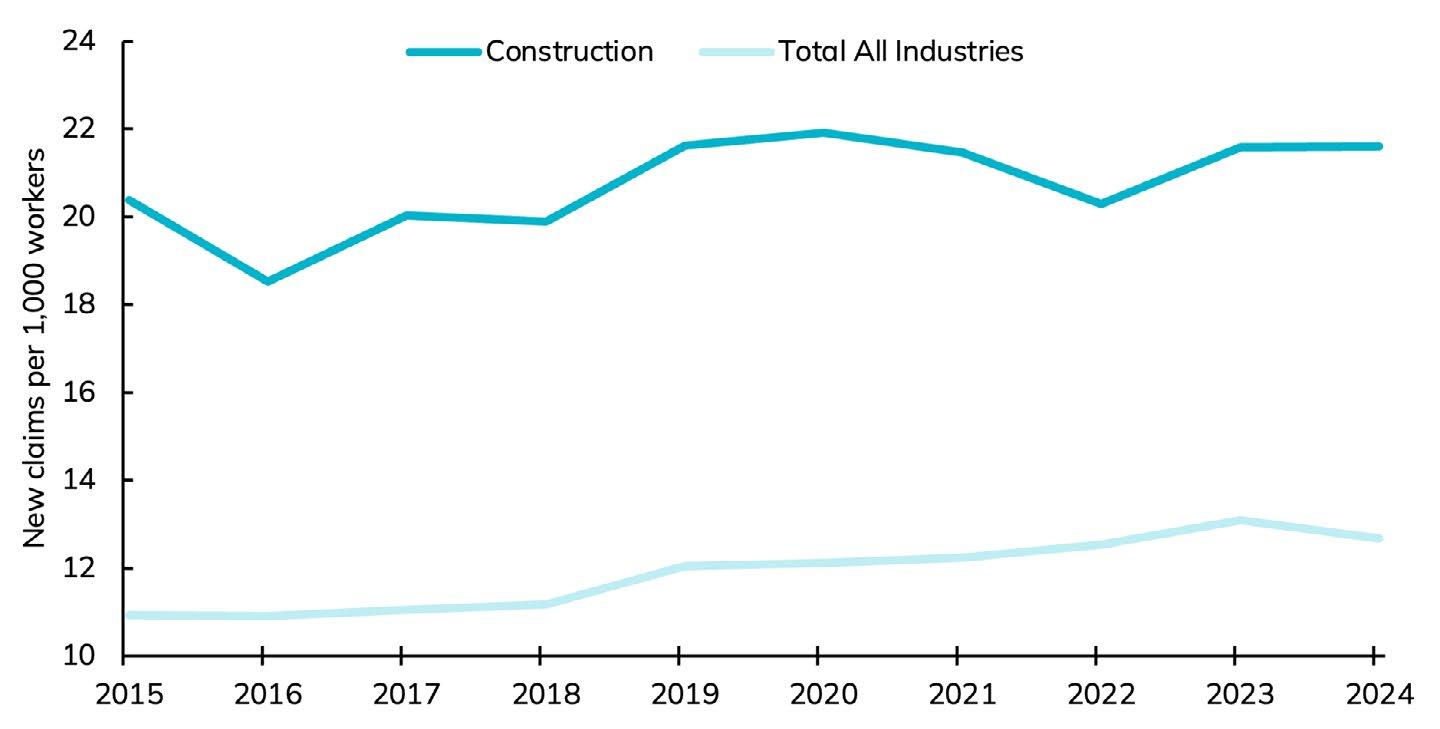
Construction is also unusual in how many are injured at work. In 2024, there were 22 serious injuries for every 1,000 worker – the second highest of all industries, 70% higher than the New Zealand average (Figure 27) and 16% higher than the Australian construction sector.
It means someone working in construction is 70% more likely to be hurt at work than in the typical job in New Zealand and 16% more likely than in a construction job in Australia.
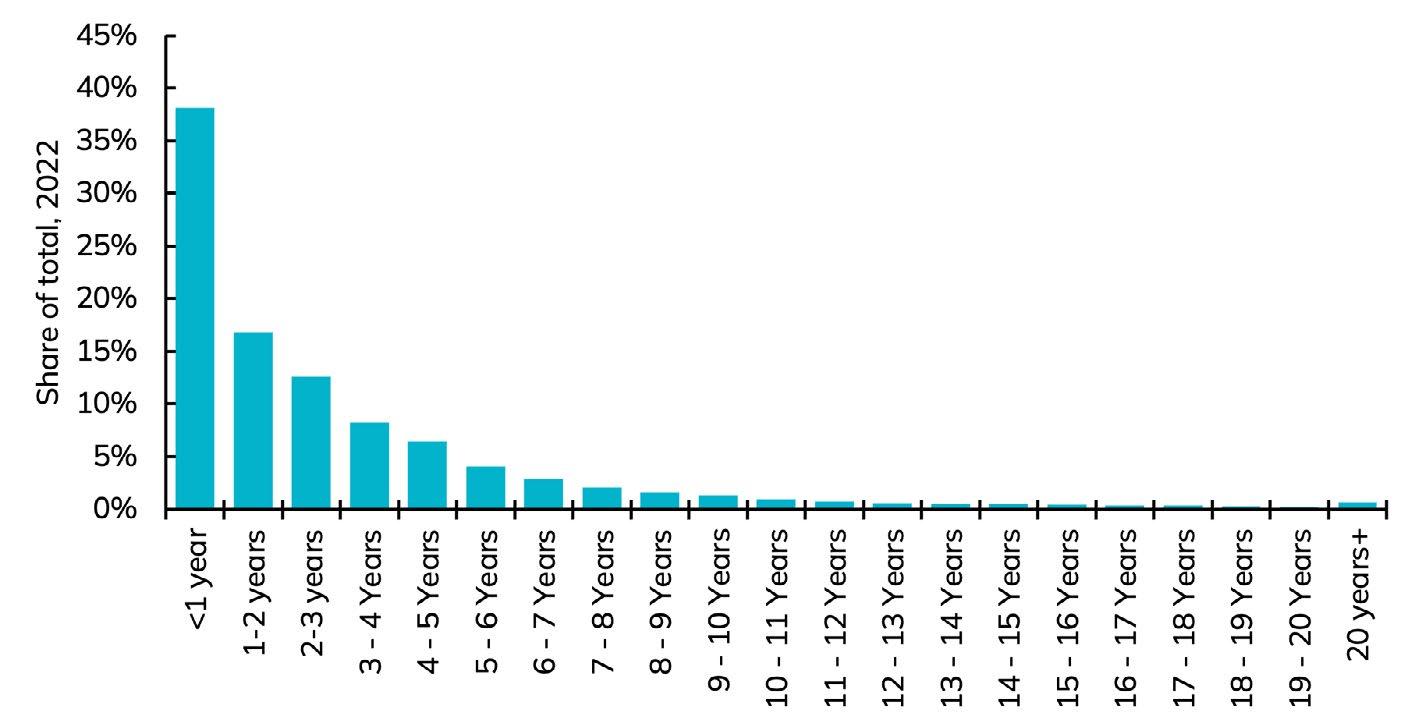
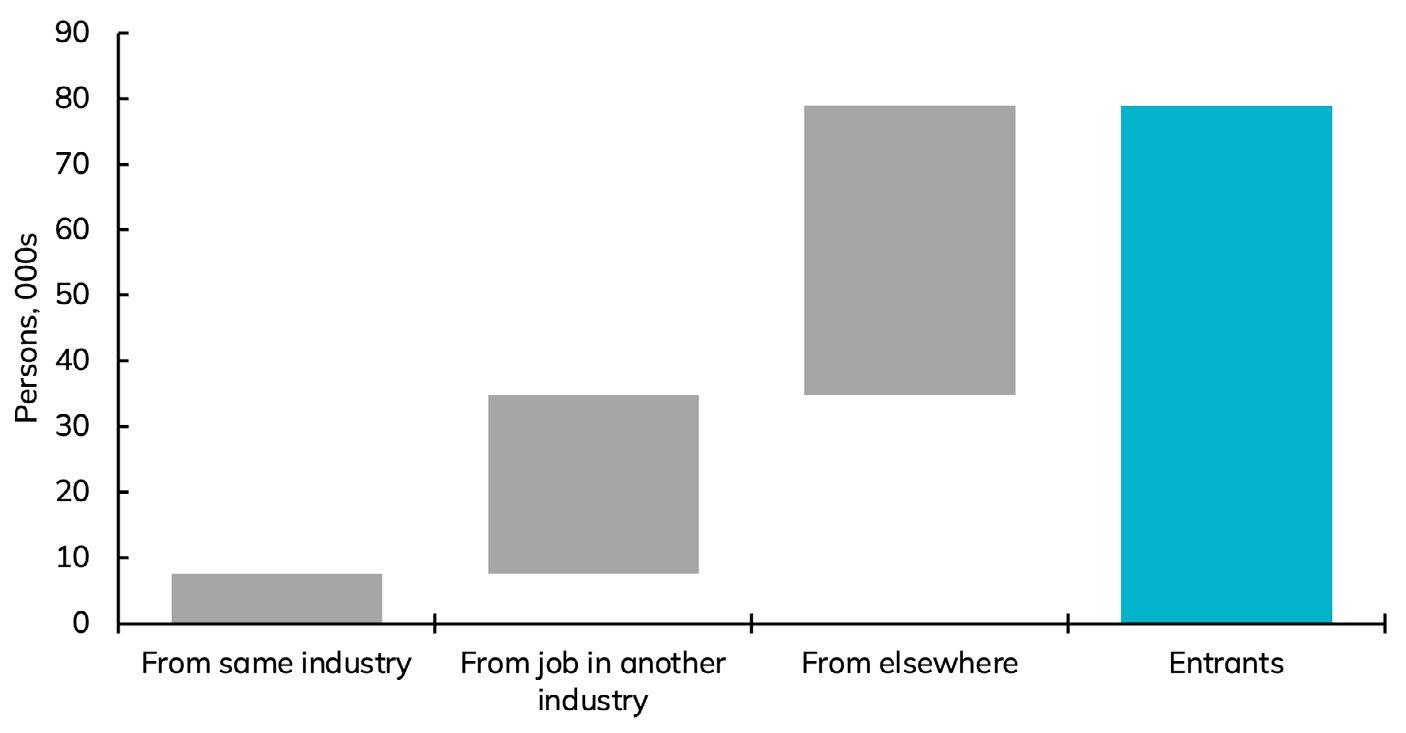
High worker turnover is a contributing factor to this poor health and safety performance. Close to 40% of workers had been in the industry for less than a year in 2022 (Figure 28). This is because there are always people leaving and entering the industry. In the last year, close to 80,000 people started a construction job. Fewer than 10,000 of them were from another firm in the sector with most coming from other industries or from some other activity such as study or unemployment.
This high rate of recruitment speaks to two key priorities for business. There is a need for excellent training systems and resources to upskill people and approaches to integrate new people into teams and work culture, and increased efforts are needed to continuously train and upskill, provide career and income progression and increase retention rates to reduce the cost of recruitment, disruption and training and increase productivity and profitability.
The construction sector is in a downturn in 2024. This will lead to some job losses due to downsizing and some business closures. But most businesses will survive the recession, for them it is about preparing for the recovery sometime in 2025. Labour shortages will return with a vengeance when the cycle turns up, and the best strategies are to retain your current people where you can (through reducing hours for example) and by upskilling your people now. Most businesses are too busy during boom times to fit in extensive training, and there is often too little money during a downturn. It is always a good time to upskill your people, they pay you back in efficiency gains and increased revenue. In downturns, it turns spared capacity into investment.
Figure 21: Construction employment has increased strongly since the early 2000s
Construction employment
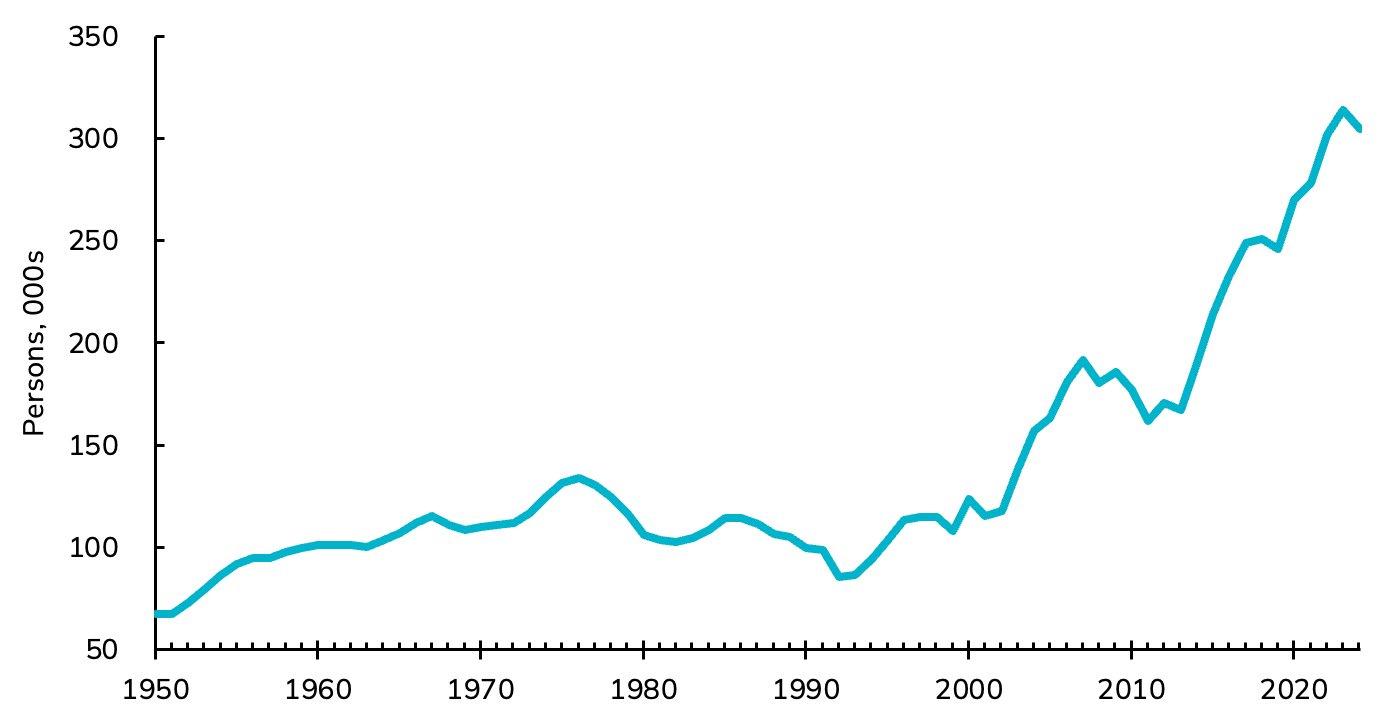
Source: Author estimates from Stats NZ source data
22: Employment supported in suppliers makes the footprint of the sector quite large
Construction employment: direct and highly dependent suppliers
23: Construction services is the largest segment of employment covering a broad range of specialised services…
Construction employment
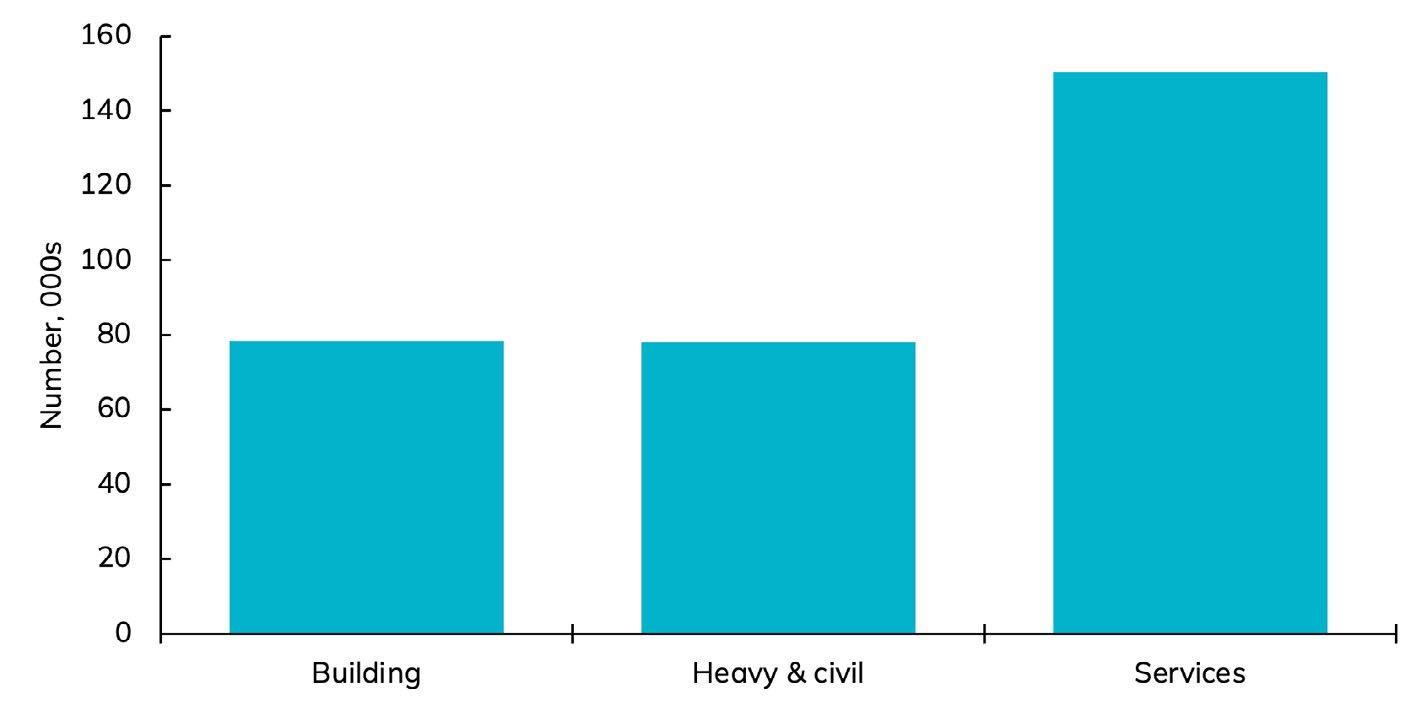
Source: Author estimates from Stats NZ source data
Figure 24: … which includes a broad range of services from electrical and plumbing to glazing and hire of specialised machinery
Detailed construction employment (2024)
Source: Author estimates from Stats NZ source data
Figure 25: The construction sector remains very male dominated
Female share of employment
Source: Author estimates from Stats NZ source data
Figure 26: A quarter of construction sector employees are owner operators
Self-employed share of employment
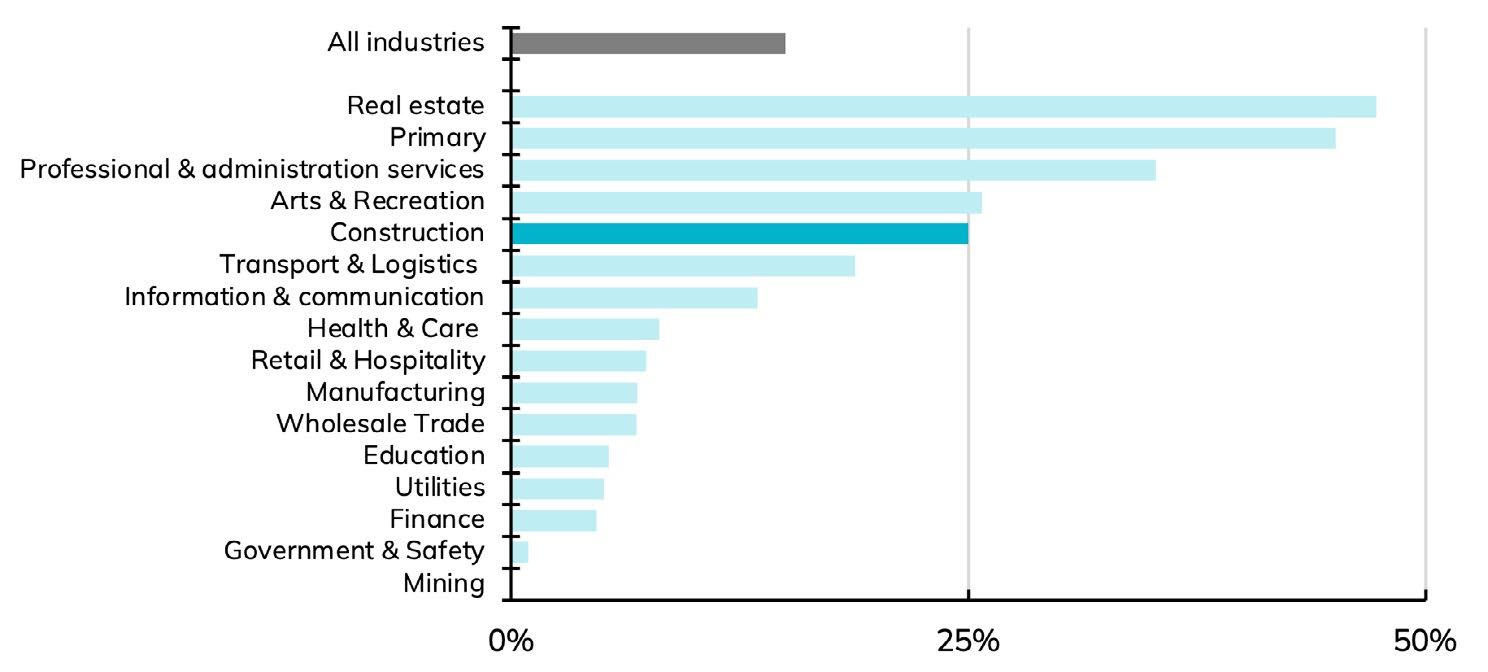
Total share
Source: Author estimates from Stats NZ source data
Figure 27: Construction sector experiences 70% more workplace injuries than the sector, and is 16% higher than Australia
Serious* injury claims
*ACC workplace injury claims for more than one week off work
Source: Author estimates from Stats NZ source data
Figure 28: The sector has high turnover…
Share of workers by duration in job
Source: Author estimates from Stats NZ source data
Figure 29: … hiring nearly 80,000 over the past year but fewer than 10,000 came from another job in the sector, meaning training and integration into workplace and culture are significant issues
Source of new construction hires in 2024
Source: Author estimates from Stats NZ source data
The construction sector is usually also looked at through three specific lenses: residential, non-residential buildings and infrastructure.
This section provides high-level indicators on demand and supply and an assessment of future strategic conditions.
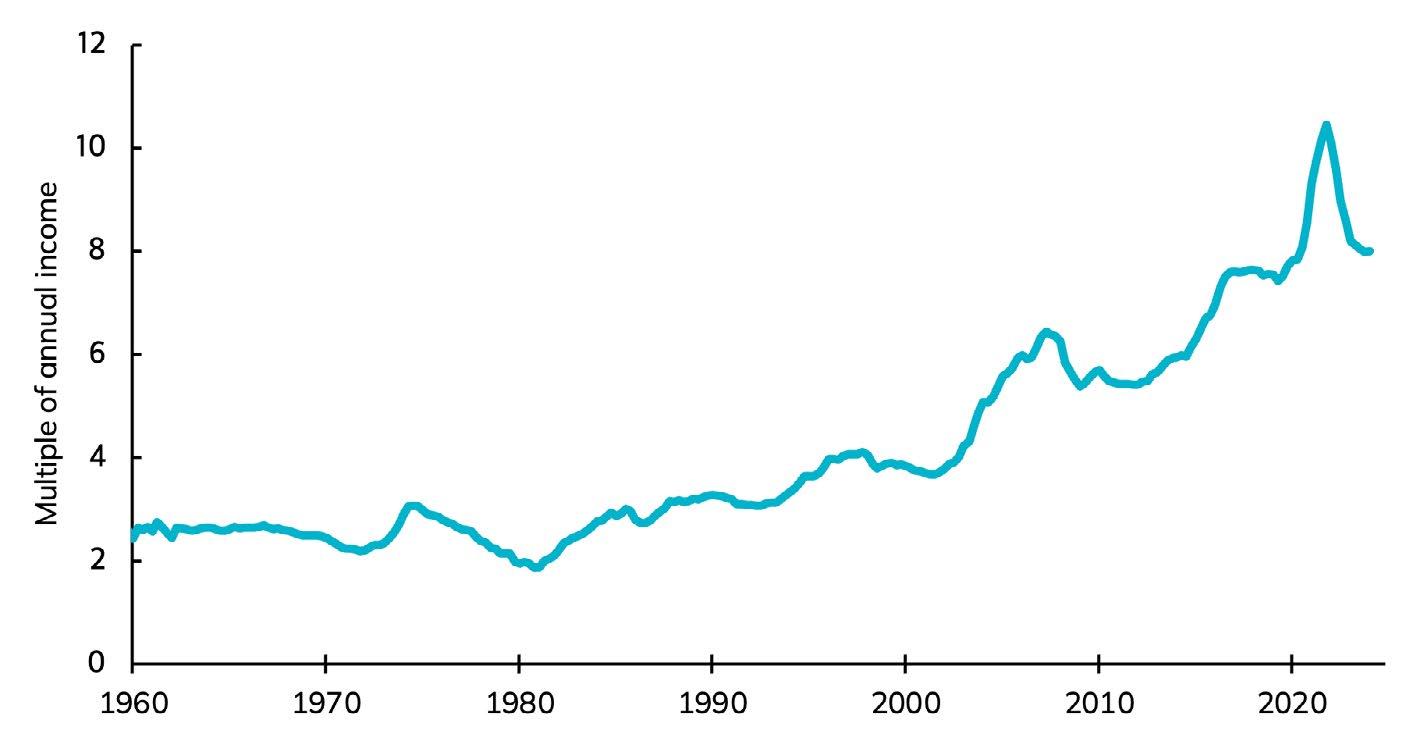
New Zealand has a very expensive housing market. House prices are high relative to incomes but have eased from extremely unaffordable levels during the pandemic (Figure 30). Low affordability affects most parts of New Zealand (Figure 31).
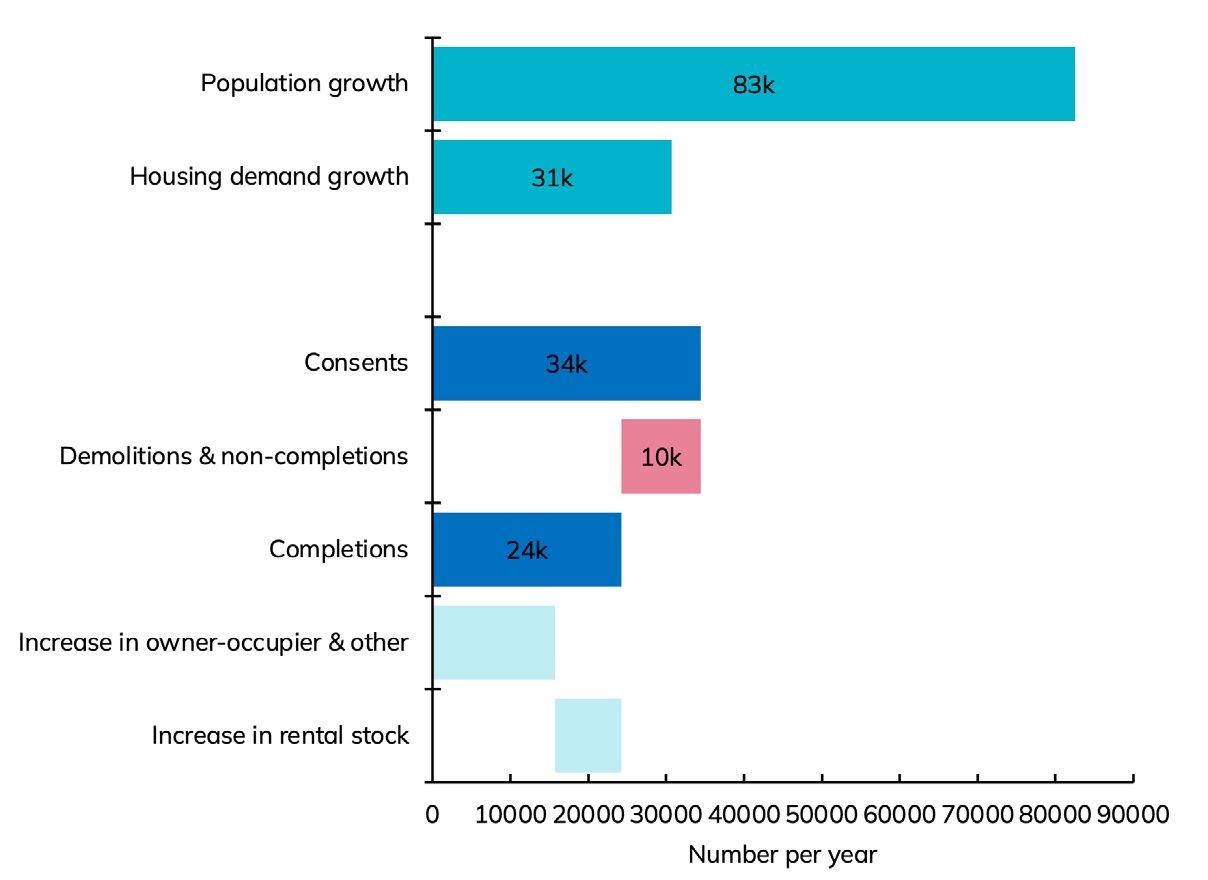
Houses are unaffordable because of a long accumulation of undersupply – supply did not keep pace. Restrictive planning and infrastructure conditions were the main drivers. While supply is improving, it has not been enough to match demand (Figure 32). Over the decade to 2023, we needed 31,000 more homes per year but the housing stock only grew by 24,000 a year. We are still not building enough homes, and we have a large, accumulated shortfall compared to peer countries in the OECD (Figure 33).
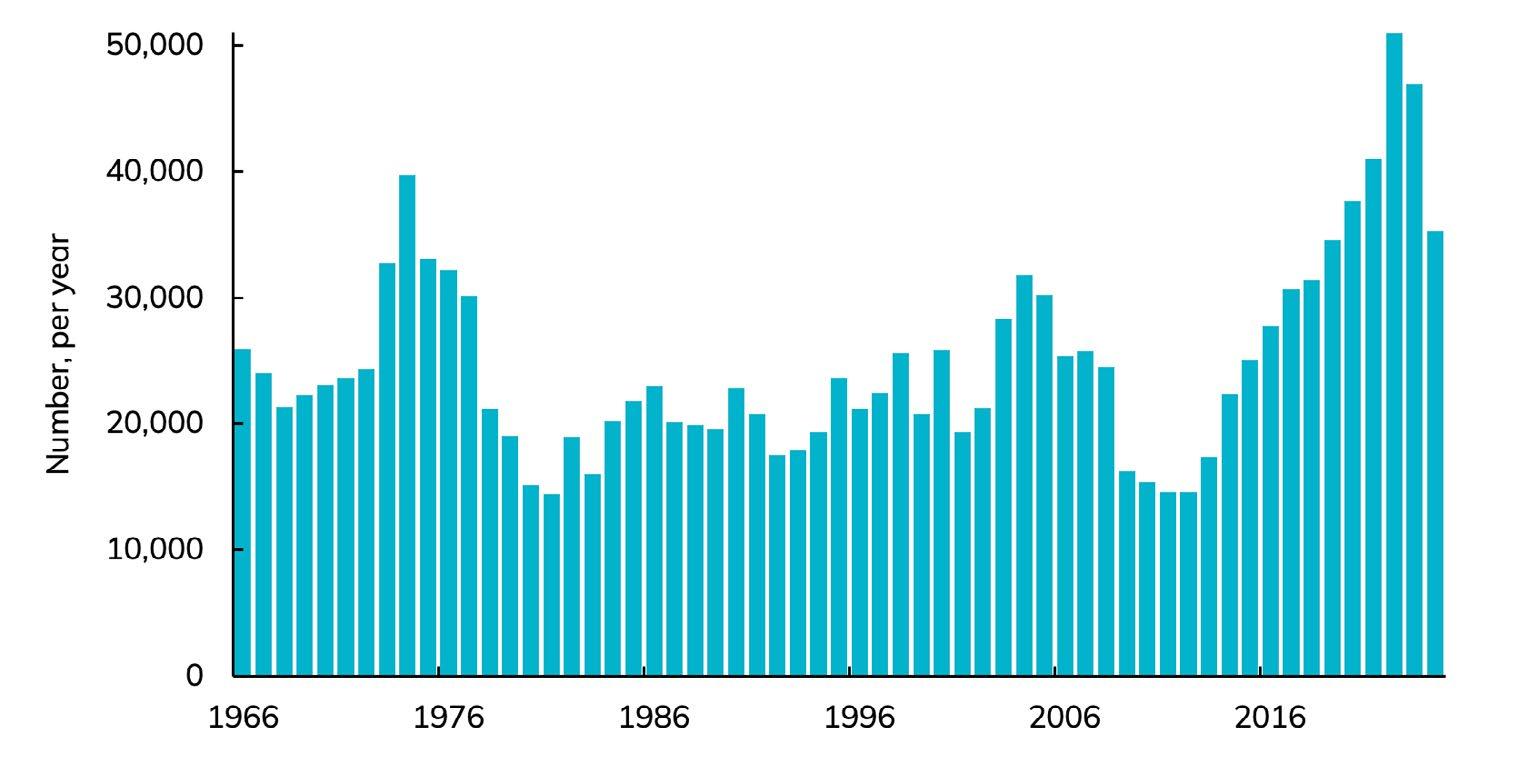
The pace of new supply has trended higher in recent years (although it has slowed since mid2023 in line with a slowing economy), driven by policy improvements (Figure 34). The Auckland Unitary Plan made planning more permissive in Auckland. The National Policy Statement on Urban Development enabled more density across large urban areas.
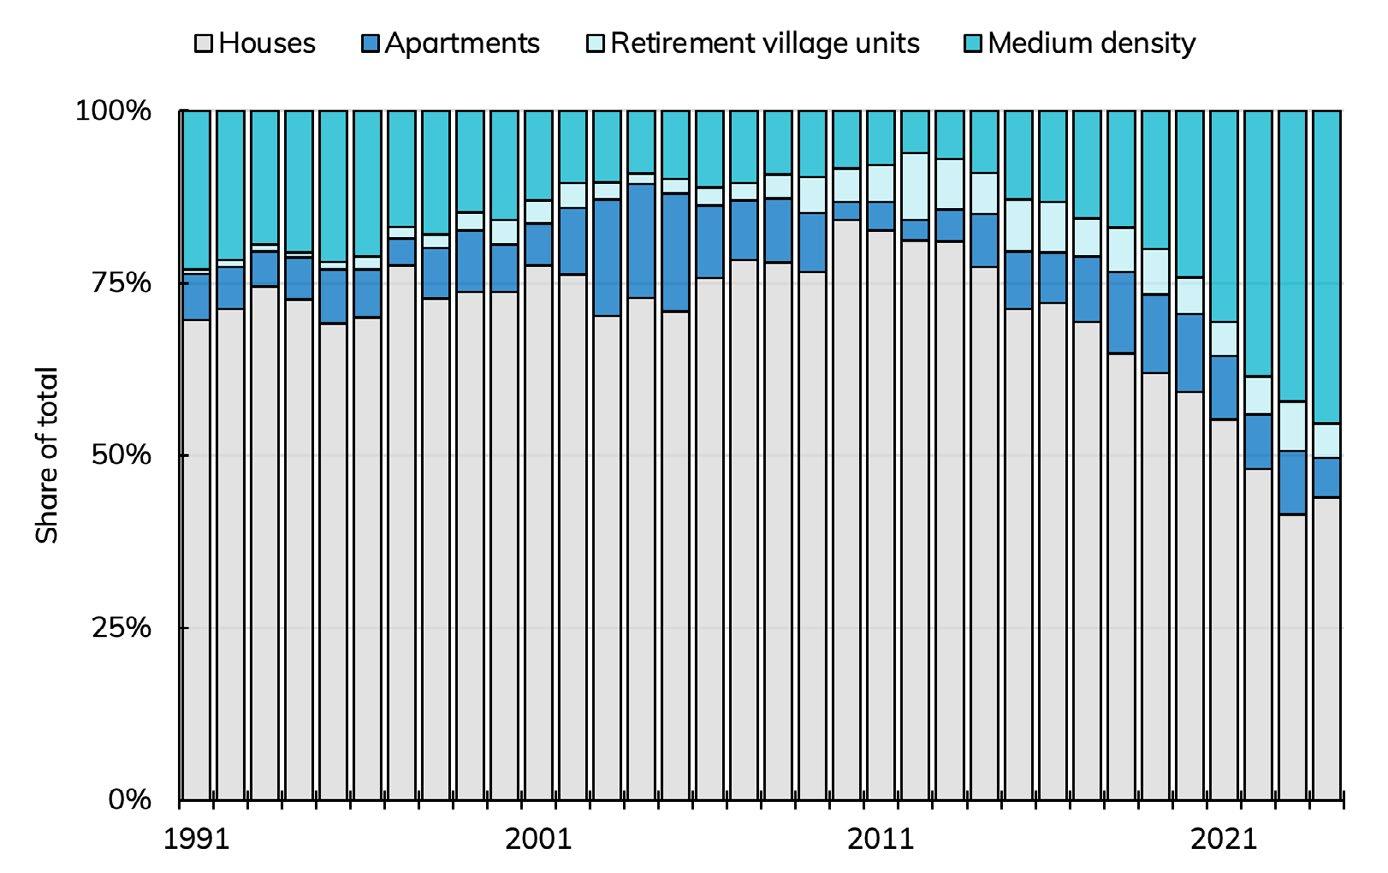
These policies are working – more homes are being consented and more than half of the new supply is higher density rather than standalone houses (Figure 35).
Progress is continuing with further reductions in planning restrictions, work on improving the Resource Management Act and local government infrastructure funding and financing, which is a critical roadblock. The housing policy environment is increasingly supportive of more activity. New Zealand needs sustained investment in new housing for many decades to meet historical housing shortages and to match growing demand in the future from a growing and ageing population (Figure 36).
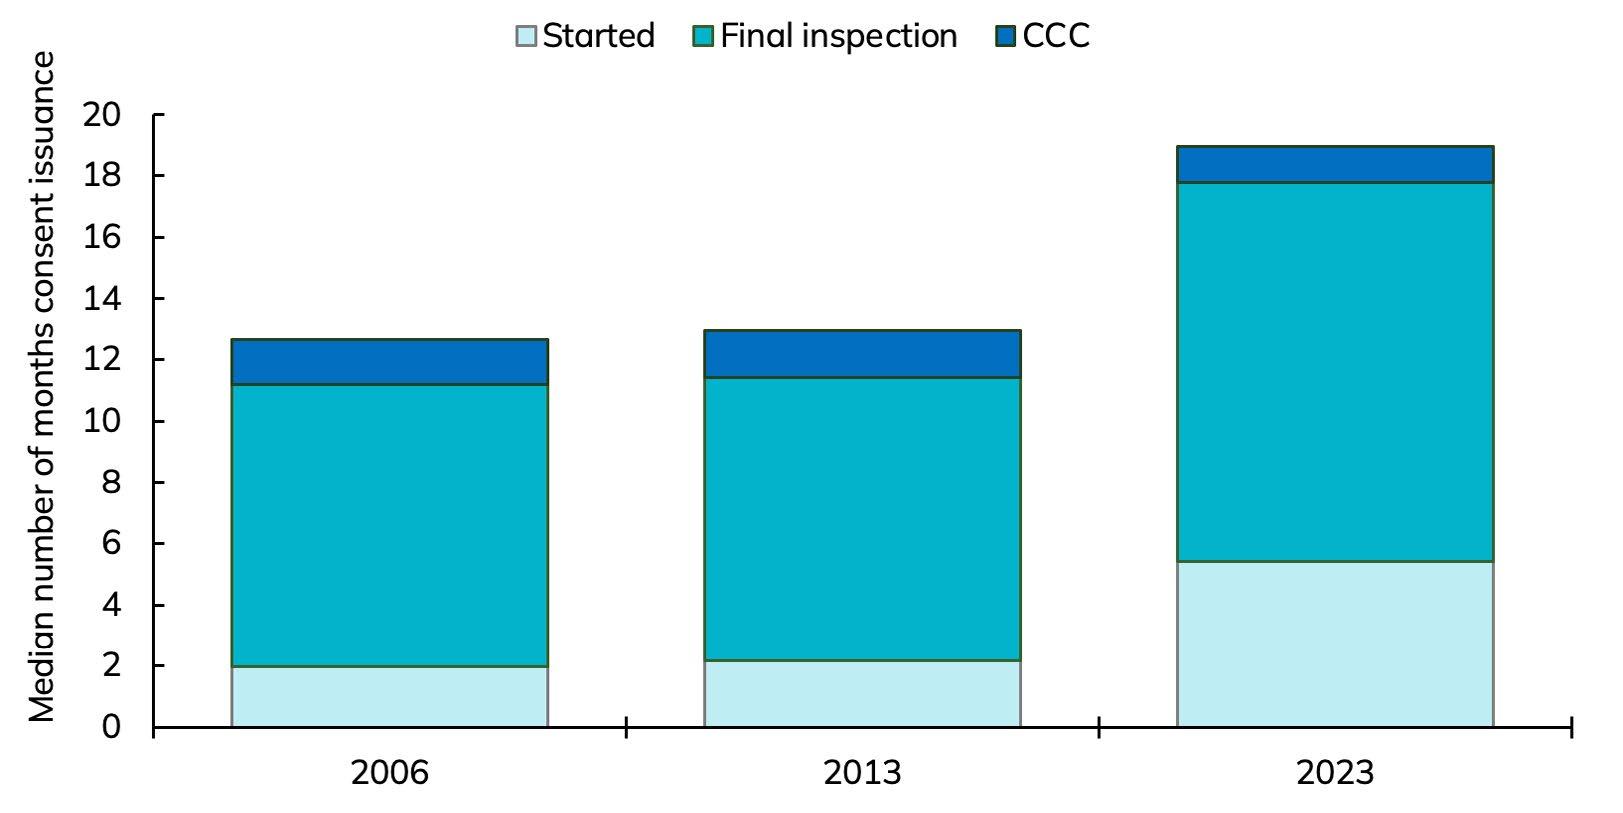
Increased volume of activity and changing mix of projects is causing pressures across the construction system. The time to build a home has increased by 50% in recent years from 13 months to 19 months (Figure 37). Previous experience suggests these delays are a product of the economic cycle – capacity did not keep up with the volume of work leading the longer build times. Growing capacity in know-how in the workforce (including in regulators like building consenting authorities) should alleviate these issues in the future.
The housing construction sector faces a cyclical downturn but very expensive housing confirms persistent housing shortages. Massive existing need, growing demand and a more enabling policy environment all suggest the strategic outlook for residential construction is strongly positive.
Residential construction builders need to navigate and understand their stakeholders and customers closely. For developers, it is about ensuring access to well-priced and relatively patient capital, because the timing of the upturn is uncertain. For those selling direct to consumers, it is important to start engaging now so that your customers know that it is a great time to build. There is plenty of capacity in materials, people and trades, meaning projects can be delivered at pace and at good value for money.
Figure 30: New Zealand house prices are very high relative to incomes …
House price: multiple of income
Source: Author estimates from Stats NZ source data
Figure 31: … affecting most parts of New Zealand.
House price to income by Territorial Authority 2001 2023


Source: Author estimates from QVNZ and Stats NZ source data
Figure 32: Housing demand has been outstripping supply for decades
Components of housing demand and supply: decade to 2024
Source: Author estimates from Stats NZ source data
Figure 33: We start with a shortage of homes
Additional houses to match selected countries
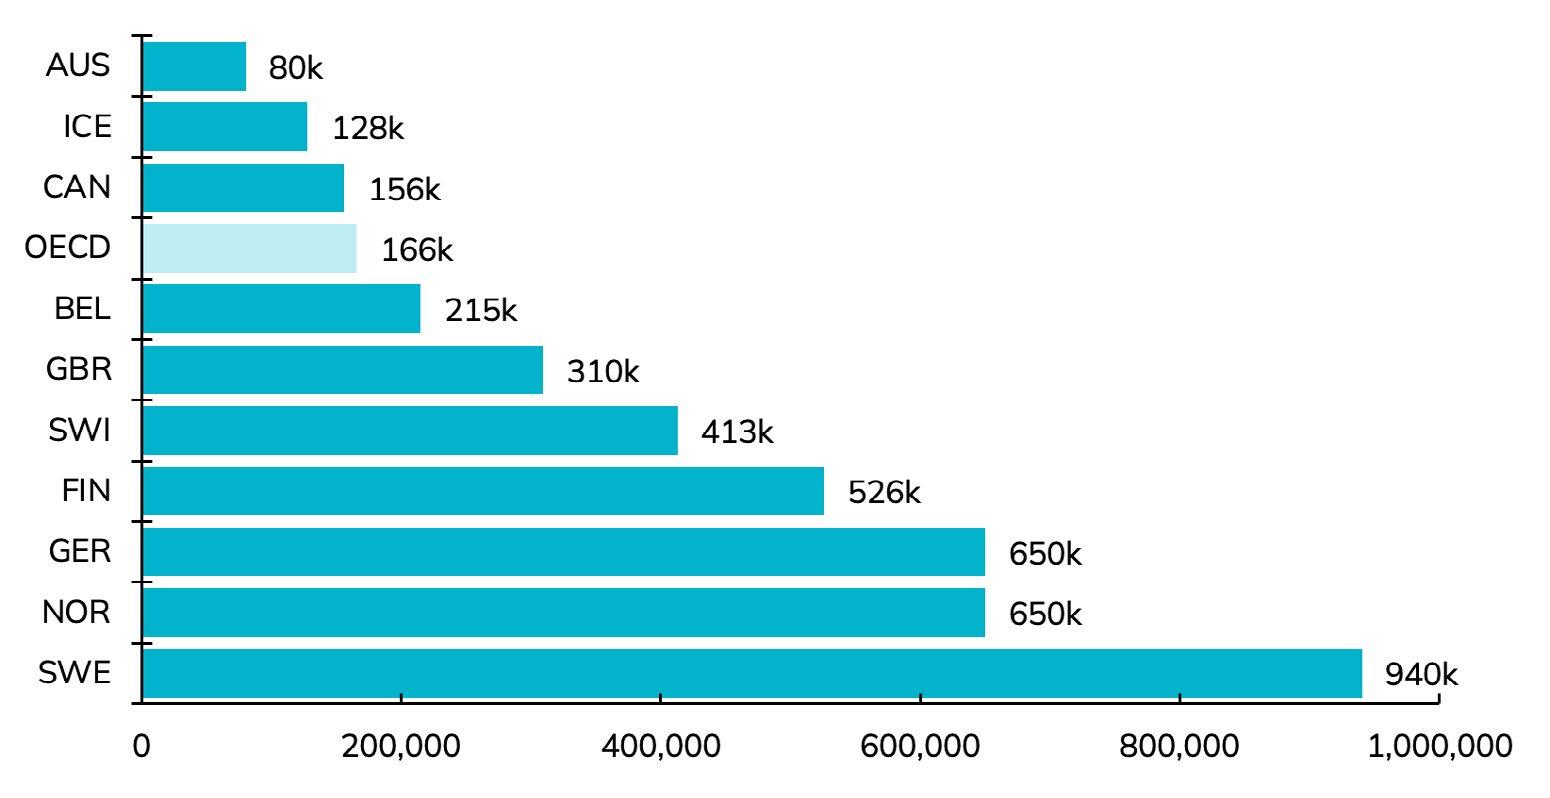
Source: Author estimates from Stats NZ source data
Figure 34: New Zealand is building more, enabled by better policies
Dwelling consents
Source: Author estimates from QVNZ and Stats NZ source data
35: Stand-alone houses are no longer the most common type of new home, edged out by more density
Composition of residential consents
Source: Author estimates from Stats NZ source data
Figure 36: Housing demand is being driven by population growth and an ageing population (who live in smaller households)
Drivers of New Zealand population growth by decade
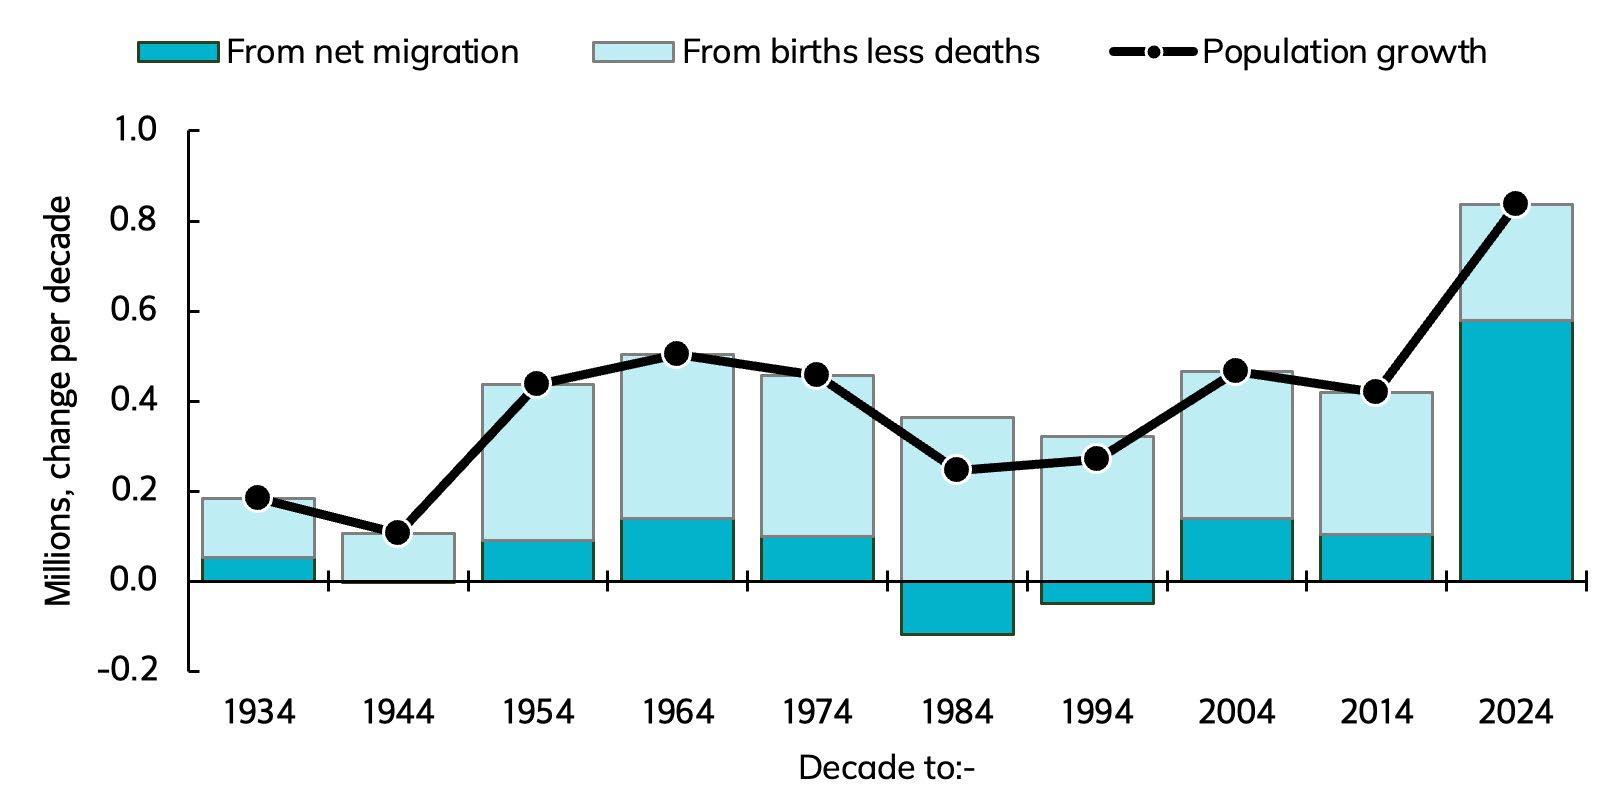
Source: Author estimates from Stats NZ source data
Figure 37: Build times have increased by 50% in recent years due to capacity issues and changing mix of buildings (more medium density)
Time to build a house
Source: Author estimates from Stats NZ source data
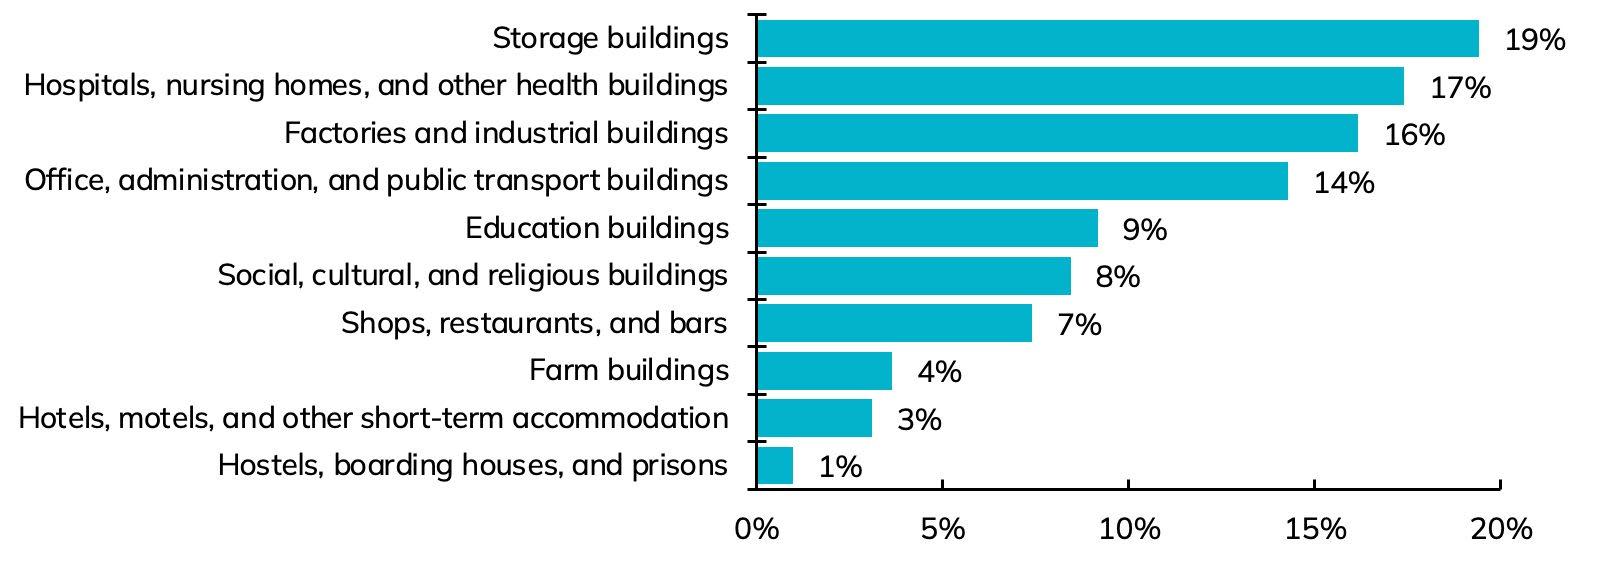
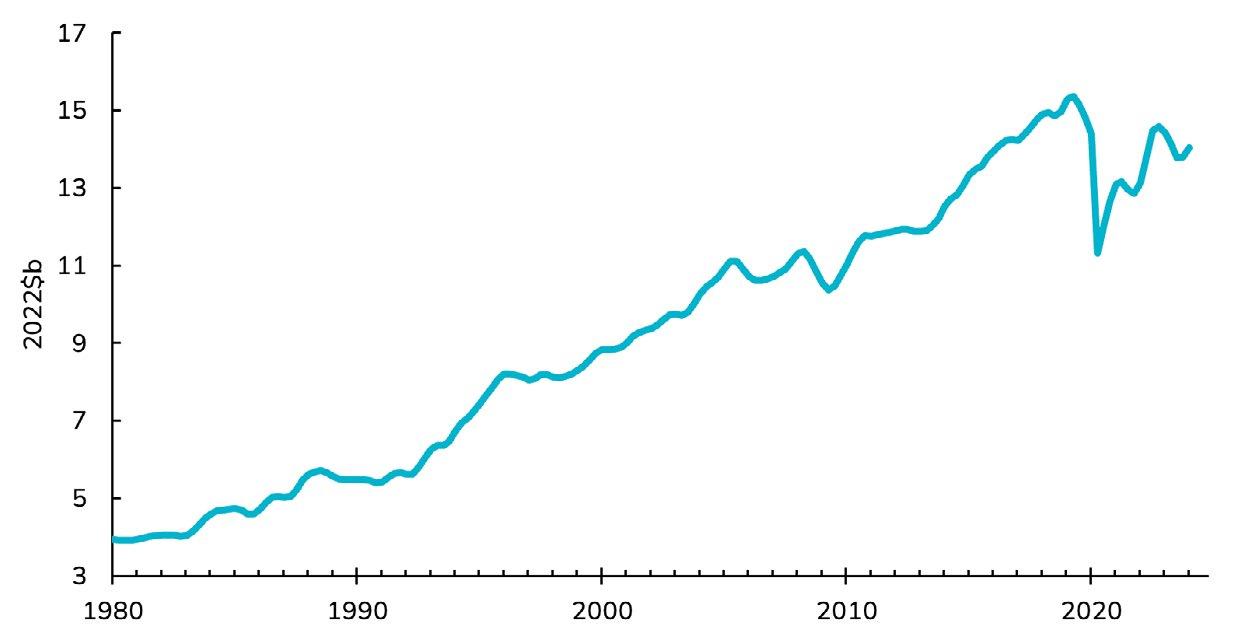
The non-residential construction sector is diverse. It covers prisons to hotels, factories to offices (Figure 38).
Three broad categories are useful to consider: retail, office and industrial. The others are largely government (health, education, prisons, stadiums, etc.), driven by political and policy forces rather than economic drivers.
The retail sector has not built much new capacity in recent years (Figure 39) consistent with slowing retail spending (Figure 40). The longer-term outlook is positive – a growing and wealthier population will drive demand for retail and hospitality spaces. This will be boosted by changing geography, especially as large urban centres like Auckland sprawl.
The accommodation sector (hotels, motels and similar) has not built much since the pandemic (Figure 41). There is significant pent-up demand for new high-grade stock (Figure 42), but an uncertain recovery from the pandemic and current recession has delayed new supply. A recovery in tourism will expose unmet demand and spur accelerated investment over the coming decade.
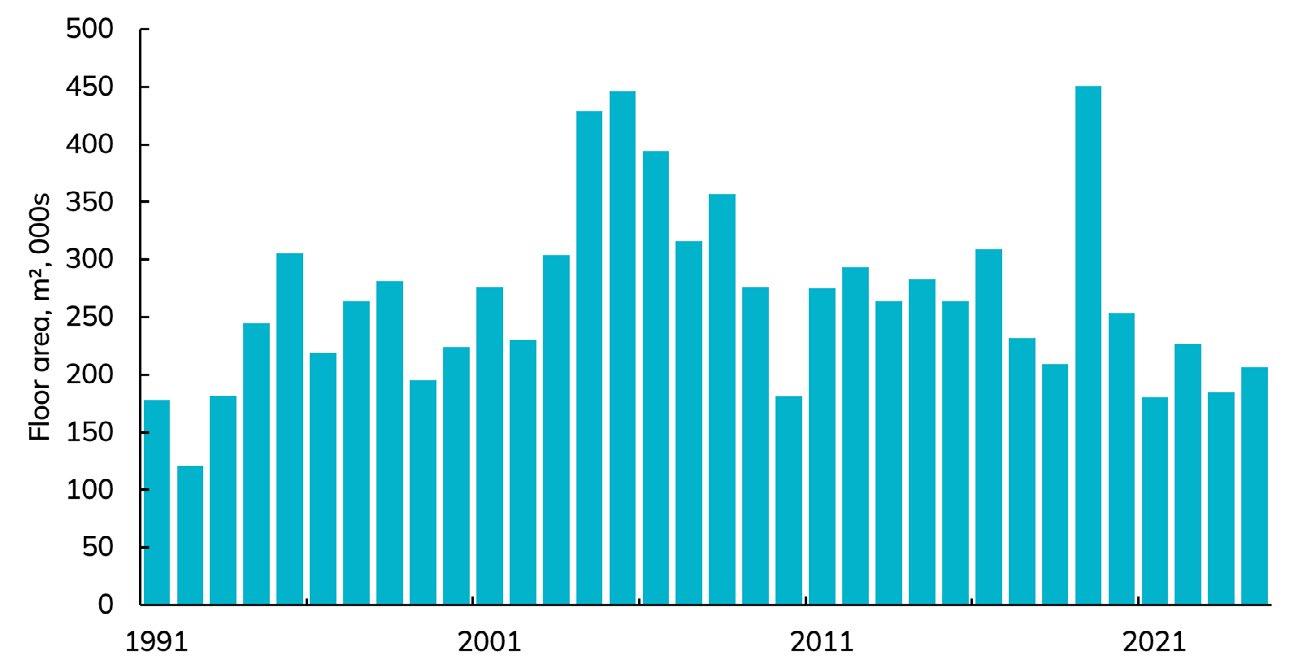
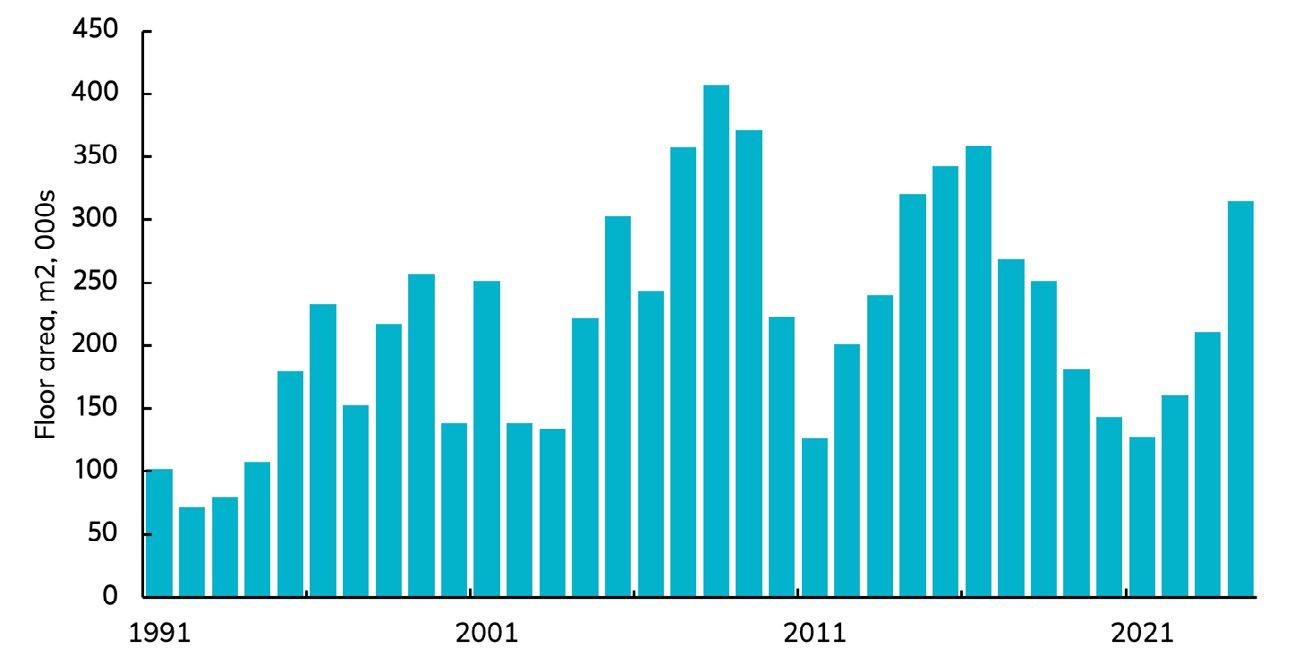
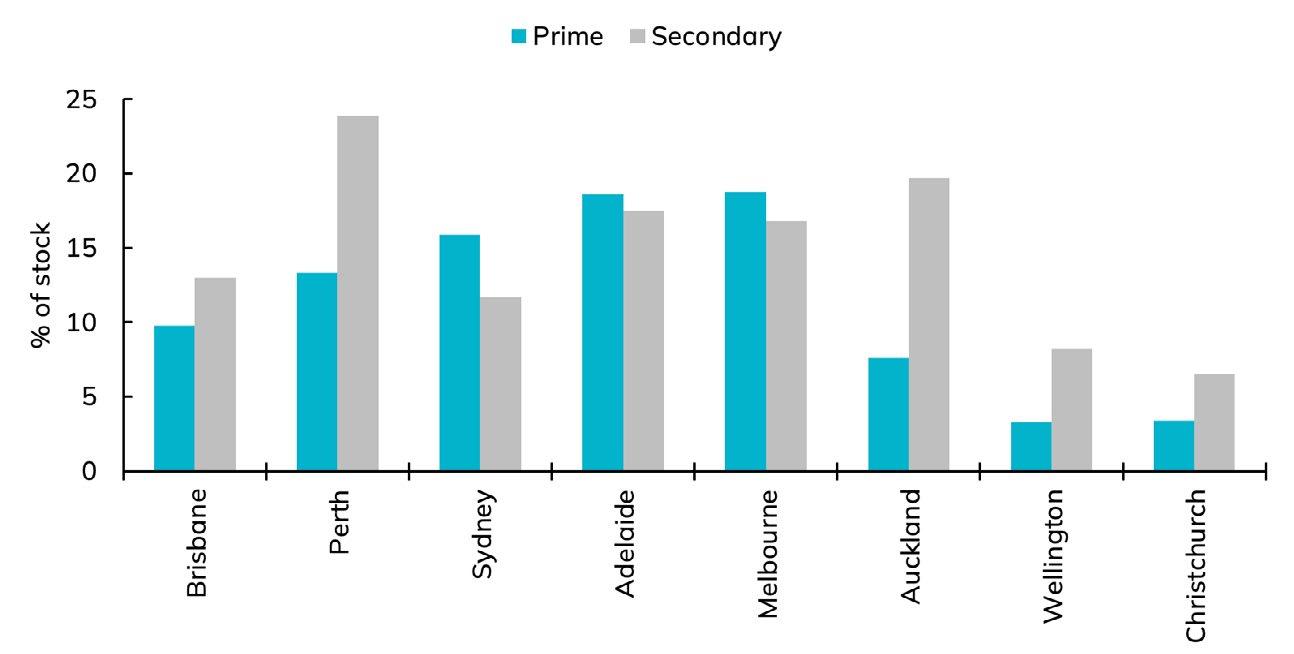
Office supply has accelerated in recent years
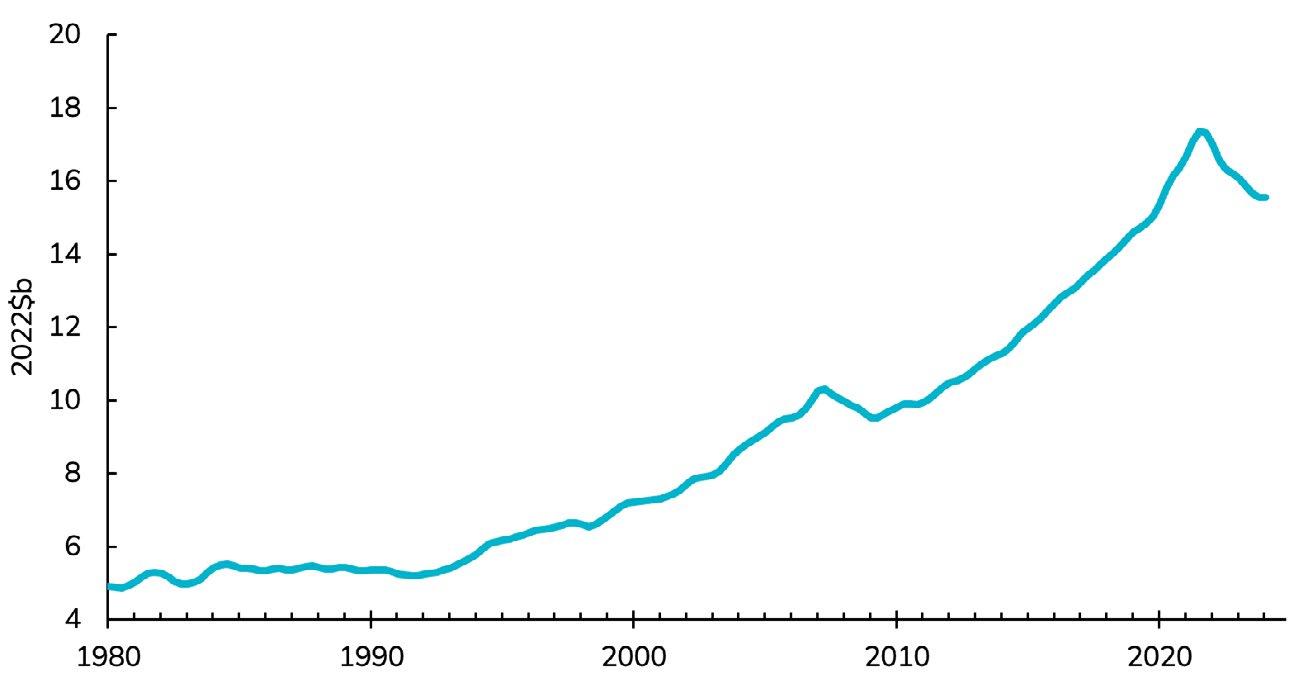
(Figure 43) but vacancy rates remain very low for premium buildings (Figure 44). Older secondary stock is getting harder to let, which could lead to change of use (for example, conversion to residential). Secular growth in the services economy will continue to lift office demand in the longer term (Figure 45). Public sector also added to demand for office space, which grew for 20 years after 20 years of stagnation (Figure 46), but may now be a entering a period of consolidation.
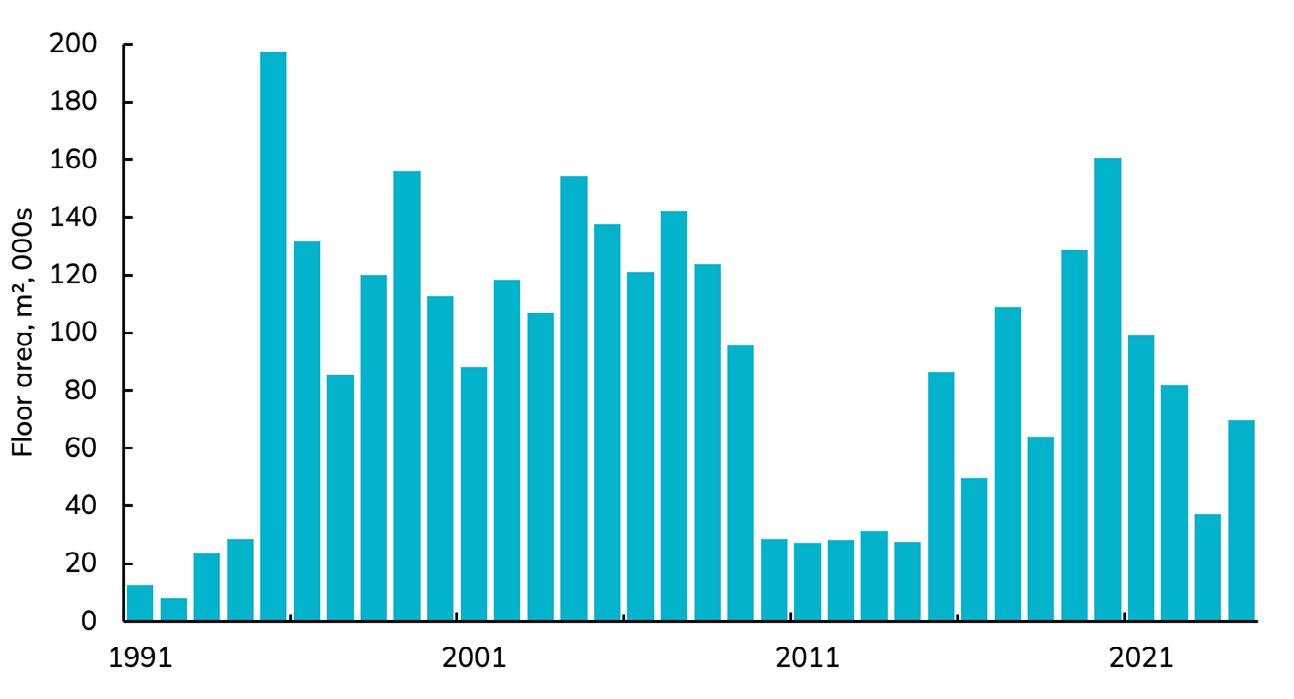
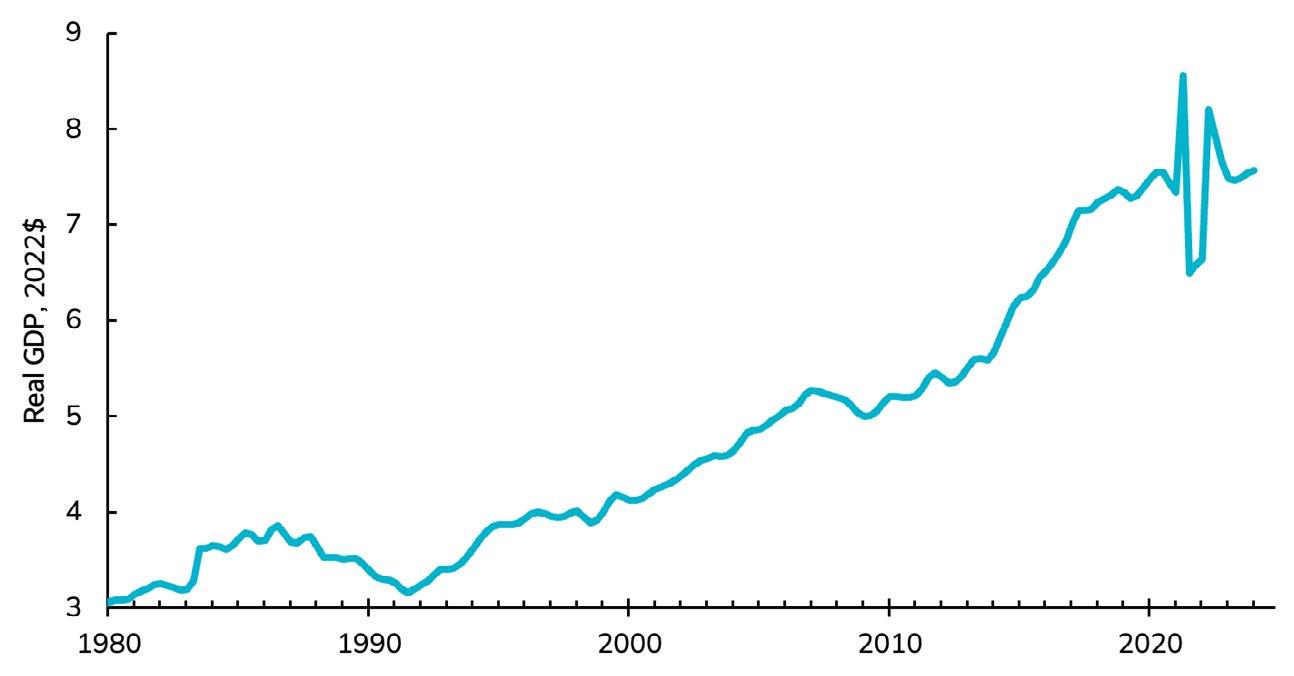
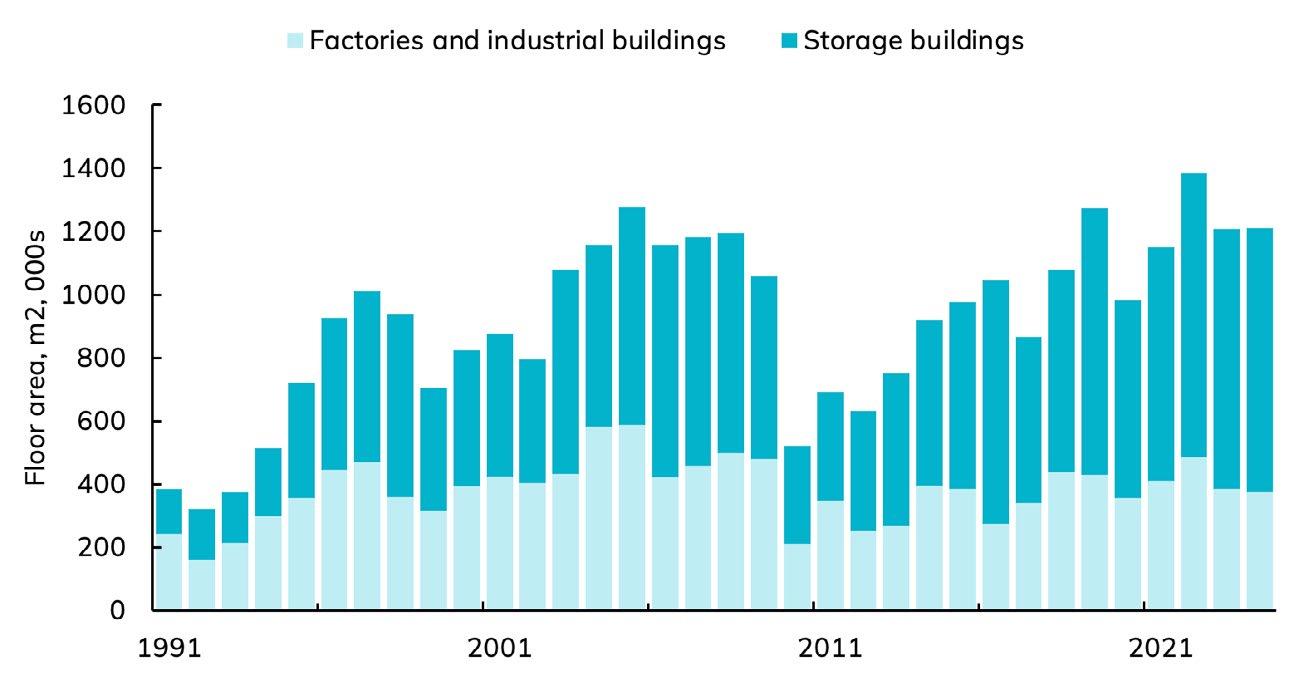
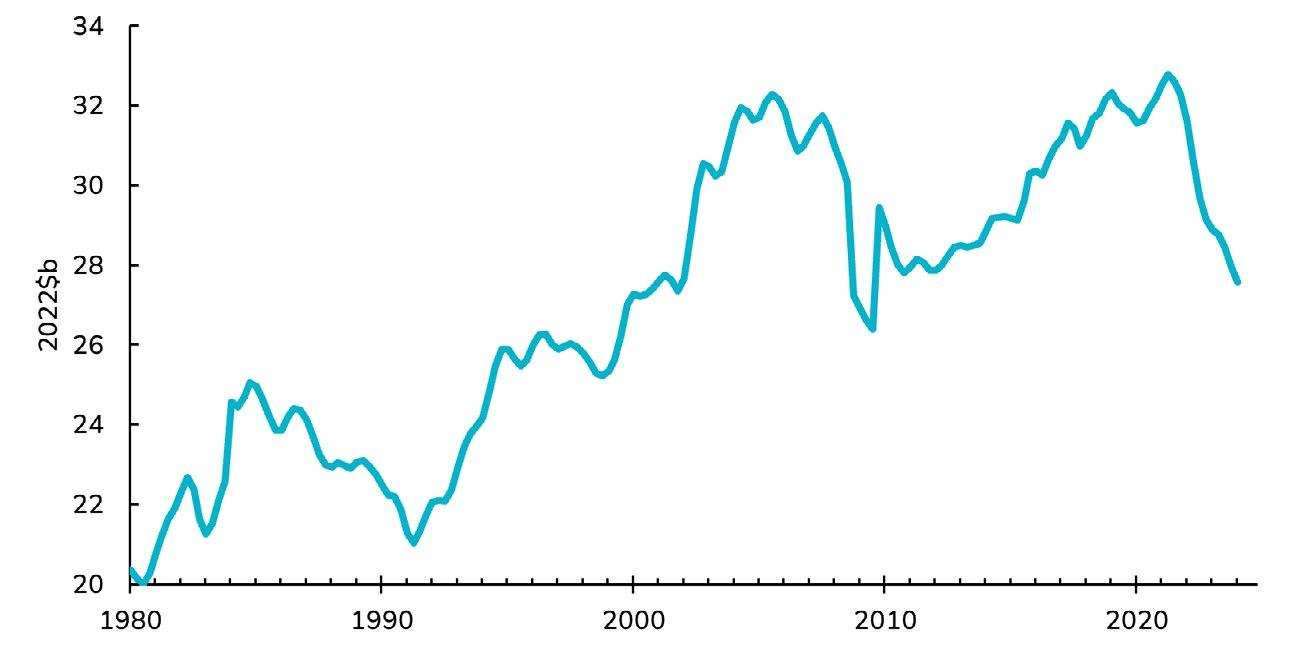
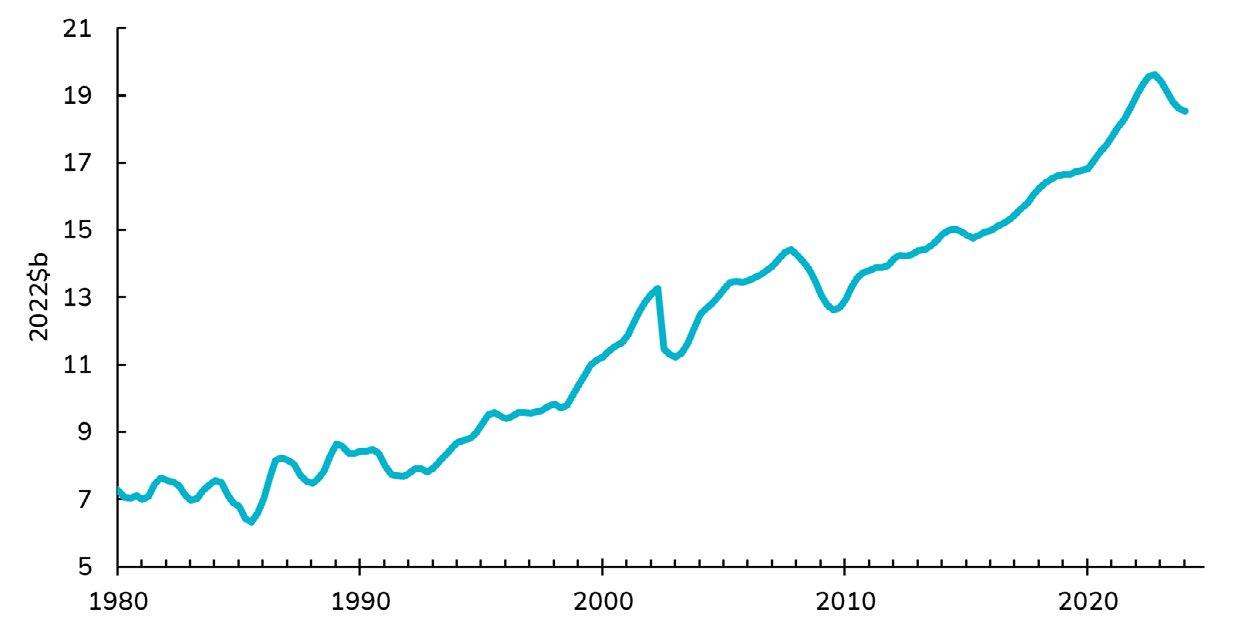
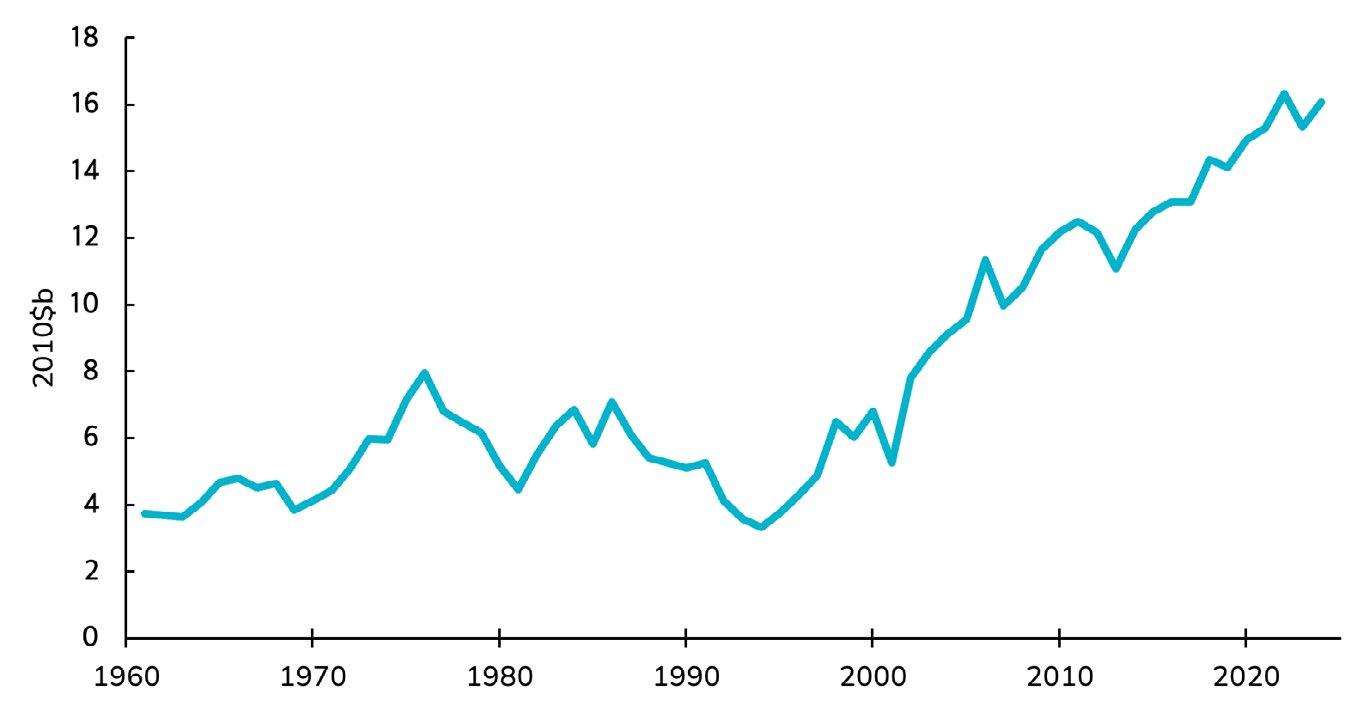
Industrial building supply has accelerated in recent years driven by storage buildings (Figure 47). This is because there is a greater penetration of delivery and businesses inventory is managed differently (holding less stock but moving it more rapidly). There is subdued demand for factory space in line with weak manufacturing sector prospects (Figure 48). The outlook for industrial building construction is segmented – storage demand will continue to be high (Figure 49 and Figure 50) but factory demand is less likely.
The non-residential building segment is an odd collection and the customers are inherently different, responding to different drivers. For businesses servicing this broad category, understanding your segment and customer is critical. The overall economic conditions will become more supportive over the course of 2025, but the pace and scale of recovery will be subject to prevailing shortages and demand conditions.
Source: Author estimates from Stats NZ source data
Figure 39: Retail consents have been stable in recent years…
Consents: Shops and restaurants
Source: Author estimates from Stats NZ source data
Figure 40: … consistent with slowing retail sales reducing confidence and demand – long-term outlook is positive
GDP: Shops and restaurants
Source: Author estimates from Stats NZ source data
Figure 41: Accommodation supply has been subdued since the pandemic …
Consents: Accommodation
Source: Author estimates from Stats NZ source data
Figure 42: … but there is pent-up demand for new stock, which will be needed as the economy recovers and tourism grows
GDP: Hospitality
Source: Author estimates from Stats NZ source data
Figure 43: Office supply has accelerated in recent years…
Consents: Office
Source: Author estimates from Stats NZ source data
Figure 44: … but vacancy rates are still very low for prime quality building, although vacancy is increasing for lowergrade building
Office vacancy rates: New Zealand and Australia
Source: Author estimates from Stats NZ source data
Figure 45: The economy is increasingly moving towards services, which drives demand for office space (in the private sector)
GDP: Private services
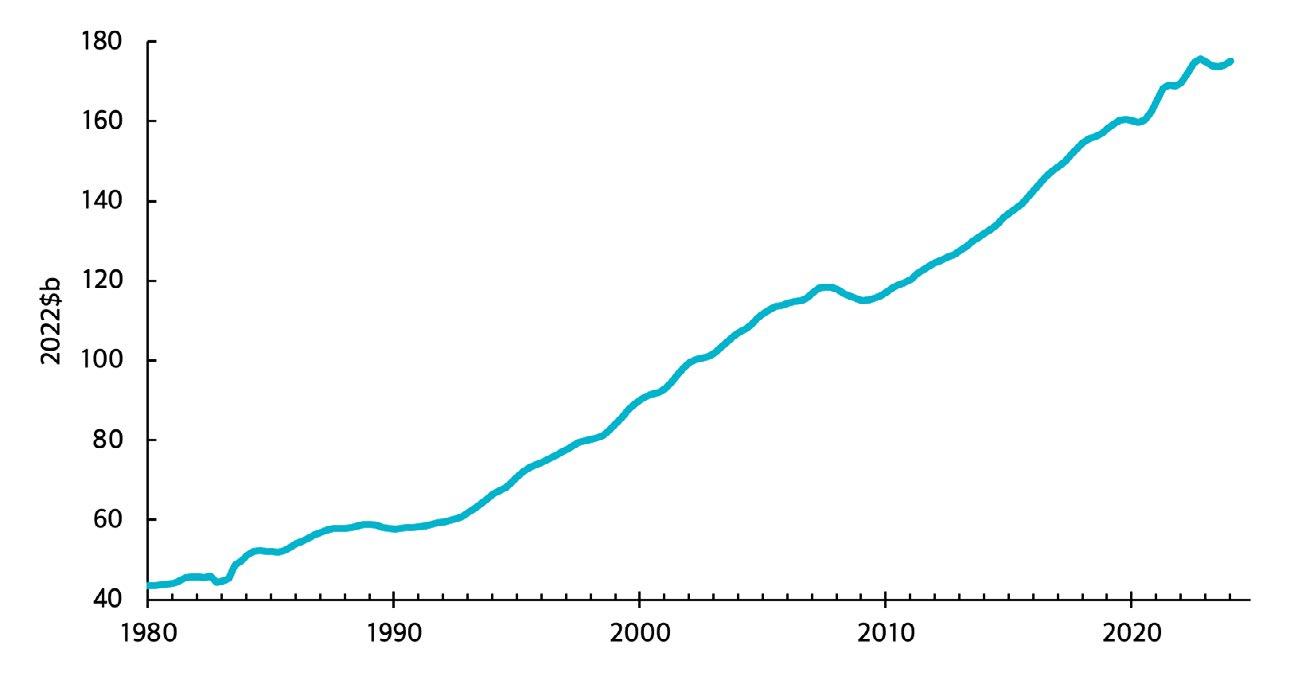
Figure 46: Government sector didn’t grow for 20 years from 1980 but then grew a lot for the last 25 years – there is risk of a long period of austerity/consolidation that will affect office demand in Wellington
GDP: Government services
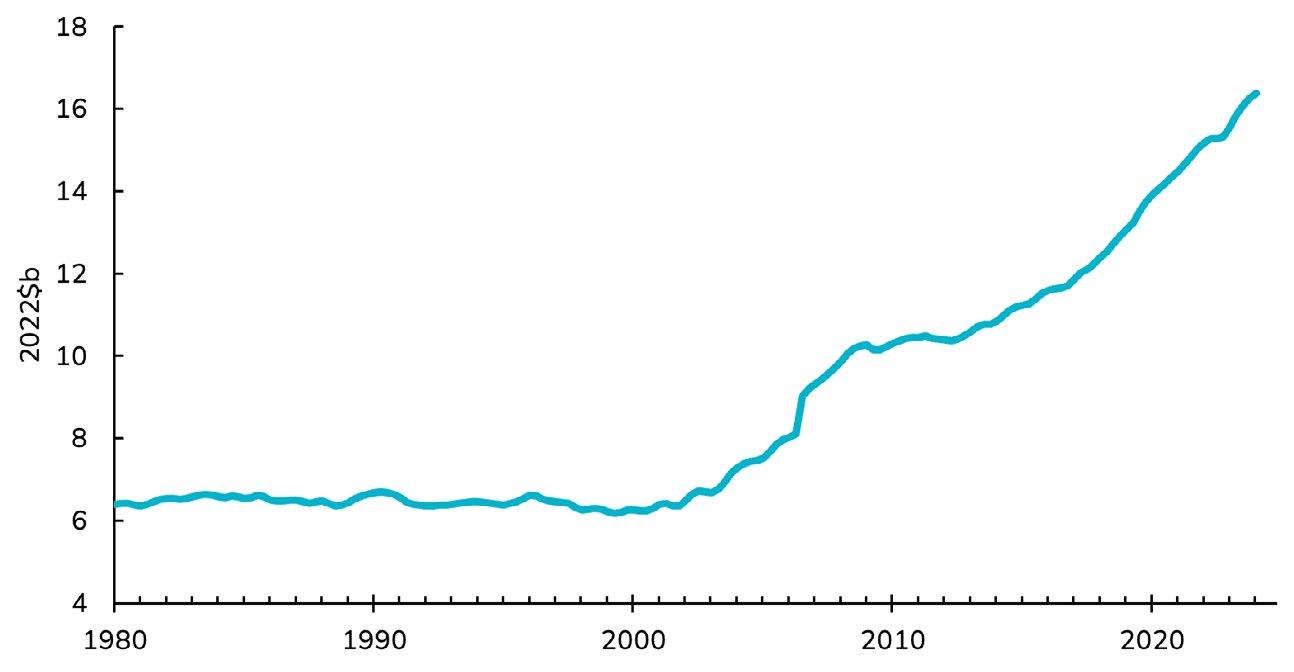
Source: Author estimates from Stats NZ source data
Figure 47: Industrial buildings have been growing at a steady clip, with much of the demand from storage space rather than factories.
Consents: Industrial and storage
Source: Author estimates from Stats NZ source data
Figure 48: The manufacturing sector is shrinking and faces de-industrialisation risks
GDP: Industrial and storage
Source: Author estimates from Stats NZ source data
Figure 49: There is a structural increase in wholesale and…
GDP: Wholesale
Source: Author estimates from Stats NZ source data
Figure 50: … logistics, reflecting a wider trend towards holding less inventory and increasing product turnover, which requires more storage and distribution space
GDP: Transport
Source: Author estimates from Stats NZ source data
New Zealand has an estimated $204b infrastructure shortfall. To maintain existing assets and fill that shortfall would require $1,000b of investments over the next 30 years. New Zealand cannot afford to invest such huge sums, but infrastructure renewals and efforts to close this infrastructure gap create an extremely positive long-term outlook for infrastructure construction (Figure 51).
A key risk for infrastructure is that government is the main client and project choice and funding can be affected by a change in government or government preferences. This is likely to affect the types of projects rather than an overall desire to improve the quality of existing assets, catch up on the deficits and expand infrastructure capacity.
For local government projects, there is more certainty now that the Long Term Plans are completed. We will see local government clients beginning to commission a new programme of work soon. Firms should engage with local government procurement teams to understand
the pipeline of work and the procurement methods that will be used. Some approaches, such as panels are time consuming, but can be rewarding in terms of improving and deepening client-supplier relationships, leading to increased productivity and lower hurdle for winning future work.
For central government projects, the May 2024 budget allocated funds. Now the work begins to map the funds and government priorities to projects. Because this is the first budget of the new government, there will be a lag before this process is completed, projects are designed, procured and constructed. There will be a pause, before work picks up. Civil and heavy engineering construction firms need to pay close attention to the type and timing of work in the pipeline, as they will need to either retain existing staff through this pause in activity, or may need to pivot to different types of work, requiring new staff or invest in training.
The long-term outlook for infrastructure investment is positive, because New Zealand is just so short. But politics remains the biggest risk to stability of the type and volume of work.
Figure 51: Government investment has accelerated since the early 2000s, and this will continue
Government investment
Source: Author estimates from Stats NZ source data
The New Zealand construction sector is large with $99b in revenue in 2024. It employs a big swathe of the country – over 300,000 people directly and close to 270,000 in suppliers of materials and services.
The work is important and necessary. New Zealand has shortages of houses and infrastructure. Improving policy settings and shortfalls will accelerate housing supply over the
coming decade. Growing political consensus (on the issues if not the projects) will sustain strong infrastructure investment.
To meet the needs of the future, the sector must mature. A key part of that is improving productivity by working with less ambiguity, streamlining work and investing in upskilling our people.
Barbosa, F., Woetzel, L., Mischke, J., Ribeirinho, M., Sridhar, M., Parsons, M., Bertram, N., & Brown, S. (2017). Reinventing construction through a productivity revolution. McKinsey Global Institute. https://www.mckinsey.com/capabilities/operations/our-insights/reinventing-construction-through-a-productivityrevolution
Construction Leadership Council. (2023). Creating a productive environment for UK construction. https://www.constructionleadershipcouncil.co.uk/wp-content/uploads/2023/09/Creating-a-productive-environmentfor-UK-Construction.pdf
D’Amico, L., Glaeser, E., Gyourko, J., Kerr, W., & Ponzetto, G. (2024). Why has construction productivity stagnated? The role of land-use regulation. SSRN Electronic Journal. https://crei.cat/wp-content/uploads/2024/02/WCPS.pdf
D’Amico, L., Glaeser, E., Gyourko, J., Kerr, W., & Ponzetto, G. (2024). Why has construction productivity stagnated? The role of land-use regulation. SSRN Electronic Journal. https://crei.cat/wp-content/uploads/2024/02/WCPS.pdf
Dixit, S., Mandal, S. N., Thanikal, J. V., & Saurabh, K. (2017). Evolution of studies in construction productivity: A systematic literature review (2006–2017). Ain Shams Engineering Journal, 10(3), 555–564. https://doi.org/10.1016/j.asej.2018.10.010
Durdyev, S., & Mbachu, J. (2011). On-site labour productivity of New Zealand construction industry: Key constraints and improvement measures. Australasian Journal of Construction Economics and Building, 11(3), 18–33. https://doi.org/10.5130/AJCEB.v11i3.2120
Frontier Economics. (2022). Transforming Construction Challenge evaluation – Phase 2: Impact evaluation. https://www.ukri.org/wp-content/uploads/2022/02/IUK-160222-ISCFTransformingConstructionChallengeEvaluation. pdf
Goolsbee, A., & Syverson, C. (2019). The strange and awful path of productivity in the U.S. construction sector. National Bureau of Economic Research. https://doi.org/10.3386/w30845
Hamza, M., Shahid, S., Bin Hainin, M. R., & Nashwan, M. S. (2019). Construction labour productivity: Review of factors identified. International Journal of Construction Management, 22 (3), 413–425. https://doi.org/10.1080/15623599.2019.1627503
Hasan, A. Baroudi, B., Elmualim, A., & Rameezdeen, R. (2018). Factors affecting construction productivity: A 30-year systematic review. Engineering, Construction and Architectural Management, 25(7), 916–937. https://www.emerald.com/insight/content/doi/10.1108/ECAM-02-2017-0035/full/html
Kirby, M., Rotimi, F., & Naismith, N. (2022, December 1–2). An investigation into quality management systems and factors affecting construction productivity: The New Zealand residential construction industry [Paper presentation]. 55th International Conference of the Architectural Science Association, Perth, Australia. https://archscience.org/wp-content/uploads/2023/03/14-An-investigation-into-quality-management-systems-andfactors-affecting-construction-productivity.pdf