A documentation and analysis of the AI epidemic in the USA in 2022

Early lay diet density and hen size: do they affect hen productivity and egg quality in late lay?
Feeding a synergistic blend of organic acids and ß-1,4 mannobiose reduces caecal salmonella in broiler chickens
3
Zootecnica International –March 2023 –POSTE ITALIANE Spa –Spediz ione in Abbonamento Postale 70%, Fir enze
2023
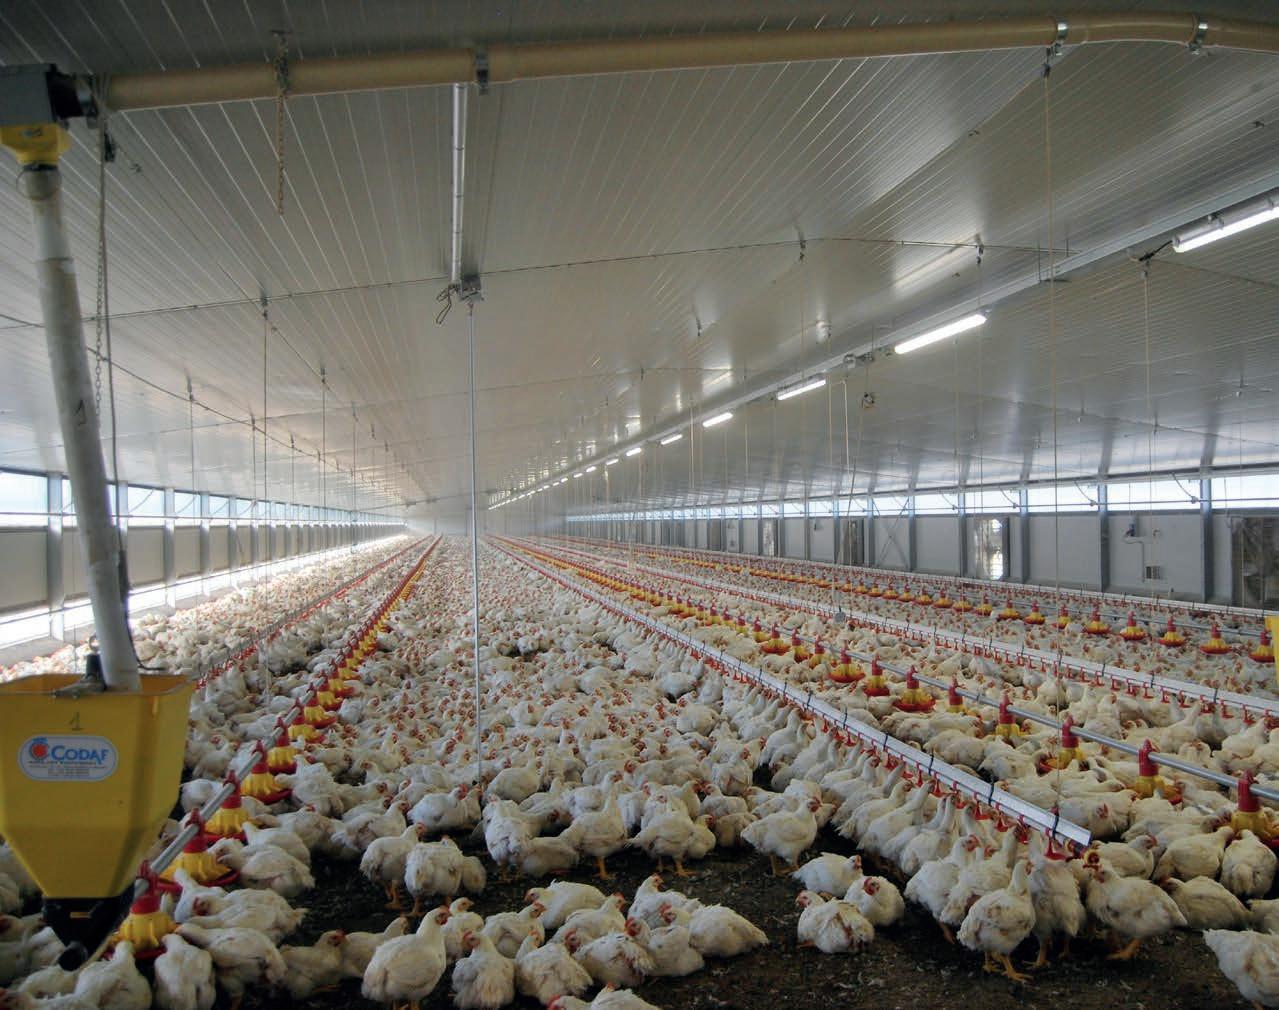
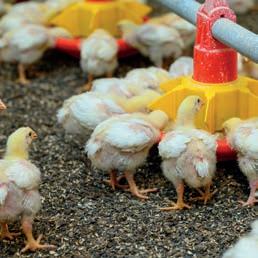
The new feeders of the «Gió» range, specifically developed for great poultry farms, thanks to the easiness in the regulation of the feed and to the absence of grill (that avoid chicks perching) have many advantages: they are easy to use and their cleaning is extremely easy and fast too, leading to an overall reduction in labour costs.

CODAF
Equipment Manufacturers •
74/76 • 25010
ITALY Tel. +39 030 9958156 • Fax: +39 030 9952810 • info@codaf.net • www.codaf.net
Poultry
Via Cavour,
Isorella (Brescia),
EDITORIAL
The negative effects caused to the entire poultry sector by a documentary broadcast in January on the Italian television programme “ Report ” should make us once again reflect on the erroneous communication approach we have, so far, had towards the consumer. The “ Report ” case is the most recent example.

As early as the 1960s, when chicken meat began to be produced on an industrial scale, scandalous articles have appeared in Italian newspapers trying to discredit poultry farming. One of the most frequent allegations was that chickens and turkeys were being fed hormones. Apart from the ethical aspect, it was enough to reply by explaining that, given, the short growing cycle of poultry flocks the cost of using hormones could not be justified. Regretfully none of the main poultry producers replied to this criticism.
The ignorance on the subject was such that even several doctors advised against poultry meat for the same reason. Such ignorance still reigns supreme among most consumers. For decades, advertising has helped shape the collective imagination, evoking happy chickens and hens outdoors. The importance of documenting the great and rapid evolution of the large scale poultry sector was not best explained. The ability the industry has shown for producing products aimed at satisfying new market needs, changing food styles and guaranteeing the hygienic-sanitary safety of the products seems to have been undervalued.
The big players in the sector have not responded to the accusations from animal rights activists, greens and vegans etc. There has been a overall lack of cohesion between producers, both at national and European level, to avoid regulations that have also penalized consumers. Legislators have let themselves be influenced more by political currents than by scientific opinions. In the name of presumed sustainability or animal and human welfare, absurd regulations have been created on GMOs, antibiotics, organic farming and free-range farming. It would have been much more correct to explain that there is almost no genetically modified product in the world and that no negative effects have ever been found in humans. It would have been much more appropriate to illustrate that over the last few years the consumption of antibiotics has decreased by 80% and that, as for humans, when serious illnesses arise, these drugs cannot be eliminated. The term ‘organic’ has been given an improper definition, exploited as for GMOs, for marketing reasons.
As for outdoor farms, it would be timely to point out the greater risks of pathogens in this type of farming. It would also be appropriate to highlight the difficulties in providing outdoor space for 60 million chickens and about 50 million hens which is the current national production figures. It should be remembered that thanks to genetics, breeding technologies, animal feed, slaughtering and product processing technology, chicken has been on everyone’s table for years. We should be explaining, guided by the principles of democracy, that also in the food sector there are products on the market that cost less and others are more expensive, and we should be explaining the reasons for the differences, starting from the essential principle of safety and healthiness for both types.
The most innovative feed pan for broilers

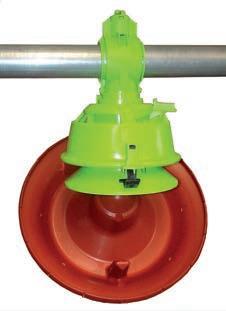

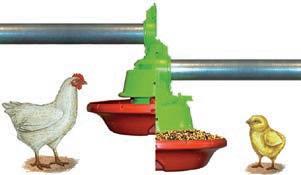


Automatic feed level adjustment from chick to adult phase with the window opening system.

Low bottom pan from one-day old to slaughtering age.
No chick trapped in the pan. Bottom pan designed to avoid feed waste.
FULLY
ONE SECOND TO OPEN
CLICK
ONE SECOND TO CLOSE
AUTOMATIC AZA International s.r.l. Via Roma 29 24030 Medolago (BG) Italy Phone (+39) 035 - 901240 - E-mail: info@azainternational.it QUALITY MADE IN ITALY Watch all information about Pratika I WANT AZA! www.azainternational.it PRATIKA
CLACK
STRUDY SUPPORT EASY CLEANING

SUMMARY WORLDWIDE NEWS 4 DOSSIER A documentation and analysis of the AI epidemic in the USA in 2022 8 FOCUS Could you survive a stop movement order in the case of a highly pathogenic AI virus outbreak? .......................................................... 16 MARKETING Patterns and dynamics of global turkey meat production and trade Part 2 – Turkey meat trade 20 MANAGEMENT Early lay diet density and hen size: do they affect hen productivity and egg quality in late lay? ............................................................................ 28 NUTRITION The challenge of reducing crude protein in meat-type chicken diets First part 32 VETERINARY Feeding a synergistic blend of organic acids and ß-1,4 mannobiose reduces caecal salmonella in broiler chickens ............................................................. 38 PROCESSING Broiler processing, product quality, and yield ................................................. 42 MARKET GUIDE 44 UPCOMING EVENTS ......................................................................47 INTERNET GUIDE 48 38 8 28
Fact.MR: poultry feed market to hit US$ 228.1 billion by 2033
The global poultry feed market enjoys a valuation of US$ 123.5 billion by 2023 and is forecasted to surge to US$ 228.1 billion by the end of 2033. This jump is because, over the course of the next ten years, worldwide sales of poultry feed are projected to rise at a CAGR of 6.3%.
Based on source, the market for poultry feed is segmented into corn, wheat, soybeans, blend grains, and others. Soybeans are rich in nutrients and have been proven to be excellent ingredients in animal feed in recent years. Its higher protein content and better amino acid profile than corn are the prime factors that are increasing its popularity among poultry farmers across the world. Changing preferences of poultry farmers are pushing poultry feed manufacturers to incorporate soybeans in their chicken feed.
However, corn remains the more used ingredient in chicken farms as it makes up for more than 1/3 of all the feed ingredients used. The use of corn is expected to witness a steady decline over the coming years as demand for high-protein poultry feed increases globally.
Competitive landscape
Increasing adoption of modern poultry systems by farmers across the world is expected to boost sales of automatic chicken feeders and this in turn is projected to favour market development across the forecast period. Chicken water feeder sales are also anticipated to witness a steady hike going forward. Chicken layer feed, hen feed, chicken scratch feed, broiler feed, quail feed, and chick starter feed are some of the most popular products in the marketplace that are estimated to maintain a bright demand outlook throughout the forecast period. Contrastingly, changing mandates regarding the use of feed additives and increasing consumer preference for fish and meat owing to relatively low pricing are prospects that could impede the consumption of poultry feed over the next ten years.
Where will most poultry feed be sourced from?
“Efforts to improve nutritional content of feed resulting in high demand for soybeans”
Poultry feed companies are focusing on sustainability and coming up with new ways to produce animal feed that causes minimal harm to the environment and reduces the overall carbon footprint of the manufacturing process.

• In November 2022, ForFarmers, a Dutch agricultural feed organization announced its plans to use alternative raw materials and food waste to manufacture new animal feeds that meet the new demand for sustainable agricultural practices.
Poultry feed providers are also investing in the expansion of their production capacity to meet rising demand from various parts of the world.
• In November 2022, Alturas Group of Companies, a diversified business for agricultural manufacturing increased its investments in the agriculture business as it recently launched a new feed mill in Marcela Farms in Ubay, Bohol.
Source: Fact.MR
4 - worldwide newsWORLDWIDE NEWS
4002 H
• 360 degrees opening
• Highly strong and durable material
• “SOFT” action
4626

• Suitable for fattening turkeys
• Perfectly dry bedding
• Simultaneous watering of 2 and more animals
INFINITY
• Essential design
• No chicks in the pan!
• Regulation of minimun and maximum feed level


• Available in caged broilers version
for breeding
PP Belts
• Egg collection


• Manure drying system

• Manure belt collection
• PP woven egg belts


• PP hole egg belts
4006 H
• 360 degrees opening


• Highly strong and durable material


• “EXTRASOFT” action
4901 N
Pressure regulator with bypass




CORTI ZOOTECNICI
ARTICLES ACCESSORIES
Corti Zootecnici Srl | Via Volta, 4 21020 Monvalle (VA) Italy| www.cortizootecnici.it |
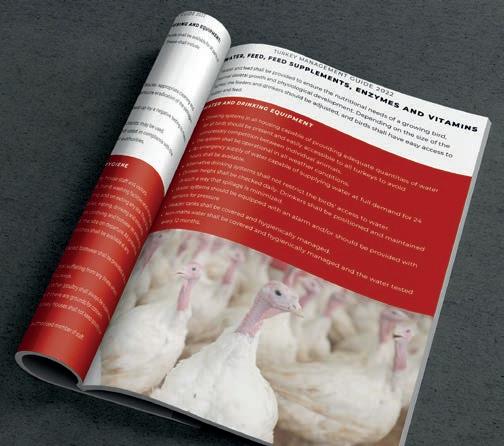
AVEC Turkey Management Guide
The major European turkey producers, members of AVEC have cooperated to establish the Turkey Management Guide. The aim is to promote harmonized best practices for European turkey rearing and to avoid that different European standard regulate the production of the European turkey producers.
AVEC, representing the European Poultry Meat Sector acknowledge that good turkey farming practice and turkey house management are vital for turkey health and welfare. Turkeys are sentient beings and shall be treated with respect. AVEC agrees with the One Health approach where the health of humans, animals and ecosystems are interconnected.
Good farm management practices are an essential aspect of jigsaw to ensure the health and wellbeing of all the interconnected elements.
Good turkey house management practices include:
• care for animal health and welfare aspects;
• turkey-specific training of staff;
• bio-security measures, daily checks and maintenance of the technical facilities;

• recording, monitoring and evaluation of results.
The health and welfare of the turkeys are the results of a combination of interactions between good turkey housing practice, the equipment, the building, the monitoring and stocking density.
Turkeys are kept in houses where the following aspects are provided:
• appropriate nutrition;
• freedom of movement;
• physical comfort and the need to perform normal behaviour;
• progress or advance in feed, housing, equipment, medicines and genetic research should be considered to improve the conditions during rearing.
This stakeholders’ agreement aims to ensure the best and quickest possible implementation of these innovations in the turkey farming.
6 - worldwide newsWORLDWIDE NEWS
Source: AVEC
National Chicken Council releases its most comprehensive Guidelines to date for well-being of broiler chickens
Consumers want to be sure that all animals being raised for food are treated with respect and are properly cared for during their lives. The people and companies involved in raising chickens for food share the public’s concern.
The guidelines include:
• the identification of Key Welfare Indicators (KWIs) including paw/footpad health, gait scoring, effective processing parameters, and minimizing leg/wing injuries;
• whistleblower protection;
• additional focus on training programs for proper handling;
• more documentation and monitoring of various practices;
• a more streamlined auditing tool for ease of auditing;
• an increased focus on bird behavior, objective measures and welfare outcomes; and
• updated scoring guides developed by the American Association of Avian Pathologists (AAAP).
NCC’s guidelines were updated with assistance from an academic advisory panel consisting of poultry welfare experts and veterinarians from across the United States and were recently certified by the Professional Animal Auditor Certification Organization (PAACO), a leading authority on animal welfare auditing who provides high quality training and certification credentials for auditors and audits.
To assist chicken producers and processors in this effort, the National Chicken Council (NCC) in 1999 developed the NCC Broiler Welfare Guidelines and Audit Checklist which have been widely adopted by chicken farmers and processors to ensure all chickens are being properly cared for and treated humanely. Annually reviewed, the guidelines cover every phase of a chicken’s life and offer the most up-to-date recommendations for the proper treatment and humane care of broiler chickens – those chickens raised for meat.
The 2023 update of the NCC Broiler Welfare Guidelines is more robust than ever before and incorporates new parameters to improve bird welfare.
“With this certification, consumers and customers can feel confident that when buying and eating chicken, the birds were well-cared for and treated humanely,” said Ashley Peterson, Ph.D., NCC senior vice president of scientific and regulatory affairs. “Our approach to the well-being of birds is to focus on objective measures and welfare outcomes throughout the birds’ entire lives by carefully observing the chickens’ behavior.”
NCC also plans to release an updated version of its Broiler-Breeder Welfare Guidelines by the end of 2023.
Source: National Chicken Council

- march 2023 - 7 WORLDWIDE NEWS
Hans-Wilhelm Windhorst The author is Professor emeritus of the University of Vechta and Visiting Professor at the University of Veterinary Medicine Hannover, Germany
A documentation and analysis of the AI epidemic in
the USA in 2022
Devastating outbreaks of the Avian Influenza virus (AI) hit the United States in 2015 and 2022. In the first half-year of 2022, there was still a certain resemblance to what happened in 2015, but the further course showed significant differences.
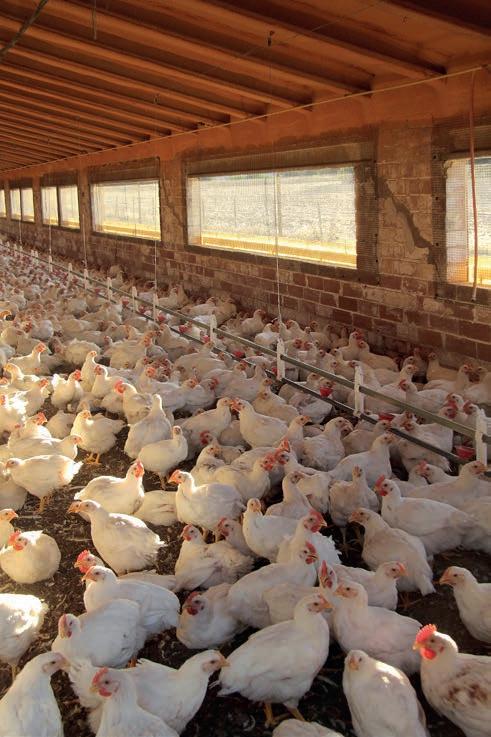
While it was still assumed in June 2022 that the outbreaks would follow the pattern observed so far and that there would be no or only a few cases in the warmer summer months, it soon became apparent that this would not be the case. Although no new outbreaks occurred between June 9th and July 13th, three turkey farms in Utah were affected in the second half of July. This was followed by a period of almost a month without any new cases, before a new wave of massive outbreaks began on August 22nd.
A more detailed analysis of the timeline will show that, strictly speaking, these were two separate waves, which also showed different spatial patterns. The last case of the epidemic was documented on December 28th, but new outbreaks already occurred in January 2023, so it can be assumed that the epidemic will continue in the following months. The aim of this article is to show the timeline of the AI outbreaks in 2022 and to document the different dynamics in the two half-years.1

8
©PexelsBrian Forsyth
DOSSIER - dossier -
1 The epidemics in 2015 and the first half-year of 2022 were analysed in detail by the author (Windhorst 2016, 2022, 2022a)
An unusual timeline
Figure 1 documents the timeline of the outbreaks and the associated animal losses. 2 The first outbreak of the H5N1 virus strain was detected on February 8th, 2022 in a turkey farm in Indiana. More cases emerged in the days that followed. Almost simultaneously, farms in Kentucky were infected, one turkey and one broiler farm. In late February and early March, additional outbreaks occurred in layer and broiler flocks in Delaware and Maryland, and on a broiler farm in Missouri. Beginning in mid-March, several large layer flocks in Iowa and Wisconsin were affected. In Minnesota, the center of turkey growing, the first case was reported on March 26th. In the weeks that followed, the virus spread rapidly through Minnesota
and the Dakotas. As of April 15th, a cluster developed in Pennsylvania; layer and duck farms were particularly affected. Outbreaks in layer farms in Colorado followed in the last week of April. During the last two weeks of May, the number of infections decreased rapidly, but the virus flared up again in two large layer flocks in Colorado in early June. The last outbreak was reported by APHIS on June 9th.
Nine weeks followed with no major outbreaks apart from three affected turkey farms in Utah between July 1st and July 26th. The impression was growing that the course of the outbreaks as in 2015 would be repeated. However, this was soon to prove to be a fallacy, because from August 22nd on, two clusters with numerous cases began to form. On
2 Only data for outbreaks and animal losses in commercial poultry farms are used. The data is based on the documentation of APHIS. Differences between the data of the documented daily outbreaks and the summarized state data for the whole year may occur.
the one hand, states in the western United States were affected (California, Utah), on the other hand, states in the Midwest and the western plains states (Minnesota, South Dakota, Nebraska, Wisconsin and Iowa). Notably, in contrast to 2015, the mid-Atlantic states had few outbreaks, with the exception of Pennsylvania. From the end of October, the epidemic activity in the western USA decreased noticeably, but two large laying hen flocks in Colorado were still affected on December 16th and 20th. In contrast, numerous outbreaks continued to occur in the northern Midwest until mid-December.
The lower part of Figure 1 (see also Figures 4 and 5) illustrates the large differences in the respective animal losses. The highest losses occurred in laying hens because very large farms were affected. Although the number of cases was much higher in turkey farms, the herd sizes were significantly smaller. If one considers the timeline of the disease over the whole year, it becomes obvious that there were actually two waves of outbreaks, a first wave from February to June and a second wave from August to December. It is obvious, that the outbreaks in the first half-year of 2022 were triggered by infected migratory birds using the Atlantic route and the Mississippi route. The wave in the second halfyear was also triggered by migratory birds, which this time used the Pacific and Rocky Mountain as well as the Mississippi route.
However, since the wild birds frequented the flight routes less in the summer months than in winter, it can be assumed that the AI virus, which had become endemic, also triggered infections in the poultry farms. This
9 - march 2023DOSSIER
Cases 0 10 20 30 40 Weeks 6810121416182022242628303234363840424446485052 1st half-year 2nd half-year Titolo del grafico Animal losses [1,000] 0 2.250 4.500 6.750 9.000 Weeks 6810121416182022242628303234363840424446485052 1st half-year 2nd half-year
Figure 1 – AI outbreaks and resulting animal losses in 2022 (design: A.S. Kauer based on APHIS data)
would explain the large number of cases and high animal losses in the summer months.
High regional concentration of outbreaks and animal losses
Of the 306 AI outbreaks in 2022, 188 occurred in the first half-year and 118 in the second half-year. Figure 2 shows
that in both half-years, Minnesota and South Dakota had the highest number of cases, but there are significant differences in the following rankings. While Pennsylvania ranked third in the first half-year, followed by Iowa and Indiana, Utah and California ranked third and fourth in the second half-year. Considering the animal losses as a criterion, one can easily see that there were different spatial patterns in the two half-years. This reflects the large differences in the stock sizes of laying hens and other poultry species. Table 1 lists the ten states with the highest animal losses in each of the two half-years and for 2022 as a whole. In the first half-year, a loss of 40.1 million animals was documented. They either died from the virus infection or were culled. That matched the animal loss of 40.1 million in the 2015 epidemic. Two northern Midwestern states ranked as number one and two, followed by Pennsylvania on the east coast. Of the western states, only Utah was represented among the top ten states.
In the second half-year, the spatial pattern changed significantly. Ohio was in first place, followed by Colorado. In addition to four states from the northern Midwest, three states from the western United States now showed up, two of them on the Pacific coast. Apparently, the infections were caused by migratory birds, which used the Pacific flight route. For the year as a whole, Iowa ranked first by a wide margin, followed by Nebraska, Colorado, and Pennsylvania. The composition of the ten states with the highest animal losses reflects the different patterns in the two half-years and reveals that infections from migratory birds occurred in all three flight corridors, and that the virus which had become endemic apparently also caused infections in the second half-year. Figure 3 documents the shares of the ten states with the highest animal losses in the two half-years and in 2022 as a whole. It is obvious, that the states, in which large laying hen farms were affected, ranked high in terms of animal losses.
Highest animal losses in laying hens and turkeys
As with the epidemic of 2015, laying hen and turkey farms were particularly affected in 2022. Of the 57.6 million birds that died from the infection or were culled, laying hens and turkeys accounted for 54.0 million or 93.7%. Of these, 44.3 million were laying hens and 9.7 million were turkeys. Table 2 documents the distribution over the two half-years. While broiler losses were high in the first half-
10 DOSSIER - dossier -
1st half-year Total: 188 outbreaks 11.2% 2.1% 2.1% 3.2% 4.3% 4.8% 4.8% 8.0% 9.0% 19.1% 31.4% Minnesota S. Dakota Pennsylvania Iowa Indiana N. Carolina Wisconsin Missouri Colorado Nebraska Others 2nd half-year Total: 118 outbreaks 8.6% 2.5% 2.5% 3.4% 4.2% 5.9% 7.6% 13.6% 15.3% 17.8% 18.6% Minnesota S. Dakota Utah California Iowa Pennsylvania Tennessee Colorado Wisconsin Nebraska Others 2022 total Total: 306 outbreaks 16.1% 2.6% 2.6% 3.3% 3.6% 4.9% 6.2% 7.8% 7.8% 18.6% 26.5% Minnesota S. Dakota Iowa Pennsylvania Utah California Wisconsin Indiana Colorado Missouri Others
Figure 2 – The share of the ten states with the highest number of AI outbreaks in the two half-years of 2022 and the whole year (design: A.S. Kauer, based on APHIS data)
Figures 4 and 5 document the timeline of the outbreaks in layer and turkeys farms as well as the respective animal losses per outbreak. In 2022, a total of 45 outbreaks on laying hen farms was recorded, 27 of them in the first and 18 in the second halfyear. The highest animal losses occurred between calendar week 11 and 17. The number of outbreaks on turkey farms was far higher. In the first half-year, 131 cases were documented and 86 in the second halfyear. While there was a clear peak between weeks 12 and 16 in the first half-year, the second half-year showed a more even distribution. Despite the significantly lower number of outbreaks, losses of laying hens were much higher due to the size of the flocks.
year due to infections by wild birds using the Atlantic route, losses in the second half were comparatively insignificant. Laying hens and turkeys accounted for 92.3% of the losses in the first half-year and 97.2% in the second half-year.

11 - march 2023DOSSIER
1st half-year 2nd half-year 2022 total State Animal losses State Animal losses State Animal losses Iowa Nebraska Pennsylvania Colorado Wisconsin Minnesota Maryland S. Dakota Utah Delaware 13,374.2 4,863.6 4,224.7 3,566.1 3,027.7 2,964.0 1,762.1 1,666.2 1,501.3 1,438.6 Ohio Colorado Iowa S. Dakota Nebraska Minnesota Washington California Utah Tennessee 3,748.5 2,680.7 2,549.7 1,168.2 1,774.4 1,257.0 1,105.5 715.3 595.8 150.2 Iowa Nebraska Colorado Pennsylvania Minnesota S. Dakota Ohio Wisconsin Utah Maryland 15,924.0 6,728.3 6,258.6 4,357.5 4,220.1 3,968.2 3,749.4 3,305.3 2,206.6 1,786.7 10 states 38,388.6 10 states 16,745.3 10 states 52,504.7 Total 40,088.6 Total 17,523.6 Total 57,612.2 !lanigirO Per ulteriori informazioni visitate il sito www.lubingsystem.com O scrivete una mail a info@lubing.it
Table 1 – The ten states with the highest animal losses caused by AI outbreaks in 2022; data in 1,000 birds (source: own calculations, based on APHIS data).
Large differences in the size classes of the affected flocks
Comparing the average flock sizes of the affected laying hen and turkey farms, considerable differences become obvious. While the laying farms had an average size of 715,000 hen places, turkey farms had only 44,650. Figures 6 and 7 show the distribution by size-classes. Figure 6 reveals that 13 of the 45 affected laying hen farms had a size of less than 100,000 hen places. These were mainly breeder farms for laying hens and broilers. In contrast, 21 farms had more than 1 million places, two even more than 5 million. It is worth noting that farms with more than 5 million places were not affected in the second halfyear. This is probably due to the fact that, after the experiences in the first half-year, farm managers improved the biosecurity of their farms, and on the other hand that, if they were affected again, they may not have been fully restocked when the epidemic flared up again. The distribution of the turkey flocks (Figure 7 ) differed significantly from that of the laying hens. Flocks with 25,000 to 50,000 birds dominated. They accounted for 41.9% of all cases. Larger farms with more than 75,000 places accounted
12 DOSSIER - dossier1st half-year 4.3% 3.6% 3.7% 4.1% 4.4% 7.4% 7.6% 8.9% 10.5% 12.1% 33.4% Iowa Nebraska Pennsylvania Colorado Wisconsin Minnesota Maryland S. Dakota Utah Delaware Others Total: 40.1 mill. 2nd half-year Total: 17.5 mill. 5.1% 0.9% 3.1% 4.1% 6.3% 7.2% 10.1% 12.3% 14.5% 15.2% 21.2% Ohio Colorado Iowa S. Dakota Nebraska Minnesota Washington California Utah Tennessee Others 2022 total Total: 57.6 mill. Iowa Nebraska Colorado Pennsylvania Minnesota S. Dakota Ohio Wisconsin Utah Maryland Others 9.0% 3.1% 3.9% 5.8% 6.6% 6.9% 6.4% 7.6% 11.0% 11.8% 27.9%
Figure 3 – The share of the ten states with the highest animal losses caused by AI outbreaks in the two half-years of 2022 and the whole year (design: A.S. Kauer, based on APHIS data).
1st half-year 2nd half-year Laying hens Cases 0 8,75 17,5 26,25 35 Weeks 6810121416182022242628303234363840424446485052 1st half-year 2nd half-year Laying hens Animal losses [1,000] 0 2.250 4.500 6.750 9.000 Weeks 6810121416182022242628303234363840424446485052
Figure 4 – The timeline of AI outbreaks in layer farms and resulting animal losses in 2022 (design: A.S. Kauer, based on APHIS data).
ˮ
“When considering the 2022 epidemic in context, it becomes obvious that, in contrast to 2015, not only the Mississippi flight route of migratory birds lead to primary outbreaks, but that infections also occurred in the Atlantic and Pacific flight routes, which caused several epicenters of outbreaks
for 12.4%. The largest infected farm in Minnesota had 298,000 places, in California 161,700.
Impacts on production and retail prices of eggs and turkey meat
Animal losses had a significant impact on egg and turkey meat production. Assuming that 306 million laying hens were housed in market-oriented farms with more than 30,000 places at the beginning of 2022, the outbreaks
reduced the total inventory by 44.3 million, or 14.5%. The individual states were affected differently. Nebraska lost a good half of its inventory, Iowa over a third, Ohio 14%. The impacts in Colorado were particularly serious. In the first half-year, 68.6% of the laying hens were lost. No exact percentage can be given for the second half-year. For reasons of data protection, it is not known to what extent farms had already been restocked and if they were affected again. The loss of another 2.7 million hens led to a further reduction in egg production and supply shortages in December 2022 and January 2023.
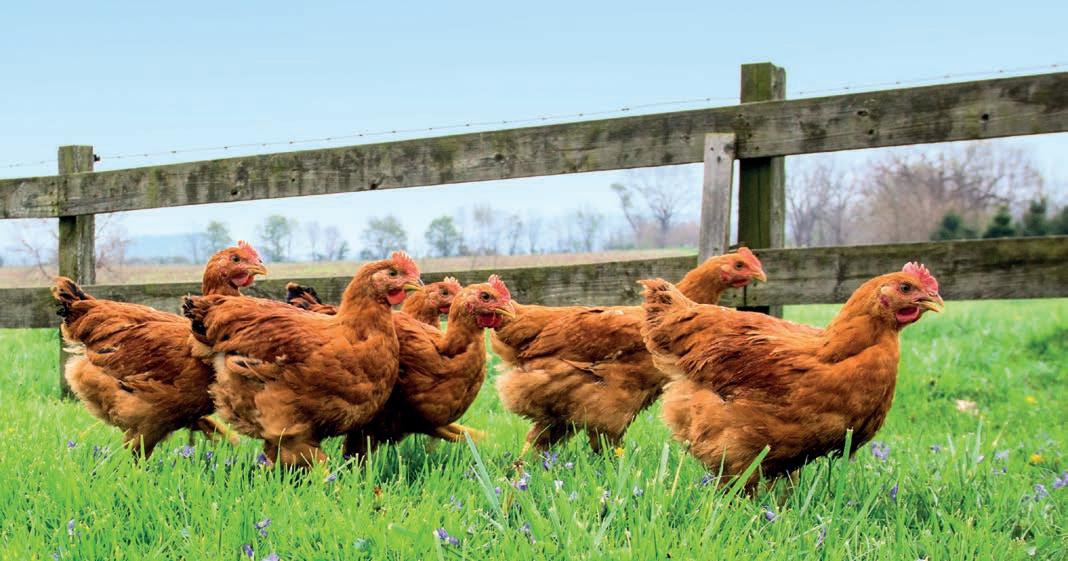
13 - march 2023DOSSIER
Cases 0 8,75 17,5 26,25 35 Weeks 6810121416182022242628303234363840424446485052 1st half-year 2nd half-year Turkeys Animal losses [1,000] 0 400 800 1.200 1.600 Weeks 6810121416182022242628303234363840424446485052 1st half-year 2nd half-year Turkeys YOUR CHOICE WELFARE FOR YOUR CHICKENS OUR COMMITMENT A ROBUST AND ANTIBIOTIC FREE CHICKEN HUBBARD PREMIUM the natural choice! WORLD LEADER IN SPECIALITY MARKETS! www.hubbardbreeders.com
Figure 5 – The timeline of AI outbreaks in turkey farms and resulting animal losses in 2022 (design: A.S. Kauer, based on APHIS data).
The sharp reduction in laying hen inventory affected retail prices for both shell eggs and egg products. According to the Egg Industry Center, the average price for grade L (large) shell eggs increased from $1.32/dozen in January to $3.88/ dozen in November 2022.3 In California, prices were even as high as $6.72/dozen.4 The significantly higher price there is a consequence of Proposition 12, which prohibits the sale of eggs produced in farms with conventional cages. Affected farms
with alternative housing systems reduced the available egg supply considerably, so that higher prices could be enforced in retail. The loss of 9.7 million fattening turkeys also led to a significant increase in retail meat prices. Due to high animal losses in Minnesota and South Dakota, leading processors in the Midwest were forced to cut production by 20 to 30 percent. The price of turkey breast increased from an average of $4.40 per kg in 2020 to over $14 in the fourth quarter of 2022.5
3 Cost and Prices for November 2022 mailed by December 2022.
4 https://abc7.com/egg-prices-in-california-avian-flu-bird-cage-free-eggs/12690623.
5 https://nypost.com/2022/09/02/turkey-prices-reach-record-highs-as-thanksgiving-nears.
Summary and outlook
When considering the 2022 epidemic in context, it becomes obvious that, in contrast to 2015, not only the Mississippi flight route of migratory birds lead to primary outbreaks, but that infections also occurred in the Atlantic and Pacific flight routes, which caused several epicenters of outbreaks (Figure 8).
While there were no more outbreaks in the early summer months of 2015, a new wave of outbreaks occurred in 2022 from mid-July onward. A closer analysis of the spatio-temporal development reveals two separate waves of outbreaks. While in the first half-year of 2022, the outbreaks were probably mainly infections triggered by migratory birds, which to a high degree affected farms in the northern Midwest and at the mid-Atlantic, states in the western United States and again in the Midwest were affected in the second halfyear. Here it became obvious that the familiar spatial pattern of AI epi-
14 DOSSIER - dossier -
Poultry species 1st half-year 2nd half-year 2022 total Laying hens Turkeys Broilers Ducks Others* 31,402.3 5,580.1 2,356.2 244.0 506.0 12,914 2 4,110.0 33.9 59.7 405.8 44,316.5 9,690.2 2,390.1 3.7 1211.7 Total 40,088.6 17,523 6 57,612.2
Table 2 – Animal losses caused by AI outbreaks in 2022; data in 1,000 birds (source: own calculations, based on APHIS data).
* mainly game bird
1st half-year Laying hens Cases 0,8 18,1 35,4 52,7 70 Size classes < 0.1 0.25 - 0.51 - 2.5 > 5 2 1 9 4 3 44 1st half-year Laying hens Size classes Animal losses [mill.] 0 2 4 6 8 10 12 14 16 18 20 22 24 < 0.1 0.25 - 0.51 - 2.5 > 5 2nd half-year Laying hens Size classes Cases 0 17,5 35 52,5 70 < 0.10.1 - 0.250.25 - 0.50.5 - 11 - 2.52.5 - 5> 5 0 1 7 100 9 2nd half-year Size classes Animal losses [mill.] 0 2 4 6 8 10 12 14 16 18 20 22 24 < 0.1 0.25 - 0.51 - 2.5 > 5 Laying hens 2022 total Laying hens Size classes Cases 0 17,5 35 52,5 70 < 0.1 0.25 - 0.51 - 2.5 > 5 22 16 4 3 5 13 2022 total Size classes Animal losses [mill.] 0 2 4 6 8 10 12 14 16 18 20 22 24 < 0.1 0.25 - 0.51 - 2.5 > 5 Laying hens
Figure 6 – AI outbreaks in layer farms and resulting animal losses in 2022 at flock size level (design: A.S. Kauer, based on APHIS data).
Mobile Poultry Shed

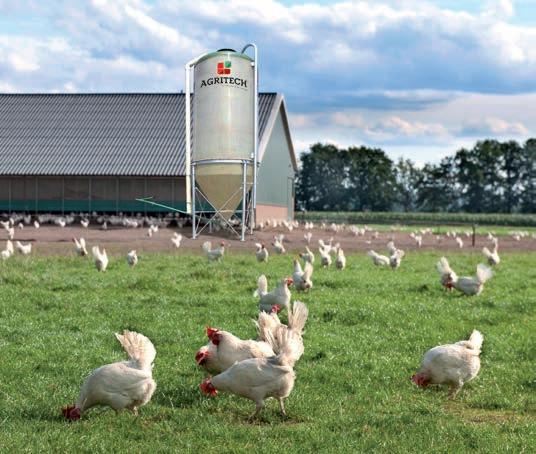
60 m2 Surface Mobile Poultry Shed. Professional design, made in Italy, suitable for free range poultry breeding. 5



15 - march 2023DOSSIER
Agritech s.r.l. Via Rimembranze, 7 25012 Calvisano (BS) Italy Tel. + 39 030 9968222 r.a. Fax + 39 030 9968444 commerce@agritech.it www.agritech.it
unassembled sheds in one truckload
demics had changed. The AI virus had obviously become endemic, occurred in native wild birds and triggered infections in commercial poultry farms. This explains why in 2022 outbreaks were detected in commercial poultry farms in 27 states and a new record was reached with 57.6 million animals, killed or culled. Although estimates have not yet been released by the US Department of Agriculture, it is reasonable to assume that the financial loss will be between $4 billion and $5 billion, assuming a loss of around $3 billion in 2015.
In his detailed analysis of the epidemic in 2015, Böckmann (2021) already pointed out that, in addition to the financial losses, the large number of outbreaks led to psychological stress for poultry farmers, especially turkey farmers. Renewed outbreaks in 2022 are likely to have resulted in similar problems, especially in Minnesota and South Dakota. Since, in contrast to Germany, the financial losses of farmers and companies are compensated for by payments from the federal government, the direct losses caused by an epidemic are small. However, financial losses resulting from the vacancy after a ban on restocking, as well as losses of compound feed mills, processing plants, transport companies or veterinary practices were not reimbursed. The changed temporal and spatial pattern of the AI outbreaks in 2022 and the occurrence of the virus in domestic wild birds have rekindled the discussion about preventive vaccination of poultry stocks and a change in housing systems (Brockötter 2022). In view of
the virus, which has become endemic, the predominant way of keeping turkeys in open barns represents an unacceptable risk and, because of the high infection pressure, also for laying hens in closed facilities. A change in the attitude of the poultry industry will be necessary, to prevent epidemics of the magnitude of 2015 and 2022. In addition, it will be necessary to increase the monitoring of wild birds, both migratory and resident.
Quite obviously, despite the experiences with the 2015 epidemic, it was not possible to educate poultry farmers adequately about ways to improve the biosecurity of their farms, because there is hardly any other way to explain the large number of outbreaks on turkey farms, even taking into account the susceptibility of the turkeys. In the large laying hen farms with several million hen places, the management obviously did also not succeed in preventing the virus from penetrating into the farm buildings.
One way to prevent or at least limit devastating epidemics in future would be the vaccination of flocks. This is endorsed by major egg producers, as the author’s interviews with representatives of the two leading US egg companies in the summer of 2022 showed. However, most poultry meat slaughterhouses and processors continue to reject compulsory vaccination because they fear that this would severely limit their export opportunities or could lead to the loss of important markets. Whether a compromise will be possible here, is still completely open.
16 DOSSIER - dossier -
Cases 0 25 50 75 100 Size classes < 10,000 25- 50,00075- 100,000 7 5 18 69 27 5 1st half-year Animal losses [1,000] 0 875 1.750 2.625 3.500 Size classes < 10,00025- 50,00075- 100,000 1st half-year Cases 6 29,5 53 76,5 100 Size classes < 10,00025- 50,00075- 100,000 8 7 22 22 19 8 2nd half-year Animal losses [1,000] 0 875 1.750 2.625 3.500 Size classes < 10,00025- 50,00075- 100,000 2nd half-year YV, Cases 0 25 50 75 100 Size classes < 10,00025- 50,00075- 100,000 15 12 40 91 46 13 2022 total Animal losses [1,000] 0 875 1.750 2.625 3.500 Size classes < 10,00025- 50,00075- 100,000 2022 total
Figure 7 – AI outbreaks in turkey farms and resulting animal losses in 2022 at flock size level (design: A.S. Kauer, based on APHIS data).
Data sources and references
APHIS: 2022 Confirmations of Highly Pathogenic Avian Influenza in Commercial and Backyard Flocks. https:// www.aphis.usda.gov/aphis/ourf oc us/animalhealth/animal-disease-information/avian/avian-influenza/hpai2022/2022-hpai-commercial-backyard-flocks
Böckmann, H. Ch.: Avian Influenza Outbreaks in Germany and the USA – Comparison and Analysis. (WING-Beiträge zur Geflügelwirtschaft, Heft 30). Vechta 2021.
Brockötter, F.: Unspeakable damage and unexplainable consequences. In: Poultry World 38 (2022), no. 9, p. 6-9.
National Wildlife Health Center: Distribution of Highly Pathogenic Avian Influenza in North America, 2021/2022. https://www.usgs.gov/cen te rs/nwhc/science/distribution-highly-pathogenic-avian-influenza-north-america-20212022#overview
United States Department of Agriculture (USDA), & Animal and Plant Health Inspection Service (APHIS). (2016). Final Report for the 2014-2015 Outbreak of Highly Pathogenic Avian Influenza (HPAI) in the United States. Veterinary Services, National Preparedness and Incident Coordination. https://www.aphis.usda.gov/animal_health/ emergency_management/downloads/ hpai/presentation/ finalreport14-15_shortppt.pdf
Windhorst, H.-W.: Avian Influenza Outbreaks in the USA in 2014 and 2015. A status report. In: Hafez, M. H. (ed.): Turkey Production and Health: Current and Future Perspectives. Berlin: Mensch und Buch Verlag 2016.
Windhorst, H.-W.: Verheerender Seuchenzug im Land. Eine räumliche und zeitliche Analyse der Avian Influenza in den USA im Jahr 2022. In: Fleischwirtschaft 102 (2022), Nr. 9, S. 23-27.
Windhorst, H.-W.: Analyzing the 2022 US avian influenza outbreak. In: Poultry World 38 (2022a), no. 6, p. 12-14.
17 - march 2023DOSSIER
State 678910111213141516171819202122232425 -2 7 28293031323334353637383940414243444546474849505152 Washington 1 California 35111 31 1 Idaho 1 1 Utah 1* 111 1252221 Colorado 11 1 11 Oklahoma 1 N. Dakota 21 1 1 S. Dakota 131099 1111 1 65321 Nebraska 2 2 1 1 1 Kansas 1 1 Minnesota 281881821 2 2344 32111 11 Wisconsin 213 2 Iowa 1 1264 1 11 34 Michigan 111 1 Indiana 1131 1 Ohio 1 Kentucky 2 Tennessee 1 112 Missouri 3 12 11 Arkansas 1 Mississippi 1 Delaware 1111 Maryland 21 1 Pennsylv. 133243 1 1 1 23 N. Carolina 4221
Weeks 1st half-year 2nd half-year
Figure 8 – The spatial diffusion of the AI virus and the formation of clusters in the USA in 2022 (design: author; based on APHIS data).
* figures indicate the number of outbreaks
University of Minnesota, Secure Food Systems, Saint Paul, MN 55108
Could you survive a stop movement order in the case of a highly pathogenic AI virus outbreak?
The U.S. has one of the most robust foreign animal disease (FAD) preparedness and response programs in the world; much time, money, and effort are invested in defense against diseases such as highly pathogenic Avian Influenza (HPAI), foot and mouth disease, and recently, African swine fever.
The first priority during an FAD event is prevention of disease spread. This is accomplished by imposing a quarantine on the infected site and restricting animal and product movements from other uninfected1 sites. The details of movement restriction (a “stop movement order”) depend on the commodity, pathogen, and pathways for introduction and spread. If your farm was issued a “stop movement order” during an HPAI outbreak, would you know what to do to maintain continuity of business?
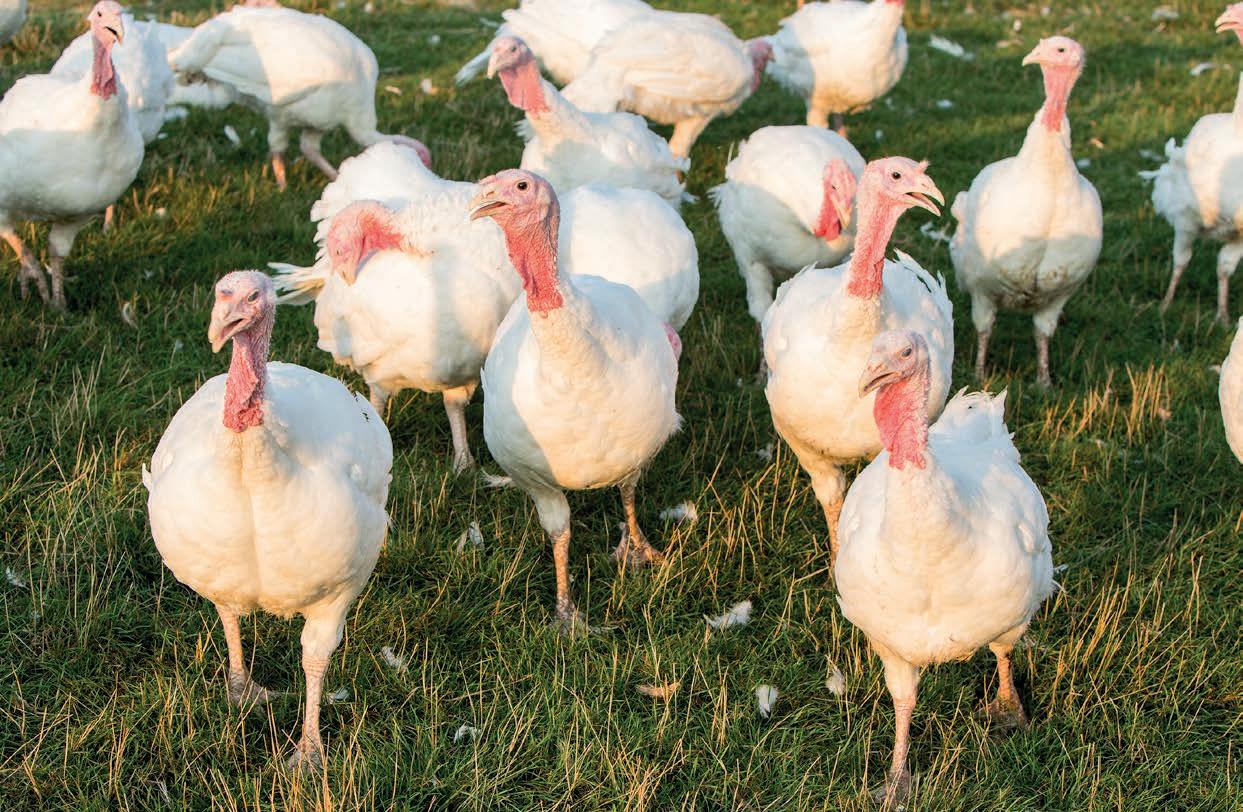
18 FOCUS - focus -
Michelle I. Leonard, Rosemary Marusak, Catherine Alexander, Benjamin Blair, Peter Bonney, Carol Cardona, Cesar Corzo, Marie Culhane, Timothy Goldsmith, Sasidhar Malladi, Miranda Medrano, Kaitlyn St. Charles, Amos Ssematimba
1 “Not known to be infected” is more accurate wording
When a flock is diagnosed with HPAI, the infected premises are immediately quarantined and prepared for depopulation within 24 hours. Other premises within the 10 km Control Area (CA) are labeled “at risk” until their status is established as either a contact, suspect, or monitored premises (Figure 1). Farms that have no epidemiological links, have normal production parameters, and are negative on molecular testing are defined as monitored premises. Only monitored premises can apply to Incident Command (IC) for permitted movement of poultry and poultry products out of and within the CA.


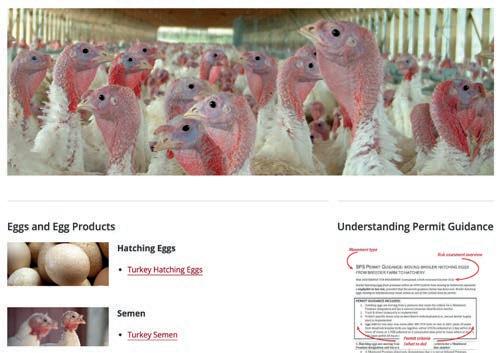
One approach an IC may follow for permit considerations is the use of the USDA-APHIS reviewed and approved Secure Poultry Supply (SPS) plans. SPS plans are generated from science-based risk assessments (RA) and provide permit guidances (PG) for the movement of poultry and poultry products from uninfected premises within a CA. PGs are found at https://securepoultrysupply.umn. edu/ for the turkey, egg layer and broiler industries. Figure 2 shows how to navigate the SPS site to get to turkey









- march 2023 - 19 FOCUS
At risk premises Contact premises Free premises Infected premises Suspect premises Monitored premises
Figure 1 – Diagram of a Control Area showing premises status
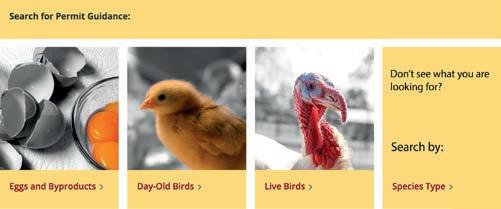
Figure 2 – Choose to view by species type; click on Turkeys; choose the PG for the movement you need.
www.pasreform.com pas2020_adv-Zootecnica-180x61mm.indd 1 25-02-2020 11:16
Royal Pas Reform Integrated Hatchery Solutions
PGs. SPS PGs tell a producer what needs to get done for permit consideration and how to do it. PGs are harmonized; they contain similar content and ordering, making navigation easier for states and permitters regardless of the species and product whose movement is requested. Each PG details what surveillance must be done, when, and how often, and also details strict biosecurity measures that a farm must adhere to during a specified pre-movement isolation period (PMIP).
Each person on the farm team may have one or more roles during an outbreak – implementing enhanced biosecurity; initiating biosecurity training; applying for the permit; or overseeing emergency operations. These roles should be clearly delineated prior to an outbreak.
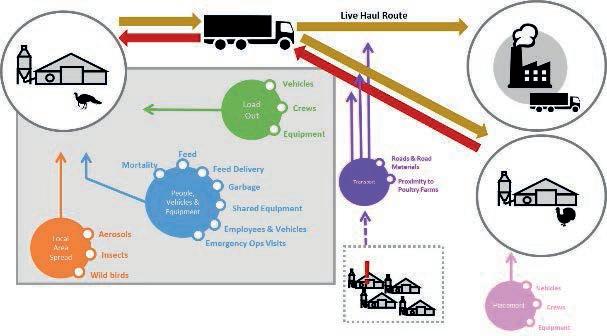
Two examples of live bird movements for which permits may be needed and requested include moving turkeys to market (TTM) and poults from brood to grow-out (BTG). Although these may seem similar, the overall risks for movement are different. Movement risks are determined by the overall likelihoods of moving infected, undetected birds and the consequences of doing so. Figure 3 depicts likelihood pathways for virus introduction and spread for both TTM and BTG scenarios. Because the destination for moving turkeys to market is a “dead-end”, the consequence of moving a few infected, undetected birds is less than moving a few infected, undetected birds to a site where the birds continue to live and grow.
termined the relative contribution of biosecurity tactics in reducing the risk of HPAI in market age turkeys during an outbreak, Figure 4. Notice how by focusing on the first four tactics, almost 50% of biosecurity concerns for virus infection and spread can be addressed. It may be assumed that these categories remain top priority mitigations for BTG movements as well. However, even stricter protocols may be warranted for this higher consequence movement.
Criteria for the destination premises may lower the consequences for BTG movements, but the producer can also implement enhanced practices at the origin brood site prior to (i.e., during the PMIP) and during load-out to help lower the likelihood of moving infected, undetected birds to a grow-out site. What should a producer focus on for maximum benefit? The TTM RA Workgroup de -
A comparative example using the most important biosecurity tactic – strict LOS (line of separation) enforcement with PPE during load out- illustrates how TTM PG requirements can be enhanced to lower the risk for moving infected, undetected birds during BTG movements (Table 1). An accompanying worksheet acquaints you with the TTM PG requirements for the next three important biosecurity tactics (Figure 4) during load-out and asks you to brainstorm enhanced mitigation measures that may be feasible for the high consequence movement of poults to the grow-out barn. Can you meet the demands for lowest risk movement of TTM and the recommended enhanced measures for a BTG movement from an uninfected premises out of a CA during an outbreak? Use “best practice” biosecurity and be prepared for what may be lurking over the horizon!
References
USDA APHIS Veterinary Services. “Foreign Animal Disease (FAD) Response Ready Reference ...” Foreign Animal Disease (FAD) Response Ready Reference Guide:
20 FOCUS - focus -
Figure 3 – TTM and BTG pathways
Strict LOS enforcement w/PPE Strict PBA enforcement Visitor restrictions Shared equipment restrictions Vehicle C&D and inspection Truck & driver biosecurity Biosecure dead bird disposal Shower & change clothes Biosecure garbage management Natural barrier to live-haul roads Downtime for employees Bird-proof confinement Secure feed bins & spill management Ventilation system Feed truck restrictions
Figure 4 – Relative contribution of biosecurity tactics in reducing the risk of HPAI in market age turkeys during and outbreak (from STS TTM)
TTM PG BTG* Diagram of Enhanced Biosecurity Measures
Crews must shower and change to clean clothes and footwear between farms
Turkey loading crews are prohibited from entering other turkey houses on the same farm.
Designated inside (blue) and outside (red) workers with color-coded uniforms
Expansion and/or Encroachment of LOS protocols
All persons entering a barn must use barn-specific footwear and farmspecific clothing Strict biosecurity oversight (green)
* enhanced biosecurity measures suggested by the Cross Commodity Workgroup


Critical Activities & Tools during an FAD Response, May 2020, https://www.aphis.usda.gov/animal_health/emergency_management/downloads/generic_critical_activities_rrg.pdf.
ment/downloads/hpai_response_plan.pdf.
USDA APHIS Veterinary Services. “Foreign Animal Disease (FAD) Response Ready Reference ...” Foreign Animal Disease (FAD) Response Ready Reference Guide— Overview of Continuity of Business and the Secure Food Supply Plans, Dec. 2016, https://www.aphis.usda.gov/ animal_health/emergency_management/downloads/
- march 2023 - 21 FOCUS
Table 1 – Strict LOS enforcement during load-out.
Barbieri srl Via Garibaldi, 54 • 26040 Scandolara Ravara (CR) Italy Tel. (+39) 0375 / 95135 • Fax (+39) 0375 / 95169 • Manu re re moval belt s • Manu re belt wi th hole s for dr yi ng system s
www.barbieribelts.com BELTS and ROP ES for AV ICULTURAL USE BE LT S
info@barbieri-belts.com
Hans-Wilhelm Windhorst
Patterns and dynamics of global turkey meat production and trade
Part 2 – Turkey meat trade

The article will analyse the development and patterns of turkey meat trade. The share of the exports in the total production volume differed considerably between meat types. In 2020, 19.9% of pig meat was exported, 14.8% of poultry meat, 13.5% of cattle meat and 12.1% of chicken meat. With 14.5%, turkey meat exports reached a remarkably high value.
Considerable fluctuation of exports
Global turkey meat exports fluctuated considerably between 2000 and 2020. Figure 1 shows that this was mainly a result of the ups and downs in North America. While from 2000 to 2010, the traded volume was quite stable and hovered around 900,000 t, the following decade was affected by massive Avian Influenza outbreaks, especially in the USA (2015). They led to an import stop by Mexico, the main country of destination. The AI outbreaks in Europe had
22 MARKETING - marketing -
The author is Prof. Emeritus of the University of Vechta and visiting Professor at the Hannover Veterinary University, Germany
less serious effects on exports. For both continents a downward trend can be observed from 2019 on, a consequence of the Covid-19 pandemic and the decreasing demand because of several lockdowns.
Europe dominated turkey meat exports and imports
In 2020, about 870,000 t of turkey meat were traded worldwide. Figure 2 shows the dominating role of European countries in exports as well as in imports. In exports, North America ranked in second place, followed by Central and South America. In imports, the regional concentration was lower because of the higher shares of Central and South America, Africa and Asia.
Patterns at country level differed considerably
In 2020, the regional patterns of turkey meat exports respectively imports differed considerably (Figure 3). The regional concentration in turkey meat exports was remarkably high. The ten leading countries shared 86.2% in the overall export volume. The USA ranked in first place, contributing almost one quarter to the total export volume, followed by Poland and Germany. Together, the three countries shared 54.8%.
In imports, the regional concentration was much lower. The ten leading importing countries contributed only 56.2%. Mexico and Germany ranked as number one and two. Together they imported 27.3% of the turkey meat, which reached the global market. The imbalance in the
regional concentration between exports and imports documents that only a few countries had a considerable surplus over their domestic demand while a greater number of countries had to import turkey meat to meet it. At first sight surprising is
that Germany ranked third in exports and second in imports. This is mainly due to the financial investments of a large German poultry company in Poland. A considerable amount of the production was exported to Germany (cf. Figure 4 and 5).

INTRA HYDROCARE DOES COMPLY WITH THE LATEST REGULATIONS

Pioneers in future proof solutions

23 - march 2023MARKETING
[mill. t] 0,0 0,1 0,2 0,3 0,4 0,6 0,7 0,8 0,9 1,0 1,1 20002002 200420062008201020122014201620182020 World Europe Northern America
Figure 1 – The development of global turkey meat exports between 2000 and 2020 (design: A.S. Kauer based on FAO data).
PT02, PT03, PT04, PT05
UNIQUE BLEND STRONGER THROUGH INNOVATION
SMART,
SAFETY!
BE
CHOOSE
Remarkable differences in the patterns of trade flows
In a next step, the trade flows of the leading turkey meat exporting and importing countries will be analysed. Figure 4 shows the shares of the ten leading countries of destination for the USA, Poland and Germany.
Mexico imported almost 135,000 t of turkey meat from the USA in 2020, 63.1% of the total export volume. China ranked in second place, followed by Central and South Ameri-
can countries with the exception of South Africa. The turkey meat industry of the USA is to a high degree depending on Mexico’s imports. It is a unidirectional trade pattern with a high economic risk, which the impacts of the AI outbreaks in 2015 revealed.
Poland exported 59,000 t of turkey meat to Germany, 35.1% of the total export volume. With the exception of Benin, all leading countries of destination were EU (28) member countries. The special situation of exports to Germany was already
explained before. The trade pattern was a mixture between uni- and multidirectional.
The trade pattern of Germany’s turkey meat exports differed considerably from that of the USA and Poland. None of the leading countries of destination was in a dominating position. The four top ranked countries shared 54.1% in the overall export volume, the ten leading countries 84.3%. The trade pattern was multidirectional, reflecting the central location of the country within the EU.
As expected, the import patterns of the leading countries (Figure 5) differed from that of exports, as only a limited number of countries had a surplus over their domestic demand.
With a share of 15.1% in the global turkey meat imports, Mexico ranked in first place. Its trade pattern was extremely unidirectional as it imported only from the USA. The free trade agreement between the USA, Canada and Mexico (USMCA) was the decisive steering factor beside the spatial neighbourhood.
In second place ranked Germany with an import volume of 106,109 t, which equalled 12.2% of the global imports. In 2020, Germany imported 55,049 t from Poland, 51.9% of the total import volume. In 2010, Poland had exported only 4,000 t to Germany. The fast increase reflects the remarkable growth of the Polish poultry industry. The regional concentration of Germany’s imports was very high, the six leading countries of origin contributed 89.5%. With the exception of Chile, the other countries were EU (28) members. The trade pattern of Spain was similar to that of Germany. The regional
24 MARKETING - marketing -
0.3% 20.6% 1.4% 54.8% 7.6% 15.3% Africa Asia Europe N America CS America Oceania 0.3% 7.2% 27.4% 62.6% 2.1% 0.4% Total: 871.302 t Exports Total: 869.412 t Imports
Total: 871.300 t Exports Total: 869,400 t Imports 13.8% 2.8% 2.8% 3.2% 4.4% 5.4% 6.1% 6.7% 11.0% 19.3% 24.5% USA Poland Germany Italy France Spain Brazil Hungary Canada Chile Others 43,9% 2,8% 2,9% 2,9% 3,0% 3,3% 4,3% 4,6% 5,0% 12,2% 15,1% Mexico Germany Spain Benin Belgium France China Austria UK S. Africa Others
Figure 2 – The share of the continents in turkey meat exports and imports in 2020 (design: A.S. Kauer based on FAO data).
Figure 3 – The share of the ten leading countries in turkey meat exports and imports in 2020 (design: A.S. Kauer based on FAO data).
tries shared 98.3% in the overall imports. Poland ranked in first place. It exported 22,626 t to Spain, 52.0% of the total import volume. In 2010, the exports of Poland to Spain were negligible. France was the main country of origin, contributing over 90% to the imports. With a share of 4.6% in the global import volume, Benin ranked fourth
25 - march 2023MARKETING
Contact us www.facco.net - info@facco.net Marsango di Campo San Martino Padova - Italy +39 049 9698111 60 years of experience in cage free and free range projects all over the world! Cage Free Contact us www.facco.net - info@facco.net Marsango di Campo San Martino Padova - Italy +39 049 9698111
among the leading turkey meat importing countries. The main countries of origin were EU (28) members, with France in a leading position. The close trade relations reflects the former status of the country as a French colony, reaching its independency in 1960. Benin exported considerable amounts of its imports to other African countries. Exact data are not available however.
Summary and perspectives
The preceding analysis documented the extraordinary role, which European countries played in the global trade with turkey meat. In exports, they shared almost 63% of the exported volume, in imports 54.8%. North America ranked in second place in exports, Central and South America in imports. The composition and ranking at country level reflects this pattern.
The trade flow pattern of the leading exporting and importing countries differed considerably between extremely unidirectional and multidirectional.
A perspective for the future of turkey meat production and trade has to consider the increasing importance of Russia. Over the past years, turkey meat production showed remarkable growth rates (Vorotnikov 2021). In 2021, the production volume reached 400,000 t (Vorotnikov 2022). Russia ranked as number five among the leading turkey meat producers. With the fast growth of turkey meat production, Russia tried to compensate the decrease of chicken meat production. Russia may also play an important role in turkey meat exports in future, especially to China, which in 2020 imported this meat type mainly from the USA and Chile.
Which impacts the war in Ukraine will have on Russia’s production and exports in 2022 is almost impossible to predict. Trade via railroad was still possible, but the route by vessel via Black Sea ports was blocked since March.
References
FAO database: https://www.fao.org/faostat.
OECD-FAO (Ed.): Agricultural Outlook 2021 – 2030. https://stats.oecd.org.
Vorotnikov, V.: Russian turkey production shows record growth rate. In: Poultry World online 9. 2. 2021. https:// www.topagrar.com/gefluegel/russland-baut-putenproduktion-aus-12707945.html.
Vorotnikov, V.: Russian turkey industry gets closer to world leaders in 2021: Corrected. In: Poultry World online 16. 2. 2022. https://www.poultryworld.net/poultry/other-species/russian-turkey-industry-gets-closer-to-worldleaders-in-2021.
26 MARKETING - marketing -
10.5% 4.2% 4.5% 6.7% 10.1% 12.1% 51.9% Poland Italy France Austria Chile UK Others Total: 106.109 t
Total: 43.548 t Spain 1.7% 1.7% 2.5% 3.8% 17.4% 20.9% 52.0% Poland France Germany Italy Netherlands UK Others Total: 39.975 t Benin 27.1% 5.2% 7.1% 9.6%9.9% 12.4% 28.7% France Italy Spain Germany Denmark Poland Others
Germany
Figure 5 – The share of the six leading countries of origin of Germany’s, Spain’s and Benin’s turkey meat imports in 2020 (design: A.S. Kauer based on FAO data).

27 - march 2023 -
Early lay diet density and hen size: do they affect hen productivity and egg quality in late lay?
Rearing pullets of breed standard weight or slightly smaller size may improve laying persistency and egg quality when birds are to be in production beyond 80 weeks of age.
birds. Egg weight at 89 woa experienced treatment interactions with HW birds fed LND diet producing the heaviest eggs and LW birds on LND diet the lightest eggs. HW birds had numerically higher cum. eggs per hen continuing and cum. feed conversion ratio (FCR) to 89 woa. LW hens on HND had lowest FCR to 89 woa. Yolk colour and shell weight as percent egg weight were not different but shell thickness and breaking strength were significantly higher in birds that had received the HND diet. Overall, LW hens demonstrated benefits from receiving a HND diet during early lay.
Introduction
1 School of Life and Environmental Sciences, Faculty of Science, Poultry Research Foundation, The University of Sydney, Camden, NSW 2570, Australia
2 PO Box 1362, Elanora, Queensland, 4221, Australia
3 Sydney School of Veterinary Science, Faculty of Science, Poultry Research Foundation, The University of Sydney, Camden, NSW 2570, Australia
Hen production and late lay egg quality were evaluated in heavier (HW) and lighter weight (LW) ISA Brown hens fed either a higher nutrient density (HND) or lower nutrient density (LND) diet during early lay. Eighteen-week-old pullets were assigned to either above breed standard weight (BSW), HW, or below BSW, LW treatment groups. Within each weight group birds were randomly allocated to an early lay HND or LND diet which was fed from 18 to 24 weeks of age (woa). Hens on the HND diet moved to LND diet at 25 woa. All birds were on the same diet from 25 woa, changing to a mid-lay diet at 40 woa and late lay diet at 78 woa. Hen performance was recorded from 18-89 woa and egg quality of 12 focal birds per treatment group was evaluated between 86-90 woa. Heavier weight birds had significantly higher body weight, daily and cumulative (cum.) feed intake (FI) and cum. egg mass at 89 woa compared to LW
Pullet body weight (BW) has significant impact on hen sexual maturity, egg productivity and flock uniformity. Australian layer flocks are frequently 100-300 grams heavier than breed standard weight (BSW) These birds typically lay larger eggs than LW hens and higher BW is symptomatic of bird obesity which can result in the production of excessively large eggs with lower eggshell quality and poorer persistency of lay in late lay compared to smaller sized birds. Therefore, rearing pullets of BSW or slightly smaller size may improve laying persistency and egg quality when birds are to be in production beyond 80 woa.
Globally the layer industry is extending layer hen productive life to 100 woa to realise benefits in industry sustainability. But, for this to succeed, longer term efficient hen productivity, hen health and eggshell quality need to be achieved. The better feed efficiency of smaller sized hens is appealing

28 MANAGEMENT - management -
W.I. Muir1, Y. Akter1, K. Bruerton2 and P.J. Groves3
in a longer laying cycle. However, as smaller hens have lower FI compared to larger sized hens they may not consume adequate diet for their nutritional needs, especially when the diet is formulated on BSW daily FI.
A diet of higher nutrient density (HND) at the start of lay could circumvent challenges of lower FI in LW hens enabling them to attain required nutrients within their lower daily FI. This diet may also prime these birds for sustained egg production. This study compared the persistency of lay, eggshell quality and feed efficiency of HW and LW point of lay pullets fed either a HND or LND diet during early lay.
Materials and methods
This study was a 2 × 2 factorial arrangement consisting of 2 nutrient densities (HND and LND) and 2, 18 woa bird
Table
weight groups: mean weight 1.65 kg (HW) and 1.49 kg (LW). When 16 woa, 240 ISA Brown pullets were purchased from a grower, transported to University of Sydney, Camden and housed in the high-rise layer shed in individual pens (25 × 50 × 50 cm) each with an individual feeder and waterer. Pullets were fed the LND diet ad libitum and allowed to acclimate for a 2-week period. All birds were weighed at 18 woa and 120 pullets were allocated to each weight group (HW or LW). Sixty pullets from each weight group were randomly assigned to either a HND (formulated on 90g FI/day; 2900 kcal/kg, 0.83% SID.Lys) or LND (formulated to 110g FI/day; 2725 kcal/kg; 0.737% SID.Lys) diet. They were fed the experimental diets from 18 to 24 woa. At 25 woa hens on HND diet were consuming at least 100g FI/day and were transferred to the LND diet. At 40 woa all hens were moved to a mid- lay diet (formulated to >110g FI/day; 2724.2 kcal/kg; 0.695% SID.Lys and then at 78 woa a late lay diet (formulated to
– Hen weight, week 89 production and weeks 18-89 cumulative production.
BW(18woa): 18 weeks of age body weight; HW: Heavier weight; LW: Lighter weight; DND: Diet nutrient density; HND: Higher nutrient density diet (formulated on 90g FI/day; 2900 kcal/kg, 0.83% SID.Lys); LND: Lower nutrient density diet (formulated to 110g FI/day; 2725 kcal/kg; 0.74% SID.Lys); BW (Kg)^: body weight at 90 woa; FI: average daily feed intake at 89 woa; EP(%): average percent egg production at 89 woa; EW: average egg weight at 89 woa; Cum. eggs/hen: total number of eggs produced from 18-89 woa; CFI: Cumulative feed intake 18-89 woa; CEM: Cumulative egg mass 18-89 woa; CFCR: Cumulative feed conversion ratio 18-89 woa. #HND diet was fed to the end of 24 woa being replaced with LND diet. From 40 woa mid-lay diet (formulated to >110g FI/day; 2724.2 kcal/kg; 0.695% SID.
Lys and from 78 woa late lay diet (formulated to 110g FI/day; 2752.63 kcal/kg; 0.728% SID.Lys) were fed to all birds. abc Means within column not sharing a common suffix are significantly different at P<0.05.
29 - march 2023MANAGEMENT
Treatment BW (Kg)^ FI (g/d) + EP (%) + EW (g) + Cum . eggs/ hen CFI (Kg) CEM (Kg) CFCR BW (18woa) HW 2.23 111 81.7 62.4 469.7 58.4 27.6 2.14 LW 2.01 101 80.8 61.6 462.6 53.5 26.2 2.10 DND HND# 2.12 107 81.3 61.9 464.8 55.4 26.8 2.11 LND 2.11 105 81.2 62.1 467.5 56.5 27.0 2.12 Interaction HW*HND 2.25 111 83.2 61.5a,b 464.9 57.9 27.1 2.16 HW*LND 2.20 111 80.3 63.4a 474.5 58.9 28.1 2.12 LW*HND 1.99 103 79.4 62.3 a,b 464.7 52.9 26.5 2.07 LW*LND 2.02 99 82.1 60.8 b 460.4 54.2 25.9 2.13 P- Values BW <0.0001 <0.0001 0.83 0.21 0.29 <0.0001 0.02 0.33 DND 0.78 0.47 0.98 0.81 0.70 0.29 0.69 0.85 BW*DND 0.31 0.30 0.52 0.02 0.31 0.86 0.14 0.21
1
BW(18woa): 18 weeks of age body weight; HW: Heavier weight; LW: Lighter weight; DND: Diet nutrient density; HND: Higher nutrient density diet (formulated on 90g FI/day; 2900 kcal/kg, 0.83% SID.Lys); LND: Lower nutrient density diet (formulated to 110g FI/day; 2725 kcal/kg; 0.74% SID.Lys); #HND diet was fed to the end of 24 woa being replaced with LND diet. From 40 woa mid-lay diet (formulated to >110g FI/day; 2724.2 kcal/kg; 0.695% SID.Lys and from 78 woa late lay diet (formulated to 110g FI/day; 2752.63 kcal/ kg; 0.728% SID.Lys) were fed to all birds.
abc Means within column not sharing a common suffix are significantly different at P<0.05.
110g FI/day; 2752.63 kcal/kg; 0.728% SID.Lys) which they received until 90 woa. From 18-89 woa individual hen egg production (EP), egg weight (EW) and FI were measured to allow weekly determination of egg mass (EM), FCR and cum. production. Between 86-90 woa eggs from 12 focal birds /treatment group were assessed for egg quality each week. Data were analysed using a factorial ANOVA with 18 woa BW and diet nutrient density as the main effects.
Results and discussion
Typical of Australian conditions the 16 woa pullets were above BSW but HW and LW pullets were selected without drawing from the extremities of the flock. Hen weight and production are presented in Table 1. Production data is presented to 89 woa as bird sampling during 90 woa (data not shown) prevented those birds from contributing to a full week of production data. Therefore, to include at least 32 birds in each treatment group for statistical analysis, 89 woa data was used.
Average BW at 90 woa and 89 woa average daily FI, 18-89 cum. FI (CFI) and cum. egg mass (CEM) of HW birds were significantly higher (P<0.05) than the LW birds. Heavy weight birds at 18 woa were 10.7% heavier than LW birds and 10.9% heavier at 90 woa. Hence LW birds did not undergo compensatory growth which has also been reported for HyLine Brown hens (Perez-Bonilla et al. 2012). HW birds had an average 9.2% higher cum. FI to produce an additional 5.3 % cum. egg mass or, for each additional 100 g BW at 90 woa they consumed an additional 4.5 g/d feed and produced an additional 0.36 g/d EW. In comparison Leeson and Summer (1987) identified an average increase of 3.5g FI and 1.2g EW for each 100 g increase in BW in Leghorn hens. Diet density only impacted EW at 89 woa, where a significant interaction (P= 0.02) resulted in the highest EW for HW LND diet treatment birds compared to LW LND diet birds. However, there were no significant differences in 89 woa egg production nor cumulative eggs produced per hen. Cumulative FCR was not significantly different however at 69 woa the LW hens had significantly lower cumulative FCR (data not shown) and continued with the lowest cum. FCR to 89 woa. In light of the preference for HW hens in Australia it is interesting to consider a simple cost benefit analysis to 89 woa on the cost of the additional 4.9 kg of feed consumed by HW birds with the return for their additional 7 eggs compared to LW hens.
Interestingly the HND diet did not initiate a significant reduction in FI to the end of 24 woa (data not shown). This lack of FI adjustment for diet
30 MANAGEMENT - management -
Haugh Unit Yolk colour Shell weight (%) Shell t hickness (mm) Shell breaking strength (g) BW(18woa) HW 92.7 9.15 9.7 0.35 3799 LW 92.6 9.01 9.9 0.36 3781 DND HND# 90.6 9.15 9.9 0.36 3896 LND 94.8 9.01 9.8 0.35 3683 Interaction HW*HND 91.6 9.30 9.7 0.36 3884 HW*LND 93.8 9.00 9.7 0.35 3714 LW*HND 89.5 9.01 10.1 0.37 3908 LW*LND 95.7 9.02 9.8 0.35 3653 P-Value BW 0.98 0.23 0.11 0.64 0.86 DND 0.05 0.20 0.37 0.03 0.05 BW*DND 0.35 0.18 0.19 0.15 0.69
Table 2 – Egg quality at 86-90 weeks of age.
nutrient density has been identified previously while adjustment in FI due to diet density has been reported by others. The reason behind these differences is not immediately evident.

The effects of BW and diet nutrient density on egg quality assessed across 86-90 woa are presented in Table 2 Haugh units of birds on HND diet were significantly lower (P= 0.05) than the LND diet; however both measures were above 90. Perez-Bonilla et al. (2012) also observed a significantly lower Haugh unit in eggs from 56-59 woa Hy-line Brown hens fed a higher energy diet, but it should be noted those hens consumed the treatment diets from 24-59 woa, as opposed to this study where the dietary treatments were fed in early lay only. DePersio et al. (2015) also noted a decline in Haugh unit in Hy-line W36 hens between 33-70 woa when hens had consumed the higher energy compared to the lower energy diet from 19-70 woa. Yolk colour and % shell weight were not different, the latter also being reported by Perez-Bonilla et al. (2012).
As seen in Table 2 percent shell was at or above 9.7% being the minimum below which the number of shell fractures tends to increase. Importantly the HND diet fed during early lay resulted in significantly thicker eggshell (P= 0.03) and higher (P=0.05) shell breaking strength. Literature on eggshell thickness and shell breaking strength due to diet nutrient density is limited, however both dePersio et al. (2015) and Hassan et al. (2013) found no difference in shell breaking strength with higher energy diets.
While the HW birds had the highest cum FI, cum EM and cum. FCR, LW hens and particularly the LW birds on the HND diet had the lowest cum FCR and no difference in egg production. The HND diet also increased the shell thickness and shell breaking strength. Hence LW hens can perform across a long laying cycle with benefits in their production and egg quality from a HND diet fed in early lay. These treatments should be evaluated in cage free systems.
Acknowledgment: This research was funded by Australian Eggs
References are available on request
From the Proceedings of the Australian Poultry Science Symposium 2022
31 - march 2023MANAGEMENT
CARFED INTERNATIONAL LTD Italian headquarters: Piazza Oberdan 3, 20129 Milano (Italy) Italian warehouse: Via Basilicata 10, 20098 San Giuliano Milanese (Italy) Ph.: +39 02 9881140 – Fax: +39 02 98280274 Email: carfed@carfed.it – Website: www.carfed.it UK headquarters: Ground Floor, One George Yard, London EC3V 9DF, England, UK Ph.: + 44. 20. 7660.0987 – Email: carfed@carfed.co.uk
The challenge of reducing crude protein in meattype chicken diets – First part

Amino acids (AA’s), the building blocks of protein have received considerable attention in avian nutrition and, retained nitrogen, in the form of lean tissue, in growing meat-type chickens is the most abundant component after water.
not successful or have attempted to solve the conundrum through many iterations of AA combinations. However, reducing CP in broiler diets and maintaining performance is possible, providing the decrease is not too excessive. For example, in van Harn and van Krimpen (2016) reducing CP by 2% and 3% for 0-35 days in Ross 308 male broilers, had no effect on live weight and a significant improvement (P<0.05) in FCE.
The reduction of CP in broiler feeds reduces water intake, improves litter condition and leads to an improvement in associated welfare issues, such as foot pad dermatitis. In addition, nitrogen excretion is reduced and less soyabean meal is used providing strong incentives to successfully reducing CP in broiler feeds.
There are a plethora of research papers, theses and books on protein and amino acid (AA) nutrition and subsequent dietary responses to changing AA and crude protein (CP) contents of diets offered to meattype chickens. Almquist and Grau (1944) appear to be the first investigators to use crystalline AA’s to completely replace the CP in meat-type, semi-purified chicken diets. However, these researchers were unable to maintain both maximum bird growth or feed conversion efficiency (FCE) using reduced CP diets. Many researchers have attempted, since this early research, to either theorise why these types of diets are
Much focus has taken place on determining the “requirements” of individual amino acids and the development of an “ideal protein” concept where the nominally “essential amino acids” (EAA’s) are expressed in a ratio to the reference amino acid, which is usually lysine. More recently, the reduction of nitrogen excretion from poultry and other intensively farmed livestock has re-ignited research into reducing CP content of modern meat-type diets by using crystalline AA’s to meet the determined requirements to sustain an objective function, which maximises specific performance parameters in the animal, or minimizes costs associated with meat production. The research that has been done with reduced CP diets has had variable outcomes but the most common thread is that carcass lipid increases and bird performance deteriorates as CP
32 NUTRITION - nutrition -
Peter V. Chrystal1, Sonia Y. Liu2, Amy F. Moss2, Dafei Yin2, Victor D. Naranjo3 and Peter H. Selle2
1 Baiada, 642 Great Western Highway, Pendle Hill, NSW, 2145, Australia
2 Poultry Research Foundation within the University of Sydney, 425 Werombi Road, Camden, NSW, 2570, Australia
3 Evonik Nutrition & Care, Rodenbacher Chaussee 4, 63457, Hanau-Wolfgang, Germany
is decreased from standard practical diets. Whilst many researchers hypothesize, logically, that reducing CP in diets may result in insufficient nitrogen for the animal to metabolise AA’s that have been determined to be “non-essential” (NEAA), there are many other dietary factors that change when crude protein is reduced in diets and these are often ignored. Limiting the provision of amino nitrogen may cause a shortage of precursors. In addition, there is a likelihood that some metabolic processes are too slow to provide the modern broiler with sufficient amounts of NEAA’s. Somewhat surprisingly, the vast majority of published data does not try to distinguish between true protein and non-protein nitrogen and this may be of relevance since a reduction in CP with the addition of crystalline AA’s leads to a concomitant decline in the dietary non-protein nitrogen (NPN) content. The importance of the NPN compounds in feed that include nucleotides, nucleic acids, amines, amides, urea, nitrates, nitrites, ammonia, phospholipids, nitrogenous glycosides and even some vitamins are largely beyond the scope of this paper. However cognisance of their role in nutrition should be considered and, whilst data on many of these compounds in the context of reduced CP diets is not well documented, they cannot be ignored.
The determination of all the factors, including AA’s, that change as CP reduces in practical meat-type chicken diets should be considered and the effects of these either ruled out or taken into account when formulating these diets. AA nutrition, particularly with respect to the branched chain amino acids (isoleucine, valine and leucine) due to their role in muscle synthesis, as well as NEAA such as glycine and serine have received considerable attention recently. In addition, as CP is reduced in diets and addi-
tional crystalline AA’s are added, there are changes in dietary lipid and starch content, dietary electrolyte balance (DEB), fibre and the possible partial destruction of AA’s through Maillard reactions in pelleted (heat treated) feed. The reduction of CP content of feed also reduces the phytic acid content of the feed and this may reduce the response to phytase enzymes, which are now common in practical, modern meat-type chicken diets. Therefore the reduction of the phytic acid substrate, on which phytase works when CP is reduced, cannot be ignored. The effects of access to feed (or feed restriction) and addition of biogenic amines have received some attention but are beyond the scope of this paper. More recent research on the influence of digestive dynamics in reduced CP diets will form an integral part of the implications of reducing CP in practical diets and, identifying where the nutrient “gaps” exist, in both current and past research; will be crucial to applying an effective reduction in CP in practical meat-type chicken diets. The effect of fibre and whole grain feeding in conjunction with reduced CP diets, with respect to gizzard functionality, reverse peristalsis and digestive dynamics, warrants further research.
Finally, the practical, commercial implementation of reduced CP diets within the feedmill does not receive attention normally, but should also be considered. By reducing CP, the number of ingredients to be weighed per batch of feed increases and an extra 4 crystalline AA’s can represent approximately 20% additional ingredients (by number) within a batch. Depending on the feedmill design, such as scale and bin configuration, the added ingredients might add significant time to batching and decrease feedmill capacity. Providing the capacity is available, this would represent only an added cost although, if the mill

33 - march 2023NUTRITION
VISIT OUR WEBSITE zootecnicainternational.com FOR A DEEP INSIGHT INTO THE POULTRY INDUSTRY! and latest technical and scientific advances at zootecnicainternational.com! NEW PRODUCTS COMPANY NEWS INTERVIEWS FIELD REPORTS MARKET TRENDS EVENTS PROFILES
is already running at capacity, it may be impossible to implement these diets without major capital investment. Most feedmills are old in New Zealand and Australia and do not have the available extra bins to either add these extra amino acids or the space within the mill to add more bins. Weighing and subsequent hand addition of the additional AA’s is a possibility but, it is a very costly option in both New Zealand and Australia. In addition, relying on a person to weigh these ingredients introduces the added risks of human error in batching.
“Crude” versus “true” protein
CP has been used for over 150 years and is simply the nitrogen content of the feed multiplied by 6.25. It assumes that, on average, feed ingredients contain 160 g/kg protein. As a measure of the nitrogen content of feed, the use of CP may be justified in practical diet formulation since most commercial broiler diets are formulated to digestible AA’s. However, true protein (TP), as reflected by the total of EAA’s and NEAA’s, may hold more relevance in reduced CP diets, with the liberal use of supplemental crystalline AA’s. Indeed, based on nitrogen content alone, the CP of some crystalline AA’s exceed 1,000 g/kg. For example, L-glycine has a CP value of 1,154 g/kg and L-arginine a CP value of 1,996 g/kg. Clearly, the TP content of the relevant AA used in feed formulation cannot exceed the concentration of the AA itself.
Dietary nitrogen from NPN sources decline as CP is reduced with a concomitant increase in AA nitrogen as ever increasing amounts of crystalline AA’s are added to feed. Moreover, much of the research into reduced CP diets doesn’t define what values of CP have been used for the crystalline AA’s, whilst several researchers do not assign CP values to the crystalline AA’s. For feed ingredients, Mariotti et al., (2008) in a literature review have proposed an average factor of 5.60 as more appropriate than 6.25. These authors have summarised data from a number of different sources and some of the main ingredients used in feed formulation are shown (Table 1).
Branched-chain amino acids
The importance of the branched-chain amino acids (BCAA); leucine (Leu), isoleucine (Ile) and valine (Val) in reduced CP diets is significant since these make up
nearly 50% of the supply of EAA’s in typical meat-type poultry diets and constitute 33% of all the amino acids in the bird. Some unique features of the catabolism of the BCAA have implications for improving the understanding of inter-organ relationships in nitrogen and carbon metabolism. The initial enzymes for catabolism of the BCAA’s are regulated differently from other amino acid degrading enzymes; one or more of the BCAA’s appear to exert specific regulatory effects on tissue protein degradation and synthesis and BCAA’s, through competition with other AA’s in blood and appear to play a role in controlling brain AA concentrations and thereby in the synthesis of AA-derived neurotransmitters.
Whilst the antagonistic effect of high levels of Leu on the absorption of Ile and Val have been known for many years, the influence of low Leu (and low BCAA’s) concentrations in reduced CP diets is not well documented. Recommendations of dietary BCAA inclusions differ markedly between researchers and, in starter diets, suggested ratios to Lys (100%) vary between 92% and 139% for Leu, 65% and 84% for Ile, and 67% and 96% for Val (Coon, 2004), respectively. More recently, Pastor et al. (2013) reviewed ratios of the BCAA’s to lysine (Lys) that differ from accepted published figures and suggested that higher ratios to Lys are required in the grower peri-
34 NUTRITION - nutrition -
Ingredient Mossé (1990) Sosulski & Imafidon (1990) Tkachuk (1969) Other Data Mean Value Maize 5.65 5.61 5.59 5.62 Wheat 5.33 5.66 5.49 5.49 Barley 5.50 5.40 5.45 Triticale 5.36 5.62 5.49 Oats 5.36 5.32 5.34 Pearl Millet 5.30 5.63 5.47 Sorghum 5.65 5.68 5.67 Rice 5.17 5.37 5.47 5.34 Wheat Bran 4.71 5.20 4.96 Soyabean Meal 5.52 5.44 5.64 5.50 Peas 5.44 5.24 5.40 5.36 Lupins 5.40 5.47 5.44 Canola 5.29 5.41 5.34 Sunflower (hulled) 5.29 5.29
Table 1 – Review of conversion factors for nitrogen to TP of some major ingredients used in feed formulation (after Mariotti et al., 2008)
od compared with the starter period. These authors also suggested standardised ileal digestible (SID) Leu ratios to Lys of 106% in grower diets and 94% in starter diets; 72% Val in grower diets and 65% in starter diets. In addition, SID Ile to Lys ratio remained similar in starter and grower phases (56% in grower vs. 55% in starter). In contrast, Wu (2014) reviewed various ideal AA ratios and, in the Texas A&M University data, the SID Leu to Lys ratio was 109%, for birds of all ages; SID Val to Lys was 77% in birds younger than 21 days of age and 80% for birds that were older. The SID Ile ratio to Lys was 67% in birds younger than 21 days of age and 69% for older birds. Wu (2018) pointed out that the Texas A&M recommendation for leucine is 21.1% higher for pigs than poultry - despite the fact that the leucine contribution to whole body protein is identical in the two species. The ideal corresponding ratio of SID Leu to Lys in pigs is 132% whilst SID Ile and Val are similar to poultry at 67% and 77% respectively. It is therefore plausible that nutritionists have underestimated the Leu requirements of poultry, particularly when CP is reduced, since normal, practical diets would have ratios that exceed 120%. The published, recommended ratios of BCAA to Lys have been included in typical meat-type chicken diet formulation; however the enormous range of BCAA ratios to Lys for optimal broiler performance requires further investigation, particularly in the context of reduced CP diets.
Glycine and serine
Siegert et al. (2016) suggested that the NEAA’s, Glycine (Gly) and ser-
ine (Ser) may limit growth of broiler chickens if enough metabolic precursors are not available or, if metabolic processes are not rapid enough. Consequently, supplementing Gly in reduced CP diets has been shown to enhance the growth performance of meat-type chickens (Jiang et al., 2005; Dean et al., 2006). Gly equivalents (Glyequi) has been used in the literature to describe the dietary requirement of Gly plus Ser in broiler chickens. Glyequi is calculated by
Petersime’s new
X-Streamer™ brings incubator intelligence and performance to the next level. The X-Streamer™ is the first intelligent incubator that turns data into maximum hatchery performance. It knows which eggs are on board and uses this knowledge to help you maximise incubation performance, while minimising operational costs.
This ensures you get the best economic return out of your hatchery; not just right now, but during its entire lifetime. Maximum profit for life is what we stand for.

35 - march 2023NUTRITION
X-Streamer™
keep in touch! www.petersime.com
Let’s
Scan for more information: Built-in intelligence Unique Embryo-Response Incubation™ technology Designed for minimum operational costs
incubator
into maximum
performance
The intelligent
that turns data
hatchery
© Petersime 2020All rights reserved.
adding Ser (multiplied by 0.7143, the ratio of Ser molar weight) to Gly.
Siegert et al. (2016) investigated the influence of Glyequi in broiler diets that were either supplemented with “intact” protein bound AA’s as soya protein isolate or a mixture of free crystalline AA’s in reduced CP diets
and they reported raising the Glyequi increased the average daily gain (ADG) in broiler chickens offered diets containing both AA sources. However, for the soya protein isolate treatment, average daily feed intake (ADFI) increased and consequently, gain to feed (FCE) was not influ-
enced, whilst treatment using the crystalline AA sources, ADFI was not influenced and therefore, FCE was improved.
a,b,c,d Values within a row without a common superscript are significantly different (P<0.05) 1 FPS (foot pad score) = [(n score 0 * 0) + (n score 1 * 0.5) + (n score 2 * 2)]/n total *100
More recently, Hilliar et al., (2017) investigated the supplementation of Gly to diets based on wheat, sorghum and soyabean meal. The control treatment contained 217/198 g/kg CP for the grower and finisher phases respectively, and the remaining treatments contained either 200/180 g/kg CP, 185/165 g/kg CP or 170/150 g/kg CP. Gly was supplemented to ensure equal levels of Glyequi in the experimental diets and all the diets were balanced with EAA’s. The addition of Gly improved FCE (g gain/g feed) from day 10 to day 35 by 4.71% (695 versus 663; P<0.001) in birds fed the diet with 200/180 g/kg CP and by 4.78% (679 versus 646; P<0.05) in birds fed the diet with 185/165 g/kg CP, but had no significant effect in birds fed the diet with 170/150 g/kg CP. Gly addition also improved BWG from day 10 to day 35 in birds fed the diet with 200/190 g/kg CP by 10.8% (2,234 versus 2,017 g/bird; P<0.05) and by 13.9% (2,076 versus 1,822 g/bird; P<0.05) with the 185/165 g/kg CP diet.
However, no significant effect on BWG was observed at 170/150 g/kg CP. These results suggest that the supplementation of Gly could significantly enhance performance in broilers offered diets with moderate CP reductions until other dietary factors become limiting.
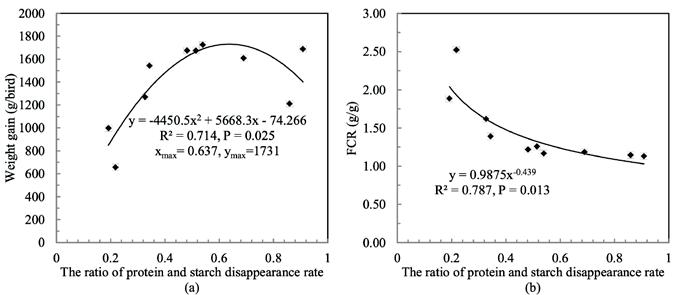
References are available on request
From the Proceedings of the New Zealand Poultry Industry Conference
36 NUTRITION - nutrition -
Grower Diets Finisher Diets Nutrient (g/kg) Control Tmnt 1 Tmnt 2 Tmnt 3 Control Tmnt 1 Tmnt 2 Tmnt 3 Crude Protein 200 194 186 178 191 184 176 168 Crude Lipid 81 76 70 66 75 71 66 60 Brunt Starch1 350 364 385 404 359 379 407 432
Table 2 – Proximate analyses of CP, lipid and starch concentrations in experimental diets. (after van Harn and van Krimpen, 2016).
1Brunt et al., (1998) starch analysis method
Control Tmnt 1 Tmnt 2 Tmnt 3 Liveweight (g) 2,416 2,433 2,450 2,444 Mortality (%) 5.4 5.9 2.7 6.1 FCE (g lwt./g feed) 660.9a 664.0 ab 672.0 b 671.6 b Feed Intake (g/d) 107.3 106.4 105.0 106.0 Water Intake (ml/d) 199.7 193.0 179.6 188.9 FPS1 143a 110 b 79 c 39 d
Table 3 – Overall performance of male Ross 308 broilers on reduced CP diets (after van Harn and van Krimpen, 2016).
Figure 1. The influence of the ratio of protein and starch disappearance rates in the distal ileum on weight gain (a) and FCR (b), (after Liu et al., 2017).
Specific feed pan for turkeys


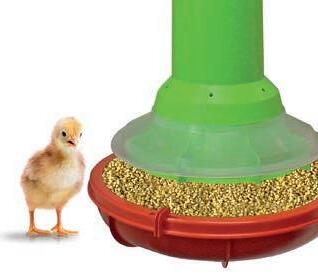


- march 2023NUTRITION AZA International s.r.l. Via Roma 29 24030 Medolago (BG) Italy Phone (+39) 035 - 901240 - E-mail: info@azainternational.it QUALITY MADE IN ITALY Watch all information about Modula www.azainternational.it MODULA Leader in pig & poultry equipment
I WANT AZA!
day-old
and
simple and complete
of any
of the feed pan. STURDY AND EASY TO MANAGE
CHICK INSIDE THE PAN
FAST ASSEMBLY
Designed from one
chicks to heavy and nervous male turkeys. Safe and fast assembly/ disassembly of the anti- waste ring without tools. The bottom cap is easy to remove
assures
washing
component
NO
EASY CLEANING SAFE AND
Feeding a synergistic blend of organic acids and ß-1,4 mannobiose reduces caecal salmonella in broiler chickens
The aim of this study was to investigate the overall effect of feeding a synergistic blend, that contains short chain fatty acids, medium chain fatty acids, hydrolyzed copra meal (containing ß-1,4 mannobiose) and microencapsulated sodium salts of butyric acid, on caecal Salmonella counts in Salmonella challenged broiler chickens, regardless of experimental conditions.
DPI. Data analysis was done in SAS taking within and between study variation into account using a random and repeated statement within the mixed model respectively.
The results show that in the period 0-14 DPI the synergistic blend resulted in significantly lower caecal Salmonella counts compared to the control diet. The natural course of Salmonella infection caused a decrease in the period 15-34 DPI, resulting in no significant differences between caecal Salmonella counts of both diets. Overall, it was concluded that feeding a synergistic blend is effective in reducing caecal Salmonella in broiler chickens within the first 14 days after the initiation of the challenge.
Introduction
To test this, data from 9 studies, performed around the globe (Brazil, Spain, Thailand), were combined into one meta-analysis. In all studies broiler chickens were fed either a control diet according to local standards or a diet containing the synergistic blend from day 1 onwards. Between day 1 and 8 of age the birds were challenged with one of the Salmonella spp. (Enteritidis, Typhimurium, or Heidelberg). The quantitative Salmonella count data were split between 0-14 days post inoculation (DPI) and 15-34
Salmonella spp. in poultry pose a serious risk for food safety. The complex nature of Salmonella infections in poultry requires a multifactorial solution. It is key to preventing Salmonella colonization throughout the entire gastrointestinal tract (GIT). Short chain fatty acids (SCFA) have been described as having beneficial effects in the upper part of the gut, whereas medium chain fatty acids (MCFA) target the lower GIT. Coated butyrate is described as having an effect in the lower GIT. Combining these three ingredients into one feed additive blend results in a targeted response to Salmonella throughout the GIT. In addition, since a microbial imbalance, due to overgrowth by organisms such as Salmonella, may cause a less efficient gut immune response, a fourth ingredient was considered. Hydrolyzed copra meal with ß-1,4 mannobiose as main ingredient has proven beneficial effects against Salmonella in vitro and in vivo in broiler chickens, in addition to activating the innate immune response in mac -
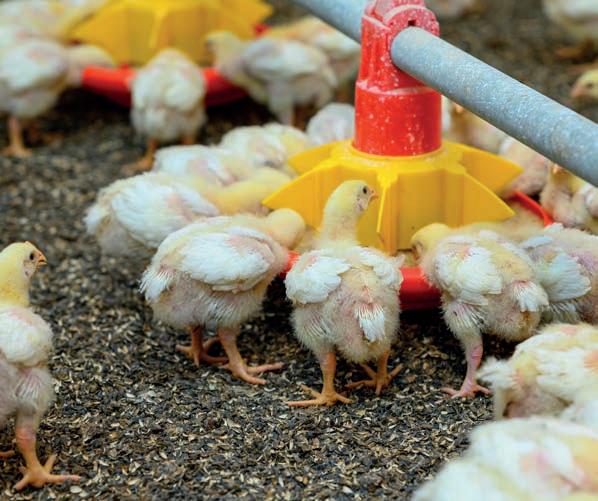
38 - veterinary scienceVETERINARY SCIENCE
S. Van Kuijk1, L. Pineda1 and Y. Han1
1 Trouw Nutrition R&D, P.O. Box 299, 3800 AG Amersfoort, the Netherlands
rophages, supporting the natural host defense mechanisms. It is hypothesized that feeding a synergistic blend containing SCFA, MCFA, hydrolyzed copra meal (containing ß-1,4 mannobiose) and microencapsulated sodium salts of butyric acid will reduce Salmonella colonization in the GIT of broiler chickens. Several studies have been performed around the globe to show effects of this synergistic blend; however due to differences in study design and geographic differences the results were not always consistent. Therefore, all these studies were combined into one meta-analysis, aimed at investigating the overall effect of the synergistic blend on Salmonella colonization in Salmonella challenged broiler chickens, regardless of experimental conditions.

Materials and methods
Thirteen studies, conducted at various research institutes around the globe (Brazil, Spain, Thailand) were included in the meta-analysis. All included stud -
- march 2023 - 39 VETERINARY SCIENCE
Country Study duration (days) Model Salmonella serovar Day of inoculation Included parameter s1 Spain 32 Infection Enteritidis 7 15-34 DPI Spain 42 Infection Typhimurium 8 15-34 DPI Spain 35 Infection Enteritidis 8 0-14 DPI, 15-34 DPI Spain 32 Infection Enteritidis 7 0-14 DPI, 15-34 DPI Spain 42 Infection Enteritidis 8 0-14 DPI, 15-34 DPI Spain 33 Infection Enteritidis 7 15-34 DPI Spain 33 Infection Typhimurium 7 15-34 DPI Brazil 35 Seeder Heidelberg 3 0-14 DPI, 15-34 DPI Thailand 35 Infection Typhimurium 7 0-14 DPI 1 0-14 DPI = Salmonella
days 0 and 14 post inoculation; 15-34 DPI = Salmonella
days 15 and 35 post inoculation. FIER VICOLA I N TER N A T IO N A L P OU LTR Y EX HI B I T IO N 3-4-5 MAY 2023 RIMINI - EXPO CENTRE - ITALY TOGETHER WITH cjc
Table 1 – Overview of studies included in the meta-analysis.
counts between
counts between
ies were performed at Trouw Nutrition research facilities or done at research institutes in collaboration with Trouw Nutrition. None of the studies were published, details on the study design per study are shown in Table 1. All studies were done in broiler chickens that were challenged with one of the Salmonella strains (Enteritidis, Typhimurium, or Heidelberg). In each study, from day 1 onwards, the birds received either a control diet, or the control diet with the synergistic blend (Fysal Fit-4, Trouw Nutrition, the Netherlands) added to it. The synergistic blend was a proprietary mixture of short chain fatty acids, medium chain fatty acids, hydrolyzed copra meal (containing 13% ß-1,4 mannobiose) and microencapsulated sodium salts of butyric acid.
The blend was dosed at 3 kg/metric tonne in the first feeding phase, which varies in length up to maximum 23 days of the study, and 1 kg/metric tonne until the end of each study. In all 9 studies, quantitative Salmonella counts were enumerated in the caecum at one or more different days varying per study. Caecal Salmonella counts are expressed as log colony forming units (CFU) per gram caecal content.
The raw data containing caecal Salmonella counts of the studies were combined into one file. The data were analyzed in SAS using a mixed model including within and between study variation in the random and repeated statements. Data analysis was split into two statistical analyses. One contains the data between 0 and 14 days post inoculation (DPI), for which analysis 5 studies were included. The second contains data between 15 and 34 DPI, for which 8 studies were included.
Table 2 – Overview of the meta-analysis results for Salmonella counts. Results of 0-14 DPI were based on 5 studies, results of 15-34 DPI were based on 8 studies.
Results
The results of the meta-analysis are shown in Table 2. In the analysis for 0-14 DPI including 5 studies, the caecal Salmonella counts were significantly lower in the birds fed the synergistic blend compared to the control group. In total a reduction of 0.429 log CFU/g (+/- 0.164) was observed (P=0.011). There were no significant differences between the control and the synergistic blend in Salmonella counts between 15-34 DPI including 8 studies (P=0.519).
Discussion
The synergistic blend contains several ingredients and, based on the current data, it is not possible to link the results to any one of the ingredients. As described above, the main ingredients SCFA, MCFA, ß-1,4 mannobiose and the butyric acids are all individually described to have beneficial effects in Salmonella challenged chickens. The combination of the different ingredients likely results in a functional feed additive that also supports the bird’s gut and supports the natural host defense mechanisms via the immune system. This is the first detailed study showing the effect of the synergistic blend on Salmonella control and growth performance, while combining different studies performed under various conditions. Future studies should be performed to look at other effects such as stimulation of the immune system or effect on gut health of the synergistic blend in addition to Salmonella reduction. The inoculation of the birds included in the current study was done between day 3 and 8 of age, meaning young chicks were used for all studies. In young chicks, the gastrointestinal tract is not yet fully developed meaning that Salmonella can infect relatively easily. However, upon maturation of the gastrointestinal tract, Salmonella infections will be naturally reduced. This explains why there was no difference in Salmonella counts between 15-34 DPI. From this study it can be concluded that feeding a synergistic blend containing SCFA, MCFA, hydrolyzed copra meal (containing ß-1,4 mannobiose) and microencapsulated sodium salts of butyric acids may significantly reduce caecal Salmonella counts in young chicks within the first 14 DPI.
References are available on request
From the Proceedings of the APSS 2022
40 - veterinary science -
VETERINARY SCIENCE
Salmonella 0-14 DPI (log CFU/g) Salmonella 15-34 DPI (log CFU/g) Mean - Control 3.097a 1.605 Mean - Synergistic blend 2.669 b 1.536 Difference of the means -0.429 -0.069 Standard error of the difference 0.164 0.107 Lower 95% confidence limit -0.757 -0.281 Upper 95% confidence limit -0.101 0.142 P-value 0.011 0.519
CHOOSE HOW YOU WANT TO ENJOY
It’s been 50 years since Zootecnica International started serving the poultry industry and professionals. Today the magazine is edited in three languages (English, Italian and Russian) and delivered monthly in 120 countries, reaching around 30.000 readers all over the world.

The target of Zootecnica International includes farmers, egg producers, breeding companies, hatcheries, feed mills, poultry and egg processing companies.
Magazine and website offer a broad overview on the poultry industry, providing in-depth news on international markets, business management, trends and practices in poultry, genetics, incubation, nutrition, veterinary and management.
PRINT ONLY
(print magazine delivered to your door)
DIGITAL ONLY
(digital magazine sent to your mailbox)
PRINT + DIGITAL
€ 99
€ 49
Subscribe by money transfer:
1. effect a money transfer to: Zootecnica International, Vicolo Libri, 4 50063 Figline Incisa Valdarno (FI), Italy; bank: UNICREDIT, BIC: UNICRITM1OU9
Iban: IT 81 H 02008 38083 000020067507
2. send us your complete shipping address by email: subscription@zootecnica.it.
€ 109
- march 2023
VETERINARY SCIENCE
Broiler processing, product quality, and yield
Meat quality is usually defined as a measurement of attributes or characteristics that determine the suitability of meat to be eaten as fresh or stored for reasonable period without deterioration. During the production and processing of poultry for consumption, many factors influence final product quality. Final product quality is measured through a variety of parameters including physiological composition, microbiological status, processing parameters, and sensory parameters.
Dianna V. Bourassa, Auburn University
Production parameters
Parameters during broiler production will influence final product quality.

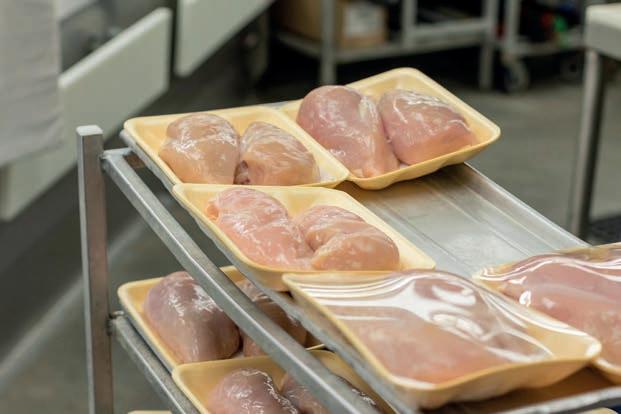
Genetics
Many meat quality traits have high heritability. Bird genetics can influence feathering, growth rates, and meat traits. Poor feathering can lead to an increase in scratches, breast blisters, and potentially cellulitis. Alternatively, heavy feathering can lead to a need to increase defeathering time or adjust pickers, potentially leading to skin tearing or wing damage. Growth rate influences the presence of myopathies. Meat traits such as color, pH, drip loss, and shear can also be influenced by bird genetics.
Health
Bird health has a major impact on meat quality. Skin leukosis, dermal cell carcinoma, reovirus, bacterial infections, and septicemia/toxemia can all lead to poor quality, loss of yield, and condemnations.
Nutrition
Feed formulation and feed quality can have strong positive or negative impacts on product quality. Feed ingredients will influence skin color, meat color, and meat pH which impact the visual appearance and functional properties of the product. Oxidative stability and fatty acid profiles will influence the microflora and shelf life. The presence of mycotoxins in poor quality feed can lead to capillary hemorrhage, therefore influencing color and yield.
42 - processingPROCESSING
Stocking density
The appearance of the skin can be influenced by stocking density. Increased densities have been shown to lead to increases in dermatitis, bruising, and scratches on carcasses at processing.
Litter management
Like stocking density, the birds’ environment during growout plays in important role in the appearance of the carcass. Poor litter management can lead to issues such as hock burns, breast blisters, paw burns, high levels of ammonia exposure, and potentially infectious process from secondary infections.
Bird management
Bird stress will influence product quality and yield. Green muscle disease is caused by excessive physical movement or flapping, inflammation of the pectoralis major and minor muscles, lack of blood flow to the pectoralis minor due to the inflammation, and finally tissue necrosis. Heat and cold stress can lead to muscle damage, reduced protein functionality, and pse-like meat.
Harvest and transport parameters
Harvest injury
Harvesting birds for processing inherently increases injuries. However, the frequency of injury can be reduced through well trained catch crews utilizing proper catching techniques and transport module maintenance. Management during catching to keep birds as calm as possible while avoiding piling will reduce resulting injuries.
Transport
Heat and cold stress during transport have long term impacts on meat pH, color, cook loss and water holding capacity. Extreme stress will lead to increased frequency of DOAs and thus total losses of birds with maximum inputs.
Processing parameters
Unloading
Tipping and shacking have the potential to lead to wing damage and bruising.
Stunning and neck cut
Electrical stunning should be maintained to minimize hemorrhages and broken clavicles/wings. Controlled atmosphere stunning can be adjusted to minimize wing damage during stunning, defeathering issues, and broken paws. Efficiency of neck cut can influence a successful bleedout reducing red wing tips.
Scalding
Underscalding can lead to barking and issues downstream with defeathering. Overscalding leads to meat discoloration due to cooking.
Defeathering
Aggressive defeathering can lead to carcass damage, particularly if the meat is prone to spaghetti breast. Less aggressive defeathering can lead to excess feathers remaining on carcasses.
Evisceration
If not well adjusted for bird size, evisceration equipment can cause viscera or carcass damage, reducing yields. Flock variability can also negatively affect evisceration outcomes.
Chilling
Carcass chilling strongly influences final product quality and yield. Overexposure to antimicrobials such as PAA during immersion chilling can cause bleaching. Water pH can influence both microbial reduction and water pickup. Air chilling can lead to poor skin appearance if there is a lack of moisture added during the chill process.
Deboning
Time between slaughter and deboning in addition to rates of temperature decrease can influence both pH decline and subsequent meat texture. Overall, a multitude of factors will influence quality and yield of processed broiler meat products. Although many factors occur during production and would require longer term plans for adjustment, much can be done between harvest and deboning to improve product quality and yield outcomes.
From the Proceedings of the Midwest Poultry Federation Convention 2022
43 - march 2023PROCESSING
World leader in incubators & complete hatchery solutions


www.petersime.com
Incubators for all types of eggs. Specialists for partridges, pheasants and ostriches. Via Bancora e Rimoldi 3 – 22070 Guanzate (COMO), Italy 39-031.352.91.22 – 031.352.91.29 - Fax: 39-031.352.95.91 victoria@victoria-srl.com
Automatic and digital incubators from 18 to 10.000 eggs of capacity Via G.Galilei 3 – 22070 Guanzate (COMO), Italy - Fax: +39-031.899.163


E-mail: fiem@fiem.it


INCUBATORS SPECIALIST SINCE 1924
aviagen.com Great Achievements, Great Numbers 2020 - Arbor Acres Zootecnica Magazine Market Guide Ad - ENGLISH.indd 1 2/10/20 1:38 PM Reliable Breeder, Resilient Broiler aviagen.com aviagen.com ROSS 308 DELIVERS Ross Zootecnica Magazine Market Guide Ad - ENGLISH.indd2/10/201 1:34 PM info@cobbvantress.com The Chicken Experts. aviagen.com zootecnicainternational.com Breeders Hatcheries
www.agritech.it – e-mail: commerce@agritech.it
Leader in pig & poultry equipment


THE MOST INNOVATIVE RANGE FOR POULTRY FEEDING


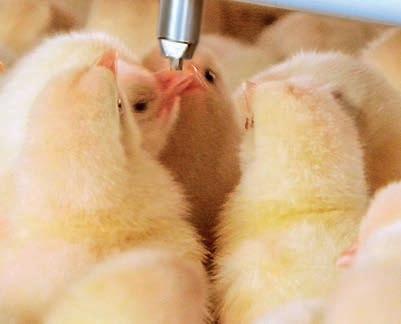
Via Roma 29, 24030 Medolago (BG) Italy - Phone +39 035 901240 Fax +39 035 902757 info@azainternational.it www.azainternational.it
CARFED INTERNATIONAL LTD

Italian headquarters: Piazza Oberdan, 3, 20129 Milano (Italy)
Italian warehouse: Via Basilicata, 10, 20098 San Giuliano Milanese (Italy)
Tel.: +39 02 9881140 - Fax: +39 02 98280274
Email: carfed@carfed.it - Website: www.carfed.it
UK headquarters: Ground Floor, One George Yard, London EC3V 9DF, England, UK
Тel.: + 44. 20. 7660.0987- Email: carfed@carfed.co.uk
www.bigdutchman.de
POULTRY EQUIPMENT
No. 1 worldwide
CODAF Poultry Equipment Manufacturers
Via Cavour, 74/76 • 25010 Isorella (Brescia), ITALY
Tel. +39 030 9958156 • Fax: +39 030 9952810 info@codaf.net • www.codaf.net
• Watering & Feeding Systems
• Poultry Accessories

• Industry Breeding
• Manure & Egg Belts
Corti Zootecnici Srl | Via Volta 4, Monvalle (VA) - Italy|
Tel. +39 0332 799985 | info@cortizootecnici.com
BELTS AND ROPES FOR AVICULTURAL US E Manure removal belts an d Manure belt with holes for drying system s
TURNKEY PROJECTS
Via Garibaldi, 54 – 26040 Scandolara Ravara (CR) Italy
Tel. (+39) 0375/95135 • Fax. (+39) 0375/95169 info@barbieri-belts.com • www.barbieri-belts.com
POULTRY INTEGRATED PROJECTS POULTRY EQUIPMENT FOR BROILERS AND LAYERS AVIARY SYSTEMS
Officine Facco & C. S.p.A. Via Venezia, 30 - Marsango (PD) Italy Tel. +39 049 9698111 - Fax +39 049 9630605 | www.facco.net - facco@facco.net 03/10/14 15:06
The
BD Ad Zootecnica 55x95 10-13.indd 1 22.10.13 14:24
Equipment
GmbH & Co. KG
Dassendaler Weg 13 • D-47665 Sonsbeck (Germany)
POULTRY EQUIPMENT MANUFACTURERS


VALLI spa • via Cimatti, 2 • 47010 Galeata (FC) • Italy
T: +39 0543 975 311 • F: +39 0543 981 400
E: info@valli-italy.com • I: www.valli-italy.com
Housing equipment for breeders, layers and broilers.
www.vencomaticgroup.com
T: +49 (0) 2838 912-0 • F: +49 (0) 2838 2791 info@specht-tenelsen.de • www.specht-tenelsen.de impex nl
zootecnicainternational.com

Let’s talk about water
Drinking systems for chicks, broilers, breeders, layers, ducks, turkeys, rabbits and pigs

Conveyor systems for egg collection
Climate systems: Pad Climate (evaporative cooling for paper or plastic pads) and Top Climate (with high pressure nozzles)
LUBING via Marco Polo, (Z.I.)
info@lubing.it www.lubingsystem.com
SISTEM SRL lubingsystem.com
THE BEST FOR YOUR EGGS!
via San Lorenzo, 9b 35010 Campo San Martino (PD), Italy
Ph: +39.049.9620774
Web: www.flexy.it - Email: info@flexy.it

Campodarsego,
+ fax +
Padova Italy tel.
Equipment
UPCOMING EVENTS
March, 8 to 10
VIV ASIA
International trade show from feed to food for Asia
IMPACT Exhibition Center
Bangkok, Thailand
For information contact:
Worldwide
VNU Exhibitions Europe
Tel.: +31 (0) 30 295 2700
Fax: +31 (0) 30 295 2809
South East Asia
VNU Exhibitions Asia Pacific Co., Ltd.
88 The PARQ, 4th Fl., West Wing
Ratchadaphisek Rd., Khlong Toei, Bangkok 10110 Thailand
Tel.: +662 111 6611
Email: viv@vnuasiapacific.com
Website: vivasia.nl
March, 22 to 24
123rd Turkey Science and Production Conference
Carden Park Hotel and Golf Resort
Chester, UK
For information contact:
Carden Park Hotel and Golf Resort
Broxton Road, Chester CH3 9DQ, United Kingdom
Tel.: +44 1829 731000
Email: 2023@turkeytimes.co.uk
Website: www.turkeytimes.co.uk
April, 11 to 13
PEAK
Where North American Poultry Connects
Minneapolis Convention Center
Minneapolis, USA
For information contact:
Tel.: +1 (612) 736 284 6763
Email: info@midwestpoultry.com
Website: www.midwestpoultry.com
May, 1 to 3
MEP
Middle East Poultry Expo
Riyadh International Convention and Exhibition Center
Riyadh, Saudi Arabia
For information contact:
Website: www.mep-expo.com
May, 3 to 5
Fieravicola
International Poultry Exhibition
Rimini Expo Centre
Rimini, Italy
For information contact: Fieravicola S.R.L. Via Emilia, 155 47921 Rimini (RN) - Italy
Tel.: +39 0547 1877115
Email: info@fieravicola.com
Website: www.fieravicola.com
May, 30 to June 1
Meat and Poultry Industry Russia
From Feed to Food
Crocus Expo
Moscow, Russia
For information contact:
Email: info@meatindustry.ru
Website: meatindustry.ru
July, 6 to 9
VIV TURKEY
International trade fair for poultry technologies
Istanbul Expo Center
Istanbul, Turkey
For information contact:
Mrs Hande Çakıcı
Tel.: +90 212 216 4010
Fax: +90 212 216 3360
Email: hande@hkf-fairs.com
Website: www.vivturkey.com
June, 21 to 24
23rd European Symposium on Poultry Nutrition - ESPN 2023
Palacongressi Rimini
Rimini, Italy
For information contact:
VET International S.r.l.
Milan, Italy
Email: espn2023@vetinternational.eu
espn2023sponsor@vetinternational.eu
Website: www.espn2023.eu
September, 12 to 14
SPACE 2023
Parc-Expo Rennes
Rennes Cedex, France
For information contact:
Tel.: +33 (0) 2 23 48 28 80
Email: info@space.fr
Website: www.space.fr
November, 20 to 22
VIV MEA
International Trade Show From Feed To Food for The Middle East and Africa
ADNEC, Abu Dhabi
United Arab Emirates
For information contact:
Organizer VIV worldwide
VNU Exhibitions Europe
P.O.Box 8800
3503 RV Utrecht, the Netherlands
Tel.: +31 (0) 30 295 2999
Email: viv.mea@vnuexhibitions.com
Website: www.vivmea.nl
Venue
Abu Dhabi National Exhibitions Company (ADNEC)
Khaleej Al Arabi Street
P.O. Box 5546
Abu Dhabi, United Arab Emirates
Tel.: 800 23632 and international +971 (0) 2 444 6900
Fax: +971 (0) 2 444 6135
Website: www.adnec.ae
2023
INTERNET GUIDE
Agritech commerce@agritech.it
Arion Fasoli info@arionfasoli.com
Aviagen info@aviagen.com
Aviagen Turkeys Ltd turkeysltd@aviagen.com
Aza International info@azainternational.it
Barbieri Belts info@barbieri-belts.com
Big Dutchman big@bigdutchman.com
Biochem info@biochem.net
Carfed International Ltd carfed@carfed.co.uk
Carfed Italian Branch carfed@carfed.it
Cobb Europe info@cobb-europe.com
Codaf info@codaf.net
Corti Zootecnici S.r.l. info@cortizootecnici.com
DACS mail@dacs.dk
EuroTier eurotier@dlg.org
Facco Poultry Equipment facco@facco.net
FIEM fiem@fiem.it
FierAgricola Verona fieragricola@veronafiere.it
FierAvicola info@fieravicola.com
Gasolec sales@gasolec.com
Giordano Poultry Plast info@poultryplast.com
GI-OVO B.V. sales@gi-ovo.com
Hendrix Genetics info@hendrix-genetics.com
Hubbard contact.emea@hubbardbreeders.com
Hy-Line International info@hyline.com
Impex Barneveld BV info@impex.nl
Intracare info@intracare.nl
Jamesway sales@jamesway.com
Jansen Poultry Equipment info@jpe.org
Lubing System info@lubing.it
Marel Poultry info.poultry@marel.com
Mbe Breeding Equipment info@mbefabriano.it
Menci commerciale@menci.it
Meyn sales@meyn.com
MOBA sales@moba.net
MS Technologies info@mstegg.com
Newpharm info@newpharm.it
Officine Meccaniche Vettorello luciano@officinevettorello.it
Omaz srl omaz@omaz.com
Petersime N.V. info@petersime.com
Prinzen B.V. info@prinzen.com
Reventa info.reventa@munters.de
Royal Pas Reform info@pasreform.com
www.agritech.it
www.arionfasoli.com
www.aviagen.com
www.aviagenturkeys.com
www.azainternational.it
www.barbieribelts.com
www.bigdutchman.de
www.biochem.net
www.carfed.it
www.cobb-vantress.com
www.codaf.net
www.cortizootecnici.it
www.dacs.dk
www.eurotier.com
www.facco.net
www.fiem.it
www.fieragricola.it
www.fieravicola.com
www.gasolec.com
www.poultryplast.com
www.gi-ovo.com
www.hendrix-genetics.com
www.hubbardbreeders.com
www.hyline.com
www.impex.nl
www.intracare.nl
www.jamesway.com
www.jpe.org
www.lubingsystem.com
www.marel.com/en/poultry
www.mbefabriano.it
www.menci.it
www.meyn.com
www.moba.net
www.mstegg.com
www.newpharm.it
www.officinevettorello.com
www.omaz.com
www.petersime.com
www.prinzen.com
www.reventa.de
www.pasreform.com
Roxell info@roxell.com www.roxell.com
Ska ska@ska.it www.skapoultryequipment.com
Socorex socorex@socorex.com www.socorex.com
Space info@space.fr
Specht Ten Elsen GmbH & Co. KG info@specht-tenelsen.de
Sperotto S.p.A. info@sperotto-spa.com
www.space.fr
www.specht-tenelsen.de
www.sperotto-spa.com
TPI-Polytechniek info@tpi-polytechniek.com www.tpi-polytechniek.com
Val-co intl.sales@val-co.com www.val-co.com
Valli info@valli-italy.com www.valli-italy.com
VDL Agrotech info@vdlagrotech.nl www.vdlagrotech.com
Vencomatic Group B.V. info@vencomaticgroup.com www.vencomaticgroup.com
Victoria victoria@victoria-srl.com www.incubatricivictoria.com
VIV Europe viv.europe@vnuexhibitions.com www.viveurope.nl
Editorial Director
Lucio Vernillo
Editorial Staff
Daria Domenici (zootecnica@zootecnica.it)
Account Executive
Marianna Caterino (amministrazione@zootecnica.it)
Editorial Office
Zootecnica International
Vicolo Libri, 4
50063 Figline Incisa Valdarno (FI) Italy
Tel.: +39 055 2571891
Website: zootecnicainternational.com
Licence
Registrazione Tribunale di Firenze n.3162 Spedizione in A.P. Art.2 comma 20/B legge 662/96 - Filiale di Firenze
ISSN 0392-0593
Subscription Rates (1 year / 11 issues): Europe Euro 100 Rest of the World Euro 120
Subscribe online by Credit Card or Paypal: zootecnicainternational.com/subscription
Subscribe by money transfer:
1. effect a money transfer to: Zootecnica International, Vicolo Libri, 4
50063 Figline Incisa Valdarno (FI) Italy; bank: UNICREDIT, BIC: UNICRITM1OU9 Iban: IT 81 H 02008 38083 000020067507
2. send us your complete shipping address by email: amministrazione@zootecnica.it.
Art Direction & Layout
Laura Cardilicchia – elleciwebstudio.com
Printed
Nova Arti Grafiche, Florence
English Edition Year XLV March 2023
The transport of live birds is a fundamental process in poultry production. Giordano Poultry Plast® products are suitable for several poultry sector species. All the cages and boxes of Poultry Plast are strong and durable, hygienic and easy to clean. Animal welfare is guaranteed thanks to excellent ventilation, easy stacking, as well as smooth and round surfaces that minimize bruises and broken wings, preventing injuries during coop handling. The coop line is very simple to assemble: push fitself locking.















da





The of live birds is a fun ® amental in poultr y e Plastarestronganddurablehygienicand www.poultryplast.com


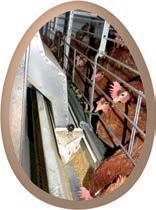





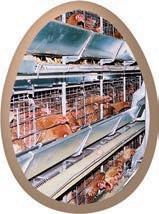

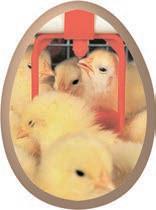


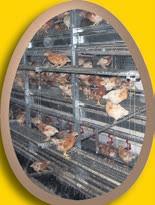


ORIGINAL POULTRY EQUIPMENT GmbH & Co. KG Dassendaler Weg 13 • D-47665 Sonsbeck (Germany) Telefon +49 (0) 2838 912-0 • Telefax+49 (0) 2838 2791 info@specht-tenelsen.de • www.specht-tenelsen.de ® • Cage floor • Group cage system (enriched cage) • Egg belt • Layer battery • Egg collecting system • Manure drying system • Rearing in cages • Rearing in aviary system • Feeding system SPECHT is everywhere hens are! ORIGINAL eco and livestock friendly • Layers in Varia-System where


