DASHBOARD


Q1 2023


Welcome to the Q1 2023 Edition of the Aftermarket Dashboard, a quarterly information service for members of the AAAA.
This industry publication captures useful statistical and related data, as indicators of the unfolding trends and health of the automotive aftermarket industry, and has been designed to provide regular insight on our industry. We value your suggestions for improvement or feedback regarding content.

Consumer confidence continued to fall through the first quarter of 2023 off the back of continuing economic uncertainty, rising inflation, and a level of concern around job security that is impacting consumer spending.
While Australia’s consumer confidence remains at the lows seen through the COVID pandemic and GFC, suggestions from the RBA that interest rates will steady in coming months will hopefully reduce some of the pressure.
Business confidence rose during the first quarter of 2023, however is still in negative territory (under the benchmark of 100). Key factors impacting this include increasing costs of production, ongoing supply chain disruptions, and (in some markets) reduced levels of consumer demand.
While we will potentially see more improvement in consumer confidence that can translate through to the business sector, the continuing uncertainty is impacting investment decisions, hiring plans, and overall business outlook.


Petrol prices declined slightly in the first quarter of 2023 but remain significantly above the historic average, continuing to put pressure on consumer and fleet budgets.

Ongoing global geopolitical uncertainty, along with the recent announcement from OPEC members of reduced production volumes mean that crude oil prices are unlikely to decline significantly in the short to medium term. Relief at the pump is likely still a while off.

Despite ongoing new vehicle production and supply shortages, and significant backlogs on vehicles clearing quarantine, Australia recorded a strong sales result for the first quarter of 2023. Almost 270,000 vehicles were sold, putting it slightly above recent years (and well ahead of the COVID-impacted 2020 result).

Given there is a high level of unmet demand from both private and fleet buyers, this suggests we could be on track for a solid 2023 result. The main factor holding down sales volumes will be availability, with some manufacturers currently listing 12-18 month wait times.
269,002
2023 sales volume in Q1
Q1 of 2023 saw mixed performance across Australian states and territories. On the positive side, the ACT, WA, QLD, NSW, and SA all recorded sales increases. On the flipside, Victoria, Tasmania and the NT recorded YoY declines, underperforming their Q1 2022 results.
This variability in performance (despite supply chain limitations and challenges impacting states across the board) talks to the impact of consumer and business sentiment on sales volumes, with prospective purchasers in some states appearing more hesitant about making significant purchases.


Toyota again finished at the top of the leaderboard this quarter, despite a 30% YoY decrease off the back of significant supply constraints. Extended delivery times on many popular models (e.g. RAV4) mean we could see further shifts through 2023 as other brands ‘pick up the slack’.

▪ Ford will be pleased by its 43% YoY increase, with the Ford Ranger ranked first overall for model sales this quarter (11,909 units).
▪ Hyundai climbed two spots to enter the top 5, just 43 units ahead of Mitsubishi (which recorded a double-digit YoY decline).
▪ Tesla enters the top 10 off the back of strong Model Y sales, achieving 46 units more than Isuzu ute to take 9th spot for the quarter.
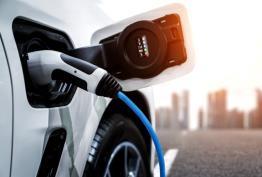
EVs are growing increasing popular with almost 35,000 low or zero emission vehicles sold in the first quarter of 2023.
17,396
That includes 17,396 battery electric vehicles, which is almost triple the entire number sold in 2021. Alongside this, another 1,461 Plug-In Hybrid vehicles were sold over that period.
We are however seeing a shift in the type of EV being sold –in line with broader market trends, the strongest growth is in the SUV category (largely driven by the strong performance of the MG ZS, Tesla Model Y, and BYD Atto 3). While the numbers are small, we can also see electric options emerging in Light Commercial, as electrified vans and utes (the LDV eT60 enter the Australian market).
At a brand level, Tesla continues to dominate the EV market, with the its high-performing Model 3 ranking 3rd overall in terms of new vehicle sales through Q1 (7,238 units), and the newer Model Y achieving 3169 sales.
Looking back at 2022, we can see that the EV growth trajectory really started in Q3, with almost three quarters of these vehicles sold in the second half of the year. At a state level, it’s significant to see VIC outperforming NSW in Q4, despite total sales being ~10,000 less in the southern state. Similarly, more electric vehicles were sold in the ACT than TAS (off the back of a strong program of incentives), despite total Q4 vehicle sales volumes being 20% less in Canberra.
Given total EV sales for Q1 2023 are ~50% higher than was recorded in Q4, we can safely predict strong growth in all segments when the next set of figures are released.
33,416
Much of the early discussion around electric vehicles relates to fleet buyers, talking about them as the ideal early adopters of EVs. One reason for this is that their purchasing is based on Total Cost of Ownership calculations, meaning that in many cases they can already line up the costs of acquiring and operating electric and internal combustion vehicles.
Despite this, 2022 sales figures demonstrate that consumers are leading the way to electric vehicles, with more than two thirds of the vehicles sold in each quarter going to private buyers.
At an overall market level, fleet buyers typically purchase around half of the vehicles on offer, suggesting that this trend will reverse itself as the range of electric vehicles on offer (and supporting infrastructure continue to improve. Particularly important here will be their capabilities as tool of trade vehicles, supporting tradespeople and other skilled workers who spend significant time on the road each day.
(Source: ACA Research Consumer Auto Tracker)
Aftermarket accessories is a category that performed well through the pandemic, with consumers stuck at home taking advantage of the time to install modifications. Data from the ACA Research Consumer Automotive Tracker shows that this hasn’t changed as we’ve moved beyond the pandemic, with many consumers still choosing to upgrade their vehicle.
We can however see that this is heavily skewed by lifestage, with younger Gen Z consumers the most likely to have purchased products in each of the four categories within the past 12 months. This includes almost half of them purchased car cleaning and care products (which is also the most popular category overall).
Gen Z particularly stand out for interior accessories (such as seat covers, floor mats and sunshades) and in-car technology (e.g. dash cams, GPS, speakers), which can often help them personalise their vehicle at a reasonable price point.
While the volumes are smaller, Gen Z are also the most likely to fit exterior accessories, which may include leisure related options such as towbars and roof racks, as well as performance options such as body kits and exhausts.
We can also see a level of variation in purchasing of aftermarket accessories by state, with Queenslanders the most likely to have purchased three of our four categories (vehicle cleaning & care products, interior accessories and exterior accessories). The sole outlier is in-car technology, where NSW/ACT sit marginally ahead of VIC/TAS and QLD.
Despite recording lower results in some categories, close to two in five consumers in SA/NT and WA have still purchased car cleaning and care products, with around
one in five buying interior accessories and one in ten fitting in-car tech and exterior accessories.
Continuing improvements to eCommerce and logistics offerings mean that availability will only improve from here, ensuring a broad range of products are accessible to consumers across the country.

The Australian Automotive Aftermarket Association (AAAA) has welcomed the passing of the ‘National Reconstruction Fund Corporation Bill 2022’ . The new Bill will establish a $15 billion Australian Manufacturing Fund, making $5 billion available from its commencement.
The fund will specifically target transport manufacturing and supply chains for cars, trains, and shipbuilding. Many Australian automotive product and technology manufacturers will be well placed to benefit, leveraging their skills and knowledge to rebuild Australia’s industrial base.
Peak body welcomes new landmark GCM, GVM codes in the Sunshine State
The Queensland Department of Transport and Main Roads (TMR) has introduced a new Gross Combination Mass (GCM) Code and amended Gross Vehicle Mass (GVM) Code following industry and stakeholder consultations, which has been welcomed by the Australian Automotive Aftermarket Association (AAAA).
The landmark Code is a win for recreational motorists and aftermarket manufacturers in Queensland, making it easier for drivers to modify light vehicles and four-wheel drives to safely carry and tow heavier loads

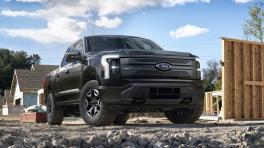
Car manufacturing could be reborn in Australia in the coming years if we were to make electric vehicles here, a senior minister has said.
Minister for Energy and Climate Change Chris Bowen told a global clean energy forum in the US that he wanted to see an EV manufacturing sector set up in Australia which could produce cars for local and international markets.
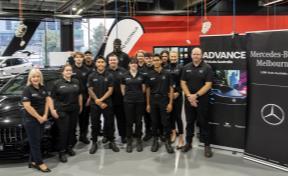
Mercedes-Benz retailer LSH Auto Australia appears to have set the bar for apprenticeship training to a new high by offering trainees a two-and-a-halfyear apprenticeship instead of four years.
In a move designed to enhance the retailer’s reputation as an employer of choice, LSH Auto has been working with the Melbourne-based Kangan Institute and with vocational trainer WPC Group to provide an accelerated training program for aspiring technicians.
The federal government has released its first electric vehicle strategy and outlined how it plans to remove barriers to buying EVs.
The three focus areas for the government are the supply of EVs, the systems and infrastructure needed to support uptake, and demand from drivers for them
Australian Automotive Aftermarket Association Dashboard. Presented by ACA Research. Copyright © 2023.
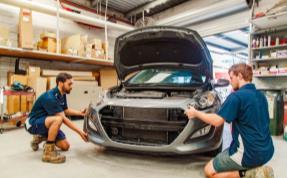
The Albanese Government has announced additional support for automotive business owners and those seeking to enter the trade in a bid to slow the increasing labour gaps in the industry.
The Federal Government has expanded the Australian Apprenticeship Priority List from 77 to 111 – as part of the Australian Apprenticeship Incentive Scheme – and it now includes all major automotive categories.
The Australian Automotive Aftermarket Association, is the national industry association representing manufacturers, distributors, wholesalers, importers and retailers of automotive parts and accessories, tools and equipment, as well as providers of vehicle service, repair and modification services in Australia.
With over 20 years of automotive experience, ACA Research has developed a detailed understanding of the automotive sector, using this market knowledge, we design and deliver research that helps our clients understand and overcome their business issues, empowering them to move forward with confidence.
For more information, please contact:
Lesley YatesDirector
ofGovernment Relations and Advocacy
Australian Automotive Aftermarket Association (AAAA)
Convenor: Automotive Products Manufacturers & Exporters Council (APMEC)
7-8 Bastow Place
Mulgrave VIC 3170 Australia
+61 (3) 9545 3333 | 0402 005 476 lyates@aaaa.com.au
For more information, please contact:
Ben Selwyn Matthew Beatty Director Account ExecutiveACA Research
ACA Research
0411 132 166 0467 243 525 bselwyn@acaresearch.com.au
mbeatty@acaresearch.com.au
Level 6, 54 Miller St
North Sydney NSW 2060 Australia
+61 (2) 9927 3333