17 minute read
Sampling, Analysis, and Risk Assessment for Asbestos and Other Mineral Fibers in Soil

from EEG Journal - February 2020 Vol. XXVI, No. I (2)
by Association of Environmental & Engineering Geologists (AEG)

ED CAHILL* EMSL Analytical, Inc., 200 Route 130 North, Cinnaminson, NJ 08077
Key Terms: Activity-Based Sampling, Fluidized Bed Asbestos Segregator, Incremental Sampling Methodology, Natural Occurrences of Asbestos, Risk Assessment, Soil
ABSTRACT
Asbestos may be present in soil as a natural occurrence or by contamination from asbestos-containing building materials, illegal dumping of asbestos, or other human activities. When trying to properly assess asbestos and other mineral fiber content in a sample by microscopy, soil is a problem matrix in all respects. Even defining the sample to be collected requires forethought and can greatly influence the final analytical result. Determining the sampling approach as well as the best sample preparation and analysis techniques are critical to obtaining accurate results in a metric that is useful to the end user. This article provides an overview of the various approaches that can be applied to assist those involved with asbestos in soil projects. There are many analytical techniques that can be applied for the determination of asbestos content in soil, including visual observation in the field, stereomicroscopy, polarized light microscopy, scanning electron microscopy, transmission electron microscopy, x-ray diffraction, and others. All of these techniques have their own inherent strengths and weaknesses. Fortunately all of the analysis options are complementary, and using multiple techniques can help to better characterize a sampling site and provide a more comprehensive assessment. Time and cost constraints will typically play a role in determining the final sampling and analysis plan.
INTRODUCTION
As high-profile examples of asbestos in soil projects (such as the naturally occurring asbestos [NOA] discovery and response in El Dorado County in California; Meeker et al., 2006) appear in the news media there is increasing awareness and attention paid to the potential for asbestos in soil on all types of project sites (ATSDR, 2011; Buck et al., 2013). NOA sites, brown-
*Corresponding author email: ed.cahill@outlook.com
fields, sites of previous building demolitions, sites of known or suspected illegal dumping, etc., are all being sampled and tested much more than in the past.
Unfortunately, though there are well-established policies, guidance, and regulations covering asbestos in building materials and the indoor or built environment—such as those associated with the Environmental Protection Agency (EPA) Asbestos Hazard Emergency Response Act (US EPA, 1986), the EPA National Emissions Standard for Hazardous Air Pollutants (1973), Occupational Safety and Health Administration (OSHA, 1986), and state and local regulations—there is little guidance dealing with asbestos in soil and rock. Comprehensive Environmental Response, Compensation, and Liability Act (CERCLA) regulations, commonly known as the EPA’s Superfund Program (US EPA, 1980), provide some guidance, but their applicability is limited. CERCLA does recognize the fact that dealing with asbestos-containing building materials (typically covered under NESHAP) is much different from dealing with asbestos in soil scenarios. It cites that using the typical <1 percent action limit for asbestos in building materials is inappropriate for asbestos in soil, as concentrations below 1 percent may still pose unacceptable health risks. The EPA Framework for Investigating Asbestos Contaminated Superfund Sites (US EPA, 2008) does provide some relevant but limited guidance for asbestos in soil projects. The document does suggest various sampling and analytical approaches, but recognizing how disparate various project sites can be, it recommends developing your own site-specific procedures and risk-based action levels.
SAMPLING
Unlike sampling building materials in the built environment, soil sampling often involves much larger and less well-defined sampling areas. If asbestos is present it is typically heterogeneously distributed in the soil, which makes it difficult to decide where to sample and how many samples to collect. The goal is to collect enough samples to reasonably reflect the asbestos content in the soil or rock over a defined area. The collection of discrete grab samples is a common sampling
strategy and can be useful for finding hot spots of asbestos, especially when there is some evidence or indication of where asbestos might be located. Because of the heterogeneity of asbestos in soil, however, individual grab samples can be non-representative of larger areas of concern. This can result in false-negative assumptions, on the one hand, to overestimation of asbestos content on the other. It can take large numbers of grab samples to adequately represent asbestos content on even modest-sized sampling sites. For this reason, incremental sampling is increasingly being used as a means of obtaining more representative samples while controlling for analytical costs.
The incremental sampling methodology (ISM) is designed as a means to collect composite samples that better represent a defined area. In 2009 the Interstate Technology Regulatory Council (ITRC) established a team of experts to investigate, evaluate, and refine the ISM for sampling soils. This technique is valuable for numerous target analytes, not just asbestos. ITRC’s comprehensive Web site (www.itrcweb.org) provides excellent online training and lays out detailed instructions for designing a quality sampling plan. Development of a quality sampling plan is best achieved with the involvement of all parties associated with the project, including property owners, field personnel, geologists, consultants, the lab technicians performing the preparation and analysis of samples collected, and the end users of the data.
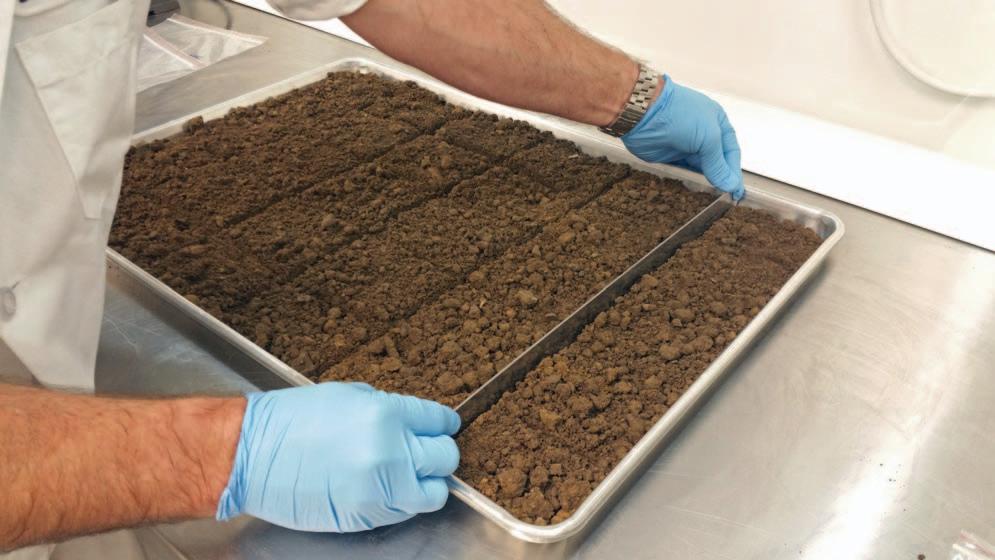
One of the key components of ISM is defining a decision unit, that area (or, more precisely, the volume, since a decision unit is three dimensional) from which a composite sample is to be collected. The size of the decision unit depends on a variety of factors, including what the response action will be if that area is determined to exceed a pre-determined threshold. The specific steps to be taken are detailed on the ITRC Web site and elsewhere. In addition to the field collection procedures, there are quite-specific ISM preparation steps to be performed in the laboratory as well (Figure 1). It is important to work with a laboratory that is versed in ISM and can be a strategic partner on the project team.
ANALYSIS
Microscopy is the primary analytical technique typically applied. X-ray diffraction (XRD) can be useful for mineral identification; however, it lacks the sensitivity of microscopy. XRD also lacks the critical ability to differentiate fibrous from non-fibrous particles. The “detector” for a microscopic analysis is the human eye. This makes it uniquely suited for distinguishing very thin asbestos fibers from a field of view filled with obscuring non-asbestos particulate as a background. One downside of a microscopic analysis is that it has a subjective component, which can add to variability and bias. In addition, regardless of what method is used, there is currently disagreement among experts about what should be counted as a fiber per the method and per existing regulations, what fiber dimensions are of concern toxicologically, how to distinguish true asbestiform particles from cleavage fragments, and if that distinction is even important. More regulations and guidance are needed in these areas.
Even with these issues, microscopy is generally considered the best available technology for detecting low levels of asbestos in soil and rock. This is especially true when both light and electron microscopy are used in conjunction. Polarized light microscopy (PLM) analyses combine visual, stereomicroscopic, and PLM observations for detecting, identifying, and quantifying asbestos. The magnification typically used for a PLM analysis is 400×. Because this type of analysis is performed at relatively low magnifications, the amount of subsample analyzed is much greater than is possible for analyses that occur at higher magnifications; however, small fibers below the limit of resolution for light microscopy go undetected.
Electron microscopy offers much higher magnifications as well as the ability to perform elemental analysis. Scanning electron microscopy (SEM) can reach higher magnifications than can PLM, and being a surface analysis, SEM provides a different perspective than both PLM and transmission electron microscopy (TEM). Although SEM cannot match TEM in terms of magnification or resolution, its images are far superior in depth of field, which provides a more three-dimensional view of the surface of a sample and better morphological information of suspect fibers. SEM is arguably weaker at identifying fibers than are both PLM and TEM as a result of SEM’s inability to easily obtain diffraction pattern information from individual fibers; however, this technique bridges the magnification gap between the two and may be the preferred initial analytical technique in some cases.
TEM operates at much higher magnifications than both PLM and SEM and can readily detect asbestos fibers that are well beyond the limit of resolution of light microscopy. TEM analyses are typically performed at magnifications of 20,000× and higher. The TEM’s extremely high magnification and its ability to collect diffraction patterns and to perform elemental analysis on a fiber-by-fiber basis via energy-dispersive spectroscopy make it well suited to asbestos analysis. Its extremely high magnification, however, limits the amount of subsample that can be analyzed. All of the analytical techniques mentioned are complementary, and multiple approaches can be applied to a single
Technique Strengths Limitations
X-ray diffraction (XRD) Strong mineral identification Limited sensitivity
No morphological data obtained; cannot distinguish fibrous from non-fibrous Polarized light microscopy (PLM) Relatively large subsample can be analyzed Good mineral identification Morphological information can be obtained Relatively low magnification and limited resolution, so small fibers can go undetected Scanning electron microscopy (SEM) Higher magnification than PLM Better resolution than PLM Excellent morphological data obtained Elemental analysis capability for mineral identification Quantitation difficult Inability to easily obtain diffraction data makes
mineral identification less definitive than TEM Transmission electron microscopy (TEM) Highest magnification and resolution Elemental analysis capability Small subsample analyzed
sample. The strengths as well as the limitations of each approach are summarized in Table 1.
Microscopic analysis works best on homogeneous fine powders. In this regard, soil and rock represent a problem matrix, as they are typically heterogeneous and have relatively large particle sizes. To address these issues, a well-outfitted soil lab has all manner of equipment (Figure 2), including jaw crushers, sieve shakers, riffle splitters, turbula mixers, muffle furnaces, mills, and grinders, to render the soil more amenable to a quality preparation and analysis. In fact, the main differences between the methods typically used for analysis of soil and rock comprise the preparation steps used to address the two issues of particle size and heterogeneity. All of the preparation methods described below have the potential to release and disperse asbestos fibers. The release of fibers is a concern not only for potential exposure to lab personnel but also for potential cross-contamination between samples. For this reason, all preparation steps are performed in negative pressure, high-efficiency particulate air (HEPA)–filtered enclosures. Specific procedures and choice of
Figure 1. Two-dimensional slab cake, part of the lab portion of the incremental sampling methodology.
equipment should be made with an eye toward minimizing the release of fibers.
Sieving Approach
With the ASTM method D7521 (2016) approach the fine fraction of the sample that is amenable to preparation and analysis is separated out through sieving. The sample is typically dried, weighed, and then passed through a sieve stack of 19 mm, 2 mm, and 106 µm. The fine (<106-µm) fraction is amenable to both PLM and TEM preparation and analysis. A benefit of this approach is that this fine fraction is analyzed essentially in the same state in which it was collected in the field, with minimal manipulation or alteration. The downside of the sieving approach is that unlike the fine fraction, the coarse and medium fractions are still not amenable to preparation and analysis by PLM or TEM. The particle size of these fractions precludes making proper slide preparations for PLM or grid preps for TEM. Instead, both fractions are examined by low-magnification stereomicroscopy for suspect asbestos materials that might then be isolated and ground fine enough to be mounted for analysis. This approach can potentially lead to false-negative results, and when asbestos is found it makes accurate quantitation difficult. If all three fractions are “non-detectable” for asbestos then the fine fraction is prepared and analyzed qualitatively by TEM. This helps to ensure that small fibers beyond the resolution of light microscopy are not being missed. The coarse and medium fraction are not prepped for or analyzed by TEM since their particle size is prohibitive.
Milling Approaches
Rather than separating out the fine fraction, the milling methods reduce the entire sample to a parti
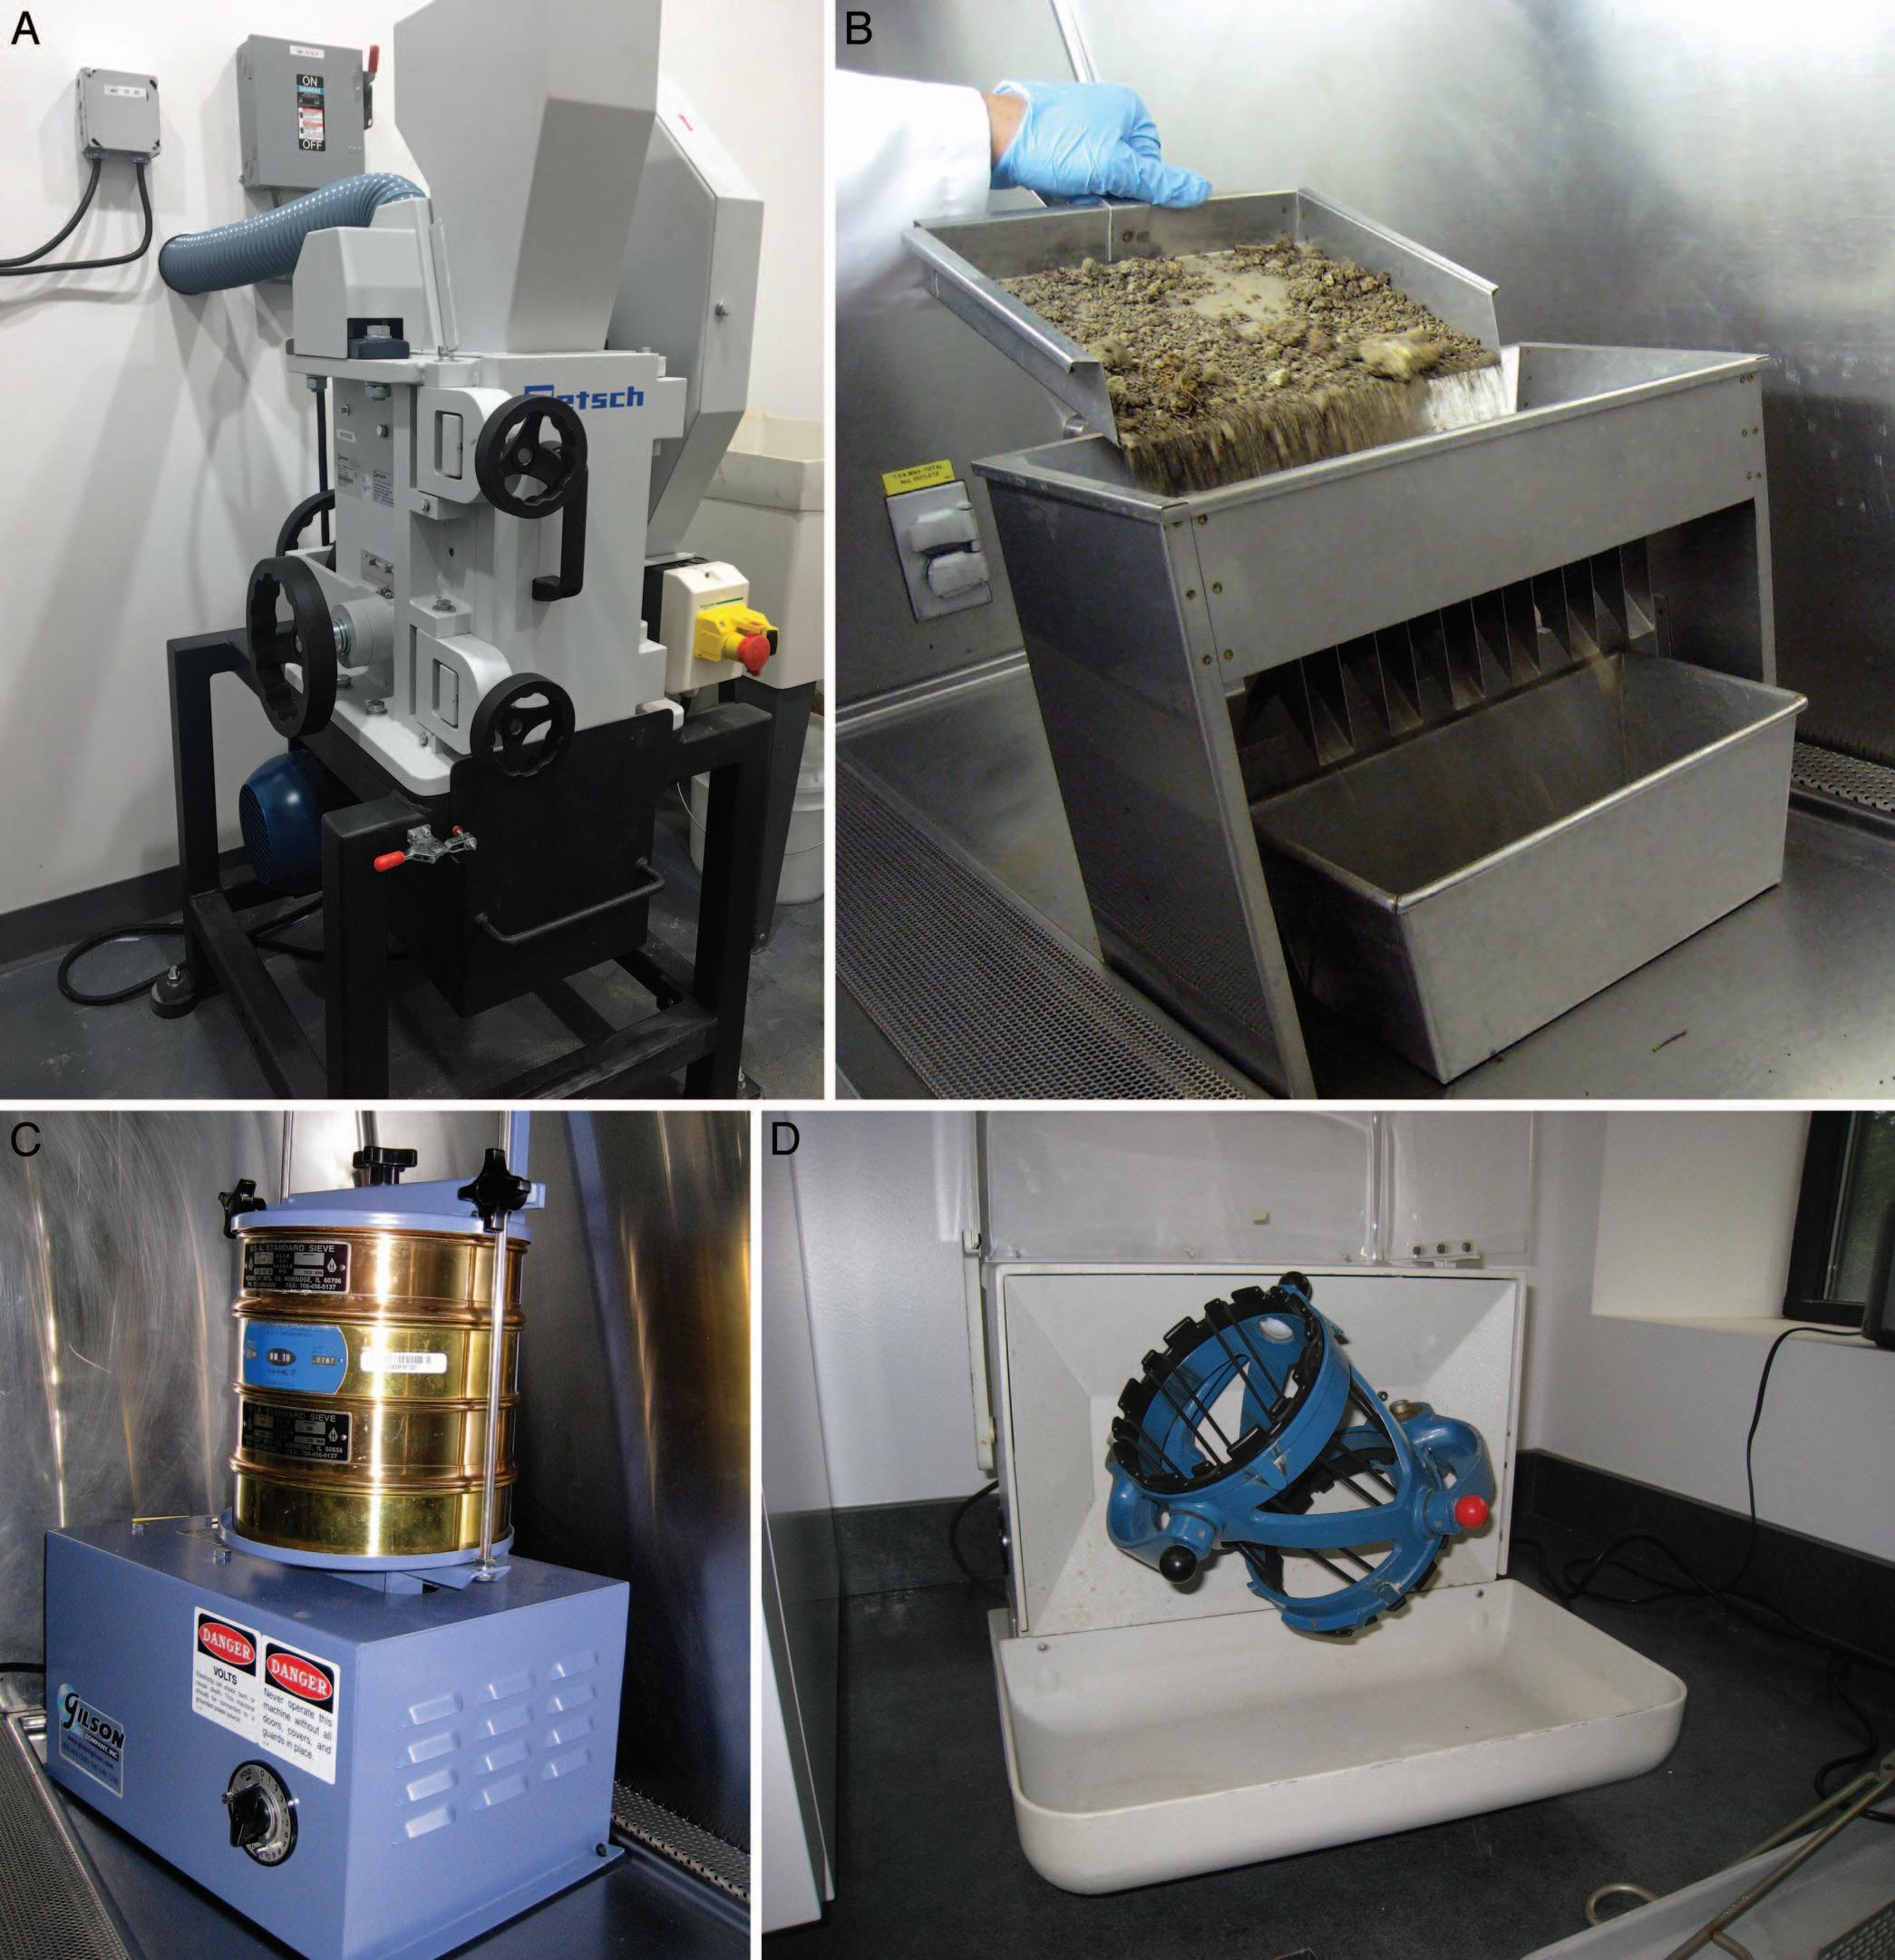
Figure 2. Soil lab instrumentation (clockwise from top left): jaw crusher, riffle splitter, turbula mixer, and sieve shaker.
cle size amenable to preparation and analysis for microscopy (US EPA, 1993; California Air Resources Board, 1991). Once the rock and/or soil have been reduced to a fine powder they are more readily homogenized and prepared for light or electron microscopy (Figure 3). The advantage of milling over sieving is that the entire sample is now represented by the subsample being analyzed. This can reduce the chance for falsenegatives and helps to provide a more accurate overall quantitation of asbestos content.
Just as PLM and TEM analyses are complementary, so too can the sieving and milling preparation approaches be used in conjunction. If, for example, the fine fraction is sieved out of the sample and
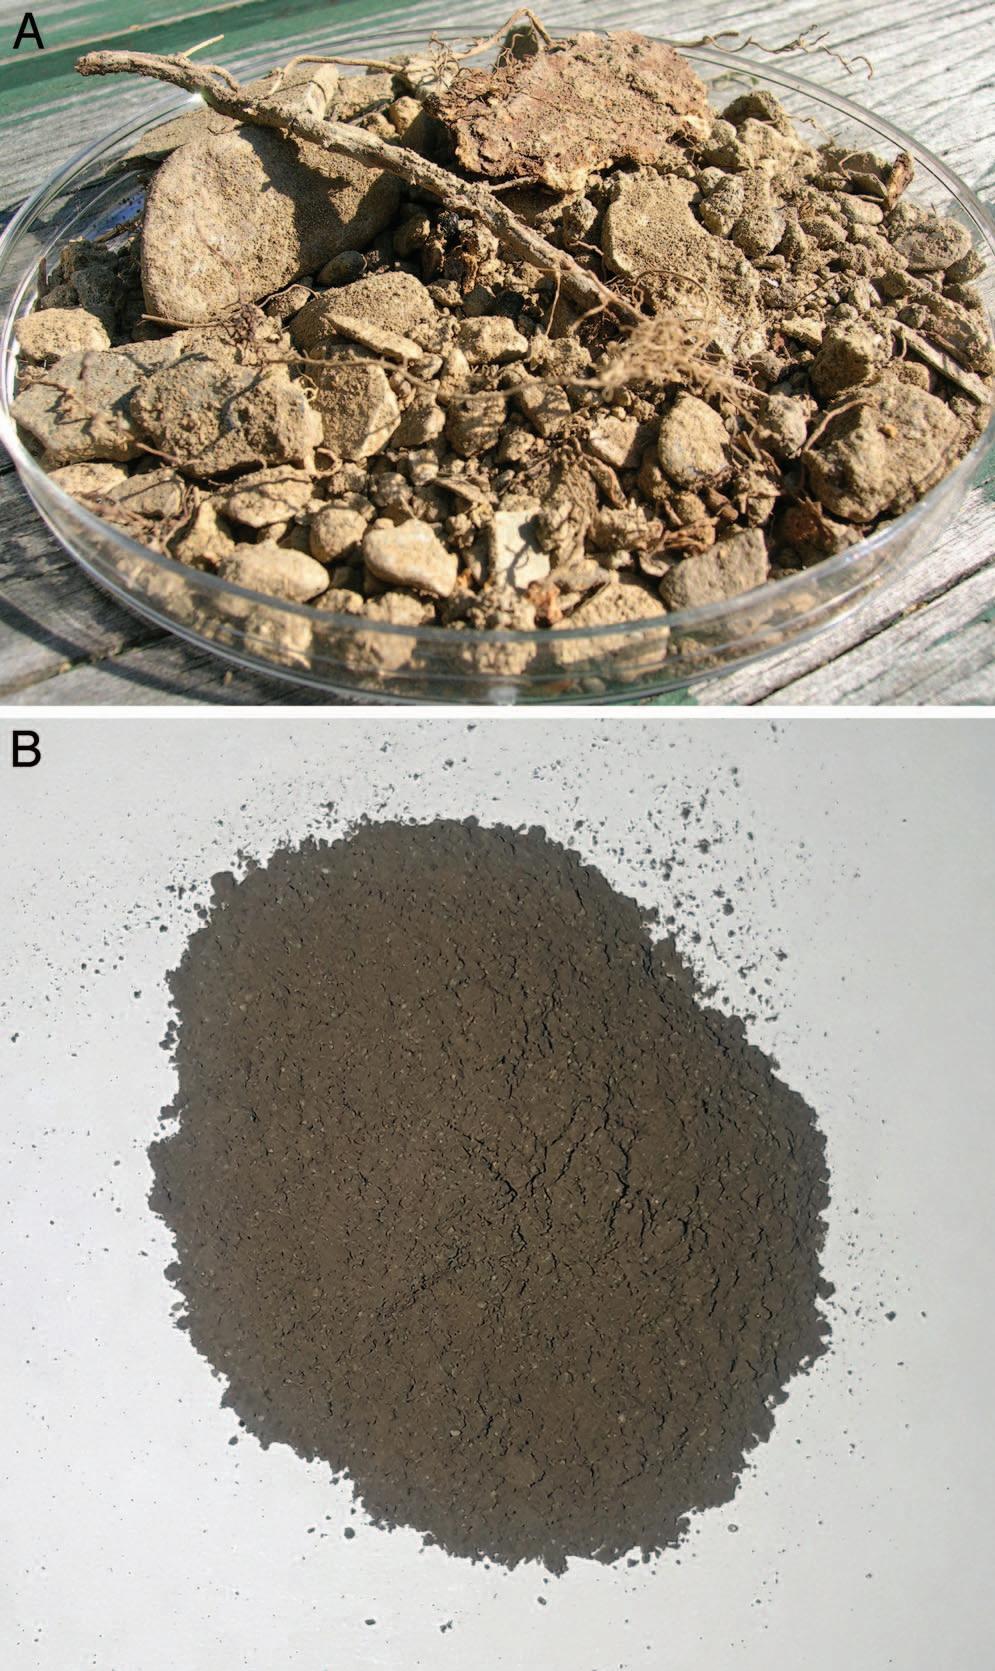
Figure 3. Typical heterogeneous soil and rock sample, as submitted and after milling.
analyzed prior to milling, we get the advantage of looking at the fine fraction unaltered by milling. This can be important in NOA situations, since milling can alter fiber dimensions, break up large bundles of asbestos, and potentially create cleavage fragments from non-asbestiform minerals that can be counted as fibers by the method used. The subsequent milling of the coarser fraction(s) makes those fractions amenable to proper PLM and TEM analyses.
DATA INTERPRETATION
Unequivocal identification of individual mineral fibers found in soil can be difficult. Many of the amphiboles are part of solid solution series, with no clear boundaries between members. It can likewise be difficult to distinguish true asbestiform minerals, those that grow in a mainly unidirectional manner to form extremely long and thin fibers, from those that have broken or cleaved into countable “fibers” by the analytical methods being applied. These are subjective decisions, and it is currently debated just how important those distinctions are. Most existing regulations focus on the indoor environment and six specific regulated asbestos types. But minerals other than the regulated six, such as those that are part of what is known as the “Libby Amphibole” suite of minerals (Meeker et al., 2003), and Erionite, a fibrous Zeolite, are also implicated in causing disease. The National Institute for Occupational Safety and Health (NIOSH) Current Intelligence Bulletin 62 (NIOSH, 2011) known as the “Asbestos Roadmap” advocates looking beyond just the regulated six asbestos minerals. More guidance, policy, and regulations are needed.
Most methods that are applied to soil and rock for asbestos content provide results as a percentage of asbestos. While this is informative to a degree, it provides little information regarding risk. At any given percentage it is the number of respirable fibers that really inform as to the potential risk. For this reason many consultants will augment their sampling of the soil or rock with activity-based air sampling (ABS). ABS typically involves collecting air samples on personnel outfitted with personal protective equipment while mimicking an activity that is likely to occur on the site. The results (in fibers per cubic centimeter) can be compared with existing air action limits such as the OSHA Permissible Exposure Limits (OSHA, 1986). Values can also be compared with historic exposure levels and corresponding toxicity values via the EPA’s Integrated Risk Information System (US EPA, 1988) for risk characterization.
ABS can be useful but is relatively expensive to implement and is hindered by the myriad variables associated with field sampling. Wind velocity and direction, moisture content of soil, height of the sampler (distance from the source), etc., can lead to variability between measurements. To avoid some of the pitfalls of ABS the EPA has begun using the Fluidized Bed Asbestos Segregator (Januch et al., 2013). With this instrument (Figure 4), a known quantity of soil is made to behave like a fluid in an enclosed glass vessel by flowing HEPA-filtered air in the opposite direction of sedimentation, thus liberating respirable dust while a TEM air sample is collected isokinetically from above. The results are expressed in releasable fibers per gram of soil. This instrument was developed for the EPA by the Idaho National Lab (Wright and O’Brien, 2007) and is based on work by Spurney et al. (1975) and others. The EPA made several improvements to the initial design and is using the technique on select projects. The fluidized bed procedure is currently cited
Technique Strengths Limitations
Activity-based sampling (ABS) Personal air sampling results in fibers per cubic centimeter can be used directly for risk assessment Fluidized bed asbestos segrator (FBAS) Field sampling variables are eliminated for more consistent results Less expensive than ABS, since no personal air monitoring is required Can be used to determine if the more expensive ABS sampling should be performed Relatively expensive Field sampling can result in wide variabilty due to changing environmental conditions Results in fibers per gram are only indirectly applicable for risk assesssment models
as “Other Test Method 42” (US EPA, 2018) as it awaits the Federal rulemaking process. The results from the fluidized bed analysis can augment ABS data or be used to help determine if ABS is necessary. Both of these techniques are complementary and can be used in conjunction to take advantage of the strengths of each approach, as summarized in Table 2.
CONCLUSIONS
The determination of asbestos and other mineral fiber content in soil and rock is complex and fraught with variables. It is important to recognize these variables as well as the limitations of each approach to sampling and analysis in order to obtain quality data in the appropriate metric for the data end users. Fortunately, the various approaches and methodologies are
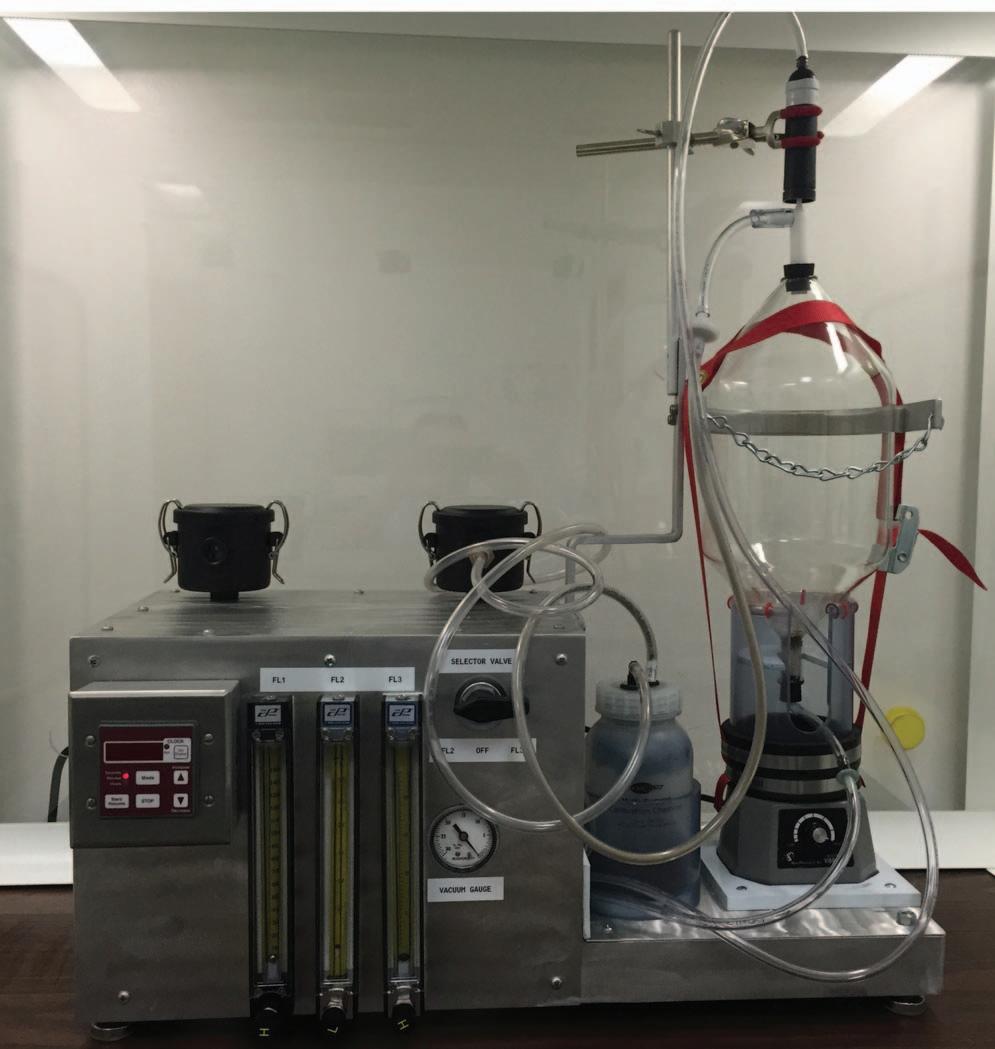
Figure 4. Fluidized bed asbestos segregator.
complementary, and each can contribute to the overall characterization of the soil and/or rock on a given project site. How much sampling and analytical effort are to be applied depend on many variables and can be determined on a site-by-site basis.
REFERENCES
ASTM D7521-16, 2016, Standard Test Method for Determination of Asbestos in Soil:ASTM International, West Conshohocken, PA. Buck, B.; Goosens, D.; Metcalf, R.; McLaurin, B.; Freudenberger, F.; and Ren, M., 2013, Naturally occurring asbestos: Potential for human exposure, southern Nevada, USA: Soil Science Society America Journal, Vol. 77, No. 6, pp. 2192–2204. California Air Resources Board, 1991, Determination of Asbestos Content of Serpentine Aggregate: Method 435, 19 p. Interstate Technology Regulatory Council (ITRC), 2009, Incremental Sampling Methodology Training Courses available at https://www.itrcweb.org/Guidance/ ListDocuments?topicID=11&subTopicID=16 Januch, J.; Brattin, W.; Woodbury, L.; and Berry, D., 2013, Evaluation of a fluidized bed asbestos segregator preparation method for the analysis of low levels of asbestos in soil and other solid media: Analytical Methods, Vol. 5, No. 7: 1658–1668. Meeker, G. P.; Bern, A. M.; Brownfield, I. K.; Lowers, H. A.; Sutley, S. J.; Hoefen, T. M.; and Vance, J. S., 2003, The composition and morphology of amphiboles from the Rainy Creek complex, near Libby, Montana: American Mineralogist, Vol. 88, No. 11-12, pp. 1955–1969. Meeker, G. P.; Lowers, H. A.; Swayze, G. A.; Van Gosen, B. S.; Sutley, S. J.; and Brownfield, I. K., 2006, Mineralogy and Morphology of Amphiboles Observed in Soils and Rocks in El Dorado Hills, California: U.S. Geological Survey Open-File Report 2006-1362, 47 p. National Institute of Occupational Safety and Health (NIOSH), 2011, Asbestos Fibers and Other Elongate Mineral Particles: State of the Science and Roadmap for Research: Current Intelligence Bulletin 62, Publication No. 2011-159, 174 p. Occupational Safety & Health Administration [OSHA]. (1986) 1910, Subpart Z. Regulations (Standards-29 CFR 1910.1001. Retrieved from https://www.osha.gov/lawsregs/regulations/standardnumber/1910/1910.1001 Spurney, K.; Boose, C.; Hochraine, D.; and Geselschaft, F., 1975, On the pulverization of asbestos fibers in a fluidized-bed aerosol generator: Staub Reinhaltung Luft [in English], Vol. 35, No.12, pp. 440–445.
U.S. Department of Health and Human Services Agency for Toxic Substances and Disease Registry (ATSDR), Division of Health Assessment and Consultation, 2011, Evaluation of Community-Wide Asbestos Exposures—El Dorado Hills Naturally Occurring Asbestos Site, El Dorado Hills Boulevard, El Dorado Hills, California: Health Consultation, EPA Facility ID: CAN000906083, 194 p. U.S. Environmental Protection Agency (US EPA), 1973, National Emission Standards for Hazardous Air Pollutants Compliance Monitoring (NESHAP), 40 CFR Part 61 Subpart M; amended 1990 and 1995. US EPA, 1980, Comprehensive Environmental Response, Compensation, and Liability Act (CERCLA or Superfund); amended by the Superfund Amendments and Reauthorization Act, 1986. US EPA, 1986, Asbestos Hazard Emergency Response Act, 40 CFR Part 763, Subpart E. US EPA, 1988, Integrated Risk Information System Assessments: Asbestos, CASRN 1332-21-4. US EPA, 1993, Method for the Determination of Asbestos in Bulk Building Materials: EPA600/R-93/116, 98 p. US EPA, 2008, Framework for Investigating AsbestosContaminated Superfund Sites: OSWER Directive 9200.0-68, 71 p. US EPA, 2018, Sampling, Sample Preparation and Operation of the Fluidized Bed Asbestos Segregator: Other Test Method (OTM) 42, 21 p. Wright, K. and O’Brien, B., 2007, Fluidized Bed Asbestos Sampler Design and Testing: INL/EXT-07-13122, 23 p.


