Scoring Boxes
Other Uses of Containerboard BY DICK STORAT
I
4
BOXSCORE May/June 2020
UID
400
Unidentified Uses of Containerboard
350 Three-year average = 150,000 tons/month
300 250 200 (000 Tons)
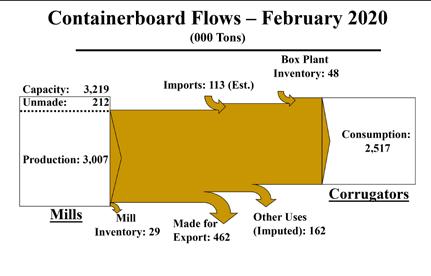
n this article, we will discuss domestic uses of containerboard other than that corrugated by America’s boxmakers. For orientation, the graphic at top right displays graphically the flows of containerboard for the month of February 2020. While the specific numbers will of course change from month to month, the overall pattern remains pretty much the same. The left side of the graphic shows mill production, which in February amounted to just over 3 million tons. Of the total production, some may go to inventory at mills, which amounted to 29,000 tons in February. A substantial fraction of production is made for export and shown as an outflow of 462,000 tons in the diagram. In February, that amounted to 15% of the total U.S. production, mainly unbleached kraft linerboard grades, some 20% of which is exported monthly. Imports, mostly from Canada, account for about 4%–5% of monthly consumption. Also, containerboard held in inventory at box plants can contribute to corrugated volume. In February, 48,000 tons of box plant inventory contributed 1.9% of the 2.517 million tons consumed by corrugators during the month. The remaining 2.356 million tons of February’s corrugated volume was supplied by domestic containerboard mills, amounting to 93.6% of February’s consumption and 78% of production. On top of containerboard that is converted in the U.S., there are uses of containerboard that do not involve corrugation. These are not reported but imputed as the remainder of board produced by mills after adjustment for inventory change and trade flows. It is labeled as “Other Uses” in the top graphic.
150 100 50 0 -50
-100 -150
JAN FEB MAR APR MAY JUN JUL AUG SEP OCT NOV DEC
Source: AF&PA, FBA, RSA
2018
2019
2020
In February, these other uses amounted Page 1accounted for in statistical reports. Over time, these other uses amount to about to 162,000 tons, or 5.4% of monthly 150,000 tons per month, and they track containerboard production. These can be with what some industry observers believe considered in several distinct categories. the actual other uses to be. The first and largest category is actual While these other uses have remained uses of linerboard or medium. The full fairly constant over multiyear periods, spectrum of uses for which linerboard the monthly swings can be quite volatile, and medium are needed is broad, if not


