


, a complete range of quality fish feeds are formulated by our experienced aquatic animal nutritionists covers freshwater and marine species.

The quality diets will maximize feed intake and improving feed conversion ratio, promotes performance by supplying a specific amino acid balance to deliver excellent growth and reducing environmental impacts.
www.shenglongbt.com
SHENG LONG BIO-TECH (INDIA) PVT LTD


Add: Plot No. A-11/1, Part-A, SIPCOT Industrial Park, Thervoykandigai Village, Gummidipoondi Taluk, Thiruvallur District, Tamil Nadu 601202, India. Tel: 91-44-6790 1001

Email: info@shenglongindia.com
91-44-6790 1017
www.shenglongindia.com
From the editor
2 The Role of Processors
Industry News
4 Shrimp Crop 2022 Review: Farmed shrimp production in India
6 Innovative yeast solution is EU complaint for organic feed production
Shrimp Aquaculture
8 Meeting the challenges in Vietnam’s shrimp farming industry in 2022
At TARS 2022, Olivier Decamp and Nguyen Van Khanh say that optimism at the start of 2022 was dampened by EHP outbreaks
13 Using data science to optimise shrimp farm yields

Neil Arvin Bretaña shows how data science offers a systematic and scientific approach to detect variables at a farm in central Philippines
Disease Management
Editor/Publisher
Zuridah Merican, PhD
Tel: +60122053130
Email: zuridah@aquaasiapac.com
Editorial Coordination
Corporate Media Services P L
Tel: +65 6327 8825/6327 8824
Fax: +65 6223 7314
Email: irene@corpmediapl.com
Web: www.corpmediapl.com
Design and Layout
Words Worth Media Management Pte Ltd
Email: sales@wordsworth.com.sg
Web: www.wordsworth.com.sg
AQUA Culture Asia Pacific is published bimonthly by
Aqua Research Pte Ltd

3 Pickering Street, #02-36 Nankin Row, Singapore 048660
Web: www.aquaasiapac.com
Tel: +65 9151 2420
Fax: +65 6223 7314
Printed in Singapore by Print & Print Pte Ltd
3011 Bedok Industrial Park E, #03-2000 Singapore 489977
Subscriptions
Subscribe via the website at www.aquaasiapac.com
Subscriptions can begin at any time.
Subscriptions rate/year
(6 issues): SGD 70,
Email: subscribe@aquaasiapac.com
Tel: +65 9151 2420
Fax: +65 6223 7314
Copyright © 2023 Aqua Research Pte Ltd.
All rights reserved. No part of this publication may be reproduced, stored in a retrieval system or transmitted, in any form or by any means, electronic, mechanical, photocopying or otherwise, without the prior permission of the copyright owners.
18 Potential of a new feed solution to improve resistance of white shrimp post larvae challenged by EHP
The potential of a prophylactic solution to control EHP in white shrimp, by Stephane Frouel, Julie Castier and Maxime Hugonin
23 Cost benefits of functional health additives
At TARS 2022, Ruth Garcia Gomez discussed cost implications for farmers and incentives for feed millers to change
26 Solutions for stress mitigation
In his presentation at TARS 2022, Benny Shapira discussed several nutritional interventions for stress mitigation
Interview
28 Drivers for sustainable agriculture and aquaculture in Asia
At VIV Asia 2023, a conversation with the Alltech team
Genetics
32 Evidence of selection response and increased profitability of a new generation commercial tilapia fingerlings
Growth, fillet yield, survival, feed efficiency and uniformity was compared between two generations of GenoMar tilapia fingerlings in Malaysia. By Rajesh Joshi, Anders Skaarud, Oliver Arribas Robles, Thea Luz Pineda and Anne Vik Mariussen
Feed Technology
36 A multi-species evaluation of replacing fishmeal and fish oil - The F3 experience
A review by the F3 team shows the potential for the complete removal of fishmeal and fish oil in feeds for carnivorous fish
42 Agri-Food Outlook 2023
Results from the annual Alltech’s World Feed Survey
44 Adapt to pivot in Asian aquaculture
At DSM’’s conference in 2022, Rui A. Gonçalves talked on hidden threat of mycotoxins in aquafeeds and Dr Viviane Verlhac-Trichet on tools to assess novel nutritional ingredients
50 Insights on occurrences of mycotoxins in 2022: Focus on the Asia Pacific region
Discussions from the DSM World Mycotoxin Survey: Impact 2023 report
54 Marine Shrimp in Asia: Production mired by low prices and disease outbreaks in 2022
More outbreaks of WSSV, AHPND and WFS/EHP was reported, linked to adverse climate conditions, says Zuridah Merican
60 GOAL 2022: Global farmed shrimp supply
The results of this year’s survey push Ecuador to the top of the league with 1.3 million tonnes
Company News and Events
62 Naming of ‘Alain Michel Hatchery’ at Oceanpick, Sri Lanka 64 Pilot for the development of modern shrimp ponds in Indonesia Aqua Culture Asia Pacific is a
Ihavea theory. In 2019, shrimp production volumes for Ecuador and India were 670,000 tonnes and 770,000 tonnes, respectively, basically in the same ballpark. However, this changed during the Covid lockdowns. With confinements and logistic restrictions, processing plants in both countries could not operate. There was no buying of shrimp leading to farm gate prices dropping to levels below the direct cost of production, but the consequences were very different. While Indian farmers decided to exit one cycle waiting for better prices, we see that Ecuador’s farmers continued production despite farm gate prices falling to USD2.70/kg for size 60/kg (circa Sept 2020). Why the difference when one could argue that Covid 19 dealt the same set of cards to both countries? In 2020, Ecuador increased production by nearly 30% and pulled ahead to reach 850,000 tonnes while India fell 15% to 650,000 tonnes.
My theory is that in Ecuador, 40% of shrimp production come from integrated operations with processing facilities where the profits are only measured at the final shrimp product for export. The processing segment will make higher margins, as long as international prices are stable. Even if there were logistic restrictions, the shrimp product could be stored in the cold room for prolonged periods. Whereas in India, only a minor proportion of farmed shrimp comes from integrated operations and farmers largely depend on the daily price offers from processors. Here each segment has to mind their own profit and loss statements and balance sheets.
There is a lesson here as this situation is about to haunt us again. Farm gate shrimp prices are falling due to a higher supply and lower demand. Demand in the major shrimp markets are easing due to the higher consumer prices resulting from inflation and increased cost of distribution. In the US, shrimp is a highly price elastic product. As this affects all shrimp exporting countries, will we see the same consequences again?
This is already happening as we speak. Compare the black tiger size 30/kg farm gate prices between Vietnam and India in February 2023 which were USD9.60/kg versus USD4.30/kg, respectively. International prices were the same so why the huge difference? Vietnam has a sophisticated processing and export segment with good sales channels to major markets and they believe that it would be better to honour their contracts and sacrifice margins than to allow their workers to sit idle at processing plants. Furthermore, this was the winter season with lower supply of shrimp. Although, in Vietnam, the farmers and processors are not integrated, it shows a very good model for how the processing
segment supports the value chain. Back in September 2020, Samson Li at a SAP, India webinar discussed how the large processors in Vietnam support the farming segment, with accreditations, financing etc.
This could be a model that Asia should emulate since it is much easier for shrimp stocks to be stored for an indeterminate period in cold storage. Furthermore, as farm gate prices are reasonable, the financial risk is minimal. However, if the processors do not buy, farm gate prices will fall further and the supply chain goes into a negative spiral!
In its infancy, the feed segment supported and built this industry but today, with high feed ingredient prices, the baton has to be passed on and the processors should pull their weight. Shrimp is an export commodity hence processors are integral to the supply chain. Indonesia’s culture spans across the whole country but its processing is concentrated in Java and South Sumatra. Farmers must sell their harvest to the processors for freezing and storage. Without the processors, farmers will have to exit the business and without farming, there is no more industry to speak of.
The poultry and pig industries are older and have evolved to quasi-total integration today. The shrimp industry will evolve in the same manner as processors play this role in the industry life cycle.

If you have any comments, please email: zuridah@aquaasiapac.com

We strive to be the beacon for the regional aquaculture industry. We will be the window to the world for Asia-Pacific aquaculture producers and a door to the market for international suppliers.
We strive to be the forum for the development of self-regulation in the Industry.


Article for page 4 and 5
InJanuary, the Society of Aquaculture Professionals (SAP) organised several meetings to review the situation in shrimp farming in India. There was a virtual meeting on 19 January 2023 on the situation with regards to disease and an in-person Shrimp Crop 2022 Review Meeting & Stakeholder Consultation on 21 January 2023 in Chennai.
In January, the Society of Aquaculture Professionals (SAP) organised several meetings to review the situation in shrimp farming in India. There was a virtual meeting on 19 January 2023 on the situation with regards to disease and an in- person Shrimp Crop 2022 Review Meeting & Stakeholder Consultation on 21 January 2023 in Chennai.

In 2019, the production of both vannamei and monodon shrimp was less than 600,000 tonnes. Production rose to 650,000 tonnes in 2020 and by 2021, the volume escalated to 930,000 tonnes (Figure 1). Industry stakeholders at this Shrimp Crop 2022 Review expected a production decline to 902,525 tonnes as shown in Table 1.
In 2019, the production of both vannamei and monodon shrimp was less than 600,000 tonnes. Production rose to 650,000 tonnes in 2020 and by 2021, the volume escalated to 930,000 tonnes (Figure 1). Industry stakeholders at this Shrimp Crop 2022 Review expected a production decline to 902,525 tonnes as shown in Table 1.

Total 930 000 902 525 Data from Annual Shrimp Crop Reviews by the Society of Aquaculture Professionals Table 1. Shrimp production (tonnes) by regions in 2021 and estimates for 2022 A lower production for 2022 Stakeholders gave the following reasons for the lower estimate for 2022. There

This brought down national production by 3% compared to the previous year. The reasons cited included the following:
• Unseasonal and frequent rains triggering multiple white spot syndrome virus (WSSV) outbreaks Enterocytozoon hepatopenaei (EHP) and white faeces syndrome (WFS)
• Unseasonal and frequent rains triggering multiple white spot syndrome virus (WSSV) outbreaks
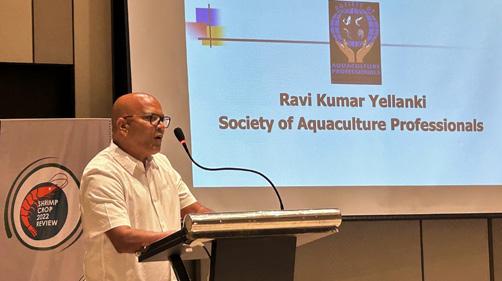
Ravi Kumar Yellanki , Vaisakhi Bio-Marine Private Limited and Vaisakhi Bio-Resources Private Limited, was one of the presenters and facilitators during this in-person meeting.
A lower production for 2022
March/April 2023 AQUA Culture Asia Pacific
• Enterocytozoon hepatopenaei (EHP) and white faeces syndrome (WFS)
• Increasing costs of production
• Sharp fall in shrimp prices towards the end of 2022.
However, the higher cost of production and decline in prices affected all regions. The lack of credit also limited growth in Odisha, West Bengal and Gujarat. Challenges in major producing areas are summarised in Table 2.
prices towards the end of 2022 However, the higher cost of production and decline in prices affected all regions. The lack of credit also limited growth in Odisha, West Bengal and Gujarat. Challenges in major producing areas are summarised in Table 2. Stocking density (PL/m2) Culture period (days) Survival (%) Size (shrimp/kg) Most challenging factors West Coast 20-40 120-170 65 41-60 Shrimp prices cost of production, diseases and credit Tamil Nadu 40 90 65 41-60 Shrimp prices and cost of production South Andhra Pradesh 20-40 115 61-75 61-100 Shrimp prices, cost of production, diseases and credit Krishna 20-40 100 51-60 61-100 Shrimp prices, cost of production and diseases
EHP, septic hepatopancreatic necrosis (SHPN), caused by Vibrio spp. and WSSV are the major diseases affecting shrimp farms. There seems to be increasing incidences of infectious myonecrosis virus (IMNV) as well.
WSSV has undergone significant modifications in its genome and the new strain of WSSV is highly virulent and causes rapid mortalities in affected shrimp. Farmers also indicated that WSSV can remain infectious in harvested pond water for up to 12 days and in dried pond sediments up to 19 days. Drying of pond soil and proper disinfection are necessary to avoid transmission of WSSV to the next crop.
EHP infections in shrimp result in a loss in diversity in the microbiome and shift in the flora from beneficial microbes to pathogenic ones in the affected shrimp. There could be a possibility of other microsporidia (aside from EHP) showing up as positive for EHP. Therefore, all PCR positives for EHP should be reconfirmed by testing for other target genes such as SWP gene and the amplicon be sequenced to confirm the homology with published EHP sequences.
Stakeholders said that unless prices for size 100 count (100 shrimp/kg) are at INR230/kg (USD2.77/kg) or more, the enthusiasm of farmers to start a crop cycle will wane. When this occurs, the result will be a 10-15% lower production in 2023.
In January 2023, stocking was already lower than historic levels. Furthermore, reduced broodstock imports and lower demand for post larvae pointed to expectation of a drop in production for the first crop in 2023.
It was estimated that 70,000-100,000 tonnes of shrimp are currently consumed within India. However, in the review, SAP suggested that a comprehensive marketing effort requires an annual investment of INR500 million (USD6 million) for at least five years to triple this consumption to at least 210,000 tonnes. Shrimp Crop 2022 survey participants indicated that industry stakeholders would be willing to pay up to INR0.5/kg (USD 0.06 cents/kg) for marketing promotions which can generate INR300-400 million/year (USD3.6-4.8 million/year). A Shrimp Marketing Board comprising stakeholders may be created to drive this effort.


In February, Lallemand Animal Nutrition announced used in organic production in the EU under Regulation the full Lallemand yeast portfolio can be used in millers serving the organic farming sector now derivative products documented to help reinforce animals, including pets.
“In several countries in the EU, the organic food decades. With a wide offer of different yeast-based Lallemand can help contribute to the sustainability animals’ welfare” comments Monika Leukert, Yeast
InFebruary, Lallemand Animal Nutrition announced that its innovative yeast solution YANG can be used in organic production in the EU under Regulation (EU) No 2018/848. With this new addition, the full Lallemand yeast portfolio can be used in feed for organic production. Nutritionists and feed millers serving the organic farming sector now have access to one of the most innovative yeast derivative products documented to help reinforce natural defenses and support gut health in all animals, including pets.
“In several countries in the EU, the organic food industry has experienced a real boom in the last decades. With a wide offer of different yeast-based solutions suitable for organic production, Lallemand can help contribute to the sustainability of animal production and help to maintain animals’ welfare” comments Monika Leukert, Yeast Derivatives & Antioxidants Product Manager.
YANG is a research-proven innovative feed ingredient combining inactivated yeast fractions from different and selected strains, each produced using dedicated
processes. YANG is formulated to have strong bacteriabinding capacities and broad immune modulation properties while securing performance. It helps strengthen animals’ natural defenses with a synergistic effect on the immune response (patent pending). It is the first yeast derivative product of its kind on the market.

In February, Lallemand Animal Nutrition announced that its innovative yeast solution YANG can be used in organic production in the EU under Regulation (EU) No 2018/848. With this new addition, the full Lallemand yeast portfolio can be used in feed for organic production. Nutritionists and feed millers serving the organic farming sector now have access to one of the most innovative yeast derivative products documented to help reinforce natural defenses and support gut health in all animals, including pets.
YANG is a research-proven innovative feed ingredient different and selected strains, each produced using strong bacteria-binding capacities and broad immune performance. It helps strengthen animals’ natural response (patent pending). It is the first yeast derivative YANG can be used in all animal species: ruminants, and more. www.lallemandanimalnutrition.com
YANG can be used in all animal species: ruminants, swine, poultry, equine, pets, fish, crustaceans, and more. www. lallemandanimalnutrition.com

“In several countries in the EU, the organic food industry has experienced a real boom in the last decades. With a wide offer of different yeast-based solutions suitable for organic production, Lallemand can help contribute to the sustainability of animal production and help to maintain animals’ welfare” comments Monika Leukert, Yeast Derivatives & Antioxidants Product Manager.
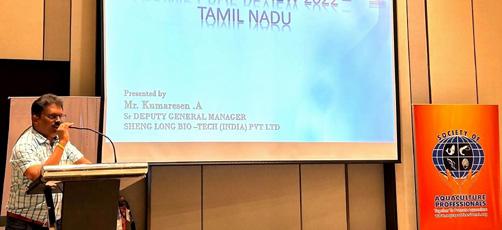
Anupam Panda, Poseidon Biotech; Shrinibas Mohanty and Rajkishore Parida, Avanti Feeds; Vivek Kadolkar, Grobest Feeds; Ganesh Arekere and V.R. Mansingh, CPF (India). A. Kumaresan, Sheng Long provided the regional data for this Shrimp Crop 2022 Review.
S. Muthukaruppan, S. Chandrasekar and Ravi Kumar Yellanki of the Society of Aquaculture Professionals compiled the data and led the interactions.
proven innovative feed ingredient combining inactivated yeast fractions from h produced using dedicated processes. YANG is formulated to have binding capacities and broad immune modulation properties while securing performance. It helps strengthen animals’ natural defenses with a synergistic effect on the immune ponse (patent pending). It is the first yeast derivative product of its kind on the market. YANG can be used in all animal species: ruminants, swine, poultry, equine, pets, fish, crustaceans,
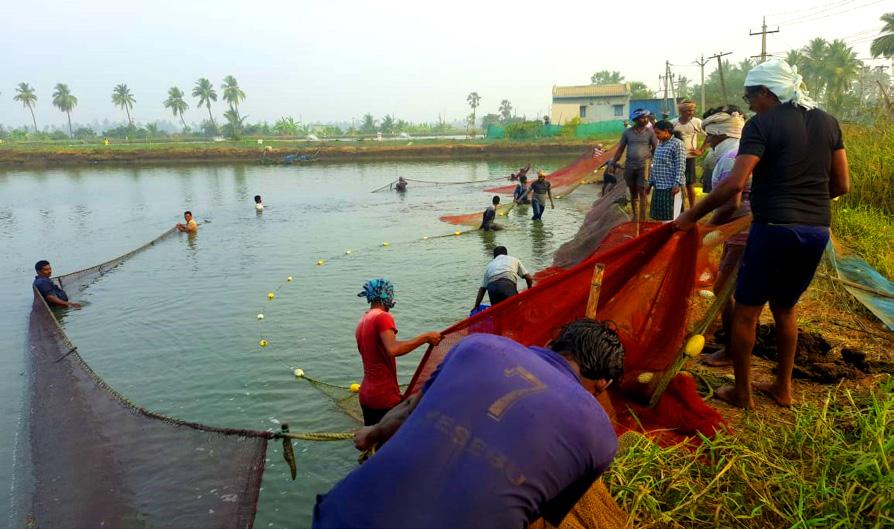
Harvesting shrimp at a farm in Tamil Nadu, India.
Ezhil Rani Praveena and Subhendu Kumar Otta, Central Institute of Brackishwater Aquaculture; Anup Mondal, Rajiv Gandhi Centre for Aquaculture; Shahul Hameed, Aquatic Animal Health Laboratory; Amerneni Ravikumar, Alpha Biologicals, Ramesh Kumar, Salem Microbes and Arun Dhar, University of Arizona presented data at the Shrimp Disease Situation 2022 which was coordinated and moderated by SAP’s D. Ramraj. Victor Suresh, SAP. presented proposal for domestic shrimp marketing.
Email: P.K. Senthil Kumar (Contact@aquaprofessional. org) for further details.
yeast association new generation
• A synergistic combination of several yeast strains and specific production processes.
• A powerful defensive barrier acting on mucus production, immune modulation and binding of undesirable bacteria in the intestine.
• Scientifically proven and field validated performance benefits leading to a higher return for producers.
Not all products are available in all markets nor associated claims allowed in all regions.
The best defense lies in working together.

Optimism at the beginning of the year was dampened by diseases, led by EHP outbreaks from April onwards
In a joint presentation during TARS 2022 Aquafeeds: A New Equilibrium, Dr Olivier Decamp, Group Technical Marketing Product Director and Nguyen Van Khanh, Head of Technical Service and Sales, Grobest, reviewed some challenges in Vietnam’s shrimp industry in 2022. Since the event was held in Ho Chi Minh City, Vietnam, in October, Vietnam was chosen to showcase how the aquafeed industry supports farmers to achieve higher profitability.
Vietnam aimed to achieve the USD4 billion target in exports in 2022. At the beginning of the year, there were already good deliverables as shrimp exports were on the rise compared to the same period in 2021 (Figure 1). “However, starting from April, we began to hear of some reports in the press that seafood exporters expected challenges in getting raw materials in the second half of 2022,” said Decamp adding, “We wondered how production would evolve!”
Figure
tonnes: Comparison of monthly volumes from January to August 2021 and 2022 and YTD to August 2021 and 2022.
There are some indicators to explain production trends. These include broodstock importation, post larvae sales and stocking percentage. Figure 2 shows the trend in post larvae (million PL) sold from central Vietnam, where around 30% of the overall post larvae supply comes from. “Since January 2022, monthly sales have been down by as much as 25% compared to 2021. This indicated that something was going on at the farm level.”
“In the Mekong Delta, rain volume and patterns were very challenging for farmers. In several leading production areas in the Mekong Delta (Soc Trang, Ca Mau and Bac Lieu), there was excessive rain in peak production months, i.e., June and July, compared to 2021,” said Olivier Decamp.






At the beginning of 2022, stocking was excellent, leading to optimistic perceptions for the year. Following the Covidrelated restrictions in late 2021, there was active stocking in January, February and March (Figure 3), fuelled by higher prices. Then, the percentage of farms stocking decreased. In the second half of the year, unfavourable weather conditions and the prevalence of diseases resulted in crop losses or delayed crops. Decamp said, “In the Mekong Delta, rain volume and patterns were very challenging for farmers. In several leading production areas in the Mekong Delta (Soc Trang, Ca Mau and Bac Lieu), there was excessive rain in peak production months, i.e., June and July, compared to 2021”.

Data collected by the Grobest technical team showed that there were few incidences of diseases before March. However, from March onwards, there were reports of white faeces syndrome (WFS) across the country and then slow growth followed by major reports of mortality. In the Mekong Delta, it was WFS, Enterocytozoon hepatopenaei (EHP) and acute hepatopancreatic necrosis disease (AHPND); in central Vietnam, it was all three diseases due to rains; and in the north, white spot syndrome virus (WSSV) was rampant in addition to EHP, WFS and AHPND. This information matched the observations of processors on the difficult access to raw material (Figure 4). “Out of all pathogens, EHP was critical this year,” said Decamp.
Data collected by the Grobest technical team showed that there were few incidences of diseases before March However, from March onwards, there were reports of w across the country and then slow growth followed by major reports of mortality. Delta, it was WFS, Enterocytozoon hepatopenaei (EHP) and acute hepatopancreatic necrosis disease (AHPND); in central Vietnam, it was all three diseases due to rains syndrome virus (WSSV) was rampant in addition to EHP, WFS the observations of processors on the difficult access to raw material pathogens, EHP was critical this year,” said Decamp.
EHP outbreaks across the country impacted farm operations and farmers were hesitant to stock due to fear of disease outbreaks. Across the country, positive cases for EHP in the Mekong Delta were as high as 100% in Long An, 65% in Bac Lieu, to only 27% in Ben Tre. In the north, it was as high as 86% in Thai Binh and a low of 55% in Thua Thien Hue. In the central region, it was 90% in Binh Thuan, 75% in Ninh Thuan, to only 35% in Binh Dinh (Figure 5).
“EHP is a nasty pathogen, which does not kill the shrimp but decreases farmers’ profitability because of lower growth. As a feed company, we need to make sure that we provide feed or feeding protocol that will give farmers the best return on investment,” said Decamp. “Feed conversion ratio (FCR) is not the only factor considered in economic analysis. We need to make sure that we provide the best return on investment for customers. One feed may not be the best for all the farmers and may not be the best throughout the year for all culture situations.”
EHP outbreaks across the country impacted farm operations and farmers were hesitant to stock due to fear of disease outbreaks. Across the country, positive cases for EHP in the Mekong Delta were as high as 100% in Long An, 65% in Bac Lieu, to only 27% in Ben Tre. In the north, it was as high as 86% in Thai Binh and a low of 55% in Thua Thien Hue. In the central region, it was 90% in Binh Thuan, 75% in Ninh Thuan, to only 35% in Binh Dinh (Figure 5)
“EHP is a nasty pathogen, which does not kill the shrimp but decreases farmers’ profitability because of lower growth. As a feed company, we need to make sure that we provide feed or feeding protocol that will give farmers the best return on investment,” said Decamp and added that feed conversion ratio (FCR) is not the only factor considered in economic analysis “We need to make sure that we provide the best return on investment for customers . One feed may not be the best for all the farmers and may not be the best throughout the year for all culture situations.”
There is already a high level of culture intensification in Vietnam. There is also a general understanding that such intensification is impossible because of the farming conditions and environment in some areas. According to Li (2021), intensive culture in lined open ponds starts with a stocking density of 90 PL/m2 and produces 10-20 tonnes/ ha/cycle. In highly aerated lined open ponds with waste management protocols and producing 15-40 tonnes/ha/ cycle, the stocking density is 200-400PL/m2
Commented [NMT1]: This
“We need to make sure that investment”
we need to make sure that protocol that will give farmers investment,” said Decamp and ratio (FCR) is not the only factor analysis. “One feed may not and it may not be the best throughout situations.”
% positive cases in the Central 2 region
Figure 5. EHP outbreaks across Vietnam from data collected by the Grobest technical team in 2022.

drainage system for a farm.
The construction of a central drainage system for a farm in <where>.

The value advantage for farmers in Vietnam
“Nowadays, Vietnamese farmers must cope with numerous challenges. Therefore, as a feed company, our role is to ensure benefits to the farmer, such as feeds with low FCR, to produce healthy and increase shrimp survival rates. We have to create several feeding protocols to match the needs of farms which differ in the level of intensification. We have situations where farmers can achieve faster shrimp growth rates and produce larger shrimp with higher ex-farm prices, such as in South Vietnam. Weather conditions in the north and central regions limit this possibility,” said Khanh. “In this presentation, we show examples of the value of feed and feed SOPs. The value advantage is the profit per kg of shrimp; harvest yields as high as VND76,000/kg (USD3.2/kg) but at a feed/kg shrimp cost of VND61,221/ kg (USD2.56/kg) in contrast with a harvest yield of VND70,732/kg (USD2.96/kg) and a feed/kg shrimp cost of VND 47,939 (USD2/kg).
There is already a high level of culture intensification in Vietnam. There is also a general understanding that such intensification is impossible because of the farming conditions and environment in some areas According to Li (2021), intensive culture in lined open ponds starts with a stocking density of 90 PL/m2 and produces 10-20 tonnes/ha/cycle. In highly aerated lined open ponds with waste management protocols and producing 15 -40 tonnes/ha/cycle, the stocking density is 200-400PL/m2 .
“Nowadays, Vietnamese farmers must cope with numerous challenges. Therefore, as a feed company, our role is to ensure benefits to the farmer, such as feeds with low FCR, to produce healthy and increase shrimp survival rates. We have to create several feeding protocols to match the needs of farms which differ in the level of intensification We have situations where farmers can achieve faster shrimp growth rates and produce larger shrimp with higher ex-farm prices, such as in South Vietnam Weather conditions in the north and central regions limit this possibility,” said Khanh. “In this presentation, we show examples of the value of feed and feed SOPs. The value advantage is the profit per kg of shrimp; harvest yields as high as VND76,000/kg (USD3.2/kg) but at a feed/kg shrimp cost of VND61,221/kg (USD2.56/kg) in contrast with a harvest yield of VND70,732/kg (USD2.96/kg) and a feed/kg shrimp cost of VND 47,939 (USD2/kg).
Quote:
Photo
Nguyen Van Khanh says, “The more data we collect, the more we can understand the culture situations and the better we can help farmers with the correct advice.”
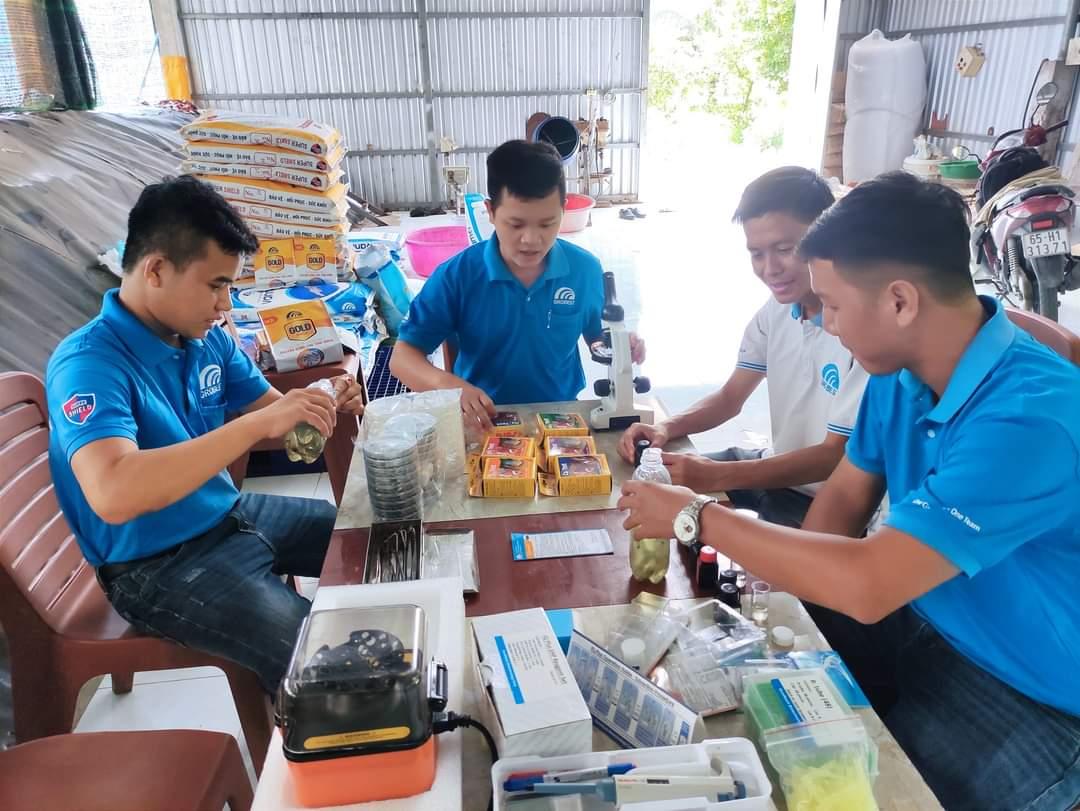
“We also understand that just by providing feeds only, we cannot help the farmers. We need to support them by checking the environmental conditions, evaluating the shrimp’s health status and performing diagnostics, etc., so that they understand the real situation around the farm and make the right decision for their shrimp and farm success Data is then transferred to a central database.

“We also understand that just by providing feeds only, we cannot help the farmers. We need to support them by checking the environmental conditions, evaluating the shrimp’s health status and performing diagnostics, etc., so that they understand the real situation around the farm and make the right decision for their shrimp and farm success. Data is then transferred to a central database. The more data we collect, the more we can understand the culture situations and the better we can help farmers with the correct advice,” said Khanh.
Nguyen Van Khanh says, “The more data we collect, the more we can understand the culture situations and the better we can help farmers with the correct advice.”

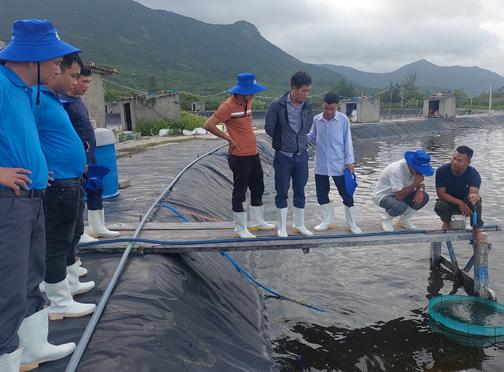
A comprehensive checklist for the technical team includes infrastructure details for water management, such as surface and benthic aeration, presence of central drainage, systems for disinfection, liners, biosecurity features and automation and monitoring devices. On the operations side are details such as hatchery and post larvae audits, stocking, water quality parameters, feeding adjustments, biosecurity and production and health records.
“Based on the information collected, we can guide them to improve their culture system and get better results. Sometimes we can make some improvement for the farm, but sometimes we have to start from the beginning and help farmers to construct the farm,” said Khanh. This is the “Grofarm” model, developed to start from the beginning.
The team works with several partner hatcheries in the country to help farmers get the best post larvae and also identify which genetics (fast growth or disease resistant) suits the farmer’s goal and farm in a particular region or area. “Our team also stays in the hatchery to choose the best post larvae for the farmer. This is quite special for our company. We also develop functional feeds for nursery stages, provide immune and grow-out booster feeds and help farmers decide on the right protocol at the farm.”
The goal is to achieve as high an efficiency for each farm as possible and return higher profits. Besides that, advise farmers to culture shrimp to a marketable size and volume that fits market demand, geography and environmental conditions.
In his take-home message, Decamp emphasised that the role of the aquafeed company is to identify, understand and prioritise the challenges and then develop or improve on cost-efficient diets and feed management protocols. It is also to analyse farm and feed performance data and share the output with farmers. The feed company supports farms with access to the best-performing post larvae, new technologies and funding and provides recommendations on infrastructure needs.
Samson Li, 2021. Managing the shrimp production supply chain in a post-pandemic world: Vietnam’s case. Aqua Culture Asia Pacific, January/February 2021, Pages 18-22.
Decamp, O., Nguyen Van Khanh, 2022. Challenges in shrimp production in Vietnam: Role of Aquafeed Players. Presented at TARS 2022, Aquafeeds: A New Equilibrium, October 6-7, Ho Chi Minh City, Vietnam.


Seafood is a vital source of sustenance for a growing global population and plays a significant role in food security. With wild fish stocks declining, aquaculture has become a crucial component in meeting the demand for seafood – one that is expected to increase five-fold in the next decade. However, ensuring global seafood security is a complex issue that requires a multi-disciplinary approach, including the use of data science to optimise aquaculture farm yield. Maximising yield while minimising resources, wastes, and environmental impacts requires a thorough understanding of the biological and environmental factors that affect the growth and health of aquatic species.
Traditional aquaculture methods rely on trial-and-error and intuition, leading to suboptimal results and increased costs. Data science, on the other hand, offers a systematic and scientific approach to optimising aquaculture. By collecting and analysing large amounts of data, data scientists can identify patterns and relationships that would be difficult to discern through intuition alone.
NSB-NB5 is a shrimp farm in Central Philippines that is starting to embrace data-driven innovation. In three previously recorded harvest cycles, the farm saw a loss of up to 50% in expected yield. This meant that up to half of the projected harvest failed to reach the market. This was despite attempting to maintain the farm’s standard inputs including feed, probiotics, and water quality. It was interested in identifying which of the modifiable parameters can be associated with this outcome. NSB-NB5 tapped Birkentech Solutions Pty Ltd, an Australian data science consultancy firm that focuses on supporting agriculture and aquaculture, to analyse their pond variables and identify the ones related to a high shrimp survival and yield.
Birkentech recommended a statistics-based data science approach to achieve this goal. This was done in close collaboration with the farm management team and technicians. Data from three harvest cycles from nine Penaeus vannamei shrimp ponds consisting of daily recorded values for physicochemical measurements, feed and supplementary data and water management inputs were collected.
Physicochemical variables included pH, dissolved oxygen, temperature, salinity, depth, transparency, water colour and weather. Water management input included organic disinfectant, water probiotic, and minerals. Feed and supplement names were de-identified and coded to protect proprietary information.
At the end of each harvest cycle, the percent survival rate was recorded for each pond. The recorded survival rate, indicating the health outcome of the shrimp culture at the end of each harvest cycle, was utilised as the target variable for the study with a survival threshold set to 80%.
A total of 22,968 data points were made available. First, the basic summary of the data was described (Table 1).
This included the mean, median, minimum, maximum, and standard deviation of the variables. For categorical variables such as colour and weather, basic summary was described by calculating the frequency distribution. Missing values were handled by imputation using the MICE package in R.
Ponds were compared in terms of variable variation using an unsupervised clustering technique to assess whether all ponds were similar or different. K-means clustering was applied; this is one of the most basic and often used unsupervised machine learning techniques to find underlying patterns by grouping similar data points together.
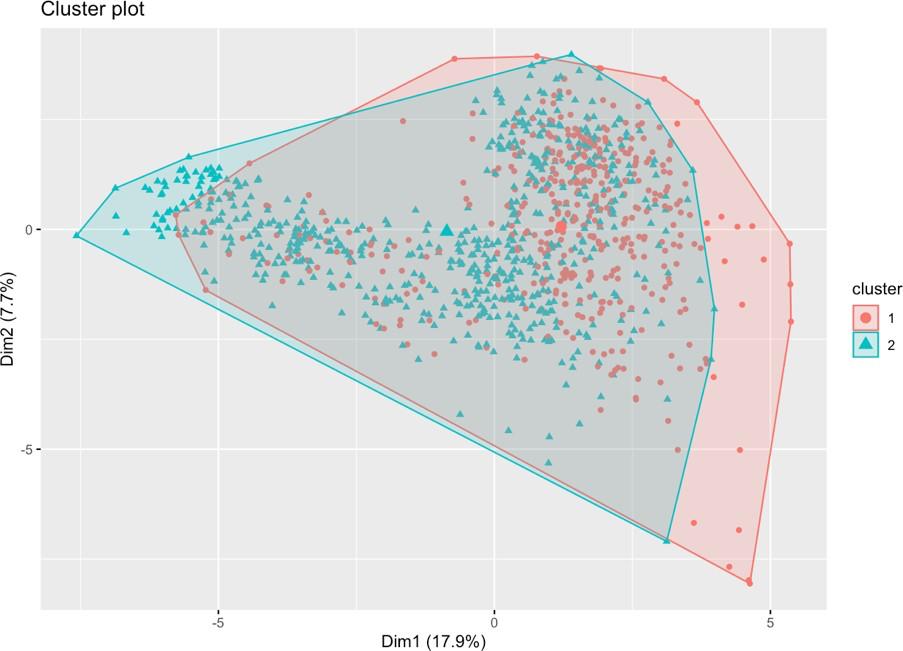
The silhouette method revealed k=2 as the optimal number of cluster centroids to do the analysis. Based on a clustering analysis, the data points revealed that the clusters formed from k=2 overlap with each other. This implies that all data points could be regarded as one cluster and there was not a single pond that behaved differently as a separate cluster (Figure 1). For instance, 68 of the 119 data points in pond 2 formed with one centroid and 51 formed with the other centroid. A similar split between the two centroids were found for the data points of all other ponds. Therefore, analysis was performed on all data points collectively.
Important variables related to the survival outcome were identified using the Boruta algorithm. Boruta is a feature selection algorithm based on the random forest algorithm, which determines important features based on statistical significance.
In a nutshell, it works by comparing the calculated Z-score of each variable using the original values in a model versus the maximum Z-score of each variable using a randomised set of values. It then eliminates variables with Z-scores that are not higher than the maximum Z-score of the random ones. Variables with the higher Z-scores were then interpreted as the important variables.
Additional correlation analysis using Person correlation was then carried out on these resulting variables to explore the relationship between any two pairs. This revealed that feed products had a linear relationship with each other in terms of improving shrimp survival. The software tool Python was utilised to run the analyses.
From this analysis, it was identified that specific feed and supplement variables were highly associated with a high survival rate (>80%). From the set of physicochemical variables - dissolved oxygen, PH , depth, temperature, and salinity were revealed to be important parameters. From the set of water management input variables, ammonia and magnesium levels were revealed to be significant parameters for shrimp survival. As shown in Table 2, these variables were supported with a mean importance score produced by the Boruta algorithm.


A close collaboration with farmers and technicians was vital to logically interpret the results of the study for NSB-NB5. This has potential to inform and guide farm practices on what variables are sensitive to the harvest yield, requiring close monitoring and careful modification.
However, this is not a one-and-done study. It requires results to be put into practice and the re-evaluation after a number of harvests to see if the yield can be improved. It is also important to note that many of the water management and physicochemical variables found to be associated with a high survival in this analysis were already known and had already been included in industry best practices for years.
The novelty of the results, in this case, was the discovery of six feeds and one supplement product, which most likely holds the key to an optimised yield of at least 80% for the farm. This would mean almost doubling the amount of produce for markets and doubling the contribution toward the local seafood supply.
Such results help farmers in optimising farm input and ensuring that identified parameters are carefully controlled. From an economic angle, this reduces wastage, maximises resource potential and improves growth rates, leading to higher yields and increased profits. By using historical production data and modelling techniques, farmers can optimise their production schedules, and reduce the risk of overstocking and underutilisation of resources.
Additionally, data science techniques can help farmers monitor and control water quality, reducing the risk of disease outbreaks and improving the overall health of the species. Further analysis can explore the development and use of predictive models using similar machine learning methods to forecast future trends in demand and supply, as well as helping farmers make informed decisions about production levels and inventory management. These models can also be used to assess environmental factors, such as temperature and water quality, and their impacts on fish health and growth, allowing farmers to take proactive preventative measures.
There is still a lot of work to be done. Most farms do not have the enabling technology to adopt these methodologies. Unlike NSB-NB5, not all farmers are open to exploring the benefits of data science. Other multiple factors contribute to the slow uptake of this method in the aquaculture industry. These include lack of awareness and understanding, limited technological expertise, limited data availability, a high cost of implementation and a focus toward more traditional practices in most settings.
As the benefits of data science become widely recognised in this field and technical expertise and data availability improve, we hope to see more aqua farmers adopting these methodologies to improve their operations and increase profitability. This is the mission of Birkentech.


The use of data science in the shrimp/fish farming industry is still in its early stages. Its applications in aquaculture is critical for ensuring global seafood security and sustainability. It should be noted, though, that data scientists should work closely with domain experts such as aquaculture farmers and farm technicians to make sensible interpretations from the data.


Dr Neil Arvin Bretaña is an award-winning data scientist and public health researcher with over 10 years of experience in data analytics, modelling, and innovation. He is passionate about the use of technology in improving the social determinants of health, which includes agriculture and food production. He is a lecturer at the University of South Australia and also the founder and director of aquaculture data science consultancy company Birkentech Solutions Pty Ltd.
Email: admin@birkentech.com


Dr Neil Arvin Bretaña is an award-winning data scientist and public over 10 years of experience in data analytics, modelling, and innovation. about the use of technology in improving the social determinants agriculture and food production. He is a lecturer at the University also the founder and director of aquaculture data science consu Solutions Pty Ltd. Email: Neil.Bretana@unisa.edu.au

In vitro tests consolidated by in vivo trials confirmed the potential of a prophylactic solution to control EHP in white shrimp.
By Stephane Frouel, Julie Castier and Maxime HugoninAquaculture is a complex industry with multiple variables that strongly impact its performance. Among these, sources of stress, disease outbreaks and occurrence of new pathogens such as parasites are huge threats.
Enterocytozoon hepatopenaei (EHP) is a microsporidian parasite that was first characterised in the giant or black tiger shrimp Penaeus monodon in 2009 in Thailand. EHP is restricted to the shrimp hepatopancreas (HP) and its occurrence is usually not heeded because of the overwhelming focus on some secondary diseases such as early mortality syndrome (EMS), white faeces syndrome, etc. However, although EHP does not appear to cause high mortality, it is associated with severe growth retardation and degraded feed conversion ratios (FCRs) in shrimp leading to economic losses for the farmers who in the worst case scenarios, need to decide for an early harvest.
To date, no reliable and sustainable solutions have shown real efficacy on the reduction of impact of EHP in shrimp. The aim of the current research at Mixscience, France, is to design a specific solution against EHP in shrimp aquaculture. Efficacy was demonstrated from the laboratory to shrimp post larvae, focusing on the reduction of germination of EHP spores and its associated effect on shrimp performance. Since EHP has an internal phase during which spores enter host’s cells, it is important to ensure that the parasite is

inhibited from host cell entry during its external phase when spores are free and non-protected and before emergence of their polar tube. This is a fundamental point when deciding on recommendations for application of this new biosecurity tool.
The life cycle of a microsporidian parasite can be divided into three phases: the infective, the proliferative and the spore-forming phase (Figure 1). The infective phase is the only phase that can survive without the host since spores are outside of the host’s cells. Then, the infective spores puncture the plasma membrane of the host’s cell with their polar tube, releasing sporoplasm (infectious material) inside the cytoplasm of the cell.
Sporoplasm proliferates inside the cells forming branched plasmodia (nucleus copies without new membrane). This spore extrusion precursor forms prior to breakdown of the plasmodium cytoplasm into sporoblasts (newly formed spores). The infected hepatopancreatic epithelial cell swells and ruptures, releasing the mature spores in the hepatopancreas or discharging them into the environment via faeces. Healthy shrimp get infected by the accidental ingestion of spores from faeces or via cannibalism (Keeling, 2009).
Polar tube extrusion is an essential process for infectivity of EHP on shrimp since it allows the spore to attach to the host’s cell and transfers its material

A-Coverost (Mixscience, France) is an innovative blend of oleochemicals associated to a specific active matrix. The combined effects maximising efficacy of the product are described in Figure 2.
In vitro approach: Reduction of the germination rate of the EHP spores
Experimental laboratory studies were performed at the National Center for Genetic Engineering and Biotechnology (BIOTEC) facilities, Thailand. The EHP spores used were purified according to a standard protocol developed by the centre (Aldama-Cano et al., 2018).
White shrimp Penaeus vannamei post larvae (weighing between 6 and 10g) and heavily infected with EHP, were obtained from intensive farming systems in Thailand. Their level of EHP infection was confirmed by nested SWP-PCR (Nested PCR usually involves two sequential amplification reactions, each of which uses a different pair of primers). The product of the first amplification reaction was used as the template for the second PCR, which was primed by oligonucleotides that were placed internal to the first primer pair.
Live shrimp with high levels of infection were anaesthetised in a solution of ice-cold artificial seawater before a meticulous dissection of the hepatopancreatic tissue. The tissue was homogenised with sterile distilled water to obtain a final concentration of 10% (vol/vol) in a 50mL Falcon tube. The spores were separated from the homogenate by centrifugation.
The purified spores were aliquoted and incubated with the experimental product (A-Coverost) for 30 minutes at room temperature (27°C) in Eppendorf tubes and a total volume of 1mL per reaction. The effect of the product on germination and spore viability was measured by microscopic observation after a staining step with phloxine. The germination rate or percentage of spore extrusion
was calculated from the number of spores extruded (or germinated) out of the 100 spores observed.
In order to assess the robustness of the results, this test was carried out with three replicates and two repetitions. Statistical analysis was performed by a t-test with a 95% confidence interval to determine if there was a significant difference between the germination rates.
In vivo confirmation: Restoration of the shrimp performance challenged by EHP


An experimental shrimp study was also performed at the BIOTEC facilities under laboratory conditions. Following the laboratory tests, the experimental product A-Coverost was applied either before infestation (preventive approach) or after infestation (curative approach).
The experimental product was incorporated by top coating. To prepare 1kg of finished diet, 50g of alpha starch were boiled in 100mL of water and allowed to cool down at room temperature (25-27°C) before mixing with 4g of A-Coverost. The mixture was then sprayed on the feed pellets and followed by coating with 10mL squid oil. The final pellets were dried at 30°C for 6 hours.
The control feed was prepared by a pelletizing process and followed by the same top coating method without supplementation of experimental product to ensure comparable measurements.
The trial was set up as a completely randomised design and two groups (Challenged CTRL and Challenged A-Coverost) were compared (Table 1). Each tank contained 200 shrimp with an initial weight of about 3g (water volume 320L; salinity 20ppt) and shrimp were pre-fed with the indicated feed for a pre-feeding period of seven days. On day 7 of feeding, 12 shrimp from each group were collected for the detection of EHP level by qPCR. Each group had three replicates.
After the pre-feeding period, shrimp from each group were transferred to three baskets with 35 shrimp each (water volume 30L; salinity 20ppt) and placed into three cohabitation tanks (water volume 300L; salinity 20ppt) for induction of EHP infection by the cohabitation model (Salachan et al., 2017).

A number of 10 EHP heavily infected shrimp, determined by a nested PCR method were added into the challenge tanks. During cohabitation, shrimp were continuously fed with the indicated feed formula. On day 17, 12 shrimp per basket were collected for the detection of EHP level by SWP-PCR. Experimental timelines are described in Table 1.
Some 600 shrimp with an initial weight of about 2.5g were induced with EHP infection by co-habitation model for 10 days. During the EHP induction, all shrimp were fed with diet CTRL.

After 10 days of co-habitation, shrimp were divided into two groups (Challenged CTRL and Challenged A-Coverost, Table 2), within three tanks each (45 shrimp/tank; water volume 80L; salinity 20ppt) and were continuously fed for 7 days. On day 17, 12 shrimp per basket was collected for the detection of EHP level by qPCR. Experimental timelines are described in Table 2.
Shrimp hepatopancreas was collected individually from 12 shrimp per tank for DNA extraction. DNA template for qPCR was obtained by homogenising hepatopancreas tissue in DNA lysis buffer (Munkongwongsiri et al., 2021). The 20µL of qPCR reaction mixture contained 1x SYBR greenqPCR, 0.2 µM SWP primers and 10ng of DNA template. To calculate the EHP load, the samples were compared with the standard obtained from plasmid DNA at a concentration of 1.0x10⁶ copies/µL.
The shrimp growth performance indicators including final weight, weight gain, average daily growth (ADG), feed conversion ratio (FCR) and survival rate were determined during the preventive and curative trials. The initial weights of the experimental shrimp were determined in both the preventive and curative tests.
For the preventive test, growth parameters were determined on day 7 post feeding and day 10 post cohabitation (day 17 of the experiment). For the curative test, growth parameters were determined on day 10 post co-habitation and day 7 post feeding (day 17 of the experiment).
The mean value of growth performance parameters and the quantity of EHP copies from shrimp fed by the two different formulae were tested by a one-way ANOVA and followed by a post-hoc Duncan test for multiple comparisons. If the data were non-parametric, a Kruskal-Wallis oneway ANOVA and a Mann-Whitney U test were applied for statistical comparison.
At the laboratory scale, results showed that A-Coverost significantly reduced (>60%) the germination rate of EHP spores. It has been expressed by a lower expression of polar tubes visible under microscope. This trend has been observed in the two consecutive trials demonstrating a certain robustness of the efficacy of the product (Figure 3).
When applied as a preventive solution, the treatment (at 4g/kg of feed) tended to restore and even improve the feed efficiency and the associated growth performance altered by the presence of the parasite. The results with A-Coverost were statistically and numerically better for the final bodyweight gain and FCR, meaning that the EHP impact was neutralised.
However, on the contrary, the growth performance parameters of the challenged shrimp were highly degraded. The survival rate remained high and no difference was observed between treatments. These results confirmed the fact that EHP mainly affects the growth rather than the survivability of shrimp.
Shrimp in all replicates of the challenged control group were infected with high density of EHP parasite load at the end of the trial. Meanwhile, a significant reduction was observed in the treatment group.


is a blend of natural products dedicated to stress management based on natural defenses stimulation and control thanks to anti-inflammatory and antioxidant effects.
2
is a blend of unique oleochemicals and active matrix selected for aquaculture application to help the reduction of parasitic challenges.


1 3 4
is a natural solution specially developped for Aqua challenges leading to better economical results thanks to a wide spectrum modes of actions essentially linked to the gut balance modulation.


is a blend of Bacillus spp. strains dedicated to biocontrol in all aquaculture farming systems.


To support our customers to combine sustainability and economical performance
These results revealed that the product could control or delay replication of EHP. In this case, it means that the host will not engage energy to fight against the pathogen damaging the hepatopancreatic cells. This energy will be reallocated to performance and feed efficiency processes (Table 3).
When applied as a curative solution, the treatment (applied at 4g/kg of feed) did not restore the feed efficiency and the associated growth performance altered by the presence of the parasite. The results were even numerically worst despite the reduction of the EHP load in the hepatopancreas.
This result revealed that the product could not control or delay the EHP replication when the parasite had already penetrated the shrimp hepatopancreas. This is a fundamental and critical point when recommending such solutions (Table 3).
This new study, conducted in Thailand, confirmed the previous study, carried out in Vietnam (Frouel et al, 2021), demonstrating a certain robustness of efficacy of the product developed by Mixscience to control EHP infection and counteract its negative effects on shrimp performance.
Due to the specificity of the parasite’s cycle, it is highly recommended to have a continuous and preventive approach rather than a curative approach, so that the product could interact with EHP spores during their preinfective phase.
However, it is clear that a single solution is not sufficient to fully eradicate EHP occurrences. A-Coverost needs to be used as a tool in a complete management program based on biosecurity practices to implement at the farm level in order to limit the presence of the parasite.
Aldama-Cano D.V., Sanguanrut P., Munkongwongsiri N., IbarraGámez J.C., Itsathitphaisarn O., Vanichviriyakit R., Flegel T.W., Sritunyalucksana K., Thitamadee S. 2018. Bioassay for spore polar tube extrusion of shrimp Enterocytozoon hepatopenaei (EHP). Aquaculture 490: Pages 156-161
Chaijarasphong T., Munkongwongsiri N., Stentiford G. D., AldamaCano D. J., Thansa K., Flegel T. W. 2021. The shrimp microsporidian Enterocytozoon hepatopenaei (EHP): Biology, pathology, diagnostics and control. Journal of Invertebrate Pathology 186 Frouel S., Castier J., Hugonin M. 2021. A new feed prophylactic to improve resistance of white shrimp post larvae against EHP. Aqua Culture Asia Pacific Magazine, March/April, Pages 42-44
Keeling P. J. 2009. Five questions about Microsporidia. PLoS Pathogens 5 (9)
Munkongwongsiri N., Aldama-Cano D.V., Suebsing R., Thaiue D., Prasartset T., Itsathitphaisarn O., Sritunyalucksana K. 2021. Microsporidian Enterocytozoon hepatopenaei (EHP) spores are inactivated in 1 min at 75°C. Aquaculture 533: 736178
Salachan P.V., Jaroenlak P., Thitamadee S., Itsathitphaisarn O., Sritunyalucksana K. 2017. Laboratory cohabitation challenge model for shrimp hepatopancreatic microsporidiosis (HPM) caused by Enterocytozoon hepatopenaei (EHP). BMC Veterinary Research 13(1):9
Dr Stephane Frouel is an Aquaculture Specialist at Mixscience and is responsible for aquaculture project management including assays on feed additives and worldwide trials.

Email: stephane.frouel@mixscience.eu
Julie Castier is a Technical Specialist at Mixscience and is responsible for the current research dedicated to providing an innovative solution against EHP disease.

Email: julie.castier@mixscience.eu
Maxime Hugonin is an Aquaculture Specialist at Mixscience and is responsible for the product development of the current solution against EHP disease. He is now Director of Mixscience Asia.
Email: maxime.hugonin@mixscience.eu

Gomez,
Business Development Managerfor Aquatic
 Health
and Farm Care Products at APAC/ ISC sub-regions for Adisseo, said that today, incidences of disease outbreaks are not only linked to increased intensification but also to increased farming stressors, including less digestible diets, changes in environmental conditions, extreme weather events and limited availability of veterinary medicines in aquaculture. For the shrimp industry, an evaluation indicated that by 2050, there may be around 40% losses due to infectious diseases. She said this when presenting “What are the cost implications of using functional health additives for farmers and what will the incentives be for feed millers to change” at TARS 2022 Aquafeeds: A New Equilibrium in October.
Garcia Gomez said, “We face multifactorial infections –very often in aquaculture, there is no single pathogen but co-infections and multifactorial disease scenarios, such as in tilapia farming in Thailand. In open aquaculture systems, along the production cycle from the hatchery until after the end of the grow-out, farmers face different bacterial, viral and external and internal parasitic infections.”
Disease management in the livestock sector is well organised considering epidemiology and early diagnosis, genetic selection towards pathogen resistance, active vaccination programs as well as strong on-farm biosecurity strategies and improved husbandry. However, the aquaculture sector has a different set of challenges. As a veterinarian, Garcia Gomez asked whether the aquaculture sector is investing enough in prevention and will a single bullet – a single veterinary medicine work against multiple infectious diseases?
In terms of preventive approaches and on how to evaluate their economic value, Garcia Gomez stated, “We believe in prevention approaches and promote the idea of the broader spectrum health additives with multiple modes of action. Organic acids have a clear impact on the pathogenic loadreducing bacterial quantities. Whereas phyto-biotics have a clear impact in the host, increasing disease resistance through gut flora modulation, improving and maintaining gut integrity and structure, limiting quorum sensing and therefore, promoting growth and profitability. The concept of a balanced immune system is important towards stress reduction and enhanced immunocompetence.
“There is a need for a change in mindset on functional health additives when backed and validated with scientific data obtained via in vivo and in vitro trials. However, we need clear and coherent regulatory frameworks at national and regional level in promoting these types of preventive approaches. It also requires commitment from key stakeholders within the aquaculture sector at all levels,” said Garcia Gomez adding, “Preventive approaches and alternatives to antimicrobial use which can reduce antimicrobial resistance are going to be always well accepted by the public. In most cases, they are safe and traceable.”
Garcia Gomez discussed some results from commercial field trials conducted with Penaeus vannamei shrimp in Indonesia. The trial looked at reducing the impact of white faeces syndrome (WFS) using a phyto-biotic-based additive.
The significance of this trial was paralleled with the presentation by Dr Olivier Decamp, Grobest, on the impact of Enterocytozoon hepatopenaei (EHP) in shrimp farming in Vietnam and its combination with WFS and vibriosis (see pages 8-12). In this trial, WFS was detected at days of culture (DOC) 30-40 in the last 4 crops at the farm. EHP was positive by PCR. The maximum survival rate was 50% and feed conversion ratio (FCR) was 1.7. The Vibrio load was at more than 10 2 CFU/mL.


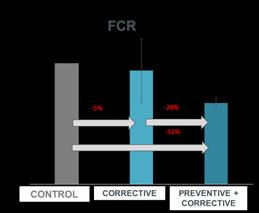
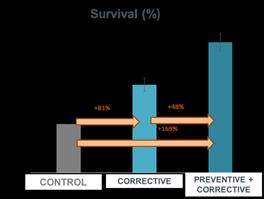
Garcia Gomez discussed results from supplementation under the two different strategies (corrective and preventive). There were improvements in survival (+164%), FCR (-32%) and biomass at harvest (64%). Additionally, the use of the preventive dosage throughout the entire cycle maintained growth and survival rates to pre-WFS levels and ROI (1:40).
“Also important is that the environmental evaluation to assess the kilograms of CO 2 per kg of shrimp showed that the corrective approach gave a significant reduction in total CO 2 production by 16% while the combination of preventive and corrective approach reduced this further to 39%.”


This is the result of a completely different farm trial which on the brown marble grouper Epinephelus fuscoguttatus together with the National Agricultural University in Hanoi. The objective of the trial was to validate the efficacy of a health additive based on essential oils towards reduction of impact of external parasites over the 90 day-culture period. The impact of a medium and high dose on the prevalence of four groups of parasites ( Dactylogyrus sp, Argulus sp., Zeylanicobdella sp and Trichodina sp. ) was calculated.
www.adisseo.com
“There are clear benefits for farmers to start working and thinking about prevention and of course improve performance and profitability,” says Ruth Garcia Gomez
Figure 1. Results on supplementation of phyto-biotic-based additive in Indonesia: corrective to mitigate signs of infection (ROI 1:18) and preventive and corrective to maintain growth rates and survival rate to pre -WFS levels (ROI 1:40)

10x10). Statistical method ANOVA.

“The interesting outcome was that the decrease in the ectoparasite infestation intensity had a clear impact on the general health status of the fish, its immune system as well as on the general performance and profitability. The final biomass increased 10.9% with the high dose and 8.5% with the medium dose.”

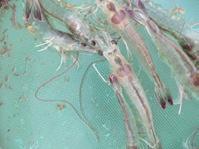
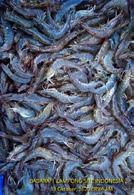
Finally, Garcia Gomez compared the cost benefits of health additives for shrimp and finfish farmers and feed millers. She cautioned that functionality should be hand in hand with improved husbandry and biosecurity strategies to optimise the results. “There are clear benefits for farmers to start working and thinking about prevention and of course improve performance and profitability. Feed millers must make changes in feed formulation, depend on availability of additives as well as on farmers’
acceptance and motivation. They also need to make species-specific adaptations and validate customised products.”
As the industry contemplates the benefits of functional additives, Garcia Gomez asked “Does the industry have sufficient evidence of the positive impact of functional additives and do players needs to change its mindset towards prevention in aquaculture? Additionally, should the sector continue to invest in research, development and innovation?”
Reference Ruth Garcia Gomez. 2022. “What are the cost implications of using functional health additives for farmers and what will the incentives be for feed millers to change? Presentation at TARS 2022, Ho Chi Minh City, Vietnam, 6-7 October, 2022.
In health management, several nutritional interventions for stress mitigation have been proposed. During TARS 2022, which focused on aquafeeds, Benny Shapira, Senior Director, Phibro Aqua updated the audience on stressors in aquaculture and on ways to mitigate stress. “In modern aquaculture, we cannot avoid stress which is part of our culture system. Our role is to help our clients learn how to mitigate stress with the minimum damage to yield maximum profit.”
There are several types of stressors. Physical stressors include temperature, salinity, light, dissolved oxygen, pH, sound etc. Chemical stressors include water quality, pollution, feed and metabolic wastes. Biological stressors range from stocking density, micro-organisms (pathogenic and nonpathogenic) and parasites and farm activities causing stress, including handling, transportation, sorting and stocking.
“Talking to several successful farmers around the world led me to the understanding that good fish and shrimp farming has a lot to do with “growing good water”. This means that stress mitigation is the management of the environment and controlling water quality as a key to having good farming and good yield.”
Shapira said, "We can mitigate stress via biological and chemical approaches. The first water quality, optimal stocking density, uniform-size stocking, etc. These vary by species systems. Regarding the latter, it is dietary supplementations; vitamins (C, E), tryptophan immunostimulants, prebiotics and minerals.
Shapira presented several studies conducted to screen for feed additives which can be used as stress modulators. In a 2021 study at Kasetsart University in Thailand, three feed additives were evaluated for 2g white shrimp Litopenaeus vannamei as possible stress modulators. These were a combination of minerals and yeast components (PG), an organic acid blend (PT) and a photogenic product (PP).
"Talking to several successful farmers around the world led me to the understanding and shrimp farming has a lot to do with "growing good water". This means that stress the management of the environment and controlling water quality as a key to having and good yield "
In health management, several nutritional interventions for stress mitigation have been proposed. , During TARS 2022, which focused on aquafeeds, Benny Shapira, Senior Director, Phibro Aqua updated the audience on stressors in aquaculture and on ways to mitigate stress. "In modern aquaculture, we cannot avoid stress which is part of our cu lture system. Our role is to help our clients learn how to mitigate stress with the minimum damage to yield maximum profit "
“We also included a treatment with a mix of at 3:1:1 (PG:PT: PP) to investigate whether we can generate synergism between different additives.” The stress used for this trial was biological in the shape of a challenge with Vibrio parahaemolyticus
Shapira presented several studies conducted to screen for feed additives which can be modulators. In a 2021 study at Kasetsart University in Thailand, three feed additives were for 2g white shrimp Litopenaeus vannamei as possible stress modulators. These were of minerals and yeast components (PG), an organic acid blend (PT) and a photogenic "We also included a treatment with a mix of at 3:1:1 (PG:PT: PP) to investigate whether generate synergism between different additives " The stress used for this trial was biological shape of a challenge with Vibrio parahaemolyticus
There are several types of stressors Physical stressors include temperature, salinity, light, dissolved oxygen, pH, sound etc. Chemical stressors include water quality, pollution, feed and metabolic wastes. Biological stressors range from stocking density, micro-organisms (pathogenic and nonpathogenic) and parasites and farm activities causing stress, including handling, transportation, sorting and stocking
Stress indicators
There are several ways to identify stress. At the cellular level, there are early genes and intracellular enzymes. There are heat shock proteins, either HSP70 or HSP90. Primary and secondary physiological stress indicators include catecholamines, steroid hormones or haemocytes. On the farm level, there are several indicators. “Raising the red flag for the farmer will be fish behaviour such as swimming performance and reduced appetite and whole body stress indicators; retarded growth and body colouration. The farmer can see these in the pond and need intervention quickly,” said Shapira.

There are several ways to identify stress. At the cellular level, there are early genes and intracellular enzymes. There are heat shock proteins, either HSP70 or HSP90. Primary and secondary physiological stress indicators include catecholamines, steroid hormones or haemocytes. On the farm level, there are several indicators which "Raising red flag for the farmer will be fish behaviour such as swimming performance and reduced appetite and whole body stress indicators; retarded growth and body colouration. The farmer can see these in the pond and need intervention quickly," said Shapira.
How the fish or shrimp adapt to stress is described in below. “At the last stage, when the stress is too long or too severe, the animal reaches the stage of exhaustion, when it cannot overcome the stress resulting in poor growth or a higher prevalence of disease outbreaks. This is again a game of energy, utilising energy to overcome and handle stress rather than for growth. This leads to higher feed conversion ratios (FCRs) and higher cost of production.”
An alarm reaction in which “stress hormones” (catecholamine and corticosteroids) are released
A stage of resistance during which adaptation occurs
• A stage of exhaustion in which adaptation is lost because the stress was too severe or long lasting
The indicators of stress measured included phenoloxidase activity, haemocyte count Results showed that in the mixed group, an elevated haemocyte count indicated an advantage diverse additives. "Interestingly, the results show a possible synergistic effect between components for the mixed treatment group. We can assume that these feed additives the immune or stress response of the shrimp. This could be in correlation to the suggestion functional feed additives should be used as a preventive measure rather than being used curative."
The indicators of stress measured included phenoloxidase activity, haemocyte count and SOD. Results showed that in the mixed group, an elevated haemocyte count indicated an advantage for diverse additives. “Interestingly, the results show a possible synergistic effect between the different components for the mixed treatment group. We can assume that these feed additives are priming the immune or stress response of the shrimp. This could be in correlation to the suggestion that functional feed additives should be used as a preventive measure rather than being used as curative.”
How the fish or shrimp adapt to stress is described in Figure 1. , when the stress is too long or too severe vercome the stress resulting in poor This is again a game of energy, utilising energy rather than for growth. This leads to higher feed conversion ratios (FCRs) and h
2
Shapira said, “We can mitigate stress via biological and chemical approaches. The first is managing water quality, optimal stocking density, uniform-size stocking, etc. These vary by species and culture systems. Regarding the latter, it is dietary supplementations; vitamins (C, E), tryptophan, immunostimulants, prebiotics and minerals.
A study conducted at Nong Lam University, Vietnam in 2020 evaluated a functional feed additive as a stress modulator in tilapia Oreochromis niloticus against heat stress of 36°C for 14 days. The trial started with two weeks of feeding, followed by two weeks of the challenge and then a recovery of two weeks, after which effects on feed conversion ratio (FCR) were analysed (Figure 1).
“After two weeks of stress, FCR was dramatically elevated. However, interestingly, at a higher dose of the additive, FCR was at the same level as before the start of the stress challenge. Cortisol is a well-known indicator of stress, and
a high cortisol level even after the two weeks of recovery suggested that it takes more time for the animal to recover without the stress modulator.”
A study conducted at Nong Lam University, Vietnam in 2020 evaluated a stress modulator in tilapia Oreochromis niloticus against heat stress of 36 started with two weeks of feeding, followed by two weeks of the two weeks, after which effects on feed conversion ratio (FCR) were analy
"After two weeks of stress, FCR was dramatically elevated. However, interestingly, at a higher dose of the additive, FCR was at the same level as before the start of the stress challenge. Cortisol is a well-known indicator of stress, and a high cortisol level even after the two weeks of recovery suggested that it takes more time for the animal to recover without the stress modulator.
Another stress indicator that demonstrates the efficacy of feed additive as a stress modulator was alkaline phosphatase, which is linked to liver damage, this indicator showed lower alkaline phosphatase levels for the treated fish both with and without stress. “The next step is to understand how this stress modulator might work,” said Shapira.
Another stress indicator that demonstrates the efficacy of feed additive as alkaline phosphatase, which is linked to liver damage, this indicator phosphatase levels for the treated fish both with and without stress. "The next step is to understand how this stress modulator might work,” said Shapira

In this assessment, white-leg shrimp were fed on two diets, with and without feed additive supplementation, for 28 days. Hepatopancreas were collected from 4 shrimp fed on each diet and analysed for gene expression. A V. parahaemolyticus challenge was performed. A transcriptomic analysis of the effects of the feed additive showed that the topmost upregulated genes were related to the metabolism of glucose and fatty acid biosynthesis. “As stress is an energy-demanding process, by enabling better nutrient utilisation, we are helping the animal to overcome stressful events. Better metabolism leads to better amino acid biosynthesis. Fatty acids biosynthesis provides more available energy enabling the animal to overcome stress,” said Shapira.
“Our role is to help our clients learn how to mitigate stress with the minimum damage to yield maximum profit.”
- Benny Shapira
In this assessment, white-leg shrimp were fed on two diets, with and without feed additive supplementation, for 28 days. Hepatopancreas were collected from 4 shrimp fed on each diet and analysed for gene expression. A V parahaemolyticus challenge was performed. A transcriptomic analysis of the effects of the feed additive showed that the topmost upregulated genes were related to the metabolism of glucose and fatty acid biosynthesis. "As stress is an energy-demanding process, by enabling better nutrient utilisation, we are helping the animal to overcome stressful events. Better metabolism leads to better amino acid biosynthesis. Fatty acids biosynthesis provides more available energy enabling the animal to overcome stress , " said Shapira.

antagonistic against pathogenic Vibrio, and Sphingobium produces carotenoids, essential antioxidants to help the animal overcome stress.”
Shapira summarised, “Feed additives can help to modulate stress, but a synergistic effect of a different combination of components might be more effective than a single one. Finally, mitigating stress is highly important in modern aquaculture, we must understand that there is no silver bullet, and to mitigate stress, we must combine stress modulators alongside good farm practices.”
Lastly, there was a microbiome analysis to understand how the product worked. Shrimp samples from a full commercial trial in Mexico were analysed for their microbiome after feeding with and without the additive. The analysis was conducted at Plymouth University, UK (Figure 2). “We saw a shift in the microbiome and a change in abundance for four genera of bacteria; Acinetobacter, Bacillus, Pseudomonas and Sphingobium.” Acinetobacter is
Reference
Lastly, there was a microbiome analysis to understand how the product worked. S hrimp samples from a full commercial trial in Mexico were analysed for their microbiome after feeding with and without the additive. The analysis was conducted at Plymouth University, UK (Figure 3). "We saw a shift in the microbiome and a change in abundance for four genera of bacteria; Acinetobacter, Bacillus, Pseudomonas and Sphingobium. " Acinetobacter is antagonistic against pathogenic Vibrio, and Sphingobium produces carotenoids, essential antioxidants to help the animal overcome stress. "
Benny Shapira, 2022. Solutions for Stress Mitigation-Technical and Innovative Perspective, TARS 2022, October 6-7, Ho Chi Minh City, Vietnam.

7, Ho Chi Minh City,
At TARS 2022, the panel on adoption of novel feed ingredients/additives, from left, Marc Campet, ADM, Vietnam; Romi Novriadi, Jakarta Technical University, Indonesia; Nguyen Duy Hoa, Empyreal Products, Cargill, Vietnam; Benny Shapira, Phibro Aqua and Loc Tran, ShrimpVet Laboratory, Vietnam.

At VIV Asia 2023, a conversation with Alltech on recent developments and future plans
In recent years, Alltech, a leader in animal nutrition and technology, has made several acquisitions to drive its vision for a more sustainable future for the agri-food sector. It has dedicated itself to advancing nine out of the 17 Sustainable Development Goals (SDGs) of the United Nations. These goals are particularly relevant for Alltech’s core businesses and the company’s vision of Working Together for a Planet of Plenty™, launched in 2019. This is the commitment of Alltech’s global team, be it in crop science, livestock or aquaculture. It is also a call to collaborate with producers and to embrace innovative technologies, business models and improved farm management practices. In September 2022, Alltech announced the appointment of Tara McCarthy, the former CEO of the Irish Food Board, as its global vice president of environmental, social and corporate governance (ESG). Additionally, Alltech has committed to the Science Based Targets initiative (SBTi). These targets are designed to help companies reduce their greenhouse gas (GHG) emissions and share their progress through transparent documentation and reporting.
Alltech dedicates 10% of its revenue to R&D. “The future of agriculture is not simply food production: we need to improve our outcomes on nutrition, energy production and capture of carbon and to build business models to do these things,” said Dr. Mark Lyons, President and CEO.

“Some projects have involved digesters, which convert waste into energy. Over the past decade, we had 20 acquisitions and we have put most of our energy on these. We have launched an innovation department led by Dr. Kyle McKinney who most recently served as the global director of our enzyme technology platform. This is a big area for us.”
Below are excerpts from a joint interview by regional media during VIV Asia 2023, held from 8-10 March, Bangkok, Thailand with the Alltech CEO and President, Dr. Mark Lyons , the second generation of the family business and Jonathan Forrest Wilson , President of the Asia-Pacific region for Alltech and responsible for leading Alltech’s strategy within China and Asia Pacific. The conversation focused on Alltech’s plans for a sustainable agriculture and aquaculture industry in Asia. Sustainability in the industry remains a goal, but the pace has been disrupted by feed industry players coping with rising costs of feed ingredients and energy, resulting from the Ukraine war.
This is a core target in animal production especially as the Asian feed industry moves to use more alternative raw materials such as palm kernel meal. Enzymes maximise feed efficiency in a sustainable way. In aquaculture, use of a natural enzyme complex, can reduce fishmeal content in fish diets while maintaining and improving growth performance. Alltech has Allzyme® SSF, a natural complex of enzymes produced through solidstate fermentation system (SSF).
Lyons has a close affinity to this technology. Besides earning a Ph.D. on SSF from Heriot-Watt University, Scotland, early in his career at Alltech, he spent time rebuilding the company’s SSF plant in Serdán, Mexico. During this interview, Lyons categorically distinguished Alltech’s enzyme technology from other enzymes in the market.
“The difference is that through SSF technology, many enzymes are produced by the same organism, which gives balance and stability to the product. In contrast, most other companies are producing enzymes through liquid fermentation and they have one enzyme or a mix of several enzymes. Our enzymes can release more nutrients, especially in situations where we have byproducts with a lot of cellulose, which are not well utilised.”
Lyons added, “Today, we are in the situation where raw material costs are high. With a lot of imports, our concerns are on mycotoxins and food security issues, particularly in Asia.”
With regards to market growth for enzymes, Lyons said, “I expect the enzyme market will continue to grow. It will be 3-4 times larger in the next 4 years, as it will be critical for us to get more out of the feed and manage feed costs more effectively. This is an area where we are putting more effort today.”
With reference to the recent opening of the new Bioplex® plant in 2022, the first organic mineral production facility in Vietnam and Alltech’s 8th globally, Lyons said that the company has committed significant resources into organic trace mineral production, quality control and research, as trace mineral nutrition is essential to animal health.
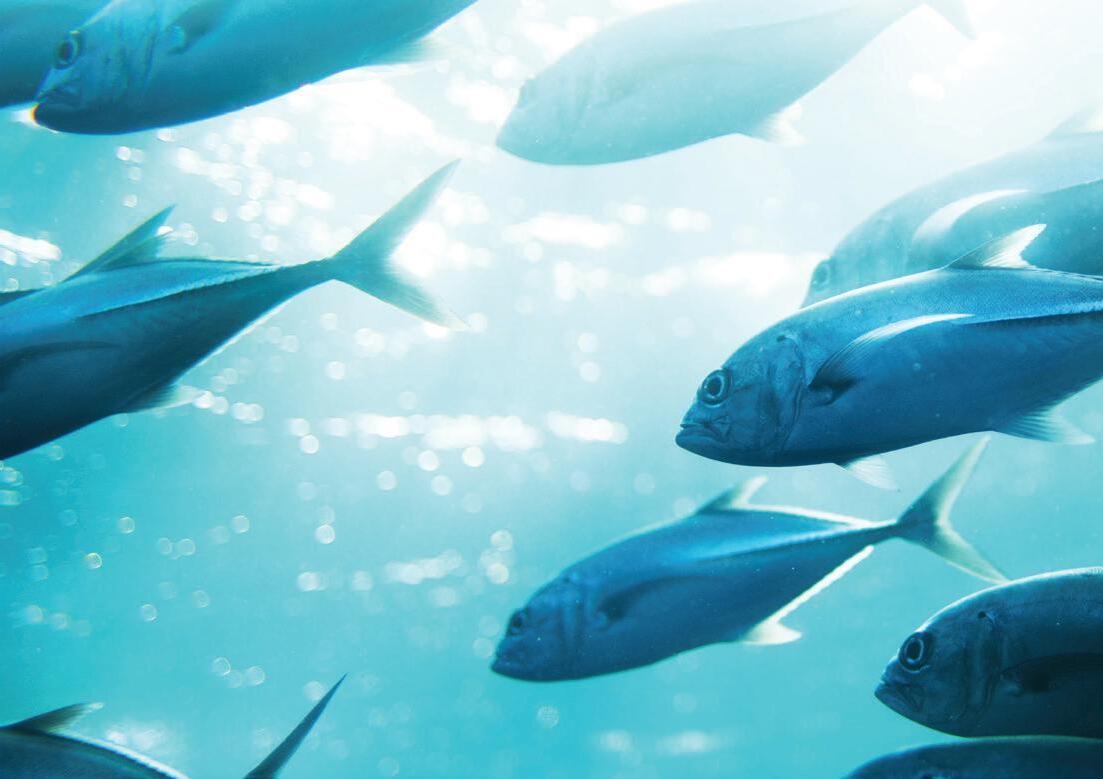
“I expect that in the future, perhaps 20-30 years on, inorganic minerals will not be used at all. Through science, we are seeing more and more negative impacts of inorganic minerals, not only because they may denature enzymes but also their impact on antimicrobial resistance (AMR) and negative impact in the soil. Inorganic minerals may also be contaminated with heavy metals, and dioxin-like polychlorinated biphenyls (PCBs). We test most of our minerals and vitamins and the Alltech Q+ (Quality Plus) program has been very successful in upholding our standards for quality.”
Wilson added, “This Bioplex story is important not only for efficiency but also for the environment. We can expect more of its use as today, the prices for feed ingredients are high.”
Built on partnership and innovation, Wenger is providing more opportunities for client success.
For almost a century, Wenger has delivered extrusion-based innovations to our partners. We’ve worked alongside you to develop new processing solutions and better products, providing our industry-leading expertise and ongoing support every step of the way.
We don’t plan on stopping any time soon.
Wenger’s global food processing family is growing, and we look forward to the exciting opportunities that lie ahead. We will continue to deliver even more innovations and technologies to benefit companies that share our vision of tomorrow.
Wenger.com
With the adoption of organic minerals, Alltech has large in-house marketing teams to convince feed formulators of the merits of its feed additives and then also help feed millers promote the value of these feeds to their customers. “Integrators can capture the value of the technologies themselves and so I expect that with more integration, the adoption of feed additives will be much faster,” said Lyons.
Wilson added, “As companies move downstream, they work more closely with food producers and the value accrues to them.”
Alltech is working on a new program with larger companies to determine risk levels in feed, mitigate those risks and manage costs. With regards to mycotoxin management by aquafeed players, Wilson said, “The aquaculture industry has not been focusing on mycotoxin management well enough. We want to show a more efficient use of aquafeeds, as well as reduce disease and anti-nutritional effects in the ponds. We have done some research with products here especially in high plant-based diets, such as for freshwater fish, which could come along with some level of mycotoxin contamination. If farmers are using compound feed with high inclusion rates of plant based raw materials with potential mycotoxin challenges, we introduce mycotoxin management programs.
“Adding to what Mark said, we have quite a lot of data. However, the next thing is to figure out what level of risk the toxins present and make recommendations on required dosages to control contamination levels.”
“Our advantage is that we have feed milling operations, albeit in another part of the world. But we can use their expertise with local customers. The challenge is to get these key colleagues to spend time in Asia. Again, we have the advantage of feed milling experience when we talk with fish farmers. This big shift only happened in the last 10 years. I think that this is an important advantage. The question is can we use that advantage to scale the business,” said Lyons.
The adoption of nutritional technology in global feed markets, has an uptake of 70%-80% but in many feed markets in Asia, it is only around 50%.
“Therefore, the potential to increase uptake is large in Asia. We see growth in the enzyme and organic minerals segments. The program we are building to remove antibiotics is moving fast and getting legislative approvals. But we found that even with our program to remove the use of antibiotics, we are not reducing AMR. The resistant gene is still there. So, we are creating a different competitive landscape and can show more sensitivity to antibiotics from the bacteria. We are reversing AMR. This is really very exciting and through agriculture and aquaculture, we can have a positive impact on human health, not just around nutrition but making sure that the antibiotics are working when we use them for our animals,” said Lyons.
Over the last two years with higher raw material prices, what have been the changes in feed markets? Lyons responded, “From the conversations that we are having, we see that before, companies were just asking whether to adopt certain production technologies, but now they are seeking out new technologies and realising their values. When feed ingredient prices are high, it makes more sense to try to use feed additives to efficiently convert feed into nutritious products like milk and eggs.”
Wilson added, “One of the big industry challenges that we face is efficiency. That is why we are having discussions on organic minerals and enzymes etc., and bring multiple products together and experts with some solutions. Sometimes the lowest cost feeds are not the best for the animal. We need to drive efficiency.”
“In 2022, knowing that the world is beginning to open again, we saw a big drive for sustainability. Now a year later, we see more regionalisation, polarised global politics and high raw material prices. Each country will have to make their own decisions on sustainability. There are some positives with investments in green energy. Undoubtedly, every company is facing uncertainty and needs to focus on profitability. They are hesitant to make these investments for sustainability,” said Lyons.
“However, we do need to continue to focus on sustainability; if not, in 5-10 years, we will say that we have missed the opportunities. In agriculture, there is still a lot of rebalancing as compared to a year or two ago. I believe it is time for our industry to show what our environmental impact is. We have interesting projects to be carbon negative. This is part of the future.”
Within aquaculture for Alltech, there is Alltech Coppens with specialty feeds and Guabi in Brazil, which has 25% of their extruded feeds for tilapia and shrimp.
“Alltech Coppens is taking the lead within our global aquaculture business. Last week, we formed a joint venture with the Finnish recirculating aquaculture systems (RAS) company Finnforel, for farming trout. They want to come to Asia with their RAS and are looking at Singapore and Japan as well as the Middle East. If all this happens, we have to produce specialised feeds for these systems and that is where Coppens comes in,” said Lyons, adding that “Aquaculture is a fast-growing business for us. We started with the traditional way selling feed additives to the feed millers and aquaculture companies.”
Wilson announced the expansion of its aquaculture team. Shrimp expert Dr. Zhang Yufan, who has built a good team in China as China Aqua Business Manager, will now be based in Bangkok and will be building up the aquaculture teams in India, Indonesia, Thailand and Vietnam and connect with customers on the technical side and support the commercial team led by Henry Wong, Asia Aquaculture Commercial Development Director.
Wilson said, “During the Covid years, we launched Bioplex® Aqua Boost, a new addition to our line of mineral management solutions. Now we are working on products for water quality and expanding on our De-Odorase® to control ammonia. We are getting good reviews from shrimp farmers in India and pangasius farmers in Vietnam. Since 2020, we have put a lot of effort into having more products to serve our market.
“Although Coppens is involved in feeds for cold water fish such as trout and sturgeon, their contribution for Asian aquaculture is in R&D. For example, it is working on our net energy concept, which is producing diets based on net energy rather than just a matrix. They also help us with different ways of approaching nutrition and run trials at the Alltech Coppens Aqua Centre, one of Alltech’s five bioscience centres globally.”
May/June 2023
Issue focus: Sustainable & Responsible Aquaculture
Industry Review: Aquafeed Production
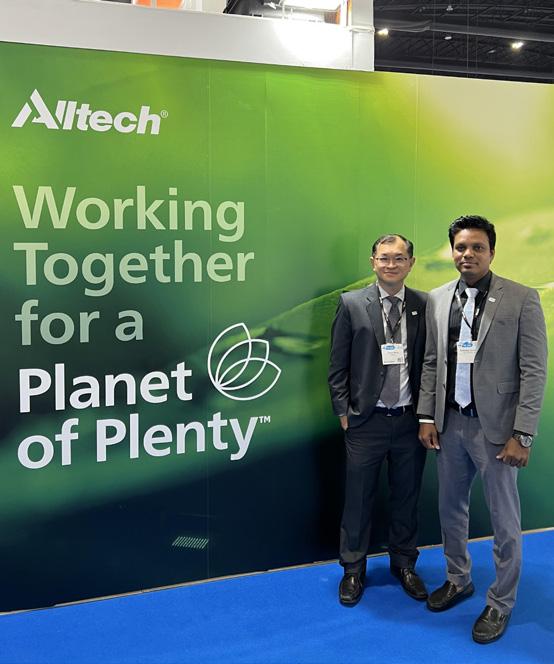
Feed/Production Technology: Sustainable Feeds; Hatchery Technology
Deadlines: Articles/Adverts – March 22
July/August 2023
Issue focus: Demand and Supply Equilibrium
Industry Review: Tilapia
Feed/Production Technology: Novel Ingredients; Real Time Monitoring/Big Data
Deadlines: Articles - May 24
Email: zuridah@aquaasiapac.com/enquiries@aquaasiapac.com

In this article, we describe how farmers can save 2.26 tonnes of feed and harvest an extra 4.2 tonnes of whole tilapia or 1.7 tonnes of well-trimmed fillet by using a new generation of GenoMar GAIN Nile tilapia (Oreochromis niloticus) compared to fingerlings from the former generation. These results originate from a field trial of one cage farming production cycle.

GenoMar Genetics Group is an international aquaculture breeding and distribution company that provides genetically improved tilapia to farmers globally. The company has two products for the Asian market: GenoMar GAIN, selected for growth and high fillet yield and GenoMar STRONG, selected for robustness and high survival. The GenoMar tilapia strain has been selected for fast growth since the establishment of the founder population in the late 1980s. Systematically selective breeding for more than 30 generations, using state-ofthe-art technologies has led to gradual improvements in growth rate and other important traits. Today, the GenoMar strain is established as a superior profitable brand for tilapia farmers.
We have been a pioneer in including and measuring various traits of commercial interest for selection in tilapia breeding programs. This includes growth in multiple environments, fillet yield and resistance to specific diseases such as streptococcosis and columnaris, thus
enabling us to provide farmers with premium quality differentiated products. The growth of our fingerlings has been demonstrated in various trials described in technical and semi-technical literatures and made us the industry leader in terms of tilapia genetics.
When producing fingerlings and juveniles for the farmer, the weightage of traits in the final selection of parent stock is based on the predetermined desired genetic profile. The best performing parents matching the profile are then picked for mating.
In GenoMar GAIN we have kept the solid underlying robustness and specific disease resistance improvements and continued the growth and fillet yield performance developed through many generations of systematic selections. This new generation with increased performance of the key economically important traits is available to farmers every one or two years.
Performance evaluation under industrial field conditions is an important prerequisite to validate the improved performance of the new generation of commercial fingerlings. In 2021, the new and former generations of GenoMar GAIN Nile tilapia were individually tagged



Figure 1. Comparison of growth and fillet yield parameters between the former and new generation of GenoMar GAIN. Growth was compared using two metrics: specific growth rate (SGR) and body weight at harvest. Fillet yield was compared by three different market practices to obtain the fillet: removing bone and scales, removing bone and skin, and removing bone, skin and trim.
and placed together in cages in a commercial farm to test the different groups under industrial-scale conditions in Malaysia. The fish was harvested at around 1,250g after 165 days post-transfer to grow-out.
The commercial field trial revealed a significant increase in the growth rate for the new generation of GenoMar GAIN compared to the former generation (Figure 1). To compare the growth between these two generations, we used two different metrics: specific growth rate (SGR) and harvest weight. The SGR for the new generation was 3.83% higher (P<0.001) compared to the former generation while the harvest weight of the new generation was on average about 43g or about 3.5% higher body weight (P<0.001) than the former generation over the same culture period. There was no significant difference in initial body weight at stocking.
Similar to growth rate, the commercial field trial also revealed that the new generation of GenoMar GAIN had significantly higher fillet yield (ratio of the weight of fillet to the body weight at harvest). Filleting was performed in a commercial filleting plant, where three types of fillets were obtained based on the market practices: skin-on (removing bones and scales), deep-skin (removing skin from the skin-on fillet) and well-trimmed (removing trims from deep-skin fillet). Skin-on, deep-skin and welltrimmed fillets yield ratios were found to be significantly higher in the new generation groups by 1.91%, 1.48% and 1.95% respectively, compared to fish in the former generation (Figure 1).
It must be noted that the traits for fillet yield and body weight at harvest have shown no genetic correlation, that is if we just select for growth in the breeding programs, there will be no improvements in fillet yield. Thus, we have been selecting not only for growth, but for various economically important traits, including fillet yield, so that the products are superior for all the key commercial traits.
The profitability of farmers is not only dependent on the final weight of the fish but also on the total biomass that is produced. If there is a huge mortality despite having very big fish, it will be difficult to make a profit. Therefore, we have further been selecting our fish for increased disease resistance and overall survival, so that the total biomass produced is very high. At 165 days post-transfer to grow-out, the cumulative mortality was on average 27.17% for the new generation and 30.27% for the former generation. This result demonstrated that survivability increased throughout the entire grow-out phase with approximately 10.24% (Figures 2 and 3, P <0.001).
The economic implication for farmers is greater if the mortality rate is higher in the later stages of the growout phase compared to the earlier stages, mainly due to the investment in feeds. In many countries in Asia, feeds account for around 70-85% of the cost of production in Nile tilapia aquaculture, whereas the cost of fingerlings is only around 5-10%. As can be seen in Figure 2, the mortality rate in the later phases of the grow-out (after around 110 days) was significantly lower in both new and former generations of GenoMar GAIN, thereby increasing margins.
Figure 2. Cumulative mortality curve showing significantly reduced mortality in the new generation of GenoMar GAIN compared to the former generation.
More than 70% of the total cost of production in Nile tilapia is attributed to the feed cost. Any improvement in the feed efficiency greatly impacts the profitability of farmers. The feed conversion ratio (FCR) was used to assess the feed efficiency for the two groups of fish. Feed efficiency was found to increase by 2.5% for the new generation of the fish, compared to the former generation (Figure 3). We have not directly selected for FCR in our breeding nucleus, but this increase in FCR was due to increase in growth rate and decrease in mortality.
For fish farmers, selection for uniformity of body weight leads to increased profit by producing more fish of the size range demanded by consumers and processors. Some processing plants even pay premium prices if the farmer can deliver very uniform fish. Therefore, the coefficient of variation for body weight at harvest was used to assess the uniformity for the two groups of fish. The higher the coefficient of variation, the lower the uniformity. The new generation fish was found to have a more uniform body weight at harvest, the value being 10.33% (P <0.001) more uniform as compared to the former generation (Figure 3).
generation fingerlings improved, farmers selling whole fish gained an extra 4.2 tonnes of tilapia per harvest, while processors selling fillet, gained around 1.7 tonnes of well-trimmed fillet per harvest. This showed that farmers can reap huge benefits with this new generation of fingerlings.
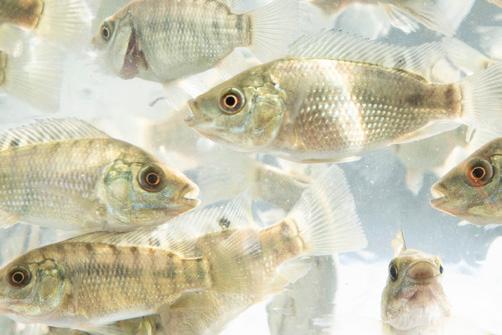
This new generation of fingerlings of GenoMar GAIN is already available to the customers from our hatcheries in the Philippines, Malaysia and Vietnam. These fingerlings will be available to customers in Colombia and Brazil from the third quarter of 2023.
Rajesh Joshi, Anders Skaarud and Anne Vik Mariussen, 2021. 30 years of tilapia breeding programs: An essential contribution for a healthy and profitable industry. Aqua Culture Asia Pacific, November/December 2021. Page 20-24.
Rajesh Joshi, Anders Skaarud and Anne Vik Mariussen, 2022. 30 years of tilapia breeding programs: The effect of traditional and novel selection methods. Aqua Culture Asia Pacific, January/ February 2021. Page 13-19.
We carried out some simple analyses to calculate the extra benefits for farmers when using the new generation of fingerlings compared to the former generation. This was based on results from a commercial trial of one production cycle stocking 60,000 fingerlings and harvesting around 1,250g/fish.
In terms of input costs, there was no extra cost associated with the purchase of the new generation of GenoMar GAIN fingerlings. All other costs associated with rearing fish of either generation were equal for the farmers. The field trial showed that farmers benefited by using the new generation fingerlings. The feed efficiency improved, thereby saving 2.26 tonnes of feed. Since, both survival and the body weight at harvest for the new
Rajesh Joshi is Senior Researcher.

Email: rajesh.joshi@genomar.com
Anders Skaarud is Senior Researcher. Email: anders.skaarud@genomar.com


Oliver Arribas Robles is Technical Director. Email: oliver.arribas@genomar.com
Anne Vik Mariussen is Marketing and Communications Manager.

Email:anne.vik.mariussen@genomar.com
The above authors are from GenoMar Genetics Group, Norway.
Thea Luz G. Pineda is Breeding Manager for Asia Pacific in GenoMar Genetics, Philippines.
Email: thea.pineda@genomar.com

Studies with various carnivorous fish show the potential for the complete removal of fishmeal and fish oil from aquafeeds although dietary fine-tuning will be required for higher feed efficiencies, says the F3 team
Over the past eight years, the F3 Future of Fish Feed consortium, a collaboration between NGOs, researchers, and private partnerships, has undertaken a variety of trials to evaluate the potential for the complete removal of fishmeal and fish oil from aquafeeds.
Here, we summarise findings from eight fish-free feed (F3) trials on Hawaiian kampachi Seriola rivoliana , California yellowtail Seriola dorsalis , largemouth bass Micropterus salmoides , Florida pompano Trachinotus carolinus and red drum Sciaenops ocellatus from the original publication (Campbell, K.B. et al., 2022. In Pursuit of Fish-Free Feeds: A Multi-Species Evaluation. Fishes 2022, 7(6), 336).
These open-source recipes, together with others, are available through the F3 Feed Innovation Network (https://f3fin.org) for use and can be redesigned to suit the availability of specific ingredients or to cater to an individual’s or company’s needs. In all trials, the performance of each species fed fish-free feed (F3) was compared against a commercial feed and/or a fishmeal and fish oil based experimental diet. The formulations discussed here, for each species examined, are summarised in Table 1.
Juvenile kampachi Seriola rivoliana (282g) were distributed into one of eight 4-tonne tanks (30 fish/ tank) and fed on a F3 (Table 1) or commercial diet. After 56 days of growth, animal numbers were halved to accommodate for fish growth. After that period, they grew on for a further 28 days, totalling 84 days. Fish were initially fed twice daily until they achieved ~1 kg weight at which point they were fed once a day. At trial termination fish were weighed, gutted and filleted to obtain fillet yield. F3 and control fed fish were of similar weight through 56 days. After 56 days, weight gain in the F3 fed fish declined relative to that of fish fed the commercial feed.
The viscerosomatic index (VSI) for control fish was higher than the F3 kampachi, which resulted in fillet yields being equivalent across the two diets. There were no differences in feed conversion ratio (FCR) (~1.31) between tested feeds. Interestingly, when a blind taste test was undertaken, 62% of participants preferred the F3 fed fish, 19% preferred those reared on the commercial diet and 19% were unable to discriminate between the two (Meigs et al., 2020).

Juvenile California yellowtail Seriola dorsalis (20g) were maintained in a semi-closed recirculation system (RAS) comprising 1,000L circular fiberglass tanks. Tanks were randomly stocked with 15 fish/tank. The water temperature was maintained at 22 o C, salinity at 34.5mg/L and dissolved oxygen (DO) between 10-12mg/L. Fish were fed in quadruplicate a F3 feed consisting of poultry by-product- Spirulina meals and corn protein concentrate (Table 1) or a fishmeal and fish oil (FM+FO) based experimental feed. Animals were fed to satiation using belt feeders at 5-10% body weight per day for 64 days.
At trial termination, fish were sampled for weight gain, survival, FCR, whole-body proximate composition and histological assessment of the intestine and liver and hepatic glycogen levels. Following completion of the trial, F3-diet-fed yellowtail had poorer growth and demonstrated an increased FCR compared to those on the FM+FO control experimental diet. However, there was no significant difference between the F3 group and the group where fishmeal was substituted but fish oil was used.
This demonstrated that algal oil is a suitable substitute for fish oil in California yellowtail. Survival was identical between groups. Examination of body composition determined that lipid level was lower and moisture higher in fish fed the F3 diet. The F3 fed fish also exhibited the highest hepatic glycogen accumulation. There were also differences in gut histology between feeds, with goblet cell numbers being elevated in yellowtail fed the F3 diet (Stuart et al., 2020).
Juvenile largemouth bass Micropterus salmoides were randomly dispersed into 20 tanks at densities of 7.4kg/ m 3. Tanks were maintained as a recirculating aquaculture system (RAS) held at 28 o C, with a DO of 8mg/L and randomly assigned to either a F3 feed or commercial largemouth bass diet (n=80 fish per diet). Animals were fed to apparent satiation three times daily for 84 days and at the end of the trial, weight gain, condition factor (K), FCR, hepatosomatic index (HIS) and VSI were assessed. Tissue samples (n=3 fish/tank) were taken from the liver, spleen, head kidney, proximal and distal intestines. These were stained using haematoxylin and eosin or Prussian blue to evaluate potential pathologies and hemosiderin. Liver lipid, glycogen and glucose concentrations were quantified using standard methods.
At trial termination, there were no differences in weight gain or K between diets. HSI, VSI and melanomacrophage and non-melanomacrophage centers hemosiderin concentrations and hepatic vacuolisation, glycogen, lipid, and glucose levels were also similar. No differences were noted in the structural integrity of the proximal or distal gut.
However, F3 feeds returned inferior FCRs (McLean et al., 2020a). Fish from the same study were then transferred to another RAS comprising 757L tanks and density reduced (3.1-kg/m 3 ) and grown for 126 days further to market size. F3-fed largemouth bass returned an inferior growth performance and FCR when compared to fish fed the commercial diet, although K and HSI
were identical. This study also examined δ 15N and δ 13C using a Europa 20-20 continuous-flow isotope ratio mass spectrometer to establish whether it was possible to use this method to differentiate between fish that had been grown on a F3 feed versus animals receiving FM+FO based diets. Results confirmed the pertinency of this method to verify use of FM/FO-free feeds during production (McLean et al., 2020b).
One further study with largemouth bass (McLean et al., 2022) evaluated the impact of using various blends of alternative oils on growth performance. In this trial, fish oil was substituted by flax, canola, and algal oils, either alone or in combination. The oils and blends had no negative impact on performance characteristics although whole-body fatty acid profiles were aligned with dietary levels. Notable was that total omega-3 and omega-6 ratios differed between diets, with canola oilbased feeds expressing lowest and algal oil-containing feeds returning highest ratios. Further studies with different dietary lipids and their combinations, are worthwhile to assess whether they may impact fillet quality characteristics as reported for other species.
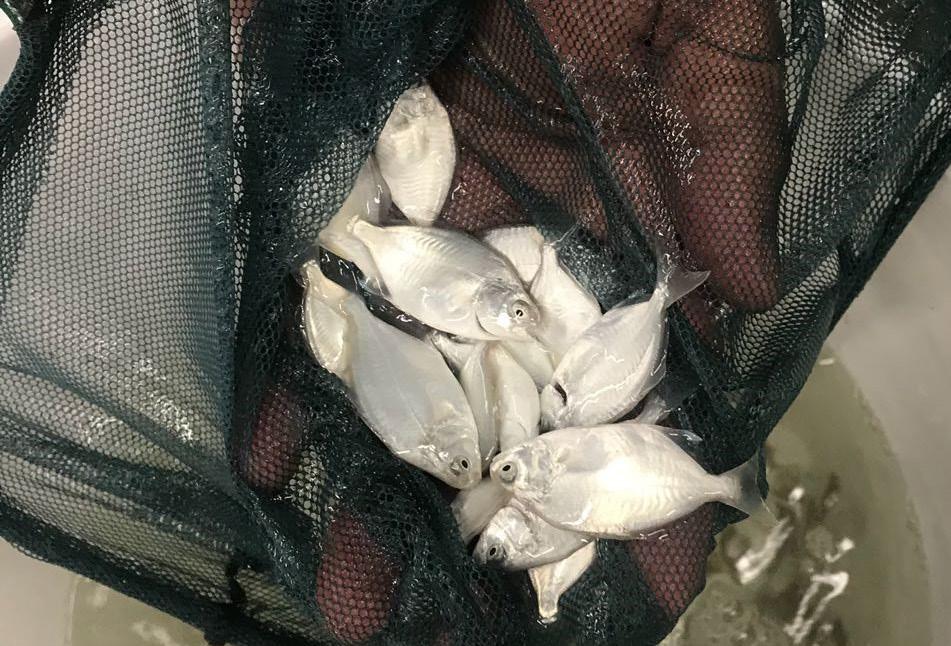
Juvenile Florida pompano Trachinotus carolinus of about 15g were held in a RAS under hyposaline (3mg/L) conditions and fed the test diet (Table 1, pompano 1), Atlantic salmon diet or experimental FM+FO based feeds. Ten animals were stocked into 110L aquaria, which then were randomly assigned to each diet in triplicate (n= 30 fish per feed). Fish were fed twice per day to satiation by hand for 94 days. At the trial end, weight gain, feed efficiency and survival were recorded for each aquarium. Three fish from each aquarium (n = 9 per diet) were then euthanised and examined for HSI, intraperitoneal fat (IPF) ratio, fillet yield and K. Fish from each diet were then pooled and homogenised to examine body composition. After the 12-week trial, there were no differences between feeds for weight gain, K, survival or fillet yields, HSI or IPF. However, feed efficiency was higher for the FM+FO control pompano.
Comparison of whole-body proximate composition failed to reveal any differences between diets. In another study (Riche et al., 2022), the effect of fishmeal and fish oil free diets on performance of Florida pompano (Table 1, pompano 2) was also evaluated but in this study Spirulina and higher levels of algal oil were used. Diets containing
algal oil returned equivalent growth and survival to the FM+FO control diet but outperformed the growth of fish fed on a diet in which the sole source of lipid was provided by soybean oil. Although other studies have demonstrated the feasibility of eliminating fishmeal and fish oil from pompano feeds, these trials were the first to evaluate diets completely void of fishmeal and fish oil simultaneously (Alfrey et al., 2022; Riche et al., 2022).

Juvenile red drum Sciaenops ocellatus with initial weight 3.2g were maintained in 38L aquaria configured as a RAS and holding water at 5.3g/L salinity, temperature of 27.5 o C and DO of 6.88mg/L. Fifteen fish were randomly assigned to aquaria and diets in quadruplicate (n = 60 fish per diet). Red drum were fed to apparent satiation two times daily for 56 days. At the end of the study, identical production parameters to that described for Florida pompano, except for K, were collated.
By trial end, there were no differences observed for any of the six (weight gain, FE, survival, or fillet yields, HSI or IPF) production elements considered between the F3 and experimental FM+FO feeds. However, the F3fed pompano expressed a reduced whole-body lipid concentration and reduced protein conversion efficiency. This trial, similar to that for pompano, represents the first simultaneous replacement of fishmeal and fish oil in juvenile red drum diets without impact on production characteristics (Suehs et al., 2022).
The above studies with cultured carnivorous fish illustrate that great potential exists for the complete removal of fishmeal and fish oil from aquafeeds. Fishmeal was successfully replaced using blends of proteins that included poultry by-product meal, corn protein concentrate, soy protein concentrate, hydrolysed soy and others, supplemented with methionine, lysine, threonine and taurine.

Likewise, fish oil was replaced successfully using flax, canola, non-GMO (non-genetically modified organisms) soy and algal oils. When F3 feeds were compared against commercially available or experimental FM+FO diets, they each performed well. The only exception to this was the growth response of California yellowtail, the depression of which may be explained by the significant percentage of dietary protein provided as Spirulina
Feed efficiencies were generally poorer for F3 diets, which might have reflected sub-optimal nutrient balance, feedstuff digestibility and or palatability. Dietary finetuning would be expected to correct these shortcomings, with higher level carnivores likely requiring additional effort to increase palatability and nutrient composition of plant-based feeds. Whole-body composition also remained remarkably stable across species; nonetheless, lipid levels were reduced in red drum and California yellowtail, with the latter also returning lower moisture content. Three of the studies reported on whole body fatty acid analyses and as has been reported elsewhere, the variations seen mirrored those of the dietary profiles. Fillet yields were unaltered by diet and importantly, when basic organoleptic examinations were performed with largemouth bass and kampachi, results were highly positive.
Several crucial areas for further research remain. The F3 diets did not influence survival and had no apparent meaningful impact on the histology of examined tissues. It is notable, however, that in those trials where histological assessments were made, these were only undertaken at trial termination. The possibility of transient negative effects of alternative proteins and oils on liver and gut microstructure, therefore, cannot be discounted.
Feed manufacturing implications must also be considered, including possible impacts of alternative ingredients on pellet processing and stability, as well as effects on palatability and faecal consistency once diets are fed to fish. Looking at the wider aquaculture feed landscape, efforts to standardise global regulations will help lower the barrier to entry for alternative ingredient providers. Ultimately, all-encompassing elite aquafeeds, comprising non-marine sourced ingredients, will only become mainstream once the nutrient requirements of all farmed species are known.
Slightly reduced fish performance resulting from alternative protein/lipid feeds might be considered acceptable given the increasing cost and scarcity of fishmeal and fish oil. Aquaculture is a business and when growing products for consumption, it must, like any other food-producing industry, make a profit. Feeds are the most expensive variable operating cost, and the FAO reports that this may represent upwards of 50% of a farm’s budget.
Protein embodies the costliest nutritional component of aquafeeds. Savings, by using less expensive and more sustainable protein sources, as represented by rendered animal and vegetable proteins, therefore, greatly reduces feed costs, increases farm profitability, stabilises the industry and employment within and outside the business (i.e., in the service sector), while offering the potential for lower consumer prices.
This review was contributed by the F3 Future of Fish Feed team
Reference Campbell, K.B. et al. 2022. In Pursuit of Fish-Free Feeds: A Multi-Species Evaluation. Fishes 2022, 7(6), 336). https:// www.mdpi.com/2410-3888/7/6/336

you could get more from your fish and shrimp feeds?


What if Alltech optimizes digestive function and support growth.

World feed production remained steady in 2022 at almost 1.27 billion tonnes. Global aquafeed production grew 2.7%, while China showed a 10% increase
In January, Alltech released its 2023 Agri-Food Outlook, highlighting the global feed production survey data. Despite significant macroeconomic challenges that affected the entire supply chain, global feed production remained steady in 2022 at 1.27 billion tonnes, a decrease of 0.42% from 2021’s estimates. The annual survey, now in its 12th year, includes data from 142 countries and more than 28,000 feed mills.
Europe bore the brunt of the impact, including significant disease challenges, severe weather and the consequence of the invasion of Ukraine. The global Covid-19 pandemic has affected the agri-food sector, contributing to supply chain challenges and accelerating the adoption of new technology and environmental sustainability practices.
Each year, Alltech works with feed mills and industry and government entities worldwide to compile data and insights on feed production. Compound feed production and prices were collected by its global sales team and in partnership with local feed associations in the last quarter of 2022. These figures are purely estimates intended to serve as an information resource for industry stakeholders.
Feed production increased in several regions, including Latin America (1.6%), North America (0.88%) and Oceania (0.32%), while Europe decreased by 4.67%, Africa by 3.86% and the Asia-Pacific region also dropped 0.51%.
Globally, increases in feed tonnage were reported in the aquaculture, broiler, layer and pet food sectors, while feed tonnage in the beef, dairy and pig sectors decreased.
Although it experienced a narrow reduction in feed production, China remains the largest feed-producing country in the world, followed by the U.S. and Brazil.
Production in million tonnes, from the top 10 feedproducing countries over the past year was China (260.74), U.S. (240.40), Brazil (81.95), India (43.36), Mexico (40.14), Russia (34.15), Spain (31.23), Vietnam (26.72), Argentina (25.74) and Germany (24.40).
Together, these top 10 countries produced 64% of the world’s feed production. Half of the world’s global feed consumption is concentrated in four countries: China, the U.S., Brazil and India. Vietnam experienced excellent recovery in feed production in 2022, entering the top 10 ahead of Argentina and Germany.
Survey respondents identified inflation and the overall state of the economy, particularly the increased prices of raw materials, feed and food, as the key challenges affecting the agri-food sector in 2022 (Figure 1).
The state of the economy will remain one of the most significant factors influencing the industry’s success, said a participant from South Africa. Changes in consumer habits, such as point of purchase and dietary trends, also make an impact.
Supply chain disruptions remain an obstacle for the agrifood industry across all regions. Many regions reported that geopolitical tensions, particularly the invasion of Ukraine, have affected imports and exports, the supply chain and raw materials prices.
North America reported an increase of 0.88% (2.27 million tonnes) and the U.S. remained the second-largest feedproducing country globally, behind China. Growth was in the broiler, beef and pet food sectors.
Latin America experienced a growth of 1.6% (3.01 million tonnes) and Brazil remained the leader in feed production for the region and ranked third overall globally. Mexico, Brazil and Chile reported the most growth.
Europe saw a massive decrease in feed production of 4.67% ( -12.88 million tonnes) in its feed production due to issues that include the invasion of Ukraine and the spread of animal diseases, such as African swine fever (ASF) and avian Influenza (AI).
The Asia-Pacific remained flat as decreases reported in China, Pakistan, Thailand and Malaysia were offset by increases in Vietnam, the Philippines, Mongolia and South Korea.
Africa experienced a decrease of 3.86% in feed tonnage ( -1.72 million tonnes), mainly because of reductions reported in Egypt, Morocco, Kenya and Nigeria.
The Middle East region is up significantly at 24.7% (6.30 million tonnes) due to more accurate reporting and efforts by the Saudi Arabian government to increase broiler production as part of its Vision 2030 plan.
Oceania was flat, with a slight reduction reported by Australia which was offset by a slight increase reported by New Zealand.
The poultry sector experienced increases in layer and broiler feed production by 0.31% and 1.27%, respectively. Avian influenza, other diseases and the high costs of raw materials affected the layer sector in many markets, especially in Asia, Europe and Africa.
Pig feed production was down globally in 2022 by almost 3%. ASF and high feed prices depressed pig production in many countries. However, in Vietnam, China, South Africa, Brazil and Mexico, better pork prices and other market conditions led to growth in the sector.
Many regions reported that geopolitical tensions, particularly the invasion of Ukraine, have affected imports and exports, the supply chain and raw materials prices.
Dairy feed tonnage decreased by 1.32%, mainly due to the high feed cost combined with low milk prices, which caused farmers to reduce their numbers of cows and/or rely more on non-commercial feed sources.
Beef feed production decreased slightly by 0.34% globally. The downward trend continued in Europe, but increases were seen in almost all other regions.
Table 1. Feed production in million tonnes by sector in 2022 and % growth from 2021.

Pet feed production had the highest increase among the different sectors, with a global average 7.25% rise in production. This significant increase is largely due to the rise in pet ownership during the pandemic.
The aquaculture sector experienced a total global feed production growth of 2.7%. The top five aquafeed countries are China, Vietnam, India, Norway and Indonesia. Significant increases were reported in China, Brazil, Ecuador, the Philippines and the U.S. aquafeed production was one of a few sectors that saw growth in Europe.
Africa: Aquafeed production was down 2.38% in 2022, although increases were reported in South Africa, Zimbabwe, Zambia, Ghana and Seychelles.
Europe: Aquafeed feed tonnage grew by 1.78%.
Latin America: 2022 was a record year for shrimp feed production in Ecuador. It had a 17% increase in feed tonnage.
Middle East: A slight growth was reported, where all countries had feed volumes increasing or staying at the same level as 2021.
North America: Aquafeed production was up 2% (0.02 million tonnes) due to increased fish prices, favourable weather conditions.
Oceania: Australia’s aquafeed production was up by 11% in 2022.
China reported a 10% (2 million tonnes) increase in aquafeed volumes. With the recovery of China’s economy and improvements in living standards in recent years, the demand for aquatic products has been increasing. The scale of the region’s aquaculture industry expanded in 2022. There was also growth in feed production in the Philippines, Bangladesh, South Korea, Malaysia and others.
Knowing the hidden threat of mycotoxins in aquafeeds and tools to assess functional ingredients improves production efficiency
In November 2022, DSM Animal Nutrition Asia Pacific organised its 27th DSM Aqua Conference as an in-person meeting in Bangkok, Thailand. The theme was “Adapt to Pivot”.
The program had six presentations from industry experts discussing some of the hot topics faced by the industry. The report in issue January/February (page 43-46), covered four of these. In this issue, we continue this conference report with two presentations covering mycotoxins in aquaculture and tools to assess functional ingredients.
Dr Rui A. Gonçalves has studied the occurrences of mycotoxins in plant meals used in aquafeeds and in his presentation titled, “Mycotoxins in Asian aquaculture: A hidden threat in Southeast Asian aquaculture”, he provided some data on occurrences of mycotoxins, mainly aflatoxin (AF), zearalenone (ZEN), deoxynivalenol (DON), fumonisins (FUM), ochratoxin A (OTA) and trichothecenes (T-2). Mycotoxins in ingredients and finished feeds have been surveyed on a yearly basis since 2020 (see pages 50-53).
The contamination chain is from crops and grains to feeds; from harvesting to distribution, it moves along the transportation process and storage in the feedmill. High water activity plays a big role in mycotoxin contamination in grains and mycotoxins at harvest will be transferred into feeds. Storage mycotoxins are derived from Aspergillus spp and Penicillin spp.
Gonçalves explained the results of the 2015 survey of 2,176 samples of plant meals used for aquafeeds in Southeast Asia and pointed out that cottonseed meal is well known to have high levels of aflatoxin (~2,500µg/kg or ppb), corn gluten meal had high levels of deoxynivalenol and fumonisins at more than 2,000ppb while wheat bran had around 1,660ppb of deoxynivalenol . Most fungi can produce more than one mycotoxin and the co-occurrence of mycotoxins was demonstrated in a 2016 survey covering 18 mycotoxins.
“Only a few meals, wheat flour and soybean cake, were contaminated with only one mycotoxin. Many others have co-occurrence of 2-6 mycotoxins such as wheat bran with zearalenone, deoxynivalenol and fumonisins. There was co-occurrence of 7-8 mycotoxins in corn dust, cotton gluten and DDGS,” said Gonçalves.
A survey in 2021-2022 showed mycotoxin occurrences specific to the Asian region. Deoxynivalenol contamination was high in 15 samples of cotton seed meal at 1,410ppb. The mean value for fumonisins in 60 corn samples was 1,373ppb but the highest level was as high as 9,000ppb. The contamination of fumonisins was also high in finished feed at 498ppb.
The answer is “maybe”. In Asian aquaculture there are almost 424 cultured species, according to FAO data. The results on contamination in plant meals used in
aquafeeds (fish and shrimp feeds) were compared to data available in published literature on contamination levels affecting rainbow trout, pacific white shrimp, carp and red tilapia in the case of deoxynivalenol. In Asian aquafeeds, aflatoxin contamination was close to 221ppb while contamination by fumonisins was up to 573ppb. Published research on mycotoxin contamination in Pacific white shrimp, black tiger shrimp, rainbow trout, Nile tilapia and carp showed contamination of aflatoxin to be as high as 2,500ppb in Nile tilapia and black tiger shrimp and with fumonisins at 5000ppb in carp and 150ppb in Nile tilapia fingerlings.
“Factors such as age, as well as nutritional and health status, rearing density and environmental conditions of animal tested influenced outcome of trials leading to variable sensitivity. It is difficult to estimate the risk that these concentrations have on aquaculture species, as most published studies investigating the effect of mycotoxins in aquaculture species tested contamination at unrealistically high levels to be present in aquafeeds. For industry use, it does not make any sense,” said Gonçalves.
“In risk mitigation, steps should be consciously taken based on indicators, to counter, in advance, the effects of mycotoxins in the aquaculture industry. One size-fits all solutions is not advisable.”
says Rui A. Gonçalves.
Evaluating mycotoxin contamination is not a common practice since clinical signs on their effects in specific species have not been well investigated. Unlike in livestock where there are specific clinical signs for each mycotoxin, in aquaculture species, clinical signs are generally inexistent or subclinical.
Mycotoxin contamination could represent a hidden problem which can lead to increased disease susceptibility and poor performance. There is the general effect of suppression of feed intake but then, it was pointed out, many adverse conditions affect feed intake. A common reported impact has been in liver and gut health which are associated with immunosuppression. Gonçalves noted, “Clinical signs are generally misleading or easily associated with other pathogens.”
Some clinical signs for specific mycotoxins were discussed. Fumonisins contamination is common in corn and the target organs are liver, kidney and the brain. A reduction in weight gain and lesions in the mouth occurred in carp fed with 500ppb fumonisins, according to Petrinec et al. (2004). A synergistic effect with aflatoxin B1 (AFB 1 ) has been well established.
Aquaculture businesses are faced with rising feed costs, which could reduce their profitability. Feed enzymes can help protect your profits by enabling cost optimization and formula flexibility, as well as maximizing shrimp and fish performance.
If

Gonçalves demonstrated how clinical signs can be misleading with his studies on rainbow trout fed diets contaminated with deoxynivalenol. In the shortterm exposure study, fish were fed a high dosage of deoxynivalenol at 800-5,000ppb for less than 60 days and in the long term exposure, the dosage was low at less than 500ppb deoxynivalenol over 150 days. “The
results did not show skin lesions and only showed that growth and feed intake were affected especially in the short term study. At the end of 150 days, there was a significant difference in growth. As these are also common clinical signs for Yersinia ruckeri infections, we tested fish and confirmed negative results for this bacteria.”
Aflatoxin B1 is a strong immunosuppressor, affecting growth and feed efficiency. It is also most toxic. Similar to fumonisins, aflatoxins targets the liver and kidney. Effects on Nile tilapia and pangasius catfish were discussed. “There is the residue (carry over effects) and we show that just 5ppb aflatoxin can affect shrimp moulting and growth and this level is present in almost all aquafeeds,” said Gonçalves.

There are reports on how contaminated feeds can affect product quality of fish and shrimp. “In China, yellow catfish was fed 0, 44 and 234ppb aflatoxin B1 in feeds. The feeds with 44 and 234ppb AFB1 did not inhibit growth but reduced protein content and the phospholipids/ triglycerides (PL/TG) ratio in flesh and significantly changed the characteristics of the myofibres (diameter, number and area). This impaired the nutritional value, flavour and sensory quality of fish flesh. If there has been no effect on growth, the fish will pass through the whole production cycle.”


In China, shrimp fed 10% of LD50 of trichothecenes, deoxynivalenol, alflatoxin B1 and ochratoxin A led to impaired shrimp quality. The aim was not to suppress growth but just to observe the impacts on quality. The effect was poor muscle colour and tender texture and more lipid peroxidation and pH change. The higher K-value and total volatile basic nitrogen (TVB-N) decreased freshness of shrimp and therefore, its
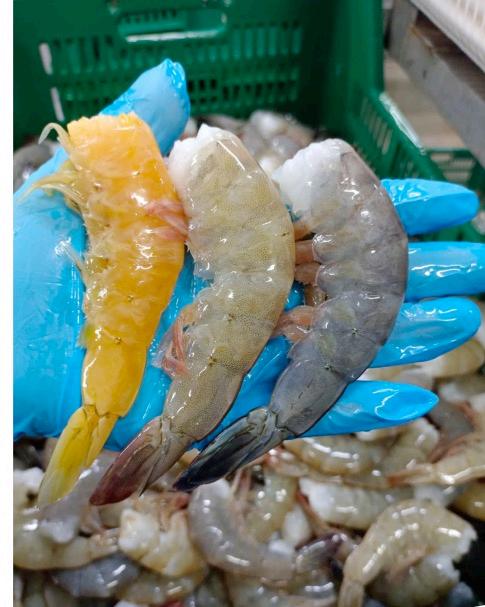
life.
ratio in flesh
In this final part of the presentation, Gonçalves emphasised on the need to understand the kind of mycotoxins and the different effects on the species, and then the importance to develop a risk mitigation plan. The steps are outlined in Figure 3. In risk assessment, we need to identify the critical control points, analyse the good and bad storage practices and understand the hotspots. The uneven distribution of mycotoxins may lead to severe sampling errors. The advice was to be careful with exceptions such as cotton seed meal and peanut meal.
Risk identification means that a different risk management protocol will be required for different mycotoxins. Risk analysis includes the maximum level of contamination which the feed miller can accept and possible use of products to reduce the contamination level. This includes referring to peer review information and experience from experts. In aquaculture, the challenge is the lack of specific guidance or legislation and that the absence of clear clinical signs may give misleading signals.
“The presence of good records at the farm level will help to diagnose an asymptomatic mycotoxin problem while at the feedmill, a good record of certified suppliers will help to diagnose the source of mycotoxin contamination. In risk mitigation, steps should be consciously taken based on indicators, to counter, in advance, the effects of mycotoxins in the aquaculture industry. One sizefits all solutions is not advisable.”
In her preamble, Dr Viviane Verlhac-Trichet , Associate Professor in Aquaculture Nutrition at the Faculty of Biosciences and Aquaculture (FBA) of Nord University, Norway, said that both novelty and creativity are priorities in aquaculture especially when it comes to producing aquafeeds. “Expectations are high for novel ingredients in aquaculture given the different species being farmed, their accessibility and ability to satisfy nutrition, feed intake and health needs. That is a lot to demand from any single ingredient.”
However, opportunities abound with aquaculture, with its potential role in feeding the world in 2050 and new species development. Her presentation focused on new tools to assess nutritional and functional ingredients which, for a large part, have been results of studies undertaken by research groups in aquaculture, algae and microbiome and genomics at FBA.
As Verlhac-Trichet said, “Optimal growth is based on three pillars: feed intake which guarantees the quality of the feed and its digestion by the animal; nutrition ensuring all macro and micro nutrient requirements are optimised and there is the health pillar which is always challenging but so important to ensure good growth, low mortality and low stress. Nutritional and functional ingredients should be evaluated on this basis, not necessarily all three, or not to the same extent. The presentation aimed also at highlighting the priorities when testing a new ingredient with nutritional value, e.g. as an alternative source of protein, versus a new functional ingredient targeting immunomodulatory or anti-inflammatory effect.”
Nutritional ingredients can be divided into macronutrients such as marine, animal and plant meals and their alternatives. Functional ingredients are mainly extracted or purified from nutritional ingredients (beta glucans, carotenoids, pre-and probiotics etc.). Multifunctional ingredients are either naturally producing bioactives or modified to produce bioactives (micro and macro algae, yeast, copepods and krill). Verlhac-Trichet made the distinction between nutritional and functional ingredients and discussed the tools or techniques or parameters which could be more adequate to assess for one or the others.
Classical versus new tools
Regarding nutritional ingredient assessment, besides their complete characterisation, most important is feed intake which is linked to correct feed formulation, adequate feed processing and good feed quality. Feed palatability is also very important and a new tool to assess feed intake is taste Then come the classical studies which are absolutely important in nutritional assessments (zootechnical, growth, digestibility, absorption, protein retention etc.)
When considering new ways to evaluate an ingredient, many studies target the impact on “gut health”. VerlhacTrichet distinction between “gastrointestinal functionality” which is related to nutrition and “gut health”. Studies on gut microbiome are coming up too with interesting findings relating to health management and to nutrition.”
Using examples of feed intake studies, Verlhac-Trichet discussed some findings on impacts of palatability, attractability (in the case of shrimp) and taste. In a study with Atlantic salmon fed different inclusions of Nannochloropsis , feed intake (percent of body weight) increased with higher inclusion rate but so did the feed conversion ratio (FCR). However, such effect was not visible on growth (Sørensen et al. 2017). “It is often that the impact of growth is not seen in experimental trials.”
In a tilapia study (Levina et al. 2020), the palatability index was established based on amino acids and compared to the species specific requirements. Yuan et al. (2021) assessed fishmeal, fish protein hydrolysate, squid meal and casein at the same dietary level for their relative influence on feed intake rates of Litopenaeus vannamei . This showed the efficiency of a classical method to estimate attractability (Figure 1). Advances in the understanding of feed intake now include the involvement of taste receptors in the perception of nutrients.
In the Nannochloropsis study (Sørensen et al. 2017), apparent digestibility coefficient (ADC) of protein, lipid and energy values were good, but although feed intake increased, retention of protein was low. According to Verlhac-Trichet, “Body analysis is often not sufficient to detect differences between ingredients. While feed intake was different between treatments and protein digestibility was high, protein retention was low. Digestibility is a snapshot of the situation while retention is a long-term view.”
Flesh quality is important when sourcing a new ingredient. Muscle cellularity, fatty acids and body composition are useful. Verlhac-Trichet reminded that histology is time consuming but reveals a lot especially when combined with conventional nutritional assessments.
Optimal gastrointestinal functionality leads to the optimisation of feed utilisation, digestion and absorption processes and feed waste reduction and the lowering of potential inflammation. This stresses the importance of studies on gastrointestinal functionality.
FBA and DSM have collaborated to develop a model on soybean-induced inflammation (Kiron et al. 2021). Atlantic salmon were fed diets with 5% full fat soybean meal and 2% saponins. Intestinal transcriptome analysis revealed changes derived from soybean inclusion, leading to the clustering of the control and soybean diet fish groups by principal component analysis.
Flesh quality is important when sourcing a new ingredient. Muscle cellularity, fatty acids and body composition are useful. Verlhac-Trichet reminded that histology is time consuming but reveals a lot especially when combined with conventional nutritional assessments.
Intensive aquaculture puts a lot of pressure on gastrointestinal functionality to achieve low FCRs and high weight gain. Potential dysbiosis can occur due to stress, inflammation, inadequate nutrition, unbalanced feed or a novel ingredient. Consequences could be important on performance, welfare and production cost optimisation.
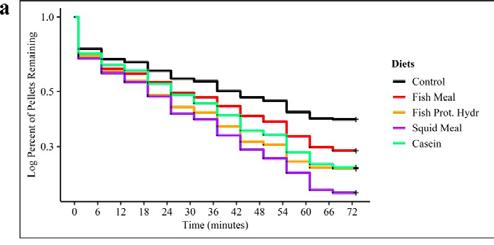
Intensive aquaculture puts a lot of pressure on gastrointestinal functionality to achieve low FCRs and high weight gain. Potential dysbiosis can occur due to stress, inflammation,
The assessment criteria should preferably be aligned to the targets set for the functional ingredients: improvement of overall health, welfare status and improved gastrointestinal functionality which involves reducing gut inflammation, gut structure and oxidative stress.
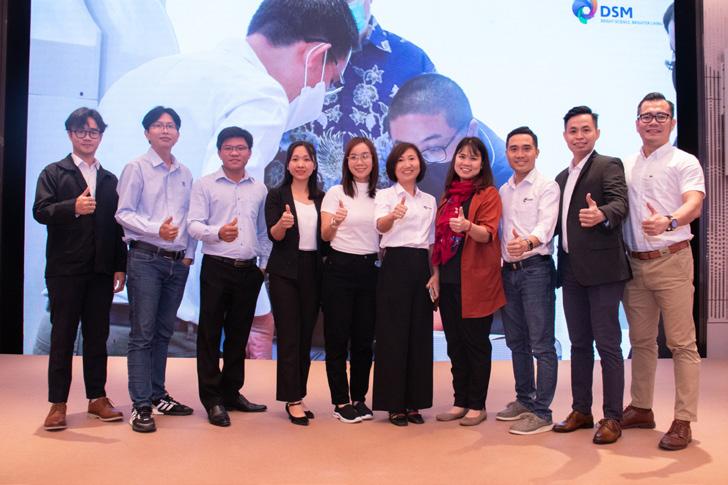
The work of Sørensen et al. (2021) where Atlantic salmon was fed various combinations of marine and plant meals and oils, attempted to correlate intestine histomorphology and macronutrient ADC. In the case of soybean meal diet, lower lipid digestibility was observed and this is reflected in the histological data. (Figure 2).
Viviane Verlhac-Trichet reminded that histology is time consuming but reveals a lot especially when combined with conventional nutritional assessments.
“When we want to assess the impact of a functional ingredient in fish or shrimp, we always wonder what should we assess because innate immunity is most important. In fish, epithelial barriers are the first response to infections, thus highlighting the importance of gut health,” said VerlhacTrichet, adding, that in fish, the time for developing innate immunity are hours to days while adaptive immunity with antibody production takes longer (days to weeks). In shrimp, it is more difficult with only innate immunity, molecular pattern recognition receptors and reactive oxygen species.
New tools to assess immune response include individual cell analysis using flow cytometry coupled with image analysis of cells. The intestinal inflammation model described earlier showed changes in intestinal cell populations and phagocytic activity in salmon, fed soybean and control diets, after eight weeks of feeding trial (Park, 2021, PhD thesis).

ingredients. Verlhac-Trichet stressed the importance of performing integrative studies which combine classical and omics methods.
inadequate nutrition, unbalanced feed or a novel ingredient. Consequences could be important on performance, welfare and production cost optimisation.
How morphometric techniques can be used to calculate the cell proliferation index (CPI) of The distal intestine was discussed using an example of Atlantic salmon fed plant-based diets. (Gong et al. 2020). VerlhacTrichet showed the impact of a probiotic on gut health, by evaluating several parameters such as goblet cell density, vacuolisation, enterocytes and gut villi structural components.
inadequate nutrition, unbalanced feed or a novel ingredient. Consequences could be important on performance, welfare and production cost optimisation.
“It is important to understand the value and cost when considering these methods. The intestinal inflammation model developed at FBA in collaboration with DSM was also used to evaluate the potential of a health premix (Kiron et al. 2022) employing proteomics, when demonstrating the different processes of the health premix effects (reduced inflammation and less altered proteins in intestinal mucus of fish receiving the health premix). ”

The work of Sørensen et al. (2021) where Atlantic salmon was fed various combinations of marine and plant meals and oils, attempted to correlate intestine histomorphology and macronutrient ADC. In the case of soybean meal diet, lower lipid digestibility was observed and this is reflected in the histological data. (Figure 2).
There is the microbiome dynamics in the gut; with different examples using functional ingredients (oligosaccharides, probiotics), it can be demonstrated that the bacterial community can be shifted. This demonstrates the range of possibilities offered by microbiome studies to assess health. “There is a lot of developmental work being done in this area. Diets clearly have an impact on the microbiome and this could be used as a tool to select ingredients”.
The work of Sørensen et al. (2021) where Atlantic salmon was fed various combinations of marine and plant meals and oils, attempted to correlate intestine histomorphology and macronutrient ADC. In the case of soybean meal diet, lower lipid digestibility was observed and this is reflected in the histological data. (Figure 2).
Finally, Verlhac-Trichet summarised the different models used for functional ingredient evaluation developed at FBA and elsewhere. The in vivo models included intestinal inflammation model, wound healing model and zebrafish model. The in vitro models include the different approaches to investigate gastrointestinal functionality (salmon intestinal model SalmoSin, intestinal cell line, Ussing chambers, etc).
Optimal gastrointestinal functionality leads to the optimisation of feed utilisation, digestion and absorption processes and feed waste reduction and the lowering of potential inflammation. This stresses the importance of studies on gastrointestinal functionality.
Omics (genomics, transcriptomics, proteomics and metabolomics) are advanced tools that can be very valuable in understanding action mechanisms of functional
Fishmeal
Plant meal
Plant oil
Optimal gastrointestinal functionality leads to the optimisation of feed utilisation, digestion and absorption processes and feed waste reduction and the lowering of potential inflammation. This stresses the importance of studies on gastrointestinal functionality.
Histomorphology of distal intestine of salmon fed marine and plant ingredients (Sørensen et al. 2021)
Histomorphology of distal intestine of salmon fed marine and plant ingredients (Sørensen et al. 2021)
Histomorphology of distal intestine of salmon fed marine and plant ingredients (Sørensen et al. 2021)
ADC.
Figure 2. Gastrointestinal functionality in Atlantic salmon fed diet combinations of marine and plant meals and oils: attempt to correlate histomorphology and ADC. Sørensen et al. (2021).
Extreme risk of contamination and co-occurrence of major mycotoxins in South Asia and China and a 95% prevalence of fumonisins in Asian corn
This report is from the DSM World Mycotoxin Survey: Impact 2023, presented by the DSM Animal Health & Nutrition and Romer Labs team at a webinar on January 17.
Started in 2004, this is the longest-running mycotoxin survey. The comprehensive dataset allows the company to look at variations in contamination levels over the years. The ten-year trend in contamination of all commodities as well as finished feed was described as stable on a global basis.
Prevalence of the Fusarium mycotoxins , deoxynivalenol, fumonisins, trichothecenes and zearalenone varied between years at >50% and up to 74% of samples. The yearly average of positive concentration levels shows more variation with some peaks. The prevalence of aflatoxins and ochratoxin was relatively stable. Aflatoxin concentrations varied widely, with peak values in 2014, 2017 and 2020. While there was a high variation with different raw materials in other regions or subregions, there was a consistent presence of mycotoxins in animal feeds and feed ingredients (https://www.dsm.com/ anh/news/events/dsm-world-mycotoxin-surveyimpact-2023.html).
The Mycotoxin Risk Management team at DSM Animal Nutrition & Health comprising Anneliese Mueller PhD, Product Manager and Bettina Behler-Wöchtl PhD, Global Product Manager, began the webinar with the statement that 2022 was a very challenging year for mycotoxins in raw materials. The supply chain dynamics and the war in Ukraine put pressure on producers by increasing prices of feed raw materials and energy. All these contributed to higher costs for producers.
program and to contribute knowledge of alternatives and byproducts; we have a special focus on this in this 2022 survey,” said Mueller.
In 2022, the survey covered 27,279 samples and 122,240 analyses were conducted to detect six main mycotoxins in raw materials and finished feeds from 87 countries. Analyses were performed using ELISA, HPLC and LCMS-MS, measuring several mycotoxins in one run.
Mueller reported that based on worldwide samples, 57% showed the prevalence of more than one mycotoxin. Cooccurrence is high and leads to additive and synergistic effects, negatively affecting animal health. “Although we do not know much about the effects in ruminants and aquatic species, some studies show increasing detrimental effects due to the combination of mycotoxins in poultry, swine and fish. Over the years, we see that co-occurrence is the rule, not the exception.”
Figure 2. Overview of mycotoxin prevalence in 2022. The boxes show the prevalence of the six major mycotoxins by region. The colours signify the overall risks for all samples in the regions. For example, yellow means that the risk is moderate, orange is high risk and reaching extreme risk is red. (Note: Afla = aflatoxin; ZEN = zearalenone; DON = deoxynivalenol; T2 = trichothecenes; FUM = fumonisins; OTA = ochratoxin A).
Figure 1 shows extreme risks in South Asia, China and Taiwan. In Southeast Asia and East Asia, the risk is severe. Mueller explained how they decide on the risk level from samples in the region. “If less than 25% of samples contain at least one mycotoxin in concentrations above the respective risk threshold, the risk level is moderate and indicated as yellow. Extreme risk is red if more than 75% of the samples contain at least one mycotoxin exceeding the respective risk threshold. Risk threshold are based worldwide experience, feed trials, scientific publications, trials and regulations. Concentrations exceeding these levels can already negatively impact animal health.”
Mueller reported that based on worldwide samples, 57% showed the prevalence of more than one mycotoxin. Co-occurrence is high and leads to additive and synergistic effects, negatively affecting animal health. “Although we do not know much about the effects in ruminants and aquatic species, some studies show increasing detrimental effects due to the combination of mycotoxins in poultry, swine and fish. Over the years, we see that cooccurrence is the rule, not the exception.”
“This also affected mycotoxin risk management as some producers opted to use cheaper products, which led to the buildup of mycotoxin contamination. It is important to include all materials into the mycotoxin risk management
Behler-Wöchtl reported on the situation in this region. India, Pakistan, Sri Lanka, South Asia and China are at extreme risk for mycotoxin exposure, as reported in 2021. The prevalence of all major mycotoxins increased in 2022 compared to 2021. Only deoxynivalenol was slightly lower at 70%, compared to 2021 (73%, Figure 2).
Figure 1. Prevalence of mycotoxins in Asia and Oceania. The colours signify the overall risks for all the samples; yellow means that the risk is moderate, orange is high risk and reaching extreme risk is red. (Note: Afla = aflatoxin; ZEN = zearalenone; DON = deoxynivalenol; T2 = trichothecenes; FUM = fumonisins; OTA = ochratoxin A).

more than 75% of the samples The risk threshold is based on animal species, worldwide experience, feed trials, scientific publications, trials and regulations. Concentrations exceeding these levels can negatively impact animal health.”
Figure 2. Survey findings on mycotoxin prevalence in Asia and risk levels according to species in 2022. Coloured animals indicate the risk posed to this species by the prevalence and concentration of each mycotoxin in all samples from this region (yellow = moderate to red = extreme). % Contaminated samples, January – December 2022, January – December 2021.
Figure 4 Survey findings on mycotoxin prevalence in Asia and risk levels according to species in 2022. Coloured animals indicate the risk posed to this species by the prevalence and concentration of each mycotoxin in all samples from this region (yellow = moderate to red = extreme). % Contaminated samples, January – December 2022, January – December 2021.
*Cereals include: wheat grain, barley, rye, oats, rice grain, sorghum, millet.
Asian corn showed high co-contamination. Some 95% of Asian corn was contaminated with fumonisins (Figure 2, Table 1). “Co-contamination is of special importance as the risk for health and animal performance is multiplied by toxin scenarios. Asian corn kernels have a high prevalence of fumonisins, deoxynivalenol and zearalenone, where 94% are contaminated with two major mycotoxins.” She added that as was also
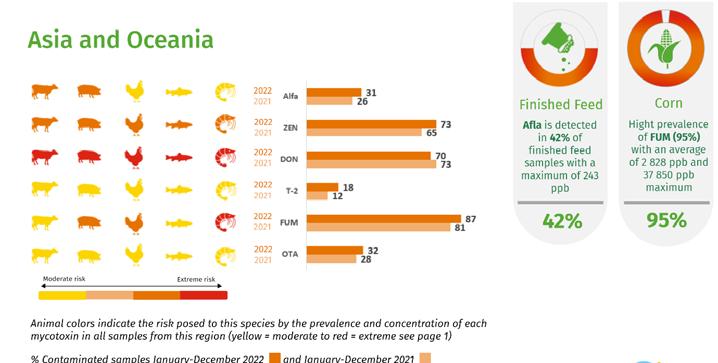
shown in scientific literature and compared to other raw materials, deoxynivalenol, zearalenone, trichothecenes, fumonisins and ochratoxin are elevated in distillers dried grains with solubles (DDGS). There is a high average contamination level of deoxynivalenol, zearalenone and fumonisins in DDGS in Asia (Figure 3). Aflatoxin levels must be considered as harmful too.
-
“One limitation of lateral flow devices is that they cannot be used to assess finished feeds or silages. Therefore, we recommend testing finished feeds with at least an LC-MS.”
- Nora Kogelnik


“Over the years, we see that co-occurrence is the rule, not the exception.”
- Anneliese Mueller
“Co-contamination is of special importance as the risk for health and animal performance is multiplied by toxin scenarios.”
Bettina Behler-Wöchtl
In finished feed samples in China, India and Indonesia, Behler-Wöchtl reported the following:
In finished feed samples in China, India and Indonesia, Behler-Wöchtl reported the following:
In Indonesia , fumonisins were detected in 100% of samples, followed by zearalenone and aflatoxin. The aflatoxin levels exceed the EU regulation. The maximum level is extreme at 243ppb. Some 98% of samples are co-contaminated with at least two of the six major mycotoxins.
“In the case of China, we matched the results from corn and corn-derived raw materials with finished feeds. Zearalenone, deoxynivalenol and fumonisins were found in nearly every sample tested. All samples (100%) have at least two mycotoxins. Although aflatoxin was found less frequently, individual samples contained high toxin levels. The same can be said for trichothecenes,” said Behler-Wöchtl.
In the case of China , results from corn and corn-derived raw materials match with results of the finished feed samples. Zearalenone, deoxynivalenol and fumonisins were found in nearly every sample tested. All samples (100%) have at least two mycotoxins. Although aflatoxin was found less frequently, individual samples contained high toxin levels. The same can be said for trichothecenes,”. said Behler-Wöchtl.
The situation in India was different compared to China. Prevalence of deoxynivalenol and fumonisins was lower compared to China, but the average contamination with both of these mycotoxins was higher. The risk in India is contamination with aflatoxin at 98% and values over 27ppb, which exceeds the European Union (EU) regulation. The danger here is the carry-over effect in foodstuffs and, in the case of livestock, via milk.
Looking at the 10-year trend (2003-2022), BehlerWöchtl said that data with Asian corn showed that over the years, there had been more fluctuations (in terms of samples) with aflatoxin contaminations. There is an upward trend in A-trichothecenes (T-2 toxin) and ochratoxin A in Asia (Figure 4). Poultry is particularly susceptible to trichothecenes with mouth and tongue lesions.
Major Mycotoxins Asia Corn – Trends 2013 to 2022
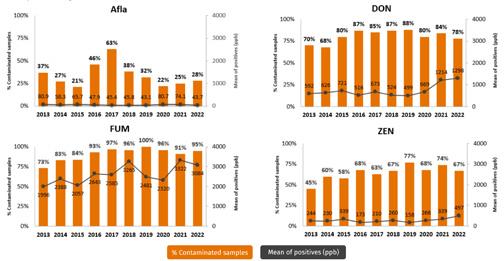


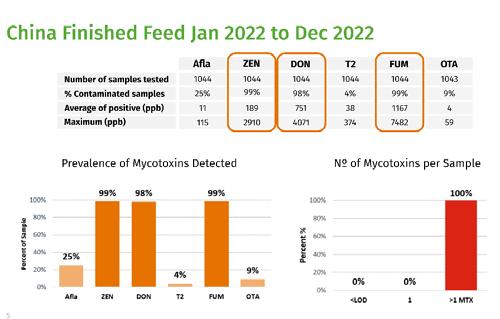
Figure 4. Trends in contamination of major mycotoxins in Asian corn for aflatoxin (Afla), deoxynivalenol (DON), fumonisins (FUM) and zearalenone (ZEN), T-2 toxin (T2) and ochratoxin A (OTA) for 2013-2022
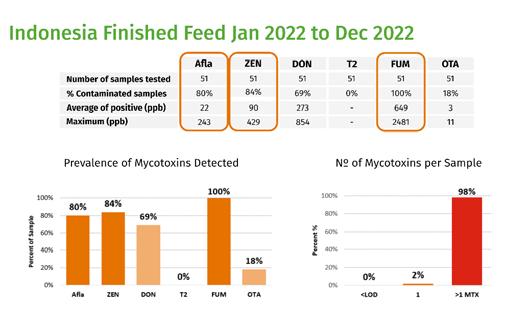
Asian soybean was most frequently contaminated with zearalenone at 72% (Figure 5). Other mycotoxins were aflatoxins, deoxynivalenol and fumonisins, although at slightly lower levels. Some 69% of samples had co-occurrence of more than one mycotoxin. BehlerWöchtl said, “We should not underestimate soybean as a potential source of mycotoxins.”
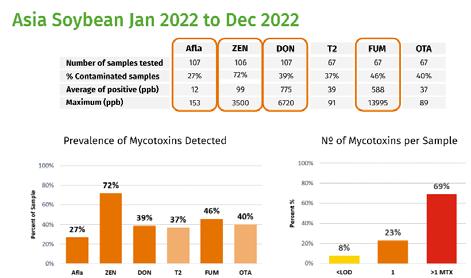
In the case of Asian wheat bran, the average contamination levels of zearalenone and deoxynivalenol were high. The maximum level of zearalenone at 7,885ppb was extremely high (Figure 6).
The discussion moved on to diagnostics and Dr Nora Kogelnik, Product Manager at Romer Labs, explained the reasons for the growing popularity of rapid tests. “These are now the go-to method in risk management as they can deliver results easily, quickly and at low cost. Lateral flow devices allow for rapid on-site testing for aflatoxins, deoxynivalenol, zearalenone and fumonisins of a wide range of feed ingredient samples and deliver results in under ten minutes and can be used by everybody.”
However, while there are advantages, there are some limitations as well. “They deliver fast and do not need laboratory equipment or intensive training. Additionally, the extraction of the mycotoxin now uses water or buffer and reduces the need for organic solvents, which minimises their disposal. Furthermore, there is no need to send samples to a laboratory.
“One limitation of lateral flow devices is that they cannot be used to assess finished feeds or silages. They give no structural information. This is because the different components in the matrix affect the flow in different ways and the accuracy of results.” Kogelnik detailed how feed formulation affects the matrix and the analysis of the analyte, which is the mycotoxin. “Therefore, we recommend testing finished feeds with at least an LC-MS.”
These are frequently found in agricultural commodities, but their toxicity is still under investigation. The European Food Safety Authority has began risk management on some emerging mycotoxins. Masked mycotoxins are socalled because conventional analysis methods cannot detect them. These are formed when sugar molecules are added to mycotoxins as a plant-defense mechanism, forming compounds such as DON-glucoside. When the animal consumes the contaminated feed, the sugar is cleaved, releasing the mycotoxin and increasing its bioavailability. Mueller explained the concern with the presence of these mycotoxins on feeds and food safety.
Due to the high price of raw materials, there are moves to use byproducts and protein alternatives in feeds. However, these are ingredients with less data with regard to mycotoxin contamination. Mueller cited raw materials such as wheat bran, wheat gluten, brewery products, peanut meal, cotton, rice bran, palm kernel, coconut, etc.
DSM’s Spectrum Top®50 was used to analyse multimycotoxins for wheat byproducts and protein sources. Data included emerging and masked mycotoxins. In 300 samples of several byproducts from wheat milling (wheat bran, wheat middlings and wheat feed), the contamination level was high (84%) with deoxynivalenol and the presence of ergot alkaloids in these samples. In screening 60 samples of protein sources (peas, lupins, beans and chickpeas), the contamination levels were moderate and the prevalence of masked mycotoxins were low.
In mycotoxin management, Mueller discussed predictive tools and solutions on mycotoxin management from DSM, such as the 5th generation Mycofix. The predictive tools were developed with several universities considering critical information such as plant growth, crop data and detailed weather forecasts. “This tool helps our customers to consider mycotoxin risk management in advance and make informed decisions. More on the survey at www. dsm.com/anh.

More outbreaks of WSSV, AHPND and WFS/EHP were reported, linked to adverse climate conditions
By Zuridah MericanThe estimates on global production of farmed marine shrimp for 2022 are around 5.5 million tonnes, comprising vannamei and black tiger shrimp by the GOAL survey (see pages 60-61). Asia contributed more than 3.5 million tonnes. In January 2023, the Shrimp Panel at the Global Seafood Marketing Conference (GSMC) estimated 4.973 million tonnes of vannamei shrimp with Asia contributing 2.955 million tonnes.
Up to November 2022, the US imported less shrimp at 779,725 tonnes compared to the same period in 2021 at 808,534 tonnes. Seafoodsource.com reported that in the second half of 2022, monthly imports were lower compared to those in the previous year. National Marine Fisheries Service (NMFS) data indicated less imports from India (-9%), Indonesia (-2%), Vietnam (-14%) and China (-35%).
The expectation is that 2023 will be a difficult year following the lower stocking rates of the last quarter; the second half of the year will depend on shrimp price movement and the world economy both of which will affect the purchasing power and hence consumption. It is expected that countries with domestic consumption will be less affected than those dependent on exports (GSMC, 2023).
With regards to global production in 2023, the GSMC shrimp panel forecasted a 1% decrease to 4.870 million
tonnes. According to Nikolik and Sharma (2022), industry remains optimistic on supply in 2023 with growth in supply and recovery in Chinese production. Asia’s contribution will increase 4% to 4 million tonnes in 2023. Meanwhile industry in Ecuador expects exports of 1.02 million tonnes from a production of 1.4 million tonnes in 2023.
In the following paragraphs, we discuss recent developments in Asia’s shrimp aquaculture industry, based on information from industry, presentations at recent conferences and news reports.
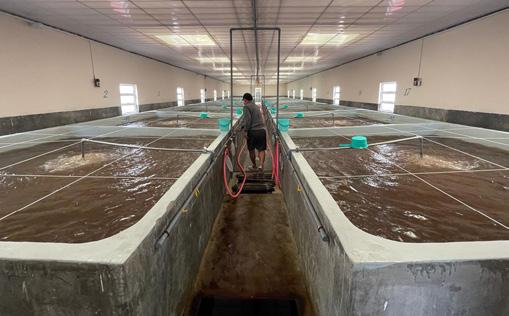
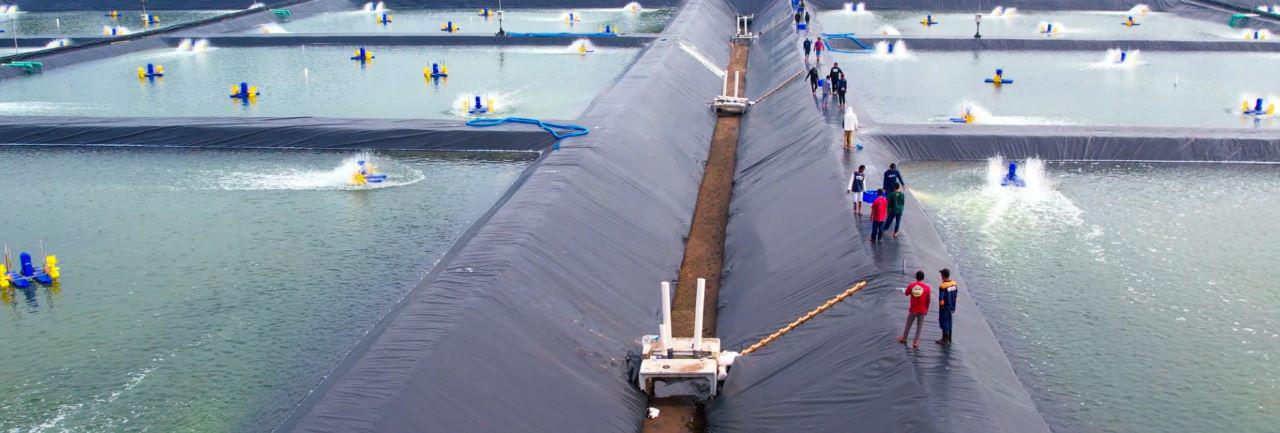
2023
Table 1. Some industry estimates (tonnes) of farmed shrimp production in major countries in Asia. DOF- Department of Fisheries, Thailand; SAP - Society of Aquaculture Professionals, India; GSMC 2023 -Global Seafood Marketing Conference, 15 -19 January 2023, Palm Springs, California, USA; SCI- Shrimp Club Indonesia; Manoj Sharma, Mayank Aquaculture, India; Philippines Statistics Authority.

TARS 2023
is an in-person event.
Networking & Engagement Opportunities!
The Asian shrimp aquaculture industry is stagnating. While supply from Latin America increases, demand from the global market faces headwinds from inflation and a looming recession. High costs of production are erasing margins and affecting all along the supply chain. A key challenge is the lack of efficiency from poor survival rates but there is a larger systemic risk.
Evolving is not enough. The industry in Asia needs a regeneration and the responsibility falls on all stakeholders. TARS 2023 Shrimp Aquaculture: Regeneration will be the platform for brainstorming the way forward.
40 SPEAKERS & INDUSTRY PANELLISTS
• State of the Industry, Challenges and Growth in Indonesia
• A Good Start with Genetics, Hatchery and Nursery
• Precision Shrimp Nutrition and Feed Efficiency
• Revolutionising Shrimp Farming in Asia
• Processing, Branding and Marketing


• Future Proofing Asia’s Shrimp Aquaculture
INDUSTRY DIALOGUE WITH NEXT GENERATION PLAYERS
What is holding Shrimp Aquaculture back?
CEOs
• CTOs
• Geneticists
HARD TALK WITH BUSINESS LEADERS
What does it take to produce Sustainable Asian Shrimp?
• Farm and Hatchery


• Interactive Sessions
• Panel Discussions
• Q&A and More!
3 INTERACTIVE BREAKOUT ROUNDTABLE SESSIONS
Developing Traceability along the Supply Chain
Managers & Technicians
• Integrators
• Feed and Feed Additive Producers
• Nutritionists
• Processors
• Technologists

• Suppliers
• Marketeers
• Startups
The Aquaculture Roundtable Series® (TARS) is designed as a series of roundtable sessions aimed at bringing together all relevant stakeholders to discuss the state of Asian aquaculture, and provide a strategic direction forward to ensure the long-term sustainability of the industry.
• Innovators
• NGOs
• Investors
• Academia
• Governments
• Researchers
Organisers: Supported by: Sponsors:
For more information, email: conference@tarsaquaculture.com or visit www.tarsaquaculture.com
Follow us on |
India is now Asia’s leader in farmed shrimp. In their annual shrimp crop review, the Society of Aquaculture Professionals (SAP) estimated a marginal 3% drop in total production to 902,525 tonnes for 2022 (see pages 4-6). However, this contrasted with earlier estimates that the 2022 production will be down by 20-30%.
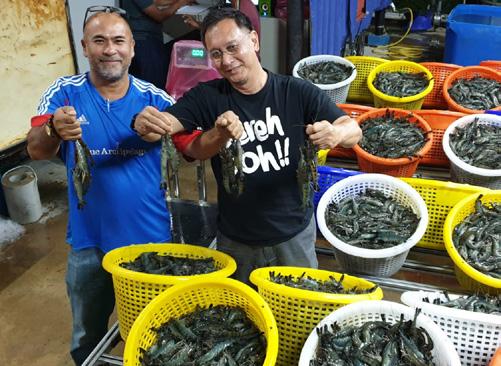
In his blog, Willem van der Pijl, Shrimp Insights, said that the industry in India has been facing “extraordinary low farm gate prices and high input costs”. As broodstock imports and shrimp exports plummeted in October and November, a decrease may happen in the first quarter of 2023. Seafoodsource.com said that the situation has discouraged farmers from stocking their ponds, with many considering leaving them fallow until April 2023.
Around 40% of Indian shrimp goes to the US market and China is its biggest market after the US. The preferred harvest size for vannamei shrimp depends on the processors and market demand. For Chinese markets, the preferred size is 80-90/kg. At the end of February 2023, farm gate prices for size 100/kg shrimp were INR255/kg (USD3.08/kg) and the cost of production ranged from INR200-210/kg (USD2.422.54/kg) in farms in Andhra Pradesh, the leading shrimp farming state.
However, producing size 100/kg shrimp is not attractive for farmers in Tamil Nadu, culturing in coastal/creek-based ponds with high salinity, as the culture duration is much longer at 60-70 days and production cost is too high at around INR215/ kg (USD2.60/kg, direct cost). A profitable harvest size for them is 40/kg where the cost of production is around INR265/kg (USD3.21/kg) and farm gate prices at around INR380/kg (USD4.60/kg).
The disease situation has been dire in India. Until early 2023, the degree of infection and impact varied tremendously and the country-wide prevalence of Enterocytozoon hepatopenaei (EHP) was almost 80%. White spot syndrome virus (WSSV) has been more prevalent over the winter months.
“In parts of Andhra Pradesh (Krishna, West and East Godavari), farming the vannamei shrimp at low salinity (5-12ppt) is popular particularly when EHP is present as survival and growth rates are not so adversely affected. The poor farming success rates
in the traditional high saline ponds have now pushed up prices of land leases in low saline farming areas,” said B. Ravikumar, Assistant Vice President - Sales and Technical at Growel Feeds Pvt Ltd.
“With EHP infections, the cost of production rises by 10-13% in low saline ponds, depending on harvest size in Andhra Pradesh as compared to 20-25% for shrimp in 25-33ppt ponds in Tamil Nadu. In these low saline ponds, farmers can have 3-4 crops/year producing size 100/kg at INR225-240/kg (USD2.72-2.90/kg) since each cycle is around 50-60 days.”
With regards to genetics, industry also said that SyAqua’s balanced line has been very successful and are getting traction in India with acceptable growth and better survival in the farms. Post larvae performed better at low salinity and recovery from white faeces is faster.
Industry reported a production of 800,000 tonnes in 2021 and forecasted a 10% drop in production in 2022 to 720,000 tonnes, due to EHP in the second half of 2022. The GSMC shrimp panel estimated a production of 680,000 tonnes of vannamei shrimp and 180,000 tonnes of black tiger shrimp.
Increasing shrimp production annually is an ongoing target for Vietnam’s shrimp industry stakeholders. Industry leaders said that production may reach one million tonnes in 2022 with the application of high technology models which can produce 40-60 tonnes/ ha compared to the average yield in 2021 which was over 5 tonnes/ha (vietnamagriculture.nongnghiep.vn).
Dr Loc Tran, ShrimpVet Laboratory says that at his farm, the preferred harvest size is 50/kg or larger shrimp but processors in general prefer size 40-60/kg. In a presentation at TARS 2022, Olivier Decamp and Nguyen Van Khanh, Grobest, described in detail indications of lower production. Among them were the export situation which went down from June 2022, lower post larvae supply early in 2022, outbreaks of EHP, white faeces syndrome (WFS) and acute hepatopancreatic necrosis disease (AHPND) since April, and adverse climate (see page 8-12). Tran added that among them, EHP has been the most serious disease.
Table 2. Comparison of % survival, feed conversion ratio (FCR) and cost of production (COP) in low saline (5-12ppt) ponds, with and without Enterocytozoon hepatopenaei (EHP) in Andhra Pradesh, India. The survey was carried out on close to 1,000 ponds from June 2022 to February 2023. Source: B. Ravikumar, and Gnanasri Jandhyala, Growel Feeds Pvt Ltd. Conversion: INR82.52=one USD (20 March 2023).
In July 2022, Seabinagroup reported that vannamei prices increased by VND1,000-2,000/kg (USD0.040.08/kg) in Soc Trang (Mekong Delta) because of lower harvests. The price range for large sizes (40-25/kg) was VND130,000-175,000/kg (USD5.51-USD7.42/ kg). For smaller sizes (100-70/kg) it was VND99,000119,000/kg (USD4.19-5.04/kg).
The GOAL survey has adjusted the estimate on China’s farmed shrimp production to 800,000 tonnes in 2022 and GSMC also gave a total of 800,000 tonnes, including 120,000 tonnes of black tiger shrimp. Since China’s shrimp exports to the US dropped by 35%, China is now seen as a consumer of shrimp, rather than as a global supplier.
According to Fatima Ferdouse, International ConsultantFisheries, Malaysia, China imported almost one million tonnes in 2022, most of these during the post lockdown months from July 2022 at 100,000 tonnes/month. Sixty percent of her imports came from Ecuador, followed by Vietnam and India. Local production of live vannamei and black tiger shrimp is increasing, said an industry source. However, there is high price elasticity, prices dropping when farmers harvest more shrimp. With China fully opening in 2023, it will be the bright spot with increasing demand and hopefully this will improve overall prices.
The most recent estimate on total farmed shrimp production for 2022, according to Haris Muhtadi, President of Shrimp Club Indonesia, was 445,000 tonnes, unchanged from the production in 2021. This would also include some 50,000 tonnes of black tiger shrimp from extensive culture systems. In 2023, Haris expects the production to be lower than in 2022, at only 415,000 tonnes because of increases in disease outbreaks, mainly WSSV, AHPND and infectious myonecrosis (IMNV) in North Sumatra, Lampung, Java and Sulawesi. At GSMC, the shrimp panel was more optimistic with a forecast of 380,000 tonnes of vannamei shrimp in 2023.
Based on feed sales data and estimates from local industry insiders, a February 2023 Shrimp Insights blog suggested a total production volume of vannamei shrimp in Indonesia not exceeding 400,000-450,000 tonnes. It also said that the export volume of vannamei shrimp stagnated just above 200,000 tonnes for 2022. Exports grew in the first three months of 2022 and then stagnated over the last nine months.
Haris said that production was still below expectations because of diseases, lower farm gate prices and that farmers preferred to harvest small size shrimp with better offer prices from processing plants during the second half of 2022.
A preferred harvest is size 30/kg but this is difficult to achieve as most farms are located on Java Island and processors need only small volumes of this. For this, the production cost is IDR50,000- IDR60,000/ kg (USD3.25-3.90/kg). Processors look for sizes 50100/kg.
The government has commenced its plans to increase farmed shrimp production by 2024 to 2 million tonnes. It has launched the first farm in Kebumen Regency, Central Java Island with 149 lined ponds. The target production is 40tonnes/ha. (see page 64).
Thailand’s production of 256,832 tonnes, comprising 241,526 tonnes of vannamei shrimp and 15,306 tonnes of black tiger shrimp saw further decline since 2019. This official data is derived from a system called Aquaculture Product Purchasing Document (APD) which links farmers to processors. Without utilising this system, farmers cannot sell their shrimp; the Department of Fisheries explained that it is to create confidence in Thailand’s traceability system.
According to Aquaculture Development Consultant Vinij Tansakul, the majority of Thai farmers prefer to go back to the days of higher production or at least to enhance yields. “Due to market volatility and limited capital investments, the number of processing plants with cold storage facilities has dropped to 20, with a total capacity at approximately 160,000-200,000 tonnes/year. If farmers seek to increase productivity, they must also consider the purchasing capability of processors and storage facilities particularly during peak production which is during the second half of the year. Otherwise, higher yields will bring down prices.”
The preferred harvest size for Thai farmers is the more profitable size 60-70/kg. Survival ranges from 6575%. “Processors prefer size 25-30/kg but this size is actually difficult to find and buy from Thai shrimp farms because it will require 110-120 days to culture. The majority of Thai shrimp farms wish to culture for a maximum of 80-90 days only,” said Tansakul. “Feed conversion ratio (FCR) is usually 1.3-1.4 and average daily growth (ADG) using a fast growing shrimp line is 0.21-0.23g and for the balanced line, ADG is 0.180.21g. WSSV has been present since Q4 2022 and appears to persist for an unusually long time.”
During the recent Suratthani gathering for the Thai Shrimp industry, Robins Mcintosh, Charoen Pokphand Foods Public Ltd (CPF), presented on using genetics as a tool and not as a solution. He gave examples of successful (profitable) farmers attaining harvests of 30 tonnes/ ha after 85 days at 92% survival. McIntosh stressed on feeding rates to match genetics and reducing stocking density to 100PL/m 2 to achieve ADG of 0.33g.
Among the local industry players, there is some ambiguity with regards to production volumes in 2022; they said volumes ranged between 60-65,000 tonnes but based on feed consumption, production could be about 40,000 tonnes of vannamei shrimp. The Philippines Statistics Authority gave black tiger shrimp production of 33,731 tonnes in 2022, which could also include vannamei shrimp. Sporadic disease outbreaks such as AHPND, WSSV and EHP and co infections caused abrupt mortalities. Farmers’ dilemma included unpredictable and changing weather conditions, low salinities causing mineral imbalance, increased feed costs and seasonal drop in shrimp prices.
In late 2022, the entire Calatagan region was hit by AHPND, EMS, running mortality syndrome (RMS) coupled with EHP according to samples sent to BFAR for testing. William Kramer, CCM Agri Aqua Ventures, said, “The disease situation apparently had started in April/May 2022 in the west side of the province.” Elsewhere, industry players listed WSSV in Negros Occidental and in parts of Cebu Island.
With lower supply from diseases as well as higher costs of production, Kramer said that farm gate prices have increased. “The base price (for 10g) shrimp is PHP240-280/kg (USD4.38-5.11/kg) for Luzon farms and PHP140/kg (USD2.55/kg) for farms in Visayas. Luzon producers have the edge because of their proximity to high-demand markets around Metro Manila while the Visayas producers need to spend PHP70-80/kg (USD1.27-1.46/kg) for transport and Mindanao producers PHP90-100/kg (USD1.64-1.82/kg) for air freight.” In March 2023, farm gate prices in Cebu remained high at PHP260/kg (4.75/kg) whereas the base price is usually only PHP 190/kg (USD3.47/kg, Dr Valeriano Corre, pers. comm).
The industry does not expect 2022 production to change from 40,000 tonnes as was achieved in 2021. In terms of size, processors prefer size 31-40/kg for either vannamei or black tiger. Live cooked shrimp sell at higher prices than chilled cooked shrimp although there is no differentiation in farm gate prices at MYR3335 (USD7.37-7.81/kg) for size 30/kg (March 2023). Colour is important for the buyers who focus on colour 29 on the salmon fan. Almost all of the production is for domestic markets. Singapore is an important market for live shrimp, Local shrimp with farm gate prices of MYR27/kg (USD6.03/kg) for size 70/kg, often compete with imports of high-quality Thai shrimp and when this happens, prices drop.
Wan Nadhri Wan Fauzi, CEO at Blue Archipelago Bhd, Malaysia’s leading shrimp integrator, said, “Our buyers prefer size 40-60/kg shrimp but for us, the optimal range is 14g-18g (size 70-50/kg) or days of culture 65-85, given the survival rates, FCR, market prices and disease mitigation plans. In 2022, our major challenges were disease problems especially WSSV. In terms of genetics, we are comfortable with our specific pathogen tolerant/specific pathogen free (SPT/SPF) shrimp and we wish to see 1-2 more proven tolerant lines with good growth such as ADGs above 0.2g.”
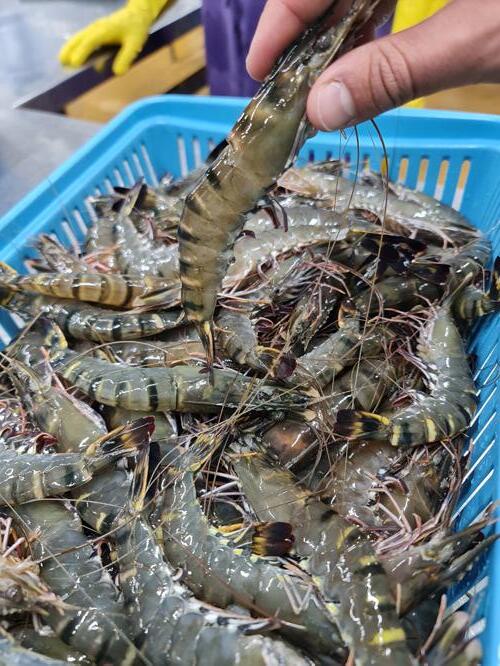
Recently, hatcheries in India and Southeast Asia have several choices of growth and balanced lines broodstock. In India, the Shrimp Improvement Systems (SIS) hardy line and Kona Bay balance line are market leaders. Kona Bay had a good year in Indonesia, while new shrimp lines from American Penaeid Inc (API) and Benchmark were introduced to hatcheries in Lampung and Java. The results of these new introductions are yet to be seen, said an industry source, adding that there has been a shift towards tolerant animals in Indonesia, but growth is slow, resulting in higher FCR, reducing profits especially with lower prices. He added that the balance line seems to be the preference but growth performance has yet to achieve consistency.
Some comments on the use of growth and tolerant lines were given under the relevant country report. Additional general comments include the following.
• Generally, the fast growth lines remain popular.
• Broodstock based on balance line genetics tend to be preferred in cycles with disease outbreaks and during the monsoon season.
• Benchmark and API have not entered the Philippines market where the preference is still for fast growth.
• While farmers are challenged by disease problems, they remained technically advanced and more open to test and adapt to new genetics.”
From his visits to many hatcheries in Asia, Mark R. Napulan, Zeigler feeds observed, “Hatchery players need to put more focus on elevating biosecurity measures by reducing the use of live and fresh feeds and implementing strict biosecurity protocols in the hatchery. We advocate switching to using biosecure diets in shrimp maturation and larval rearing to help mitigate impact of diseases and prevent pathogen entry. The application of a proven and effective probiotic program in the hatchery could eliminate Vibrio , promote gut health and maintain a stable environment for post larvae.”
In terms of cost optimisation, Napulan suggested that hatcheries start evaluating feed efficiency by calculating number of post larvae produced/g of feed. “The use of nutrient-dense and highly digestible diets produce quality post larvae that will perform later in ponds,”
In Indonesia, Philippines, Malaysia and India, nursery systems are currently not well adopted and there is a lack of interest. “From farmers’ perspectives, the
risks of having nurseries outweigh the benefits. Farms which have previously invested in nursery systems have returned to direct stocking,” said Napulan. Other reasons pulling farms away from adopting nursery systems is that skilled technicians are required and that its management is still viewed as complex by many farmers.
During a session dedicated to black tiger shrimp farming at the 2022 Global Shrimp Forum (GSF), McIntosh said that the surge in its farming in China, Thailand, Vietnam and Malaysia, was largely due to the availability of CPF’s domesticated and specific pathogen free (SPF) broodstock. He expected China’s black tiger shrimp production to rise to 180,000 tonnes from 100,000 tonnes in 2021 while Minh Phu CEO, Le Van Quang, expected that 20% of Vietnam’s shrimp production to be black tiger shrimp, estimated to be 180,000 tonnes (AAP, September/October 2022).
In India, the interest in its farming came with the availability of fast-growing SPF black tiger shrimp such as those from Moana (Hawaii) and domesticated broodstock from Madagascar. It is also because the black tiger has a higher tolerance to EHP and WFS, as well as to RMS and is more suitable to farm in Gujarat during the hot summer months which the vannamei shrimp cannot tolerate. Gujarat farmers always have only one crop/year and with black tiger, they have a choice of another crop. SAP estimated 50,000 tonnes in 2022 while Dr Manoj Sharma, Mayank Aquaculture, India, gave an estimate of 30,000-35,000 tonnes in 2022.
McIntosh said that farms in China, Vietnam, and parts of India often struggle with diseases in their white shrimp populations, but black tiger has not faced the same difficulties (seafoodsource.com). “If black tiger came back to be 20% of Asian farmed shrimp production, that would be a huge success.”

The price factor worked well during the early part of 2022. By mid-year, producers in Malaysia began to complain of low prices in contrast to farm gate prices in Vietnam.
In March 2023, farm gate prices for size 30/kg black tiger shrimp at MYR 33-34/kg (USD7.37-7.59/kg) was MYR1.00 (USD 0.22/kg) lower than for equivalent size vannamei shrimp. At the end of 2022, black tiger shrimp prices for size 20/kg dropped to INR420 (5.08/kg) from INR720/kg (USD8.72/kg) in India while the cost of production was INR480/kg (USD5.81/kg). Vietnam’s size 30/kg black tiger shrimp prices remained high at USD7.80/kg at the end of the year and rose to USD9.60/ kg in February 2023, while Indian prices dropped to USD4.30/kg in February 2023.
In his blog, van der Pijl said that raw black tiger shrimp exports have also increased YOY, reaching a year total of 15,500 tonnes in October, up by 68% compared to the same period in 2021. “Buyers from Belgium, Germany, and the Netherlands-traditionally larger markets for Asian black tiger shrimp are clearly complementing or replacing their supplies from Bangladesh with Indian shipments.”
Next issue: The rising cost of production in Asia’s shrimp farming industry

A smarter global standard for safer and more sustainable farming practices that covers all stages of production.
The results of this year’s survey push Ecuador to the top of the league with 1.3 million tonnes and lift production from the Americas to 2 million tonnes
As has been the tradition, GOAL 2022 presented data from the global farmed shrimp and finfish production survey and forecast for the global supply in 2023. On behalf of the Global Seafood Alliance (GSA) and Rabobank, Gorjan Nikolik Senior Analyst Seafood, Rabobank, presented results from this survey as well as industry’s concerns in 2022. The 21st edition of the GSA’s flagship event was held in Seattle, USA, from 3-6 October 2022. It was a success, attracting 350 delegates from around the world.
Nikolik started this year’s presentation complimenting on the incredible increase in volumes from Ecuador. Driven by production in Ecuador, the survey indicated that Latin American (LATAM) producers are set to contribute 2 million tonnes to the global supply of vannamei shrimp in 2022. In the December 2022 Rabobank report, Nikolik and Sharma (2022) hinted that continued growth will lift the Americas over the 2 million tonne-mark by 2023.
Ecuador and the Americas
Ecuador had 40.9% growth in 2021, breaching the one million tonne-mark. For 2022, the GOAL team expected 18% growth and the most recent forecast was that 1.35 million tonnes of production was possible. This is an increase of 26% over that of 2021. However, according to Nikolik and Sharma (2022), current data suggest a supply growth of 30%. This would give Ecuador its largest single year volume growth recorded at 300,000 tonnes, just slightly lower than Thailand’s annual production.
In 2023, Ecuador might meet the 1.5 million tonne-mark. Overall, these double-digit growth in production from Ecuador has been very impressive. Nikolik also noted that such growth rates from a high base, is the largest single nominal growth of any aquaculture industry seen over the past 50 years.
Among the other major producers in LATAM, Mexico has recovered well in 2022 and increased production to 200,000 tonnes. In 2023, growth is expected at 6.1%.
With increasing supply from Brazil, Venezuela, Peru, Honduras, Nicaragua, Guatemala, Colombia, Costa Rica and Panama and led by Ecuador, (Figure 1), Nikolik said, “LATAM’s growth is impressive from 9% growth prior to 2020 to double digits in 2021 (29.8%), 2022 (15.3%) and then an estimated 13.1% in 2023. Back in 2010, Ecuador’s production was half of the total Latin American production at around 200,000 tonnes; today it dominates the continent’s production, showing the success and competitiveness of Latin American producers.”
Figure 1. Vannamei shrimp production
Ecuador is
to
Latin
With


Ecuador’s production is estimated to be I.3 million tonnes in 2022 and might breach the 1.5 million tonnes level in 2023.
growth prior to 2020 to double digits in 2021 (29.8%), 2022 (15.3%) and then an estimated 13.1% in 2023. Back in 2010, Ecuador’s production was half of the total Latin American production at around 200,000 tonnes; today it dominates the continent’s production, showing the success and competitiveness of Latin American producers.”
Figure 2. Indian


Figure 2 Indian shrimp production. The GOAL survey data predicted a contraction by 4.7% in 2022 and increase in 2023 by 3.5%. Note: The survey did not use FAO data for 2020 for India as it conflicted with all other sources.
production. The GOAL survey data predicted a contraction by 4.7% in 2022 and increase in 2023 by 3.5%. Note: The survey did not use FAO data for 2020 for India as it conflicted with all other sources.
Similar to the 2021 report, India is the Asian producer to watch (Figure 2) In 2020, production volumes contracted and a recovery in 2021 with more production at 11.2% was driven by US demand. In 2022, a second contraction was expected at -4.7%. Nikolik said that feedback from respondents mentioned that the contraction was due to disease problems feed costs and shrimp prices Nevertheless, Indian production is expected to grow in 2023 by 3.7% of that in 2022. Led by India, there was less optimism on the production from Asia
Asia’s production
Similar to the 2021 report, India is the Asian producer to watch (Figure 2). In 2020, production volumes contracted and a recovery in 2021 with more production at 11.2% was driven by US demand. In 2022, a second contraction was expected at -4.7%. Nikolik said that feedback from respondents mentioned that the contraction was due to disease problems, feed costs and shrimp prices. Nevertheless, Indian production is expected to grow in 2023 by 3.7% of that in 2022. Led by India, there was less optimism on the production from Asia.
Figure 3. China’s production using industry data. Note: The survey team did not use FAO data as it considered to be overestimated. Production contracted by 0.8% in 2022 and is expected to rise in 2023 by 9.5%.
production using industry data. Note: The survey team did not use FAO data as it considered to be overestimated. Production contracted by 0.8% in 2022 and is expected to rise in 2023 by 9.5%.
Figure 3.
In the 2021 report, Nikolik had discussed issues on China’s production volumes which showed an upward trend leading to 2 million tonnes of production in 2019. Therefore, this year the survey did not use FAO data which the team considered to be overestimated Instead, it chose data from industry proposed by Robins McIntosh (CPF). Figure 3 shows the production data starting with 800,000 tonnes in
Figure 1 Vannamei shrimp production in Latin America, led by Ecuador is set to reach 2 million tonnes in 2023. Ecuador’s production is estimated to be I.3 million tonnes in 2022 and might breach the 1.5 million tonnes level in 2023.in
America, led by
set
reach 2 million tonnes in 2023.
In the 2021 report, Nikolik had discussed issues on China’s production volumes which showed an upward trend leading to 2 million tonnes of production in 2019. Therefore, this year the survey did not use FAO data which the team considered to be overestimated. Instead, it chose data from industry proposed by Robins McIntosh (CPF). Figure 3 shows the production data starting with 800,000 tonnes in 2010 to just over 700,000 tonnes in 2020. Respondents identified a small decline in 2022 and a very nice recovery by 9.5% in 2023.
Nikolik also noted that FAO data for Vietnam was marginally overestimated and that for Indonesia, a gross overestimation. In the case of Vietnam , after years of growth at 10.9%, from 2010 to 2020, the survey reported production plateauing at 1.5% in 2021. The growth forecast was 0.7% for 2022 and a marginal 0.6% for 2023 (Figure 4).
In the case of Thailand , Nikolik commented, “Thailand is the only country that really has good data. Growth is expected at 2.3% in 2022 and then higher at 4.0% in 2023. For the first time since the EMS crisis in 2013, a contraction of 0.1% in Asian production is expected for 2022. “There is some optimism by the respondents that 4.2% will be the growth in 2023, lifted by higher production in China and India and slight increase in Vietnam to reach above 4 million tonnes.”
With production driven by volumes from LATAM, the global supply in 2022 was estimated at 5.5 million tonnes, with just one country, Ecuador, accounting for almost 22%. Supply increase is at 4.2% over that of 2021, but lower than the historical rate (Nikolik and Sharma, 2022).
marginally overestimated.

considered marginally overestimated.
Nikolik also noted that FAO data for Vietnam was marginally overestimated and that for Indonesia, a gross overestimation. In the case of Vietnam, after years of growth at 10.9%, from 2010 to 2020, the survey reported production plateauing at 1.5% in 2021. The growth forecast was 0.7% for 2022 and a marginal 0.6% for 2023 (Figure 4).
FAO data shrimp production in Indonesia is almost double that of the production data given by industry. The adjusted data for Indonesia showed a production of less than 350,000 tonnes in 2020 and black tiger shrimp accounting for less than 50,000 tonnes. Growth at 5.2% in 2021 was driven by demand in US markets, the main market for Indonesian shrimp. The survey expected marginal increases in production at 3.5% in 2022, followed by 6.2% in 2023. This contrasted with the previous expectation of an increase by 5.8% in 2022.
expected for 2022 (Figure 6). “There is some optimism by the respondents that 4.2% will be the growth in 2023, lifted by higher production in China and India and slight increase in Vietnam to reach above 4 million tonnes.”
2022.
4 million tonnes in 2023,

Bullish global forecast
With production driven by volumes from LATAM, the global supply in 2022 was estimated at 6 million tonnes, with just one country, Ecuador, accounting for almost 22%. Supply increase is at 4.2% over that of 2021, but lower than the historical rate (Nikolik and Sharma, 2022).
Every year, the survey team asked respondents to rank key concerns. Aquafeed prices, a key concern in 2020 survey was mirrored in 2022. Other top concerns were market prices, disease problems and market access. Nikolik said that not only are people worried on price of feed, but they are also worried on feed quality and feed performance. For the first time, access to credit was identified as a concern, jumping from position 12 to 7 in this 2022 survey. Nikolik and Sharma (2022) said that this is linked to central banks raising interest rates to curtail inflation and lenders curtailing credit.

Figure 5. Shrimp production from Asia is expected to
GSA, 2022. Global Shrimp Aquaculture Production Survey and Forecast. Presented by Gorjan Nikolik, Rabobank at GOAL 2022, Seattle, USA, October 3-6, 2022. Nikolik, G., Sharma, N. 2022. What to expect in the aquaculture industry in 2023. Rabobank, The Netherlands, December 2022.

The GSA has announced that GOAL is now called The Responsible Seafood Summit , a name that better represents GSA’s vision of a world that embraces the role of responsible seafood in meeting global nutritional needs, for both farmed and wild seafood. The first event under the new name will be held at The Delta Hotel in Saint John, New Brunswick, Canada, from 2-5 October 2023.
Figure 4. Vietnam’s shrimp production included both vannamei and black tiger shrimp. Note: The survey team did not use FAO data which was Figure 4. Vietnam’s shrimp production included both vannamei and black tiger shrimp. Note: The survey team did not use FAO data which was considered


Following the valuable contributions made by Alain Michel, the French consultant who died on 11 June 2022 (see issue January/February 2022, pages 49-52), the Board of Directors of Oceanpick Pvt Ltd in Sri Lanka decided to rename Oceanpick hatchery as the “Alain Michel Hatchery”. The ceremony took place at Oceanpick farms in Trincomalee on 26 January 2023. It was attended by company staff, dignitaries, virtually by Michel’s family and friends and was live streamed to colleagues around the globe.
Oceanpick is Sri Lanka’s first oceanic fish farm, with cages located off Trincomalee on its eastern seaboard. It farms the Asian seabass or barramundi. The farm was established in 2012 and received a Best Aquaculture Practices (BAP) in 2019. The hatchery was established in 2018.
Alain Michel was introduced to Oceanpick farms by Peter Richardson of Kames fish farms in 2016. His expertise was sought to develop the hatchery for Oceanpick. His initial visit to the island in 2016 was to better understand the operations and production of barramundi in South Asia’s largest commercial finfish farm. At that time, Oceanpick
farms consisted of 10-16 sea cages. Michel’s subsequent visits to Sri Lanka focused on the development of the necessary infrastructure and to collect the broodstock from existing stocks for the initial development stage of the hatchery project.
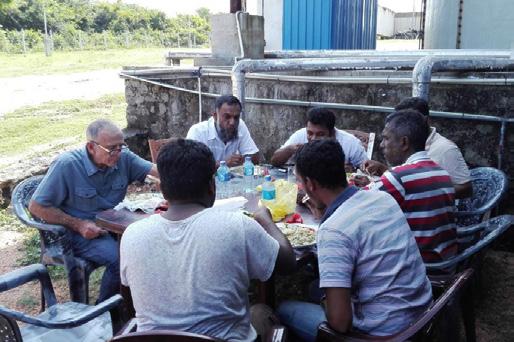
The team at Oceanpick appreciated Michel’s contribution. “Alain developed a keen interest in Oceanpick farms. His kindness, team spirit and modesty touched all who worked closely with him at the farm. This was also the beginning of our enduring friendship,” said Oceanpick founder Irfan Thassim.
Michel continued his work with Oceanpick farms as a permanent consultant and was instrumental in developing the immunisation program for the hatchery including preventive methodologies for disease outbreaks and went on to further improve the farm’s husbandry practices. “Alain will be greatly missed by everyone who knew him and had the opportunity to work with him at Oceanpick. He was not only renowned for his professional skills but for his kindness and humanity which Oceanpick has come to cherish over the years,” said Irfan. www.oceanpick.com
Clockwise from top left. Naming of the hatchery; appreciation by Oceanpick staff; Oceanpick founder Irfan Thassim (second right) and directors at the naming ceremony and Alain Michel, Irfan and staff.
a pilot for the development of modern shrimp ponds in Indonesia. This farm concept will be replicated in Waingapu in East Nusa Tenggara, covering an area of 1,800ha. The ground breaking is planned for June/July 2023.
Over the last few years, Indonesia’s Ministry of Marine Affairs and Fisheries (MMAF) has been planning to expand farmed shrimp production to 2 million tonnes by 2024. The concept is a cluster farming system and will be implemented all over the Archipelago. All facilities from hatchery to cold storage and processing will be available in each cluster. The idea is to raise the productivity of traditional farms with smaller and lined ponds and adapt to new technology and innovations.
On 9 March 2023, Indonesia President Joko Widodo inaugurated a zone-based integrated shrimp farm covering 60ha out of a total land area of 100ha in Petanahan District, Kebumen, Central Java. This was at an investment of IDR175 billion (USD11.4 million).
On9 March 2023, Indonesia President Joko Widodo inaugurated a zone-based integrated shrimp farm covering 60ha out of a total land area of 100ha in Petanahan District, Kebumen, Central Java. This was at an investment of IDR175 billion (USD11.4 million).
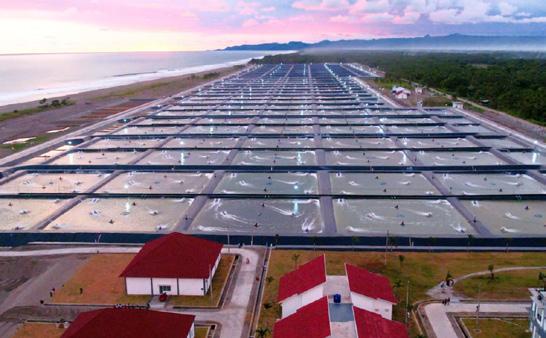
This zone-based shrimp farming concept called BUBK is an environmentally friendly pond system and will be a pilot for the development of modern shrimp ponds in Indonesia. This farm concept will be replicated in Waingapu in East Nusa Tenggara, covering an area of 1,800ha and where the ground breaking is planned for June/July 2023.
This zone-based shrimp farming concept called BUBK is an environmentally friendly pond system and will be
The Kebumen BUBK pond system consists of 149 ponds with an initial productivity of 40 tonnes/ha. It is equipped with a wastewater management plant (WWTP), water intake to laboratory space. This pond implements Good Fish Farming Methods (CBIB) to maintain the optimisation of shrimp growth so that the harvest is of high quality and competitive in the market.
Over the last few years, Indonesia’s Ministry of Marine Affairs and Fisheries (MMAF) has been planning to expand farmed shrimp production to 2 million tonnes by 2024. The concept is a cluster farming system and will be implemented all over the Archipelago. All facilities from hatchery to cold storage and processing will be available in each cluster. The idea is to raise the productivity of traditional farms with smaller and lined ponds and adapt to new technology and innovations. It will also involve the revitalisation of traditional ponds.
The Kebumen BUBK pond system consists of 149 ponds with an initial productivity of 40 tonnes/ha. It is equipped with a wastewater management plant (WWTP), water intake to laboratory space. This pond implements Good Fish Farming Methods (CBIB) to maintain the optimisation of shrimp growth so that the harvest is of high quality and competitive in the market.

The theme of this year’s VietShrimp Aquaculture International Fair (VietShrimp) is “Innovative value chain upgrading”. It will be held from 12-14 April at Can Tho Promotion Agency, Can Tho City, Vietnam.

VietShrimp 2021 was successful but with a few foreign visitors due to the Covid-19 pandemic. In 2023, with the opening of borders, organisers expect that VietShrimp will attract businesses from leading countries in aquaculture. Additionally, those absent from VietShrimp 2021 have expressed interest to participate in this year’s event and seek cooperation opportunities with Vietnam’s businesses. International companies based in Vietnam have already registered to attend the event, including Thang Long Group, Skretting Vietnam, Viet Uc Seafood Corporation, UniPresident Vietnam Ltd., Co, DSM, Rynan Technologies Vietnam JSC, and Lallemand Animal Nutrition.
According to VASEP, the sector continues to face difficulties since 2020, affecting productivity and profitability.
Production from aquaculture accounts for 70% of raw materials required for processing for export. Thus, businesses are all considering expanding farming areas. However, due to urbanisation, the shortage of land is a big challenge to businesses and farmers. In addition, there are hurdles with certification on
traceability of seafood. At VietShrimp 2023, leading experts in fisheries from Vietnam and other countries will discuss and find solutions to help businesses overcome challenges for the development of Vietnam’s fisheries.
Organisers have arranged for an exciting 2-day workshop program, to showcase Vietnam’s aquaculture industry. There will be 4 sections: Innovative value chain upgrading; Emission reductions in shrimp farming; Value chain digitization and Branding Vietnamese shrimp. Leading aquaculture companies will present their latest research, products and models. International experts will also provide an overall view of this industry and share knowledge on the the science, technology, business and social aspects of aquaculture.
More information: www.vietshrimp.net or email vietshrimp@gmail.com.
Look
Deadlines -Technical articles
Deadlines - Advert Bookings
Innovations/ Startups
14
21 May 23
25
26
Experiences and opinions covering role models; clear and present needs of industry; innovations and digitalisation in aquaculture
Interviews with industry leaders Focus in 2023 will be leaders pushing for sustainable aquaculture

Issue focus Emerging trends and challenges Sustainable & Responsible Aquaculture Demand & Supply Equilibrium
Marketing activities Market and product developments, generic marketing, certifications, branding, food safety etc
Company/Product News News on activities at international, regional and local conferences and trade shows
For advertising/article contributions and guidelines contact: zuridah@aquaasiapac.com


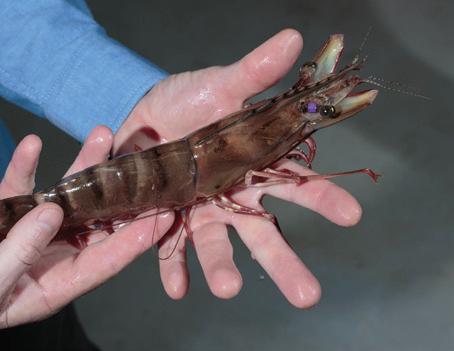


in the remote Northern Territory (NT). Dan is a strategic thinker and thought leader with a passion for people, environmental stewardship, farming and implementing business improvements that deliver real results.
The World Aquaculture Society (WAS) and the Steering Committee of World Aquaculture Darwin 2023 are excited to organise the upcoming WAS event in Australia in Darwin for the first time since 2014. The WA Darwin 2023 will be held during May 29 to June 1, 2023 at Darwin Convention and Exhibition Centre.
The World Aquaculture Society (WAS) and the Steering Committee of World Aquaculture Darwin 2023 will organise the upcoming WAS event in Australia in Darwin for the first time since 2014. The WA Darwin 2023 will be held during May 29 to June 1, 2023 at Darwin Convention and Exhibition Centre.
The World Aquaculture Society (WAS) and the Steering Committee of World Aquaculture Darwin 2023 are excited to organise the upcoming WAS event in Australia in Darwin for the first time since 2014. The WA Darwin 2023 will be held during May 29 to June 1, 2023 at Darwin Convention and Exhibition Centre.

The WA2023 conference is honoured to welcome Dan Richards and David Whyte as the plenary speakers. Dan Richards is CEO of Humpty Doo Barramundi - the award-winning, family owned and operated barramundi farm in the remote Northern Territory (NT). Dan is a strategic thinker and thought leader with a passion for people, environmental stewardship, farming and implementing business improvements that deliver real results.
The WA2023 conference is honoured to welcome Dan Richards and David Whyte as the plenary speakers. Dan Richards is CEO of Humpty Doo Barramundi - the awardwinning, family owned and operated barramundi farm
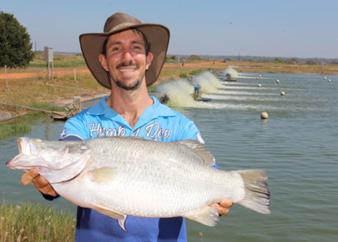
The WA2023 conference is honoured to welcome Dan Richards and David Whyte as the plenary speakers. Dan Richards is CEO of Humpty Doo Barramundi - the award-winning, family owned and operated barramundi farm in the remote Northern Territory (NT). Dan is a strategic thinker and thought leader with a passion for people, environmental stewardship, farming and implementing business improvements that deliver real results.
Humpty Doo Barramundi is widely recognised for its work pioneering Australian Barramundi farming, growing over the past 30 years from the smallest Barramundi farm in Australia to the largest. The premium quality saltwater barramundi produced by the farm features in Australia’s top restaurants, leading retailers and was chosen by our national airline to feature in business and first-class meals. David Whyte is Managing Director of BioMar Australia. He has 35 years’ experience in aquaculture production and supply companies in Scotland, Australia, and New Zealand. David brings a deep understanding of aquaculture and will share insights into the opportunities, challenges, and realities of offshore aquaculture development.
Hundreds of abstracts have already been submitted. Many session topics are available covering all aspects of aquaculture in Australia on Aquaculture engineering, Aquatic Animal Health, Freshwater, Food quality and Safety and more. To date, more than 200 booths for the tradeshow have been booked. New participants register every day. It is advised to start planning early your trip and book your accommodation to come to Australia and explore new aquaculture experiences in Darwin.
For more information on this event https://www.was.org/meeting/code/WA2023 or contact apcsec@was.org
May 29 – June 1
World Aquaculture 2023 Darwin, Australia www.was.org
April 12-14
Vietshrimp Aquaculture International Fair Can Tho, Vietnam https://vietshrimp.net

April 18 - 21
Latin American & Caribbean Aquaculture 2023
Panama City, Panama www.was.org
April 21-22
RASTECH 2023
Florida, USA www.ras-tec.com
April 25-27
Seafood Expo Global/Seafood Processing Global Barcelona, Spain www.seafoodexpo.com/global
July 24-26
Shrimp Summit
Ho Chi Minh City, Vietnam www.responsibleseafood.org
August 16-17
TARS 2023 - Shrimp Aquaculture, Bali, Indonesia
www.tarsaquaculture.com
August 25-27
VIETFISH 2023
Ho Chi Minh City www. vietfish.com.vn/en
August 31- September 2
Taiwan International Ocean and Fisheries Show (TIOFIS 2023)
Taipei www.taiwanfishery.com.tw
September 5-7
Global Shrimp Forum Utrecht, The Netherlands www.shrimp-forum.com/
September 18–20, Aquaculture Europe 2023, Vienna, Austria www.aquaeas.org
September 26-27
THRIVE Hawaii Agrifood & Aquaculture Summit
Hawaii www.TropAgTech.com
October 23-26
Aqua Expo 2023
Guayaquil, Ecuador www. aquaexpo.com.ec
November 13-16
AFRAQ 2023
Lusaka, Zambia www.was.org
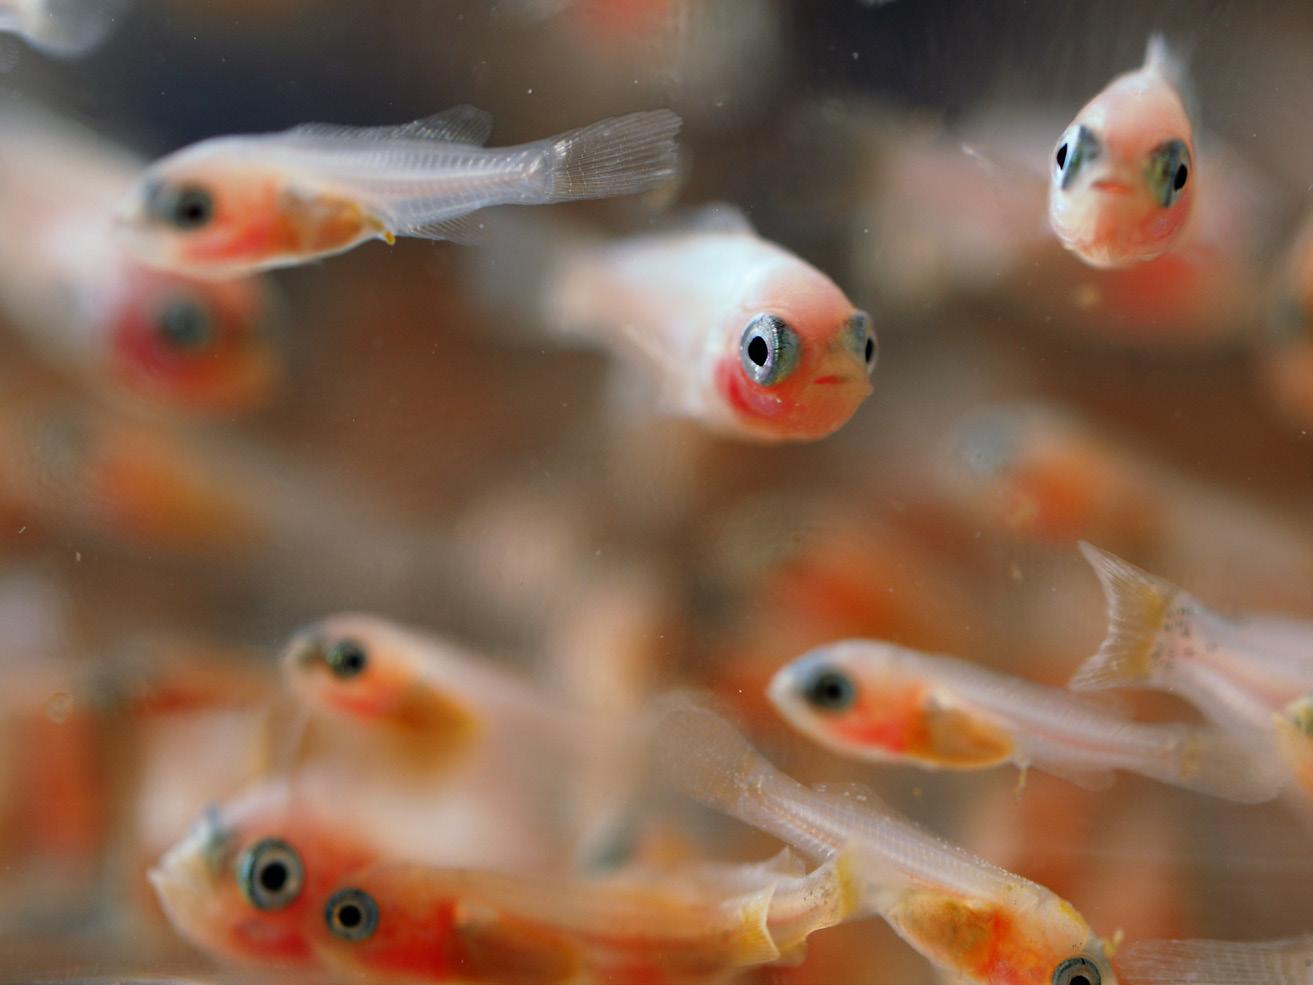









• No.16-18-20, DT743 Road, Song Than II Industrial Zone, Di An Ward, Di An City, Binh Duong Province, Vietnam
• Tel: +84-274-3790811 (Ext: 1711)
• Fax: +84-274-3790819
• Email: aquafeed@upvn.com.vn

