Unlock your full potential with the latest Precision workstations. Whether you are creating groundbreaking design, dynamic visuals, or complex coordination, these workstations are engineered to enhance your productivity. Equipped with NVIDIA RTX™ Ada Generation GPUs and integrated AI capabilities, they streamline your workflow and elevate your creative and technical endeavors.
Letter from the Editor
Here we go into October, and our theme for the month is customization. As many that know me, customization is my thing. I love customizing Harley Davidsons. I also like customizing my workspace in Civil 3D. At my office we have lots of customization in our workspaces. Over the last couple of years, we have moved that customization from the ribbon to a networked tool palette. This has been a wonderful transition, and a lot of help and thanks goes to Daniel Lench for getting this started with the initial setup.
From the Merriam-Webster dictionary, the definition of “customize” is to build, fit, or alter according to individual specifications. There are several 3rd party developers out there that customize your program to fit your needs. If it wasn’t for these wonderful developers, our production would be utter chaos. Some of these great developers in my field, like Steve Hill (Red Transit Consultants), Jimmy Bergmark (JTB World), Christopher Fugitt (works closely with Tony Carcamo at CCLS), Jeff Mishler (Quux Software), and many more.
As I always mention, if you’re interested in writing an article for me, or be a content manager, please email me at todd.rogers@augi.com.
Have a great October!
AUGIWORLD
www.augi.com
Editors
Editor-in-Chief
Todd Rogers - todd.rogers@augi.com
Copy Editor
Isabella Andresen - isabella.andresen@augi.com
Layout Editor
Tim Varnau - tim.varnau@augi.com
Content Managers
3ds Max - Brian Chapman
AutoCAD - Matthew Marrero
Civil 3D - Shawn Herring
BIM/CIM - Stephen Walz
BricsCAD - Craig Swearingen
Electrical - Mark Behrens
Manufacturing - Kristina Youngblut
Revit Architecture - Jonathan Massaro
Revit MEP - Jason Peckovitch
Tech Manager - Mark Kiker
Inside Track - Rina Sahay
Advertising / Reprint Sales
Kevin Merritt - salesmanager@augi.com
AUGI Executive Team
President
Eric DeLeon
Vice-President
Frank Mayfield
Treasurer
Todd Rogers
Secretary
Kristina Youngblut
AUGI Board of Directors
Eric DeLeon
KaDe King
Chris Lindner
Frank Mayfield
Todd Rogers
Scott Wilcox
Kristina Youngblut
AUGI Advisory Board of Directors
Shaan Hurley
Shelby Smith
Publication Information
AUGIWORLD magazine is a benefit of specific AUGI membership plans. Direct magazine subscriptions are not available. Please visit www.augi.com/account/register to join or upgrade your membership to receive AUGIWORLD magazine in print. To manage your AUGI membership and address, please visit www.augi. com/account. For all other magazine inquires please contact augiworld@augi.com
Published by:
AUGIWORLD is published by AUGI, Inc. AUGI makes no warranty for the use of its products and assumes no responsibility for any errors which may appear in this publication nor does it make a commitment to update the information contained herein.
All registered trademarks and trademarks included in this magazine are held by their respective companies. Every attempt was made to include all trademarks and registered trademarks where indicated by their companies.
AUGIWORLD (San Francisco, Calif.) ISSN 2163-7547
Invention, Innovation and Improvement
Tech Managers, and those that use the tech they manage, come up with new ideas and ways of doing things all the time. The good tech users and managers do not stand still and continue to use the same tools in the same way. They modify, mold and mix things together in a way that increases productivity, reduce errors and improve output. Creating, customizing, or configuring – it all starts with an idea.
But when you do something new, or in a new way, are you being inventive, innovative, or improving the process or tool? It may not seem like it matters, but I think you move between all three. That is what this article is about.
INVENTION
Invention is defined by EPAM SolutionHub as, “… creating something entirely new, for example,
the first light bulbs or the telephone.” This is the simplest definition of the term, and it is a good place to start. Stefan F. Dieffenbacher, Founder and CEO of Digital Leadership, defines it a more exactly as, “…the initial creation of a product or the introduction of a process, marking its first occurrence. It is the conception of an idea that holds the innovation potential.” He goes on to say, “Invention refers to the occurrence of a completely new idea for a product or process that has never been created before.”
The point is that it is something brand new. Something not done before. In the tech world it seems to happen all the time. Many tech tools we now use every day were considered inventive at the time of introduction.
INNOVATION
Going back to SmartHub, they define innovation as, “…the process of improving the existing creations or finding new applications for them. A typical example could be the transformation of smartphones from basic communication devices into powerful pocket computers.” Mr. Dieffenbacher states it this way: “…introducing new things, ideas, or ways of doing something,” and continues with, “Innovation involves the implementation of an idea for a product or process that is being introduced for the first time.”
Here, we have the process of taking something that exists and applying it is such a way that it can actually be used. It is taking something out of the lab, or proof of concept phase and moving it into the adoption phase.
IMPROVEMENT
Wikipedia defines improvement as, “The process of a thing moving from one state to a state considered to be better, usually by a change or addition that improves.” It is making adjustments that may seem incremental but make things better. It is tweaking things so that they are more efficient or used in a more efficient way. It does not really introduce something new but takes what is used and making it more productive. It is like moving the plotter closer to the production team, so they don’t have to walk so far to pick up their prints.
SO, WHAT?
Is it all just semantics? Does it really matter what you call the process that is used? It really does not, but I just want to point out that you probably do all three and move from one to another all the time.
Most of us do not usually invent things. Having a brand new, unique idea and making it workable does not happen every day. Just having an idea does not mean you are inventing anything. It must move to the tangible. It cannot just exist in your head. I have had a lot of “ideas” that never went anywhere… until someone else made it happen. How many times have you complained about a tech hole that no one is filling, framed an idea of what was needed, and then realized it is more work than you want to put in or it is not possible for you to work it out? You may have ‘ideated’, but nothing concrete was invented.
You do innovate – and you do it a lot. Every time you upgrade from one version to another, you are innovating. You are implementing a new version you are being innovative. You are taking something that others have invented, and you are making it a reality for your firm. When you research a new tool and bring it into your firm for the first time, you are innovating.
You probably improve things the most. You may never stop improving. Those small tweaks you do all the time. That is improvement. If you tried to list all the improvements you have made, the list would be pretty long. Improvement is in your blood. You can’t help but see how to improve things. It may be just moving the coffee machine in the break room to be closer to the sink so cleanup is easier, you just always see improvements that can be made.
So, whether you are inventing, innovating or improving, you are making your firm more efficient and output more stable. You are setting the environment on productivity. I have not mentioned elimination. You may also get rid of old tech so that people move forward.
The next time have a thought, and idea, revelation or make a change, don’t stop to think what word best describes what you are doing. Just make it happen. No matter what word you hang on it. You are making things better. Keep it up.
Mark Kiker has more than 35 years of hands-on experience with technology. He is fully versed in every area of management from deployment planning, installation, and configuration to training and strategic planning. He is an internationally known speaker, writer and former AUGI Board member and president. Mark is currently serving as Chief Technology Officer for SIATech, a non-profit public charter high school focused on dropout recovery. He oversees two web sites, www.caddmanager.com and www.bimmanager.com. He can be reached at mark.kiker@ augi.com and would love to hear your questions, comments and perspectives.
Role Playing in ACC
In this article, Autodesk Certified Professional Daniel Lench emphasizes defining role-based permissions in Autodesk Construction Cloud (ACC).
Iwouldn’t go to a bakery for an oil change. Similarly, team members should only change the data for which they possess the skills, knowledge, and authorization. This allowance may come from their position, department, or role within a project. Project managers rarely need to be in design software, and the design team would not be involved in project management. Crossing roles would confuse and impact the entire team’s effectiveness. Surveyors must protect their observed data at all costs. I have seen countless times when a designer will mistakenly edit a topo file to “fix” linework. This breaks the chain of custody and adds an element of risk to the design workflow.
The traditional server and folder layout may present users with a project folder containing subfolders whose permission levels are inherited from the drive letter on which they reside. This typically allows all users in a division to read and write access for all items in the drive. Other drives may be created for accounting, human resources, management, or administration. Permissions are set at the drive level by IT.
ACC treats each project as a stand-alone, selfcontained data set. When users are added to the company and given a default role, their permissions
are automatically defined when they are added to a project. A user’s roles can be modified uniquely in each project’s folders, but starting with an intentional default permission hierarchy ensures success throughout the project and consistency throughout the company.
Your project creation template should include the company’s Role permissions scheme for each folder. Any project created with the template will have these default permissions defined, allowing you to add users and trust that they will gain appropriate access levels to the areas they have been provisioned.
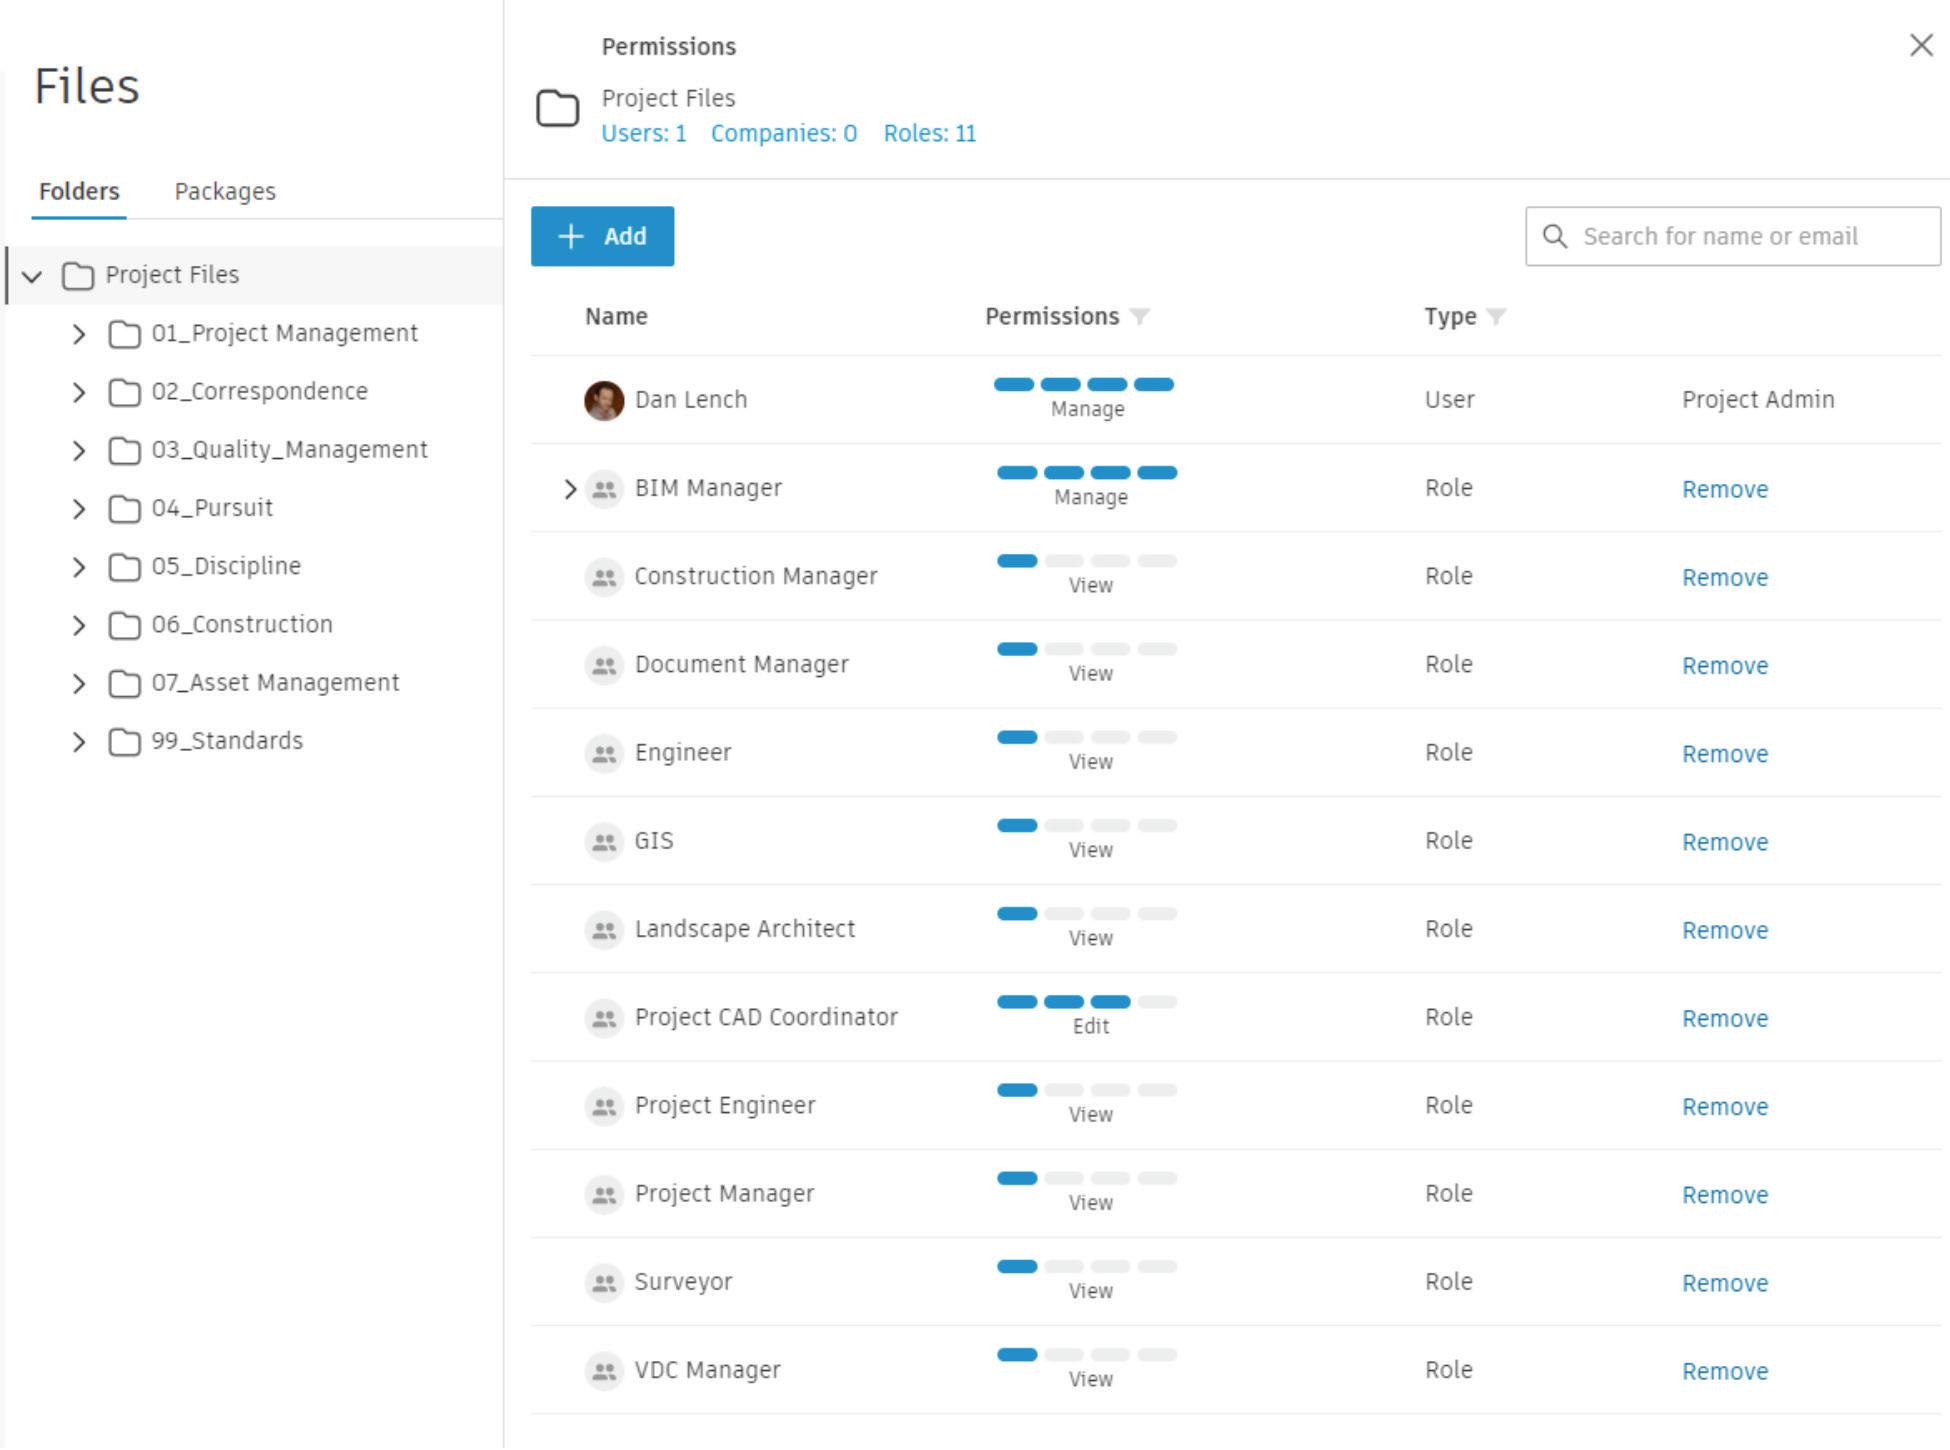
The “Project Files” folder is the topmost level of an ACC project. This folder will have the ACC admins added by name with the “Manage” permission. Additional roles with “Manage” permissions may include a BIM Manager or other appropriate role identified by your organization. Every other role at this top level should be the most restrictive. Subfolders will become less restrictive as they get deeper into the project to isolate data and tasks. Setting “View+Download” for roles other than CAD Coordinators sets the default permission inheritance throughout the project.
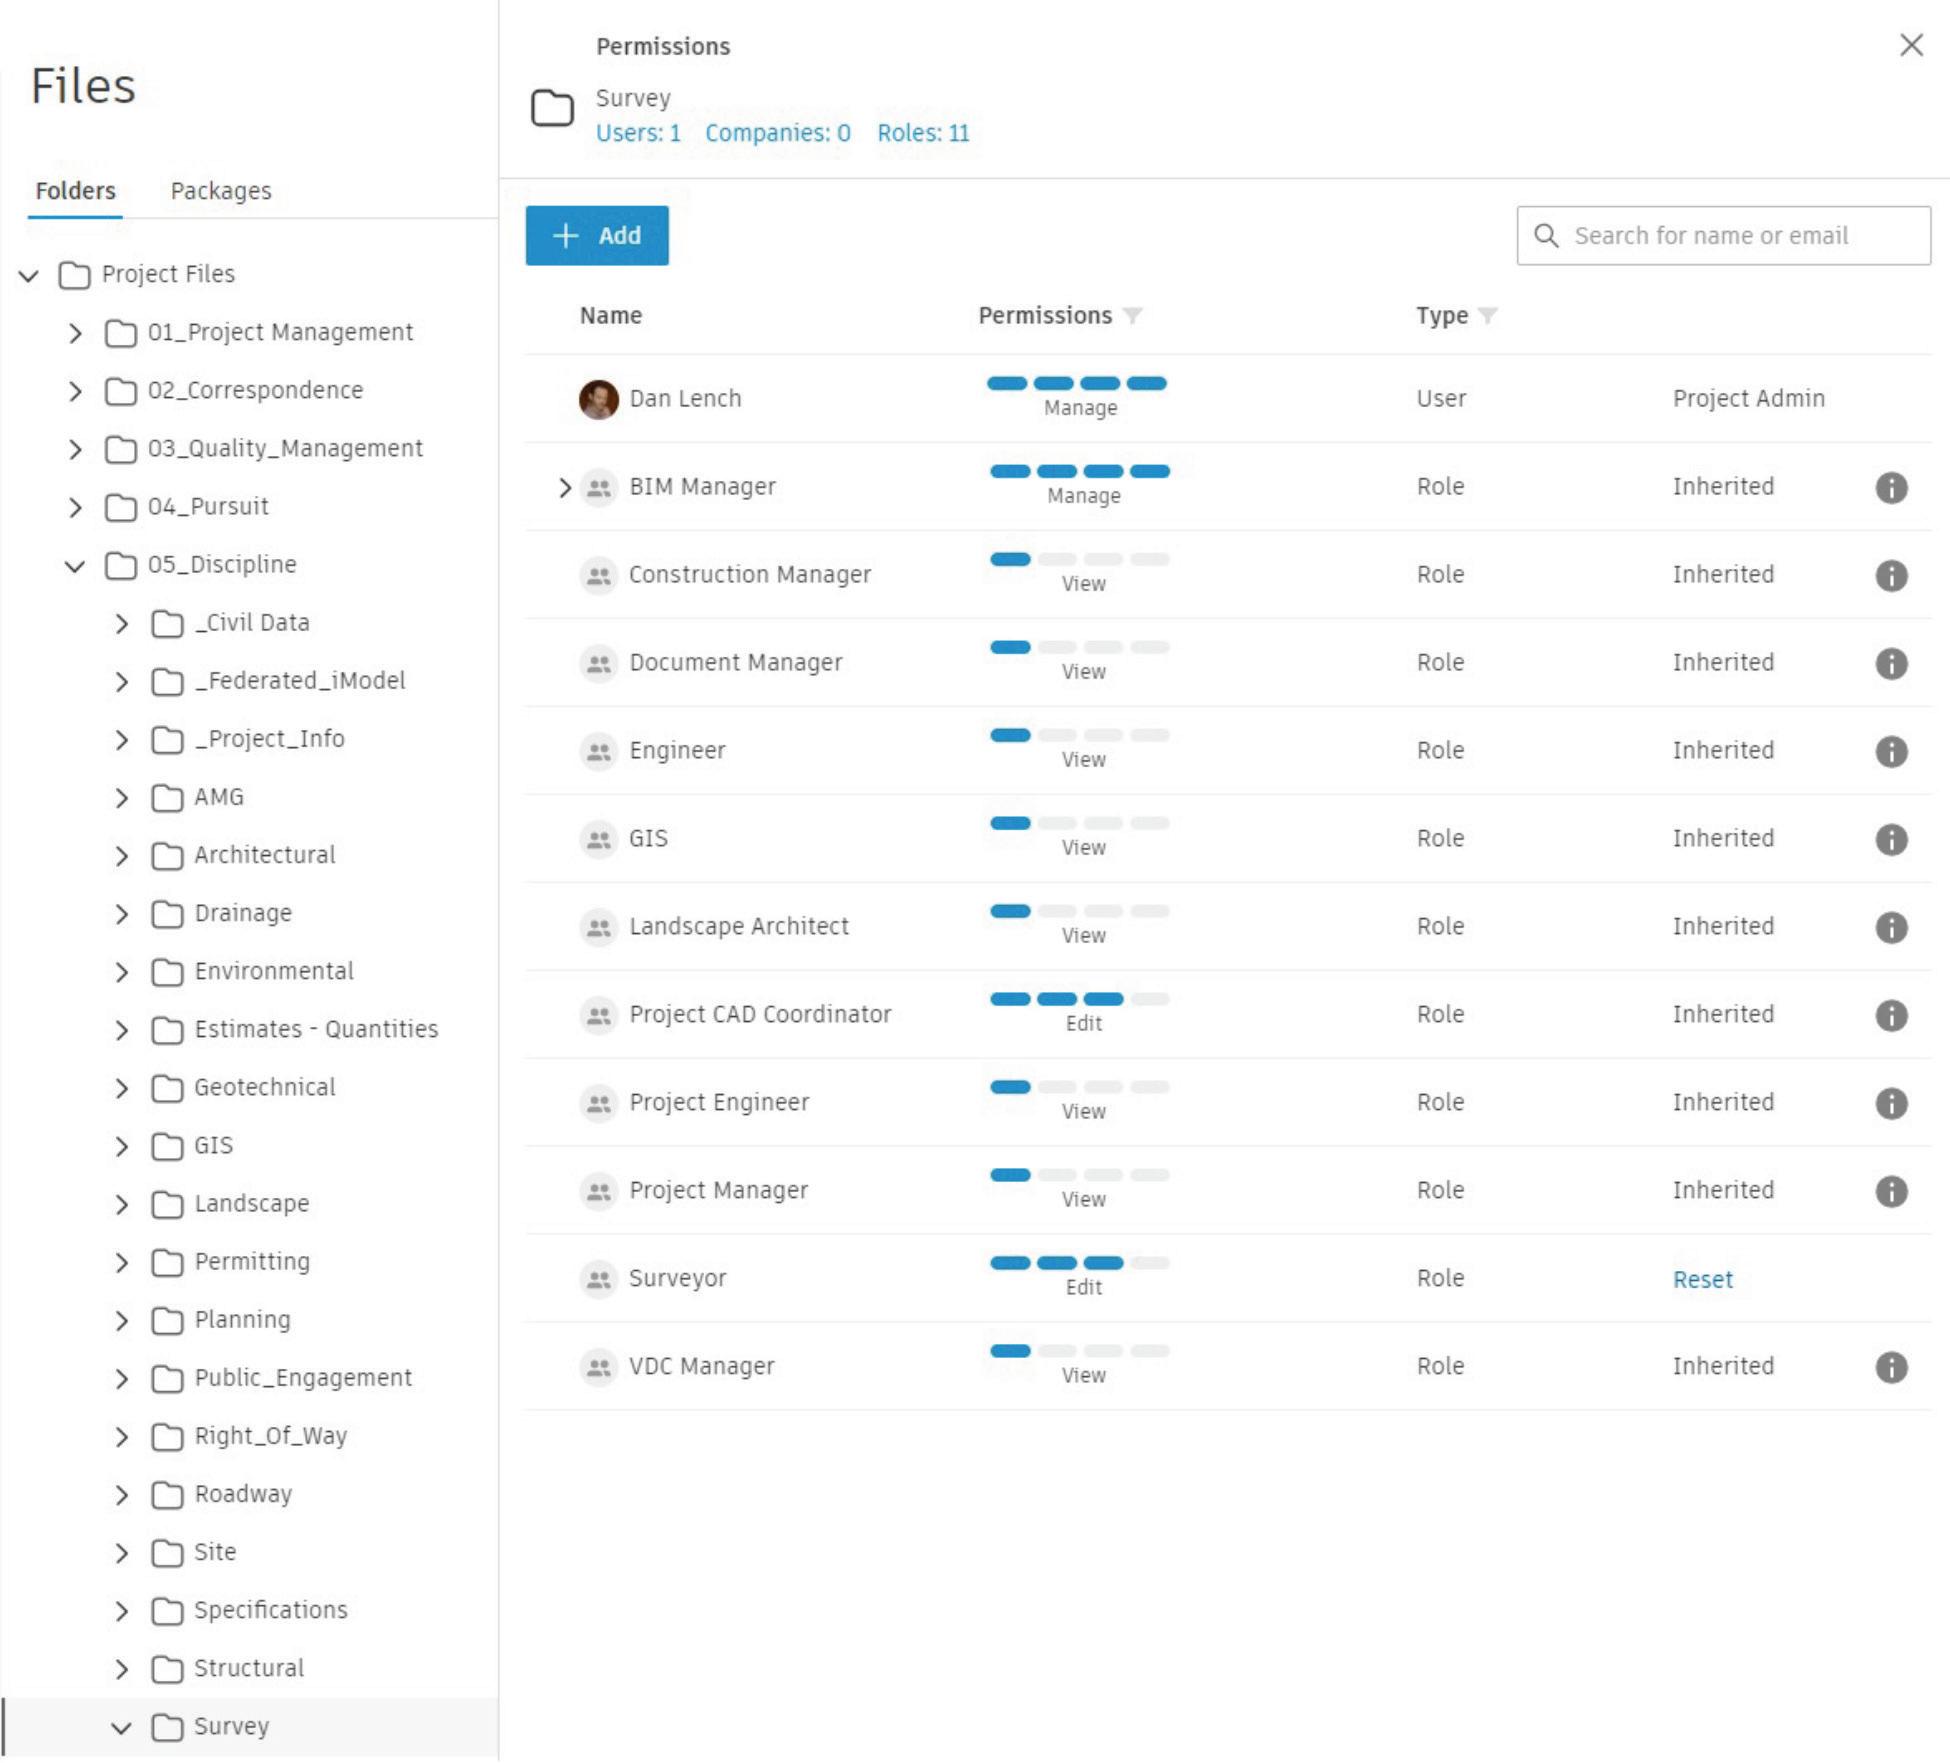
The Survey folder has the “View+Download” role inherited from the Project Root. This inheritance gives you the greatest control over folder access throughout the project. The Survey role has been allowed editing permissions. Users can have multiple roles assigned to them, the default company-wide role and a projectspecific role.
A project-specific role is handy when identifying a user who will share data between consultants over Bridge. Assigning a “Project CAD Coordinator” role with project-wide “Edit” permissions allows the user to share data. Lesser privileged roles do not allow sharing.
Understanding your company’s needs and assets and how these relate to a project’s data structure is paramount to enforcing responsible access across folders. I welcome additional observations and tips and look forward to learning from your ACC experiences.
Daniel Lench, with over two decades of experience in CAD management, is passionate about sharing his accumulated knowledge and workflows. A unified company and user experience, along with future-proofing the CAD workforce and systems, are the primary focus of what he develops. Daniel has consulted with private firms and city engineers to develop and optimize their environments. He work at WSB and can be reached at dlench@wsbeng.com
Figure 1: Project Root
Figure 2: Srvey Folder
The Civil 3D Grading Optimization Extension – A Case Study
The Grading Optimization (GO) extension in Civil 3D is a relatively new feature in Civil 3D that has the capability to gre atly reduce the time civil designers spend with grading tasks. The extension uses algorithms to iterate through TIN surface triangulation based on your own project specific design criteria. Two examples of grading criteria would be minimum/maximum slopes in an area and a building floor elevation. The GO works with simple polylines from your dwg file to derive a grading solution fast. It can also automatically transfer or update the results right back to Civil 3D. And it can return results with balanced earthwork much faster than I ever have produced.
I find the GO workflow to be fast and simple because it does not require specific elevation input for every object being constructed as you would need in a corridor or feature line grading model. The GO works primarily with simple 2D polylines at elevation 0.
As mentioned above, the Grading Optimizer works by manipulating surface triangles based on simple 2d polylines. It does not work with or recognize vertical curves used in profile designs. It will not compute cross slopes perpendicular from a centerline.
Due to the way the Grading Optimization Extension works I do not use it to produce a construction quality grading model. It can be used for very simple grading designs, but it is best used in my opinion, to provide a good rough surface that is already earthwork balanced. This optimized surface can be used to create a final grading model. This is done by either tracing layout profiles over the GO surface or superimposing elevations to feature lines from the GO surface for a final design and greatly reducing iterations with conventional grading techniques to balance earthwork.
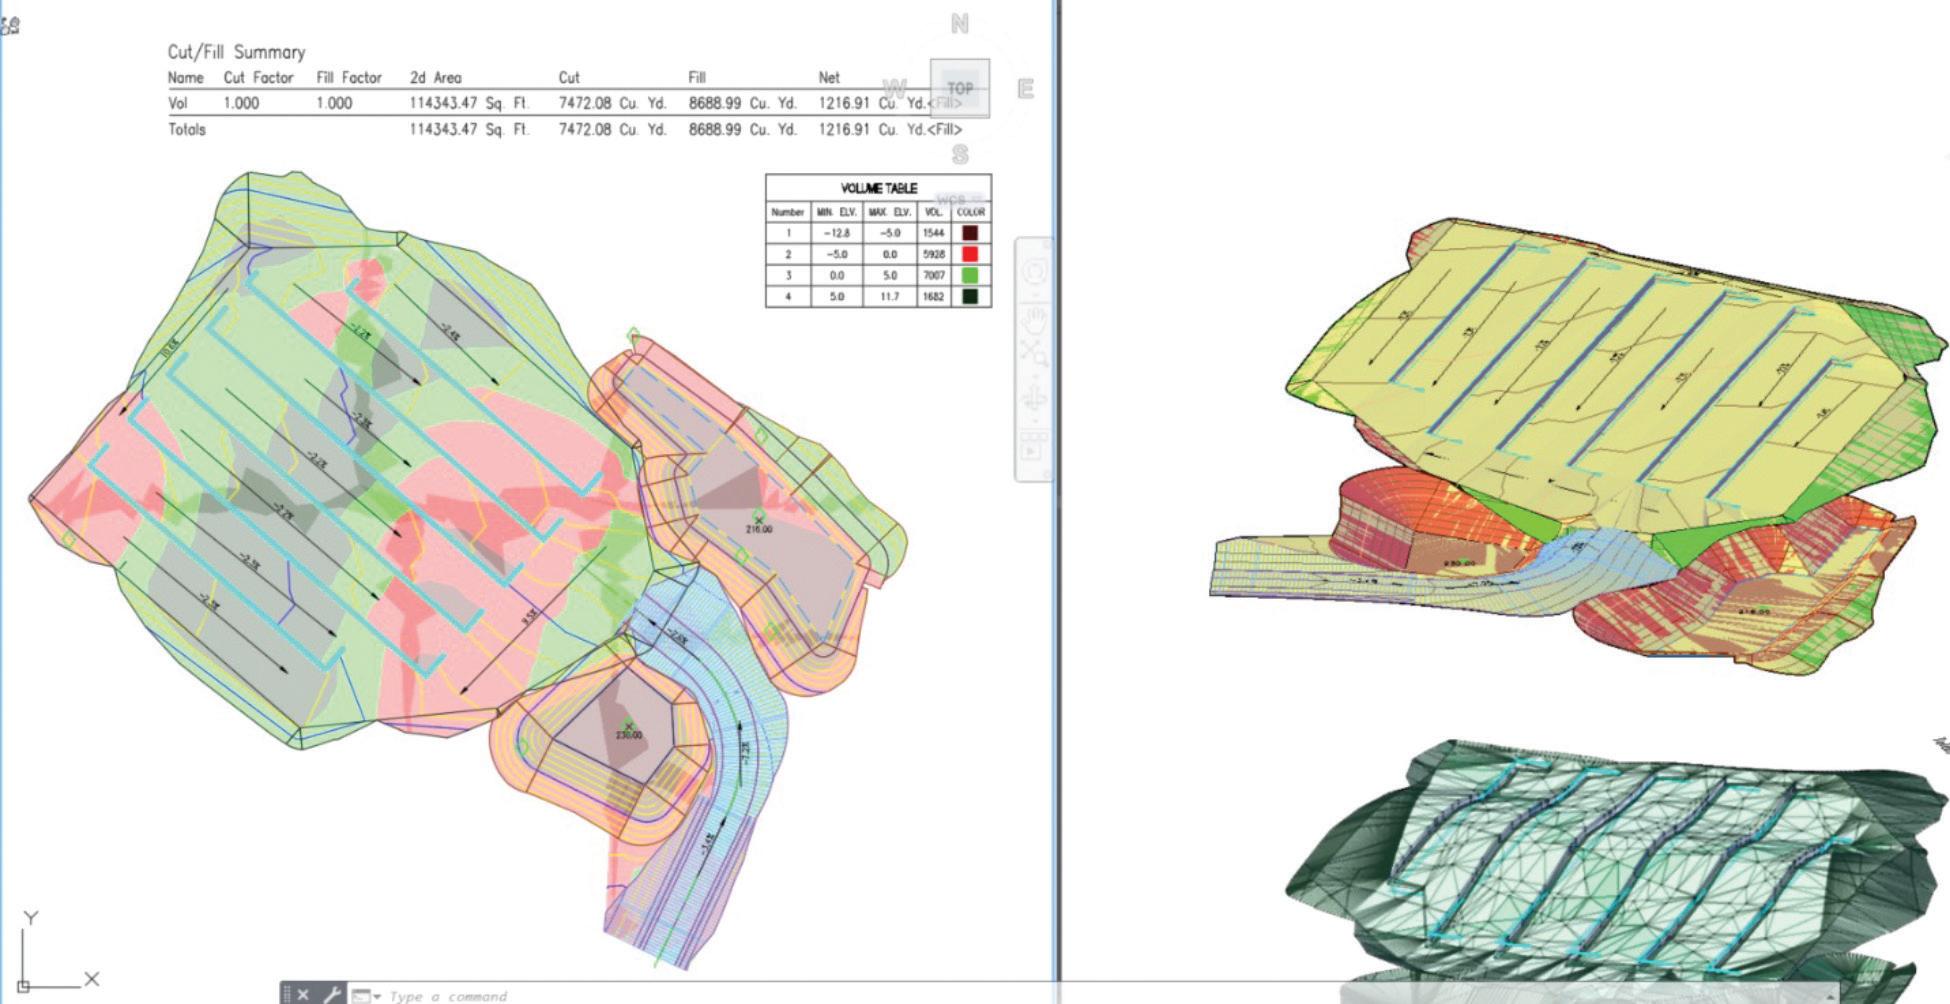
I recently worked with a coworker to compare a project’s proposed grading model that was created using a combination of a corridor, gradings and feature lines to create a proposed stepped landscape energy storage site. The site grading consisted of using 6 retaining walls to create 7 low
sloped equipment areas with vehicle access and two ponds. The grading task took some time. A couple of days of labor were spent designing and trying to balance the earthwork. The engineer did a great job getting the site to about 1200 CY of fill required.
The original grading model
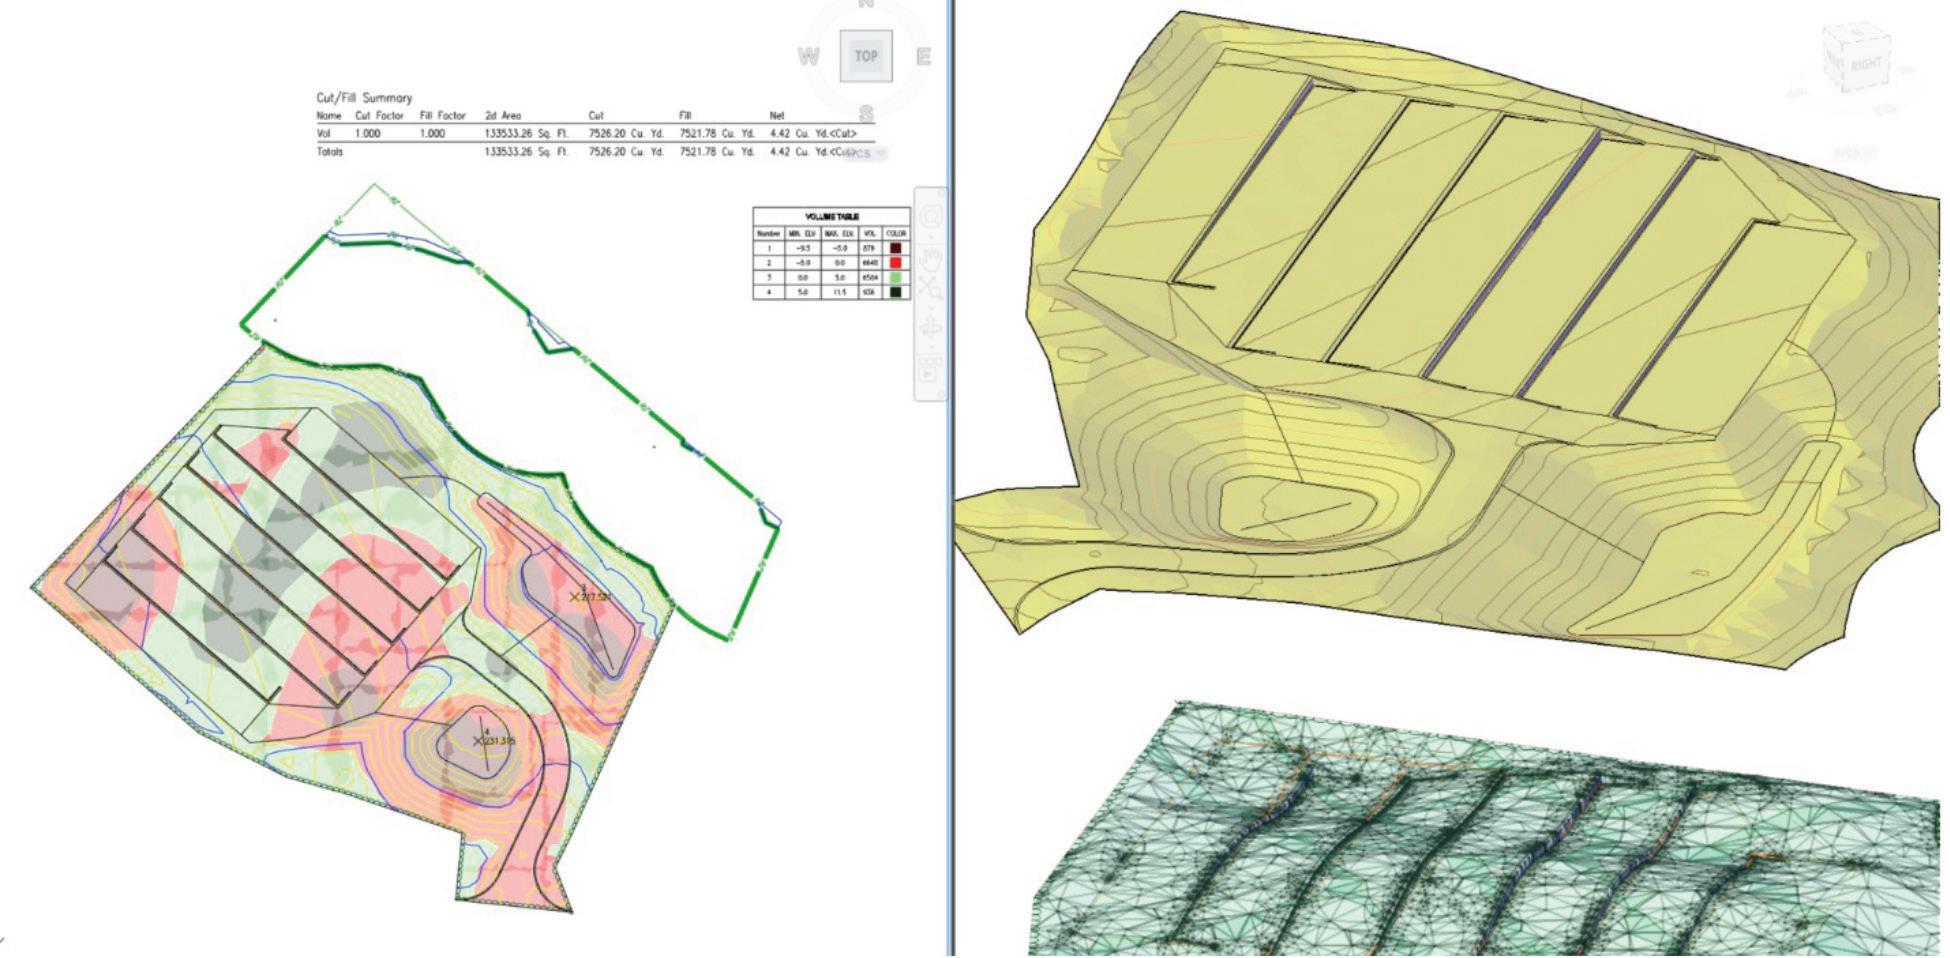
After examining the proposed model I started a new dwg file, created a Datashortcut Reference to the existing ground surface and XRef’ed in the linework for the proposed conditions. I spent about 30 mins copying or creating polylines for different grading areas and objects (access aisles, walls, ponds) and ran the grading optimization tool. The result took our civil engineering team by surprise as the Grading Optimization tool reduced the earthwork to 4 CY of fill without running it to completion. It also significantly reduced the face area of the retaining walls and reduced the total area of cut/fill depths in excess of 5’.
Even as a new user, the Grading Optimization process only took about an hour and a half to this solution and the results were great. The resulting model still needed revisions for vehicle access vertical design and minimizing retaining walls, but it saved a lot of construction costs and design iterations to balance the earthwork.
SUMMARY OF RESULTS
1. Earthwork
Original Grading: 1217 CY Fill
GO Grading: 4.5 CY Fill
2. Cut/Fill Depths
Original Grading: -12.8’ cut and 11.7’ fill
GO Grading: -9.5’ cut and 11.5’ fill
3. Retaining Walls
Original Grading: 3923 SF of face area
GO Grading: 2190 SF of wall face area (a 44% reduction)
4. Time Investment
Original Grading: 8 hrs.
GO Grading: 4 hrs.
Personally, I am sold on this relatively new feature and strongly recommend finding ways to make this part of your grading workflows. The GO is simple, easy to learn and has the capability to significantly reduce the time invested in grading tasks. If you are interested in learning how to use this great new Civil 3D feature follow the links below to a great web series by Autodesk employees, John Sayre, Charlie Ogden, and Valentin Koch.
Grading Optimization LIVE Part 1: The Grading Optimization Workflow https://www.youtube.com/watch?v=s1UCNW38qPI
Grading Optimization LIVE Part 2: Site Grading https://www.youtube.com/watch?v=pa4au__GuMY
Grading Optimization LIVE Part 3: Pond Design https://www.youtube.com/watch?v=3Xusn9-zW4c
Grading Optimization LIVE Part 4: Mass Grading https://www.youtube.com/watch?v=fDmZNOM9KXs
Grading Optimization LIVE Part 5 Subdivision Grading https://www.youtube.com/watch?v=S-VM3jaehgA
Grading Optimization LIVE Part 6 Retaining Walls https://www.youtube.com/watch?v=5RRHQS3mYpk
John Mayo, PE, CFM, CME, has worked as an engineer for private developers, municipalities, highway authorities (as a consultant) and utility companies (as a consultant). His projects have ranged from residential, commercial, retail and industrial sites, stormwater design (private site and municipal systems), flood analysis and culvert design, utility design and multi-county mapping, survey mapping (F2F and point cloud data extraction). John's CAD skills began with AutoCAD Release 9 and then with Softdesk 7 for civil engineering design. He is proficient with AutoCAD, Civil 3D, Map 3D, Infraworks, HydroCAD, Hec Ras, Revit, ArcGIS and other engineering and surveying applications.
Engineering Technology Manager – New Leaf Energy
Adjunct Professor – New Jersey Institute of Technology
Autodesk Expert Elite - Charter Member
AUGI Members Reach Higher with Expanded Benefits
AUGI is introducing three new Membership levels that will bring you more benefits than ever before. Each level will bring you more content and expertise to share with fellow members, plus provide an expanded, more interactive website, publication access, and much more!
Basic members have access to:
• Forums
• HotNews (last 12 months)
• AUGIWORLD (last 12 months)
DUES: Free
Student members have access to:
• Forums
• HotNews (last 24 months)
• AUGIWORLD (last 24 months)
• AUGI Educational Offerings
DUES: $2/month or $20/year
Professional members have access to:
• Forums
• HotNews (full access)
• AUGIWORLD (full access and in print)
• AUGI Library
• ADN Standard Membership Offer
DUES: $5/month or $50/year
Bob’s BricsCAD Customization Journey
Like every great CAD software, BricsCAD® offers users an almost infinite number of customization options, allowing you to work exactly the way you want. However, with all these options, it can seem a little overwhelming.
To help you learn how to get started, we’ll follow first-time user “Bob” through his journey to customizing BricsCAD. From confusion to satisfaction.
Bob is an experienced 2D and 3D drafter, and team lead. He’s used many different CAD software products over the years but now works mostly in 2D. His boss has asked him to manage the migration of his team to BricsCAD.
WORKSPACES
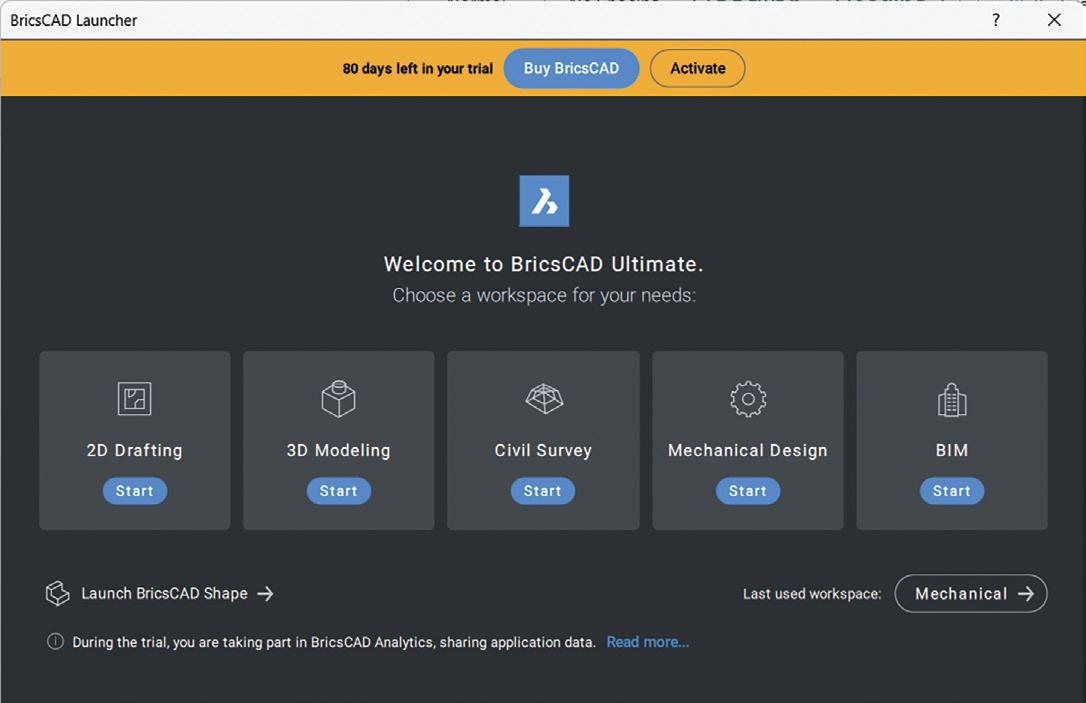
After downloading and installing BricsCAD, the first thing Bob sees is the Launcher. The Launcher asks you to pick a workspace: Drafting, Modeling, Civil, BIM, or Mechanical.
Bob looks at the five workspaces and selects Drafting, as this best fits his team’s needs at the moment.
Drafting
For those that only need 2D tools. This strippedback workspace means there’s more space for drafting and annotation tools.
Modelling
For those that work in 3D. In the Modeling workspace, you’ll find tools for direct modeling, 3D parameters, and point clouds.
“Bob” starting his journey and confused about where to start. Photo by Oladimeji Ajegbile. Credit Pexels
Figure 2: The Launcer.
Civil Survey
For those that work in the Civil field. Tools for TIN surfaces, strings, corridors, geo data, and more can be found here. The Civil Explorer panel also offers extra functionality.
BIM
For those that want to add BIM data to their drawings. Here you’ll find tools for adding data, modeling building elements such as stairs and roofs, Scan2BIM, and LOD controls. Panels such as the Project browser, also make taking a construction project from ideation to workable drawing a breeze.
Mechanical
This is the workspace for those that work in 2D or 3D. Here you’ll find tools for creating sheet metal parts, documentation, assembly design, and advanced 2D drafting tools.
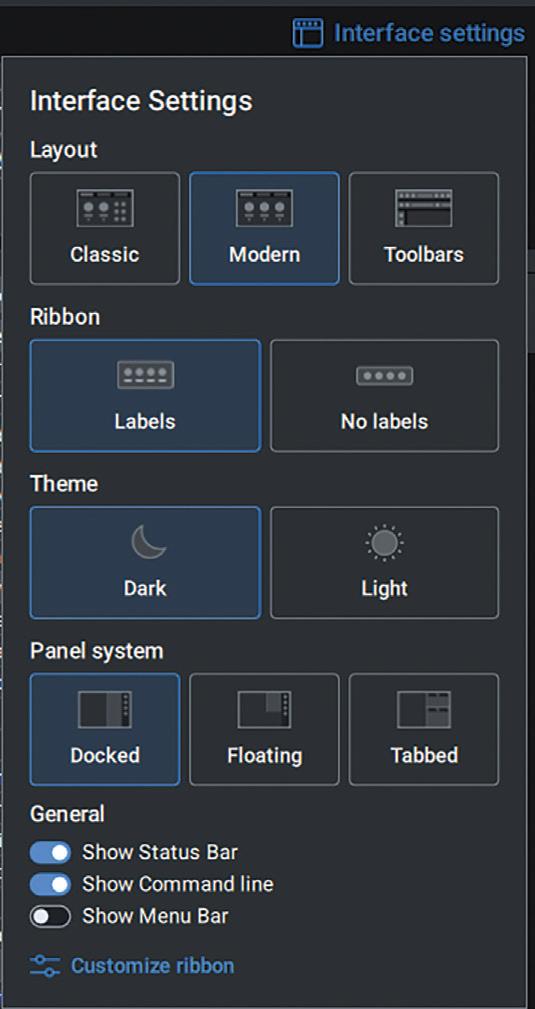
INTERFACE SETTINGS
The next point of customization for Bob is the Interface Settings.
You’ll find these in the top-right of BricsCAD and they help you set up the UI (User Interface) quickly (Figure 4).
THE LAYOUT
BricsCAD offers pre-built workspace layouts: Classic, Modern, and Toolbars. Bob is interested in the unique productivity tools available in BricsCAD and wants something that’s easy on the eye, so picks the Modern layout.
Classic
For those that come from the traditional CAD software. The layout will appear familiar. Smaller icons and less text means that more tools are displayed. Unique BricsCAD tools are left out.
Modern
Designed with hours of research and real, user feedback. Focused on workflows, with priority on the most frequently used commands.
BricsCAD’s unique productivity tools are located seamlessly within the appropriate tabs. Larger icons, more labels, and comfortable spacing makes it easier to find the tools you need when you need them.
Toolbars
Users that have been working with CAD since the 1980s will find these workspaces refreshingly familiar. The Ribbon is switched off by default and the tools are arranged around the edge of the workspace.
LIGHT MODE/DARK MODE
BricsCAD offers users two color themes: light and dark. Bob likes the eye-friendly dark mode and leaves the default switched on.
Figure 3: Key customization areas of the workspace.
Figure 4: The Interface Settings dialog.
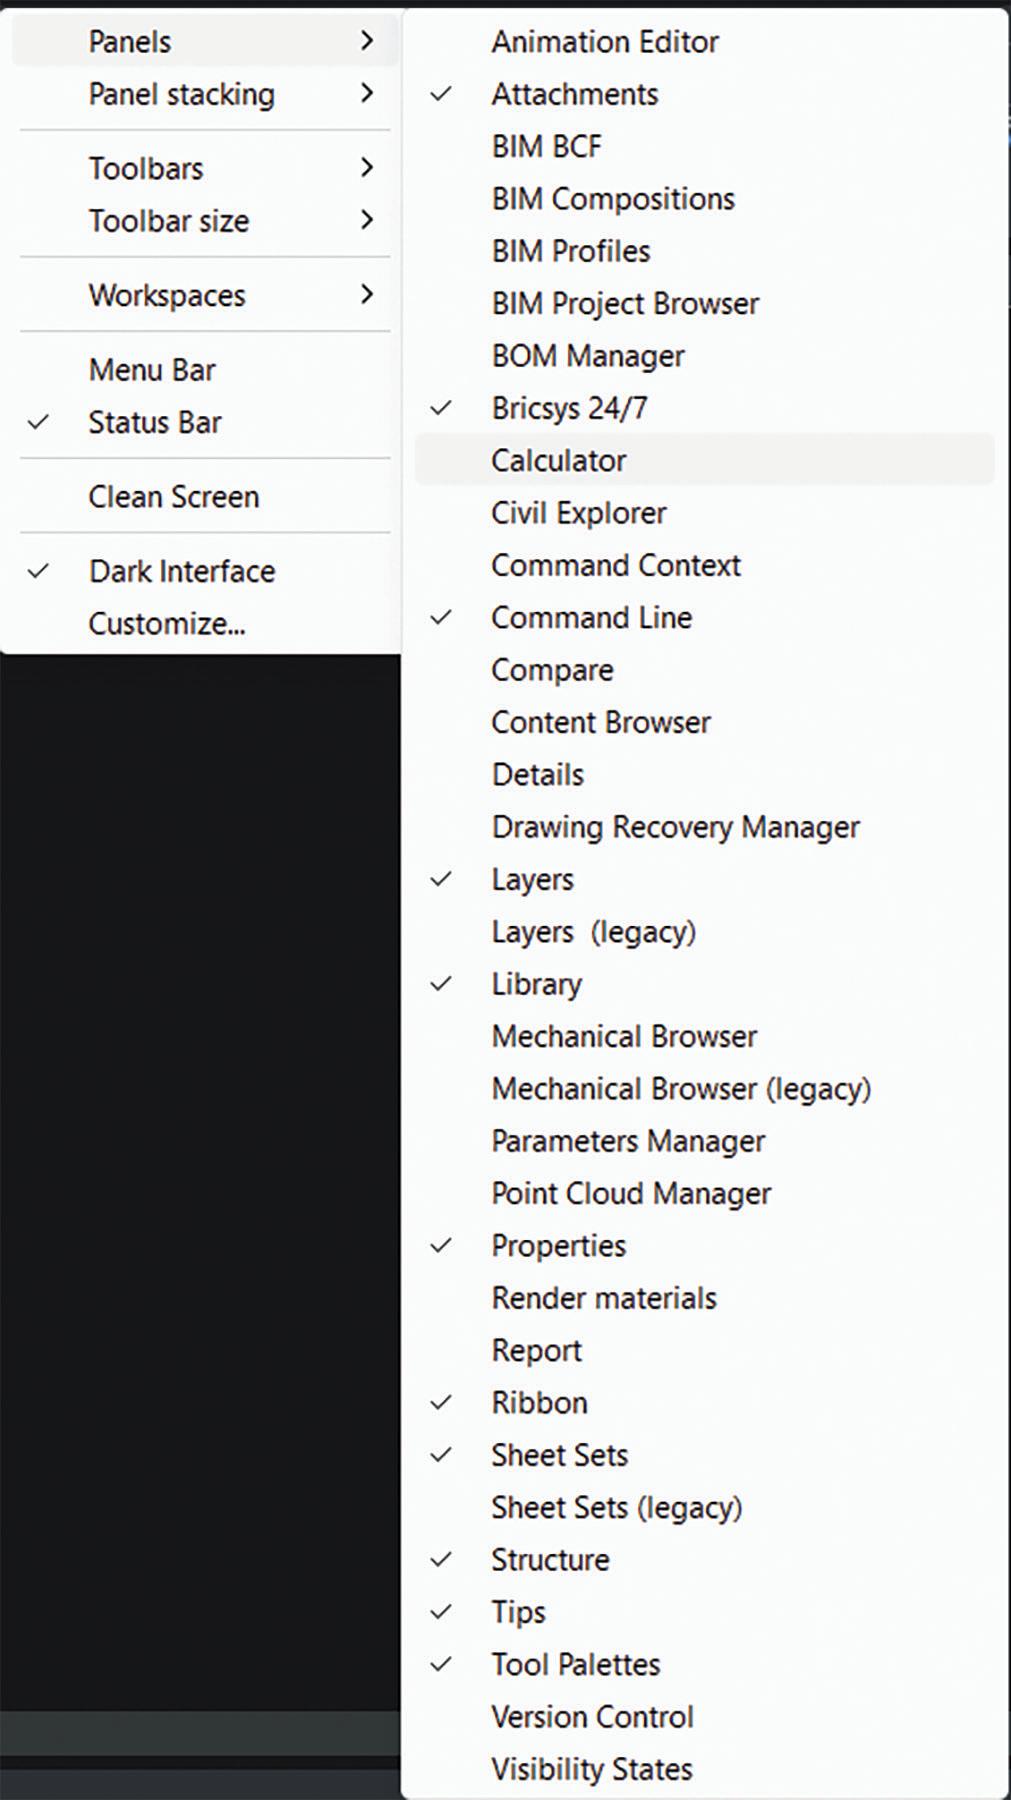
Panels
Panels are saved to workspaces. They are easy to turn on and off and can be dragged and dropped to any part of the workspace. Most of the default panels fit well, but Bob wants to add the Calculator.
Add a panel to a workspace:
1. Right-click on the ribbon to open the context menu.
2. Move the mouse to ‘Panels’ and then select the panel you wish to add, in this case, Bob picks the calculator.
Reposition a panel or Toolbar:
1. Click on the three dots on the panel.
2. Hold the mouse button and drag.
3. Release the mouse button and place the panel.
Note: you can dock or float the panel or toolbar.
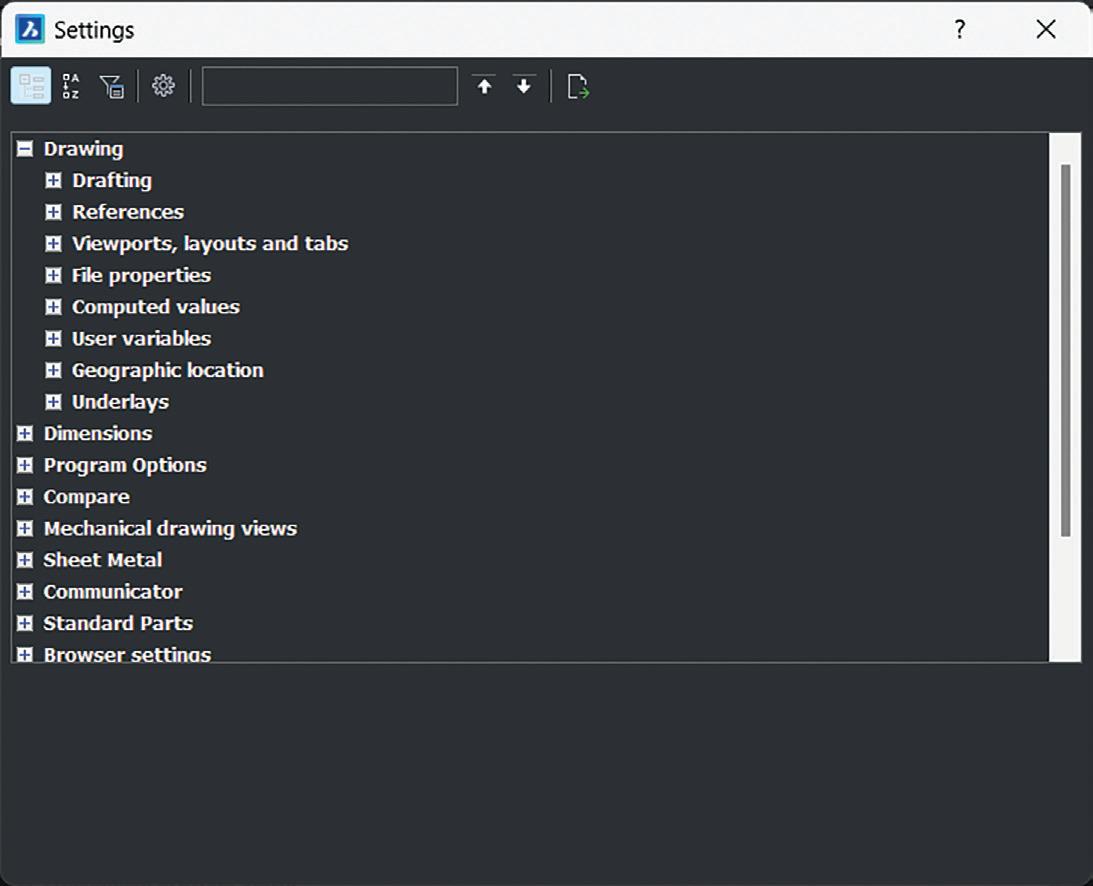
THE SETTINGS DIALOG
The next thing Bob wants to do is modify some of the system variables (settings). To do this, naturally, he uses the Settings dialog (Figure 6).
The Settings dialog displays all the system variables for BricsCAD in a single location. Here you’ll find controls for the drawing, display, file paths, commands, and more. No need to hunt around different dialog boxes to find what you are looking for.
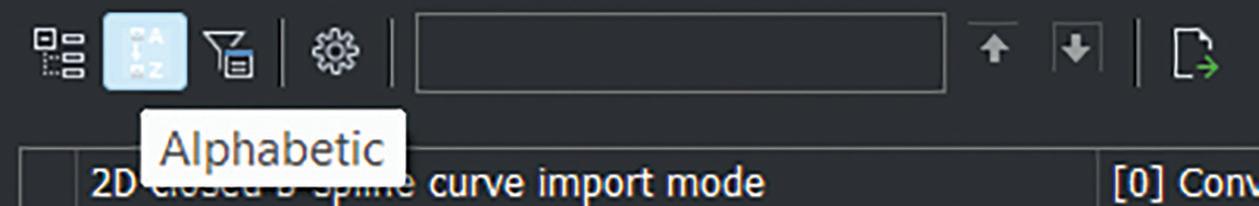
Changing a setting
Bob likes to draw with a cursor that fills the screen, so heads over to the Settings dialog and searches for CROSSHAIRSIZE, and changes it to 100%.
By default, the system variables are organized by category and they can be searched with the search bar. To improve the search functionality, click the ‘Alphabetic’ sorting option at the top (Figure 7).
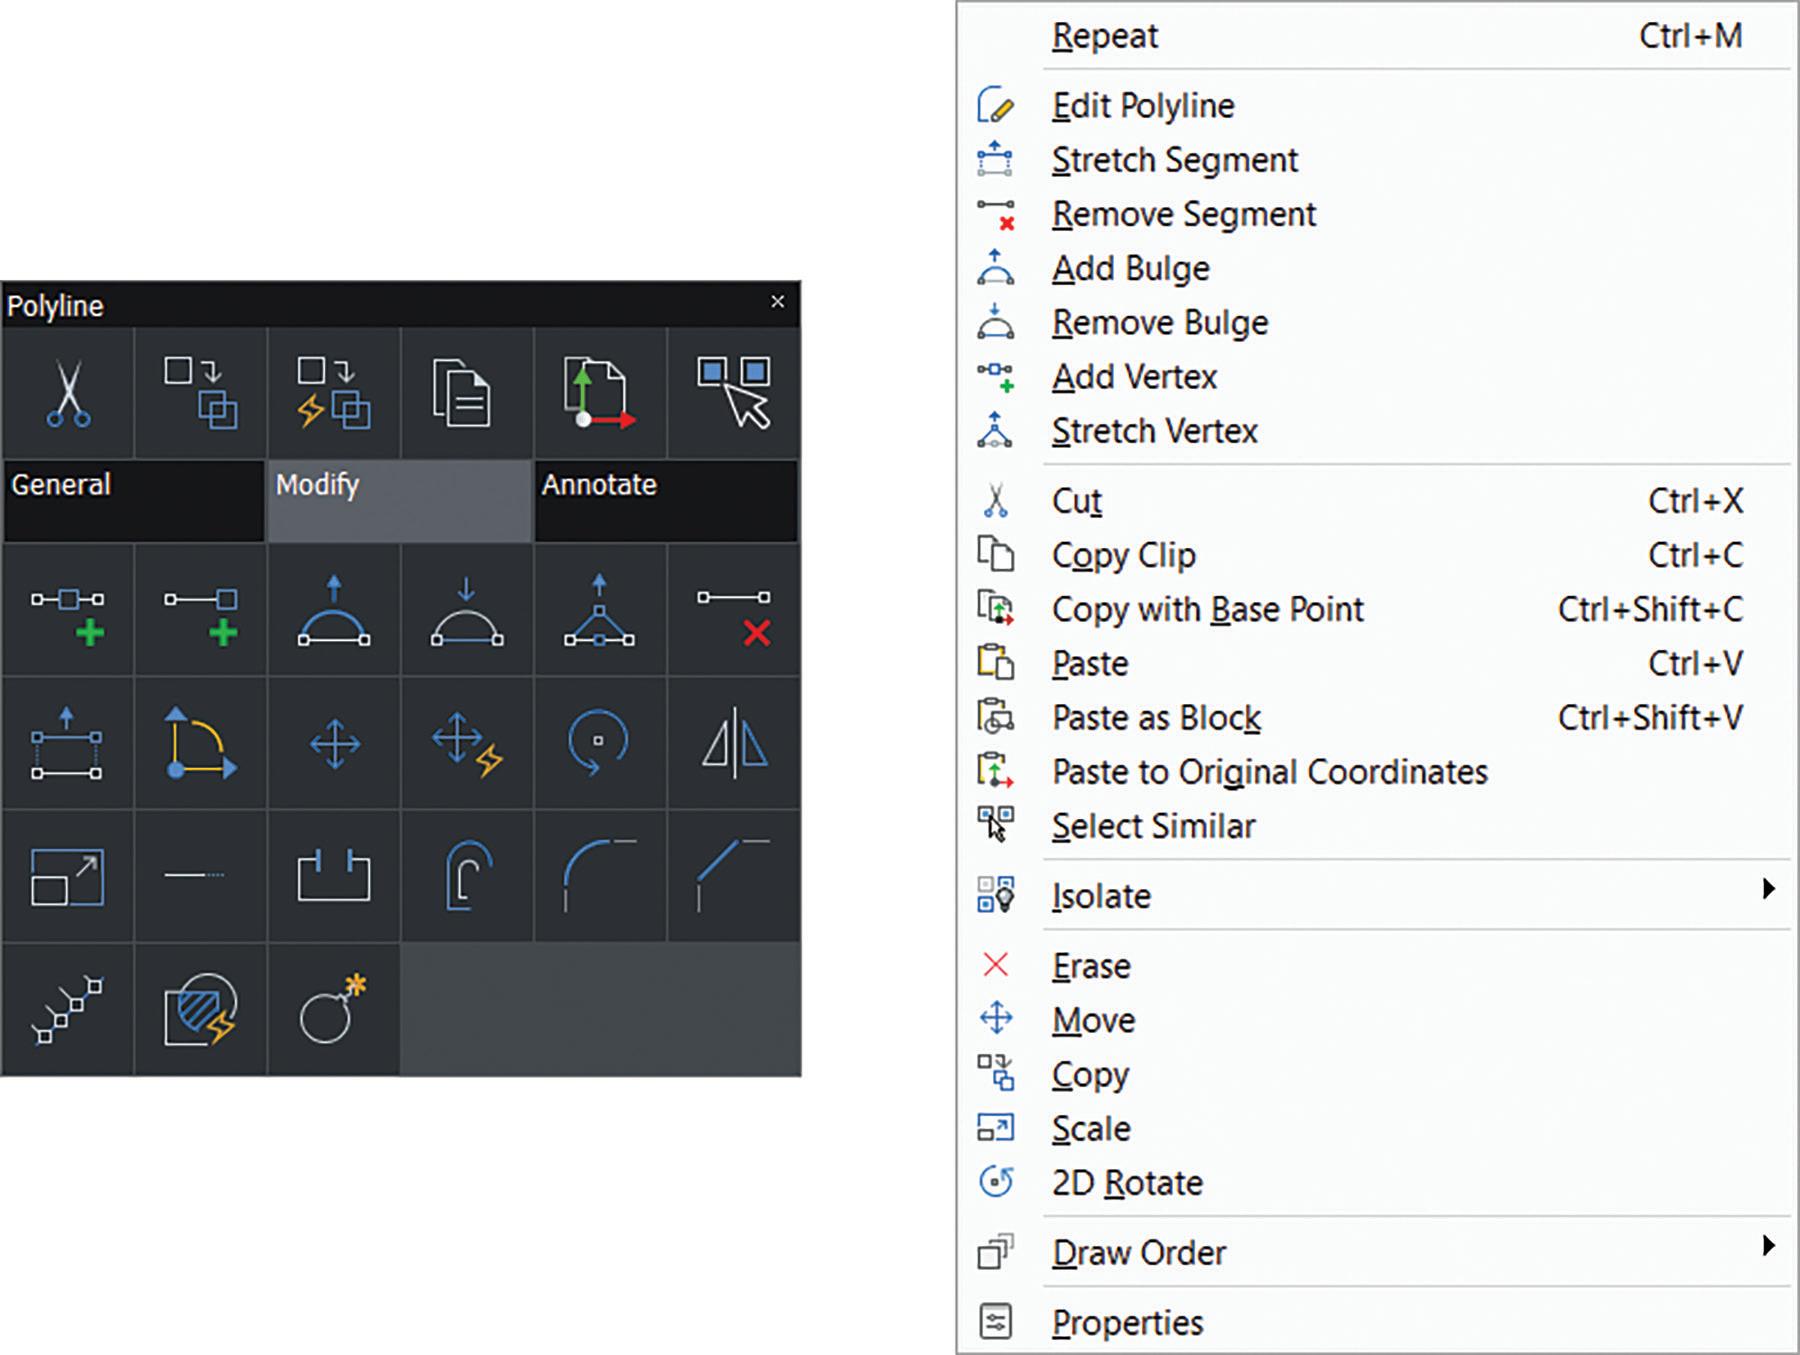
RIGHT-CLICK MENU VS THE QUAD
BricsCAD offers 2 forms of selection-specific menus, both place the tools you need under the cursor; the Quad and the context menu.
Figure 5: Adding a panel.
Figure 7: The Settings dialog.
Figure 6: The Settings dialog.
Here Bob favors a more traditional CAD experience, and turns the Quad off from the Status bar, so he can use the context menu, “the rightclick menu”.
The Quad
The Quad, is an alternative to the Comm and line, Ribbon, or Toolbars. It places commands that are relevant to the selected drawing entities under the cursor, reducing the number of clicks and cursor movement.
The Context Menu
The context menu a.k.a the “right-click menu” is a more familiar method for manipulating entities in model and paper space. Although it lacks many of the tools of the Quad, it still contains most of the key tools you need based on the selected entities.
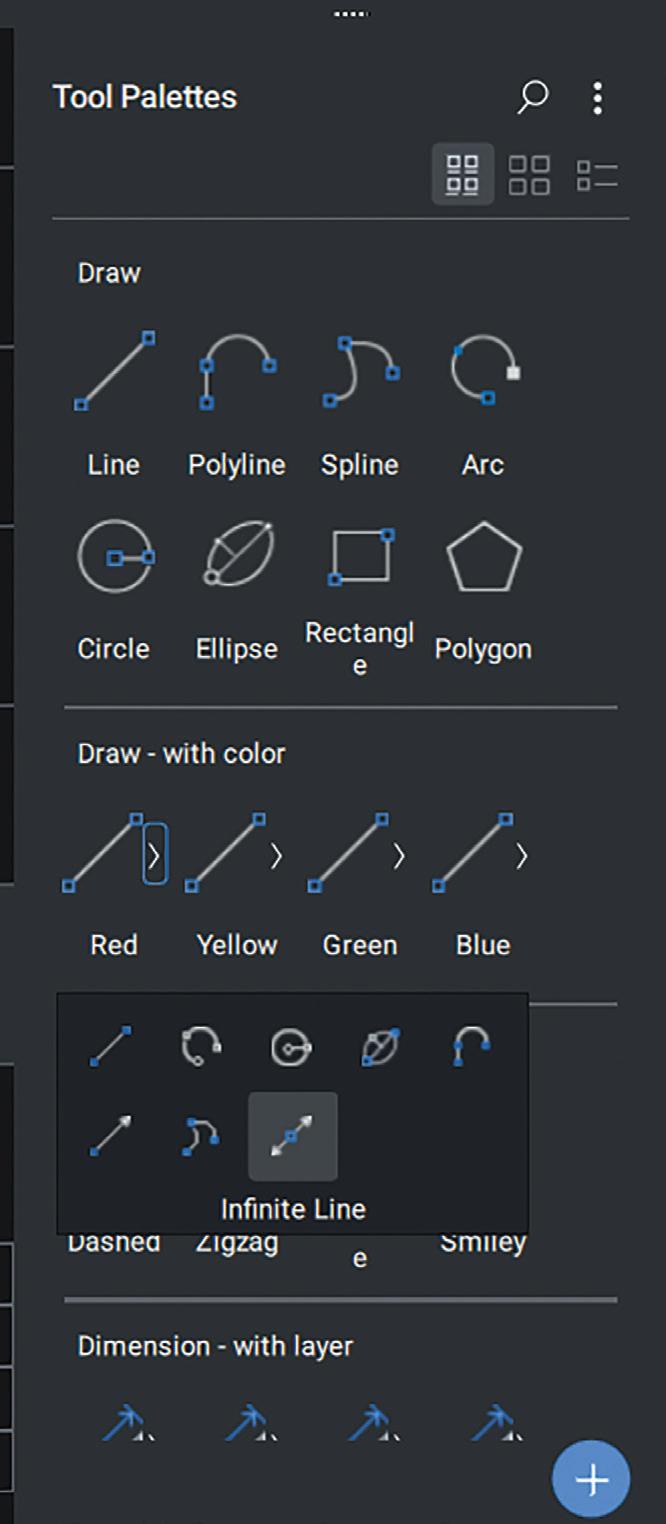
TOOL PALETTES
Bob migrates his tool palettes to BricsCAD easily. All he needs to do is load them into BricsCAD.
Tool Palettes offer a central location to access blocks, hatches, and commands. Entities can be set to a specific layer, color, line weight, and more.
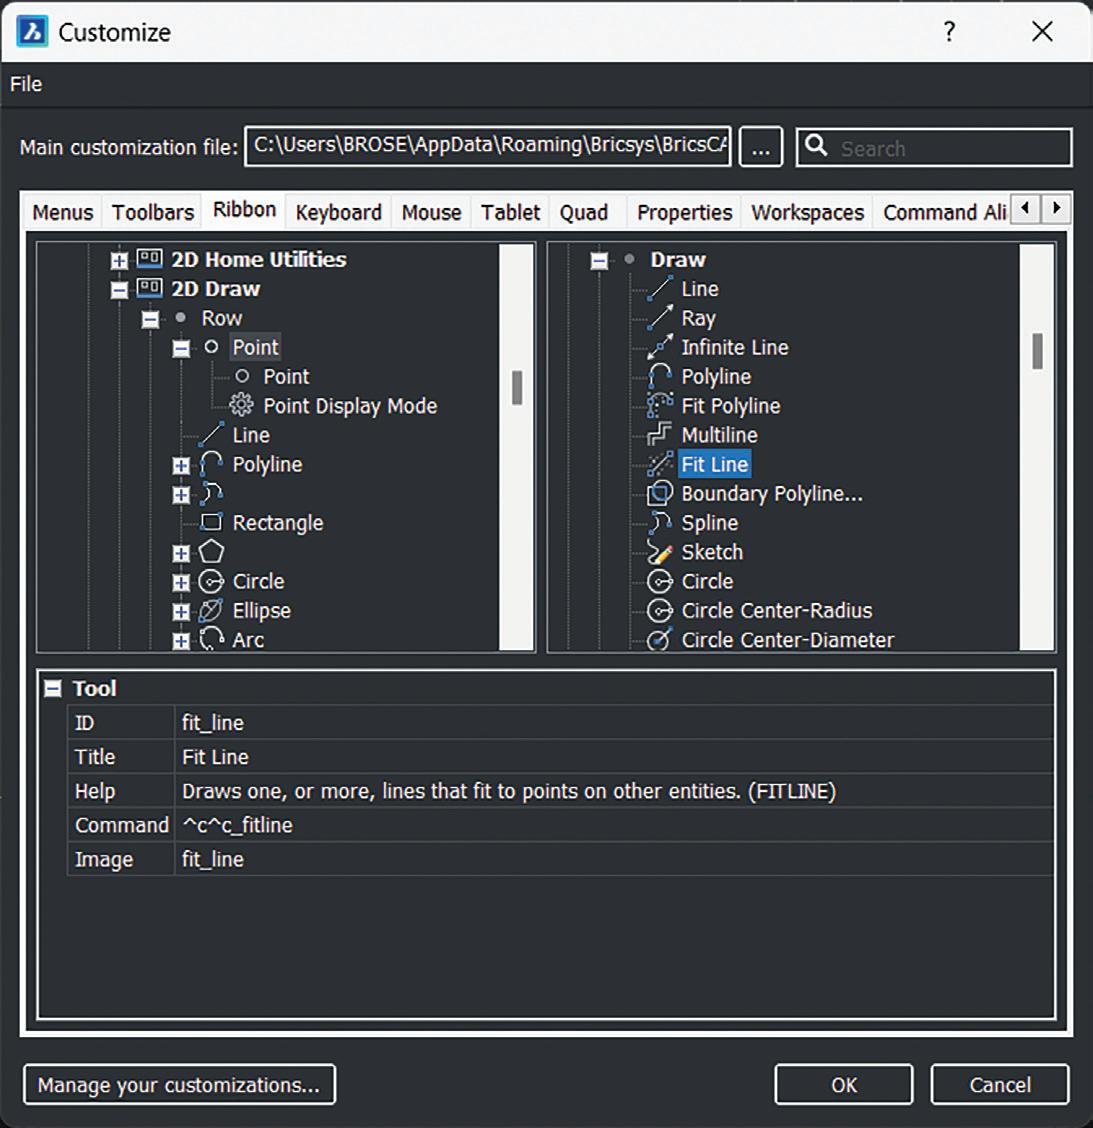
THE CUSTOMIZE DIALOG
The next thing on Bob’s customization wish list is to create a CUI (Custom User Interface) file. He’ll make some shortcuts, modify the ribbon, and add some aliases to BricsCAD for his most frequently used commands and actions. Once finished, he’ll share these customizations with the rest of his team.
To do this he launches the Customize dialog with the CUI command (Figure 10).
The Customize dialog offers the following options:
Load CUI files
It’s possible to load and unload cui files, allowing you to share your BricsCAD customizations with others. A CUI file contains information about the workspace.
Figure 8: Left: The Quad, Right: The context menu.
Figure 9: The Tool Palettes panel.
Menus
The menu bar is a series of tabs with drop-down menus that run across the top of BricsCAD. On Windows, this is turned off by default. You can turn it back on with the MENUBAR system variable.
Toolbars
Toolbars are similar to the Ribbon, in that they contain a number of tools, typically in a row and they can be docked or undocked. However, toolbars can be docked on the workspace in more locations. They also contain no text (are image only) and offer less layout options.
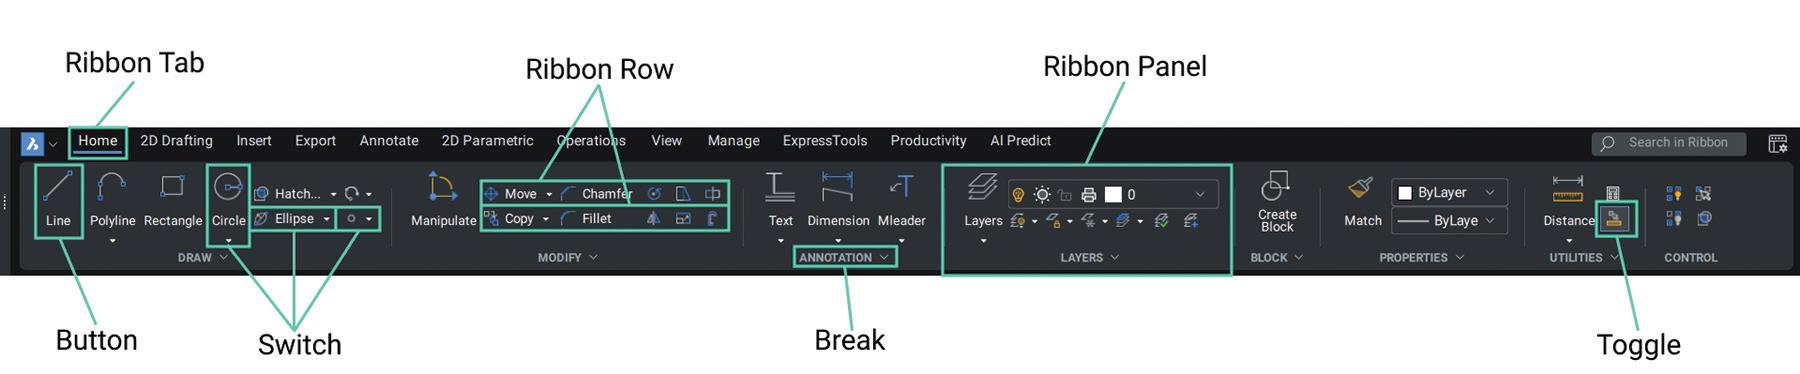
The Ribbon
As a more advanced user, Bob has been asked to create a ribbon to share with the rest of his team. This will contain some of the custom LISP scripts already in use, as well as some of the most frequently used commands.
The Ribbon displays a number of tools at the top of the BricsCAD workspace. This provides you with easy access to the tools you need. It’s possible to create a fully customized Ribbon with custom tools and icons.
The Ribbon is composed of a series of tabs, composed of a set of panels. In turn, ribbon panels are composed of rows that contain tools, controls, and sub-panels.
Keyboard Shortcuts
Keyboard shortcuts allow you to launch a command or script with a single, or combination, of keyboard buttons. BricsCAD contains a number of these out of the box, such as Ctrl+2 – launches the Drawing Explorer, and Ctrl+P – launches the Print dialog, but you can also make your own.
Mouse Buttons
Just like the keyboard, you can also customize your mouse buttons.
The Quad
The unique-to-BricsCAD, context-sensitive Quad menu is as customizable as the rest of BricsCAD. You can even add your own custom tools and tabs.
Workspaces
Workspaces contain the information about which tabs, panels, and other UI elements are displayed.
Command Aliases
Much like keyboard shortcuts, you can program commands to launch after any sequence of numbers and letters. For example, if you find you are using the COPYGUIDED3D command frequently, you can program BricsCAD to launch COPYGUIDED3D with the input of just CG3.
Good to Know: CUI changes are automatically saved when BricsCAD is closed, but not on a crash.
Figure 10: The Customize Dialog.
Figure 11: Anatomy of the Ribbon.
PROFILES
Once Bob is done customizing, he shares the CUI file and his user profile with the rest of his team.
User profiles save settings and allow you to share your customizations with others, or migrate to another computer:
• The current CUI file (does not save CUI modifications)
• The current workspace.
• Configuration settings: all system variables which are saved in the Registry and user preferences.
• Default plot settings.
• Settings in dialog windows.
• Project settings.
• Recent paths.
• Status bar settings.
• Properties panel settings.
• Toolbar and menu configurations.
• Worksets.
Good to Know: Profile changes are automatically saved when BricsCAD is closed, but not on a crash.
Share a Profile
To save and share a profile, use the PROFILEMANAGER command to launch the Profile Manager dialog. You can also do this with BricsCAD‘s User Profile Manager application, which is automatically installed on your machine at the same time as BricsCAD.
LISP
BricsCAD is compatible with AutoLISP scripts. As a result, Bob doesn’t need to do anything to reuse his company’s LISP scripts, other than rename and load them.
To create a custom script, use BricsCAD’s built-in AutoLISP editor; BLADE.
CUSTOM APPLICATIONS
Finally, Bob looks at how he can convert his company’s custom application to run on top of BricsCAD. He’s pleased to find that the changes required are minimal and Bricsys’ support team responds quickly to all his questions.
BricsCAD’s BRX API is highly compatible, and it costs nothing to join the Bricsys Developer Collective. The following APIs are supported:
.NET
• LISP
• DIESEL
• COM
• VBA TX
MORE ABOUT BRICSCAD
BricsCAD is professional CAD software without compromise. Accelerate your time to deliverable without compromising on performance, cost, licensing flexibility, and data security. Not ready to buy? Download the free, 30-day trial of BricsCAD at Bricsys.com. Would you like free lessons? We have that available with Bricsys Learning. Ready to migrate to BricsCAD? Download the Migration Guide. The latest version of BricsCAD improves the tools and features users love, as well as new functionality and UI that supercharge productivity. Follow us today on LinkedIn and Youtube.
MORE ABOUT BRICSYS
Bricsys, part of Hexagon®, is the global technology company that creates the BricsCAD family of computer aided design (CAD) products and the Bricsys 24/7 project collaboration platform. We are relentlessly committed to the success of our customers by offering cost-effective, missioncritical CAD software with industry-leading product support. Learn more at www.Bricsys.com.
Hexagon is a global leader in digital reality solutions. Learn more about Hexagon (Nasdaq Stockholm: HEXA B) at hexagon.com and follow us @HexagonAB.
Rose Barfield is a Product Owner of BricsCAD and a 2D/3D drafting expert, specializing in digital art and CAD. Before coming to Bricsys® she spent years working as a technical illustrator for various Engineering firms. She has a passion for engineering and drafting and loves to share tips and tricks with others in the industry.
Smooth Production Not Guaranteed
Ilove to clean. It’s a bit of an obsession. So much so that I’ve worked cleaning into my weekly schedule. My home being clean is essential to my mental well being and my productivity as a person. I treat my work as a CAD Tech with just as much obsession. While I haven’t worked in Civil 3D/AutoCAD as long as some of the masters, but I have learned that there are many ways to reach the same result in Civil 3D. However, clean and well-maintained files are non-negotiable for a smooth production experience. Just as having an unclean home has negative effects on someone’s health, having poorly maintained project files will ultimately lead to negative effects on the production of a project.
SURVEY
With Civil 3D being my main expertise, everything starts with the survey file. Some firms have internal surveying which helps greatly with keeping files within company standards and in a state that would be more friendly to whoever has to work with the file. Other firms must rely on external companies for survey, and results may vary. Having standards baked into the survey contracts will help with maintaining standards, but this can be a hit or miss when the surveyor is contracted by the client instead of your firm. These constraints should be expected and are not impossible to work within, but the drafter does have the responsibility to ensure that the file received can be worked with. This will range from separating the 3d components
Image by kjpargeter on Freepik
from the 2d linework, making sure that line types match the legend, or checking for geolocation and scale factor accuracy. Firm standards will vary but ultimately the file will need some amount of cleanup to ensure a good working experience. The survey file will be the foundation for most files in the respective project and making sure it is in good working order will set the tone for how smooth of an experience the production team will have.
SITE
The next file in the proverbial file pyramid, would be the proposed site file. This can be set up as a blank drawing with the survey referenced and geolocation set if the production team is waiting on files, information from the client, or if the proposed site is still being coordinated. Once the coordination is finished and a background is provided from the other consultants the engineering of the site can start. It’s important to remember that an external file should be triaged before being introduced into the project file structure.
3D FILES
Once the two main background files are set up, Civil 3D can be leveraged to a better degree. While it may seem simple, setting up your 3d files correctly will pay dividends. Using the data reference feature to interconnect your surfaces and utilities. A perfect example of this is creating an empty proposed surface and creating a data shortcut. This data shortcut will be used in the proposed utility file to tie the utilities to the surface. This will enable drafters to leverage the smart labels from the very beginning of the project instead of having to wait, or God forbid, using normal leaders to label utilities. Even if you don’t have utility paths completely coordinated with the other consultants, you can still leverage this strategy by creating empty pipe networks and setting the proposed surface to be the linked surface that should have been data referenced in the proposed utility file. I can’t emphasize how much easier this set up makes the production process. You can have all these 3d items linked and begin a preliminary design while coordination is ongoing. Another powerful and underutilized tool that can be used by both Civil 3D users and Revit users, is the function to set a shared coordinate point. If you don’t know about this function, I highly recommend looking into it and implementing it into all projects. This can drastically reduce the amount of time both groups of users spend trying to use files from each other.
SHEET FILES
Once all these background files are set up, creating sheet files becomes an easier task as well. Practices will vary from firm to firm, but you can essentially create a single sheet file with all the elements needed, and then strip them of background files as needed to set up the sheet files as needed. If your background files are geolocated you can begin to set up viewports, sheet sizes, and sheet layouts even if you’re lacking a title block. Frontloading your project set up will reduce time and workload in the future.
CONCLUSION
It’s extremely important to understand that maintaining clean and functional files is a continual process in the lifetime of a project. Keeping files clean and set up correctly to leverage the strength of Civil 3D is the most important part of the production process. There’s nothing worse than getting deep into the production process only to have everything come to a stop because one file wasn’t set up correctly or wasn’t properly triaged when received from and external source. Inevitably a good project depends on how well every file, be it background or production sheet, was set up. No matter how front loaded it may seem it is always worth putting in the time and effort to set up properly and correctly. This will make all the difference in having a smooth and productive experience or an experience with constant setbacks and delays because of poorly set up files. It is everyone’s responsibility to ensure files are being properly maintained, but experienced drafters, at the end of the day, hold the major responsibility of the proliferation of this knowledge to their junior drafters and others on the production team in order to maintain proper standards and wellmaintained projects.
I started working with AutoCAD software in 2018 and have 6 years of experience with 2 serperate firms. I’ve worked on major site development projects like healthcare facilities to higher education campus’. Most of my experience is in Civil 3D using the 2D and 3D elements of the program to make the best product possible.
Pull/Push Viz States
What I am going to show you is a way to have a LOT of different visibility combinations without a Visibility State in a dynamic block. You should be familiar with AutoCAD scaling of entities as that is how this works.
There are so many different combinations available. Using visibility states would be a really long list and not that easy to use compared to this way.
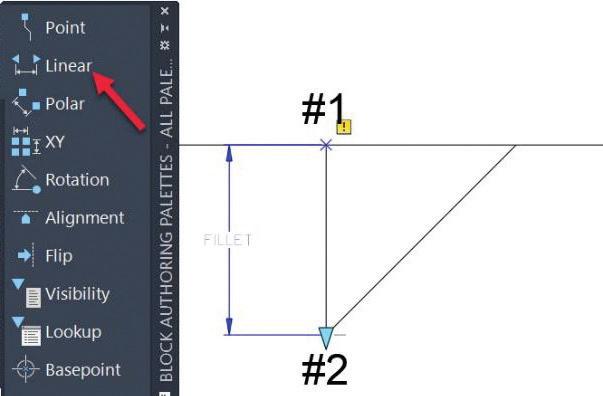
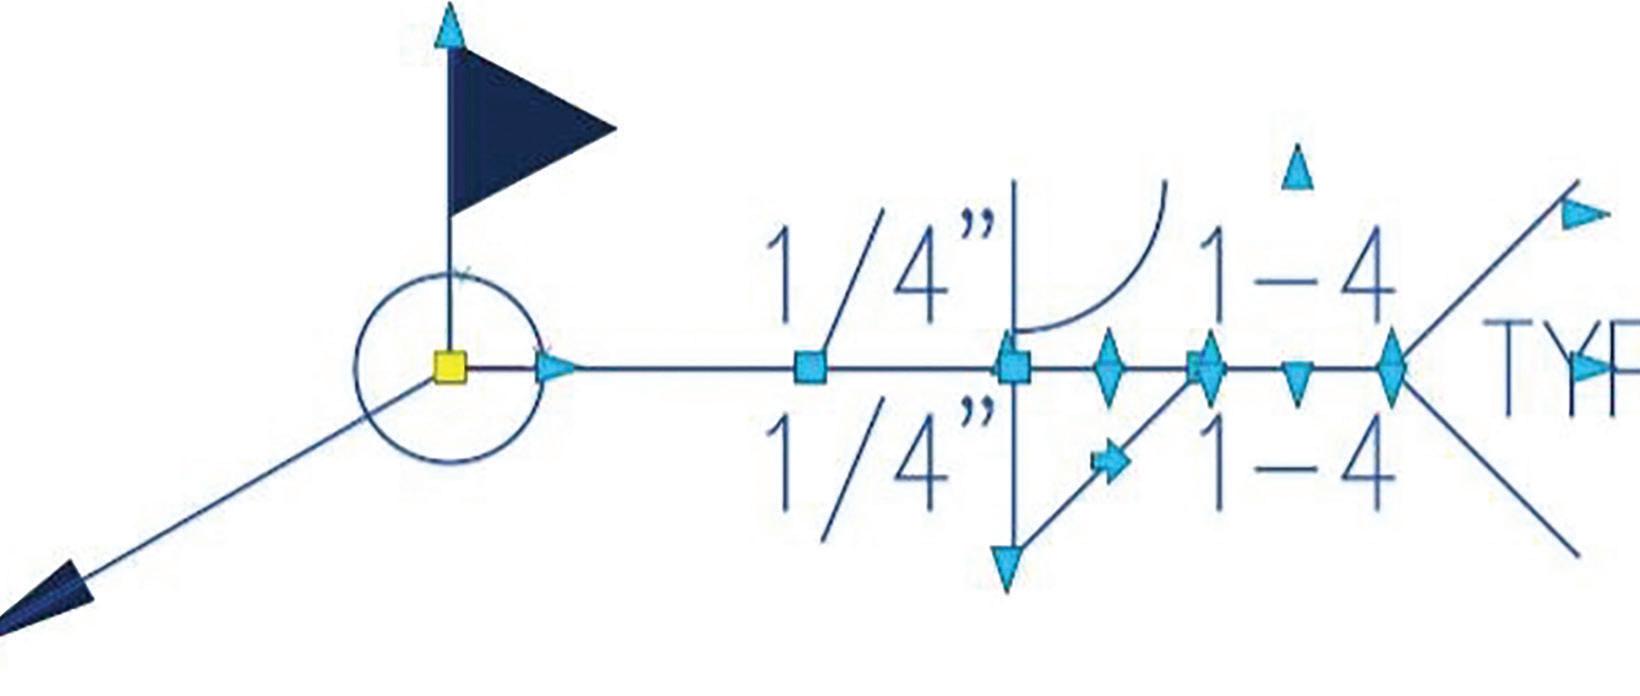
I am going to do a fillet weld symbol for this lesson as it is what I first developed this system for. In the block editor we start with the horizontal line and then we draw the lines for a fillet weld onto the bottom of it as shown. Make this the actual size you want it to be when plotted. In this case it is 1/4" (0.250) (Figure 1).
Next add a Linear Parameter from the Block Authoring Palette. Make sure you pick the endpoints of the line. Pick top #1 of the vertical line first and then the bottom #2 (Figure 2).
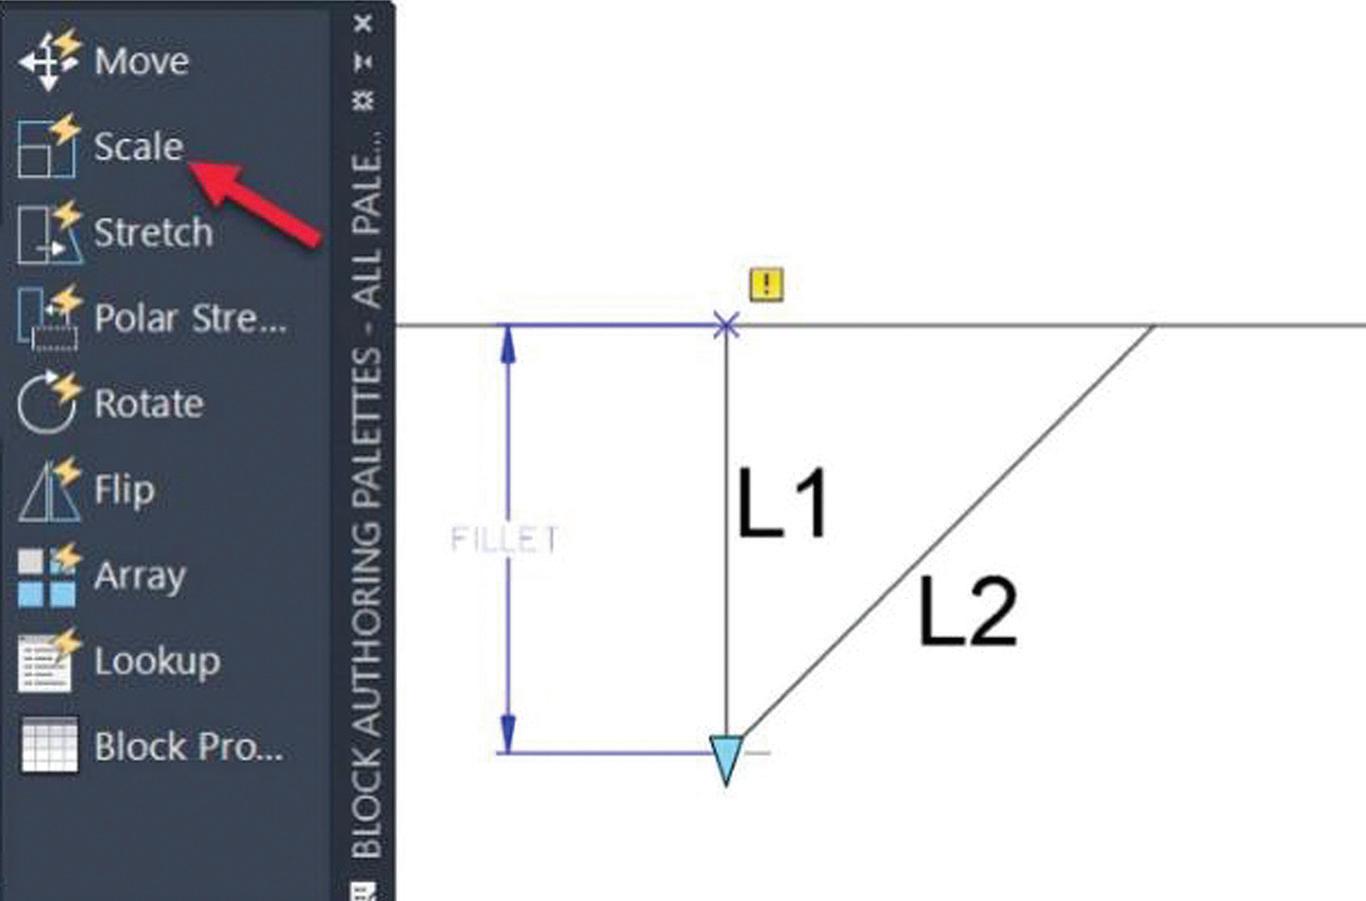
Now we are going to choose an Action for the Linear Parameter. We are going to pick Scale and then select our parameter. Then we select the two lines (L1 & L2) that represent the fillet weld symbol. When you select the grip for this action those are the lines that will be acted upon (Figure 3).
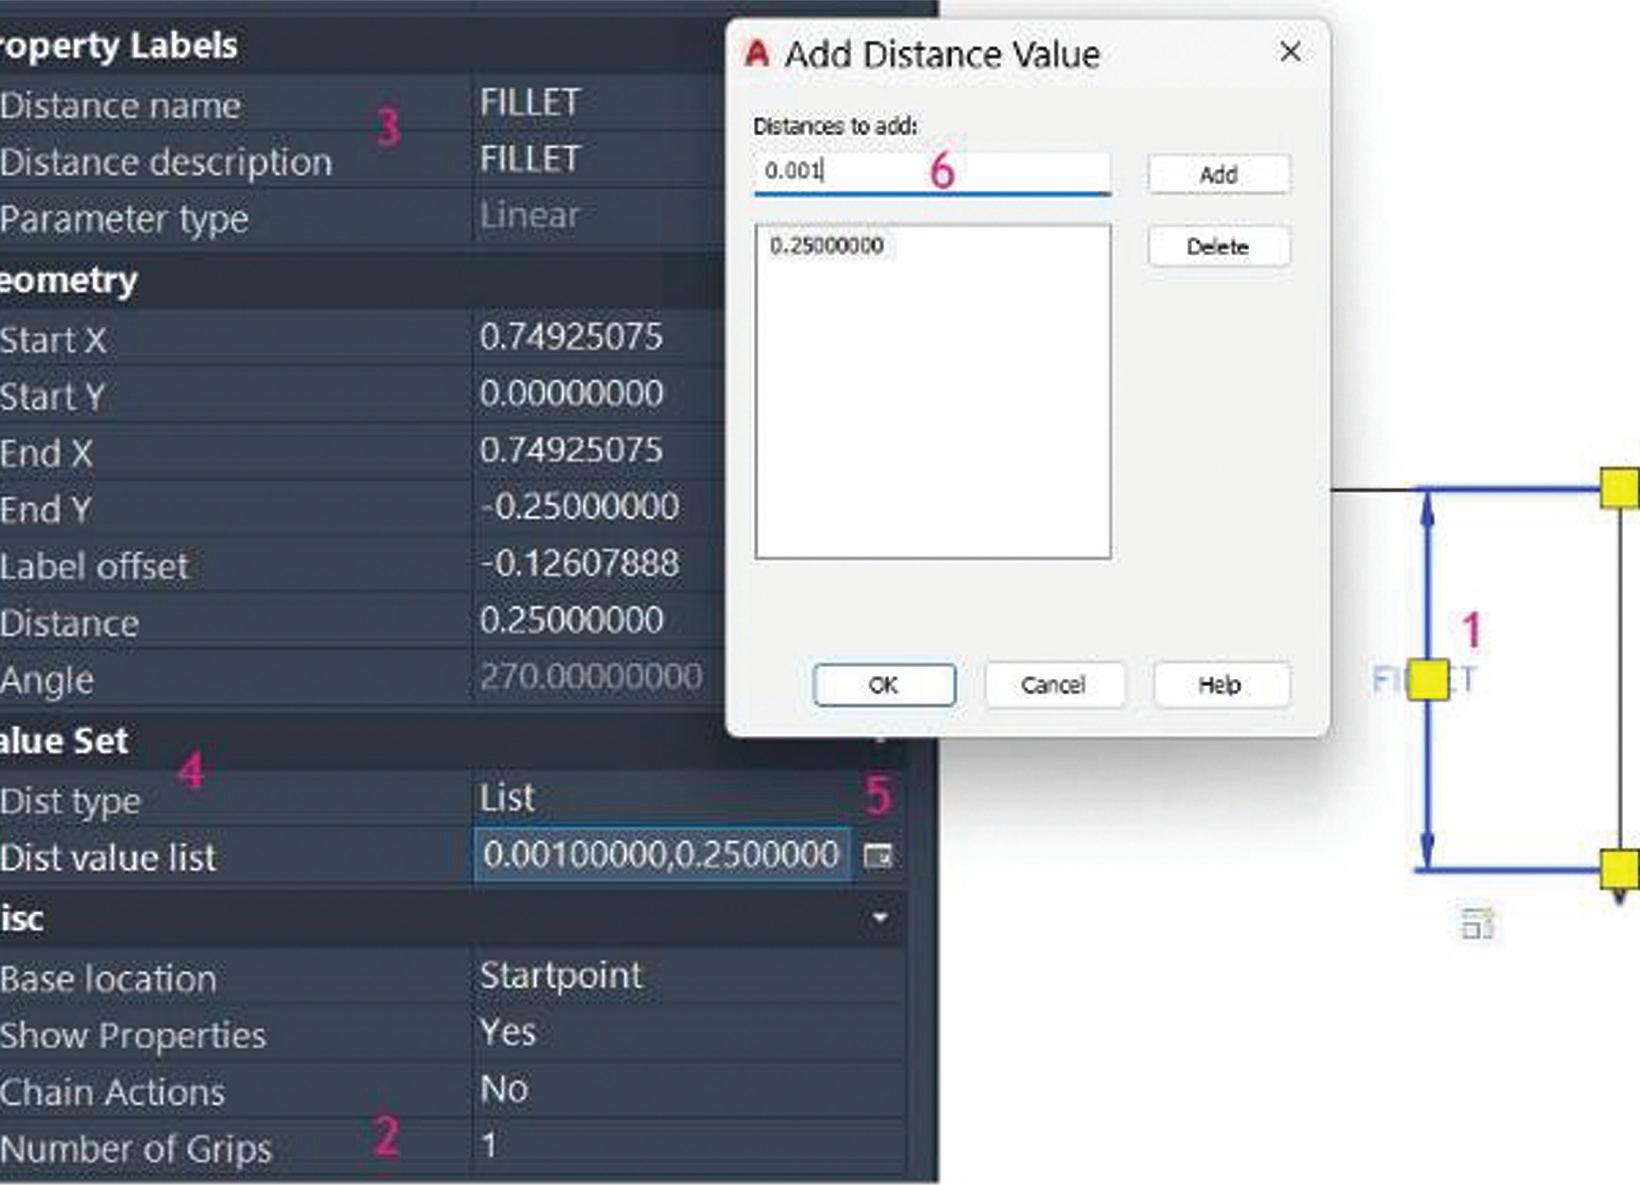
Back to the Properties Palette and select the fillet parameter (1). We are going to make several
Figure 1
Figure 2
changes. Let’s start at the very bottom and change “Grips” (2) from 2 to 1. We only want the lower grip to show as you will see (Figure 4).
Now go up to the “Properties Labels” (3) where we will change the “Distance name” & “Distance description” to a name that makes sense “Fillet” as that is what it is. Then we go down to the “Value Set” (4) section and we choose the “Dist type” and change that from “None” to “List”. As soon as you choose List things change. Below the “Dist type” is a “Dist value list”. That value is the length of the line you added the parameter to. In this case it is the 1/4” (0,250). Pick on the box (5) with the 1/4” or (0.250) showing and on the right is a drop down arrow. Select the arrow and a dialog box pops up. At the top of the box (6) you can add another distance that this fillet symbol will display at. In the box you will enter 0.001 which sounds dumb but hang on. If we can change this 1/4” block so it is only 0.001” tall that is smaller than your default line width. When plotted the symbol is smaller than the line
width and so it will never show. So even though the symbol is still there and shows correct if you zoom in a bunch it is only .001” tall.
Now you want to use the test block and select the block and then the grip. Drag the grip up towards the horizontal line and release. The symbol will no longer show. That is provided you moved the grip more than half of the distance between the two values in your list of distances. So you have it either pulled out and displaying or pushed in and still displaying but so small it will never show when plotted. How sweet is that?
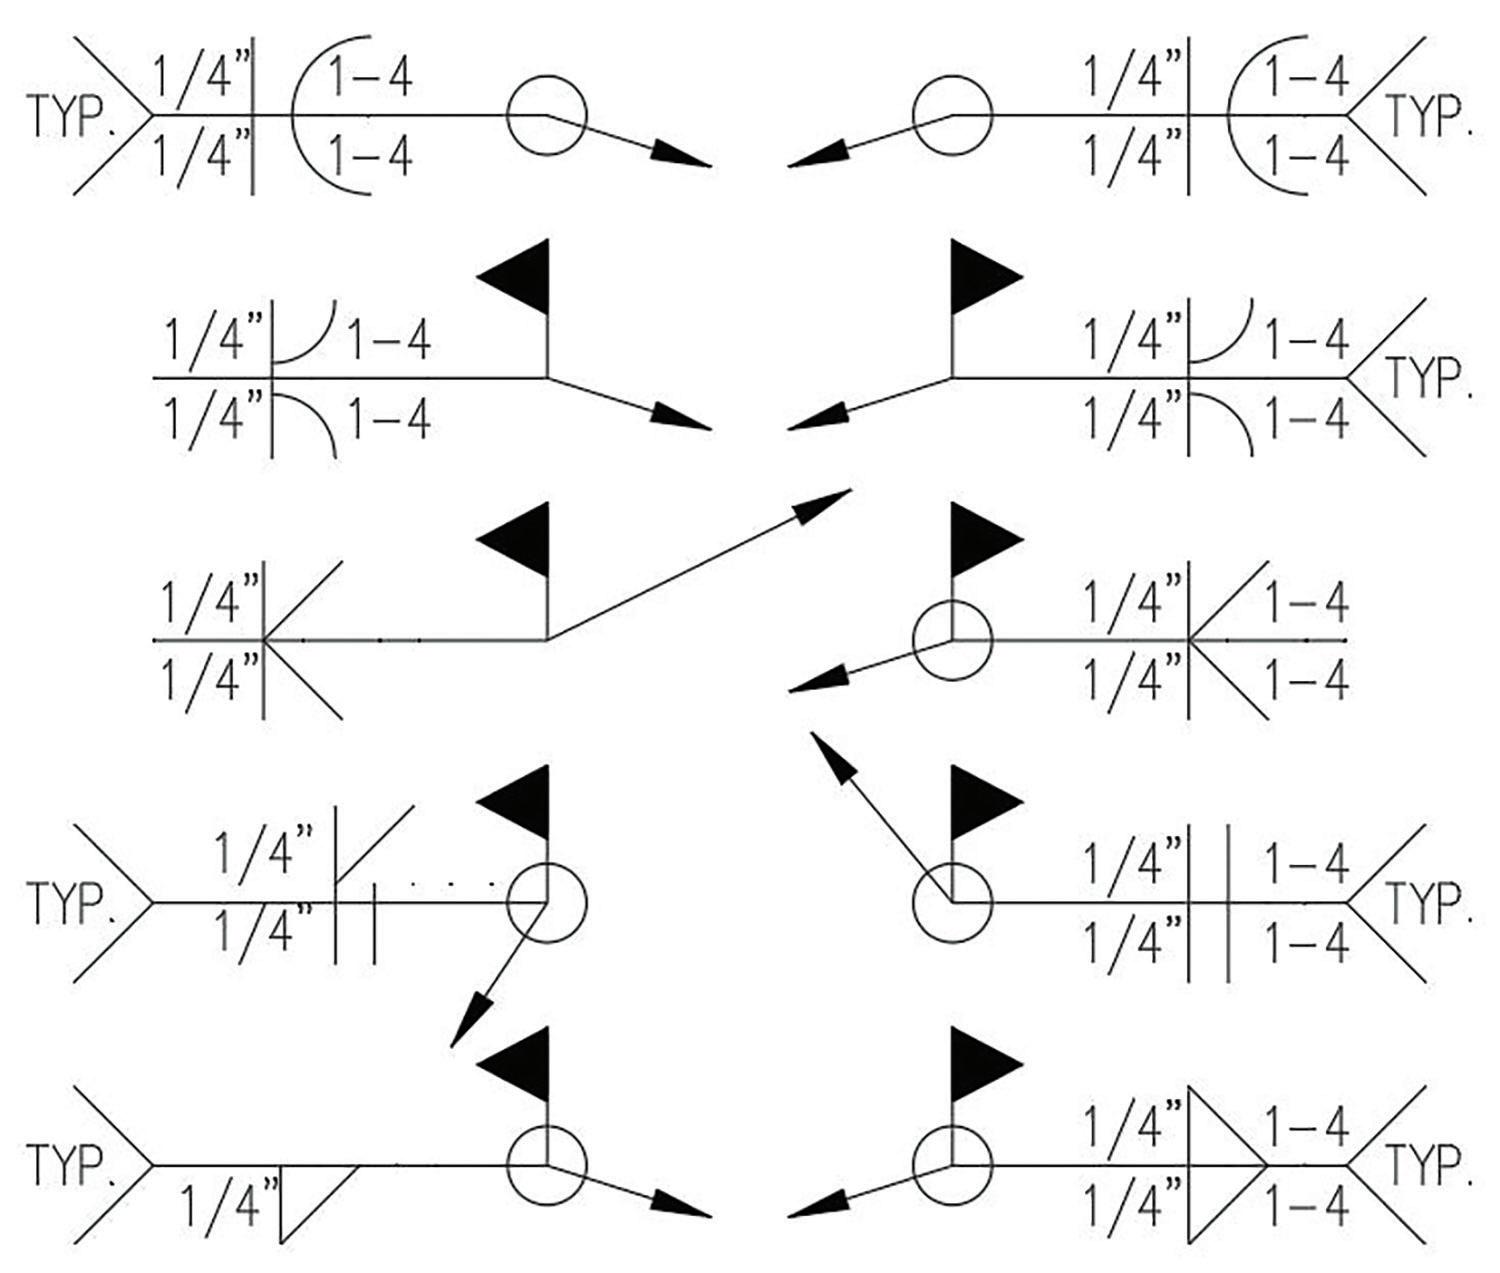
Figure 5 shows the final weld symbol that I created. I have copied it and modified it showing just a few of the many combinations possible. I don’t know how to calculate how many there actually would be. There are 13 different parts you can pull out or push in. Along with the attributes for sizes and you can see there are a bunch of combinations. I am sure it would be over 100 different visual styles or combinations. More than you could easily manage using Visibility States.
There are attributes to type in values for the size of the welds and spacing parameters. They also have grips to move them around if needed. Standard dynamic block tools you have probably used before. This lesson is only about creating lots of different combinations of entities or objects that are visible without having a long list of visibility states.
This also allows many more combinations and especially for something like weld symbols. For example, you can have one type of weld on the
Figure 3
Figure 4
Figure 5
near side and another type of weld on the far side. Something not possible with separate blocks for each type of weld symbol.
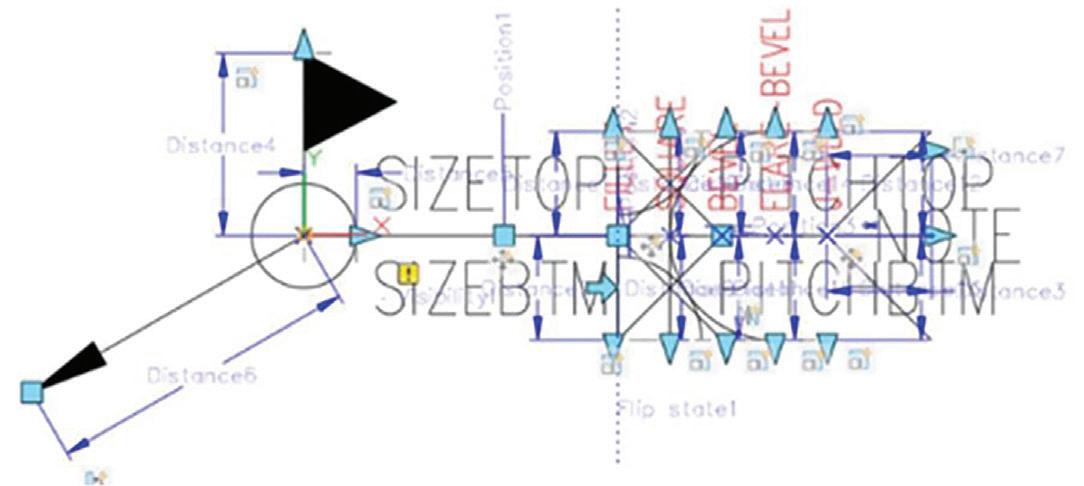
I have all of the grips displayed in Figure 6 so you can see the large flexibility provided. The text can be moved if needed. The overall length can be changed.
This simple method could be used for much larger items. Different types of tables, cabinets, equipment, whatever. You could have a table that is 10 feet long when pulled out and have it be 0.001 tall pushed back in. It would never show when plotted so it doesn’t hurt anything if it is still there.
Extra tip: If you put multiple symbols over top of each other separate them by layers until done. As Figure 7 shows, there is so much going on. It is a mess to work with unless you can turn some things off and on. Create a layer for each one so you can easily keep them separated by turning layers on and off. Unlike visibility states which can use a line in multiple states each of these are separate entities. When you are done you can put all of them onto layer 0. This allows them to take on the properties of the layer they are inserted on. Creating a complex dynamic block like this is when it can get difficult (Figure 7).
Also notice that even though some lines are drawn over top of lines the parameters are off to the side. I was surprised that I could do such. This then allowed me to space out the grips so they were easy
to access. You also can see text beneath each of the grips that describes what the grip is for. This text is placed on a “No Plot” and it can also be turned off. This is not necessary if in the Properties you enter a name for Distance description in the properties as suggested earlier. Thanks to KaDe for this tip.
I hope you find this helpful and can see there is a large amount of combinations of entities that you can have displayed at any one time. It really is not a lot of extra work. It only gets difficult when you have objects over top of similar objects.
You might have one of these combinations that is very popular and used a lot. Having to pull out and enter values every time becomes work. When I have this condition I will take a blank dwg and insert the block and adjust what I want to display. I then save the dwg and give it a name that means something. Now when I insert this dwg I make it be inserted exploded. What I have is the block the way I want it that I can copy to use elsewhere or copy and change as required.
I am only suggesting doing this for the few combinations that will be the most popular. Otherwise, you would have lots of blocks that you could have just created with all the different entities showing. This would not make any sense.
As I was creating this lesson I had another wild idea that someone might want to do. You could take something like this with everything in one AutoCAD layer state. You could then have another layer state and you could have a lot of push/pull to display objects in that layer state. You could have one lone block be a large symbol library. Probably not a good idea but with all the super smart AutoCAD users who knows what someone might do. I never thought I would create this method but I did and it works great.
Jack Foster has 35 years of AutoCAD experience. He loves designing in 3D especially routing piping systems. Jack has worked as CAD manager. He is an AutoCAD registered developer and has written hundreds of programs to make using AutoCAD easier. Jack has taught multiple classes at Autodesk University. His favorite and most popular was 1 Pick Plotting.
Figure 6
Figure 7
CAD Managers: Are You Superman or Batman?
Growing up in the 1960’s was far different than it is today, and for many reasons. I’ll skip over all the sociological and cultural ones and focus primarily on how the youngsters of my day occupied themselves. There was no Xbox or Sony PS-whatever, no cellphones, nor any social media. Rather, it was board games or toys, a black phone hanging on the wall that you fought over, and if you wanted to talk to someone directly you rode your bike over to see them.
For someone living two miles outside of Smalltown USA, the difference was even more stark. No other kids lived in the area, so most of my leisure time
was by myself (this is in no way a handwringing, ohwoe-is-me statement. I had a ball.). I hunted, fished, shot my .22 rifle, built towns and machines with my erector set and Lincoln logs, and had about a million of those little green soldiers, complete with tanks and jeeps. What I really loved was reading –Moby Dick, Treasure Island, all the works of Louis L’Amour, and comic books. I read a lot – a lot – of comic books. Every genre possible – war, science fiction, and most importantly, superheroes.
There were several costumed villain-smackers to choose from – Spiderman, Captain America, the Hulk, Iron Man, Thor – but the two everybody
(including myself) took to were Superman and Batman. They were the originals, by the way. Superman – Kal-El, the Man of Steel - first appeared in Action Comics #1 in 1938, so the Caped Crusader was widening the eyes of many youngsters before I came along1
Next came Batman – Bruce Wayne, the Caped Crusader, the Dark Knight – first appeared in Detective Comics (later shortened to DC Comics) Edition #27 in 19392
CAD Management
At this point, you might be wondering what in the name of God’s green earth does any of this have to do with CAD Management?
The answer is simple.
Every CAD Manager (CM) is- at the heart of thingsone of these caped do-gooders, and the best part is, you don’t get to choose. The answer doesn’t lie within you, but within those around you. To help you better understand that statement, let’s first have a broad stroke look at the CM of today. I conducted a poll of CM’s that I rub elbows with to get a feel of who you are, and the results were, admittedly, not surprising at all.
QUESTION #1 - ARE YOU A PROFESSIONAL ENGINEER?
No CM’s I’ve talked to are Professional Engineers. That’s not to say they aren’t educated, though. Their education includes degrees in CAD, Architecture, Electrical Engineering, Civil Engineering, Industrial Technology and Computer Programming.
Their training doesn’t stop there. Additional certifications include BIM Management, Revit Certified Professional, Autodesk Certified Professional and Autodesk Expert Elite, along with courses in Excel, Autolisp, and Bluebeam to name a few.
QUESTION #2 - ARE YOU STRICTLY A CAD MANAGER, OR DO YOU HAVE OTHER DUTIES?
The vast majority are not strictly CM’s. In fact, the CM position is secondary to their main position as civil, architectural and structural designers, GIS technicians, IT professionals, and client managers.
QUESTION #3 - WHAT ARE YOUR DUTIES AS A CAD MANAGER?
The duties they described as included in their CAD Manager position are:
a. IT management
b. Purchase and configuration of hardware and software
c. Management of software licensure and subscriptions
d. Training and mentoring of staff
e. Training of company interns
1In April of this year, a copy of Action Comics #1, the introduction of Superman, was sold at auction for $6 million clams – is that endurance, or what?)
2In May of 2022, a vintage copy of this one sold at auction sold for $1.7 million. Not too shabby, either.)
CAD Management
f. Management of project filing system
g. Software deployment
h. Maintenance and updating of the CAD symbol library
i. Maintenance and updating of the construction detail library
j. Drawing template production
k. Construction detail library maintenance
l. BIM Management
m. New hire orientation regarding CAD standards and protocols
n. Maintenance and updating of the company CAD manual
o. Keeping abreast of software updates and improvements
QUESTION #4. (HINT: WE’RE STARTING TO ADDRESS OUR ABOVE-MENTIONED HEROES)
What importance do you feel your company puts on CAD standards?
The answers varied – some stated that they hit a brick wall at every attempt to standardize, some said they got support as long as the bottom line wasn’t affected, and some said they had the full confidence of those upstairs.
Of those answers, the total of each were about equal.
That’s interesting.
If you were to poll the upper management of all the companies which employ CM’s and asked them, in general, how much impact standardized routine and protocols across the spectrum have on their business’s bottom line, I strongly suspect they’d reply a great deal. Yet roughly 67% of those who employ our polled CM’s seem to consider their duties as either barely justifiable, or only justifiable if it saves them money.
Take a look at the list of duties again. Which of those would not save money if conducted – and followed – correctly? By the way, that brings up a point. In my poll, I did not include a question about how good the participants thought they were at their job. That does have a bearing on things, of course, and it’s impossible to measure that impact from afar. If investigated, the answer to that question could explain some of the numbers for this question. Some, but not all.
Hilary Hinton “Zig” Ziglar was one of the most sought-after motivational speakers of all time. He started as a salesman, got into motivational speaking, and before all was said and done, owned a company that trained motivational speakers. His company has produced dozens of audio training sessions, and he himself has written 30 books on the subject. If you never listened to him, go to YouTube and put in his name. Before you do, make sure you set aside a lot of time.
Traffic lights weren’t stop lights to him – he called them “go-lights”. Why? His contention was simple –try going a few days without them.
Try going a few days without that list.
QUESTION #5 – HOW DIFFICULT IS IT TO GET CO-WORKERS TO EMPLOY STANDARDS YOU’VE CREATED?
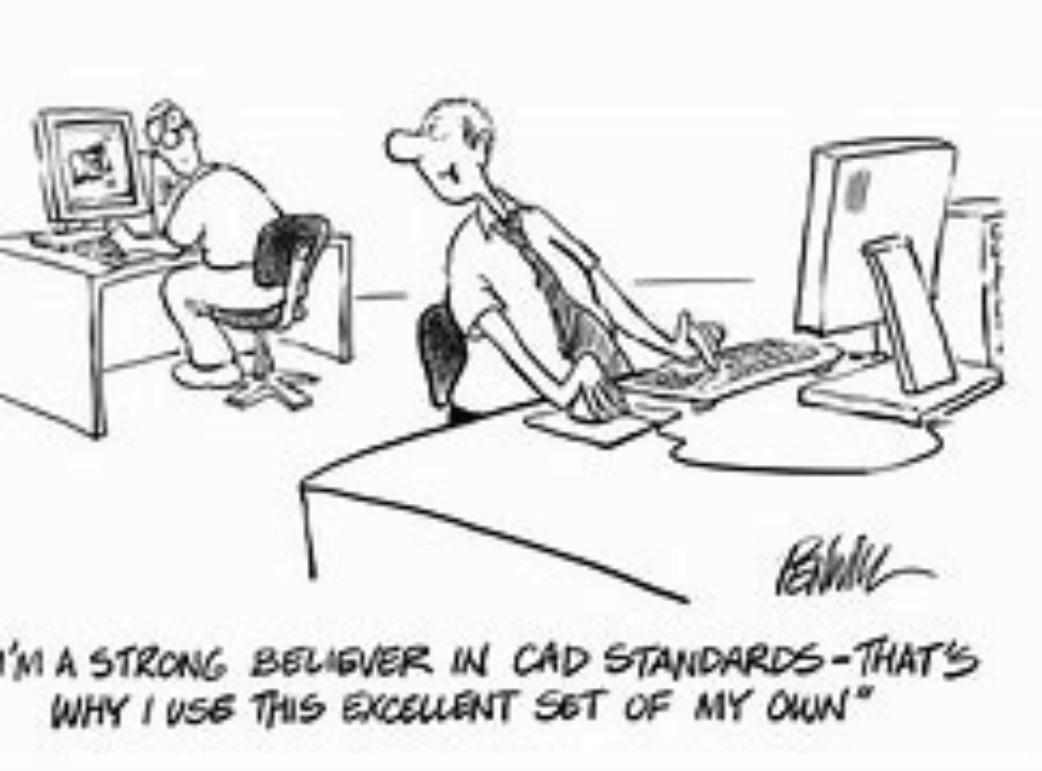
This one is a biggie – perhaps the biggest. After all, if you have the support – even grudging support – of upper management but your efforts to standardize look like someone trying to herd snakes, then management’s outlook doesn’t’ mean much.
Amazingly, many said they don’t have much problem with this. Oh, there are the inevitable strays that like to do their own thing, but most welcome a shortcut to assist with their workload. Interestingly – and not surprisingly – it’s the new hires that respond the best. After all, a new position at a professional organization can be a daunting circumstance, and who wouldn’t like a little help with accomplishing things a little easier? The ones who have an established methodology and workflow are historically the ones who resist change, and it’s no different here.
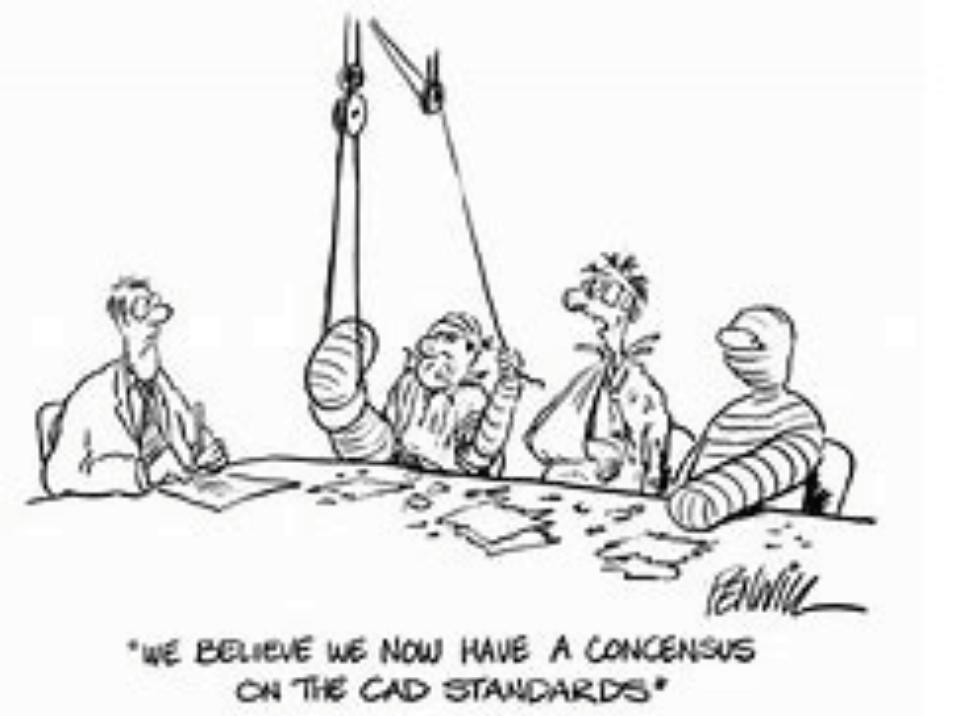
QUESTION #6 – DO YOU OPERATE ON YOUR OWN, OR AS PART OF A COMMITTEE. FOR EITHER ONE, WHAT DO YOU FEEL ARE THE ADVANTAGES AND DISADVANTAGES?
This one was unanimous – no one likes committees. Many have been part of an attempt to control standards with a committee, and all said that:
a. Everyone had their own opinion and couldn’t come to an agreement.
b. Those on the committee weren’t qualified in the areas they were to help regulate and couldn’t add perspective to the efforts.
c. People were assigned tasks and rarely had those tasks completed by the time the next meeting rolled around. More often, they were never completed.
d. Some said that asking others their opinion of a problem/solution on an individual basis allowed more clarity than – one of the contributors put it this way – being inundated by a tidal wave of information.
All that being said, I’ll point out that the answer to the Superman vs. Batman question has just been answered.
Superman lives in bright, shiny Metropolis, where the citizens are awestruck by his feats of daring-do, pointing at the sky as he rocketed by. They worship him. He is the one who stands between them and the ne’er-do-wells who lurked around every corner. They’d cheer and wave and everything was right in the world when he was on patrol.
Batman is the watchdog for Gotham, a dark city, fraught with evil. Violence and crime are the rule
rather than the exception. Unlike Superman, Batman’s kingdom is the dark of the night. But the real difference is the attitude of the population toward him. The citizenry wondered at him too, but the second he did something a little out of bounds – even if it was at least a little justified – it was time to bring out the torches and pitchforks. He was, in a word, tolerated. Even the cops resent him. It was their job to bring justice, and he’s just a vigilante. They have even tried to arrest him on several occasions.
And there we have the three points of view towards CAD Managers, as described in our poll – “Hip-hiphooray!”, “Go ahead, but watch your step”, and “Why do we need you?” Whichever point of view has, trust me – we’re hard to do without or replace. The job takes a few qualities that are short in supply in today’s world – backbone, grit, tolerance and bulldog determination.
I fear that the Cad Manager position will eventually go away. Most everyone is looking for that sheepskin and the PE license now, and the power and money it can lead to. There’s not much romance in being a rank-and-file worker anymore, even though this county was built by them. Deep down, though, I think we’ll be around for a long while. There’s always going to be somebody that won’t accept the status quo and wants to restore order where chaos exists.
The world is always going to need Superman and Batman.
Tom Schrecengost has 40 years of experience in land surveying and civil engineering, including survey rodman, instrument operator, survey party chief, civil designer, and CAD Manager. He has been a civil designer since 1993 and has been a Senior Civil Designer and the CAD Manager at MJ Engineering in New York since 2014. As CAD manager, he creates and maintains all of the company CAD standards and also trains the design staff in CAD methodologies and company CAD protocols. He is an Autodesk Certified Professional.
Revit-lution: Unleashing the Power of Custom Templates
As we progress into the latter part of 2024, it’s evident that numerous companies in the AEC industry have yet to adopt Revit for their principal design software. In August, I took part in a webinar led by BetterPros where Nicolas Catellier from BIM Pure spoke about From CAD to Revit: Strategies for a Successful Transition. The session was rich with insights and can be viewed on YouTube. One key takeaway, number thirteen on his list, was the importance of creating an effective template. Although he didn’t delve deeply into this topic, I have decided to expand upon what constitutes a strong, continuously enhancing ‘living’ template file.
To refresh your memory, in the April 2022 issue of AUGIWORLD, I discussed the Successful BIM Implementation for Revit MEP. A segment of that article highlighted the advantages of using
a Starting File or Template, illustrating key components to include. This piece intends to further explore the various “project configuration elements” divided into seven specific categories.
While my experiences are drawn from my Buildings MEPF specialty, most concepts I’ll cover are applicable across various templates regardless of the discipline. Personally, I’ve shifted from using traditional template (.rte) files to something I call a Starter File (.rvt), which is essentially a workshared project. For the purpose of this article and ease of reference, let’s continue to call it a template. This process allows for certain actions that a typical template does not, which I will explain further on.
An effective template is predicated on the inclusion of the standards you and your company have discussed/created as evidenced by the things
discussed here. If you take anything from reading this article, you should evaluate what you want to include within your template which includes thoroughly looking at each and every settings dialogue mentioned below as well as any other suggestions provided.
The first question you may have could be, “What version of Revit should I be using to create my template?” Well, the answer to that question is not that simple and can depend on several factors. If you are an architectural firm, you can easily use the latest version (currently 2025) and upgrade each year or every few years. For and Engineering firm, both MEP and Structural, you are beholden to whatever your client (the architect in most cases) is using. We have clients still using Revit 2021 and have projects in versions 2022, 2023 and 2024. Most of our new projects are using Revit 2023 and I have recently upgraded our template and Revit families from Revit 2021 to Revit 2023. All of the screenshots therein have been captured using Revit 2023. What I am trying to say here is, you need to create your template in the oldest version you are using. Now let’s get into what you should customize to help streamline your projects.
MEP SETTINGS
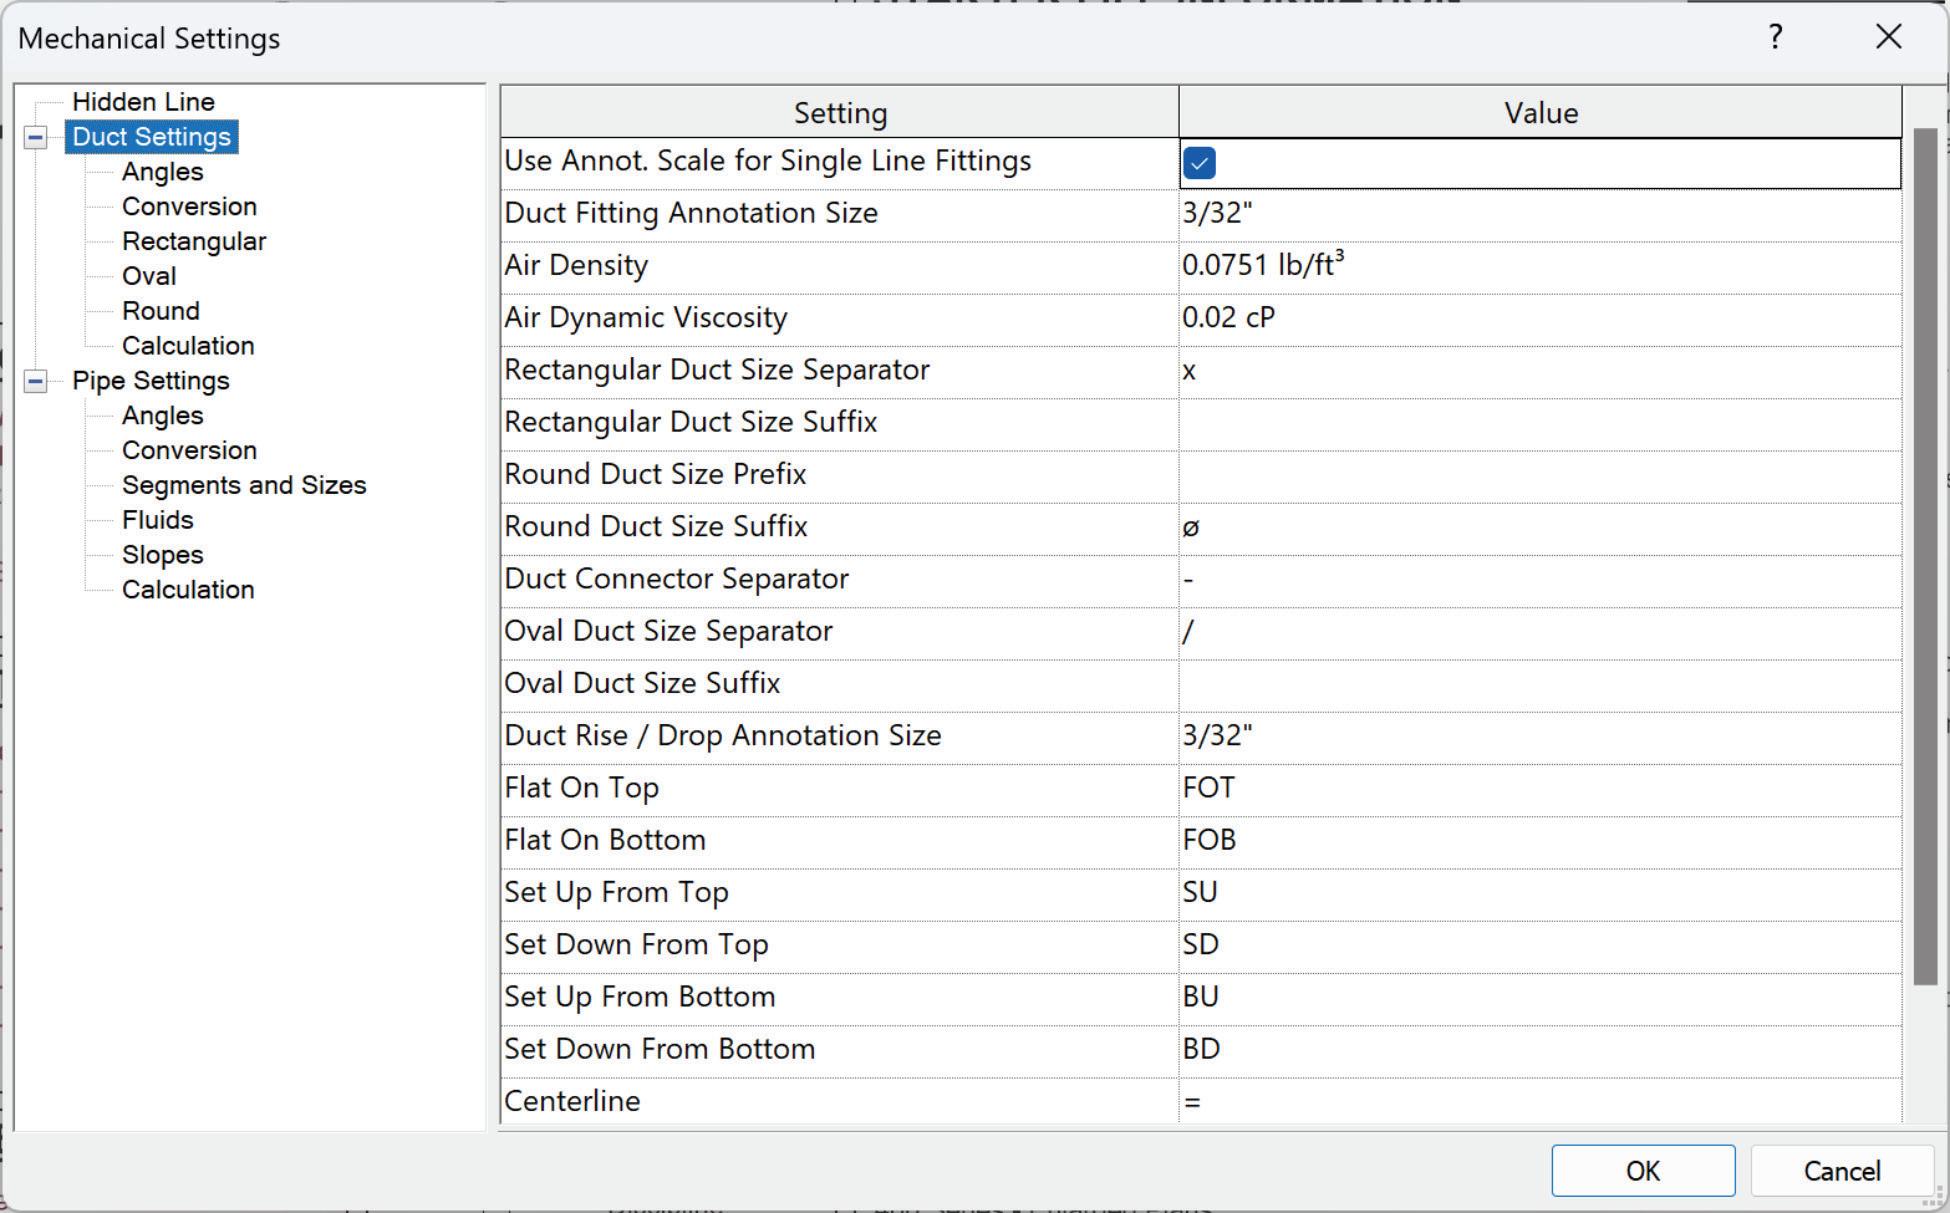
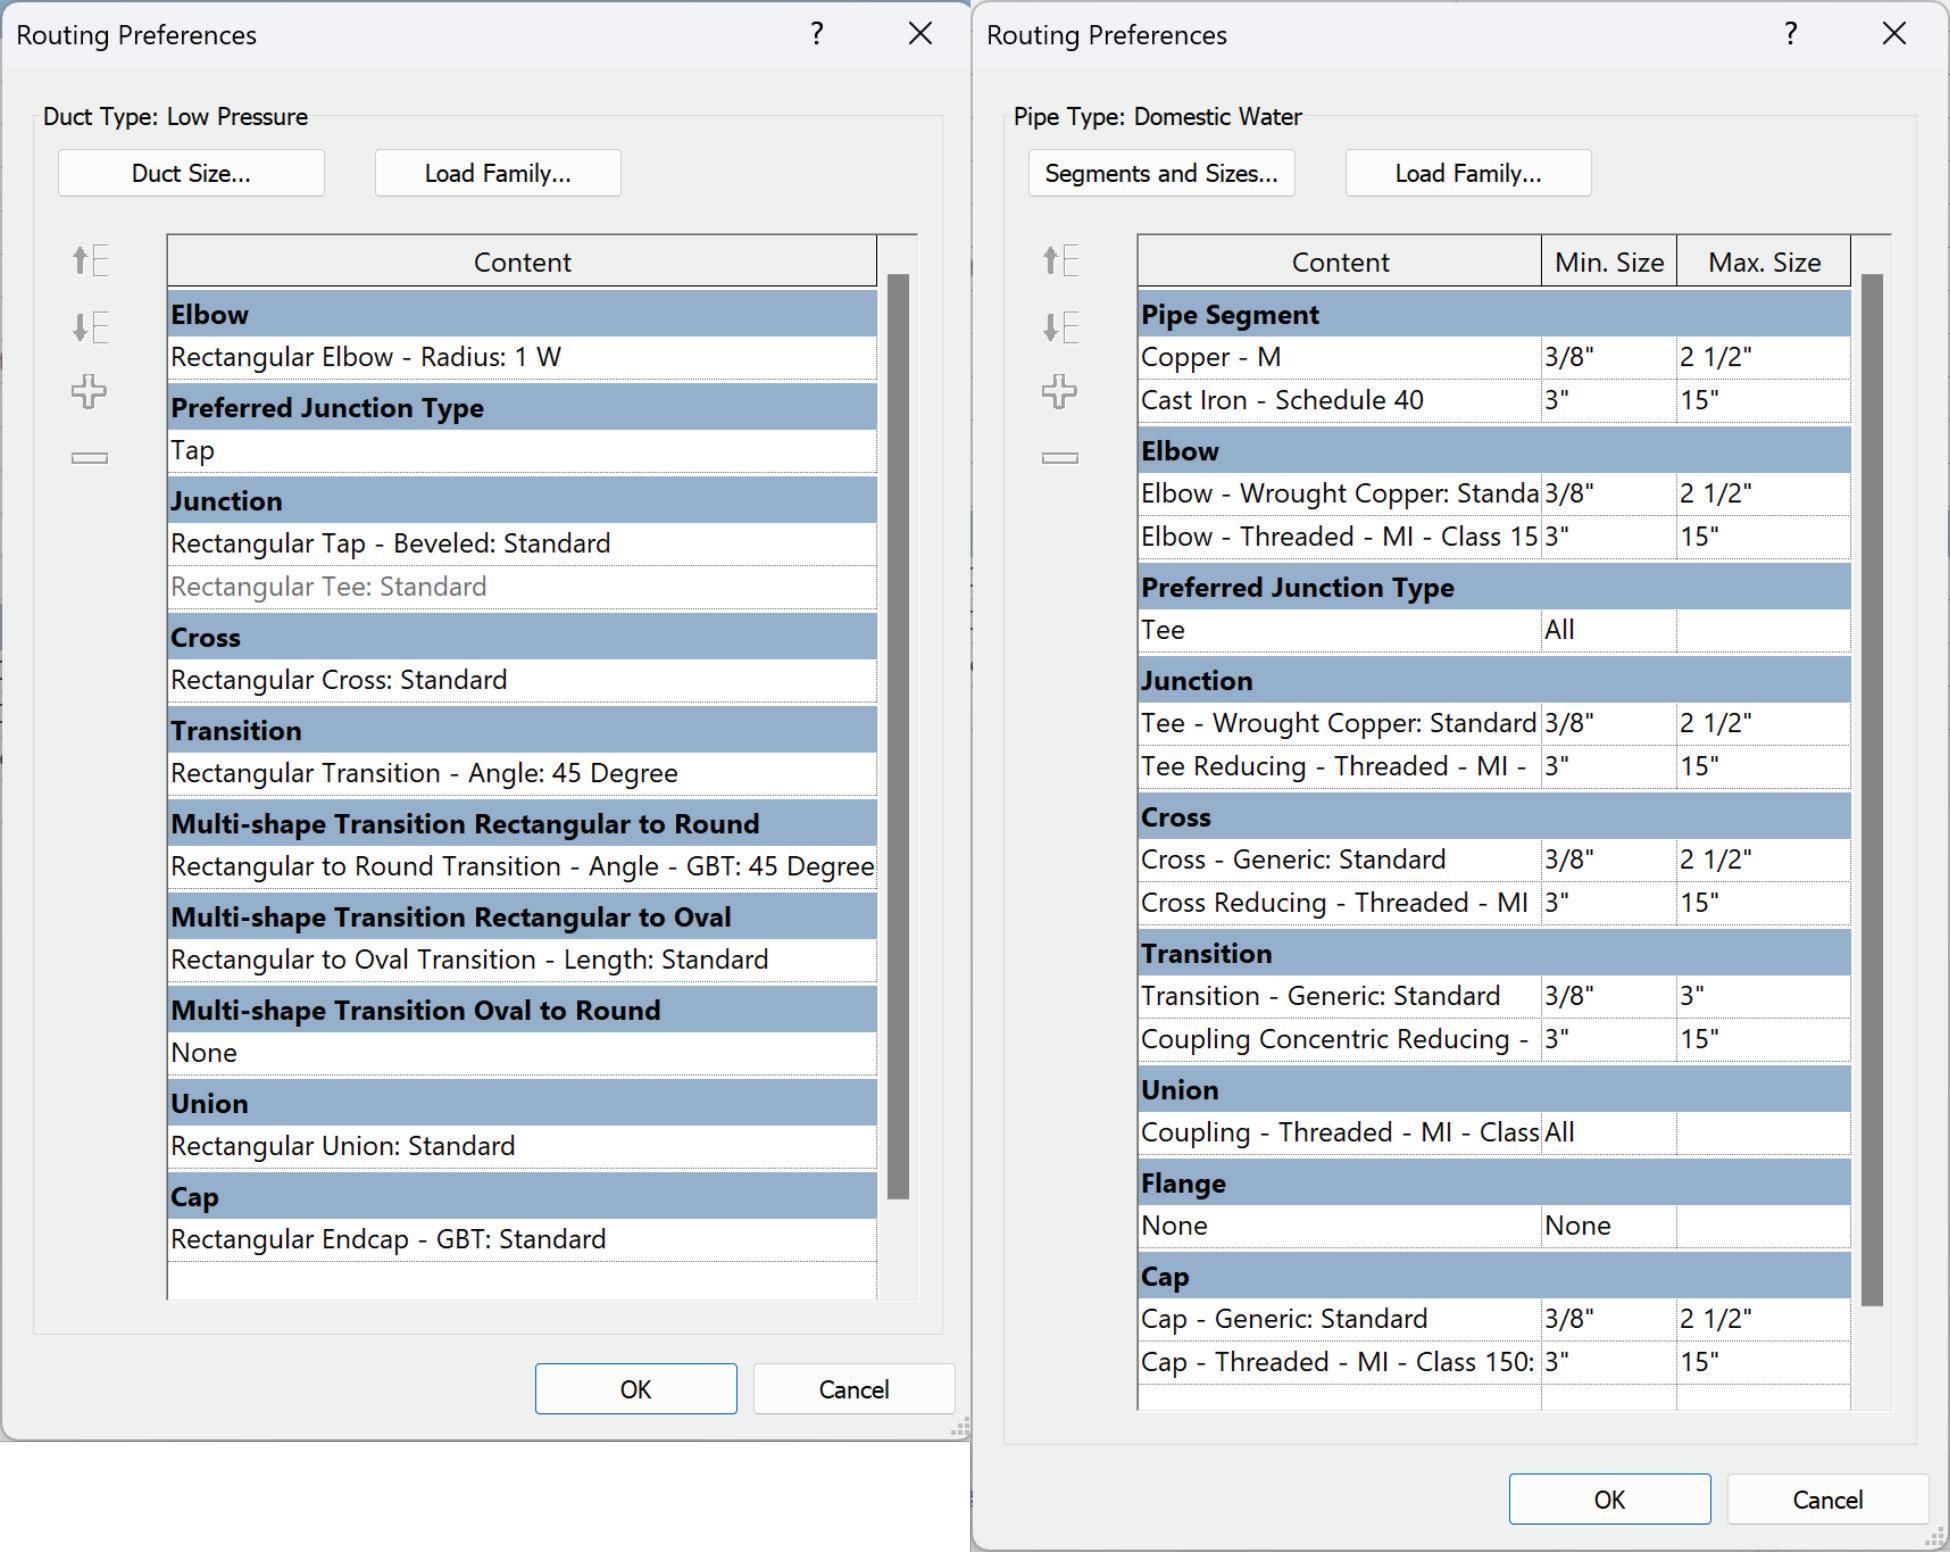
Mechanical Settings is where you will define your Mechanical/Plumbing Hidden Line style and its gaps. For Duct/Pipe Settings, you can define angles used for fittings, Duct Sizes, and Pipe Segments and Sizes. You will also find a section for the Calculation method you want to use when defining Duct or Pipe Pressure Drop and Pipe Flow. Duct/ Pipe sizes are what sizes you have available to you in the size drop down which can vary for the Pipe Segment you are specifying when laying out piping (Figure 2).
The Manage tab in Revit is the home to many of Revit’s Project Settings. Let’s start with MEP Settings. Here you will find Mechanical/Electrical Settings, Fabrication Settings (if you use that at all), Load Classifications, Demand Factors, Building/ Space Types, Electrical Analytical Load Type Settings and P&ID Settings (Figure 1).
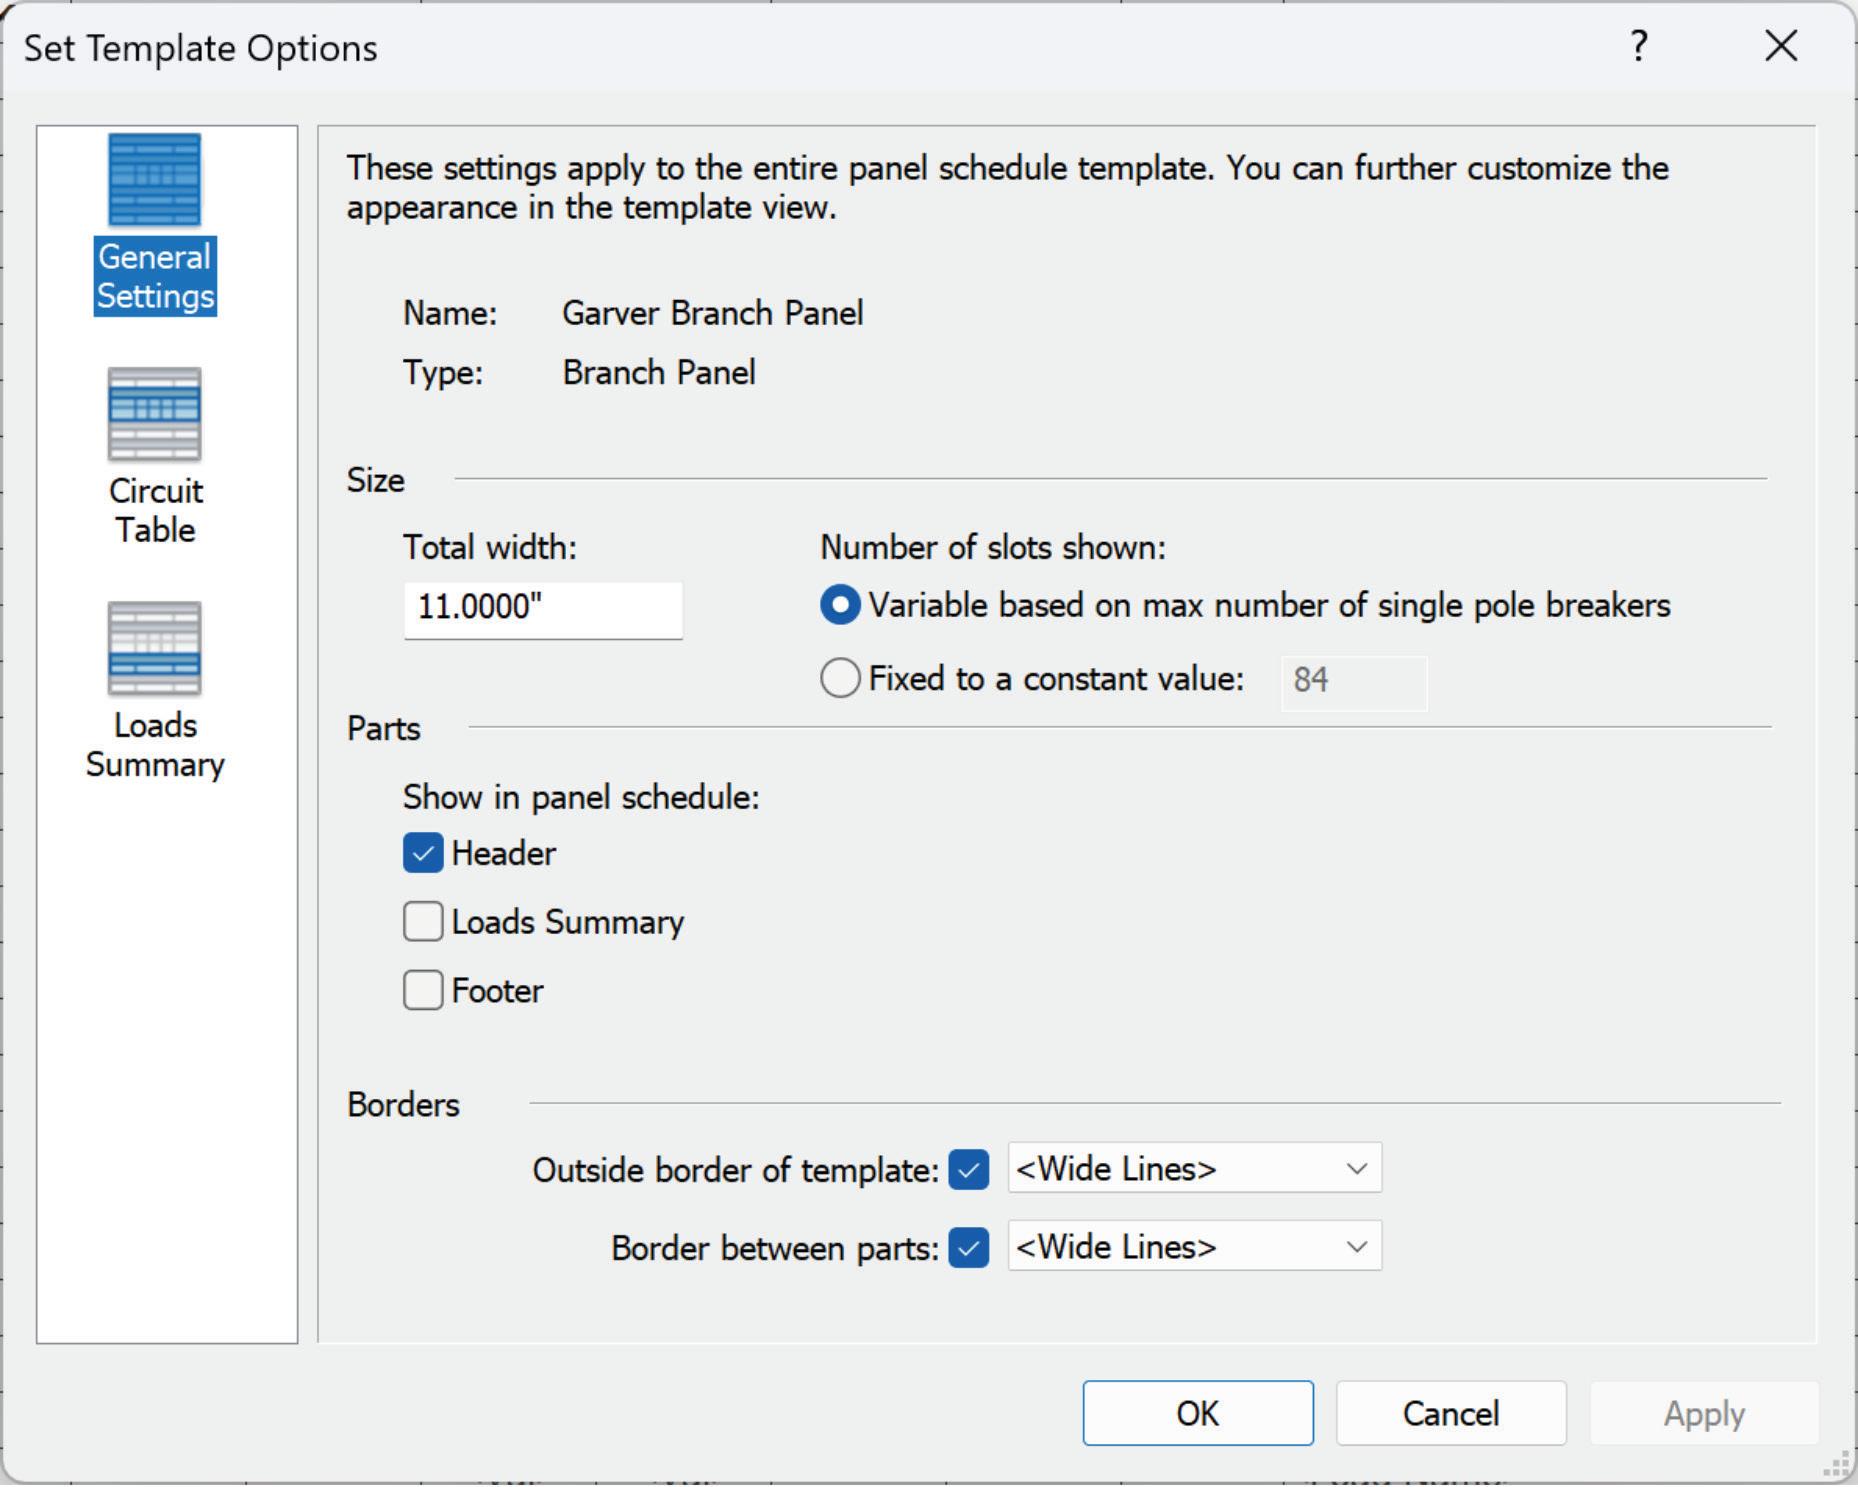
Under Electrical Settings there are quite a few more options here: Hidden Line for Electrical, General, Wiring, Voltage Definitions, Distributions Systems, Cable Tray/Conduit Settings, Load Calculations, Panel Schedules and Circuit Naming. Voltage Definitions and Distribution Systems are very important to define here, without them you will not be able to circuit any of your Revit families that require power to your Electrical Panels/Equipment.
Figure 1 - Manage Tab
Figure 2 - Mechanical Settings: Duct Settings
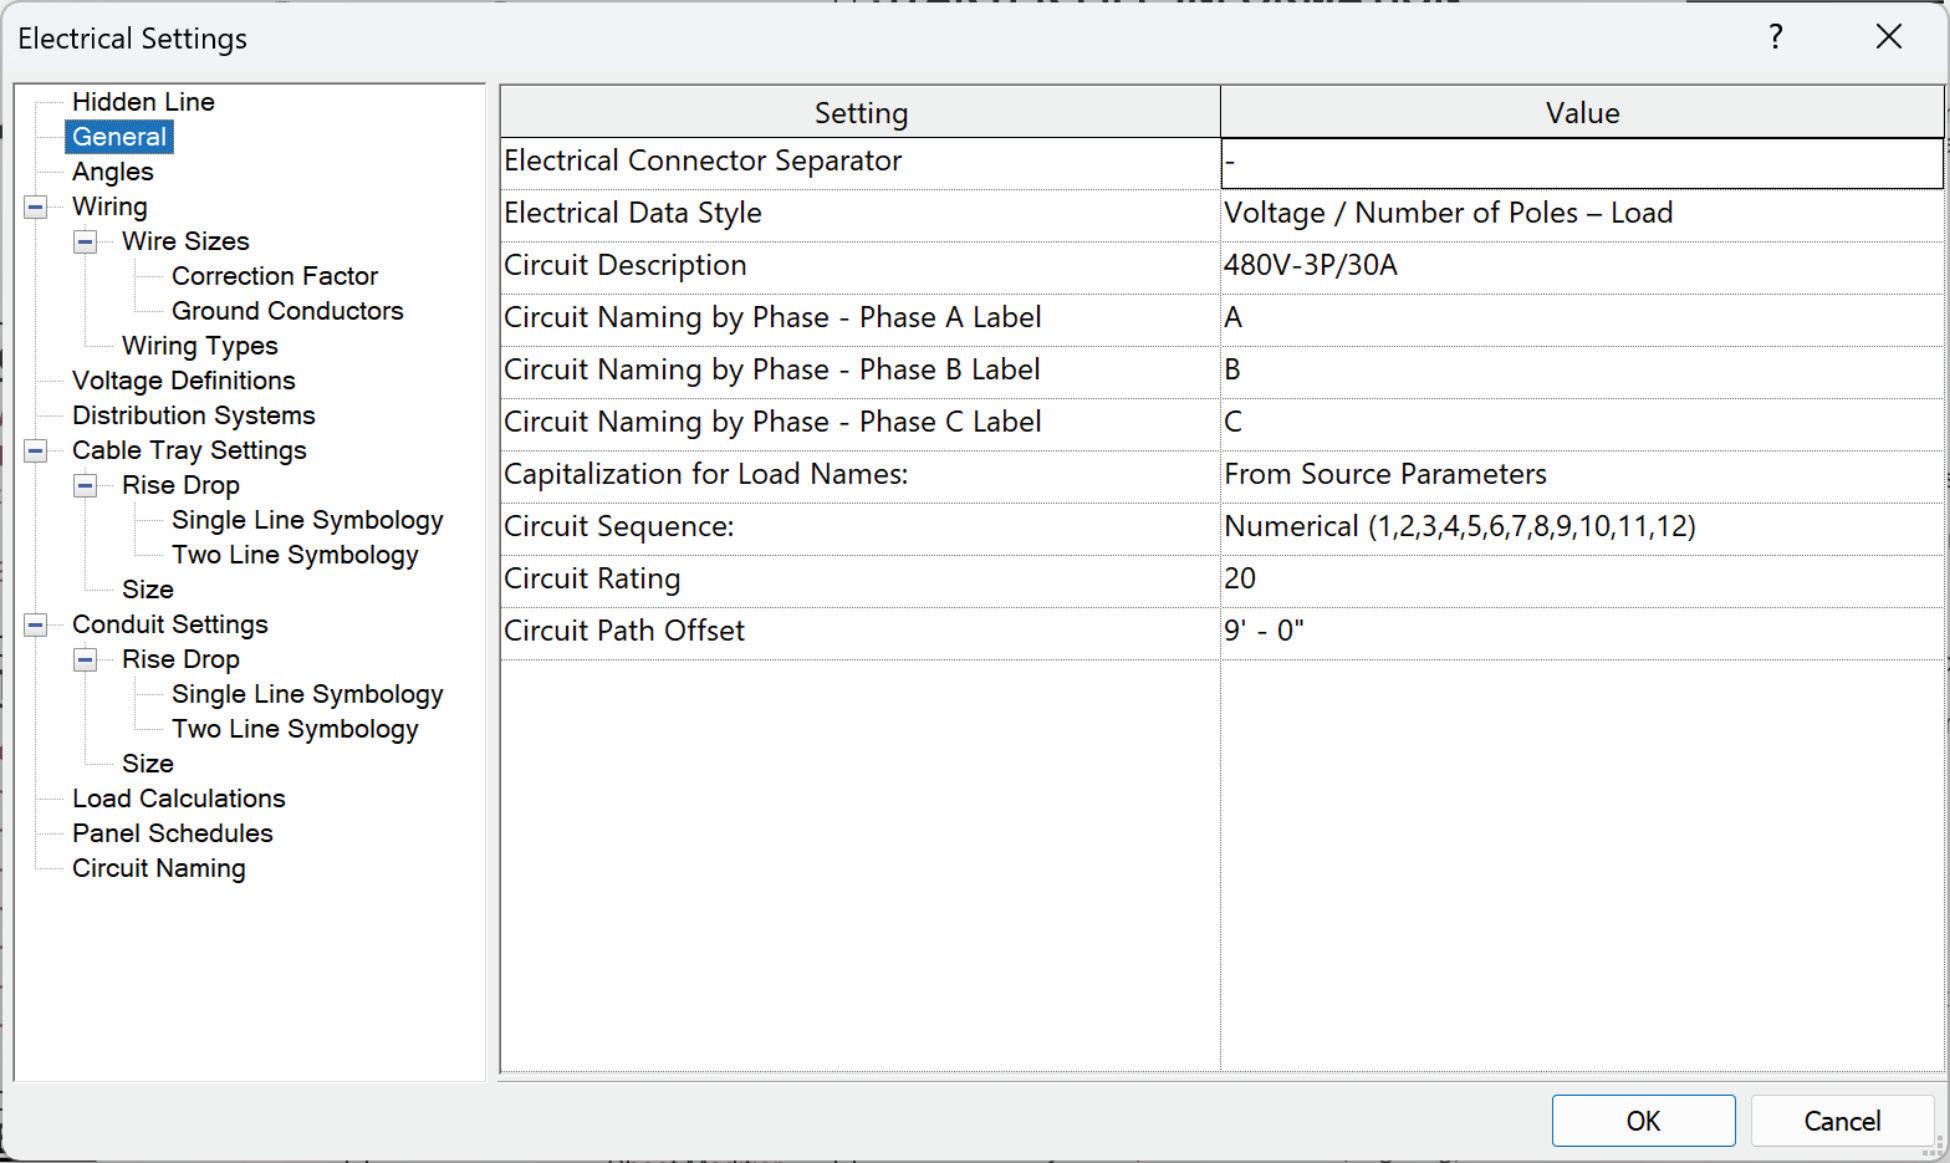
As seen in Figure 3 – Electrical Settings – General, you can define your Electrical Connector Separator, Circuit Naming by Phase, Default Circuit Rating for your Panel Schedules (this does not change automatically unfortunately) or the Circuit Sequence (Numerical, Group by Phase or Odd than Even) amongst a few other options.
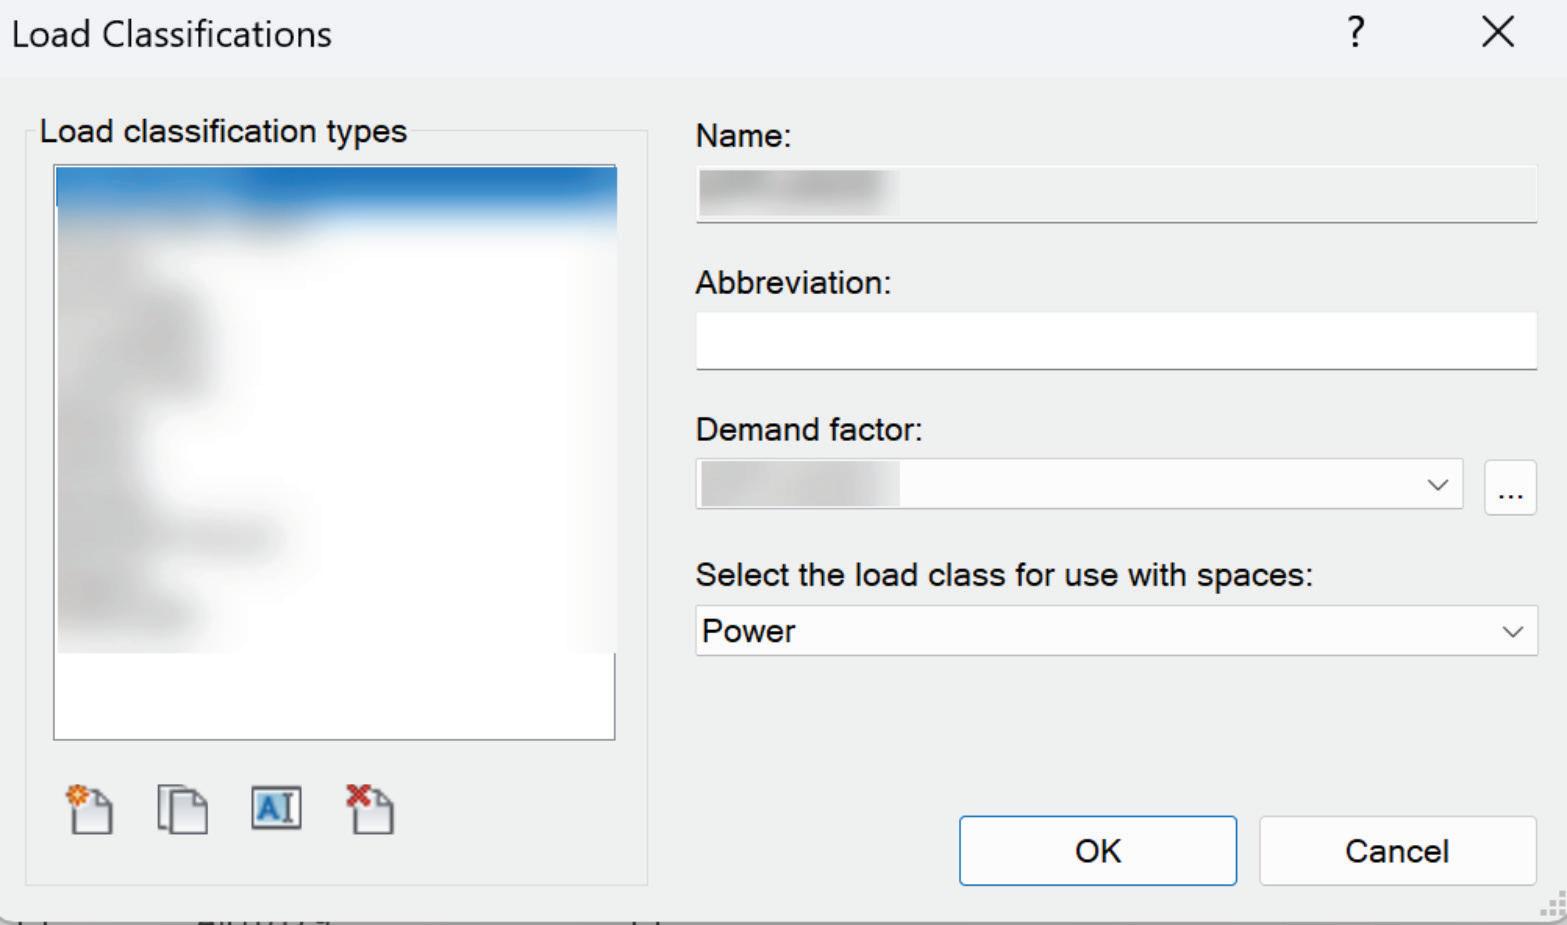
Load Classifications and Demand Factors also go hand in hand here. You cannot have one without the other. Load Classifications, while they may be defined in your template and could be visible in your Panel Schedules, the Demand Factor is what tells Revit how much of the load is being used. The Load Classifications must be assigned to the Electrical Connector within your families. Your Load Classification list can be customized to what you want those loads to look like in your Panel Schedules by Name or Abbreviation, but you cannot go wrong using the Load Classifications/Demand Factors defined in the Electrical Code (Figure 4).
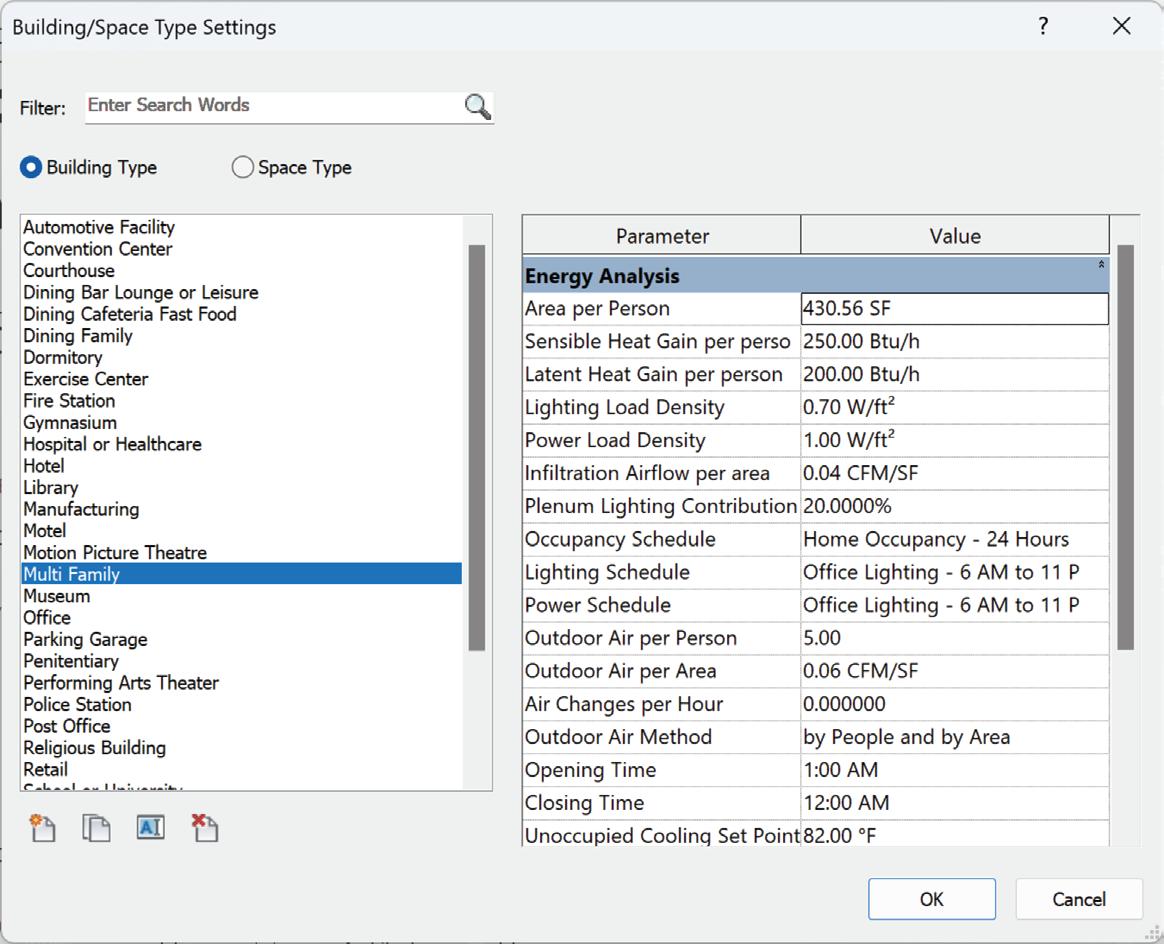
Finally, under MEP Settings, let’s talk about Building/Space Types. This originally was one of those Revit settings that was “what you see is what you get” but thankfully you have been able to create custom types since Revit 2018. Each Building Type has specific Energy Analysis values. When a Building Type is assigned within the Energy Settings dialogue, <Building> is the default value assigned to your MEP Spaces. Spaces, if not assigned a specific Space Type, which allows you to further customize your Energy Analysis values, will follow the values assigned to the Building Type. You will not find the Energy Settings under the Manage Tab; you will find it on the Analyze Tab under Energy Optimization (Figure 5).
ADDITIONAL SETTINGS
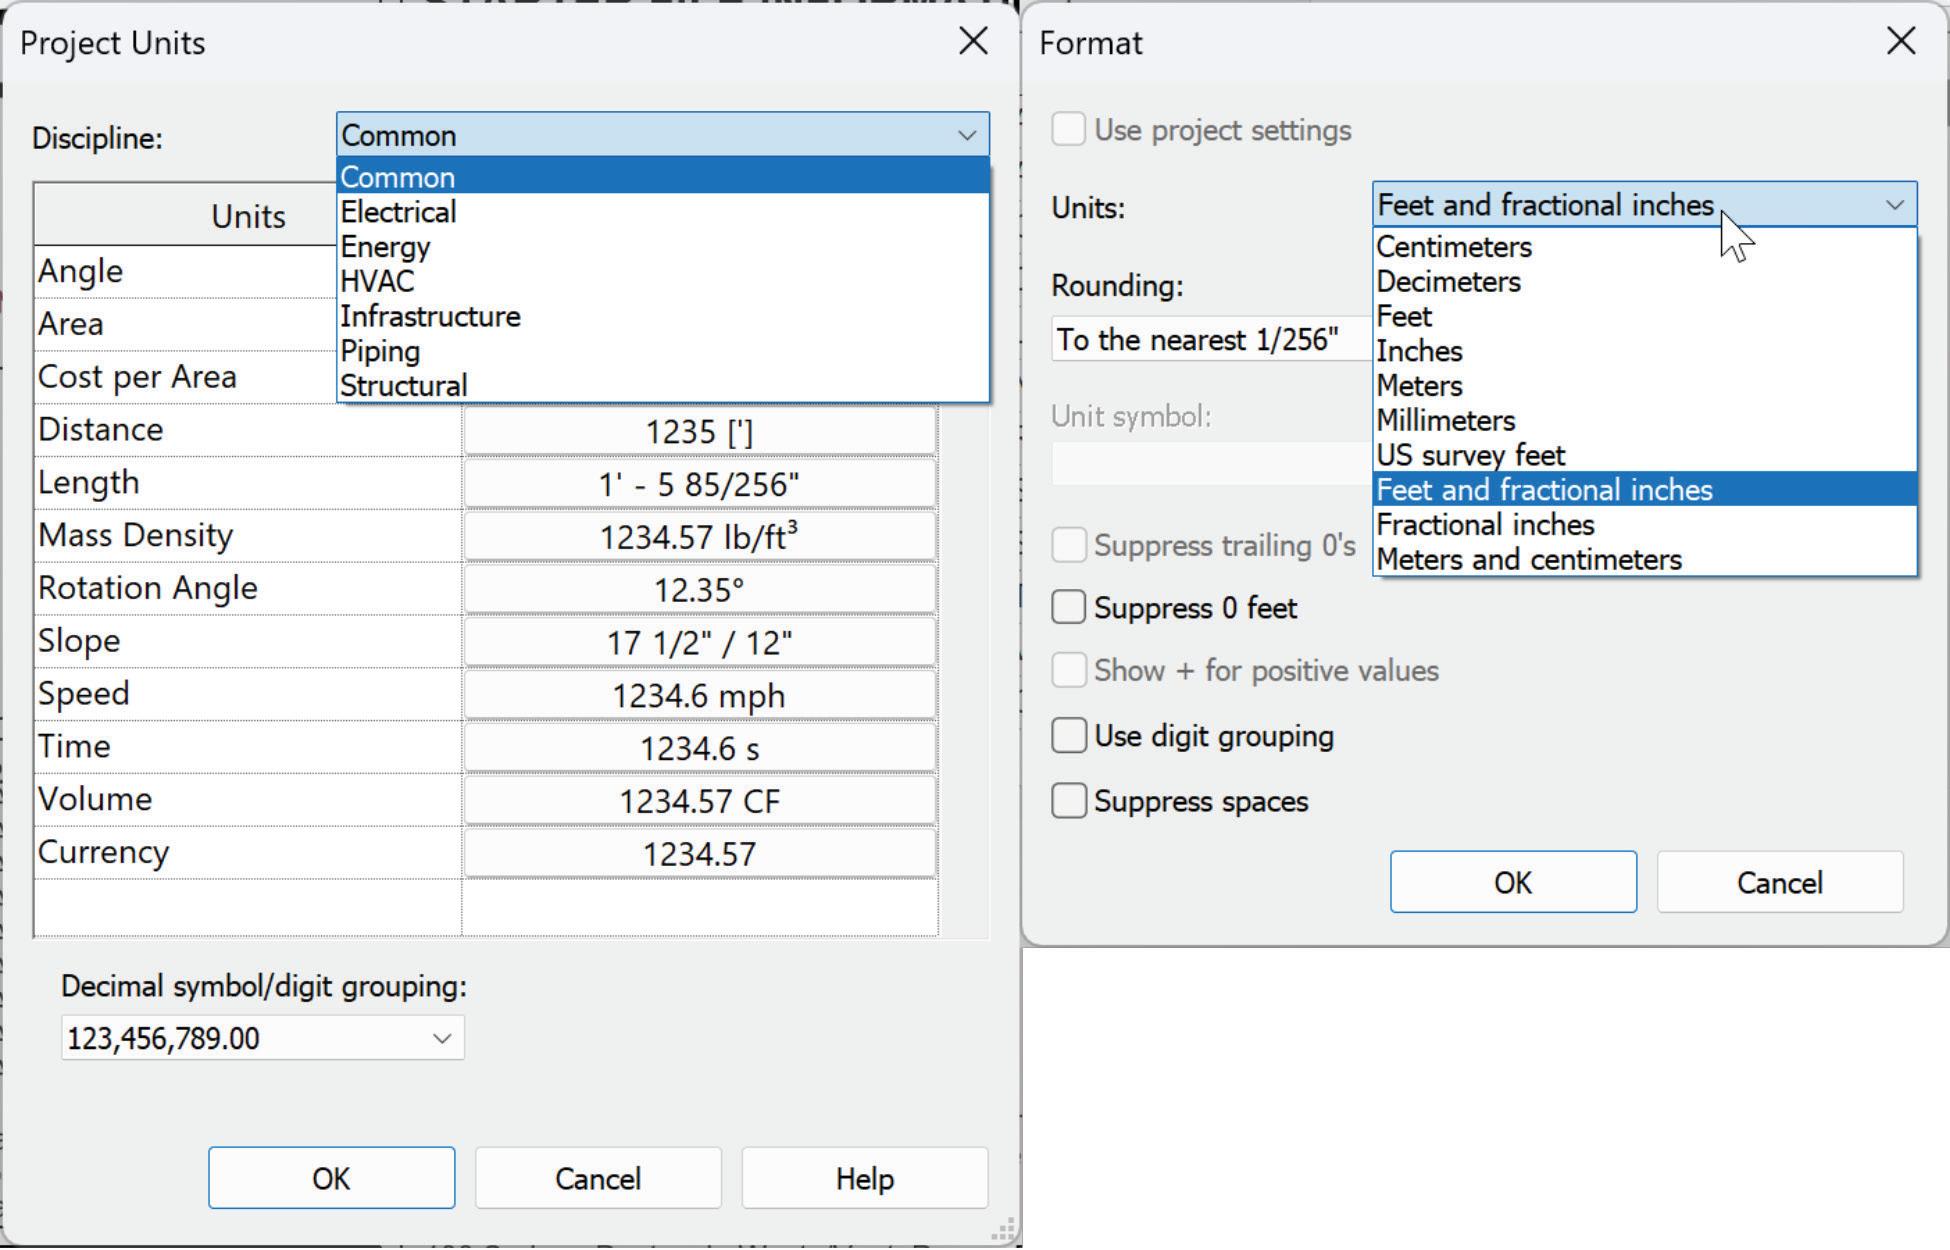
Besides MEP Settings, Project Units are another important aspect you should modify to your needs. There are seven groups of
Figure 3 - Electrical Settings: General
Figure 4 - Load Classifications
Figure 5 - Building/Space Type Settings
Project Units for you to look at: Common, Electrical, Energy, HVAC, Infrastructure, Piping, and Structural. Each Unit: Area, Length, Air Flow, Apparent Power, for example, can have a multitude of unit type options for you to choose from, typically imperial vs metric (Figure 7). For each one, you will need to define that unit type, the rounding, what the Unit Symbol is and whether you are suppressing trailing zeros, using digit grouping and suppressing spaces. It is imperative that you set this within your template, schedules and tags will display the Unit Symbol by default and you would not want them to be incorrect. This is something that unfortunately cannot be transferred from project to project using Transfer Project Standards so take your time to get it right the first time.
In Revit, parameters are fundamental pieces of information associated with elements in a project. They help define and describe those elements. Parameters can be categorized into different types:
• Project Parameters: These parameters are specific to a single project file. They are added to elements by assigning them to multiple categories of elements, sheets, or views. Project Parameters are used for scheduling, sorting, and filtering in a project. Most of the Project Parameters I am using in my template (45 of them) are used for Project Information, in my title blocks and for my Starting View (something I will discuss later).
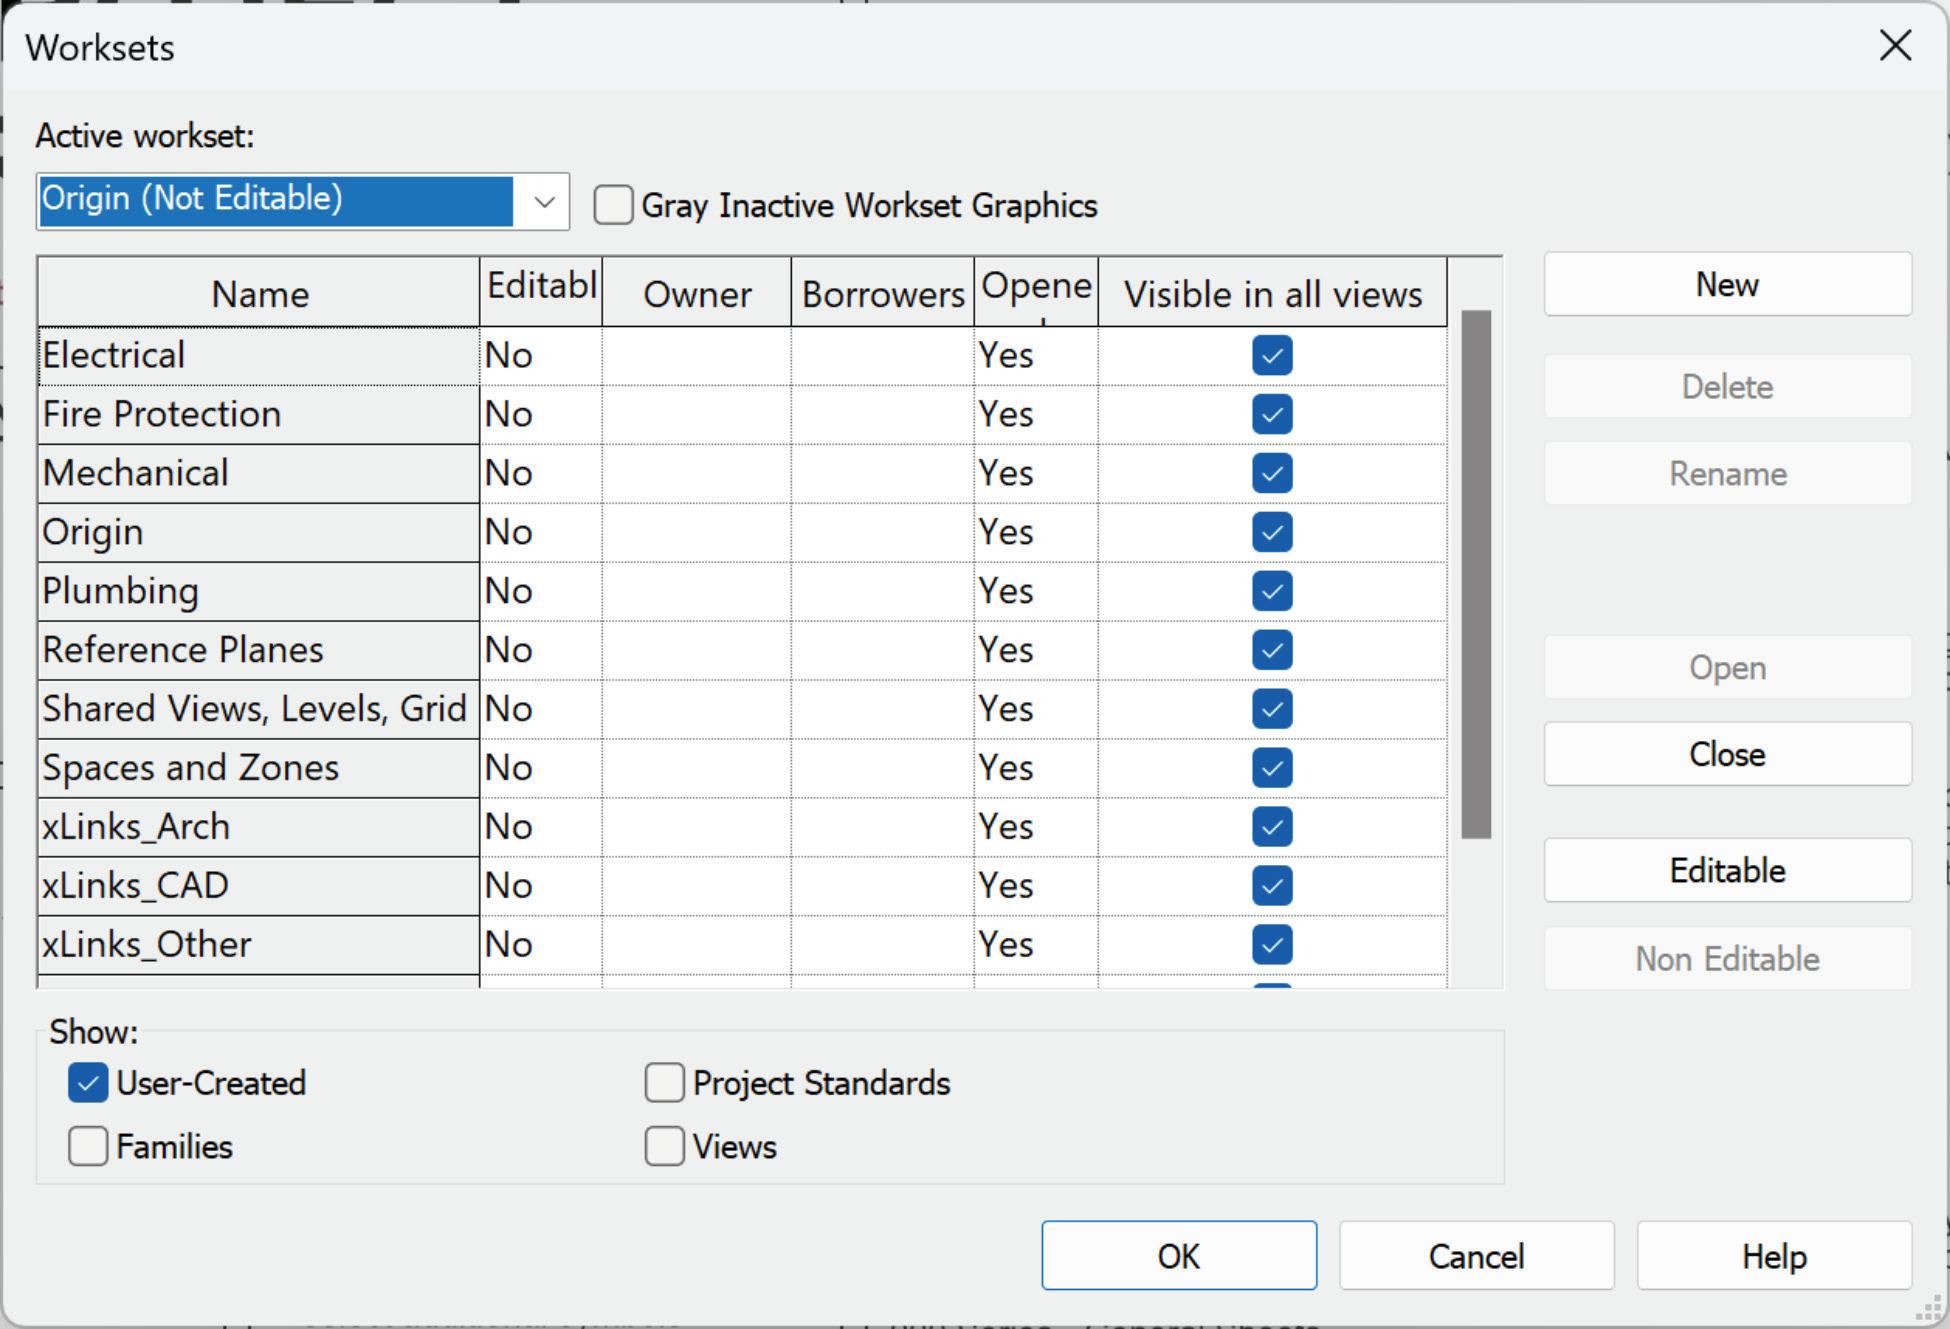
• Global Parameters: These parameters are specific to a single project file but are not assigned to categories. They can be simple values, values derived from equations, or values taken from the model using other global parameters. Global parameters are used to drive and report values. Global Parameters are one of those things I mentioned at the beginning of the article that cannot be included if the file is a .RTE (Revit Template) file. I am using Global Parameters to control North Arrow rotation for the project, identifying what version of Revit and Starter File version that are used for the project.
• System Parameters: These are built-in by default
6/7 - Project Units and Format
in Revit and cannot be removed, renamed, or modified. They control the properties of elements in the project. These parameter types are not something that you would have control over in your template.
• Shared Parameters: These are parameter definitions that can be used in multiple families or projects. Shared parameters can be tagged and scheduled, and their definitions are stored in a separate file, making them protected from change. I use Shared Parameters for my Global and Project Parameters and the location of your company’s Shared Parameter text file can be mapped within your template, so users have easy access to add additional parameters if needed.
• Family Parameters: These parameters control variable values of the family, such as dimensions or materials. They are specific to the family and can be used to control a parameter in a nested family by associating the parameter in the host family to the parameter in the nested family.
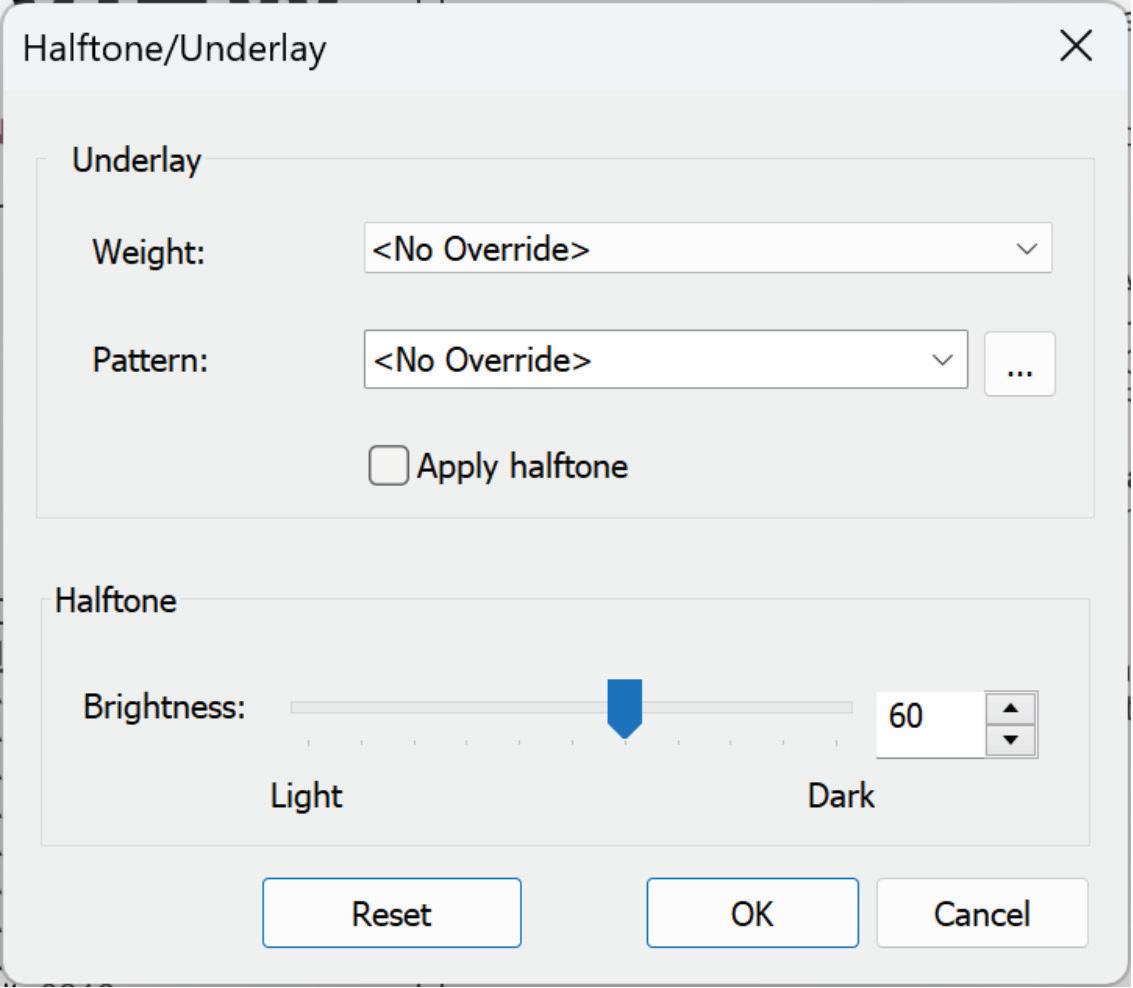
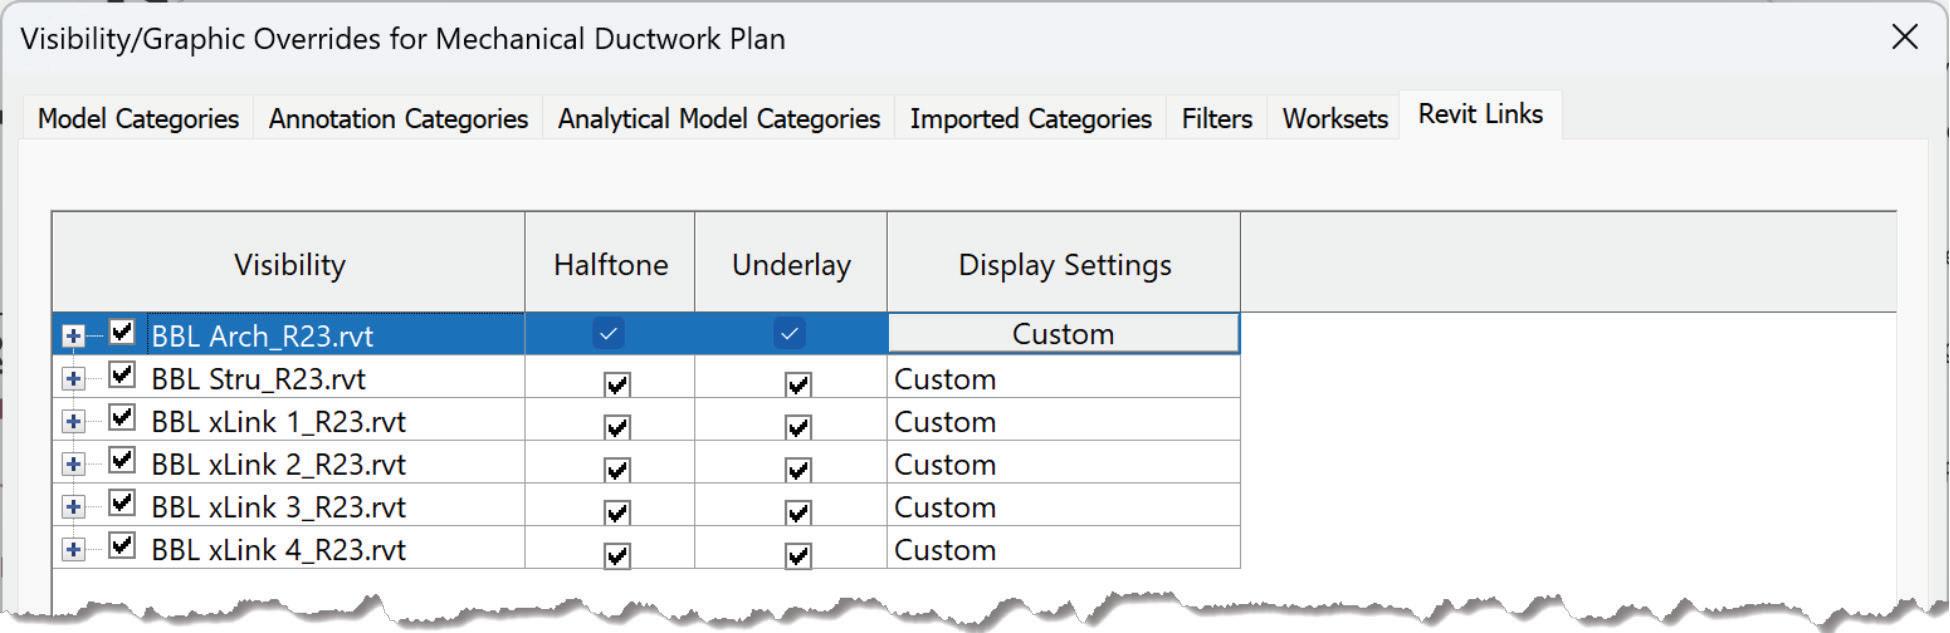
Halftone/Underlay is one of those global settings that controls how any linked models look. If you want them to “fade” into the background so your work stands out more, check the box for Apply halftone and play with the Brightness slider to dial in how dark/light you want those background models to be.
Figure
OBJECT STYLES AND DEFINITIONS
These elements define how your plans look. Aside from nailing down your settings, this is probably the single most important aspect of your template. You will want this to conform to the standards you have established and if they are still a work in progress, you can always revisit them after you knock out a couple of projects.
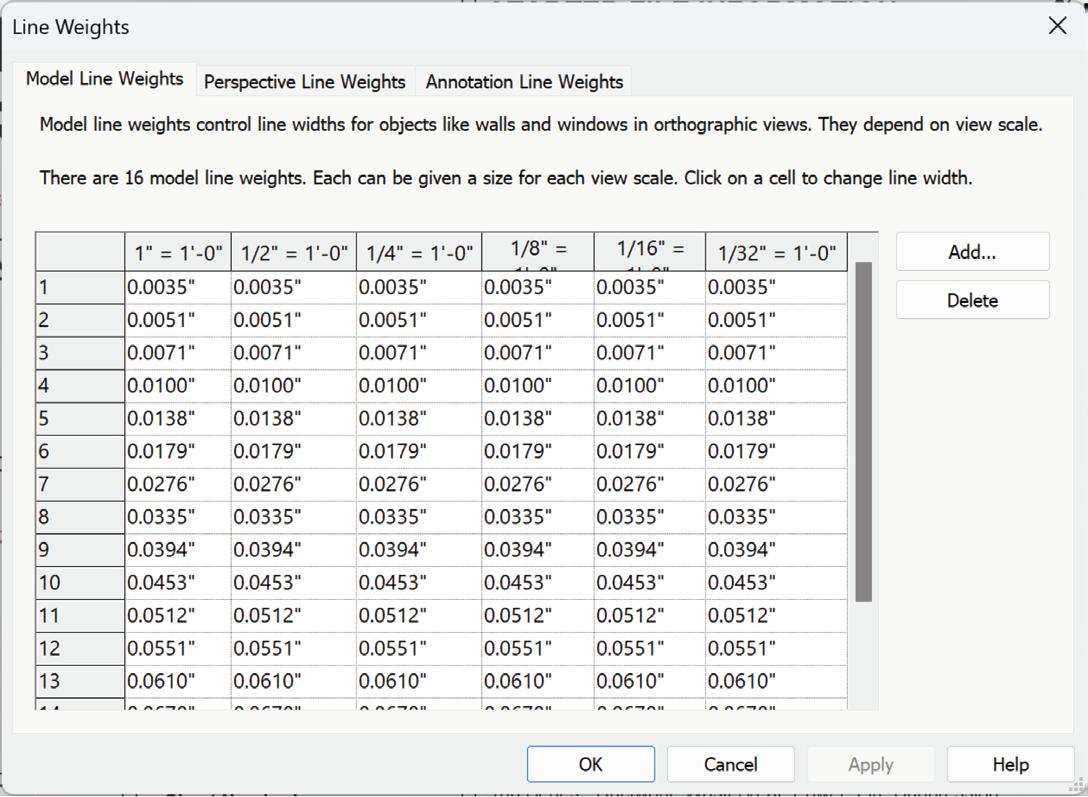
Object Styles, of all the things from this group, are paramount to your template and control how the Revit Categories (model, annotation, analytical, and imported) look on your plans. However, you cannot define your object styles without defining a few other things first. Those things are Line Weight, Line Patterns and Materials. These control how thick your work is, if the lines are solid or some other pattern and if they have a material assigned to them by default. The out of the box Line Weights are something I do not recommend using. You have sixteen available Line Weights to use within your template. The sixteenth one from Autodesk is a ½” thick. Who uses a ½” thick line? You can also create different line weights for different scales if you wish. At any rate, you should modify these to be something more reasonable (Figure 9).
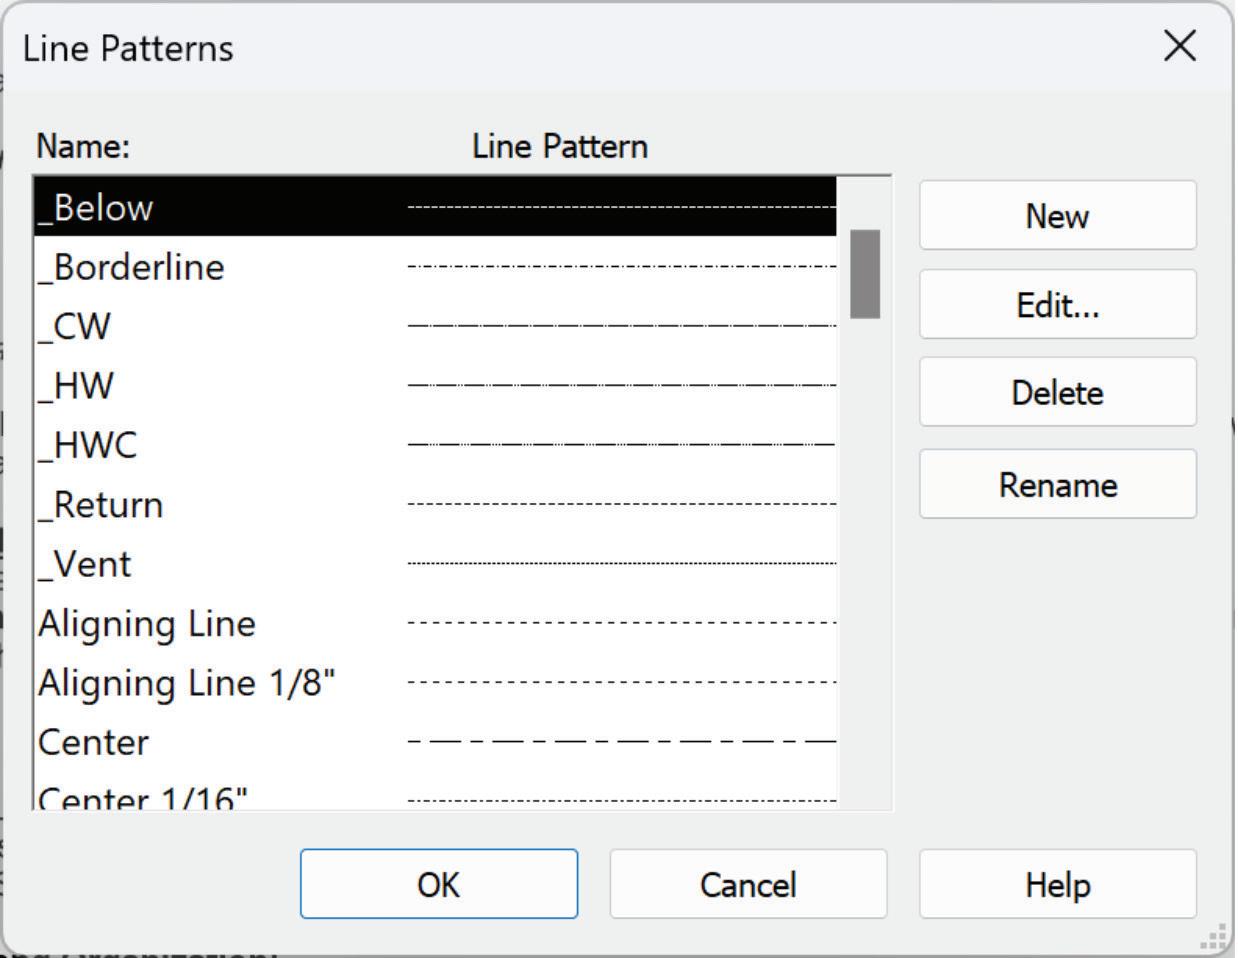
There is already a healthy amount of line patterns already defined within Revit when your template is created, like Center, Dash, or Hidden. For MEP, I have specific line patterns for Domestic Water Cold, Hot and Recirc, Return Systems, Vent and Waste. This way if the other similar patterns get changed,
they don’t affect the ones needed for my Piping Systems. You can create new patterns using specific Dash/Dot and Spaces set to a specific length Figure 10).
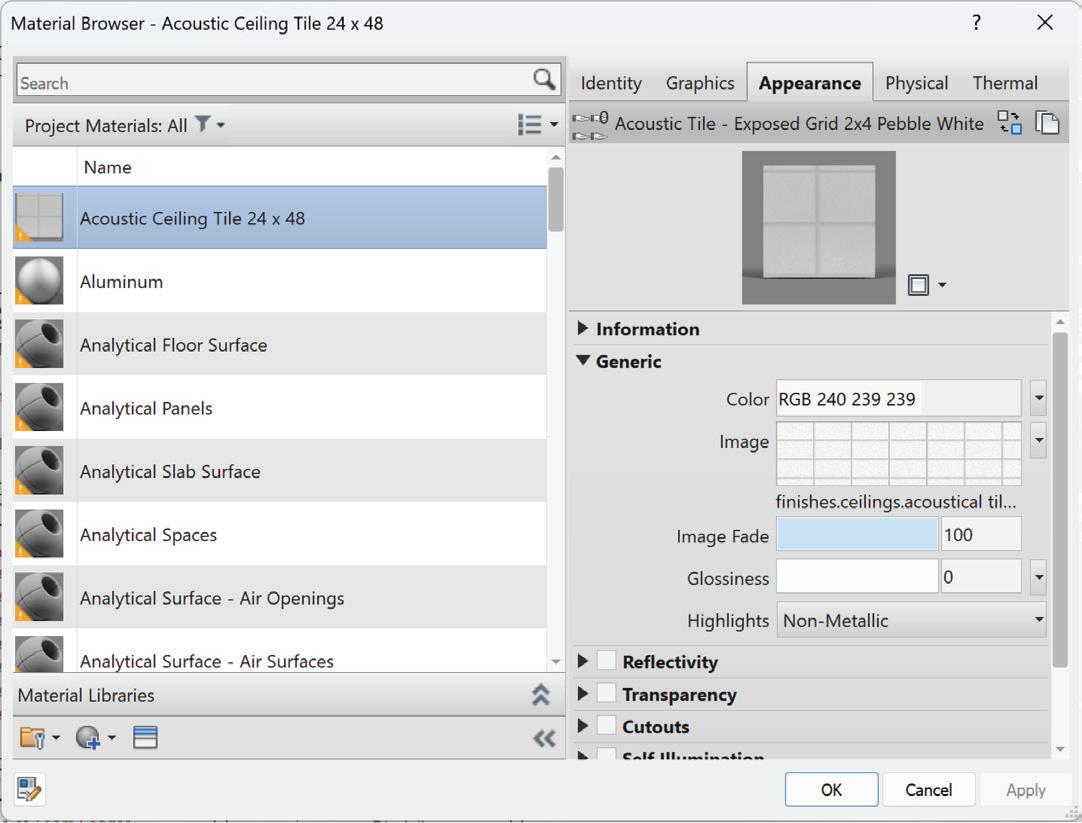
Materials, which can be assigned to any modeled Revit family, can get a little out of control in your template if you do not keep an eye on it. Revit includes several dozen materials already. I highly recommend coming up with a material naming convention so that you can quickly identify when a rogue material is loaded into your Starter File or Project. I also highly recommend keeping your material list lean and mean. Materials will get loaded into your project from the content you load into it during the life of your project (Figure 11).
Figure 8 - Halftone/Underlay
Figure 9 - Line Weights
Figure 10 - Line Patterns
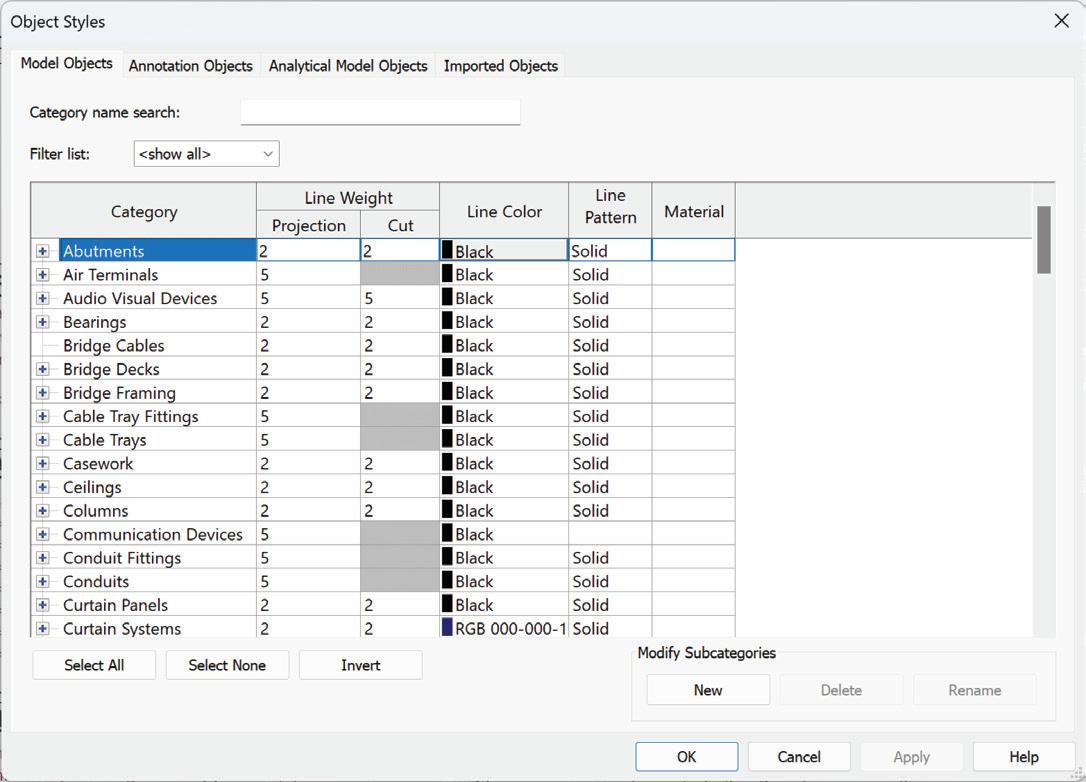
Now that you have defined your Line Weights, created any additional Line Patterns you need as well as any Materials you wish to include in your template, you are ready to define your template’s Object Styles. Within the Object Styles is a list of all the Revit Categories and the default/created subcategories for those main categories. You will need to assign each of those categories a line weight for project and cut, line color, line pattern
and material. Projection lines are seen from a distance. Cut lines are usually thicker and are used when an element intersects the cut plane of the view. For our MEP Template, I have our MEP categories set to a line weight of five, while the Architectural and Structural categories are set to a line weight of two (Figure 12).
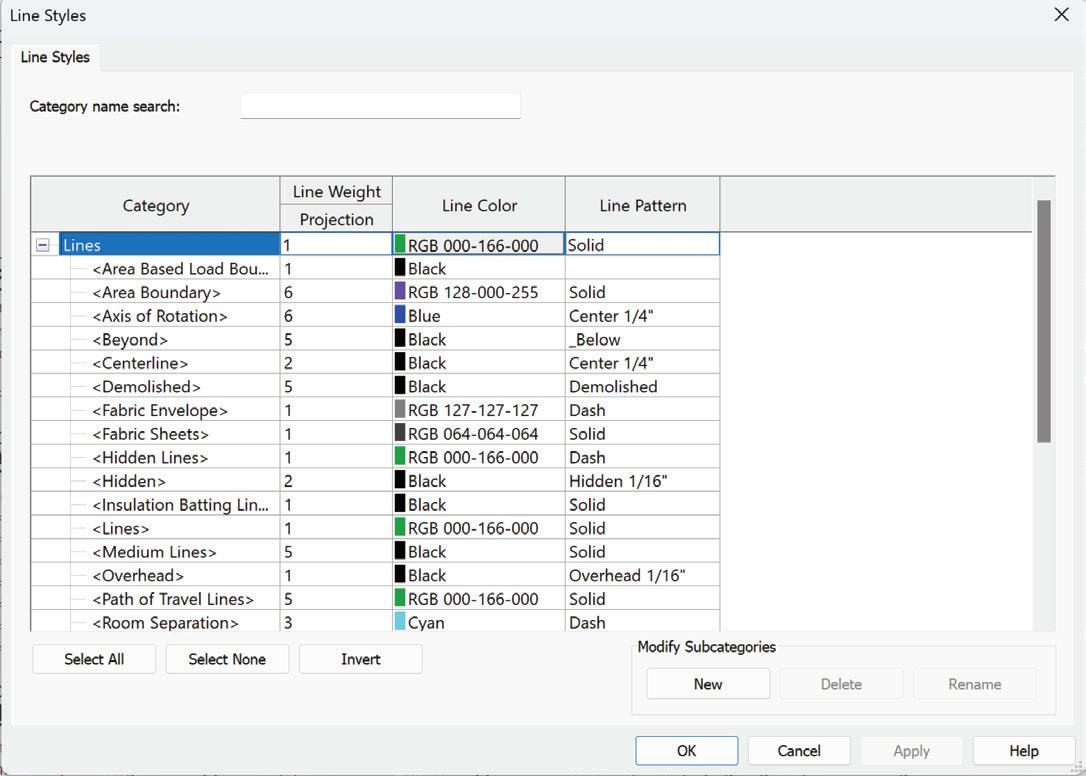
Line Styles are another “setting” that should be evaluated. Revit of course comes with some Line Styles already defined and those can be identified with < and > before and after the Line Style name. Any category as they are called whether out of the box or custom will need to have a Line Weight, Line Color and Line Pattern assigned. Your Line Styles are your 2D elements within your template that could get used on your plans or in your details.
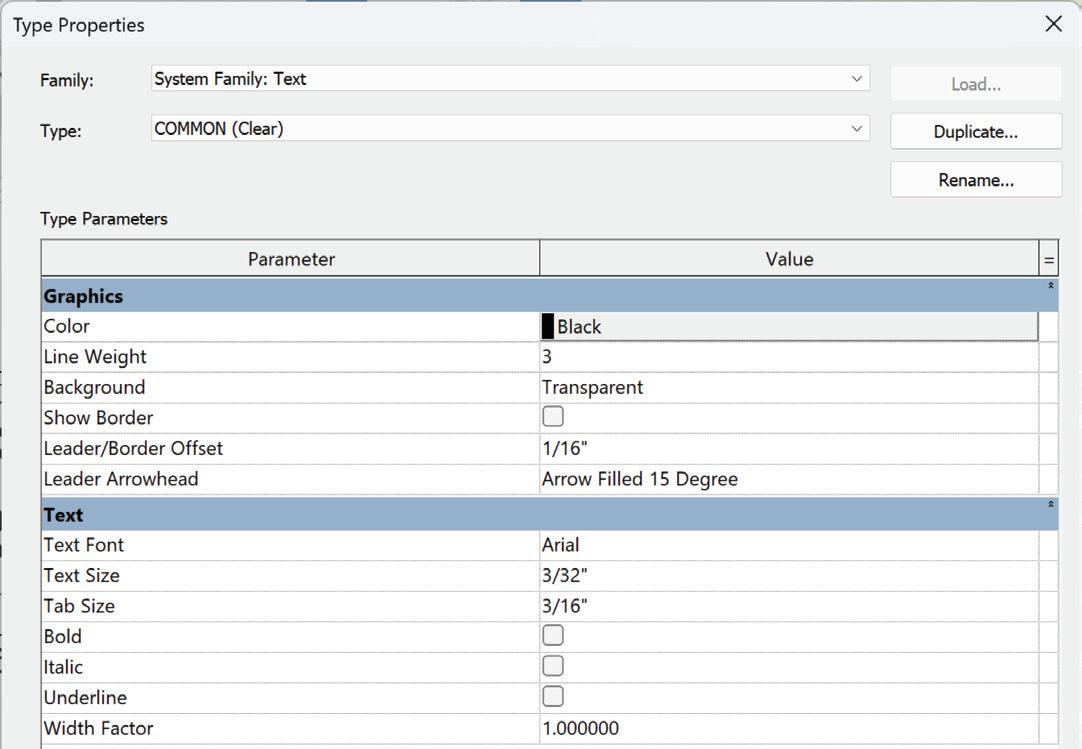
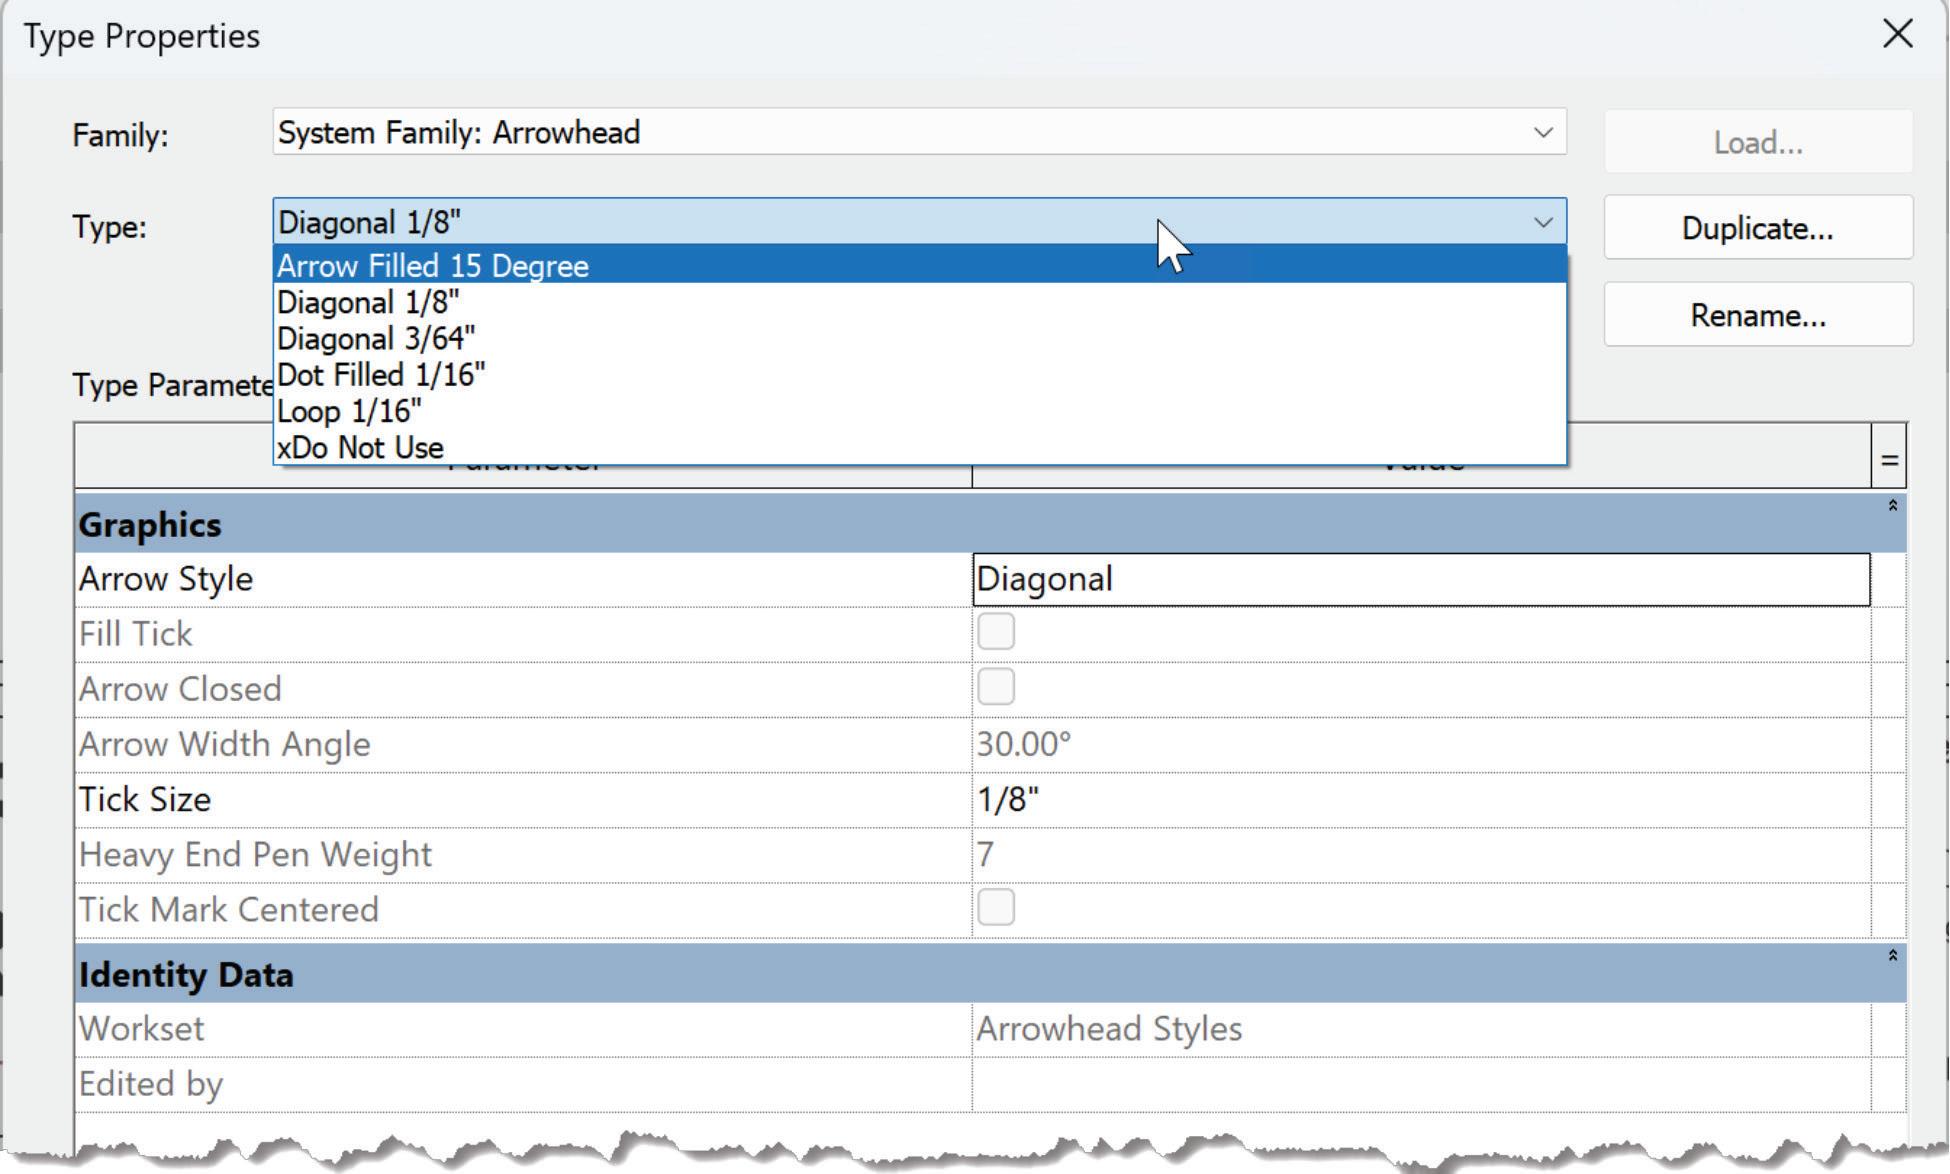
Next on the list is Text Styles. This is where you define the text types you wish to have within your template. These contain the text font, text size, tab size, width factor, line weight (of the leader), background (opaque or transparent) color, show border, leader arrowhead and whether it is bold, italic or underlined. You can create as many text styles as you need. We have several text styles for
Figure 11 - Material Browser
Figure 12 - Object Styles
Figure 13 - Line Styles
Figure 14 – Text Type Properties
different text sizes, different backgrounds and some different colors (Figure 14).
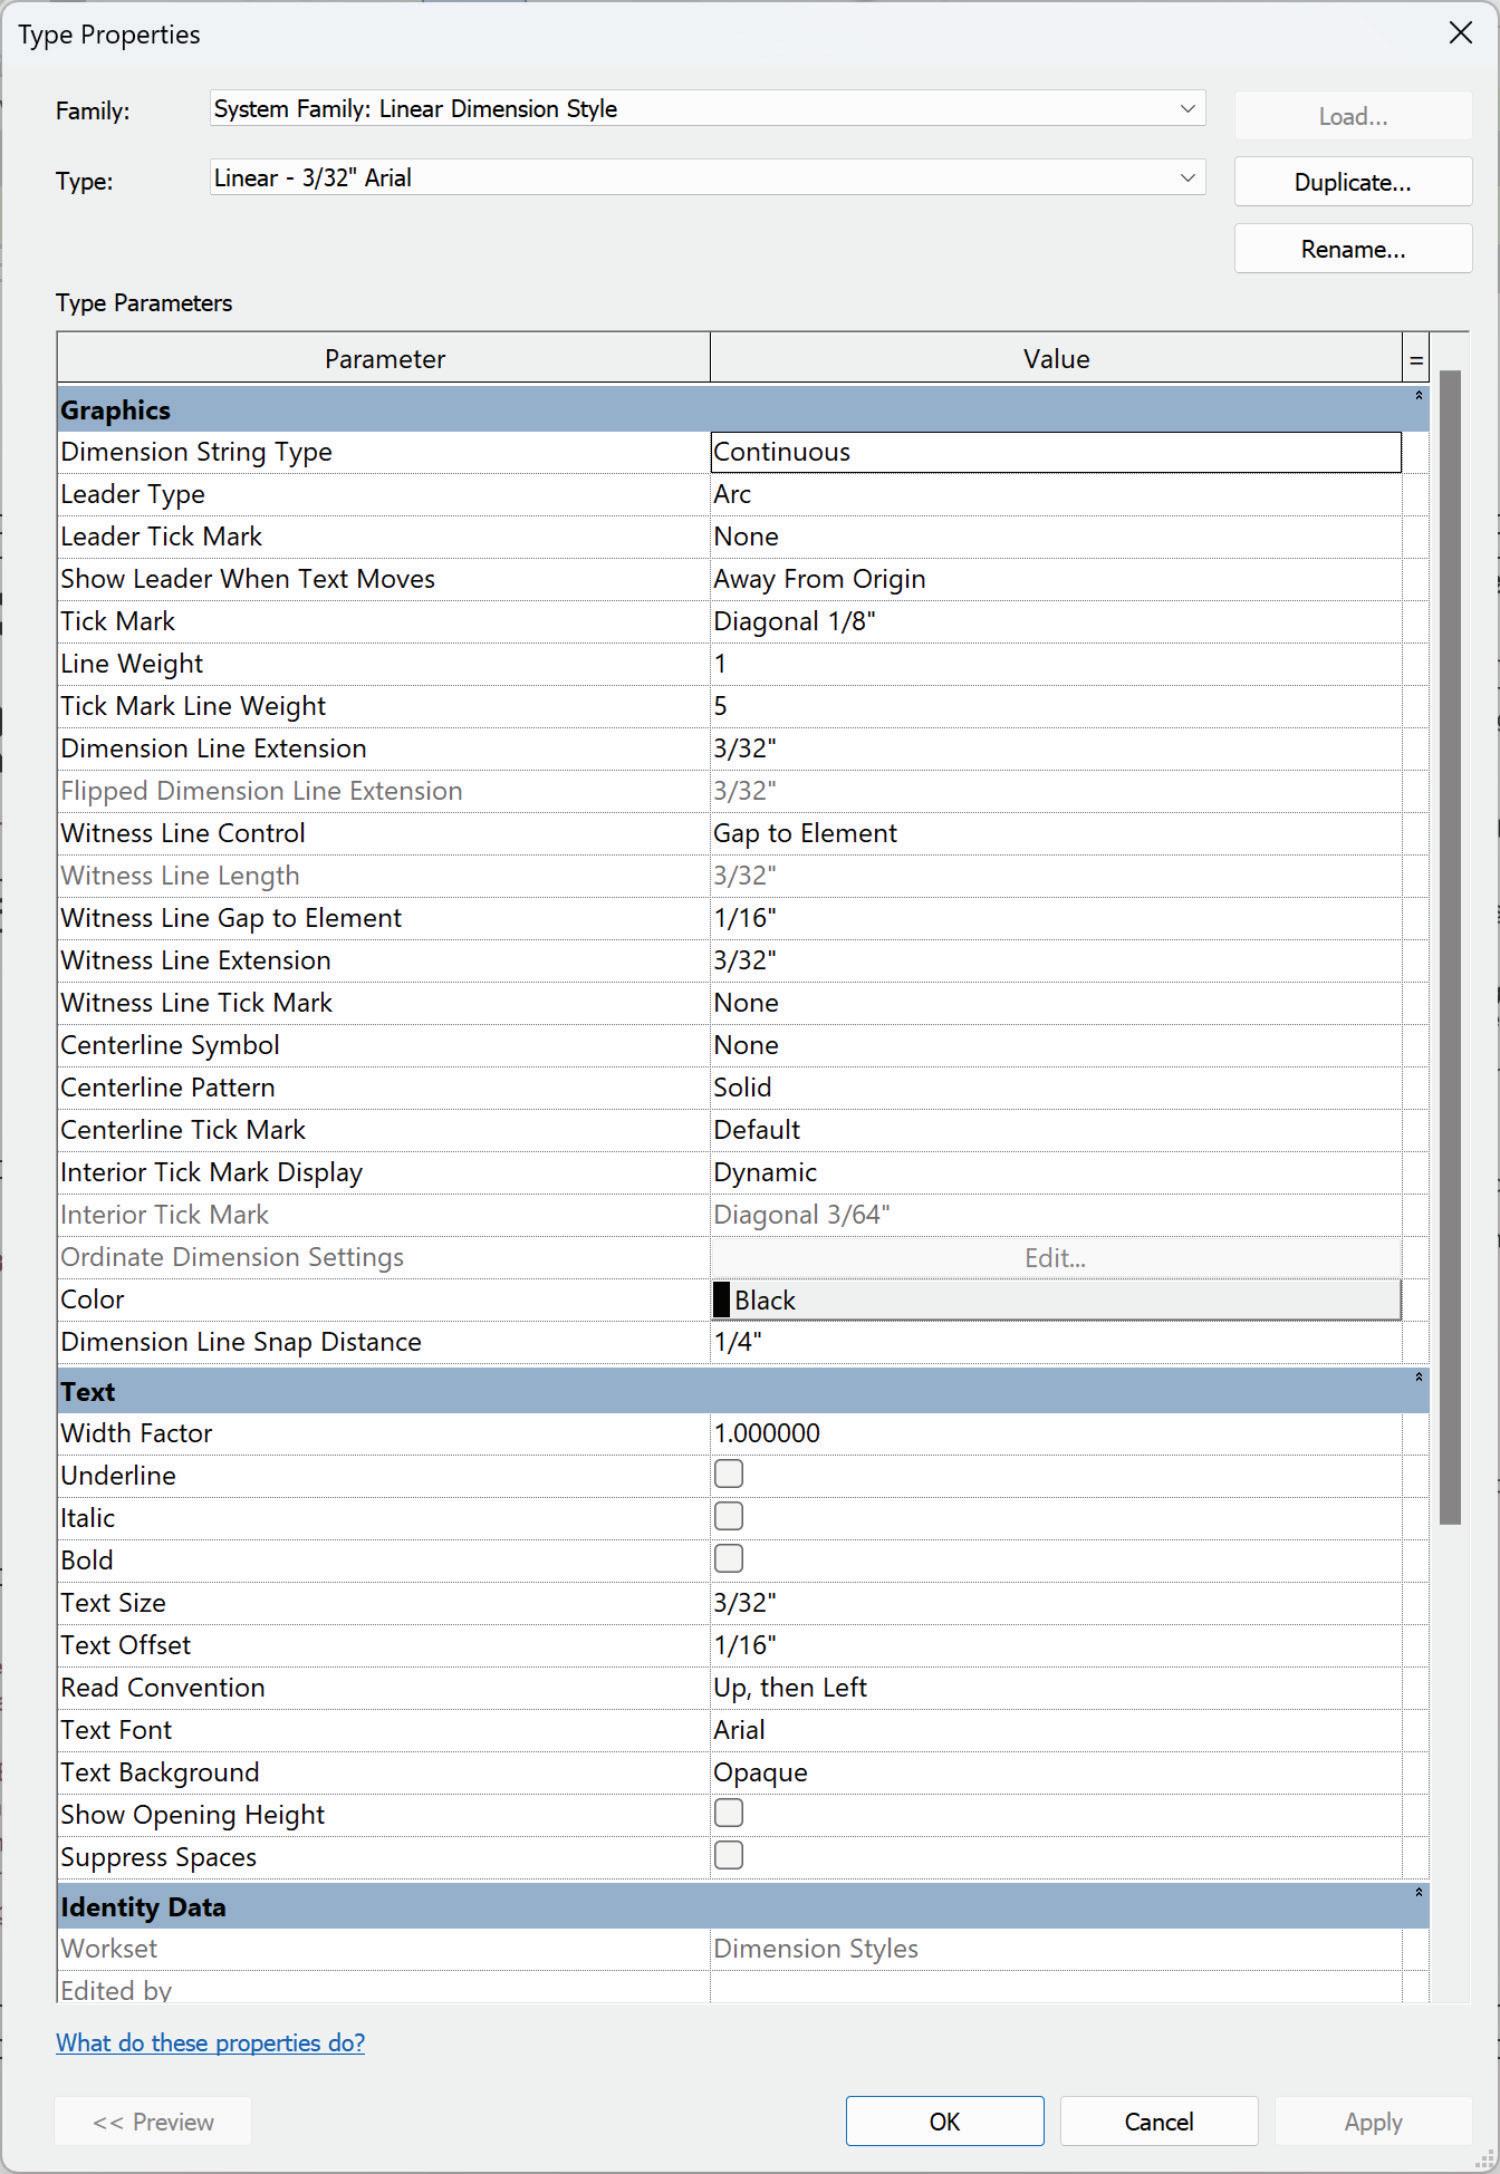
Revit also comes with several out of the box Dimension Styles you can use as is or customize to your needs. With Dimension Styles you have way more options to choose from as you can see from figure 15 so I won’t get into the weeds here. If you are showing dimensions on your plans, you will want to make sure these look the way you want them too.
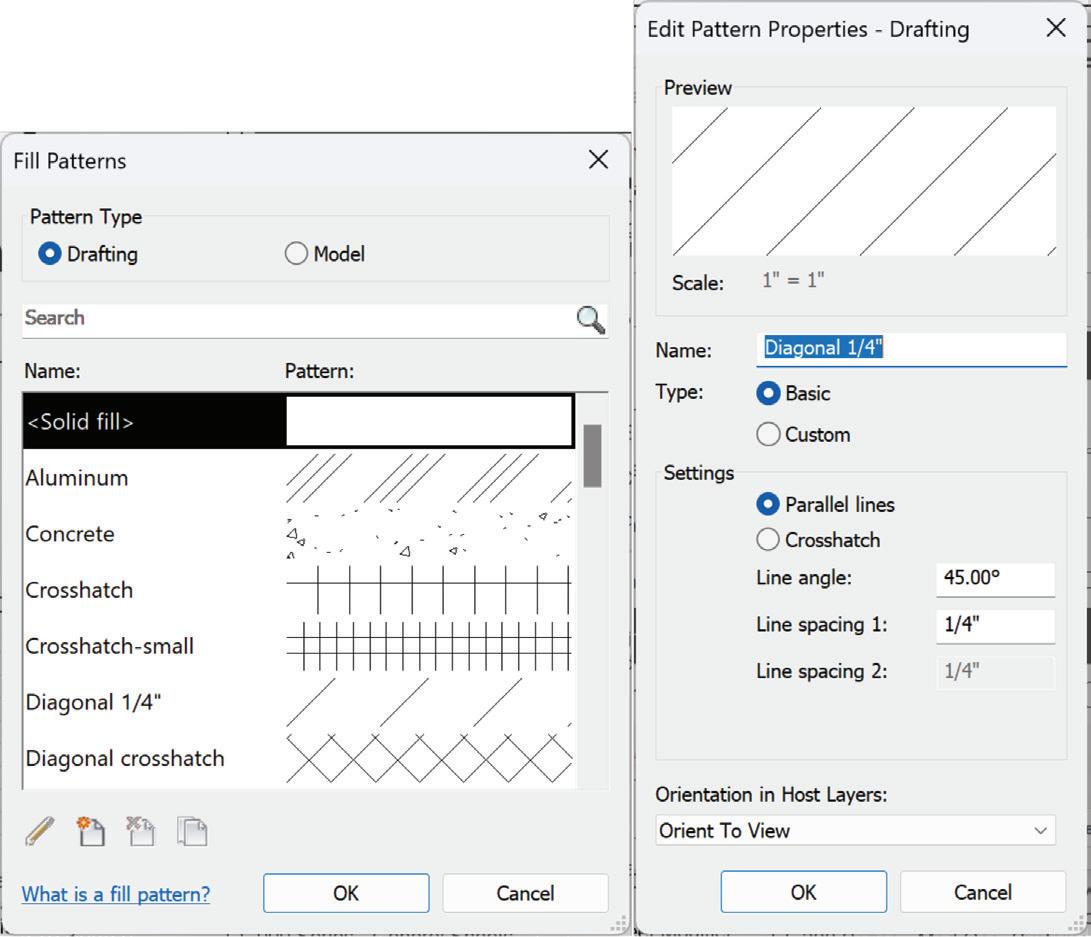
parallel or crosshatch, the angle, and your line one and two spacing. Custom lets you import a custom .pat file that was created in another program.
SHEETS AND VIEWS
The sheets and views consist of several elements: Drafting Views, Legends, Pre-Defined Sheets, Placeholder Sheets, Plan Views, View Templates, Levels, Browser Hierarchy, Starting View definition and working Schedules.
Drafting Views are your 2D detail views. These can consist of line, text, filled regions or Revit families known as Detail Items. If you have some standard details that you know you will always have on every project, you can include them in your template, so you do not have to load them all the time. These views can only be placed on your sheets once. If you need to place them on multiple sheets, they must be duplicated.
Ok, “one” more thing when it comes to the look and feel of your plans and that is Filled Regions and Fill Patterns. Think of Filled Regions as Hatch Patterns in AutoCAD. Filled Regions are defined by their Fill Pattern. You can have Drafting or Model Fill Patterns, and those Patterns are assigned to your Filled Regions. Your Fill Patterns can be basic or custom. Basic lets you define your settings for
Legends are another type of 2D view. The difference between them and Drafting Views is that they can be placed on multiple sheets. While they can consist of lines and text, they can also contain legend components. Legend components are 2D representations of the Revit families that are loaded into your template. I do not recommend loading all your modeled content into your template and I just create my legends using lines and text and some may disagree.
Figure 15 - Dimension Type Properties
Figure 16 - Fill Patterns
Before I discuss views, let’s talk about levels. Levels are defined as finite horizontal planes that act as a reference for level-hosted elements, such as roofs, floors, and ceilings. Levels are also needed to create your views. The number of levels you have in your template will depend on the types of projects you typically work on. If you primarily work on projects with one or two stories, create two levels and a roof level. If you work on high-rise projects create ten to twelve levels and a roof level. For the latter, you may want to create a few underground levels (for parking) as well. Right now, our template has two levels and a roof while an old firm I worked at back in Denver, we had fifteen levels, a roof, and two underground levels.
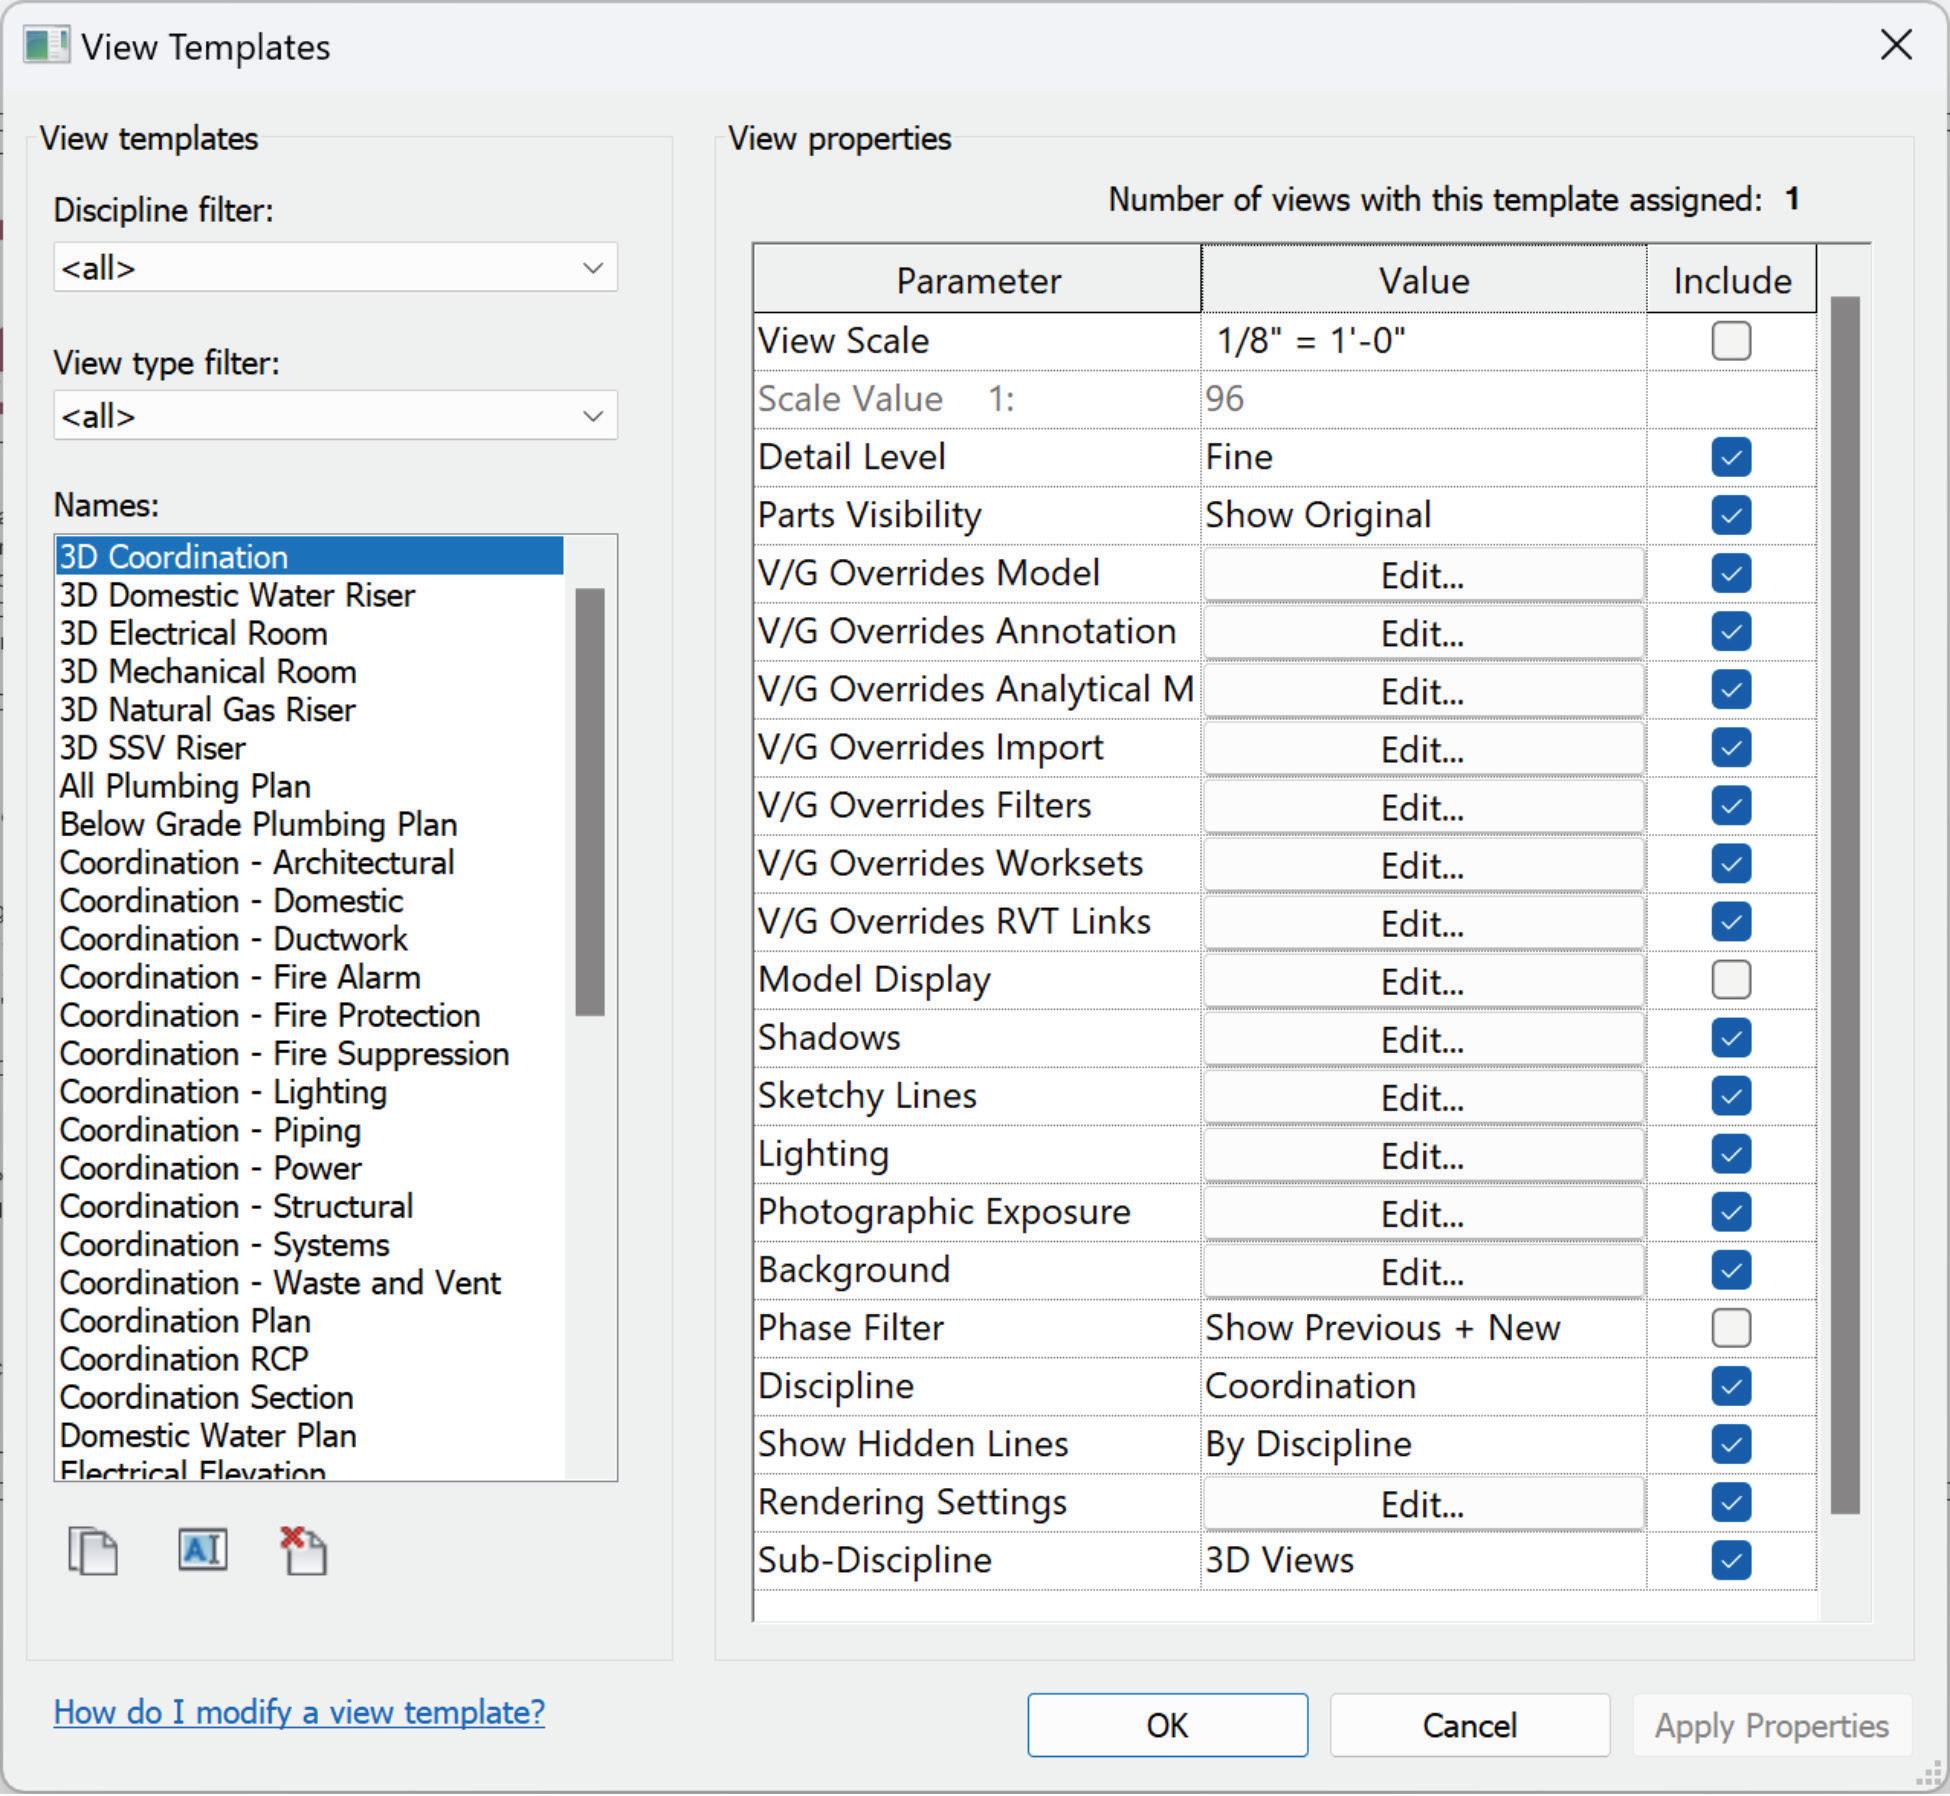
In tandem with your levels, you can generate all the necessary views for your project during template creation, allowing the deletion of unnecessary views when setting up the project. These views also come with specific View Templates already assigned. A Revit view template is a set of predefined view settings that can be applied across multiple views
to ensure consistency and avoid unintended changes. View templates encompass nearly all the settings available in the properties dialog, such as view scale, detail level, visibility settings, and discipline. Utilizing view templates enables swift application of numerous visibility and graphic properties to a view, facilitating the maintenance of standard settings and ensuring uniformity throughout your project. There are Revit addins out there that will let you create levels, views, sheets, et cetera, on the fly and that may be more efficient to some, but I feel it is better to delete something than it is to create it every time.
My template also includes both Placeholder Sheets and Pre-defined sheets. Placeholder sheets are sheets that exist in a sheet list as data rows, but do not exist in the project under sheets. Our placeholder sheets have a sheet number, and a sheet name already filled out which can easily be modified to match any of the architects we work with using various methods. I have enough placeholder sheets in my template for all the subdiscipline views that correspond to each level I have. I also have placeholder sheets for enlarged plans, additional details, schedules and diagrams. For predefined sheets, these are sheets like Legends, Abbreviations and Notes and Details. The drafting views or legends are created within the template and placed on these pre-defined sheets so that this information is in the same exact spot on our sheets for each project and the end user does not have to recreate them every time.
Your template should absolutely contain some schedules, working or otherwise. What I mean by a working schedule is a schedule that contains information that you can manipulate as needed
but that does not get submitted on your sheets. I have a Master Sheet List and Master View list as well as a Space Schedule. Everything else gets loaded into the project as needed. If you need additional design or calculation schedules, create them in your template.
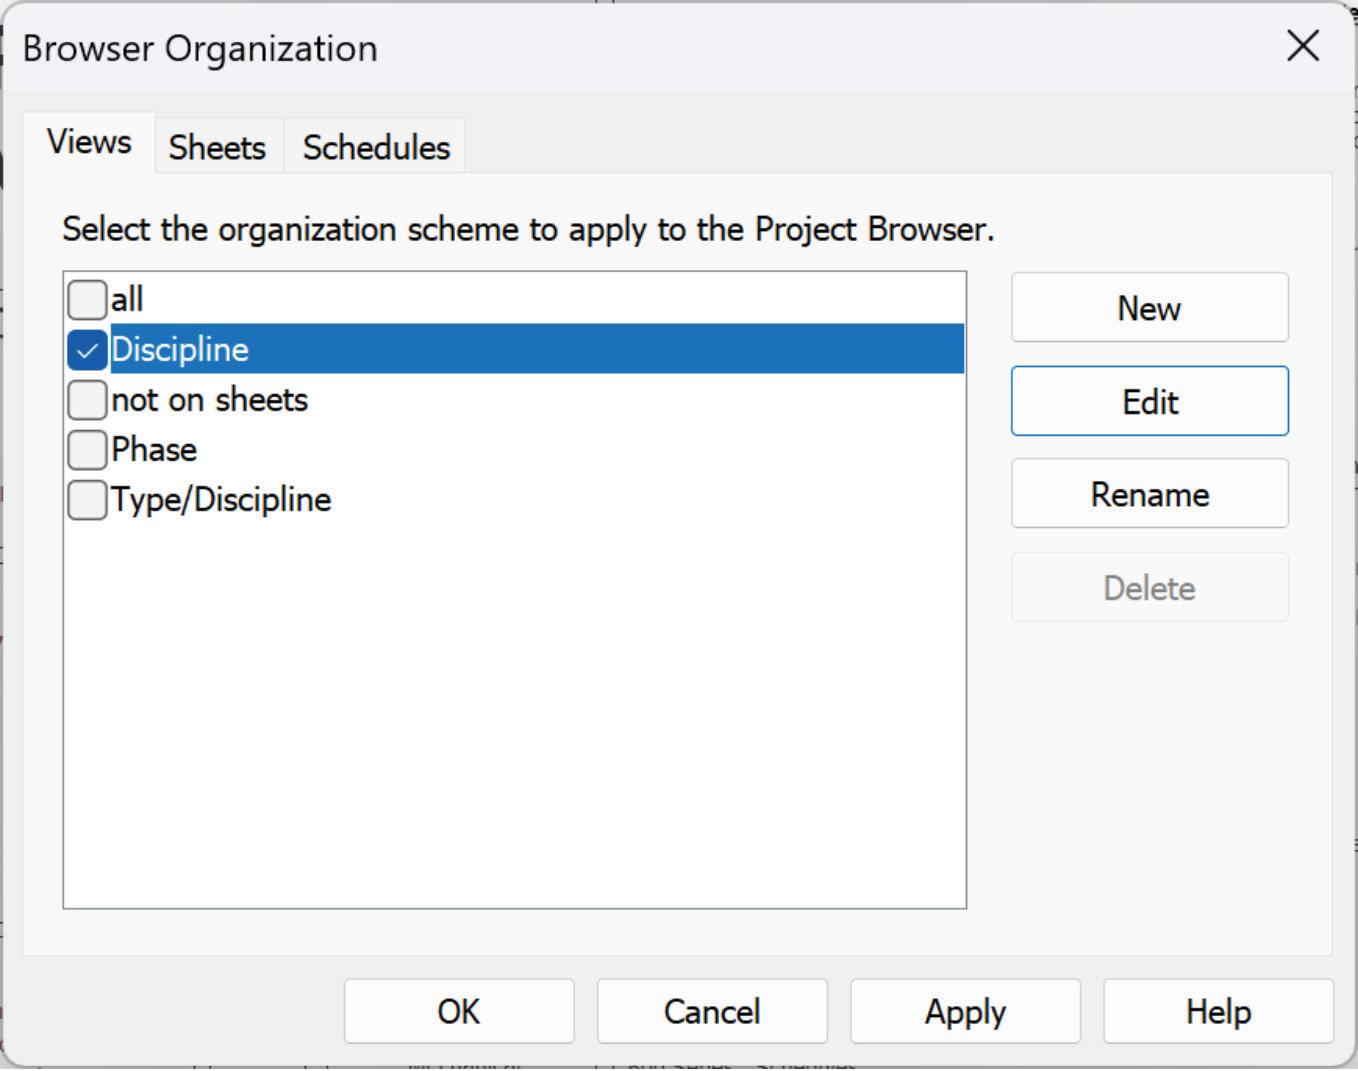
You will access all of these elements: views, schedules, sheets, and legends from Revit’s Project Browser. Think of this like a table of contents in a document. You can customize how your Project Browser displays these elements. You can have different Browser Organization settings for your Views, Schedules and Sheets. The settings are controlled by parameters, either built-in ones or ones that were assigned to those categories using Project Parameters. You’ll want to set this up to work best for your company.
A Starting View can be defined as any view you want to be the first thing the user sees when they open the project. In the past, these were “2D” views that had minimal information, and it was recommended to synchronize your model with this view open. These starting views have evolved into something that gives the end user a plethora of information related to the project. I would create this as a sheet because it could contain Project Information and pull that information from parameters that are only found in your projects title blocks. I have seen these as dashboards of sorts or contain some design specific schedules. Use it to put any information you want the end-user to see right away.
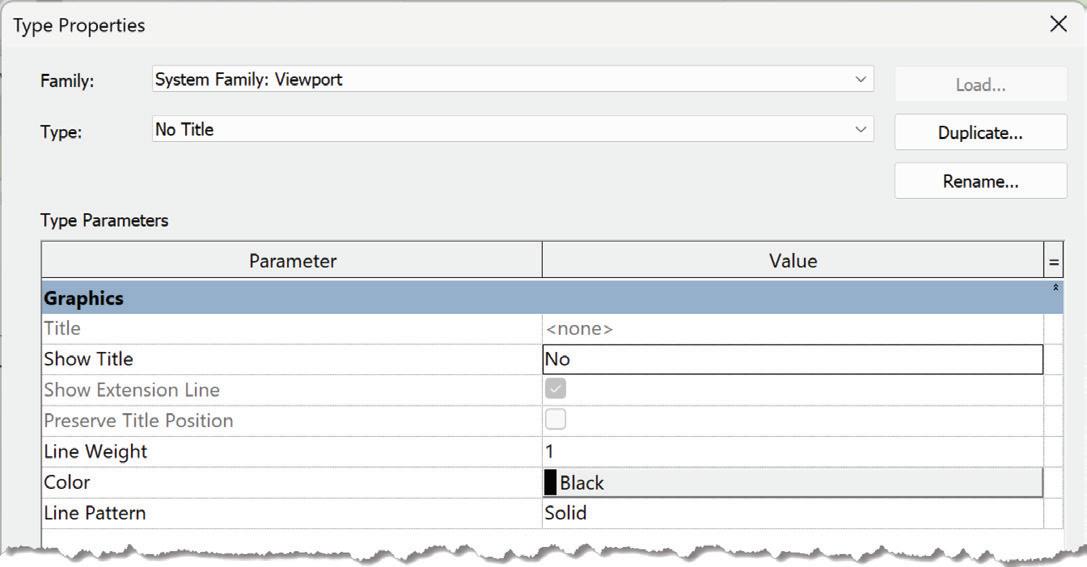
When a view is placed on a sheet, Revit uses a Viewport Type. There is a default Viewport Type, but others can be created and customized as you need. These Viewport Types control the View Title used. View Titles are loadable Revit Generic Annotation families. You have the option to show the title, control its line weight, color and pattern.
I have different view titles for different things like No Title, Plan Views (have north arrow built in) or Not to Scale.
MEP SYSTEMS
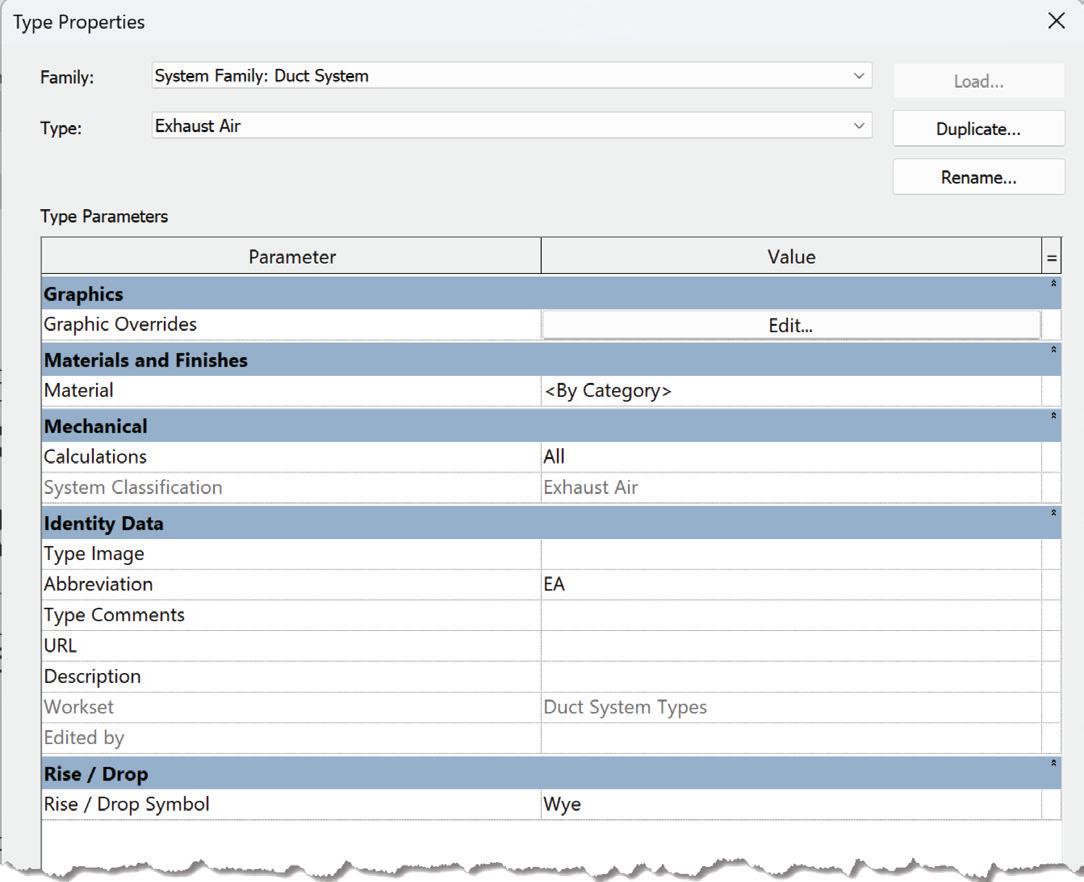
For MEP Systems, as with other things within Revit, there are some default systems already created for you. While you may be able to get by with the default, I am very confident that you are going to want to expand on these MEP Systems. For Duct, you get Supply, Return and Exhaust. These system types can be duplicated, renamed and additional type information modified. Under the Systems type properties, you can change how the system looks (graphic overrides), what material it uses if different than your global change to Ducts in Object Styles. You have options for calculations, the system abbreviation, description and how the rise/drop symbol looks. We change our graphic overrides to be a certain color based on the system for both duct and piping, so the different systems are easily identified on screen.
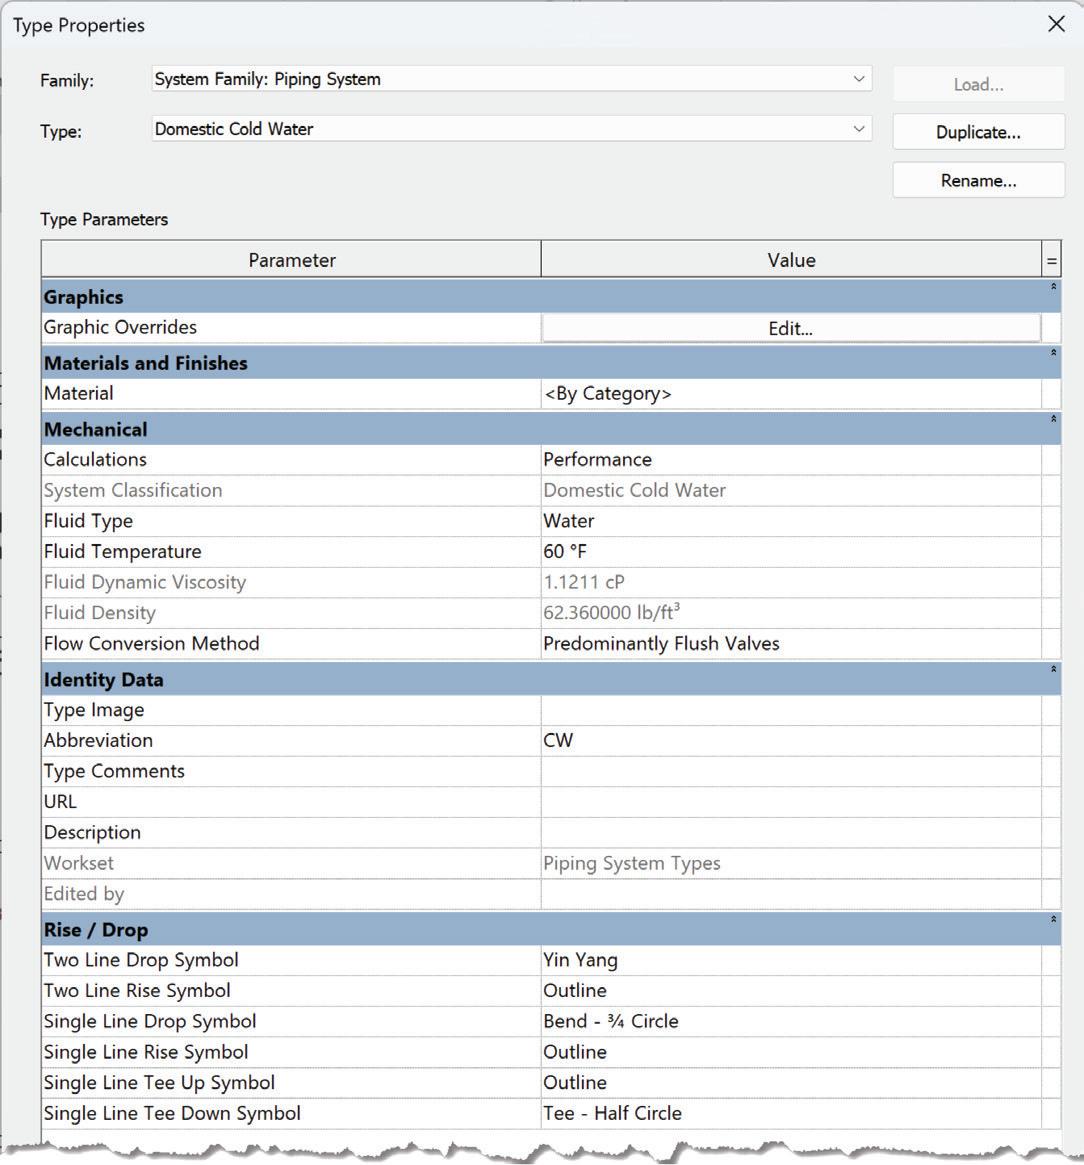
Similar to Duct, Piping Systems have some default systems already available that you will use to create other systems. Those types are Domestic Cold/ Hot, Hydronic Return/Supply, Other (this is typically used for Gas and Air systems), Fire Protection PreAction, Wet, Dry and Other, Sanitary and Vent. Piping Systems have a lot of the same options as Duct Systems but there are quite a few additional
Figure 18 - Browser Organization
Figure 19 - Viewport Types
options. These options, as seen in Figure 20, are Fluid Type and Temperature, Flow Conversion Method, and Two Line and Single Line Symbols.
Cable Tray and Conduit also work the same as Duct and Piping Systems and have pre-built system types already. Now these, for the most part, can be used as is. There are types for Conduit/Cable Tray with and without fittings. I highly recommend removing all of the without fitting types except one and renaming it to “Do Not Use” because you technically cannot delete all the types. You will also need to make sure that the Conduit/Cable Tray with Fitting types actually have fittings assigned to them.
In order to be able to layout your Duct and Piping Systems you need to create some Duct and Pipe Types. These are used to define your Duct or Pipe Routing preferences. These are what defines the duct/pipe. Under the Duct/Pipe types of settings you will find a button called Routing Preferences. Here is where you will have to tell Revit what duct/ pipe fittings you want to use (1D radius elbow vs mitered for example). For Piping, you have to identify which Pipe Segment
you want to use, copper, PVC, Black Iron or Carbon Steel are some options here. You also can change the segment and fittings you are using for Piping Systems as the pipe size changes.
Figure 20 - Exhaust Air Type Properties
Figure 21 - Domestic Cold Water Type Properties
Figure 22- Duct/Pipe Type Routing Preferences
of these tags to show the information you want using their built-in parameters or any custom shared parameters you have added to your families. Any standards you have created, like text styles, line weights, line styles and line patterns should also be replicated in your generic annotation and tag families.
Besides the Revit System families (which cannot be loaded), I recommend keeping your template free of most of your loadable content except for your tags and the generic annotation families mentioned above. In my opinion this keeps your template small and easy to manage. A Content Management System like Unifi, Hive or Avail to get that content loaded very quickly into your project.
Panel Schedule Templates are another aspect of the template that should be customized. The default ones will work, but you can pretty easily modify these schedules to match as close to possible how your AutoCAD Panel Schedules look. There are a lot of options to go through for a Panel Schedule –General, Circuit Table and Loads Summary, but I will let you take the time to go through each of those options to fine tune to your needs.
ANNOTATIONS AND TAGS
To tie all the things mentioned previously together, you need generic annotation families for your documentation. These Generic Annotation families include all of your Revit Category Tags for loadable content, View Titles, Section/Callout/ Elevation Tags, Title blocks, Level Heads, Gridlines, Room/Space Tags or View References. You can customize most
Those tags and various other Generic Annotation families, as well as your Text Styles have an option for arrowhead type. These Arrowheads can be defined under the Additional Settings drop down menu on the Manage Tab (back where we started). There are some default ones here as well and they are also system families. There is a dropdown for some pre-canned arrow styles and depending on your choice, you can control if it’s closed or open, it’s angle and size.
Figure 23 - Set Template Options
Figure 24 - Arrowhead Type Properties
MISCELLANEOUS
OK ok, if I still have you since there was a lot of information to digest up until this point, we are in the home stretch. There are few things left to discuss that really did not fit into the other categories, so they fall under miscellaneous. Let’s go over those now.
Revit models can be created as a workshared model or a single person model. A workshared model requires worksets. When worksharing is enabled, Revit creates Shared Levels and Grids and Workset 1 for you. As the master of the template, if you are using a Starter File and not a template, you
can create all the necessary worksets you may need. Worksets are not layers and while people use them to control visibility, they were not intended to be used to control visibility. They are intended to allow multiple people to work on similar things. There is no guarantee that what is modeled in your model is on the correct workset unless you manually change an elements workset or use a third-party tool to do it for you. So, it is best not to use them to control visibility at all. This is what filters are for. We have worksets for each Discipline: Mechanical, Electrical, Plumbing and Fire Protection. We also have some miscellaneous worksets for linked models (this is like xref in AutoCAD), Spaces/Zones and Reference Planes.
Speaking of Links, earlier I discussed View Templates and how those View Templates can control how a specific view looks. Within View Templates, there is a tab for Revit Links. These View Templates can control how a Revit link looks as well. If you add what I call Placeholder Links to your template, you can control how those links look on all future projects. This way you do not have to manually do this every time. I turn off things like Reference Planes, Gridlines, Levels, Matchlines. Actually, I just turn off all of the annotation
Figure 25 - Worksets
Figure 26 - Placeholder Links
categories in my links. I have 6 placeholder links in my template and to maintain those link settings you would “reload from” instead of link a new model.
We are using Revit as a 3D modeling and design tool but 2D aspects as still needed to convey your design intent. This can come from linked dwgs in the form of details or sitework from Civil3D. There is a “hidden” setting within Revit where you are given a list with all 255 colors from AutoCAD and here is where you can map those colors to Revit Line Weights that you established earlier. How this works is that when a CAD file is linked or imported (please link) into your Revit model, it looks at this setting and changes the thickness of the DWG lines to match the line weights for that color.
In Figure 27, you may notice that everything is set to 1, this is because we try to use as little AutoCAD in our models as possible. In a previous firm I worked for, we had different values for all the colors. Please note that these line weights
Figure 27 - Import Line Weights Location
Figure 28 - Import Line Weights
Figure 29 - Sheet Issues/Revisions
only apply to line/layers that are set to default and not overridden in AutoCAD.
Revisions are yet another thing to look at. On the View Tab you will see a button for Revisions. When you select it, a Revisions dialogue is opened, and this is where you set your Revision options. You can modify the numbering per project or sheet, any custom numbering and your arc length. The default arc length is set to 3/4”.
One last thing to discuss and that is a new feature in Revit 2023 called Multiple Values Indication. This is a global setting but can be individually controlled within any of your schedules. What this means is that whenever you have something that has multiple values, like the cell of a schedule, Revit used to just show it as blank. It now says <varies> by default but it can be changed to show custom text. This comes in handy in Schedules for sure, like telling a specific column to say “SEE PLANS” or similar.
CONCLUSION
In conclusion, customizing your Revit Template is not just a technical task; it’s a strategic move that can significantly enhance your workflow and project outcomes. By tailoring the template to meet your specific needs, you ensure that every project starts on the right foot, with the right tools and settings in place. This customization leads to increased efficiency, consistency, and quality in your work, ultimately saving time and reducing errors.
The importance of this process ties back to the title of the article, emphasizing that a well-customized Revit Template is the foundation of successful project execution. Just as a strong foundation is crucial for a building’s stability, a customized template is essential for a streamlined and effective design process. It empowers you to focus on creativity and innovation, rather than getting bogged down by repetitive tasks and adjustments.
In essence, investing time in customizing your Revit Template is an investment in the future success of your projects. It sets the stage for excellence,
allowing you to deliver high-quality results that meet and exceed client expectations. So, take the time to customize, and watch your projects soar to new heights.
Jason Peckovitch is an Autodesk Revit Certified Professional for Mechanical and Electrical Design located in SE Iowa. He is a BIM Manager for Garver’s Buildings Business Line, specifically MEPF. Garver has nearly 50 offices across the United States and more than 1200 employees. His CAD/BIM career spans over 25 years but he didn’t switch to the AEC Industry until 2007 as a Mechanical HVAC Drafter and transitioned into BIM Management shortly after where he has been working since. Jason is also the father of three children; Shelby – 12, Blake – 9 and Logan - 6, a published photographer, gamer, and car/ tech guy. He can be reached at jmpeckovitch@garverusa.com.
Figure 30 - Multiple Values
Project Explorer–Object Sets and Custom Reporting Tools
Within your Civil 3D files there is an abundance of information. As you know, within Civil 3D there are many reporting methods for creating tables and exporting reports.
Project Explorer has its own built in, customizable and exportable, reports and tables. These can be built from individual objects as well as a group of “Object Sets”.
Also within Project Explorer are the options to export out to 2D AutoCAD drawings. This exports ONLY the Civil 3D Entities, and no other linework.
WHAT IS PROJECT EXPLORER?
Project Explorer (PE) provides users with an easyto-use Civil 3D design model review tool and user-
configurable report generator. Civil 3D users now have a more efficient way to access, interact, and share the staggering array of design information that is in a Civil 3D model.
Project Explorer:
• Simplifies project data navigation, review, and model editing.
• Makes it easier to discover and evaluate design criteria warnings to help meet design standards
• Facilitates more efficient generation of custom reports and tables that help meet delivery requirements.
HOW IS IT USED?
Typically, to manage projects and drawing objects, users would use the Toolspace Prospector tab in Civil 3D.
Image by freepik
Now, you can view and edit Civil 3D designs in a tabbed series of object lists, profile and section views, parameter lists, and many other designs review tools.
Now, you can validate your design using an extensive range of dynamic tooltips.
And now, you can automate the production of user configurable reports, spreadsheets, dynamic tables, and AutoCAD drawings.
Let’s look at some of the functions and settings first, then jump into creating a couple reports.
REPORT PREFERENCES / SETTINGS
Project Explorer includes a Version Control System which tracks and records every report generated from the Object Sets tab in the Project Explorer window.
The Preferences window is accessed from the Preferences button in the lower left corner of the main Project Explorer window.
Preferences determine any aspect of the Project Explorer user interface which is not relevant to the generation of reports. For example, color schemes and default scale settings for profile and section views, font settings for the user interface, and the visibility and pane layout of each individual Object Category tab in the Project Explorer window.
Figure 1
Figure 2
Civil 3D
In here, you can also edit the defaults for Reports and Tables for Object Sets.
Generate AutoCAD Drawings
The purpose of the 2D drawing export function in Project Explorer is to allow users to generate DWG files containing simplified 2D versions of their Civil 3D content. Exported geometry should look identical in plan but be built only from 2D entities. Sub-surface geometry and complex relationships that exist in the source Civil 3D drawing should be excluded from the exported drawing.
Generate AutoCAD Tables
There are two key methods for generating AutoCAD Tables from Project Explorer. The quickest and simplest method is to use the Quick Report to AutoCAD table option which supports the creation of static AutoCAD tables only. Alternatively, if more control is required over the content or scope of the table, or if it is likely to require updating repeatedly, an Object Set can be used to control the generation of your table. The Object Sets workflow supports the creation of dynamic AutoCAD tables which are linked back to source object geometry in Civil 3D.
For example, if I’d like to see a detailed Pipe Network table in Civil 3D I can select the pipe network, right click and choose Quick Report to AutoCAD table.
I can then choose a Sub-Object such as structures only, pipes only, or specify a certain Pipe Run. In this case, I chose to report on a Pipe Run between SSMH #1a and SSMH #5a.
4
Select OK and select NEXT. This brings me to the Create AutoCAD Table where we can customize a whole range of items pertaining to the layout of the table. For now, just select OK and place your table in Model Space.
OBJECT SETS
The Object Sets tab in the main Project Explorer window allows one or more sets of objects to be persistently defined in your AutoCAD drawing. Object Sets are particularly useful for automating the generation of one or more reports from your drawing.
Actions may be associated with each Object Set, and these actions can be triggered with just a single mouse click. For example, a report generating action could be used to create a report file using a pre-configured Layout Style, Report Style, Output File Name, and Path.
Object Sets can be created from the Create Object Set dialog box, which can be accessed in two ways.
• Navigate to the Object Sets tab in the Project Explorer window and click the Create Object Set button.
• Right-click any object in the Project Explorer window and select the Add to Object Set > Create Object Set... menu item.
An optional Object Set Action may be assigned
Figure
to each Object Set. Actions are generally used to automate the process of generating reports, spreadsheets, or AutoCAD tables. The Object Set Action Type parameter determines how the assigned action should be triggered - either manually or dynamically.
For this example, I’ve created an Object Set
Name called Pipe to Alignment SO. I’ve given it a description, set my Object Set Action to Report to DOCX File, and used the default settings for layout styles. Select OK.
data columns and values for all reports and spreadsheets.
• Report Style - required to define the page size, page orientation, page margins, report header, page header, and page footer settings for all reports and spreadsheets.
CREATE QUICK REPORT
The Create Quick Report window
Similar to adding a table into Civil 3D, you open the Create Quick Report window by selecting one or more objects from any object list pane in the Project Explorer window and select one of the Quick Report to File options from the right-click menu.
REPORTING OPTIONS
There are two key methods for generating reports and spreadsheets from Project Explorer. The quickest and simplest method is to use the Quick Report to File option. Alternatively, if more control is required over the content or scope of the report, or if it is likely to require updating repeatedly, an Object Set can be used to control the generation of your report.
Whichever method is used to generate a report or spreadsheet, there are two key input requirements which are needed to define the layout and format of report content.
• Layout Style - required to define the layout, format, heading name, and visibility of
Sub-Object support
For some object types, you can choose which sub-object type to include in a report. For example, for alignments it is possible to generate a report which includes calculated stations, alignment entities, alignment PIs, or superelevation critical stations.
When the Quick Report to File option is used, the sub-object type which is sent to the report is determined by the subobject tab which is currently selected in the Project Explorer user interface.
Layout
Style for Quick Report
The Layout Style for a report or spreadsheet may be specified in one of two ways:
• Using the Layout Style currently applied to the Project Explorer window. In this instance, the layout and formatting of any content written to the report will be dependent on layout options currently in use by the Project Explorer window.
• By defining a dedicated Layout Style for this report, or by loading a saved Layout Style definition from a file.
For this quick report, I’ve selected my sewer pipe network, right clicked and selected Quick Report to File. I’ve chosen a Sub-Object Type of Pipes List and selected Next to get to the Create Quick Report dialog box.
Figure 5
To further customize this report, I’ve selected the Use Custom Layout Style radial button, and selected Edit Layout Style.
From the Pipe Networks table, select the Set Column Layout for Pipes from the Column Chooser dropdown. Uncheck any properties you
don’t want to see in the report and organize them in order of how you want to see things. You can also set a sampling interval, in this case 5 feet. Select OK.
Select OK again to save and view the report.
CREATE REPORT USING OBJECT SETS
In a previous section of this article, we created an Object Set Name called Pipe to Alignment SO. Now let’s add to that Object Set.
Right click on the Sewer network and select Add Pipe Network(s) to Object Set and choose the Pipe to Alignment SO object set or create a new one.
Select Pipe Run as the Sub-Object type, and filter based on Start and End Structure, for this example I used SSMH #1a to SSMH #5a. Select OK. Select Next. Your pipe objects have now been added to the object set.
Switch to the Alignments tab of Project Explorer, scroll down to your preferred alignment, for this example I’m using N-S Main Rd. Right click, choose add Alignment(s) to Object Set and choose the same Object Set you added your pipes to. Leave the default value of Calculated Stations and select Next. Your alignment has now been added to the object set. You can choose to do the same with the design profile if you’d also like a depth comparison.
Switch to the Object Sets tab and select the Pipe to Alignment SO Object set (Figure 9).
You may edit any preferences or layout options while in this dialog box. When you’ve completed your setup, select RUN ALL ACTIONS to generate your report, and select Yes to open your report.
The possibilities here are endless and it may take some time to get the reports and layouts exactly how you want them, but if you haven’t yet explored Project
Figure 6
Figure 8 Figure 7
Explorer then hopefully this helps show a few of the capabilities.
CONCLUSION
This article barely scratches the surface of what Project Explorer can do. I’ll follow up with more use cases in future articles, but some of my favorite
Project Explorer (PE) uses not mentioned in this article are:
• Swap Multiple gravity parts (not capable without PE)
• View Profile View of Feature lines! (Great for curb returns, parking lots, et cetera)
• Grade from one structure throughout a pipe run at a set percentage. Great use, not capable without PE!
• Manage Assemblies and subassemblies
Shawn has been a part of the design engineering community for roughly 15 years in all aspects of design, construction and software implementations. He has implemented and trained companies across the Country on Civil 3D and other infrastructure tools and their best practice workflows. Shawn can be reached for comments or questions at sherring@ prosoftnet.com.
Figure 9
Figure 10
An AREA That Still Needs Improvement
FIELD OF DREAMS
In June of 2021, I wrote an article titled An Area That Needed Improvement. I pointed out that AutoCAD 2005’s new FIELD command provided a powerful dynamic feature. With this command users can now link properties like an object’s area value to a text field. Any time the object changes in size the area value in the text field would update automatically. Though the Field command is a dream come true, it is very complicated to use. The graphical user interface (GUI) required a number
of mouse clicks to select an object to link. An additional dialog box would have to appear one on top of another to format the selected value. Worst of all, it was not intuitive at all on how to link a property of multiple objects. This caused me to develop back then and share with the AutoCAD community for free the Area Object Link (AOL) app. Since that time, AOL has gone through a major upgrade to fulfill this area that still needs improvement. I will introduce these new features in this follow up article.
AOL’S NEW FEATURES
Briefly, the new AOL v5.0 offers the following four major GUI driven command modules:
1. AOL or Area Object Link – this is the original AOL GUI linking objects such as Circles, Ellipses, Hatches, closed Plines and Regions’ Area values but with a number of added improvements
2. POL or Perimeter Object Link – this uses a similar GUI as AOL to link objects such as Circles, Pline Ellipses, closed Plines and Regions’ Perimeter values
3. APL or Area Perimeter Link – this offers a GUI combining AOL and POL to link objects’ Area and Perimeter values
4. AOT or Area Object Table – this offers a GUI to link all the inserted Area and Perimeter values into a Table with the option to include a total summation.
I’ll now proceed into more detail as to what each of these four AOL command modules entail.
1. AOL VS AOL
First of all, the upgraded AOL (Area Object Link) command module like the previous version still offers a simple to use GUI presenting various options in a single window to create a link to the object(s) area value (see Figure 1).
There are four major additions to the AOL command module:
1. At the top of the GUI under the Area Object Commands section is added the Draw Command. This command first executes the PLINE command for you to complete a closed polygon. Afterwards the Block Attribute is Inserted automatically linking to the drawn PLINE’s Area value. This saves you the steps of having to first manually enter the PLINE command to draw the shape. Then secondly, launch the AOL app. And third, you still have to select the drawn object to complete the link (see Figure 2).
2. Also, under the Area Object Commands section is added the Select command. This command gives the user the ability to select already drawn objects such as Circles, Ellipses, Hatches, closed Plines and Regions and have them sequentially labeled and automatically linked to their Area values. This is a major time saver. Instead of having to tediously select the objects one by
Figure 2
one, now in one fell swoop all the selected objects are labelled and Area linked (see Figure 3).
3. In the middle of the AOL GUI next to Suffix Type now offers a section dedicated to adding a Prefix Type before the Area value. You can select from a list of built-in prefixes or choose Custom and enter your own (see Figure 1).
4. At the bottom of AOL’s GUI is the new Settings button. This opens up a separate AOL Settings GUI that offers the option to save the following Block Attribute settings as default:
a. Layer – this selects a Layer where the Block Attribute labels are to be placed when Inserted into the drawing.
b. Font – this selects from any of the True Type Fonts (ttf) located in your Windows OS and AutoCAD Fonts (shx) found in the AutoCAD support path to be used as the default Font for the Block Attribute.
c. Height & Width – this offers the option to select paper space sized height and width factor values to be used as default by the Block Attribute.
These Block Attribute Settings open up the possibility of implementing your own favorite look and feel to the Block Attribute label (See Figure 4).
2. POL VS AOL
Second, the new POL (Perimeter Object Link) command module offers a similar GUI as the AOL command module. All the options including the newly added ones are located exactly in the same position under similarly labeled sections: Perimeter (vs Area) Object Commands, Measuring Units, Insert Options, Prefix & Suffix Types. I purposely designed the POL GUI based on AOL so there’s a little to no learning curve. This makes it very easy and straight forward to use this new command module to link to the objects’ Perimeter value (see Figure 5).
Unlike AOL, the main difference with POL of course is with the linked value. Instead of getting a squared format value representing an object’s Area, POL links to the object’s Perimeter value which is in linear units. Also, since the Hatch and Ellipse objects do not provide a Perimeter value, I programmed POL to exclude these object types from the selection process. Lastly, when the drawing is in Imperial units and the Perimeter Length selected is in Feet under the Suffix Type section, I included a toggle button labeled “Ft-In” to return the value in Foot and Inch format. In the Imperial unit standards of measurement Architects tend to design and layout their drawings showing measurements not in decimal feet. But instead, sizes and dimensions are typically shown in foot and inches. So, offering this feature in POL is a must (see Figure 6).
Figure 3
Figure 4
3. APL: AOL & POL
Third, the new APL (Area Perimeter Link) command module combines the best of both worlds of AOL & POL. When inserted the APL Block Attribute label shows both the Area, and the Perimeter linked values. APL’s GUI is designed so that many of the selections can be commonly applied to both. For example, the commands under the Area Perimeter Commands section are effective for both the Area and Perimeter. But when it comes to selections that are specific to one vs the other, I clustered the Area related selections on the left and the Perimeter related selections on the right. This makes it possible for you to have the cake and eat it (see Figure 7).
Because of APL’s duality of purpose, there are some options where the user must choose to either implement the command on an Area or Perimeter, but it cannot be both. For example, under Area Perimeter’s Link command a drop-down menu is made available for the user to select to either link to the objects’ Area or Perimeter. Another feature
I made available to the user with APL is the ability to show the Area value in a different unit than the Perimeter value. So, the user can choose to show the Area in Square Feet while the Perimeter value can be selected to be shown in Inches (see Figure 8).
4. TABLE FOR THREE
Fourth, I wanted to offer a command module where all the linked Areas and Perimeters can be listed, sorted alphabetically by Space Name and tabulated with a grand total. I developed the new AOT (Area Object Table) command module to meet this purpose. AOT gives the user an option to select
Figure 5
Figure 6
Figure 8
Figure 7
either the AOL, POL or APL Block Attribute labels linking the values to generate a Summary Table. AOT’s GUI offers options for you to customize the Table’s Title and Column Headings (see Figure 9).
In addition to placing a Table object into AutoCAD I also wanted to offer the user the option to export the Table directly into Excel as an added bonus. Lastly, I programmed AOT so the cells in the Table are composed of Fields. This makes it possible so that at any time when AOL, POL and APL’s Area or Perimeter value changes the values in the Table also update automatically (see Figure 10):
DREAM COME TRUE
This most recent upgrade to AOL 5.0 fulfills a number of wishes & dreams on my plate. I wanted to enhance this app to help fulfill the needs of the vast community of AutoCAD users. Actually, a number of these added features came as requests
from AutoCAD users like you. I’m glad AOL can fill the gap since this is still an area that needs improvement in AutoCAD.
Mr. Paul Li graduated in 1988 from the University of Southern California with a Bachelor of Architecture degree. He worked in the Architectural field for small to midsize global firms for over 33 years. Throughout his tenure in Architecture he has mastered the use and customization of AutoCAD. Using AutoLISP/ Visual Lisp combined with Dialog Control Language (DCL) programming he has developed a number of Apps that enhance the effectiveness of AutoCAD in his profession. All the Apps actually came out of meeting challenging needs that occurred while he worked in the various offices. He has made all the Apps available for free and can be downloaded from the Autodesk App Store. Though he recently retired from the Architectural profession, Paul continues to write articles depicting his past work experience. Some of these articles can be found in AUGIWorld magazine where he shares his knowledge learned. Paul can be reached for comments or questions at PaulLi_apa@hotmail.com
Figure 9
Figure 10
Bright Ideas for a Bright Future
AUGIWORLD brings you the latest tips & tricks, tutorials, and other technical information to keep you on the leading edge of a bright future.
Welcome to AUGIWorld Inside Track! Check out the latest opportunities to advance your skills, processes, and workflows in your firm with the most current AEC-related software and hardware updates available.
Par t 2: Let’s Look at DiRoots!
Gentle Reader - today we step away f rom the comfortable confines of my desktop to explore the world of plug-ins everywhere else.
DiRoots is a company that developed a suite of FREE Revit (and other!) add-ins that have made quite an impact on the industry. In addition, they develop bespoke custom plug-ins to automate productivity workflows and enhance efficiency
Bear with me, O Gentle Reader, as I move this narrative forward to explore some eye-catching features of the DiRoots set of add-ins!
But before that, as always, let’s get the formal introductions out of the way -
Gentle Reader - DiRoots, DiRoots - Gentle Reader
This article is a continuation of Part 1: Let's Look at DiRoots from AUGIWORLD September 2024
Now for the Other Kids on The Block!
DISTELLAR (BETA)
DiStellar is an online IFC viewer developed to manage BIM models. This is a completely mouse driven web app that can be opened from https:// diroots.com/apps/distellar/. You do need an account to sign in and use the tool. It supports IFC2x3 and IFC4.
To start with, you can set up your Preferences to control and override how elements are displayed. You can even set materials to be transparent to get a better view of the inside of the model! Click on your photo at the top right and set up Application Preferences (Figure 2).
You can add multiple IFCs into the same scene. Model elements are searchable using the Model
Tree or the Search function at the top of the screen (Figure 3).
Figure
Figure 2
Figure 3
You can view the model in 3D or in a Floor Plan view, take Snapshot images of the model.
The feature that I liked the best was the dynamic Sectioning tool where you can define and drag a section plane to see what you need to.
higher ed. Well, it’s still in Beta stage, and I have high hopes for its future.
DIROOTSONE FOR AUTOCAD (BETA)
Here’s what I noticed during testing - DiStellar worked well with smaller IFC models, but when I opened one of my larger IFC projects basic functions like Zoom, Pan, and Orbit showed a marked loss in performance. A definite negative for larger projects - industrial, retail, healthcare, and
DiRootsOne for AutoCAD is still in its public Beta stage. It supports AutoCAD verticals like Civil 3D, Advance Steel, AutoCAD Plant 3D, AutoCAD Architecture, AutoCAD Electrical, AutoCAD MEP, AutoCAD Map 3D, AutoCAD Mechanical, etc. through versions 2021-2024. Currently it features OneFilter, which uses advanced conditional rules to quickly finds elements
• By Layer
• By Object Type
• By Properties
Figure 5
Figure 6
Figure 7
In the example in Figure 7, I am filtering the Current Selection of gridlines. I would need to click on the button next to Filter by Layers to activate it and filter the gridlines by Layer.
Elements may be searched for in
• The Whole Model
• Current Selection
• Active Space (an option I don’t see very commonly used)
To then filter these gridlines by Property, I would need to click for the drop down for Property Name to filter by a specific Property.
A feature that is on its way is SheetGen, which automates drawing production workflows.
At the risk of repeating myself, O Gentle Reader - as tempting as it may be to see your UI bedecked with all of these wonderful tools, please restrain the urge. Please don’t strain the software’s teensy-weensy little brain by giving it too many add-ins to deal with! Avoid the resulting undesirable aftereffects like poor performance, possibly model corruption. Utilize them ONLY on an as-needed basis. Disable / Remove the Extension once the need has passed. Better safe than sorry!
Watch out for the next episode, Gentle Reader! Until then - Keep Reviting!
Rina Sahay is the BIM Manager at Abonmarche, based in glorious Grand Rapids, Michigan (Great Lakes, anyone?). She started her Autodesk journey with AutoCAD Release 10 (remember that dreary DOS interface - and the need for super-duper spelling skills?). Rina learned enough Revit to stay one chapter ahead of college students in the classroom. That changed in a hurry when she made a triumphantly painful return to industry as a BIM Specialist and had to use Revit in the worst way possible. She HATED it and grieved for her beloved AutoCAD every day! Until she figured Revit out - the rest, as they say, is history. Autodesk Expert Elite in 2018, presenter at Autodesk University since AU2019 (and Rina has the Best Speaker awards for 2021 and 2022 to show for it!). And now here she is, to educate, enlighten, and hopefully, entertain.
Gentle reader - since this article went to press, DiRoots has announced a change in their model. They are now a “Freemium” subscription service with a mix of free and paid tools. For more detailshttps://diroots.com/diroots-freemium-transition-detailed-information/ Till next time!
Please let us know if you have some news to share with us for future issues. Likewise, if you are a featured product or news item user and would like to write a review, we want to know. Drop me a line at: rinasahay@gmail.com. We’d love to hear from you!