2022 - 23 BUDGET
City of Eden Prairie, Minnesota

CONTENTS Budget Award 3 City Manager Message 4 Budget in Brief 6 Short-Term Budget Factors 8 Organizational Chart 9 City Council and Management 10 Full-Time Employee Chart 11 Mission and Vision 12 Citywide Goals 14 Accomplishments 17 Fund Structure 20 Fund Crosswalk 21 Basis of Accounting 22 Financial Policies 23 Budget Process 27 Financial Schedules 30 Four-Year Summary 30 2020 Actual by Fund 31 2021 Budget by Fund 32 2022 Budget by Fund 33 2023 Budget by Fund 34 Projected Changes in Fund Balances 35 Revenues 37 General Fund 37 Internal Service Funds 39 Enterprise Funds 40 Long-Range Financial Planning 42 General Fund Five-Year Forecast 43 Tax Levy Projections 44 Capital Expenditures 46 Capital Projects by Department 47 Capital Projects by Funding Source 48 Significant Non-Recurring Capital Projects 51 Debt 55 Summary of Tax Levy by Bond Issue 56 Long-Term Debt 57 General Fund Department Summaries 61 Administration 61 Community Development 64 Parks and Recreation 67 Police 70 Fire 73 Public Works 76 Internal Service Fund Summary 80 Enterprise Fund Department Summaries 84 Utilities 84 Liquor 87 Supplemental Information 91 Glossary 96 2
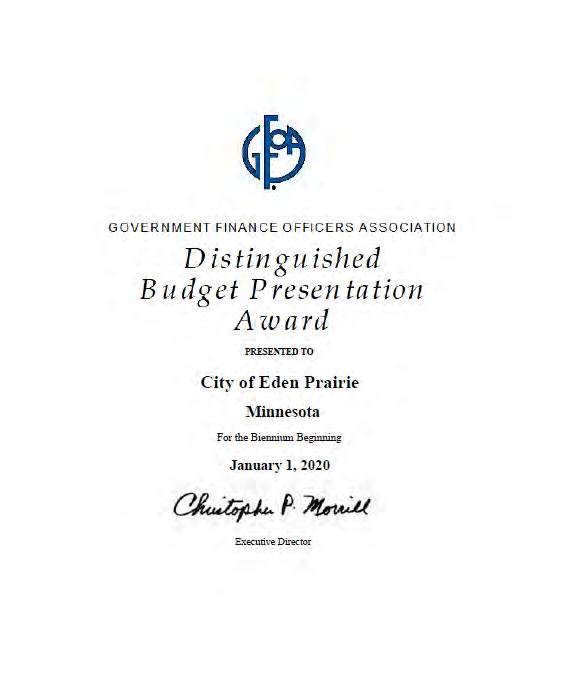
B U D G E T A W A R D 3
I am pleased to present the 2022-23 City of Eden Prairie budget adopted Dec. 7, 2021, by the City Council. This budget provides the resources to achieve the City’s goals for Eden Prairie residents, which are part of the Eden Prairie Promise, embedded in the City’s vision, mission and values, and define how City employees work together to meet resident expectations and deliver top results.
Our long-term goals include maintaining high quality services with reasonable tax impacts, maintaining employee morale and engagement, and maintaining a strong financial position.
This budget document provides an understanding of the City budget and factors affecting finances, prepared using practices and techniques recommended by the Governmental Accounting Standards Board (GASB) and the Governmental Finance Officers Association (GFOA). The balanced budget represents a fiscally conservative approach to meeting the demands of residents, businesses and the City Council.
To maintain high-quality services and satisfied residents, the General Fund budget is increasing 4.8% in 2022 and 3.2% in 2023. While most of the 2022-23 budget is incremental growth based on the programs and services of previous years, there are several new initiatives in the upcoming two years. These initiatives include an additional police dispatcher and police officer with K-9 explosives detection, technology investments in body cameras and electronic citations, an additional assistant fire chief for improved emergency management systems, four additional duty crew fire staff, a second forester position to limit the spread of invasive species, health insurance enhancements for City staff and investments in sustainability, affordable housing, and race and equity.
The City prepares a 10-year Capital Improvement Plan every other year. Plans for capital spending for 2022 and 2023 are included in this document. Significant capital projects for 2022-23 include reconstruction of the Round Lake Park building, Staring Lake Amphitheatre renovation, conversion to LED lighting at Miller Park, and ongoing trail and pavement maintenance.
Debt service for the City remains stable; $2,553,000 is budgeted for tax-supported debt service payments in 2022 and 2023, which is the same amount budgeted in 2021. In 2022, debt will be issued to finance fire engine replacements. Budget information is also provided for the Water, Wastewater, Stormwater and Liquor enterprise funds. These operations continue to be operationally and financially stable.
The City continues to make efforts to stabilize taxes through long-term strategic budgeting, systematic replacement of assets and establishing reserves that allow for budget flexibility. The City maintains its bond ratings of Aaa from Moody's Investors Service and AAA from Standard & Poor’s Financial Services, which reflect a healthy economy, conservative fiscal management and manageable debt levels.
Eden Prairie continues to be a highly desirable place for residents and businesses. I would like to thank the City staff members who prepared the 2022-23 Budget, as well as the City Council for their budget review and adoption efforts.
Respectfully submitted,
 Rick Getschow City Manager
A M E S S A G E F R O M T H E C I T Y M A N A G E R
4
BUDGET IN BRIEF
Budget in Brief
The budget in brief provides a summary of the 2022-23 budget highlighting the major government funds and factors affecting the budget. The City created this summary to provide a clear understanding of the financial impact of services provided Additional details about the City’s budget, operations and policies can be found in the sections that follow. Please contact the City of Eden Prairie with any questions at 952-949-8376.
Tax Levy
$40,607,612
The tax levy is the amount raised by property taxes. For 2022, the tax levy is $40,607,612. This is a 4.7% increase over 2021 and includes $40,149,554 for operations, $400,000 for capital improvements, $2,553,000 for debt service and a fiscal disparity distribution of $2,494,942. Property taxes are the largest source of revenue, and the City strives to balance increases with demand for services. For 2023, the tax levy will increase an additional 4.4% to $42,414,342 These increases are primarily driven by personnel wages and benefits.
General Fund
$52,664,390
The General Fund is the chief operating fund of the City. It pays for a full range of municipal services including police, fire, street maintenance, park maintenance, recreation programs, administration, community development and building inspections. Expenditures for 2022 and 2023 are increasing 5.1% to $52,664,390 and 3.4% to $54,442,407. Additions to the budget are driven by wage and health benefit increases along with funds for elections, additional positions in police, fire and parks, funding for parks and recreation outreach programs, and increased public safety technology.
6
Enterprise Funds
The Water Fund accounts for the City’s water operations including water treatment, inspections, storage, meter reading, repair, installation and water distribution. Expenses for 2022 are declining 1.1% to $10,544,578 due to reduced depreciation expense and increasing 1.3% to $10,681,229 for 2023.
Water Fund
$10,544,578
$7,738,683
The Wastewater Fund accounts for the City’s sanitary sewer mains and lift stations. Expenses are decreasing 1.9% to $7,738,683 for 2022 primarily due to reduced wastewater fees. For 2023, the budget is decreasing 0.6% to $7,688,453 due to reduced depreciation expense
The Stormwater Fund accounts for maintenance of the City’s stormwater ponds and waterways. Expenses are increasing 7.1% to $3,302,274 for 2022 and 1.6% to $3,354,502 for 2023. The budget increases include additional funds for capital projects as emerging stormwater issues are requiring a greater need for curb drain tile and sump pump collection systems.
Liquor Fund
$11,203,602
Capital Project Fund
$3,302,274
The Liquor Fund accounts for the City’s three municipal liquor stores. Expenses are increasing 2.3% to $11,203,602 for 2022 For 2023, the budget is increasing 3.8%. The liquor operations transfer $800,000 to $850,000 annually to the Capital Improvement and Maintenance Fund to pay for various parks and recreation, and public safety projects.
The Capital Project Fund pays for large capital outlays. Total expenditures for 2022 are $10,162,100 and $9,392,550 for 2023. The capital levy for 2022 and 2023 is the same as the 2021 levy of $400,000. The levy is used to maintain the City’s strong pay-as-you-go method for paying for projects.
Debt Service Fund
The City of Eden Prairie issues debt to fund certain projects. Current examples include Fire Station 4 and park improvements including the Community Center aquatic expansion. Debt payments supported by the tax levy are projected to remain 4%-5% of the general fund budget. City policy maintains debt under 15% of the general fund budget. Total debt supported by the tax levy for 2022 and 2023 remains at $2,553,000 for both years
Wastewater Fund
Stormwater Fund
7
Short -Term Budget Factors
Revenue
Increase in property values — The City saw an increase in assessed valuation in 2021. The current estimated market value for taxes payable in 2022 is $11.8-billion, which is a 3.2% increase over 2021 For 2022, the median value home in Eden Prairie of $430,400 increased 3.3% in value. Commercial properties decreased 4.7% and apartments are up 4.0%
Property tax revenue — Property taxes are the single largest source of revenue. The City strives to balance increases in property taxes with the demand for services Property taxes support 72% of the General Fund budget providing a stable source of revenue for the General Fund
Charges for services — The second largest revenue source is decreasing 19.4% in 2022 due to COVID-19 impacts at the Community Center. An expected increase of 6.8% is budgeted for 2023 in anticipation of improved performance.
Building permits and fees — Collections vary each year based on development and permit activity. The City budgets conservatively for this line item
American Recovery Plan — The City received $3,723,700 in American Recovery Plan funds in 2021 and will also receive this same amount in 2022. The City anticipates using this revenue to offset any revenue shortfalls impacted by COVID19
Expenditures
Personnel costs — Wages and Benefits make up 63% percent of the General Fund budget The City prepares the wage budget by looking at trends within the private sector labor market and our local government peer group. Based on the compensation trends, we are proposing a 3% wage increase in 2022 and 2023. This proposal is in line with our peer cities and the private sector We must continue to provide similar increases as the private sector and our public sector peer cities to remain competitive.
Health Insurance — The City periodically conducts a Request for Proposal (RFP) process to procure health insurance State law requires the City to issue an RFP every five years In 2017, the City Council approved a five-year health insurance contract with HealthPartners for 2018 to 2022. For 2022, the budget is expected to increase 14.2%, attributed to a rate cap increase of 9%, increased employer contribution and the addition of new employees For 2023, the budget will increase 9.7%
Fire Relief Pension — Firefighters are members of the Eden Prairie Firefighter Relief Association The Association is the administrator of the single-employer defined benefit pension plan available to firefighters Minnesota Statute specifies minimum support rates required on an annual basis by the City The Association completes an actuarial study every two years which documents the required contribution from the City For 2022, the required amount is $545,153, which is the same as 2021 An updated actuarial will be completed for the 2023 budget The City receives Fire Relief Pension Aid from the state of approximately $494,000 which offsets the City’s required contribution.
Elections — In 2022, the City will conduct elections City costs added to the budget include $1 85,000, of which $162,500 is for part-time staff to conduct the election.
Other Priorities — Approximately $430,000 in additional funding was provided to support parks and recreation outreach initiatives, add a forestry position to limit the spread of invasive species, add an assistant fire chief to improve the City’s emergency management system, add a police officer with K-9 explosives detection, and add a dispatcher to ensure two employees are always on duty
8
Organizational Chart
City Council
City Manager
Recreation
Administrative Services Communications Finance & Liquor Operations


City Clerk Facilities Human Resources & Support Services Information Technology

Services

Administration Community Development Public Works Police Fire Parks &
Assessing Economic Development Housing & Community
Planning Engineering Fleet Services Streets Maintenance Utilities Investigations Patrol Support Building Inspections Fire Prevention Fire Suppresion Community Center Parks & Natural Resources Recreation Services
9
City Council and Management
Kathy Nelson
Lisa Toomey
City Management Team
City Manager Rick Getschow
Department Directors Administration
Community Development
Fire
Parks and Recreation
Police


Public Works
Alecia Rose
Julie Klima
Scott Gerber
Jay Lotthammer
Matt Sackett
Robert Ellis 10
Mayor Ron Case
Council Member Mark Freiberg
Council Member PG Narayanan
Council Member
Council Member
FTE Chart
Full-Time Equivalents
Total FTEs increased 2.20 for the 2022 budget with a 1.0-FTE decrease in City Clerk, 0.2-FTE increase in Planning, 1.0FTE increase in Forestry, 1.0-FTE increase in Fire and 1.0-FTE increase in Police Dispatch For the 2023 budget, a 1.0FTE Police Officer was added as well as a 1.0-FTE Fire Administrative Assistant.
A 1.0-FTE Forester was added to limit the spread of new and existing invasive species A 1.0-FTE Assistant Fire Chief was added to improve the City’s emergency management system. The increase in police FTEs is to ensure two dispatchers are always on duty and to add a Police Officer with K -9 explosives detection. The other changes were made to better support services in those areas 11
Department 2020 Actual 2021 Budget 2022 Budget 2023 Budget Administration Office of City Manager 2.0 2.0 2.0 2.0 City Clerk 2.0 2.0 1.0 1.0 Human Resources 9 8 9 8 9 8 9 8 Communications 3.5 3.5 3.5 3.5 Finance 5.5 5.5 5.5 5.5 Liquor Stores 9.0 9.0 9.0 9.0 Information Technology 6.0 6.5 6.5 6.5 Facilities 10.0 10.0 10.0 10.0 Community Development Administration 2.0 2.0 2.0 2.0 Assessing 7.0 7.0 7.0 7.0 Planning 4.8 4.8 5.0 5.0 Economic Development 1.0 1.0 1.0 1.0 Housing and Community Services 2.0 2.0 2.0 2.0 Parks and Recreation Administration 2.0 2.0 2.0 2.0 Park Maintenance 20.0 20.0 21.0 21.0 Recreation Services 7.6 7.6 7.6 7.6 Community Center 6.5 6.5 6.5 6.5 Police Administration 24.0 24.0 25.0 25.0 Officers 69.5 70.5 70.5 71.5 Fire Administration 9.0 9.0 10.0 11.0 Building Inspections 9.0 9.0 9.0 9.0 Public Works Engineering 7.5 7.5 7.5 7.5 Street Maintenance 15.0 15.0 15.0 15.0 Utilities 39.5 39.5 39.5 39.5 Fleet Services 5.0 5.0 5.0 5.0 Total FTEs 279.20 280.70 282.90 284.90
Mission and Vision
The Eden Prairie Promise defines how City employees work together to meet resident expectations and deliver top results. It is the City’s promise to the community to fulfill the mission and vision of Eden Prairie
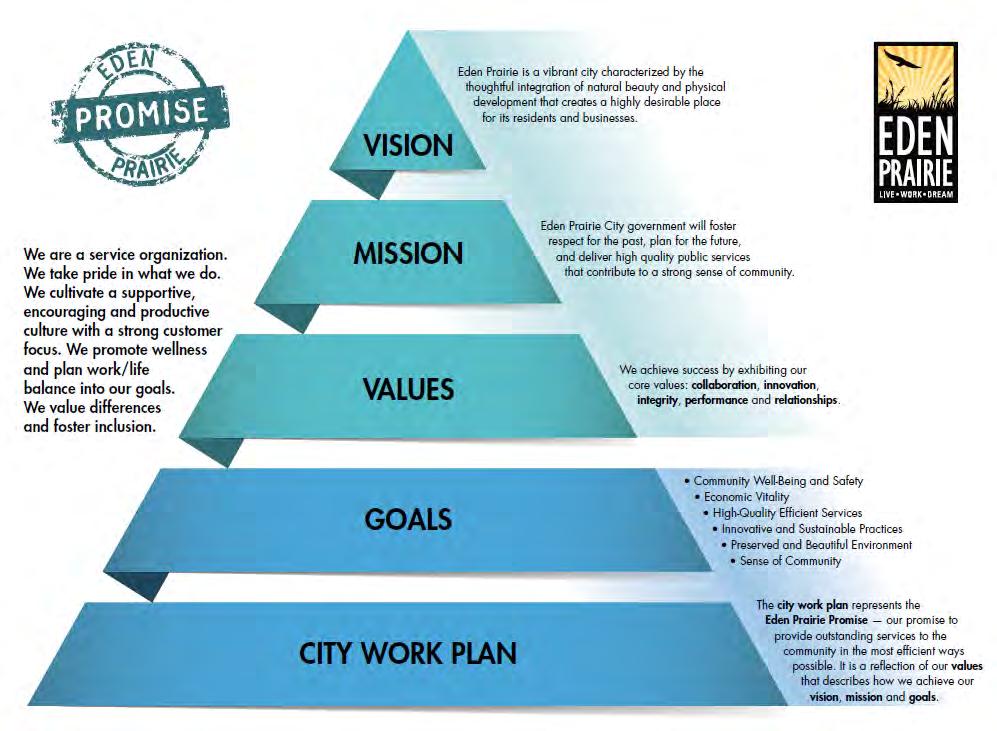
City leaders and employees are held accountable for executing the City’s vision and mission for the benefit of the community. A performance measurement dashboard tracks performance and progress toward the six goals that are part of the Eden Prairie Promise. This dashboard is available to the public at edenprairie.org/EdenPrairiePromise. Measures can also be found in the department summary sections of this document.
Annual work plans are created by department managers and directors each fall with input from staff. These work plans are shared with all City staff annually and form the City’s strategic goals More information on specific department goals and objectives may be found in the department summaries section of this book.
12
CITYWIDE GOALS

- • _..._., a -~ .._,. •lk S:,. - -r -
Citywide Goals
Community Well-Being and Safety
Weprovideuniqueanddiverseopportunitiesforthecommunitytolivewell.Weprotectandserve ourcommunitybydeliveringexceptionalandcommunity-engagingpublicsafetyservices.
Preserve and develop affordable housing, including integration into development near light rail stations
Create a police safety team to respond to high density areas and events including light rail, mall, airport and special events
Maintain high ratings on the bienniel resident survey regarding the overall feeling of safety, emergency response time and quality of life
Expand and diversify the transportation system including light rail connecting employment, housing, open space and entertainment
Engage residents to partner with police to conduct community outreach, and build trust and relationships
Add missing trail links identified in the City's pedestrian and bicycle plan
Continue partnerships with businesses and organizations to provide health and wellness training such as CPR and AED
Provide and maintain a safe transportation system
Provide fair housing education to City staff, property owners/landords and tenants to reduce and prevent evictions
Economic Vitality
WeenhancethequalityoflifeinEdenPrairiebysustainingadiverseand prosperouseconomicbasewhilesupportingbusinessgrowthanddevelopment.
Preserve and expand capital that is sustainable and affordable for residents
Maintain high bond ratings
Maintain moderate debt burden
Support and manage efforts to provide grants and public financing for business retention, expansion, rehabilitation and renovation
Prioritize projects that support business growth
Assist in the development, growth and attraction of new businesses
14
High-Quality Efficient Services
Wedelivercost-effective,efficientandresponsiveservicestoresidentsandthepublic.
Recruit and retain high-quality employees
Maintain and enhance a positive, engaging and passionate work culture
Upgrade technology infrastructure to improve functionality, reliability and security
Increase utilization of e-scheduling and e-licensing for building inspections
Improve and maximize digital communication strategies within recreation services
Provide a high-quality and efficient transportation system
Innovative and Sustainable Practices
Weimplementinitiativesalignedwithourstrategytobeforward-thinking, progressiveandenvironmentallyconscious.
Achieve regionally sustainable levels of community water usage
Provide a sustainable use of energy for City fleet, street lights and traffic signals
Provide means for residents and businesses to further reduce, reuse and recycle solid waste
Promote sustainability of resources by identifying HVAC replacement needs and investigating more efficient technologies
15
Weestablishobjectivesandstrategiesthatsupportupholdingthenaturalbeauty, physicaldevelopmentandhistoryofthecommunity.
Complete upgrades to outside plaza of Community Center, Convert turf areas to Protect urban forest from creating space for pollinator-friendly native plants emerald ash borer gathering and community
Create opportunities for community-building and place-making through public art and engagement
Maintain high-quality ratings from residents on the overall appearance of Eden Prairie
Sense of Community
Wepromoteasenseofcommunitybyprovidingrecreationalamenities, programmingandeventsfortheentirecommunity. Wefocusoninclusiveandcollaborativecommunityengagementinitiatives.
Enhance PeopleFest! event to integrate, increase awareness and boost pride among the many cultures represented in Eden Prairie
Increase service and outreach to underrepresented segments of the community
Continue partnership for Citywide Open House
Enhance and improve Complete City entry monument opportunities for signs and bridge branding resident engagement to provide a sense of place during development and identity
Preserved and Beautiful Environment
16
Accomplishments
Best Places to Live in America
Eden Prairie is consistently ranked among the best places to live in America by a variety of publications with such rankings. In 2010, MONEY Magazine named Eden Prairie the #1 Best Place to Live in America, and the City has now occupied the top three spots on the list Residents continue to rate the overall quality of life exceptionally high on the biennial Quality of Life Survey In 2020, 93% of residents rated the overall quality of life as excellent or good.

Sustainable Eden Prairie
Sustainable Eden Prairie is an ongoing effort focusing on education and implementation of sustainable practices to protect the City’s environment and natural resources. The City is leading by example and providing a foundation for residents and businesses to carry out sustainable practices in four areas — energy, landscape, waste and water. A Climate Action Plan adopted by the City Council has a goal of achieving communitywide carbon neutrality by 2050.
The City partners with local energy utilities to promote conservation and provide residents with resources to help them save on energy bills and obtain rebates. Additional Citysponsored programs include water conservation and landscaping rebates and community waste drop-off events
SolSmart Gold Designation

SUSTAINABLE PRAIRIE
The City of Eden Prairie has achieved the Gold designation from the national SolSmart program for making it faster, easier and more affordable for homes and businesses to go solar. This achievement recognizes Eden Prairie for taking bold steps to encourage solar energy growth, including a City ordinance change allowing for solar energy systems development Information on the City’s website assists residents and businesses interested in financing solar projects and navigating the solar permitting process.
Rooftop solar panels on City buildings along with off-site solar energy subscriptions will soon allow Eden Prairie’s municipal energy usage to be 100% solar-powered. Community Solar Garden construction at the Community Center is expected in spring 2022 with commercial operation following, allowing Eden Prairie Xcel Energy customers to subscribe to solar power.
GreenStep Cities
Minnesota GreenStep Cities is a continuous improvement program based on 29 best practices tailored to Minnesota cities focusing on cost savings, energy use reduction and civic innovation. Eden Prairie has received Step 5 recognition — the highest level of achievement — each year since 2017.

17
Star Tribune Top Workplaces
The City has been named a Top Workplace by the Star Tribune each year since 2014. This ranking places the City among the best of the best in the state The City is a pioneer in the public sector, with a progressive, high-performing organization The motivation and drive demonstrated by employees creates a culture of pride, where they can grow and develop in their careers while enjoying life outside of work. In 2021 the City earned the inaugural Top Workplaces USA award which offers national recognition to regional Top Workplaces winners based solely on employee feedback and
Parks and Recreation Awards of Excellence
The Minnesota Recreation and Park Association bestowed Awards of Excellence on the Parks and Recreation Department in 2021 for the Community Center's new Virtual Membership and the Boo Drive-Thru event. Both programs were introduced in 2020 in response to the pandemic.


Sterling Tree City USA
The Arbor Day Foundation has named Eden Prairie a Tree City USA for a 37th time. The City has received the growth award 10 times during that span, making Eden Prairie a Sterling Tree City USA community. The growth award program is presented to Tree City USA communities that demonstrate higher levels of tree care and community engagement throughout the year.
Award-Winning Communications
In 2021, the Communications Division earned top honors from the national City -County Communications and Marketing Association, winning the Savvy Award (first place) for the Life in the Prairie newsletter and the Chalk your Walk Contest (resident participation); the Silver Circle Award (second place) for the Chalk your Walk Contest (best use of social media) and the Community Center Summer Membership Campaign (best social media campaign); and the Award of Excellence (third place) for the Parks and Recreation Program Guide Redesign, and the Community Center Summer Membership Campaign (most creative/least spent).
USX
18
FUND STRUCTURE

Fund Structure
The financial reporting and budgeting systems of the City are organized on a fund basis. A fund is a fiscal and accounting entity with a self-balancing set of accounts. Funds are the control structures that ensure public funds are spent only for purposes and amounts authorized Funds are established to account for different types of activities and legal restrictions associated with a government function.
City of Eden Prairie
Fund Descriptions
Governmental Funds


Governmental Funds account for the City’s day-to-day activities These include the General Fund, Debt Service Fund and Capital Project Fund.
General Fund — City’s primary operating fund. Carries the basic activities of the City including Administration, Community Development, Parks and Recreation, Police, Fire and Public Works. Accounts for the proceeds of specific revenue sources that are restricted or committed to expenditures for specified purposes other than debt service and capital projects.
Debt Service Fund — Accounts for all financial resources that are restricted, committed or assigned to expenditures for principal and interest. Debt Service funds with a related tax levy are budgeted.
Capital Project Funds — Account for all financial resources that are restricted, committed or assigned to expenditures for capital outlay, other than those financed by proprietary funds.
• Capital Improvement & Maintenance Fund — Accumulates resources from the tax levy and other sources to pay for capital projects Generally, projects budgeted in this fund do not have other funding sources.
• Pavement Management Fund — Accumulates franchise fee revenue to pay for the City’s pavement management program.
• Trails — Accumulates resources from the Capital Improvement & Maintenance Fund to provide funding for new trails and sidewalks.
c____ CJ
CJ CJ CJ
I 'I -' '-CJ '---------'
Governmental Funds General Fund Debt Service Fund Capital Project Funds Improvement & Maintenance Pavement Management Trails Proprietary Funds Enterprise Funds Water Wastewater Stormwater Liquor Internal Service Funds Information Technology Fleet Services Facilities Employee Benefits Property Insurance
20
Proprietary Funds
Proprietary Funds account for the City’s businesslike activities. These include Enterprise Funds and Internal Service Funds Enterprise Funds account for those government activities that are self-supporting, where the cost of providing a service is recovered primarily through user charges, similar to private business enterprises Internal Service Funds account for the financing of goods or services provided by one department to another on a cost-reimbursement basis.
Enterprise Funds
Water Fund — Accounts for the operations of the City-owned water system.
Stormwater Fund — Accounts for the operations of the City’s stormwater system.
Wastewater Fund — Accounts for the operations of the City’s wastewater service.
Liquor Fund — Accounts for the operations of the City’s three retail liquor stores.
Internal Service Funds
Information Technology — Accounts for the accumulation and allocation of costs associated with information technology operations.
Facilities — Accounts for the accumulation and allocation of costs associated with maintaining City-owned buildings.
Property/Workers’ Compensation Insurance — Accounts for the accumulation and allocation of costs associated with property and workers’ compensation insurance.
Fleet Services — Accounts for the accumulation and allocation of costs associated with fleet services operations.
Employee Benefits — Accounts for the accumulation and allocation of costs associated with health, dental and other employee benefits.
The City has other funds which are not formally budgeted including Special Revenue Funds, Debt Service Funds, Capital Project Funds, Permanent Funds and Trust and Agency Funds.
Fund Crosswalk
This chart shows the relationship between functional units and funds. For example, the Police Department may have some authorized appropriations in both the General Fund and Capital Project Fund.
General Fund
Police Fire Public Works Community Development
and Recreation Administration
Utiilties
Works
Liquor Administration
Fire Public Works
Development
and Recreation Administration 21
Parks
Enterprise Funds
Public
Adminstration
Capital Project Funds Police
Community
Parks
Basis of Accounting
The City is required to account for revenues and expenditures according to generally accepted accounting principles (GAAP). An annual budget is adopted consistent with GAAP for the general fund. This is consistent with the accounting methods used for financial reporting.
Governmental Funds are maintained on a modified accrual basis with revenues recognized in the accounting period in which they become available and measurable. Expenditures are recognized in the accounting period in which the fund liability is incurred Encumbrance accounting is also employed in governmental funds Encumbrances (purchase orders, contracts) outstanding at year -end are reported as unassigned fund balances and do not constitute expenditures or liabilities because the amount will be appropriated and honored during the subsequent year All annual appropriations lapse at fiscal year -end
Proprietary Funds are maintained on the accrual basis. Revenues are recognized in the accounting period in which they are earned, and expenses are recognized in the period in which the liability is incurred
Modified Accrual Governmental Funds Full Accrual Proprietary Funds 22
Financial Policies
The City of Eden Prairie has an important responsibility to its residents to manage its resources responsibly . Adopting financial policies is an important first step to ensure that resources are managed responsibly. The policies provide the framework for the overall fiscal management of the City and guide the decision-making processes The policies operate independently of changing circumstances and conditions
Objectives
To protect the City Council’s policymaking ability by ensuring that important policy decisions are not constrained, impacted or controlled by financial problems or emergencies.
To enhance the City Council’s policymaking ability by providing accurate information on the full costs of current operations, new proposals and capital requests.
To provide sound principles to guide the decisions of the City Council and City staff which have financial impacts
To enhance the City Council’s policymaking ability by providing accurate and timely information on the City’s financial condition.
To provide, improve and maintain essential public facilities and prevent deterioration of the City’s infrastructure and equipment to assist in the long-term, cost-effective provision of City services.
To protect and enhance the City’s credit rating and prevent default on any municipal obligations
To ensure the legal use and protection of all City funds through a good system of financial and accounting controls.
Financial Management Policies
A. The City will develop two-year budgets. In the second year of the two-year budget process, the previously developed budget for the following year will be fine-tuned as necessary Each year the City will certify only the following year’s budget and levy to Hennepin County
B. The City will adopt a balanced budget with current revenues equal to or greater than current expenditures It is not the City’s policy to finance ongoing operations with one-time revenues. One-time revenues will be used for one-time expenditures.
C. The City, through its capital and operating budgets, will provide for the adequate maintenance, replacement and improvement of the City’s physical assets in order to protect the City’s capital investment and to minimize future maintenance and replacement costs
D. The City will maintain a budgetary control system to ensure adherence to the budget and will prepare quarterly reports (excluding March 30) comparing actual revenues and expenditures to budgeted amounts.
E. The City will attempt at all times to maintain the Distinguished Budget Presentation Award of the Government Finance Officers Association.
F. The City will review and update as needed the budget policies at the beginning of each two-year budget cycle.
G. The City will provide long-term financial stability through sound short and long-term financial planning.
H. The City will estimate its annual revenues and expenditures in a conservative manner to reduce exposure to unforeseen circumstances.
I. The City will review and update the schedule of fund balances in all operating funds of the City and determine adequacy of those balances, using specified guidelines and criteria in conjunction with budgets set annually.
J. The City will project revenues and expenditures for the next five years and will update this projection each budget process.
K. The City will not sell assets or use one-time revenue to balance the General Fund Budget.
23
Revenue Policy
A. The City will endeavor to maintain a diversified and stable revenue system to shelter it from annual fluctuations in any one revenue source.
B. The City will conservatively estimate and budget for its annual revenues by an objective analytical process. Fees and charges will be reviewed to ensure that reasonable rates are set and at a minimum are adjusted for inflation.
C. The City, recognizing the potential cash flow problems associated with property tax collections, will budget 98% of the amount levied for tax revenue.
D. The City will establish all user charges and fees for General Fund program activities at a level related to the full cost of providing the services, or as adjusted for particular program goals. Sensitivity to market rates will also be considered in setting fees
E. The City will set fees and user charges for the utility enterprise funds which includes water, wastewater and stormwater, at a level that fully supports the total costs including operations, capital and debt service payments Replacement (or bonding for replacement) of enterprise infrastructure will be paid for from accumulated (or annual) earnings of the particular system
Debt Policy
A. The City will confine long-term borrowing to capital improvements, equipment or projects that have a life of more than five years and cannot be financed from current revenues
B. The City will endeavor to keep the total maturity length of general obligation bonds below 20 years and at least 50% of the principal shall be retired within 10 years. In all cases, the maturity shall be shorter than the life of the related assets.
C. The total debt levy paid by general obligation taxes shall remain under 15% of the general fund budget
D. All debt will be issued with a fixed rate, no variable rate debt will be issued
E. Future debt issuance impacting the City’s tax levy will be planned through the Capital Improvement Plan process.
F. To minimize the need for debt, the City will maintain a strong pay-as-you-go program for capital purchases.
G. Net general obligation debt (as defined above) will not exceed the statutory limit of 3% of the estimated Full Market Value of taxable property in the City as required by Minnesota Statute, Section 473.53.
H. Where possible, the City will use revenue (including G.O. backed revenue) or other self-supporting type bonds instead of general obligation bonds.
I. The City will not use long-term debt for current operations.
J. The City will maintain frequent and regular communications with all bond rating agencies about its financial condition and will follow a policy of full disclosure in every financial report and bond prospectus. The City will comply with Securities Exchange Commission reporting requirements
K. Interfund borrowing for periods of more than one year shall only be undertaken for capital expenditures. A reasonable payment schedule for repayment of the borrowed amounts will be established and interest will be charged
Accounting, Auditing and Financial Reporting Policies
A. The City will establish and maintain the highest standard of accounting practices, in conformity with Generally Accepted Accounting Principles (GAAP) and with recommended best practices as promulgated by the Government Finance Officers Association
B. The City shall prepare Quarterly Financial Reports (except for the first quarter) and an Annual Comprehensive Financial Report for the purposes of providing finances to interested parties and the public at large.
C. The City will contract with an independent audit firm to perform an annual audit of the financial statement of the City.
D. The City will attempt at all times to maintain the Certificate of Excellence in Financial Reporting of the Government Finance Officers Association.
24
Capital Improvement Policies
A. The City will develop a 10-year Capital Improvement Plan for all projects over $25,000 and will update the plan every two years.
B. The City will identify the estimated cost and potential funding sources for each project and determine the most effective financing method for the proposed project.
C. Liquor profits are a dedicated funding source of the Capital Improvement Plan.
Fund Balance Policy — General Fund
By approval of this policy, the City Council authorizes the Finance Manager and/or City Manager to assign a fund balance that reflects the City’s intended use of those funds When both restricted and unrestricted resources are available for use, it is the City’s policy to first use restricted resources and then use unrestricted resources as they are needed. When unrestricted resources are available for use, it is the City’s policy to use resources in the following order: 1) committed 2) assigned 3) unassigned. These fund balance classifications apply only to Governmental Funds, not Enterprise or Internal Service Funds The unassigned fund balance will be in the following three categories.
Unassigned Fund Balance — Working Capital Policy
The City's unassigned fund balance — working capital as of the end of the year should equal to 50% of the next year’s budgeted tax revenue Any amount in excess of 50% will be used for budget stabilization. If the balance falls below 50%, a plan will be developed and implemented to replenish the funds. A balance equal to 50% of the next year’s budgeted tax revenue is needed to fund the following year’s operations until the tax settlement is received at the end of June.
Unassigned Fund Balance — Emergency/Maintain Bond Rating
In recognition that the amount for working capital only covers operating costs for the first six months of the year, the City wants to maintain additional resources on hand to provide for contingencies. Therefore, at the end of each year, the City will maintain an amount for emergencies and maintenance of the Aaa bond rating of 10% of the next year's budget. The intent is not to use this balance except in extreme emergencies. If for any reason the balance falls below 10%, a plan would be developed and implemented to replenish the fund.
Unassigned Fund Balance — Budget Balancing
In recognition that the City’s budget is volatile, the City wants to maintain a balance to help manage the fluctuations in the budget. Therefore, at the end of each year, the City will maintain an amount for budget balancing This amount will vary as positive financial results increase the amount, and negative financial results and one-time uses decrease the amount At all times, the City will implement a balanced budget Generally, the balance will be maintained at 5% to 7% of the next year's budget.
After the end of each calendar year as part of the annual financial reporting, the City Manager will update the City Council on the status of the budget balancing amount. The update will include the current balances and the changes from the previous year The City Manager will inform the City Council of any one-time uses throughout the year that were not planned for during the budget process.
Use of Budget Balancing Amount
Some examples of when and how the balance would be used include the following:
• When the balance is greater than 5%, the City Manager may recommend that amounts be used for one-time purchases in the next year’s operating budget. These will help to level expenditures from year to year.
• When workload demand increases significantly, the City Manager may recommend the use of the balance for short-term support. For example, temporary staffing to assist with the light rail transit projects Many times, there will be an increase in revenue due to this activity but the need for support and the timing of the revenue may differ.
• When other one-time operating needs become apparent after the budget is adopted, the City Manager may recommend the use of the balance.
• When financial results are negative, the balance would be used. If for any reason the balance falls below 5% and staff believes this will not self-correct, a plan would be developed and implemented to replenish the fund.
25
Fund Balance Policy (Unrestricted Net Assets) — Internal Service Funds
The City maintains internal service funds as a tool to purchase goods and services centrally and then charge the costs back to the departments that use the service. This provides more accurate information of the cost to provide City Services The City maintains the following internal service funds:
• Information Technology
• Facilities
• Property/Workers’ Compensation
• Fleet Services
• Employee Benefits
Internal service funds will maintain unrestricted net assets of 15% to 20% of the annual budget. Funds with a capital component, facilities, fleet and information technology will also maintain one year of the capital budget This will provide for adequate cash flow for operations and provide flexibility to meet the City’s capital needs
Fund Balance Policy (Unrestricted Net Assets) — Enterprise Funds
The City of Eden Prairie maintains enterprise funds for the following activities:
• Water
• Stormwater
• Wastewater
• Liquor
Water, Wastewater, Stormwater
The City of Eden Prairie periodically works with a consultant on a utility rate study for financial planning purposes to ensure that revenue collected will provide for operating and capital costs for the systems. The most recent update to the study was completed in 2017. The study included an analysis of the cost of service, capital improvement planning, utility rate design, revenue adequacy evaluation and proposed rate adjustments The study also provided a recommended policy for the amounts to maintain in unrestricted net assets The City’s policy agrees with this recommendation The unrestricted net asset policy is as follows:
• An amount equal to 90 days of operating expense
• An amount equal to the following year’s debt service principal and interest
• A capital reserve of two years’ capital expense
The expectation is that these reserves will provide for the long-term funding needs of the utility operations.
Liquor
Generally, all liquor store profit from operations is transferred to the Capital Improvement and Maintenance Funds Exceptions may include maintaining profit for planned improvements
Other Policies
The City has other policies related to the budget and finances of the City which are not included in this document These polices include:
• Post Issuance Compliance Policy for Tax Exempt and Tax Advantaged Obligations
• Business Subsidy
• Community Development Block Grant Funds (CDBG)
• Human Services Funding
• Tax Increment Financing
• Investments
• Capital Asset
• Credit Card
• Purchasing
26
Budget Process
The budget is the vehicle through which the City establishes the appropriations of the City and reflects the allocation of limited revenue among competing uses. The allocation is accomplished through a comprehensive budget process The City Council approves a budget resolution which authorizes spending based on estimates of the financial resources required to support these expenditures A public hearing takes place before legal adoption of the budget
2022/2023 Budget Timeline
Winter 2020 Complete Citywide workplans
March 2021 City Council workshop on Quality of Life Survey results
April 2021 City Council planning session, prepare internal service fund budgets, budget kick-off meetings
May 2021 City Council workshop, review prior year audited financial results, staff budgets due
June 2021 Budget rework, Council workshop preparation
July 2021 City Council budget workshop
September 2021 Preliminary tax levy and budget adopted
October 2021 Budget engagement
November 2021 City Council workshop on Enterprise Funds
December 2021 Public hearing, adoption of final tax levy and budget
May–August 2022 2022 tax projection updated, 2023 budget may be amended before tax levy certification
September 2022 Budget amendments presented to City Council, workshop on Capital Improvement Plan, amended budget and tax levy certified by Sept. 15
December 2022 Public hearing on 2023 budget and Capital Improvement Plan, budget and tax levy adopted
27
Budget Monitoring and Amendments
The appropriated budget is prepared by each Department and Division. The Department Directors and Division Managers may make transfers of appropriations within a division Transfers of appropriations between divisions require the approval of the City Manager Any changes in the total budget of each fund requires approval by a majority vote of the City Council.
Capital Budget Process
The City plans for capital maintenance and improvements by preparing a 10-year Capital Improvement Plan (CIP) The CIP represents a framework for planning the preservation and expansion of capital including equipment, facilities and infrastructure It sets forth the estimated schedule, timing and details of specific improvements by year, together with the estimated cost, the need for the improvement and sources of revenue to pay for the improvement The plan is updated every other year during the second year of the two-year operating budget preparation The plan authorizes the expenditures for the first two years of the 10-year planning period.
The City Council considers the following when preparing the CIP for each project and for the overall plan:
• Condition of the City’s infrastructure, including the projected need for repair or replacement
• Likely demand for the improvement
• Estimated cost of the improvement
• Available public resources
• Level of overlapping debt in the City
• Relative benefits and costs of alternative uses of the funds
• Operating cost of the proposed improvement
• Alternatives for providing services most efficiently through shared facilities with other cities or local government units
Each department documents and prioritizes their requested projects. The cost estimates for each request include capital and operating budget costs that would result from the project.
Finance then analyzes the requested projects and compares the requests to funds available. A CIP committee consisting of the department heads meets to make a final recommendation to the City Manager of the proposed CIP projects. The City Manager makes the final recommendation to the City Council on which projects to include and fund in the CIP.
28
FINANCIAL SCHEDULES

Financial Schedules
Four-Year Summary
2020 2021 2022 2023 Actual Budget Budget % Change Budget % Change Revenues By Source Taxes $ 39,232,502 $ 40,270,260 $ 42,316,562 5.1% $ 44,087,158 4.2% Assessments 643,541 - - - -Licenses and Permits 8,257,772 7,055,780 7,241,700 2.6% 8,068,700 11.4% Intergovernmental Revenue 6,824,556 1,849,222 5,671,301 206.7% 2,001,300 (64.7%) Charges for Services 53,853,809 59,600,676 59,950,146 0.6% 62,368,740 4.0% Fines and Penalties 230,341 417,000 367,000 (12.0%) 367,000 0.0% Investment Earnings 1,901,307 258,000 275,000 6.6% 275,000 0.0% Other Revenue 1,101,847 2,424,082 1,452,880 (40.1%) 1,453,380 0.0% Other Financing Sources 7,254,694 1,355,397 1,399,194 3.2% 1,445,832 3.3% Total $ 119,300,369 $ 113,230,417 $ 118,673,783 4.8% $ 120,067,110 1.2% Expenditures (Expenses) by Department Administration $ 4,547,110 $ 4,719,537 $ 5,032,648 6.6% $ 5,009,025 (0.5%) Community Development 2,431,612 2,506,395 2,647,422 5.6% 2,726,689 3.0% Parks and Recreation 11,084,484 13,434,873 14,063,502 4.7% 14,472,106 2.9% Police 15,357,194 16,346,761 17,388,375 6.4% 18,233,620 4.9% Fire 6,378,338 6,477,683 6,709,802 3.6% 6,965,251 3.8% Public Works 5,991,750 6,536,459 6,709,291 2.6% 6,922,366 3.2% Capital Outlay 7,119,787 8,207,000 9,056,000 10.3% 9,200,500 1.6% Utilities 18,828,402 20,841,494 20,604,280 (1.1%) 20,627,711 0.1% Internal Service 18,192,568 19,703,317 20,800,109 5.6% 21,700,912 4.3% Liquor Operations 10,503,726 10,955,292 11,203,602 2.3% 11,625,142 3.8% Debt Service 2,765,308 2,650,058 2,833,581 6.9% 2,846,661 0.5% Other 7,497,954 1,218,227 1,262,024 3.6% 1,308,662 3.7% Total $ 110,698,233 $ 113,597,096 $ 118,310,636 4.1% $ 121,638,645 2.8% Expenditures (Expenses) by Object Personnel Services $ 43,009,320 $ 46,246,110 $ 49,022,420 6.0% $ 51,166,793 4.4% Supplies 4,205,859 4,576,217 4,642,283 1.4% 4,710,529 1.5% Contractual Services 18,295,904 21,766,943 22,273,665 2.3% 22,993,043 3.2% User Charges 11,593,974 11,985,021 12,552,107 4.7% 12,915,092 2.9% Capital Under $25,000 1,050,673 1,152,734 879,010 (23.7%) 810,460 (7.8%) Capital Outlay 7,119,787 8,207,000 9,056,000 10.3% 9,200,500 1.6% Depreciation 6,859,455 7,235,123 7,109,173 (1.7%) 6,679,517 (6.0%) Cost of Goods Sold 8,299,999 8,559,663 8,680,373 1.4% 9,007,388 3.8% Debt Service 2,765,308 2,650,058 2,833,581 6.9% 2,846,661 0.5% Other 7,497,954 1,218,227 1,262,024 3.6% 1,308,662 3.7% Total $ 110,698,233 $ 113,597,096 $ 118,310,636 4.1% $ 121,638,645 2.8% 30
2020 Actual by Fund
General Debt Service Capital Project Enterprise Total Internal Service Fund Funds Funds Funds 2020 Funds Revenues By Source Taxes $ 36,283,374 $ 2,553,000 $ 396,128 $ -$ 39,232,502 $Assessments - - 37,332 606,209 643,541Licenses and Permits 4,996,872 - 3,260,900 - 8,257,772Intergovernmental Revenue 6,238,109 - 500,000 86,447 6,824,556Charges for Services 2,464,886 - - 32,034,637 34,499,523 19,354,286 Fines and Penalties 230,341 - - - 230,341Investment Income 536,716 - 367,793 701,283 1,605,792 295,515 Other Revenue 253,315 - 466,764 81,179 801,258 300,589 Bond Proceeds - - - - -Other Financing Sources 411,468 - 5,826,486 1,016,740 7,254,694Total $ 51,415,081 $ 2,553,000 $ 10,855,403 $ 34,526,495 $ 99,349,979 $ 19,950,390 Beginning Fund Balances $ 25,435,483 $ -$ 15,280,651 $ 137,006,826 $ 177,722,960 $ 11,403,767 Expenditures (Expenses) by Department Administration $ 4,547,110 $ -$ -$ -$ 4,547,110 $Community Development 2,431,612 - - - 2,431,612Parks and Recreation 11,084,484 - - - 11,084,484Police 15,357,194 - - - 15,357,194Fire 6,378,338 - - - 6,378,338Public Works 5,991,750 - - - 5,991,750Capital Outlay - - 6,586,451 533,336 7,119,787Utilities - - - 18,828,402 18,828,402Internal Service - - - - - 18,192,568 Liquor Operations - - - 10,503,726 10,503,726Debt Service 60,765 2,553,000 - 151,543 2,765,308Other 4,696,486 - 1,500,000 1,301,468 7,497,954Total $ 50,547,739 $ 2,553,000 $ 8,086,451 $ 31,318,475 $ 92,505,665 $ 18,192,568 Ending Fund Balances $ 26,302,825 $ -$ 18,049,603 $ 140,214,846 $ 184,567,274 $ 13,161,589 Expenditures (Expenses) by Object Personnel Services $ 28,778,882 $ -$ -$ 5,324,342 $ 34,103,224 $ 8,906,096 Supplies 1,795,624 - - 1,227,305 3,022,929 1,182,930 Contractual Services 4,255,457 - - 7,572,600 11,828,057 6,467,847 User Charges 10,710,228 - - 866,326 11,576,554 17,420 Capital Under $25,000 250,297 266,006 516,303 534,370 Capital Outlay - - 6,586,451 533,336 7,119,787Depreciation - - - 5,775,550 5,775,550 1,083,905 Cost of Goods Sold - - - 8,299,999 8,299,999Debt Service 60,765 2,553,000 - 151,543 2,765,308Other 4,696,486 - 1,500,000 1,301,468 7,497,954Total $ 50,547,739 $ 2,553,000 $ 8,086,451 $ 31,318,475 $ 92,505,665 $ 18,192,568 31
2021 Budget by Fund
General Debt Service Capital Project Enterprise Total Internal Service Fund Funds Funds Funds 2021 Funds Revenues By Source Taxes $ 37,325,260 $ 2,553,000 $ 392,000 $ - $ 40,270,260 $Assessments - - - - -Licenses and Permits 3,855,780 - 3,200,000 - 7,055,780Intergovernmental Revenue 1,299,222 - 550,000 - 1,849,222Charges for Services 6,468,995 - - 32,906,397 39,375,392 20,225,284 Fines and penalties 417,000 - - - 417,000Investment Earnings 150,000 - - 75,000 225,000 33,000 Other Revenue 162,990 - 2,117,000 5,592 2,285,582 138,500 Bond Proceeds - - - - -Other Financing Sources 423,227 - 932,170 - 1,355,397Total $ 50,102,474 $ 2,553,000 $ 7,191,170 $ 32,986,989 $ 92,833,633 $ 20,396,784 Beginning Fund Balances $ 26,302,825 $ - $ 18,049,603 $ 140,214,846 $ 184,567,274 $ 13,161,589 Expenditures (Expenses) by Department Administration $ 4,719,537 $ - $ - $ - $ 4,719,537 $Community Development 2,506,395 - - - 2,506,395Parks and Recreation 13,434,873 - - - 13,434,873Police 16,346,761 - - - 16,346,761Fire 6,477,683 - - - 6,477,683Public Works 6,536,459 - - - 6,536,459Capital Outlay - - 7,877,000 330,000 8,207,000Utilities - - - 20,841,494 20,841,494Internal Service - - - - - 19,703,317 Liquor Operations - - - 10,955,292 10,955,292Debt Service 60,766 2,553,000 - 36,292 2,650,058Other 20,000 - - 1,198,227 1,218,227Total $ 50,102,474 $ 2,553,000 $ 7,877,000 $ 33,361,305 $ 93,893,779 $ 19,703,317 Ending Fund Balances $ 26,302,825 $ - $ 17,363,773 $ 139,840,530 $ 183,507,128 $ 13,855,056 Expenditures (Expenses) by Object Personnel Services $ 31,134,848 $ - $ - $ 5,938,719 $ 37,073,567 $ 9,172,543 Supplies 1,760,095 - - 1,316,495 3,076,590 1,499,627 Contractual Services 5,713,747 - - 8,696,430 14,410,177 7,356,766 User Charges 11,066,168 - - 900,695 11,966,863 18,158 Capital Under $25,000 346,850 492,181 839,031 313,703 Capital Outlay - - 7,877,000 330,000 8,207,000Depreciation - - - 5,892,603 5,892,603 1,342,520 Cost of Goods Sold - - - 8,559,663 8,559,663Debt Service 60,766 2,553,000 - 36,292 2,650,058Other 20,000 - - 1,198,227 1,218,227Total $ 50,102,474 $ 2,553,000 $ 7,877,000 $ 33,361,305 $ 93,893,779 $ 19,703,317 32
2022 Budget by Fund
The proposed 2022 budget presented to the City Council Sept 7, 2021, is the same budget adopted by the City Council Dec. 7, 2021 This budget complies with City financial policies.
General Debt Service Capital Project Enterprise Total Internal Service Fund Funds Funds Funds 2022 Funds Revenues By Source Taxes $ 39,371,562 $ 2,553,000 $ 392,000 $ - $ 42,316,562 $Assessments - - - - -Licenses and Permits 4,041,700 - 3,200,000 - 7,241,700Intergovernmental Revenue 5,121,301 - 550,000 - 5,671,301Charges for Services 5,214,704 - - 33,257,495 38,472,199 21,477,947 Fines and penalties 367,000 - - - 367,000Investment Earnings 150,000 - - 75,000 225,000 50,000 Other Revenue 179,800 - 1,133,000 5,580 1,318,380 134,500 Bond Proceeds - - - - -Other Financing Sources 442,024 - 957,170 - 1,399,194Total $ 54,888,091 $ 2,553,000 $ 6,232,170 $ 33,338,075 $ 97,011,336 $ 21,662,447 Beginning Fund Balances $ 26,302,825 $ - $ 17,363,773 $ 139,840,530 $ 183,507,128 $ 13,855,056 Expenditures (Expenses) by Department Administration $ 5,032,648 $ - $ - $ - $ 5,032,648 $Community Development 2,647,422 - - - 2,647,422Parks and Recreation 14,063,502 - - - 14,063,502Police 17,388,375 - - - 17,388,375Fire 6,709,802 - - - 6,709,802Public Works 6,709,291 - - - 6,709,291Capital Outlay - - 8,704,000 352,000 9,056,000Utilities - - - 20,604,280 20,604,280Internal Service - - - - - 20,800,109 Liquor Operations - - - 11,203,602 11,203,602Debt Service 93,350 2,553,000 - 187,231 2,833,581Other 20,000 - - 1,242,024 1,262,024Total $ 52,664,390 $ 2,553,000 $ 8,704,000 $ 33,589,137 $ 97,510,527 $ 20,800,109 Ending Fund Balances $ 28,526,526 $ - $ 14,891,943 $ 139,589,468 $ 183,007,937 $ 14,717,394 Expenditures (Expenses) by Object Personnel Services $ 32,907,519 $ - $ - $ 6,306,371 $ 39,213,890 $ 9,808,530 Supplies 1,817,875 - - 1,310,130 3,128,005 1,514,278 Contractual Services 5,997,103 - - 8,552,507 14,549,610 7,724,055 User Charges 11,419,193 - - 1,111,308 12,530,501 21,606 Capital Under $25,000 409,350 123,460 532,810 346,200 Capital Outlay - - 8,704,000 352,000 9,056,000Depreciation - - - 5,723,733 5,723,733 1,385,440 Cost of Goods Sold - - - 8,680,373 8,680,373Debt Service 93,350 2,553,000 - 187,231 2,833,581Other 20,000 - - 1,242,024 1,262,024Total $ 52,664,390 $ 2,553,000 $ 8,704,000 $ 33,589,137 $ 97,510,527 $ 20,800,109
33
2023 Budget by Fund
General Debt Service Capital Project Enterprise Total Internal Service Fund Funds Funds Funds 2023 Funds Revenues By Source Taxes $ 41,142,158 $ 2,553,000 $ 392,000 $ - $ 44,087,158 $Assessments - - - - -Licenses and Permits 4,068,700 - 4,000,000 - 8,068,700Intergovernmental Revenue 1,401,300 - 600,000 - 2,001,300Charges for Services 5,571,287 - - 34,393,926 39,965,213 22,403,527 Fines and penalties 367,000 - - - 367,000Investment Earnings 150,000 - - 75,000 225,000 50,000 Other Revenue 178,300 - 1,135,000 5,580 1,318,880 134,500 Bond Proceeds - - - - -Other Financing Sources 463,662 - 982,170 - 1,445,832Total $ 53,342,407 $ 2,553,000 $ 7,109,170 $ 34,474,506 $ 97,479,083 $ 22,588,027 Beginning Fund Balances $ 28,526,526 $ - $ 14,891,943 $ 139,589,468 $ 183,007,937 $ 14,717,394 Expenditures (Expenses) by Department Administration $ 5,009,025 $ - $ - $ - $ 5,009,025 $Community Development 2,726,689 - - - 2,726,689Parks and Recreation 14,472,106 - - - 14,472,106Police 18,233,620 - - - 18,233,620Fire 6,965,251 - - - 6,965,251Public Works 6,922,366 - - - 6,922,366Capital Outlay - - 8,768,000 432,500 9,200,500Utilities - - - 20,627,711 20,627,711Internal Service - - - - - 21,700,912 Liquor Operations - - - 11,625,142 11,625,142Debt Service 93,350 2,553,000 - 200,311 2,846,661Other 20,000 - - 1,288,662 1,308,662Total $ 54,442,407 $ 2,553,000 $ 8,768,000 $ 34,174,326 $ 99,937,733 $ 21,700,912 Ending Fund Balances $ 27,426,526 $ - $ 13,233,113 $ 139,889,648 $ 180,549,287 $ 15,604,509 Expenditures (Expenses) by Object Personnel Services $ 34,276,946 $ - $ - $ 6,562,931 $ 40,839,877 $ 10,326,916 Supplies 1,853,625 - - 1,316,636 3,170,261 1,540,268 Contractual Services 6,103,158 - - 8,892,223 14,995,381 7,997,662 User Charges 11,736,128 - - 1,155,537 12,891,665 23,427 Capital Under $25,000 359,200 123,960 483,160 327,300 Capital Outlay - - 8,768,000 432,500 9,200,500Depreciation - - - 5,194,178 5,194,178 1,485,339 Cost of Goods Sold - - - 9,007,388 9,007,388Debt Service 93,350 2,553,000 - 200,311 2,846,661Other 20,000 - - 1,288,662 1,308,662Total $ 54,442,407 $ 2,553,000 $ 8,768,000 $ 34,174,326 $ 99,937,733 $ 21,700,912 34
Projected Changes in Fund Balances
*The greater than 10% percent change in fund balance for the Capital Project Funds is a result of planned spending and varying annual expenditures.
**The internal service fund balance increased by more than 10% during 2020 due to reduced expenditures during the COVID-19 pandemic. Many buildings were closed throughout the year.
Fund General Fund Year 2020 2021 2022 2023 Fund Balance January 1 $ 25,435,483 26,302,825 26,302,825 28,526,526 Revenues $ 51,415,081 50,102,474 54,888,091 53,342,407 Expenditures $ 50,547,739 50,102,474 52,664,390 54,442,407 Fund Balance December 31 $ 26,302,825 26,302,825 28,526,526 27,426,526 Increase / (Decrease) $ 867,3422,223,701 (1,100,000) % Change in Fund Balance 3.4% 0.0% 8.5% (3.9%) Debt Service 2020 2021 2022 2023-2,553,000 2,553,000 2,553,000 2,553,000 2,553,000 2,553,000 2,553,000 2,553,000---0.0% 0.0% 0.0% 0.0% Capital Project Funds 2020 2021 2022 2023 15,280,651 18,049,603 17,363,773 14,891,943 10,855,403 7,191,170 6,232,170 7,109,170 8,086,451 7,877,000 8,704,000 8,768,000 18,049,603 17,363,773 14,891,943 13,233,113 2,768,952 (685,830) (2,471,830) (1,658,830) 18.1% * (3.8%) (14.2%) * (11.1%) * Enterprise Funds 2020 2021 2022 2023 137,006,826 140,214,846 139,840,530 139,589,468 34,526,495 32,986,989 33,338,075 34,474,506 31,318,475 33,361,305 33,589,137 34,174,326 140,214,846 139,840,530 139,589,468 139,889,648 3,208,020 (374,316) (251,062) 300,180 2.3% (0.3%) (0.2%) 0.2% Internal Service Funds 2020 2021 2022 2023 11,403,767 13,161,589 13,855,056 14,717,394 19,950,390 20,396,784 21,662,447 22,588,027 18,192,568 19,703,317 20,800,109 21,700,912 13,161,589 13,855,056 14,717,394 15,604,509 1,757,822 693,467 862,338 887,115 15.4% 5.3% 6.2% 6.0% * * Grand Total 2020 2021 2022 2023 189,126,727 197,728,863 197,362,184 197,725,331 119,300,369 113,230,417 118,673,783 120,067,110 110,698,233 113,597,096 118,310,636 121,638,645 197,728,863 197,362,184 197,725,331 196,153,796 8,602,136 (366,679) 363,147 (1,571,535) 4.5% (0.2%) 0.2% (0.8%)
35
REVENUES

Revenues General Fund


The City of Eden Prairie’s largest sources of General Fund revenue are property taxes, charges for services, and licenses and permits. For 2020 and 2022, Intergovernmental revenue is larger than typical due to federal funds received for the COVID-19 pandemic A review of all revenue sources is completed with the biennial budget Revenues are projected based on information from City staff, Hennepin County, other external sources and analytical review Charges for services are reviewed annually to ensure reasonableness and may be adjusted for inflation.
Property Taxes
Property tax revenue is the single largest source at 72% of the General Fund budget. The City strives to balance increases in property taxes with the demand for services Tax revenue is projected to increase 5.5% for 2022 and 4.5% for 2023
Property tax revenues are collected by the County and passed through to the City. Every property owner is subject to property tax by the County, the school district and City in which the property is located, and other special authorities like watershed districts The estimated market value is a valuation set upon real estate and certain personal property by the City Assessor as a basis for levying property taxes This value is converted to tax capacity by a formula specified in state law The tax levy is the amount raised by general property taxes
Property Taxes 72% Charges for Services 10% Licenses & Permits 7% Other 2% Intergovernmental 9% 2020 2021 2022 Increase / 2023 Increase / Revenue Source Actual Budget Budget Decrease Budget Decrease Property Taxes $ 36,283,374 $ 37,325,260 $ 39,371,562 $ 2,046,302 $ 41,142,158 $ 1,770,596 Charges for Services 2,464,886 6,468,995 5,214,704 (1,254,291) 5,571,287 356,583 Licenses & Permits 4,996,872 3,855,780 4,041,700 185,920 4,068,700 27,000 Intergovernmental 6,238,109 1,299,222 5,121,301 3,822,079 1,401,300 (3,720,001) Other 1,431,840 1,153,217 1,138,824 (14,393) 1,158,962 20,138 Total $ 51,415,081 $ 50,102,474 $ 54,888,091 $ 4,785,617 $ 53,342,407 $ (1,545,684) Percent Change 9.6% -2.8%
37
While property taxes are difficult to compare across cities due to differences in tax base, growth, level and quality of services, Eden Prairie’s property tax rate compares favorably to other nearby cities.
Please see the 2021 City Tax chart below based on a median-valued home of $415,800
2021 City Tax
$2,500

Source: Applicable counties’ tax rate schedules
Charges for Services
Charges for Services, 10% of the General Fund budget, includes membership dues, daily fees and program fees for Park and Recreation programs The City collects fees for recreation programs based on a policy approved by the City Council in 2008 For 2022 these revenues are projected to decrease 19.4% and increase 6.8% in 2023 The decrease in 2022 is a result of parks and recreation program revenues still recovering from the pandemic
Fee schedules are reviewed annually by the Parks and Recreation Department and adjusted accordingly. Cost recovery for the various recreation programs depends on the type of service offered. Basic services are those that every taxpayer is entitled to receive. Cost recovery within the basic services range from 0% to 75%. Enhanced services are special events or activities to which the community is invited without a fee Minimum cost recovery for these types of programs ranges from 10% to 50% with the goal to obtain sponsorship of the entire cost of the programs Feeassisted services are programs that have a high-cost recovery as well as programs with mandated fee levels These programs recover costs up to 85% to 100% Fee-supported services are programs provided at no cost to taxpayers and in many cases show a profit.
Licenses and Permits
License and permit fees are 7% of the General Fund budget For 2022, they are projected to increase 4.8% and remain relatively flat for 2023.
Per Minnesota Statute 462.353, subd. 4(a), a city may charge fees that are sufficient to defray the costs incurred by the city in reviewing, investigating and administering an application for an amendment to an official control, or an application for a permit or other approval required under an official control Fees are required by law to be fair, reasonable and proportionate, and have a nexus to the actual cost of the service for which the fee is imposed All
$0 $500 $1,000 $1,500 $2,000
38
cities are required to adopt management and accounting procedures to ensure fees are maintained and used only for the purpose for which they are collected
Revenue from building permits and fees makes up a large part of the license and permit revenue. It is dependent on the number of housing starts, subdivision plats and commercial development applications Every two years, City staff review the fees charged and recommend adjustments based on inflation and the cost to provide the service. As shown in the graph below, revenue can vary significantly each year.
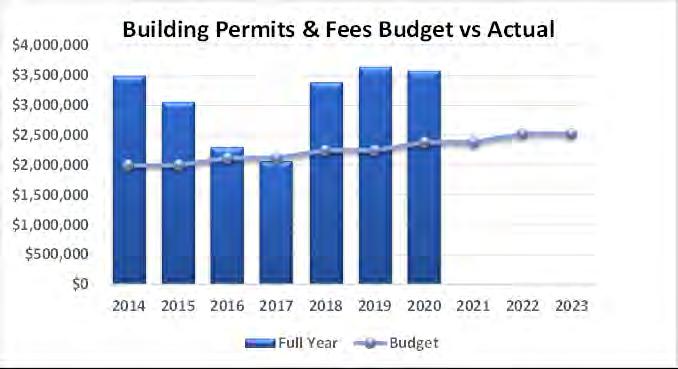
Businesses continue to invest in Eden Prairie. We expect this to continue and for the City to remain a favorable location for conducting business. Staff continue to discuss what a good base number is for development revenue to avoid being too aggressive and causing potential midyear operational challenges, while also recognizing that increased development activity will increase revenue and service demand.
Intergovernmental
Intergovernmental revenue sources include Federal and State grants, State aid and local grants. This revenue is 9% of the General Fund budget For 2022 an increase of $3,822,079 is expected due to the collection of $3,723,700 in American Recovery Plan Funds The City plans to use this revenue to offset shortfalls caused by the pandemic For 2023 revenue will decrease back to pre-pandemic levels The remainder of the revenue sources are Police Pension Aid and Fire Relief Association Aid.
Internal Service Funds
Internal Service Funds receive revenue through user chargeback of expenses. The City’s Internal Service Funds include Employee Benefits, Facilities, Fleet Services, Information Technology and Property Insurance The expenses of these funds are charged to the General Fund and Enterprise Funds based on a cost recovery allocation methodology These allocation methods are reviewed and updated every two years with the City’s budget cycle. Other revenue is primarliy fleet disposal proceeds. More information on the Internal Service Fund expenses can be found in the department summary section
2020 2021 2022 Increase / 2023 Increase / Revenue Source Actual Budget Budget Decrease Budget Decrease Charges for Services Other $ 19,354,286 596,104 $ 20,225,284 171,500 $ 21,477,947 184,500 $ 1,252,663 13,000 $ 22,403,527 184,500 $ 925,580Total $ 19,950,390 $ 20,396,784 $ 21,662,447 $ 1,265,663 $ 22,588,027 $ 925,580 Percent Change 6.2% 4.3% 39
Enterprise Funds
The drinking water, wastewater and stormwater utility is the largest source of the Enterprise Funds revenue budget at 64%, followed by liquor sales at 36%. Other revenue is primarily investment earnings, assessments and contributions of utilities by developers Overall revenues are projected to increase 1.1% for 2022 and 3.4% for 2023.
Utility Rate Study
The City periodically updates the 10-year utility rate study for water, wastewater and stormwater. In 2017, AE2S was retained to update the study The study provides a long-term and comprehensive plan for funding operation and maintenance, and the capital needs of the three utilities. Financial costs of service are balanced with rate changes. Staff monitors financial results against expectations to ensure appropriate levels of funding for the operations A residential utility bill of 18,000 gallons a quarter is expected to increase 3.1% and 3.2% for 2022 and 2023 respectively.
Liquor Sales
Eden Prairie has the fourth largest municipal off sale operation in Minnesota. Sales for the City’s three municipal liquor stores in 2022 are projected to increase 2.9% from the 2021 budget and increase 3.9% in 2023. City policy states that liquor profits are transferred to the Capital Improvement Program Operating income is projected to be $835,344 and $881,039 in 2022 and 2023 respectively.


Water 30% Wastewater 23% Stormwater 11% Liquor 36% 2020 2021 2022 Increase / 2023 Increase / Revenue Source Actual Budget Budget Decrease Budget Decrease Water $ 9,988,116 $ 10,098,173 $ 9,914,622 $ (183,551) $ 10,234,318 $ 319,696 Wastewater 7,167,274 7,552,063 7,635,527 83,464 7,874,974 239,447 Stormwater 3,376,785 3,561,554 3,668,401 106,847 3,778,453 110,052 Liquor 11,502,462 11,694,607 12,038,945 344,338 12,506,181 467,236 Other 2,491,858 80,592 80,580 (12) 80,580Total $ 34,526,495 $ 32,986,989 $ 33,338,075 $ 351,086 $ 34,474,506 $ 1,136,431 Percent Change 1.1% 3.4%
40
LONG RANGE
FINANCIAL PLANNING
Long-Range Financial Planning
The City utilizes a five-year budget model for its General Fund to assist in long-term strategic planning, and to detect any future structural funding and property tax levy problems as early as possible This section looks at these projections and the assumptions used to develop the projections.
Property Values — The City expects to see increased valuations going forward The Twin Cities Metropolitan Area is one of the fastest growing regions in the Midwest. The region has low unemployment, a high-quality workforce, robust transportation system, excellent business culture and a high quality of life We believe these trends, along with the investments we continue to see in our community, will maintain and increase property values
Tax Levy — The property tax levy is the City’s largest revenue source The General Fund tax levy is projected to increase 4% to 4.5% from 2024 to 2028. The total levy which includes the General Fund, debt and capital levy is projected to increase 3.9% to 4.3% over the same period This recognizes the need to maintain our services with incremental change as needed. As each budget is fine-tuned, we have flexibility to adjust as needed.
Charges for Services — Recreation charges are increased annually to pay for increases in the cost to provide service. For 2024 and 2025 charges for services are projected to increase 8.3% and 7.7% respectively, as the City is still steadily rebuilding back to the pre-pandemic amounts. For 2026 to 2028 fees are projected to increase 3% annually
License and Permit Fees — Building permit fees are reviewed every two years by City staff Adjustments are made based on inflation and the cost to provide service Generally, the budget has increased approximately 6% every other year. This has allowed builders to better plan for fee changes.
Personnel Costs — Wages and benefits continue to be the largest driver of the operating budget. For the budget model, we have planned for a 3.8% increase in wages This recognizes base increase, step and performance pay, and employee turnover As the baby boomers continue to retire, the City has been proactive in succession planning. Health insurance rates for 2024 to 2028 are projected to increase 7%.
Total Expenditures — Total General Fund expenditures are expected to increase between 3.4% to 3.8% annually to fund current City services
Debt — Debt payments paid by the debt levy remain stable We plan to issue debt from 2023 to 2027 for fire engines and improvements to our public safety facilities
Contingency Planning — The City employment base is populated with a healthy combination of retail, professional and light industrial businesses. The City does not rely solely on a single sector of employment and is able to better weather fluctuations in national and international economic changes In addition, we maintain reserves to provide temporary resources as needed. We also have flexibility in our budget
Limited Developable Land — The City is almost fully developed We have started to see more redevelopment, which continues to add value to the community Redevelopment trends may be volatile, and the City is able to respond to these changes with our contingency plans
Structural Balance — The General Fund long-term model reflects conservative estimates of revenue and expenditures and shows a balanced budget for all years except 2023 and 2024. The City is still steadily rebuilding back to prepandemic amounts and will use ARPA money received in 2021 and 2022 to cover the shortfall Each budget cycle the model is adapted to include changes in inflation, community growth, program choices and levels of service The subsequent modeling provides a financial context to understanding of funding requirements to maintain quality services. The out-years will be tempered with possible levy limits, program choices and policy-influenced levels of service The General Fund is part of a larger model to ensure the City has adequate resources to pay for services and to deal with cyclical downturns
42
General Fund Five-Year Forecast
The projections for 2024 to 2028 are shown below.
Proposed Proposed Estimated Estimated Estimated Estimated Estimate d 2022 2023 2024 2025 2026 2027 2028 REVENUES Taxes $ 39,371,562 $ 41,142,158 $ 43,028,439 $ 44,899,925 $ 46,761,782 $ 48,600,477 $ 50,584,821 License and Permits Building Permits and Fees 2,524,975 2,524,975 2,675,926 2,676,819 2,837,032 2,837,944 3,007,988 Other 1,516,725 1,543,725 1,547,692 1,551,698 1,555,744 1,559,831 1,563,958 Total Licenses and Permits 4,041,700 4,068,700 4,223,617 4,228,517 4,392,776 4,397,774 4,571,947 Intergovernmental Revenue Police Pension Aid 610,000 610,000 622,200 634,644 647,337 660,284 673,489 Fire Relief Association Aid 494,000 494,000 503,880 513,958 524,237 534,721 545,416 School Liaison 124,600 128,300 129,583 129,583 130,879 130,879 132,188 Other 3,892,701 169,000 170,850 172,724 174,621 176,542 178,488 Total Intergovernmental Revenue 5,121,301 1,401,300 1,426,513 1,450,908 1,477,073 1,502,426 1,529,581 Charges for Services Public Safety 171,047 172,533 175,379 178,281 181,241 184,260 187,339 Recreation 5,043,657 5,398,754 5,858,502 6,321,854 6,510,694 6,705,191 6,905,514 Total Charges for Services 5,214,704 5,571,287 6,033,880 6,500,135 6,691,935 6,889,451 7,092,853 Other Revenue 696,800 695,300 702,253 709,276 716,368 723,532 730,767 Total Revenues 54,446,067 52,878,745 55,414,703 57,788,761 60,039,935 62,113,660 64,509,970 EXPENDITURES Administration 5,032,648 5,009,025 5,291,262 5,373,912 5,641,409 5,779,019 6,096,288 Community Development 2,647,422 2,726,689 2,831,001 2,939,149 3,060,543 3,178,024 3,304,411 Police 17,388,375 18,233,620 18,931,139 19,653,590 20,462,449 21,247,536 22,091,935 Fire 6,709,802 6,965,251 7,204,489 7,447,864 7,715,457 7,977,310 8,258,297 Public Works 6,709,291 6,922,366 7,153,964 7,387,981 7,647,620 7,899,634 8,172,230 Parks and Recreation 14,063,502 14,472,106 14,960,420 15,458,165 15,999,113 16,533,993 17,104,320 Debt Service 93,350 93,350 - - - -Total Expenditures 52,644,390 54,422,407 56,372,275 58,260,661 60,526,591 62,615,516 65,027,481 Excess (Deficiency of Revenues over Expenditures) 1,801,677 (1,543,662) (957,572) (471,899) (486,656) (501,856) (517,511) OTHER FINANCING SOURCES / (USES) Issuance of Debt - - - - - -Transfers In 442,024 463,662 477,572 491,899 506,656 521,856 537,511 Transfers Out (20,000) (20,000) (20,000) (20,000) (20,000) (20,000) (20,000) Total Other Financing Sources 422,024 443,662 457,572 471,899 486,656 501,856 517,511 Net Change in Fund Balance $ 2,223,701 $ (1,100,000) $ (500,000) $ (0) $ (0) $ (0) $ (0) 43
Tax Levy Projections
Tax Levy Projections Adopted 2022 Proposed 2023 Estimated 2024 Estimated 2025 Estimated 2026 Estimated 2027 Estimated 2028 General Fund Tax Levy $ 40,149,554 $ 41,956,284 $ 43,889,008 $ 45,797,924 $ 47,697,018 $ 49,572,487 $ 51,596,518 Current Debt Service New Debt Service Total Debt Service 2,553,0002,553,000 2,553,0002,553,000 2,275,000 278,000 2,553,000 2,175,000 378,000 2,553,000 1,110,000 1,443,000 2,553,000 1,160,000 1,541,000 2,701,000 1,160,000 1,713,000 2,873,000 Capital Levy 400,000 400,000 400,000 400,000 400,000 400,000 400,000 Total Tax Levy $ 43,102,554 $ 44,909,284 $ 46,842,008 $ 48,750,924 $ 50,650,018 $ 52,673,487 $ 54,869,518 Change Percent Change 1,806,730 4.2% 1,932,724 4.3% 1,908,916 4.1% 1,899,094 3.9% 2,023,469 4.0% 2,196,031 4.2% 44
CAPITAL EXPENDITURES

Capital Expenditures
Definition
A capital improvement is a major expenditure of City funds. For the Capital Improvement Plan (CIP), the City defines capital as the cost of a single project or piece of equipment over $25,000. Projects under $25,000 appear in the operating funds and on a limited basis in the CIP
Capital Project Funding Sources
Capital Improvement Fund
Projects paid for out of the Capital Improvement Fund do not have another funding source. Funding for the Capital Improvement Fund includes liquor profits, tax revenue, lease revenue, franchise fees, transfers-in, interest and other miscellaneous sources Usually, onetime money received is put into the Capital Improvement Fund The City uses the Capital Improvement Fund and pay-as-you-go financing whenever possible.
Pay-as-you-go is a method of financing capital projects with current revenues — paying cash instead of borrowing against future revenues Pay -as-you-go works well where capital needs are steady and financial capability is adequate This method saves interest costs since interest on long-term bonds can more or less equal the original capital costs, depending on interest rates and repayment schedules It also protects borrowing capacity for unforeseen major outlays that are beyond any current year’s capability, and it fosters favorable bond ratings when long-term financing is undertaken.
Projects paid from the Capital Improvement Fund include maintenance of approximately 235 miles of City streets as well as new trails, sidewalks, park maintenance fire and police equipment.
Internal Service Funds
The City funds capital projects out of the Fleet Services, Information Technology and Facilities Internal Service Funds. Fleet Services manages the acquisition and disposal of over 290 vehicles and 150 pieces of small equipment. Information Technology includes maintenance of the City’s internal and external network infrastructure and replacement of various software Facility projects include improvements, repairs and maintenance of the City’s 32 buildings
Utility Funds
Projects under Utility Funds include maintenance to the City’s utility infrastructure. Projects are part of the 10-year CIP and the utility rate study to ensure adequate funding amounts are collected
46
Capital Projects by Department
Department 2022 Budget2023 Budget Engineering $200,000$1,600,000 Facilities 1,010,000 590,000 Fire 780,000 305,000 Fleet 2,001,100 1,724,550 Information Technology 682,000 295,000 Parks and Recreation 2,770,000 1,700,000 Police 199,000 93,000 Water Utility 405,000 435,000 Wastewater Utility 260,000 260,000 Stormwater Utility 1,300,000 2,355,000 Sustainability 555,000 35,000 Total $10,162,100$9,392,550 47
Capital Projects by Funding Source
Capital Improvement Fund Project 2022 Budget 2023 Budget Significant Non Recurring Eng i neering ADA Ramp Improvement Program $75,000 $75,000 Annual Public Works Maintenance & Repair 125,000 125,000 West 70th St East Segment 1,400,000 X Fir e Station Alerting 75,000 Security Cameras and Servers 230,000 100,000 Dispatch and Radio Tower Power Supply 40,000 Card Access Control 25,000 Radio Loggers 75,000 Analog Phone Loggers 80,000 Radio Replacement 75,000 Station 1 Emergency Operations 100,000 X Breathing Apparatus Fill Stations 160,000 Rad 57 Replacement 35,000 Rescue Tool Replacement 90,000 Fleet Vehicle Replacement 35,000 Parks Play Equipment Replacement 130,000 110,000 Parking Lot Maintenance 100,000 125,000 Trail Maintenance 400,000 450,000 Hard Court Maintenance 115,000 150,000 Flying Cloud Fields Regrading 275,000 X Staring Lake Amphitheatre Renovation 200,000 X Park Building Access Upgrades 60,000 60,000 Round Lake Park Building Reconstruction 1,250,000 X Staring Lake Trail Bridge Replacement 150,000 X Miller Park Indoor Court Facility 150,000 X New Trails and Sidewalks 365,000 380,000 Police Negotiations Van 100,000 X Ballistic Helmets and Plates Replacement 40,000 New Squad Car 59,000 59,000 Infrared Laser Sights Replacement 34,000 Sustainability Miller Park Light Conversion 525,000 X Electric Vehicle Charging Stations 30,000 35,000 Total $4,504,000 $3,768,000 48
Internal Service Funds
Pr oject 2022 Budg et 2023 Budget Significant Non Recurring Facilities Building Restoration $80,000 $80,000 Heat Pump Replacement 40,000 60,000 Replace Zambonis 155,000 155,000 X Seal Apparatus Bay Floors, Fire 1 25,000 Kitchen Remodel, Fire 1 80,000 Maintenance Facility Parking Lot 300,000 X Rebuild Community Center Gym Floor 80,000 Replace Air Handling Unit, Rink 1 115,000 X Seal Apparatus Bay Floors, Fire 3 25,000 Maintenance Facility Roof 75,000 City Center LED Lighting 330,000 Fleet Vehicle and Equipment Replacement 2,001,100 1,689,550 Infor mation Technol ogy Network Storage Upgrades 180,000 265,000 Fiber Implementation 275,000 GPS Equipment Replacement 30,000 Police Body Cameras 175,000 X Police License Plate Readers 52,000 Total $3,693,100 $2,574,550 49
Utility Funds

Project 2022 Budget 2023 Budget Significant Non Recurring Bituminous Surfaces Rehab Water Plant $60,000 $60,000 West 70th St East Segment 30,000 Annual Conservation Landscaping 15,000 15,000 Annual Well Rehab 130,000 130,000 Annual Water Main Rehab 200,000 200,000 Sump Pump Collection Systems 50,000 50,000 Lift Station Rehabilitation Program 210,000 210,000 Pioneer Trail (CSAH 1) 250,000 X Dell Road (Crestwood Terrace to CSAH 61) 1,300,000 X Sump Pump Collection Systems 50,000 50,000 West 70th St East Segment 80,000 Stormwater Quality Improvement Projects 475,000 150,000 Creek and River Restoration Projects 275,000 125,000 General Repairs and Maintenance 225,000 200,000 Annual Road Drainage Improvements 275,000 200,000 Total $1,965,000$3,050,000 Water Wastewater Stormwater 50
Significant Non-Recurring Capital Projects
West 70th Street East Segment — $1,400,000
This section of West 70th Street is currently a standard industrial street section. The project is needed to match this existing section to the new extension of West 70th Street to the west, and the Light Rail plaza area The project will also provide improved multimodal access for area businesses and will serve the proposed Golden Triangle Light Rail station It will include multiuse sidewalks and streetscape improvements.
Operating Budget Impact — It will result in additional roadway pavement and new trails/sidewalks requiring standard maintenance
Fire Station 1 Emergency Operations — $100,000
The current emergency operations command center located at Fire Station 1 is not an effective overall space and does not provide continuity of operations. The project will add an audio-visual system, monitors, white boards and redundant fiber connection.
Operating Budget Impact — Future replacement cost of the audio-visual system and monitors.
Flying Cloud Fields Regrading — $275,000
The youth soccer field surfaces at the Flying Cloud Fields athletic complex require regrading to improve the turf condition and player safety There are currently 15 acres of turf soccer fields at this location accommodating 25 youth fields. The turf is uneven in multiple locations, especially in the goal areas. The fields will be regraded and leveled for better drainage, turf condition and safer play.
Operating Budget Impact — No additional maintenance costs.
Staring Lake Amphitheatre Renovation — $200,000
Sets are currently built off-site and transported to the park for summer play performances The sets, props and performance materials are stored in an unsecured space. Renovation of the amphitheater will increase storage, workspace and set production efficiency.
Operating Budget Impact – No additional maintenance costs; reduced costs related to transportation of sets.
Round Lake Park Building Reconstruction — $1,250,000
Many areas do not meet current building code requirements and spaces are too small for use. This project will replace the park building to accommodate larger groups, increase storage and update the building layout to improve accessibility.
Operating Budget Impact — Increased utility costs could be added due to the larger building footprint.
Staring Lake Trail Bridge Replacement — $150,000
The existing bridges are nearing the end of their useful lives and are too narrow for maintenance equipment to cross. Two bridges will be replaced around the Staring Lake loop trail, widening them to 10 feet.
Operating Budget Impact — No additional maintenance costs
Miller Park Indoor Sports Facility — $150,000
With continued popularity of tennis and pickleball, there are numerous requests for year-round court space The demand for pickleball at the Community Center outpaces the space Construction of a year-round facility would relieve much of this demand and allow the Community Center gyms to be programmed for a wider variety of
51
activities. An indoor court facility would be constructed at the current location of the tennis and basketball courts at Miller Park Access to the building would be controlled remotely . Residents would be able to reserve space for tennis, pickleball and basketball Youth athletic associations may also reserve time for early spring practice.
Operating Budget Impact — Additional utility costs would be added to the budget for heating, air, lighting and security. In addition, there may be modest increases to the budget for building and property insurance.
Negotiations Van — $100,000
With mental health crisis calls increasing, a negotiations vehicle will allow the Crisis Team to effectively respond to incidents with emotional and suicidal individuals.
Operating Budget Impact — Additional costs for insurance, fuel and maintenance of the van
Miller Park Lighting Conversion — $525,000
The current athletic field lights are over 20 years old and expensive to maintain. Conversion of the lights to LED will save on future operating costs.
Operating Budget Impact — Reduction in lighting costs.
Zambonis — $310,000
This project will replace two gas-powered Zambonis with electric, which will aid in meeting more stringent air quality testing requirements and aligns with the City’s sustainability initiatives.
Operating Budget Impact — Replacement of gas costs with electric.
Maintenance Facility Parking Lot — $300,000
The asphalt at this location is beyond useful life and failing. It requires replacement from native soil to parking surface A mill and overlay study was completed and determined the lot needs to be torn out and completely replaced.
Operating Budget Impact — Additional operating costs are not expected as this is an existing lot.
Replace Air Handling Unit, Rink 1 — $115,000
The unit is original to the rink and beyond useful life. Air handling units and exhaust systems for ice rinks have restrictive limits for carbon dioxide and nitrogen dioxide
Operating Budget Impact — The new unit will be more energy efficient than the original leading to possible reduction in energy costs.
Police Body Cameras — $175,000
Body cameras for patrol and liaison officers to promote officer safety, gather evidence and augment officer transparency.
Operating Budget Impact — Staffing time to process additional video data is expected to be absorbed within the existing records unit. In addition, annual technology maintenance costs of approximately $63,000 per year will be added to the operating budget.
Pioneer Trail (CSAH 1) Stormwater Improvements — $250,000
This project would upgrade a rural two-lane roadway to an urban two-lane roadway Turn lanes would be added along with an 8-foot trail Sanitary sewer, stormwater and water will be extended for future development.
52
Operating Budget Impact — Total reconstruction will restart the lifecycle of the pavement. Additional maintenance costs for striping, seal coating and overlays are modest.
Dell Road (Crestwood Terrace to CSAH 61) Stormwater Improvements — $1,300,000
An upgrade of an existing rural unimproved roadway to a two-lane urban collector street with curb and gutter, storm sewer facilities, trail extension to Flying Cloud Drive, creek crossing and a pedestrian underpass.
Operating Budget Impact — New pavement eliminates the need for frequent gravel and grading The new roadway and utilities will be added to our standard preventative maintenance programs.
53
DEBT

Debt
The City of Eden Prairie strategically uses debt to provide consistency in its high quality of municipal services, without subjecting residents and business to dramatic spikes and declines in taxes. From 2022 to 2023, debt payments supported by the tax levy are projected to remain approximately 4% to 5% of the General Fund budget The City has a policy of maintaining a percentage of 5% to 15% of the general fund budget as this is considered a moderate debt burden
Moody’s Investors Service has assigned its highest rating, Aaa, to the City of Eden Prairie’s bonds for every debt issue since 2003. Standard and Poor’s Financial Services has also assigned its highest rating of AAA to the City of Eden Prairie’s bonds outstanding. This ensures the City receives the most competitive interest rates The City’s bond ratings reflect Eden Prairie’s extensive and diversified tax base, low amount of rapidly amortized debt and capably managed operations Of the 854 cities in Minnesota, there are only 12 rated Aaa by Moody’s Investors Service and 19 rated AAA by Standard and Poor’s Financial Services
The City issues general obligation bonds to provide funds for the acquisition and construction of major capital facilities. General obligation bonds are direct obligations and pledge the full faith and credit of the City.
The City also issues assessment debt with governmental commitment to provide funds for the construction of streets and utilities. These bonds are repaid from amounts levied against the property owners who benefit from this construction. If a deficiency exists because of unpaid or delinquent assessments at the time a debt service payment is due, the City must provide resources to cover the deficiency until other resources are received. Assessment debt with governmental commitment has been issued for governmental activities.
The City also issues tax abatement bonds. These bonds and interest thereon are payable from abatements collected from certain property owners in the City. If abatement revenues are insufficient to meet principal and interest due, the City is required to levy ad valorem taxes without limit as to rate or amount on all taxable property in the City to make up the deficiency.
The City also issues general obligation utility revenue bonds to provide funds for the acquisition and construction of major capital facilities. General obligation bonds have been issued for business-type activities. General obligation bonds are paid from charges collected from customers of the utility funds.
The City formally budgets and levies taxes for General Obligation Bonds. General Obligation Bonds include amounts levied against tax capacity and amounts levied against market value Following is a summary of the total debt levy from 2014 to 2023, and a summary of the tax levy by bond issue for 2021 to 2023:
55
Debt Levies 2014-2023
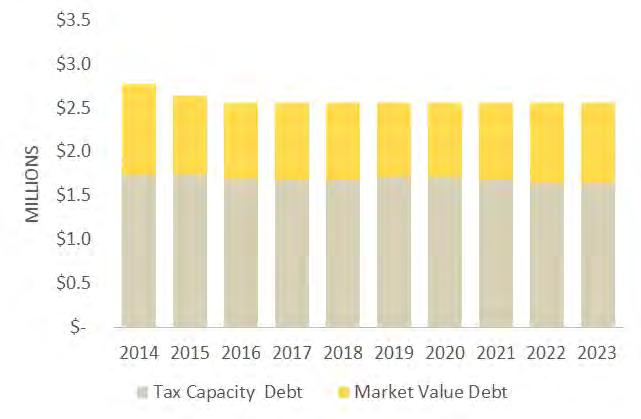
Summary of Tax Levy by Bond Issue
2021 to 2023
Legal Debt Margin
Minnesota Statute limits the amount of debt the City may issue to 3% of the assessor’s market value of the City’s tax base The assessor’s 3% market value less net debt is referred to as the legal debt margin The following table shows the legal debt margin on Dec. 31, 2020
2021 2022 Percent 2023 Percent Debt Levy Adopte d Adopted Difference Change Proposed Difference Change Debt Levy on Tax Capacity 2012B SouthWest Fire Station $ 280,000 $ - (280,000) (100.0%) $ -$ - 0.0% 2014 Tax Abatement 1,397,000 1,368,000 (29,000) 0.0% 1,368,000 - 0.0% 2020A Refunding Bonds (SouthWest Fire Station) - 280,000 280,000 0.0% 280,000 - 0.0% Sub-total 1,677,000 1,648,000 (29,000) (1.7%) 1,648,000 - 0.0% Debt Levy on Market Value 2012A Parks Referendum 876,000 - (876,000) 0.0% 2020A Refunding Bonds (Parks Referendum) - 905,000 905,000 0.0% 905,000 - 0.0% Sub-total 876,000 905,000 29,000 3.3% 905,000 - 0.0% Total $ 2,553,000 $ 2,553,000 $ -0.0% $ 2,553,000 $ -0.0%
56
As can be seen from the table, the City is significantly under the legal debt limit. This puts the City in a secure position because debt can be issued if necessary
Long-Term Debt
On Dec 31, 2021, the City’s net tax supported debt outstanding was $4,891,000 of General Obligation Bonds and $26,030,000 of Tax Abatement Bonds, and total debt was $44,461,000. In December 2021 the City refinanced the Tax Abatement Bonds which will be fully refunded in January 2022 Projected changes in bonds payable during 2022 and 2023 are summarized below.
The timing of the purchase and bond issuance could change.
Below summarizes debt outstanding at the end of each year from 2022 to 2038 Within the next 10 years, 82% of the City’s debt will be paid.
Estimated Market Value ('19/'20) $ 11,121,835,000 Legal Debt Margin: Debt Limit: 3% of Market Value 333,655,050 General Obligation Bonds 13,227,541 Tax Abatement Bonds 15,306,879 Deductions: Amt available for repayment of bonds 8,730,968 Total debt applicable to limit 19,803,452 Legal debt Margin $ 313,851,598 As a % of debt limit 94.1%
Balance 01/01/22 Addition Retired Balance 01/01/23 Addition Retired Balance 01/01/24 Governmental Activity: General Obligation Bonds Tax Abatement Bonds G.O. Special Assess. Bonds G.O. Utility Revenue Bonds Total $ 4,891,000 26,030,000 2,575,000 10,965,000 $ 44,461,000 $ 750,000-$ 750,000 $ 1,218,000 14,090,000 488,000 350,000 $ 16,146,000 $ 4,423,000 11,940,000 2,087,000 10,615,000 $ 29,065,000 $ 1,600,000-$ 1,600,000 $ 1,218,000 755,000 498,000 620,000 $ 3,091,000 $ 4,805,000 11,185,000 1,589,000 9,995,000 $ 27,574,000
Year Amount Year Amount 2024 $1,700,000 2026 $825,000 2025 $14,650,000 2027 $1,500,000
The City plans to issue debt for fire engines beginning in 2022 thru 2027 and also a Police Department remodel in 2025. See schedule below for future issuance of debt
57
Summary of Debt Outstanding
Annual debt service payments to maturity for all debt and future interest outstanding as of Jan 1, 2022, are as follows (in thousands of dollars):
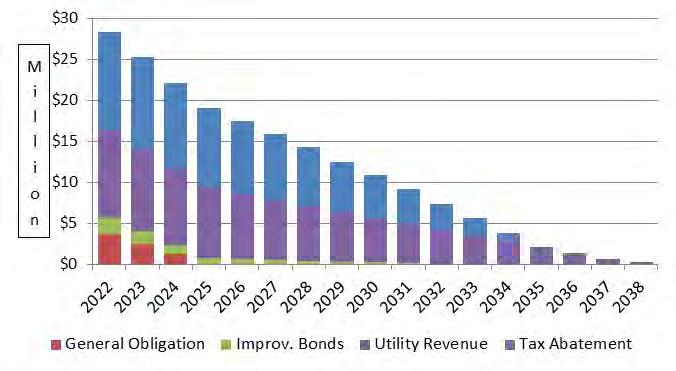
(Amounts in Thousands)
Governmental Activity: Assessment Debt with Govt Years Commitment Ending G.O.Bonds Improv Bonds Tax Abatement Bonds Total 12/31 Principal Interest Principal Interest Principal Interest Principal Interest 2022 $ 1,218 $ 41 $ 488 $ 47 $ 14,090 $ 487 $ 15,796 $ 575 2023 1,218 31 498 38 755 378 2,471 447 2024 1,216 21 498 29 830 347 2,544 397 2025 1,239 11 376 22 720 316 2,335 349 2026 -- 105 17 755 286 860 303 2027 105 15 775 256 880 271 2028 -- 105 12 800 224 905 236 2029 100 9 1,135 186 1,235 195 2030 100 7 955 144 1,055 151 2031 100 4 995 109 1,095 113 2032 100 1 1,025 79 1,125 80 2033 1,050 53 1,050 53 2034 1,060 32 1,060 32 2035 1,085 11 1,085 11 Total $ 4,891 $ 104 $ 2,575 $ 201 $ 26,030 $ 2,908 $ 33,496 $ 3,213 58
Revenue Debt with Govt Years Commitment Ending Utility Bonds 12/31 Principal Interest 2022 $ 350 $ 251 2023 620 294 2024 665 272 2025 685 249 2026 710 226 2027 735 202 2028 575 180 2029 595 159 2030 615 137 2031 640 117 2032 660 100 2033 675 84 2034 685 70 2035 700 56 2036 715 41 2037 735 26 2038 300 15 2039 305 7 Total $ 10,965 $ 2,486 59
Enterprise Activity:
General Fund Department Summaries Administration
Description of Operations
Administration includes the City Council, Office of the City Manager, Legal Counsel, Property and Workers’ Compensation Insurance, City Clerk, Communications, Finance, Human Resources, Facilities and Information Technology divisions Facilities, Information Technology and Property and Workers’ Compensation Insurance budgets are detailed in the Internal Service Fund section of this document All other Administration functions are included within the General Fund
The functions of the Administration divisions range from managing the City’s facilities and technology needs to external communication and the City budget. Records management, elections and boards and commissions are also part of the Administration Department Each division also supports the City’s core service departments.
The City of Eden Prairie operates under a statutory Plan B form of government with a council-manager system, with day-to-day administrative duties led by the City Manager. The City Council delegates all administrative duties to the City Manager, who is accountable to the Council for the effective administration of City business.
State law requires each City to retain an attorney. The City Manager — with consent of the Council — appoints the City Attorney . Since 1978, the City has retained the services of Gregerson, Rosow, Johnson & Nilan.
The City Clerk is responsible for administration of elections, official records management and city code maintenance
Communications manages the internal and external communications of the City including marketing and community engagement
Finance overseas all financial activity including capital improvement planning, budget coordination, debt management, investments and liquor operations More information about Eden Prairie Liquor is available in the liquor fund section of this document.
Human Resources is responsible for labor relations, compensation and benefits, training, organizational development and support services Budgeted Positions
Administration 2020 Actual 2021 Budget 2022 Budget 2023 Budget Office of City Manager 2.0 2.0 2.0 2.0 City Clerk 2.0 2.0 1.0 1.0 Communications 3.5 3.5 3.5 3.5 Finance 5.5 5.5 5.5 5.5 Human Resources 9.8 9.8 9.8 9.8 Total FTEs 22.8 22.8 21.8 21.8 61
Financial Information


% OF ADMINSTRATION BUDGET
Services (wages and benefits) are increasing $201,845 or 7.6% for 2022 A large portion of the increase, $165,000, is due to the hiring of part-time staff for the 2022 election. The 2023 personnel services budget reduction reflects the removal of the election staff
Supplies are decreasing $2,125 in 2022 to better reflect actual expense trends during 2020 and 2021. A 1.8% increase is projected for 2023.
Contractual Services are increasing 6.1% or $75,059 in 2022 due to election ballot printing and legal expenses The 2023 budget for this category is increasing 1.5% due to legal expenses.
User Charges account for the Internal Service Fund expenditures. These charges represent Administration’s share of Facilities, Information Technology, and Property and Workers’ Compensation insurance Every two years user charge allocation methods are reviewed and adjusted to more accurately reflect service levels provided Due to this adjustment, the 2022 user charge is increasing $38,332 or 5.5% for 2022 and 3.4% for 2023. The driving factor for this increase is related to Information Technology expenses. 62
City Council 7% Legal Counsel 11% Office of City Manager 10% City Clerk 8% Communications 14% Finance 19% Human Resources 31% 2020 2021 2022 Increase / 2023 Increase / Category Actual Budget Budget Decrease Budget Decrease Personnel Services $ 2,707,152 $ 2,665,417 $ 2,867,262 $ 201,845 $ 2,797,362 $ (69,900) Supplies 98,904 118,885 116,760 (2,125) 118,835 2,075 Contractual Services 1,057,470 1,234,837 1,309,896 75,059 1,328,952 19,056 User Charges 682,974 700,398 738,730 38,332 763,876 25,146 Capital under $25,000 610 - - - -Total $ 4,547,110 $ 4,719,537 $ 5,032,648 $ 313,111 $ 5,009,025 $ (23,623) Percent Change 6.6% (0.5%)
Personnel
Goals, Objectives and Measures
Mitigate risk and liability to the City through sitespecific training, safety committee meetings and annual training These strategies allow the City to maintain a workers’ compensation experience modification rating less than the industry average (1.0), which results
Administration Goals, Objectives and Measures 2018 Actual 2020 Actual 2022 Target Division Goal
Community Well-Being and
—
Safety Objectives
insurance premiums. 0.62 0.59 <1.0 Human Resources Maintain high resident ratings of excellent or good on the overall quality of life in Eden Prairie 95% 93% 95% Office of the City Manager Goal — Economic Vitality Objectives Maintain highest available bond rating from Moody’s, and Standard and Poor’s Aaa AAA Aaa AAA Aaa AAA Finance Maintain moderate debt burden of 5-15% of the general fund budget per City policy 6% 5% 515% Finance Preserve and expand capital that is sustainable and affordable by preparing a fiscally balanced budget and 10-year balanced Capital Improvement Plan Yes Yes Yes Finance Goal — High-Quality Efficient Services Objectives Maintain or increase resident ratings of excellent or good on ease of use of the City website at or above national benchmarks 71% 70% 72% Communications Maintain or increase percentage of residents who consider website preferred City information source 77% 84% 85% Communications Maintain or increase percentage of residents who consider “Life in the Prairie” newsletter preferred City information source 75% 74% 75% Communications Maintain resident ratings of excellent or good on quality of overall employee customer service 92% 92% 93% Office of the City Manager Maintain the employee partnership survey job likability response and a positive, engaged and passionate work culture by continuing stay interviews, training/development programs, respectful workplace training and wellness initiatives 92% 96% 95% Human Resources Goal — Sense of Community Objectives Maintain or increase percentage of residents who access City website 66% 73% 75% Communications Maintain or increase annual email/text engagement rate 66% 80% 82% Communications 63
in reduced
Community Development
Description of Operations
The Community Development Department supports the long-term vitality of the City through land-use planning, development review, business, housing and community service support needs, and responsible property valuations It includes Administration, Assessing, Economic Development, Housing and Community Services, and Planning
• Community Development Administration oversees the divisions, represents the department at City Council meetings, coordinates special projects, and takes an active role in LRT planning, and negotiating and funding large redevelopment projects.
• Assessing establishes annual property valuations, inspects all properties once every five years per state law, provides staff support to the Board of Appeal and Equalization, and represents the City in Minnesota Tax Court matters
• Economic Development provides services promoting business growth, development and redevelopment, advocates for transportation infrastructure improvements and helps developers navigate the development review process
• Housing and Community Services is responsible for affordable housing initiatives, rehabilitation loan programs, human service coordination and agency contracts, and cultural assistance. Staff members support the Human Rights and Diversity Commission, Property Managers Group and Housing Task Force.
• Planning performs zoning code updates, development, sign permit and telecommunication reviews, and overall comprehensive planning for the City. The Aspire Eden Prairie 2040 comprehensive plan was approved by the Metropolitan Council in August 2019 and adopted by the City Council in October 2019. Staff members support the Planning and Heritage Preservation commissions.
Budgeted Positions
Community Development 2020 Actual 2021 Budget 2022 Budget 2023 Budget Administration 2.0 2.0 2.0 2.0 Assessing 7.0 7.0 7.0 7.0 Economic Development 1.0 1.0 1.0 1.0 Housing and Community Services 2.0 2.0 2.0 2.0 Planning 4.8 4.8 5.0 5.0 Total FTEs 16.8 16.8 17.0 17.0 64
% OF COMMUNITY DEVELOPMENT BUDGET


Services are budgeted to increase 3.8% in 2022 and 4.1% in 2023 due to base salary and step increases as well as a 0.2-FTE increase in Planning to better meet the division’s service needs
Supplies are increasing 5.6% in 2022 and 1.8% in 2023. The increase is due to postage for property tax valuation notices.
Contractual Services are increasing $72,095 or 30.6% for 2022 Increases are due to special area studies for the Aspire Eden Prairie 2040 plan implementation as well as a business survey A reduction of $15,050 is expected for 2023 due to the removal of the one-time business survey in 2022.
User Charges are decreasing $4,528 in 2022 due to allocation cost adjustments in the Facilities charges for Assessing and Planning. An increase of $11,523 or 3.5% is expected in 2023.
Overall, the Community Development budget is increasing 5.6% for 2022 and 3% for 2023 primarily for personnel services
Financial Information
Administration 10% Assessing 42% Economic Development 7% Housing and Community Services 14% Planning 27% 2020 2021 2022 Increase / 2023 Increase / Category Actual Budget Budget Decrease Budget Decrease Personnel Services $ 1,820,731 $ 1,923,441 $ 1,996,041 $ 72,600 $ 2,078,535 $ 82,494 Supplies 13,434 15,430 16,290 860 16,590 300 Contractual Services 274,479 235,985 308,080 72,095 293,030 (15,050) User Charges 321,409 331,539 327,011 (4,528) 338,534 11,523 Capital Outlay 1,559 - - - -Total $ 2,431,612 $ 2,506,395 $ 2,647,422 $ 141,027 $ 2,726,689 $ 79,267 Percent Change 5.6% 3.0%
Personnel
65
Goals, Objectives and Measures
Goal — Community Well-Being and Safety
Objectives
Maintain the City’s affordable housing score by preserving and developing affordable housing and implementing an inclusionary housing policy into City developments The Housing Opportunities Amount Score (ALHOA) assesses local efforts to maintain and support low- and moderate-income households The score ranges from 0 (lack of housing activity) to 100 (outstanding performance)
Goal — Economic Vitality
Objectives
Support a prosperous economic base for business growth and development by implementing Aspire Eden Prairie 2040, the City’s comprehensive plan, ensuring code amendments and rezoning of properties are consistent with the 2040 plan
Maintain the percentage of Eden Prairie businesses satisfied with the City’s decision-making process. Business survey results help identify wants and needs of the City’s business community
Prioritize projects supporting business growth and preserve affordable housing through update of the Housing and Economic Development Strategic Plan 2021-2025. This plan is updated every five years
Maintain a strong employment base (total # of jobs) by continuing business meet and greets, coordinating annual Open to Business contracts, supporting business retention, expansion, rehabilitation and renovation
Goal — High-Quality Efficient Services
Objectives
Goal — Innovative and Sustainable Practices
Objectives
Facilitate approval and implementation of ecoinnovation and industrial flex tech zoning districts in accordance with the City’s comprehensive plan
Community Development Goals, Objectives and Measures 2018 Actual 2020 Actual 2022 Target Division
85 100 100 Housing and Community Services
n/a Yes Yes Planning
90% 90% 90% Economic Development
n/a n/a Yes Community Development Administration
62,758 57,505 60,000 Economic Development
Implement electronic review of land use applications n/a n/a Yes Planning Meet state mandated ratio of property valuation versus property sale purchase
Yes Yes Yes Assessing
between 90-105%
n/a n/a Yes Planning Community Development Administration 66
Parks and Recreation
Description of Operations
The Parks and Recreation Department provides the community with comprehensive recreational amenities and programming. This includes parks and trails planning and development, facilities maintenance, forestry, leisure services programming and special events.
A goal of the department is to enhance the quality of life in the City and promote a stronger sense of community among residents and businesses The Parks and Recreation Department includes Administration, Parks and Natural Resources, Recreation Services and the Community Center.
• Administration supervises the entire operation, leads park acquisitions, and provides department planning and budgeting.
• Parks and Natural Resources provides forestry, wildlife and natural resources management, park and trail maintenance, and cemetery administration
• Recreation Services coordinates the programming of all areas including youth and family programs, organized athletics, community art events, therapeutic recreation and Art Center, Senior Center and Outdoor Center classes.
• The Community Center manages and operates a 239,000-square-feet facility including three ice arenas, three indoor pools, gyms, courts, fitness center and cardio equipment Round Lake and Riley Lake beaches, and park rental facilities are also managed by the Community Center.
Budgeted Positions
Parks and Recreation 2020 Actual 2021 Budget 2022 Budget 2023 Budget Administration 2.0 2.0 2.0 2.0 Park Maintenance 20.0 20.0 21.0 21.0 Recreation Services 7.6 7.6 7.6 7.6 Community Center 6.5 6.5 6.5 6.5 Total FTEs 36.1 36.1 37.1 37.1 67
% OF PARKS AND RECREATION BUDGET


Personnel Services are projected to increase $452,433 or 6.9% in 2022 and $271,370 or 3.9% in 2023 due to base salary and step increases. Continued market analysis for part-time employees is resulting in minimum wage increases to remain competitive, recruit and retain staff. An additional 1.0 FTE was added in 2022 for a forestry position.
Supplies are increasing $14,275 or 2.8% in 2022 and projected to increase $7,975 or 1.5% for 2023. These increases are primarily driven by community outreach and increasing programs at the Art Center.
Contractual Services are decreasing $4,497 in 2022 and slightly increasing by $25,549 or 1.7% in 2023. Reductions in 2022 are noted in deer consultant fees, equipment maintenance, special event fees and printing for promotional brochures Slight increases are expected in 2023 in utility expenses (electric, gas, waste disposal), community celebrations such as the Summer Concert Series, PeopleFest!, Arts in the Park and specialty fitness programs.
User Charges are budgeted to increase $112,418 or 2.4% for 2022 and 3.1% for 2023. These increases are primarily related to increased information technology expenses with additional equipment expected in park building locations as well as increased access to internet in parks.
Capital under $25,000 is projected to increase $54,000 or 27.9% in 2022 and decrease 19.1% in 2023. This is the result of new fitness equipment purchases at the Community Center.
Financial Information
Administration 3% Park Maintenance 33% Recreation Services 23% Community Center 41% 2020 2021 2022 Increase / 2023 Increase / Category Actual Budget Budget Decrease Budget Decrease Personnel Services $ 5,288,066 $ 6,529,863 $ 6,982,296 $ 452,433 $ 7,253,666 $ 271,370 Supplies 389,437 501,950 516,225 14,275 524,200 7,975 Contractual Services 717,540 1,480,487 1,475,990 (4,497) 1,501,539 25,549 User Charges 4,583,172 4,729,073 4,841,491 112,418 4,992,501 151,010 Capital under $25,000 106,269 193,500 247,500 54,000 200,200 (47,300) Total $ 11,084,484 $ 13,434,873 $ 14,063,502 $ 628,629 $ 14,472,106 $ 408,604 4.7% 2.9%
68
Goals, Objectives and Measures
Parks and Recreation Goals, Objectives and Measures 2018 Actual 2020 Actual* 2022 Target Division Goal — Community Well-Being and Safety Objectives Maintain the number of annual Community Center visits by including adaptive swim lessons and removing barriers to participation 899,000 400,000 600,000 Community Center Expand opportunities for outdoor fitness n/a n/a Yes Community Center Add missing trail and sidewalk links identified in the City’s pedestrian and bicycle plan Yes Yes Yes Park Maintenance Goal — High-Quality Efficient Services Objectives Increase Senior Center visits by improving the physical space and equipment to provide for lifelong learning needs, and the physical/social well-being of older adults 31,900 5,800 15,000 Recreation Services Maintain Art Center visits by continuing to offer improved programming 4,171 1,936 3,000 Recreation Services Goal — Preserved and Beautiful Environment Objectives Convert turf areas to pollinator-friendly native plants n/a n/a Yes Park Maintenance Protect urban forest from emerald ash borer by removing infested trees and replacing with diverse species 245 trees 889 trees 275 trees Park Maintenance Maintain high resident ratings on the overall appearance of Eden Prairie 95% 93% 95% Administration Park Maintenance Maintain high resident ratings of excellent or good on quality of large community parks 96% 97% 96% Administration Park Maintenance Maintain resident ratings of excellent or good on quality of small neighborhood parks 91% 96% 96% Administration Park Maintenance Goal — Sense of Community Objectives Maintain Community Center memberships by serving and attracting new populations with membership retention programs, sensoryfriendly events and virtual programs 2,608 1,683 >2,200 Community Center Maintain resident ratings of excellent or good on quality rating of recreation services 92% 91% 92% Recreation Services Community Center Enhance PeopleFest! event to increase the number of cultures and experiences represented by convening multiple partner agencies n/a n/a Yes Recreation Services Improve resident ratings of excellent or good on Eden Prairie’s sense of community 68% 69% 75% All Park and Recreation Divisions
Parks and Recreation facilities were closed during 2020 due
coronavirus pandemic. 69
*
to the
Police
Description of Operations
The Police Department protects and serves the community through active and professional engagement. The department is committed to providing customized service, exercising discretion and fairness in enforcement, building public trust and promoting the professional development of its force.

Chief Captain
X '-/ -- A --
Patrol Investigations Support
Animal Control, Crime Prevention, Mental Criminal, Domestic Abuse, Code Enforcement, Health, SWAT, Traffic Explorers, School Liasons Licensing, Records
Budgeted Positions
Administration includes 911 emergency dispatch services, records, licensing and community service officers Eden Prairie Police operates its own dispatch center allowing for enhanced, personalized customer service The dispatch center answers approximately 50,000 calls for service annually The Animal Control Unit responds to nearly 2,000 calls for service annually dealing with domestic, wild and livestock animal concerns.
The Patrol Division includes eight units serving the needs of the community by protecting victims and apprehending criminals. The Crime Tech Unit includes a sergeant and eight officers specially trained to process evidence from crime scenes including fingerprints, shoe prints and DNA The Crisis Intervention Team includes a sergeant and four officers specially trained in crisis intervention techniques The Domestic Abuse Response Team includes one sergeant and seven officers trained to help domestic abuse victims.
Police 2020 Actual 2021 Budget 2022 Budget 2023 Budget Administration 24.0 24.0 25.0 25.0 Officers 69.5 70.5 70 5 71.5 Total FTEs 93.5 94 5 95.5 96.5
70
% OF POLICE BUDGET


Services are increasing $839,640 or 6.4% in 2022 and $764,610 or 5.5% in 2023. These additions are due to salary and step increases, the addition of 2.0 FTEs, and an increase in overtime pay The additional 2.0 FTEs is to ensure two dispatchers are always on duty and to add a Police Officer with K-9 explosives detection.
Supplies are increasing $4,800 or 1.4% in 2022 and $19,000 or 5.5% in 2023 The increase in 2023 is a result of an additional K-9 unit and anticipated increase of uniform costs
Contractual Services are increasing $65,554 or 15.1% in 2022 for a new fitness testing initiative and access to a data service for investigations The budget is increasing 2.2% for 2023.
User Charges are increasing $129,120 or 5.3% for 2022 and $48,135 or 1.9% for 2023 Most of this increase is related to the Information Technology user charge due to increasing costs of police software, the addition of body cameras, a new ticket writer, drone maintenance and the addition of several devices (desktops, laptops and iPads).
Capital under $25,000 is increasing $2,500 or 3.3% for 2022 and 2023 due to expected increases in the cost of equipment. Typical items purchased include tasers, radar and ballistic plates.
Information
Financial
Capital under $25,000 Personnel Services 80% Supplies 2% Contractual Services 3% User Charges 15% 0% 2020 2021 2022 Increase / 2023 Increase / Category Actual Budget Budget Decrease Budget Decrease Personnel Services $ 12,382,308 $ 13,038,984 $ 13,878,624 $ 839,640 $ 14,643,234 $ 764,610 Supplies 295,546 338,700 343,500 4,800 362,500 19,000 Contractual Services 255,488 434,415 499,969 65,554 510,969 11,000 User Charges 2,366,748 2,458,662 2,587,782 129,120 2,635,917 48,135 Capital under $25,000 57,104 76,000 78,500 2,500 81,000 2,500 Total $ 15,357,194 $ 16,346,761 $ 17,388,375 $ 1,041,614 $ 18,233,620 $ 845,245 Percent Change 6.4% 4.9% Personnel
71
Goals, Objectives and Measures
*Measures affected by the coronavirus pandemic
Police Goals, Objectives and Measures 2018 Actual 2020 Actual* 2022 Target Division Goal — Community Well-Being and Safety Objectives Maintain high resident rating on overall feeling of safety 94% 92% 97% All Police Divisions Maintain traffic safety program by researching and implementing a portable license plate reader. Measure overall traffic stops which detect and deter crime 17,236 8,719 16,000 Patrol Maintain safe roadways. Measure number of DWI arrests 214 260 275 Patrol Research fitness testing for existing officers n/a n/a Yes Support Create a team to respond to high-density areas and events including light rail, the mall and airport n/a n/a Yes Patrol Continue senior liaison events, such as Coffee with Cops, lunches and meetings at senior buildings to reduce crimes against seniors 62 15 75 Investigations Continue support of “Night to Unite” summer neighborhood parties to celebrate and strengthen the commitment to keeping our City safe 165 n/a 185 All Police Divisions Goal — High-Quality Efficient
Objectives Maintain high resident ratings or excellent or good on overall quality of Police Department services 94% 92% 95% All Police Divisions Maintain high resident ratings of excellent or good on overall quality of contact with Eden Prairie police 92% 92% 95% All Police Divisions
Services
72
Fire Description of Operations
The Fire Department mission is to minimize risk, increase safety and improve the quality of life through education, code compliance and emergency response The department focuses on a continual cycle of planning, mitigation, and response and recovery activities to ensure a high level of readiness for events impacting the community.
Established in 1967, the department operates four fire stations with a staff of 10 full-time fire employees, 9 full-time building inspections employees, 99 paid on-call firefighters, and several Community Emergency Response Team volunteers. The department areas include Building Inspections, Fire (including Prevention/Inspection, Suppression and Emergency Response), Emergency Management and Public Safety Communications.
• Building Inspections is primarily responsible for code compliance. This division ensures buildings are constructed safely in accordance with state and local building and fire codes Activities include plan review, on-site inspections, occupancy approvals, permit issuance and fee collection.
• Fire includes fire and life safety business inspections, rental housing licensing and inspection, hazmat facility permitting and inspection, fire investigations, public education activities, responding to emergencies including medical emergencies, structure fires, hazardous material incidents, rope/trench/confined space rescue, vehicle extrication, structural collapse, ice/water and search/rescue incidents.
• Public Safety Communications manages the overall strategy for Citywide radio infrastructure, subscriber units, security cameras and card access for facility security.

• Emergency Management includes the coordination of the overall mitigation, preparedness, response and recovery for the City This includes management and support of the emergency operations plan, emergency operation center (EOC) and various training and exercises.
The Eden Prairie Fire Department offers a range of community outreach programs and public services each year. Programs include Night to Unite, public safety open houses, station tours, pop-up splash pad events, business safety training and community EMT These programs give the public a chance to learn more about the department and its firefighters.
The Home Safety Audit Program is a free service provided by the Fire Department for Eden Prairie residents. Trained volunteers from the Community Emergency Response Team visit homes and provide advice and suggestions to improve the home’s overall safety Safety topics include barbecue grills, candles, carbon monoxide, fire and burn prevention, fireworks and smoke alarms.
Budgeted Positions
•
Fire 2020 Actual 2021 Budget 2022 Budget 2023 Budget Administration 9.0 9.0 10.0 11.0 Building Inspections 9.0 9.0 9.0 9.0 Total FTEs 18.0 18.0 19.0 20.0 73
Financial Information


% OF FIRE BUDGET
Personnel Services are increasing $160,431 or 3.9% for 2022 due to an additional 1.0 FTE for an Assistant Fire Chief An increase of $205,817 or 4.8% is expected for 2023 due to an additional 1.0 FTE for an Administrative Assistant as well as base salary and step increases.
Supplies are increasing $17,330 or 6.2% for 2022 due to City AED battery and pad replacement, postage for inspection notices, and equipment repair costs on aging apparatus and extrication equipment. An increase of 2.2% is included for 2023.
Contractual Services are increasing $2,025 or 0.4% for 2022. An increase of $18,090 or 3.1% is projected for 2023 due to replacement of the outdoor warning siren and health surveillance evaluations for all firefighters.
User Charges are increasing $34,333 or 2.4% for 2022 and $42,142 or 2.8% for 2023. The support of additional devices ( iPads and laptops) was added to the Information Technology user charge resulting in increased expenses to Fire In addition, the Facilities user charge is increasing due to cleaning of the fire stations.
Capital under $25,000 is increasing $18,000 for 2022 due to the addition of new computers for building inspectors. The decrease noted in 2023 is a result of the computers being removed from the 2023 budget
Public Safety Communications Fire 77% Building Inspections 21% 2% 2020 2021 2022 Increase / 2023 Increase / Category Actual Budget Budget Decrease Budget Decrease Personnel Services $ 3,945,136 $ 4,138,863 $ 4,299,294 $ 160,431 $ 4,505,111 $ 205,817 Supplies Contractual Services 541,496 463,340 277,920 575,693 295,250 577,718 17,330 2,025 301,650 595,808 6,400 18,090 User Charges 1,401,597 1,451,207 1,485,540 34,333 1,527,682 42,142 Capital under $25,000 26,769 34,000 52,000 18,000 35,000 (17,000) Total $ 6,378,338 $ 6,477,683 $ 6,709,802 $ 232,119 $ 6,965,251 $ 255,449 Percent Change 3.6% 3.8%
74
Goals, Objectives and Measures
Fire Goals, Objectives and Measures 2018 Actual 2020 Actual 2022 Target Division Goal — Community Well-Being and Safety Objectives Maintain high resident ratings of excellent or good on quality of emergency response time 96% 98% 99% Fire Public Safety Communications Partner with businesses and organizations to provide health and wellness training such as CPR and AED Yes Yes Yes Fire Maintain high resident ratings of excellent or good on quality of Fire Department services 98% 98% 99% All Fire Divisions Partner with all City departments to provide an effective All-Hazard Emergency Management System n/a n/a Yes Fire Emergency Management Maintain the property value saved from fire index with continued quick response times, improved fire education efforts and increased fire suppression systems 92% 97% 97% All Fire Divisions Goal — High-Quality Efficient
Objectives Implement electronic plan review n/a n/a Yes Building Inspections Increase number of electronic building permits issued to improve efficiency of the permit process for contractors 58% 68% 70% Building Inspections Implement Mobile Eyes software for the fire inspections area n/a n/a Yes Fire Maintain high quality training for all fire department personnel Yes Yes Yes All Fire Divisions Maintain high resident ratings of excellent or good on quality of building inspections 85% 85% 90% Building Inspections Goal — Sense of Community Objectives Host Citywide fire open house Yes n/a Yes Fire Continue fireside chats at Eden Prairie Senior Center and appoint a liaison Yes Yes Yes Fire Continue development of Safety Camp for 3rdgraders Yes Yes Yes Fire Expand pop-up splash pad community events in spring and summer Yes Yes Yes Fire Develop diverse firefighter recruit pool by communicating with school district about EMT/firefighter opportunities n/a n/a Yes Fire 75
Services
Public Works
Description of Operations
The Public Works Department constructs and maintains the City’s public infrastructure. It is comprised of Engineering, Fleet Services, Streets Maintenance and Utilities Fleet Services expenses are discussed in the Internal Service Fund section of this document, and Utilities expenses are included in the Enterprise Fund section All other operations are addressed within the General Fund.
• Engineering oversees the construction of major public infrastructure projects, private development road and utility installations, and is responsible for protecting many of the City’s natural resources. In addition, the Engineering Division manages the City’s Sustainable Eden Prairie initiative This program focuses on education and implementation of sustainable practices in energy, landscape, waste and water to protect the environment.
• Streets maintains the City’s roadway network of over 230 miles including right-of -way maintenance and repair of street signs and traffic control systems, as well as street lighting maintenance. Activities include asphalt overlay, seal coats, street sweeping, snow/ice control and roadside mowing
Budgeted Positions
Public Works 2020 Actual 2021 Budget 2022 Budget 2023 Budget Engineering 7.5 7.5 7.5 7.5 Street Maintenance 15.0 15.0 15.0 15.0 Total FTEs 22.5 22.5 22.5 22.5 76
% OF PUBLIC WORKS BUDGET


Personnel Services are increasing $45,722 or 1.6% for 2022 and $115,036 or 4% for 2023 A part-time position in the sustainability program for 2022 was moved to the Water Treatment Plant Increases in 2023 are the result of expected wage adjustments.
Supplies are increasing $22,640 or 4.5% for 2022 primarily due to rising costs of salt and de-icing liquids. Supplies are projected to remain flat for 2023
Contractual Services are increasing $73,120 or 4.2% for 2022 because of the City drop-off day recycling event and the addition of an electric vehicle charger pilot rebate cost share with Xcel Energy This category is projected to increase $47,410 or 2.6% for 2023 due to expected increases in street lighting
User Charges are increasing $43,350 or 3.1% for 2022 and $38,979 or 2.7% for 2023 because of the Fleet charge Fleet Services’ share of parts, labor and fuel has increased in the Streets Division.
Capital under $25,000 is decreasing $12,000 or 27.7% for 2022. For 2023, these expenditures are increasing $11,650 or 37.2% due to the purchase of a hydro seeder.
Financial Information
Engineering 20% Street Maintenance Street Lighting 14% 66% Category Personnel Services Supplies Contractual Services User Charges Capital under $25,000 Total $ $ 2020 Actual 2,635,489 456,807 1,487,140 1,354,328 57,986 5,991,750 $ $ 2021 Budget 2,838,280 507,210 1,752,330 1,395,289 43,350 6,536,459 $ $ 2022 Budget 2,884,002 529,850 1,825,450 1,438,639 31,350 6,709,291 Increase / Decrease $ 45,722 $ 22,640 73,120 43,350 (12,000) $ 172,832 $ 2023 Budget 2,999,038 529,850 1,872,860 1,477,618 43,000 6,922,366 Increase / Decrease $ 115,03647,410 38,979 11,650 $ 213,075 Percent Change 2.6% 3.2%
77
Goals, Objectives and Measures
Goal — Community Well-Being and Safety
Objectives
Provide and maintain a safe transportation system by keeping roadways clear of snow/ice, performing annual bridge inspections and completing roadway improvements in the CIP
Goal — High-Quality Efficient Services
Objectives
Provide a high-quality, efficient transportation system by implementing new roadway rehabilitation treatments and maintaining a pavement condition index rating of 70 or higher (very good or better)
Goal — Innovative and Sustainable Practices
Objectives
Continue residential energy conservation program participation (programs include Saver’s Switch, smart thermostat, home energy audits, efficient home construction)
Provide means for residents to reduce, reuse and recycle solid waste streams by promoting curbside organics collection, managing the City Yard Waste Site, and planning and hosting the annual Drop-Off Day
Public Works Goals, Objectives and Measures 2018 Actual 2020 Actual 2022 Target Division
Yes Yes Engineering Streets
Yes Yes Yes Engineering Streets
Yes
Inspect, repair and maintain critical storm drainage infrastructure
75 86 >70 Engineering Streets
resident ratings of excellent or good on overall quality of City streets 87% 87% 90% Engineering Streets Improve resident ratings of
good
snow removal 85% 83% 90% Streets
Maintain
excellent or
on quality of
2,837 1,911 2,500 Engineering Increase the number of renewable energy subscribers 953 1,442 1,500 Engineering Increase residential renewable electric kilowatt-hour production through expanded use of energy conservation programs 3,384M kWh 4,182M kWh 4,200M kWh Engineering
Yes Yes Engineering 78
Yes
INTERNAL SERVICE FUND SUMMARY

Internal Service Fund Department Summary
Description of Operations
Internal Service Fund expenses are charged to City departments on a cost-reimbursement basis. This provides a predictable expense stream for those departments and avoids monthly expense fluctuations
Employee Benefits, Facilities, Information Technology and Property Insurance are Administration Department functions. Fleet Services is part of the Public Works Department
• Employee Benefits includes medical, dental, disability, payroll taxes, public employee retirement (PERA), severance pay and workers’ compensation insurance The City pays public employee PERA benefits for all eligible employees.
• Facilities is responsible for building-related operations, remodeling, and preventive and long-term maintenance of City -owned facilities These buildings include the City Center, Community Center, Senior Center, Art Center, Outdoor Center, Water Treatment Plant, Maintenance Facility, four fire stations, three liquor stores, 12 park shelters, five historical buildings and the Housing and Community Services office at Eden Prairie Center
• Information Technology provides strategic technology direction and manages IT governance processes. Network wellness, application development, computer and phone systems, and technology analysis are coordinated and managed by the division
• Property Insurance includes the cost to insure City-owned buildings and property including fleet vehicles, as well as property and casualty claims
• Fleet Services provides and maintains a safe, reliable and efficient fleet of nearly 300 vehicles and equipment. Included in the fleet are police and fire vehicles, snowplows and dump trucks
Budgeted Positions Department 2020 Actual 2021 Budget 2022 Budget 2023 Budget Administration Information Technology 6.0 6 5 6.5 6.5 Facilities 10.0 10.0 10.0 10.0 Public Works Fleet Services 5.0 5.0 5.0 5.0 Total FTEs 21.0 21.5 21.5 21.5 80
% OF INTERNAL SERVICE FUND BUDGET


Services are increasing
or 6.9% for 2022 and
or 5.3% for 2023. More than 75% of the 2022 increase is related to employee health insurance premiums
are increasing $14,651 or 1% for 2022 and $25,990 or 1.7% for 2023.
Contractual Services are increasing 5% or $367,289 for 2022 and 3.5% or $273,607 for 2023. Additions to the budget include software maintenance for police body cameras, a drone and an electronic ticket writer. Property insurance premiums are budgeted to increase $32,949 or 4.7% in 2022 and $62,522 or 8.6% in 2023 Workers’ compensation insurance premiums are budgeted to increase $209,090 or 33.57% for 2022 and $33,739 or 4.1% for 2023.
User Charges include property insurance premiums for the City Center building. These costs are reimbursed by tenants who lease space at City Center.
Capital under $25,000 is expected to increase to $32,497 or 10.4% for 2022 and decrease $18,900 or 5.5% for 2023. The increase in 2022 relates to new software for the Police Department that allows alarm companies to enter alarm calls without the need for a phone call to dispatch.
Deprecation is projected to increase for 2022 and 2023 due to anticipated fleet vehicle purchases.
Financial Information
Property Insurance 38% Information Technology 14% 2020 2021 2022 Increase / 2023 Increase / Category Actual Budget Budget Decrease Budget Decrease Benefits Facilities Fleet Services 15% 4% 29% Personnel Services $ 8,906,096 $ 9,172,543 $ 9,808,530 $ 635,987 $ 10,326,916 $ 518,386 Supplies 1,182,930 1,499,627 1,514,278 14,651 1,540,268 25,990 Contractual Services 6,467,847 7,356,766 7,724,055 367,289 7,997,662 273,607 User Charges 17,420 18,158 21,606 3,448 23,427 1,821 Capital under $25,000 534,370 313,703 346,200 32,497 327,300 (18,900) Depreciation 1,083,905 1,342,520 1,385,440 42,920 1,485,339 99,899 Total $ 18,192,568 $ 19,703,317 $ 20,800,109 $ 1,096,792 $ 21,700,912 $ 900,803 Percent Change 5.6% 4.3% Personnel
$635,987
$518,386
Supplies
81
Goals, Objectives and Measures
Goal — Community Well-Being and Safety
Objectives
Improve safety of online transactions by ensuring staff use Payment Card Industry (PCI) standard applications, hardware and processes, update PCI policies, and require annual training for all credit card users
Provide and maintain a safe vehicle fleet by performing annual Department of Transportation safety inspections and ensuring operators are trained in daily safety inspection procedures
Goal — High-Quality Efficient Services
Objectives
Internal Service Fund Goals, Objectives and Measures 2018 Actual 2020 Actual 2022 Target Division
Yes Yes Yes Information Technology
Yes Yes Yes Fleet Services
Yes Yes Yes Facilities Maintain high
95% 93% 95% Facilities Upgrade technology to
Agreement, replacing workstations
cycle and
network core Yes Yes Yes Information Technology Enhance fiber network by
school district switch for 5 City locations n/a n/a Yes Information Technology
Objectives Investigate future solar possibilities on City building roofs n/a Yes Yes Facilities Identify lighting and mechanical replacements, and investigate new technologies n/a Yes Yes Facilities Research and implement sustainable options for fleet replacements where appropriate and costeffective n/a Yes Yes Fleet Services 82
Ensure City facilities are attractive and safe by performing annual building envelope restoration and replacing aging HVAC infrastructure with efficient technology
resident ratings of excellent or good on overall appearance of Eden Prairie
improve functionality, storage and security by updating the Microsoft Enterprise
on a 5-year
replacing
removing reliance on
Goal — Innovative and Sustainable Practices
ENTERPRISE FUND
DEPARTMENT SUMMARIES

.= ' EXIT n
Enterprise Fund Department Summaries
Utilities
Description of Operations
Utilities operates and maintains the water, wastewater and stormwater systems
• Water is drawn from the Prairie Du Chien and Jordan aquifers through 15 raw water wells located in the City. Raw water is pumped to the City’s Water Treatment Plant for purification and treated water is distributed to customers through a vast network of water mains, valves and storage reservoirs. The Utilities Division is responsible for water sampling and inspections, water wells, water storage, water meter installation, meter reading and repair, and water distribution system maintenance.
• The Utilities Division is responsible for the safe collection and removal of sanitary waste. Wastewater is collected through a system of mains and lift stations connected to the Metropolitan Council Environmental Services wastewater interceptors. Raw sewage is transported to the Blue Lake Wastewater Treatment Facility in Shakopee where it is treated and discharged into the Minnesota River. Wastewater operators perform regular maintenance to prevent sewer backups including jetting mains to remove buildup and debris, lift station pump maintenance and collection system maintenance.
• Utilities manages projects to control flooding caused by water runoff, and protects and improves the water quality of wetlands, creeks and lakes. Eden Prairie is home to diverse water resources, including 17 lakes, 513 wetlands, 177 stormwater ponds and three creek systems. The stormwater system is comprised of channels, ponds, lakes, streams, pipes, curb, gutter and catch basins.
Budgeted Positions
Utilities 2020 Actual 2021 Budget 2022 Budget 2023 Budget Water Treatment Plant 13.0 13.0 13.0 13.0 Utility Field and Maintenance 17.0 17.0 17.0 17.0 Customer Service and Engineering 7.75 7.75 7.75 7.75 Utility Management 1.75 1.75 1.75 1.75 Total FTEs 39.5 39.5 39.5 39.5 84
Financial Information
% OF UTILITIES BUDGET


Services are increasing $298,743 or 6.4% for 2022 and $196,184 or 4% for 2023. These increases are due to wage adjustments as well as employee benefit increases.
Supplies are decreasing $6,519 or 0.5% for 2022 and increasing $6,000 or 0.5% for 2023 Most of the supply expense budget relates to chemical treatment.
Contractual Services are decreasing $210,703 or 2.7% for 2022 and increasing $313,815 or 4.1% for 2023. The majority of the 2022 decrease is due to a reduction in the Metropolitan Council Environmental Services (MCES) wastewater user fee An expected increase of 4% is budgeted for this fee in 2023.
User Charges are increasing $217,456 or 29.9% for 2022 and $37,487 or 4% for 2023. Fleet Services is funding the purchase of utility vehicles beginning in 2022 and transferring the cost through a user charge. Capital under $25,000 is decreasing $367,321 or 75.9% for 2022 to better align with actual expenses.
Water 49% Wastewater 36% Stormwater 15% 2020 2021 2022 Increase / 2023 Increase / Category Actual Budget Budget Decrease Budget Decrease Operating Personnel Services $ 4,216,770 $ 4,66 3,522 $ 4,962,265 $ 298,743 $ 5,158,449 $ 196,184 Supplies 1,197,169 1,272,419 1,265,900 (6,519) 1,271,900 6,000 Contractual Services 6,708,972 7,801,420 7,590,717 (210,703) 7,904,532 313,815 User Charges 701,126 727,649 945,105 217,456 982,592 37,487 Capital under $25,000 264,079 483,881 116,560 (367,321) 116,060 (500) $ 13,088,116 $ 14,948,891 $ 14,880,547 $ (68,344) $ 15,433,533 $ 552,986 Non Operating Capital Outlay $ 533,336 $ 330,000 $ 352,000 $ 22,000 $ 432,500 $ 80,500 Depreciation 5,740,286 5,892,603 5,723,733 (168,870) 5,194,178 (529,555) Non-Operating Expenses 151,543 36,292 187,231 150,939 200,311 13,080 Transfer Out 451,468 423,227 442,024 18,797 463,662 21,638 $ 6,876,633 $ 6,682,122 $ 6,704,988 $ 22,866 $ 6,290,651 $ (414,337) Total Expenses $ 19,964,749 $ 21,631,013 $ 21,585,535 $ (45,478) $ 21,724,184 $ 138,649 Percent Change (0.2%) 0.6% Personnel
85
Goals, Objectives and Measures
Maintain a water loss percentage below 10% as recommended by the American Water Works Association through a strong water metering management program, reduction of unmetered water use and system leak detection
Utilities Goals, Objectives and Measures 2018 Actual 2020 Actual 2022 Target Division Goal — Community Well-Being and Safety Objectives
Treatment
and
Yes Yes Yes Water Protect public health by providing safe collection and removal of wastewater, perform system maintenance and reduce sources of inflow and infiltration Yes Yes Yes Wastewater Refine stormwater modeling to identify critical impact areas to improve storm drainage and natural waterway system n/a Yes Yes Stormwater Goal — High-Quality Efficient Services Objectives Maintain the resident ratings of excellent or good on quality of utility billing 85% 83% 90% Water Maintain the resident ratings of excellent or good on quality of City drinking water 83% 84% 85% Water Goal — Innovative and
Provide and deliver a safe supply of water to customers by ensuring security of Water
Plant, wells
storage sites, and ensuring processes meet state and federal water quality standards
Sustainable Practices Objectives
7.6% 7.8% <8% Water Maintain or reduce annual amount of raw water pumped to the treatment plant for purification and distribution to customers 2.58 2.54 <3.45 Water Through conservation efforts, residential water use per day per capita will be equal to or less than 75 gallons. 75 73 75 Water 86
Liquor
Description of Operations
The City operates three municipal liquor stores located at Prairie Village Mall, Prairie View Mall and Den Road Eden Prairie has the fourth largest municipal off-sale operation in the State The Finance Division oversees Eden Prairie Liquor operations.
Municipal liquor stores have been in operation since the United States government repealed prohibition in 1933, giving individual states the responsibility and authority to regulate liquor sales. At that time, the Minnesota legislature gave cities the option of issuing liquor licenses to private businesses or providing municipal alcohol dispensing services.
Eden Prairie, along with more than 300 other cities, chose to operate municipal liquor stores. This choice not only allows for greater control over liquor being sold and consumed in the City, but also further diversifies City revenue sources.
Historically, the City's three Eden Prairie Liquor locations have generated between $700,000 and $1-million in profit annually. Profits are transferred to the City’s Capital Improvement Plan (CIP) fund. Some examples of CIP projects include improvements to playground equipment and parking lots at several City parks as well as trail maintenance throughout the community.
This budget cycle, the City is expecting a profit of $835,344 and $881,039 from liquor operations for 2022 and 2023.
Budgeted Positions
Liquor 2020 Actual 2021 Budget 2022 Budget 2023 Budget Operations Manager 1.0 1.0 1.0 1.0 Purchasing Manager 1.0 1.0 1.0 1.0 Store Managers, Asst Mgrs, Leads 7.0 7.0 7.0 7.0 Total FTEs 9.0 9.0 9.0 9.0 87
% OF LIQUOR BUDGET
or


for 2022 and
or $60,376 for 2023. The increase is due to changes in base salaries and part-time wages. Supplies are increasing modestly in 2022 and 2023.
Services are increasing $66,780 or 7.5% for 2022 and $25,901 or 2.7% for 2023. Most of the increase in 2022 is due to bank service charges related to credit card fees since online ordering was implemented.
User Charges are decreasing $6,843 or 4% for 2022 due to reduced property insurance premiums for liquor store buildings and increasing $6,742 or 4.1% for 2023 due to inflationary increases in the facilities user charge Capital under $25,000 is slightly lower for 2022 and modestly increasing for 2023 Liquor assets were fully depreciated in 2020 resulting in $0 budgeted in future years.
Financial Information
Prairie Village 26% Den Road Prairie View 29% 45% 2020 2021 2022 Increase / 2023 Increase / Category Actual Budget Budget Decrease Budget Decrease Cost of Sales $ 8,299,999 $ 8,559,663 $ 8,680,373 $ 120,710 $ 9,007,388 $ 327,015 Personnel Services 1,107,572 1,275,197 1,344,106 68,909 1,404,482 60,376 Supplies 30,136 44,076 44,230 154 44,736 506 Contractual Services 863,628 895,010 961,790 66,780 987,691 25,901 User Charges 165,200 173,046 166,203 (6,843) 172,945 6,742 Capital under $25,000 1,927 8,300 6,900 (1,400) 7,900 1,000 Depreciation 35,264 - - - -Total $ 10,503,726 $ 10,955,292 $ 11,203,602 $ 248,310 $ 11,625,142 $ 421,540 Percent Change 2.3% 3.8% Cost of Sales is increasing $120,710 or 1.4% for 2022. A 3.8% or $327,015
for 2023. Personnel
5.4%
increase is projected
Services are increasing
$68,909
4.5%
Contractual
88
Goals, Objectives and Measures
Liquor Goals, Objectives and Measures 2018 Actual 2020 Actual* 2022 Target Goals — Economic Vitality, High-Quality Efficient Services Objectives Maintain average sale per transaction $23 96 $29.11 $30.75 Increase number of annual customer visits 440,793 393,733 405,000 Improve operations by launching the delivery program n/a n/a Yes Maintain courtesy and friendliness of staff as measured by the biennial Quality of Life Survey 94% 96% 96% Maintain resident ratings of excellent or good on quality of product selection 87% 89% 90% Improve customer loyalty by reviewing promotional and pricing strategy Increased Traffic Increased Traffic Increased Traffic *Measures affected by the coronavirus pandemic 89
H EDEN PRAl~I~
SUPPLEMENTAL INFORMATION
Supplemental Information
History
For most of its existence, Eden Prairie was a sleepy, pastoral village on the far southwestern fringes of the Twin Cities area. Between 1880 and 1960, Eden Prairie’s population barely changed. During those 80 years, the population increase was only 1,300 people from 739 in 1880 to 2,000 in 1960. By 2000, the population swelled to almost 60,000, a 3,000% increase. It changed from a predominantly agricultural rural area to a thriving, business-rich community that is a highly desirable place to live and work.
The City owes its name to Elizabeth Fries Ellet, an East Coast writer who visited the area and proclaimed it the garden spot of the territory. Native Americans were the first to live in the area. In 1851, a treaty opened land west of the Mississippi River to settlement, allowing pioneers to settle in what is now Eden Prairie.

The town board of Eden Prairie held its first meeting in a log schoolhouse May 11, 1858, the same day Minnesota became a state. In 1929, the first graduating class left the Eden Prairie Consolidated School. Today that building serves as the main office for Eden Prairie School District 272.
Eden Prairie’s farming community grew slowly over the years. Flying Cloud Airport was the first sign of big development in 1946. The 1960s and 1970s were decades of growth for the City’s parks and recreation system. In the mid-1970s, the community earned a higher profile with the addition of Interstate 494 and the Eden Prairie Center mall. Today, Eden Prairie is home to more than 2,300 businesses, nearly 25,000 households and over 63,000 residents. It is 36 square miles and 22,594 acres. The Minnesota River forms the southern border, and the City is home to 17 lakes, three creeks, 100 miles of multi-use trails, 1,000 park acres and 1,400 acres of preserved open space.
91


I I 1 I I I I I I I l I i I I I ' I I I
Taxpayers $3,250 $250 $750 $1,250 $1,750 $2,250 $2,750 Thousands
Top-10
Employers
Source: City of Eden Prairie Assessing, 2020 Top-10
Water Revenue
250 750 1250 1750 2250 2750 3250 3750 Optum Eden Prairie Mall EP Schools CH Robinson United Natural Foods Inc Starkey Labs Emerson Process Management Tennant Co Element Fleet Management MTS Systems # of Employees 92
Source: Official Bonds Statement for G.O.
Bonds, Series 2021A
Population and Unemployment Rate
Source: Met Council, Minnesota Local Area Unemployment Statistics File and Minnesota Department of Employment and Economic Development

Year Population Unemployment Rate 2011 61,151 5.2% 2012 62,004 4.6% 2013 62,004 4.0% 2014 62,729 2.4% 2015 62,593 2.3% 2016 63,187 2.9% 2017 63,163 2.4% 2018 63,726 2.6% 2019 63,456 2.3% 2020 63,726 3.4%
93
City Statistics

2016 2017 2018 2019 2020 General Government Bond Rating - Moody's Investor Service Aaa Aaa Aaa Aaa Aaa Bond Rating - Standard & Poors AAA AAA AAA AAA AAA Housing and Human Services Number of Residents Served 3,500 3,750 3,975 5,700 9,200 Assessing: Number of Appraisals Completed 5,066 5,061 4,908 4,912 5,267 Parks and Recreation Avg Monthly Community Center Memberships 2,511 2,688 2,608 2,486 1,683 Program Registrations (Excludes Leagues) 15,701 17,161 17,972 19,931 6,022 Public Safety Fire Number of Calls 1,615 1,742 1,908 1,875 2,915 Inspection Permits Issued 5,997 6,227 6,436 6,438 7,766 Building permit revenue $2,303,405 $2,066,787 $3,388,529 $3,646,332 $3,578,799 Police Number of Calls 50,741 46,319 52,278 50,909 40,564 Public Works: Patching Materials (Tons) 2,370 1,650 1,700 1,976 1,739 Overlays (Tons) 23,070 28,856 29,852 31,503 35,988 Crack Filling Materials (Lbs) 68,000 42,000 31,920 50,007 66,175 Seal Coating (Sq Yards) - Chips Sealed Placed 381,600 405,425 365,907 327,998 364,854 Seal Coating (Sq Yards) - Fog Seal/Reclamite Placed n/a n/a n/a 276,296 470,020 Water System: Number of Connections 19,362 19,426 19,426 19,426 19,541 Water Main Repairs 53 30 18 24 33 Number of Hydrant Flushed 4,515 4,360 4,395 4,274Average Daily Usage 7.07 MGD 7.06 MGD 7.08 MG 6.25 MG 6.95 MG Sewer System: Number of Connections 18,707 18,865 18,925 18,955 19,016 Miles of Sanitary Sewer Cleaned 81 76 65 50 10 Storm System: Number of Storm Sumps Maintained 91 88 97 48 40 Sources: Various City Departments MGD - Million Gallons Daily N/A - Not Available 94
GLOSSARY

Glossary
Accrual Basis of Accounting — The method of accounting under which revenues are recorded when they are earned (whether or not cash is received at that time), and expenditures are recorded when goods and services are received (whether cash disbursements are made at that time or not).
ACFR — Annual Comprehensive Financial Report
Adopted Budget — The financial plan of revenues and expenditures for a fiscal year as adopted by the City Council.
Appropriation — An authorization made by the legislative body of a government which permits officials to incur obligations against and to make expenditures of governmental resources Appropriations are usually made for fixed amounts and are typically granted for a one-year period.
Assessed Valuation — A value established by the City Property Appraiser for all real or personal property for use as a basis for levying property taxes.
Assets — Property owned by a government with monetary value.
Balanced Budget — When expenditures are offset by an equal amount of revenue in the General Fund
Bond — A written promise to pay (debt) a specified sum of money (called principal or face value) at a specified future date (called the maturity date(s) along with periodic interest paid at a specified percentage of the principal (interest rate) Bonds are typically used for long-term debt.
Budget — The financial plan for the operation of a program or organization which includes an estimate of proposed expenditures for a given period and the proposed means of financing those expenditures.
Budget Calendar — The schedule of key dates involved in the process of adopting and executing an adopted budget.
Budget Document — The official written document prepared by the Finance Division which describes the adopted financial plan.
Budget Message — A general discussion of the budget presented in writing as a part of the budget document The budget message explains principal budget issues against the background of financial experience in recent years.
Capital Assets — Assets of significant value and having a useful life of several years Capital assets are also called fixed assets.
Capital Budget — A plan of proposed capital expenditures and the means for financing them The capital budget is usually enacted as part of the complete annual budget which, includes both operating and capital outlays.
Capital Improvement Plan (CIP) — A plan for capital expenditures to be incurred each year over a fixed period of several future years setting forth each capital project, identifying the expected beginning and ending date for each project, the amount to be expended in each year and the method of financing those expenditures.
Capital Outlay — Expenditures for the acquisition of capital assets.
Capital Project Fund — Capital project funds are used to account for all financial resources that are restricted, committed or assigned to expenditures for capital outlay, other than those financed by proprietary funds.
CDBG — Community Development Block Grant
96
CIP — Capital improvement Plan
City Council — The elected body of members making up the legislative arm of local government in Eden Prairie.
Contingency — A budgetary reserve set aside for emergencies or unforeseen expenditures not otherwise budgeted for.
Debt Service — Payment of interest and repayment of principal to holders of a government’s debt instruments.
Debt Service Fund — Debt service funds account for all financial resources that are restricted, committed or assigned to expenditures for principal and interest.
Deficit — (1) The excess of an entity's liabilities over its assets (See Fund Balance); (2) the excess of expenditures or expenses over revenues during a single accounting period.
Depreciation — (1) Expiration in the service life of capital assets attributable to wear and tear, deterioration, action of the physical elements, inadequacy or obsolescence; (2) that portion of the cost of a capital asset which is charged as an expense during a particular period.
Enterprise Funds — Funds maintained on the accrual basis Revenues are recognized in the accounting period in which they are earned, and expenses are recognized in the period in which the liability is incurred.
Estimated Market Value — Represents the selling price of a property if it were on the market. Estimated market value is converted to tax capacity before property taxes are levied
Expenditures — Where accounts are kept on the accrual or modified accrual basis of accounting, the cost of goods received, or services rendered whether cash payments have been made or not.
Fiscal Disparities — The program created by the Metropolitan Fiscal Disparities Act which shares growth in the commercial-industrial tax base in the seven-county metropolitan area. Forty percent of the value of new commercialindustrial development since 1971 is pooled and redistributed among approximately 300 taxing districts to address disproportionate business development throughout the region.
Fiscal Year — A 12-month period to which an annual operating budget applies The Eden Prairie fiscal year is from Jan. 1 to Dec 31
Franchise Fee — The right or license granted to an individual or group to market a company’s goods or services in a particular territory.
FTE (Full-Time Equivalent) — Represents one employee working full time.
Fund — An independent fiscal and accounting entity with a self-balancing set of accounts recording cash and/or other resources together with all related liabilities, obligations, reserves and equities, which are segregated for the purpose of carrying on specific activities or attaining certain objectives.
Fund Balance — The excess of a fund’s assets over its liabilities
GAAP — Generally Accepted Accounting Principles
A negative fund balance is sometimes called a deficit.
GASB (Governmental Accounting Standards Board) — It is the highest source of accounting and financial reporting guidance for state and local governments.
97
General Fund — The General Fund is the City’s primary operating fund. It accounts for the proceeds of specific revenue sources that are restricted or committed to expenditures for specified purposes other than debt service and capital projects. It includes the basic activities for the City including Administration, Community Development, Parks and Recreation, Police, Fire and Public Works
General Obligation Bonds — When a government pledges its full faith and credit to the repayment of the bonds it issues, then those bonds are general obligation (GO) bonds Sometimes the term refers to bonds that are to be repaid from taxes and other general revenues.
GFOA (Government Financial Officers Association) — The professional association of state and local finance officers in the United States who are dedicated to the sound management of governmental financial resources. The association sets standards to the GFOA’s Certificate of Achievement for Excellence in Financial Reporting.
Governmental Funds — Funds maintained on a modified accrual basis with revenues recognized in the accounting period in which they become available and measurable Expenditures are recognized in the accounting period in which the fund liability is incurred.
Internal Service Fund — Internal Service Funds account for the financing of goods or services provided by one department or agency to other departments or agencies of the government on a cost-reimbursement basis
Levy — To impose taxes, special assessments or service charges, or the amount of those taxes, special assessments or charges.
L OGIS — Local Government Information Systems Association is a consortium of 44 Minnesota local government units that supports its members’ technology needs.
LRT — Light Rail Transit
Measures — A quantitative or qualitative tool to analyze progress, reprioritize goals and ensure success
Modified Accrual Basis — The basis of accounting under which expenditures other than accrued interest on general long-term debt are recorded at the time liabilities are incurred, and revenues are recorded when received in cash except for material and/or available revenues, which should be accrued to reflect properly the taxes levied and revenue earned.
Net Assets — The difference between program revenues and expenses.
Objectives — A statement outlining priorities that supports achieving a Citywide goal
Operating Budget — Financial plan for the fiscal year which authorizes proposed expenditures and the revenues to finance them
Pavement Management Program — A street overlay and construction program that provides for the systematic maintenance and replacement of City streets.
PERA — Minnesota Public Employee Retirement Association
Personnel Services — The costs related to employee services including wages and benefits
Proposed Budget — Budget as submitted by the City Manager to the City Council 98
Revenue — The term designates an increase to a fund's assets which does not increase a liability (e.g., proceeds from a loan), does not represent a repayment of an expenditure already made, does not represent a cancellation of certain liabilities and does not represent an increase in contributed capital
Special Assessment — A compulsory levy made against certain properties to defray a portion of, or all costs of a specific improvement or service deemed to primarily benefit those properties.
Tax Rate — Rates at which estimated market values are converted into the property tax base The classification rates are assigned to properties depending on their type (residential, commercial, farm, etc.) In some cases, there are two tiers of rates with the rate increasing as the estimated market value increases
Tax Levy — Property taxes certified to the County Auditor
99
