CITY OF EDEN PRAIRIE, MINNESOTA

For the Fiscal Year Ended December 31, 2023

ANNUAL
FINANCIAL REPORT
COMPREHENSIVE
This page is intentionally left blank
2
For The Fiscal Year Ended December 31, 2023
Rick Getschow, City Manager
Prepared by THE FINANCE DIVISION
Tammy Wilson, Chief Financial Officer
ANNUAL COMPREHENSIVE FINANCIAL
of the
REPORT
CITY OF EDEN PRAIRIE MINNESOTA
3
City of Eden Prairie, Minnesota
For the Year Ended December 31, 20 23 Table of Contents Page Introductory Section Letter of Transmittal ....................................................................................................................................................... 8 GFOA Certificate of Achievement ........................................................................................................................... 15 Organizational Chart .................................................................................................................................................... 16 List of Principal Officials ............................................................................................................................................. 17 Financial Section Independent Auditors’ Report ................................................................................................................................. 20 Management’s Discussion and Analysis .............................................................................................................. 24 Basic Financial Statements Government-wide Financial Statements Statement of Net Position ............................................................................................................................... 38 Statement of Activities ..................................................................................................................................... 40 Fund Financial Statements Balance Sheet-Governmental Funds .......................................................................................................... 44 Reconciliation of the Balance Sheet of Governmental Funds to the Statement of Net Position............................................................................................................. 45 Statement of Revenues, Expenditures and Changes in Fund Balances – Governmental Funds ................................................................................................ 46 Reconciliation of the Statement of Revenues, Expenditures and Changes in Fund Balances of Governmental Funds to the Statement of Activities.................................. 47 Statement of Revenues, Expenditures and Changes in Fund Balance – Budget and Actual – General Fund 49 Statement of Net Position – Proprietary Funds .................................................................................... 52 Statement of Revenues, Expenses and Changes in Net Position – Proprietary Funds ......... 53 Statement of Cash Flows – Proprietary Funds....................................................................................... 54 Statement of Fiduciary Net Position ......................................................................................................... 56 Statement of Changes in Fiduciary Net Position ................................................................................... 57 Notes to Financial Statements ............................................................................................................................ 60 Required Supplemental Information Modified Approach for Infrastructure Assets ......................................................................................... 104 Schedule of Changes in the City’s Total OBEB Liability and Related Ratios .............................. 105 Schedule of Proportionate Share of Net Pension Liability Public Employees General Employees Retirement Fund .................................................................. 106 Public Employees Police and Fire Fund .................................................................................................... 107 Eden Prairie Fire Relief .................................................................................................................................... 108 Schedule of Contributions Public Employees General Employees Retirement Fund .................................................................. 109 Public Employees Police and Fire Fund 110 Eden Prairie Fire Relief 111 4
City of Eden Prairie, Minnesota
For the Year Ended December 31, 20 23 Notes to Required Supplemental Information Notes to Schedule of Changes in Net Pension Liabilities and Related Ratios ........................... 112 Combining Fund Statements Combining Balance Sheet – Nonmajor Governmental Funds .......................................................... 127 Combining Statement of Revenues, Expenditures and Changes in Fund Balances – Nonmajor Governmental Funds ............................................................................. 136 Combining Statement of Net Position – Internal Service Funds 146 Combining Statement of Revenues, Expenses and Changes in Net Position – Internal Service Funds .................................................................................................... 148 Combining Statement of Cash Flows – Internal Service Funds ....................................................... 150 Combining Statement of Fiduciary Net Position 155 Combining Statement of Changes in Fiduciary Net Position 156 Statistical Section Government-wide Net Position by Category........................................................................................... 159 Changes in Net Position - Total ..................................................................................................................... 160 Changes in Net Position – Governmental Activities ............................................................................. 161 Changes in Net Position – Business-type Activities ............................................................................. 162 Fund Balances – Governmental Funds....................................................................................................... 163 Changes in Fund Balances – Governmental Funds ............................................................................... 164 Assessed/Tax Capacity Value and Estimated Market Value of Property.................................... 165 Direct and Overlapping Property Tax Rates............................................................................................ 166 Principal Property Taxpayers 167 Property Tax Levies and Collections .......................................................................................................... 168 Legal Debt Margin ............................................................................................................................................... 169 Ratios of Outstanding Debt by Type ........................................................................................................... 170 Ratios of General Bonded Debt Outstanding........................................................................................... 171 Computation of Direct and Overlapping Bonded Debt ....................................................................... 172 Demographic and Economic Statistics ....................................................................................................... 173 Principal Employers ........................................................................................................................................... 174 Employees by Function .................................................................................................................................... 175 Operating Indicators .......................................................................................................................................... 176 Capital Assets Statistics by Function .......................................................................................................... 177 5
This page is intentionally left blank
6

INTRODUCTORY SECTION
7
April 22, 2024
To the Honorable Mayor, Members of the City Council and the Citizens of the City of Eden Prairie:

The annual comprehensive financial report of the City of Eden Prairie, Minnesota, for the year ended December 31, 2023, is hereby submitted. The report was prepared in accordance with accounting principles generally accepted in the United States of America (GAAP) as established by the Governmental Accounting Standards Board and meets the requirements of the State Auditor’s Office.
The report consists of management’s representations concerning the finances of the City. Consequently, management assumes full responsibility for the completeness and reliability of all information presented within this report. To provide a reasonable basis for making these representations, management of the City has established internal controls designed to protect the City’s assets from loss, theft or misuse and to provide sufficient information for the preparation of these financial statements in conformity with GAAP. Because the cost of internal controls should not outweigh the benefits, the City’s internal controls have been designed to provide reasonable rather than absolute assurance that the financial statements will be free from material misstatements. As management, we assert that to the best of our knowledge and belief this financial report is complete and reliable in all material respects.
The City’s financial statements have been audited by BerganKDV, Ltd, Certified Public Accountants. The goal of the independent audit was to provide reasonable assurance that the financial statements of the City for the year ended December 31, 2023, are free of material misstatement. The independent audit involved examining, on a test basis, evidence supporting the amounts and disclosures in the financial statements, assessing the accounting principles used and significant estimates used by management; and evaluating the overall financial statement presentation. Based upon the audit, the independent auditor concluded that there was reasonable basis for rendering an unmodified opinion that the City’s financial statements, for the year ended December 31, 2023, are fairly presented in conformity with GAAP. The independent auditors’ report is present in the financial section of this report.
8
GAAP requires that management provide a narrative introduction, overview, and analysis to accompany the basic financial statements in the form of Management’s Discussion and Analysis (MD&A). This letter of transmittal is designed to complement the MD&A and should be read in conjunction with it. The City’s MD&A can be found in the financial section of this report immediately following the report of the independent auditors.
City Profile
Eden Prairie is a suburban community of 64,023 people located in the southwest corner of Hennepin County in a setting of rolling hills and picturesque lakes and creeks. Eden Prairie has a convenient location, a comprehensive system of highways, and is a short distance from downtown Minneapolis and St. Paul and the Minneapolis-St. Paul International Airport.
Incorporated in 1974 as a city, the City of Eden Prairie operates under a Statutory Plan B form of government. Policymaking and legislative authorities are vested in the governing council, which consists of a mayor and a four-member council. The governing council is responsible, among other things, for passing ordinances, adopting the budget, appointing committees and hiring the government's manager and attorney. The council is elected on a nonpartisan basis. The mayor and council members are elected to four-year staggered terms. The City Manager is responsible for carrying out the policies and ordinances of the governing council, for overseeing the day-to-day operations of the government, and to assign appropriate responsibility and authority to City staff for the efficient and effective delivery of City services.
With a staff of around 285 regular, full-time equivalent employees, the City provides its residents and businesses with a full range of municipal services consisting of police and fire protection, street maintenance, recreation programs, park maintenance, community and economic development, building inspections, and water, wastewater and storm water services.
The City is also financially accountable for the Housing and Redevelopment Authority (HRA), which is included in the City’s financial statements as a blended component unit. Additional information on the HRA is located in Note 1 in the notes to the financial statements.
The biennial budget serves as the foundation for the City’s financial planning and control. Departments submit budget requests to Finance in May and the City Manager presents the proposed budget to the City Council for review prior to September 30th of each year. A budget workshop is usually held with the City Council in June or July. The City Council holds a public meeting on the proposed budget and adopts the final budget in December each year. The City does not budget for governmental funds other than the General fund.
9
During the first year of the two-year budget process, both years’ budgets are developed and the City Council adopts the first year’s budget. During the second year of the two-year budget process, budget work is minimized. Staff updates the budget for any significant budget development,s and the council then reviews and adopts the second year budget.
The budget is prepared by department and division. The City’s directors and division managers may make transfers of appropriations within a division. Transfers of appropriations between departments require the approval of the City Manager. Any changes in the total budget must be approved by the City Council.
Economic Conditions and Outlook
Eden Prairie is a suburban community located in the southwest corner of the Minneapolis/St. Paul Metropolitan area. With the last update of the comprehensive plan and the trend towards condensed multi-family housing along the LRT corridor and other multi-family projects in other locations within the City, it is expected that Eden Prairie’s population will grow to 82,400 by 2040 an increase of 29% from 2023.
Below summarizes the City’s market value since 2015.
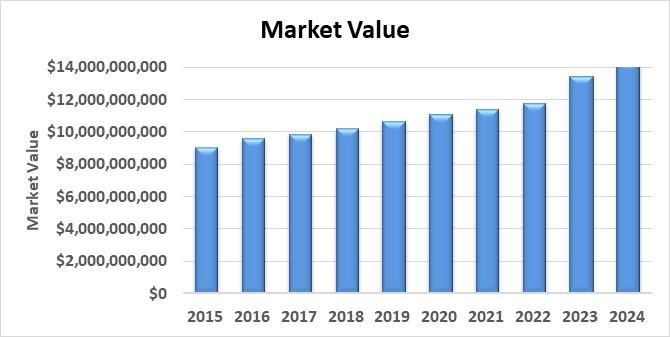
The City’s tax base increased from $11.8 billion to $13.4 billion from 2022 to 2023. In 2024, the market value increased to $14.3 billion. The real estate market has seen significant increases nationwide. Home prices have increased by the following approximate percentages: Nationally-20%, Statewide-15%, Twin Cities Suburbs-18%. Eden Prairie’s unemployment rate is 2.4%, which is less than the State rate of 2.8% and the Federal rate of 3.6%.
10
We had another strong year in licenses and permits, and Inspections issued permits with a value of $195,785,542. The largest project was The Golden Triangle Station apartment with a value of $39,512,670. The City also had 4 new commercial/industrial buildings versus 7 in 2022. The valuations of these new buildings ranged from $1,000,000 to $9,400,000.
Eden Prairie serves as the corporate headquarters location for many national and international businesses including United Health Group, CH Robinson World Wide, Tennant Company, Optum, Lifetouch/ShutterFly, Starkey Hearing, MTS Corporation, Arctic Wolf, and hundreds of other small and mid-size companies headquartered in multi-tenant office buildings located throughout the City.
Eden Prairie also has key locations for retailing including the City’s mall which has approximately 1.5 million square feet of shopping. The mall is part of the City’s “Major Center Area” or downtown. Stores include a 160,000 square foot Von Maur Department Store, Scheels, a Barnes and Noble Bookstore, an 18-screen AMC Movie Theater, and numerous restaurants.
Due to its strong and healthy local economy, Moody’s Investors Service has assigned a rating of Aaa to the City of Eden Prairie’s (MN) bond for every debt issue since 2003, the highest rating from Moody’s. Standard & Poor’s has also assigned a rating of AAA to the City of Eden Prairie’s bonds outstanding, their highest rating as well. This ensures the City receives the most competitive interest rates. The City’s bond ratings reflect Eden Prairie’s large, growing tax base, very healthy operating reserves, low direct debt burden, and strong financial management.
Long‐term Financial Planning
The City has implemented various financial policies to guide the Council and staff when making financial decisions. This helps to ensure the long-term stability and flexibility of City finances and operations. These policies include the following:
The original budget should be balanced with revenues equal to expenditures,
One-time revenues will be used for one-time expenditures,
The City will maintain fund balance for working capital in the general fund at 50% of the next year’s budgeted tax revenue,
The City will also maintain 10% of the next year’s budget in fund balance for budget stabilization and 5% of the next year’s budget for budget balancing in the general fund,
The City will confine long-term debt to capital improvements or projects that cannot be financed from current revenues, and
11
The City will maintain a ten-year capital improvement plan to provide for capital asset acquisition, maintenance, replacement, and retirement.
The City has consistently followed our financial policies.
Major Initiatives
Electrify Everything MN
The cities of Eden Prairie, Edina, and St. Louis Park are partnering on a residential electrification campaign in 2023 called Electrify Everything MN to meet our respective Climate Action Plan (CAP) goals around fuel switching. Eden Prairie’s CAP includes a goal that 17% of households have switched from being served by natural gas for space and water heating to electricity by 2030, 55% of households by 2040, and 97% of households by 2050. Actions identified to encourage fuel switching include:
Promoting building efficiency to reduce up-front costs of electrification
Explore incentives to promote fuel switching
Parks, Recreation, and Natural Resources Guide Plan Update
The Guide Plan development has been a process and a vehicle to engage residents, elected officials, and City staff in imagining and giving guidance to our future. Previous master/comprehensive park plans were created in 1965, 1989 and 2003. Also, in 2018, Parks and Recreation staff participated in the development of the City’s updated comprehensive plan, Aspire Eden Prairie 2040, which has components that serve as a foundation and data source for this Guide Plan update. The new Parks, Recreation, and Natural Resources Guide is intended to recognize and embrace past efforts, acknowledge changes, integrate programming efforts, and inform plans and efforts into the future.
Round Lake Park Building
The new Round Lake building was substantially completed and opened to the public in 2024. This state-of-the-art building features two meeting rooms, changing rooms and restrooms that are accessible from both inside and outside of the building. Energy conservation features include solar and geothermal energy, and a green roof. The building costs of $3M were paid with funds from the Park Improvement and Capital Maintenance Improvement funds.
Duck Lake Road Earns American Public works Association‐MN Structural Project of the Year
The Duck Lake Road Improvement Project transformed a key stretch of Duck Lake Road, resulting in a safer and more environmentally friendly corridor. Construction was largely
12
completed in fall 2022 and there was a ceremonial ribbon-cutting event in June 2023. The project included a fully reconstructed roadway from Duck Lake Trail to Mallard Court; a new bridge and fishing pier; enhanced stormwater management features; new paved trail; and concrete curb and gutter. The project was selected due to the many engineering challenges that were overcome in order to successfully rebuild the road and bridge.
Electrification of Vehicle Fleet
During the year, the City purchased its second electric Zamboni, two electric police vehicles, two electric utility vans, and an electric dump truck. The City also added additional EV charging stations for the Police department.
Paravel Apartments
The Paravel Apartments opened in August 2023. The five and seven story buildings include 246 units. Of the 246 units, 62 are affordable units per the City’s Inclusionary Housing policy.
Certificate of Achievement
The Government Finance Officers Association of the United States and Canada (GFOA) awarded a Certificate of Achievement for Excellence in Financial Reporting to the City of Eden Prairie for its Annual Comprehensive Financial Report for the fiscal year ended December 31, 2022.
The Certificate of Achievement is a prestigious national award-recognizing conformance with the highest standards for preparation of state and local government financial reports. In order to be awarded a Certificate of Achievement, a government unit must publish an easily readable and efficiently organized comprehensive annual financial report whose contents conform to program standards. Such comprehensive annual financial report must satisfy both generally accepted accounting principles and applicable legal requirements. A Certificate of Achievement is valid for a period of one year. The City of Eden Prairie has received a Certificate of Achievement every year since 1990. We believe our current report continues to conform to the Certificate of Achievement program requirements, and we are submitting it to GFOA.
In addition, the Government Finance Officers Association of the United States and Canada (GFOA) presented the Distinguished Budget Presentation award to the City of Eden Prairie for its Two Year Budget for the fiscal years beginning January 1, 2022 and 2023. In order to receive this award, a government unit must publish a budget document that meets program criteria as a policy document, as an operations guide, as a financial plan and a communications device. The award is valid for a period of two years only. The City of Eden
13
Prairie has received a Distinguished Budget Presentation award for every budget since 1998.
Also, the Government Finance Officers Association of the United States and Canada (GFOA) has given an Award for Outstanding Achievement in Popular Annual Financial Reporting to the City of Eden Prairie for its Popular Annual Financial Report for the fiscal year ended December 31, 2022. The Award for Outstanding Achievement in Popular Annual Financial Reporting is a national award recognizing conformance with the highest standards for preparation of state and local government financial reports. In order to receive an Award for Outstanding Achievement in Popular Annual Financial Reporting, a government unit must publish a Popular Annual Financial Report, whose contents conform to program standards of creativity, presentation, understandability, and reader appeal. An Award for Outstanding Achievement in Popular Annual Financial Reporting is valid for a period of one year only. The City of Eden Prairie has received the award annually since 1998. We believe our current report continues to conform to the Popular Annual Financial Reporting requirements, and we are submitting it to GFOA.
Acknowledgements
We would like to thank the Mayor and Council Members for their continued support in planning and conducting the financial operations of the City in a responsible and progressive manner. We would also like to express our appreciation to the employees of the Finance Division for their contribution to the preparation of this report.
Respectfully submitted,

 Rick Getschow Tammy Wilson City Manager Chief Financial Officer
14

City of Eden Prairie Minnesota
For its Annual Comprehensive Financial Report For the Fiscal Year Ended December 31, 2022
 Executive Director/CEO
Government Finance Officers Association
Certificate of Achievement for Excellence in Financial Reporting
Presented to
15
City of Eden Prairie, Minnesota
For the Year Ended December 31, 2023


City Council City Manager Administration Administrative Services City Clerk Facilities Human Resources & Support Services Information Technology Communications Finance & Liquor Operations Community Development Assessing Economic Development Housing & Community Services Planning Public Works Engineering Fleet Services Streets Maintenance Utilities Police Investigations Patrol Support Fire Building Inspections Fire Prevention Fire Suppresion Parks & Recreation Community Center Parks & Natural Resources Recreation Services 16
City of Eden Prairie, Minnesota
For the Year Ended December 31, 2023
Principal Officials
Elected Officials:
Mayor (Term expiration 12/31/26) Ron Case
Council Member (Term expiration 12/31/26) Mark Freiberg
Council Member (Term Expiration 12/31/24) PG Narayanan
Council Member (Term expiration 12/31/26) Kathy Nelson
Council Member (Term expiration 12/31/24) Lisa Toomey
Appointed Officials:
City Manager Rick Getschow
City Attorney Maggie Neuville
Departments:
Chief of Police Matt Sackett
Community Development Director Julie Klima Fire Chief Scott Gerber
Parks and Recreation Director Amy Markle
Public Works Director Robert Ellis
17
This page is intentionally left blank
18

FINANCIAL SECTION
19

Independent Auditor's Report
Honorable Mayor and Members of the City Council
City of Eden Prairie Eden Prairie, Minnesota
Report on the Audit of the Financial Statements
Opinions
We have audited the financial statements of the governmental activities, the business-type activities, each major fund, and the aggregate re maining fund information of the City of Eden Prairie, Minnesota, as of and for the year ended December 31, 2023, and the related notes to the basic financial statements, which collectively comprise City's basic financial statements as listed in the Table of Contents.
In our opinion, the accompanying financial statemen ts present fairly, in all material respects, the respective financial position of the governmental activities, the business-type activities, each major fund, and the aggregate remaining fund information of the City of Eden Prairie, Minnesota, as of December 31, 2023, and the respective changes in financial position and, where applicable, cash flows thereof, and the budgetary comparison for the General Fund for the year then ended in accordance with accounting principles generally accepted in the United States of America.
Basis for Opinions
We conducted our audit in accordance with auditing standards generally accepted in the United States of America (GAAS) and the standards applicable to financial audits contained in Government Auditing Standards, issued by the Comptroller General of the United States. Our responsibilities under those standards are further described in the Auditor's Responsibilities for the Audit of the Financial Statements section of our report. We are required to be independent of the City of Eden Prairie and to meet our other ethical responsibilities, in accordance with the relevant ethical requirements relating to our audit. We believe that the audit evidence we have obtained is sufficient and appropriate to provide a basis for our audit opinions.
Emphasis of Matter – Implementation of GASB 96
The City has adopted new accounting guidance, Governmental Accounting Standards Board (GASB) Statement No. 96, Subscription-Based Information Technology Arrangements. Our opinion is not modified with respect to this matter.
Report on Summarized Comparative Information
We have previously audited the City's 2022 financia l statements of the governmental activities, the business-type activities, each major fund, and the aggregate remaining fund information, and we expressed unmodified opinions on those financial statements in our report dated April 19, 2023. In our opinion, the summarized comparative information presented herein as of and for the year ended December 31, 2022, is consistent, in all material respects, with the audited financial statements from which it has been derived.
20
Responsibilities of Management for the Financial Statements
The City of Eden Prairie's management is responsible for the preparation and fair presentation of the financial statements in accordance with accounting principles generally accepted in the United States of America, and for the design, implementation, and maintenance of internal control relevant to the preparation and fair presentation of financial statements that are free from material misstatement, whether due to fraud or error.
In preparing the financial statements, management is required to evaluate whether there are conditions or events, considered in the aggregate, that raise substantial doubt about the City of Eden Prairie's ability to continue as a going concern for twelve months beyond the financial statement date, including any currently known information that may raise substantial doubt shortly thereafter.
Auditor's Responsibilities for the Audit of the Financial Statements
Our objectives are to obtain reasonable assurance about whether the financial statements as a whole are free from material misstatement, whether due to fraud or error, and to issue an auditor's report that includes our opinions. Reasonable assurance is a high level of assurance but is not absolute assurance and therefore is not a guarantee that an audit conducted in accordance with GAAS and Government Auditing Standards will always detect a material misstatement when it exists. The risk of not detecting a material misstatement resulting from fraud is higher than for one resulting from error, as fraud may involve collusion, forgery, intentional omissions, misrepresentations, or the override of internal control. Misstatements are considered material if there is a substantial likelihood that, individually or in the aggregate, they would influence the judgment made by a reasonable user based on the financial statements.
In performing an audit in accordance with GAAS and Government Auditing Standards, we:

Exercise professional judgment and maintain professional skepticism throughout the audit. Identify and assess the risks of material misstatement of the financial statements, whether due to fraud or error, and design and perform audit procedures responsive to those risks. Such procedures include examining, on a test basis, evidence regarding the amounts and disclosures in the financial statements.
Obtain an understanding of internal control relevant to the audit in order to design audit procedures that are appropriate in the circumstances, but not for the purpose of expressing an opinion on the effectiveness of the City's internal control. Accordingly, no such opinion is expressed.


Evaluate the appropriateness of accounting policies used and the reasonableness of significant accounting estimates made by management, as well as evaluate the overall presentation of the financial statements.
Conclude whether, in our judgment, there are conditions or events, considered in the aggregate, that raise substantial doubt about the City's ability to continue as a going concern for a reasonable period of time.
We are required to communicate with those charged with governance regarding, among other matters, the planned scope and timing of the audit, significant audit findings, and certain internal control–related matters that we identified during the audit.
21
Required Supplementary Information
Accounting principles generally accepted in the United States of America require that the Management's Discussion and Analysis, which follows this report letter, and Required Supplementary information as listed in the Table of Contents be presented to supplement the basic financial statements. Such information is the responsibility of management and, although not a part of the basic financial statements, is required by the GASB, who considers it to be an essential part of financial reporting for placing the basic financial statements in an appropriate operational, economic, or historical context. We have appl ied certain limited procedures to the Required Supplementary Information in accordance with auditing standards generally accepted in the United States of America, which consisted of inquiries of management about the methods of preparing the information and comparing the information for consistency with management 's responses to our inquiries, the basic financial statements, and other knowledge we obtained during our audit of the basic financial statements. We do not express an opinion or provide any assurance on the information because the limited procedures do not provide us with sufficient evidence to express an opinion or provide any assurance.
Supplementary Information
Our audit was conducted for the purpose of forming opinions on the financial statements that collectively comprise the City of Eden Prairie's basic financial statements. The accompanying supplementary information identified in the Table of Contents is presented for purposes of additional analysis and are not a required part of the basic financial statements.
Such information is the responsibility of management and was derived from and relates directly to the underlying accounting and other records used to prepare the basic financial statements. The information has been subjected to the auditing procedures applied in the audit of the basic financial statements and certain additional procedures, including comparing and reconciling such information directly to the underlying accounting and other records used to prepare the basic financial statements or to the basic financial statements themselves, and other additional procedures in accordance with auditing standards generally accept ed in the United States of America. In our opinion, the accompanying supplementary information is fairly stated, in all material respects, in relation to the basic financial statements as a whole.
Other Information
Management is responsible for the other information included in the Annual Comprehensive Financial Report. The other information comprises the introductory and statistical sections but does not include the basic financial statements and our auditor's report thereon. Our opinions on the basic financial statements do not cover the other information, and we do not express an opinion or any form of assurance thereon.
In connection with our audit of the basic financial statements, our responsibility is to read the other information and consider whether a material inconsistency exists between the other information and the basic financial statements, or the other information otherwise appears to be materially misstated. If, based on the work performed, we conclude that an uncorrected material misstatement of the other information exists, we are required to describe it in our report.
22
Other Reporting Required by Government Auditing Standards
In accordance with Government Auditing Standards, we have also issued our report dated April 22, 2024, on our consideration of the City of Eden Prairie 's internal control over financial reporting and on our tests of its compliance with certain provisions of laws, regulations, contracts, and grant agreements and other matters. The purpose of that report is solely to describe the scope of our testing of internal control over financial reporting and compliance and the results of that testing, and not to provide an opinion on the effectiveness of internal control over financial reporting or on compliance. That report is an integral part of an audit performed in accordance with Government Auditing Standards in considering the City of Eden Prairie's internal control over financial reporting and compliance.
St. Cloud, Minnesota
April 22, 2024
23
City of Eden Prairie, Minnesota Management’s Discussion and Analysis
As management of the City of Eden Prairie, this section of the City’s comprehensive annual financial report presents a discussion and analysis of the City’s financial activities during the fiscal year ended December 31, 2023. This discussion and analysis should be read in conjunction with the transmittal letter in the introductory section of this report.
Financial Highlights
The City as a Whole
• The assets and deferred outflow of resources of the City exceeded liabilities and deferred inflows of resources by $448,594,793. Of this amount, $108,142,993 (unrestricted net position) may be used to meet the City’s ongoing obligations to citizens and creditors, $322,468,804 is invested in capital assets, and $17,982,996 is restricted.
• The City’s total net position increased by $11,544,397 or 2.6%. The key factors in this increase were positive General Fund results and increased Parks and Recreation program revenue. Another contributing factor was the increase in investment income. The City was able to transfer positive General Fund results to the Capital Improvement and Maintenance Fund as one-time revenue to support the Capital Improvement Plan.
• The City had a prior period adjustment of $4,469,649 due to a change in accounting policy related to capitalized assets in aggregate. Assets in aggregate over $50,000 are now capitalized.
• The City’s total long-term liabilities decreased by ($27,752,573) or (31.1%) in comparison with the prior year. Contributing to the overall decrease was a decrease in the net pension liability of ($24.7M) and Other Post Employment Benefits Liability of ($514k). Additionally, there was a decrease in bonds payable of ($3.3M) for the current year retirement of debt. These decreases were offset by an increase in IT subscriptions of $842k. GASB Statement No. 96 was implemented in 2023 with the recognition of long-term subscription-based technology arrangements and their related principal payments. These subscriptions are for payroll and time keeping, fleet maintenance, police body cameras, emergency citizen alerts, email and City website hosting.
Using This Annual Report
This annual report consists of a series of financial statements. The Statement of Net Position and the Statement of Activities provide information about the activities of the City as a whole and present a longer-term view of the City’s finances. For governmental activities, the fund financial statements tell how these services were financed in the short term as well as what remains for future spending. Fund financial statements also report the City’s operations in more detail than the government-wide statements by providing information about the City’s most significant funds. The remaining statements provide financial information about activities for which the City acts solely as a trustee or agent for the benefit of those outside of the government.
24
City of Eden Prairie, Minnesota Management’s Discussion and Analysis
Reporting the City as a Whole
The Statement of Net Position and the Statement of Activities
One of the most important questions asked about the City’s finances is “Is the City as a whole better off or worse off as a result of the year’s activities?” The Statement of Net Position and the Statement of Activities report information about the City as a whole and about its activities in a way that helps answer this question. These statements include all assets, deferred outflows of resources, liabilities and deferred inflows of resources using the accrual basis of accounting, which is similar to the accounting used by most private-sector companies. All of the current year’s revenues and expenses are taken into account regardless of when cash is received or paid.
These two statements report the City’s net position and changes in them. You can think of the City’s net position – the difference between assets, deferred outflows of resources, liabilities, and deferred inflows of resources – as one way to measure the City’s financial health, or financial position. Over time, increases or decreases in the City’s net position is one indicator of whether its financial health is improving or deteriorating. You will need to consider other nonfinancial factors, however, such as changes in the City’s property tax base and the condition of the City’s roads, to assess the overall health of the City.
In the Statement of Net Position and the Statement of Activities, we divide the City into two kinds of activities:
• Governmental Activities – Most of the City’s basic services are reported here, including general government, public safety, public works, and parks and recreation. Property taxes, charges for services, and capital grants and contributions finance most of these activities.
• Business-type Activities – The City charges a fee to customers to help it cover all or most of the cost of certain services it provides. The City’s utility system (Water, Wastewater and Stormwater Funds) and liquor operations are reported here.
Reporting the City’s Most Significant Funds
Fund Financial Statements
The fund financial statements provide detailed information about the most significant funds – not the City as a whole. Some funds are required to be established by State law and by bond covenants. However, the City Council establishes many other funds to help it control and manage money for particular purposes or to show that it is meeting legal responsibilities for using certain grants and other money. The City’s two kinds of funds – governmental and proprietary – use different accounting approaches.
• Governmental funds – Most of the City’s basic services are reported in governmental funds, which focus on how money flows into and out of those funds and the balances left at year-end that are available for spending. These funds are reported using an accounting method called modified accrual accounting, which measures cash and all other financial assets that can
25
City of Eden Prairie, Minnesota
Management’s Discussion and Analysis
readily be converted to cash. The governmental fund statements provide a detailed short-term view of the City’s general government operations and the basic services it provides. Governmental fund information helps to determine whether there are more or fewer financial resources that can be spent in the near future to finance the City’s programs. We describe the relationship between governmental activities (reported in the Statement of Net Position and the Statement of Activities) and governmental funds in a reconciliation provided after the fund financial statements.
• Proprietary funds – When the City charges customers for the services it provides – these services are generally reported in proprietary funds. Proprietary funds are reported in the same way that all activities are reported in the Statement of Net Position and the Statement of Activities.
The City of Eden Prairie maintains two different types of proprietary funds.
• Enterprise funds are the same as the business-type activities reported in the governmentwide statements but provide more detail and additional information, such as cash flows.
• Internal service funds are an accounting device used to accumulate and allocate costs internally among the City’s various functions. The City uses internal service funds to account for activities pertaining to employee benefits, workers compensation, personal time off accruals, property insurance, facilities, fleet services, and information technology.
The City as Trustee
Reporting the City’s Fiduciary Responsibilities
All of the City’s fiduciary activities are reported in a separate Statement of Fiduciary Net Position and Statement of Changes in Fiduciary Net Position. The City is fiduciary for resources collected and owed to others including developers and governmental agencies. We exclude these activities from the City’s other financial statements because the City cannot use these assets to finance operations. The City is responsible for ensuring that the assets reported in these funds are used for their intended purposes. The accounting used for fiduciary funds is much like that used for proprietary funds.
The City as a Whole
The City’s combined net position increased from $437,050,396 to $448,594,793 and maintained its financial position. A large part of this increase was due to positive performance in the General and Liquor funds The General Fund had positive performance in licenses and permits, property tax revenue, charges for services, and investment income, which allowed the General fund to transfer $2,661,850 to the Capital Improvement Maintenance fund. Positive performance in the Liquor funds resulted in a transfer of $800,000 to the Capital Improvement Maintenance fund. . By far the largest portion of the City of Eden Prairie’s net position, $322,468,804 (approximately 72%) reflects its investment in capital assets (e.g. land, buildings, machinery, and equipment) less any related debt used to acquire those assets that is still outstanding. The City of Eden Prairie uses
26
City of Eden Prairie, Minnesota Management’s Discussion and Analysis
these capital assets to provide services to citizens; consequently, these assets are not available for future spending. Although the City’s investment in its capital assets is reported net of related debt, the resources needed to repay this debt must be provided from other sources, since the capital assets themselves cannot be used to liquidate these liabilities.
An additional portion of the City’s net position $17,982,996 (approximately 4%), represents resources that are subject to external restrictions on how they may be used. The remaining balance of unrestricted net position, $108,142,993 (approximately 24%), may be used to meet the City’s ongoing obligations to citizens and creditors.
At the end of the current fiscal year, the City is able to report positive balances in all of the categories of net position reported for the government as a whole.
The following schedule provides a summary of the City’s net position as of December 31, 2023 (in thousands):
Key elements of these changes are shown on the following page.
2023 20222023202220232022 Current and Other Assets 119,343 $ 118,804 $ 48,460 $ 46,335 $ 167,803 $ 165,139 $ Capital Assets 237,603 232,059 114,358 111,070 351,961 343,129 Total Assets 356,946 350,863 162,818 157,405 519,764 508,268 Deferred Outflows 25,643 28,120 917 1,439 26,560 29,559 Total Assets and Deferred Outflows 382,589 378,983 163,735 158,844 546,324 537,827 Long-Term Liabilities Outstanding 45,701 71,304 15,708 17,857 61,409 89,161 Other Liabilities 6,064 6,930 1,912 1,877 7,976 8,807 Total Liabilities 51,765 78,234 17,620 19,734 69,385 97,968 Deferred Inflows 26,757 6,578 1,588 701 28,345 7,279 Total Liabilities and Deferred Inflows 78,522 84,812 19,208 20,435 97,730 105,247 Invested in Capital Assets 219,430 212,853 103,038 105,258 322,468 318,111 Restricted 17,983 16,290 - - 17,983 16,290 Unrestricted 66,654 65,028 41,489 33,151 108,143 98,179 Total Net Position 304,067 $ 294,171 $ 144,527 $ 138,409 $ 448,594 $ 432,580 $ Governmental Activities Business-Type activities Total 27
City of Eden Prairie, Minnesota Management’s Discussion
and Analysis
202320222023202220232022 Revenues: Program Revenues Charges for Services 13,009 $ 13,343 $ 35,505 $ 34,364 $ 48,514 $ 47,707 $ Operating Grants and Contributions 3,228 6,799 45 107 3,273 6,906 Capital Grants and Contributions 10,589 8,995 2,358 2,339 12,947 11,334 General Revenues Property Taxes 44,020 43,333 - - 44,020 43,333 Tax Increment 2,577 2,750 - - 2,577 2,750 Gain on sale of Capital Assets 167 - 3 - 170Grants and Contributions 565 972 117 - 682 972 Investment Income 4,005 (1,512) 1,841 (691) 5,846 (2,203) Total Revenues 78,160 74,680 39,869 36,119 118,029 110,799 Expenses: Administration 5,819 5,752 - - 5,819 5,752 Community Development 5,762 5,987 - - 5,762 5,987 Police 20,135 17,956 - - 20,135 17,956 Fire 7,372 5,689 - - 7,372 5,689 Public Works 13,712 16,584 - - 13,712 16,584 Parks and Recreation 17,801 17,932 - - 17,801 17,932 Interest on Long Term Debt 360 (126) - - 360 (126) Water - - 13,276 13,549 13,276 13,549 Wastewater - - 7,692 8,375 7,692 8,375 Stormwater - - 3,268 3,170 3,268 3,170 Liquor - - 11,288 11,085 11,288 11,085 Total Expenses 70,961 69,774 35,524 36,179 106,485 105,953 Changes in Net Position Before Transfers 7,199 4,906 4,345 (60) 11,544 4,846 Internal Transfers 1,748 4,339 (1,748) (4,339) -Change in Net Position 8,947 9,245 2,597 (4,399) 11,544 4,846 Net Position - Beginning 294,171 284,926 138,409 142,809 432,580 427,734 Prior Period Adjustment, as Restated 949 - 3,521 - 4,470Net Position - Beginning Restated 295,120 284,926 141,930 142,809 437,050 427,734 Net Position, December 31 304,067 $ 294,171 $ 144,527$ 138,409$ 448,594$ 432,580 $ Business-Type Total Governmental Activities 28
City
of Eden Prairie, Minnesota
Management’s Discussion and Analysis
Governmental Activities
Revenue by Source
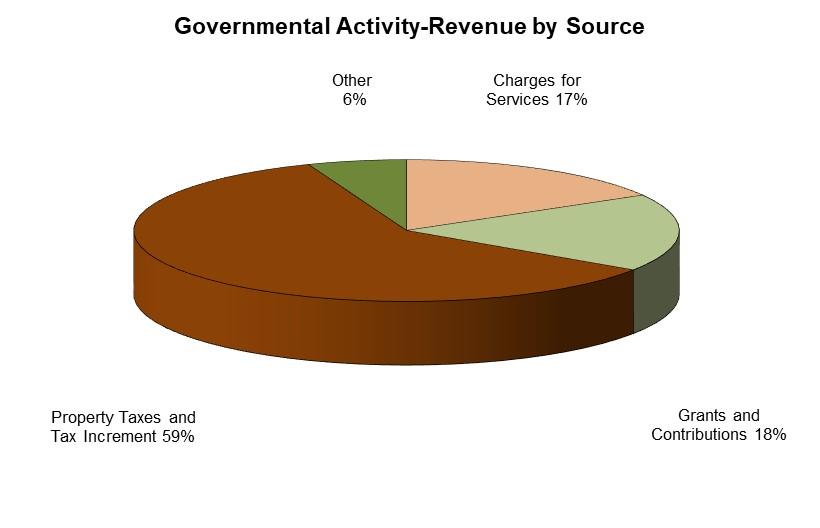
• For the year, property taxes totaled $46,596,745 which is an increase of $3,263,522 or 7.5% from 2022. For 2023, the City budgeted for a 5.7% increase in property taxes. The increase in taxes was more than what was budgeted due to a higher tax collection rate than anticipated.
• Charges for services decreased by $334,364 or 2.5% from 2022 due mainly to decreased permit fee revenue.
• Operating grants and contributions decreased from 2022 by $3,571,352 due primarily to the $3.7M Cares Act Grant received in 2022 but not in 2023
• Capital grants and contributions increased in 2023 by $1,593,670 due primarily to a rate increase in franchise fees for the Pavement Management fund.
29
City
of Eden Prairie, Minnesota
Management’s Discussion and Analysis
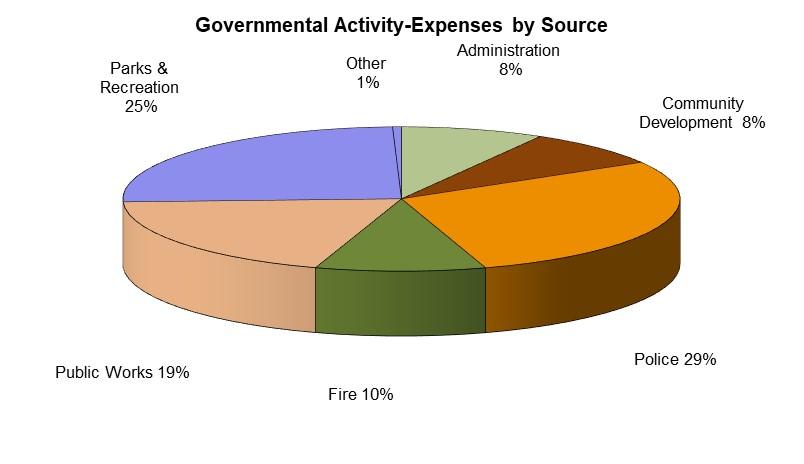
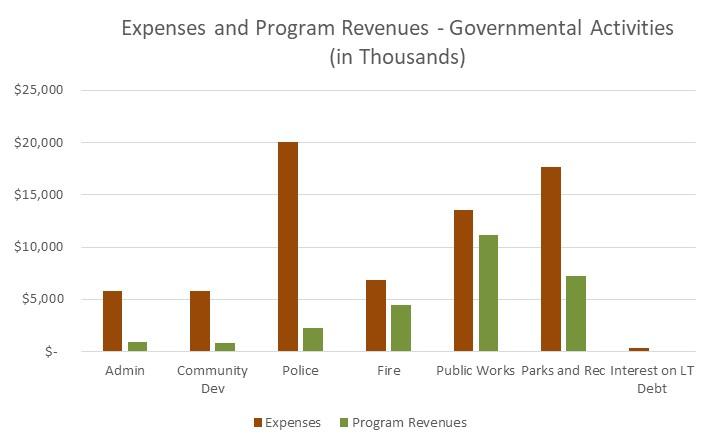
Expenses by Program
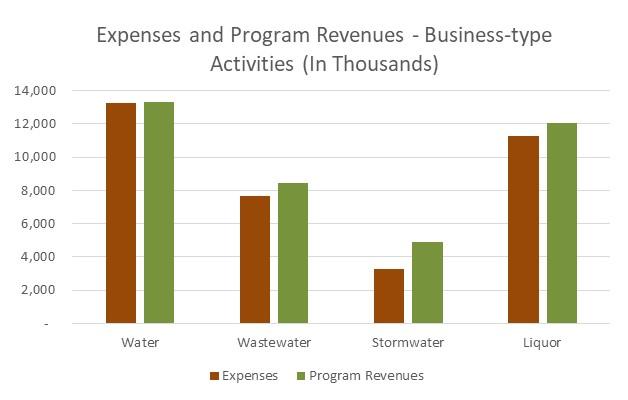
Business-type Activities
For the business-type activities, charges for services accounts for 89.0% of revenues. The Water Fund, Wastewater Fund and Stormwater Fund had a change to net position of $528,765, $932,972 and $1,093,167. The Water and Wastewater fund’s increase in net position is mainly due to a 3% increase in rates and the increase in investment income. The Stormwater Fund’s increased net position is due to a 3% rate increase, investment income and fewer projects in 2023. The Liquor operations had a positive change in net position of $97,535.
30
City of Eden Prairie, Minnesota Management’s Discussion
and Analysis
The City’s Funds
The General fund is the chief operating fund of the City of Eden Prairie. Fund balance increased by $283,982. The City was able to maintain balances in accordance with its fund balance policy.
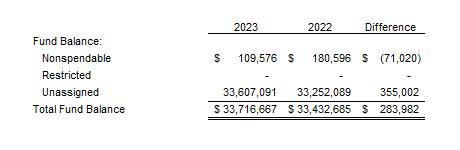
Non-spendable Balances
The balances classified as non-spendable consist of balances that are not in spendable form, such as prepaid assets.
Restricted Balances
The balances classified as restricted consist of balances related to externally imposed constraints established by creditors, grantors/contributors, or state statutory provisions.
31
City of Eden Prairie, Minnesota Management’s
Unassigned Balances
Discussion and Analysis
The unassigned fund balance consists of the residual classification for the general fund. The City maintained an unassigned fund balance in accordance with the City’s fund balance policy.
Other Major Funds
The Public Improvement Construction fund balance decreased by ($104,229) in 2023. Revenue of $814,635 was collected which consisted of special assessments and intergovernmental revenue. Construction costs include Pioneer Trail reconstruction and the Prairie Center Drive and Singletree Lane intersection. These projects will be repaid with future special assessments, grants and state aid. There was also a transfer in of $1,441,133 for the Pioneer Trail project.
The Capital Improvement Maintenance fund balance increased by $4,030,055 in 2023. Revenue of $4,964,150 was collected which consists mainly of general property taxes, building rental income, intergovernmental revenue and investment income. Expenditures for the year include parks parking lot maintenance, Round Lake park building reconstruction, Willow Creek Bridge replacement and a new plow truck. Transfers in included $3,829,973 which consisted of $800,000 from the Liquor funds and $2,661,850 from the General fund due to positive operating results. $450,000 was transferred out for the Capital Improvement Maintenance’s Fund share of trail maintenance.
The City’s proprietary funds provide the same type of information found in the government-wide financial statements, but in more detail.
Water fund sales through December 31, 2023 totaled $11,831,046, which is an increase of $822,209 or 7.5% from 2022. Water usage increased from 2.39 billion gallons to 2.55 billion gallons. The change in sales can be attributed to an increase in rates along with an increase in consumption.
Wastewater fund sales through December 31, 2023 totaled $7,725,339, which is an increase of $207,868 or 2.8% from 2022. Sewer usage decreased from 1.36 billion gallons to 1.35 billion gallons. The change in sales can be attributed to an increase in rates offset by a decrease in consumption.
Stormwater fund sales through December 31, 2023 totaled $3,879,587 which is an increase of $109,025 or 2.9% from 2022. The increase is due to the rate increase.
Liquor operations profit of $800,000 was transferred to the Capital Improvement Maintenance Fund. Sales totaled $11,766,007 which is an increase of $12,200 or .1% over 2022. The operation continues to provide value to customers and maintain customer loyalty.
32
City of Eden Prairie, Minnesota
Management’s Discussion and Analysis
Budgetary Highlights
The net change in fund balance to the General fund was $283,982. Revenues of $55,902,448 were recorded which is $3,023,703 more than budgeted. Property tax revenue, licenses and permits and intergovernmental revenue performed better than expected. Charges for services performed better than budget due to the increase in community center memberships and organized athletics after the effects of COVID in the past couple years. Investment Income also performed better than budgeted due to the Fed’s very aggressive rate hike cycle. Total expenditures equaled $53,401,278 or 98.0% of the budget. All departments have spent less than 100% of the amounts budgeted. Due to the positive General Fund performance, $2,681,850 was transferred to the Capital Improvement and Maintenance Fund to support the Capital Improvement Program.
Capital Assets and Debt Administration
Capital Assets
At the end of 2023, the city had $352 million invested in capital assets Major capital assets added during the current fiscal year by fund include the following.
2023 Fund Project Name Additions Fleet CapitalVehicle and Equipment Replacements 2,632,959 $ Water CapitalWater Meter Replacements 1,976,922 Park ImprovementRound Lake Park Shelter 1,762,556 Water CapitalWell 17 1,582,314 Capital MaintenanceRound Lake Park Shelter 1,317,155 Shady Oak NorthW 62nd Street Reconstruction 574,371 Total 9,846,277 $ 33
City of Eden Prairie, Minnesota Management’s Discussion and Analysis
Capital Assets (net of depreciation/amortization, in thousands)
The City has chosen to maintain infrastructure using the modified approach. This means the City does not depreciate the cost of infrastructure but maintains the system at a “very good condition” level or higher. Additional information on the modified approach can be found in Note 1 of this report and additional information on the City’s capital assets can be found in Note 4 of this report.
The City’s policy is to achieve an average rating of 70 (very good condition) for all streets and trails. In the summer of 2022, the City conducted a physical condition assessment. This assessment will be performed every three years. As of December 31, 2022, the City’s infrastructure system was rated at a Pavement Condition Index (PCI) of 85.3%, which is higher than the City’s policy level The City’s infrastructure is constantly deteriorating resulting from the following factors: (1) traffic using the system; (2) the sun’s ultra-violet rays drying out and breaking down the top layer of pavement; (3) utility company/private development trenching operations; (4) water damage from natural precipitation; and (5) frost heave. The City is continuously taking actions to prolong the life of the system through short-term maintenance activities such as pothole patching, crack sealing, seal coating, and overlaying. The City expended $4,755,130 on infrastructure maintenance for the year ending December 31, 2023. These expenditures delayed deterioration; and, the overall condition of the system was improved through these maintenance expenditures. The City has estimated that the amount of annual expenditures required to maintain the City’s infrastructure at the average PCI rating of very good is approximately $5,000,000.
Debt
At year-end, the City had approximately $61 million in bonds and other long-term liabilities outstanding compared to $89 million last year. Long term liabilities decreased due to a decrease in the net pension and bonds liability. Refer to Note 10 – Long Term Debt. 202320222023202220232022
Land & Land Improv. 33,441 $ 33,498 $ 1,477 $ 1,332 $ 34,918 $ 34,830 $ Infrastructure 143,128 139,375 - - 143,128 139,375 Work in Progress 6,198 5,409 1,582 348 7,780 5,757 Distribution System - - 82,457 84,549 82,457 84,549 Buildings 42,847 44,914 18,426 19,588 61,273 64,502 Leased Buildings - - 1,084 1,279 1,084 1,279 Leased Equipment 74 98 - - 74 98 Subscription Assets 888 - - - 888Leasehold Improvements - - - - -Machinery & Equipment 1,807 1,003 8,226 2,772 10,033 3,775 Autos 4,777 3,838 208 239 4,985 4,077 Other Assets 4,443 3,924 898 963 5,341 4,887 Total 237,603 $ 232,059$ 114,358$ 111,070$ 351,961$ 343,129$ Governmental Activities Business-type Activities Total 34
City of Eden Prairie, Minnesota
Management’s Discussion and Analysis
Economic Factors and Next Year’s Budgets
The City’s elected officials consider many factors when adopting the budget and determining fees for service and fees that will be charged for the business-type activities. These factors include service levels, the tax impact on the median value home, commercial/industrial and household growth, and inflation.
Currently, the 2024 general fund budgeted appropriations are $57,521,455 which is an increase of $3,079,048 or 5.7% from the 2023 budget. Revenues less expenses for 2024 are ($1,000,000). The City anticipates using American Recovery Plan funding to offset the revenue shortfalls.
Contacting the City’s Financial Management
This financial report is designed to provide a general overview of the City’s finances for those interested in the government’s finances. If you have questions about this report or need additional financial information, contact the Finance Division at City of Eden Prairie, 8080 Mitchell Road, Eden Prairie, MN 55344.
35
This page is intentionally left blank
36

GOVERNMENT -WIDE STATEMENTS
37
City of Eden Prairie, Minnesota Statement of Net Position December 31, 2023
Governmental Business-type Activities Activities Total ASSETS Cash and Investments $ 102,242,364 $ 40,701,422 $ 142,943,786 Receivables Accounts (net of allow for uncollectible) 3,266,365 3,755,552 7,021,917 Investment Interest 526,807 225,328 752,135 Lease Receivable Interest 22,252 1,333 23,585 Due From Other Governments 3,312,623 20,798 3,333,421 Unremitted Taxes 163,359 - 163,359 Delinquent Taxes 285,840 - 285,840 Unremitted Special Assessments 214 2,819 3,033 Delinquent Special Assessments 2,894 409,911 412,805 Special Assessments 1,584,565 740,611 2,325,176 Unavailable Special Assessments 1,162,402 444,686 1,607,088 Inventory 170,744 1,218,376 1,389,120 Net Pension Asset 803,054 - 803,054 Prepaid Items 797,898 447,854 1,245,752 Lease Receivable Due Within One Year 455,444 104,448 559,892 Due in More Than One Year 3,738,711 387,640 4,126,351 Land Held for Resale 808,000 - 808,000 Capital Assets Nondepreciable/Nonamortizable Land 22,119,564 1,057,955 23,177,519 Infrastructure 143,127,977 - 143,127,977 Work in Progress 6,197,675 1,582,312 7,779,987 Depreciable/Amortizable Buildings, Property and Equipment, Net 66,158,167 111,717,880 177,876,047 Total Assets 356,946,919 162,818,925 519,765,844 DEFERRED OUTFLOWS OF RESOURCES Refunding of Debt 240,432 - 240,432 Other Post Employment Benefits 824,620 61,756 886,376 Pensions 24,577,677 855,480 25,433,157 Total Deferred Outflows of Resources 25,642,729 917,236 26,559,965 Total Assets and Deferred Outflows of Resources 382,589,648 163,736,161 546,325,809 Primary
The notes to the financial statements are an integral part of this statement 38
Government
City of Eden Prairie, Minnesota
Statement of
Position
December 31, 2023
Net
Governmental Business-type Activities Activities Total LIABILITIES Accounts and Contracts Payable 3,342,329 1,390,516 4,732,845 Claims Payable 6,348 - 6,348 Salaries Payable 1,134,134 198,710 1,332,844 Investment Interest Payable 7,714 - 7,714 Bond Interest Payable 172,893 81,709 254,602 IT Subscriptions Interest Payable 18,097 - 18,097 Lease Interest Payable 212 3,117 3,329 Due to Other Governments 323,870 228,947 552,817 Unearned Revenue 1,058,393 9,816 1,068,209 Total Other Post Employment Benefits Liability Due Within One Year 23,107 1,444 24,551 Due in More Than One Year 2,749,272 223,371 2,972,643 Net Pension Due in More Than One Year 22,862,558 3,293,399 26,155,957 IT Subscriptions Liabilities Due Within One Year 257,317 - 257,317 Due in More Than One Year 584,770 - 584,770 Lease Liability Payable Due Within One Year 23,617 179,888 203,505 Due in More Than One Year 51,986 970,850 1,022,836 Bonds Payable Due Within One Year 2,544,000 665,000 3,209,000 Due in More Than One Year 13,823,643 9,934,698 23,758,341 Finance Purchases From Direct Borrowing Due Within One Year 92,046 - 92,046 Due in More Than One Year 233,891 - 233,891 Compensated Absences Due Within One Year 1,222,556 218,630 1,441,186 Due in More Than One Year 1,232,147 220,346 1,452,493 Total Liabilities 51,764,900 17,620,441 69,385,341 DEFERRED INFLOWS OF RESOURCES Other Post Employment Benefits 827,423 56,778 884,201 Pensions 21,840,844 1,062,081 22,902,925 Deferred Inflows of Resources Related to Lease Receivable 4,089,078 469,471 4,558,549 Total Deferred Inflows of Resources 26,757,345 1,588,330 28,345,675 Total Liabilities and Deferred Inflows 78,522,245 19,208,771 97,731,016 NET POSITION Net Investment in Capital Assets 219,430,606 103,038,198 322,468,804 Restricted for Perpetual Care, Nonexpendable 201,349 - 201,349 Restricted for Debt Service 4,363,992 - 4,363,992 Restricted for Special Assessments 11,540 - 11,540 Restricted for Tax Increment 3,901,204 - 3,901,204 Restricted for Fire Relief 3,675,871 - 3,675,871 Restricted for Police 387,503 - 387,503 Restricted for Public Works 1,482,020 - 1,482,020 Restricted for Parks and Recreation 3,947,651 - 3,947,651 Restricted for Historical and Cultural 11,866 - 11,866 Unrestricted 66,653,801 41,489,192 108,142,993 Total Net Position $ 304,067,403 $ 144,527,390 $ 448,594,793 Primary
The notes to the financial statements are an integral part of this statement 39
Government
City of Eden Prairie, Minnesota
Statement of Activities
For the Year Ended December 31, 2023
General Revenues
Taxes
Property Taxes, Levied for General Purposes
Property Taxes, Levied for Debt Service Tax Increment
Gain on Sale of Capital Asset Grants and Contributions Not Restricted to Specific Programs Investment Income Transfers
Total General Revenues and Transfers
Change in Net Position
Net Position - Beginning
Prior Period Adjustment, as Restated (See Note 17)
Net Position - Beginning Restated
Net Position - Ending
Program Revenue Operating Capital Charges for Grants and Grants and Expenses Services Contributions Contributions FUNCTIONS/PROGRAMS Primary Government Governmental Activities Administration $ 5,819,132 $ 932,607 $ 17,259 $Community Development 5,762,042 76,298 703,605 67,000 Police 20,135,104 991,422 1,072,863 205,706 Fire 7,371,601 3,719,560 712,359Public Works 13,711,989 368,949 500,331 10,271,637 Parks and Recreation 17,801,245 6,920,145 221,039 44,422 Interest on Long Term Debt 359,725 - -Total Governmental Activities 70,960,838 13,008,981 3,227,456 10,588,765 Business-Type Activities Water 13,276,328 11,831,046 11,333 1,393,681 Wastewater 7,692,294 7,725,339 8,717 638,742 Stormwater 3,268,137 3,879,587 20,026 325,543 Liquor 11,287,849 12,069,015 5,239Total Business-Type Activities 35,524,608 35,504,987 45,315 2,357,966 Total Primary Government $ 106,485,446 $ 48,513,968 $ 3,272,771 $ 12,946,731
The notes to the financial statements are an integral part of this statement 40
Net (Expense) Revenue and Changes in Net Position
Governmental Business-type Activities Activities
$ (4,869,266) $ - $ (4,869,266) (4,915,139) - (4,915,139) (17,865,113) - (17,865,113) (2,939,682) - (2,939,682) (2,571,072) - (2,571,072) (10,615,639) - (10,615,639) (359,725) - (359,725) (44,135,636) - (44,135,636) - (40,268) (40,268) - 680,504 680,504 - 957,019 957,019 - 786,405 786,405 - 2,383,660 2,383,660 (44,135,636) 2,383,660 (41,751,976)
41,486,708 - 41,486,708 2,533,046 - 2,533,046 2,576,991 - 2,576,991 167,444 3,563 171,007 565,167 117,647 682,814 4,004,805 1,841,002 5,845,807 1,748,321 (1,748,321)53,082,482 213,891 53,296,373 8,946,846 2,597,551 11,544,397 294,171,398 138,409,349 432,580,747 949,159 3,520,490 4,469,649 295,120,557 141,929,839 437,050,396 $ 304,067,403 $ 144,527,390 $ 448,594,793
Total
The
to
statements are
part of this statement 41
notes
the financial
an integral
This page is intentionally left blank
42

FUND FINANCIAL STATEMENTS
43
City of Eden Prairie, Minnesota
December 31, 2023
BALANCES
Balance Sheet Governmental Funds
Public Capital Other Total Improvement Improvement Governmental Governmental General Construction Maintenance Funds Funds ASSETS Cash and Investments $ 35,561,962 $ - $ 28,156,231 $ 24,885,515 $ 88,603,708 Receivables Accounts 550,610 - - 1,401,403 1,952,013 Lease Receivable - - 368,281 86,867 455,148 Investment Interest 158,763 - 138,793 151,396 448,952 Lease Receivable Interest - - 18,377 2,265 20,642 Due From Other Governments 216,604 - 2,496,100 561,361 3,274,065 Unremitted Taxes 121,643 - 1,149 40,567 163,359 Delinquent Taxes 283,141 - 2,699 - 285,840 Unremitted Special Assessments 208 6 - - 214 Delinquent Special Assessments 2,330 - 247 317 2,894 Deferred Special Assessments 13,704 89,659 126,450 1,354,752 1,584,565 Special Deferred Special Assessments - 159,706 61,582 941,114 1,162,402 Due From Other Funds - - 473,151 66,507 539,658 Prepaid Items 109,576 - 14,600 60,923 185,099 Lease Receivable - - 3,426,622 279,283 3,705,905 Land Held for Resale - - - 808,000 808,000 Notes Receivable (net of allow for uncollectible) - - - 1,212,024 1,212,024 Total Assets $ 37,018,541 $ 249,371 $ 35,284,282 $ 31,852,294 $ 104,404,488 LIABILITIES Accounts and Contracts Payable $ 1,726,139 $ 38,476 $ 47,020 $ 344,183 $ 2,155,818 Salaries Payable 1,029,887 - - 11,252 1,041,139 Investment Interest Payable - 6,214 - 506 6,720 Due to Other Governments 88,929 - - 10,617 99,546 Due to Other Funds - 473,151 - 66,507 539,658 Unearned Revenue 155,204 - 119,534 783,655 1,058,393 Total Liabilities 3,000,159 517,841 166,554 1,216,720 4,901,274 DEFERRED INFLOWS OF RESOURCES Deferred Inflow of Resource Related to Lease Receivable - - 3,693,281 364,814 4,058,095 Unavailable Revenue 2,540 - - 375 2,915 Unavailable Revenue - State Shared Taxes - - 2,496,100 - 2,496,100 Unavailable Revenue-Property Taxes 283,141 - 2,699 - 285,840 Unavailable Revenue-Special Assessments 16,034 249,365 188,279 2,296,183 2,749,861 Total Deferred Inflows of Resources 301,715 249,365 6,380,359 2,661,372 9,592,811
Nonspendable 109,576 - 14,600 262,272 386,448 Restricted - - - 12,965,377 12,965,377 Assigned - - 28,722,769 14,792,512 43,515,281 Unassigned 33,607,091 (517,835) - (45,959) 33,043,297 Total Fund Balance 33,716,667 (517,835) 28,737,369 27,974,202 89,910,403
Liabilities, Deferred Inflows of Resources, and Fund Balance $ 37,018,541 $ 249,371 $ 35,284,282 $ 31,852,294 $ 104,404,488 Capital Projects The notes to the financial statements are an integral part of this statement 44
FUND
Total
City of Eden Prairie, Minnesota
Governmental Funds
Reconciliation of the Balance Sheet of Governmental Funds to the Statement of Net Position
December 31, 2023
Amounts Reported for Governmental Activities in the Statement of Net Position are Different Because:
Total Fund Balance - Governmental Funds $ 89,910,403
1. Capital assets used in Governmental Activities are not financial resources and therefore are not reported as assets in governmental funds. Cost of Capital Assets 286,331,144
Less Accumulated Depreciation (58,274,747)
2. Long term liabilities, including bonds payable, are not due and payable in the current period and therefore are not reported as liabilities in the funds. Long-term liabilities at year end consist of:
Bond Principal Payable Net (16,367,643) Finance Purchases From Direct Borrowing (325,937) Subscription Liablity (23,691)
Gain on Refunding 240,432
3. The City's net pension liability, net pension asset and related deferred outflows and inflows of resources are recorded only on the Statement of Net Position Balances at year end are:
Outflows of Resources related to pensions 24,577,677
Pension Liability (22,862,558) Deferred Inflows of Resources related to pensions (21,840,844)
4. Taxes and special assessment receivable will be collected in future years, but are not available soon enough to pay for the current period's expenditures and therefore are deferred in the funds. 3,035,701
5. Receivable will be collected in future years, but are not available soon enough to pay for the current period's expenditures and therefore are deferred in the funds. 2,499,015
6. Governmental funds do not report a liability for accrued interest on long-term debt until due and payable. (172,893)
7. Internal Service Funds are used by management to charge the costs of employee benefits to individual funds. The assets and liabilities of the Internal Service Fund are included in Governmental Activities in the Statement of Net Position. 16,081,235
8. Internal Service Funds are used by management to charge the costs of employee benefits to individual funds. The assets and liabilities of the Internal Service Fund are included in Business-type Activities in the Statement of Net Position. 457,055 Net Position - Governmental Activities $ 304,067,403
Deferred
Net
Deferred
Net
Pension Asset 803,054
45
The notes to the financial statements are an integral part of this statement
City of Eden Prairie, Minnesota
Statement of Revenues, Expenditures and Changes in Fund Balances Governmental Funds
For the Year Ended December 31, 2023
Public Capital Other Total Improvement Improvement Governmental Governmental General Construction Maintenance Funds Funds REVENUES General Property Taxes $ 41,383,475 $ - $ 393,087 $ 5,312,877 $ 47,089,439 Special Assessments 30,897 182,095 14,570 560,257 787,819 Penalties and Interest 11,606 - - - 11,606 Licenses and Permits 5,054,344 - - 4,803,077 9,857,421 Intergovernmental Revenue 1,822,526 664,455 2,806,873 2,393,860 7,687,714 Charges for Services 5,817,974 - - 1,253,385 7,071,359 Fines and Forfeits 349,641 - - 2,250 351,891 Investment Income 1,190,635 (31,915) 1,147,864 1,069,224 3,375,808 Lease Income - - 107,640 12,479 120,119 Rental - - 483,437 81,730 565,167 Other 241,350 - 10,679 403,203 655,232 Total Revenues 55,902,448 814,635 4,964,150 15,892,342 77,573,575 EXPENDITURES Current Administration 4,890,058 - 633,613 - 5,523,671 Community Development 2,561,689 - - 3,120,475 5,682,164 Police 17,854,145 - - 261,979 18,116,124 Fire 6,760,050 - - - 6,760,050 Public Works 6,792,740 - - 60,516 6,853,256 Parks and Recreation 14,440,321 - - 65,819 14,506,140 Capital Outlay Administration - - - 26,646 26,646 Community Development - - - 143,885 143,885 Police - - 152,264 36,491 188,755 Fire - - 205,220 - 205,220 Public Works - 2,359,997 1,187,109 5,342,028 8,889,134 Parks and Recreation - - 2,135,862 2,254,644 4,390,506 Debt Service Principal 92,200 - - 2,489,486 2,581,686 Interest 10,075 - - 447,945 458,020 Fiscal Agent Fees - - - 5,099 5,099 Total Expenditures 53,401,278 2,359,997 4,314,068 14,255,013 74,330,356 Excess of Revenues Over (Under) Expenditures 2,501,170 (1,545,362) 650,082 1,637,329 3,243,219 OTHER FINANCING SOURCES (USES) Issuance of Debt - - - 36,491 36,491 Transfers In 464,662 1,441,133 3,829,973 5,532,179 11,267,947 Transfers Out (2,681,850) - (450,000) (5,602,213) (8,734,063) Total Other Financing Sources (Uses) (2,217,188) 1,441,133 3,379,973 (33,543) 2,570,375 Net Change in Fund Balances 283,982 (104,229) 4,030,055 1,603,786 5,813,594 Fund Balance (Deficit) - Beginning 33,432,685 (413,606) 24,707,314 26,370,416 84,096,809 Fund Balance (Deficit) - Ending $ 33,716,667 $ (517,835) $ 28,737,369 $ 27,974,202 $ 89,910,403 Capital Projects The notes to the financial statements are an integral part of this statement 46
City of Eden Prairie, Minnesota
Reconciliation of the Statement of Revenues and Expenditures, and Changes in Fund Balances of Governmental Funds to the Statement of Activities For the Year Ended December 31, 2023
Total net change in fund balances - governmental funds $ 5,813,594
Amounts Reported for Governmental Activities in the Statement of Activities are Different Because:
Capital outlays are reported in Governmental Funds as expenditures. However, in the Statement of Activities, the cost of those assets is allocated over the estimated useful life's as depreciation expense.
net effect of the disposal of capital assets
Principal payments of long-term debt and SBITAs consumes the current financial resources of Governmental Funds, However they have no effect on Net Position. 2,576,000
Interest on long-term debt in the statement of activities differs from the amount reported in the Governmental Funds because interest is recognized as an expenditure in the funds when it is due thus requires use of current financial resources. In the Statement of Activities, however interest expense is recognized as the interest accrues, regardless of when it is due. 17,620
The issuance of long-term debt and SBITAs provides current financial resources to Governmental Funds and has no effect on Net Position. These amounts are reported in the Governmental Funds as a source of financing. These amounts are not shown as revenue in the Statement of Activities, but rather constitute long-term liabilities in the Statement of Net Position. (36,491)
Governmental Funds report debt issuance premiums and discounts as another financing source or use at the time of issuance. Premiums and discounts are reported as an unamortized asset or liability in the Government-wide financial statements. 113,317
Refunding gains/(losses) are recognized when paid in the governmental funds but amortized over the life of the debt in the Statement of Activities.
Amortization of Deferred Gain (21,857)
Taxes and special assessments receivable will be collected in future years, but are not available soon enough to pay for the current period's expenditures, and therefore are deferred in the funds. (1,445,856)
Receivable will be collected in future years, but are not available soon enough to pay for the current period's expenditures, and therefore are deferred in the funds. 1,225,132
Some pension expenses reported in the Statement of Activities do not require the use of current financial resources and, therefore are not reported as expenditures.
Change in Net Pension Asset/Liability and Related Deferred Outflows/Inflows of Resources (2,214,161)
Internal Service Funds are used by management to charge the costs of employee benefits to individual funds. The net revenue of these activities is reported in Governmental Activities. 1,677,134
Internal Service Funds are used by management to charge the costs of employee benefits to individual funds. The net revenue of these activities is reported in Business Type Activities. 54,888
Capital Outlays 6,267,351 Depreciation/Amortization Expense (4,282,029) The
Contributed to Enterprise funds (785,563) Disposals (446,169) Accumulated Depreciation/Amortization
Disposals 433,936
on
Net Position - Governmental
The notes to the financial statements are an integral part of this statement 47
Change in
Activities $ 8,946,846
This page is intentionally left blank
48
City of Eden Prairie, Minnesota
General Fund
Statement of Revenues, Expenditures and Changes in Fund Balance - Budget and Actual For the Year Ended December 31, 2023 With Comparative Actual Amounts For the Year Ended December 31, 2022
REVENUES
2022 Budget Budget Variance Original Final Actual Over/(Under) Actual
Taxes and Special Assessments General Property Taxes and Assessments $ 41,117,158 $ 41,117,158 $ 41,414,372 $ 297,214 $ 39,704,702 Penalties and Interest 25,000 25,000 11,606 (13,394) 22,551 Total Taxes and Special Assessments 41,142,158 41,142,158 41,425,978 283,820 39,727,253 Licenses
Liquor, Beer and Wine Licenses 311,650 311,650 309,450 (2,200) 298,029 Other Licenses 44,425 44,425 30,342 (14,083) 39,036 Building Permits and Fees 2,524,975 2,524,975 3,562,908 1,037,933 3,836,375 Cable TV 791,000 791,000 733,781 (57,219) 759,370 Other Permits Inspection Fees 245,000 245,000 244,160 (840) 209,223 Non-Development Fire Permits 113,500 113,500 130,295 16,795 119,744 Other 38,150 38,150 43,408 5,258 41,690 Total Licenses and Permits 4,068,700 4,068,700 5,054,344 985,644 5,303,467 Intergovernmental Revenue Police Pension Aid 610,000 610,000 728,684 118,684 651,068 Fire Relief Association Aid 494,000 494,000 600,218 106,218 542,833 School Liaison 128,300 128,300 - (128,300) 124,600 Police Training 65,000 65,000 69,704 4,704 65,963 Fire Training 25,000 25,000 112,142 87,142 16,820 Grants 70,000 70,000 302,815 232,815 3,935,576 Local Performance Aid 9,000 9,000 8,963 (37) 8,980 Total Intergovernmental Revenue 1,401,300 1,401,300 1,822,526 421,226 5,345,840 Charges for Services Public Safety 172,533 172,533 242,495 69,962 213,151 Recreation Community Center 4,233,054 4,233,054 4,331,204 98,150 3,845,607 Youth Programs 497,500 497,500 552,300 54,800 471,568 Organized Athletics 208,900 208,900 161,110 (47,790) 154,295 Senior Center 77,800 77,800 69,413 (8,387) 59,178 Outdoor Center 75,500 75,500 81,018 5,518 84,818 Arts Center 109,200 109,200 195,924 86,724 201,829 Park Facilities 82,000 82,000 85,204 3,204 80,085 Park Maintenance 43,300 43,300 40,825 (2,475) 36,941 Therapeutic Recreation 38,500 38,500 24,979 (13,521) 21,742 Arts 27,400 27,400 33,322 5,922 31,764 Special Events 5,600 5,600 180 (5,420) 270 Total Recreation 5,398,754 5,398,754 5,575,479 176,725 4,988,097 Total Charges for Services 5,571,287 5,571,287 5,817,974 246,687 5,201,248 Fines and Forfeits 367,000 367,000 349,641 (17,359) 296,757 Investment Income 150,000 150,000 1,190,635 1,040,635 (468,510) Other 178,300 178,300 241,350 63,050 231,252 Total
$ 52,878,745 $ 52,878,745 $ 55,902,448 $ 3,023,703 $ 55,637,307 2023 The notes to the financial statements are an integral part of this statement 49
and Permits
Revenues
City of Eden Prairie, Minnesota
General Fund
Statement of Revenues, Expenditures and Changed in Fund Balance - Budget and Actual For the Year Ended December 31, 2023
With Comparative Actual Amounts For the Year Ended December 31, 2022
EXPENDITURES
Continued
2022 Budget Budget Variance Original Final Actual Over/(Under) Actual
Current Administration Legislative $ 358,635 $ 358,635 $ 364,911 $ 6,276 $ 377,212 Office of the City Manager 500,720 500,720 433,417 (67,303) 408,807 Legal Counsel 575,000 575,000 678,299 103,299 499,784 City Clerk 191,065 191,065 182,306 (8,759) 358,716 Communications 727,187 727,187 724,688 (2,499) 691,641 Finance 976,514 976,514 964,624 (11,890) 931,975 Customer Service 410,876 410,876 385,964 (24,912) 389,406 Human Resources 1,223,369 1,223,369 1,155,849 (67,520) 1,223,047 Total Administration 4,963,366 4,963,366 4,890,058 (73,308) 4,880,588 Community Development Assessing 1,135,558 1,135,558 1,131,997 (3,561) 1,055,993 Planning 730,797 730,797 646,085 (84,712) 574,623 Community Development Administration 267,283 267,283 240,752 (26,531) 231,497 Economic Development 174,877 174,877 172,214 (2,663) 186,083 Housing & Community Services 372,605 372,605 370,641 (1,964) 364,744 Total Community Development 2,681,120 2,681,120 2,561,689 (119,431) 2,412,940 Police 18,162,956 18,162,956 17,854,145 (308,811) 17,032,495 Fire Fire 5,349,449 5,349,449 5,252,294 (97,155) 5,369,294 Inspections 1,389,418 1,389,418 1,357,905 (31,513) 1,327,290 Public Safety Communications 153,680 153,680 149,851 (3,829) 144,835 Total Fire 6,892,547 6,892,547 6,760,050 (132,497) 6,841,419 Public Works Engineering 1,369,704 1,390,954 1,331,320 (59,634) 1,280,818 Street Maintenance 4,608,644 4,608,644 4,551,891 (56,753) 4,298,081 Street Lighting 1,023,500 1,023,500 909,529 (113,971) 983,693 Total Public Works 7,001,848 7,023,098 6,792,740 (230,358) 6,562,592 2023 The notes to the financial statements are an integral part of this statement 50
City of Eden Prairie, Minnesota
General Fund
Statement of Revenues, Expenditures and Changed in Fund Balance - Budget and Actual For the Year Ended December 31, 2023
With Comparative Actual Amounts For the Year Ended December 31, 2022
EXPENDITURES (Continued)
Current (Continued)
Continued
2022 Budget Budget Variance Original Final Actual Over/(Under) Actual 2023
Parks and Recreation Park Maintenance 4,936,972 4,936,972 5,015,348 78,376 4,808,144 Community Center 5,885,462 5,885,462 5,707,115 (178,347) 5,351,320 Youth Programs 707,191 707,191 718,720 11,529 700,406 Senior Center 500,519 500,519 484,722 (15,797) 453,463 Park Administration 484,185 484,185 486,727 2,542 444,131 Organized Athletics 284,220 284,220 261,686 (22,534) 223,960 Recreation Administration 417,381 417,381 365,896 (51,485) 335,449 Arts Center 369,864 369,864 478,706 108,842 431,491 Therapeutic Recreation 247,286 247,286 185,314 (61,972) 161,265 Outdoor Center 273,756 273,756 272,606 (1,150) 282,369 Arts 170,649 170,649 180,542 9,893 161,958 Special Events 153,284 153,284 145,981 (7,303) 145,431 Park Facilities 96,688 96,688 87,626 (9,062) 81,114 Beaches 99,763 99,763 49,332 (50,431) 54,617 Total Parks and Recreation 14,627,220 14,627,220 14,440,321 (186,899) 13,635,118 Debt Service Principal 86,241 86,241 92,200 5,959 18,819 Interest 7,109 7,109 10,075 2,966 1,843 Total Debt Service 93,350 93,350 102,275 8,925 20,662 Total Expenditures 54,422,407 54,443,657 53,401,278 (1,042,379) 51,385,814 Excess of Revenues Over (Under) Expenditures (1,543,662) (1,564,912) 2,501,170 4,066,082 4,251,493 OTHER FINANCING SOURCES / (USES) Issuance of Debt - - - - 436,955 Transfers In 463,662 463,662 464,662 1,000 444,324 Transfers Out (20,000) (20,000) (2,681,850) (2,661,850) (1,020,000) Total Other Financing Sources / (Uses) 443,662 443,662 (2,217,188) (2,660,850) (138,721) Net Change in Fund Balance $ (1,100,000) $ (1,121,250) 283,982 $ 1,405,232 4,112,772 Fund Balance, January 1 33,432,685 29,319,913 Fund Balance, December 31 $ 33,716,667 $ 33,432,685 The notes to the financial statements are an integral part of this statement 51
Proprietary Funds
December 31, 2023
City of Eden Prairie, Minnesota
Statement of Net Position
Governmental Activities Internal Water Wastewater Stormwater Liquor Service Fund Fund Fund Fund Totals Fund ASSETS Current Assets: Cash and Investments $ 20,467,342 $ 11,417,839 $ 6,533,094 $ 2,740,202 $ 41,158,477 $ 13,181,601 Receivables: Accounts 1,590,337 1,395,433 746,329 23,453 3,755,552 102,328 Lease Receivable - - - 104,448 104,448 296 Investment Interest 114,469 59,230 36,922 14,707 225,328 77,855 Lease Receivable Interest - - - 1,333 1,333 1,610 Due From Other Governments 19,798 - 1,000 - 20,798 38,558 Unremitted Special Assessments 2,523 296 - - 2,819Delinquent Special Assessments 396,858 9,391 3,662 - 409,911Deferred Special Assessments 241,090 317,085 182,436 - 740,611Special Deferred Special Assessments 193,593 251,093 - - 444,686Due From Other Funds - - - - - 557,359 Inventory - - - 1,218,376 1,218,376 170,744 Prepaid Items 30,854 383,901 - 33,099 447,854 612,799 Total Current Assets 23,056,864 13,834,268 7,503,443 4,135,618 48,530,193 14,743,150 Noncurrent Assets Lease Receivable - - - 387,640 387,640 32,806 Capital Assets: Not Being Depreciated or Amortized Land 410,694 - 110,602 536,659 1,057,955Work in Progress 1,582,312 - - - 1,582,312 1,228,992 Depreciated or Amortized Property, Plant and Equipment 147,287,697 83,914,640 54,326,188 2,628,498 288,157,023 16,826,318 Leased IT Subscriptions - - - - - 1,160,733 Leased Building/Equipment - - - 1,474,097 1,474,097 116,896 Less Accumulated Depreciation/Amortization (90,653,586) (55,504,356) (29,726,925) (2,028,373) (177,913,240) (9,785,953) Total Noncurrent Assets 58,627,117 28,410,284 24,709,865 2,998,521 114,745,787 9,579,792 Total Assets 81,683,981 42,244,552 32,213,308 7,134,139 163,275,980 24,322,942 DEFERRED OUTFLOWS OF RESOURCES Other Post Employment Benefits 39,905 10,156 3,452 8,243 61,756 824,620 Pensions 463,385 106,935 106,935 178,225 855,480Total Deferred Outflows of Resources 503,290 117,091 110,387 186,468 917,236 824,620 Total Assets and Deferred Outflows of Resources 82,187,271 42,361,643 32,323,695 7,320,607 164,193,216 25,147,562 LIABILITIES Current Liabilities: Accounts Payable 737,747 98,652 77,659 476,458 1,390,516 1,186,511 Claims Payable - - - - - 6,348 Salaries Payable 93,850 29,472 22,346 53,042 198,710 92,995 Investment Interest Payable - - - - - 994 IT Subscriptions Interest Payable - - - - - 18,097 IT Subscriptions Liabilities - - - - - 245,779 Bond Interest Payable 81,709 - - - 81,709Lease Interest Payable - - - 3,117 3,117 212 Due to Other Governments 76,202 - - 152,745 228,947 224,324 Due to Other Funds - - - - - 557,359 Unearned Revenue - - - 9,816 9,816Current Other Postemployment Benefits Liability 943 246 64 191 1,444 23,107 Current Lease Liability Payable - - - 179,888 179,888 23,617 Current Portion of Bonds Payable 665,000 - - - 665,000Current Portion of Compensated Absences 114,831 32,994 10,345 60,460 218,630 1,222,556 Total Current Liabilities 1,770,282 161,364 110,414 935,717 2,977,777 3,601,899 Noncurrent Liabilities: Total Other Postemployment Benefits Liability 137,682 38,652 20,327 26,710 223,371 2,749,272 IT Subscriptions Liabilities - - - - - 572,617 Net Pension Liability 1,783,924 411,675 411,675 686,125 3,293,399Lease Liability Payable - - - 970,850 970,850 51,986 Bonds Payable 9,934,698 - - - 9,934,698Compensated Absences 115,732 33,252 10,427 60,935 220,346 1,232,147 Total Noncurrent Liabilities 11,972,036 483,579 442,429 1,744,620 14,642,664 4,606,022 Total Liabilities 13,742,318 644,943 552,843 2,680,337 17,620,441 8,207,921 DEFERRED INFLOWS OF RESOURCES Other Postemployment Benefits Liability 36,859 9,488 2,879 7,552 56,778 827,423 Pensions 575,294 132,760 132,760 221,267 1,062,081Deferred Inflow of Resource Related to Lease Receivable - - - 469,471 469,471 30,983 Total Deferred Inflows of Resources 612,153 142,248 135,639 698,290 1,588,330 858,406 Total Liabilities and Deferred Inflows of Resources 14,354,471 787,191 688,482 3,378,627 19,208,771 9,066,327 NET POSITION Net Investment in Capital Assets 48,457,906 28,410,284 24,709,865 1,460,143 103,038,198 8,022,976 Unrestricted 19,374,894 13,164,168 6,925,348 2,481,837 41,946,247 8,058,259 Total Net Position $ 67,832,800 $ 41,574,452 $ 31,635,213 $ 3,941,980 144,984,445 $ 16,081,235 Adjustment to Reflect the Consolidation of Internal Service Fund Activities Related to Enterprise Funds (457,055) Total Net Position-Business-Type Activities $ 144,527,390 The notes to the financial statements are an integral part of this statement 52
City of Eden Prairie, Minnesota
Proprietary Funds
Statement of Revenues, Expenses and Changes in Net Position For the Year Ended December 31, 2023
Governmental ActivitiesInternal Water Wastewater Stormwater Liquor Service Fund Fund Fund Fund Total Fund SALES AND COST OF SALES Sales $ - $ - $ - $ 11,766,007 $ 11,766,007 $Cost of Sales - - - (8,470,531) (8,470,531)Gross Profit - - - 3,295,476 3,295,476OPERATING REVENUE Sales 11,810,456 7,725,239 3,879,587 - 23,415,282Charges for Services - - - - - 21,193,334 Rental - - - 245,056 245,056 622,325 Lease Receivable Interest - - - 17,646 17,646 1,110 Other 20,590 100 - 40,306 60,996Total Operating Revenues 11,831,046 7,725,339 3,879,587 303,008 23,738,980 21,816,769 OPERATING EXPENSE Personnel Services 3,265,298 1,004,127 742,586 1,456,148 6,468,159 10,063,310 Supplies Supplies 107,042 14,793 37,600 31,263 190,698 83,310 Cleaning Supplies 13,947 - - - 13,947 98,290 Motor Fuel - - - - - 505,929 Tires - - - - - 75,161 Chemicals 1,256,070 - - - 1,256,070Repair and Maintenance Supplies 318,178 21,283 32,993 1,242 373,696 714,087 Contractual Services Contractual Services 494,114 160,840 649,943 383,877 1,688,774 4,199,845 Software 67,200 67,200 - 148 134,548 1,198,092 Janitorial Services 55,200 - - 27,712 82,912 892,553 Lime Residual Removal 380,617 - - - 380,617Building Rent - - - 96,120 96,120Licenses, Permits, Taxes 264,694 47 1,090 60 265,891 3,704 Repair and Maintenance 520,928 47,406 18,661 - 586,995 293,147 Utilities 1,087,514 28,016 1,070 77,534 1,194,134 1,647,784 MCES Fees - 4,458,823 - - 4,458,823Bank and Credit Card Fees 69,176 69,176 - 271,838 410,190User Charges 430,913 341,127 210,552 180,633 1,163,225 23,427 Capital Under $25,000 1,640,463 80,500 492,799 27,230 2,240,992 481,775 Total Operating Expenses 9,971,354 6,293,338 2,187,294 2,553,805 21,005,791 20,280,414 Operating Income (Loss) Before Depreciation/Amortization 1,859,692 1,432,001 1,692,293 1,044,679 6,028,665 1,536,355 Depreciation/Amortization 3,065,370 1,377,115 1,042,310 232,829 5,717,624 1,327,853 Operating Income (Loss) Before Nonoperating Revenue / Expense (1,205,678) 54,886 649,983 811,850 311,041 208,502 NONOPERATING REVENUE (EXPENSE) Grants 24,599 39,428 53,620 - 117,647Investment Income 951,850 449,129 319,727 120,296 1,841,002 639,068 Lease Interest Expense - - - (39,850) (39,850) (2,902) Subscription Interest Expense - - - - - (31,895) Bonds Interest (287,173) - - - (287,173)Bond Issuance Cost 52,569 - - - 52,569Fiscal Agent Fees (1,320) - - - (1,320)Gain/(Loss) on Disposition of Capital Assets - 3,563 - - 3,563 179,677 Contributions - - - - - 2,673 Miscellaneous 11,333 8,717 20,026 5,239 45,315 321,205 Total Nonoperating Revenues (Expenses) 751,858 500,837 393,373 85,685 1,731,753 1,107,826 Income (Loss) Before Contributions and Transfers (453,820) 555,723 1,043,356 897,535 2,042,794 1,316,328 Contributions - from Governmental Activities 61,864 70,118 653,581 - 785,563 360,806 Contributions - from Developers 190,738 213,462 276,038 - 680,238Capital Access Charges 955,010 233,370 - - 1,188,380Capital Special Assessments 247,933 191,910 49,505 - 489,348Transfers Out (472,960) (331,611) (929,313) (800,000) (2,533,884)Change in Net Position 528,765 932,972 1,093,167 97,535 2,652,439 1,677,134 Net Position - Beginning 63,783,545 40,641,480 30,542,046 3,844,445 138,811,516 14,241,204 Prior Period Adjustment (See Note 17) 3,520,490 - - - 3,520,490 162,897 Net Position - Beginning (Restated) 67,304,035 40,641,480 30,542,046 3,844,445 142,332,006 14,404,101 Net Position - Ending $ 67,832,800 $ 41,574,452 $ 31,635,213 $ 3,941,980 144,984,445 $ 16,081,235 Amounts reported for Business Type Activities in the Statement of Activities are Different Because: Adjustment to Reflect the Consolidation of Internal Service Funds Activities Related To Enterprise Funds (54,888) Change in Net Position of Business-Type Activities 2,597,551 $ The notes to the financial statements are an integral part of this statement 53
City of Eden Prairie, Minnesota
Proprietary Funds Statement of Cash Flows
the Year Ended December 31, 2023
Page
Governmental ActivitiesInternal Water Wastewater Stormwater Liquor Service Fund Fund Fund Fund Totals Fund CASH FLOWS FROM OPERATING ACTIVITIES Receipts From Customers $ 11,657,429 $ 7,616,768 $ 3,854,124 $ 12,036,146 $ 35,164,467 $ 21,116,153 Payments to Vendors (6,683,072) (5,264,153) (1,388,620) (9,650,224) (22,986,069) (9,693,520) Payments to Employees (3,161,737) (973,935) (718,294) (1,388,671) (6,242,637) (10,000,025) Other Receipts 20,590 100 - 9,267 29,957 621,561 Net Cash Provided (Used) By Operating Activities 1,833,210 1,378,780 1,747,210 1,006,518 5,965,718 2,044,169 CASH FLOWS FROM INVESTING ACTIVITIES Investment Income 900,336 417,530 304,562 113,450 1,735,878 604,467 Net Cash Provided (Used) By Investing Activities 900,336 417,530 304,562 113,450 1,735,878 604,467 CASH FLOWS FROM NONCAPITAL FINANCING ACTIVITIES Grants 24,599 39,428 53,620 - 117,647Miscellaneous 11,333 8,717 20,026 5,239 45,315 323,878 Payments From Other Funds - - - - - (557,359) Payments to Other Funds - - - - - 557,359 Transfers (Out) (472,960) (331,611) (929,313) (800,000) (2,533,884)Net Cash Provided (Used) By Noncapital Financing Activities (437,028) (283,466) (855,667) (794,761) (2,370,922) 323,878 CASH FLOWS FROM CAPITAL FINANCING ACTIVITES Contributions - - - - - (3,202,931) Acquisition and Construction of Capital Assets (3,970,658) - (48,500) - (4,019,158)Proceeds From Sale of Equipment - 3,563 - - 3,563 168,916 Access Charges 955,010 233,370 - - 1,188,380Special Assessments 247,933 191,910 49,505 - 489,348Principal Paid on Debt (620,000) - - (163,601) (783,601) (365,176) Interest and Fiscal Agent Paid on Debt (295,255) - - (40,293) (335,548) (16,764) Net Cash Provided (Used) By Capital Financing Activities (3,682,970) 428,843 1,005 (203,894) (3,457,016) (3,415,955) Net Increase (Decrease) in Cash and Cash Equivalents (1,386,452) 1,941,687 1,197,110 121,313 1,873,658 (443,441) Cash and Cash Equivalents, January 1 21,853,794 9,476,152 5,335,984 2,618,889 39,284,819 13,625,042 Cash and Cash Equivalents, December 31 $ 20,467,342 $ 11,417,839 $ 6,533,094 $ 2,740,202 $ 41,158,477 $ 13,181,601 The notes to the financial statements are an integral part of this statement 54
For
1 of 2
City of Eden Prairie, Minnesota
Proprietary Funds
Statement of Cash Flows
the Year Ended December 31, 2023
RECONCILIATION OF OPERATING INCOME (LOSS) TO NET CASH PROVIDED (USED) BY OPERATING ACTIVITIES:
Adjustments to Reconcile Operating Income (Loss) to
Cash Provided (Used) by Operating Activities:
(Increase) Decrease in Assets and Deferred Outflows:
Page
Governmental ActivitiesInternal Water Wastewater Stormwater Liquor Service Fund Fund Fund Fund Totals Fund
For
2 of 2
Operating Income (Loss) $ (1,205,678) $ 54,886 $ 649,983 $ 811,850 $ 311,041 $ 208,502
Depreciation/Amortization 3,065,370 1,377,115 1,042,310 232,829 5,717,624 1,327,853
Accounts Receivable 6,828 12,415 12,506 (16,630) 15,119 (76,546) Lease Receivable - - - (8,379) (8,379) (1,874) Special Assessments Receivable (159,855) (120,886) (37,969) - (318,710)Due From Other Governments 3,253 50,000 18,241 - 71,494 (9,452) Inventory - - - (79,776) (79,776) 16,927 Prepaid Items 7,254 (12,332) 5,250 (562) (390) 8,675 Other Post Employment Benefits (Deferred Outflow) 5,086 1,325 345 1,034 7,790 124,785 Pensions (Deferred Outflow) 278,634 64,300 64,300 107,167 514,401Increase (Decrease) in Liabilities and Deferred Inflows: Accounts Payable (18,378) (12,610) 32,597 (16,064) (14,455) 496,394 Salaries Payable 1,532 667 (20) 8,254 10,433 2,419 Unearned Revenue - - - 1,407 1,407 (635) Due to Other Governments 30,855 - - 14,366 45,221 11,040 Other Post Employment Benefits (19,771) (5,148) (1,338) (4,015) (30,272) (484,523) Net Pension Liability (726,251) (167,596) (167,596) (279,327) (1,340,770)Other Post Employment Benefits (Deferred Inflow) 13,980 3,641 947 2,840 21,408 342,645 Pensions (Deferred Inflow) 533,236 123,054 123,054 205,091 984,435Compensated Absences 17,115 9,949 4,600 26,433 58,097 77,959 Net Cash Provided (Used) by Operating Activities $ 1,833,210 $ 1,378,780 $ 1,747,210 $ 1,006,518 $ 5,965,718 $ 2,044,169 Noncash Investing, Capital and Financing Activities: Contributions of Capital Assets from Governmental Activities $ 61,864 $ 70,118 $ 653,581 $ - $ 785,563 $ 360,806 Contributions of Capital Assets from Developers 190,738 213,462 276,038 - 680,238Amortization of Bond Premium 52,569 - - - 52,569The notes to the financial statements are an integral part of this statement 55
Net
City of Eden Prairie, Minnesota
Fiduciary Funds
Statement of Fiduciary Net Position
December 31, 2023
705,299
705,299
Custodial Funds Total ASSETS Cash and Investments $ 643,043 Due from Other Governments 98,894 Prepaids 66,142 Total Assets $ 808,079 LIABILITIES Accounts Payable $ 98,359 Due to Other Governments
Total Liabilities $
NET POSITION Restricted $
$
The notes to the financial statements are an integral part of this statement 56
4,421
102,780
City of Eden Prairie, Minnesota
Fiduciary Funds
Statement of Changes in Fiduciary Net Position For the Year Ended December 31, 2023
Custodial Funds Total ADDITIONS Grants $ 379,335 Memberships 492,050 Investments Earnings 32,086 Building Permits 656,040 Other 12,892 Total Additions
Personnel Services 427,437 Supplies 27,778 Contractual Services 1,081,094 Total Deductions 1,536,309 Net Increase (Decrease) in Fiduciary Net Position 36,094 Net Position - Beginning 669,205 Net Position - Ending $ 705,299 The notes to the financial statements are an integral part of this statement 57
1,572,403 DEDUCTIONS
This page is intentionally left blank
58

NOTES TO FINANCIAL STATEMENTS
59
City of Eden Prairie, Minnesota
Notes to Financial Statements
Note 1—Summary of Significant Accounting Policies
Reporting Entity
The City of Eden Prairie is a municipal corporation governed by an elected mayor and fourmember council. The accompanying financial statements consist of the primary government and organizations for which the primary government is financially accountable. In addition, the primary government may determine through exercise of management’s professional judgment that the inclusion of an organization that does not meet the financial accountability criteria is necessary in order to prevent the financial statements from being misleading. The criteria used to determine if the primary government is financially accountable for a potential component unit include whether or not the primary government appoints the voting majority of the potential component unit’s board, is able to impose its will on the potential component unit, is in a relationship of financial benefit or burden with the potential component unit or is fiscally depended upon by the potential component unit.
Blended Component Unit
The Housing and Redevelopment Authority H.R.A. is a body organized and existing under the laws of the State of Minnesota. The Authority was established in 1980 by the City to carry out certain redevelopment projects within the City and is governed by the City Council and the Mayor. The City also has an operational responsibility for the H.R.A. The H.R.A. has a December 31 yearend and does not issue financial statements. This unit is included within the H.R.A. and Economic Development funds.
Government-Wide and Fund Financial Statements
The government-wide financial statements i.e., the Statement of Net Position and the Statement of Activities report information on all of the nonfiduciary activities of the City. The fiduciary funds are only reported in the statement of fiduciary net position and the statement of changes in fiduciary net position at the fund financial statement level. Governmental activities, which normally are supported by taxes and intergovernmental revenues, are reported separately from business-type activities, which rely to a significant extent on fees and charges for support.
The statement of activities demonstrates the degree to which the direct expenses of a given function or segment are offset by program revenues. Direct expenses are those that are clearly identifiable with a specific function or segment. Program revenues include 1 charges to customers or applicants who purchase, use or directly benefit from goods, service or privileges provided by a given function or segment and 2 grants and contributions that are restricted to meeting the operational or capital requirements of a particular function or segment. Taxes and other items not properly included among program revenues are reported instead as general revenues.
Measurement Focus, Basis of Accounting and Statement Presentation
Separate financial statements are provided for governmental funds, proprietary funds, and fiduciary funds, even though the latter are excluded from the government-wide financial statements. Major individual governmental funds and major individual proprietary funds are reported as separate columns in the fund financial statements.
60
City of Eden Prairie, Minnesota
Notes to Financial Statements
The financial statements for the government-wide, proprietary funds, fiduciary funds which include custodial funds are reported using the economic resources measurement focus and the accrual basis of accounting. Revenues are recorded when earned and expenses are recorded when a liability is incurred, regardless of the timing of the related cash flows. Property taxes are recognized as revenues in the year for which they are levied. Grants and similar items are recognized as revenue as soon as all eligibility requirements imposed by the provider have been met.
Governmental fund financial statements are reported using the current financial resources measurement focus and the modified accrual basis of accounting. Revenues are recognized as soon as they are both measurable and available. Revenues are considered to be available when they are collectible within the current period or soon enough thereafter to pay liabilities of the current period. For this purpose, the City considers revenues to be available if they are collected within 60 days of the end of the current fiscal period. Expenditures generally are recorded when a liability is incurred, as under accrual accounting. However, debt service expenditures, as well as expenditures related to compensated absences and claims and judgments, are recorded only when payment is due.
Property taxes, licenses, interest and special assessments are all considered to be susceptible to accrual and so have been recognized as revenues of the current fiscal period. Grants and similar items are recognized as revenue as soon as all eligibility requirements imposed by the provider have been met. All other revenue items are considered to be measurable and available only when payment is received by the City.
The City reports the following major governmental funds:
The General fund is the City’s primary operating fund. It accounts for the proceeds of specific revenue sources that are restricted or committed to expenditures for specified purposes other than debt service and capital projects.
The Public Improvement Construction fund accounts for proceeds of bonds sold and special assessments collected to finance street, drainage, and lateral utility construction within the City.
The Capital Improvement Maintenance fund accounts for the accumulation of resources to be used for capital improvements and maintenance of City property.
The City reports the following major proprietary funds:
The Water fund accounts for the operations of the City water system.
The Wastewater fund accounts for the operations of the City wastewater service.
The Stormwater fund accounts for the operations of the City’s stormwater system.
The Liquor fund accounts for the operations of the City’s three retail liquor stores and the operations of the City-owned Den Road building which is leased to City liquor operations and other tenants.
Additionally, the city reports the following fund types:
Internal Service funds are used to account for the financing of goods or services provided by one department or agency to other departments or agencies of the
61
City of Eden Prairie, Minnesota
Notes to Financial Statements
government and to other government units, on a cost reimbursement basis. Internal Service funds include Health & Benefits, Dental, Severance, Workers Compensation, Property Insurance, Facilities, Fleet, and Information Technology.
Fiduciary funds include Custodial funds that account for evidence held by the Police department in the Escrow fund, WAFTA, Metropolitan Council Environmental Services funds MCES , Fencing and the 494 Corridor Commission.
As a general rule the effect of interfund activity has been eliminated from the government-wide financial statements. Exceptions to this rule are payments in-lieu of taxes and other charges between the City’s water, wastewater, and storm water function and various other functions of the City. Elimination of these charges would distort the direct costs and program revenues reported from the various functions concerned.
Proprietary funds distinguish operating revenues and expenses from nonoperating items. Operating revenues and expenses generally result from providing services and producing and delivering goods in connection with a proprietary fund’s principal ongoing operations. The principal operating revenue of the City’s proprietary funds are charges to customers for sales and services. Operating expenses for proprietary funds include the cost of sales and services, administrative expenses, and depreciation on capital assets. All revenues and expenses not meeting this definition are reported as nonoperating revenues and expenses.
Assets, Liabilities, Deferred Outflows/Inflows of Resources, and Net Position/Fund Balance
Cash and Investments
Cash and investments, except for small amounts of cash on hand, are deposited in pooled accounts of the City. The City invests cash surpluses in these accounts; and investment earnings, as well as gains and losses on sales of securities, are allocated to the various funds on the basis of average cash balances. Funds with deficit cash balance averages interfund payable are charged interest equivalent to the average investment earnings lost in financing the deficits. For purposes of the statement of cash flows, the Proprietary funds consider all unrestricted investments held in the pooled accounts of the City to be cash equivalents because this pool is used essentially as a demand deposit account.
Investments are stated at their fair value as determined by quoted market prices, except for money market investments and participating interest-earning investment contracts that have a remaining maturity at time of purchase of one year or less which are recorded at amortized cost, provided that the fair value of those investments is not significantly affected by the impairment of the credit standing of the issuer or by other factors. Money market investments are short-term, highly liquid debt instruments including commercial paper, banker's acceptances, and U.S. Treasury and agency obligations. Investments in external investment pools that meet the criteria of GASB Statement No. 79 are valued at amortized costs. If an external investment pool does not meet the criteria established by this Statement, that pool should apply the provisions in paragraph 16 of Statement No. 31.
62
City of Eden Prairie, Minnesota Notes to Financial Statements
Interfund Receivables/Payables
Activity between funds that are representative of lending/borrowing arrangements outstanding at the end of the fiscal year are referred to as “due to/from other funds” i.e., the current portion of interfund loans or advances to/from other funds. All other outstanding balances between funds are reported as “due to/from other funds.” Any residual balances outstanding between the governmental activities and business-type activities are reported in the government-wide financial statements as “internal balances.”
Inventories and Prepaid Items
Liquor fund inventories are valued at average cost. The Fleet fund’s inventories are valued at cost. All inventories use the first-in/first-out FIFO method. Inventories and prepaids of governmental funds are recorded as expenditures when consumed rather than when purchased. Certain payments to vendors reflect costs applicable to future accounting periods and are recorded as prepaid items in both government-wide and fund financial statements.
Capital Assets
Capital assets, which include property, plant, equipment, and infrastructure assets e.g., roads, bridges, sidewalks, and similar items , are reported in the applicable governmental or businesstype activities columns in the government-wide financial statements. Capital assets are defined by the City as assets with an initial individual cost of more than $25,000 and an estimated useful life in excess of 1 year. Such assets are recorded at historical cost or estimated historical cost if purchased or constructed. Donated capital assets are recorded at acquisition value at the date of donation. Lease assets and information technology subscription assets are recorded based on the measurement of payments applicable to the lease and subscription term.
The costs of normal maintenance and repairs that do not add to the value of the asset or materially extend assets lives are not capitalized.
The City has chosen to use the modified approach for its infrastructure assets which means the following criteria will take place:
The City will preserve and maintain infrastructure assets at a condition level of 70.
The Engineering department will be in charge of determining the appropriate condition level at which these assets are to be maintained.
The City will maintain an inventory of these assets and perform a condition assessment every 3 years to establish that the condition level of 70 is being maintained.
The City will make annual estimates of the amounts that must be expended to preserve and maintain these assets at the condition level of 70.
63
City of Eden Prairie, Minnesota
Notes
to Financial Statements
Property, plant, and equipment, except for infrastructure, of the City are depreciated or amortized using the straight-line method over the following estimated useful lives:
Buildings 5-50 years
Land improvements 10-50 years
Leasehold improvements 10-25 years
Lease Assets shorter of useful life or lease term
Subscription Assets shorter of useful life or subscription term
Equipment 5-30 years
Autos 5-20 years
Other assets 5-30 years
Distribution system 25-50 years
Intangible assets 3 years
Deferred Outflows/Inflows of Resources
In addition to assets, the statement of financial position includes a separate section for deferred outflowsofresources . This separate financial statement element, deferred outflows of resources, represents a consumption of net assets that applies to a future period s and will not be recognized as an outflow of resources expense/ expenditure until then. The City has three items that qualify for reporting in this category. It is the deferred charge on refunding reported in the government-wide statement of net position, and deferred amounts related to pension and OPEB. The deferred charge on refunding resulted from the difference between the carrying value of refunded debt and its reacquisition price. This amount is deferred and amortized over the shorter of the life of the refunded or refunding debt. The deferred amounts related to pension and OPEB relate differences between estimated and actual investment earnings, changes in actuarial assumptions, and other pension and OPEB related changes.
In addition to liabilities, the statement of financial position includes a separate section for deferred inflows of resources. Deferred inflows of resources represent an acquisition of net assets that applies to a future period s and so will not be recognized as an inflow of resources revenue until that time. The City has three items that qualify for reporting in this category. Unavailable revenue is reported only in the governmental funds balance sheet. The governmental funds report unavailable revenues from four sources: property taxes, special assessments, state shared taxes and loans/invoices not collected within 60 days. The City also reports deferred amounts related to leases. These amounts are deferred and recognized as an inflow of resources in the period that the amounts become available. In the government-wide financial statements the City reports deferred amounts related to leases and deferred amounts related to pension and OPEB.
Pensions
For purposes of measuring the net pension liability, deferred outflows/inflows of resources, and pension expense, information about the fiduciary net position of the Public Employees Retirement Association PERA and the relief association and additions to/deductions from PERA’s and the relief association fiduciary net position have been determined on the same basis as they are reported by PERA and the relief association except that PERA’s fiscal year end is June 30. For this
64
City of Eden Prairie, Minnesota
Notes to Financial Statements
purpose, plan contributions are recognized as of employer payroll paid dates and benefit payments and refunds are recognized when due and payable in accordance with the benefit terms. Investments are reported at fair value. For the governmental activities, the net pension liability will be liquidated through the General fund.
For purposes of measuring the liability, deferred outflows of resources and deferred inflows of resources, and expense associated with the City’s requirement to contribute to the Eden Prairie Firefighter Relief Association, information about the Plan’s fiduciary net position and additions to/deductions from the Eden Prairie Firefighter Relief Association Plan’s fiduciary net position have been determined on the same basis as they are reported by the Plan. For this purpose, benefit payments including refunds of contributions are recognized when due and payable in accordance with the benefit terms. Investments are reported at fair value.
Postemployment Benefits Other Than Pensions OPEB
For purposes of measuring the total OPEB liability, deferred outflows/inflows of resources related to OPEB, and OPEB expense, the City recognizes benefit payments when due and payable in accordance with the benefit terms. The City’s benefit payments consist of the implicit rate subsidy, and subsidized premiums for officers injured in the line of duty. Other post-employment benefits are generally liquidated through the Health and Benefits Internal Service funds.
Compensated Absences
The City compensates employees upon termination for unused paid time off PTO . Such pay will be reflected as a liability in the government-wide financial statement and accrued as an expense as it is earned in an internal service fund.
General Property Taxes
Property tax levies are set by the City Council in December each year and are certified to Hennepin County for collection in the following year. In Minnesota, counties act as collection agents for all property taxes.
The County spreads all levies over taxable property. Such taxes become a lien on January 1 and are recorded as receivables by the City at that date. Revenues are accrued and recognized in the year collectible, net of delinquencies.
Real property taxes may be paid by taxpayers in two equal installments on May 15 and October 15. Personal property taxes may be paid on February 28 and June 30. The County provides tax settlements to taxing districts in February, June, and December.
In the governmental fund financial statements, taxes that remain unpaid at December 31 are classified as delinquent taxes receivable and are fully offset by unavailable revenue because they are not available to finance current expenditures.
Special Assessment Levies
Special assessments represent the financing for public improvements paid for by the benefiting property owner. In the fund financial statements, special assessment revenue and related interest
65
City of Eden Prairie, Minnesota
Notes to Financial
Statements
income is generally recognized in the year collected. Hennepin County acts as the billing and collection agent. Amounts collected by the County during the year that have not yet been remitted to the City are considered collections for purposes of revenue recognition.
Deferred special assessments receivable represents principal amounts due in future years. Special deferred assessments receivable includes Green Acres, disability, senior citizen owned property or other qualified hardship properties. These special assessments are deferred until such time the property loses its exempt status. While these taxes remain a valid receivable, the timing of their collection is uncertain. Interest accrues from the year of the deferment.
Delinquent special assessments receivable represents special assessments principal and interest that are past due. In the governmental fund financial statements, deferred and delinquent special assessments receivable are fully offset by deferred inflows of resources because such assessment revenue is not available currently.
Long-term Obligations
In the government-wide financial statements and proprietary fund financial statements, long-term debt and other long-term obligations are reported as liabilities in the statement of net position. Bond premiums and discounts are amortized over the life of the bonds using the effective interest method. Bonds payable are reported net of the applicable bond premium or discount.
In the fund financial statements, governmental fund types recognize bond premiums and discounts, as well as bond issuance costs, during the current period. The face amount of debt issued is reported as other financing sources. Premiums and discounts on debt issuances are reported as other financing sources/uses. Issuance costs, whether or not withheld from the actual debt proceeds received, are reported as debt service expenditures.
Fund Balance Classifications
In the fund financial statements, governmental funds report fund balance in classifications that disclose constraints for which amounts in those funds can be spent. These classifications are as follows:
Nonspendable-consists of amounts that are not in spendable form, such as prepaid assets and assets that are legally or contractually required to be maintained intact.
Restricted-consists of amounts related to externally imposed constraints established by creditors, grantors or contributors; or constraints imposed by state statutory provisions.
Committed-consists of internally imposed constraints. These constraints are established by Resolution of the City Council. Only the Council can remove or change the constraints placed on committed fund balances by resolution.
Assigned-consists of internally imposed constraints. These constraints reflect the specific purpose for which it is the City’s intended use. These constraints are established by the City council and/or management. Pursuant to City Council Resolution, the City Manager or Finance Manager is authorized to establish assignments of fund balance.
Unassigned-is the residual classification for the general fund and also reflects negative residual amounts in other funds.
66
City of Eden Prairie, Minnesota
Notes
to Financial Statements
When both restricted and unrestricted resources are available for use, it is the City’s policy to first use restricted resources, and then use unrestricted resources as they are needed. When unrestricted resources are available for use, it is the City’s policy to use resources in the following order: 1 committed 2 assigned 3 unassigned.
The City’s fund balance policy requires the unassigned for working capital fund balance component to equal 50% of the next year’s budgeted tax revenue. In recognition that the amount for working capital only covers operating costs for the first six months of the year, the City will maintain an unassigned fund balance component for budget stabilization which is 10% of the next year’s budget in fund balance for budget stabilization and 5% of the next year’s budget for budget balancing in the general fund. If the balance falls below 15%, a plan would be developed and implemented to replenish the fund.
Prior Period Comparative Financial Information/Reclassification
The financial statements include certain prior year partial comparative information but not at the level of detail required for a presentation in conformity with accounting principles generally accepted in the United States of America. Accordingly, such information should be read in conjunction with the City’s financial statements for the year ended December 31, 2022, from which the summarized information was derived. Also, certain amounts presented in the prior year data have been reclassified in order to be consistent with the current year’s presentation.
Change in Accounting Principle
For the year ended December 31, 2023, the City implemented GASB statement 96, SubscriptionBased Information Technology Arrangements SBITAs . This statement establishes standards of accounting for SBITAs. SBITAs provide governments with access to vendors’ IT software for subscription payments without granting perpetual licenses or title to the software. A government must recognize a subscription liability and right to use subscription asset. The implementation of this standard resulted in an adjustment of capital assets and long-term liabilities.
Note 2—Stewardship, Compliance and Accountability
Budgetary Information
An annual budget is adopted on a basis consistent with generally accepted accounting principles for the General fund. The City does not budget for governmental funds other than the General fund. All annual appropriations lapse at fiscal year end.
The proposed budget is presented to the City Council for review. The Council then holds a truthin-taxation meeting after which a final General Fund annual budget is legally adopted by no later than December 31.
The appropriated budget is prepared by department and division. The City’s directors and division managers may make transfers of appropriations within a division. Transfers of appropriations between departments require the approval of the City Manager. The legal level of budgetary control is the fund level. Any changes in the total budget of each fund must be approved by a majority vote of the City Council. During the year, adjustments between the original and final
67
City of Eden Prairie, Minnesota
Notes to Financial Statements
General fund amended budget resulted in an increase of $21,250. Following are changes made to the original budget during the year:
General fund expenditures equal $53,401,278 or 98.1% of the annual amount budgeted of $54,443,657. All departments have spent less than 100% of the amounts budgeted.
Deficit Fund Equity
The following governmental funds had deficit fund balance/net position at December 31, 2023:
The fund balance deficits of these individual Capital Project funds will be financed by municipal state aid, special assessments and other future City planned funding as identified in the City’s Capital Improvement Plan. The fund balance deficit of the Severance and Workers Compensation Internal Service funds will be financed by user charges. The fund balance deficit of the Health and Benefits fund is due to the OPEB liability which the City will not fund since it pertains only to the Implicit Rate.
Note 3—Cash and Investments
Components of Cash and Investments
Cash and investments at year-end consist of the following:
Sustainable Eden PrairieEducation & outreach costs for electrification education 21,250 $ 21,250 $ Major Funds: Public Improvement Construction517,835 $ Non-Major Governmental Funds: Willow Creek Utilities45,959 Internal Service Funds: Health and Benefits823,167 Severance907,238 Workers Compensation293,782 Investments
Total
68
143,546,118 $ Cash on hand 40,711
143,586,829 $
City of Eden Prairie, Minnesota
Notes to Financial Statements
Cash and investments are presented in the financial statements as follows:
Statement of Net Position
Cash and cash equivalents142,943,786 $
Statement of Fiduciary Net Position
Cash and investments
Deposits
643,043
143,586,829 $
In accordance with Minnesota Statutes, the City maintains deposits at those depository banks authorized by the City Council, including checking accounts and certificates of deposits.
The following is considered the most significant risk associated with deposits:
Custodial Credit Risk
In the case of deposits, this is the risk that in the event of a bank failure, the City’s deposits may be lost.
Minnesota Statutes require that all deposits be protected by federal deposit insurance, corporate surety bond, or collateral. The fair value of collateral pledged must equal 110% of the deposits not covered by federal deposit insurance or corporate surety bonds. Authorized collateral includes treasury bills, notes, and bonds; issues of U.S. government agencies; general obligation rate “A” or better; revenue obligations rate “AA” or better; irrevocable standard letters of credit issued by the Federal Home Loan Bank; and certificated of deposit.
Minnesota Statues require that securities pledged as collateral be held in safekeeping in a restricted account at the Federal Reserve Bank or in an account at a trust department of a commercial bank or other financial institution that is not owned or controlled by the financial institution furnishing the collateral. It is the City’s policy to limit collateral to what is authorized by Minnesota Statutes.
At year-end, the carrying amount of the City’s deposits was $0 while the balance on the bank records was $0. At December 31, 2023, all deposits were fully covered by federal depository insurance, surety bonds, or by collateral held by the City’s agent in the City’s name.
69
City of Eden Prairie, Minnesota Notes to Financial Statements
Investments
As of December 31, 2023, the city had the following investments and maturities:
Investment Maturities (in Years)
* The weighted average life of mortgage-backed securities are no more than seven 7 years from the date of purchase.
Moody’s Investors Service was used as the primary agency for the municipal bond ratings, in the case that Moody’s did not provide a rating a Standard & Poor’s was used.
Investments are subject to various risks, the following of which are considered the most significant.
Interest
Rate Risk
Per City policy, the City will match its investments with anticipated cash flow requirements. Unless matched to a specific cash flow, the City will not directly invest in securities maturing more than seven 7 years from the date of purchase or for mortgage-backed securities, the weighted average life must be no more than seven 7 years from the date of purchase. The intent to invest in securities with longer maturities will be disclosed to the City Council. Currently, the City does Less 1 to 7 TotalThan 1 YearYears*
U.S. Agencies 76,151,649 $ 11,555,096 $ 64,596,553 $ Municipal Bonds 18,853,716 12,949,058 5,904,658 Commercial Paper 990,330 990,330Negotiable Certificate of Deposit8,892,651 7,435,603 1,457,048 Mutual Funds 38,657,772 38,657,772Total 143,546,118 $ 71,587,859 $ 71,958,259 $
Negotiable USMunicipalCertificateCommercial Mutual
DepositPaperFundsTotal Moody's Aaa58,895,377 $ 7,844,009 $ - $ - $ - $ 66,739,386 $ Aa1- 4,460,307 - - - 4,460,307 Aa2- 1,193,428 - - - 1,193,428 Aa3- 865,449 - - - 865,449 N/A, N/R16,121,675 - 8,892,651 990,330 38,657,772 64,662,428 S&P AA- 797,762 - - - 797,762 AA+ 1,134,597 808,338 - - - 1,942,935 AAA - 2,884,423 - - - 2,884,423 76,151,649 $ 18,853,716 $ 8,892,651 $ 990,330 $ 38,657,772 $ 143,546,118 $ 70
AgenciesBondsof
City of Eden Prairie, Minnesota
Notes to Financial Statements
not have any investments with an expected average life greater than seven years from the date of purchase.
Credit Risk
It is the City’s policy to limit its investments to the following types, which are also authorized by Minnesota Statutes:
Direct obligations or obligations guaranteed by the United States or its agencies, its instrumentalities or organizations created by an act of congress, excluding mortgagebacked securities defined as high risk.
Shares of investment companies registered under the Federal Investment Company Act of 1940 and whose only investments are in securities described above or in general obligation tax exempt securities or repurchase or reverse repurchase agreements.
Repurchase or reverse repurchase agreements with banks that are members of the Federal Reserve System with capitalization exceeding $10,000,000: a primary reporting dealer in U.S. government securities to the Federal Reserve Bank of New York; certain Minnesota securities broker-dealers, or a bank qualified as a depositor.
Commercial paper issued by United States corporations or their Canadian subsidiaries, of the higher quality, and maturing in 270 days or less.
Banker’s acceptance of U.S. banks eligible for purchase by the Federal Reserve System.
General obligations of a state or local government.
Money market mutual funds meeting the conditions of rule 2a-7 of the Securities and Exchange Commission. The fair value of the position in the pool is the net asset value per share provided by the pool.
Custodial Credit Risk
For an investment, custodial credit risk is the risk that in the event of the failure of the counterparty, the city will not be able to recover the value of its investments or collateral securities that are in the possession of an outside party. The City’s investments are held in safe keeping. The City’s investment policy specifically addresses custodial credit risk by requiring investments to be held at the Federal Reserve Bank or any bank authorized under the laws of the United States.
Concentration Risk
This is the risk associated with investing a significant portion of the City’s investment considered 5 percent or more in the securities of a single issuer, excluding U.S. guaranteed investments such as Treasuries , investment pools, and mutual funds. The City’s investment policy specifically addresses the City’s desire to limit risk by avoiding over concentration in securities from a specific issuer and by setting allocation guidelines to diversify the types of securities in the portfolio. At year end, the City did hold the following investments in securities with a single issuer which exceeded 5%.
IssuerPercentage FHLMC9.0% 71
City of Eden Prairie, Minnesota Notes to Financial Statements
Fair Value Measurements
The City uses fair value measurements to record fair value adjustments to certain assets and liabilities and to determine fair value disclosures. The City follows an accounting standard that defines fair value, establishes a framework for measuring fair value, establishes a fair value hierarchy based on the quality of inputs used to measure fair value, and requires expanded disclosures about fair value measurements. In accordance with this standard, the City has categorized its investments, based on the priority of the inputs to the valuation technique, into a three-level fair value hierarchy.
The fair value hierarchy gives the highest priority to quoted prices in active markets for identical assets or liabilities Level 1 and the lowest priority to unobservable inputs Level 3 . If the inputs used to measure the financial instruments fall within different levels of the hierarchy, the categorization is based on the lowest level input that is significant to the fair value measurement of the instrument. Financial assets and liabilities recorded on the combined statements of financial position are categorized based on the inputs to the valuation techniques as follows:
Level 1 – Financial assets and liabilities are valued using inputs that are unadjusted quoted prices in active markets accessible at the measurement date of identical financial assets and liabilities.
Level 2 – Financial assets and liabilities are valued based on quoted prices for similar assets, or inputs that are observable, either directly or indirectly for substantially the full term through corroboration with observable market data.
Level 3 – Financial assets and liabilities are valued using pricing inputs which are unobservable for the asset, inputs that reflect the reporting entity’s own assumptions about the assumptions market participants and would use in pricing the asset.
143,546,118 $
Level 1Level 2Level 3Total U.S. Agencies52,121,556 $ 24,030,093 $ - $ 76,151,649 $ Municipal Bonds- 18,853,716 - 18,853,716 Negotiable Certificates of Deposit- 5,292,987 - 5,292,987 52,121,556 $ 48,176,796 $ - $ 100,298,352 Investments measured at amortized cost43,247,766
72
City of Eden Prairie, Minnesota Notes to Financial Statements
Note 4—Capital Assets
Capital asset activity for the year ended December 31, 2023 was as follows:
Change in Accounting 2023Principle/ 2023 BeginningPrior Period Ending Balance AdjustmentIncreasesDecreasesTransfersBalance GOVERNMENTAL ACTIVITIES Capital Assets, Not Depreciated/Amortized Land $22,068,182 $- $51,382 $ - $ - $22,119,564 Infrastructure 139,374,845 - 777,837 - 2,975,295 143,127,977 Work in Progress 5,409,234 - 6,456,115 - (5,667,674) 6,197,675 Total Capital Assets, Not Depreciated/Amortized166,852,261 - 7,285,334 - (2,692,379) 171,445,216 Capital Assets, Depreciated/Amortized Buildings 74,212,763 - 207,980 82,289 - 74,338,454 Land Improvements 24,788,346 67,723 207,345 62,030 736,565 25,737,949 Leased Equipment 116,896 - - - - 116,896 Subscription Assets - 1,035,865 161,359 - - 1,197,224 Leasehold Improvements 77,318 - - - - 77,318 Machinery and Equipment 5,150,558 589,464 656,265 302,399 (86,207) 6,007,681 Autos 13,286,424 - 861,102 403,240 977,734 14,722,020 Other Assets 11,043,490 291,972 610,074 202,935 278,724 12,021,325 Total Capital Assets, Depreciated/Amortized 128,675,795 1,985,024 2,704,125 1,052,893 1,906,816 134,218,867 Total Capital Assets, Cost 295,528,056 1,985,024 9,989,459 1,052,893 (785,563) 305,664,083 Less Accumulated Depreciation/Amortization for Buildings 29,298,705 - 2,263,141 71,058 - 31,490,788 Land Improvements 13,358,680 - 1,120,493 62,030 - 14,417,143 Leased Equipment 19,458 - 23,824 - - 43,282 Subscription Assets - - 308,547 - - 308,547 Leasehold Improvements 76,855 - 293 - - 77,148 Machinery and Equipment 4,147,098 - 442,781 302,399 (86,207) 4,201,273 Autos 9,447,593 - 791,950 380,501 86,207 9,945,249 Other Assets 7,120,350 - 658,853 201,933 - 7,577,270 Total Accumulated Depreciation/Amortization 63,468,739 - 5,609,882 1,017,921 - 68,060,700 Total Capital Assets, Depreciated/Amortized, Net65,207,056 1,985,024 (2,905,757) 34,972 1,906,816 66,158,167 Governmental Activities Capital Assets, Net$232,059,317 $1,985,024 $4,379,577 $34,972 $(785,563) $237,603,383 73
City of Eden Prairie, Minnesota Notes to Financial Statements
2023 2023 BeginningPrior PeriodEnding Balance Adjustment IncreasesDecreasesTransfersBalance BUSINESS-TYPE ACTIVITIES Capital Assets, Not Depreciated/Amortized Land$1,057,955 $- $ - $ - $ - $1,057,955 Work in Progress 348,360 - 1,648,481 - (414,529) 1,582,312 Total Capital Assets, Not Depreciated/Amortized1,406,315 - 1,648,481 - (414,529) 2,640,267 Capital Assets, Depreciated/Amortized Land Improvements 434,190 - 173,325 8,337 - 599,178 Buildings 59,361,370 - - - - 59,361,370 Distribution System 211,619,152 - 852,167 4,632 785,563 213,252,250 Leased Buildings 1,474,097 - - - - 1,474,097 Leasehold Improvements 702,855 - - - - 702,855 Machinery and Equipment 6,170,782 3,520,490 2,025,422 - 414,529 12,131,223 Autos 1,064,820 - - 26,098 - 1,038,722 Other Assets 1,071,425 - - - - 1,071,425 Total Capital Assets, Depreciated/Amortized 281,898,691 3,520,490 3,050,914 39,067 1,200,092 289,631,120 Total Capital Assets, Cost 283,305,006 3,520,490 4,699,395 39,067 785,563 292,271,387 Less Accumulated Depreciation/Amortization for Land Improvements 161,229 - 27,198 8,337 - 180,090 Buildings 39,772,611 - 1,162,728 - - 40,935,339 Distribution System 127,069,756 - 3,729,689 4,632 - 130,794,813 Leased Buildings 194,808 - 194,808 - - 389,616 Leasehold Improvements 702,855 - - - - 702,855 Machinery and Equipment 3,399,474 - 505,522 - - 3,904,996 Autos 825,900 - 31,536 26,098 - 831,338 Other Assets 108,050 - 66,143 - - 174,193 Total Accumulated Depreciation/Amortization172,234,683 - 5,717,624 39,067 - 177,913,240 Total Capital Assets, Depreciated/Amortized, Net109,664,008 3,520,490 (2,666,710) - 1,200,092 111,717,880 Business-Type Activities Capital Assets, Net$111,070,323 $3,520,490 $(1,018,229) $ - $785,563
74
$114,358,147
City of Eden Prairie, Minnesota
Notes to Financial Statements
Depreciation/Amortization expense was charged to functions/programs of the City as follows:
Governmental Activities
Administration$260,932
Community Development52,968
Police222,541
Fire549,594
Public Works346,640
Parks and Recreation2,849,354
Capital Assets Held by the Government's Internal Service Funds are Charged to the Various Functions
Based on their Usage of the Assets1,327,853
Total Depreciation/Amortization Expense
Business-Type Activities
$5,609,882
Water$3,065,370
Wastewater1,377,115
Stormwater1,042,310
Liquor232,829
Total DepreciationAmortization Expense
Note 5—Long Term Receivables
Non-Current Lease Receivable
$5,717,624
The City, as lessor, leases certain real property to several communications companies to install cell towers, as well as tenants to operate retail businesses, provide education and day care services, and for a community solar garden under long-term, non-cancellable lease agreements. These leases expire in various future years with the latest expiration date in 2050. For the year ended 2023, the City received $138,875 in interest revenue and $665,514 in lease revenue per the terms of these contracts. In addition, the City received variable payments for common area maintenance and insurance expenses of $93,734 not included in the measurement of the lease receivable.
Notes Receivable
The City has entered into note agreements with Eden Prairie residents to either improve the quality of housing and/or to increase the availability of affordable housing. These note agreements are secured by a secured lien that is placed on the property. The Rehabilitation Assistance notes have a phased repayment plan. If the loan is within 11 years of the loan date, 100% of the principal amount is due. On the 11th anniversary of the loan origination date, 90% of the loan principle is due and declines 10% a year until it is forgiven after 20 years. The Home Buyer notes are interest free and are due either when the home sells or 30 years, whichever occurs first.
The City has also entered into a note agreement with Climatech to help fund planned renovations through DEED’s Minnesota Investment Fund. The program required the City to apply for the grant on behalf of Climatech and act as a conduit between DEED and the business. If Climatech meets the
75
City of Eden Prairie, Minnesota
Notes to Financial Statements
job creation and wage commitments, $100,000 of the note principal will be forgiven. The remaining $270,000 will be repaid over 6 years at an interest rate of 2.0%. The note was paid off in 2023 and Climatech met their job creation and wage commitments.
The City has entered into a $500,000 TIF note agreement with the developer Elevate for site improvement costs to redevelop the vacant Ruby Tuesdays and Anchor Bank. The new six-story building will include 222 apartment units over approximately 13,000 square feet of retail and restaurants. The note will bear simple interest at the rate of 1% per annum. The interest and principal shall be paid on the earlier of a the end of the term of the HUD Mortgage 40 years or b a sale, refinancing, or exchange of the Project by the Developer, at which time all principal plus accrued interest shall be paid in a lump sum.
Receivables as of December 31, 2023, in the aggregate, including the applicable allowances for uncollectible accounts, are as follows:
Home Buyer Assistance Program209,064 $ Rehabilitation Assistance Program740,301 Elevate
Less: allowance for uncollectibles(237,341)
Note 6—Interfund Receivables and Payables
The composition of due to/from balances as of December 31, 2023, is as follows:
Net Total Notes Receivable1,212,024 $ Due FromDue To Other FundsOther Funds
Capital Improvement Maintenance 473,151 $ -$
Public Improvement Construction- 473,151
Non-Major Governmental Funds66,50766,507
Internal Service Funds557,359557,359
Total1, 097,017$ 1,097,017 $
The funds will be repaid as special assessment revenue, taxes, grants and other future City planned funding as identified in the City’s Capital Improvement Plan are received.
Interfund payables and receivables are representative of lending/borrowing arrangements to cover deficit cash balances.
Notes ProjectReceivable
500,000 Gross Receivables1,449,365
76
City of Eden Prairie, Minnesota Notes to Financial Statements
Note 7—Interfund Transfers
The composition of interfund transfers as of December 31, 2023, is as follows:
Assist with park program
Capital Improvement MaintenanceGeneral
Positive performance Liquor Fund
Positive performance Wastewater
Assist with capital improvements Stormwater
Public Improvement ConstructionWater
Wastewater
Stormwater
Non-Major Governmental Funds
Non-Major Governmental FundsGeneral
Wastewater
Assist with capital improvements
Assist with capital improvements
Assist with capital improvements
Assist with capital improvements
Assist with capital improvements
Assist with Organized Athletics
Assist with capital improvements
Assist with capital improvements
Assist with capital improvements Stormwater
Non-Major Governmental Funds
Total of transfers 11,267,947 $
Note 8—Pension Plan
Defined Benefit Pension Plans
Assist with capital improvements
Assist with capital improvements
The Health & Benefits and Enterprise Funds typically liquidate the liability related to the pensions.
Plan Description
The City participates in the following cost-sharing multiple-employer defined benefit pension plans administered by the Public Employees Retirement Association of Minnesota PERA . PERA’s defined benefit pension plans are established and administered in accordance with Minnesota Statutes, Chapters 353 and 356. PERA’s defined benefit pension plans are tax qualified plans under Section 401 a of the Internal Revenue Code.
General Employees Retirement Plan
All full-time and certain part-time employees of the City of Eden Prairie are covered by the General Employees Plan. General Employees Plan members belong to the Coordinated Plan. Coordinated Plan members are covered by Social Security.
Public Employees Police and Fire Plan
The Police and Fire Plan, originally established for police officers and firefighters not covered by a local relief association, now covers all police officers and firefighters hired since 1980. Effective
Transfers Out Amount Purpose General Water 231,831 $ Annual budgeted transfer Wastewater 162,282
Stormwater 69,549
1,000
Transfers In
Annual budgeted transfer
Annual budgeted transfer Non-Major Governmental Funds
2,661,850
800,000
30,000
338,123
124,000
22,200
470,241
824,692
20,000
450,000
Water 117,129
Capital Improvement Maintenance
117,129
51,400
4,776,521
77
City of Eden Prairie, Minnesota
Notes to Financial Statements
July 1, 1999, the Police and Fire Plan also covers police officers and firefighters belonging to local relief associations that elected to merge with and transfer assets and administration to PERA.
Benefits Provided
PERA provides retirement, disability, and death benefits. Benefit provisions are established by state statute and can only be modified by the state Legislature. Vested, terminated employees who are entitled to benefits, but are not receiving them yet, are bound by the provisions in effect at the time they last terminated their public service.
General Employees Plan Benefits
General Employees Plan benefits are based on a member’s highest average salary for any five successive years of allowable service, age, and years of credit at termination of service. Two methods are used to compute benefits for PERA's Coordinated Plan members. Members hired prior to July 1, 1989, receive the higher of Method 1 or Method 2 formulas. Only Method 2 is used for members hired after June 30, 1989. Under Method 1, the accrual rate for Coordinated members is 1.2 percent for each of the first 10 years of service and 1.7 percent for each additional year. Under Method 2, the accrual rate for Coordinated members is 1.7 percent for all years of service. For members hired prior to July 1, 1989, a full annuity is available when age plus years of service equal 90 and normal retirement age is 65. For members hired on or after July 1, 1989, normal retirement age is the age for unreduced Social Security benefits capped at 66.
Benefit increases are provided to benefit recipients each January. The postretirement increase is equal to 50 percent of the cost-of-living adjustment COLA announced by the SSA, with a minimum increase of at least 1 percent and a maximum of 1.5 percent. Recipients that have been receiving the annuity or benefit for at least a full year as of the June 30 before the effective date of the increase will receive the full increase. Recipients receiving the annuity or benefit for at least one month but less than a full year as of the June 30 before the effective date of the increase will receive a reduced prorated increase. In 2023, legislation repealed the statute delaying increases for members retiring before full retirement age.
Police and Fire Plan Benefits
Benefits for Police and Fire Plan members first hired after June 30, 2010, but before July 1, 2014, vest on a prorated basis from 50 percent after five years up to 100 percent after ten years of credited service. Benefits for Police and Fire Plan members first hired after June 30, 2014, vest on a prorated basis from 50 percent after ten years up to 100 percent after twenty years of credited service. The annuity accrual rate is 3 percent of average salary for each year of service. For Police and Fire Plan members who were first hired prior to July 1, 1989, a full annuity is available when age plus years of service equal at least 90.
Benefit increases are provided to benefit recipients each January. The postretirement increase is fixed at 1 percent. Recipients that have been receiving the annuity or benefit for at least 36 months as of the June 30 before the effective date of the increase will receive the full increase.
78
City of Eden Prairie, Minnesota
Notes to Financial Statements
Recipients receiving the annuity or benefit for at least 25 months but less than 36 months as of the June 30 before the effective date of the increase will receive a reduced prorated increase.
Contributions
MinnesotaStatutesChapter 353 sets the rates for employer and employee contributions. Contribution rates can only be modified by the state Legislature.
General Employees Plan Contributions
Coordinated Plan members were required to contribute 6.50 percent of their annual covered salary in fiscal year 2023 and the City was required to contribute 7.50 percent for Coordinated Plan members. The City’s contributions to the General Employees Fund for the year ended December 31, 2023, were $1,520,244. The City’s contributions were equal to the required contributions as set by state statute.
Police and Fire Fund Contributions
Police and Fire Plan members were required to contribute 11.80 percent of their annual covered salary in fiscal year 2023 and the City was required to contribute 17.70 percent for Police and Fire Plan members. The City’s contributions to the Police and Fire Fund for the year ended December 31, 2023, were $1,704,781. The City’s contributions were equal to the required contributions as set by state statute.
Pension Costs
General Employees Fund Pension Costs
At December 31, 2023, the City reported a liability of $13,722,493 for its proportionate share of the General Employees Fund’s net pension liability. The City’s net pension liability reflected a reduction due to the State of Minnesota’s contribution of $16 million. The State of Minnesota is considered a non-employer contributing entity and the state’s contribution meets the definition of a special funding situation. The State of Minnesota’s proportionate share of the net pension liability associated with the City totaled $378,334.
The net pension liability was measured as of June 30, 2023, and the total pension liability used to calculate the net pension liability was determined by an actuarial valuation as of that date. The City’s proportionate share of the net pension liability was based on the City’s contributions received by PERA during the measurement period for employer payroll paid dates from July 1, 2022, through June 30, 2023, relative to the total employer contributions received from all of PERA’s participating employers. The City’s proportionate share was 0.2454 percent at the end of the measurement period and 0.2438 percent for the beginning of the period.
79
City of Eden Prairie, Minnesota Notes to Financial Statements
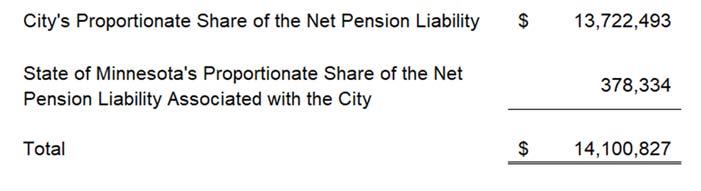
For the year ended December 31, 2023, the City recognized pension expense of $2,180,547 for its proportionate share of the General Employees Plan’s pension expense. In addition, the City recognized an additional $1,700 as pension expense and grant revenue for its proportionate share of the State of Minnesota’s contribution of $16 million to the General Employees Fund.
At December 31, 2023, the City reported its proportionate share of the General Employees Plan’s deferred outflows of resources and deferred inflows of resources related to pensions from the following sources:
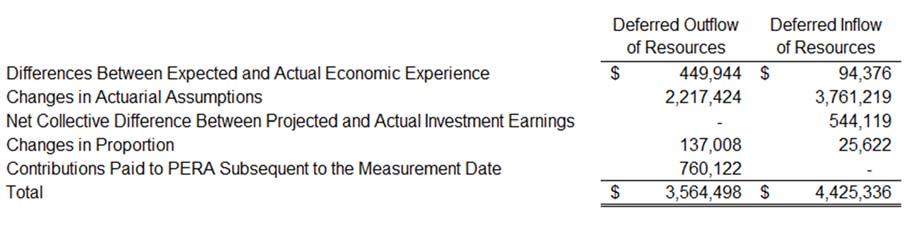
The $760,122 reported as deferred outflows of resources related to pensions resulting from the City’s contributions subsequent to the measurement date will be recognized as a reduction of the net pension liability in the year ended December 31, 2024. Other amounts reported as deferred outflows and deferred inflows of resources related to pensions will be recognized in pension expense as follows:
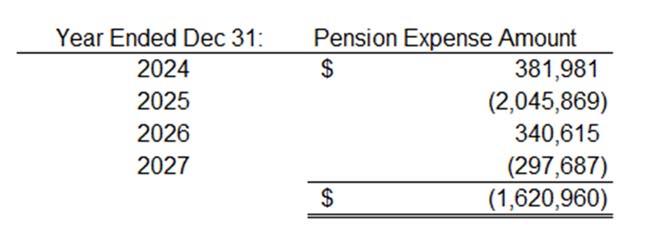
Police and Fire Plan Pension Costs
At December 31, 2023, the City reported a liability of $12,433,464 for its proportionate share of the Police and Fire Fund’s net pension liability. The net pension liability was measured as of June 30, 2023, and the total pension liability used to calculate the net pension liability was determined by an actuarial valuation as of that date. The City’s proportionate share of the net pension liability
80
City of Eden Prairie, Minnesota
Notes to Financial Statements
was based on the City’s contributions received by PERA during the measurement period for employer payroll paid dates from July 1, 2022 through June 30, 2023, relative to the total employer contributions received from all of PERA’s participating employers. The City’s proportionate share was 0.7200 percent at the end of the measurement period and 0.7260 percent for the beginning of the period.
The State of Minnesota contributed $18 million to the Police and Fire Fund in the plan fiscal year ended June 30, 2023. The contribution consisted of $9 million in direct state aid that does meet the definition of a special funding situation and $9 million in supplemental state aid that does not meet the definition of a special funding situation. The $9 million direct state was paid on October 1, 2022. Thereafter, by October 1 of each year, the state will pay $9 million to the Police and Fire Fund until full funding is reached or July 1, 2048, whichever is earlier. The $9 million in supplemental state aid will continue until the fund is 90 percent funded, or until the State Patrol Plan administered by the Minnesota State Retirement System is 90 percent funded, whichever occurs later. The State of Minnesota’s proportionate share of the net pension liability associated with the City totaled $500,827.
City's Proportionate Share of the Net Pension Liability12,433,464 $
State of Minnesota's Proportionate Share of the Net Pension Liability Associated with the City 500,827
Total12,934,291 $
The State of Minnesota is included as a non-employer contributing entity in the Police and Fire Retirement Plan Schedule of Employer Allocations and Schedule of Pension Amounts by Employer, Current Reporting Period Only pension allocation schedules for the $9 million in direct state aid. Police and Fire Plan employers need to recognize their proportionate share of the State of Minnesota’s pension expense and grant revenue under GASB 68 special funding situation accounting and financial reporting requirements. For the year ended June 30, 2023, the City recognized pension expense of $3,618,134 for its proportionate share of the Police and Fire Plan’s pension expense. The City recognized $30,164 as grant revenue and pension expense for its proportionate share of the State of Minnesota’s pension expense for the contribution of $9 million to the Police and Fire Fund.
The State of Minnesota is not included as a non-employer contributing entity in the Police and Fire Pension Plan pension allocation schedules for the $9 million in supplemental state aid. The City recognized $64,799 for the year ended December 31, 2023 as revenue and an offsetting reduction of net pension liability for its proportionate share of the State of Minnesota’s on-behalf contributions to the Police and Fire Fund.
81
City of Eden Prairie, Minnesota Notes to Financial Statements
At December 31, 2023, the City reported its proportionate share of the Police and Fire Plan’s deferred outflows of resources and deferred inflows of resources related to pensions from the following sources:
The $852,390 reported as deferred outflows of resources related to pensions resulting from the City’s contributions subsequent to the measurement date will be recognized as a reduction of the net pension liability in the year ended December 31, 2024. Other amounts reported as deferred outflows and inflows of resources related to pensions will be recognized in pension expense as follows:
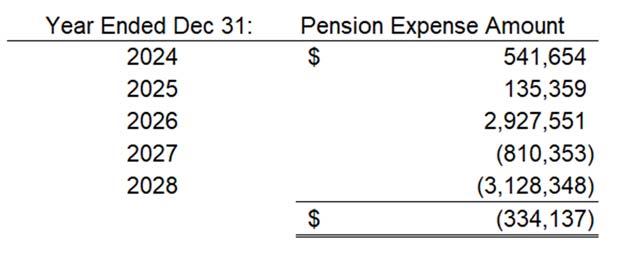
Long-Term Expected Return on Investment
The State Board of Investment, which manages the investments of PERA, prepares an analysis of the reasonableness on a regular basis of the long-term expected rate of return using a buildingblock method in which best-estimate ranges of expected future rates of return are developed for each major asset class. These ranges are combined to produce an expected long-term rate of return by weighting the expected future rates of return by the target asset allocation percentages. The target allocation and best estimates of geometric real rates of return for each major asset class are summarized in the following table:
Asset Class Target Allocation Long-Term Expected Real Rate of Return Domestic Equity 33.5% 5.10% International Equity 16.5% 5.30% Fixed Income 25.0% 0.75% Private Markets 25.0% 5.90% Total 100% Deferred Outflow of Resources Deferred Inflow of Resources Differences Between Expected and Actual Economic Experience3,419,132 $ - $ Changes in Actuarial Assumptions14,325,663 17,482,157 Net Collective Difference Between Projected and Actual Investment Earnings- 329,296 Changes in Proportion 168,805 436,284 Contributions Paid to PERA Subsequent to the Measurement Date 852,390Total 18,765,990 $ 18,247,737 $ 82
City of Eden Prairie, Minnesota
Notes to Financial Statements
Actuarial Methods and Assumptions
The total pension liability in the June 30, 2023, actuarial valuation was determined using an individual entry-age normal actuarial cost method. The long-term rate of return on pension plan investments used in the determination of the total liability is 7.0 percent. This assumption is based on a review of inflation and investments return assumptions from a number of national investment consulting firms. The review provided a range of return investment return rates deemed to be reasonable by the actuary. An investment return of 7.0 percent was deemed to be within that range of reasonableness for financial reporting purposes.
Inflation is assumed to be 2.25 percent for the General Employees Plan and 2.25 percent for the Police and Fire Plan. Benefit increases after retirement are assumed to be 1.25 percent for the General Employees Plan, and 1 percent for The Police and Fire Plan.
Salary growth assumptions in the General Employees Plan range in annual increments from 10.25 percent after one year of service to 3.0 percent after 27 years of service. In the Police and Fire Plan, salary growth assumptions range from 11.75 percent after one year of service to 3.0 percent after 24 years of service.
Mortality rates for the General Employees Plan are based on the Pub-2010 General Employee Mortality Table. Mortality rates for the Police and Fire Plan are based on the Pub-2010 Public Safety Employee Mortality tables. The tables are adjusted slightly to fit PERA’s experience.
Actuarial assumptions for the General Employees Plan are reviewed every four years. The most recent four-year experience study for the General Employees Plan was completed in 2022. The assumption changes were adopted by the Board and became effective with the July 1, 2023 actuarial valuation. The most recent four-year experience study for the Police and Fire Plan was completed in 2020 and was adopted by the Board and became effective with the July 1, 2021 actuarial valuation.
The following changes in actuarial assumptions and plan provisions occurred in 2023:
General Employees Fund
Changes in Actuarial Assumptions:
The investment return assumption and single discount rate were changed from 6.5% to 7.0%.
Changes in Plan Provisions:
An additional one-time direct state aid contribution of $170.1 million will be contributed to the Plan on October 1, 2023.
83
City of Eden Prairie, Minnesota
Notes to Financial Statements
The vesting period of those hired after June 30, 2010 was changed from five years of allowable service to three years of allowable service.
The benefit increase delay for early retirements on or after January 1, 2024, was eliminated.
A one-time, non-compounding benefit increase of 2.5 percent minus the actual 2024 adjustment will be payable in a lump sum for calendar year by March 31, 2024.
Police and Fire Fund
Changes in Actuarial Assumptions:
The investment return assumption was changed from 6.5% to 7.0%.
The single discount rate changed from 5.4% to 7.0%.
Changes in Plan Provisions:
Additional one-time direct state aid contribution of 19.4 million will be contributed to the Plan on October 1, 2023.
Vesting requirement for new hires after June 30, 2014, was changed from a graded 20year vesting schedule to a graded 10-year vesting schedule, with 50 percent vesting after five years, increasing incrementally to 100 percent after 10 years.
A one-time, non-compounding benefit increase of 3.0 percent will be payable in a lump sum for calendar year 2024 by March 31, 2024.
Psychological treatment is required effective July 1, 2023, prior to approval for a duty disability benefit for a psychological condition relating to the members’ occupation.
The total and permanent duty disability benefit was increased, effective July 1, 2023.
Discount Rate
The discount rate for the General Employees Plan used to measure the total pension liability in 2023 was 7.0 percent. The projection of cash flows used to determine the discount rate assumed that contributions from plan members and employers will be made at rates set in Minnesota Statutes. Based on these assumptions, the fiduciary net position of the General Employees and Police and Fire Funds were projected to be available to make all projected future benefit payments of current plan members. Therefore, the long-term expected rate of return on pension plan investments was applied to all periods of projected benefit payments to determine the total pension liability.
Pension Liability Sensitivity
The following presents the City’s proportionate share of the net pension liability for all plans it participates in, calculated using the discount rate disclosed in the preceding paragraph, as well as what the City’s proportionate share of the net pension liability would be if it were calculated using a discount rate one percentage point lower or one percentage point higher than the current discount rate:
84
City of Eden Prairie, Minnesota
Notes to Financial Statements
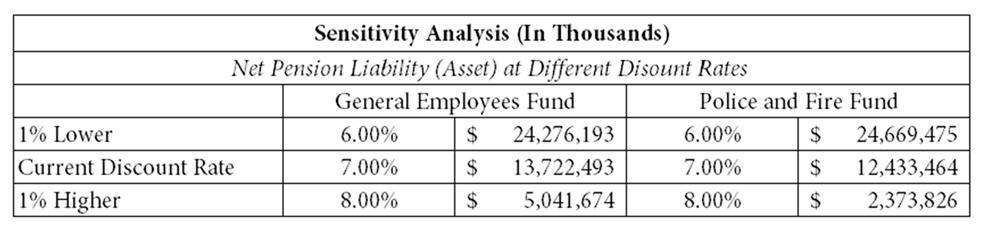
Pension Plan Fiduciary Net Position
Detailed information about each pension plan’s fiduciary net position is available in a separately issued PERA financial report that includes financial statements and required supplementary information. That report may be obtained on the Internet at www.mnpera.org.
Public Employees Defined Contribution Plan
Five council members are covered by the Defined Contribution Plan, a multiple-employer deferred compensation plan administered by PERA. The Defined Contribution Plan is a tax qualified plan under Section 401 a of the Internal Revenue Code and all contributions by or on behalf of employees are tax deferred until time of withdrawal.
Plan benefits depend solely on amounts contributed to the plan plus investment earnings, less administrative expenses. MinnesotaStatutes , Chapter 353D.03, specifies plan provisions, including the employee and employer contribution rates for those qualified personnel who elect to participate. An eligible elected official who decides to participate contributes five percent of salary which is matched by the elected official's employer. For salaried employees contributions must be a fixed percentage of salary. Employees who are paid for their services may elect to make member contributions in an amount not to exceed the employer share. Employer and employee contributions are combined and used to purchase shares in one or more of the seven accounts of the Minnesota Supplemental Investment Fund. For administering the plan, PERA receives two percent of employer contributions and twenty-five hundredths of one percent 0.25 percent of the assets in each member's account annually.
Total contributions made by the City during fiscal year 2023 were:
EmployeeEmployerEmployeeEmployer 3,533 $ 3,533 $ 5.0%5.0%5.0% Amount% of Covered Payroll Required Rates 85
City of Eden Prairie, Minnesota Notes to Financial Statements
Defined Benefit Pension Plans – Volunteer Fire Fighter’s Relief Association
Plan Description
Firefighters of the City of Eden Prairie are members of the Eden Prairie Firefighter Relief Association. The Association is the administrator of the single-employer defined benefit pension plan available to firefighters. The plan was established in 1968 and operates under the provisions of Minnesota Statutes Chapter 69, Chapter 424A, and the Association’s by-laws. As of December 31, 2022, membership includes 95 active participants, 108 retirees and beneficiaries currently receiving benefits, and 20 terminated employees entitled to but not yet receiving benefits. The plan issues a stand-alone financial statement.
Benefits Provided
Authority for payment of pension benefits is established in Minnesota Statutes §69.77 and may be amended only by the Minnesota State Legislature. Each member who is at least 50 years of age, has separated from active service with the Eden Prairie Fire Department, has served at least 10 years of active service with such department before retirement, and has been a member of the Association in good standing for at least 10 years prior to such retirement, shall be entitled to receive a service pension based on the vested amount of service time accrued. Full vesting occurs at 10 years of service, with no provision for partial vesting. Upon retirement, an irrevocable election for one of the following two plan options must be made.
Monthly Service Pension – Each eligible member electing this plan is entitled to receive a monthly service pension calculated by multiplying $56 times each year that member has been an active firefighter in the Fire Department and member in good standing of the Relief Association, up to a maximum monthly pension of $1,792.
Lump Sum Service Pension – each eligible member electing this plan is entitled to receive a one-time lump sum service pension equivalent to the base sum amount of $12,400 multiplied by the total number of years of active service.
A member of the Association who has completed 10 or more years of active service with the Fire Department and has been an active member in the Association for at least 10 years, but has not reached age 50, shall have the right to retire from the Fire Department without forfeiting the right to a service pension. The member shall be entitled to a deferred service pension, and upon attaining the age of 50, the Association shall, upon application thereof, pay the member’s pension from the date the application is approved.
A member, who is disabled with a fire service related disability, shall be eligible to collect a disability benefit. The member shall be eligible to receive the disability benefit immediately upon approval of the Board of Trustees. The disability benefit amount shall be equal to the service pension amount in effect on the date of the disability for each year of active service. A member must apply for and meet all the requirements for disability as defined in the bylaws in order to receive such benefits. A member currently receiving a disability benefit shall receive all approved
86
City of Eden Prairie, Minnesota
Notes
to Financial Statements
increases in the monthly service pension applicable to that member’s number of years of active firefighting service.
In the event of the death of an active or deferred member of the Association, the surviving spouse, if any, shall be paid 100% of the lump sum benefit for each year of service. If such member who has no surviving spouse leaves a surviving child or children, such child or children as a group shall be paid 100% of the lump sum benefit for each year of active service. If such member has no spouse and no surviving children but has a designated beneficiary on file, such beneficiary shall be paid 100% of the lump sum benefit for each year of active service. If such member has no spouse, no surviving children, and no designated beneficiary, the member’s estate shall be paid 100% of the lump sum benefit. Such death benefits are payable without regard to minimum or partial vesting requirements.
If an active member dies before completing one year of active service, the Association shall pay a death benefit to his or her surviving spouse, surviving children or designated beneficiary on file in the same order and procedure as describe above of $10,000.
In the event of the death of a retired member of the Association, the surviving spouse, if any, shall be paid until death or remarriage of the surviving spouse, monthly, two-thirds of the monthly service pension for each year of active service. If such member leaves a surviving child or children in the addition to a spouse, such child, or children, in the aggregate, shall be paid, monthly, the sum of one-third of the monthly service pension. If such member is survived only by a child or children, such child, or children, in the aggregate, shall be paid, monthly, the sum of 100% of the monthly service pension for each year of active service.
MinnesotaStatutesSection 424A.10 provides for the payment of a supplemental benefit equal to 10% of a regular lump sum distribution up to a maximum of $1,000. The supplemental benefit is in lieu of state income tax exclusion for lump sum distributions and will no longer be available if state tax law is modified to exclude lump sum distributions from state income tax. The Association qualifies for these benefits.
Contributions
MinnesotaStatuesChapter 424A.093 specifies minimum support rates required on an annual basis. The significant actuarial assumptions used to compute the municipal support are the same as those used to compute the accrued pension liability. The minimum contribution from the City of Eden Prairie and state aid is determined as follows:
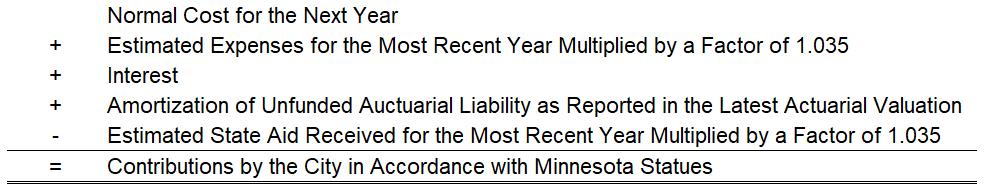
87
City of Eden Prairie, Minnesota
Notes to Financial Statements
The Plan is funded in part by fire state aid and, if necessary, City contributions. The State of Minnesota distributed to the City $600,218 in fire state aid and $9,000 of supplemental benefit paid by the City to the Relief Association for the year ended December 31, 2023. Required employer contributions are calculated annually based on statutory provisions. The City’s statutorily required contribution to the plan for the year ended December 31, 2023 was $0.
Pension Costs
At December 31, 2023, the City reported $803,054 for the Association’s net pension asset. The net pension asset was measured as of December 31, 2022, and the total pension asset used to calculate the net pension asset was determined by an actuarial valuation as of January 1, 2022.
As a result of its requirement to contribute to the Relief Association, the City recognized fire pension expense of $435,124 for the year ended December 31, 2023. At December 31, 2023, the City reported deferred outflows of resources and deferred inflows of resources from the following sources:
The City contributions to the Association subsequent to the measurement date of $600,218, reported as deferred outflows of resources, will be recognized as an addition of the net pension asset in the year ended December 31, 2024. Other amounts reported as deferred outflows and inflows of resources related to the Association’s pension will be recognized in pension expense as follows:
Year Ended Dec 31: Pension Expense Amount
2,272,599 $
Deferred Outflow of Resources Deferred Inflow of Resources Liability Gains$ 182,310 $ Changes in Actuarial Assumptions- 47,542 Investment Losses2,502,451City Contributions Subsequent to the Measurement Date 600,218Total 3,102,669 $ 229,852 $
2024(229,816) $ 2025546,033 2026884,570 20271,071,812
88
City of Eden Prairie, Minnesota
Notes to Financial Statements
Actuarial Assumptions
The actuarial total pension liability was determined as of December 31, 2021, using the following actuarial assumptions, applied to all periods included in the measurement:
Valuation Date
1/1/22
Actuarial Cost Method Entry Age Normal
Amortization Method Level Dollar Closed
Actuarial Assumptions:
Discount Rate 5.50%
Investment Rate of Return 5.50%
20-Year Municipal Bond Yield 3.50%
Age of Service Retirement Later of Age 50 or 10 years of service
Mortality
Assumed life expectancies were based on the RP-2014 Generational mortality table projected with Improvement Scale MP-2021
Disability Rate as a percent by age:
Age 20: 0.08%
Age 30: 0.08%
Age 40: 0.20%
Age 50: 0.49%
Age 55: 0.89%
25% of active disabilities are assumed to be in the line of duty or fire-service related.
Withdrawal
Percent Married
Age Difference
Form of Payment
Service 0-4 years: 7%
Service 5-9 years: 5%
Service 10 years: 10%
85%
3 Years
50% Annuity J&S if married , 50% Lump Sum
The long-term expected rate of return on pension plan investments was determined using a building-block method in which best-estimates of expected future real rates of return expected returns, net of pension plan investment expense and inflation are developed for each major asset class. These asset class estimates are combined to produce the portfolio long-term expected rate of return by weighting the expected future real rates of return by weighting the expected future real rates of return by the current asset allocation percentage or target allocation, if available and by adding expected inflation.
Best estimates of geometric real and nominal rates of return for each major asset class included in the pension plan's asset allocation are summarized in the following table:
89
City of Eden Prairie, Minnesota
Notes to Financial Statements
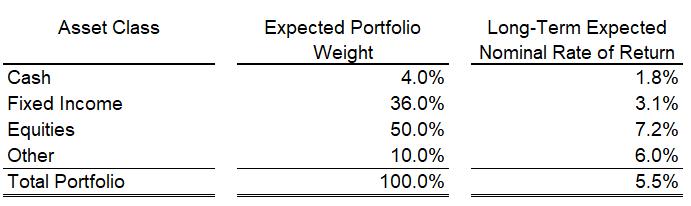
Discount Rate
The discount rate used to measure the total pension liability was 5.5%. Assets were projected using expected benefit payments and expected asset returns. Expected benefit payments by year were discounted using the expected assets return assumption for years in which the assets were sufficient to pay all benefit payments. Any remaining benefit payments after the trust fund is exhausted are discounted at the municipal bond rate of return. The equivalent single rate is the discount rate. Based on those assumptions, the pension plan's fiduciary net position was projected to be available to make all projected future benefit payments of current plan members.
Pension Liability Sensitivity
The following presents the City of Eden Prairies proportionate share of the net pension liability of the Association, calculated using the discount rate of 5.50%, as well as what the Association’s net pension liability would be if it were calculated using a discount rate that is one percentage point lower 4.50% or one percentage point higher 6.50% than the current rate:
Plan’s Fiduciary Net Position
Detailed information about the Plan’s fiduciary’s net position is available in a separately-issued report. That report may be obtained by writing to Eden Prairie Firefighter’s Association, 14800 Scenic Heights Rd., Eden Prairie, MN 55344 or by calling 952 949-8367.
1% DecreaseSelected Discount Rate1% Increase Net Pension Liability (Asset)1,468,711 $ (803,054) $ (2,691,393) $ Discount Rate4.50%5.50%6.50% 90
City of Eden Prairie, Minnesota Notes to Financial Statements
about the changes in the Plan’s net pension liability asset is as follows:
Information
2022 2021 Total Pension Liability Service Cost 473,801 $ 507,405 $ Interest 1,103,831 1,154,852 Differences Between Expected and Actual Experience - (546,930) Changes of Assumptions - (142,626) Changes of Benefit Terms -Benefit Payments, Including Member Conribution Refunds (1,739,601) (1,993,913) Net Change in Total Pension Liability (161,969) $ (1,021,212) $ Total Pension Liability - Beginning 20,465,655 $ 21,486,867 $ Total Pension Liability - Ending (a) 20,303,686 $ 20,465,655 $ Plan Fiduciary Net Position Municipal Contributions 32,827 $ 34,587 $ State Contributions 546,833 516,566 Net Investment Income (3,948,288) 2,293,858 Benefit Payments (1,739,601) (1,993,913) Administrative Expenses (31,081) (21,360) Other Changes -Net Change in Fiduciary Net Position (5,139,310) $ 829,738 $ Fiduciary Net Position - Beginning 26,246,050 $ 25,416,312 $ Fiduciary Net Position - Ending (b) 21,106,740 $ 26,246,050 $ Association's Net Pension Liability/(Asset) - Ending (a) - (b) (803,054) $ (5,780,395) $ General Employees PlanPolice and FireFire ReliefTotal Pension Expense $ 2,180,547 $ 3,618,134 $ 435,124 $ 6,233,805 Net Pension Asset - - 803,054 803,054 Net Pension Liability 13,722,493 12,433,464 - 26,155,957 Deferred Outflows 3,564,498 18,765,990 3,102,669 25,433,157 Deferred Inflows 4,425,336 18,247,737 229,852 22,902,925 91
City of Eden Prairie, Minnesota
Notes to Financial Statements
Note 9—Other Post-Employment Benefits Plan
Plan Description
The City's single-employer defined benefit OPEB plan provides OPEB for all permanent full-time employees of the City. The City’s OPEB Plan is administered by the City. The City does not administer a trust and therefore does not issue a separate report.
Benefits Provided
All retirees of the City have the option under state law to continue their medical insurance coverage through the City from the time of retirement until the employee reaches the age of eligibility for Medicare.
For members of all employee groups, the retiree must pay the full premium to continue coverage for medical and dental insurance.
The City is legally required to include any retirees for whom it provides health insurance coverage in the same insurance pool as its active employees, whether the premiums are paid by the City or the retiree. Consequently, participating retirees are considered to receive a secondary benefit known as an “implicit rate subsidy.” This benefit relates to the assumption that the retiree is receiving a more favorable premium rate than they would otherwise be able to obtain if purchasing insurance on their own, due to being included in the same pool with the City’s younger and statistically healthier active employees.
Employees Covered by Benefit Terms
At January 1, 2023, membership included 20 retirees and others currently receiving benefits, 5 spouses receiving payments and 261 active plan members.
Contributions
All post-employment benefits are based on contractual agreements with employee groups. These contractual agreements do not include any specific contribution or funding requirements.
Total OPEB Liability
The City's total OPEB liability was measured as of January 1, 2023, and was determined by an actuarial valuation as of that date. The Health & Benefits and Enterprise Funds typically liquidate the liability related to OPEB.
Actuarial Assumptions
The total OPEB liability in the January 1, 2022, actuarial valuation was determined using the following actuarial assumptions, applied to all periods included in the measurement, unless otherwise specified:
Inflation 2.5%
Salary Increases
Service graded table
Healthcare cost trend rates 6.25% as of January 1, 2023 grading to 5.00% over 5 years and then to 4.00% over the next 48 years
92
City of Eden Prairie, Minnesota
Notes to Financial Statements
Mortality rates were based on the Pub-2010 Public Retirement Plans Headcount-Weighted Mortality Tables General, Safety with MP-2021 Generational Improvement Scale.
Discount Rate
The discount rate used to measure the total OPEB liability was 4.0%. Since the plan is not funded by a trust, the discount rate is equal to the 20-year Municipal Bond Yield.
Changes in the Total OPEB Liability
Total OPEB Liability
Balances at 12/31/22 $ 3,511,989
Changes for the year:
Service Cost 118,766
Interest 70,733
Changes of Assumptions (515,195)
Benefit payments (189,099) Net changes (514,795)
Balances at 12/31/23 $ 2,997,194
Sensitivity of the Total OPEB Liability to Changes in the Discount Rate
The following presents the total OPEB liability of the City, as well as what the City's total OPEB liability would be if it were calculated using a discount rate that is 1% point lower 3.0% or 1% point higher 5.0% than the current discount rate:
DecreaseDiscount Rate1%
OPEB Liability3,263,540 $ 2,997,194
2,
Sensitivity of the Total OPEB Liability to Changes in the Healthcare Cost Trend Rates
The following presents the total OPEB liability of the City, as well as what the City's total OPEB liability would be if it were calculated using healthcare cost trend rates that are 1% point lower 5.25% decreasing to 4% or 1% point higher 7.25% decreasing to 6% than the current healthcare cost trend rates:
1% Decrease (5.25% decreasing to 4%) Healthcare Cost Trend Rates (6.25% decreasing to 5%) 1% Increase (7.25% decreasing to 6%) Total OPEB Liability2,681,519 $ 2,997,194 $ 3,369,369 $
93
1%
Increase (3.0)%(4.0)%(5.0)% Total
$
759,189$
City of Eden Prairie, Minnesota Notes to Financial Statements
OPEB Expense and Deferred Outflows of Resources and Deferred Inflows of Resources Related to OPEB
For the year ended December 31, 2023, the City recognized OPEB expense of $164,948. At December 31, 2023, the City reported deferred outflows and inflows of resources related to OPEB from the following sources:
Contributions Subsequent to the Measurement Date183,115 $ -$
Difference Between Expected and Actual528,203 104,691
Change in Assumptions175,058 779,510
Total886,376 $ 884,201$
The City’s contributions subsequent to the measurement date of $183,115, reported as deferred outflows of resources, will be recognized as a reduction of the total OPEB liability in the City’s fiscal year ended December 31, 2024. Other amounts reported as deferred inflows of resources related to OPEB will be recognized in OPEB expense as follows:
Year Ended December 31 OPEB Expense
2024(24,551) $ 2025(24,551) 2026(24,551) 2027(12,992) 20287(4,530) Thereafter(89,765) (180,940) $
Note 10—Long Term Debt
Bonds
The City issues general obligation bonds to provide funds for the acquisition and construction of major capital facilities. General obligation bonds have been issued for both governmental and business-type activities. General obligation bonds are direct obligations and pledge the full faith and credit of the City.
The City also issues assessment debt with governmental commitment to provide funds for the construction of streets and utilities. These bonds will be repaid from amounts levied against the property owners benefited by this construction. In the event that a deficiency exists because of unpaid or delinquent assessments at the time a debt service payment is due, the City must provide resources to cover the deficiency until other resources are received. Assessment debt with governmental commitment has been issued for governmental activities.
The City also issues tax abatement bonds. These bonds and interest thereon are payable from abatements collected from certain property in the City. If abatement revenues are insufficient to meet principal and interest due, the City is required to levy ad valorem taxes without limit as to rate or amount on all taxable property in the City to make up the deficiency.
Deferred Outflows of Resources Deferred Inflows of Resources
94
City of Eden Prairie, Minnesota Notes to Financial Statements
currently outstanding in thousands of dollars are as follows:
Bonds
2023Due IssueInterestOriginalAmountWithin DateRatesIssueMaturitiesOutstandingOne Year Governmental Activity Long-term Liabilities General Obligation Bonds G.O. Refunding Bonds 2020A10/28/200.85%6,081 $ 20252,455 $ 1,216$
Debt With Govt Commit G.O. Bonds of 2016A 12/29/162.30-3.00%2,360 20321,045 225 G.O. Refunding Bonds 2020A10/28/200.85%1,336 2025 544 273 Tax Abatement Bonds G.O. Tax Abatement Bonds 2021A12/08/212.00-4.00%11,940 203511,185 830 Total Governmental Activity 15,229 2,544 Unamortized Bond Premiums 1,139 Other Long-term Liabilities Finance Purchases Turn out gear 01/12/222.32%381 2027 308 74 Tasers 01/01/203.25%95 2024 18 18 Total Finance Purchases 326 92 Lease Liability 76 24 Subscription Liability 842 258 Compensated Absences 2,455 1,223 Total Long-term Liabilities 20,067 $ 4,141$ Business
Long-term Liabilities G.O. Bonds of 2016A 12/29/162.30-3.00%1,580 2027 690 165 G.O. Water Bonds 2019A 12/05/192.00-3.00%4,920 20394,140 210 G.O. Water Bonds 2021A 12/08/212.00-4.00%5,420 20375,165 290 Total Business Type Activity 11,920 9,995 665 Unamortized Bond Premiums 605 Other Long-term Liabilities Lease Liability 1,151 180 Compensated Absences 439 219 Total Long-term Liabilities 12,190 $ 1,064$ 95
Assess
Type Activitiy
City of Eden Prairie, Minnesota
Notes to Financial Statements
Annual debt service requirements to maturity for governmental and business-type activity bonds in thousands of dollars are as follows:
Years Ending 12/31PrincipalInterestPrincipalInterestPrincipalInterest 20241,216 $ 21 $ 498$29$ 830$ 347$ 20251,239 11 376 22 720 316 2026- - 105 17 755 286 2027- - 105 14 775 256 2028- - 105 12 800 224 2029- - 100 9 1,135 185 2030- - 100 7 955 144 2031- - 100 4 995 110 2032- - 100 1 1,025 79 2033- - - - 1,050 53 2034- - - - 1,060 32 2035- - - - 1,085 11 Total2,455 $ 32 $ 1,589$ 115$ 11,185 $ 2,043 $ Tax Abatement Bonds Governmental Assessment Debt with Govt Commitment G.O.BondsImprov Bonds
Ending 12/31PrincipalInterestPrincipalInterestPrincipalInterestPrincipalInterestPrincipalInterest 202492 $ 8 $ 24$ 2$ 258$ 54$ 665$ 272$ 180$ 35 $ 202576 5 24 1 158 39 685 249 188 29 202678 4 23 1 116 28 710 226 206 22 202780 2 5 1 129 19 735 202 216 15 2028- - - - 143 10 575 180 207 8 2029- - - - 38 1 595 159 122 3 2030- - - - - - 615 137 32 1 2031- - - - - - 640 117 -2032- - - - - - 660 100 -2033- - - - - - 675 84 -2034- - - - - - 685 70 -2035- - - - - - 700 56 -2036- - - - - - 715 41 -2037- - - - - - 735 26 -2038- - - - - - 300 15 -2039- - - - - - 305 7 -Total326 $ 19 $ 76$ 5$ 842$ 151$ 9,995 $ 1,941$ 1,151$ 113 $ Lease Liability Finance Purchases Revenue Bonds Subscription Liability Lease Liability Governmental Business Type 96
Years
City of Eden Prairie, Minnesota Notes to Financial Statements
Finance Purchases From Direct Borrowing
In January 2022, the City entered into a financing agreement for the purchase of turn out gear for the Fire department. Payment terms have an interest rate of 2.32% and mature in January 2027. Upon payment in full of the scheduled debt payments, the lessor’s interest in the equipment is transferred to the City, free and clear of any right or interest of the lessor. The General Fund will be used to liquidate this liability.
In 2020, the City entered into a financing agreement for the purchase of tasers for the Police department. Payment terms have an interest rate of 3.25% and mature in 2025. Upon payment in full of the scheduled debt payments, the lessor’s interest in the equipment is transferred to the City, free and clear of any right or interest of the lessor. The General Fund will be used to liquidate this liability.
Lease Liabilities
The City, as lessee, entered into long-term, non-cancellable lease agreements for copy machines and building space for its municipal liquor stores. The copy machine leases are a five-year term with the latest expiration in 2027. The liquor building leases are a ten-year term with the latest expiration in 2030. The interest and discount rate for leases ranges from 3.25% to 3.5%. Variable payments of $222,887 were made during 2023 for copy machine maintenance and common area maintenance at municipal liquor stores. These variable payments are not included in the lease liability.
The total of the City’s lease assets and accumulated amortization are $1,590,993 and $432,898, respectively, and may be found in Note 4.
Subscription Liabilities
The City entered into long-term, non-cancellable subscription-based technology arrangements for payroll and time keeping, fleet maintenance, police body cameras, emergency citizen alerts, email and City website hosting. The subscriptions range from three year to eight-year terms with the latest expiration date in 2029. The interest and discount rate ranges from 3.25% to 6.5%. Variable payments of $28,004 were made during 2023 for employee email licenses, payroll, and time keeping. These variable payments are not included in the subscription liability.
The total of the City’s subscription assets and accumulated amortization are $1,197,224 and $308,547, respectively, and may be found in Note 4.
97
City of Eden Prairie, Minnesota Notes to Financial Statements
Changes in Long Term Debt
Long-term debt activity for the year ended December 31, 2023, in thousands of dollars was as follows:
Business
Activity
For the governmental activities, the finance purchases payable are generally paid with unassigned fund balances within the General fund.
There are a number of limitations and restrictions contained in the various bond indentures. The City is in compliance with all significant limitations and restrictions. Call provisions are applicable to certain general obligation and special assessment bond issues.
Note 11—Risk Financing and Related Insurance Issues
The City is exposed to various risk of loss related to torts; thefts of, damage to and destruction of assets; errors and omissions; injuries to employees; and natural disasters. In order to protect against these risks of loss, the City purchases commercial insurance through the League of Minnesota Cities Insurance Trust, a public entity risk pool, for property insurance and workers compensation. This pool currently operates as a common risk management and insurance program for municipal entities. The City pays an annual premium to the League for its insurance coverage. The League of Minnesota Cities
Trust is self-sustaining through commercial companies for excess claims. The City is covered through the
for any
Insurance
pool
claims incurred but Change
BeginningAccounting Ending BalancePrincipleAdditionsReductionsBalance Governmental Activity G.O. Bonds 3,673 $ -$ -$ 1,218$ 2,455$ Assess. Debt With Govt Commitment Improvement Bonds 2,087 - - 498 1,589 Tax Abatement Bonds 11,940 - - 755 11,185 Issuance Premium/Discount 1,252 - - 113 1,139 Total Bonds 18,952 - - 2,584 16,368 Lease Liability 99 - - 23 76 Subscription Liability - 1,036 162 356 842 Compensated Absences 2,377 - 2,186 2,108 2,455 Finance Purchases 418 - - 92 326 Total 21,846$ 1,036 $ 2,348$ 5,163$ 20,067$
in
Revenue Bonds 10,615 $ -$ -$ 620$ 9,995$ Issuance Premium/Discount 657 - - 52 605 Total Bonds 11,272 - - 672 10,600 Lease Liability 1,314 - - 163 1,151 Compensated Absences 381 - 370 312 439 Total 12,967 $ -$ 370$ 1,147$ 12,190 $ 98
Type
City of Eden Prairie, Minnesota
Notes to Financial Statements
unreported, however, retains risk for the deductible portion of its insurance policies. The amount of these deductibles is considered immaterial to the financial statements.
During the year ended December 31, 2023, there were no significant reductions in insurance coverage from the prior year. Settled claims have not exceeded the City’s commercial coverage in any of the past three years.
The City uses its Dental Insurance Internal Service Fund to account for and finance its self-insured risk of loss for an employee dental plan. The dental plan is funded by the City, employee contributions, and investment earnings. The claims liability is included in the liabilities of the Dental Insurance Internal Service Fund at December 31, 2023, and is based on the requirement that a liability for claims be reported if information prior to issuance of the financial statements indicates that it is probable that a liability has been incurred on the date of the financial statements and the loss can be reasonably estimated.
20222023
Unpaid Claims at Beginning of Year$ -$ Incurred Claims- 253,472 Premiums and Settlements- (247,124)
Unpaid Claims at End of Year - $ 6,348$
Note 12—Contingencies
The City has been named in various legal actions. At the present time, there is no significant litigation pending that would cause a material effect on the financial statements if unfavorable rulings would result. While it is not possible to provide any probability of success or estimate of potential loss in defending any of these legal actions, the City expects to contest the allegations vigorously and does not believe these actions will have a material effect on the financial statements.
A potential claim may be asserted against the City arising out of its membership in the Western Area Firing Training Academy WAFTA . WAFTA is a joint powers entity consisting of 11 member cities that was formed in 1974 to purchase property to be used and operated as a fire training facility. In the late 1980’s, WAFTA became aware that the site was contaminated. Since that time, WAFTA has been working with the Minnesota Pollution Control Agency MPCA and other responsible parties to address the contamination issues on the site. At this time, there is not an estimated dollar amount of the cost to remediate the site nor has a claim been asserted against WAFTA or the City.
99
City of Eden Prairie, Minnesota Notes to Financial Statements
Note
13—Contract Commitments
At December 31, 2023, the City had commitments on various capital projects. These commitments totaled approximately $13,022,803. The breakdown by fund is shown below.
Fund Total
General $ 199,340
Public Improvement Construction 40,439
Capital Improvement Maintenance 1,181,859
Park Improvement 268,624
Pavement Management 145,879
Economic Development 2,019
Transportation 400,557
Water 694,198
Wastewater 1,079,894
Stormwater 390,998
Internal Service 8,618,996
$ 13,022,803
Note 14—Conduit Debt Obligations
To further economic development in the City, the City has issued bonds that provide capital financing to private-sector entities for the acquisition and construction of industrial and residential facilities. The properties financed are pledged as collateral, and the bonds are payable solely from payments received from the private-sector entities on the underlying mortgage or promissory notes. In addition, no commitments beyond the collateral, the payments from the private-sector entities, and maintenance of the tax-exempt status of the conduit debt obligation were extended by the City for any of those bonds. At December 31, 2023 the bonds have an aggregate outstanding principal amount payable of $19,530,000.
Note 15—Tax Abatements
The City enters into property tax abatement agreements through the use of tax increment financing districts with local businesses under various Minnesota Statutes. Under these statutes the City annually abates taxes collected above the districts’ base tax capacity which is established during adoption of the tax increment district. These agreements are established to foster economic development and redevelopment through creating jobs, removing blight and providing affordable housing. The City uses Minnesota Statutes 469.001 to 469.047 and 469.174 to 469.179 The Tax Increment Act to create these districts.
100
City of Eden Prairie, Minnesota
Notes to Financial Statements
For the fiscal year ended December 31, 2023, the City has one agreement established under Minnesota Statute 469.001 to 469.047 which resulted in property taxes totaling $242,164 being abated. The agreement is a pay as you go note to convert substandard property into an office and retail complex.
For the fiscal year ended December 31, 2023, the City has six agreements established under Minnesota Statute 469.174 to 469.179 The Tax Increment Act which resulted in property taxes totaling $1,960,750 being abated. The following agreements each exceeded 10 percent of the total amount abated, during the year:
• A pay as you go note to finance the cost of a senior rental housing project that provides housing in part for persons or families with low to moderate income. The abatement amount was $601,189.
• A pay as you go note to finance the cost of a rental apartment project that provides housing in part for persons or families with low to moderate income. The abatement amount was $377,639.
• A pay as you go note to finance the cost of a senior rental housing project that provides housing in part for persons or families with low to moderate income. The abatement amount was $258,597.
• A pay as you go note to finance the cost of a rental housing project that provides housing in part for persons or families with low to moderate income. The abatement amount was $675,542.
101
City of Eden Prairie, Minnesota Notes to Financial Statements
Note 16—Fund Balance Classification
At December 31, 2023, a summary of the governmental fund balance classifications are as follows:
Note 17—Prior Period Adjustment
Beginning net positions were restated to reflect a change in accounting policy related to capitalized assets in aggregate. Assets in aggregate over $50,000 are now capitalized. The net book value of these assets should have been included in the December 31, 2022 net position. The restatement of beginning net position as of January 1, 2023 due to this adjustment is shown below. Governmental activities were adjusted $949,159. Business type activities were adjusted $3,520,490. Internal service funds were adjusted $162,897 and enterprise funds were adjusted $3,520,490.
Public Capital Other ImprovementImprovementGovt GeneralConstructionMaintenanceFundsTotal Nonspendable: Prepaid Items109,576 $ -$ 14,600 $ 60,923 $ 185,099 $ Cemetery Perpetual Care- - - 201,349 201,349 Total Nonspendable 109,576 - 14,600 262,272386,448 Restricted for: Debt Service - - - 3, 146,1743,146,174 Special Assessments - - - 88,959 88,959 Park Dedication Fees - - - 3, 637,363 3,637,363 Franchise Fee - - - 1, 380,9841,380,984 Grants - - - 77,988 77,988 Cemetery - - - 310,288310,288 Police - - - 309,515309,515 Recycling - - - 101,036101,036 Historical and Cultural - - - 11,86611,866 Tax Increment - - - 3, 901,2043,901,204 - - - 12, 965,37712,965,377 Assigned to: Capital Projects - - 28,722,7696, 013,87034,736,639 Improvement Projects - - - 8, 778,6428,778,642 Total Assigned - - 28,722,76914, 792,51243,515,281 Unassigned: 33,607,091(517,835) - (45,959) 33,043,297 Total Fund Balance 33,716,667 $ (517,835) $ 28,737,369 $ 27,974,202 $ 89,910,403 $ GovernmentalBusiness TypeInternal ServiceEnterprise ActivitiesActivitiesFundsFunds Net Position as Previously Reported$294,171,398 $138,409,349 $14,241,204 $138,811,516 Prior Period Adjustment949,159 3,520,490 162,897 3,520,490 Net Position as Restated$295,120,557 $141,929,839 $14,404,101 $142,332,006 102

REQUIRED SUPPLEMENTARY INFORMATION 103
City of Eden Prairie, Minnesota
Required Supplemental Information
Modified Approach for Infrastructure Assets
Condition Rating of the City’s Street System:
Average PCI
202285.3%
201984.4%
201676.9%
201379.7%
201081.1%
200782.3%
Comparison of Needed-to-Actual Maintenance/Preservation:
20232022202120202019
$ Actual4,755,1306,008,5813,562,6814,154,9443,154,439 Difference (105,370) $ 958,081 $ (172,819) $ 1,205,444 $ 199,939 $
The condition of road pavement is measured using Good Pointe’s Icon pavement management system. Pavements in the City of Eden Prairie are visually inspected using the Paver-based Pavement Condition Index (PCI) methodology. The methodology is based on a numeric rating system ranging from 100 for a newly surfaced pavement to 0 for a failed pavement. The condition index is used to classify roads in excellent condition (85-100), very good condition (70-84), good condition (55-69), fair condition (40-54), poor condition (25-39), very poor condition (10-24) and failed condition (0-9). It is the City’s policy to maintain an average PCI of 70 percent.
3,735,500
2,949,500
2,954,500
104
Budget4,860,500 $ 5,050,500 $
$
$
City of Eden Prairie, Minnesota
Required Supplemental Information
Other Post-Employment Benefits Plan
Schedule of Changes in the City’s Total OPEB Liability and Related Ratios Last 10 Fiscal Years
Less than ten years is presented due to information not available. Will add additional years as they become available. January 1, 2023January 1, 2022January 1, 2021
Total OPEB Liability Service Cost 118,766 $ 162,530 $ 192,408 $ Interest 70,733 64,120 85,767 Changes in Plan - 18,823Difference Between Expected and Actual Experience - 704,273Changes of Assumptions (515,195) (392,033) 166,748 Benefit Payments (189,099) (177,557) (155,238) Net Change in Total OPEB Liability (514,795) 380,156 289,685 Total OPEB Liability - Beginning 3,511,989 3,131,833 2,842,148 Total OPEB Liability - Ending 2,997,194 $ 3,511,989 $ 3,131,833 $ Total OPEB Liability 2,997,194 $ 3,511,989 $ 3,131,833 $ Covered Employee Payroll 24,873,052 $ 24,148,594 $ 23,661,024 $ City's Total OPEB Liability as a Percentage of the Covered Employee Payroll 12.05% 14.54%13.24% Total OPEB Liability January 1, 2020January 1, 2019January 1, 2018 Service Cost Interest 160,108 $ 135,751 $ 143,922 $ Changes in Plan 109,426 94,001 91,272 Difference Between Expected and Actual Experience - 7,200Changes of Assumptions (209,383) -Benefit Payments 141,690 (92,512)Net Change in Total OPEB Liability (156,962) (118,903) (169,360) Total OPEB Liability - Beginning 44,879 25,537 65,834 Total OPEB Liability - Ending 2,797,269 2,771,732 2,705,898 2,842,148 $ 2,797,269 $ 2,771,732 $ Total OPEB Liability 2,842,148 $ 2,797,269 $ 2,771,732 $ Covered Employee Payroll 22,916,246 $ 22,281,528 $ 21,632,551 $ City's Total OPEB Liability as a Percentage of the Covered Employee Payroll 12.40% 12.55%12.81% 105
City of Eden Prairie, Minnesota
Required Supplemental Information
Schedule of Proportionate Share of Net Pension Liability Public Employees General Employees Retirement Fund Last Ten Years*
Fiscal Year Ending
June
Employer's Proportion (Percentage) of the Net Pension Liability (Asset)
Employer's Proportionate Share (Amount) of the Net Pension Liability (Asset) (a)
State's Proportionate Share (Amount) of the Net Pension Liability Associated with the City (b)
Employer's Proportionate Share of the Net Pension Liability and the State's Proportionate Share of the Net Pension Liability Associated with the City (a+b)
June
June
* This schedule is provided prospectively beginning with the fiscal year ended December 31, 2015. **For purposes of this schedule, covered payroll is defined as "pensionable wages."
Employer's Covered Payroll** (c)
Employer's Proportionate Share of the Net Pension Liability (Asset) as a Percentage of its Covered Payroll ((a+b)/c)
Plan
Total Pension Liability
Fiduciary Net Position as a Percentage of the
13,085,860
14,836,066
88.20% 78.2%
30, 2016 0.2482% 20,152,608 263,262 20,415,870 15,161,268 134.66% 68.9%
30, 2017 0.2536% 16,189,657 203,595 16,393,252 16,339,119 100.33% 75.9% June 30, 2018 0.2419% 13,419,620 440,302 13,859,922 16,251,609 85.28% 79.5% June 30, 2019 0.2365% 13,075,555 406,316 13,481,871 16,728,911 80.59% 80.2%
30, 2015 0.2525% 13,085,860 $ - $
$
$
June
June
0.2422% 14,520,997 447,832 14,968,829 17,272,920 86.66% 79.1%
30, 2020
30, 2021 0.2450% 10,462,598 319,529 10,782,127 17,628,443 61.16% 87.0% June 30, 2022 0.2438% 19,309,040 565,976 19,875,016 18,207,196 109.16% 76.7%
30, 2023 0.2454% 13,722,493 378,334 14,100,827 19,475,515 72.40% 83.1%
June
106
City of Eden Prairie, Minnesota
Required Supplemental Information
Schedule of Proportionate Share of Net Pension Liability
Public Employees Police and Fire Fund Last Ten Years*
Fiscal Year Ending
June
June
June
June
June 30, 2021
June
June
Employer's Proportion (Percentage) of the Net Pension Liability (Asset)
Employer's Proportionate Share (Amount) of the Net Pension Liability (Asset) (a) State Proportionate Share (Amount) of the Net Pension Liability Associated with the City City's Proportionate Share of the Net Pension Liability and the State's Proportionate Share of the Net Pension Liability Associated with the City Employer's Covered Payroll** (b)
$ N/A
N/A
* This schedule is provided prospectively beginning with the fiscal year ended December 31, 2015. **For purposes of this schedule, covered payroll is defined as "pensionable wages."
Employer's
Share
Net Pension Liability
Percentage
Payroll (a/b) Plan Fiduciary Net Position as a Percentage of the Total Pension Liability
Proportionate
of the
(Asset) as a
of its Covered
8,828,538
8,828,538
7,116,963
124.05% 86.6%
June 30, 2015 0.7770%
$
$
2016 0.7580% 30,419,859
30,419,859 7,302,618 416.56% 63.9%
30, 2017 0.7510% 10,139,393
10,139,393 7,706,718 131.57% 85.4%
30,
June
N/A
30, 2018 0.7296% 7,776,785 N/A 7,776,785 7,689,360 101.14% 88.8%
30, 2019 0.7299% 7,770,523 N/A 7,770,523 7,702,165 100.89% 89.3%
0.7225% 9,458,299 224,377 9,682,676 8,151,644 116.03% 87.2%
30, 2020
0.6933% 5,289,145 240,567 5,529,712 8,522,492 62.06% 93.7%
30, 2022 0.7260% 31,592,652 1,380,114 32,972,766 8,838,760 357.43% 70.5%
30, 2023 0.7200% 12,433,464 500,827 12,934,291 9,377,957 132.58% 86.5%
107
City of Eden Prairie, Minnesota
Required Supplemental Information
Schedule of Proportionate Share of Net Pension Liability
Eden Prairie Fire Relief - Last Ten Years*
* This schedule is provided prospectively beginning with the fiscal year ended December 31, 2014.
2022 2021 2020 2019 2018 T otal Pension Liability Service Cost 473,801 $ 507,405 $ 495,029 $ 485,127 $ 498,110 $ Interest 1,103,831 1,154,852 1,149,953 1,159,236 1,147,434 Differences Between Expected and Actual Experience - (546,930) - (27,803) (29,793) Changes of Assumption - (142,626) - (65,011) 246,754 Changes of Benefit Terms - - - - 338,844 Benefit Payments, Including Member Contribution Refunds (1,739,601) (1,993,913) (1,142,660) (2,326,728) (1,449,720) Net Change in Total Pension Liability (161,969) (1,021,212) 502,322 (775,179) 751,629 Total Pension Liability - Beginning 20,465,655 21,486,867 20,984,545 21,759,724 21,008,095 Total Pension Liability - Ending (a) 20,303,686 20,465,655 21,486,867 20,984,545 21,759,724 Plan Fiduciary Net Position Municipal Contributions 32,827 34,587 184,172 209,316 523,283 State Contributions 546,833 516,566 494,923 476,219 457,741 Net Investment Income (3,948,288) 2,293,858 2,942,302 3,828,516 (1,274,855) Benefit Payments (1,739,601) (1,993,913) (1,142,660) (2,326,728) (1,449,720) Administrative Expenses (31,081) (21,360) (29,231) (29,062) (30,772) Other Changes - - - 680 254 Net Change in Fiduciary Net Position (5,139,310) 829,738 2,449,506 2,158,941 (1,774,069) Fiduciary Net Position - Beginning 26,246,050 25,416,312 22,966,806 20,807,865 22,581,934 Fiduciary Net Position - Ending (b) 21,106,740 26,246,050 25,416,312 22,966,806 20,807,865 Association's Net Pension Liability/(Asset) Ending (a) - (b) (803,054) $ (5,780,395) $ (3,929,445) $ (1,982,261) $ 951,859 $ Fiduciary Net Position as a Percentage of the Total Pension Liability (b) / (a) 103.96%128.24%118.29%109.45%95.63% Covered Payroll N/A N/A N/A N/A Net Pension Liability/(Asset) as a Percentage of Covered Payroll N/A N/A N/A N/A 2017 2016 2015 2014 Total Pension Liability Service Cost 485,961 $ 434,587 $ 449,426 $ 413,646 $ Interest 1,123,468 1,151,849 1,104,701 1,083,202 Differences Between Expected and Actual Experience - (233,976) -Changes of Assumption - 935,047 -Changes of Benefit Terms - - -Benefit Payments, Including Member Contribution Refunds (1,084,111) (1,135,264) (1,270,544) (1,027,216) Net Change in Total Pension Liability 525,318 1,152,243 283,583 469,632 Total Pension Liability - Beginning 20,482,777 19,330,534 19,046,951 18,577,319 Total Pension Liability - Ending (a) 21,008,095 20,482,777 19,330,534 19,046,951 Plan Fiduciary Net Position Municipal Contributions 387,665 388,664 398,395 488,073 State Contributions 448,846 448,848 437,948 414,343 Net Investment Income 2,776,128 892,090 (393,362) 646,363 Benefit Payments (1,084,111) (1,137,136) (1,270,544) (1,027,216) Administrative Expenses (34,700) (56,576) (26,323) (37,158) Other Changes 671 4,426 - 81,893 Net Change in Fiduciary Net Position 2,494,499 540,316 (853,886) 566,298 Fiduciary Net Position - Beginning 20,087,435 19,547,119 20,401,005 19,834,707 Fiduciary Net Position - Ending (b) 22,581,934 20,087,435 19,547,119 20,401,005 Association's Net Pension Liability/(Asset) Ending (a) - (b) (1,573,839) $ 395,342 $ (216,585) $ (1,354,054) $ Fiduciary Net Position as a Percentage of the Total Pension Liability (b) / (a) 107.49%98.07%101.12%107.11% Covered Payroll N/A N/A N/A N/A Net Pension Liability/(Asset) as a Percentage of Covered Payroll N/A N/A N/A N/A 108
City of Eden Prairie, Minnesota
Required Supplemental Information
Schedule of Contributions
Public Employees General Employees Retirement Fund Last Ten Years*
* This schedule is provided prospectively beginning with the fiscal year ended December 31, 2015. **For purposes of this schedule, covered payroll is defined as "pensionable wages."
Year Ending Statutorily Required Contributions (a) Contributions in Relation to the Statutorily Required Contributions (b) Contribution Deficiency (Excess) (a-b) Covered Payroll**(d) Contributions as a Percentage of Covered Payroll (b/d)
31, 2015 1,164,110 $ 1,164,110 $ - $ 15,528,311 $ 7.50% December 31, 2016 1,157,735 1,157,735 - 15,436,692 7.50% December 31, 2017 1,199,292 1,199,292 - 15,990,664 7.50% December 31, 2018 1,231,656 1,231,656 - 16,470,531 7.48% December 31, 2019 1,286,909 1,286,909 - 17,163,209 7.50%
31, 2020 1,290,562 1,290,562 - 17,207,493 7.50% December 31, 2021 1,345,713 1,345,713 - 17,940,189 7.50% December 31, 2022 1,399,316 1,399,316 - 18,672,879 7.49% December 31, 2023 1,520,244 1,520,244 - 20,098,678 7.56%
December
December
109
City of Eden Prairie, Minnesota
Required Supplemental Information
Schedule of Contributions
Public Employees Police and Fire Fund Last Ten Years*
* This schedule is provided prospectively beginning with the fiscal year ended December 31, 2015. **For purposes of this schedule, covered payroll is defined as "pensionable wages."
Year Ending Statutorily Required Contributions (a) Contributions in Relation to the Statutorily Required Contributions (b) Contribution Deficiency (Excess) (a-b) Covered Payroll** (d) Contributions as a Percentage of Covered Payroll (b/d)
31, 2015 1,215,450 $ 1,215,450 $ - $ 7,509,128 $ 16.2% December 31, 2016 1,188,923 1,188,923 - 7,339,334 16.2% December 31, 2017 1,224,005 1,224,005 - 7,555,723 16.2% December 31, 2018 1,260,639 1,260,639 - 7,780,987 16.2% December 31, 2019 1,342,840 1,342,840 - 7,922,043 16.95%
31, 2020 1,464,610 1,464,610 - 8,264,270 17.72% December 31, 2021 1,543,612 1,543,612 - 8,721,153 17.70% December 31, 2022 1,596,141 1,596,141 - 9,012,516 17.71% December 31, 2023 1,704,781 1,704,781 - 9,621,206 17.72%
December
December
110
City of Eden Prairie, Minnesota
Required Supplemental Information
20232022202120202019 Statutorily Required Contribution - $ 2,320 $ 68,174 $ 184,172 203,986 Contributions in Relation to Statutorily Required Contribution - (2,320) (68,174) (184,172) (203,986) Contribution Deficiency (Excess) - $ - $ - $ - $ - $ 20182017201620152014 Statutorily Required Contribution 517,955 $ 382,336 $ 388,664 $ 398,395 $ 488,073 $ Contributions in Relation to Statutorily Required Contribution (517,955) (382,336) (388,664) (393,065) (488,073) Contribution Deficiency (Excess) - $ - $ - $ 5,330 $ - $ 111
Schedule of Contributions Eden Prairie Fire Relief Last Ten Years
City of Eden Prairie, Minnesota
Notes to Required Supplemental Information
Notes to Schedules of Changes in Net Pension Liabilities and Related Ratios
Other Post-Employment Benefits Plan
The City has no assets accumulated in a trust that meets the criteria in GASB 75.0
2023 Changes
Changes in Plan Provisions:
• For the year ending December 31,2023: None.
Changes in Actuarial Assumptions:
• The discount rate was changed from 2.00% to 4.00%
• The inflation rate was changed from 2.00% to 2.50%.
2022 Changes
Changes in Plan Provisions:
• There was a liability loss of $600,259 due to updated census data.
• There was a liability loss of $104,014 due to claims and premiums higher than expected.
• Per a special agreement, one retiree is receiving City paid medical and dental premiums until December 2023 or until they are eligible another employer’s health insurance coverage, whichever comes first. This change increased the liability $18,823.
Changes in Actuarial Assumptions:
• The health care trend rates were changed to better anticipate short term and long term medical increases.
• The mortality tables were updated from the Pub-2010 Public Retirement Plans HeadcountWeighted Mortality Tables (General, Safety) with MP-2019 Generational Improvement Scale to the Pub-2010 Public Retirement Plans Headcount-Weighted Mortality Tables (General, Safety) with MP-2021 Generational Improvement Scale.
• The salary increase rates were updated to reflect the latest experience study.
• The retirement and withdrawal rates were updated to reflect the latest experience study.
• The inflation rate was changed from 2.50% to 2.00%.
• The subsidized benefit for one officer injured in the line of duty, who is age 60 as of the valuation date, is expected to end at age 65 instead of age 62.
• The percent of future retirees electing coverage was lowered from 50% to 40%.
• These changes decreased the liability $392,033.
2021 Changes
Changes in Actuarial Assumptions:
• The discount rate was changed from 2.90% to 2.00%.
112
City of Eden Prairie, Minnesota
Notes to Required Supplemental Information
2020 Changes
Changes in Actuarial Assumptions:
• The health care trend rates, mortality tables, salary increase rates, and subsidy end date of one officer (age 58 as of the valuation date) injured in the line of duty were updated.
• The discount rate was changed from 3.80% to 2.90%.
2019 Changes
Changes in Plan Provisions:
• Per a special agreement, one retiree received City paid medical and dental premiums for six months during 2019.
Changes in Actuarial Assumptions:
• The discount rate was changed from 3.30% to 3.80%.
General Employees Fund
2023 Changes
Changes in Actuarial Assumptions
• The investment return assumption and single discount rate were changed from 6.5 percent to 7.00 percent.
Changes in Plan Provisions
• An additional one-time direct state aid contribution of $170.1 million will be contributed to the Plan on October 1, 2023.
• The vesting period of those hired after June 30, 2010, was changed from five years of allowable service to three years of allowable service.
• The benefit increase delay for early retirements on or after January 1, 2024, was eliminated.
• A one-time, non-compounding benefit increase of 2.5 percent minus the actual 2024 adjustment will be payable in a lump sum for calendar year 2024 by March 31, 2024.
2022 Changes
Changes in Actuarial Assumptions:
• The mortality improvement scale was changed from Scale MP-2020 to Scale MP-2021.
Changes in Plan Provisions:
• There were no changes in plan provisions since the previous valuation.
2021 Changes
Changes in Actuarial Assumptions:
• The investment return and single discount rates were changed from 7.50 percent to 6.50 percent, for financial reporting purposes.
• The mortality improvement scale was changed from Scale MP-2019 to Scale MP-2020.
113
City of Eden Prairie, Minnesota
Notes to Required Supplemental Information
Changes in Plan Provisions:
• There were no changes in plan provisions since the previous valuation.
2020 Changes
Changes in Actuarial Assumptions:
• The price inflation assumption was decreased from 2.50% to 2.25%.
• The payroll growth assumption was decreased from 3.25% to 3.00%.
• Assumed salary increase rates were changed as recommended in the June 30, 2019 experience study. The net effect is assumed rates that average 0.25% less than previous rates.
• Assumed rates of retirement were changed as recommended in the June 30, 2019 experience study. The changes result in more unreduced (normal) retirements and slightly fewer Rule of 90 and early retirements.
• Assumed rates of termination were changed as recommended in the June 30, 2019 experience study. The new rates are based on service and are generally lower than the previous rates for years 2-5 and slightly higher thereafter.
• Assumed rates of disability were changed as recommended in the June 30, 2019 experience study. The change results in fewer predicted disability retirements for males and females.
• The base mortality table for healthy annuitants and employees was changed from the RP2014 table to the Pub-2010 General Mortality table, with adjustments. The base mortality table for disabled annuitants was changed from the RP-2014 disabled annuitant mortality table to the PUB-2010 General/Teacher disabled annuitant mortality table, with adjustments.
• The mortality improvement scale was changed from Scale MP-2018 to Scale MP-2019.
• The assumed spouse age difference was changed from two years older for females to one year older.
• The assumed number of married male new retirees electing the 100% Joint & Survivor option changed from 35% to 45%. The assumed number of married female new retirees electing the 100% Joint & Survivor option changed from 15% to 30%. The corresponding number of married new retirees electing the Life annuity option was adjusted accordingly.
Changes in Plan Provisions
• Augmentation for current privatized members was reduced to 2.0% for the period July 1, 2020 through December 31, 2023 and 0.0% after. Augmentation was eliminated for privatizations occurring after June 30, 2020.
2019 Changes
Changes in Actuarial Assumptions:
• The morality projection scale was changed from MP-2017 to MP-2018.
Changes in Plan Provisions:
• The employer supplemental contribution was changed prospectively, decreasing from $31.0 million to $21.0 million per year. The State’s special funding contribution was changed prospectively, requiring $16.0 million due per year through 2031.
114
City of Eden Prairie, Minnesota
Notes to Required Supplemental Information
2018 Changes
Changes in Actuarial Assumptions:
• The morality projection scale was changed from MP-2015 to MP-2017.
• The assumed benefit increase was changed from 1.00 percent per year through 2044 and 2.50 percent per year thereafter to 1.25 percent per year.
Changes in Plan Provisions:
• The augmentation adjustment in early retirement factors is eliminated over a five-year period starting July 1, 2019, resulting in actuarial equivalence after June 30, 2024.
• Interest credited on member contributions decreased from 4.00 percent to 3.00 percent, beginning July 1, 2018.
• Deferred augmentation was changed to 0.00 percent, effective January 1, 2019. Augmentation that has already accrued for deferred members will still apply.
• Contribution stabilizer provisions were repealed.
• Annual increases were changed from 1.00 percent per year with a provision to increase to 2.50 percent upon attainment of 90.00 percent funding ratio to 50.00 percent of the Social Security Cost of Living Adjustment, not less than 1.00 percent and not more than 1.50 percent, beginning January 1, 2019.
• For retirements on or after January 1, 2024, the first benefit increase is delayed until the retiree reaches normal retirement age; does not apply to Rule of 90 retirees, disability benefit recipients, or survivors.
• Actuarial equivalent factors were updated to reflect revised mortality and interest assumptions.
2017 Changes
Changes in Actuarial Assumptions:
• The combined service annuity (CSA) loads were changed from 0.80 percent for active members and 60.00 percent for vested and non-vested deferred members. The revised CSA load are now 0.00 percent for active member liability, 15.00 percent for vested deferred member liability, and 3.00 percent for non-vested deferred member liability.
• The assumed postretirement benefit increase rate was changed for 1.00 percent per year for all years to 1.00 percent per year through 2044 and 2.50 percent per year thereafter.
Changes in Plan Provisions:
• The State’s contribution for the Minneapolis Employees Retirement Fund equals $16,000,000 in 2017 and 2018, and $6,000,000 thereafter.
• The Employer Supplemental Contribution for the Minneapolis Employees Retirement Fund changed from $21,000,000 to $31,000,000 in calendar years 2019 to 2031. The state’s contribution changed from $16,000,000 to $6,000,000 in calendar years 2019 to 2031.
2016 Changes
Changes in Actuarial Assumptions:
• The assumed postretirement benefit increase rate was changed from 1.00 percent per year through 2035 and 2.50 percent per year thereafter to 1.00 percent per year for all years.
• The assumed investment return was changed from 7.90 percent to 7.50 percent. The single discount rate changed from 7.90 percent to 7.50 percent.
115
City of Eden Prairie, Minnesota
Notes to Required Supplemental Information
• Other assumptions were changed pursuant to the experience study June 30, 2015. The assumed future salary increases, payroll growth, and inflation were decreased by 0.25 percent to 3.25 percent for payroll growth and 2.50 percent for inflation.
Changes in Plan Provisions
• There have been no changes since the prior valuation.
2015 Changes:
Changes in Actuarial Assumptions:
• The assumed annual increase rate was changed from 1.00 percent per year through 2030 and 2.50 percent per year thereafter to 1.00 percent per year through 2035 and 2.50 percent per year thereafter.
Changes in Plan Provisions:
• On January 1, 2015, the Minneapolis Employees Retirement Fund was merged into the General Employees Fund, which increased the total pension liability by $1.1 billion and increase the fiduciary plan net position by $892 million. Upon consolidation, state and employer contributions were revised; the State’s contribution of $6.0 million, which meets the special funding situation definition, was due September 2015.
Police and Fire Fund
2023 Changes
Changes in Actuarial Assumptions
• The investment return assumption was changed from 6.5 percent to 7.00 percent.
• The single discount rate changed from 5.4 percent to 7.0 percent.
Changes in Plan Provisions
• Additional one-time direct state aid contribution of 19.4 million will be contributed to the Plan on October 1, 2023.
• Vesting requirement for new hires after June 30, 2014, was changed from a graded 20-year vesting schedule to a graded 10-year vesting schedule, with 50 percent vesting after five years, increasing incrementally to 100% after 10 years.
• A one-time, non-compounding benefit increase of 3.0 percent will be payable in a lump sum for calendar year 2024 by March 31, 2024.
• Psychological treatment is required effective July 1, 2023, prior to approval for a duty disability benefit for a psychological condition relating to the member’s occupation.
• The total and permanent duty disability benefit was increased, effective July 1, 2023.
2022 Changes
Changes in Actuarial Assumptions:
• The mortality improvement scale was changed from Scale MP-2020 to Scale MP-2021.
• The single discount rate changed from 6.50% to 5.40%.
116
City of Eden Prairie, Minnesota
Notes to Required Supplemental Information
Changes in Plan Provisions:
• There were no changes in plan provisions since the previous valuation.
2021 Changes
Changes in Actuarial Assumptions:
• The investment return and single discount rates were changed from 7.50 percent to 6.50 percent, for financial reporting purposes.
• The inflation assumption was changed from 2.50 percent to 2.25 percent.
• The payroll growth assumption was changed from 3.25 percent to 3.00 percent.
• The base mortality table for healthy annuitants and employees was changed from the RP-2014 table to the Pub-2010 Public Safety Mortality table. The mortality improvement scale was changed from MP-2019 to MN-2020.
• The base mortality table for disabled annuitants was changed from the RP-2014 healthy annuitant mortality table (with future mortality improvement according to Scale MP2019) to the Pub-2010 Public Safety disabled annuitant mortality table (with future mortality improvement according to Scale MP-2020).
• Assumed rates of salary increase were modified as recommended in the July 14, 2020 experience study. The overall impact is a decrease in gross salary increase rates.
• Assumed rates of retirement were changed as recommended in the July 14, 2020 experience study. The changes result in slightly more unreduced retirements and fewer assumed early retirements.
• Assumed rates of withdrawal were changed from select and ultimate rates to servicebased rates. The changes result in more assumed terminations.
• Assumed rates of disability were increased for ages 25-44 and decreased for ages over 49. Overall, proposed rates result in more projected disabilities.
• Assumed percent married for active female members was changed from 60 percent to 70 percent. Minor changes to form of payment assumptions were applied.
Changes in Plan Provisions:
• There were no changes in plan provisions since the previous valuation.
2020 Changes
Changes in Actuarial Assumptions
• The morality projection scale was changed from MP-2018 to MP-2019.
Changes in Plan Provisions
• There have been no changes since the prior valuation.
2019 Changes
Changes in Actuarial Assumptions
• The morality projection scale was changed from MP-2017 to MP-2018.
Changes in Plan Provisions
• There have been no changes since the prior valuation.
117
City of Eden Prairie, Minnesota
Notes to Required Supplemental Information
2018 Changes
Changes in Actuarial Assumptions
• The morality projection scale was changed from MP-2016 to MP-2017.
Changes in Plan Provisions
• Annual increases were changed to 1.00 percent for all years, with no trigger.
• An end date of July 1, 2048 was added to the existing $9.0 million state contribution.
• New annual state aid will equal $4.5 million in fiscal years 2019 and 2020, and $9.0 million thereafter until the plan reaches 100 percent funding, or July 1, 2048, if earlier.
• Member contributions were changed from 10.80 percent to 11.30 percent of pay, effective January 1, 2019 and 11.80 percent of pay, effective January 1, 2020.
• Employer contributions were changed from 16.20 percent to 16.95 percent of pay, effective January 1, 2019 and 17.70 percent of pay, effective January 1, 2020.
• Interest credited on member contributions decreased from 4.00 percent to 3.00 percent, beginning July 1, 2018.
• Deferred augmentation was changed to 0.00 percent, effective January 1, 2019. Augmentation that has already accrued for deferred members will still apply.
• Actuarial equivalent factors were updated to reflect revised mortality and interest assumptions.
2017 Changes
Changes in Actuarial Assumptions
• Assumed salary increases were changed as recommended in the June 30, 2016 experience study. The net effect is proposed rates that average 0.34 percent lower than the previous rates.
• Assumed rates of retirement were changed, resulting in fewer retirements.
• The combined service annuity (CSA) load was 30.00 percent for vested and non-vested, deferred members. The CSA has been changed to 33.00 percent for vested members and 2.00 percent for non-vested members.
• The base mortality table for healthy annuitants was changed from the RP-2000 fully generational table to the RP-2014 fully generational table (with a base year of 2006), with male rates adjusted by a factor of 0.96. The mortality improvement scale was changed from Scale AA to Scale MP-2016. The base mortality table for disabled annuitants was changed from the RP-2000 disabled mortality table to the mortality tables assumed for healthy retirees.
• Assumed termination rates were decreased to 3.00 percent for the first three years of service. Rates beyond the select period of three years were adjusted, resulting in more expected terminations overall.
• Assumed percentage of married female members was decreased from 65.00 percent to 60.00 percent.
• Assumed age difference was changed from separate assumptions for male members (wives assumed to be three years younger) and female members (husbands assumed to be four years older) to the assumption that males are two years older than females.
• The assumed percentage of female members electing joint and survivor annuities was increased.
118
City of Eden Prairie, Minnesota
Notes to Required Supplemental Information
• The assumed annual increase rate was changed from 1.00 percent for all years to 1.00 percent per year through 2064 and 2.50 percent thereafter.
• The single discount rate was changed from 5.60 percent per annum to 7.50 percent per annum.
Changes in Plan Provisions
• There have been no changes since the prior valuation.
2016 Changes
Changes in Actuarial Assumptions
• The assumed postretirement benefit increase rate was changed from 1.00 percent per year through 2037 and 2.50 percent per year thereafter to 1.00 percent per year for all future years.
• The assumed investment return was changed from 7.90 percent to 7.50 percent.
• The single discount rate changed from 7.90 percent to 5.60 percent.
• The assumed future salary increases, payroll growth, and inflation were decreased by 0.25 percent to 3.25 percent for payroll growth and 2.50 percent for inflation.
Changes in Plan Provisions
• There have been no changes since the prior valuation.
2015 Changes
Changes in Actuarial Assumptions
• The assumed postretirement benefit increase rate was changed from 1.00 percent per year through 2030 and 2.50 percent per year thereafter to 1.00 percent per year through 2037 and 2.50 percent per year thereafter.
Changes in Plan Provisions
• The postretirement benefit increase to be paid after the attainment of the 90.00 percent funding threshold was changed from inflation up to 2.50 percent, to a fixed rate of 2.50 percent
Fire Relief
2023 Changes
• No changes since 2022 report
2022 Changes
• No changes since 2021 report
2021 Changes
• The mortality projection scale was updated from MP-2019 to MP-2021
• The termination assumption was updated to reflect experience from the last four years
119
City of Eden Prairie, Minnesota
Notes to Required Supplemental Information
2020 Changes
• No changes since 2019 report
2019 Changes
• The mortality projection scale was updated from MP-2017 to MP-2019
2018 Changes
• The lump sum benefit level was increased from $10,000 to $12,400
• The mortality projection scale was updated from MP-2016 to MP-2017
• The termination decrement scale was updated to reflect a recent experience study
• The lump sum election rate was changed from 20% to 50%
2017 Changes
• No changes since 2016 report
2016 Changes
• The base mortality table was updated from the RP-2014 Blue Collar table to the unadjusted RP-2014 table
• The mortality projection scale was updated from MP-2014 to MP-2016
2015 Changes
• No changes since 2014 report which was the year of implementation so no further changes to note.
120

COMBINING FUND STATEMENTS
121
City of Eden Prairie, Minnesota
Nonmajor Governmental Funds
Special Revenue Funds
Special revenue funds are used to account for and report the proceeds of specific revenue sources that are restricted or committed to expenditures for specified purposes other than debt service or capital projects
Housing Redevelopment Authority (HRA Grant) – This fund accounts for monies received under Title I of the Housing and Community Development Act of 1974 and other related housing activities.
Pleasant Hills Cemetery – This fund accounts for the current operations of the City cemetery including maintenance costs and lot sales.
Eden Prairie Cemetery – This fund accounts for the current operations of the City cemetery including maintenance costs and lot sales.
Grant – This fund accounts for monies received from the State. The grant will fund a police officer who will dedicate his time to decreasing DWI’s.
Recycling – This fund accounts for monies received from Hennepin County's household waste rebate programs. All dollars received are to be spent on eligible recycling programs within Eden Prairie.
Opioid Settlement – This fund accounts for monies received under the National Opioid Settlement. All dollars received are to be spent to fight the opioid crisis.
Historical and Cultural - This fund accumulates revenue from the sale of a book on Eden Prairie's 100-year history and the sale of old street signs. The book was donated to the City by the Eden Prairie Historical Society, with revenues earmarked for expenditure on the preservation of the history of Eden Prairie.
Debt Service Funds
Debt service funds are used to account for all financial resources that are restricted, committed, or assigned to expenditures for principal and interest.
General Obligation Refunding Bonds 2016A – This fund accounts for the refunding of the G.O. Bonds 2008B which accounted for the accumulation of resources needed to repay bonds issued to finance the construction of streets, lateral utilities, and drainage for the Flying Cloud Drive construction project. The primary sources of repayment on these bonds are special assessments levied on benefited properties.
General Obligation Improvement Bonds 10A/20A – This fund is used to account for the accumulation of tax revenues needed to repay bonds issued to pay the construction costs for the Singletree Lane project. G.O. Bonds 10A were refunded with G.O. Bonds 20A.
122
City of Eden Prairie, Minnesota
Nonmajor Governmental Funds
Debt Service Funds (Continued)
General Obligation Refunding 11D/20A – This fund accounts for the refunding of the G.O. Improvement Revolving Bonds which accounted for the accumulation of tax revenues needed to repay bonds issued to finance the construction at 212 and Charleston Road. G.O. Bonds 11D were refunded with G.O. Bonds 20A.
General Obligation Refunding 12A/20A – This fund accounts for the refunding of the G.O. Bonds 2005C which accounted for the accumulation of tax revenues needed to repay bonds issued to finance construction projects for various trails, park improvements and the community center. G.O. Bonds 12A were refunded with G.O. Bonds 20A.
General Obligation Refunding 12B/20A – This fund accounts for the refunding of the G.O. Bonds 2006B which accounted for the accumulation of tax revenues needed to repay bonds issued to finance construction projects for the new fire station. G.O. Bonds 12B were refunded with G.O. Bonds 20A.
General Obligation Tax Abatement 2014A/21A – This fund accounts for the accumulation of tax revenues needed to repay bonds issued to finance construction of the aquatics and fitness expansion G.O. Tax abatement 2014A were refunded with G.O. Tax Abatement Bonds 21A.
General Obligation Bonds 2016A – This fund is used to account for the accumulation of special assessments needed to repay bonds issued to finance the West 70th project.
Capital Project Funds
Capital project funds are used to account for all financial resources that are restricted, committed, or assigned to expenditures for capital outlay.
Police - This fund accounts for all confiscated money, and / or property obtained through drugrelated criminal arrests and compliance fines. The funds are earmarked for expenditures on law enforcement operations.
E-911 - This fund accounts for monies received from the State of Minnesota to be used for the E-911 emergency system.
Senior Board/EP Players - This fund was established to account for monies received for Senior Awareness Week and EP Players, a parks and recreation department theater program
Park Improvement - This fund accounts for the park dedication fees, grants, and other contributions earmarked for expenditure on park acquisition and development.
123
City of Eden Prairie, Minnesota
Nonmajor
Governmental Funds
Capital Project Funds (Continued)
CIP Trails - This fund accounts for the accumulation of resources to be used for capital improvements and maintenance of City trails.
CIP Pavement Management - This fund accounts for the accumulation of resources to be used for capital improvements and maintenance of City streets.
Economic Development – This fund accounts for money set aside to assist in the redevelopment of the City.
Project – This fund accounts for tax increment revenue set aside to assist in the redevelopment of the City.
HRA – This fund accounts for the accumulation of resources to be used for economic development projects.
Tree Replacement – This fund accounts for tree replacement fees that are collected from permittees who have demonstrated that it is not possible or reasonable to plant all or some of the required replacement trees on site. The revenue will be used for planting of trees and natural enhancements within the City.
Transportation - This fund accounts for proceeds of state aid. This revenue is used to finance street improvements.
Shady Oak Road North – This fund accounts for the accumulation of resources to be used for the reconstruction of Shady Oak Road from Rowland Road through the Highway 62 interchange.
Cable PEG (Public, Educational, and Government) – This fund accounts for the revenues collected from Comcast. These funds will be used to produce PEG Access programming.
Eden Prairie Connect to Flying Cloud – This fund accounts for the accumulation of resources to be used for the construction of road from Frederick Place to north of Riley Creek.
Homeowners Improvements Area – This fund accounts for the accumulation of resources to be used for Housing Improvements to the Fairway Woods II Condominiums.
Duck Lake Road Construction – This fund accounts for the accumulation of resources to be used to upgrade existing rural roadway to a 2 lane urban roadway.
Dell Road – This fund accounts for accumulation of resources to be used to upgrade a rural section of Dell Road between Crestwood Terrace and County Road 61.
124
City of Eden Prairie, Minnesota
Nonmajor Governmental Funds
Capital Project Funds (Continued)
Willow Creek Utilities – This fund accounts for accumulation of resources to be used for street improvements and installation of city utilities in the Willow Creek Road neighborhood.
Permanent Funds
Permanent funds are used to account for resources that are restricted to the extent that only earnings, and not principal, may be used for purposes that support the City’s programs that is, for the benefit of the City or its citizens.
Cemetery Perpetual Care - This fund was established to account for funds dedicated for cemetery maintenance in accordance with state statutes.
125
This page is intentionally left blank
126
City of Eden Prairie, Minnesota
Combining Balance Sheet
Nonmajor Governmental Funds
December 31, 2023
Page
9
1 of
HRA
Grant
Fund ASSETS Cash and Investments $ - $ 141,127 $ 114,421 $ 41,245 Receivables Accounts - 3,061 1,810Lease Receivable - - -Investment Interest - 865 497 271 Lease Receivable Interest - - -Due from Other Governments 39,169 - - 38,477 Unremitted Taxes - - -Delinquent Special Assessments - - -Deferred Special Assessments - - -Special Deferred Special Assessments - - -Due from Other Funds - 21,996 -Prepaid Items - - -Lease Receivable - - -Land Held for Resale - - -Notes Receivable (net of allow for uncollectible) - - -Total Assets $ 39,169 $ 167,049 $ 116,728 $ 79,993 LIABILITIES Accounts and Contracts Payable $ 15,148 $ 2,420 $ 848 $Salaries Payable 2,025 - - 2,005 Investment Interest Payable - - -Due to Other Governments - - -Due to Other Funds 21,996 - -Unearned Revenue - 1,150 -Total Liabilities 39,169 3,570 848 2,005
Deferred Inflow of Resource Related to Lease Receivable - - -Unavailable Revenue-Revenue - - 375Unavailable Revenue-Special Assessments - - -Total Deferred Inflows of Resources - - 375FUND BALANCES Nonspendable - - -Restricted - 163,479 115,505 77,988 Assigned - - -Unassigned - - -Total Fund Balance - 163,479 115,505 77,988 Total Liabilities, Deferred Inflows of Resources, and Fund Balances $ 39,169 $ 167,049 $ 116,728 $ 79,993 Special
127
Pleasant Eden
Hill Prairie Grant
Cemetery Cemetery
DEFERRED INFLOWS OF RESOURCES
Revenue
City of Eden Prairie, Minnesota
Combining Balance Sheet
Nonmajor Governmental Funds
December 31, 2023
Special Revenue
ASSETS
Cash and Investments
Receivables
Accounts
Lease Receivable
Investment Interest
Lease Receivable Interest
Due from Other Governments
Unremitted Taxes
Delinquent Special Assessments
Deferred Special Assessments
Special Deferred Special Assessments
Due from Other Funds
Prepaid Items
Lease Receivable
Land Held for Resale
Notes Receivable (net of allow for uncollectible)
Total Assets
LIABILITIES
Accounts and Contracts Payable
Salaries Payable
Investment Interest Payable
Due to Other Governments
to Other Funds
Unearned
DEFERRED INFLOWS OF RESOURCES
Deferred Inflow of Resource Related to Lease Receivable
Unavailable Revenue-Revenue
Unavailable Revenue-Special Assessments
Total Deferred Inflows of Resources
FUND BALANCES
Nonspendable
Restricted
Assigned
Unassigned
Total Fund Balance
Page
9
2 of
Due
Revenue Total Liabilities
Liabilities,
Inflows of Resources,
Fund Balances Historical Opioid and Recycling Settlement Cultural Total $ 104,716 $ 85,152 $ 14,026 $ 500,687 - - - 4,871 - - -- 459 172 2,264 - - -- - - 77,646 - - -- - -- - -- - -- - - 21,996 - - -- - -- - -- - -$ 104,716 $ 85,611 $ 14,198 $ 607,464 $ 2,882 $ - $ 2,263 $ 23,561 798 - - 4,828 - - -- - 69 69 - - - 21,996 - - - 1,150 3,680 - 2,332 51,604 - - -- - - 375 - - -- - - 375 - - -101,036 85,611 11,866 555,485 - - -- - -101,036 85,611 11,866 555,485 $ 104,716 $ 85,611 $ 14,198 $ 607,464
Total
Deferred
and
128
City of Eden Prairie, Minnesota
Combining Balance Sheet
Nonmajor Governmental Funds
December 31, 2023
ASSETS
Cash and Investments
Receivables
Accounts
Lease Receivable
Investment Interest
Lease Receivable Interest
Due from Other Governments
Unremitted Taxes
Delinquent Special Assessments
Deferred Special Assessments
Special Deferred Special Assessments
Due from Other Funds
Prepaid Items
Lease Receivable
Land Held for Resale
Notes Receivable (net of allow for uncollectible)
Total Assets
LIABILITIES
Accounts and Contracts Payable
Salaries Payable
Investment Interest Payable
Due to Other Governments
Due to Other Funds
Unearned Revenue
Total Liabilities
DEFERRED INFLOWS OF RESOURCES
Deferred Inflow of Resource Related to Lease Receivable
Unavailable Revenue-Revenue
Unavailable Revenue-Special Assessments
Total Deferred Inflows of Resources
FUND BALANCES
Nonspendable
Restricted
Assigned
Unassigned
Total Fund Balance
Total Liabilities, Deferred Inflows of Resources, and Fund Balances
Page
3 of 9
General General General General Obligation Obligation Obligation Obligation Refunding Improvement Refunding Refunding Bonds Bonds Bonds Bonds 2016A 10A/20A 11D/20A 12A/20A $ 441,187 $ 138,572 $ 622,291 $ 343,045 - - -- - -2,121 937 3,749 3,266 - - -- - -- - - 3,266 - - 317- 150,946 272,755- - 120,762- - -- - -- - -- - -- - -$ 443,308 $ 290,455 $ 1,019,874 $ 349,577 $ 217 $ 217 $ 217 $ 217 - - -- - -- - -- - -- - -217 217 217 217 - - -- - -- 150,946 393,834- 150,946 393,834- - -443,091 139,292 625,823 349,360 - - -- - -443,091 139,292 625,823 349,360 $ 443,308 $ 290,455 $ 1,019,874 $ 349,577 Debt Service 129
City of Eden Prairie, Minnesota
Combining Balance Sheet
Nonmajor Governmental Funds
December 31, 2023
ASSETS
Cash and Investments
Receivables
Accounts
Lease Receivable
Investment Interest
Lease Receivable Interest
Due from Other Governments
Unremitted Taxes
Delinquent Special Assessments
Deferred Special Assessments
Special Deferred Special Assessments
Due from Other Funds
Prepaid Items
Lease Receivable
Land Held for Resale
Notes Receivable (net of allow for uncollectible)
Total Assets
LIABILITIES
Accounts and Contracts Payable
Salaries Payable
Investment Interest Payable
Due to Other Governments Due to Other Funds
Unearned Revenue
Total Liabilities
DEFERRED INFLOWS OF RESOURCES
Deferred Inflow of Resource Related to Lease Receivable
Unavailable Revenue-Revenue
Unavailable Revenue-Special Assessments
Total Deferred Inflows of Resources
FUND BALANCES
Nonspendable Restricted Assigned
Unassigned
Total Fund Balance
Total Liabilities, Deferred Inflows of Resources, and Fund Balances
Page
9
4 of
General
General General
Bonds
Abatement
Bonds
Total $ 51,798 $ 1,400,687 $ 125,319 $ 3,122,899 - - -- -1,056 3,821 262 15,212 - - -- - -1,073 5,243 - 9,582 - - - 317 - - 845,931 1,269,632 - - - 120,762 - - -- - -- - -- - -- - -$ 53,927 $ 1,409,751 $ 971,512 $ 4,538,404 $ 217 $ 217 $ 217 $ 1,519 - - -- - -- - -- - -- - -217 217 217 1,519 - - -- - -- - 845,931 1,390,711 - - 845,931 1,390,711 - - -53,710 1,409,534 125,364 3,146,174 - - -- - -53,710 1,409,534 125,364 3,146,174 $ 53,927 $ 1,409,751 $ 971,512 $ 4,538,404 Debt Service 130
Obligation
Refunding Obligation Obligation
Tax
Bonds 12B/20A
2014A/21A 2016A
City of Eden Prairie, Minnesota
Combining Balance Sheet
Nonmajor Governmental Funds
December 31, 2023
ASSETS
Cash and Investments
Receivables
Accounts
Lease Receivable
Investment Interest
Lease Receivable Interest
Due from Other Governments
Unremitted Taxes
Delinquent Special Assessments
Deferred Special Assessments
Special Deferred Special Assessments
Due from Other Funds
Prepaid Items
Lease Receivable
Land Held for Resale
Notes Receivable (net of allow for uncollectible)
Total Assets
LIABILITIES
Accounts and Contracts Payable
Salaries Payable
Investment Interest Payable
DEFERRED INFLOWS OF RESOURCES
Deferred Inflow of Resource Related to Lease Receivable
Unavailable Revenue-Revenue
Unavailable Revenue-Special Assessments
Total Deferred Inflows of Resources
FUND BALANCES
Nonspendable
Restricted
Assigned
Unassigned
Total
Page
9
5 of
Due to
Due to Other Funds Unearned Revenue Total Liabilities
Other Governments
Inflows of Resources,
Fund Balances Senior Board Park Police E-911 EP Players Improvement $ 45,656 $ 231,655 $ 15,562 $ 4,764,242 - - -- - - 9,128 295 972 89 31,986 - - - 1,439 - 13,715 -- - -- - -- - -- - -- - -- 55,832 -- - - 52,023 - - -- - -$ 45,951 $ 302,174 $ 15,651 $ 4,858,818 $ 3,948 $ - $ 22 $ 175,164 1,251 - -- - -- - -- - -- - - 312,505 5,199 - 22 487,669 - - - 71,796 - - -- - -- - - 71,796 - 55,832 -- 223,904 - 3,329,176 40,752 22,438 15,629 970,177 - - -40,752 302,174 15,629 4,299,353 $ 45,951 $ 302,174 $ 15,651 $ 4,858,818
131
Fund Balance Total Liabilities, Deferred
and
Capital Projects
City of Eden Prairie, Minnesota
Combining Balance Sheet
Nonmajor Governmental Funds
December 31, 2023
Projects
ASSETS
Cash and Investments
Receivables
Accounts
Lease Receivable
Investment Interest
Lease Receivable Interest
Due from Other Governments
Unremitted Taxes
Delinquent Special Assessments
Deferred Special Assessments
Special Deferred Special Assessments
Due from Other Funds
Prepaid Items
Lease Receivable
Land Held for Resale
Notes Receivable (net of allow for uncollectible)
Total Assets
LIABILITIES
Accounts and Contracts Payable
Salaries Payable
Investment Interest Payable
Due to Other Governments
to Other Funds
Unearned Revenue Total Liabilities
DEFERRED INFLOWS OF RESOURCES
Deferred Inflow of Resource Related to Lease Receivable
Unavailable Revenue-Revenue
Unavailable Revenue-Special Assessments
Total Deferred Inflows of Resources
FUND BALANCES
Nonspendable
Restricted
Assigned
Unassigned
Total Fund Balance Total
Page 6 of 9
Due
Inflows of Resources,
Fund Balances CIP Economic CIP Pavement Development Project Trails Management Fund Fund $ 1,102,121 $ 1,066,191 $ 2,702,628 $ 4,727,415 - 1,342,025 -- - 77,7393,853 14,435 16,303 25,698 - - 826- - -- - - 30,385 - - -45,001 - -- - -- - -- - -- - 227,260- - 808,000- - - 1,212,024 $ 1,150,975 $ 2,422,651 $ 3,832,756 $ 5,995,522 $ 640 $ 9,665 $ 18,940 $ 23,860 - - -- - -- - - 10,548 - - -- - -640 9,665 18,940 34,408 - - 293,018- - -45,001 - -45,001 - 293,018- - -- 1,004,524 - 3,901,204 1,105,334 1,408,462 3,520,798 2,059,910 - - -1,105,334 2,412,986 3,520,798 5,961,114 $ 1,150,975 $ 2,422,651 $ 3,832,756 $ 5,995,522 Capital
132
Liabilities, Deferred
and
City of Eden Prairie, Minnesota
Combining Balance Sheet
Nonmajor Governmental Funds
December 31, 2023
ASSETS
Cash and Investments
Receivables
Accounts
Lease Receivable
Investment Interest
Lease Receivable Interest
Due from Other Governments
Unremitted Taxes
Delinquent Special Assessments
Deferred Special Assessments
Special Deferred Special Assessments
Due from Other Funds
Prepaid Items
Lease Receivable
Land Held for Resale
Notes Receivable (net of allow for uncollectible)
Total Assets
LIABILITIES
Accounts and Contracts Payable
Salaries Payable
Investment Interest Payable
Due to Other Governments
Due to Other Funds
Unearned Revenue
Total Liabilities
DEFERRED INFLOWS OF RESOURCES
Deferred Inflow of Resource Related to Lease Receivable
Unavailable Revenue-Revenue
Unavailable Revenue-Special Assessments
Total Deferred Inflows of Resources
FUND BALANCES
Nonspendable
Restricted
Assigned
Unassigned
Total Fund Balance
Page 7 of 9
Tree Road HRA Replacement Transportation North $ 329,495 $ 320,332 $ 3,369,220 $ 121,357 - - -- - -1,625 1,883 30,312 3,393 - - -- - 470,000600 - -- - -- - 23,336- - 820,352- - -- - -- - -- - -- - -$ 331,720 $ 322,215 $ 4,713,220 $ 124,750 $ - $ - $ 67,532 $ 17,490 5,173 - -- - -- - -- - -- - 470,0005,173 - 537,532 17,490 - - -- - -- - 843,688- - 843,688- - -- 308,187 - 77,419 326,547 14,028 3,332,000 29,841 - - -326,547 322,215 3,332,000 107,260 $ 331,720 $ 322,215 $ 4,713,220 $ 124,750
133
Total Liabilities, Deferred Inflows of Resources, and Fund Balances Shady Oak
Capital Projects
City of Eden Prairie, Minnesota
Combining Balance Sheet
Nonmajor Governmental Funds
December 31, 2023
Capital Projects
ASSETS
Cash and Investments
Receivables
Accounts
Lease Receivable
Investment Interest
Lease Receivable Interest
Due from Other Governments
Unremitted Taxes
Delinquent Special Assessments
Deferred Special Assessments
Special Deferred Special Assessments
Due from Other Funds
Prepaid Items
Lease Receivable
Land Held for Resale
Notes Receivable (net of allow for uncollectible)
Total Assets
LIABILITIES
Accounts and Contracts Payable
Salaries Payable
Investment Interest Payable
Due to Other Governments
Due to Other Funds
Unearned Revenue
Total Liabilities
DEFERRED INFLOWS OF RESOURCES
Deferred Inflow of Resource Related to Lease Receivable
Unavailable Revenue-Revenue
Unavailable Revenue-Special Assessments
Total Deferred Inflows of Resources
FUND BALANCES
Nonspendable
Restricted
Assigned
Unassigned
Total Fund Balance
Total Liabilities, Deferred Inflows of Resources, and Fund Balances
Page 8 of 9
Cable
PEG
$ 348,449 $ - $ 11,683 $53,867 - -- - -1,750 - 47- - -- - -- - -- - -- - 16,783- - -- - -5,091 - -- - -- - -- - -$ 409,157 $ - $ 28,513 $$ - $ - $ - $- - -- - -- - -- - -- - -- - -- - -- - -- - 16,783- - 16,7835,091 - -376,460 - 11,54027,606 - 190- - -409,157 - 11,730$ 409,157 $ - $ 28,513 $ -
134
Eden Prairie Rd Homeowners Duck
Connect to Improvements Lake Road
Flying Cloud Area Reconstruction
City of Eden Prairie, Minnesota
Combining Balance Sheet
Nonmajor Governmental Funds
December 31, 2023
ASSETS
Cash and Investments
Receivables
Accounts
Lease Receivable
Investment Interest
Lease Receivable Interest
Due from Other Governments
Unremitted Taxes
Delinquent Special Assessments
Deferred Special Assessments
Special Deferred Special Assessments
Due from Other Funds
Prepaid Items
Lease Receivable
Land Held for Resale
Notes Receivable (net of allow for uncollectible)
Total Assets
LIABILITIES
Accounts and Contracts Payable
Salaries Payable
Investment Interest Payable
Due to Other Governments Due to Other Funds
Unearned Revenue Total Liabilities
DEFERRED INFLOWS OF RESOURCES
Deferred Inflow of Resource Related to Lease Receivable
Unavailable Revenue-Revenue
Unavailable Revenue-Special Assessments
Total Deferred Inflows of Resources
FUND BALANCES
Unassigned
Total Fund Balance
Page
9
9 of
Nonspendable Restricted Assigned
Cemetery Total Perpetual Nonmajor Dell Willow Creek Care Governmental Road Utilities Total Fund Funds $ 1,874,709 $ - $ 21,030,715 $ 231,214 $ 24,885,515 - - 1,395,892 640 1,401,403 - - 86,867 - 86,867 - - 132,641 1,279 151,396 - - 2,265 - 2,265 - - 483,715 - 561,361 - - 30,985 - 40,567 - - - - 317 - - 85,120 - 1,354,752 - - 820,352 - 941,114 44,511 - 44,511 - 66,507 - - 60,923 - 60,923 - - 279,283 - 279,283 - - 808,000 - 808,000 - - 1,212,024 - 1,212,024 $ 1,919,220 $ - $ 26,473,293 $ 233,133 $ 31,852,294 $ - $ 1,362 $ 318,623 $ 480 $ 344,183 - - 6,424 - 11,252 420 86 506 - 506 - - 10,548 - 10,617 - 44,511 44,511 - 66,507 - - 782,505 - 783,655 420 45,959 1,163,117 480 1,216,720 - - 364,814 - 364,814 - - - - 375 - - 905,472 - 2,296,183 - - 1,270,286 - 2,661,372 - - 60,923 201,349 262,272 - - 9,232,414 31,304 12,965,377 1,918,800 - 14,792,512 - 14,792,512 - (45,959) (45,959) - (45,959) 1,918,800 (45,959) 24,039,890 232,653
$ 1,919,220 $ - $ 26,473,293 $ 233,133 $
Capital
Permanent
135
Total Liabilities, Deferred Inflows of Resources, and Fund Balances
27,974,202
31,852,294
Projects
Fund
City of Eden Prairie, Minnesota
Combining Statement of Revenues, Expenditures, and Changes in Fund Balances
Nonmajor Governmental Funds
For the Year Ended December 31, 2023
Revenue
Page 1 of 9
Pleasant Eden HRA Hills Prairie Grant Grant Cemetery Cemetery Fund REVENUES General Property Taxes $ - $ - $ - $Special Assessments - - -Licenses and Permits - - -Intergovernmental Revenue 621,585 - - 123,724 Charges for Services - 46,890 73,450Fines and Forfeits - - -Investment Income - 6,582 2,298 2,014 Lease Income - - -Rental - - -Other Contributions and Donations - - -Miscellaneous - - -Total Revenues 621,585 53,472 75,748 125,738 EXPENDITURES Current Community Development 621,585 - -Police - - - 115,877 Public Works - - -Parks and Recreation - 36,551 25,914Capital Outlay Administration - - -Community Development - - -Police - - -Public Works - - -Parks and Recreation - - -Debt Service Principal - - -Interest - - -Fiscal Agent Fees - - -Total Expenditures 621,585 36,551 25,914 115,877 Excess of Revenues Over (Under) Expenditures - 16,921 49,834 9,861 OTHER
Issuance of Debt - - -Transfers In - - -Transfers Out - - -Total Other Financing Sources (Uses) - - -Net Change in Fund Balances - 16,921 49,834 9,861 Fund Balances (Deficit) - Beginning - 146,558 65,671 68,127 Fund Balances (Deficit) - Ending $ - $ 163,479 $ 115,505 $ 77,988
136
FINANCING SOURCES (USES)
Special
City of Eden Prairie, Minnesota
Combining Statement of Revenues, Expenditures, and Changes in Fund Balances
Nonmajor Governmental Funds
For the Year Ended December 31, 2023
Special Revenue
REVENUES
General Property Taxes
Special Assessments
Licenses and Permits
Intergovernmental Revenue Charges for Services
Fines and Forfeits
Investment Income
Lease Income
Rental
Other Contributions and Donations
Miscellaneous Total Revenues
EXPENDITURES
Current
Outlay
Principal
Fiscal Agent Fees
Expenditures
Excess of Revenues Over (Under) Expenditures
OTHER FINANCING SOURCES (USES)
of Debt Transfers In Transfers Out
Total Other Financing Sources (Uses)
Change in Fund Balances
Balances (Deficit) -
(Deficit) - Ending
Page 2 of 9
Public
Community Development Police
Works Parks and Recreation Capital
Police Public
Debt
Administration Community Development
Works Parks and Recreation
Service
Interest
Total
Issuance
Historical Opioid and Recycling Settlement Cultural Total $ - $ - $ - $- - -- - -112,192 - - 857,501 - - - 120,340 - - -- 1,680 1,678 14,252 - - -- - -- - -145 33,962 1,413 35,520 112,337 35,642 3,091 1,027,613 - - 26,487 648,072 - 39,534 - 155,411 60,516 - - 60,516 - - - 62,465 - - -- - -- - -- - -- - -- - -- - -- - -60,516 39,534 26,487 926,464 51,821 (3,892) (23,396) 101,149 - - -- - -- - -- - -51,821 (3,892) (23,396) 101,149 49,215 89,503 35,262 454,336 $ 101,036 $ 85,611 $ 11,866 $ 555,485
137
Net
Fund
Beginning Fund Balances
City of Eden Prairie, Minnesota
Combining Statement of Revenues, Expenditures, and Changes in Fund Balances
Nonmajor Governmental Funds
For the Year Ended December 31, 2023
REVENUES
General Property Taxes
Special Assessments
Licenses and Permits
Intergovernmental Revenue Charges for Services
Fines and Forfeits
Investment Income
Lease Income
Rental
Other Contributions and Donations
Miscellaneous Total Revenues
EXPENDITURES
Current
Development
Parks and Recreation Capital Outlay
Administration
and Recreation Debt Service
Principal
Excess of Revenues Over (Under) Expenditures
OTHER FINANCING SOURCES (USES)
Issuance of Debt Transfers In Transfers Out
Total Other Financing Sources (Uses)
Net Change in Fund Balances
Fund Balances (Deficit) - Beginning
Fund Balances (Deficit) - Ending
Page 3 of 9
Community
Police Public Works
Community Development Police Public Works Parks
Interest
Total
Fiscal Agent Fees
Expenditures
General General General General Obligation Obligation Obligation Obligation Refunding Improvement Refunding Refunding Bonds Bonds Bonds Bonds 2016A 10A/20A 11D/20A 12A/20A $ - $ - $ - $ 900,356 116,878 87,367 185,708- - -- - -- - -- - -17,179 7,737 29,872 26,434 - - -- - -- - -- - -134,057 95,104 215,580 926,790 - - -- - -- - -- - -- - -- - -- - -- - -- - -120,000 91,000 177,000 884,000 5,400 2,380 4,522 22,695 657 657 657 657 126,057 94,037 182,179 907,352 8,000 1,067 33,401 19,438 - - -- - -- - -- - -8,000 1,067 33,401 19,438 435,091 138,225 592,422 329,922 $ 443,091 $ 139,292 $ 625,823 $ 349,360 Debt Service 138
City of Eden Prairie, Minnesota
Combining Statement of Revenues, Expenditures, and Changes in Fund Balances
Nonmajor Governmental Funds
For the Year Ended December 31, 2023
REVENUES
General Property Taxes
Special Assessments
Licenses and Permits
Intergovernmental Revenue Charges for Services
Fines and Forfeits
Investment Income
Lease Income
Rental
Other Contributions and Donations
Miscellaneous Total Revenues
EXPENDITURES
Current
Development
Parks and Recreation
Capital Outlay
Administration
Community Development
Principal
Expenditures
Excess of Revenues Over (Under) Expenditures
OTHER FINANCING SOURCES (USES)
Issuance of Debt Transfers In Transfers Out
Total Other Financing Sources (Uses)
Net Change in Fund Balances
Fund Balances (Deficit) - Beginning
Fund Balances (Deficit) - Ending
Page 4 of 9
Community
Police Public Works
Police Public
Works Parks and Recreation Debt Service
Interest
Total
Fiscal Agent Fees
General Obligation General General Refunding Obligation Obligation Bonds Tax Abatement Bonds 12B/20A Bonds 2014A/21A 2016A Total $ 277,399 $ 1,355,291 $ - $ 2,533,046 - - 143,813 533,766 - - -- - -- - -- - -10,489 53,376 1,891 146,978 - - -- - -- - -- - -287,888 1,408,667 145,704 3,213,790 - - -- - -- - -- - -- - -- - -- - -- - -- - -334,000 755,000 110,000 2,471,000 8,525 378,400 26,010 447,932 657 1,157 657 5,099 343,182 1,134,557 136,667 2,924,031 (55,294) 274,110 9,037 289,759 - - -- - -- - -- - -(55,294) 274,110 9,037 289,759 109,004 1,135,424 116,327 2,856,415 $ 53,710 $ 1,409,534 $ 125,364 $ 3,146,174 Debt Service 139
City of Eden Prairie, Minnesota
Combining Statement of Revenues, Expenditures, and Changes in Fund Balances
Nonmajor Governmental Funds
For the Year Ended December 31, 2023
Projects
REVENUES
General Property Taxes
Special Assessments
Licenses and Permits
Intergovernmental Revenue Charges for Services
Fines and Forfeits
Investment Income
Lease Income
Rental
Other Contributions and Donations
Miscellaneous Total Revenues
EXPENDITURES
Current
2,216,542
Excess of Revenues Over (Under) Expenditures OTHER FINANCING SOURCES (USES)
Total Other Financing Sources (Uses) Net Change in Fund Balances Fund Balances (Deficit) - Beginning
Balances (Deficit) -
4,299,353
Page 5 of 9
Community
Police Public Works Parks
Capital
Community Development Police Public Works Parks
Recreation Debt Service
Interest Fiscal Agent Fees Total
Development
and Recreation
Outlay Administration
and
Principal
Expenditures
Issuance of Debt Transfers In Transfers Out
Ending Senior Board Park Police E-911 EP Players Improvement $ - $ - $ - $- - -- - -- 205,706 -- - - 1,123,835 2,250 - -1,912 3,390 743 239,646 - - - 1,439 - - - 2,903 - - - 41,643 6,251 - 3,46410,413 209,096 4,207 1,409,466 - - -23,482 83,086 -- - -- - 2,634- - -- - -- 36,491 -- - -- - -
12,800 -- - -- - -23,482 132,377 2,634 2,216,542 (13,069) 76,719 1,573 (807,076) - 36,491 -- - - 20,000 - - (1,000)- 36,491 (1,000) 20,000 (13,069) 113,210 573 (787,076) 53,821 188,964 15,056 5,086,429 $ 40,752 $ 302,174 $ 15,629 $
140
Fund
Capital
City of Eden Prairie, Minnesota
Combining Statement of Revenues, Expenditures, and Changes in Fund Balances
Nonmajor Governmental Funds
For the Year Ended December 31, 2023
REVENUES
General Property Taxes
Special Assessments
Licenses and Permits
Intergovernmental Revenue Charges for Services
Fines and Forfeits
Investment Income
Lease Income
Rental
Other Contributions and Donations
Miscellaneous Total Revenues
EXPENDITURES
Current Community Development Police Public Works
Parks and Recreation
Capital Outlay
Administration
Community Development Police
Public Works
Parks and Recreation
Debt Service
Principal Interest
Fiscal Agent Fees
Total Expenditures
Excess of Revenues Over (Under) Expenditures
OTHER FINANCING SOURCES (USES)
Issuance of Debt
Transfers In Transfers Out
Total Other Financing Sources (Uses)
Net Change in Fund Balances
Fund Balances (Deficit) - Beginning
Fund Balances (Deficit) - Ending
Page 6 of 9
CIP Economic CIP Pavement Development Project Trails Mgmt Fund Fund $ - $ - $ - $ 2,576,991 18,808 - -- 4,682,041 -- 500,000 80,000- - -- - -24,019 140,725 131,468 202,837 - - 11,040- - 78,827- - -- - 67,01342,827 5,322,766 368,348 2,779,828 - - - 2,268,011 - - -- - -- - -- - -- - 143,885- - -62,916 4,156,057 153,465- - -- - 5,686- - 13- - -62,916 4,156,057 303,049 2,268,011 (20,089) 1,166,709 65,299 511,817 - - -450,000 - -- (777,600) (47,092)450,000 (777,600) (47,092)429,911 389,109 18,207 511,817 675,423 2,023,877 3,502,591 5,449,297 $ 1,105,334 $ 2,412,986 $ 3,520,798 $ 5,961,114 Capital
141
Projects
City of Eden Prairie, Minnesota
Combining Statement of Revenues, Expenditures, and Changes in Fund Balances
Nonmajor Governmental Funds
For the Year Ended December 31, 2023
Capital Projects
REVENUES
General Property Taxes
Special Assessments
Licenses and Permits
Intergovernmental Revenue Charges for Services
Fines and Forfeits
Investment Income
Lease Income
Rental
Other Contributions and Donations
Miscellaneous Total Revenues
EXPENDITURES
Current Community Development Police Public Works
Parks and Recreation
Capital Outlay
Administration
Community Development Police Public Works
Parks and Recreation
Debt Service
Principal Interest
Fiscal Agent Fees Total Expenditures
Excess of Revenues Over (Under) Expenditures
OTHER FINANCING SOURCES (USES)
Issuance of Debt
Transfers In Transfers Out
Total Other Financing Sources (Uses)
Net Change in Fund Balances
Fund Balances (Deficit) - Beginning
Fund Balances (Deficit) - Ending
Page 7 of 9
Shady Oak Tree Road HRA Replacement Transportation North $ 202,840 $ - $ - $- - 3,269- - -- 9,250 -- -- - -13,109 14,028 134,807 29,841 - - -- - -- 14,312 -- - -215,949 37,590 138,076 29,841 204,392 - -- - -- - -- - -- - -- - -- - -- - 239,855 584,326 - 38,102 -- - -- - -- - -204,392 38,102 239,855 584,326 11,557 (512) (101,779) (554,485) - - -- - 2,776,521- - -- - 2,776,52111,557 (512) 2,674,742 (554,485) 314,990 322,727 657,258 661,745 $ 326,547 $ 322,215 $ 3,332,000 $ 107,260
142
City of Eden Prairie, Minnesota
Combining Statement of Revenues, Expenditures, and Changes in Fund Balances
Nonmajor Governmental Funds
For the Year Ended December 31, 2023
REVENUES
General Property Taxes
Special Assessments
Licenses and Permits
Intergovernmental Revenue Charges for Services
Fines and Forfeits
Investment Income
Lease Income
Rental
Other Contributions and Donations
Miscellaneous Total Revenues
EXPENDITURES
Current Community Development Police
Parks and Recreation
Capital Outlay
Administration
Community Development Police Public Works
Parks and Recreation Debt Service
Principal Interest
Fiscal Agent Fees Total Expenditures
Excess of Revenues Over (Under) Expenditures
OTHER FINANCING SOURCES (USES)
Issuance of Debt Transfers In Transfers Out
Total Other Financing Sources (Uses)
Net Change in Fund Balances
Fund Balances (Deficit) - Beginning
Fund Balances (Deficit) - Ending
Page 8 of 9
Public Works
Eden Prairie Rd Homeowners Duck Lake Cable Connect to Improvements Road PEG Flying Cloud Area Reconstruction $ - $ - $ - $- - 4,414121,036 - -- 741,403 -- - -- - -13,270 (45,731) 160 (4,155) - - -- - -- - -- - - 235,000 134,306 695,672 4,574 230,845 - - -- - -- - -- - -26,646 - -- - -- - -- 6,504 - 83,437 - - -- - -- - -- - -26,646 6,504 - 83,437 107,660 689,168 4,574 147,408 - - -- 285,658 -- - - (4,776,521) - 285,658 - (4,776,521) 107,660 974,826 4,574 (4,629,113) 301,497 (974,826) 7,156
$ 409,157
-
143
4,629,113
$
$ 11,730 $Capital Projects
City of Eden Prairie, Minnesota
Combining Statement of Revenues, Expenditures, and Changes in Fund Balances
Nonmajor Governmental Funds
For the Year Ended December 31, 2023
REVENUES
General Property Taxes
Special Assessments
Licenses and Permits
Intergovernmental Revenue Charges for Services Fines and Forfeits
Investment Income
Lease Income
Rental
Other Contributions and Donations
Miscellaneous Total Revenues
EXPENDITURES Current
Expenditures
of Revenues Over (Under) Expenditures
OTHER FINANCING SOURCES (USES)
of Debt
Total Other Financing Sources (Uses) Net Change in Fund Balances
(Deficit) - Beginning Fund Balances (Deficit) -
Page 9 of 9
Community
Police Public Works Parks
Recreation Capital
Administration Community Development Police Public Works Parks and Recreation Debt Service Principal Interest Fiscal Agent Fees Total
Development
and
Outlay
Excess
Issuance
Transfers
In Transfers Out
Cemetery Total Perpetual Nonmajor Dell Willow Creek Care Governmental Road Utilities Total Fund Funds $ - $ - $ 2,779,831 $ - $ 5,312,877 - - 26,491 - 560,257 - - 4,803,077 - 4,803,077 - - 1,536,359 - 2,393,860 - - 1,123,835 9,210 1,253,385 - - 2,250 - 2,250 (1,844) (302) 897,923 10,071 1,069,224 - - 12,479 - 12,479 - - 81,730 - 81,730 - - 55,955 - 55,955 - - 311,728 - 347,248 (1,844) (302) 11,631,658 19,281 15,892,342 - - 2,472,403 - 3,120,475 - - 106,568 - 261,979 - - - - 60,516 - - 2,634 720 65,819 - - 26,646 - 26,646 - - 143,885 - 143,885 - - 36,491 - 36,491 9,811 45,657 5,342,028 - 5,342,028 - - 2,254,644 - 2,254,644 - - 18,486 - 2,489,486 - - 13 - 447,945 - - - - 5,099 9,811 45,657 10,403,798 720 14,255,013 (11,655) (45,959) 1,227,860 18,561 1,637,329 - - 36,491 - 36,491 2,000,000 - 5,532,179 - 5,532,179 - - (5,602,213) - (5,602,213) 2,000,000 - (33,543) - (33,543) 1,988,345 (45,959) 1,194,317 18,561 1,603,786 (69,545) - 22,845,573 214,092 26,370,416 $ 1,918,800 $ (45,959) $ 24,039,890 $ 232,653 $ 27,974,202 Permanent Fund Capital Projects 144
Fund Balances
Ending
City of Eden Prairie, Minnesota Internal Service Funds
Internal Service Funds
Internal service funds are used to account for the financing of goods or services provided by one department or agency to other departments or agencies of the government and to other government units, on a cost reimbursement basis.
Health & Benefits – This fund accounts for the activities pertaining to health, life and disability insurance. This fund also accounts for the employer’s portion of pension, FICA and Medicare contributions.
Dental – This fund is to account for and finance its self-insured risk of loss for an employee dental plan. The dental plan is funded by the City, employee contributions, and investment earnings.
Severance – This fund accounts for the payment of unused personal time off for governmental fund employees.
Workers Compensation – This fund accounts for the costs associated with workers’ compensation. Revenues are primarily charges to other funds, interest earnings and insurance checks. Expenditures will consist of insurance premiums.
Property Insurance – This fund accounts for the costs associated with the City’s property and casualty insurance program. Revenues are primarily charges to other funds and interest earnings. Expenditures will consist of insurance premiums.
Facilities – This fund accounts for the costs associated with maintaining city owned buildings. Revenues are primarily charges to other funds, rental income, and interest earnings.
Fleet – These funds account for the costs associated with maintaining and purchasing vehicles and equipment for the City. Revenues are primarily charges to other funds and interest earnings.
Information Technology – These funds account for the provision of information technology services including infrastructure and applications. Revenues are primarily charges to other funds and interest earnings.
145
City of Eden Prairie, Minnesota Internal Service Funds Combining Statement of Net Position December 31, 2023 Health & Workers Benefits Dental Severance Compensation ASSETS Current Assets Cash and Investments $ 2,050,768 $ 46,660 $ 983,692 $Receivables Accounts 8,796 1,135 -Lease Receivable - - -Investment Interest 11,846 157 8,660Lease Receivable Interest - - -Due From Other Governments 38,558 - -Due From Other Funds - - 557,359Inventory - - -Prepaid Items - - - 266,818 Total Current Assets 2,109,968 47,952 1,549,711 266,818 Noncurrent Assets: Lease Receivable - - -Capital Assets Not Being Depreciated or Amortized Work in Progress - - -Depreciated or Amortized Property, Plant and Equipment - - -Leased IT Subscriptions - - -Leased Building/Equipment - - -Less Accumulated Depreciation/Amortization - - -Total Noncurrent Assets - - -Total Assets 2,109,968 47,952 1,549,711 266,818 DEFERRED OUTFLOWS OF RESOURCES Other Post Employment Benefits 801,853 - - 82 Total Deferred Outflows of Resources 801,853 - - 82 Total Assets and Deferred Outflows of Resources $ 2,911,821 $ 47,952 $ 1,549,711 $ 266,900 LIABILITIES Current Liabilities: Accounts Payable $ 23,820 $ 7,760 $ - $Claims Payable - 6,348 -Salaries Payable - - 2,246 1,687 Investment Interest Payable - - - 994 IT Subscriptions Interest Payable - - -IT Subscriptions Liabilities - - -Lease Interest Payable - - -Due to Other Governments 215,719 - -Due to Other Funds - - - 557,359 Current Other Postemployment Benefits Liability 22,538 - - 2 Current Lease Liability Payable - - -Current Portion of Compensated Absences - - 1,222,556Total Current Liabilities 262,077 14,108 1,224,802 560,042 Noncurrent Liabilities: Total Other Postemployment Benefits Liability 2,667,100 - - 554 IT Subscriptions Liabilities - - -Lease Liability Payable - - -Compensated Absences - - 1,232,147Total Noncurrent Liabilities 2,667,100 - 1,232,147 554 Total Liabilities 2,929,177 14,108 2,456,949 560,596 DEFERRED INFLOWS OF RESOURCES Other Postemployment Benefits 805,811 - - 86 Deferred Inflow of Resource Related to Lease Receivable - - -Total Deferred Inflows of Resources 805,811 - - 86 Total Liabilities and Deferred Inflows of Resources 3,734,988 14,108 2,456,949 560,682 NET POSITION Net Investment in Capital Assets - - -Unrestricted (823,167) 33,844 (907,238) (293,782) Total Net Position (823,167) 33,844 (907,238) (293,782) Total Liabilities and Deferred Inflows of Resources $ 2,911,821 $ 47,952 $ 1,549,711 $ 266,900 and Net Position 146
December 31, 2023
Not Being Depreciated or Amortized
Depreciated or Amortized Property, Plant and Equipment
Leased IT Subscriptions
Leased Building/Equipment Less Accumulated Depreciation/Amortization
Eden
Internal Service Funds
City of
Prairie, Minnesota
Combining Statement of Net Position
ASSETS Current Assets Cash
Receivables Accounts Lease
Investment
Lease
Due
Due
Inventory Prepaid
Total
Noncurrent Assets: Lease
Capital Assets
Work
and Investments
Receivable
Interest
Receivable Interest
From Other Governments
From Other Funds
Items
Current Assets
Receivable
in Progress
Assets DEFERRED
Other Post
Total
Total
LIABILITIES Current
Accounts
Claims
Salaries
Investment
IT
IT
Lease
Due to Other
Due to Other
Current Other
Benefits
Current
Current
Total Current
Noncurrent Liabilities: Total Other Postemployment Benefits
IT Subscriptions
Lease
Compensated
Total Noncurrent
Total Liabilities DEFERRED
Other
Deferred
Total Deferred Inflows of Resources Total Liabilities and Deferred Inflows of Resources NET POSITION Net Investment in Capital Assets Unrestricted Total Net Position Total Liabilities
Deferred Inflows of Resources and Net Position Property Information Insurance Facilities Fleet Technology Total $ 211,910 $ 4,149,780 $ 3,832,845 $ 1,905,946 $ 13,181,601 - 88,100 3,253 1,044 102,328 - 296 - - 296 1,383 21,264 24,704 9,841 77,855 - 1,610 - - 1,610 - - - - 38,558 - - - - 557,359 - - 170,744 - 170,744 176,800 39 1,500 167,642 612,799 390,093 4,261,089 4,033,046 2,084,473 14,743,150 - 32,806 - - 32,806 - - 1,228,992 - 1,228,992 - 3,931,370 11,894,855 1,000,093 16,826,318 - - - 1,160,733 1,160,733 - - - 116,896 116,896 - (1,362,613) (7,451,538) (971,802) (9,785,953) - 2,601,563 5,672,309 1,305,920 9,579,792 390,093 6,862,652 9,705,355 3,390,393 24,322,942 82 9,248 8,695 4,660 824,620 82 9,248 8,695 4,660 824,620 $ 390,175 $ 6,871,900 $ 9,714,050 $ 3,395,053 $ 25,147,562 $ 1,268 $ 650,696 $ 434,458 $ 68,509 $ 1,186,511 - - - - 6,348 1,687 44,489 17,710 25,176 92,995 - - - - 994 - - - 18,097 18,097 - - - 245,779 245,779 - - - 212 212 - - 7,561 1,044 224,324 - - - - 557,359 2 248 187 130 23,107 - - - 23,617 23,617 - - - - 1,222,556 2,957 695,433 459,916 382,564 3,601,899 555 32,535 37,556 10,972 2,749,272 - - - 572,617 572,617 - - - 51,986 51,986 - - - - 1,232,147 555 32,535 37,556 635,575 4,606,022 3,512 727,968 497,472 1,018,139 8,207,921 86 9,078 7,701 4,661 827,423 - 30,983 - - 30,983 86 40,061 7,701 4,661 858,406 3,598 768,029 505,173 1,022,800
- 2,289,242 - 5,321,813 - 411,921 8,022,976 386,577 3,814,629 3,887,064 1,960,332 8,058,259 386,577 6,103,871 9,208,877 2,372,253 16,081,235 $ 390,175 $ 6,871,900 $ 9,714,050 $ 3,395,053 $ 25,147,562 147
Total Noncurrent Assets Total
OUTFLOWS OF RESOURCES
Employment Benefits
Deferred Outflows of Resources
Assets and Deferred Outflows of Resources
Liabilities:
Payable
Payable
Payable
Interest Payable
Subscriptions Interest Payable
Subscriptions Liabilities
Interest Payable
Governments
Funds
Postemployment
Liability
Lease Liability Payable
Portion of Compensated Absences
Liabilities
Liability
Liabilities
Liability Payable
Absences
Liabilities
INFLOWS OF RESOURCES
Postemployment Benefits
Inflow of Resource Related to Lease Receivable
and
9,066,327
City of Eden Prairie, Minnesota
Combining Statement of Revenues Expenses and Changes in Net Position For the Year Ended December 31, 2023
(See Note
Service
Internal
Funds
Health & Workers Benefits Dental Severance Compensation OPERATING REVENUE Charges for Services $ 6,833,446 $ 309,848 $ 233,679 $ 892,256 Rental - - -Lease Interest Income - - -Total Operating Revenues 6,833,446 309,848 233,679 892,256 OPERATING EXPENSE Personnel Services 6,736,913 253,472 226,455 58,817 Supplies Supplies - - -Cleaning Supplies - - -Motor Fuel - - -Tires - - -Repair and Maintenance Supplies - - -Contractual Services Contractual Services 13,836 23,080 - 1,403,929 Software - - -Janitorial Services - - -Licenses, Permits, Taxes - - -Repair and Maintenance - - -Utilities - - -User Charges - - -Capital Under $25,000 - - -Total Operating Expenses 6,750,749 276,552 226,455 1,462,746 Operating Income (Loss) Before Depreciation/Amortization 82,697 33,296 7,224 (570,490) Depreciation/Amortization - - -Operating Income (Loss) Before Nonoperating Revenue / Expense 82,697 33,296 7,224 (570,490) NONOPERATING REVENUE (EXPENSE) Investment Income 94,465 548 66,793 (419) Lease Interest Expense - - -Subscription Interest Expense - - -Gain/(Loss) on Disposition of Capital Assets - - -Contributions - - -Miscellaneous 37,497 - - 44,804 Total Nonoperating Revenues (Expenses) 131,962 548 66,793 44,385 Income (Loss) Before Contributions and Transfers 214,659 33,844 74,017 (526,105) Contributions - from Governmental Activities - - -Change in Net Position 214,659 33,844 74,017 (526,105) Net Position - Beginning (1,037,826) - (981,255) 232,323 Prior Period Adjustment
17) - - -Net Position - Beginning (Restated) (1,037,826) - (981,255) 232,323 Net Position - Ending $ (823,167) $ 33,844 $ (907,238) $ (293,782) 148
City of Eden Prairie, Minnesota
Internal Service Funds
Combining Statement of Revenues
Expenses and Changes in Net Position For the Year Ended December 31, 2023
OPERATING REVENUE
Charges for Services
Rental
Lease Interest Income
Total Operating Revenues
OPERATING EXPENSE
Personnel Services
Supplies Supplies
Cleaning Supplies
Motor Fuel
Tires
Repair and Maintenance Supplies
Contractual Services
Contractual Services
Software
Janitorial Services
Licenses, Permits, Taxes
Repair and Maintenance
Utilities
User Charges
Capital Under $25,000
Total Operating Expenses
Operating Income (Loss) Before Depreciation/Amortization
Depreciation/Amortization
Operating Income (Loss) Before Nonoperating Revenue / Expense
NONOPERATING REVENUE (EXPENSE)
Income
Interest Expense Subscription Interest Expense Gain/(Loss) on Disposition of Capital Assets Contributions
Miscellaneous Total Nonoperating Revenues (Expenses) Income (Loss) Before Contributions and Transfers
Contributions - from Governmental Activities Change
(See Note 17)
Investment
Lease
in Net Position Net Position - Beginning Prior Period Adjustment
Net Position - Beginning (Restated) Net Position - Ending Property Information Insurance Facilities Fleet Technology Total $ 835,957 $ 5,711,921 $ 3,106,525 $ 3,269,702 $ 21,193,334 - 622,325 - - 622,325 - 1,110 - - 1,110 835,957 6,335,356 3,106,525 3,269,702 21,816,769 58,816 1,316,609 586,982 825,246 10,063,310 - 3,645 73,159 6,506 83,310 - 98,290 - - 98,290 - 8,528 497,401 - 505,929 - - 75,161 - 75,161 - 299,309 414,778 - 714,087 966,401 1,615,117 11,331 166,151 4,199,845 - - - 1,198,092 1,198,092 - 892,553 - - 892,553 - 1,641 2,063 - 3,704 - - 293,147 - 293,147 - 1,458,116 17,122 172,546 1,647,784 - 23,427 - - 23,427 - 257,165 59,185 165,425 481,775 1,025,217 5,974,400 2,030,329 2,533,966 20,280,414 (189,260) 360,956 1,076,196 735,736 1,536,355 - 91,059 782,766 454,028 1,327,853 (189,260) 269,897 293,430 281,708 208,502 12,609 188,535 204,778 71,759 639,068 - - - (2,902) (2,902) - - - (31,895) (31,895) - - 179,677 - 179,677 - 2,673 - - 2,673 139,390 31,946 27,819 39,749 321,205 151,999 223,154 412,274 76,711 1,107,826 (37,261) 493,051 705,704 358,419 1,316,328 - - 360,806 - 360,806 (37,261) 493,051 1,066,510 358,419 1,677,134 423,838 5,610,820 8,142,367 1,850,937 14,241,204 - - - 162,897 162,897 423,838 5,610,820 8,142,367 2,013,834
$ 386,577 $ 6,103,871 $ 9,208,877
149
14,404,101
$ 2,372,253 $ 16,081,235
City of Eden Prairie, Minnesota
Internal Service Funds
Combining Statement of Cash Flows For the Year Ended December 31, 2023
CASH FLOWS FROM OPERATING ACTIVITIES
CASH FLOWS FROM NONCAPITAL FINANCING ACTIVITIES
CASH FLOWS FROM CAPITAL AND RELATED FINANCING ACTIVITES
Acquisition and Construction of Capital Assets
Proceeds From Sale of Equipment
Principal Paid on Debt
Health & Workers Benefits Dental Severance Compensation
Receipts From Customers $ 6,833,591 $ 308,713 $ 233,679 $ 892,256 Payments to Vendors (13,799) (8,972) - (1,494,477) Payments to Employees (6,753,586) (253,472) (151,608) (58,805) Other Receipts - - -Net Cash Provided (Used) By Operating Activities 66,206 46,269 82,071 (661,026) CASH
INVESTING
Investment Income 88,671 391 62,301 922 Net Cash Provided (Used) By Investing Activities 88,671 391 62,301 922
FLOWS FROM
ACTIVITIES
Payments From Other Funds - - (557,359)Payments to Other Funds - - - 557,359 Miscellaneous 37,497 - - 44,804 Net Cash Provided (Used) By Noncapital Financing Activities 37,497 - (557,359) 602,163
- - - -
- - - -
- - - -
- - -Net
Provided
Capital
Related Financing Activities - - -Net Increase (Decrease) in Cash and Cash Equivalents 192,374 46,660 (412,987) (57,941) Cash and Cash Equivalents, January 1 1,858,394 - 1,396,679 57,941 Cash and Cash Equivalents, December 31 $ 2,050,768 $ 46,660 $ 983,692 $150
Interest and Fiscal Agent Paid on Debt
Cash
(Used) By
and
City of Eden Prairie, Minnesota
Internal Service Funds
Combining Statement of Cash Flows For the Year Ended December 31, 2023
CASH FLOWS FROM OPERATING ACTIVITIES Receipts From Customers Payments to Vendors Payments to Employees Other Receipts
Net Cash Provided (Used) By Operating Activities
CASH FLOWS FROM INVESTING ACTIVITIES
Investment Income
Net Cash Provided (Used) By Investing Activities
CASH FLOWS FROM NONCAPITAL FINANCING ACTIVITIES Payments From Other Funds Payments to Other Funds
Miscellaneous
Net Cash Provided (Used) By Noncapital Financing Activities
CASH FLOWS FROM CAPITAL AND RELATED FINANCING ACTIVITES
Acquisition and Construction of Capital Assets Proceeds From Sale of Equipment Principal Paid on Debt
Interest and Fiscal Agent Paid on Debt
Net Cash Provided (Used) By Capital and Related Financing Activities
Net Increase (Decrease) in Cash and Cash Equivalents
Cash and Cash Equivalents, January 1
Cash and Cash Equivalents, December 31
Page 1 of 2 Property Information Insurance Facilities Fleet Technology Total $ 835,957 $ 5,633,932 $ 3,105,209 $ 3,272,816 $ 21,116,153 (1,002,936) (4,428,919) (1,081,852) (1,662,565) (9,693,520) (58,804) (1,312,737) (586,944) (824,069) (10,000,025) - 621,561 - - 621,561 (225,783) 513,837 1,436,413 786,182 2,044,169 12,112 180,302 193,585 66,183 604,467 12,112 180,302 193,585 66,183 604,467 - - - - (557,359) - - - - 557,359 139,390 34,619 27,819 39,749 323,878 139,390 34,619 27,819 39,749 323,878 - (386,300) (2,632,956) (183,675)
- - 168,916 - 168,916 - - - (365,176) (365,176) - - - (16,764) (16,764) - (386,300) (2,464,040) (565,615) (3,415,955) (74,281) 342,458 (806,223) 326,499 (443,441) 286,191 3,807,322 4,639,068 1,579,447 13,625,042
211,910
4,149,780
3,832,845
1,905,946
13,181,601 151
(3,202,931)
$
$
$
$
$
City of Eden Prairie, Minnesota
Internal Service Funds
Combining Statement of Cash Flows For the Year Ended December 31, 2023
RECONCILIATION OF OPERATING INCOME (LOSS) TO NET CASH PROVIDED (USED) BY OPERATING ACTIVITIES:
Adjustments to Reconcile Operating Income (Loss) to Net Cash Provided (Used) by Operating Activities: Depreciation/Amortization
(Increase) Decrease in Assets:
Noncash Investing, Capital and Financing Activities: Contributions
Health & Workers Benefits Dental Severance Compensation
Operating Income (Loss) $ 82,697 $ 33,296 $ 7,224 $ (570,490)
- - - -
Accounts Receivable 145 (1,135) -Lease Receivable - - -Due From Other Governments (30,180) - -Inventory - - -Prepaid Items 26,715 - - (90,548) Other Post Employment Benefits (Deferred Outflow) 121,708 - - 14 Increase (Decrease) in Liabilities: Accounts Payable (1,658) 14,108 -Salaries Payable - - (3,112) 14 Unearned Revenue - - -Due to Other Governments 5,160 - -Current Other Postemployment Benefits Liability 334,199 - - 36 Other Post Employment Benefits (Deferred Inflow) (472,580) - - (52) Compensated Absences - - 77,959Net Cash Provided
Operating Activities $ 66,206 $ 46,269 $ 82,071 $ (661,026)
of Capital Assets from Governmental Activities $ - $ - $ - $152
(Used) by
City of Eden Prairie, Minnesota
Internal Service Funds
Combining Statement of Cash Flows
For the Year Ended December 31, 2023
RECONCILIATION OF OPERATING INCOME (LOSS) TO NET CASH PROVIDED (USED) BY OPERATING ACTIVITIES:
Operating Income (Loss)
Adjustments to Reconcile Operating Income (Loss) to Net Cash Provided (Used) by Operating Activities: Depreciation/Amortization (Increase) Decrease in Assets:
Accounts Receivable
Lease Receivable
Due From Other Governments
Inventory
Prepaid Items
Other Post Employment Benefits (Deferred Outflow)
Increase (Decrease) in Liabilities:
Accounts Payable
Salaries Payable
Unearned Revenue
Due to Other Governments
Current Other Postemployment Benefits Liability
Other Post Employment Benefits (Deferred Inflow)
Compensated Absences
Net Cash Provided (Used) by Operating Activities
Noncash Investing, Capital and Financing Activities: Contributions of
Capital
Page 2 of 2 Property Information Insurance Facilities Fleet Technology Total $ (189,260) $ 269,897 $ 293,430 $ 281,708 $ 208,502 - 91,059 782,766 454,028 1,327,853 - (77,354) (1,316) 3,114 (76,546) - (1,874) - - (1,874) - 20,728 - - (9,452) - - 16,927 - 16,927 (36,803) - - 109,311 8,675 14 1,339 1,008 702 124,785 268 208,144 339,032 (63,500) 496,394 14 4,055 175 1,273 2,419 - (635) - - (635) - - 5,536 344 11,040 36 3,677 2,767 1,930 342,645 (52) (5,199) (3,912) (2,728) (484,523) - - - - 77,959 $ (225,783) $ 513,837 $ 1,436,413 $ 786,182 $ 2,044,169 $ - $ - $ 360,806 $ - $ 360,806 153
Assets from Governmental Activities
City of Eden Prairie, Minnesota
Custodial Funds
Custodial Funds
Custodial funds are used to account for assets held by the government as an agent for individuals, private organizations, other governments, or other funds.
WAFTA – This fund accounts for the collection and remittance of expenses pertaining to the fire training facility owned by 11 member cities.
MCES - This fund accounts for the collection and remittance of sewer availability charges to the Metropolitan Council Environmental Services.
Escrow - This fund is used to account for evidence held by the Police Department.
Fencing – The seven-county metro area has formed a Fencing Consortium to provide anti-scale fencing. The intent of the Fencing Consortium is to provide anti-scale fencing within hours around potentially impacted government buildings in response to a critical incident. The Consortium is funded by membership dues.
I-494 Corridor Commission – This fund accounts for the collection and remittance of expenses pertaining to the policy work and employer and commuter outreach performed by staff of the I-494 Corridor Commission. The Commission is funded by member cities, a federal Congestion Mitigation & Air Quality grant, and a Telework state grant
154
City of Eden Prairie, Minnesota
Fiduciary Funds
Statement of Fiduciary Net Position
December 31, 2023
NET POSITION
Custodial Funds WAFTA MCES Escrow Fencing I-494 Total
Cash and Investments $ 376,178 $ 2,485 $ 117,104 $ 56,475 $ 90,801 $ 643,043 Due from Other Governments - - - - 98,894 98,894 Prepaids 937 - - 57,441 7,764 66,142 Total Assets $ 377,115 $ 2,485 $ 117,104 $ 113,916 $ 197,459 $ 808,079 LIABILITIES Accounts Payable $ - $ - $ 87,706 $ - $ 10,653 $ 98,359 Due to Other Governments - 2,485 - - 1,936 4,421 Total Liabilities $ - $ 2,485 $ 87,706 $ - $ 12,589 $ 102,780
Restricted For: Police Evidence Cash $ - $ - $ 29,398 $ - $ - $ 29,398 Western Area Fire Training Costs 377,115 - - - - 377,115 Fencing Consortium Costs - - - 113,916 - 113,916 I-494 Corridior Commission Costs - - - - 184,870 184,870 $ 377,115 $ - $ 29,398 $ 113,916 $ 184,870 $ 705,299 155
ASSETS
City of Eden Prairie, Minnesota
Fiduciary Funds
Statement of Changes in Fiduciary Net Position For the Year Ended December 31, 2023
Custodial Funds WAFTA MCES Escrow Fencing I-494 Total ADDITIONS Grants $ - $ - $ - $ - $ 379,335 $ 379,335 Memberships 22,000 - - 302,020 168,030 492,050 Investments Earnings 16,101 - - 5,639 10,346 32,086 Building Permits - 656,040 - - - 656,040 Other - - 11,484 - 1,408 12,892 Total Additions 38,101 656,040 11,484 307,659 559,119 1,572,403 DEDUCTIONS Personnel Services - - - - 427,437 427,437 Supplies - - - 359 27,419 27,778 Contractual Services 1,642 656,040 - 193,384 230,028 1,081,094 Total Deductions 1,642 656,040 - 193,743 684,884 1,536,309 Net Increase (Decrease) in Fiduciary Net Position 36,459 - 11,484 113,916 (125,765) 36,094 Net Position - Beginning 340,656 - 17,914 - 310,635 669,205 Net Position - Ending $ 377,115 $ - $ 29,398 $ 113,916 $ 184,870 $ 705,299 156

STATISTICAL SECTION
157
City of Eden Prairie, Minnesota Statistical Section (Unaudited)
This part of the City of Eden Prairie’s annual comprehensive financial report presents detailed information as a context for understanding this year’s financial statements, note disclosures, and supplementary information. This information has not been audited by the independent auditor.
Contents
Financial Trends
These tables contain trend information that may assist the reader in assessing the City’s current financial performance by placing it in historical perspective.
Revenue Capacity
These tables contain information that may assist the reader in assessing the viability of the City’s most significant “own-source” revenue, the property tax.
Debt Capacity
These tables present information that may assist the reader in analyzing the affordability of the City’s current levels of outstanding debt and the City’s ability to issue additional debt in the future.
Demographic and Economic Information
These tables offer economic and demographic indicators that are commonly used for financial analysis and that can increase one’s understanding of the City’s present and ongoing financial status.
Operating Information
These tables contain service and infrastructure indicators that can increase one’s understanding of how the information in the City’s financial statements relates to the services the City provides and the activities it performs.
Source:
Unless otherwise noted, the information in these tables is derived from the annual comprehensive financial reports for the relevant year.
Page
........................................................................................................................................................159-164
165-168
..............................................................................................................................................................169-172
......................................................................................................173-174
...........................................................................................................................................175-177
158
City
wide Net
Last
2014 2015 2016 2017 2018 2019 2020 2021 2022 2023 GOVERNMENTAL ACTIVITIES Net Investment in Capital Assets $ 181,975,764 $ 189,217,647 $ 191,675,648 $ 195,150,960 $ 198,061,704 $ 204,564,164 $ 207,181,863 $ 209,098,130 $ 212,853,068 $ 219,430,606 Restricted 13,773,554 23,112,719 26,405,621 23,186,863 28,343,449 20,531,807 18,319,451 16,430,792 16,290,155 17,982,996 Unrestricted 60,341,383 31,911,221 21,694,457 29,707,881 29,069,260 33,229,904 44,514,934 59,396,843 65,028,175 66,653,801 Governmental Activities Net Position 256,090,701 244,241,587 239,775,726 248,045,704 255,474,413 258,325,875 270,016,248 284,925,765 294,171,398 304,067,403 BUSINESS-TYPE ACTIVITIES Net Investment in Capital Assets 131,144,305 128,130,738 125,479,624 121,073,703 116,820,164 114,243,631 120,560,158 114,898,693 105,257,847 103,038,198 Unrestricted 14,438,525 14,792,266 16,155,406 19,142,578 22,590,071 25,296,848 22,267,651 27,910,252 33,151,502 41,489,192 Business-Type Activities Net Position 145,582,830 142,923,004 141,635,030 140,216,281 139,410,235 139,540,479 142,827,809 142,808,945 138,409,349 144,527,390
Net Investment in Capital Assets 313,120,069 317,348,385 317,155,272 316,224,663 314,881,868 318,807,795 327,742,021 323,996,823 318,110,915 322,468,804 Restricted 13,773,554 23,112,719 26,405,621 23,186,863 28,343,449 20,531,807 18,319,451 16,430,792 16,290,155 17,982,996 Unrestricted 74,759,133 46,703,487 37,849,863 48,850,459 51,659,331 58,526,752 66,782,585 87,307,095 98,179,677 108,142,993 Primary Government Net Position $ 401,652,756 $ 387,164,591 $ 381,410,756 $ 388,261,985 $ 394,884,648 $ 397,866,354 $ 412,844,057 $ 427,734,710 $ 432,580,747 $ 448,594,793 159
of Eden Prairie, Minnesota Government-
Position by Category (accrual basis of accounting)
Ten Years
PRIMARY GOVERNMENT
City of Eden Prairie, Minnesota
Changes in Net Position-Total (accrual basis of accounting)
Last Ten Years
Source 2014 2015 2016 2017 2018 2019 2020 2021 2022 2023 EXPENSES Governmental Activities $ 57,169,862 $ 65,402,641 $ 63,294,429 $ 60,402,652 $ 59,821,696 $ 67,623,543 $ 60,556,153 $ 61,204,663 $ 69,774,367 $ 70,960,838 Business-type Activities 29,820,423 27,924,045 30,170,309 28,922,085 30,324,121 30,033,843 30,124,648 33,758,571 36,179,924 35,524,608 Total Expenses 86,990,285 93,326,686 93,464,738 89,324,737 90,145,817 97,657,386 90,680,801 94,963,234 105,954,291 106,485,446 PROGRAM REVENUES Governmental Activities 33,865,654 31,911,922 18,955,697 19,086,961 23,707,803 26,795,160 26,013,884 29,841,902 29,137,248 26,825,202 Business-type Activities 28,335,144 27,330,069 29,392,647 28,144,288 30,391,136 29,543,322 33,416,255 35,519,042 36,810,235 37,908,268 Total Program Revenues 62,200,798 59,241,991 48,348,344 47,231,249 54,098,939 56,338,482 59,430,139 65,360,944 65,947,483 64,733,470 Net (Expense) Revenue (24,789,487) (34,084,695) (45,116,394) (42,093,488) (36,046,878) (41,318,904) (31,250,662) (29,602,290) (40,006,808) (41,751,976) GENERAL REVENUES AND TRANSFERS Governmental Activities 37,961,763 37,694,597 39,872,871 41,618,266 43,542,602 43,679,845 46,232,642 46,272,278 49,882,752 53,082,482 Business-type Activities (1,367,634) 336,534 (510,312) (640,952) (873,061) 620,765 (4,277) (1,779,335) (5,029,907) 213,891 Total General Revenues and Transfers 36,594,129 38,031,131 39,362,559 40,977,314 42,669,541 44,300,610 46,228,365 44,492,943 44,852,845 53,296,373 Change in Net Position $ 11,804,642 $ 3,946,436 $ (5,753,835) $ (1,116,174) $ 6,622,663 $ 2,981,706 $ 14,977,703 $ 14,890,653 $ 4,846,037 $ 11,544,397 160
City of Eden Prairie, Minnesota
Changes in Net Position- Governmental Activities (accrual basis of accounting)
Last Ten Years
SOURCES 2014 2015 2016 2017 2018 2019 2020 2021 2022 2023 EXPENSES Administration $ 4,921,044 $ 5,579,070 $ 5,003,957 $ 4,611,732 $ 5,092,886 $ 4,827,249 $ 5,554,966 $ 4,679,960 $ 5,751,886 $ 5,819,132 Community Development 5,368,762 7,730,338 5,692,215 6,222,326 4,942,029 4,771,490 4,767,416 5,198,300 5,986,996 5,762,042 Police 13,534,150 14,118,565 17,793,494 15,769,976 14,365,502 15,021,975 15,189,099 14,150,218 17,956,084 20,135,104 Fire 6,093,772 6,324,124 7,542,196 6,896,697 6,406,404 7,191,071 6,131,926 6,474,736 5,689,004 7,371,601 Public Works 13,321,459 17,652,163 11,035,229 10,616,604 10,098,667 19,518,141 14,981,533 14,706,067 16,584,584 13,711,989 Parks and Recreation 12,947,006 12,862,402 15,133,618 15,274,479 18,008,795 15,458,406 13,135,532 15,218,460 17,931,630 17,801,245 Interest on Long Term Debt 983,669 1,135,979 1,093,720 1,010,838 907,413 835,211 795,681 776,922 (125,817) 359,725 Total Expenses 57,169,862 65,402,641 63,294,429 60,402,652 59,821,696 67,623,543 60,556,153 61,204,663 69,774,367 70,960,838 PROGRAM REVENUES Charges for Services Administration 1,314,271 1,132,606 1,442,068 1,173,177 1,079,151 1,052,388 982,079 1,109,882 897,992 932,607 Community Development 73,929 93,195 152,708 127,248 161,918 180,443 142,353 124,707 85,127 76,298 Police 1,130,020 1,063,129 1,131,502 1,039,936 1,115,447 1,103,269 847,564 989,466 1,022,601 991,422 Fire 3,502,952 2,571,830 2,315,725 2,240,351 3,505,901 3,580,095 3,609,503 4,696,599 3,948,568 3,719,560 Public Works 411,144 975,701 330,709 218,292 274,679 1,070,746 329,277 214,521 336,140 368,949 Parks and Recreation 5,187,195 5,229,060 5,513,331 6,091,247 5,854,094 6,004,835 2,445,386 5,559,244 7,052,917 6,920,145 Operating Grants and Contributions 1,741,945 1,818,333 1,614,263 1,707,453 2,457,482 2,461,663 7,376,216 6,509,714 6,798,808 3,227,456 Capital Grants and Contributions 20,504,198 19,028,068 6,455,391 6,489,257 9,259,131 11,341,721 10,281,506 10,637,769 8,995,095 10,588,765 Total Program Revenues 33,865,654 31,911,922 18,955,697 19,086,961 23,707,803 26,795,160 26,013,884 29,841,902 29,137,248 26,825,202 Net (Expense) Revenue (23,304,208) (33,490,719) (44,338,732) (41,315,691) (36,113,893) (40,828,383) (34,542,269) (31,362,761) (40,637,119) (44,135,636) GENERAL REVENUES AND TRANSFERS Taxes Property Taxes 32,781,740 33,708,909 34,217,549 35,405,930 37,338,583 38,203,969 39,864,882 40,478,282 43,333,223 44,019,754 Tax Increment 3,070,936 3,249,355 3,357,247 3,570,703 2,320,447 1,936,046 2,193,637 2,681,357 2,750,448 2,576,991 Gain on Sale of Capital Assets - - - - - - - - - 167,444 Grants and Contributions Not Restricted to Specific Programs 483,914 741,828 1,268,257 1,545,745 1,644,788 1,718,391 1,788,293 1,836,431 971,536 565,167 Investment Income 210,373 272,989 418,849 334,305 988,382 1,747,241 1,651,912 (335,188) (1,511,717) 4,004,805 Transfers 1,414,800 (278,484) 610,969 761,583 1,250,402 74,198 733,918 1,611,396 4,339,262 1,748,321 Total General Revenues and Transfers 37,961,763 37,694,597 39,872,871 41,618,266 43,542,602 43,679,845 46,232,642 46,272,278 49,882,752 53,082,482 Change in Net Position $ 14,657,555 $ 4,203,878 $ (4,465,861) $ 302,575 $ 7,428,709 $ 2,851,462 $ 11,690,373 $ 14,909,517 $ 9,245,633 $ 8,946,846 161
City of Eden Prairie, Minnesota
Changes in Net Position-Business-type Activities (accrual basis of accounting)
Last Ten Years
SOURCE 2014 2015 2016 2017 2018 2019 2020 2021 2022 2023 EXPENSES Water $ 9,856,001 $ 8,905,768 $ 10,526,151 $ 9,686,669 $ 10,460,599 $ 9,708,148 $ 9,481,491 $ 12,433,736 $ 13,549,136 $ 13,276,328 Wastewater 6,403,264 6,565,966 7,407,149 6,913,276 7,469,070 7,678,652 7,496,256 7,504,396 8,375,360 7,692,294 Stormwater 2,545,818 2,082,594 1,793,588 2,437,573 2,351,367 2,413,725 2,538,257 2,894,253 3,170,444 3,268,137 Liquor 11,015,340 10,369,717 10,443,421 9,884,567 10,043,085 10,233,318 10,608,644 10,926,186 11,084,984 11,287,849 Total Expenses 29,820,423 27,924,045 30,170,309 28,922,085 30,324,121 30,033,843 30,124,648 33,758,571 36,179,924 35,524,608 PROGRAM
Charges for Services Water 7,315,328 7,162,740 7,675,337 7,846,540 8,422,155 7,699,582 8,987,364 10,682,945 11,008,837 11,831,046 Wastewater 5,566,951 5,661,990 5,789,584 5,863,517 6,356,014 6,726,548 6,895,764 7,460,750 7,517,471 7,725,339 Stormwater 1,656,817 1,933,572 2,095,629 2,400,254 2,786,754 3,125,251 3,376,785 3,631,369 3,770,562 3,879,587 Liquor 12,216,404 11,312,822 10,747,887 10,501,449 10,848,725 10,977,643 11,711,560 11,923,359 12,067,226 12,069,015 Operating Grants and Contributions 131,600 133,195 155,041 238,392 20,665 69,429 117,123 68,185 107,493 45,315 Capital Grants and Contributions 1,448,044 1,125,750 2,929,169 1,294,136 1,956,823 944,869 2,327,659 1,752,434 2,338,646 2,357,966 Total Program Revenues 28,335,144 27,330,069 29,392,647 28,144,288 30,391,136 29,543,322 33,416,255 35,519,042 36,810,235 37,908,268 Net (Expense) Revenue (1,485,279) (593,976) (777,662) (777,797) 67,015 (490,521) 3,291,607 1,760,471 630,311 2,383,660 GENERAL REVENUES AND TRANSFERS Grants and Contributions Not Restricted - - - - - - - - - 117,647 to Specific Programs Gain on Sale of Capital Assets - - - - - - - - - 3,563 Investment Income 47,166 58,050 100,657 120,631 377,341 694,963 729,641 (167,939) (690,645) 1,841,002 Transfers (1,414,800) 278,484 (610,969) (761,583) (1,250,402) (74,198) (733,918) (1,611,396) (4,339,262) (1,748,321) Total General Revenues and Transfers (1,367,634) 336,534 (510,312) (640,952) (873,061) 620,765 (4,277) (1,779,335) (5,029,907) 213,891 Change
Position $ (2,852,913) $ (257,442) $ (1,287,974) $ (1,418,749) $ (806,046) $ 130,244 $ 3,287,330 $ (18,864) $ (4,399,596) $ 2,597,551 162
REVENUES
in Net
City of Eden Prairie, Minnesota Fund Balances- Governmental Funds
Last Ten Years
TOTAL GOVT' FUNDS
201420152016 2017 2018 2019 2020 2021 2022 2023 GENERAL
Nonspendable $ 39,844 $ 22,947 $ 35,792 $ 30,037 $ 103,845 $ 69,611 $ 94,824 $ 187,378 $ 180,596 $ 109,576 Restricted - - 286,942 - - 11,148 10,572 - -Unassigned 22,292,187 22,859,810 23,171,318 22,592,160 24,438,689 25,354,724 26,197,429 29,132,535 33,252,089 33,607,091 Subtotal General Fund 22,332,031 22,882,757 23,494,052 22,622,197 24,542,534 25,435,483 26,302,825 29,319,913 33,432,685 33,716,667 General Fund % Change 3.7%2.5%2.7% (3.7%) 8.5% 3.6% 3.4%11.5%14.0% 0.8% ALL
Nonspendable 542,619 1,938,628 250,970 250,290 227,197 221,019 227,706 266,408 298,312 276,872 Restricted 23,065,276 10,891,614 11,676,546 7,680,713 11,577,849 13,330,982 20,224,326 26,854,736 15,106,171 12,965,377 Assigned 28,510,594 22,935,181 19,799,434 25,270,027 25,215,825 24,996,835 31,958,975 34,757,827 36,717,748 43,515,281 Unassigned (6,295,915) (6,572,969) (5,110,657) (2,587,713) (4,512,314) (2,218,785) (3,741,963) (2,227,264) (1,458,107) (563,794) Subtotal All Other Govt' Funds 45,822,574 29,192,454 26,616,293 30,613,317 32,508,557 36,330,051 48,669,044 59,651,707 50,664,124 56,193,736
Nonspendable 582,463 1,961,575 286,762 280,327 331,042 290,630 322,530 453,786 478,908 386,448 Restricted 23,065,276 10,891,614 11,963,488 7,680,713 11,577,849 13,342,130 20,234,898 26,854,736 15,106,171 12,965,377 Assigned 28,510,594 22,935,181 19,799,434 25,270,027 25,215,825 24,996,835 31,958,975 34,757,827 36,717,748 43,515,281 Unassigned 15,996,272 16,286,841 18,060,661 20,004,447 19,926,375 23,135,939 22,455,466 26,905,271 31,793,982 33,043,297 Total Govt' Funds $ 68,154,605 $ 52,075,211 $ 50,110,345 $ 53,235,514 $ 57,051,091 $ 61,765,534 $ 74,971,869 $ 88,971,620 $ 84,096,809 $ 89,910,403 All Govt' Funds % Change 1.2% (23.6%) (3.8%) 6.2% 7.2% 8.3%21.4%18.7% (5.5%) 6.9% 163
FUND
OTHER GOV'T FUNDS
City of Eden Prairie, Minnesota
Changes in Fund Balances-Governmental Funds (modified accrual basis of accounting)
Last Ten Years
EXPENDITURES
of Revenues Over (Under) Expenditures
SOURCE 2014 2015 2016 2017 2018 2019 2020 2021 2022 2023 REVENUES Taxes and Special Assessments $ 37,189,846 $ 44,259,324 $ 41,169,891 $ 42,262,252 $ 42,826,126 $ 42,964,367 $ 44,264,894 $ 46,176,740 $ 46,337,423 $ 47,888,864 Licenses and Permits 7,084,975 6,686,477 6,017,523 5,810,945 7,938,046 9,054,415 8,351,257 9,207,247 8,639,380 9,857,421 Intergovernmental Revenue 8,582,993 6,299,840 2,362,417 7,787,877 2,980,678 14,691,473 10,676,031 11,176,877 13,417,354 7,687,714 Charges for Services 4,841,857 4,864,818 5,325,932 5,744,494 5,976,951 6,132,338 2,464,886 5,680,570 7,128,820 7,071,359 Fines and Forfeits 406,210 344,384 346,823 347,285 416,028 370,944 231,166 323,965 297,682 351,891 Investment Income 216,895 276,176 417,997 310,433 887,536 1,523,825 1,458,094 (279,195) (1,264,760) 3,375,808 Lease Income - - - - - - - - 88,712 120,119 Miscellaneous Revenue 1,647,534 7,098,463 3,249,117 2,835,760 4,853,894 4,684,221 5,166,785 2,519,176 2,113,950 1,220,399 Total Revenues 59,970,310 69,829,482 58,889,700 65,099,046 65,879,259 79,421,583 72,613,113 74,805,380 76,758,561 77,573,575
Administration 3,946,531 3,809,732 4,280,665 4,036,821 4,467,514 4,455,624 4,547,110 4,652,491 5,299,977 5,523,671 Community Development 5,224,034 7,666,282 5,536,030 6,102,434 5,143,042 4,762,403 4,975,185 5,399,337 5,822,510 5,682,164 Police 13,079,303 13,704,796 13,917,677 14,183,797 14,672,312 15,354,150 15,537,807 16,332,800 17,306,528 18,116,124 Fire 5,664,111 5,754,747 5,699,308 6,145,202 6,058,619 5,854,829 6,378,338 6,421,157 6,841,419 6,760,050 Public Works 5,915,849 5,869,727 5,929,171 6,194,054 5,997,312 6,010,535 6,090,297 6,207,912 6,640,329 6,853,256 Parks and Recreation 10,255,620 10,571,858 11,008,845 11,309,009 12,176,110 12,629,951 11,137,410 12,360,785 13,684,180 14,506,140 Capital Outlay 21,000,674 31,265,363 15,133,476 8,779,760 9,816,539 24,076,873 13,411,943 12,224,168 14,365,404 13,844,146 Miscellaneous 25,547 39,283 49,954 40,019 66,154 65,245 98,137 - -Debt Service Principal 3,178,107 3,974,224 3,415,369 5,657,828 3,869,824 3,436,793 3,743,793 4,956,848 2,696,989 2,581,686 Interest 1,127,862 1,304,947 1,148,544 1,068,403 975,631 895,435 815,351 688,156 578,520 458,020 Other 144,530 22,517 66,043 23,500 16,848 10,838 64,875 137,719 8,733 5,099 Total Expenditures 69,562,168 83,983,476 66,185,082 63,540,827 63,259,905 77,552,676 66,800,246 69,381,373 73,244,589 74,330,356 Excess
(9,591,858) (14,153,994) (7,295,382) 1,558,219 2,619,354 1,868,907 5,812,867 5,424,007 3,513,972 3,243,219 Other Financing Sources (Uses) 10,380,621 (1,925,400) 5,330,516 1,566,950 1,196,223 2,845,536 7,393,468 8,575,744 (8,388,783) 2,570,375 Net Change in Fund Balance $ 788,763 $ (16,079,394) $ (1,964,866) $ 3,125,169 $ 3,815,577 $ 4,714,443 $ 13,206,335 $ 13,999,751 $ (4,874,811) $ 5,813,594 Debt Service as a % of Noncapital Expenditures 7.5% 7.9% 8.1%11.4% 8.0% 6.4% 7.2% 8.3% 4.7% 4.5% 164
City
of Eden Prairie, Minnesota
Assessed/Tax Capacity Value and Estimated Market Value of Property
Last Ten Years
Source: City Assessing Department and Hennepin County
Tax Tax Capacity Less:Less: TotalTotal Estimated Annual Payable Personal Commercial Farm & Before Fiscal TaxAssessed Direct Market % Dec. 31 PropertyResidentialApartments & Industrial OtherDeductionsDisparitiesIncrementValue Tax Rate ValueChange 2014 $ 1,536,795 $ 59,699,056 $ 6,723,391 $ 37,928,219 $ 75,620 $ 105,963,081 $ 14,732,733 $ 3,137,785 $ 88,092,563 $ 34.709 $ 8,627,122,700 1.7% 20151,581,718 63,907,631 7,045,373 38,765,135 49,597 111,349,454 15,719,259 2,933,721 92,696,474 33.9549,078,339,200 5.2% 20161,659,596 68,205,510 7,667,144 40,928,173 45,052 118,505,475 15,104,618 3,126,571 100,274,286 32.3279,633,243,700 6.1% 20171,778,971 69,180,068 8,887,941 41,710,414 44,200 121,601,594 16,281,768 3,209,405 102,110,421 32.6679,872,802,500 2.5% 20181,317,656 72,149,265 9,758,671 41,957,995 43,813 125,227,400 16,415,817 2,208,824 106,602,759 32.52610,209,614,900 3.4% 20191,995,250 75,815,471 10,394,693 42,523,027 44,602 130,773,043 16,343,594 1,869,603 112,559,846 31.69010,663,264,100 4.4% 20201,947,874 79,500,899 11,243,928 43,474,992 46,519 136,214,212 17,538,211 2,121,042 116,554,959 31.67611,121,835,000 4.3% 20212,051,756 80,291,885 12,786,587 45,576,586 46,926 140,753,740 17,487,960 2,669,795 120,595,985 31.58911,432,806,600 2.8% 20221,161,844 83,981,033 13,846,793 45,217,108 47,063 144,253,841 18,644,565 2,767,772 122,841,504 32.47511,797,011,500 3.2% 20231,261,919 101,477,516 14,702,244 46,666,073 47,873 164,155,625 17,627,603 2,847,499 143,680,523 29.03913,485,585,500 14.3% 2014 1.5% 56.3% 6.3% 35.8% 0.1% 16.7% 3.6% 2015 1.4% 57.4% 6.3% 34.8% 0.0% 17.0% 3.2% 2016 1.4% 57.6% 6.5% 34.5% 0.0% 15.1% 3.1% 2017 1.5% 56.9% 7.3% 34.3% 0.0% 15.9% 3.1% 2018 1.1% 57.6% 7.8% 33.5% 0.0% 15.4% 2.1% 2019 1.5% 58.0% 7.9% 32.5% 0.0% 14.5% 1.7% 2020 1.4% 58.4% 8.3% 31.9% 0.0% 15.0% 1.8% 2021 1.5% 57.0% 9.1% 32.4% 0.0% 14.5% 2.2% 2022 0.8% 58.2% 9.6% 31.3% 0.0% 15.2% 2.3% 2023 0.8% 61.8% 9.0% 28.4% 0.0% 12.3% 2.0%
Percentages Tax Capacity 165
City
of Eden Prairie, Minnesota Direct and Overlapping Property Tax Rate
Ten Years
Direct Rates
Tax Capacity Rates
Overlapping Rates
Market Value Rates
Overlapping Rates
Year City School School School Ended Direct DistrictDistrictDistrict Dec. 31 Rate#270#272#276
20140.01220.1970.1670.270
20150.01000.1790.2440.264
20160.00910.1870.2310.301
20170.00890.1800.2200.300
20180.00860.1500.2290.303
20190.00800.1470.2220.340
20200.00770.1620.2090.339 20210.00770.1440.2010.325
20220.00770.1400.2050.312
20230.00680.1500.2160.307
(1) Special Districts include Metropolitan Council, Regional Transit Board, Metropolitan Mosquito Control, County Park Museum, & Hennepin Suburban Parks
Year Total School School School WatershedWatershedWatershed Ended City HRA City Hennepin SpecialDistrictDistrictDistrictDistrictDistrictDistrict Dec. 31 RateRateRate County Districts (1) #270#272#276#1#2 #4 201434.4930.21634.70949.95910.56132.35827.81724.3741.4900.759 1.880 201533.7490.20533.95446.3989.78530.34022.03025.0931.3150.686 1.855 201632.1370.19032.32745.3569.53028.51420.94822.8871.2330.598 1.745 201732.4800.18732.66744.0879.31925.61121.86522.7701.2570.718 1.992 201832.3480.17832.52642.8088.97329.03520.52523.1331.2040.659 2.269 201931.5210.16931.69041.8618.55027.02220.75621.2091.1640.527 2.204 202031.5130.16331.67641.0848.21927.19021.55521.1671.1110.574 2.160 202131.4320.15731.58938.2107.81326.47821.71720.9231.0200.550 1.992 202232.3220.15332.47538.5357.84926.78320.99521.0020.9810.541 1.968 202328.9040.13529.03934.5426.94425.00619.24317.7200.9350.480 1.757
Last
166
City of Eden Prairie, Minnesota
Principal Property Taxpayers
For the Year Ended December 31, 2023 and 2014
Percentage Percentage Tax of Total Tax of Total Taxpayer Capacity Tax Capacity Taxpayer Capacity Tax Capacity United Healthcare $ 2,557,030 1.6% Liberty Property Limited Partnership $ 2,509,100 2.4% Arrive Eden Prairie Apartments 1,106,350 0.7% Eden Prairie Mall LLC 2,503,440 2.4% Fountain Place Apartments 1,100,489 0.7% AGNL Health 1,394,430 1.3% Eden Prairie Mall 1,092,450 0.7% CPE Holding 32607 LLC, Etal 815,130 0.8% Elevate Apartments 908,585 0.6% PRIT Core Realty Holdings LLC 747,088 0.7% Flagstone-Presbyterian Homes 881,438 0.5% United Healthcare Serv Inc 629,250 0.6% UHG Headquarters 807,250 0.5% Lifetouch Inc. 594,962 0.6% Flying Cloud Corporate Campus 775,620 0.5% Gelco Corp. 559,740 0.5% Park at City West Apartments 686,909 0.4% Windsor Plaza LLC 536,298 0.5% Arrive Watertower Apartments 677,845 0.4% IRET Properties 472,660 0.4% Total Principal Taxpayers 10,593,966 6.5% 10,762,098 10.2% All Other Taxpayers 153,561,659 93.5% 95,200,983 89.8% Total $ 164,155,625 100.0% $ 105,963,081 100.0% Source: City of Eden Prairie Assessing Department 2023 2014 167
City
of Eden Prairie, Minnesota
Property Tax Levies and Collections
Last Ten Years
Source: Hennepin County
Collected Within the Year Current Year Levy Collections Total Collections to Date Ended Taxes % of in Subsequent % of Dec. 31 Levied Amount Levy Years Amount Levy 2014 $ 33,220,111 $ 32,881,280 98.98% $ (25,563) $ 32,855,717 98.90% 201533,992,311 33,675,337 99.07%(121,190) 33,554,147 98.71% 201634,860,874 34,512,035 99.00%(334,699) 34,177,336 98.04% 201735,911,841 35,480,742 98.80%(223,399) 35,257,343 98.18% 201837,349,820 37,319,709 99.92%(49,207) 37,270,503 99.79% 201938,478,724 38,167,003 99.19%(41,107) 38,125,896 99.08% 202039,821,102 39,406,040 98.96%(35,815) 39,370,225 98.87% 202141,214,490 40,801,607 99.00%114,887 40,916,494 99.28% 202243,302,554 42,959,885 99.21%(172,868) 42,787,017 98.81% 202345,114,284 44,679,780 99.04%(90,383) 44,589,397 98.84%
168
City of Eden Prairie, Minnesota
Legal Debt Margin
Last Ten Years
Deductions:
Debt Margin
1 - Amt Available for Repayment of Bonds only includes "Restricted Debt" of General Obligation and Tax Abatement Bonds
2014 2015 2016 2017 2018 2019 2020 2021 2022 2023 Estimated Market Value $ 8,627,122,700 $ 9,078,339,200 $ 9,633,243,700 $ 9,872,802,500 $ 10,209,614,900 $ 10,663,264,100 $ 11,121,835,000 $ 11,432,806,600 $ 11,797,011,500 $ 13,485,585,500 Legal Debt Margin: Debt Limit: 3% of Market Value 258,813,681 272,350,176 288,997,311 296,184,075 306,288,447 319,897,923 333,655,050 342,984,198 353,910,345 404,567,565 Amount of Debt Applicable to Debt Limit: General Obligation Bonds 17,906,759 13,499,232 12,036,705 10,648,354 9,211,190 8,191,241 13,227,541 4,891,000 3,673,000 2,455,000 Tax Abatement Bonds 17,598,269 17,575,537 17,552,806 17,180,074 16,697,342 16,229,610 15,306,879 27,653,135 13,168,934 12,303,881
Amt Available for Repayment of Bonds (1) 1,715,750 2,032,109 2,303,895 2,336,132 2,296,320 2,682,004 8,730,968 14,651,101 1,407,790 1,659,490 Total Debt Applicable to Limit 33,789,278 29,042,660 27,285,616 25,492,296 23,612,212 21,738,847 19,803,452 17,893,034 15,434,144 13,099,391 Legal
$ 225,024,403 $ 243,307,516 $ 261,711,695 $ 270,691,779 $ 282,676,235 $ 298,159,076 $ 313,851,598 $ 325,091,164 $ 338,476,201 $ 391,468,174 As a % of Debt Limit 86.9% 89.3% 90.6% 91.4% 92.3% 93.2% 94.1% 94.8% 95.6% 96.8%
169
City of Eden Prairie, Minnesota
Ratios of Outstanding Debt by Type
Last Ten Years
20223,673,000
(1) See Demographic and Economic Statistics for personal income (2) See Demographic and Economic Statistics for population * Information is not available
Special Year General Tax T otal General LeaseAssessments Total Total Percentage EndedObligationAbatementBonded Revenue ImprovementFinances Lease SubscriptionGovt' Revenue LeaseBusiness- of Personal Per Dec. 31 BondsBonds Debt BondsBonds Purchases LiabilityLiabilityBonds BondsLiability Type Total Income (1) Capita (2) 2014 $ 17,906,759 $ 17,598,269 $ 35,505,028 $ 1,290,000 $ 14,834,596 $ 89,593 $- $ - $ 51,719,217 $ 2,927,476 $- $ 2,927,476 $ 54,646,693 1.73% 871 201513,499,232 17,575,537 31,074,769 1,220,000 12,289,647 45,369 - - 44,629,785 2,466,230 - 2,466,230 47,096,015 1.425% 752 201612,036,705 17,552,806 29,589,511 1,145,000 12,799,455 286,942 - - 43,820,908 3,631,427 - 3,631,427 47,452,335 1.38% 751 201710,648,354 17,180,074 27,828,428 - 10,021,959 231,734 - - 38,082,121 3,143,967 - 3,143,967 41,226,088 1.14% 653 20189,211,190 16,697,342 25,908,532 - 8,054,154 175,457 - - 34,138,143 2,511,507 - 2,511,507 36,649,650 1.01% 575 20198,191,241 16,229,610 24,420,851 - 6,101,720 118,090 - - 30,640,661 6,960,748 - 6,960,748 37,601,409 1.01% 593 202013,227,541 15,306,879 28,534,420 - 4,320,627 59,611 - - 32,914,658 6,088,767 - 6,088,767 39,003,425 1.05% 612 20214,891,000 27,653,135 32,544,135 - 2,606,494 - - - 35,150,629 11,674,835 - 11,674,835 46,825,464 1.18% 729
13,168,934 16,841,934 - 2,110,026 418,137 98,441 - 19,468,538 11,272,267 1,314,339 12,586,606 32,055,144 0.74% 500 20232,455,000 12,303,881 14,758,881 - 1,608,762 325,937 75,603 842,087 17,611,270 10,599,698 1,150,738 11,750,436 29,361,706 * 459
Governmental Activities Activities Business-Type 170
City
of Eden Prairie, Minnesota
Ratios of General Bonded Debt Outstanding Last Ten Years
(1) Amount Does not Include Special Assessment Improvement or Revenue Bonds. (2) See "Taxable Assessed Value and Estimated Actual Value of Property" for Market Value (3) See Demographic and Economic Statistics for Population
Total Net Ratio of Net Year General Tax General Less Amounts General Bonded Debt EndedObligationAbatementBonded Available in Debt Bonded to Estimated Per Dec. 31 Debt (1) Bonds Debt Service Fund (1) Debt Market Value (2)Capita (3) 2014 $ 17,906,759 $ 17,598,269 $ 35,505,028 $ 1,715,750 $ 33,789,278 0.39%539 201513,499,232 17,575,537 31,074,769 2,032,109 29,042,660 0.32%464 201612,036,705 17,552,806 29,589,511 2,303,895 27,285,616 0.28%432 201710,648,354 17,180,074 27,828,428 2,336,132 25,492,296 0.26%404 20189,211,190 16,697,342 25,908,532 2,296,320 23,612,212 0.23%371 20198,191,241 16,229,610 24,420,851 2,682,004 21,738,847 0.20%343 202013,227,541 15,306,879 28,534,420 8,730,968 19,803,452 0.18%311 20214,891,000 27,653,135 32,544,135 14,651,101 17,893,034 0.16%279 20223,673,000 13,168,934 16,841,934 1,407,790 15,434,144 0.13%241 20232,455,000 12,303,881 14,758,881 1,659,490 13,099,391 0.10%205
171
City of Eden Prairie, Minnesota
Computation of Direct and Overlapping Bonded Debt
December 31, 2023
Notes:
1- The percentage of overlapping debt applicable is estimated using taxable assessed property values. Applicable percentages were estimated by determining the portion of the county's taxable assessed value that is within the City's boundaries and dividing it by the county's total taxable assessed value.
Percent of Debt Net Debt Debt Applicable Applicable Governmental Unit Outstanding to City (1) to City Direct Debt: City of Eden Prairie $ 17,611,270100.00% $ 16,792,874 Overlapping Debt: Hopkins ISD 270 $ 139,056,1234.28% $ 5,951,602 Eden Prairie ISD 272 98,606,12597.54% 96,180,414 Minnetonka ISD 276 117,165,2562.74% 3,210,328 Hennepin County 1,056,334,5265.82% 61,478,669 Henn Suburban Park District 49,655,0748.02% 3,982,337 Henn Regional RR Authority 80,622,4435.82% 4,692,226 Metropolitan Council 89,723,1302.88% 2,584,026 Total Overlapping Debt 1,631,162,677 178,079,602 Total Direct and Overlapping Debt $ 1,648,773,947 $
194,872,476
172
City of Eden Prairie, Minnesota
Demographic and Economic Statistics
Last Ten Years
Sources:
City of Eden Prairie Planning Department
Minnesota Department of Employment and Economic Development
United States Census Bureau
Eden Prairie School District 272 - Enrollment History Website
* Data is not available
Per Personal CapitaMedianSchool Unemployment Year Population IncomeIncome Age Enrollment Rate 2014 62,729 $3,163,737,115 50,435 $ 37.90 9,011 3.3% 2015 62,593 3,306,037,074 52,818 38.30 8,941 2.9% 2016 63,187 3,450,073,387 54,601 39.70 8,844 2.9% 2017 63,163 3,609,007,494 57,138 40.20 8,835 2.7% 2018 63,726 3,624,097,620 56,870 39.40 8,780 2.3% 2019 63,456 3,735,654,720 58,870 39.40 8,861 2.5% 2020 63,726 3,719,877,798 58,373 40.20 8,759 5.3% 2021 64,198 3,963,584,520 61,740 39.70 8,534 3.0% 2022 64,142 4,309,251,986 67,183 39.50 8,748 2.0% 2023 64,023 * * * 8,834 2.4%
Governmental Activities 173
City of Eden Prairie, Minnesota
Principal Employers
For the Year Ended December 31, 2023 and 2014
Source: Official Bonds Statement for G.O. Water Revenue Bonds, Series 2021A
Percentage Percentage of Total of Total Employer Employees City Employment Employer Employees City Employment Optum 3,312 5.7%Optum 4,400 8.7% Eden Prairie Mall 2,329 4.0% Starkey Labs 2,000 4.0% EP Schools 2,329 4.0% EP Schools 1,583 3.1% CH Robinson 2,200 3.8% CH Robinson 1,536 3.0% United Natural Foods Inc. 2,000 3.5% Rosemount - Emerson 1,500 3.0% Starkey Labs 1,500 2.6% SuperValu Stores Inc. 1,100 2.2% Emerson Process Management 1,500 2.6%Cigna 950 1.9% Tennant Company 1,500 2.6% Eaton Corp. 850 1.7% Element Fleet Management 1,200 2.1% MTS Systems Corp. 833 1.6% MTS Systems 1,000 1.7% Kroll On-Track 808 1.6% Total Principal Employer 18,870 32.7% 15,560 30.8% Other Employers 38,776 67.3% 35,034 69.2% Total Employers 57,646 100.0% 50,594 100.0%
2023 2014 174
City of Eden Prairie, Minnesota
Source: Human Resource department
Last Ten Years 2014201520162017201820192020202120222023 Administration Office of City Manager 2222222222 City Clerk 1111112211 Human Resources 9.79.79.89.89.89.89.89.89.89.8 Communications 3.53.53.53.53.53.53.53.53.53.5 Finance 5.55.55.55.55.55.55.55.55.55.5 Liquor Stores 9999999999 Information Technology 7766666 6.56.56.5 Facilities 9.889.889.8810101010101010 Community Development Administration 2222222222 Assessing 7777777777 Planning 4.64.74.74.74.74.74.84.8 55 Economic Development 1111111111 Housing & Community Services 1.751.751.751.751.75 22222 Parks and Recreation Administration 2222222222 Park Maintenance 20202020202020202121 Recreation Services 7.67.67.67.67.67.67.67.67.67.6 Community Center 5.55.56.56.56.56.56.56.56.56.5 Police Professional Staff 25252525252424242525 Sworn Officers 66666768686969.570.57172 Fire Administration 99999999 1111 Building Inspections 9999999999 Public Works Engineering 8.39.310.310.37.57.57.57.57.57.5 Street Maintenance 14.514.51414141515151515 Utilities 34.734.735.735.739.539.539.539.54039.5 Fleet Services 6.55.5 55555555 Grand Total 272.03272.13274.23275.35276.35277.6279.2280.7284.9285.4
Employees by Function
175
City of Eden Prairie, Minnesota
Operating Indicators
Sources: Various City Departments
MGD -
Last
2014201520162017201820192020202120222023 General Government Bond Rating - Moody's Investor Service Aaa Aaa Aaa Aaa Aaa Aaa AaaAaaAaaAaa Bond Rating - Standard & Poors AAA AAA AAA AAA AAA AAA AAAAAAAAAAAA Housing and Human Services Number of Residents Served 3,500 3,500 3,500 3,750 3,975 5,700 9,200 14,300 6,105 5,050 Assessing: Number of Inspections Completed 5,291 5,320 5,066 5,061 4,908 4,912 5,267 4,842 5,195 5,116 Parks and Recreation Avg Monthly Community Center Memberships n/a n/a2,511 2,688 2,608 2,486 1,683 1,346 1,744 1,954 Program Registrations (Excludes Leagues) 18,269 17,531 15,701 17,161 17,972 19,931 6,022 14,848 15,877 17,643 Public Safety Fire Number of Calls 1,614 1,617 1,615 1,742 1,908 1,875 2,915 2,909 3,426 3,272 Inspection Permits Issued 7,469 6,405 5,997 6,227 6,436 6,438 7,766 8,883 7,117 6,603 Building permit revenue $3,496,417 $3,059,075 $2,303,405 $2,066,787 $3,388,529 $3,646,332 $3,578,799 $4,409,481 $3,836,375 $3,562,908 Police Number of Calls 50,380 49,921 50,741 46,319 52,278 50,909 40,564 42,801 43,363 45,765 Public Works: Patching Materials (Tons) 2,400 1,555 2,370 1,650 1,700 1,976 1,739 1,164 1,019 1,140 Overlays (Tons) 26,488 29,602 23,070 28,856 29,852 31,503 35,988 33,164 45,456 39,484 Crack Filling Materials (Lbs) 154,944 32,000 68,000 42,000 31,920 50,007 66,175 6,340 34,570 36,432 Seal Coating (Sq Yards) - Chips Sealed Placed 375,500 411,700 381,600 405,425 365,907 327,998 364,854 66,892 N/AN/A Seal Coating (Sq Yards) - Fog Seal/Reclamite Placed n/a n/a n/a n/a n/a276,296 470,020 602,335 502,598 259,820 Water System: Number of Connections 19,269 19,312 19,362 19,426 19,426 19,426 19,541 19,526 19,568 19,598 Water Main Repairs 9 28 53 30 18 24 33 24 27 36 Number of Hydrant Flushed 4,326 4,311 4,515 4,360 4,395 4,274 - 4,273 4,470 4,476 Average Daily Usage 7.25 MGD6.99 MGD7.07 MGD7.06 MGD7.08 MG6.25 MG6.95 MG7.72 MG7.4 MG7.6 MGD Sewer System: Number of Connections 18,578 18,644 18,707 18,865 18,925 18,955 19,016 19,022 19,072 19,096 Miles of Sanitary Sewer Cleaned 75 81 81 76 65 50 10 51 65 86 Storm System: Number of Storm Sumps Maintained 103 78 91 88 97 48 40 60 52 143
Ten Years
Million Gallons Daily
176
N/A - Not Available
Last Ten Years 2014201520162017201820192020202120222023 Public Safety Fire Protection Number of Stations 4444444444 Number of Volunteer Firefighters 909299101959294939592 Police Protection Number of Stations 1111111111 Public Works Miles of City Streets 233 234 234 234 235 235 235 236235235 Parks and Recreation City Parks 43434343434343434343 Conservation Areas 15151515151515151515 Historic Sites 5555555555 Special Use Areas 5555555555 Miles of Trails 128128128134134134.5134.5134.5134.5134.5 Water System Number of Wells 15 15 15 15 15 15 15 151515 Total Pumping Capacity 28 MGD28 MGD28 MGD28 MGD28 MGD28 MGD28 MGD28 MGD28 MGD28 MGD Total Storage Capacity 8.5 MG8.5 MG8.5 MG8.5 MG8.5 MG8.5 MG12.5 MG12.5 MG12.5 MG12.5 MG Miles of Water Mains 326326328326326327326322399408 Sewer System Miles of Sanitary Sewer 262 264 264 263 263 264 265 262262334 Miles of Storm Sewer 186 189 193 193 193 195 198 200209207 Sources: Various City Departments
No Capital Asset Indicators are Available for the General Government Functions. MGD - Million Gallons Daily 177
City of Eden Prairie, Minnesota Capital Assets Statistics by Function
Note:
