46 | Reducing Breast Cancer Disparities with Precision Public Health: A New Strategy to Improve Prevention and Advance Health Equity in Delaware Hotspots
Scott D. Siegel, Ph.D., M.H.C.D.S.
52 | Global Health Matters Newsletter May – June 2024
Fogarty International Center
68 | Cancer Incidence and Mortality in Delaware, 2016-2020
Delaware Department Of Health And Social Services
128 | Lexicon & Resources
130 | Index of Advertisers
132 | Delaware Journal of Public Health Submission Guidelines
ISSN 2639-6378
The Delaware Journal of Public Health (DJPH), first published in 2015, is the official journal of the Delaware Academy of Medicine / Delaware Public Health Association (Academy/DPHA).
Submissions: Contributions of original unpublished research, social science analysis, scholarly essays, critical commentaries, departments, and letters to the editor are welcome.
Questions? Contact managingeditor@djph.org
Advertising: Please contact ksmith@delamed.org for other advertising opportunities. Ask about special exhibit packages and sponsorships. Acceptance of advertising by the Journal does not imply endorsement of products.
Any report, article, or paper prepared by employees of the U.S. government as part of their official duties is, under Copyright Act, a “work of United States Government” for which copyright protection under Title 17 of the U.S. Code is not available. However, the journal format is copyrighted and pages August not be photocopied, except in limited quantities, or posted online, without permission of the Academy/DPHA. Copying done for other than personal or internal reference use-such as copying for general distribution, for advertising or promotional purposes, for creating new collective works, or for resale- without the expressed permission of the Academy/DPHA is prohibited. Requests for special permission should be sent to managingeditor@djph.org
IN THIS ISSUE
Cancer and the Power of Preventive Screening
When an individual is diagnosed with cancer, not only is there an increased medical burden (e.g., tests, treatments, therapies), but also an economic burden. As cancer progresses, the costs associated with treatment and the burdens of the disease begin piling up, leading to both economic distress and increased time living with disability.
And that is just for one person with cancer.
Looking at the whole population, as we like to do in public health, shows cancer having a significant impact on health in the United States, and in Delaware. Not only the economic burdens due to lost wages and increased costs associated with treatment, but the increased years of life lost due to premature death, the decreased quality of life for cancer survivors, and the ongoing burden of disease, treatment, and remission.
Cancer also represents a continuum of opportunities to care for the patient and community: from bench research, to bedside care, to prevention and community outreach. In this issue of the Journal, we look at all these aspects of cancer, including the power of preventive screenings. By studying ways to improve cancer control programs, assessing the risks and benefits of screening to inform guidance on screening strategies, and implementing those strategies to prevent, detect, diagnose, and treat cancer earlier, we can have a significant impact on cancer incidence and prevalence in the first state.
We also wish to add a personal tribute to our guest co-editor Dr. Nick Petrelli. He has been a stalwart champion of the patient, first and foremost, for nearly a quarter century in his leadership role as the head of the Helen F. Graham Cancer Center at ChristianaCare in Delaware. He reprises his role as guest editor of this issue, as we also reflect on his legacy of patient care and advancing the health of populations.
Dr. Khan notes that,
Nick is a dear friend, and colleague, and with him you always know where you stand! His direct approach is matched only by his unparalleled dedication to our patients and community.
Dr. Nick Petrelli is a most valued colleague, scholar, physician and leader extraordinaire, and we are lucky to have benefited from his years of dedication.
As always, we welcome your feedback on this and any issue of the Journal.
Omar A. Khan, M.D., M.H.S. Editor-in-Chief, Delaware Journal of Public Health
Katherine Smith, M.D., M.P.H. Publisher, Delaware Journal of Public Health
Cancer and the Power of Preventative Screening: We Have Come a Long Way
Nicholas Petrelli, M.D. Bank of America Endowed Medical Director, Helen F Graham Cancer Center & Research Institute, ChristianaCare
This issue of the Journal is about cancer in Delaware and, as the title states, the power of preventive screening. There is no question that Delaware has come a long way in both cancer incidence and mortality, even in the last decade. This is evident by the subject matter in this issue of the Journal leading up to the discussion of cancer incidence and mortality in Delaware, 2016-2020.
The latest data puts Delaware 15th in the nation for overall cancer mortality and 20th for overall cancer incidence.1 We have come a long way from number 1 for both cancer incidence and mortality, but there is still much more to do, especially in our underserved populated areas in the state.2,3 The fact is, each of the cancer centers in the state working together with the State government and community organizations has led to the success that we have seen so far. Just as impressive and a tribute to everyone involved is that the Delaware Cancer Treatment Program (DCTP) is still active and vibrant 20 years later.4 The DCTP can support treatment for cancer patients who are uninsured for two years and can even help with patients’ co-pay. As I wrote in a previous commentary,5 “collaboration can be successful statewide,” which Delaware has demonstrated in the last 23 years in cancer treatment and prevention. This success is a model for the rest of the Country. However, we can’t rest on our laurels.
Progress in cancer care is occurring at warp speed. Personalized medicine, where oncologists can use a person’s cancer genes to choose their treatment, has made progress in lung cancer, breast, melanoma, and colon and rectal cancer just to name a few. Genetic counseling and gene testing are critical and standard of care in the treatment of patients with cancer today. In view of the speed of new knowledge, the ability of oncologists to personalize cancer treatment today will seem embryonic even five years from now.
The last commentary I wrote for the Delaware Journal of Public Health was in 2017.6 At that time, I stated that without question there were disparities in cancer care in Delaware. Seven years later, those disparities still exist.2,3 Although community cancer outreach programs in the Hispanic, African American, Asian, and South Asian communities are addressing these disparities every day, we still have a lot of work to do.
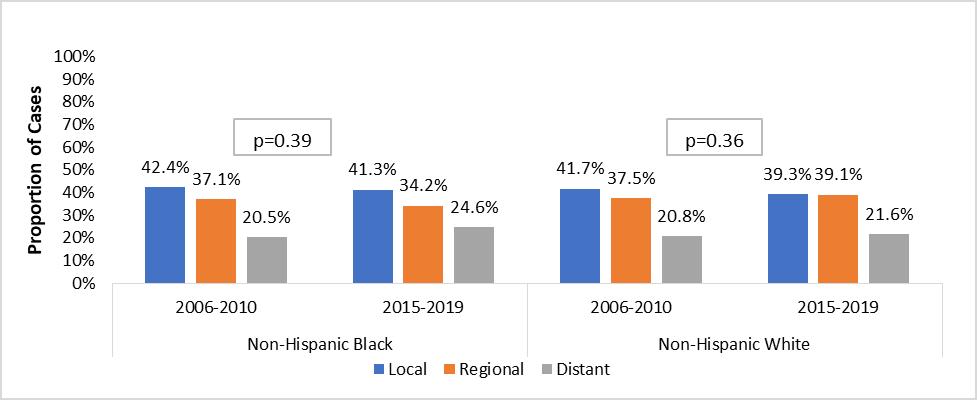
As stated in this issue of the Journal by Diane Ng and Associates (Sustaining Improvements in Colorectal Cancer Across Delaware: A Look at Racial Disparities a Decade Later), the success of the colorectal statewide program which ended the disparity between Caucasians and African Americans in 20087 is a model for other cancers, such as lung cancer and breast cancer. Recent analysis conducted in the report by Ng and Associates reveals that trends in colorectal cancer incidence and mortality have remained stable for non-Hispanic Blacks and non-Hispanic Whites for most of the last decade, following significant decreases seen in 2001-2010. Although there is no decrease in incidence and mortality, this is still significant. On the other hand, lung cancer is still responsible for 33% of cancer deaths in Delaware, and we have the highest incidence of triple negative breast cancer in the country, especially in the African American population.2 These are two areas of top priority over the next five years.
This year marks my 23rd year as Medical Director of the Helen F. Graham Cancer Center and Research Institute at ChristianaCare, and my 23rd year as a member of the Delaware Cancer Advisory Council and Consortium.8 I can look back on my career in Delaware9 and know that the individuals across the state whom I have had the pleasure of working with are leaving a legacy for future Delawareans.
Although we have a lot of work left to do, I do not know of any other state that has had the type of progress in cancer treatment and prevention that Delaware has achieved. Government is not a popular subject these days, especially the one in Washington, D.C., but for 23 years our state government has continued to support the Delaware Cancer Advisory Council and Consortium, which throughout both decades could have easily been axed in view of other priorities. That is a credit to the three governors and lieutenant governors under whom I have served in the last 23 years.
In conclusion, I cannot even imagine what cancer care treatment and prevention will be a decade from now. We have some of the brightest minds on the planet in this country working every day to tackle what I would consider the smartest cells on the planet: cancer cells. I can’t predict whether someday cancer will be cured, but I do know that as opposed to even eight years ago, many cancers have turned into a chronic disease with improvements in quality of life. And perhaps like diabetes, arthritis and osteoporosis, cancer will continue to be a chronic disease with which we will deal with for a long period of time.
Dr. Petrelli may be contacted at npetrelli@christianacare.org
REFERENCES
1. American Cancer Society. (2024). Cancer facts & figures 2024. Atlanta: American Cancer Society. 1-82.
2. Siegel, S. D., Brooks, M. M., Sims-Mourtada, J., Schug, Z. T., Leonard, D. J., Petrelli, N., & Curriero, F. C. (2022, January). A population health assessment in a community cancer center catchment area: Triple-negative breast cancer, alcohol use, and obesity in New Castle County, Delaware. Cancer Epidemiol Biomarkers Prev, 31(1), 108–116. https://doi.org/10.1158/1055-9965.EPI-21-1031
3. Siegel, S. D., Brooks, M. M., Lynch, S. M., Sims-Mourtada, J., Schug, Z. T., & Curriero, F. C. (2022, June 1). Racial disparities in triple negative breast cancer: Toward a causal architecture approach. Breast Cancer Res, 24(1), 37 https://doi.org/10.1186/s13058-022-01533-z
4 Delaware Cancer Treatment Program. (n.d.). Retrieved from: https://dhss.delaware.gov/dph/dpc/catreatment.html
5 Petrelli, N. (2024, February). Collaboration can be successful statewide. Surgical Oncology, 52, 102018 https://doi.org/10.1016/j.suronc.2023.102018
6 Petrelli, N. J. (2017, June 29). Cancer care in Delaware: A national model. Delaware Journal of Public Health, 3(3), 4–6. https://doi.org/10.32481/djph.2017.06.002
7. Grubbs, S. S., Polite, B. N., Carney, J., Jr., Bowser, W., Rogers, J., Katurakes, N., . . . Paskett, E. D. (2013, June 1). Eliminating racial disparities in colorectal cancer in the real world: It took a village. J Clin Oncol, 31(16), 1928–1930 https://doi.org/10.1200/JCO.2012.47.8412
8 Kirkpatrick, Q. (2022, Apr). The Delaware cancer consortium releases 5 year action plan. Delaware Public Media. https://www.delawarepublic.org/science-health-tech/2022-04-11/thedelaware-cancer-consortium-releases-5-year-action-plan
9. The Cancer Letter. (2023). Nicholas Petrelli to retire as medical director of Christiana Care Helen F Graham Cancer Center & Research Institute. The Cancer Letter. https://cancerletter.com/in-brief/20231215_8g/
American Cancer Society Annual Cancer Statistics 2024 Shows Drop in Cancer Mortality but Increasing Incidence for Six of the Top Ten Cancers
American Cancer Society
On January 17, 2024, the American Cancer Society (ACS) released Cancer Statistics, 2024, the organization’s annual report on cancer facts and trends.1 The new data show overall cancer mortality has continued to decline, resulting in over four million fewer deaths in the United States since 1991; however, this progress is jeopardized by increasing incidence for six of the top ten cancers as the projected number of new diagnoses now tops 2 million (2,001,140) for the first time. These important findings are published in CA: A Cancer Journal for Clinicians, alongside its consumer-friendly companion, Cancer Facts & Figures 2024, available on cancer.org.2
“We’re encouraged by the steady drop in cancer mortality as a result of less smoking, earlier detection for some cancers, and improved treatment,” said Rebecca Siegal, senior scientific director, surveillance research at the American Cancer Society and lead author of the report. “But as a nation, we’ve dropped the ball on cancer prevention as incidence continues to increase for many common cancers – like breast, prostate, and endometrial, as well as colorectal and cervical cancers in some young adults.”
For the report, ACS researchers compiled the most recent data on population-based cancer occurrence and outcomes using incidence data collected by central cancer registries (through 2020) and mortality data collected by the National Center for Health Statistics (through 2021).
Rising colorectal cancer incidence has rapidly shifted mortality patterns in adults under 50 years of age; colorectal cancer has moved up from being the fourth leading cause of cancer death in both younger men and women two decades ago to first in men and second in women. Breast cancer leads in women under 50 with 2,251 deaths in 2021.
“The continuous sharp increase in colorectal cancer in younger Americans is alarming,” said Dr. Ahmedin Jemal, senior vice president, surveillance and health equity science at the American Cancer Society and senior author of the study. “We need to halt and reverse this trend by increasing uptake of screening, including awareness of non-invasive stool tests with follow-up care, in people 45-49 years. Up to one-third of people diagnosed before 50 have a family history or genetic predisposition and should begin screening before age 45 years. We also need to increase investment to elucidate the underlying reasons for the rising incidence to uncover additional preventive measures.”3
“The 2024 ACS cancer report underscores the importance of cancer prevention, and illuminates priority areas to address cancers whose incidence and/or mortality rates are inexplicably rising,” said Dr. Karen E. Knudsen, chief executive officer at the American Cancer Society. “These observations highlight the critical need to invest in equitable application of proven cancer control interventions, and in discovery for new therapies -- especially for advanced-stage cancers. Both endeavors will be essential to accelerate progress against the 200 diseases we call cancer, and to save lives.”
Other highlights from the report include:
• Cervical cancer incidence rates are decreasing steeply in women in their 20s, who were first to receive the HPV vaccine, but are increased in women 3044 years old by 1.7% per year from 2012 through 2019, highlighting the need for more emphasis on screening in young women, as well as broader uptake of the vaccine. In 2021, HPV vaccination coverage in adolescents 13-17 years ranged from 33% in Mississippi to 79% in the District of Columbia.
• After decades of increase, cancer incidence in children has finally leveled off, although rates continue to increase among adolescents (ages 15-19 years), including a greater than 4% per year rise in thyroid cancer, much of which is likely overdiagnosis; the 15-year survival rate for thyroid cancer in adolescents is 99%.
• Mortality rates continue to increase by 2% per year for uterine corpus (endometrial) cancer, one of the few cancers with increasing mortality. Steeper increases in women of color are widening racial disparities, with the death rate now two times higher in Black women (9.1 per 100,000) than in White women (4.6 per 100,000).
• Cancer patients are getting younger: the proportion of diagnoses in people who are middle-aged (50-64 years) increased from 25% in 1995 to 30% in 20192020, whereas the proportion 65 years and older decreased from 61% to 58%, despite both age groups growing in the general population (from 13% to 19% for ages 50-64 years and from 13% to 17% for ages 65 and older). In addition to changes in the population age distribution, this shift reflects steep decreases in incidence of prostate cancer and smoking-related cancers in older adults, as well as increased cancer incidence in people born after the 1950s because of higher obesity and other yet unknown factors.
“People younger than 65 are less likely to have health insurance and more likely to be juggling family and careers,” explained Dr. William Dahut, chief scientific officer at the American Cancer Society. “Also, men and women diagnosed younger have a longer life expectancy in which to suffer treatment-related side effects, such as second cancers.”
The report also showed progress against cancer is hampered by wide static cancer disparities. Compared to White people, mortality rates are two‐fold higher for prostate, stomach, and uterine corpus cancers in Black people and for liver, stomach, and kidney cancers in Native American people.
“This report underscores the need for public policy interventions to help reduce these cancer disparities and save more lives,” said Lisa A. Lacasse, president of ACS’s advocacy affiliate, the American Cancer Society Cancer Action Network. “We urge lawmakers at all levels of government to advance policies that ensure more people have health insurance coverage as well as improved access to and affordability of care, such as increased funding for cancer research and screening programs. Doing so will bring us closer to our vision of ending cancer as we know it, for everyone.”
All of the data in these reports can be accessed from the newly designed Cancer Statistics Center, available on cancer.org, which includes custom maps and graphs, such as a state-level comparison of smoking prevalence and lung cancer rates, which can be viewed and downloaded.4
Delaware Journal of
Public Health
This year’s report also includes a special section: Cancer in People Who Identify as Lesbian, Gay, Bisexual, Transgender, Queer or Gender-nonconforming (LGBTQ+). The section is a summary of the latest information on the prevalence of major modifiable cancer risk factors and preventive measures, including screening in the LGBTQ+ populations, as well as challenges faced by LGBTQ+ individuals with cancerbased on current data.
ACS author Angela Giaquinto also participated in the study.
REFERENCES
1. Siegel, R. L., Giaquinto, A. N., & Jemal, A. (2024, Jan-Feb). Cancer statistics, 2024. CA: a Cancer Journal for Clinicians, 74(1), 12–49. https://doi.org/10.3322/caac.21820
2 American Cancer Society. (2024). Cancer facts & figures 2024. Cancer.com. Retrieved from https://www.cancer.org/research/cancer-facts-statistics/all-cancer-factsfigures/2024-cancer-facts-figures.html
3 Dizon, D. S., & Kamal, A. H. (2024, Jan-Feb). Cancer statistics 2024: All hands on deck. CA: a Cancer Journal for Clinicians, 74(1), 8–9. https://doi.org/10.3322/caac.21824
4 American Cancer Society. (2024). Cancer statistics center. Retrieved from https://cancerstatisticscenter.cancer.org/
Upcoming Issues
Each year, the Delaware Journal of Public Health publishes five different theme issues. Article submissions are accepted on a rolling basis, and the editorial board considers all submissions, both those connected directly to a theme issue, and non-thematic submissions. The editorial board reserves the right to include non-thematic submissions in each issue.
The working publishing calendar and thematic issues for 2024 are as follows:
Issue Submission Publication
Chronic Disease February 2024 March 2024
Violence April 2024 May 2024
Cancer & the Power of Preventive Screening June 2024 July 2024
Childhood Development & Education August 2024 September 2024
After COVID - Rebuilding Public Health & Healthcare Resilience October 2024 November 2024
If you have questions about submissions, ideas for an article, or suggestions for a future theme issue, please email Kate Smith: ksmith@delamed.org
All submissions can be submitted via the online submission portal: https://www.surveymonkey.com/r/2DSQN98 Submissions guidelines can be found at: https://djph.org
Evaluating Quality of Cancer Care in Delaware using Commission on Cancer (CoC) Quality Measures, 2018-2019
Wilhelmina Ross, P.A., M.P.H.
Delaware Cancer Registry Director, Westat
Diane Ng, M.P.H.
Research Associate, Westat
Hayley Little, M.P.H.
Research Associate, Westat
Sumitha Nagarajan, M.P.H.
Cancer Epidemiologist, Cancer Prevention and Control Bureau, Health Promotion and Disease Prevention Section, Division of Public Health, Delaware Department of Health and Social Services
Paulette Robinson-Wilkerson, M.S.
Public Health Treatment Program Administrator, Cancer Prevention and Control Bureau, Health Promotion and Disease Prevention Section, Division of Public Health, Delaware Department of Health and Social Services
Dawn Hollinger, M.S., M.A.
Bureau Chief, Cancer Prevention and Control Bureau, Health Promotion and Disease Prevention Section, Division of Public Health, Delaware Department of Health and Social Services
ABSTRACT
Introduction. American College of Surgeons Commission on Cancer (CoC) quality measures are used to monitor and evaluate metrics among their CoC-accredited programs, which include seven of Delaware’s hospitals. The Delaware Department of Health and Social Services, Division of Public Health (DPH) also utilizes these metrics to monitor and evaluate Delaware’s overall performance on these standards of care as it relates to the health care provided to cancer patients. Methods. Delaware Cancer Registry (DCR) cases diagnosed in 2018 and 2019 were selected and were analyzed separately to calculate results for each selected measure by year: HT, nBX, LNoSurg, and RECRTCT. Results. Results of the analysis showed that three out of the four CoC quality measures evaluated met the CoC standard of care for both 2018 and 2019 data. The three measures that met the CoC standards for 2018 were HT (90.4%), nBX (87.6%), and LNoSurg (93.3%). The RECRTCT measure did not meet the CoC standard for 2018 data with 71.4%. All four measures evaluated met the CoC standards for 2019 (HT – 91.6%; nBX – 85.2%; LNoSurg – 92.7%; RECRTCT – 92.3%). Discussion. A majority of cases assessed met the CoC quality measure standards, meeting standards of cancer care and treatment. More discovery work needs to be done to assess the RECRTCT metric to explore reasons why cases did not meet the CoC quality measure standards. There was notable improvement seen for the HT measure over time, where cases had not met the CoC standard in previous years. Public Health Implications. When CoC quality measures are met, medical providers can ensure patients receive effective and targeted cancer care. This practice ultimately saves resources, reduces cancer burden, impacts survival, and improves public health outcomes.
INTRODUCTION
The Delaware Cancer Registry (DCR) collects, stores, manages, and analyzes data related to individuals with cancer in Delaware. Delaware legislation requires that all health care facilities within the state must report all newly diagnosed or treated cancer cases.1 Information reported to the registry includes patient demographics, cancer diagnosis, and staging, treatment, and mortality.
The DCR, in coordination with the Delaware Department of Health and Social Services, Division of Public Health (DPH), utilizes cancer data to analyze and monitor quality indicators and trends, identify potential research areas, share information with stakeholders, and guide policy makers.2 In addition, the DCR participates in the Delaware Cancer Consortium (DCC), which was formed in 2001 to advise the governor and legislature on areas such as underlying
contributors to cancer burden and cancer risk reduction strategies.3 Several committees are associated with the DCC, including the Delaware Cancer Registry Advisory Committee (DCRAC), which advises and supports the DCR with the end goal of improving cancer data quality, supporting cancer surveillance and control initiatives, promoting the use and dissemination of data for research or public use, and advising on new innovative applications of data.
DCRAC has been interested in examining how the state performs on cancer quality care measures, such as the measures defined by the American College of Surgeons Commission on Cancer (CoC). The CoC is an accrediting body of multidisciplinary professional organizations that aim to advance both the quality of life and survival for cancer patients. The CoC determines quality standards to ensure a
high level of cancer care delivery in health care settings. The measures are categorized into the areas of accountability, quality improvement, and surveillance. Accountability measures can be used for various purposes, including public reporting, payment incentive programs, and the selection of providers by consumers, health plans, or purchasers. Quality improvement measures are intended to monitor internal performance within an organization. Surveillance measures can be used to identify the status quo and monitor patterns and trends of care to guide decision-making and resource allocation. Finally, the CoC utilizes the data to develop interventions to improve cancer prevention, early detection, cancer care delivery, and patient outcomes.4
The CoC accreditation process for cancer hospital-based programs includes a site visit every three years and an evaluation performed by a CoC reviewer. CoC quality measures are used to monitor and evaluate metrics among their CoC-accredited programs, including all of Delaware’s seven CoC-accredited hospital programs. However, DCRAC wanted to adapt these measures to evaluate selected metrics among all DCR cases.
A previous analysis was conducted using 2016 and 2017 DCR data to measure performance on selected CoC quality measures.5 DCRAC evaluates selected CoC quality measures at different time points as a means to assess whether Delaware cancer patients are receiving standard of care. This analysis was valuable to identify areas of improvement with actionable recommendations aligned with CoC guidelines for healthcare facilities and providers in the state. Thus, DCRAC, DPH, and DCR elected to conduct a similar analysis utilizing 2018-2019 DCR data for the same quality measures evaluated in the previous analysis to assess whether there have been improvements or differences in DCR cases meeting the CoC standards. The four quality measures included are the HT and nBX measures for breast cancer, the LNoSurg measure for lung cancer, and the RECRTCT measure for rectum cancer (Table 1).
METHODS
DCR cases diagnosed in 2018 and 2019 were selected and analyzed separately to calculate results for each measure by year. DCR cases included cases where cancer was diagnosed in Delaware regardless of CoC-accreditation status of the facility. Specific selection criteria were applied to create subsets of cases for each measure based on the CoC quality measure specifications.6 The measure types included in this study were accountability (HT) and quality improvement (nBX, LNoSurg, and RECRTCT) (see Table 1 for definitions of each standard). No surveillance measures were included in this study. Each measure specification is defined to calculate a proportion of cases meeting the standard with a numerator and denominator for each measure. Flag variables were created to define whether cases met different parameters for selection, inclusion in the numerator, and/or inclusion in the denominator. For each measure, there are several specifications using various data items from the case records that include diagnostic information, staging and prognostic factors, treatment, and patient demographic information (e.g., sex, age) to define the selection criteria and to calculate
the metric. The data items are defined according to the North American Association of Central Cancer Registries (NAACCR) data standards and data dictionary, the standard for central cancer registry and hospital-based cancer registry data collection in the U.S. All analyses were performed using SAS version 9.4 (see Table 1 for the expected percent of cases that served as a benchmark for each standard).
Following the calculation of the percentage of cases that met each standard by year, the DCR performed an additional review of cases for measures where the CoC standard was not met by obtaining additional information through the Delaware Health Information Network (DHIN).7 DHIN is a statewide health information exchange that the DCR can access to search for a patient’s clinical history. Though all Delaware facilities involved in the diagnosis or treatment of a cancer case are required to report directly to the DCR, sometimes information may not have been reported by every facility or an abstract may have been submitted prior to the completion of the cancer treatment and care. Therefore, DHIN is an additional source that the DCR may use to obtain additional information related to a case. If additional information was found for the case, such as information about treatment received that was not provided and available to the DCR, this data was incorporated into the analysis for the applicable measure.
RESULTS
Counts of eligible cases (denominators) and cases that met each CoC standard (numerators) are included in Table 1, along with the percentages of cases meeting each standard by year. Results of the analysis showed that three out of the four measures evaluated met the CoC standard for both 2018 and 2019 data. The three measures that met the CoC standards for 2018 were HT (90.4%), nBX (87.6%), and LNoSurg (93.3%). The RECRTCT measure did not meet the CoC standard for 2018 data, with 64.3% of cases originally meeting the standard and only improving to 71.4% after the DHIN review. It is important to note that few cases met the selection criteria for the RECRTCT measure. All four measures evaluated met the CoC standards for 2019 (HT –91.6%; nBX – 85.2%; LNoSurg – 92.7%; RECRTCT – 92.3%).
DISCUSSION
Almost all the evaluated CoC quality measures for 2018 and 2019 were met based on an analysis of DCR cases. The only measure where DCR cases did not meet the CoC standard was for the RECRTCT measure in 2018, though the measure was met for 2019 cases. In the previous analysis of this measure, DCR cases met the CoC standard for 100% of cases in 2016 and 92.9% in 2017. In reviewing the cases that did not meet the standard for 2018, both chemotherapy and radiation were often given but were not given relative to surgery as suggested by the standard (i.e., was given prior to surgery when recommendation is to follow surgery, or vice versa). It is unclear why the 2018 cases did not meet the standard. However, it is important to note that there were small sample sizes for the RECRTCT measure from both 2018 and 2019, which means a small number of cases that did not meet the measure guidelines resulted in a percentage
Table 1. Proportion of Delaware Cancer Registry (DCR) cases that met selected Commission on Cancer (CoC) quality measures, Delaware, 2018-2019.
Breast HT - Tamoxifen or third generation aromatase inhibitor is recommended or administered within 1 year (365 days) of diagnosis for women with AJCC T1cN0M0, or stage IB-III hormone receptorpositive breast cancer
Breast nBX - Image or palpationguided needle biopsy to the primary site is performed to establish diagnosis of breast cancer
Lung LNoSurg - Surgery is not the first course of treatment for cN2, M0 lung cases
Rectum RECRTCT - Preoperative chemo and radiation are administered for clinical AJCC T3N0, T4N0, or Stage III; or postoperative chemo and radiation are administered within 180 days of diagnosis for clinical AJCC T1-2N0 with pathologic AJCC T3N0, T4N0, or Stage III; or treatment is recommended for patients under the age of 80 receiving resection for rectal cancer.
*Original percentage before further DHIN review was 64.3%. The final percentage is shown in the table. **Sample size not shown due to threshold requirements. Cell size less than 16 count are suppressed.
below the standard. Small sample size can compromise the comparability of this measure with other measures. Also, it may hinder the reliability of conclusions made in this study. Particularly for the HT measure, there was improvement over time. Based on the previous analysis, 88.0% of DCR cases met the CoC standard in 2016 and 80.5% of cases in 2017, both values below the CoC standard of 90%. Based on the 2018 and 2019 cases, both years met the CoC standard, with a higher proportion of cases meeting the standard in 2019 compared to in 2018. For the nBX and LNoSurg measures, all years included in the previous and current analysis met the CoC standard and had similar proportions.
The DCRAC plans to continue assessing the CoC quality measures at the state level to improve quality of cancer data and care. Feedback will be shared with Delaware leadership and next steps will be discussed.
PUBLIC HEALTH IMPLICATIONS
The CoC’s quality measures play a significant role in promoting health by encouraging health care providers to
prioritize the most appropriate treatment options for cancer patients.8 These measures drive cancer treatment standards for major cancers. They also assist providers and health care facilities’ staff as they assess their adherence to standard-ofcare therapies. Targeted treatment that meets quality measure standards can lead to reduced unnecessary treatment and improved quality of life for patients.
Multiple studies have demonstrated that adherence to these standards can influence patient outcomes, even in terms of improving survival. A 2023 analysis of the Surveillance, Epidemiology, and End Results (SEER) database showed that CoC accreditation was a statistically significant variable and that non-accredited facilities had statistically significant reductions in survival.9–11 By meeting these measures consistently, hospital-based cancer programs can ensure that they are rendering the best care. Medical providers can ensure patients receive effective and targeted cancer care, ultimately saving resources, reducing cancer burden, impacting survival, and improving public health outcomes. Ms. Ross may be contacted at wilhelmninaross@westat.com.
REFERENCES
1. 16 Del. C. § 3201-3209. Retrieved May 3, 2024 from: https://delcode.delaware.gov/title16/c032/index.html
2. Delaware Health and Social Services (DHSS). (n.d.). The Delaware Cancer Registry. Retrieved from: https://dhss.delaware.gov/dph/dcr/home.html
3. Healthy Delaware. (n.d.). Delaware Cancer Consortium. Retrieved from: https://www.healthydelaware.org/consortium#upcoming-committee-meetings
4. American College of Surgeons. (n.d.). About the Commission on Cancer. Retrieved from: https://www.facs.org/quality-programs/cancer-programs/commission-oncancer/about/
5. Ross, W., & Ng, D. (2021). Quality of cancer care from 2016 to 2017 in Delaware, using select CP3R Measures. Delaware Medical Journal, 93(2), 68–71. Retrieved from: https://www.healthydelaware.org/documents/providers/delaware-cancerregistry/DMJ_-_Breast_Measures_Extract.pdf
6. American College of Surgeons. (2022). CoC quality of care measures required for 2022 site visit. Retrieved from: https://www.facs.org/quality-programs/cancer-programs/national-cancerdatabase/quality-of-care-measures/2022/
7. Delaware Health Information Network. (n.d.). About DHIN. Retrieved from: https://dhin.org/about/
8. Clark, D., & Clark, D. (2016, Summer). CP3R: An important tool. Journal of Registry Management, 43(2), 94–95. https://pubmed.ncbi.nlm.nih.gov/27556847
9. Ahmed, A., Whittington, J., & Shafaee, Z. (2024, April). Impact of Commission on Cancer accreditation on cancer survival: A surveillance, epidemiology, and end results (SEER) database analysis. Annals of Surgical Oncology, 31(4), 2286–2294. https://doi.org/10.1245/s10434-023-14709-4
10. Shulman, L. N., Browner, A. E., Palis, B. E., Mallin, K., Kakade, S., Carp, N., . . . McKellar, D. P. (2019, June). Compliance with cancer quality measures over time and their association with survival outcomes: The Commission on Cancer’s experience with the quality measure requiring at least 12 regional lymph nodes to be removed and analyzed with colon cancer resections. Annals of Surgical Oncology, 26(6), 1613–1621. https://doi.org/10.1245/s10434-019-07323-w
11. Zheleva, V., Nelson, R. A., Dumitra, S., Vora, N. L., & Lai, L. L. (2020, August). Time to adjuvant radiotherapy in breast cancer affects survival: Implications for the American College of Surgeons Commission on Cancer quality metrics. Annals of Surgical Oncology, 27(8), 2614–2625. https://doi.org/10.1245/s10434-020-08326-8
12:30 - 5:30 pm
Vaccines: An Emerging Multi-Modal Tool in the Fight Against Cancer
Valerie Lim, M.D. ChristianaCare Health System
Stephen C. Eppes, M.D. ChristianaCare Health System
ABSTRACT
Vaccines play an import role in cancer prevention as well as a growing role in cancer therapeutics. This article explores current knowledge regarding the role of vaccines (HPV and HBV vaccines) in protecting against preventable risk factors for select cancers as well as anti-cancer vaccines currently being used in practice. Current data suggests that routine childhood vaccination against HPV and HBV is an effective strategy for not only protecting against life-altering infectious diseases but also protecting against adult-onset cancers. Furthermore, while current vaccination practices and anti-cancer therapeutics have come a long way in recent decades, examination of CDC data also identifies areas for growth and improvement.
INTRODUCTION
Vaccines are commonly known for their significance in preventing a wide range of infectious diseases. However, they also play an essential role in cancer prevention and have an emerging role in treating select cancers. An estimated 12% of cancers worldwide are linked to viruses (Epstein-Barr Virus, Hepatitis B, Hepatitis C, Human papilloma virus),1 thus highlighting the importance of exploring the intersection of infectious diseases and oncologic processes. Routine childhood immunizations such as the Hepatitis B (HBV) and Human papilloma (HPV) vaccines protect against adult-onset malignancies such as hepatocellular carcinoma and HPV-associated cancers (e.g. cervical cancer, oropharyngeal cancer, oral cancer, and other genital cancers) respectively. The Bacillus Calmette–Guérin (BCG) vaccine, a vaccine used outside the US to prevent tuberculosis, is used an approved therapy for bladder cancer in the US.2 Moreover, there are many cancer vaccines currently in development to treat a variety of solid organ and hematologic malignancies.1 In this article, we will explore the impact and importance of vaccines in the fight against cancer.
HEPATITIS B AND HEPATOCELLULAR CARCINOMA
HBV is a preventable risk factor for hepatocellular carcinoma (HCC), which is associated with high morbidity and mortality worldwide. The five-year rate of progression from chronic HBV to cirrhosis is estimated to be anywhere between 12-20%.3 Of those affected by cirrhosis, the cumulative five-year progression rate to hepatocellular carcinoma is estimated to be about 10% in the US.3 Moreover, there is global variability in the prevalence of HBV-associated HCC. In areas of the world where HBV is hyperendemic such as Asia, HBV is responsible for up to 50% of HCC. There is a lower prevalence of HBV-associated HCC in the US, which is suspected to be due to relatively high vaccination rates against HBV.4 It is important to note that infants infected with HBV are at significantly higher risk for developing chronic
HBV compared to adults. While only about 5% of adults infected with acute HBV do not clear the infection and progress to chronic HBV, about 90% of infected infants progress to chronic HBV infection.5 Thus, early vaccination against HBV, particularly the birth dose of HBV, as well as screening for perinatal exposure is critically important. Nationwide, an estimated 25,000 infants are born to HBV carriers6 and of those perinatally exposed infants, about 90% are estimated to acquire an HBV infection without preventive measures.5 In the US and many countries in the world, the HBV vaccine is routinely given within the first 12-24 hours of life as well as 2-3 additional times within the first six months of life. This method has proven to be efficacious as the proportion of children under the age of five with chronic HBV was estimated to be less than 1% in 2019, a significant decrease from around 5% in the 1980s prior to the implementation of the HBV vaccine.7 While there has been a lot of progress in HBV prevention, there is still room for improvement. In 2020, about 80.6% of infants born in the US that year received the birth dose of Hep B within the first 48 hours of life.5,8 In that same year, the percentage of toddlers (aged 35 months) and adolescents (13-17 years old) who had received three Hep B doses were approximately 92.9% and 92.6% respectively.5 Given the high risk of vertical transmission and high risk of progression to chronic HBV in infants, this discrepancy between vaccination of newborns vs. older children and adolescents highlights an area for improvement.
Furthermore, acute HBV infection is oftentimes asymptomatic, putting infected adults particularly at risk for transmission. Approximately 30% of adults aged 19 and older were self-reported to have been fully vaccinated against Hep B.5 This may be due to a variety of factors including the fact that the first HBV vaccine was approved by the FDA in 1982. Therefore, as of 2023, the CDC updated HBV screening guidelines to include one-time triple panel screen (HBsAg, anti-HBs, total anti-HBc) for HBV for adults 18 and older in the general population in addition to the previous screening guideline for pregnant women and those at increased risk for HBV infection (e.g. patients with HCV or HIV, high risk sexual activity, IV drug use, and others).5
HPV AND HPV-ASSOCIATED MALIGNANCIES
HPV is associated with multiple genital malignancies (cervical, vulvar, vaginal, anal, penile cancer) as well as squamous cell carcinomas of the head and neck (oral, oropharyngeal, laryngeal cancer). Of particular importance, HPV is a major preventable risk factor for cervical cancer. Recent studies show that over 90% of cervical cancers are linked to HPV.9 Thus, immunization against HPV is imperative in preventing cervical cancer. Globally, cervical cancer is the fourth most common malignancy in women and is estimated to cause over 311,000 cancer deaths annually.9 Multiple studies have shown the efficacy of the HPV vaccine in reducing rates of cervical cancer, with rates of risk reduction as high as 87% pre and post vaccine era.10 HPV 16 and 18, which are particularly oncogenic, account for about 70% of cervical cancer cases. HPV 31, 33, 45, 52, and 58 are also considered high risk for causing cervical cancer and altogether account for 19% of cases. The 9-valent HPV vaccine available in the U.S. protects against subtypes 6, 11, 16, 18, 31, 33, 45, 52, and 58, providing protection against the most high-risk oncogenic subtypes of HPV. Per the most recent CDC Morbidity and Mortality Weekly Report (MMWR), only about 76% of adolescents aged 13-17 nationwide had received one or more HPV vaccines, and about 62.6% were fully up to date with HPV vaccines.11 The vaccination rates of HPV are notably lower than those of other recommended adolescent vaccines (89.9% and 88.6% for Tdap and MenACWY respectively) (Table 1).12 Additionally, HPV vaccination rates are overall higher in Delaware for both males and females compared to the national averages (Table 2).12 Of note, the percentage of teens up to date on their HPV vaccine is more than 10% lower than the percentage vaccinated with one HPV dose across the board for both males and females, in Delaware and nationwide. This disparity in vaccination highlights a clear area for improvement with regard to HPV and HPV-associated cancer prevention.
THERAPEUTIC VACCINES
Vaccines also have a role in the treatment of cancer. The most long-standing example is the BCG vaccine, a live attenuated strain of Mycobacterium bovis that is used in many countries outside the US to prevent tuberculosis
In the US, it has become a mainstay of treatment for intermediate to high-risk non-muscle invasive bladder cancer (NMIBC). Intravesical treatment with BCG has been proven to be efficacious in reducing the risk of postresection recurrence of NMIBC when used as a postsurgical adjuvant treatment. Early studies showed a fiveyear recurrence-free survival rate as high as 80% in those treated with adjuvant BCG after bladder tumor resection compared to those treated with resection alone.2 Subsequent landmark studies found that patients with NMIBC treated with intravesical adjuvant BCG even had higher recurrencefree survival rates than those treated with traditional intravesical chemotherapeutic agents such as doxorubicin and mitomycin. Thus, over the past 40 years, post-resection adjuvant intravesical BCG treatment has become the standard of care for NMIBC.2 It is also worth noting that other therapeutic cancer vaccines, although they are not antimicrobial vaccines, work by targeting a patient’s own immune response against tumor cells, and are considered a subtype of immunotherapy. For example, Provenge (Sipulecel-T) is a cell-based cancer vaccine FDA-approved for the treatment of metastatic castration-resistant prostate cancer. It works by targeting a patient’s own dendritic cells against prostate cancer tumor cells.13 There are many types of cancer vaccines currently in development against a wide range of cancers including pancreatic cancer, non-small cell lung cancer, multiple myeloma, and many more.1
CONCLUSION AND PERSPECTIVES
Vaccination is both an effective prevention strategy against cancer as well as an emerging therapy. This article summarizes well-established and widely implemented prevention strategies such as the HBV and HPV vaccines. Improving current vaccination rates against HPV and HBV present feasible avenues for improving cancer prevention. Moreover, the BCG vaccine and Provenge demonstrate the viability and promising therapeutic potential of anticancer vaccines. While Provenge is a cell-based vaccine, there are currently numerous clinical trials exploring the use of different vectors including virus-based, peptide-based, and nucleic acid-based anti-cancer vaccines (e.g. mRNA, DNA).1 Dr. Lim may be contacted at Valerie.lim@christianacare.org.
Table 1. Comparison of Vaccination Rates in Adolescents (aged 13-17) in the US11
Table 2. Comparison of Vaccination Rates of HPV in Adolescents (aged 13-17) in Males and Females in Delaware and in the US, Based on 2022 CDC Data12
REFERENCES
1. Liu, J., Fu, M., Wang, M., Wan, D., Wei, Y., & Wei, X. (2022, March 18). Cancer vaccines as promising immunotherapeutics: Platforms and current progress. Journal of Hematology & Oncology, 15(1), 28. https://doi.org/10.1186/s13045-022-01247-x
2. Jiang, S., & Redelman-Sidi, G. (2022, June 23). BCG in bladder cancer immunotherapy. Cancers (Basel), 14(13), 3073. https://doi.org/10.3390/cancers14133073
3. Fattovich, G., Bortolotti, F., & Donato, F. (2008, February). Natural history of chronic hepatitis B: Special emphasis on disease progression and prognostic factors. Journal of Hepatology, 48(2), 335–352. https://doi.org/10.1016/j.jhep.2007.11.011
4. Hsu, Y. C., Huang, D. Q., & Nguyen, M. H. (2023, August). Global burden of hepatitis B virus: Current status, missed opportunities and a call for action. Nature Reviews. Gastroenterology & Hepatology, 20(8), 524–537. https://doi.org/10.1038/s41575-023-00760-9
5. Centers for Disease Control and Prevention. (n.d.). CDC. https://www.cdc.gov/
6. Smith, E. A., Jacques-Carroll, L., Walker, T. Y., Sirotkin, B., & Murphy, T. V. (2012, April). The national Perinatal Hepatitis B Prevention Program, 1994-2008. Pediatrics, 129(4), 609–616. https://doi.org/10.1542/peds.2011-2866
7. World Health Organization. (2024). Hepatitis B. Retrieved from https://www.who.int/news-room/fact-sheets/detail/hepatitis-b
8. Pelts, K., & Lemma, T. (2020). 2020 Hepatitis B birth dose and timely vaccination goals: Are we there yet? Pediatrics, 146(1_ MeetingAbstract), 554–556. https://doi.org/10.1542/peds.146.1MA6.554
9. HPV Information Centre. (n.d.). Retrieved from https://hpvcentre.net/
10. Falcaro, M., Castañon, A., Ndlela, B., Checchi, M., Soldan, K., Lopez-Bernal, J., . . . Sasieni, P. (2021, December 4). The effects of the national HPV vaccination programme in England, UK, on cervical cancer and grade 3 cervical intraepithelial neoplasia incidence: A register-based observational study. Lancet, 398(10316), 2084–2092. https://doi.org/10.1016/S0140-6736(21)02178-4
11. Pingali, C., Yankey, D., Elam-Evans, L. D., Markowitz, L. E., Valier, M. R., Fredua, B., . . . Singleton, J. A. (2023, August 25). Vaccination coverage among adolescents aged 13–17 Years — National Immunization Survey–Teen, United States, 2022. MMWR. Morbidity and Mortality Weekly Report, 72(34), 912–919. https://doi.org/10.15585/mmwr.mm7234a3
12. Centers for Disease Control and Prevention. (n.d.). Teenvaxview. Retrieved from https://www.cdc.gov/vaccines/imz-managers/coverage/teenvaxview/index.html
13. Handy, C. E., & Antonarakis, E. S. (2018, April). Sipuleucel-T for the treatment of prostate cancer: Novel insights and future directions. Future Oncology (London, England), 14(10), 907–917. https://doi.org/10.2217/fon-2017-0531
The Delaware Healthcare Association Presents:
The 28th Annual Delaware Healthcare Forum on Tuesday, October 29, 2024, 8:30 AM To 4:30 PM At Bally’s Dover Casino Resort, Dover, Delaware
The Delaware Healthcare Forum is the only event attended by all of Delaware’s hospitals and health systems, from CEOs to department managers.
Sponsor Opportunities:
You don’t want to miss this opportunity to showcase your products and services to decision-makers in the healthcare industry. Sponsor participation, over the years, has been greatly appreciated, both by us and by the forum attendees. We are sure you, too, will benefit from the exposure your company receives through these events. With your sponsorship, the Delaware Healthcare Association can provide healthcare education at a reasonable cost.
Registrations:
Registrations for some members are being coordinated by one staff person – please send your registration information to the designated person as follows:
Beebe Healthcare – Becky Roberts (reroberts@beebehealthcare.org). TidalHealth Nanticoke – Kim Mitchell (Kim.mitchell@Tidalhealth.org) Nemours Children's Health - Doreen Albert (Doreen.albert@Nemours.org).
Employees of all other organizations not listed above should register individually in accordance with their customary internal processes for attending educational events.
ACHE Education Credits
The Forum offers Continuing Education Credits to attendees:
Bayhealth - Nursing Contact Hours
Bayhealth is approved as a provider of Nursing Continuing Professional Development by the Maryland Nurses Association, an accredited approver by The American Nurses Credentialing Center’s Commission on Accreditation. (MNA#4003178).
Register online at https://deha.org/Resources/Forms/Annual-Delaware-Healthcare-Forum-Registration
Our Partners:
Providers:
Hereditary Cancer Genetic Testing: 30 Years of Impact on Cancer Care
Kendra Flores, M.S., L.C.G.C. Senior Genetic Counselor, Helen F. Graham Cancer Center, ChristianaCare
INTRODUCTION
In the early 1990s Mary Claire King’s group postulated the existence of a breast cancer-susceptibility gene, localized to chromosome 17.1 In 1994 the BRCA1 gene was discovered,2 and its counterpart BRCA2 would follow a year later.3 As we celebrate 30 years since this monumental breakthrough, it is important to reflect on the impact genetic testing for hereditary cancer has had on cancer care and prevention.
Genetic testing for hereditary cancer has evolved substantially. With time we have learned that comprehensive hereditary cancer testing should include evaluation for gross genomic deletions, duplications, and large rearrangements.3 We have learned how to evaluate the consequence of DNA alterations on the structure and function of RNA.4 The arsenal of tools to resolve ambiguity in genetic variant interpretation continues to grow. Testing turn-around-time has been dramatically reduced thanks to laboratory automation, advances in sequencing technologies, and bioinformatics. The discovery of additional genes linked to hereditary cancer has led to a paradigm shift towards multigene hereditary cancer panels as the standard of care.5 Today we enjoy expanded insurance eligibility criteria and increasingly patientfriendly laboratory billing practices that continue to make this testing more widely available.
The positive impact of identification and treatment of individuals with hereditary cancer predisposition cannot be overstated. Hereditary cancer genetic counseling provides personalized risk-assessment, patient education, and psychosocial counseling. Those at increased risk of cancer may be offered early detection procedures, risk-reduction measures, or personalized cancer treatment.
GENETIC COUNSELING AND RISK ASSESSMENT
When considering the benefits of genetic testing, it is easy to overlook the value of genetic counseling and personalized preand post-test risk assessment. The initial pre-test risk assessment is facilitated by the construction of a three-generation pedigree. Patients are often tasked with completing pre-appointment paperwork, which encourages the patient to speak with relatives, clarify details, and obtain relevant documentation such as pathology reports, consultation notes, and genetic testing reports whenever possible. Studies have shown that these pre-consultation questionaries increase accuracy in reported family history and resultant risk assessment.6,7 Even in cases where genetic testing is not indicated, documenting an accurate family history in the medical record can help guide the continued medical care of the patient. The simple act of creating a visual representation allows a patient to envision the relatedness, provides an opportunity for education, and can serve as a motivator for compliance with recommended interventions.8 In addition to pedigree analysis, pre-test risk assessment involves estimating the probability that a hereditary cancer predisposition will be identified in a given
patient. This is accomplished by reviewing the patient’s personal and family history to determine if they fulfill criteria outlined by consensus guidelines (e.g. National Comprehensive Cancer Network: NCCN ®, United States Preventative Task Force, American Society of Breast Surgeons), and by utilizing probability assessment tools such as BayesMendel,9 Penn II,10 or PREMM5.11 Defining a person’s pre-test risk allows for a more informed decision about pursuing genetic testing, and can provide evidence of risk to compel insurance to cover testing.
Post-test risk assessment is just as crucial, as this process contextualizes a patient’s results within their overall medical picture. Notably, post-test risk assessment is not limited to only patients whose testing identifies a causative mutation. For those with significant family histories of cancer, but uninformative genetic testing results, genetic counseling will often include an assessment of the residual lifetime risk to develop breast cancer. One of the most utilized tools for this endeavor is the Tyrer-Cuzick (TC) model.12 The most recent iteration of this risk algorithm includes assessment of personal risk factors such as age, body mass index, menstrual history, and breast density. The evaluation also includes a nuanced three-generation family history, which includes details on both affected and unaffected relatives (illustrated by the difference in risk for someone with 1 of 1 versus 1 of 5 aunts affected with cancer). Finally, TC analysis is able to adjust its risk quantification based on genetic testing results, not just for the proband but for other relatives as well. While no risk model can determine a precise risk to develop cancer, risk tools such as the TC offer a way to communicate the reduced, but not eliminated, residual risks for patients that are gene test negative. Further, elevated risk of breast cancer through a TC or other risk model is a commonly accepted line of evidence for insurance coverage of increased breast screening measures, such as breast MRI.13
CANCER PREVENTION
Risk assessment is most fruitful when accompanied by effective tools for intervention, as illustrated by our ability to prevent cancers before they develop in those who are gene test positive. For example, bilateral salpingo-oophorectomy (BSO) is available to those at increased risk of ovarian cancer. The link between BRCA1, BRCA2, and ovarian cancer has been long established; a recent metanalysis demonstrates a penetrance by age 70 of 39-58% for BRCA1 and 13-29% for BRCA2. 14 Similarly, the association between Lynch syndrome and ovarian cancer is well known, with an estimated penetrance of 38% by age 80 for the highest risk gene, MSH2 15 More recently, the constellation of genes associated with ovarian cancer has expanded to include several moderate-risk genes, such as BRIP1, RAD51C, RAD51D and PALB2 16,17
While screening tools exist for ovarian cancer, such as transvaginal ultrasound or CA-125 blood tests, these measures have not demonstrated reduction in cancer mortality.18
Comparatively, BRCA-carriers who elect a BSO see a 90% reduction in the risk to develop ovarian cancer.19 This corresponds with both an increased overall survival and cancerspecific survival in BRCA-carriers who elect BSO.20–22 Current NCCN guidelines recommend BSO at age 35-40 for BRCA1 carriers, with the consideration to delay risk-reducing surgery to 40-45 in BRCA2 carriers.23 BSO has become the standard of care for cancer prevention in those with hereditary risk of ovarian cancer.
Despite the benefits, the choice and timing of gynecologic risk-reducing surgery are complex and informed by medical and psychological factors.24 The risk reduction of BSO must be weighed against the increased risk of cardiovascular events, accelerated bone density loss, as well as concentration and mood difficulties of surgical menopause. Further, methods of cancer prevention continue to evolve. More recent molecular data provides compelling evidence that many epithelial ovarian carcinomas are derived from the fallopian tube and endometrium, not the ovary itself.25 Evidence from population-based studies demonstrate that salpingectomy imparts a 42-65% reduction in risk of ovarian cancer.26–29 Further studies are needed to establish how this risk reduction translates to those with genetic high-risk of ovarian cancer. The promise of this early data is reflected in the most recent iteration of NCCN guidelines, which now include the discussion of upfront salpingectomy with delayed completion oophorectomy for at-risk women who are opposed to BSO in the recommended timeframe. Individuals who are interested in this alternative approach are encouraged to so as part of ongoing clinical trials evaluating this surgical decision.23
EARLY DETECTION
Risk-informed screening is an additional line of defense against cancers that cannot be prevented. It is well understood that population-based screening for cancers such as breast, colon, or cervical cancer provide improve outcomes and reduce cancer mortality. Tailored screening for those deemed at high-risk based on positive genetic testing has shown similar results. One such example is high-quality colonoscopy with polypectomy. As colonoscopies can detect both early colon cancers, as well as neoplasia that is still confined to a polyp, colonoscopies straddle the line between cancer prevention and cancer screening. Hallmark studies have demonstrated that increased frequency of colonoscopies reduces the incidents of colon cancer by 62% in individuals with Lynch syndrome.30,31 Factors such as increased hereditary risk, subtle endoscopic appearance, and rapid carcinogenesis seen in Lynch syndrome mean that not all colon cancers can be prevented through detection in the polyp stage. However, studies attribute the observed 65-72% reduction in colon cancer mortality to colonoscopies and the resulting earlier detection of colon cancers.31,32
For rarer hereditary cancers it is difficult to demonstrate reduced cancer mortality; instead, success may be defined as the detection of early-stage malignancy when metastatic presentation is the norm. For example, diffuse gastric cancer (DGC), a rare subtype of gastric malignancy, characterized by a carpet-like presentation along the lining of the stomach and a signet-ring cell histology. As DGC tumors do not form a discrete mass, they are difficult to detect endoscopically and typically present late stage. A single-center investigation of 120 patients with DGC revealed that 61% were stage IV at
discovery, and median survival for the group was eight months from diagnosis.33 Pathogenic alterations in the cell adhesion protein e-cadherin, encoded by the CDH1 gene, confer a risk of 70% for males and 56% for women to develop DGC by age 80.34 For CDH1-positive individuals, the dramatically increased risk of DGC coupled with the inefficacy of endoscopy screening necessitates consideration of prophylactic gastrectomy. A cohort study of 56 CDH1-positive families identified 17 individuals undergoing prophylactic surgery. Of these 17 specimens, occult DGC was identified in 13 or 76.5% of specimens.35 Given that complete resection is the only potential curative approach for DGC, the consequence of early detection (in no small part due to identification of high-risk individuals through genetic testing) is clear.
CANCER TREATMENT
For those that develop a hereditary cancer, knowledge of genetic causation provides insight into effective therapies. For example, BRCA1 and BRCA2 are one of several genes that encode proteins needed to repair DNA damage via homologous recombination. In homologous recombination, DNA damage that might otherwise cascade into tumorigenesis is instead corrected using the counterpart allele found on the homologous chromosome as a template. As homologous recombination is one of few methods for remedying double-stranded DNA breaks and collapsed replication forks, this repair pathway is essential to the integrity of the genome.
A homologous recombination deficient (HRD) phenotype is a complex genomic signature. Current methodology deems a tumor HRD when there are signs of HRD cause (for example a somatic or germline BRCA1/2 mutation) or HRD effect (for example loss of heterozygosity, telomeric allelic imbalance and/or large-scale state transitions).36 HRD is an important biomarker in cancer treatment as it impacts the effectiveness of PARP-inhibitor therapy. Poly ADP-ribose polymerase (PARP1) facilitates an alternative modality of DNA repair, a pathway that becomes essential for cell survival when homologous recombination is knocked-out. As early as 2005, experiments demonstrated that BRCA1- and BRCA2-deficient cell lines are highly sensitive to PARP-inhibition.37,38 Flash forward to today, evidence of germline pathogenicity and HRD phenotype is a fundamental tool in guiding therapies for ovarian,39 breast,40 prostate,41 and pancreatic cancer.42
Similarly, knowledge that an individual has Lynch syndrome can significantly impact cancer treatment choices. Lynch syndrome results from germline defects in the mismatch repair (MMR) mechanism. Tumors resulting from Lynch syndrome will typically exhibit a characteristic phenotype: microsatellite instability and loss of immunohistochemistry expression of one or more of the MMR proteins (MLH1, MSH2, MSH6, and PMS2). Assessment of microsatellite instability and MMR function was initially a modality used to screen tumors for Lynch syndrome43; now it represents a deciding factor in cancer therapy decisions. The failure of DNA repair secondary to MMR deficiency leads to an accumulation of somatic mutations. This high mutation burden within the tumor serves as a red-flag to the immune system, making MMR-deficient tumors highly sensitive to immune checkpoint blockade therapy.44–46 Our own understanding of the mechanism of these hereditary cancers provides a targeted and effective treatment that utilizes the body’s own immune defenses against the tumor.
CONCLUSION
The choice to undergo genetic testing for hereditary cancer predisposition is a complex one. Lack of awareness, family dynamics, fear of genetic discrimination, psychological impact, cultural beliefs, and cost remain barriers to genetic testing uptake.47–50 That said, there are still substantial benefits. Personalized risk assessment empowers patients with knowledge of their family health history and arms them with data to promote informed decision-making. When risks are elevated, cancer prevention by way of chemoprevention, lifestyle modification and risk-reducing surgeries demonstrate improved survival. When cancer cannot be prevented, early detection can downstage tumors and improve outcomes. Even in cases where cancer is not discovered until advanced stages, knowledge of genetic causation now informs therapeutic decisions. These drugs are designed to exploit the weakness of the inherited mutation; singling-out tumor cells while leaving healthy cells unharmed.
Every day more personalized therapies, targeting not only inherited, but also acquired somatic genetic alterations, enter the market. From 2000 to late 2022, 97.4% of FDA approvals for solid tumor therapeutics were products that bind to or address a specific molecular target.51 As we look to the future, there is potential in the form of polygenic risk scores. A polygenic risk score uses data gleaned from genome-wide association studies to provide statistical likelihood of disease. Polygenic risk scores stand to benefit the 30% of individuals who have a familial component to cancer development who will test negative for hereditary cancer predisposition.52 For those with a hereditary cancer syndrome, there is hope in the form of cancer vaccines. Clinical trials are actively recruiting individuals with hereditary cancer predisposition, investigating a vaccine which can trigger an immune response to prevent the formation of cancer. We have come a long way in the 30 years since BRCA1 was first cloned and sequenced. Years of genetic research informs personalized risk assessment for each patient. When the likelihood of cancer is elevated, there are options for prevention, early detection, and effective targeted therapies. Now more than ever, genetics plays a pivotal role in the fight against cancer. The accomplishments made and the lessons learned from hereditary cancer genetic testing illustrate the promise of precision medicine.
Ms. Flores may be contacted at Kendra.l.flores@christianacare.org REFERENCES
1. Hall, J. M., Lee, M. K., Newman, B., Morrow, J. E., Anderson, L. A., Huey, B., & King, M. C. (1990, December 21). Linkage of early-onset familial breast cancer to chromosome 17q21. Science, 250(4988), 1684–1689. Retrieved from https://pubmed.ncbi.nlm.nih.gov/2270482/ https://doi.org/10.1126/science.2270482
2. Miki, Y., Swensen, J., Shattuck-Eidens, D., Futreal, P. A., Harshman, K., Tavtigian, S., Liu, Q., Cochran, C., Bennett, L.M., Ding, W. (1994, October 7). A strong candidate for the breast and ovarian cancer susceptibility gene BRCA1. Science, 266(5182), 66–71. Retrieved from https://pubmed.ncbi.nlm.nih.gov/7545954/ https://doi.org/10.1126/science.7545954
3 Wooster, R., Bignell, G., Lancaster, J., Swift, S., Seal, S., Mangion, J., Micklem, G. (1995, December 21-28). Identification of the breast cancer susceptibility gene BRCA2. Nature, 378(6559), 789–792. Retrieved from https://pubmed.ncbi.nlm.nih.gov/8524414/ https://doi.org/10.1038/378789a0
4 Tahiliani, J., Leisk, J., Aradhya, K., Ouyang, K., Aradhya, S., & Nykamp, K. (2020). Utility of RNA sequencing analysis in the context of genetic testing. Current Genetic Medicine Reports, 8, 140–146 https://doi.org/10.1007/s40142-020-00195-7
5. Slavin, T. P., Niell-Swiller, M., Solomon, I., Nehoray, B., Rybak, C., Blazer, K. R., & Weitzel, J. N. (2015, September 29). Clinical application of multigene panels: Challenges of nextgeneration counseling and cancer risk management. Frontiers in Oncology, 5, 208. https://doi.org/10.3389/fonc.2015.00208
6 Randall Armel, S., McCuaig, J., Finch, A., Demsky, R., Panzarella, T., Murphy, J., & Rosen, B. (2009, August). The effectiveness of family history questionnaires in cancer genetic counseling. Journal of Genetic Counseling, 18(4), 366–378 https://doi.org/10.1007/s10897-009-9228-x
7 Beadles, C. A., Ryanne Wu, R., Himmel, T., Buchanan, A. H., Powell, K. P., Hauser, E., Orlando, L. A. (2014, June). Providing patient education: Impact on quantity and quality of family health history collection. Familial Cancer, 13(2), 325–332 https://doi.org/10.1007/s10689-014-9701-z
8 Wildin, R. S., Messersmith, D. J., & Houwink, E. J. F. (2021, July). Modernizing family health history: Achievable strategies to reduce implementation gaps. Journal of Community Genetics, 12(3), 493–496 https://doi.org/10.1007/s12687-021-00531-6
9. Chen, S., Wang, W., Broman, K. W., Katki, H. A., & Parmigiani, G. (2004). BayesMendel: An R environment for Mendelian risk prediction. Statistical Applications in Genetics and Molecular Biology, 3(1), 1 https://doi.org/10.2202/1544-6115.1063
10. Lindor, N. M., Johnson, K. J., Harvey, H., Shane Pankratz, V., Domchek, S. M., Hunt, K., . . . Couch, F. (2010, December). Predicting BRCA1 and BRCA2 gene mutation carriers: Comparison of PENN II model to previous study. Familial Cancer, 9(4), 495–502 https://doi.org/10.1007/s10689-010-9348-3
11. Mittendorf, K. F., Ukaegbu, C., Gilmore, M. J., Lindberg, N. M., Kauffman, T. L., Eubanks, D. J., . . . Goddard, K. A. B. (2022, April). Adaptation and early implementation of the PREdiction model for gene mutations (PREMM5™) for lynch syndrome risk assessment in a diverse population. Familial Cancer, 21(2), 167–180. https://doi.org/10.1007/s10689-021-00243-3
12. Tyrer, J., Duffy, S. W., & Cuzick, J. (2004, April 15). A breast cancer prediction model incorporating familial and personal risk factors. Statistics in Medicine, 23(7), 1111–1130. https://doi.org/10.1002/sim.1668
13. Saslow, D., Boetes, C., Burke, W., Harms, S., Leach, M. O., Lehman, C. D., . . . Russell, C. A., & the American Cancer Society Breast Cancer Advisory Group. (2007, Mar-Apr). American Cancer Society guidelines for breast screening with MRI as an adjunct to mammography. CA: a Cancer Journal for Clinicians, 57(2), 75–89. https://doi.org/10.3322/canjclin.57.2.75
14 Chen, J., Bae, E , Zhang, L., Hughes, K., Parmigiani, G., Braun, D., & Rebbeck, T. R. (2020, April 23). Penetrance of breast and ovarian cancer in women who carry a BRCA1/2 mutation and do not use risk-reducing salpingo-oophorectomy: An updated meta-analysis. JNCI Cancer Spectrum, 4(4), pkaa029. https://doi.org/10.1093/jncics/pkaa029
15 Bonadona, V., Bonaïti, B., Olschwang, S., Grandjouan, S., Huiart, L., Longy, M., . . . Bonaïti-Pellié, C., & the French Cancer Genetics Network. (2011, June 8). Cancer risks associated with germline mutations in MLH1, MSH2, and MSH6 genes in Lynch syndrome. JAMA, 305(22), 2304–2310 https://doi.org/10.1001/jama.2011.743
16 Lilyquist, J., LaDuca, H., Polley, E., Davis, B. T., Shimelis, H., Hu, C., . . . Goldgar, D. E. (2017, November). Frequency of mutations in a large series of clinically ascertained ovarian cancer cases tested on multi-gene panels compared to reference controls. Gynecologic Oncology, 147(2), 375–380 https://doi.org/10.1016/j.ygyno.2017.08.030
17. Yang, X., Leslie, G., Doroszuk, A., Schneider, S., Allen, J., Decker, B., Tischkowitz, M. (2020, March 1). Cancer risks associated with germline PALB2 pathogenic variants: An international study of 524 families. J Clin Oncol, 38(7), 674–685 https://doi.org/10.1200/JCO.19.01907
18. Henderson, J. T., Webber, E. M., & Sawaya, G. F. (2018, Feb). Screening for ovarian cancer: an updated evidence review for the U.S. Preventive Services Task Force. Rockville (MD): Agency for Healthcare Research and Quality (US). (Evidence Synthesis, No. 157.) https://www.ncbi.nlm.nih.gov/books/NBK493399/
19. Rebbeck, T. R., Lynch, H. T., Neuhausen, S. L., Narod, S. A., Van’t Veer, L., Garber, J. E., Weber, B. L., & the Prevention and Observation of Surgical End Points Study Group. (2002, May 23). Prophylactic oophorectomy in carriers of BRCA1 or BRCA2 mutations. The New England Journal of Medicine, 346(21), 1616–1622. https://doi.org/10.1056/NEJMoa012158
20. Domchek, S. M., Friebel, T. M., Neuhausen, S. L., Wagner, T., Evans, G., Isaacs, C., Rebbeck, T. R. (2006, March). Mortality after bilateral salpingo-oophorectomy in BRCA1 and BRCA2 mutation carriers: A prospective cohort study. The Lancet. Oncology, 7(3), 223–229. https://doi.org/10.1016/S1470-2045(06)70585-X
21 Domchek, S. M., Friebel, T. M., Singer, C. F., Evans, D. G., Lynch, H. T., Isaacs, C., Rebbeck, T. R. (2010, September 1). Association of risk-reducing surgery in BRCA1 or BRCA2 mutation carriers with cancer risk and mortality. JAMA, 304(9), 967–975. https://doi.org/10.1001/jama.2010.1237
22. Finch, A. P., Lubinski, J., Møller, P., Singer, C. F., Karlan, B., Senter, L., Narod, S. A. (2014, May 20). Impact of oophorectomy on cancer incidence and mortality in women with a BRCA1 or BRCA2 mutation. J Clin Oncol, 32(15), 1547–1553 https://doi.org/10.1200/JCO.2013.53.2820
23 National Comprehensive Cancer Network. (2024). Genetic/Familial High-Risk Assessment: Breast, Ovarian, and Pancreatic Cancer (version 3.202). Retrieved from https://www.nccn.org/professionals/physician_gls/pdf/genetics_bop.pdf
24 Gaba, F., Goyal, S., Marks, D., Chandrasekaran, D., Evans, O., Robbani, S., . . . Manchanda, R., & the PROTECTOR team. (2021). Surgical decision making in premenopausal BRCA carriers considering risk-reducing early salpingectomy or salpingo-oophorectomy: A qualitative study. Journal of Medical Genetics, 59(2), 122–132 https://doi.org/10.1136/jmedgenet-2020-107501
25. Erickson, B. K., Conner, M. G., & Landen, C. N., Jr. (2013, November). The role of the fallopian tube in the origin of ovarian cancer. American Journal of Obstetrics and Gynecology, 209(5), 409–414 https://doi.org/10.1016/j.ajog.2013.04.019
26 Hanley, G. E., Pearce, C. L., Talhouk, A., Kwon, J. S., Finlayson, S. J., McAlpine, J. N., . . . Miller, D. (2022, February 1). Outcomes from opportunistic salpingectomy for ovarian cancer prevention. JAMA Network Open, 5(2), e2147343. https://doi.org/10.1001/jamanetworkopen.2021.47343
27 Falconer, H., Yin, L., Grönberg, H., & Altman, D. (2015, January 27). Ovarian cancer risk after salpingectomy: A nationwide population-based study. Journal of the National Cancer Institute, 107(2), dju410 https://doi.org/10.1093/jnci/dju410
28. Lessard-Anderson, C. R., Handlogten, K. S., Molitor, R. J., Dowdy, S. C., Cliby, W. A., Weaver, A. L., BakkumGamez, J. N. (2014, December). Effect of tubal sterilization technique on risk of serous epithelial ovarian and primary peritoneal carcinoma. Gynecologic Oncology, 135(3), 423–427. https://doi.org/10.1016/j.ygyno.2014.10.005
29 Madsen, C., Baandrup, L., Dehlendorff, C., & Kjaer, S. K. (2015, January). Tubal ligation and salpingectomy and the risk of epithelial ovarian cancer and borderline ovarian tumors: A nationwide case-control study. Acta Obstetricia et Gynecologica Scandinavica, 94(1), 86–94. https://doi.org/10.1111/aogs.12516
30 Järvinen, H. J., Mecklin, J. P., & Sistonen, P. (1995, May). Screening reduces colorectal cancer rate in families with hereditary nonpolyposis colorectal cancer. Gastroenterology, 108(5), 1405–1411 https://doi.org/10.1016/0016-5085(95)90688-6
31. Järvinen, H. J., Aarnio, M., Mustonen, H., Aktan-Collan, K., Aaltonen, L. A., Peltomäki, P., Mecklin, J. P. (2000, May). Controlled 15-year trial on screening for colorectal cancer in families with hereditary nonpolyposis colorectal cancer. Gastroenterology, 118(5), 829–834
https://doi.org/10.1016/S0016-5085(00)70168-5
32. Dove-Edwin, I., Sasieni, P., Adams, J., & Thomas, H. J. (2005, November 5). Prevention of colorectal cancer by colonoscopic surveillance in individuals with a family history of colorectal cancer: 16 year, prospective, followup study. BMJ (Clinical Research Ed.), 331(7524), 1047. https://doi.org/10.1136/bmj.38606.794560.EB
33 Schauer, M., Peiper, M., Theisen, J., & Knoefel, W. (2011, January 27). Prognostic factors in patients with diffuse type gastric cancer (linitis plastica) after operative treatment. European Journal of Medical Research, 16(1), 29–33
https://doi.org/10.1186/2047-783X-16-1-29
34 Hansford, S., Kaurah, P., Li-Chang, H., Woo, M., Senz, J., Pinheiro, H., . . . Huntsman, D. G. (2015, April). Hereditary diffuse gastric cancer syndrome: CDH1 mutations and beyond. JAMA Oncology, 1(1), 23–32 https://doi.org/10.1001/jamaoncol.2014.168
35 Lynch, H. T., Kaurah, P., Wirtzfeld, D., Rubinstein, W. S., Weissman, S., Lynch, J. F., Huntsman, D. G. (2008, June 15). Hereditary diffuse gastric cancer: Diagnosis, genetic counseling, and prophylactic total gastrectomy. Cancer, 112(12), 2655–2663. https://doi.org/10.1002/cncr.23501
36 Mangogna, A., Munari, G., Pepe, F., Maffii, E., Giampaolino, P., Ricci, G., Biffi, S. (2023, February 2). Homologous recombination deficiency in ovarian cancer: From the biological rationale to current diagnostic approaches. Journal of Personalized Medicine, 13(2), 284. https://doi.org/10.3390/jpm13020284
37 Bryant, H. E., Schultz, N., Thomas, H. D., Parker, K. M., Flower, D., Lopez, E., . . . Helleday, T. (2005, April 14). Specific killing of BRCA2-deficient tumours with inhibitors of poly(ADP-ribose) polymerase. Nature, 434(7035), 913–917
https://doi.org/10.1038/nature03443
38. Farmer, H., McCabe, N., Lord, C. J., Tutt, A. N., Johnson, D. A., Richardson, T. B., Ashworth, A. (2005, April 14). Targeting the DNA repair defect in BRCA mutant cells as a therapeutic strategy. Nature, 434(7035), 917–921
https://doi.org/10.1038/nature03445
39. Ledermann, J., Harter, P., Gourley, C., Friedlander, M., Vergote, I., Rustin, G., Matulonis, U. (2012, April 12). Olaparib maintenance therapy in platinum-sensitive relapsed ovarian cancer. The New England Journal of Medicine, 366(15), 1382–1392 https://doi.org/10.1056/NEJMoa1105535
40. Tutt, A. N. J., Garber, J. E., Kaufman, B., Viale, G., Fumagalli, D., Rastogi, P., Geyer, C. E., Jr., & the OlympiA Clinical Trial Steering Committee and Investigators. (2021, June 24). Adjuvant olaparib for patients with BRCA1- or BRCA2mutated breast cancer. The New England Journal of Medicine, 384(25), 2394–2405. https://doi.org/10.1056/NEJMoa2105215
41. de Bono, J., Mateo, J., Fizazi, K., Saad, F., Shore, N., Sandhu, S., Hussain, M. (2020, May 28). Olaparib for metastatic castration-resistant prostate cancer. The New England Journal of Medicine, 382(22), 2091–2102 https://doi.org/10.1056/NEJMoa1911440
42. Golan, T., Hammel, P., Reni, M., Van Cutsem, E., Macarulla, T., Hall, M. J., . . . Kindler, H. L. (2019, July 25). Maintenance olaparib for germline BRCA-mutated metastatic pancreatic cancer. The New England Journal of Medicine, 381(4), 317–327. https://doi.org/10.1056/NEJMoa1903387
43 Evaluation of Genomic Applications in Practice and Prevention (EGAPP) Working Group. (2009, January). Recommendations from the EGAPP Working Group: Genetic testing strategies in newly diagnosed individuals with colorectal cancer aimed at reducing morbidity and mortality from Lynch syndrome in relatives. Genet Med, 11(1), 35–41 https://doi.org/10.1097/GIM.0b013e31818fa2ff
44 Le, D. T., Durham, J. N., Smith, K. N., Wang, H., Bartlett, B. R., Aulakh, L. K., Diaz, L. A., Jr. (2017, July 28). Mismatch repair deficiency predicts response of solid tumors to PD-1 blockade. Science, 357(6349), 409–413. https://doi.org/10.1126/science.aan6733
45. Le, D. T., Uram, J. N., Wang, H., Bartlett, B. R., Kemberling, H., Eyring, A. D., . . . Diaz, L. A., Jr. (2015, June 25). PD-1 blockade in tumors with mismatch-repair deficiency. The New England Journal of Medicine, 372(26), 2509–2520 https://doi.org/10.1056/NEJMoa1500596
46 Maio, M., Ascierto, P. A., Manzyuk, L., Motola-Kuba, D., Penel, N., Cassier, P. A., Marabelle, A. (2022, September). Pembrolizumab in microsatellite instability high or mismatch repair deficient cancers: Updated analysis from the phase II KEYNOTE-158 study. Annals of Oncology : Official Journal of the European Society for Medical Oncology, 33(9), 929–938. https://doi.org/10.1016/j.annonc.2022.05.519
47. Haga, S. B., Barry, W. T., Mills, R., Ginsburg, G. S., Svetkey, L., Sullivan, J., & Willard, H. F. (2013, April). Public knowledge of and attitudes toward genetics and genetic testing. Genetic Testing and Molecular Biomarkers, 17(4), 327–335 https://doi.org/10.1089/gtmb.2012.0350
48 Forrest, K., Simpson, S. A., Wilson, B. J., van Teijlingen, E. R., McKee, L., Haites, N., & Matthews, E. (2003, October). To tell or not to tell: Barriers and facilitators in family communication about genetic risk. Clinical Genetics, 64(4), 317–326. https://doi.org/10.1034/j.1399-0004.2003.00142.x
49. Wauters, A., & Van Hoyweghen, I. (2016, April). Global trends on fears and concerns of genetic discrimination: A systematic literature review. Journal of Human Genetics, 61(4), 275–282 https://doi.org/10.1038/jhg.2015.151
50 Dron, H. A., Bucio, D., Young, J. L., Tabor, H. K., & Cho, M. K. (2023, February). Latinx attitudes, barriers, and experiences with genetic counseling and testing: A systematic review. Journal of Genetic Counseling, 32(1), 166–181. https://doi.org/10.1002/jgc4.1632
51. Scott, E. C., Baines, A. C., Gong, Y., Moore, R., Jr., Pamuk, G. E., Saber, H., . . . Beaver, J. A. (2023, August). Trends in the approval of cancer therapies by the FDA in the twenty-first century. Nature Reviews. Drug Discovery, 22(8), 625–640 https://doi.org/10.1038/s41573-023-00723-4
52. University of Pennsylvania. INO 5401 Vaccination in BRCA1/2 Mutation Carriers. CinicalTrials.gov ID: NCT04367675 https://clinicaltrials.gov/study/NCT04367675#collaborators-and-investigators
September 25, 2024
8:00 am to 4:30 pm
Martin Luther King Student Center
Delaware State University 1200 N Dupont Hwy, Dover, DE 19901
Three National Keynote Speakers The Local Expert Panels
No cost to attend breakfast, breaks, and lunch included For agenda and to register online:
https://bit.ly/DEhealthcare
Brian Nam, M.D.
Lung Cancer Screening: Early Detection Decreases Mortality
Department of Thoracic Surgery & Interventional Pulmonology, Helen F Graham Cancer Center & Research Institute, ChristianaCare
Danny Hamm, M.S.N., R.N.
Department of Thoracic Surgery & Interventional Pulmonology, Helen F Graham Cancer Center & Research Institute, ChristianaCare
Nora Katurakes, M.S.N., R.N., O.C.N.
Community Health Outreach & Education, Helen F Graham Cancer Center & Research Institute, ChristianaCare
Charles Mulligan, M.D., M.B.A.
Department of Thoracic Surgery & Interventional Pulmonology, Helen F Graham Cancer Center & Research Institute, Christiana Care
ABSTRACT
Lung cancer remains the number one cancer related mortality in the United States . While it is the third most diagnosed cancer, it is often found at an advanced stage. Survival rates for stage I lung cancer are above 70% while survival rates for stage IV lung cancer are less than 10% at five years. Methods to detect lung cancer at an earlier stage when it can be more effectively treated have been investigated for many years. These included regular chest x-rays (CXRs) and sputum samples. Unfortunately, these testing modalities did not show any benefit. This changed in 2011 when data from the National Lung Screening Trial were published. This landmark trial showed conclusively that a low-radiation dose chest computed tomography scan (LDCT) performed annually in patients with a heavy smoking history reduced lung cancer related mortality by 20%. These results have led to a nationwide effort to increase lung cancer screening. While the number of eligible patients that are being screened on a national level remains modest, significant efforts are being made at the state and local levels to increase awareness and to improve screening. These efforts have also targeted underserved areas and are focused on reducing disparities in access.
ACKNOWLEDGEMENT
The authors are grateful to the Katzin Family for their support of the Lung Cancer Screening Program at the Helen F Graham Cancer Center & Research Institute.
The need for a practical method to detect lung cancer at an early, curable stage has been recognized for many years. However, finding an effective screening tool has been difficult. In 1968, a randomized study in England examined the efficacy of twice yearly chest x-rays (CXRs) in 55,000 men from the general population. Unfortunately, no difference in lung cancer mortality was seen in this study.1 In the 1970s, three trials examined the usage of CXRs and sputum cytology in 20,000 patients with a heavy smoking history. Unfortunately, no difference was noted in lung cancer incidence or mortality.2 In 2011, a large, randomized trial involving 155,000 patients determined no benefit in the utility of annual CXRs in reducing lung cancer incidence or cancer related mortality.3
As technology evolved over time, computed tomography (CT) scans became more widely used. CT scans provided the image resolution necessary to detect lung cancers at an earlier stage versus a chest x-ray. Being able to detect lung cancer earlier, when treatment options could be curative, reduced cancer related mortality. In 2006, one of the first studies utilizing CTs as a screening tool was the International Early Lung Cancer Action Project (IELCAP). This international, non-randomized multicenter study screened 31,500 patients, including patients from Delaware, with annual CT scans. A total of 484 lung cancers were detected, 85% of which were stage I.4 Building upon this data, the National Lung Screening Trial (NLST) conclusively
established CT scans as a screening tool in 2011. This landmark study examined 53,000 patients between the ages of 55 and 74 with at least a 30-pack year smoking history and who were either current smokers or had quit within 15 years. Patients were randomized to either a low-dose CT (LDCT) or CXR. This study showed a 20% reduction in lung cancer-related mortality in those who received CT screening.5 The Nelson Trial in Europe confirmed the findings of the NLST and reported a 26% reduction in lung cancer mortality.6 Since then, the American Cancer Society has broadened the guidelines to include patients between the ages of 50 to 80 who have at least a 20-pack year smoking history.7 Patients also need to have a shared decisionmaking discussion with a qualified health professional prior to CT screening and smoking cessation counseling.
While CT screening guidelines have now existed for the past 10 years, actual screening rates have remained modest. A 2022 report from the American Lung Association showed that only 5.8% of those eligible in the United States were screened with a LDCT. Delaware had an above average rate of screening of 6.3%.8 To improve these numbers, efforts were made at both the state and local levels. At the state level, the Delaware Cancer Consortium created the Screening for Life Program in 1997. This program utilized nurse navigators to provide education and outreach. Partnering with community agencies and with federally qualified health centers were key to eliminating barriers and enhancing access. Through these efforts, a total of 48 community events were organized reaching over 2,054 individuals in 2023.
At a local level, the Christiana lung cancer screening program was started in 2016. There were 500 patients initially screened; however, this increased to 1,900 patients by 2022. Of the 1,900
patients, 22 lung cancers were detected (1.16%), 12 of which were stage I (12/22= 54.5%). This data is in line with the NLST data which showed an incidence of 0.65%, of which 50% were stage I.5 To raise additional awareness, the National Lung Cancer Screening Day is an annual event created to promote in-person screening. Also, a Lung Cancer Community Research Advisory Board (CRAB) was convened by the thoracic multidisciplinary team at the Helen F Graham Cancer Center & Research Institute at ChristianaCare to engage researchers, clinicians and community members in reducing inequities and improving access.
In the past few years, further efforts have been made to improve screening in underserved areas and to reduce disparities. Racial differences exist in lung cancer incidence, mortality and screening. African American males have the highest rate of age-adjusted lung cancer incidence in the US (73.5 per 100,000 vs 63.5 per 100,000 for white males) and have the highest lung cancer mortality (62.1 vs 51.7 for white males).9 Kunitomo group published a meta-analysis demonstrating lower screening rate in African Americans, but an equal participation rate once referred for a LDCT scan.10 Barriers to screening are multifactorial including education level, socioeconomic status, implicit bias, distrust of the medical community, and lack of insurance.11,12 In an effort to reduce disparities and to include more African Americans who developed lung cancer at a younger age and with less smoking exposure, the American Cancer Society lowered the NLST smoking and age requirements for screening.7
The Christiana Lung Health Program recognized racial disparities within its health system. Accreditation for screening at an inner-city hospital CT scanner was obtained, but it was not being utilized to full capacity. An intervention including
provider education and additional support was established and results were monitored. The uptake of screening patients in low socioeconomic zip codes and demographics were evaluated (Table 1).
The Wilmington Adult Medical Clinic was the primary care site chosen for the intervention. Physicians received lung cancer screening and smoking cessation education. Philanthropic funds were utilized to fund a dedicated nurse navigator to facilitate enrollment in screening. Education began in May 2021 and nurse navigator involvement started in July 2021. In 2022, 170 total patients were screened, 48 of which were African-American. By 2023, 549 total patients were screened, 125 of which were African-American. (Table 2, Figure 1). This observational study demonstrates that providing dedicated support to train, educate and assist providers can improve screening of African Americans in an inner-city hospital.
In the future, as technology continues to evolve, other options may supplement or supplant LDCTs as a screening method. A positron emission tomography (PET) scan has a sensitivity of 6895% in detecting stage I lung cancers; however, the high financial cost of this test currently limits its utility as a screening modality.13 Artificial intelligence could be applied in a number of ways including the development of personalized screening programs or more accurate detection on imaging tests.14 Significant research continues in developing a simple blood test that could either detect circulating tumor DNA fragments or a biomarker that would identify those with lung cancer.15 Initial progress has been made; however, continued efforts will be needed to implement widespread screening and decrease lung cancer related mortality in the state of Delaware.
Dr. Nam may be contacted at bnam@christianacare.org .
•
• Provider education
• Smoking cessation education
• Primary care letter to patients
Table 1: Intervention Plan for improving LDCT Screening Improve LDCT Screening Recruitment
Nurse navigator
Table 2: LDCT Screening in High-Risk Communities
Figure 1: Race and Ethnicity LDCT 2022 vs 2023
REFERENCES
1. Brett, G. Z. (1968, July). The value of lung cancer detection by six-monthly chest radiographs. Thorax, 23(4), 414–420. https://doi.org/10.1136/thx.23.4.414
2. Sharma, D., Newman, T. G., & Aronow, W. S. (2015, October 12). Lung cancer screening: History, current perspectives, and future directions. Arch Med Sci, 11(5), 1033–1043
https://pubmed.ncbi.nlm.nih.gov/26528348
3 Oken, M. M., Hocking, W. G., Kvale, P. A., Andriole, G. L., Buys, S. S., Church, T. R., Berg, C. D., & the PLCO Project Team. (2011, November 2). Screening by chest radiograph and lung cancer mortality: The Prostate, Lung, Colorectal, and Ovarian (PLCO) randomized trial. JAMA, 306(17), 1865–1873
https://doi.org/10.1001/jama.2011.1591
4 Henschke, C. I., Yankelevitz, D. F., Libby, D. M., Pasmantier, M. W., Smith, J. P., & Miettinen, O. S., & the International Early Lung Cancer Action Program Investigators. (2006, October 26). Survival of patients with stage I lung cancer detected on CT screening. The New England Journal of Medicine, 355(17), 1763–1771. https://doi.org/10.1056/NEJMoa060476
5. Aberle, D. R., Adams, A. M., Berg, C. D., Black, W. C., Clapp, J. D., Fagerstrom, R. M., Sicks, J. D., & the National Lung Screening Trial Research Team. (2011, August 4). Reduced lung-cancer mortality with low-dose computed tomographic screening. The New England Journal of Medicine, 365(5), 395–409. https://doi.org/10.1056/NEJMoa1102873
6. De Koning, H., Aalst, C., Haaf, K., & Oudkerk, M. (2018). Effects of volume CT lung cancer screening: Mortality results of the NELSON randomised-controlled population based trial. J Thor Onc, 13(10), S185 https://doi.org/10.1016/j.jtho.2018.08.012
7 Wolf, A. M. D., Oeffinger, K. C., Shih, T. Y.-C., Walter, L. C., Church, T. R., Fontham, E. T. H., Smith, R. A. (2024, Jan-Feb). Screening for lung cancer: 2023 guideline update from the American Cancer Society. CA Cancer J Clin, 74(1), 50–81. https://doi.org/10.3322/caac.21811
8. American Lung Association. (2023). State of Lung Cancer: 2022 Report. https://www.lung.org/getmedia/647c433b-4cbc-4be6-93122fa9a449d489/solc-2022-print-report
9. Haddad, D. N., Sandler, K. L., Henderson, L. M., Rivera, M. P., & Aldrich, M. C. (2020, April). Disparities in lung cancer screening: A review. Annals of the American Thoracic Society, 17(4), 399–405 https://doi.org/10.1513/AnnalsATS.201907-556CME
10 Kunitomo, Y., Bade, B., Gunderson, C. G., Akgün, K. M., Brackett, A., Tanoue, L., & Bastian, L. A. (2022, November). Evidence of racial disparities in lung cancer screening process: A systematic review and meta-analysis. Journal of General Internal Medicine, 37(14), 3731–3738. https://doi.org/10.1007/s11606-022-07613-2
11 Carter-Harris, L., Slaven, J. E., Jr., Monahan, P. O., SheddSteele, R., Hanna, N., & Rawl, S. M. (2018, February 3). Understanding lung cancer screening behavior: Racial, gender, and geographic differences among Indiana longterm smokers. Preventive Medicine Reports, 10, 49–54. https://doi.org/10.1016/j.pmedr.2018.01.018
12. Steiling, K., Loui, T., Asokan, S., Nims, S., Moreira, P., Rebello, A., . . . Suzuki, K. (2020, May). Age, race, and income are associated with lower screening rates at a safety net hospital. The Annals of Thoracic Surgery, 109(5), 1544–1550 https://doi.org/10.1016/j.athoracsur.2019.11.052
13 Schöder, H., & Gönen, M. (2007, January). Screening for cancer with PET and PET/CT: Potential and limitations. J Nucl Med, 48(Suppl 1), 4S–18S. https://pubmed.ncbi.nlm.nih.gov/17204716
14. Cellina, M., Cacioppa, L. M., Cè, M., Chiarpenello, V., Costa, M., Vincenzo, Z., . . . Floridi, C. (2023, August 30). Artificial intelligence in lung cancer screening: The future is now. Cancers (Basel), 15(17), 4344 https://doi.org/10.3390/cancers15174344
15 Kossenkov, A. V., Qureshi, R., Dawany, N. B., Wickramasinghe, J., Liu, Q., Majumdar, R. S., Showe, L. C. (2019, January 1). A gene expression classifier from whole blood distinguishes benign from malignant lung nodules detected by low-dose CT. Cancer Research, 79(1), 263–273. https://doi.org/10.1158/0008-5472.CAN-18-2032
Development of Sub-County Cancer Reporting Zones in Delaware and Example Use Case for Targeted Interventions
Dawn Hollinger, M.S., M.A.
Bureau Chief, Cancer Prevention and Control, Division of Public Health, Health Promotion and Disease Prevention, Delaware Department of Health and Social Services
Sumitha Nagarajan, M.P.H.
Cancer Epidemiologist, Cancer Prevention and Control Bureau, Division of Public Health, Delaware Department of Health and Social Services
Diane Ng, M.P.H.
Research Associate, Westat
Wilhelmina Ross, P.A., M.P.H.
Delaware Cancer Registry Director, Westat
Hayley Little, M.P.H.
Research Associate, Westat
Helen Arthur, M.H.A.
Section Chief, Health Promotion and Disease Prevention, Division of Public Health, Delaware Department of Health and Social Services
ABSTRACT
Objective: To describe the Delaware Cancer Registry (DCR)’s participation in the National Cancer Institute (NCI)/North American Association of Central Cancer Registries (NAACCR) Zone Design Project to create sub-county geographic areas (“zones”) for use in cancer reporting and geospatial analysis. Methods: DCR and other stakeholders reviewed up to ten unique zone configurations for each of Delaware’s three counties. The zone configurations were created using AZTool and were set to optimize three objectives: create zones that have a minimum and target population of 50,000; are homogenous based on the variables of percent minority, percent below poverty, and percent urban; and are as compact as possible. The DCR sent a survey to stakeholders to provide input on their preferred zone configuration for each county. Following the final selection of zones, the DCR utilized the geographies for calculating overall and late-stage breast cancer incidence statistics and created choropleth maps to visualize the rates by quintiles. Results: The final selections resulted in a total of 15 zones for Delaware, with three in Kent County, nine in New Castle County, and three in Sussex County. The zones ranged in population size from 54,013 to 67,693 people. Zones with higher late-stage breast cancer incidence rates included those near the areas of Wilmington, Middletown, and between Milford and Georgetown. Comparing results of overall breast cancer incidence rates by zone with latestage rates by zone, there were areas that had lower relative overall breast cancer incidence rates but were relatively higher for late-stage rates by zones or vice versa. Conclusions: Aggregating census tracts into zones allows for reporting reliable cancer rates at sub-county levels, which is instrumental in conveying meaningful information about regional cancer trends to stakeholders and the public. Delaware will be able to utilize zone-level cancer information to provide targeted interventions and outreach initiatives.
BACKGROUND/INTRODUCTION
The Delaware Cancer Registry (DCR) was legislatively established in 1980. The DCR collects information about new cancer cases, including cancer diagnostic and treatment information and patient demographics. All hospitals, laboratories, physicians, and other health care providers are required by state law to report all newly diagnosed or treated cancer cases to the DCR. Cancer registry data are used to monitor cancer trends, promote research to increase survival, guide policy planning, and respond to Delaware residents’ cancer concerns.1
Since 2008, the Delaware Department of Health and Social Services, Division of Public Health (DPH) has produced an annual report on rates of cancer within census tracts as a method of identifying areas with increased cancer burden within the state.2 Due to low case counts within census tracts, many of the cancer rates required suppression in the report to ensure patient privacy. In addition, due to calculating cancer rates within a smaller population geographic area, rates had wide confidence intervals and were not reliable.
These limitations of census tract-level reporting provided minimal relevant information to stakeholders and made it difficult to communicate this information to the public. There was a desire to analyze and report cancer at sub-county levels, but at the time, census tracts were the only option. Zone Improvement Plan (ZIP) Codes and their associated ZIP Code Tabulation Areas (ZCTAs) are often used for geospatial analysis but are not ideal for this purpose as ZIP Codes often change, do not align well with U.S. Census Bureau or other administrative boundaries, and are designed for mail delivery efficiency, not for public health and epidemiological analysis.3,4
In February 2022, the DCR began participating in the National Cancer Institute (NCI)/North American Association of Central Cancer Registries (NAACCR) Zone Design Project to create cancer reporting zones (to be referred to as “zones”) that could be used for sub-county reporting in the state. The goals of the NCI/NAACCR Zone Design Project are to work with individual central cancer registries to create zones that will reduce suppression of data for
small counties, increase spatial resolution for large counties, and create geographies that are more meaningful to cancer registries and stakeholders for cancer reporting and analysis. Delaware was the 19th state to join the project. Currently 25 states participate in this initiative.
METHODS
The methodology developed to create the zones for this project was thoroughly described in the paper “Developing Geographic Areas for Cancer Reporting Using Automated Zone Design” by Tatalovich et al.5 Briefly, the NCI/NAACCR Zone Design Project team utilized AZTool,6,7 a program used for automated zone design, to aggregate census tracts within each county in Delaware (Kent, New Castle, and Sussex) to create different zone configurations for consideration. Within the process, up to ten unique zone configurations for each county were created that were set within AZTool to optimize three objectives: create zones that have a minimum and target population of 50,000; are homogenous, based on the variables of percent minority, percent below poverty, and percent urban; and are as compact as possible. The zone configuration options were provided to the DCR for review with the goal of choosing their preferred zone configuration for each county. To involve Delaware stakeholders in the review and selection of zones for the state, the DCR administered a survey to epidemiologists and other staff at DPH, the Delaware Cancer Registry Advisory Council, select hospital researchers, and local non-profit organizations, such as the Sussex County Health Coalition. Survey respondents were sent information about each of the zone configurations for each county and were asked to select their top three zone configurations for each county and to provide an explanation for their selection. The responses were considered with the DCR ultimately making the final selections for preferred zones. Considerations that reviewers could use to choose their preferred zone configurations included a relative score that compared each zone configuration to a “base” configuration for each county that calculated how it compared on the three objectives previously mentioned (population size, homogeneity, and compactness of the zones). A statistic was calculated for each of the three objectives and these values were averaged to assign a score for each zone configuration. The relative score was then calculated as the ratio of the zone configuration’s score to the “base” configuration score, where the highest relative score meant that the zone configuration best met the set objectives. In addition to the relative scores, reviewers could choose their preferred zone configuration for each county by utilizing knowledge about the geography of the areas. For example, they may justify that a specific zone configuration would not be ideal if it split a neighborhood across zones.
Once the final zones were established, the DCR began calculating statistics such as zone-level cancer incidence rates to identify areas that could potentially be the focus of interventions and DPH efforts. Specifically, the DCR calculated overall and late-stage female breast cancer incidence rates by zone and created choropleth maps that displayed rates by quintiles. Late-stage cancer was defined as cases diagnosed at regional or distant stage. Analysis was performed on cases with the following characteristics: sex of the patient was female; the year of diagnosis was in the five-year period 2016-2020; the behavior of the cancer was coded as malignant; and the primary site was breast and excluded ICD-O-3 histology codes 9050-9055, 9140, and 9590-9993 as defined by the SEER
Site Recode ICD-O-3/WHO 2008 Definition for the “Breast” site group.8 Rates were calculated and age-adjusted to the 2000 U.S. Standard Population using DCR incidence data within SEER*Stat,9 a statistical software available from the National Cancer Institute. Maps were created using ArcMap.
RESULTS
Of the 20 stakeholders who received the preferred zone survey, only 20% responded. The survey participants were provided all ten zone configurations generated by AZTool from which to select in each county. The relative score for each zone configuration was also included to participants. From the responses received, the majority opted to choose zones with the highest relative scores. The final selections resulted in a total of 15 zones for Delaware, with three in Kent County, nine in New Castle County, and three in Sussex County. The zones ranged in population size from 54,013 to 67,693 people.
Figure 1 displays choropleth maps of overall and late-stage female breast cancer incidence rates by Delaware zones for the period 2016-2020. Zones with higher late-stage cancer incidence rates include those near the areas of Wilmington, Middletown, and between Milford and Georgetown. Comparing results of overall breast cancer incidence rates by zone with late-stage rates by zone, there are areas that have lower relative overall breast cancer incidence rates but are relatively higher for late-stage rates by zones or vice versa. Areas where there are relatively lower overall rates, but higher late-stage rates include near Wilmington and the area between Milford and Georgetown, while the area near Newark has a relatively high overall rate but a low late-stage rate.
Figure 1. Overall and Late-stage Breast Cancer Incidence Rates per 100,000 Population, by Cancer Reporting Zone, Delaware, 2016-2020
Rates are age-adjusted and are per 100,000 population.
DISCUSSION
The sub-county zone analysis allows for the visualization of DCR data with less suppression than when using census tract analysis. It also offers greater spatial resolution than data displayed by county, given that Delaware has only three counties. The aim of participation in the NCI/ NAACCR Zone Design Project was to provide a more useful and reliable display of DCR data for reporting and visualization. The cancer zone maps provide visualization of how cancer in Delaware is distributed and provides an example of a tool that can be used to identify areas that require deeper analysis, such as those with low incidence but high late-stage cancer rates. Using the zones provides a more reliable method of presenting the burden of cancer in an area compared to more granular-level calculations such as census tracts where the results can fluctuate dramatically based on low case counts and small populations for this geographic area level.
By employing cancer zones, the DCR established a useful approach to illustrating the burden of cancer within an area, which contrasts starkly with the potentially volatile results derived from calculations using census tracts that are heavily influenced by case counts. Variability in case counts affects the stability of rate calculation due to the limited number of permutations resulting in wide confidence intervals. The instability underscores the importance of a rate calculation to mitigate confusion when presenting this information to stakeholders and the public.10 The utilization of zones to identify areas with high overall and late-stage breast cancer incidence rates, especially in regions proximate to Wilmington, the stretch between Milford and Georgetown, and the vicinity of Newark, has pinpointed specific areas warranting heightened attention in terms of both education and resource allocation.
The zones present an opportunity for detailed sub-county data analysis, which can be enriched by overlaying additional datasets such as CDC PLACES (Population Level Analysis and Community Estimates), Delaware’s Screening for Life (SFL) Program, and U.S. Census data. Since the zones are created using aggregations of census tracts, any data available at the census tract level can be aggregated up to the zone level for analysis and visualization. CDC PLACES data, for instance, offers Behavior Risk Factor Survey11 estimates, such as the prevalence of cancer screenings at multiple geographic levels, including county, place, census tract, and ZCTA. SFL data, on the other hand, sheds light on cancer screening utilization among Delawareans living at 250% below the federal poverty level. By incorporating U.S. Census data, researchers can gain valuable insights into areas where socioeconomic factors intersect with cancer prevalence and screening behaviors. By utilizing diverse datasets, cancer prevention programs can more effectively allocate resources to the community level where they are most needed. By optimizing resource allocation, programs can reduce spending and expand opportunities to reach a broader spectrum of Delaware residents through targeted education and outreach initiatives.
CONCLUSION
Aggregating census tracts into zones allows for reporting reliable cancer rates at sub-county levels, which is instrumental in conveying meaningful information about regional cancer trends to stakeholders and the public. Due to Delaware consisting of three large counties, there was a desire and need to report at sub-county levels to provide information at a higher spatial resolution to identify areas for more targeted and actionable interventions and resources and to allow Delawareans to understand cancer in the context of an area more local than county. Geospatial analysis has become a more standard tool in public health within Delaware with the wider availability of data and data tools.12 This method of information analysis allows for the visualization of data at various levels. However, standard geo-political geographies such as counties are not optimized for cancer reporting and are not ideal for analysis of cancer rates, as they vary widely with regard to population size and sociodemographic characteristics.5 Delaware will be able to utilize zone-level cancer information enriched with other data sources to provide targeted interventions and outreach initiatives in order to reduce the state’s cancer burden and to improve outcomes.
PUBLIC HEALTH IMPLICATIONS
By leveraging zones in conjunction with additional datasets, public health agencies gain valuable insights into areas with high cancer burden that may benefit from interventions. The COVID-19 pandemic underscores existing inequities in the public health system that requires states to respond innovatively to address challenges faced when serving clients effectively and more efficiently. In the post pandemic environment, the Division of Public Health has committed to enhancing the state’s public health data and surveillance systems which are core to our infrastructure. It is, and continues to be, a collective effort to support state programs in knowing which groups of people are most likely to get cancer. The zones support faster evaluation of cancer control strategies, enhanced program planning and advancing data modernization solutions to safeguard sustainable solutions. Consequently, the zones will increase the response to emerging health threats in Delaware.
In summary, utilizing zones alongside complementary datasets represents a sophisticated strategy for public health analysis and intervention. By harnessing the power of geospatial analysis and data integration, public health agencies can gain deeper insights into cancer burdens and devise targeted, community interventions.
Ms. Hollinger may be contacted at dawn.hollinger@delaware.gov .
REFERENCES
1. 16 Del. C. § 3201-3209. https://delcode.delaware.gov/title16/c032/index.html
2. Delaware Department of Health and Social Services. (n.d.). The Delaware cancer registry. Retrieved from https://dhss.delaware.gov/dph/dcr/home.html
3. Grubesic, T. H., & Matisziw, T. C. (2006, December 13). On the use of ZIP codes and ZIP code tabulation areas (ZCTAs) for the spatial analysis of epidemiological data. International Journal of Health Geographics, 5, 58. https://doi.org/10.1186/1476-072X-5-58
4. Grubesic, T. H. (2008). Zip codes and spatial analysis: Problems and prospects. Socio-Economic Planning Sciences, 42(2), 129–149. Retrieved from https://doi.org/10.1016/j.seps.2006.09.001 https://doi.org/10.1016/j.seps.2006.09.001
5. Tatalovich, Z., Stinchcomb, D. G., Ng, D., Yu, M., Lewis, D. R., Zhu, L., & Feuer, E. J. R. (2022, November 19). Developing geographic areas for cancer reporting using automated zone design. American Journal of Epidemiology, 191(12), 2109–2119 https://doi.org/10.1093/aje/kwac155
6 Martin, D., Nolan, A., & Tranmer, M. (2001). The application of zone-design methodology in the 2001 UK Census. Environment and Planning A. Economy and Space, 33(11), 1949–1962. https://doi.org/10.1068/a3497
7. University of Southampton. (n.d.). AZTool. Retrieved from http://aztool.geodata.soton.ac.uk/
8. National Cancer Institute. (n.d.). Site Recode ICD-O-3/WHO 2008 Definition. Retrieved from https://seer.cancer.gov/siterecode/icdo3_dwhoheme/index.html
9. Surveillance Research Program, National Cancer Institute SEER*Stat software (seer.cancer.gov/seerstat) version 8.4.3.
10. Perez, V., Best, J., & Bacon, R. (2015). Cancer clusters in Delaware? How one newspaper turned official statistics into news. Numeracy, 8 https://doi.org/10.5038/1936-4660.8.1.7
11 U.S. Centers for Disease Control and Prevention. (2023, Aug 30). CDC- BRFSS - Survey Data & Documentation. Retrieved from https://www.cdc.gov/brfss/data_documentation/index.htm
12 Highberger, J. P., & Merriman-Nai, S. (2021, July 15). The value (and nuances) of mapping as a public health tool. Delaware Journal of Public Health, 7(3), 6–9. https://doi.org/10.32481/djph.2021.07.003
Informing a Future Clinician-Led Virtual Reality Experience Through Oncology Caregivers’ Pre-Treatment Preparation Experiences
Susan Birkhoff, Ph.D., R.N.
University of Pittsburgh; Christiana Care Health System
Heidi Donovan, Ph.D., R.N., F.A.A.N.
University of Pittsburgh
Young Ji Lee, Ph.D., M.S., R.N.
University
of Pittsburg
ABSTRACT
Purpose. The purpose of this study was to 1) describe oncology caregivers’ pre-treatment preparation experiences, 2) elicit their feedback about approaches to improve the pre-treatment preparation experience, and 3) explore the potential use of visual aids into the pre-treatment education experience that will inform future clinician-led VR experiences. Methods. Using a qualitative descriptive design and convenience sampling technique, adult oncology caregivers were recruited to complete anonymous demographic and qualitative surveys posted on social media sites (i.e. American Cancer Society, Facebook, and LinkedIn) and a university supported community research registry (i.e. Pitt + Me). Demographic data were calculated using descriptive analyses (frequency and percentage) and qualitative data were analyzed using an inductive coding approach. Results. Participants (N=18) were mostly female (n=13, 72%), white (n=14, 78%), married (n=14, 78%), and had a college degree or higher (n=16, 89%). They categorically ranged in age from 26 years to above 65 years, with the majority (n=11, 61%) between 36-55 years of age. Caregivers described the cancer information as overwhelming and in need of additional side effect information and emotional support. To meet their unmet needs, participants suggested providing additional resources, different approaches to learning, better explanation of processes and procedures, diverse emotional support, and more interactions with the oncology team. Conclusion. Clinician created VR experiences designed for and informed by oncology caregivers do not exist yet. VR could provide an alternative pediogogical approach to complement standard oncology treatment preparation. These study findings begin the exploration into innovative preparation approaches that could meet oncology caregivers’ unmet emotional and educational needs during a stressful period. Key Highlights. There is a dearth of clinicians creating and testing VR experiences for patients, let alone caregivers. Oncology caregivers are the unseen ‘backbone’ supporting their loved one and providing an innovative modality to support them could improve outcomes. VR has the potential improve outcomes for caregivers, which may improve outcomes for patients.
INTRODUCTION AND BACKGROUND
Last recorded in 2020, 53 million Americans identified as being an unpaid caregiver.1 Of those caregivers, 45% experienced a financial impact from their caregiving role and 61% were female.1 A caregiver is defined as an individual who supports the needs of another person due to illness, injury, or disability.2 Specific to oncology caregivers, these individuals tend to be women (58%), middle-aged (M=53 years), and related to the person they are caring for.3 Their caregiving experiences tend to be episodic, intense, and short-term (approximately two years) in comparison to non-cancer caregivers.3 Caregivers are a hidden workforce tackling important responsibilities with limited formal training.4 Because caregivers typically are thrust into these roles with little training, they experience reduced quality of life,1,4,5especially when their diverse needs are not prioritized.6 In healthcare, caregivers typically receive limited support options compared to patients, despite requiring assistance themselves.7,8
Prior studies confirm caregivers have varied unmet needs that should be addressed to improve their outcomes. For example, Denham, et al.’s cross-sectional study9 assessed the frequency of caregivers’ (N= 457) self-reported unmet needs across five domains and demographic factors. Key findings highlighted younger caregivers, age 18-45, have moderate to high unmet needs (p<.05) and caregivers in this sample required self-care support. Recommendations for future interventions should target coordination among caregivers and health care providers, age appropriate programs, especially for younger caregivers, and accessible resources. Denham, et al., concluded increasing healthcare providers’ awareness of caregivers’ unmet needs and resources to support them is critical to meet their needs.
Wang, et al.’s systematic review10 identified non-oncology patients’ and their informal caregivers’ unmet care needs. Patients identified their most critical unmet needs related to psychological, physical, and healthcare service and
information. Informal caregivers priority unmet needs were illness and treatment information, and care related information. Wang, et al., concluded both patients and their caregivers’ unmet care needs should be evaluated as a whole unit to address their issues.10
Specific to oncology caregivers, Weaver, et al explored the unmet needs of oncology caregivers caring for patients treated for sarcoma through semi-structured interviews.11 Results revealed four key themes: support with medical aspects of caregiving, support for self, informational needs about the patient, and financial support.11 In this study, oncology caregivers recognized the need for diverse support, yet they were apprehensive to prioritize their needs over their loved one. They reflected they would benefit from connecting with fellow oncology caregivers who could empathize with their experiences.
Despite research acknowledging increased psychological distress and poorer quality of life among caregivers of patients with cancer, targeted interventions must take into account their distinct unmet needs.4,12 Virtual reality (VR) could be an innovative intervention to support oncology caregivers’ unmet needs through an immersive experience. VR technology combines three-dimensional computer-generated graphics with motion trackers and audio in head-mounted displays to create immersive and interactive environments.13 This technology could be an effective interventional tool to communicate information that requires an immersive environment10 such as patient education,14 psychological therapy,15–17 and pain distraction.18,19 In addition, immersive VR has demonstrated the ability to improve recall.20
Identifying caregivers’ multifaceted and complex unmet needs and deficiencies in services can inform future interventions.4 Tailoring these interventions to address caregivers’ needs may reduce their distress and improve their quality of life.12 Currently, there is a dearth of literature exploring oncology caregivers’ pre-treatment preparation needs and innovative interventions to support those needs during a stressful period of time. Therefore, the purpose of this study was to 1) describe oncology caregivers’ pre-treatment preparation experiences, 2) elicit feedback to improve their pre-treatment preparation experience, and 3) elicit feedback to incorporate visual aids into the pre-treatment education that will inform future nurse-led VR experiences tailored to their needs.
METHODS
Study Design and Sample
This study employed a qualitative descriptive design to explore the initial ‘empathize’ construct in the Design Thinking Framework (Figure 1).21 The emphasize construct was used describe unmet needs and pain point21 to inform a future VR intervention for oncology caregivers. After receiving Institutional Review Board approval and permission to post, from July, 2021 – October, 2021, adult oncology caregivers, 18 years or older, were recruited to respond to anonymous demographic and qualitative surveys posted on social media sites (Facebook and LinkedIn), a national oncology forum (National Cancer Society), and a university supported community research registry (Pitt + Me). Using a convenience sampling technique, participation was open to adult caregivers who 1) supported an individual who received oncology treatment within the last two years, and 2) had the ability to read, write, and speak English.
Figure 1. Design Thinking Framework21
Study Procedures and Data Collection
Prior to participant recruitment, the Institutional Review Board approved the study. Study flyers were posted on the American Cancer Society, Facebook, and LinkedIn social media sites, as well as Pitt + Me research registry. The Pitt + Me registry is a community of patients, volunteers, and researchers partnering together in research and clinical trials. Consent was not required to collect anonymous data; however, interested participants could read through the research introduction explaining the goal of the study, surveys, and time commitment before accessing the surveys. Survey data was collected through the secure and encrypted REDCap data management system. In addition to demographic questions, these semi-structured open-ended surveys aimed to elicit caregivers’ pre-treatment experiences and whether visual aids (i.e., video, model) could enhance these experiences. Data were collected until saturation occurred.
Data Analysis
Demographic data were calculated using descriptive analyses (frequency and percentage) using SPSS version 27 and qualitative data were analyzed using NVIVO version 12 software with a content analysis approach.22 Qualitative experience responses were initially coded, related codes were categorized and then, clustered to identify themes.23 Coding accuracy was assured through faculty review and themes were discussed with the research team to ensure agreement and trust worthiness of results.
Table 1. Participant Characteristics (N=18)
RESULTS
Eighteen adult caregiver participants responded to the anonymous demographic and qualitative surveys (see Table 1). Participants were mostly female (n=13, 72%), white (n=14, 78%), married (n=14, 78%), and had a college degree or higher (n=16, 89%). They categorically ranged in age from 26 years to above 65 years, with the majority (n=11, 61%) between 36-55 years of age. In addition to demographic results, three prominent themes emerged: 1) feeling of preparation to care for a loved one, 2) perspectives to improve preparation of the oncology caregiving experience, and 3) visual aids to support oncology caregivers.
THEME 1:
Feelings of Preparation to Care for Loved One
Many caregivers described their preparation experiences as fraught with many emotions and difficult to manage because they felt overwhelmed and underprepared (see Table 2). For example, one participant stated, “The emotional rollercoaster is huge, trying to make sense of and understand what’s happening feels impossible.” Another participant stated, “I felt prepared from an educational standpoint but not at all from an emotional standpoint.” From participants’ descriptions, pre-treatment education appeared to be focused on the patients’ treatment plan and less about the emotional aspects of being a caregiver. For example, “education helped to feel prepared, but the emotional and mental aspects are what drain you the most after you’re already physically drained from care for them. That’s something I don’t think you could ever be prepared for.”
THEME 2: Perspectives to Improve Preparation of Oncology Caregiving Experience
Several caregivers described the emotional toll preparing for treatment with their loved one and how they wished they better understood different aspects of the cancer journey (see Table 3). For example, the fear of the unknown and feeling helpless was expressed by several participants. Other participants felt they needed more information to adequately manage their loved one’s side effects. For instance, one participant stated, “How other people handle chemo with a similar diagnosis to hers. The doctors were always careful to explain that everyone is different but I don’t think it was ever communicated to us just how hard chemo can be on a person’s body and loved ones.” Many caregivers were unable to articulate one could better prepare for the caregiving experience related to the unknown. For example, one participant stated, “Not sure. Nothing can adequately prepare a person for the unknown…”
THEME 3: Visual Aids to Support Oncology Caregivers
Participants suggested visual aids could improve their pretreatment experiences by facilitating a better understanding of various procedures, assisting them with the organization of information, and creating a reduction of paperwork (see Table 4). Participants stated, “A calendar with when to take meds on which days of treatment cycle, what meds should be discontinued/on hold before treatments and after treatment…” and “A checklist for each office visit to ensure we had the needed lab/testing orders, prescriptions/refills, consult orders/communication etc.” Another stated, “An explanation of what will happen, for how long, and in what order.”
DISCUSSION
Guided by the empathize construct in the Design Thinking Framework,21 this study described adult caregivers’ experiences to prepare oncology treatments and their suggestions to improve these experiences. Eighteen adult caregiver participants responded to social media, oncology forum advertisements, and a regional university supported research registry to anonymously share their pre-treatment experiences. The participants were mostly white, educated, females who described their pretreatment experience as affecting different emotions related to preparation for their caregiving journey. Study sample
demographics are consistent with existing national caregiving demographics in which caregivers tend to be white females1; however, inconsistent with national oncology caregiving demographics, this subgroup of caregivers typically do not have a college degree.3
Perceptions of level of preparation affected participants’ emotions. Preparing for oncology treatments is an emotionally charged period of time with a steep learning curve for both patients and their caregivers.24 Emotional aspects may not be addressed during this pre-treatment period as the technical aspects of oncology treatments are typically discussed. In
(65) Feeling scared, grateful, unprepared, and difficulty watching loved one suffer
Felt unprepared 7 (41)
Felt prepared
6 (35)
Education was important 4 (24)
Able to ask questions
Was a forced caregiver
Feeling unprepared to manage side effects, emotional aspects of caregiving and/or full-time caregiving
Felt prepared because of education given and/or background of medical knowledge
Education helped to feel prepared
1 (6) Be able to ask oncology team questions about treatments
(6) Did not want to be a caregiver to a loved one
Table 3. Caregivers’ Perspectives to Better Prepare for the Oncology Caregiving Experience (N=18)
How to manage emotional aspect of caregiving
How to help manage side effects
Unsure or nothing
6 (35)
5 (29)
4 (24)
Information was overwhelming 2 (12)
Amount of work to provide care 1 (6)
Better understanding of procedures and steps 1 (6)
Feeling unheard, fear of the unknown, difficulty watching a loved one suffer or difficulty dealing with loved ones’ emotional responses
Need more information and guidance to manage side effects associated with treatments.
Pertaining to being unsure what they wish they better understand or not having suggestions for what they wished they better understood
Feelings of being overwhelmed when discussing treatment plan with medical team
Requirement of caregiver to support love one through treatment
The need to understand all the procedures, processes, and step involved in cancer treatments
COVID caused separation 1 (6) Perception the pandemic created a situation with less than ideal contact with providers
Wish I knew loved one was ill 1 (6) Loved one not disclosing illness
Table 4. Improving the Caregiver Experience With Visual Aids (N=18)
Themes
Unsure or nothing 8 (47) Not having additional feedback to suggest
Comprehension of procedures or steps of the process 7 (41)
Organization of all treatment aspects
In need of knowing what to expect from beginning to end, treatment information, and medication management.
3 (18) In need of more organization throughout the treatment process such as explaining the timing of treatments, having a checklist, and using a calendar.
Forming connection to others 2 (12) Connecting with clinicians and/or having personal connections
Reducing paperwork
1 (6) Having too much paperwork to manage
Using an app 1 (6) Having an app to access information
Having bigger fonts 1 (6)
Written material is in need of larger font sizes
Table 2. Caregivers’ Feelings of Being Prepared to Support Loved One (N=18)
addition, the short interval between diagnosis and treatment may not provide enough time for caregivers to learn how to best support their loved one.11
To improve feelings of preparation, participants identified the need for emotional support, better understanding of the procedures, and connecting to others like them. Often, pretreatment preparation is not tailored to caregivers who must acquire information and skills needed to support themselves and individuals with cancer before, during, and after treatment.11,24 Consistent with existing literature, caregivers would benefit from having a support system of people who can empathize with their experiences.11
Caregivers also identified the addition of visual aids could help them better understand procedures and processes. VR, in particular, could be an innovative visual aid to deliver immersive educational content that would complement standard written and verbal oncology treatment preparation.25 Further, immersing caregivers in a safe virtual environment could provide an additional opportunity to explore processes and procedures they do not fully comprehend through verbal and written explanations alone.
LIMITATIONS
Because this study was designed to describe oncology caregivers’ pre-treatment preparation experiences while simultaneously exploring opportunities to leverage future VR experiences for oncology caregivers, limitations were present. A qualitative descriptive design limits the depth of data collected, as this approach re-presents data.22 Further, a convenience sampling technique was employed to remotely reach eligible participants. In addition, the sample consisted of self-selected white, educated female participants. The sampling technique and sample could contribute to selection bias and limited understanding of diverse pre-treatment preparation experiences potentially impacting the accuracy of a future VR caregiving experience.
IMPLICATIONS FOR PUBLIC HEALTH
Caregivers are often not considered or even included when deploying technology in the healthcare setting or in the community despite evidence demonstrating they are often inextricably linked to patient outcomes.26 This gap enables clinicians to design and create a VR solution for caregivers that delivers and reinforces customized oncology information through a visually informative 3-dimensional mechanism. Further, incorporating VR technology could offer a robust and enhanced approach to supporting caregivers during a heightened emotional time.
VR experiences specifically designed for and informed by oncology caregivers do not exist. Clinicians creating VR experiences explicitly for them could lead to better outcomes not only for caregivers, but possibly for the patients they support.26 Creating VR experiences in the future could address some of these unmet preparation needs expressed by oncology caregivers, such as different approaches to learning and explanation of processes and procedures. These study findings begin the exploration into different innovative approaches to meet oncology caregivers’ unmet needs.
CONCLUSIONS
Virtual reality (VR) could be an innovative intervention to support oncology caregivers’ unmet needs in preparation to support a loved one during cancer treatment; however, this type of support is not widely used in the healthcare setting or in the community. Preparation is personal during the pre-treatment period and no two oncology caregivers are alike nor are their needs.24 Thus, clinicians creating virtual reality (VR) experiences designed for caregivers could offer innovative, enhanced preparation leading to less anxiety, uncertainty, and fear.27 Conclusions drawn from this study demonstrated an opportunity for nurses to create meaningful VR experiences to support oncology preparation for caregivers. Creating VR experiences exclusively for oncology caregivers would be a novel clinician-led approach that is currently not in existence. Current VR research focuses on delivering experiences for patients with cancer and not caregivers who support them.28 Therefore, at this current state of the science, oncology clinicians and researchers can be on the forefront of incorporating cutting-edge technologies to support caregivers whether in the hospital or community settings.
Dr. Birkoff may be contacted at sub76@pitt.edu
REFERENCES
1. National Alliance for Caregiving. (2020). Caregiving in the U.S. 2020. Retrieved from https://www.caregiving.org/caregiving-in-the-us-2020/
2. Johns Hopkins Medicine. (2022). The context of caregiving. Retrieved from https://www.hopkinsmedicine.org/about/community-health/johnshopkins-bayview/services/called-to-care/what-is-a-caregiver
3. National Alliance for Caregiving. (2016). Cancer caregiving in the U.S. Retrieved from CancerCaregivingReport_FINAL_ June-17-2016.pdf
4. Lambert, S. D., & Girgis, A. (2017, Apr-Jun). Unmet supportive care needs among informal caregivers of patients with cancer: Opportunities and challenges in informing the development of interventions. Asia-Pacific Journal of Oncology Nursing, 4(2), 136–139. https://doi.org/10.4103/2347-5625.204485
5 Santin, O., McShane, T., Hudson, P., & Prue, G. (2019, March). Using a six-step co-design model to develop and test a peerled web-based resource (PLWR) to support informal carers of cancer patients. Psycho-Oncology, 28(3), 518–524 https://doi.org/10.1002/pon.4969
6. Leonidou, C., & Giannousi, Z. (2018, February). Experiences of caregivers of patients with metastatic cancer: What can we learn from them to better support them? Eur J Oncol Nurs, 32, 25–32 https://doi.org/10.1016/j.ejon.2017.11.002
7. Taylor, J., Fradgley, E., Clinton-McHarg, T., Byrnes, E., & Paul, C. (2021, May). What are the sources of distress in a range of cancer caregivers? A qualitative study. Support Care Cancer, 29(5), 2443–2453 https://doi.org/10.1007/s00520-020-05742-0
8. Tranberg, M., Andersson, M., Nilbert, M., & Rasmussen, B. H. (2021, September). Co-afflicted but invisible: A qualitative study of perceptions among informal caregivers in cancer care. Journal of Health Psychology, 26(11), 1850–1859 https://doi.org/10.1177/1359105319890407
9 Denham, A. M. J., Wynne, O., Baker, A. L., Spratt, N. J., Turner, A., Magin, P., Bonevski, B. (2020, December 10). An online survey of informal caregivers’ unmet needs and associated factors. PLoS One, 15(12), e0243502. https://doi.org/10.1371/journal.pone.0243502
10. Wang, T., Molassiotis, A., Chung, B. P. M., & Tan, J. Y. (2018, July 23). Unmet care needs of advanced cancer patients and their informal caregivers: A systematic review. BMC Palliative Care, 17(1), 96 https://doi.org/10.1186/s12904-018-0346-9
11 Weaver, R, O’Connor, M., Halkett, G., & Smith, R. C. (2021). The unmet needs of carers of patients diagnosed with sarcoma: A qualitative study, 1-9. doi: https://doi.org/10.1002/pon.5651
12 Kim, Y., Carver, C. S., Ting, A., & Cannady, R. S. (2020, October 15). Passages of cancer caregivers’ unmet needs across 8 years. Cancer, 126(20), 4593–4601. https://doi.org/10.1002/cncr.33053
13. Vinci, C., Brandon, K. O., Kleinjan, M., & Brandon, T. H. (2020). The clinical potential of augmented reality. Clinical psychology: a publication of the Division of Clinical Psychology of the American Psychological Association, 27(3), e12357. Doi: https://doi.org/10.1111/cpsp.12357
14 Pandrangi, V. C., Gaston, B., Appelbaum, N. P., Albuquerque, F. C., Jr., Levy, M. M., & Larson, R. A. (2019, August). The application of virtual reality in patient education. Annals of Vascular Surgery, 59, 184–189 https://doi.org/10.1016/j.avsg.2019.01.015
15 Carl, E., Stein, A. T., Levihn-Coon, A., Pogue, J. R., Rothbaum, B., Emmelkamp, P., . . . Powers, M. B. (2019, January). Virtual reality exposure therapy for anxiety and related disorders: A meta-analysis of randomized controlled trials. Journal of Anxiety Disorders, 61, 27–36 https://doi.org/10.1016/j.janxdis.2018.08.003
16 Aymerich-Franch, L. (2020). Avatar embodiment experiences to enhance mental health. Technology and Health, 49-66. Doi: https://doi.org/10.1016/B978-0-12-816958-2.00003-4
17 Boeldt, D., McMahon, E., McFaul, M., & Greenleaf, W. (2019, October 25). Using virtual reality exposure therapy to enhance treatment of anxiety disorders: Identifying areas of clinical adoption and potential obstacles. Frontiers in Psychiatry, 10, 773. https://doi.org/10.3389/fpsyt.2019.00773
18. Glennon, C., McElroy, S. F., Connelly, L. M., Mische Lawson, L., Bretches, A. M., Gard, A. R., & Newcomer, L. R. (2018, July 2). Use of virtual reality to distract from pain and anxiety. Oncology Nursing Forum, 45(4), 545–552 https://doi.org/10.1188/18.ONF.545-552
19 Ng, J., Lo, H., Tong, X., Gromala, D., & Jin, W. (2018). Farmooo, a virtual reality farm simulation game designed for cancer pediatric patients to distract their pain during chemotherapy treatment. Electronic Imaging, 2018(3), 4321–432-4.
20 Gomes, N., Lou, Y., Patwardhan, V., Moyer, T., Vavala, V., & Barros, C. (2020). The effects of virtual reality learning environments on improving the retention, comprehension, and motivation of medical school students. In: Ahram, T., Taiar, R., Colson, S., Choplin, A. (eds) Human interaction and emerging technologies, proceedings of the 1st international conference on human interaction and emerging technologies (IHIET 2019). Springer. 289–296.
Doi: https://doi.org/10.1007/978-3-030-25629-6_45
21 Interaction Design Foundation - IxDF. (2023). What is Design Thinking? Retrieved from https://www.interaction-design.org/literature/topics/design-thinking
22 Sandelowski, M. (2000, August). Whatever happened to qualitative description? Research in Nursing & Health, 23(4), 334–340.
23. Creswell, J. W., & Creswell, J. D. (2018). Research design: Qualitative, quantitative, and mixed methods approaches. Fifth edition. Los Angeles: SAGE.
24 Lambourne, T., Minard, L. V., Deal, H., Pitman, J., Rolle, M., Saulnier, D., & Houlihan, J. (2019, October). Optimizing patient education of oncology medications: A patient perspective. J Cancer Educ, 34(5), 1024–1030 https://doi.org/10.1007/s13187-018-1406-9
25 Jimenez, Y. A., Wang, W., Stuart, K., Cumming, S., Thwaites, D., & Lewis, S. (2018, October). Breast cancer patients’ perceptions of a virtual learning environment for pretreatment education. J Cancer Educ, 33(5), 983–990. https://doi.org/10.1007/s13187-017-1183-x
26. Shin, J. Y., Kang, T. I., Noll, R. B., & Choi, S. W. (2018, May 23). Supporting caregivers of patients with cancer: A summary of technology-mediated interventions and future directions. Am Soc Clin Oncol Educ Book, 38, 838–849 https://doi.org/10.1200/EDBK_201397
27 Saeed, N. (2018). Patient education in radiation oncology: Evolution and innovation. Applied Radiation Oncology, 43–49 Retrieved from https://www.appliedradiationoncology.com/articles/patient-educationin-radiation-oncology-evolution-and-innovation https://doi.org/10.37549/ARO1151
28. Birkhoff, S. D., Waddington, C., Williams, J., Verucci, L., Dominelli, M., & Caplan, R. (2021, July 1). The effects of virtual reality on anxiety and self-efficacy among patients with cancer: A pilot study. Oncology Nursing Forum, 48(4), 431–439. https://doi.org/10.1188/21.ONF.431-439
August is National Minority Donor Awareness Month
U.S. Black, Indigenous, and People of Color (BIPOC) make up 60% of the more than 100,000 people on the national transplant waitlist for lifesaving organ, tissue, and cornea donations, according to the Gift of Life Donor Program.
August is National Minority Donor Awareness Month. The National Organ, Eye, and Tissue Donation Multicultural Action Group (NMAG) describes the observance as a time to increase donor registration and education and promote healthy living that decreases the need for donation.
Nationally, BIPOC populations have a high risk of developing diabetes and high blood pressure, the leading causes of kidney failure According to the Gift of Life Donor Program, Black people are four times more likely to develop end-stage kidney disease than White people Hispanic people are two times more likely to develop the disease than White people, and Asian people are 1.4 times more likely. To give the gift of life to those waiting, donors of all races and ethnicities can register at any time. You do not have to wait until you renew your driver’s license. To register as an organ, eye, and tissue donor, complete the registration form in English and Spanish at the Gift of Life Donor Program. Click here to access toolkit resources.
Keep immunizations updated for optimal wellness at all ages
Delawareans can be protected from many diseases by staying up to date with their immunizations, beginning by visiting their health care provider. August is National Immunization Awareness Month, an observance that highlights the importance of routine vaccinations for people of all ages.
As parents and guardians prepare to send children back to school, the Division of Public Health (DPH) advises to get updated immunization records from the Delaware Immunization Program or the health care provider. Keeping up to date with vaccines is one of the best things you can do to help protect your child from serious diseases. Routine childhood vaccination in the United States has been very successful in preventing illness and death. Serious diseases such as diphtheria, mumps, and rubella, once common at young ages, are now practically unheard of.
Since COVID-19 is still with us, it is important to get vaccinated with the new composition of the COVID19 vaccine when it becomes available later this summer or fall The new composition of the COVID19 vaccine aims to counter the currently circulating variants. Watch for news for updates about this vaccine.
To avoid influenza (flu) and its potentially severe complications, all eligible Delawareans need to be immunized with the flu vaccine every year. All U.S. flu vaccines will be a trivalent (three-variant protection) for the upcoming season. The influenza B/Yamagata vaccine component in flu vaccines was removed because this variant has not been detected since March 2020. The U.S. Centers for Disease Control and Prevention recommends getting flu vaccinations before the end of October for the best protection as influenza activity increases.
Visit de.gov/immunizations for vaccine schedules or take the Adult or Childhood Vaccine Quiz at https://www.cdc.gov/vaccines/events/niam/index.html.
To contact the Delaware Immunization Program, call 1-800-282-8672 weekdays between 8:00 a.m. and 4:30 p.m.
August 15 Working4Equity lecture spotlights maternal hypertension
The Working4Equity lecture series features Division of Public Health (DPH) Chief Physician Olubusola Ogunlade, MD, FACOG on Thursday, August 15 at 6:00 p.m. Dr. Ogunlade is presenting “Understanding Maternal Hypertension: Why It Matters to Everyone.” Registrants will be invited to future lectures.
Through partnership with the Medical Society of Delaware (MSD) Hot Topic Series, DPH is offering the Working4Equity Lecture Series through its newly created Health Equity Institute of Delaware (HEIDE). HEIDE is an initiative of the Office of the Medical Director and Office of the Chief Health Equity Officer.
"By working together with other stakeholders to promote health equity, participants in HEIDE will create an ecosystem that progressively supports vulnerable Delawareans to attain and maintain optimal health while moving the state towards equity, and addressing health disparities," said DPH Medical Director Dr. Awele Maduka-Ezeh.
The Working4Equity lectures are designed for working physicians and clinicians, but anyone can attend the virtual events. They may be helpful to scholars, practitioners involved in public health and health disparities work, and allies such as community members and for-profit businesses.
Registration is required for these lectures, which are free of charge. View all lectures at MSD Events Accredited continuing Medical Educational credits are available from MSD at nominal cost.
The DPH Health Promotion and Disease Prevention Section published The Burden of Chronic Disease in Delaware 2024.
The Office of Infectious Disease and Prevention published Candida auris in Delaware, 2022 to 2023
The Office of Animal Welfare published 2023 Year in Review
Sir Teacup
Found: July 31, 2024
Small dog, mix breed, no collar, microchip, unaltered male
City/Area Seen or Found: Walnut and Christian Street
ID#: ID#9280
This lost pet’s portrait was placed on the Office of Animal Welfare’s State Lost and Found Pet Registry
Try to reunite stray dogs with owners before calling Delaware Animal Services
The Delaware Division of Public Health (DPH) asks the public to try to reunite stray dogs with their owners before contacting the Office of Animal Welfare's (OAW) Delaware Animal Services for pickup or taking them to Brandywine Valley SPCA, the state's contracted animal shelter.
"Stray dogs are usually found very close to home and by walking the dog around the neighborhood or checking with neighbors, the dog can often be reunited with their owner(s) with no need for impoundment," said OAW Executive Director Christina Motoyoshi.
"We ask that all finders post the dog on the State Lost and Found Pet Registry so the owner(s) may quickly find their pet. Additionally, posting the dog on the Nextdoor app and other forms of social media can be extremely effective. We thank the public for their assistance as we try to limit the number of impounded dogs and work to reunite every lost dog with their owner."
These actions are helpful during outbreaks such as the Canine Infectious Respiratory Disease Complex Outbreak that surfaced in July.
The State Lost and Found Pet Registry is online at https://animalservices.delaware.gov/lost/33.
Sustaining Improvements in Colorectal Cancer Across Delaware: A Look at Racial Disparities a Decade Later
Diane Ng, M.P.H.
Research Associate, Westat
Stephanie Belinske, M.P.H.
Chronic Disease Epidemiologist, Chronic Disease Bureau, Health Promotion and Disease Prevention Section, Division of Public Health, Delaware Department of Health and Social Services
Dawn Hollinger M.S., M.A.
Bureau Chief, Cancer Prevention and Control Bureau, Health Promotion and Disease Prevention Section, Division of Public Health, Delaware Department of Health and Social Services
Sumitha Nagarajan, M.P.H.
Cancer Epidemiologist, Cancer Prevention and Control Bureau, Health Promotion and Disease Prevention Section, Division of Public Health, Delaware Department of Health and Social Services
Hayley Little, M.P.H.
Research Associate, Westat
Stephen Grubbs, M.D.
Vice President Care Delivery, American Society of Clinical Oncology
Heather Bittner-Fagan, M.D., M.P.H.
Medical Director of Clinical Prevention, Senior Scientist Primary Care Research, Department of Family and Community Medicine, ChristianaCare
ABSTRACT
A previously initiated statewide effort in Delaware improved outcomes in colorectal cancer (CRC) racial disparities. Objective. To examine whether improvements in racial disparities for CRC have been sustained a decade later and the status of Delaware’s current cancer burden. Methods. Cancer incidence data from the Delaware Cancer Registry, mortality data from the Centers for Disease and Control and Prevention (CDC)’s National Center for Health Statistics, and cancer screening data from CDC’s Behavioral Risk Factor Surveillance System were analyzed. Five-year age-adjusted incidence and mortality rates were calculated, and comparisons were made between non-Hispanic Black and non-Hispanic White groups using rate ratios. Distributions by cancer stage were compared between time periods by race/ethnicity utilizing chi-square statistical tests. The prevalence of Delawareans meeting recommendations for CRC screening was compared between time points for each race/ ethnicity group using the Rao-Scott Modified chi-square test. Results. Comparing 2006-2010 and 2015-2019, CRC incidence rates decreased for non-Hispanic Black Delawareans from 51.0 to 39.6 per 100,000 population and decreased for non-Hispanic White Delawareans from 46.6 to 37.6 per 100,000 population. Between 20062010 and 2015-2019, CRC mortality rates decreased for non-Hispanic Black Delawareans from 16.8 to 15.1 per 100,000 population and decreased for non-Hispanic White Delawareans from 16.8 to 13.3 per 100,000 population. There were no significant differences in CRC incidence or mortality rates by race/ethnicity in either period. The distribution of cases by stage comparing 2006-2010 and 2015-2019 were not significantly different for either race/ ethnicity group. There were no significant differences in meeting CRC screening recommendations comparing 2010 and 2018 by race/ethnicity or directly comparing race/ethnicity groups in either year. Conclusions. Delaware has sustained improvements in CRC incidence, mortality rates, and disparities between non-Hispanic Black and non-Hispanic White groups but will continue to monitor CRC trends and outcomes to ensure early diagnosis and that disparities are eliminated.
BACKGROUND
Colorectal cancer (CRC) is the second highest cause of cancer mortality for men and women combined in the United States (U.S.).1 According to the Centers for Disease Control and Prevention (CDC), from 2016-2020 in the U.S., non-Hispanic Blacks (41.4 per 100,000 population) had a higher age-adjusted incidence rate compared to nonHispanic Whites (36.7 per 100,000 population). In terms of mortality, non-Hispanic Blacks (17.6 per 100,000 population) die from CRC at a higher rate compared to non-Hispanic Whites (13.1 per 100,000 population). According to the most
recent Behavioral Risk Factor Survey (BRFS) (2022), 75.3% of non-Hispanic Blacks reported being up to date with CRC screening compared to 74.6% of non-Hispanic Whites in the U.S.1 Up-to-date CRC screening is based on the United States Preventive Services Task Force (USPSTF) recommendations. In 2013, the authors Grubbs et al. published the actions taken by the Delaware Cancer Consortium (DCC) to close the racial disparity in CRC mortality among non-Hispanic Black and non-Hispanic White Delawareans.2 Beginning in 2002, Delaware created a comprehensive statewide CRC screening program that included coverage for screening and treatment,
patient navigation for screening and care coordination, and case management. These programs include the Delaware Cancer Treatment Program (DCTP) and Screening for Life (SFL), which are managed and guided by DCC members.3,4 Through the efforts of the Consortium, improvements in CRC racial disparities from 2002 to 2009 included: the elimination of screening disparities, equalization of incidence rates, reduction in the percentage of Black Delawareans with regional and distant disease from 79% to 40%, and most importantly a near elimination of mortality differences.2,5
This article examines whether racial disparities in incidence, mortality, cancer staging, and screening still exist ten years after the Grubbs et al., publication based on current metrics including recommended screening.
METHODS
Data Sources and Definitions
Cancer incidence data from the Delaware Cancer Registry (DCR), mortality data from the CDC National Center for Health Statistics (NCHS), and cancer screening data from CDC Behavioral Risk Factor Surveillance System (BRFSS) were utilized for analysis. The DCR collects and reports data on all cancer cases for Delaware residents. Incidence cases were included in the analysis where the primary site was colon or rectum, the behavior was coded as malignant, and coding excluded ICD-O-3 histology codes 9050-9055, 9140, and 9590-9993 as defined by the Surveillance, Epidemiology, and End Results (SEER) Site Recode ICD-O-3/WHO 2008 Definition for the “Colon and Rectum” site group.6 NCHS collects data on deaths in the United States, including cause of death.7 Mortality cases were included if the cause of death was colon or rectum cancer.
The BRFSS conducts the BRFS annually, which is a randomsample telephone survey of the non-institutionalized adult population. Various survey topics include disease and conditions, cancer screening, health care utilization, behavioral risk factors, and disability. Cancer screening questions are asked biennially, in even-numbered years.8 The measure of cancer screening utilized for analysis was the prevalence of respondents aged 50 to 75 who had fully met the USPSTF recommendation for CRC screening. CRC screening was defined as having a blood stool test within the past year; having a sigmoidoscopy within the past five years and a blood stool test within the past three years; or having a colonoscopy within the past ten years.
Data Analysis
Incidence
CRC incidence rates and the proportion of CRC cases by stage were calculated in SEER*Stat9 using a DCR-created incidence database. Five-year age-adjusted rates were calculated for the periods of 2006-2010 and 2015-2019. These two five-year periods that are 10 years apart based on the end year of each 5-year period were chosen to provide cross-sectional analysis comparing change in rate between two time periods. Incidence rates between non-Hispanic Black and non-Hispanic White Delawareans were calculated and compared using rate ratios. In addition, trend analysis was conducted using the National Cancer Institute’s Joinpoint Regression Program.10
The Joinpoint Regression Program analyzes trend data (e.g., cancer rates over time) and provides an Annual Percent Change (APC). The program provides different models based on the trend, identifies joinpoints, or time points where the trend appears to change, and selects a final model. Trend analysis was conducted using 1-year rates to compare trends during the periods 2001-2010 and 2010-2019. For example, for the trend analysis for 2001-2010, 1-year rates for 2001, 2002, 2003,…2010 were plotted and modeled in the program. The Empirical Quantile method was used to calculate the APCs and to determine whether the APCs were significantly different from zero at the alpha = 0.05 level.11 When APCs are not significantly different from zero, trends are considered stable. Trend analysis was conducted in addition to the crosssectional comparison of rates in 2006-2010 and 2015-2019 to provide a more detailed analysis of trend that considers multiple time points.
Stage at Diagnosis
The DCR-created incidence database was also utilized to analyze CRC stage at diagnosis. Summary staging was used as the staging schema for the cancer cases. Over time, different summary stage variables have been used depending on the year of diagnosis. In the current analysis where stage at diagnosis was analyzed for cases diagnosed 2006-2010 and 2015-2019, the derived SEER Summary Stage 2000 variable was used to assign stage for cases in 2006-2010 and for 2015 cases; SEER Summary Stage 2000 was used for 2016 and 2017 cases; and Summary Stage 2018 was used for 2018 and 2019 cases. Each applicable summary stage variable was then used to create a merged summary stage variable across all cases, where cases were assigned to one of the following stage groups: local, regional, or distant stage. A chi-square statistical test was conducted to compare the distribution of the proportion of cases by stage at diagnosis by time period using SAS version 9.4.
Mortality
CRC mortality rates were calculated similarly to incidence rates in SEER*Stat using a mortality database made available by the National Cancer Institute’s SEER Program.12 The mortality database contains data aggregated by state and includes mortality data from 1990 to 2020 provided by NCHS. The same statistics that were calculated for CRC incidence were calculated for CRC mortality (i.e., age-adjusted rates by race/ethnicity in 2006-2010 and 2015-2019, and trend analysis for 2001-2010 and 2010-2019).
CRC screening
Prevalence of respondents meeting the USPSTF recommendation for CRC screening was provided by the CDC in the BRFS dataset for 2018.13 The algorithm for this variable was adapted and applied to 2010 BRFS data to create a consistent variable for comparison in the current analysis, since the measure for CRC screening has changed over time. The percentage that fully met the USPSTF recommendation for CRC screening was compared between 2010 and 2018 for non-Hispanic Black and non-Hispanic White groups. The difference in proportion between 2010 and 2018 was calculated, and significance testing was conducted between the two time points for each race/ethnicity group using the RaoScott Modified chi-square test.
RESULTS
CRC incidence rates decreased for non-Hispanic Black Delawareans from 51.0 per 100,000 population in 2006-2010 to 39.6 per 100,000 population in 2015-2019 (Figure 1). CRC incidence rates decreased for non-Hispanic White Delawareans from 46.6 per 100,000 population in 2006-2010 to 37.6 per 100,000 in 2015-2019. When comparing the non-Hispanic Black and non-Hispanic White groups during 2006-2010 and 20152019, there were no significant differences in CRC incidence rate between the two race/ethnicity groups in either 2006-2010 (RR=1.09, p=0.13) or in 2015-2019 (RR=1.05, p=0.37) with nonHispanic White as the reference group. In terms of trends, when analyzing APCs using 1-year rates during the two periods 2001-
2010 and 2010-2019, the trends were stable for non-Hispanic Blacks during both periods (Table 1). The model for nonHispanic Blacks that analyzed 2010-2019 identified a joinpoint in 2017, but the modeled trend in 2010-2017 and 2017-2019 were both not significant, and therefore, the trends were stable. For non-Hispanic Whites, from 2001 to 2010, CRC incidence rates decreased 2.9% per year. For 2010-2019, the model identified a joinpoint in 2012 where the modeled trend in 2010-2012 showed a decrease in CRC incidence rates of 8.6% per year. However, from 2012-2019, rates remained stable.
CRC mortality rates decreased for non-Hispanic Black Delawareans from 16.8 per 100,000 population in 2006-2010 to 15.1 per 100,000 population in 2015-2019 (Figure 1). CRC
RR = Rate Ratio; Non-Hispanic White group is the reference group in the RR calculation.
*APC is significantly different from zero at the alpha = 0.05 level
^Joinpoints were identified in the models for CRC incidence rate trends in 2017 for non-Hispanic Black and in 2012 for non-Hispanic White groups. Therefore, APCs are reported for each period separated by the joinpoint rather than for 2010-2019.
Table 1. Annual Percent Change (APC) in Colorectal Cancer (CRC) Incidence and Mortality Rates from 2001-2010 and 2010-2019 by Race/Ethnicity, Delaware
Figure 1. Incidence and Mortality Rates with Rate Ratios Comparing Non-Hispanic Black and Non-Hispanic White Groups, Delaware, 2006-2010 and 2015-2019
mortality rates decreased for non-Hispanic White Delawareans from 16.8 per 100,000 population in 2006-2010 to 13.3 per 100,000 in 2015-2019. Comparing the non-Hispanic Black and non-Hispanic White groups during 2006-2010 and 20152019, there were no significant differences in CRC mortality rate between the two race/ethnicity groups in either 2006-2010 (RR=1.00, p=1.00) or in 2015-2019 (RR=1.14, p=0.19) with non-Hispanic White as the reference group. In terms of trends, when analyzing APCs using 1-year rates during 2001-2010, the CRC mortality rates decreased by 7.9% per year for non-Hispanic Blacks and 3.0% per year for non-Hispanic Whites (Table 1). When analyzing APCs using 1-year rates during 2010-2019, the trends were stable for both non-Hispanic Blacks and nonHispanic Whites.
The proportion of cases by stage at diagnosis (local, regional, distant) among non-Hispanic Black Delawareans in 20062010 compared to 2015-2019 were similar (Figure 2). The percentage of cases diagnosed at a distant stage among this group increased from 20.5% in 2006-2010 to 24.6% in 2015-2019, but the distribution of the proportion of cases by stage was not statistically significantly different between the two time periods (p=0.39). A similar comparison of the proportion of local and
advanced (regional and distant combined) stage also did not show statistically significant differences (results not shown). Similarly, there were no statistically significant differences between the distribution of the proportion of cases by stage at diagnosis among the non-Hispanic White group when comparing 20062010 and 2015-2019 (p=0.36).
Regarding CRC screening, the percentage of non-Hispanic Black Delawareans that fully met the USPSTF recommendation for CRC screening decreased from 74.0% in 2010 to 70.6% in 2018 (Table 2). In comparison, the percentage of non-Hispanic White Delawareans who fully met the recommendation increased from 73.5% in 2010 to 75.1% in 2018. However, the percentages that met the CRC screening recommendations were not significantly different comparing 2010 and 2018 (p=0.31 for non-Hispanic Black and p=0.36 for non-Hispanic White). There were no significant differences between the non-Hispanic Black and nonHispanic White groups during either year (results not shown).
Comparisons between the 2010 and 2018 values for percentage that met the CRC screening recommendation by race/ethnicity group were tested for significance using the Rao-Scott Modified chi-square test.
Distributions by stage were compared between 2006-2010 and 2015-2019 and tested for significance using the chi-square statistic.
met USPSTF recommendation for CRC Screening
Figure 2. Percentage of Colorectal Cancer Cases by Stage at Diagnosis (Local, Regional, Distant) Comparing 2006-2010 and 2015-2019 by Race/Ethnicity, Delaware
Table 2. Comparison of Differences in Percentage of Non-Hispanic Black and Non-Hispanic White Residents That Met the United States Preventive Services Task Force (USPSTF) Colorectal Cancer (CRC) Screening Recommendation in 2010 and 2018, Delaware
Delaware’s creation of their comprehensive statewide CRC screening program has contributed to the decrease in both CRC incidence and mortality rates among non-Hispanic Black and non-Hispanic White groups that has been sustained in the last decade. Of particular note, the decline of CRC mortality rates by 7.9% per year for non-Hispanic Black Delawareans between 2001 and 2010 is an outstanding achievement. Analysis conducted in this study reveals that trends in CRC incidence and mortality have remained stable for non-Hispanic Blacks and non-Hispanic Whites for most of the last decade, following significant decreases seen in 2001-2010. Though there have not been further significant decreases during the last decade, stable lower rates attained in the previous decade are still noteworthy and show the continued success of Delaware’s programs. In addition, there were no significant differences in CRC incidence or mortality between non-Hispanic Black and nonHispanic White Delawareans in either 2006-2010 or 2015-2019. Delaware’s success stands out in contrast to U.S. statistics where racial/ethnic disparities persist, with the highest CRC incidence and mortality rates among non-Hispanic Blacks that are significantly different from rates for non-Hispanic Whites.14,15 The declining incidence of CRC in Delaware suggests success related to an emphasis on colonsocopy and primary prevention. No significant differences were found in the percentage of Delawareans who met the CRC screening guidelines when comparing non-Hispanic White and non-Hispanic Black groups in 2010 or 2018. The percentage of non-Hispanic Black Delawareans who met the CRC screening guidelines in 2018 was lower than in 2010. However, these values were not found to be significantly different from each other. Delaware will continue to monitor CRC screening by race/ethnicity over time to see if any trends emerge that require additional attention to promote screening in populations where CRC screening is low. Prior analysis conducted by the Delaware Division of Public Health (DPH) (data not shown) indicates that upstream healthcare access is associated with increased screening.16 Health care insurance coverage, having a personal doctor or medical home, and check-up timeliness (within the past year) were all associated with screening. When controlling for these variables and other demographic and socio-economic variables, having a check-up within the past year was consistently associated with meeting USPSTF CRC recommendations between 2010 and 2018. Future analysis and efforts could explore this topic further to identify possible interventions to increase CRC screening. Delaware continues to provide free access to colorectal and other cancer screenings to uninsured and underinsured Delaware residents through the SFL program since 1997, and expanded coverage in 2014 to include more Delaware residents through the Affordable Care Act Medicaid Expansion program.4,17
In the current study, the distribution of cases by stage at diagnosis comparing 2006-2010 and 2015-2019 did not significantly differ for non-Hispanic Black or non-Hispanic White groups. However, the proportion of cases diagnosed at more advanced stages may be on the rise. One reason for a
potential rise in CRC diagnosed at advanced stages could be due to the screening disruptions from the Coronavirus 2019 (COVID-19) pandemic and decreases in expected screening rates.18,19 From 2006 to 2019, the percentage of distant stage cases among both non-Hispanic Black and non-Hispanic White individuals remains unchanged at around 20%. Further exploration analyses are needed to understand the population diagnosed at late stage, with intended analyses of sociodemographic profile including residency, screening history, insurance status, and age at diagnosis. These findings can be used to identify targets for cancer prevention and screening interventions. The next few years post-pandemic will be of particular interest to monitor cancer diagnosis by stage and, subsequently, how this will affect cancer mortality and treatment resource needs.
Limitations
There are several limitations in the current study worth noting. Delaware is a small state, and therefore, difficult to stratify for analysis and maintain high statistical power. For example, the current analysis could not reliably include Hispanic or other race/ethnicity group comparisons. In addition, the current study did not analyze sociodemographic data besides race/ ethnicity. It may be that other sociodemographic factors influence CRC screening and CRC mortality that should be considered for future analysis to determine if there are disparities by other variables that can be the focus of targeted interventions. Lastly, the analyses related to stage at diagnosis and CRC screening were limited to cross-sectional analysis comparing two points in time rather than longitudinal trend analysis. Therefore, this may not provide a complete picture of what has occurred during the previous decade.
Public Health Implications
The population of Delaware has seen reductions in CRC incidence and mortality rates, with previous gaps closing among non-Hispanic Black and non-Hispanic White groups. However, screening trends and persistence of late-stage diagnoses imply that diligence is needed to continue to sustain these life-saving outcomes. More research is needed and continued analysis will help inform programs within Delaware such as those involved with increasing CRC screening and provide areas for intervention and focus for the coming years.
With the guidance of the Delaware Cancer Consortium, in 2002, Delaware created a comprehensive statewide CRC screening program that included coverage for screening and treatment, patient navigation for screening and care coordination, and case management. These programs include Screening for Life (SFL), Delaware Cancer Treatment Program (DCTP), and Health Care Connection (HCC). The SFL and DCTP programs provide financial coverage to Delawareans who cannot afford to pay for a cancer screening or treatment. The HCC program and patient navigation provides coordinated care and case management to ensure Delawareans are connected to a health home, receive referrals to medical specialists, and recommendations for healthy behavior support services such as tobacco cessation and obesity prevention. Ensuring that a coordinated care continuum framework
exists is most beneficial to those not familiar with navigating the healthcare system, especially those where English is not their first language. DPH continues to streamline processes and identify gaps within the coordinated care system, which includes SFL, HCC, DCTP, and the hospital referral system to make certain Delawareans meet timely cancer care.
Stool-based testing, such as fecal immunochemical test (FIT) or other at-home CRC screening tests, are an acceptable alternative to a colonoscopy for average-risk individuals.20 Because these tests can be completed at the privacy and convenience of the individual, they provide an alternative that can address barriers to a screening, such as fear, transportation, and work obligations, which prevent individuals from getting a cancer screening.21 Utilizing these at-home tests may attract more individuals to complete this noninvasive method of CRC screening than those who would elect to receive a colonoscopy. With more individuals screening earlier, the disparity gap between non-Hispanic Black and non-Hispanic White groups can be minimized.16 However, it’s worth noting that an overwhelming majority of Delaware adults meeting recommendations received a colonoscopy as their most recent exam. The high prevalence of colonoscopy over other types of CRC screening provides an opportunity for primary prevention of this particular cancer type that would be beneficial to maintain.
DPH is working towards collaborations with large-scale employers to encourage employees to get their ageappropriate cancer screenings with no penalties for taking time off from work. DPH is seeking partnerships with manufacturers of either FIT or other at-home CRC screening tests to establish a work-based screening for qualified individuals. To understand individuals’ perceptions, fears, and other barriers to cancer screenings, DPH is developing a survey to be conducted statewide to collect data for education and outreach planning and to mitigate barriers to cancer screening, especially non-Hispanic Black men and women. Barriers to CRC screenings exist not only at the patient-level, but also at the provider-level. Delaware is experiencing difficulty attracting and retaining healthcare providers and that challenge is widespread among medical specialties such as gastroenterology. Additional challenges for the SFL program are attracting gastroenterologists willing to see the large volume of program clients with the relatively lower Medicare reimbursement rate. The healthcare industry in the U.S. is not immune to the challenges of employee turnover.22–24 This trend is evident in Delaware as well, affecting all facets of the cancer care continuum.25
CONCLUSION
Delaware has sustained improvements in CRC incidence, mortality rates, and disparities between non-Hispanic Black and non-Hispanic White groups. It will be important to continue to monitor and study CRC trends and outcomes, including CRC screening, to ensure that Delawareans are being diagnosed early and that disparities are eliminated. Ms. Ng may be contacted at DianeNg@westat.com
REFERENCES
1. U.S. Cancer Statistics Working Group. (2023). U.S. Cancer Statistics Data Visualizations Tool, based on 2022 submission data (1999-2020). https://www.cdc.gov/cancer/dataviz
2. Grubbs, S. S., Polite, B. N., Carney, J., Jr., Bowser, W., Rogers, J., Katurakes, N., . . . Paskett, E. D. (2013, June 1). Eliminating racial disparities in colorectal cancer in the real world: It took a village. J Clin Oncol, 31(16), 1928–1930. https://doi.org/10.1200/JCO.2012.47.8412
3. Delaware Health and Social Services. (n.d.). Cancer treatment program provides financial help for uninsured patients. Retrieved from https://dhss.delaware.gov/dph/dpc/catreatment.html
4 Delaware Health and Social Services. (n.d.). Testing for breast, cervical, prostate, lung, and colorectal cancer. Retrieved from https://dhss.delaware.gov/dph/dpc/sfl.html
5 Delaware, H. (n.d.). Consortium. Retrieved from https://www.healthydelaware.org/Consortium#upcoming-committee-meetings
6. National Cancer Institute. (n.d.). Site Recode ICD-O-3/WHO 2008 definition. Retrieved from https://seer.cancer.gov/siterecode/icdo3_dwhoheme/index.html
7 National Vital Statistics System. (2024). Mortality Statistics National Center for Health Statistics, Centers for Disease Control and Prevention. Retrieved from https://www.cdc.gov/nchs/nvss/deaths.htm
8. Centers for Disease Control and Prevention. (n.d.). Behavioral Risk Factor Surveillance System. Centers for Disease Control and Prevention. Retrieved from https://www.cdc.gov/brfss/index.html
9 National Cancer Institute. (n.d.). Surveillance Research Program, SEER*Stat software (https://www.seer.cancer.gov/seerstat) version 8.4.3.
10 National Cancer Institute. (2023). Joinpoint Regression Program, Version 5.0.2; Statistical Methodology and Applications Branch, Surveillance Research Program.
11 National Cancer Institute. (n.d.). Empirical Quantile Confidence Interval. Division of Cancer Control and Population Sciences. Retrieved from https://surveillance.cancer.gov/help/joinpoint/setting-parameters/ method-and-parameters-tab/apc-aapc-tau-confidence-intervals/ empirical-quantile
12. Surveillance, E., & Results, E. (SEER) Program. (2022). (https://www.seer.cancer.gov)
13 Centers for Disease Control and Prevention. (2019). LLCP 2018 Codebook Report: Overall version data weighted with LLCPWT [Behavioral Risk Factor Surveillance System]. https://www.cdc.gov/brfss/annual_data/annual_2018.html
14. Siegel, R. L., Miller, K. D., Goding Sauer, A., Fedewa, S. A., Butterly, L. F., Anderson, J. C., Jemal, A. (2020, May). Colorectal cancer statistics, 2020. CA: a Cancer Journal for Clinicians, 70(3), 145–164. Retrieved from https://doi.org/10.3322/caac.21601
15 Fedewa, S. A., Star, J., Bandi, P., Minihan, A., Han, X., Yabroff, K. R., & Jemal, A. (2022, June 1). Changes in cancer screening in the US during the COVID-19 pandemic. JAMA Network Open, 5(6), e2215490–e2215490. https://doi.org/10.1001/jamanetworkopen.2022.15490
16 Delaware Health and Social Services. (n.d.). Trends in cancer screening prevalence relatively steady among Delaware adults. Retrieved from https://www.dhss.delaware.gov/dhss/dph/dpc/cancerscreening2016.html
17. Mitchell, A. (2021, Jun 9). Overview of the ACA Medicaid Expansion. Congressional Research Service. https://crsreports.congress.gov/product/pdf/IF/IF10399
18. Negoita, S., Chen, H. S., Sanchez, P. V., Sherman, R. L., Henley, S. J., Siegel, R. L., Cronin, K. A. (2024, January 1). Annual Report to the Nation on the Status of Cancer, part 2: Early assessment of the COVID-19 pandemic’s impact on cancer diagnosis. Cancer, 130(1), 117–127. https://doi.org/10.1002/cncr.35026
19 Oakes, A. H., Boyce, K., Patton, C., & Jain, S. (2023, January 1). Rates of routine cancer screening and diagnosis before vs after the COVID-19 pandemic. JAMA Oncology, 9(1), 145–146. https://doi.org/10.1001/jamaoncol.2022.5481
20 Jaklevic, M. C. (2020, December 23). Pandemic spotlights inhome colon cancer screening tests. JAMA, 325(2), 116–118. https://doi.org/10.1001/jama.2020.22466
21 Muthukrishnan, M., Arnold, L. D., & James, A. S. (2019, May 15). Patients’ self-reported barriers to colon cancer screening in federally qualified health center settings. Preventive Medicine Reports, 15, 100896. https://doi.org/10.1016/j.pmedr.2019.100896
22. Aiken, L. H., Lasater, K. B., Sloane, D. M., Pogue, C. A., Fitzpatrick Rosenbaum, K. E., Muir, K. J., & McHugh, M. D., & the US Clinician Wellbeing Study Consortium. (2023, July 7). Physician and nurse well-being and preferred interventions to address burnout in hospital practice: Factors associated with turnover, outcomes, and patient safety. JAMA Health Forum, 4(7), e231809–e231809. https://doi.org/10.1001/jamahealthforum.2023.1809
23. Lasater, K. B., Aiken, L. H., Sloane, D. M., French, R., Martin, B., Reneau, K., . . . McHugh, M. D. (2021, August). Chronic hospital nurse understaffing meets COVID-19: An observational study. BMJ Qual Saf, 30(8), 639–647 https://doi.org/10.1136/bmjqs-2020-011512
24 Welp, A., Meier, L. L., & Manser, T. (2015, January 22). Emotional exhaustion and workload predict clinician-rated and objective patient safety. [Original Research] Frontiers in Psychology, 5, 1573 https://doi.org/10.3389/fpsyg.2014.01573
25 Sabine, N., & Gibbs, T. E. (2023, December 31). Unraveling healthcare shortages in Delaware and charting a course for equity and resilience. Delaware Journal of Public Health, 9(5), 14–18. https://doi.org/10.32481/djph.2023.12.005
Reducing Breast Cancer Disparities with Precision Public Health: A New Strategy to Improve Prevention and Advance Health Equity in Delaware Hotspots
Scott D. Siegel, Ph.D., M.H.C.D.S.
Cawley Center for Translational Cancer Research, Helen F. Graham Cancer Center & Research Institute, ChristianaCare
ABSTRACT
While Black and White women are diagnosed with breast cancer (BC) at similar rates, Black women die from BC at a 40% higher rate. This disparity is even more pronounced for younger Black women, who die from BC at nearly twice the rate as younger White women. Black-White differences in BC mortality are largely attributable to health care and tumor biology factors. Black women face greater barriers to accessing BC screening and are twice as likely to be diagnosed with the aggressive triple-negative breast cancer (TNBC) subtype. Delaware leads the US for the incidence of late-stage BC diagnosed among younger women and TNBC. This commentary begins with a discussion of precision public health, an emerging framework that builds on and complements recent advances in precision medicine. Next, a new precision public health initiative designed to reduce BC disparities in Delaware by targeting local hotspots with prevention interventions is presented. Finally, next steps are considered for implementation, evaluation, and new research activities.
INTRODUCTION: THE EMERGENCE OF PRECISION PUBLIC HEALTH
Precision medicine is an innovative approach to disease prevention and treatment that personalizes care to individual variability in genetics, environment, and behavior.1 In this way, precision medicine improves upon “one size fits all” treatments developed for the “average patient.” Early advances in precision medicine largely focused on the development of gene-targeted therapies that can more accurately kill cancer cells while sparing healthy cells that are often harmed with more conventional cancer treatments (e.g., chemotherapy).2 Although it is the case that genetic alterations are at the root of cancer etiology, most of these alterations represent accumulated genomic damage incurred from environmental (e.g., pollution) and behavioral (e.g., smoking) exposures rather than heritable factors.1 Therefore, advances in precision medicine going forward will increasingly personalize care to the full range of factors that influence health—notably exposures that largely operate outside the clinic walls.
Precision public health represents an emerging approach that both draws on and complements precision medicine.3 Whereas precision medicine personalizes care to individual characteristics, precision public health personalizes prevention to the context of disease. It is well established that carcinogenic and other adverse exposures are more likely to cluster geographically, particularly in areas with larger proportions of low-income and racial/ethnic minority residents.4 By leveraging big data and new advances in geospatial methods and other analytic approaches, precision public health interventions can be targeted to well-defined geographies (i.e., “neighborhoods”) to improve disease prevention for subpopulations with disparate health outcomes. As one illustration of this approach, Lynch and colleagues recently drew
on Pennsylvania Cancer Registry and U.S. Census data to identify neighborhoods with greater risk for liver cancer.5 Because the leading risk factors for liver cancer are potentially modifiable (i.e., behaviors that increase the transmission of Hepatitis B and C), identifying high-risk neighborhoods can facilitate the optimal allocation of community-based prevention resources (e.g., harm reduction programs).
Replicating a precision public health approach across multiple high-priority neighborhoods can improve population health and advance health equity across larger geographies. With that vision in mind, the objective of this commentary is to describe a precision public health initiative designed to reduce racial disparities in breast cancer (BC) by targeting hotspots here in Delaware. This commentary will briefly review the epidemiological data on BC disparities nationally and locally before describing new activities designed to reverse those trends in the First State.
BREAST CANCER DISPARITIES: NATIONAL AND DELAWARE TRENDS
Nationwide, Black and White women are diagnosed with BC at similar rates (127.8 vs. 133.7 100,000) but Black women die from BC at a 40% higher rate (27.6. vs. 19.7 per 100,000).6 This disparity is even more pronounced among younger women: before age 50, Black women die from BC at nearly twice the rate as White women.6 The Black-White difference in BC mortality among younger women is largely explained by health care and tumor biology factors.7 Black women face greater barriers to accessing BC screening and are therefore more likely to be diagnosed at an advanced stage.8,9 In addition, Black women are twice as likely to be diagnosed with triple-negative breast cancer (TNBC), the most aggressive BC subtype that is more likely to present at a younger age and advanced stage.10 As we
have previously reported, residentially segregated neighborhoods have less access to mammography facilities11 and have greater exposure to the environmental conditions linked to the more aggressive tumor biology observed among younger Black women.12 This includes living in neighborhoods that are proximal to industrial plants and high-volume roadways, have less healthy food environments and greater densities of liquor stores, and have limited supports for breastfeeding. These environmental conditions lead to greater exposure to pollution, metabolic conditions, and alcohol use, as well as lower rates of breastfeeding, which are all BC risk factors.
Unfortunately, these trends are even more evident here in Delaware. Our state leads the US in the incidence of late-stage BC among women under age 50, 13 the incidence of TNBC overall and among Black women, 14 and alcohol-attributable BC 15 While quite concerning, there are clear steps we can take to improve primary and secondary prevention, reduce the overall burden of BC, and close racial disparities in BC mortality. Delaware is certainly no stranger to advancing health equity. About a decade ago, stakeholders from multiple sectors worked collectively to eliminate the disparity in colorectal cancer.16 We are now poised to repeat that success with BC.
A CALL TO ACTION: ADDRESSING BREAST CANCER DISPARITIES STATEWIDE
Last year, as part of a group of concerned Delaware clinicians, community advocates, and researchers, we issued a call to action directed at reducing racial disparities in breast cancer.17 Drawing on the lessons learned from the colorectal cancer success, we recommended two evidence-based strategies. First, we called for new policies and processes that would ensure all Delaware women of average risk be advised to initiate BC screening at age 40. When the US Preventive Services Task Force (USPSTF) updated their BC screening guidelines earlier this year, they joined several other medical organizations in recommending that screening begin at age 40, down from age 50 in their prior recommendation.18 The USPSTF pointed to an increasing rate of BC among younger women, and the racial disparities among this age group, as justification for updating their recommended age of screening initiation. However, it is not sufficient to simply advise women given the evidence that Black women disproportionately face structural barriers to accessing mammography, resulting in 20% lower odds of completing screening as recommended.19 Therefore, we called for targeted strategies developed specifically for Black women to ensure equity in BC screening.17
Our second recommended strategy was to conduct formal BC risk assessments for women prior to screening age. Whereas the recommendation to initiate BC screening at age 40 applies to women of average risk, the American College of Radiology and the Society of Breast Imaging recommend risk assessments before age 30 to identify women at elevated risk for BC.20 Women at greater risk for BC include those with a 1) known genetic predisposition (e.g., BRCA1 or BRCA2), 2) strong family history even without a known pathogenic genetic variant, 3) prior treatment with chest or mantle radiation, 4) prior history of BC or lobular neoplasia, and 5) dense breasts. In addition to taking a comprehensive family history to determine if a woman should be referred to genetic testing to confirm the presence of a
variant, multiple BC risk “calculators” have been validated to aid in conducting a risk assessment.20 Women identified as being at elevated risk may be recommended to initiate breast screening before age 40, offered supplemental forms of imaging (e.g., ultrasound), and provided prophylactic treatments.20 In addition, risk assessments can be opportunities to address other potentially modifiable risk factors (e.g., alcohol use).
OPERATIONALIZING A PRECISION PUBLIC HEALTH APPROACH IN DELAWARE
Earlier this year, our group reported on the detection of two hotspots of advanced BC in New Castle County, Delaware.21 We focused on stage-at-diagnosis because it is an important predictor of BC outcomes including mortality. One hotspot was in the northeast part of Wilmington, approximately corresponding to the Riverside community. In this hotspot, 55% of cases were diagnosed at an advanced stage, compared to 44% for the county. Approximately 96% of the women with BC in this hotspot were Black, higher than the 89% for the general population in this area. This indicates that even in this highly segregated community, Black women were overrepresented among advanced BC cases. The second hotspot approximately corresponded to Middletown, where we observed a greater rate of advanced BC specifically among women under age 50. Black women were again overrepresented in this hotspot, accounting for 44% of the cases compared to 29% of the general population.
We are now conducting follow-up analyses to better understand which factors are driving these hotspots. In general, areas with higher rates of advanced BC may reflect 1) lower rates of screening mammography and/or 2) higher rates of more aggressive disease (e.g., TNBC) secondary to adverse exposures. While work is underway to better understand Middletown, our ongoing analyses of BC patient records from the Wilmington hotspot have produced instructive findings. First, the preliminary results showed that fewer than one-third of the women diagnosed with advanced BC were detected with breast screening compared to 63% of those diagnosed at an earlier stage. Stated differently, more than two-thirds of these women were detected clinically after palpating a mass or experiencing other physical symptoms. Because aggressive BC grows more quickly, it can present in the interval between screenings for women who complete annual mammograms, leading to a clinical vs. screening method of detection. Indeed, the Wilmington advanced BC hotspot falls within a larger geographic area that we previously identified as a hotspot for TNBC (Figure 1).22 Therefore, we examined the prior history of screening for BC patients in this hotspot and found that fewer than a half of the advanced BC cases had ever completed a mammogram, compared to 67% of those diagnosed at an earlier stage. Given the high rates of clinical detection paired with low rates of prior mammography for advanced BC patients in this hotspot, there is a clear opportunity to improve screening uptake in this neighborhood. Furthermore, regardless of stage-at-diagnosis, approximately one-third of the BC cases from this hotspot had a first-degree relative with a history of breast or ovarian cancer but were not referred to genetic counseling prior to their diagnosis. The high rates of unaddressed family history paired with an elevated geographic risk of TNBC underscores the importance of taregting formal BC risk assessments to this hotspot.
Figure 1. Map of New Castle County (Wilmington inset) depicting the location of an advanced breast cancer hotspot, embedded within a larger triple negative breast cancer hotspot, that approximately corresponds to the Riverside community.
Now that we have a more precise understanding of the context of elevated rates of advanced BC in the Wilmington hotspot, we have mobilized resources to implement a targeted prevention intervention in this community. We will be drawing on the Achieving Cancer Equity through Identification, Testing, and Screening (ACE-ITS) program developed at the Georgetown Lombardi Comprehensive Cancer Center in Washington, DC, which was designed to serve an urban underresourced population.23 The ACE-ITS program centers on three interrelated activities. First, women from the target community who are overdue for screening are identified through record reviews and community outreach. Second, all women are offered the opportunity to complete a formal BC risk assessment. Third, women are offered navigation services to help connect them to mammography facilities and any other prevention services that may be indicated based on the risk assessment (e.g., genetic counseling).
To adapt ACE-ITS to the Wilmington hotspot, we will be embedding a community health worker (CHW) within the REACH Riverside organization that serves the Riverside community. CHWs are lay individuals who are trained to help connect members of the community to the health care system.24 A systematic review of randomized controlled trials found that CHWs can significantly increase BC screening uptake, particularly in urban settings and when the CHW is racially or ethnically concordant with the patients they were serving.25 It is for this reason that we aim to recruit a CHW from the Riverside community. REACH Riverside, an acronym for Redevelopment, Education, and Community Health, is one of 27 Purpose Built Communities in the US that work to advance racial equity, economic mobility, and improved health. REACH Riverside directly addresses the upstream social determinants of health by improving access to affordable housing, supporting educational and vocational opportunities across the lifespan, and connecting residents to food and other support programs. While REACH Riverside broadly aims to enhance the health of its community, it did not previously have an explicit focus on improving BC prevention. With support from the Delaware Cancer Consortium, the CHW will complement REACH Riverside’s work by identifying and engaging women overdue
for screening and other services, connect them with REACH Riverside and other community resources to help overcome structural barriers to screening, and serve as a liaison to screening mammography facilities and other BC prevention services. The long-term objective of this initiative will be to develop competencies, experience, and protocols that can serve to guide the implementation of future precision public health interventions in other Delaware hotspots.
FUTURE DIRECTIONS
Our next step is to implement this intervention in the Wilmington hotspot and to conduct a formal evaluation. We will assess the impact of the adapted ACE-ITS program on rates of BC screening uptake in Riverside by partnering with the Delaware Health Information Network (DHIN). The DHIN is a health information exchange that manages the largest database of healthcare claims in the state. DHIN data will allow us to estimate the true population rates of BC screening in Riverside relative to comparable control communities, thereby adjusting for any secular trends operating at a more regional level. Over the longer term, we aim to assess rates of advanced BC in Riverside, with the goal of converting Riverside from a hot- to a cold spot.
An additional next step, as referenced above, is to complete analyses to better understand the drivers of the Middletown hotspot. Our preliminary results would suggest that simply increasing BC screening rates may not be sufficient to improve rates of early detection. We have been partnering with community groups to interpret the results, including the Middletown-based Alpha Alpha Tau Omega (AATΩ) Chapter of the Alpha Kappa Alpha Sorority, the oldest Greek-letter organization established by African-American college-educated women. We aim to continue this partnership and co-design a targeted intervention to address the specific factors driving elevated rates of advanced BC among younger women in the Middletown area.
Finally, we aim to extend this precision public health approach to Kent and Sussex Counties. To date, we have limited our hotspot analyses to New Castle County (NCC) based on cancer registry data maintained by the Helen F. Graham Cancer Center & Research Institute (HFGCCRI)
at ChristianaCare. Approximately 85% of BC patients who reside in NCC receive their cancer care at the HFGCCRI. This subset of patients are representative of the true population of NCC BC cases in terms of age, race, BC subtype, and stage at diagnosis.22 Having access to such a large and representative subset of BC patients from NCC has allowed us to accurately estimate hotspots for the full county. However, the HFGCCRI does not provide the same share of care for BC patients in the southern part of the state. To conduct reliable hotspots analyses in Kent and Sussex Counties, we would need access to a more complete statewide data source, which is maintained by the Delaware Cancer Registry. Hotspot analyses require non-deidentified patient data, including residential address, which represent protected health information. Historically, for privacy protections, this type of data has not been made available in the same ways deidentified data have been. In this era of precision health, where we aim to personalize care to individual and neighborhood characteristics, deidentified data will only take us so far. By working together to develop new approaches to data analysis, we will be able to support initiatives that both protect privacy interests and advance health equity. The wellbeing of our fellow Delawareans, particularly those experiencing disparate health outcomes, depends on it.
Dr. Siegel may be contacted at ssiegel@christianacare.org
REFERENCES
1. Collins, F. S., & Varmus, H. (2015, February 26). A new initiative on precision medicine. The New England Journal of Medicine, 372(9), 793–795. https://doi.org/10.1056/NEJMp1500523
2. Tsimberidou, A. M., Fountzilas, E., Nikanjam, M., & Kurzrock, R. (2020, June). Review of precision cancer medicine: Evolution of the treatment paradigm. Cancer Treatment Reviews, 86(March), 102019. https://doi.org/10.1016/j.ctrv.2020.102019
3. Khoury, M. J., Bowen, M. S., Clyne, M., Dotson, W. D., Gwinn, M. L., Green, R. F., . . . Yu, W. (2018, June). From public health genomics to precision public health: A 20-year journey. Genet Med, 20(6), 574–582. https://doi.org/10.1038/gim.2017.211
4. Larsen, K., Rydz, E., & Peters, C. E. (2023, May 4). Inequalities in environmental cancer risk and carcinogen exposures: A scoping review. International Journal of Environmental Research and Public Health, 20(9), 5718. https://doi.org/10.3390/ijerph20095718
5. Lynch, S.M., Wiese, D., Ortiz, A., Sorice, K.A., Nguyen, M., González, E.T., Henry, K.A. (2020). Towards precision public health: Geospatial analytics and sensitivity/specificity assessments to inform liver cancer prevention. SSMPopulation Health, 12, 10060. https://doi.org/10.1016/j.ssmph.2020.100640
6. Giaquinto, A. N., Sung, H., Miller, K. D., Kramer, J. L., Newman, L. A., Minihan, A., . . . Siegel, R. L. (2022, November). Breast cancer statistics, 2022. CA: a Cancer Journal for Clinicians, 72(6), 524–541. https://doi.org/10.3322/caac.21754
7. Daly, B., & Olopade, O. I. (2015, May-Jun). A perfect storm: How tumor biology, genomics, and health care delivery patterns collide to create a racial survival disparity in breast cancer and proposed interventions for change. CA: a Cancer Journal for Clinicians, 65(3), 221–238. https://doi.org/10.3322/caac.21271
8. Aleshire, M. E., Adegboyega, A., Escontrías, O. A., Edward, J., & Hatcher, J. (2021, February). Access to care as a barrier to mammography for black women. Policy, Politics & Nursing Practice, 22(1), 28–40. https://doi.org/10.1177/1527154420965537
9. Hsu, C. D., Wang, X., Habif, D. V., Jr., Ma, C. X., & Johnson, K. J. (2017, August 15). Breast cancer stage variation and survival in association with insurance status and sociodemographic factors in US women 18 to 64 years old. Cancer, 123(16), 3125–3131. https://doi.org/10.1002/cncr.30722
10. Jatoi, I., Sung, H., & Jemal, A. (2022, June 23). The emergence of the racial disparity in U.S. breast-cancer mortality. The New England Journal of Medicine, 386(25), 2349–2352. https://doi.org/10.1056/NEJMp2200244
11. Webster, J. L., Goldstein, N. D., Rowland, J. P., Tuite, C. M., & Siegel, S. D. (2023, November 8). A catchment and locationallocation analysis of mammography access in Delaware, US: Implications for disparities in geographic access to breast cancer screening. Breast Cancer Res, 25(1), 137. https://doi.org/10.1186/s13058-023-01738-w
12. Siegel, S. D., Brooks, M. M., Berman, J. D., Lynch, S. M., Sims-Mourtada, J., Schug, Z. T., & Curriero, F. C. (2023, May). Neighborhood factors and triple negative breast cancer: The role of cumulative exposure to area-level risk factors. Cancer Medicine, 12(10), 11760–11772. https://doi.org/10.1002/cam4.5808
13. State Cancer Profiles. (n.d.). Incidence rate report by state [Breast (Late Stage), 2015-2019, All Reaces (includes Hispanic), Female, Ages <50. https://statecancerprofiles.cancer.gov/incidencerates/index.php
14. Sung, H., Wiese, D., Jatoi, I., & Jemal, A. (2023, May 1). State variation in racial and ethnic disparities in incidence of triplenegative breast cancer among US women. JAMA Oncology, 9(5), 700–704. https://doi.org/10.1001/jamaoncol.2022.7835
15. Goding Sauer, A., Fedewa, S.A., Bandi, P., Minihan, A.K., Stoklosa, M., Drope, J., …, Islami, F. (2021, Apr). Proportion of cancer cases and deaths attributable to alcohol consumption by US state, 2013-2016. Cancer Epidemiol, 71(Pt A), 101893. https://doi.org/10.1016/j.canep.2021.101893
16. Grubbs, S. S., Polite, B. N., Carney, J., Jr., Bowser, W., Rogers, J., Katurakes, N., . . . Paskett, E. D. (2013, June 1). Eliminating racial disparities in colorectal cancer in the real world: It took a village. J Clin Oncol, 31(16), 1928–1930. https://doi.org/10.1200/JCO.2012.47.8412
17. Siegel, S. D., Rowland, J. P., Leonard, D. J., Katurakes, N., BittnerFagan, H., Hoffman, M., . . . Petrelli, N. J. (2023). A population health proposal for increasing breast cancer screening to reduce racial disparities in breast cancer: Getting the village back together. Population Health Management, 27(1), 84–86. https://doi.org/10.1089/pop.2023.0178
18. Nicholson, W. K., Silverstein, M., Wong, J. B., Barry, M. J., Chelmow, D., Coker, T. R., . . . Wiehe, S., & the US Preventive Services Task Force. (2024, June 11). Screening for breast cancer. JAMA, 331(22), 1918–1930. https://doi.org/10.1001/jama.2024.5534
19. Ahmed, A. T., Welch, B. T., Brinjikji, W., Farah, W. H., Henrichsen, T. L., Murad, M. H., & Knudsen, J. M. (2017, February). Racial disparities in screening mammography in the United States: A systematic review and meta-analysis. J Am Coll Radiol, 14(2), 157–165.e9. https://doi.org/10.1016/j.jacr.2016.07.034
20. Monticciolo, D. L., Newell, M. S., Moy, L., Niell, B., Monsees, B., & Sickles, E. A. (2018, March). Breast cancer screening in women at higher-than-average risk: Recommendations from the ACR. J Amn Coll Radiol, 15(3 Pt A), 408–414. https://doi.org/10.1016/j.jacr.2017.11.034
21. Siegel, S. D., Zhang, Y., Lynch, S. M., Rowland, J., & Curriero, F. C. (2024, May 1). A novel approach for conducting a catchment area analysis of breast cancer by age and stage for a community cancer center. Cancer Epidemiol Biomarkers Prev, 33(5), 646–653. https://doi.org/10.1158/1055-9965.EPI-23-1125
22. Siegel, S. D., Brooks, M. M., Sims-Mourtada, J., Schug, Z. T., Leonard, D. J., Petrelli, N., & Curriero, F. C. (2022, January). A population health assessment in a community cancer center catchment area: Triple-negative breast cancer, alcohol use, and obesity in New Castle County, Delaware. Cancer Epidemiol Biomarkers Prev, 31(1), 108–116. https://doi.org/10.1158/1055-9965.EPI-21-1031
23. Dash, C., Mills, M. G., Jones, T. D., Nwabukwu, I. A., Beale, J. Y., Hamilton, R. N., . . . O’Neill, S. C. (2023, September). Design and pilot implementation of the Achieving Cancer Equity through Identification, Testing, and Screening (ACEITS) program in an urban underresourced population. Cancer, 129(S19), 3141–3151.
https://doi.org/10.1002/cncr.34691
24. Witmer, A., Seifer, S. D., Finocchio, L., Leslie, J., & O’Neil, E. H. (1995, August). Community health workers: Integral members of the health care work force. American Journal of Public Health, 85(8 Pt 1), 1055–1058. https://doi.org/10.2105/AJPH.85.8_Pt_1.1055
25. Wells, K. J., Luque, J. S., Miladinovic, B., Vargas, N., Asvat, Y., Roetzheim, R. G., & Kumar, A. (2011, August). Do community health worker interventions improve rates of screening mammography in the United States? A systematic review. Cancer Epidemiol Biomarkers Prev, 20(8), 1580–1598. https://doi.org/10.1158/1055-9965.EPI-11-0276
Delaware Mini-Medical School is a free, six-week series designed for individuals who want to gain a deeper understanding of the world of healthcare – from dentistry and medicine to public health and research. This series is designed for middle, junior, high school, and undergraduate students, though all are welcome to attend. (Parents, attend with your children!) Attendees learn about trends in diagnosing and treating illness and general health topics. Faculty will provide in-depth lectures and allow time for questions to enhance the experience. There are no tests or grades. No previous medical training is required.
Early Fall 2024 Delaware Mini Medical School is produced in partnership with Bayhealth and the Sussex County Health Coalition.
GLOBAL HEALTH MATTERS
GLOBAL HEALTH MATTERS
MAY/JUNE 2024
MAY/JUNE 2024
Supporting better heart health through education in Haiti...p. 5
Supporting better heart health through education in Haiti... p. 5
Welcoming Neuzil as Fogarty’s 13th director
Welcoming Neuzil as Fogarty’s 13th director
Dr. Kathleen Neuzil joined the Fogarty International Center as its 13th director on May 6, 2024. She has also been appointed associate director for international research at the National Institutes of Health.
Dr. Kathleen Neuzil joined the Fogarty International Center as its 13th director on May 6, 2024. She has also been appointed associate director for international research at the National Institutes of Health.
An internationally recognized researcher, Neuzil focuses on vaccine development and vaccine introduction in low- and middle-income countries and regions. She has conducted clinical and epidemiologic studies on vaccine-preventable diseases and her scientific contributions encompass design and execution of clinical trials as well as leadership of large, multicenter field studies and vaccine implementation programs.
An internationally recognized researcher, Neuzil focuses on vaccine development and vaccine introduction in low- and middle-income countries and regions. She has conducted clinical and epidemiologic studies on vaccine-preventable diseases and her scientific contributions encompass design and execution of clinical trials as well as leadership of large, multicenter field studies and vaccine implementation programs.
Neuzil's work in the field of vaccinology spans multiple infectious diseases, including influenza, rotavirus, human papillomavirus, Japanese encephalitis, typhoid, and COVID-19. She has authored or co-authored more than 340 scientific publications and has more than two decades of experience in vaccine policy. Neuzil is currently a member of the WHO Strategic Advisory Group of Experts on Immunization and, previously, she served on the Advisory Committee on Immunization Practices for the U.S. Centers for Disease Control and Prevention (CDC).
Neuzil's work in the field of vaccinology spans multiple infectious diseases, including influenza, rotavirus, human papillomavirus, Japanese encephalitis, typhoid, and COVID-19. She has authored or co-authored more than 340 scientific publications and has more than two decades of experience in vaccine policy. Neuzil is currently a member of the WHO Strategic Advisory Group of Experts on Immunization and, previously, she served on the Advisory Committee on Immunization Practices for the U.S. Centers for Disease Control and Prevention (CDC).
First woman director of Fogarty
First woman director of Fogarty
NIH Director Dr. Monica M. Bertagnolli said, “Dr. Neuzil has decades of experience in global health. Combined with her many years as a vaccine policy advisor to the CDC and the WHO, and her experience establishing new partnerships and directing diverse organization teams, she is very well suited to lead Fogarty.”
NIH Director Dr. Monica M. Bertagnolli said, “Dr. Neuzil has decades of experience in global health. Combined with her many years as a vaccine policy advisor to the CDC and the WHO, and her experience establishing new partnerships and directing diverse organization teams, she is very well suited to lead Fogarty.”
FOCUS
Immediately prior to Fogarty, Neuzil served as the Myron M. Levine MD DTPH Endowed Professor in Vaccinology, professor of medicine and pediatrics, director of the Center for Vaccine Development and Global Health, and chief of the Division of Geographic Medicine at the University of Maryland School of Medicine. Before this, she was a clinical professor in the departments of medicine and global health at the University of Washington in Seattle. Mentorship of the next generation of vaccine scientists has been a fundamental principle throughout her career; she’s committed to academic support of trainees at all levels.
Immediately prior to Fogarty, Neuzil served as the Myron M. Levine MD DTPH Endowed Professor in Vaccinology, professor of medicine and pediatrics, director of the Center for Vaccine Development and Global Health, and chief of the Division of Geographic Medicine at the University of Maryland School of Medicine. Before this, she was a clinical professor in the departments of medicine and global health at the University of Washington in Seattle. Mentorship of the next generation of vaccine scientists has been a fundamental principle throughout her career; she’s committed to academic support of trainees at all levels.
National and international service
National and international service
From 2005 to 2015, Neuzil worked for PATH, an international, nonprofit global health organization based in Seattle, Washington. Throughout her career, she has assisted national scientific organizations, including NIH, in various capacities. Most recently, she served on the National Institute of Allergy and Infectious Diseases’ Special Emphasis and Vaccine Research Center Scientific Advisory panels. A former vice president and director on the board of the National Foundation for Infectious Diseases, she also has been co-director of the COVID-19 Prevention Network since it launched in 2020.
From 2005 to 2015, Neuzil worked for PATH, an international, nonprofit global health organization based in Seattle, Washington. Throughout her career, she has assisted national scientific organizations, including NIH, in various capacities. Most recently, she served on the National Institute of Allergy and Infectious Diseases’ Special Emphasis and Vaccine Research Center Scientific Advisory panels. A former vice president and director on the board of the National Foundation for Infectious Diseases, she also has been co-director of the COVID-19 Prevention Network since it launched in 2020.
Neuzil’s numerous honors and awards include Vanderbilt University School of Medicine Distinguished Alumna Award; the Sonia Skarlatos Public Service Award from the American Society of Gene & Cell Therapy; and University of Maryland School of Medicine Chairman’s Special Achievement Award. She is a member of the National Academy of Medicine, the International Society for Infectious Diseases, and the American Society of Tropical Medicine and Hygiene. She is also a fellow of both the American College of Physicians and the Infectious Diseases Society of America. Neuzil follows Dr. Roger I. Glass, Fogarty’s longest serving director of nearly 17 years. Dr. Peter Kilmarx, acting director, will resume his role as Fogarty’s deputy director.
Neuzil’s numerous honors and awards include Vanderbilt University School of Medicine Distinguished Alumna Award; the Sonia Skarlatos Public Service Award from the American Society of Gene & Cell Therapy; and University of Maryland School of Medicine Chairman’s Special Achievement Award. She is a member of the National Academy of Medicine, the International Society for Infectious Diseases, and the American Society of Tropical Medicine and Hygiene. She is also a fellow of both the American College of Physicians and the Infectious Diseases Society of America. Neuzil follows Dr. Roger I. Glass, Fogarty’s longest serving director of nearly 17 years. Dr. Peter Kilmarx, acting director, will resume his role as Fogarty’s deputy director.
Georgia rising
Georgia rising
• Partnerships help this Eastern European nation grow
• Training the next generation of HIV researchers in Georgia
• Improving traumatic injury care in Georgia and beyond
• Learning to CARE for public and environmental health
• Partnerships help this Eastern European nation grow • Training the next generation of HIV researchers in Georgia • Improving traumatic injury care in Georgia and beyond • Learning to CARE for public and environmental health
Photo courtesy of University of Maryland
Photo courtesy of University of Maryland
Clinical trial could bring first TB vaccine in a century
By Susan Scutti
Phthisis, wasting disease, consumption, the white death— tuberculosis (TB) has been known by many names in the past and even appears in the writings of Hippocrates (460-355 BC). Though ancient in origin, this infectious disease remains a scourge in our own time, having killed 1.3 million people in 2022, with an additional 10.6 million falling ill that same year. Notably, this respiratory disease, which is triggered by a form of bacteria (Mycobacterium tuberculosis), is the leading cause of death among people living with HIV/AIDS. Overall, nearly a quarter of the world’s population has a latent TB infection; free of symptoms, these people are unable to spread TB to others, yet some will progress to active illness. Today’s TB patients are often young adults residing in low- and middleincome countries. Though most sufferers can be cured with antibiotics, multidrug-resistant TB is increasingly prevalent and threatens to become a crisis.
Meanwhile, the only licensed vaccine for TB was developed more than 100 years ago by Albert Calmette and JeanMarie Camille Guerin. A milestone achievement in 1921, the Bacille Calmette-Guerin (BCG) vaccine remains in widespread use today to prevent TB in infants and young children. It shows variable efficacy against different forms of TB, however, with most consistent protection observed against certain forms of the disease that occur outside the lungs. As this vaccine’s protection diminishes over time, teens and adults are left vulnerable to pulmonary tuberculosis, which accounts for most infections and deaths in these age groups.
A possible breakthrough is in progress. In March 2024, scientists in seven countries launched a Phase 3 trial of an investigational TB vaccine, M72/AS01E. In a previous Phase 2B trial, this innovative inoculation had stopped progression from latent to active TB in half of adults who participated in the study.
“Fogarty has been proud to support decades of research and research training around the world to address the scourge of tuberculosis, including multidrug-resistant TB,” said Dr. Peter Kilmarx, Fogarty’s deputy director. “We’re excited to see the global roll-out of the M72/AS01E vaccine trial and hope this will be a powerful new tool for the prevention of active TB disease and deaths worldwide.”
Accelerating vaccine development
During the COVID-19 pandemic, global annual spending on essential TB services fell below funding targets set by the WHO’s End TB Strategy. To stimulate investment, WHO Director-General Dr. Tedros Ghebreyesus announced in January 2023 the establishment of a WHO TB Vaccine Accelerator to identify and overcome barriers to TB vaccine development, licensing and use. M72/AS01E is one of 17 TB vaccine candidates in clinical development as part of this program.
Though most sufferers can be cured with antibiotics, multidrug-resistant TB is increasingly prevalent and threatens to become a crisis.
The M72/AS01E vaccine was originally designed by biopharmaceutical company GSK and the International AIDS Vaccine Initiative, a nonprofit research organization. Following the successful Phase 2b trial of M72/AS01E in 2019, the nonprofit Bill & Melinda Gates Medical Research Institute (Gates MRI) licensed the vaccine, intending to push it through to completion of clinical studies. This is all part of the Gates MRI’s overall market strategy. “We build the middle piece of the development process—we license the entity and drive it all the way to registration,” Emilio Emini, the nonprofit’s former chief executive officer recently told The Lancet.
Scientists and patients eagerly await the results of this Phase 3 trial. The double-blind study, led by Dr. Alemnew Dagnew for Gates MRI, aims to enroll up to 20,000 participants at 60 trial sites across South Africa, Zambia, Malawi, Mozambique, Kenya, Indonesia, and Vietnam. Participants, who include people living with HIV, will receive either M72/AS01E or a placebo. The investigators expect the trial, funded in part by Wellcome Trust, to take at least five years to complete.
Photo courtesy of NIAID
Scanning electron micrograph of Mycobacterium tuberculosis particles (colorized orange), the bacterium which causes TB.
Research Roundup: February–May 2024
Between February and May 2024, researchers within Fogarty’s Division of International Epidemiology and Population Studies published the following studies on a variety of topics related to domestic and international health.
People in LMICs at higher risk of flu-related ICU admission Fogarty’s Dr. Cécile Viboud and Chelsea Hansen contributed to this report from the Global Influenza Hospital Surveillance Network (GIHSN), which has provided patient-level data on severe influenza-like-illnesses from more than 100 clinical sites since 2012. The team assessed the risk of intensive care unit admission, mechanical ventilation, and inhospital death among 73,121 patients hospitalized with respiratory illness, including 15,660 with confirmed influenza, in 22 countries. They found a sevenfold increase in the risk of flu-related ICU admission in LMICs compared with HICs. Article title: Predictors of Severity of Influenza-Related Hospitalizations: Results From the Global Influenza Hospital Surveillance Network (GIHSN), Publication: Journal of Infectious Disease
Heterosexual transmission likely drove spread of HIV-1 subtype C Fogarty’s Dr. Nidia Trovão, senior author, investigated the spread of HIV1 subtype C, which is thought to have originated in non-human primates in the Democratic Republic of Congo. The authors analyzed near full-length genomic sequences sampled from 32 countries on four continents with sampling dates between 1986 to 2019. They estimated the total number of introduction events of HIV-1 subtype C between continents and between risk groups; the largest number of introductions occurred from Africa to Europe. Article title: The emergence and circulation of human immunodeficiency virus (HIV)-1 subtype C, Publication: Journal of Medical Microbiology
Human mobility & spread of respiratory illnesses Fogarty’s Dr. Amanda Perofsky, Dr. Cécile Viboud, and Chelsea Hansen investigated the impact of human behavior on the transmission of 17 respiratory viruses and SARS-CoV-2 in the greater Seattle, Washington, region from November 2018 to June 2022. During lockdown, mobility was a leading indicator of transmission of all viruses except SARS-CoV-2. Once restrictions relaxed, mobility’s influence on SARS-CoV-2 transmission lessened. Article title: Impacts of human mobility on the citywide transmission dynamics of 18 respiratory viruses in pre- and post-COVID-19 pandemic years, Publication: Nature Communications
This graphic shows the spatial transmission dynamics of hepatitis B virus genotype E from 1824 to 2014.
Image adapted from Figure 6 of the publication, Contemporary and historical human migration patterns shape hepatitis B virus diversity , Potter BI,
Impact of seasonal bird migration & trade on avian flu virus dispersal Fogarty’s Dr. Nidia Trovão and her co-authors used wild bird movement tracking data and virus genome sequences to measure how seasonal bird migration facilitates global dispersal of the highly pathogenic avian influenza virus (HPAIV) A H5. Article title: Synchrony of Bird Migration with Global Dispersal of Avian Influenza Reveals Exposed Bird Orders, Publication: Nature Communications
Hepatitis B spread linked to human migration Fogarty’s Dr. Nidia Trovão and co-authors described 133 newly sequenced hepatitis B virus strains from recent African immigrants upon their arrival in Belgium. The analyses showed that the A and D genotypes originated in Southeast Asia, while the E genotype likely originated in Africa; both have spread to other regions. Article title: Contemporary and historical human migration patterns shape hepatitis B virus diversity, Publication: Virus Evolution
Is the U.S. influenza inoculation program effective? To assess the effectiveness of the U.S. influenza vaccination program, Fogarty’s Dr. Cécile Viboud and colleagues estimated population-level effects of influenza vaccination uptake on pneumonia and influenza (P&I) associated deaths. Overall influenza vaccine uptake had a statistically significant protective association with the P&I death rate. Article title: The association between influenza vaccination uptake and influenza and pneumonia-associated deaths in the United States. Publication: Vaccine
Lessons learned from the COVID-19 pandemic
In this report, Dr. Cécile Viboud and co-authors summarize a 2023 meeting organized by the Center of Excellence in Respiratory Pathogens. Main takeaways include the importance of combining traditional surveillance with novel data sources and the need for a common framework for data sharing. Article title: Redefining pandemic preparedness: Multidisciplinary insights from the CERP modelling workshop in infectious diseases, workshop report. Publication: Infectious Disease Modeling
Thijssen M, Trovão NS, et al.
PROFILE
Crowdsourcing to promote HIV self-testing
Dr. Weiming Tang chose his research area after several years of volunteer work in his home country of China. While in college, he worked on a program that aimed to spread awareness about HIV among students at his college. Later, he established a peer-to-peer training program on HIV education at other universities. Recognizing the need for growth in this area, he decided to make this the focus of his career.
One unique feature of Tang’s research is that he often uses crowdsourcing to develop tools for the men who have sex with men (MSM) and transgender populations in China. Crowdsourcing—where information is obtained from a large group of people usually via the Internet—is a bottom-up strategy that allows researchers to work with their target populations and develop interventions tailored to their needs. For the MSM and transgender communities in China, this is important as the stigma around these groups often pushes individuals into the shadows, forcing them to use more discreet forms of communication. “I noticed this trend in the MSM community in China and realized it was an opportunity to develop a tool that would allow for better adherence while they are able to look for resources more discreetly.”
Tang’s Fogarty project analyzed the cost-effectiveness of a crowdsourcing video and conventional video for HIV testing uptake campaigns among MSM and transgender individuals in China. The randomized controlled trial compared first-time HIV testing rates among 721 MSM and transgender individuals who had received either a crowdsourced video or a conventional health marketing video, both promoting HIV testing. The team measured HIV test uptake within three weeks of watching either video as well as the cost of the services being promoted—a first-time HIV test and an HIV diagnosis.
Tang and his colleagues found a 2% difference in uptake rates between the two videos, with the crowdsourced version being slightly more favorable. They also found that the crowdsourced interventions cost substantially less—just US$131 vs. US$238 for the first-time HIV test and US$415 vs. US$799 for the HIV diagnosis. The results demonstrated that crowdsourcing may be
Weiming Tang, PhD
Fogarty Fellow: 2015-2016
U.S. institution: University of North Carolina, Chapel Hill
Foreign institution: Sun Yat-sen University, Guangzhou, Guangdong, China
Research topics: Promoting HIV/STI testing and healthy behavior change among key populations, digital health, and telemedicine tools
Current affiliation: Co-director of UNC Project-China, advisor of SESH Global
a more cost-effective tool. “Learning how to do a costeffective analysis was instrumental for me,” said Tang. “It’s something I now implement into all of my projects so that we can better understand if projects can be scaled-up sustainably, which is always of concern to decision-makers.”
Tang’s Fogarty year was a huge transition period for him. He was promoted to postdoctoral fellow and later to faculty the very same year he was accepted into the program. “Fogarty allowed me to conduct independent research and helped me develop the foundation for my future research and build strong relationships with Chinese research institutes.”
Today, he is the co-director of the UNC China Project, a collaboration between the University of North Carolina at Chapel Hill and Chinese partner organizations. The project aims to expand collaboration for global health research through research, teaching, and service. There he oversees the research and collaborates with different institutes in China. He also ensures a robust mentoring program for the research assistants in China, giving them the support they need for their career development.
He has since expanded upon his work, using crowdsourcing methodologies for mental health issues related to COVID-19. He continues to use digital health tools to reduce HIV stigma and increase testing among highly affected communities in China. When asked about the future of Fogarty’s LAUNCH Program, he says, “I hope that collaborative programs like this one can continue so that Chinese researchers can continue to grow in the global health research space.”
A&Q
GENE F. KWAN, MD, MPH
Dr. Gene F. Kwan, a cardiologist and global health researcher, is an assistant professor at Boston University’s Chobanian & Avedisian School of Medicine. Since 2008 he’s worked in rural Rwanda and Haiti collaborating with each country’s ministry of health as well as with the organizations Partners In Health and Zanmi Lasante. He’s also worked on projects in Malawi, Liberia, and India. He’s presented at several American Heart Association conferences. Kwan serves as a noncommunicable diseases advisor for the nonprofit public health organization Partners In Health and is co-author of “The Partners In Health Guide to Chronic Care Integration for Endemic Non-Communicable Diseases.”
What’s special about Partners In Health?
A lot of it is said in the first word of the name—“partners.” They very much collaborate with other organizations, other people, and even policymakers to help them and to understand what barriers and challenges they’re facing. Partners In Health also has a tremendous interest in research and scientific discovery. The organization focuses on rural areas of the countries in which it works. Such areas lend themselves to innovative ideas about improving access to care for patients who are most in need.
Tell us about your NIH funded projects.
My study funded by the National Heart, Lung, and Blood Institute (NHLBI), “Identifying facilitators and barriers to heart failure care in Haiti to adapt a community-based intervention,” aimed to understand the barriers patients face. Many patients were not returning to the clinic after a first diagnosis with heart failure, so we wanted to understand why and how we might change that. Patients take two days off from work, walk to a far-away clinic, wait in a really crowded waiting room, and then they get to see a clinician for 10 minutes. That whole experience can be disheartening! Partners In Health designed robust community health worker interventions and networks to improve care for patients. We've also been able to deliver education to patients, so they understand heart failure and how this chronic condition requires continuous medication to keep the symptoms controlled.
Our Fogarty-funded study, “Simulator-Based simplified Focused Cardiac Ultrasound (sFoCUS) Training in Haiti,” uses simulators to train for cardiac ultrasound. There are about 10 to 15 cardiologists in all of Haiti, a country of 10 million people, and a lot (if not all) of them are working in the capital. So our resident trainees in the rural areas just don't have access to the same kind of cardiology training. There are simulators (mannequins) that help trainees learn the skill of obtaining and interpreting cardiac ultrasound images. Our program implemented this simulator training
in rural areas. Keep in mind we applied for this before COVID, so our work was very timely!
Why do you emphasize implementation science?
In global health, a lot of the science is taking evidence that works in other contexts and trying to implement it in a new context with its unique barriers, constraints, challenges, and awareness levels. Implementation science helps us understand how to overcome all of these. A particular context may help an intervention be successful, so we need to understand contextual factors that create success. If you're going to disseminate or scale up in other places, you need to understand what inputs would be needed to be able to get things to work. Without studying the implementation of these interventions, a successful intervention can fail in a new context.
What lessons learned can you share?
One of my main messages to mentees is “be a very good listener first and foremost.” We need to listen to what our collaborators on the ground are telling us and often they also know what the solutions are. A researcher’s role is to help implement possible solutions and then study whether they're successful or not. My number two lesson for mentees is “be invited back.” You're not going to have long-term collaborations if you're not invited back! A lot of that boils down to being a good partner as opposed to coming in with preconceived ideas of what may or may not work. So always listen… and be invited back.
Global health is hard by nature and research is also very hard; putting those two together is extremely challenging so it takes grit and determination and resilience. There'll be many setbacks along the way. If you keep in mind that people throughout the world aren't getting the care they need and you can make some contribution to changing that—if you keep that as your long-term goal—it will help you get through the setbacks.
Nestled in the Caucasus region between the Black Sea and the Caspian Sea, Georgia serves as a cultural and economic link between Central Asia and Eastern Europe. It emerged as an independent nation after the dissolution of the Soviet Union in 1991, a period marked by significant socioeconomic challenges. In the wake of the country's independence, Georgia’s public health priorities underwent a significant transformation. The focus shifted from primarily addressing infectious diseases and their prevention to enhancing the overall health care system and tackling broader public health issues, including the prevention of noncommunicable diseases (NCDs).
Strengthening public health infrastructure
Since 1995, the U.S. Centers for Disease Control and Prevention (CDC) has worked closely with Georgia's National Center for Disease Control and Public Health (NCDC) to improve public health infrastructure in several key areas. This collaboration has focused on enhancing surveillance and laboratory capabilities, developing the public health workforce, managing outbreak responses, and establishing the NCDC as a comprehensive national public health institute. For over two decades, Georgia has maintained a polio-free status and achieved substantial control over hepatitis B. It launched the world’s first national hepatitis C elimination program in 2015. The nation is currently working to reduce TB incidence by developing novel treatment protocols for treating the disease.
Since 2016, Fogarty has supported several education and training programs aimed at addressing Georgia's public health concerns, including HIV/AIDS prevention and research, tuberculosis, and NCDs. The goal of these programs, like most Fogarty-supported grants, is to provide training and education and to build capacity. Dr. Denise Esserman, professor of biostatistics at Yale and principal investigator of the Georgian Implementation Science Fogarty Training Program (GIFT), emphasized the need for
local leadership in the country: “I think it’s important that our colleagues in Georgia eventually become the drivers of this program, and that our role is just to make sure the program is sustainable for them long-term.”
Meanwhile, Georgia continues to seek guidance from the National Institutes of Health (NIH) while bolstering its public health infrastructure. In May, Fogarty hosted a delegation of academic administrators who wanted to better understand the NIH grant system as well as the Institutes’ priorities for investing in research and development. This meeting also helped clarify to the visitors how NIH supports international partnership and programs in LMICs.
Ongoing partnerships
Certainly, collaborations with U.S. universities and research programs benefit Georgian researchers, but regional partnerships are equally important to the nation’s scientific growth and advancement. The iCREATE (Injury Capacity in Research in EAsTern Europe) program, co-led by the University of Iowa and University of Babes-Bolyai in Romania, connects Georgian researchers with peers in Armenia and the Republic of Moldova. A shared history of Soviet influence and other regional commonalities “pique our interest in comparing data and trends in our countries,” said Dr. Nino Chikhladze, a professor at Georgia’s Ivane Javakhishvili Tbilisi State University. Neighborly inspiration catalyzes public health progress, she said.
Among its most recent significant achievements, Georgia attained European Union candidate status in December 2023. While EU membership is not guaranteed, the nation, with a population approaching 4 million people, clearly stands on the threshold of a significant transformation. As it continues the hard work of expanding its academic network, enriching its research institutes, and articulating a national public health system, Georgia has the potential to transform itself into a scientific hub.
Photo courtesy of U.S. Army
Georgia launched the world’s first national hepatitis C elimination program in 2015. Tbilisi (pictured) is its capital city.
Training the next generation of HIV researchers in Georgia
While HIV is decreasing around the world, its incidence and mortality are increasing in Eastern Europe and Central Asia. The country of Georgia lies at the intersection of these two regions. HIV prevalence is lower in the country than in other nations in the region, but it remains higher than in the U.S. Data suggests that certain populations, such as people who inject drugs and men who have sex with men, are particularly at risk in Georgia. This led Dr. Rick Altice, a professor of medicine and public health at Yale University, and his colleagues to ask, “What needs to be done differently here?”
Altice and teams at Yale and Ilia State University in Tbilisi used Fogarty funding to develop the Georgian Implementation Science Fogarty Training (GIFT) program. The program includes a center to train researchers in implementation science, with an emphasis on biostatistical methods. The ultimate goal is to develop researchers who can help overcome prevention and treatment gaps that exist in the country.
Throughout his career, Altice has done research in Eastern Europe, Central Asia, Peru, Malaysia, and the U.S., and he believes in democratizing education and training. “High-income countries should not have a monopoly on this research. Instead, the next generation of researchers should be homegrown, and this is where Fogarty makes such a big difference.”
Gaps in HIV care
Altice and his colleagues noticed several gaps in the HIV research in Georgia. Before their project, no Fogarty grant in the region focused on the intersection between HIV and substance use, and the country lacked expertise in implementation science methods, specifically in biostatistics. That's where the unique expertise of the grant's co-principal investigator, Dr. Denise Esserman, professor of biostatistics at Yale, comes into play. “The role of a biostatistician in a clinical trial is to help the team come up with the best design to answer their research question and to make sure that this design is implemented appropriately,” she says. “And at the end, they conduct the analysis and help to interpret the results."
Because so many people with HIV in Georgia go undiagnosed, prevention and treatment methods are underused
A worker at an HIV testing clinic in Tblisi, Georgia, meets with a patient.
in the country. Those most at risk continue to be stigmatized, an issue that Dr. Irma Kirtadze, GIFT’s co-principal investigator from Ilia State University, says remains a barrier to prevention and treatment. She referenced a qualitative study of men and women who use drugs in Georgia, funded by the National Institute on Drug Abuse (NIDA) in 2012, which found that stigma was much higher for women than men, resulting in worse outcomes for this group. “Those with HIV who choose to start addiction treatment can and should be tested for HIV,” says Altice. Being in addiction treatment helps people both initially access HIV care and continue with it.
Training the trainers
The first stage of the program is to train five postdoctoral researchers from diverse medical and behavioral fields, with some working knowledge of advanced biostatistics, in methods related to biostatistics and implementation science and to provide them with immersive opportunities in implementation. These researchers, who began online training in fall 2023, followed by inperson courses at Yale in the spring of this year, will act as mentors for the first group of public health doctoral students who will enter the program in the fall of 2024.
This summer, Ilia State University will host an intensive, three-day boot camp, open to students, faculty, and Ministry of Health public health practitioners. Trainees will learn the principles and the theory, gain skills and experience, share learning experiences, and interact with faculty. The boot camp is supported by the Tbilisi regional office of the U.S. Centers for Disease Control (CDC) and by the WHO. Altice believes this part of the program is integral to GIFT’s overall success: “We don’t want to leave the country without building in-country expertise.”
Photo
Improving traumatic injury care in Georgia and beyond
The Increasing Capacity for injury Research in EAsTern Europe (iCREATE) grant emphasizes translation across three-related cultures. Led by the University of Iowa (UI) and Babes-Bolyai University (BBU) of Romania, the program aims to improve acute injury treatment while expanding on previous capacity building efforts in Georgia, Armenia, and the Republic of Moldova. This initiative is vital given that all three upper middle-income countries have lacked scientific research focusing on injuries, resulting in critical gaps in evidence-based information. Primary investigator Dr. Cara Hamann, an associate professor at UI, highlighted the political and economic ties linking the three. “Learning to overcome the challenges these countries face makes the work they are doing more relevant and more easily translatable to other former Soviet Union countries,” said Hamann.
Co-investigator Dr. Nino Chikhladze, a professor at Georgia's Ivane Javakhishvili Tbilisi State University (TSU), is well acquainted with these transnational bonds. The start of her career coincided with the collapse of the Soviet Union. Despite the turmoil, she saw “an opportunity to make a positive impact on the health and well-being not only of individual patients but also the population of Georgia as a whole.”
After Georgia gained independence from the Soviet Union, a new demand for experts able to lecture on the health care system and public health issues inspired Chikhladze to pursue public health science and education. Over time, prevention of noncommunicable diseases drew her attention. “Since becoming part of the iCREATE project, my research interest is mainly in traumatic injuries,” said Chikhladze.
After receiving training from iCREATE for almost a decade, BBU became a collaborator on the grant in 2016. Now, they facilitate the implementation of the project in Eastern Europe. Co-principal investigator Dr. Diana Dulf of BBU said, “This type of continuous funding from NIH is a great opportunity to build capacity in research over the long term and support the future leaders in the field of violence and injury prevention in other regions of the world.”
Publications and potential policy changes
Chikhladze said collaboration with universities in the U.S. and Romania has been vital. In their earliest research, the collaborators observed several shared epidemiological characteristics across various types of injuries, including traumatic brain injuries (TBIs), falls, and road traffic injuries, among the three countries. They also published analyses of data drawn from Georgia’s National Center for Disease Control and Public Health database. These comprehensive early studies provided baseline information and data on the main features of injuries, groups at high risk, and general injury trends in Georgia.
“We have now progressed to prospective studies. The comparison of findings from these studies will provide insights into cultural differences in behaviors and risk factors,” said Chikhladze. “Our findings closely align with studies conducted in Europe and the U.S., indicating that falls are a primary cause of TBIs in numerous countries,” said Chikhladze. This work has significant public health implications, she said. “This evidence can catalyze the development of preventive strategies at the national level.”
Shared shortcomings, common goals
iCREATE, started in 2005, incorporates core curricula related to injury into PhD- and Masters-level public health programs in partner institutions in Georgia, Armenia, and Moldova, while initiating experiential learning projects in the areas of road traffic injury, acute care, and violence against women and children. As part of iCREATE, TSU students attend programs and a summer school organized at BBU, while mentors from both UI and BBU supervise their projects.
8
The team is expanding its public health focus with forthcoming articles about falls among the elderly and pediatric burns as part of the acute care research portfolio. Meanwhile, Chikhladze is thankful, on behalf of TSU staff and students, to her colleagues at BBU and UI for their continuous support and fruitful partnership. “Collaborative efforts are crucial in preventing injury and violence and improving the health and well-being of the population of Georgia.”
Courtesy of Diana Dulf
Dr. Melinda Gal, former Fogarty trainee, lectures to a summer school class in Cluj, Romania.
ICREATE summer school in Cluj, Romania
Courtesy of Diana Dulf
Learning to CARE for public and environmental health
“Public health is an opportunity to take care of an entire population, not just a small number of people,” said Tamar Kashibadze, a public health specialist at the National Center for Disease Control and Public Health (NCDC) based in Tbilisi, Georgia. It is this expansive focus that attracted her to her profession. “Working in this field means that you are doing activities not exclusively for your country but for the world. You are a part of global change.”
Kashibadze is currently a doctoral trainee in the Fogartyfunded Clean Air Research & Education (CARE) program, which seeks to enlarge Georgia’s scientific capacity to conduct research related to noncommunicable diseases (NCDs) and environmental health. The program’s ultimate goal is to reduce NCDs through policy and practice. Tamar’s research project, focused on health impacts of ambient air pollution in Tbilisi, is one stepping stone toward achieving that aim.
Assessing air quality
Both air pollution and secondhand smoke have a great impact on the health of people in Georgia. According to WHO data, the country has the third highest mortality attribu-ted to ambient and indoor air pollution in the world. Meanwhile, existing in-country research opportunities examining NCDs in relation to environmental health are limited in terms of both volume and range of topics. This lack of both scientific evidence on the subject and insufficient research openings in the area prompted Kashibadze to focus her work on air pollution and its impact on human health.
Several years ago, she participated in a workshop on air pollution and health organized by the WHO Regional Office for Europe. There, she was introduced to AirQ+, a software tool that can calculate the magnitude of air pollution’s impact on health. The software is also able to estimate long- and short-term exposures to ambient pollution from several pollutants. “Georgia didn’t have any prior experience in conducting analyses using AirQ+ to determine the potential association between specific diseases and mortality rates linked to air pollution,” explained Kashibadze. “So this was precisely the focus I wanted to pursue.”
Insufficient national coverage of 24-hour air quality monitoring stations is one factor that led her to concentrate only on Tbilisi, Georgia’s capital city. Though she’s already conducted several analyses using AirQ+, her research is still in progress.
A global view
CARE is a collaboration between Emory University, NCDC, the Georgia National Environmental Agency, and Tbilisi State Medical University. The program has allowed Kashibadze to attend online classes at Emory and George Washington University, and she just returned from an intensive course in environmental health at Harvard. She appreciates these educational experiences in the U.S., which also include a previous 2015 Fogarty fellowship at State University of New York, Albany. “I expanded my skills in infectious disease epidemiology research, which I successfully use in the Georgian public health sector,” she said.
Meanwhile, the hard work of developing robust, evidencebased public health policies in Georgia is very much Kashibadze’s priority. The country achieved EU candidate status in December 2023 and “has already made significant progress in some respects,” she said. The introduction of universal health coverage has expanded access to essential health services, while vaccination programs have reduced the incidence of some preventable illnesses. Various prevention and management initiatives have begun to address the growing burden of NCDs, she said. “The environmental health system in Georgia is something that needs strengthening, especially in times when the biggest threat of the 21st century—climate change—is already affecting everyone everywhere.”
Ultimately, Kashibadze’s CARE research that uses AirQ+ software will provide evidence that will help prevent premature deaths. The results will also allow for estimating potential health gains if policies and measures are put in place to reduce air pollution. “Environmental policies in Georgia are not always a top funding priority given the scarcity of public resources and various competing social needs,” she said. “I’m sure this work will contribute to evidence-based decision making regarding national funding priorities.”
An air quality monitoring station in the Saburtalo district of Tbilisi, Georgia. A.
DIRECTOR’S COLUMN
By Dr. Peter Kilmarx, Deputy Director, Fogarty
Memory of Joel Breman
It is with a heavy heart but fond memories that I reflect on the life of our esteemed colleague, Dr. Joel Breman, who passed in Chevy Chase, Maryland, on April 6. Joel, a beloved member of the Fogarty community, was born in Chicago in 1936 and grew up in Los Angeles where he excelled as student body president and a football player.
Joel completed his undergraduate studies at UCLA— where he was president of his fraternity and rowed varsity crew—in the late 1950s, and then embarked on a unique path, serving as an artillery officer before pursuing his medical education at the Keck School of Medicine, University of Southern California. His commitment to global health emerged early on when he joined the CDC-supported global smallpox program, stationed in Guinea. There, he worked tirelessly to eradicate smallpox and combat measles across West and Central Africa.
In 1993, Joel embarked on a new chapter of his career becoming the associate director of the National Vaccine Program Office in Washington, D.C., before joining the Fogarty International Center two years later. At Fogarty, Joel’s leadership was transformative, establishing research programs focused on emerging infectious diseases and furthering global health initiatives.
Joel’s thirst for knowledge led him to further training in infectious diseases at the Harvard Medical Service at Boston City Hospital and the London School of Hygiene & Tropical Medicine. Armed with a diploma in tropical pediatric hygiene (DTPH), he delved into epidemiological research in francophone countries, focusing on childhood immunizations and the immuno-depressive effect of malaria.
In 1976, Joel’s expertise was called for during the response to the first epidemic of Ebola hemorrhagic fever in the Democratic Republic of Congo. Subsequently, he assumed several significant roles at the WHO in Geneva, overseeing the certification of smallpox eradication and pioneering research on human mpox.
Returning to the CDC in 1980, Joel spearheaded efforts to combat malaria, expanding the Malaria Branch's reach and impact in Africa. Under his leadership, the branch flourished, conducting pivotal research that informed national and international control guidelines.
Even in his emeritus years, Joel remained dedicated to his passion for epidmiology and disease eradication. He collaborated on epidemiological research, defining the burden of malaria and the pervasiveness of poor-quality drugs. He also taught a course on disease control at George Washington University’s School of Public Health, served as president of the American Society of Tropical Medicine and Hygiene (ASTMH), and consulted for the WHO, the Carter Center, the Gates Foundation, USAID, FDA, and the Multilateral Initiative on Malaria. He was also co-chair of the WHO International Commission for the Certification of Dracunculiasis Eradication and chair of an ad hoc group planning the celebration of the 40th anniversary since the World Health Assembly confirmed the eradication of smallpox. Joel has two publications forthcoming this year: his personal memoir, as well as a medical textbook from Oxford University Press, “The Principles and Practice of Disease Eradication."
I thoroughly enjoyed my interactions with Joel since I came to Fogarty in 2015. We had much in common, including rowing, past appointments at CDC, working in Africa, participating in responses to Ebola and other infectious diseases, writing, and mentoring the next generation of public health leaders. I often stopped by his desk to hear about his latest endeavors and remarkable stories and insights into public health events and personalities, past and present.
We honor a life lived with purpose, dedication, and love, rowing many global health initiatives across the finish line with long and strong strokes of the oar. Joel's legacy will continue to inspire us, guiding our efforts to create a healthier, more equitable world.
Dr. Joel Breman, (kneeling in front row, left), was part of the team established to control the 1976 Ebola outbreak in Yambuku, Zaire (now the Democratic Republic of the Congo).
International Center
Dr. Joel Breman
Photo courtesy
CDC/
Dr. Lyle Conrad
HEALTH Briefs Global PEOPLE
NCI Center for Global Health branch director retires
Cathy Muha, RN, MSN, has retired from her role as branch director for the planning and operations branch in the National Cancer Institute’s (NCI) Center for Global Health. For the last 10 years, Cathy’s role focused on international scientific partnerships, cancer control and planning, and program evaluation.
BMJ Global Health editor-in-chief steps down
Dr. Seye Abimbola has stepped down from his role as editorin-chief of BMJ Global Health after nearly nine years and two terms in post. During his tenure, Abimbola was listed in Vox’s “The 2023 Future Perfect 50” list for his work on fighting global poverty and health threats.
Soubeyran elected head of world animal health body
Emmanuelle Soubeyran, head of France’s veterinary services, was elected director general of the World Organisation for Animal Health (WOAH). Her goals include boosting links with other international organizations, such as the United Nations’ Food and Agriculture Organization, after recent crises have shown close ties between animal and human health.
Gates Medical Research Institute names new CEO
Dr. Patrice Matchaba has been named chief executive officer of the Bill & Melinda Gates Medical Research Institute, succeeding Dr. Emilio Emini. Before joining the institute, Matchaba was president of Novartis’ U.S. Foundation, group head of Novartis Global Health, and senior research scientist at the Cochrane Centre based at the South African Medical Research Centre in Cape Town.
Barbados prime minister receives WHO award
WHO Director-General Dr. Tedros Ghebreyesus awarded a Director-General’s Award for Global Health to Barbados Prime Minister Mia Mottley at the 77th World Health Assembly. The director said of Mottley, “Her tireless efforts for climate action help protect the health of all peoples, now and in the future.”
Primary health care prevents child deaths
The implementation of primary health care over the last two decades has prevented more than 300,000 child deaths in four countries, according to a study published in The Lancet Global Health. The evaluation by Barcelona Institute for Global Health focused on Brazil, Colombia, Ecuador, and Mexico from 2000 to 2019.
Insight into malaria drug resistance
Malaria led to 608,000 deaths in 2022. A study from SMART (Singapore-MIT Alliance for Research and Technology), published in Nature Microbiology, found that a cellular process called transfer ribonucleic acid modification—where cells alter RNA molecules in response to drug-induced stress—influences a parasite’s ability to develop drug resistance. The findings could help researchers develop new drugs.
WHO updates priority pathogens
The WHO’s Bacterial Priority Pathogens List (BPPL) 2024, released in May, saw the removal of five pathogen-antibiotic combinations that were included in BPPL 2017, and the addition of four new combinations. Third-generation cephalosporin-resistant Enterobacterales are listed as a standalone item and Carbapenem-resistant Pseudomonas aeruginosa (CRPA) infection was moved from critical to high priority.
Funding to prevent sepsis in newborns
The Center for Vaccine Development and Global Health at University of Maryland School of Medicine received $3.96 million to develop a maternal vaccine that prevents sepsis in newborns and infants. An estimated 2.5 million neonates die annually of sepsis, with the greatest burden in low- and middle-income countries.
Linking dengue to severe disease
A study in Science Translational Medicine explains how the four dengue subtypes influence the risk of severe infections. The researchers gathered data from 21 years of dengue surveillance from Bangkok, Thailand, and determined which combinations of subtypes pointed to mild or severe forms of dengue, which is transmitted by infected mosquitoes.
Writer/editor: Mariah Felipe Mariah.Felipe@nih.gov
Writer/editor: Susan Scutti Susan.Scutti@nih.gov
Digital analyst: Merrijoy Vicente Merrijoy.Vicente@nih.gov
Designer: Carla Conway
In rare cases when a correction is needed after an issue’s printed version has been finalized, the change will be made and explained in the online version of the article.
All text produced in Global Health Matters is in the public domain and may be reprinted. Please credit Fogarty International Center. Images must be cleared for use with the individual source, as indicated.
Jul 15, 2024
Aug 6, 2024
go.nih.gov/Fogarty-GID
Aug 22, 2024
go.nih.gov/HIV-ResearchTraining
Get ready for NIH grant process updates coming in 2025
Next year brings big changes to the National Institutes of Health (NIH) grants process. Brief summaries of these changes are below. For a full list visit: go.nih.gov/Grants2025
Changes for applications due on or after January 25, 2025
Simplified peer review: The updated framework focuses on scientific merit and reducing reputational bias in grant evaluation. It affects most competing research project grant applications.
Fellowship updates: Both the review criteria for fellowship applications and the PHS Fellowship Supplemental Form are being updated.
Training program form updates: The PHS 398 Research Training Program Plan Form and the Training Tables are being modified.
Updated instructions for reference letters: NIH is updating the instructions for reference letters to provide more structure to their content.
Transition to FORMS-I: New forms will help implement the policy updates outlined here and align form instructions and field labels with revised terminology.
Changes taking effect in May 2025
Common forms for biosketch and support: NIH is adopting Federal Common Forms for biographical sketch and current and pending support.
Extreme heat and your health
Rising temperatures, high humidity, and poor air quality combined can impede one’s ability to regulate and cool internal body temperature, which can result in illness or death Stay cool, stay hydrated, and know the symptoms of heat-related illness. Visit the Centers for Disease Control and Prevention (CDC) at Preventing Heat-Related Illness | Extreme Heat | CDC and the Division of Public Health. Use the following tips from the CDC and the National Oceanic and Atmospheric Administration to stay comfortable and safe.
When outside:
• Wear light, loose, and breathable clothing.
• Remain in the shade as much as possible, taking frequent breaks from the sun and heat.
• Take advantage of early morning and early evening hours for yard work or outdoor activit ies
• In extreme heat, a car can quickly become deadly even with windows cracked. Never leave children, pets, or anyone in the car during heat warnings.
When indoors:
• Use fans, but only if indoor temperatures are less than 90 degrees F. In temperatures are above 90 degrees F, a fan can increase body temperature.
• Use air conditioning or go to a cooler location such as a mall, library, pool, or cooling center during the hottest hours of the day
Stay Hydrated
• Carry a water bottle, drink often, and refill often.
• Limit high-sugar sodas, alcoholic drinks, and heavy meals.
• Check urine color for dehydration. It is light yellow or clear when you are drinking enough water. Know the Symptoms
• Muscle cramping
• Unusually heavy sweating
• Shortness of breath
• Rapid heart rate
• Dizziness
• Headaches
• Weakness
• Nausea.
If any of these symptoms occur, immediately stop activity, seek a cooler place indoors, and call 911 if symptoms do not subside. Learn more at Symptoms of Heat-Related Illnesses | Extreme Heat | CDC
Some groups are at risk for heat illness
During periods of extreme heat, be sure to check on neighbors, those you support, and pets. Anyone can suffer a heat-related illness, but those with medical conditions, those with access and functional needs, and those who are outdoors are at greater risk. On hot days, the CDC advises the following groups to take additional actions:
• People, especially children, with asthma and other respiratory conditions
• People with heart disease and overweight people
• Pregnant women
• People 65 years of age or older
• People who work or exercise in the heat
• Infants and young children
To stay safe and healthy this summer season, those at greater risk of heat-related illness should develop a Heat Action Plan with their health care provider Visit https://www.cdc.gov/heathealth/media/pdfs/Heat-and-Health-GuidanceInfographic-508.pdf
A new Heat and Health Index (HHI) provides heatrelated illness data and heat health risk by ZIP Code. It is the latest step by the Biden-Harris Administration to help communities prepare for extreme heat and prevent heat-related illness. HHI was developed by CDC, the Agency for Toxic Substances and Disease Registry, and the Office of Climate Change and Health Equity, all within the U.S. Department of Health and Human Services. Find HHI at Heat & Health Tracker | Tracking | NCEH | CDC
Getty Images
Breathe safely on hot days
The heat can worsen air quality and impact health through increased exposure to ozone, fine particulate matter, and chemicals According to the Centers for Disease Control and Prevention (CDC), breathing polluted air can increase the risk of heart attacks, strokes, arrhythmias, and worsen heart failure.
Breathing high concentrations of fine particulate matter can trigger cardiac events, which can lead to death.
The CDC advises to prevent heat-related illness by:
• Every day, check the Air Quality Index (AQI) from the U.S. Environmental Protection Agency; or Delawareans can visit the Delaware Department of Natural Resources and Environmental Control at https://dnrec.delaware.gov/air/quality/forecast/ Also check the CDC’s HeatRisk Dashboard daily.
• When the AQI is less than 100, most people can be active outside. Those sensitive to air pollution when the AQI is 51 to 100 should talk with their health care provider. When the AQI exceeds 100, outdoor air is unhealthy, and individuals should limit outdoor activity, take more breaks, and do less intense activities.
• Use a portable air purifier if you have heart problems or are sensitive to poor air quality
• Stay cool and stay hydrated. Drink water to help the body function normally and limit sugary, caffeinated, and alcoholic beverages. Signs of dehydration are muscle cramps; dizziness or feeling lightheaded, rapid heart rate, thirst, darker color urine, and infrequent urination.
To keep indoor air clean at any time of year, use a portable air purifier and:
• Reduce indoor pollutants such as cigarette smoke, candles, and air fresheners
• Bring outdoor air in when cooking (when AQI is less than 100), such as briefly opening a window
• On heating, ventilation, and air conditioning systems, use a replaceable High Efficiency
Particulate Air filter with a Minimum Efficiency
Reporting Value of 13 or higher.
For more healthy indoor air tips, visit the Division of Public Health’s Healthy Homes Program
Minimize wildfire smoke impacts
In the summer of 2023, smoke from wildfires in Canada greatly diminished the air quality in Delaware and other states.
Inhaling smoke or fine particulate matter (PM 2.5) can worsen breathing conditions such as asthma, emphysema, bronchitis, and chronic obstructive pulmonary disease (COPD); and it can cause heart failure, heart attack, and stroke, according to the Division of Public Health (DPH).
DPH and the Delaware Department of Natural Resources and Environmental Control (DNREC) advise the public to avoid outdoor smoke by staying indoors in a cool and clean environment, and for individuals working outdoors to wear properly fitted N95 or KN95 masks (not cloth or surgical masks). The Centers for Disease Control and Prevention suggest closing off a room from outside air and setting up a portable air cleaner or a filter to keep that air clean.
For Delaware air quality news, visit https://dnrec.delaware.gov/air/quality/forecast/ To learn where current fires are burning, visit AirNow’s Fire & Smoke map at the Environmental Protection Agency’s website, https://www.airnow.gov/wildfires/ That site also provides information on how to be smoke ready It may be necessary during a smoke emergency to create a room with clean air. For instructions and a video, visit this EPA site: https://www.epa.gov/indoor-air-qualityiaq/create-clean-room-protect-indoor-airquality-during-wildfire
Getty Images
DPH to launch Health Equity Institute of Delaware (HEIDE)
on July 18
The Division of Public Health (DPH) invites Delawareans to participate in the launch of the Health Equity Institute of Delaware (HEIDE). The virtual event will be held on July 18 from 10:30 a.m. to 12:00 p.m. and from 6:00 p.m. to 7:00 p.m.
HEIDE is an initiative of the DPH Office of the Medical Director, Awele Maduka-Ezeh, MD, MPH, PhD, CCHP and the Office of the Chief Health Equity Officer and DPH Deputy Director, Tesha Quail, PhD, LPCMH, NCC. Through HEIDE, Drs. Maduka-Ezeh and Quail aim to train clinicians and public health professionals to approach the work throughout their careers through a health equity framework.
Georges Benjamin, MD, President of the American Public Health Association is the keynote speaker during the morning session. The one-hour evening lecture, “Maternal Substance Use Disorder –Challenges in Care and Access,” will be given by Hendrée Jones, PhD of the University of North Carolina and Special Expert, R3, Substance Abuse and Mental Health Services Administration
Both sessions are free and open to the public. To participate in the morning session, visit https://tinyurl.com/2syaa66t
Registration is required for the evening session at https://tinyurl.com/mr2pt7dy. The Medical Society of Delaware offers continuing educational credits for the evening session.
The Division of Public Health’s Cancer Prevention and Control Bureau volunteered at the Food Bank of Delaware’s Mass Food Distribution event held on June 18 at Dover Speedway. Pictured left to right are Jade Nagyiski, Administrative Specialist II; Bryan Mena, Administrative Specialist I ; and Nikita Clark, Public Health Treatment Program Administrator, Screening for Life Program. Photo by Alyssa Imprescia
2024 Burden of Chronic Disease Report available
The Division of Public Health’s (DPH) Health Promotion and Disease Prevention Section has released The Burden of Chronic Disease in Delaware 2024 report. The report compares Delaware and the United States in mortality, prevalence, and incidence of heart disease, stroke, vascular disease, cancer, chronic lower respiratory disease, and diabetes. It shares data around related risk factors such as physical activity, nutrition, and obesity, tobacco and e-cigarette use, excessive alcohol use, and adolescent health. Important racial inequities related to chronic disease and related risk factors in Delaware are also included
According to the report, tens of thousands of Delawareans live with a chronic disease and 10% of residents have multiple chronic conditions that cost Delaware billions of dollars each year in healthrelated expenses. Recommendations detail how Delaware can further chronic disease prevention and management efforts to improve the health and wellbeing of residents statewide.
“This report highlights the progress that Delaware has made in addressing chronic disease, while also emphasizing the work that still needs to be done,” said DPH Director Steven Blessing. “DPH is committed to addressing health inequities and enhancing our initiatives for chronic disease prevention and management.”
Examples of Delaware’s progress in reducing the impact of the leading chronic diseases are:
• The five-year age-adjusted mortality rate from heart disease (as a broader group) decreased in Delaware and decreased nationally between the periods 2006 to 2010 and 2016 to 2020.
• From 2016 to 2020, Delaware had a lower hypertension mortality rate compared to the U.S.
• The mortality rate of chronic lower respiratory disease in Delaware declined between the periods 2006 to 2010 and 2016 to 2020.
To view the full report, visit https://dhss.delaware.gov/dph/dpc/files/BurdenOfChr onicDiseaseInDelaware2024Final.pdf
The Advancing Healthy Lifestyles Conference featured the Overcomers Panel: Being Your Best Self. From left: Darrell McDonald, ability advocate, EPIC Abilities; Vilicia Cade, EdD, Superintendent, Capital School District; Jessica Smith Moyer, owner, Ice House Wellness and Community; and moderator Tanya Haley, MS, CHES, CHWC, AE-C of the American Lung Association. Photo by Alyssa Imprescia
Advancing Healthy Lifestyles event
With the Advancing Healthy Lifestyles Coalition, the Division of Public Health (DPH) Physical Activity, Nutrition, and Obesity Prevention (PANO) Program sponsored and organized the second annual Advancing Healthy Lifestyles Conference event on June 6 at Delaware State University (DSU) in Dover.
Roughly 300 attendees learned best practices to improve health, well-being, and quality of life by improving health equity. Six-time Olympic champion Jackie Joyner-Kersee gave keynote remarks.
According to the Behavioral Risk Factor Surveillance System (BRFSS), among Delaware adults in 2022, 71.8% were obese or overweight, 23.5% were not physically active, 20.5% did not consume vegetables, and 39.7% did not consume fruit. America’s Health Rankings 2023 Annual Report shows that 11.5% of Delawareans cannot provide adequate food for household members.
The conference was co-sponsored by DSU, Delaware Public Health Association’s Delaware Academy of Medicine, Delaware First Health, Alpha Kappa Alpha Sorority, Inc. Delaware chapters Zeta Omega, Epsilon Iota Omega, Sigma Zeta Omega, Alpha Alpha Mu Omega, and Alpha Alpha Tau Omega; Delaware Highmark Blue Cross Blue Shield, Bayhealth, ChristianaCare, the YMCA of Delaware, and AmeriHealth Caritas of Delaware.
For more information, visit PANO at HealthyDelaware.org/AdvancingHealthyLifestyles.
Kissing bugs give no love
When two New Castle County, Del. residents each had a large, unusual bite mark and heart palpitations and a Halloween-themed insect was found indoors, they contacted the Division of Public Health (DPH) and the University of Delaware (UD)
J.K. Peterson of UD Department of Entomology and Wildlife Ecology identified the specimen as Triatoma sanguisuga, also known as the Eastern bloodsucking conenose The 2023 detection led to a case report published in The American Journal of Tropical Medicine and Hygiene, Vol. 110, Issue 5 (May 2024).
Although T. sanguisuga is found in the mid-Atlantic and southeastern states, little is known of its local ecology or epidemiology in Delaware. The 23millimeter insect has an orange and black striped border on the back of its abdomen They often bite the face of sleeping people at night, earning the nickname “kissing bugs ”
Triatomine insects can carry the parasite Trypanosoma cruzi, which can cause Chagas disease When people scratch or rub the bite area, they can accidentally rub triatomine bug feces in the wound and become infected. Infection can also occur during pregnancy and when food or drink is contaminated with infected triatomine bug feces. Prevent triatomine bugs from entering structures by having window and door screens with no holes, and filling cracks and crevices through which they enter.
Chagas disease has two phases. Acute Chagas disease occurs after infection and lasts for a few weeks or months and may result in mild flu-like symptoms or swelling around the bite, though most people show no symptoms during that phase. Untreated infected people enter the chronic phase, where 20% to 30% will develop health problems years to decades later. Chronic symptoms include arrythmias, heart failure, megacolon, megaesophagus, and sudden death.
For more information about Chagas disease, read DPH’s fact sheet: https://www.dhss.delaware.gov/dhss/dph/files/Chagas Disease_FAQ_PUB_ENG_1123_.pdf. Clinicians can take a free continuing education course through September 2, 2026 at https://www.cdc.gov/chagas/hcp/chagasdisease/index.html
CDC photo
CANCER INCIDENCE AND MORTALITY IN DELAWARE, 2016-2020
DELAWARE DEPARTMENT OF HEALTH AND SOCIAL SERVICES
DIVISION OF PUBLIC HEALTH 2023
This report is made possible with funding from the Delaware Health Fund, with strategic leadership and guidance provided by the Delaware Cancer Consortium.
This report was prepared by the Delaware Department of Health and Social Services, Division of Public Health, Comprehensive Cancer Control Program.
For more information, contact: Delaware Comprehensive Cancer Program Division of Public Health
Thomas Collins Building, Suite 11 540 S. DuPont Highway Dover, DE 19901
This report presents the 2016-2020 cancer incidence and mortality data and statistics for Delaware. The Delaware Department of Health and Social Services (DHSS), Division of Public Health (DPH), in conjunction with the Delaware Cancer Consortium (DCC), publishes this report as a source of cancer incidence and mortality information. DPH and other stakeholders also use this report to inform decisions on outreach and program strategies to combat cancer incidence and mortality in Delaware.
Cancer incidence (the number of new cancer cases in a population over a time period)1 and mortality (the number of deaths from cancer in a population over a time period)2 rates, and other analyses are performed by the Delaware Bureau of Cancer Prevention and Control sta ff. Incidence data are obtained from the Delaware Cancer Registry (DCR) and mortality data are obtained from the Delaware Health Statistics Center.
This report includes cancer statistics for all cancer sites combined (all -site cancer), as well as the top 23 sitespecific cancer types: brain and other nervous system, cervix, colorectal, esophagus, female breast, Hodgkin lymphoma, kidney and renal pelvis, larynx, leukemia, liver and intrahepatic bile duct, lung and bronchus, melanoma, myeloma, non-Hodgkin lymphoma, ovary, oral cavity and pharynx, pancreas, prostate, stomach, testis, thyroid, uterine, and urinary bladder. These cancer statistics reflect incidence and mortality data for 2016-2020. DPH compares Delaware’s cancer incidence and mortality statistics for 2016 -2020 to those of the U.S. over the same period. DPH also summarizes how Delaware and U.S. cancer rates have changed from 2006 to 2020.
The COVID-19 pandemic resulted in delays and reductions in cancer screening and diagnosis, which subsequently lead to a decline in 2020 incidence counts and rates that was considered an anomaly. Inclusion of 2020 rates would bias the estimates of trends over time, and therefore, 2020 rate s were not included in trend analysis.3
Between 2006 and 2019, incidence rates for all-site cancer decreased by an average of 1.1% per year in Delaware and an average of 0.6% per year in the U.S. While progress continues to be made, Delaware’s 20162020 all-site cancer incidence rate (457 6 per 100,000 population) remains significantly higher than the comparable U.S. rate (442 2 per 100,000 population). Delaware currently ranks 20th among the states for highest all-site cancer incidence. Between 2006 and 2019, incidence rates for all-site cancer decreased an average of 1.9% per year among non-Hispanic White males and remained stable for non-Hispanic White females. During that same period, incidence rates for all-site cancer decreased an average of 2.1% per year among non-Hispanic Black males and decreased an average of 1.1% per year among non-Hispanic Black females. Between 2006 and 2020, the trend in incidence rates for all-site cancer was stable among both Hispanic males and Hispanic females.
Of the 23 site-specific cancers analyzed, Delaware had a significantly higher age-adjusted incidence rate for lung and bronchus, melanoma, urinary bladder, and thyroid cancers compared to the U.S. during 2016-2020. Delaware had a significantly lower age-adjusted leukemia incidence rate compared to the U.S during the same time period. Delaware males had a significantly higher age-adjusted incidence rate for melanoma, prostate, and urinary bladder compared to U.S. males during 2016 -2020. Delaware females had a significantly higher age-adjusted incidence rate for lung and bronchus, melanoma, female breast, and thyroid cancer compared to U.S. females during 2016-2020. Delaware females had a significantly lower age-adjusted leukemia incidence
3 National Cancer Institute, Surveillance, Epidemiology, and End Results Program: Impact of COVID on 2020 SEER Cancer Incidence Data, https://seer.cancer.gov/data/covidimpact.html
Delaware Department of Health and Social Services, Division of Public Health 3 Cancer Incidence and Mortality in Delaware, 2016-2020
October 2023
rate compared to U.S. females during this time period. Among the 17 non-sex specific cancers, Delaware males had higher age-adjusted incidence rates for 13 non-sex specific cancers compared to Delaware females during 2016-2020. Of the 17 non-sex specific cancers, only thyroid cancer was significantly higher among Delaware females compared to Delaware males during 2016 -2020.
Delaware’s 2016-2020 all-site cancer mortality rate of 156.8 per 100,00 0 population was significantly higher than the U.S. rate of 149.4 per 100,000 population. This difference in all -site cancer mortality rates was statistically significant. Although Delaware’s all-site cancer mortality rate has historically been higher t han the U.S. rate, the gap has narrowed over the last decade as the state continues to make strides in reducing the cancer mortality rate through cancer screening and early detection. Delaware’s current ranking of 15th among the states for highest all-site cancer mortality is the same ranking as in the 2022 report, which examined the 2015-2019 time period. Though the ranking has increased since the 2011 -2015 period when Delaware ranked 18th, it still represents considerable continued progress since the 1990s, when the state ranked second. In the 15-year period between 2006 and 2020, mortality rates for all-site cancer decreased an average of 1.8% per year in Delaware and decreased an average of 1.7% per year in the U.S The decrease was consistent in Delaware over this time period, but the mortality rates in the U.S. had a greater average decrease of 2.0% between 2015 and 2020 compared to between 2006 and 2015 (1.5%).
Between 2006 and 2020, mortality rates for all-site cancer decreased by an average of 1.7% per year among non-Hispanic White males and decreased by an average of 1.9% per year among non-Hispanic White females. Between 2006 and 2020, mortality rates for all-site cancer decreased by an average of 2.1% per year among non-Hispanic Black males and remained stable for non-Hispanic Black females. Between 2006 and 2020, the trend in mortality rates for all-site cancer was stable among both Hispanic males and Hispanic females in Delaware.
Of the 23 site-specific cancers, Delaware had significantly higher age-adjusted mortality rates for pancreas, larynx, lung and bronchus, urinary bladder, and myeloma compared to the U.S from 2016 -2020. Delaware males had a significantly higher age-adjusted mortality rates for lung, and bronchus, and urinary bladder cancers compared to U.S. males during the same time period. Delaware females had significantly higher ageadjusted mortality rates for lung and bronchus cancers compared to U.S. females during the same period. Among the 17 non-sex-specific cancers, Delaware males had higher age-adjusted mortality rates for 14 nonsex-specific specific cancers compared to Delaware females. Among the 17 non-sex-specific specific cancers, Delaware females did not have a significantly higher age-adjusted mortality rate compared to Delaware males.
CHAPTER 1: I NTRODUCTION
DELAWARE CANCER REGISTRY
The Delaware Cancer Registry (DCR) is managed by the Delaware Department of Health and Social Services (DHSS), Division of Public Health (DPH) and serves as the state’s central cancer information center. The DCR was founded in 1972 and was legally established in 1980 under the Delaware Cancer Control Act4. The Act stipulated that all state hospitals, clinical laboratories, and cancer treatment centers report all new cancer cases to the DCR. In 1996, the Delaware Cancer Control Act was amended to require any health care practitioner who diagnoses or provides treatment to report cancer cases to the DCR. Further enhancements of the Delaware Cancer Control Act took effect in 2002 with the passage of Sen ate Bill 372 that which requires physicians to provide additional information to the DCR, including patients’ duration of residence in Delaware and their occupational history. Senate Bill 372 also extended the reporting deadline to 180 days from initial diagnosis or treatment.
Today, Delaware is one of 46 states whose central cancer registry is supported by the National Program of Cancer Registries (NPCR) of the U.S. Centers for Disease Control and Prevention (CDC).5 The DCR ensures accurate, timely, and routine surveillance of cancer trends among Delawareans.
REPORTING FACILITIES
Seven Delaware hospitals currently report cancer cases to the DCR. Non-hospital offices that submit data to the DCR include 15 diagnostic laboratories, 12 freestanding ambulatory surgery centers, and at least 20 physicians Additionally, the DCR has reciprocal data exchange agreements with Alaska, Alabama, Arkansas, California, Colorado, Connecticut, Florida, Georgia, Hawaii, Idaho, Illinois, Indiana, Louisiana, Maine, Maryland, Massachusetts, Michigan, Montana, Nebraska, Nevada, New Jersey, New York, North Carolina, Ohio, Oklahoma, Pennsylvania, Puerto Rico, Rhode Island, South Carolina, Tennessee, Texas, Utah, Virginia, Washington, Wisconsin, Wyoming, West Virginia, and the District of Columbia. Interstate data exchange agreements assist in identifying Delaware residents whose cancer was diagnosed and/or treated in another state.
DATA CONFIDENTIALITY
The DCR maintains patient confidentiality using a combination of techniques. Reporting facilities submit cancer data using computerized data encryption techniques. Published reports are limited to aggregate data, and requests for data releases are all reviewed by the Delaware Division of Public Health Privacy Board and need to be approved before release. Researchers who use DCR data must comply with regulations stated in DPH data use agreements and in some cases, obtain clearance from Delaware’s Human Subjects Review Board.
DATA QUALITY
The DCR implements internal quality control procedures to verify the consistency of cancer data continually throughout the year as data is submitted by reporting facilities. In addition, the DCR strives to meet data consistency standards set by the North American Association of Central Cancer Registries (NAACCR). Data is submitted by DCR to NAACCR annually The DCR also conducts record consolidation using a computerized matching program to identify multiple reports on the same individual. This scenario often arises when a patient is diagnosed and treated in two or more facilities , and each facility submits a cancer case reporting form to the DCR.
In 1997, the NAACCR instituted a program to independently and annually review data from member registries for their completeness, accuracy, and timeliness. The registry certification metrics are pre-determined and established by NAACCR6. Gold or Silver Standard certifications are awarded following an evaluation of data quality, completeness, and timeliness of reporting. The DCR received Gold Standard cert ification for diagnosis in 1999, 2003, 2004, 2005, 2006, 2007, 2008, 2009, 2010, 2011, 2012, 2013, 2014 , 2015, 2016, 2017, 2018, 2019, and 2020 (the most recent year for which complete data are currently available). The DCR received Silver Standard certification in 1998 and 2002.
Additionally, the NPCR provides an annual Standard Status Report to state cancer registries supported by the CDC. Delaware’s data submissions for diagnosis years 2000 through 2020 surpassed all standard levels for quality, completeness, and timeliness.
USES OF DATA
DPH uses DCR data to support various programs and initiatives, including the Screening for Life (SFL) program and the Delaware Cancer Treatment Program. DPH also uses DCR data to investigate citizen inquiries and provide up-to-date cancer statistics to Delaware residents, hospitals, health care providers, community organizations, federal agencies, research institutions, and academic institutions. Committees associated with the Delaware Cancer Consortium (DCC) utilize DCR data to monitor cancer trends across the state, promote research, and guide policy planning.
COVID-19 IMPACT ON CANCER INCIDENCE
The November 2022 SEER data submission includes new cancer cases diagnosed in 2020, the first yea r of the Coronavirus 2019 (COVID-19) pandemic. The pandemic resulted in delays and reductions in cancer screening and diagnosis, which subsequently led to a decline in 2020 incidence counts and rates that was considered a temporary, anomalous year. Inclusion of 2020 rates would bias the estimates of trends over time, and therefore, 2020 rates were not included in trend analysis.7
Caution should be taken when making comparisons of cancer incidence data that include 2020 with other time periods, as decreases in incidence counts and rates may primarily be due to the effects of COVID -19 rather than decreases due to cancer control efforts.
6 https://www.naaccr.org/certification-criteria/
7 National Cancer Institute, Surveillance, Epidemiology, and End Results Program: Impact of COVID on 2020 SEER Ca ncer Incidence Data, https://seer.cancer.gov/data/covid-impact.html
Delaware Department of Health and Social Services, Division of Public Health
7 Cancer Incidence and Mortality in Delaware, 2016-2020
October 2023
ORGANIZATION OF THIS REPORT
This report includes cancer statistics for all cancer sites combined (all -site cancer) and the top 23 site-specific cancers Cancer statistics reflect incidence and mortality data for 2016-2020. Delaware’s cancer incidence and mortality statistics for 2016-2020 are compared to the U.S. over the same time period. Changes in Delaware and U.S. cancer incidence and mortality rates are shown from 2006 through 2020 using Joinpoint trend analysis While 2020 is included in the graphs, data is not included since this year would bias estimates of trends over time. In addition to incidence and mortality, age-specific statistics are presented. In many cases, these statistics are also often calculated separately by sex, race, county of residence, and age group.
Data regarding cancer screening recommendations and compliance are presented in Appendix D. Behavioral risk factor data relevant to adult Delawareans are presented in Appendix E.
Delaware’s 2016-2020 cancer incidence and mortality rankings among all 50 U.S. states are provided for each cancer site included in the report. State rankings for cancer incidence and mortality were obtained from the U.S. Cancer Statistics Working Group8
DELAWARE’S POPULATION
In 2016-2020, census data estimated Delaware’s total average population at 967,679. Approximately 58% of Delawareans reside in New Castle County. Kent and Sussex counties are home to 18.5% and 23.8% of Delawareans, respectively (Figure 2-1).
Source: U.S. Census Bureau, 2016-2020 American Community Survey 5-Year Estimates, https://data.census.gov/
Since 2000, population growth rates have varied across Delaware counties (Figure 2-2) New Castle County is Delaware’s most populated county. New Castle County experienced the smallest population growth from 2010 to 2020, while Sussex County experienced the largest population growth from 2010 to 2020.
8 U.S. Cancer Statistics Working Group. U.S. Cancer Statistics Data Visualizations Tool, based on 2021 submission data (1999 -2019): U.S. Department of Health and Human Services, Centers for Disease Control and Prevention and National Cancer Institute; www.cdc.gov/cancer/dataviz, released in June 2022.
Delaware Department of Health and Social Services, Division of Public Health 8 Cancer Incidence and Mortality in Delaware, 2016-2020 October 2023
FIGURE 1 - 1 : PERCENTAGE OF POPULATION BY COUNTY , DELAWARE, 201 6 - 20 20
FIGURE 1 - 2 : PERCENTAGE OF POPULATION GROWTH BY COUNTY AND DECADE, DELAWARE, 200 0 - 2010 AND 2010 - 2020
Source: U.S. Census Bureau 2020, https://data.census.gov/
Census data from 2016-2020 show that the majority of Delawareans are non-Hispanic White, followed by nonHispanic Black, then Hispanic. Four percent of Delawareans are considered “other” race, which is defined as: (a) any other race group that was too small to enumerate separately; (b) unknown race; or (c) mixed race (i.e., two or more races).
TABLE 1 - 1 : PERCENTAGE OF POPULATION BY RACE/ETHNICITY AND COUNTY, DELAWARE, 2016 - 2020
Race/Ethnicity
Source: U.S. Census Bureau, 2016-2020 American Community Survey 5-Year Estimates, https://data.census.gov/
Since 2010, racial diversity has expanded at different rates across Delaware’s counties. Both Kent and New Castle counties experienced increases in the proportion of non-Hispanic Black and Hispanic residents (and concurrent decreases in the proportion of non-Hispanic White residents) from 2010 to 2020 (Figure 2-3). A different trend was observed in Sussex County, where the non-Hispanic Black population decreased from 2010 to 2020. However, similar to the trends in the other counties, the non-Hispanic White population declined while the Hispanic population increased
FIGURE 1 - 3 : PERCENTAGE OF RESIDENTS BY RACE/ETHNICITY, DELAWARE AND COUNTIES, 2010 AND 2020
Source: U.S. Census Bureau 2020, https://data.census.gov/
Delaware Department of Health and Social Services, Division of Public Health
Cancer Incidence and Mortality in Delaware, 2016-2020 October 2023
GUIDELINES FOR INTERPRETATION OF INCIDENCE AND MORTALITY RATES
Incidence and mortality rates for Delaware are expressed per 100,000 Delawareans and rates for the U.S. are expressed per 100,000 U.S. residents. Due to Delaware’s small population base, cancer rates were calculated using five-year calendar year groupings for both cancer incidence and mortality.
Cancer incidence and mortality rates were adjusted by age to enable comparisons between populations that may have different age distributions (e.g., Delaware vs. the U.S.). Thus, age-adjusted cancer rates can be compared without any concern about how differences in age distribution of the populations would affect cancer rates. The standard population used to adjust for age is the 2000 U.S. population.
Ninety-five percent confidence intervals were computed for each cancer rate. Confidence intervals represent the range of values in which the cancer rate could reasonably fall 95 % of the time. They are used to determine whether the amount by which two cancer rates differ is statistically significant. If the confidence interval for one rate does not overlap with the confidence interval for another rate, the two rates are significantly different, upon exploratory analysis When one rate is significantly different from another rate, it is assumed the difference between the rates is larger than would be expected by chance alone, meaning it is statistically significant If the confidence interval for one rate ove rlaps with the confidence interval for another rate, the two rates are not statistically significantly different , commonly referred to as “no meaningful difference” between rates. However, because confidence rates are based on the number cases, rates base d on fewer cases will have a wider confidence interval. Likewise, rates based on many cases will have a narrower confidence interval. Confidence intervals are subject to both Type I and Type II errors. Therefore, in this report rates between two or more populations with confidence intervals that do not overlap have an incidence rate ratio calculated. If both the confidence interval method and the incidence rate ratio prove to be statistically significant at the p <0.05 level, these differences are determined to be confirmed and written as such in the body of the document.
For this report, cancer frequencies and rates were suppressed according to the CDC’s United States Cancer Statistics Suppression of Rates9 and:
• Incidence and mortality frequencies of fewer than 16 were not shown to protect patient privacy and confidentiality. In some instances, additional cells were suppressed so that one cannot deduce the actual count in the initially suppressed cell. Suppressing incidence and mortality statistics based on a small number of cancer cases or deaths helps protect patient privacy and confidentiality . 10,11
• Age-adjusted incidence and mortality rates based on fewer than 16 cases or deaths were suppressed as they are inherently unstable and cannot be reliably interpreted.
9 Centers for Disease Control and Prevention. (2023, June 8). Statistical methods: Suppression of rates and counts . United States Cancer Statistics (USCS). Retrieved August 23, 2023, from https://www.cdc.gov/cancer/uscs/technical_notes/stat_methods/suppression.htm
10 Coughlin SS, Clutter GG, Hutton M. Ethics in Cancer Registries. Journal of Cancer Registry Management, 2: 5-10, 1999.
11 McLaughlin CC. Confidentiality protection in publicly released central registry data. Journal of Cancer Registry Management, 2: 84-88, 2002.
CHAPTER 2: ALL - SITE CANCER
INCIDENCE
For 2016-2020, Delaware ranked 21st in the U.S. for all-site cancer incidence (13th in 20152019); males ranked 18th (11th in 2015-2019) and females ranked 24th (13th in 2015-2019)12.
2016-2020 DATA
TABLE 2 - 1 : NUMBER OF ALL - SITE CANCER CASES, BY SEX AND RACE/ETHNICITY ; DELAWARE AND COUNTIES, 201 6 - 20 20
Source: Delaware Department of Health and Social Services, Division of Public Health, Delaware Cancer Registry, 2023.
Note: ‘All Races’ includes Non-Hispanic White, Non-Hispanic Black, and Hispanic which are shown in the table, as well as other racial/ethnic groups that are not included in the table (e.g., non-Hispanic Asian and Pacific Islander, non-Hispanic American Indian/Alaska Native, unknown race/ethnicity, and other non-specified race).
• In Delaware in 2016-2020:
o There were 29,805 new all-site cancer cases diagnosed, an average of 5,961 per year.
o Males accounted for 51% of all-site cancer cases.
o Non-Hispanic Whites accounted for 77% of all-site cancer cases.
TABLE 2 - 2 : FIVE - YEAR AVERAGE AGE -
Source (Delaware): Delaware Department of Health and Social Services, Division of Public Health, Delaware Cancer Registry, 2023
Source (U.S.): National Program of Cancer Registries and Surveillance, Epidemiology, and End Results Program SEER*Stat Database: U.S. Cancer Statistics 2001–2020 Public Use Research Database, 2022 submission Rates are per 100,000 of population age-adjusted to the 2000 U.S. standard population
12 U.S. Cancer Statistics Working Group. U.S. Cancer Statistics Data Visualizations Tool, based on November 202 2 submission data (1999-2020): U.S. Department of Health and Human Services, Centers for Disease Control and Prevention and National Cancer Institute; www.cdc.gov/cancer/dataviz, June 2023
Delaware Department of Health and Social Services, Division of Public Health 12 Cancer Incidence and Mortality in Delaware, 2016-2020 October 2023
Source (Delaware): Delaware Department of Health and Social Services, Division of Public Health, Delaware Cancer Registry, 2023 Source (U.S.): National Program of Cancer Registries and Surveillance, Epidemiology, and End Results Program SEER*Stat Database: U.S. Cancer Statistics 2001–2020 Public Use Research Database, 2022 submission
Rates are per 100,000 of population age-adjusted to the 2000 U.S. standard population and are calculated using modified U.S. Census populations available from NCI (https://seer.cancer.gov/popdata/)
• In Delaware from 2016-2020:
o Males (500.1 per 100,000 population) had a statistically significantly higher all-site cancer incidence rate compared to females (426.9 per 100,000 population).
o The difference in all-site cancer incidence rates between non-Hispanic Whites (470.3 per 100,000 population) and non-Hispanic Blacks (432.1 per 100,000 population) was statistically significant.
o Hispanics (360.7 per 100,000 population) had a statistically significantly lower all-site cancer incidence rate compared to both non-Hispanic Whites (470.3 per 100,000 population) and non-Hispanic Blacks (432.1 per 100,000 population).
• Comparing Delaware and the U.S. from 2016-2020:
o Delaware (457.6 per 100,000 population) had a statistically significantly higher all-site cancer incidence rate compared to the U.S. (442.2 per 100,000 population).
o Delaware males (500.1 per 100,000 population) had a statistically significantly higher all-site cancer incidence rate compared to U.S. males (48 0.4 per 100,000 population).
o Delaware females (426.9 per 100,000 population) had a statistically significantly higher all-site cancer incidence rate compared to U.S. females (4 16.4 per 100,000 population).
o Non-Hispanic Whites in Delaware (470.3 per 100,000 population) had a statistically significantly higher all-site cancer incidence rate compared to non-Hispanic Whites in the U.S. (461 7 per 100,000 population).
Delaware Department of Health and Social Services, Division of Public Health 13 Cancer Incidence and Mortality in Delaware, 2016-2020 October 2023
o The difference in all-site cancer incidence rates between non-Hispanic Blacks in Delaware (432.1 per 100,000 population) and non-Hispanic Blacks in the U.S. (444.9 per 100,000 population) was not statistically significant.
o The difference in all-site cancer incidence rates between Hispanics in Delaware (360.7 per 100,000 population) and Hispanics in the U.S. (339.2 per 100,000) was not statistically significant.
Incidence and Mortality in Delaware, 2016-2020
TRENDS
FIGURE 2 - 2 : AGE - ADJUSTED ALL - SITE CANCER INCIDENCE RATE TREND BY SEX; U.S. AND DELAWARE, 200 6 - 20 20*
Source (Delaware): Delaware Department of Health and Social Services, Division of Public Health, Delaware Cancer Registry, 2023. Source (U.S.): National Program of Cancer Registries and Surveillance, Epidemiology, and End Results Program SEER*Stat Database: U.S. Cancer Statistics 2001 –2020 Public Use Research Database, 2022 submission
Rates are per 100,000 of population age-adjusted to the 2000 U.S. standard population and are calculated using modified U.S. Census populations available from NCI (https://seer.cancer.gov/popdata/).
*Incidence rates for year 2020 are plotted but were not used for the analysis of trends since 2020 was an anomaly and would bias estimates
• Comparing age-adjusted all-site cancer incidence rates between the U.S. and Delaware between 2006 and 2019*:
o Incidence rates for all-site cancer decreased an average of 1.1% per year in Delaware and an average of 0.6% per year in the U.S.
o Incidence rates for all-site cancer decreased an average of 2.0% per year among Delaware males and decreased an average of 1.3% per year among U.S. males.
o The trend in incidence rates for all-site cancer was stable among both Delaware females and U.S. females. However, when examining shorter periods across these years, the incidence rates for all -site cancer increased an average of 0.6% per year between 2006 and 2014 and decreased an average of 1.7% per year between 2014 and 2019 among Delaware females.
* The COVID-19 pandemic resulted in delays and reductions in cancer screening and diagnosis, which subsequently lead to a decline in 2020 incidence counts and rates that was considered an anomaly. Inclusion of 2020 rates would bias the estimates of trends over time, and therefore, 2020 rates were not included in trend analysis.
Delaware Department of Health and Social Services, Division of Public Health 15 Cancer Incidence and Mortality in Delaware, 2016-2020 October 2023
FIGURE 2 - 3 : AGE - ADJUSTED ALL - SITE CANCER INCIDENCE RATE TREND BY SEX AND RACE/ETHNICITY ; DELAWARE, 2006 - 2020*
Source: Delaware Department of Health and Social Services, Division of Public Health, Delaware Cancer Registry , 2023 Rates are per 100,000 of population using US Census estimates and age-adjusted to the 2000 U.S. standard population and are calculated using modified U.S. Census populations available from NCI (https://seer.cancer.gov/popdata/).
*Incidence rates for year 2020 are plotted but were not used for the analysis of trends since 2020 was an anomaly and would bias estimates
• Comparing age-adjusted all-site cancer incidence rates by sex and race/ethnicity in Delaware between 2006 and 2019*:
o Incidence rates for all-site cancer decreased an average of 1.9% per year among non-Hispanic White males and remained stable for non-Hispanic White females. However, when examining shorter periods across these years, the incidence rates for all-site cancer increased an average of 0.7% per year between 2006 and 2015 and decreased an average of 2.0% per year between 2015 and 2019 among non-Hispanic White females.
o Incidence rates for all-site cancer decreased an average of 2.1% per year among non-Hispanic Black males and decreased an average of 1.1% per year among non-Hispanic Black females, with the largest decrease occurring between 2016 and 2019 at an average of 5.5% per year.
o The trend in incidence rates for all-site cancer were stable among both Hispanic males and Hispanic females.
* The COVID-19 pandemic resulted in delays and reductions in cancer screening and diagnosis, which subsequently lead to a decline in 2020 incidence counts and rates that was considered an anomaly. Inclusion of 2020 rates would bias the estimates of trends over time, and therefore, 2020 rates were not included in trend analysis.
Delaware Department of Health and Social Services, Division of Public Health
Cancer Incidence and Mortality in Delaware, 2016-2020
FIGURE 2 - 4 : AGE - SPECIFIC ALL - SITE CANCER INCIDENCE RATES BY SEX; DELAWARE, 201 6 - 20 20
Source: Delaware Department of Health and Social Services, Division of Public Health, Delaware Cancer Registry, 2023
Rates are per 100,000 of population age-adjusted to the 2000 U.S. standard population and are calculated using modified U.S. Census populations available from NCI (https://seer.cancer.gov/popdata/).
• In 2016-2020 in Delaware, the all-site cancer incidence rate was highest for males 85 years of age and older and for females between 75 and 84 years of age.
Delaware Department of Health and Social Services, Division of Public Health 17 Cancer Incidence and Mortality in Delaware, 2016-2020
October 2023
- 20 20
Source: Delaware Department of Health and Social Services, Division of Public Health, Delaware Cancer Registry, 2023
Rates are per 100,000 of population age-adjusted to the 2000 U.S. standard population and are calculated using modified U.S. Census populations available from NCI (https://seer.cancer.gov/popdata/).
• Delaware’s 2016-2020 all-site cancer incidence rate was highest for non-Hispanic Whites, non-Hispanic Blacks, and Hispanics between 75 and 84 years of age.
TABLE 2 - 3 : AGE - SPECIFIC ALL - SITE CANCER INCIDENCE RATES BY SEX AND RACE/ETHNICITY ; DELAWARE, 201 6 - 20 20
Source: Delaware Department of Health and Social Services, Division of Public Health, Delaware Cancer Registry , 2023
Rates are per 100,000 of population age-adjusted to the 2000 U.S. standard population and are calculated using modified U.S. Census populations available from NCI (https://seer.cancer.gov/popdata/).
Rates based on less than 16 cases are not shown
• In 2016-2020, the all-site cancer incidence rate was highest for non-Hispanic White and Hispanic males 85 years of age and older and for non-Hispanic Black and Hispanic males between 65 and 74 years of age.
• The 2016-2020 all-site cancer incidence rate was highest for non-Hispanic White and Hispanic females between 75 and 84 years of age and for non-Hispanic Black females 75 and 84 years.
Delaware Department of Health and Social Services, Division of Public Health
18 Cancer Incidence and Mortality in Delaware, 2016-2020
2023
MORTALITY
For 2016-2020, Delaware ranked 15th in the U.S. for all-site cancer mortality (15 th in 20152019); males ranked 14th (14th in 2015-2019) and females ranked 19th (17th in 2015-2019)13.
2016-2020 DATA
TABLE 2 - 4 : NUMBER OF ALL - SITE CANCER DEATHS, BY SEX AND RACE/ETHNICITY ; DELAWARE AND COUNTIES, 201 6 - 20 20
Source: Delaware Department of Health and Social Services, Division of Public Health, Delaware Health Statistics Center , 2023
• In Delaware in 2016-2020:
o There were 10,439 deaths from cancer, an average of 2,087 per year.
o Males accounted for 53% of all-site cancer deaths.
o Non-Hispanic Whites accounted for 78% of all-site cancer deaths.
TABLE 2 - 5 : FIVE - YEAR AVERAGE AGE - ADJUSTED ALL - SITE CANCER MORTALITY RATES OVERALL AND BY SEX; U.S., DELAWARE , AND COUNTIES, 201 6 - 20 20
Source (Delaware): Delaware Department of Health and Social Services, Division of Public Health, Delaware Health Statistics Center, 2023
Source (U.S.): Surveillance, Epidemiology, and End Results (SEER) Program, SEER*Stat Database: Mortality - All COD, Aggregated With State, Total U.S. (1990-2020)
Rates are per 100,000 of population age-adjusted to the 2000 U.S. standard population and are calculated using modified U.S. Census populations available from NCI (https://seer.cancer.gov/popdata/).
13 U.S. Cancer Statistics Working Group. U.S. Cancer Statistics Data Visualizations Tool, based on 2021 submission data (1999 -2019): U.S. Department of Health and Human Services, Centers for Disease Control and Prevention and National Cancer Institute; www.cdc.gov/cancer/dataviz, released in June 2022.
Delaware Department of Health and Social Services, Division of Public Health 19 Cancer Incidence and Mortality in Delaware, 2016-2020 October 2023
Source (Delaware): Delaware Department of Health and Social Services, Division of Public Health, Delaware Health Statistics Center, 2023
Source (U.S.): Surveillance, Epidemiology, and End Results (SEER)*Stat Database: Mortality - All COD, Aggregated With State, Total U.S. (1990 -2020)
Rates are per 100,000 of population age-adjusted to the 2000 U.S. standard population and are calculated using modified U.S. Census populations available from NCI (https://seer.cancer.gov/popdata/).
• In Delaware from 2016-2020:
o Males (188.8 per 100,000 population) had a statistically significantly higher all-site cancer mortality rate compared to females (132.8 per 100,000 population).
o Non-Hispanic Blacks (171 1 per 100,000 population) had a statistically significantly higher all-site cancer mortality rate compared to Hispanics (110 0 per 100,000 population) and compared to nonHispanic Whites (158 9 per 100,000 population)
o Non-Hispanic Whites (158.9 per 100,000 population) had a statistically significantly higher all-site cancer mortality rate compared to Hispanics (110.0 per 100,000 population).
• Comparing Delaware and the U.S. from 2016-2020:
o Delaware (156.8 per 100,000 population) had a statistically significantly higher all-site cancer mortality rate compared to the U.S. (149.4 per 100,000 population).
o Delaware males (188.8 per 100,000 population) had a statistically significantly higher all-site cancer mortality rate compared to U.S. males (177.5 per 100,000 population).
o The difference in all-site cancer mortality rates between Delaware females (132 8 per 100,000 population) and U.S. females (128 7 per 100,000 population) was not statistically significant.
Delaware Department of Health and Social Services, Division of Public Health 20 Cancer Incidence and Mortality in Delaware, 2016-2020 October 2023
o Non-Hispanic Whites in Delaware (158.9 per 100,000 population) had a statistically significantly higher all-site cancer mortality rate compared to non-Hispanic Whites in the U.S (154 4 per 100,000 population).
o The difference in all-site cancer mortality rates between non-Hispanic Blacks in Delaware (171.7 per 100,000 population) and the U.S. (174.7 per 100,000 population) was not statistically significant.
o The difference in all-site cancer mortality rates between Hispanics in Delaware (110 0 per 100,000 population) and the U.S. (108.2 per 100,000 population) was not statistically significant.
TRENDS OVER TIME - DELAWARE AND U.S.
FIGURE 2 - 7 : AGE - ADJUSTED ALL - SITE CANCER MORTALITY RATE TREND BY SEX; U.S. AND DELAWARE, 2006 - 2020
Source (Delaware): Delaware Department of Health and Social Services, Division of Public Health, Delaware Health Statistics Center, 2023
Source (U.S.): Surveillance, Epidemiology, and End Results (SEER) Program (www.seer.cancer.gov)
SEER*Stat Database: Mortality - All COD, Aggregated With State, Total U.S. (1990-2020) Rates are per 100,000 of population age-adjusted to the 2000 U.S. standard population and are calculated using modified U.S. Census populations available from NCI (https://seer.cancer.gov/popdata/).
• Comparing age-adjusted all-site cancer mortality rates between the U.S. and Delaware between 2006 and 2020:
o Mortality rates for all-site cancer decreased an average of 1.8% per year in Delaware and decreased an average of 1.7% per year in the U.S. The decrease was consistent in Delaware over this time period, but the mortality rates in the U.S. had a greater average decrease of 2.0% between 2015 and 2020 compared to between 2006 and 2015 (1.5%)
o Mortality rates for all-site cancer decreased an average of 1.8% per year among Delaware males and decreased an average of 1.9% per year among U.S. males. The decrease was consistent in Delaware males over this time period, but the mortality rates among U.S. males had a greater average decrease of 2.3% between 2015 and 2020 compared to between 2006 and 2015 (1.8%) .
o Mortality rates for all-site cancer decreased an average of 1.8% per year among Delaware females and decreased an average of 1.6% per year among U.S. females. The decrease was consistent in Delaware females over this time period, but the mortality rates among U.S. females had the greatest average decrease of 1.9% between 2015 and 20 20 compared to between 2006 and 2008 (1.7%) and between 2008 and 2015 (1.3%)
Delaware Department of Health and Social Services, Division of Public Health
22 Cancer Incidence and Mortality in Delaware, 2016-2020
October 2023
FIGURE 2 - 8 : AGE - ADJUSTED ALL - SITE CANCER MORTALITY RATE TREND BY SEX AND RACE/ETHNICITY ; DELAWARE, 2006 - 2020
Source (Delaware): Delaware Department of Health and Social Services, Division of Public Health, Delaware Health Statistics Center, 2023
Rates are per 100,000 of population age-adjusted to the 2000 U.S. standard population and are calculated using modified U.S. Census populations available from NCI (https://seer.cancer.gov/popdata/).
• Comparing age-adjusted all-site cancer mortality rates by sex and race/ethnicity in Delaware between 2006 and 2020:
o Mortality rates for all-site cancer decreased an average of 1.7% per year among non-Hispanic White males and decreased an average of 1.9% per year among non-Hispanic White females.
o Mortality rates for all-site cancer decreased an average of 2.1% per year among non-Hispanic Black males and remained stable for non-Hispanic Black females.
o The trend in mortality rates for all-site cancer was stable among both Hispanic males and Hispanic females.
Delaware Department of Health and Social Services, Division of Public Health 23 Cancer Incidence and Mortality in Delaware, 2016-2020 October 2023
AGE-SPECIFIC MORTALITY RATES – DELAWARE
FIGURE 2 - 9 : AGE - SPECIFIC ALL - SITE CANCER MORTALITY RATES BY
SEX; DELAWARE, 201 6 - 20 20
Source: Delaware Department of Health and Social Services, Division of Public Health, Delaware Health Statistics Center, 2023
Rates are per 100,000 of population age-adjusted to the 2000 U.S. standard population and are calculated using modified U.S. Census populations available from NCI (https://seer.cancer.gov/popdata/).
• In 2016-2020, Delaware’s all-site mortality rate was highest for both males and females 85 years of age and older.
Delaware Department of Health and Social Services, Division of Public Health 24 Cancer Incidence and Mortality in Delaware, 2016-2020
October 2023
FIGURE 2 - 10: AGE - SPECIFIC ALL - SITE CANCER MORTALITY RATES BY RACE/ETHNICITY; DELAWARE, 201 6 - 20 20
Source: Delaware Department of Health and Social Services, Division of Public Health, Delaware Health Statistics Center, 2023
Rates are per 100,000 of population age-adjusted to the 2000 U.S. standard population and are calculated using modified U.S. Census populations available from NCI (https://seer.cancer.gov/popdata/).
• Delaware’s 2016-2020 all-site mortality rate was highest for non-Hispanic Whites, non-Hispanic Blacks, and Hispanics 85 years of age and older
Delaware Department of Health and Social Services, Division of Public Health 25 Cancer Incidence and Mortality in Delaware, 2016-2020
October 2023
Source: Delaware Department of Health and Social Services, Division of Public Health, Delaware Health Statistics Center , 2023
Rates are per 100,000 of population age-adjusted to the 2000 U.S. standard population and are calculated using modified U.S. Census populations available from NCI (https://seer.cancer.gov/popdata/).
Rates based on 16 or fewer cases are not shown.
In Delaware from 2016-2020:
• The all-site mortality rate was highest for non-Hispanic White, non-Hispanic Black, and Hispanic males 85 years of age and older
• The all-site mortality rate was highest for non-Hispanic White, non-Hispanic Black, and Hispanic females 85 years of age and older.
• Due to small numbers, mortality rates c ould not be calculated for certain groups.
CHAPTER 4: SITE - SPECIFIC CANCER
INCIDENCE
FIGURE 4 - 1 : PERCENT DISTRIBUTION OF CANCER CASES BY CANCER SITE, DELAWARE, 201 6 - 20 20
Source: Delaware Department of Social Services, Division of Public Health, Delaware Cancer Registry, 2023
• In 2016-2020 in Delaware:
o There were 29,805 new all-site cancer cases diagnosed, an average of 5,961 per year.
o Female breast cancer accounted for 15% of all new cancer cases.
o Lung and bronchus cancer accounted for 13% of all new cancer cases.
o Prostate cancer accounted for 14% of all new cancer cases.
o Colorectal cancer accounted for 7% of all new cancer cases.
TABLE 4 - 2 : FIVE - YEAR
Rates are per 100,000 population and are age-adjusted to the 2000 U.S. standard population (19 age groups –Census P25–1130) and are calculated using modified U.S. Census populations available from NCI (https://seer.cancer.gov/popdata/). Incidence rates exclude in situ carcinomas except urinary bladder and exclude basal cell and squamous cell skin cancers. Incidence data were coded using the International Classification of Disease for Oncology (ICD-O) coding system.
Delaware cases include Delaware residents only at the time of diagnosis.
Sources: The Delaware and U.S. incidence rates are based on the Delaware Cancer Registry, Delaware Division of Public Health, 2022 submission and the NPCR and SEER Incidence - U.S. Cancer Statistics Public Use Database, 2022 submission (2001-2020), United States Department of Health and Human Services, Centers for Disease Control and Prevention and National Cancer Institute. Released June 2023. Available at www.cdc.gov/cancer/uscs/public-use. Delaware rates are referenced as DE and U.S. references the United States.
*Statistically significantly higher than the U.S. rate.
• Comparing Delaware to the U S from 2016-2020:
o Delaware (56.9 cases per 100,000 population) had a statistically significantly higher lung and bronchus cancer incidence rate compared to the U.S. (54.2 cases per 100,000 population).
o Delaware (27.1 cases per 100,000 population) had a statistically significantly higher melanoma incidence rate compared to the U.S. (22.4 cases per 100,000 population).
o Delaware (22 5 cases per 100,000 population) had a statistically significantly higher urinary bladder cancer incidence rate compared to the U.S. (18 9 cases per 100,000 population).
o Delaware (15.8 cases per 100,000 population) had a statistically significantly higher thyroid cancer incidence rate compared to the U.S. (13.3 cases per 100,000 population).
O Delaware (12.2 cases per 100,000 population) had a statistically significantly lower leukemia incidence rate compared to the U.S. (13 9 cases per 100,000 population).
TABLE 4 - 3 : FIVE - YEAR
Rates are per 100,000 population and are age-adjusted to the 2000 U.S. standard population (19 age groups –Census P25–1130) and are calculated using modified U.S. Census populations available from NCI (https://seer.cancer.gov/popdata/). Incidence rates exclude in situ carcinomas except urinary bladder and exclude basal cell and squamous cell skin cancers. Incidence data were coded using the International Classification of Disease for Oncology (ICD-O) coding system. Delaware cases include Delaware residents only at the time of diagnosis.
Sources: The Delaware and U.S. incidence rates are based on the Delaware Cancer Registry, Delaware Division of Public Health, 2022 submission and the NPCR and SEER Incidence - U.S. Cancer Statistics Public Use Database, 2022 submission (2001-2020), United States Department of Health and Human Services, Centers for Disease Control and Prevention and National Cancer Institute. Released June 2023. Available at www.cdc.gov/cancer/uscs/public-use. Delaware rates are referenced as DE and U.S. references the United States.
*Statistically significantly higher than the U.S. rate.
• Comparing Delaware males to U.S. males from 2016-2020:
o The age-adjusted incidence rate for prostate cancer among Delaware males (125.0 cases per 100,000 population) was significantly higher compared to U.S. males (110.2 cases per 100,000 population).
o Delaware males (35.0 cases per 100,000 population) had a statistically significantly higher melanoma age-adjusted incidence rate compared to U.S. males (2 8 5 cases per 100,000 population).
o Delaware males (38.4 cases per 100,000 population) had a statistically significantly higher urinary bladder cancer incidence rate compared to U.S. males (32.6 cases per 100,000 population).
TABLE 4 - 4 : FIVE - YEAR
Rates are per 100,000 population and are age-adjusted to the 2000 U.S. standard population (19 age groups –Census P25–1130) and are calculated using modified U.S. Census populations available from NCI (https://seer.cancer.gov/popdata/). Incidence rates exclude in situ carcinomas except urinary bladder and exclude basal cell and squamous cell skin cancers. Incidence data were coded using the International Classification of Disease for Oncology (ICD-O) coding system. Delaware cases include Delaware residents only at the time of diagnosis.
Sources: The Delaware and U.S. incidence rates are based on the Delaware Cancer Registry, Delaware Division of Public Health, 2022 submission and the NPCR and SEER Incidence - U.S. Cancer Statistics Public Use Database, 2022 submission (2001-2020), United States Department of Health and Human Services, Centers for Disease Control and Prevention and National Cancer Institute. Released June 2023. Available at www.cdc.gov/cancer/uscs/public-use. Delaware rates are referenced as DE and U.S. references the United States.
*Statistically significantly higher than the U.S. rate.
• Comparing Delaware females to U.S. females from 2016-2020:
o Delaware females (134 5 cases per 100,000 population) had a statistically significantly higher breast cancer incidence rate compared to U.S. females (126 9 cases per 100,000 population).
o Delaware females (52.7 cases per 100,000 population) had a statistically significantly higher lung and bronchus cancer incidence rate compared to U.S. females (48.8 cases per 100,000 population).
o Delaware females (23.1 cases per 100,000 population) had a statistically significantly higher thyroid cancer incidence rate compared to U.S. females (19.4 cases per 100,000 population).
o Delaware females (21.0 cases per 100,000 population) had a statistically significantly higher melanoma incidence rate compared to U.S. females (18.0 per 100,000 population).
o Delaware females (9.1 cases per 100,000 population) had a statistically significantly lower leukemia incidence rate compared to U.S. females (1 0.9 cases per 100,000 population).
• Comparing Delaware females to Delaware males from 2016-2020:
o Delaware males have a significantly higher age-adjusted incidence rate for oral cavity and pharynx cancer compared to Delaware females (19.0 cases per 100,000 population versus 5.7 cases per 100,000 population).
o Delaware males have a significantly higher age-adjusted incidence rate for esophagus cancer compared to Delaware females (7.7 cases per 100,000 versus 1.8 cases per 100,000 population).
o Delaware males have a significantly higher age-adjusted incidence rate for stomach cancer compared to Delaware females (8.3 cases per 100,000 versus 4.1 cases per 100,000 population).
o Delaware males have a significantly higher age-adjusted incidence rate for colorectal cancer compared to Delaware females (40.2 cases per 100,000 population versus 29.8 cases per 100,000 population).
o Delaware males have a significantly higher age-adjusted incidence rate for liver and intrahepatic bile duct cancer compared to Delaware females (12.9 cases per 100,000 population versus 4.2 cases per 100,000 population).
o Delaware males have a significantly higher age-adjusted incidence rate for pancreatic cancer compared to Delaware females (15.9 cases per 100,000 population versus 12 3 cases per 100,000 population).
o Delaware males have a significantly higher age-adjusted incidence rate for larynx cancer compared to Delaware females (5.2 cases per 100,000 population versus 1.5 cases per 100,000 population).
o Delaware males have a significantly higher age-adjusted incidence rate for lung and bronchus cancer compared to Delaware females (62.4 cases per 100,000 population versus 52.7 cases per 100,000 population).
o Delaware males have a significantly higher age-adjusted incidence rate for melanoma compared to Delaware females (35.0 cases per 100,000 population versus 21.0 cases per 100,000 population).
o Delaware males have a significantly higher age-adjusted incidence rate for urinary bladder cancer compared to Delaware females (38.4 cases per 100,000 population versus 9.8 cases per 100,000 population).
o Delaware males have a significantly higher age-adjusted incidence rate for kidney and renal pelvis cancer compared to Delaware females (22.4 cases per 100,000 population versus 11.5 cases per 100,000 population).
o Delaware males have a significantly higher age-adjusted incidence rate for non-Hodgkin lymphoma compared to Delaware females (21.8 cases per 100,000 population versus 14.3 cases per 100,000 population).
o Delaware males have a significantly higher age-adjusted incidence rate for leukemia compared to Delaware females (16.2 cases per 100,000 population versus 9.1 cases per 100,000 population).
o Delaware males have a significantly lower age-adjusted incidence rate for thyroid cancer compared to Delaware females (8.1 cases per 100,000 population versus 23.1 cases per 100,000 population).
FIGURE 4 - 2 : PERCENT DISTRIBUTION OF CANCER DEATHS BY CANCER SITE, DELAWARE, 201 6 - 20 20
Source: Delaware Department of Health and Social Services, Division of Public Health, Delaware Health Statistics Center, 202 3
• In 2016-2020 in Delaware:
o There were 10,439 deaths from cancer, an average of 2,087 per year.
o Lung and bronchus cancer accounted for 25% of all new cancer deaths.
o Colorectal cancer and pancreatic cancer accounted for 8% of all new cancer deaths.
o Female breast cancer accounted for 7% of all new cancer deaths.
o Prostate cancer accounted for 5% of all new cancer deaths
TABLE 4 - 5 : FIVE - YEAR
Rates are per 100,000 population and are age-adjusted to the 2000 U.S. standard population (19 age groups –Census P25–1130) and are calculated using modified U.S. Census populations available from NCI (https://seer.cancer.gov/popdata/). Basal cell and squamous cell skin cancers were excluded. Mortality data were coded using the International Classification of Disease Tenth Revision (ICD-10) coding system. Delaware deaths include Delaware residents only at the time of death.
Sources: The Delaware and the U.S. mortality rates are based on the Delaware Health Statistics, Delaware Division of Public Health, 2023 and the Surveillance, Epidemiology, and End Results (SEER) Program (www.seer.cancer.gov) SEER*Stat Database: Mortality - All COD, Aggregated with State, Total U. S. (1990-2020), Delaware rates are referenced as DE and U.S. references the United States.
*Statistically significantly higher than the U.S. rate.
• Comparing Delaware to the U.S. from 2016-2020:
o Delaware (38 4 deaths per 100,000 population) had a statistically significantly higher lung and bronchus cancer mortality rate compared to the U.S. (35 0 deaths per 100,000 population).
o Delaware (12.2 deaths per 100,000 population) had a statistically significantly higher pancreatic cancer mortality rate compared to the U.S. (11.1 deaths per 100,000 population).
o Delaware (5.3 deaths per 100,000 population) had a statistically significantly higher urinary bladder cancer mortality rate compared to the U.S. (4.2 deaths per 100,000 population).
o Delaware (3.7 deaths per 100,000 population) had a statistically significantly higher myeloma cancer mortality rate compared to the U.S. (3.1 deaths per 100,000 population).
O Delaware (1.2 deaths per 100,000 population) had a statistically significantly higher larynx mortality rate compared to the U.S. (0.9 deaths per 100,000 population).
TABLE 4 - 6 : FIVE
Rates are per 100,000 population and are age-adjusted to the 2000 U.S. standard population (19 age groups – Census P25–1130) and are calculated using modified U.S. Census populations available from NCI (https://seer.cancer.gov/popdata/). Basal cell and squamous cell skin cancers were excluded Mortality data were coded using the International Classification of Disease Tenth Revision (ICD-10) coding system.
Delaware deaths include Delaware residents on ly at the time of death.
Sources: The Delaware and the U.S. mortality rates are based on the Delaware Health Statistics, Delaware Division of Public Health, 2023 and the Surveillance, Epidemiology, and End Results (SEER) Program (www.seer.cancer.gov) SEER*Stat Database: Mortality - All COD, Aggregated with State, Total U. S. (1990-2020), Delaware rates are referenced as DE and U.S. references the United States.
*Statistically significantly higher than the U.S. rate.
• Comparing Delaware males to U S males from 2016-2020:
o Delaware males (45.6 deaths per 100,000 population) had a statistically significantly higher lung and bronchus cancer mortality rate compared to U.S. males (42.2 deaths per 100,000 population).
o Delaware males (9.3 deaths per 100,000 population) had a statistically significantly higher urinary bladder cancer mortality rate compared to U.S. males (7.1 deaths per 100,000 population).
TABLE 4 - 7 : FIVE - YEAR AVERAGE AGE - ADJUSTED ALL - SITE AND SITE - SPECIFIC CANCER MORTA LITY RATES AND NUMBER OF CASES FOR FEMALES; U.S. AND DELAWARE, 201 6 - 20 20
Rates are per 100,000 population and are age-adjusted to the 2000 U.S. standard population (19 age groups – Census P25–1130) and are calculated using modified U.S. Census populations available from NCI (https://seer.cancer.gov/popdata/). Basal cell and squamous cell skin cancers were excluded. Mortality data were coded using the International Classification of Disease Tenth Revision (ICD-10) coding system.
Delaware deaths include Delaware residents only at the time of death.
Sources: The Delaware and the U.S. mortality rates are based on the Delaware Health Statistics, Delaware Division of Public Health, 2023 and the Surveillance, Epidemiology, and End Results (SEER) Program (www.seer.cancer.gov) SEER*Stat Database: Mortality - All COD, Aggregated with State, Total U. S. (1990-2020), Delaware rates are referenced as DE and U.S. references the United States.
*Statistically significantly higher than the U.S. rate.
• Comparing Delaware females to U.S. females from 2016-2020:
o Delaware females (32.8 deaths per 100,000 population) had a statistically significantly higher lung and bronchus cancer mortality rate compared to U.S. females (29.3 deaths per 100,000 population).
Delaware Department of Health and Social Services, Division of Public Health
Cancer Incidence and Mortality in Delaware, 2016-2020
• Comparing Delaware females to Delaware males from 2016-2020:
o Delaware males have a significantly higher age-adjusted mortality rate for lung and bronchus cancer compared to Delaware females (45.6 deaths per 100,000 population versus 32.8 deaths per 100,000 population).
o Delaware males have a significantly higher age-adjusted mortality rate for colorectal cancer compared to Delaware females (15.3 deaths per 100,000 population versus 10.6 deaths per 100,000 population).
o Delaware males have a significantly higher age-adjusted mortality rate for pancreatic cancer compared to Delaware females (14.5 deaths per 100,000 population versus 10.3 deaths per 100,000 population).
o Delaware males have a significantly higher age-adjusted mortality rate for liver and intrahepatic bile duct cancer compared to Delaware females (10.4 deaths per 100,000 population versus 3.0 deaths per 100,000 population).
o Delaware males have a significantly higher age-adjusted mortality rate for leukemia compared to Delaware females (9.1 deaths per 100,000 population versus 4.1 deaths per 100,000 population).
o Delaware males have a significantly higher age-adjusted mortality rate for urinary bladder cancer compared to Delaware females (9.3 deaths per 100,000 population versus 2.5 deaths per 100,000 population).
o Delaware males have a significantly higher age-adjusted mortality rate for non-Hodgkin lymphoma compared to Delaware females (7.3 deaths per 100,000 population versus 3.7 deaths per 100,000 population).
o Delaware males have a significantly higher age-adjusted mortality rate for esophagus cancer compared to Delaware females (6.7 deaths per 100,000 versus 1.6 deaths per 100,000 population).
o Delaware males have a significantly higher age-adjusted mortality rate for brain and nervous system cancer compared to Delaware females (5.3 deaths per 100,000 population versus 3.2 deaths per 100,000 population).
o Delaware males have a significantly higher age-adjusted mortality rate for kidney and renal pelvis cancer compared to Delaware females (4.9 deaths per 100,000 population versus 2.5 deaths per 100,000 population).
o Delaware males have a significantly higher age-adjusted mortality rate for stomach cancer compared to Delaware females (4.8 deaths per 100,000 population versus 2.0 deaths per 100,000 population).
o Delaware males have a significantly higher age-adjusted mortality rate for oral cavity and pharynx cancer compared to Delaware females (4.3 deaths per 100,000 population versus 0.8 deaths per 100,000 population).
o Delaware males have a significantly higher age-adjusted mortality rate for melanoma compared to Delaware females (3.7 deaths per 100,000 population versus 1.6 deaths per 100,000 population).
o Delaware males have a significantly higher age-adjusted mortality rate for larynx cancer compared to Delaware females (1.9 deaths per 100,000 population versus 0.7 deaths per 100,000 population).
DATA SOURCES AND METHODOLOGY
CANCER INCIDENCE DATA
DELAWARE CANCER REGISTRY
This report covers data on cancer cases diagnosed among Delawareans from January 1, 2016, to December 31, 2020, that were reported to the Delaware Cancer Registry (DCR) by November 2022. Trends in incidence rates are based on cancers diagnosed from January 1, 2006 to December 31, 2019 The COVID-19 pandemic resulted in delays and reductions in cancer screening and diagnosis, which subsequently led to a decline in 2020 incidence counts and rates that was considered an anomaly Inclusion of 2020 rates would bias the estimates of trends over time and therefore 2020 rates were not included in trend analysis.14
During 2016-2020, there were 29,805 cancer cases diagnosed among Delawareans, which includes individuals with cancers diagnosed at more than one site (known as multiple primaries). With the exception of urinary bladder cancer, only malignant tumors are included in the analyses. In situ urinary bladder cancer cases are included because, based on language used by pathologists, it is difficult to distinguish them from malignant cancers.
The International Classification of Diseases for Oncology, Second Edition (ICD -O-2), describes the topography (primary anatomic site) and morphology (histology) for cancers reported from 1988 through 2000. Cancers diagnosed from 2001 through the present are coded using the International Classification of Diseases for Oncology, Third Edition (ICD-O-3)15. Relevant codes for this report are in Appendix B. The topography code defines both the site of the tumor and the type of cancer. The first four digits of the morphology code define the histology of the cancer and the fifth digit indicates whether the cance r is malignant, benign, in situ, or uncertain. Consistent with the CDC’s publication of the U.S. Cancer Statistics, Kaposi’s sarcoma and mesothelioma are considered separate sites based on distinct histology codes.
UNITED STATES CANCER STATISTICS (USCS)
U.S. incidence data were obtained from United States Cancer Statistics (USCS) which consists of data from cancer registries participating in the Centers for Disease Control and Prevention’s (CDC’s) National Program of Cancer Registries (NPCR) and the National Cancer Institute’s (NCI’s) Surveillance, Epidemiology, and End Results (SEER) Program. Incidence data are included from selected cancer registries meeting U.S. Cancer Statistics data quality criteria covering 99% of the U.S. population.
Historically, Delaware’s cancer incidence rates were compared to cancer incidence rates calculated using data from the SEER program, which began in 1973 with data collected from nine SEER program cancer registries (SEER-9). Over time, the number of SEER program registries expanded. In 2009, the Delaware Department of Health and Social Services (DHSS), Division of Public Health (DPH) and the Delaware Cancer Consortium (DCC) began using cancer incidence rates based on 18 population-based registries as a comparison for Delaware’s cancer incidence rates. Starting with the “Cancer Incidence and Mortality in Delaware, 2015-2019” report, USCS data was used to align with national statistics presented by national standard-setters that includes the most comprehensive data covering a majority of the U.S. population.
14 National Cancer Institute, Surveillance, Epidemiology, and End Results Program: Impact of COVID on 2020 SEER Cancer Incidence Data, https://seer.cancer.gov/data/covidimpact.html
15 Fritz A, Jack A, Parkin DM, Percy C, Shanmugarathan, Sobin L, Whelan S (eds). International Classification of Diseases for O ncology, Third Edition (ICD-O-3). World Health Organization, Geneva.
CANCER MORTALITY DATA
DELAWARE HEALTH STATISTICS CENTER
Mortality data are provided by the Delaware Health Statistics Center (DHSC) for all death certificates filed in Delaware from 2006 through 2020 Trend analyses for cancer mortality are based on deaths that occurred from January 1, 2006, to December 31, 2020
For deaths that occurred from 1999 to the present, the International Classification of Diseases, Tenth Edition (ICD-10) is used to code cause of death. To determine the underlying cause of death, the sequence of events leading to the individual’s death are recorded on the death certificate and run through the Automated Classification of Medical Entities (ACME) software used by the National Center for Health Statistics (NCHS). This program uses a series of rules and hierarchies of events to select the most appropriate underlying cause of death.
NATIONAL CENTER FOR HEALTH STATISTICS
U.S. mortality data were obtained from the NCHS. U.S. mortality data are compiled from all death certificates filed in the 50 states and the District of Columbia from 1980 through 2020. Cause of death was coded by NCHS in accordance with World Health Organization regulations that stipulate that cancer deaths be coded using the most current revision of the International Classification of Diseases. As in Delaware, deaths that occurred prior to 1999 in the U.S. are coded using ICD-9 and beginning with 1999 deaths are coded using ICD10. These U.S. mortality data were accessed through SEER*Stat16.
POPULATION ESTIMATES, 2016 - 2020
Cancer incidence and mortality rates for the U.S. are calculated using population totals estimated by the U.S. Census. Delaware rates are based on population estimates released by the U.S. Census Bureau. Population files are obtained from the NCI SEER website.17 When calculating age-adjusted mortality rates, the CDC utilizes SEER population estimates derived from the U.S. Census for the denominator18 To remain consistent with national reporting of cancer statistics, DPH utilizes U.S. Census data from SEER.19
RISK F ACTORS AND EARLY DETECTION
The Behavioral Risk Factor Survey ( BRFS) is the world’s largest ongoing telephone health survey tracking health conditions and risk behaviors in the United States yearly since 1984. Currently, data are collected in all 50 states and four territories. The survey was developed to monitor the statewide prevalence of behavioral risk factors influencing premature morbidity and mortality. The BRFS includes a core set of questions developed by the CDC and is administered to adults 18 years of age and older. Delaware’s BRFS is a collaborative effort between DPH and the CDC. BRFS questions target lifestyle behaviors (including tobacco use, fruit and vegetable consumption, exercise, and weight control); cancer screening practices; health status; and health care access and use20. Technological and cultural changes are posing challenges to survey research. One of the most significant challenges is the rapid increase in households where telephone service
16 Surveillance, Epidemiology, and End Results (SEER) Program (www.seer.cancer.gov) SEER*Stat Database: Mortality - All COD, Aggregated Total U.S. (1990-2020) <Katrina/Rita Population Adjustment>, National Cancer Institute, DCCPS, Surveillance Research Program, released June 2022. Underlying mortality data provided by NCHS (www.cdc.gov/nchs).
17 National Cancer Institute. (n.d.). Download U.S. population data - seer population data. Surveillance, Epidemiology, and End Results Program. Retrieved August 23, 2023, from https://seer.cancer.gov/popdata/download.html
18 United States Cancer Statistics: Data Visualizations, Footnotes, Centers for Disease Control and Prevention
19 United States County Population Data, 1969-2020, National Cancer Institute, cancer.gov
is provided primarily, or only, via cell phone service. These "cell phone" households are, at least c urrently, more common among young adults and minority populations.21
Originally, the BRFS survey was administered by a random -digit-dial telephone survey. Starting with reporting 2011 data, the BRFS became a "multi-mode survey," using several modes of data collection including landline telephone interviews, cell phone interviews, and online follow -up surveys for some respondents who did not want to respond by phone. Also, the BRFS uses a new method for weighting data , called “raking,” which more accurately reflects the actual population of each state22 Because cell phones are quickly replacing landline phones, it was difficult to obtain a true representative sample of some population subgroups during the late 2000s. The response rate problems likely resulted in less accurate prevalence estimates for some behaviors or conditions more prevalent in populations who primarily use d cell phones. For example, the prevalence of cigarette smoking, known to be more prevalent among young adults, may have been under-estimated for several years.23
The data in Appendix D and E relate to cancer screening and risk factor prevalence among Delawareans. Data on breast, cervical, colorectal, and prostate cancer screening patterns among Delawareans are provided in relevant cancer site chapters earlier in this document. Data on overw eight and obesity, physical activity, and consumption of dietary fruits and vegetables are provided in Appendix E24. Data on known and suspected cancer risk factors and screening recommendations are in Appendices D and E. The 2020 BRFS data include screening compliance data (Appendix D) and risk factor data (Appendix E)
21 Delaware Behavioral Risk Factor Survey-Changing to meet new challenges, https://www.dhss.delaware.gov/dhss/dph/dpc/brfs_changes2011.html
Delaware Department of Health and Social Services, Division of Public Health 43 Cancer Incidence and Mortality in Delaware, 2016-2020 October 2023
STATISTICAL METHODOLOGY AND TECHNICAL TERMS
AGE-ADJUSTMENT OF INCIDENCE AND MORTALITY RATES
The age distribution of a population is an important determinant of the burden of cancer. Because cancer incidence and mortality increase with age, crude rates cannot be used for comparisons of cancer statistics between sexes, racial or ethnic groups, or geographic entities across different time spans.
Age adjustment is useful when comparing two or more populations with different age distributions at one point in time or one populatio n at two or more points in time25. To calculate an age-adjusted incidence rate, the crude incidence rate for each of 18 five-year age groups is multiplied by a fixed population weight for that specific age group using the appropriate 2000 U.S. Standard Population (Table A -1)26. Individual age-specific rates are then summed to obtain the overall age-adjusted rate.
TABLE A-1: U.S. STANDARD YEAR 2000 POPULATION WEIGHTS, BY AGE GROUP
Source: U.S. Census 2000, accessed from SEER, http://seer.cancer.gov/stdpopulations/19ages.proportions.html
The formula for an age-adjusted rate can be presented as follows:
Age-Adjusted Rate = sum (wi x ((ci/ni) x 100,000))
• ci is the number of new cases or deaths in the i age group
• ni is the population estimate for the i age group
• wi is the proportion of the standard population in the i age group
All rates are expressed per 100,000 of the population.
TRENDS OVER TIME: JOINPOINT METHODOLOGY
For this report, trend analysis was calculated using Joinpoint statistical software available th rough the NCI.27 Briefly, trend data (e.g., cancer incidence and mortality rates), are input into the software and the software fits the simplest joinpoint model that is identified from the data. The model provides information about significant changes in the trend across the years and calculates the annual percent change.
25 Anderson RN, Rosenberg HM. Report of the second workshop on age adjustment. National Center for Health Statistics. Vital Heal th Stat 4(30). 1998.
26 Klein RJ, Schoenborn CA. Age Adjustment Using the 2000 Projected U.S. Population. Healthy People statistica l notes, no. 20, http://www.cdc.gov/nchs/data/statnt/statnt20.pdf
27 https://surveillance.cancer.gov/joinpoint/
Delaware Department of Health and Social Services, Division of Public Health 44 Cancer Incidence and Mortality in Delaware, 2016-2020 October 2023
RACE/ETHNICITY- AND SEX-SPECIFIC INCIDENCE AND MORTALITY RATES
Race/ethnicity- and sex-specific incidence and mortality rates are calculated to assess how cancer patterns differed across subgroups within the state. These rates are calculated by dividing the number of cases or deaths that occurred in each race/ethnic and/or sex group by the total population in the corresponding race/ethnic and/or sex group over the same time period. As with other rates, these rates were adjusted to the 2000 U.S. standard population and expressed per 100,000 of the population.
CONFIDENCE INTERVALS
Age-adjusted incidence and mortality rates are subject to chance variation, particularly when t hey are based on a small number of cancer cases or deaths occurring over a limited time period or in a limited geographic area. Aggregating several years of data provides more reliable estimates of incidence and mortality in these situations. The level of uncertainty associated with incidence and mortality rates is estimated by the 95% confidence interval.
When incidence rates are based on more than 100 cases, lower and upper limits of the 95 % confidence intervals for an age-adjusted (AA) incidence or mortality rate are calculated using SEER*Stat28 by methodology shown here:29
Lower Confidence Limit = AA Rate - 1.96 [ AA Rate √# Cases]
Upper Confidence Limit = AA Rate + 1.96 [ AA Rate
where AA Rate is the age-adjusted incidence or mortality rate.
When an incidence or mortality rate is based on fewer than 100 cases or deaths , the 95% confidence intervals are calculated using the following formulas:
Lower Confidence Limit (LCL) = AA Rate x L
Upper Confidence Limit (UCL) = AA Rate x U
where L and U are values published by the NCHS for the specific purpose of calculating 95% confidence intervals for rates based on fewer than 100 cases30.
LIMITATIONS OF CONFIDENCE INTERVALS
Confidence intervals are part of the standard calculations provided within SEER*Stat. While confidence intervals can be helpful to explore potential differences between populations, identifying statistically significant differences by overlapping confidence intervals alone is subject to Type I and Type II errors more often than standard hypothesis testing. Therefore, for the purpose of this report, confidence intervals are calculated but not reported within the report. For comparison of rates between two populations, an incidence rate ratio is calculated with corresponding p-value. Significance has been set to <0.05, an industry standard. The IRR is not reported but used to determine the language used to describe differences. Statements that include “statistically significant,” “significantly higher,” or “significantly lower” used the confidence interval method and were confirmed by a statistically significant incidence rate ratio.
28 Surveillance, Epidemiology and End Results (SEER) Program, National Cancer Institute. SEER*Stat Software, Version 8.3.5, http://seer.cancer.gov/seerstat/index.html
29 Tiwari RC, Clegg LX, Zou Z. Efficient interval estimation for age-adjusted cancer rates. Stat Methods Med Res 2006;15(6):547-69.
30 Martin JA, Hamilton BE, Ventura SJ, Menacker F, Park MM, Sutton PD. Births: Final data for 2001. National vital statistics re ports; vol. 51 no. 2. Hyattsville, Maryland: National Center for Health Statistics, 2002.
DATA RELEASE STANDARDS
For this report, cancer frequencies and rates are released according to CDC’s United States Cancer Statistics suppression of rates and counts guidance 31 Incidence and mortality frequencies of fewer than 16 are not presented and age-adjusted incidence and mortality rates based on 16 or fewer cases or deaths are not calculated. This DPH policy helps protect patient privacy and confidentiality32,33 Furthermore, a cancer rate based on a very small number of cases is inherently unstable and cannot be reliably interpreted.
DEFINITION OF RACE /ETHNICITY
In this report, the race/ethnicity category is defined as follows:
1. Non-Hispanic White – cases who are reported to have White race and not of Hispanic/Latino ethnicity.
2. Non-Hispanic Black – cases who are reported to have Black race and not of Hispanic/Latino ethnicity.
3. Hispanic – cases who are reported to be of Hispanic/Latino ethnicity regardless of race.
NATIONAL CANCER RANKING
State cancer rank information was retrieved from the National Cancer Institute’s CI*Rank website which provides ranked age-adjusted cancer incidence and mortality rates by state, county and special region.34[1] The data sources for the rankings that cover the 2016 -2020 period are U.S. Mortality Data 1999 -2020 from the National Center for Health Statistics and U.S. Cancer Incidence 1995-2020 data from the North American Association of Central Cancer Registries (NAACCR) CiNA Analytic File, 1995 -2020.
It should be noted that the incidence data for some years are incomplete for some states and some states are excluded. Specifically, for 2016-2020 rankings used in the current report, data were not available for all or at least part of the period for the following states: Arkansas, Colorado, Florida, Indiana, Kansas, Maryland, Minnesota, Missouri, Nevada, and Vermont. As a result, cancer incidence state rankings do not include these states and the rankings are only among the states that are included (i.e., the remaining states plus Washington, DC for a total of 41 ranking spots). The cancer mortality state rankings do include all states plus Washington, DC. 35
31 Centers for Disease Control and Prevention. (2022, June 6). Statistical methods: Suppression of rates and counts . United States Cancer Statistics (USCS). Retrieved August 18, 2022, from https://www.cdc.gov/cancer/uscs/technical_notes/stat_methods/suppression.htm
32 Coughlin SS, Clutter GG, Hutton M. Ethics in Cancer Registries. Journal of Cancer Registry Management, 2: 5-10, 1999.
33 McLaughlin CC. Confidentiality protection in publicly released central registry data. Journal of Cancer Registry Management, 2: 84-88, 2002.
34 CI*Rank: Ranked Incidence and Mortality Rates by State, County, and Special Region from https://surveillance.cancer.gov/cirank/
Aleukemic, subleukemic and Not Otherwise Specified 9733, 9742, 9800, 9831, 9870, 9948, 99639964
C420, C421, C424 9827
Source: National Cancer Institute, Surveillance, Epidemiology, and End Results (SEER) Program, Site Recode ICD-O-3/WHO 2008 Definition http://seer.cancer.gov/siterecode/icdo3_dwhoheme/index.html.
HISPANIC ETHNICITY
The U.S. Census Bureau defines "Hispanic or Latino" as "a person of Cuban, Mexican, Puerto Rican, South or Central American, or other Spanish culture or origin regardless of race.”36 According to the Census Bureau, in 2000, persons of Hispanic ethnicity comprised 5% of Delaware’s population. By 2010, Delaware’s Hispanic population increased to 8%. In the 2020 U.S. Census, persons of Hispanic origin comprised 11% of Delaware’s population.
By county, the Hispanic prevalence grew to 4% in 2000, 9% in 2010, and 11% in 2020 in Sussex County. New Castle County had a similar prevalence of 5% in 2000, 9% in 2010, and 11% in 2020. Among Kent County residents, the Hispanic population grew to 3% in 2000, 6% in 2010, and 8% in 2020
Figure C-1 shows the percentage change of the Hispanic population by county and decade in Delaware. From 2000 to 2010, the Hispanic population grew by 118% in Kent County, 78% in New Castle County, and 152% in Sussex County. In the following decade, from 2010 to 2020, the Hispanic population grew by 50% in Kent County, 35% in New Castle County, and 58% in Sussex County.
FIGURE C - 1 : PERCENTAGE OF CHANGES IN HISPANIC POPULATION BY COUNTY AND DECADE, DELAWARE, 2000 - 2010 AND 2010 - 2020
Source: U.S. Census Bureau 2020, https://data.census.gov/
Specific issues that suggest that Hispanic cancer rates could be subject to misinterpretation are discussed below:
• Uncertain estimate of Delaware’s Hispanic population — Estimates of Delaware’s population are derived from the census performed every 10 years by the U.S. Census Bureau and a final adjustment based on projections from the U.S. Census Bureau as to the overall rate of growth for the Hispanic population in both the state and the nation.
• Inaccurate recording of Hispanic ethnicity on death certificates Race and Hispanic origin are treated as distinct categories and reported separately on death certificates and to the Delaware Cancer Registry, in accordance with guidelines from the federal Office of Management and Budget. However, it is possible that Hispanic race is under-reported both in the cancer registry and on death certificates.
• Hispanic identification in the Delaware Cancer Registry data The North American Association of Central Cancer Registries (NAACCR) convened an expert panel in 2001 to develop a best practices
36 Grieco, EM, Cassidy RC. (2001-03). "Overview of Race and Hispanic Origin: Census 2000 Brief" U.S. Census Bureau Accessed May 26, 2011.
approach to Hispanic identification. In the resulting approach to enhance Hispanic identification, the NAACCR Hispanic Identification Algorithm (NHIA) was computerized and released for use by central c ancer registries in 2003. In this report, NHIA is used to identify Delawareans of Hispanic origin. To minimize misclassification, the expert panel continues to evaluate the NHIA while considering the possibility of the under- or over-estimation of Hispanic cancer incidence.
• Small number of cases or deaths and small population sizes — An incidence or mortality rate is an estimate, and the reliability of estimates can be measured by calculating a confidence interval. A narrow confidence interval suggests that the rate is a good estimate; a wide confidence interval suggests that the rate should be interpreted with caution. If the confidence intervals of two rates do not overlap, the rates are considered to be statistically different. Both the size of the numerator (the number of cases or deaths) and the size of the denominator (the population) determine the width of the confidence interval. Typically, researchers report 95% confidence intervals. When constructed properly, a 95% confidence interval includes the true cancer rate 95% of the time.
APPENDIX D: EARLY D ETECTION
FEMALE BREAST CANCER SCREENING RECOMMENDATIONS
A screening mammogram (x-ray of the breast) is used to detect breast disease in females who appear to have no breast problems. For early breast cancer detection in females without breast symptoms, t he Delaware Cancer Consortium (DCC) recommends that:37
• Females 40 years of age and older should get a mammogram and clinical breast exam annually.
• Females 25 years of age and older should get a clinical breast exam annually.
Also, as females should know how their breasts normally look and feel, they should report any breast change promptly to their health care provider. The American Cancer Society suggests females are aware how her breast feel and look. If changes occur, these changes should be reported to her health care provider37. Females at increased risk for breast cancer should discuss with their health care provider the benefits and limitations of beginning mammograms when they are younger, having additional tests, and/or having more frequent exams.
FEMALE BREAST CANCER SCREENING IN DELAWARE
The Behavioral Risk Factor Survey (BRFS) has collected yearly mammogram use data through 2000 ; after 2000, mammogram use data are collected biennially. The BRFS asks a female respondent about her receiving a mammogram during the previous two years (as opposed to the annual mammogram screening schedule recommended by the DCC) to account for minor variations in scheduling that may cause a woman to miss the one-year threshold (e.g., two mammogram screening appointments 14 months apart).
Data from the 2020 BRFS provides information on breast cancer screening among Delaware females:
• Of Delaware females 40 years of age and older, 73% reported having a mammogram within the previous two years, compared to a national median of 72%. Delaware females ranked 17th highest nationally for this response.
• In Delaware, the percentage of non-Hispanic Caucasian females 40 years of age and older who reported having a mammogram in the past two years was slightly lower compared to non -Hispanic African American females. The difference was not significantly different (7 4% versus 76%, respectively).
• Delaware females 40 years of age and older in the two highest income categories had the highest percentages of mammography use (79% for females with an annual household income between $35,000 to $49,999 and 75% for females with an annual income of $ 50,000 or more).
• Delaware females (40 years of age and older) who were college graduates (78%) had a higher prevalence of having had a mammogram in the past two years, compared to Delaware females who had less than a high school diploma (53%); this difference was statistically significant.
CERVICAL CANCER SCREENING RECOMMENDATIONS
In 2020, the American Cancer Society (ACS) updated their recommendations for cervical cancer screening. Their recommendations are that “ individuals with a cervix initiate cervical cancer screening at age 25 and undergo primary HPV testing every 5 years through age 65 (preferred). If primary HPV testing is not available,
37 American Cancer Society. (2019, January 24). Breast cancer screening guidelines faqs: FAQ breast cancer. Breast Cancer Screening Guidelines FAQs | FAQ Breast Cancer | American Cancer Society. https://www.cancer.org/cancer/types/breast-cancer/frequently- asked-questions-about-theamerican-cancer-society-new-breast-cancer-screening-guideline.html
individuals aged 25-65 years should be screened with co-testing (HPV testing in combination with cytology) every 5 years or cytology alone every 3 y ears (acceptable) (strong recommendation)”*. As well, “The ACS recommends that individuals with a cervix who are older than age 65, who have no history of cervical intraepithelial neoplasia grade 2 or a more severe diagnosis within the past 25 years, and who have documented adequate negative prior screening in the 10-year period before age 65 discontinue cervical cancer screening with any modality (qualified recommendation)”*.38 A Pap test is conducted as part of cervical cancer screening.39
*”A strong recommendation conveys the consensus that the benefits of adherence to that intervention outweigh the undesirable effects that may result fr om screening. Qualified recommendations indicate there is clear evidence of benefit of screening but less certainty about the balance of benefits and harms or about patients' values and preferences, which could lead to different decisions about screening.”
CERVICAL CA NCER SCREENING IN DELAWARE
The BRFS has collected data on cervical cancer screening in Delaware annually from 1995 to 2000 and biannually since then. In 2020 the BRFS showed that:
• Seventy-seven percent of Delaware women aged 21 to 65 years reported that they had had a Pap test within the previous three years, compared to the nation median of 80% among U.S. women of the same ages. Delaware ranked 31st highest among all states.
• In Delaware, the prevalence of receiving a Pap test in the past three years was slightly lower for Hispanic females (80%) compared to non-Hispanic White females and non-Hispanic Black females (78% vs. 83%, respectively). However, this difference was not statistically significant.
• As age increases, the prevalence increases for receiving a Pap smear within the past three years. Delaware women aged 21 to 30 had the lowest prevalence (67%) of receiving a Pap test in the past three years. The prevalence increases to 82% among Delaware women aged 46 to 55. However, this increase in screening compliance as age increase was not statistically significant.
• In Delaware, women aged 21 to 65 years with an annual household income of less than $15,000 (70%) had the lowest prevalence of receiving a Pap test within the past three years. Delaware women aged 21 to 65 with an annual household income of $50,000 or more (82%) had the highest prevalence of receiving a Pap test within the past three years. Differences among the different annual household income groups was not significant.
• Delaware women without a high school diploma had the lowest percentage of reporting having a Pap test within the past three years (59.2%). The percentage of Delaware women reporting having a Pap test in the past three years increased to 83.4% among women with a college degree. This difference between the lowest educational attainment category and the highest educat ional attainment category was statistically significant.
38 Fontham ETH, Wolf AMD, Church TR, Etzioni R, Flowers CR, Herzig A, Guerra CE, Oeffinger KC, Shih YT, Walter LC, Kim JJ, Andrews KS, DeSantis CE, Fedewa SA, Manassaram-Baptiste D, Saslow D, Wender RC, Smith RA. Cervical cancer screening for individuals at average risk: 2020 guideline update from the American Cancer Society. CA Cancer J Clin. 2020 Sep;70(5):321-346. doi: 10.3322/caac.21628. Epub 2020 Jul 30. PMID: 32729638. https://acsjournals.onlinelibrary.wiley.com/doi/full/10.3322/caac.21628
Delaware Department of Health and Social Services, Division of Public Health 52 Cancer Incidence and Mortality in Delaware, 2016-2020 October 2023
COLORECTAL CANCER SCREENING RECOMMENDATIONS
The ACS and Delaware Cancer Consortium (DCC) colorectal cancer screening guidelines recommend that at 50 years of age, males and females at average risk of developing colorectal cancer should use one of the following screening options40:
a. Fecal occult blood tests (FOBT) every year
b. Fecal immunochemical test (FIT) every year
c. Flexible sigmoidoscopy every five years
d. Double-contrast barium enema every five years
e. Computed tomography (CT) colonography (virtual colonoscopy) every five years
f. Colonoscopy every 10 years.
For options ‘a’ through ‘e,’ a follow-up colonoscopy should be performed if results from an initial screening test are positive. ACS and DCC screening guidelines offer suggested screening schedules for individuals with an elevated risk of developing colorectal cancer.
COLORECTAL CANCER SCREENIN G IN DELAWARE
Data from the 2020 BRFS provides information on colorectal cancer screening patterns among Delawareans:
• Delaware ranked 10th highest in the prevalence (77%) of adults aged 50 to 74 years who reported meeting the U.S. Preventive Services Task Force (USPSTF) recommendations for colorectal screening. The U.S. national median for meeting the USPSTF recommendation for colorectal cancer screening was 7 4%.
• The percentage of Delawareans who met the USPSTF recommendation for colorectal cancer screening increased by age group. Significantly more Delawareans aged 60 to 69 years and aged 70 to 75 years (81% and 89%, respectively) reported meeting the recommendation, compared to those aged 50 to 59 years (66%).
• The prevalence of non-Hispanic Whites aged 50 to 74 years in Delaware who met the USPSTF recommendation for colorectal cancer screening (78%) was lower compared to the prevalence for nonHispanic Black Delawareans (80%). However, this difference was not statistically significant.
• In Delaware, the prevalence of adults aged 50 to 74 years who met the USPSTF colorectal cancer screening increased by education level.
• As income increases, so does the prevalence of meeting the USPSTF recommendation for colorectal cancer screening. Delawareans who reported having the recommended colorectal cancer screenings differed significantly between income levels: 62% of Delaware adults in the lowest income category (less than $15,000 annual household income) reported meeting the USPSTF recommendation, compared to 79% in the highest income category ($50,000 or more).
LUNG CANCER SCREENING RECOMMENDATIONS
In January 2013, the ACS published new lung cancer screening guidelines41 that recommend that doctors discuss screening options with patients who meet certain criteria for high risk of developing the disease. Highrisk patients are defined as those who:
40 Detailed screening guidelines for colorectal cancer: https://www.cancer.org/cancer/types/colon-rectal-cancer/detection-diagnosis-staging/acsrecommendations.html
41 Wender, R., Fontham, E. T., Barrera, E., Jr, Colditz, G. A., Church, T. R., Ettinger, D. S., … Smith, R. A. (2013). American Cancer Society lung cancer screening guidelines. CA: a cancer journal for clinicians, 63(2), 107–117. Retrieved from https://www.ncbi.nlm.nih.gov/pmc/articles/PMC3632634/
• Are aged 55 to 74 years and in fairly good health
• Have a smoking history equivalent to a pack a day for 30 years or longer
• Currently smoke or have quit within the past 15 years.
If a high-risk individual decides to be screened for lung cancer, the ACS recommends that the testing be performed using a low dose computed tomography (CT) scan at a facility with experience in lung cancer screening. The guidelines emphasize that screening is not a substitute for quitting smoking.
LUNG CANCER SCREENING IN DELA WARE
Data from the 2020 BRFS provides information on lung cancer screening patterns among Delawareans:
• It is estimated that approximately 8% of Delaware adults between the ages of 55 and 80 may be eligible for lung cancer screening
• The vast majority of Delaware adults eligible for lung cancer screening are White (93% ). Therefore, breakdowns by race/ethnicity cannot be reported.
• Of Delaware adults eligible for lung cancer screening, only 14.6% reported having a CT scan to screen for lung cancer.
• Of Delaware adults eligible for lung cancer screening, there were no differences between Delaware males (16.2%) and Delaware females (14%) who reported having a CT scan to screen for lung cancer.
• Due to the low percentage of Delaware adults who are eligible being screened for lung cancer, breakdowns by annual household income and educational attainment cannot be reported due to small sample size.
PROSTATE CANCER SCREENING RECOMMENDATIONS
The ACS recommends that males make an informed decision with their health care provider about whether to be screened for prostate cancer. Males should receive information from their doctors about the risks and possible benefits of prostate cancer screening. Males should not be screened unless they receive this information42.
The DCC recommends the following prostate cancer screening guidelines for Delaware males:
• ‘No mass’ prostate cancer screening efforts
• Promote education for informed prostate cancer screening decision-making.
• Screening in males older than 75 years of age is less desirable; however, screening decisions should be made on an individual basis.
• Screening is not recommended for males with a life expectancy of less than 10 years.
• Offer screening for individuals considered to be at average risk for the disease beginning at 50 years of age, using an informed decision-making process.
• High-risk individuals should be encouraged to be screened starting at 40 years of age if they:
o Have first-degree relatives with prostate cancer
o Are non-Hispanic Black males
o Have family or personal history of BRCA1 or BRCA2 gene.
• Screening at one- to two-year intervals via prostate specific antigen (PSA) test, with or without digital rectal exam (DRE).
42 American Cancer Society; Prostate Cancer: Early Detection. American Cancer Society Recommendations for Prostate Cancer Early Detection | American Cancer Society
Delaware Department of Health and Social Services, Division of Public Health 54 Cancer Incidence and Mortality in Delaware, 2016-2020
PROSTATE CANCER SCREENING IN DELAWARE
Data from the 2020 BRFS provides information on the prevalence of prostate cancer screening among Delaware males:
• Thirty-three percent of Delaware males 40 years of age and older reported having had a PSA blood test in the past two years, compared to the national median prevalence of 32%. Delaware ranked 15th highest in the nation.
• The prevalence of Delaware males who received a PSA test within the past two years increased with age: 25% of males aged 50 to 59 years were tested, compared to 51% of males aged 65 years and older. This difference was statistically significant.
• In Delaware, there was no statistically significant difference in the prevalence of having a PSA test within the past two years between non-Hispanic White males (36%) and non-Hispanic Black males (26%).
• As the level of education increased, the prevalence of Delaware males who had a PSA test within the past two years increased. Only 19% of Delaware males with less than high school education reported having a PSA test within the past two years, compared to 41% of Delaware males who graduated from college. This difference was statistically significant.
• According to the 2018 BRFS, 44% of Delaware males reported making the decision together with their health care provider to have the PSA test done. Another 26% of Delaware males made the decision with one or more other person. Only 16% of Delaware males made the decision to have the PSA test done alone. Data about prostate cancer screening decision making was last asked in 2018.
APPENDIX E: BEHAVIORAL RISK FACTORS
CURRENT TRENDS IN SMOKING IN DELAWARE
The Behavioral Risk Factor Survey (BRFS) collects data annually on tobacco use among the Delaware population. Current smoking trends may be predictive of cancer rates in the 2030s. In the 1980s , the time period relevant to current lung cancer rates in terms of tobacco use behaviors, Delaware’s smoking prevalence rates were among the highest in the country. Historical BRFS data show that in 1982, 30% of adult Delawareans smoked cigarettes. By the 1990s, Delaware’s smoking rate among adults had declined to approximately 25%.
In recent years, tobacco use prevalence has continued to slowly decline among adult Delawareans and among high school students. In 2021, 15% of adult Delawareans smoked cigarettes regularly. The following data highlights smoking trends in Delaware in 2021:
• The prevalence for current smokers in Delaware (13%) is almost the same as the 2020 U.S. median prevalence of 14%.
• Delaware adult males (16%) had a significantly higher current smoking prevalence compared to Delaware females (11%)
• There were no differences in current smoking prevalence among non-Hispanic White (14%) and nonHispanic Black (13%) in Delaware
• When smoking prevalence was stratified by age group, Delawareans aged 35 to 44 reported the highest prevalence of current smoking (21%). This prevalence was statistically significantly higher compared to that for Delawareans 65 years of age and older.
• Current smoking prevalence changed with education attainment. In Delaware, 22% of residents who did not complete their high school education said they were current smokers. As education level increased, smoking prevalence decreased. Nineteen percent of Delaware adults who reported having a high school diploma or its equivalent reported being a current smoker, compared to 13% with some post-high school education, and 5% who completed college.
• Current smoking prevalence also decreased with higher income levels. In Delaware, 30% of Delaware adults with a household income between $15,000 and $24,000 were current smokers. The lowest smoking prevalence was among those who earned $ 100,000 to $199,999 per year (7%).
OVERWEIGHT/OBESITY
Being overweight or obese is a risk factor for numerous cancers, including female breast, colorectal, kidney, and uterine cancers. In addition, being overweight or obese is a major risk factor for other chronic diseases, including coronary heart disease, type 2 diabetes, and stroke.43
The Centers for Disease Control and Prevention (CDC) defines overweight as a body mass index (BMI) from 25 to less than 30 and obese as a BMI equal to or greater than 30. BMI is calculated using an individual’s height and weight44 The following data are specific to the 2021 Delaware BRFS:
43 Centers for Disease Control and Prevention. (2023, August 9). Obesity and cancer https://www.cdc.gov/cancer/obesity/index.htm
44 About BMI for Adults, http://www.cdc.gov/healthyweight/assessing/bmi/adult_bmi/index.html
• In Delaware, 69% of adults aged 18 years and older were overweight or obese in 20 21, compared to the national median of 68%.
• In 2021, the prevalence of being overweight in Delaware differed significantly by sex: 40% of males and 30% of females were overweight.
• The prevalence of obesity among adult Delawareans did not differ by sex: 3 2% of males and 36% of females were obese in 2021
• In 2021, the prevalence of being overweight was the same for non-Hispanic White (36%) and non-Hispanic Black (36%) Delawareans.
• In Delaware, non-Hispanic Blacks (40%) had a higher prevalence of obesity than non-Hispanic Whites (32%) in 2021. This difference was not statistically significant.
• In 2021, the prevalence of being overweight was highest among Delaware college graduates (36%).
• In 2021, as education increases, the prevalence of obesity decreases. However, there were no statistica lly significant differences among educational attainment groups.
• In 2021, there were no significant differences in obesity among those with different annual household incomes; adults with annual household income less than $15,000 had the highest obesity prevalence (45%).
• Among Delawareans in 2021, the prevalence of obesity was highest among those aged 45 to 54 years (40%).
PHYSICAL ACTIVITY
Lack of physical activity is a substantiated risk factor for colorectal cancer and a suspected risk factor for other cancers.45 The benefits of regular, sustained physical activity includes reduced risk for chronic diseases including coronary heart disease, stroke, and type 2 diabetes; and improved well-being.46
The 2021 Delaware BRFS asks a question about participating in any physical activities in the past month.
The following data are from the 2021 Delaware BRFS:
• In Delaware, 73% of adults 18 years of age and older participated in any physical activities in the past month, similar to the national median of 76%.
• There was no difference in physical activity by race/ethnicity. In 2021, 75% of non -Hispanic Whites, 72% of non-Hispanic Blacks, and 83% of Hispanics participated in physical activity in the past month.
• More Hispanic (46%) and Black Delawareans (43%) did not meet aerobic or strengthening guidelines than Whites (33%). This difference was statistically significant.
• Significantly more college graduates participated in physical activity compared to any other educational attainment. In 2021, 84% of college graduates participated in physical activity, compared to 74% of adults with some post high school education and 69% of adults with a high school diploma or GED. Likewise, statistically fewer Delaware adults with less than a high school diploma (48%) participated in physical activities in the past month.
45 Centers for Disease Control and Prevention. (2022, April 27). Physical activity and cancer https://www.cdc.gov/physicalactivity/basics/pahealth/physical-activity-and-cancer.html
46 Centers for Disease Control and Prevention. (2021, July 7). Adults with chronic health conditions and disabilities https://www.cdc.gov/physicalactivity/basics/chronic-health-conditions-and-disabilities.html
• Delawareans in lower income categories reported a statistically significantly lower prevalence of participating in physical activities in the past month (52% of those earning less than $15,000; 59% of those earning $15,000 to $24,999 did not meet the guidelines). This compares to Delawareans in the highest income category, where 89% of those earning $200,000 or more per year participated in physical activities in the past month.
DIETARY FRUITS AND VEGETABLES
A diet high in fruits and vegetables is a protective factor against numerous cancers, including cancers of the breast, cervix, colon/rectum, uterus, esophagus, oral cavity, ovary, pancreas, prostate, and stomach. These questions are asked every other year 47
The following data are from the 2021 Delaware BRFS:
• In Delaware, 40% of adults consumed fruit less than one time per day, the same as the national median (40%).
• In 2021, 39% of Delaware adult females consumed fruit less than one time per day, compare d to 43% of Delaware adult males. This difference was not statistically significant.
• There were no differences observed by race/ethnicity for fruit consumption: 41% of non -Hispanic Whites, 40% of non-Hispanic Blacks, and 31% of Hispanics consumed fruit less than one time per day.
• In Delaware, 21% of adults consumed vegetables less than one time per day, almost the same as the national median (20%).
• Delaware adult females reported consuming vegetables more often per day than Delaware adult males. In 2021, 26% of Delaware adult males consumed vegetables less than one time per day, compared to 16% of Delaware adult females.
• There were differences in daily vegetable consumptions by race/ethnicity groups. Only 16% of Delaware non-Hispanic Whites reported consuming vegetables less than one time per day, compared to 28% of nonHispanic Blacks and 44% of Hispanics. The difference between non-Hispanic Whites and non-Hispanic Blacks and Hispanics was significantly different.
47 National Cancer Institute. (2023, August). Cancer Trends Progress Report: Fruit and vegetable consumption. Fruit and Vegetable Consumption. https://progressreport.cancer.gov/prevention/fruit_vegetable
Delaware Department of Health and Social Services, Division of Public Health
58 Cancer Incidence and Mortality in Delaware, 2016-2020 October 2023
LUNG CANCER
•
•
“I’m
Ask about a prostate cancer screening, and you’re asking for so much more.
Approximately one in eight men will be diagnosed with prostate cancer during their lifetime, but one simple screening can help detect cancer when it’s most treatable. If you’re 40 or older, or have a family history of prostate cancer, ask your health care provider if and how often you should be screened. Don’t have insurance? You could be eligible for a free screening. Visit HealthyDelaware.org/Prostate or call 2-1-1 to learn more.
LEXICON
Chemoprevention
e use of medicine, vitamins, or other substances to help prevent or delay cancer from developing in people at high risk.
Hyperendemic
A disease constantly present at a high level of occurrence in a speci c area or group of people.
Incidence
e rate of new cases over a speci ed period of time, for the population at risk of the disease.
Malignancy
e state or presence of a malignant tumor, in which abnormal cells divide without control and can invade nearby tissue.
Mortality
Death (in this case, due to a disease or condition).
Polygenic
A group of genes interacting to form a certain disease or trait.
Prevalence
e proportion of a population a ected by a medical condition at a speci c time.
Prophylactic
Intended to prevent disease.
Tumorigenesis
e production or formation of a tumor or tumors.
RESOURCES
National Resources
American Association for Cancer Research – https://aacr.org
American Cancer Society – https://www.cancer.org/
Cancer Facts and Statistics: – https://www.cancer.org/research/cancer-facts-statistics.html
Cancer Care – https://www.cancercare.org/helpinghand/
Centers for Disease Control and Prevention – https://www.cdc.gov/cancer/index.html
National Cancer Institute – https://www.cancer.gov/resources-for/patients
National Comprehensive Cancer Network – https://www.nccn.org
Oncolink – https://www.oncolink.org/
Delaware Resources
American Cancer Society: Delaware Chapter – https://www.cancer.org/about-us/local/delaware.html
Cancer Support Community: Delaware – https://cancersupportdelaware.org/
Christiana Lung Cancer Screening Program –https://christianacare.org/us/en/care/cancer-care/multidisciplinary-care/lung-health-and-screening-program
Delaware Breast Cancer Coalition – https://debreastcancer.org/
Delaware Cancer Action Center – https://www.fightcancer.org/states/delaware
Delaware Cancer Consortium – https://www.dhss.delaware.gov/dph/dpc/consortium.html
Delaware Cancer Treatment Program – https://dhss.delaware.gov/dph/dpc/catreatment.html
Delaware Department of Human Resources: Cancer Resources – https://dhr.delaware.gov/benefits/cancer/index.shtml
Helen F. Graham Cancer Center & Research Institute – https://christianacare.org/us/en/facilities/helen-f-graham-cancer-center
Healthy Delaware: Cancer Support Services –https://www.healthydelaware.org/Individuals/Cancer/Get-Help/Cancer-Support-Resources#programs
Incyte Cancer Care Assistance Fund –https://cancersupportdelaware.org/resources/incyte-cancer-care-assistance-fund/
Screening for Life Program – https://dhss.delaware.gov/dph/dpc/sfl.html
If you’re 45 or older, have a family history, or are experiencing symptoms of colon cancer — including bloody stools, cramping, and weight loss— talk to your health care provider about getting screened.
Don’t have a health care provider? A screening nurse navigator can help you schedule a screening at no cost. And if you’re uninsured or underinsured, you could be eligible for a free screening through the Division of Public Health’s Screening for Life program.
To learn more, visit HealthyDelaware.org/Colon or call 2-1-1.
Public Health Delaware Journal of Submission Guidelines
updated March, 2024
About the Journal
Established in 2015, The Delaware Journal of Public Health is a peer-reviewed electronic publication created by the Delaware Academy of Medicine/Delaware Public Health Association. The publication acts as a repository of news for the medical, dental, and public health communities, and is comprised of upcoming event announcements, past conference synopses, local resources, peer-reviewed content ranging from manuscripts and research papers to opinion editorials and personal interest pieces, relating to the public health sector. Each issue is largely devoted to an overarching theme or current issue in public health.
The content in the DJPH is informed by the interest of our readers and contributors. If you have an event coming up, would like to contribute an Op-Ed, would like to share a job posting, or have a topic in public health you would like to see covered in an upcoming issue, please let us know.
If you are interested in submitting an article to the Delaware Journal of Public Health, or have any additional inquiries regarding the publication, please contact the managing editor at managingeditor@djph.org, or the publisher at ksmith@delamed.org.
Information for Authors Submission Requirements
The DJPH accepts a wide variety of submission formats, including brief essays, opinion editorials pieces, research articles and findings, analytic essays, news pieces, historical pieces, images, advertisements pertaining to relevant, upcoming public health events, and presentation reviews. Additional types of submission not previously mentioned may be eligible, please contact a staff member for more information.
The initial submission should be clean and complete, without edits or markups, and contain both the title and author(s) full name(s). Submissions should be 1.5 or double spaced with a font size of 12. Once completed, articles should be submitted via the submission page at https://djph.org/submissions/submit-an-article/ Graphics, images, info-graphics, tables, and charts are welcome and encouraged to be included in articles. Please ensure that all pieces
are in their final format, and all edits and track changes have been implemented prior to submission. To view additional information for online submission requirements, please refer to the DJPH website: https://djph.org/submissions/submit-an-article/
Trial registration information is required for all clinical trials and must be included in the final article and/or abstract.
Abstracts
Authors must submit a structured or unstructured abstract along with their article. Abstracts will have a maximum of 200 words, including headings. Structured abstracts should employ 4-5 headings, and may include Objectives, Methods, Results, and Conclusions. A fifth heading, Policy Implications, may be used if relevant to the article. All abstracts should provide the date(s) and location(s) of the study if applicable, as well as any trial registration information.
Submission Length
While there is no prescribed word length, full articles will generally be in the 2,500-4,000word range, and editorials or brief reports will be in the 1,500-2,500-word range. If there are any questions regarding the length of a submission or APA guidelines, please contact a staff member.
Copyright
The journal and its content is copyrighted by the Delaware Academy of Medicine / Delaware Public Health Association (Academy/DPHA). The contents are licensed under Creative Commons License – CC BY-NC-ND (https://creativecommons.org/licenses/by-nc-nd/4.0/).
Images are NOT covered under the Creative Commons license and are the property of the original photographer or company who supplied the image.
Opinions expressed by authors of articles summarized, quoted, or published in full within the DJPH represent only the opinions of those authors and do not necessarily reflect the official policy of the Academy/DPHA, the DJPH, or the institution with which the authors are affiliated.
Con icts of Interest
Any conflicts of interest, including political, financial, personal, or academic conflicts, must be declared prior to the submission of the article, or in conjunction with a submission. Conflicts of interest are any competing interests that may leave readers feeling misled or deceived, and/or alter their perception of subject matter. Declared conflicts of interest will be published alongside articles in the final publication.
Nondiscriminatory Language
Use of nondiscriminatory language is required in all DJPH submissions. The DJPH reserves the right to reject any submission found to be using sexist, racist, or heterosexist language, as well as unethical or defamatory statements.