21 minute read
On the development and application of airborne GPR solutions


Jesper Emilsson1*, Johan Friborg1, Jaana Gustafsson1, Jimmy Adcock1 and Andreas Viberg1 discuss the impact of an airborne attena solution on footprint, unwanted signal input and signal loss.
Abstract Recent development of ground penetrating radar (GPR) technology, together with effective unmanned aerial vehicles (UAVs), have made it possible to carry out airborne GPR measurements across areas otherwise difficult to access and survey. The interest in airborne GPR studies has therefore been rising steadily in recent years and applications are many, including bathymetry, glaciology, archaeology, near-surface geology, ice- and snow thickness, road planning, peat, and wetland studies.
Advertisement
However, airborne GPR measurements introduce several challenges that affect surface-based measurements to a lesser extent. Some of these challenges are regulatory, others of a more technical nature. In this article, we will discuss the effects an airborne antenna solution has on antenna footprint, unwanted signal input and signal loss. We will also describe a few scenarios where airborne GPR has been successfully used. Throughout the included studies, and depending on the application, different MALÅ GeoDrone antennas (developed and manufactured by Guideline Geo) have been used. At this point, it is also important to remind the reader the importance of adhering to local and regional regulations regarding the use of both UAV and GPR equipment.
Introduction Anyone involved in geophysics realises the benefit of airborne measurements. Compared to ground-based techniques, airborne measurements offer the advantages of improved access and rapid sampling of data across larger areas. Traditionally, airborne geophysics involves aeroplanes or helicopters, making surveys expensive to perform and has therefore mostly been used by large exploration and mining companies, government departments including national geological surveys and other state-owned organisations. However, the development of UAVs and drone technologies has made it possible to cost efficiently perform small-scale studies using relatively inexpensive equipment and, as a result, the interest for unmanned airborne geophysical measurements has grown tremendously as of late.
Ground penetrating radar (GPR) is a near surface geophysical method based on the propagation of high-frequency electromagnetic (EM) waves in the range of 30 MHz to 3 GHz (Leckebusch 2003, Daniels 2004, Jol 2009). The development of GPR equipment and its applications has been rapid during the last 30 years and today it is routinely used in many different application areas – utility detection, concrete investigations, roads, and near-surface geology among others. Compared to other geophysical methods, GPR is very versatile, often delivering better resolution and at a much higher data collection speed. In recent years, cutting-edge GPR technology, together with the development of effective UAVs, have made it possible to carry lightweight GPR equipment, including high precision positioning devices, across areas that otherwise would be difficult to access.
Unmanned surface-based measurements using ground penetrating radar is a given, but unmanned aerial GPR surveys have been seen as a no-go-zone for different reasons. From a purely practical perspective, most commercially available airborne drones require the equipment to be very lightweight and the method normally requires precise positioning of data points which may be difficult from an airborne platform. Additionally, in many parts of the world there are complex regulatory issues to consider concerning the use of aerial drones for GPR measurements. However, the greater issues arise from the fact that ground penetrating radar is best and most effectively applied in direct contact with, or at least very near to, the surface of the media under investigation. If this is not the case, a number of technical challenges arise.
Technical challenges Footprint widening One immediate effect of using a GPR system at a distance from the ground surface is that the radar footprint in the ground will be larger. This effectively means that the resolution of an airlaunched GPR will be less than that of an equivalent ground-coupled system and there will be some horizontal smearing of features in the radargram.
To quantify this effect, let us make the simplified assumption that we are using a monostatic antenna configuration (i.e. transmitting and receiving are co-located) and that the footprint is approximately equal to the first Fresnel zone. The first Fresnel zone being defined as the area ‘illuminated’ at a depth from which all reflections arrive within half a wavelength. There are more elaborate ways to describe the antenna footprint, but this basic approximation will suffice to demonstrate the magnitude of the effect.
1 Guideline Geo AB * Corresponding author, E-mail: jesper.emilsson@guidelinegeo.com DOI: 10.3997/1365-2397.fb2022065
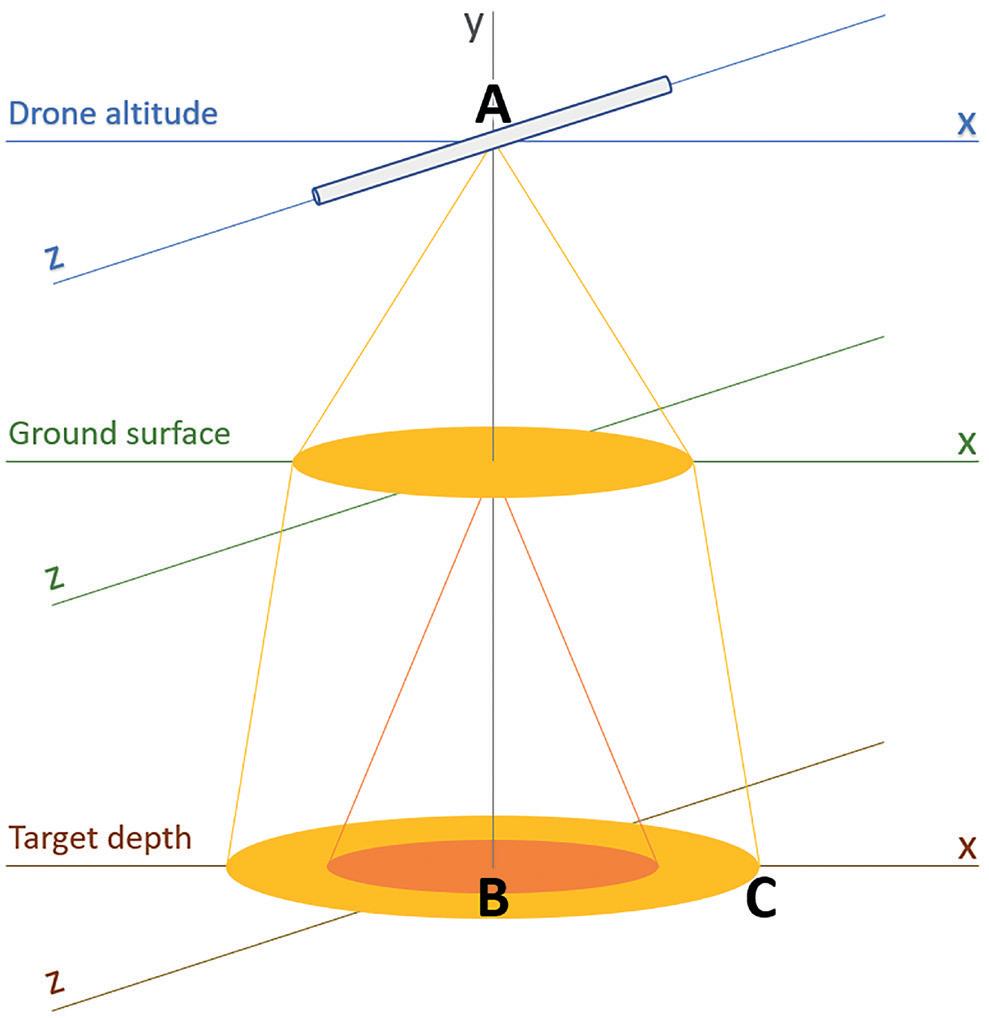
Figure 1 The geometry of ray paths and footprints for both an air-launched and ground-coupled antenna.
Figure 1 shows an example of the geometry of ray paths and footprints for both air-launched and ground-coupled antennas. It is interesting to note that the air-launched ray path bends strongly towards the normal when entering the ground, hence mitigating some of the spreading that occurs in the layer of air between the GPR antenna and the ground surface.
Looking at the time difference between ray paths AB and AC, we know that when this corresponds to a path difference of one quarter of a wavelength, C will be at the outer edge of the Fresnel footprint. Figure 2 shows, as an example, a comparison between the theoretical footprints for an air-launched and a ground-coupled 80 MHz antenna. The widening of the footprint is largest at shallow depth; at large depth the widening becomes insignificant. The effect increases with increasing permittivity and with increasing flight elevation.
Unwanted above-ground reflections One of the main issues with running a GPR well above the ground surface is that unwanted air-reflections from above-ground objects in the surroundings will contaminate the radargram. The higher the elevation, the bigger the effect of these unwanted reflections in the recorded data. Fortunately, air-reflections have
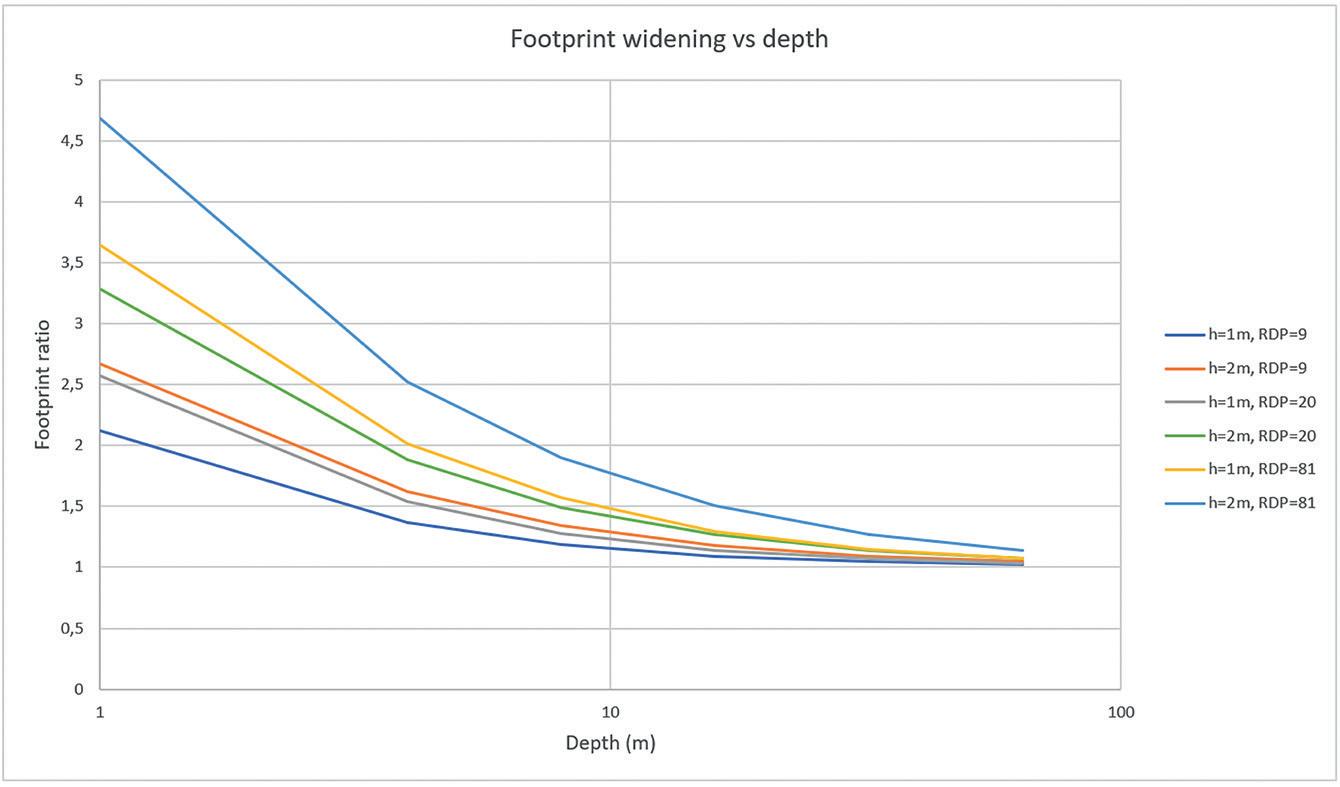
Figure 2 Example of the widening of the footprint for an 80 MHz antenna. The footprint ratio is the ratio of the air-launched footprint radius to the groundcoupled footprint radius. RDP is the relative dielectric permittivity.
of at least 15 to 20 m is achievable with a 100 MHz GPR system flown at an elevation of 1 m.
For a hypothetical average soil, the velocity would be about 100 m/ms resulting in a power loss of about 2.5 dB; a significant but in no way crippling amount of loss.
Field experiments – antenna elevation As an illustration of the above theoretical considerations, we performed a small experiment with an 80 MHz GeoDrone antenna suspended at different elevations. The experiment was carried out on a site dominated by sandy sediments, providing near-ideal conditions for the GPR. Figure 5 summarizes the results. Admittedly this is just a single example, but it agrees with the predictions. Under these favourable conditions, lifting the antenna off the ground will: 1) only lose a small amount of energy at the air-ground interface 2) lose some near-surface resolution, and 3) add some amount of unwanted air-reflections.
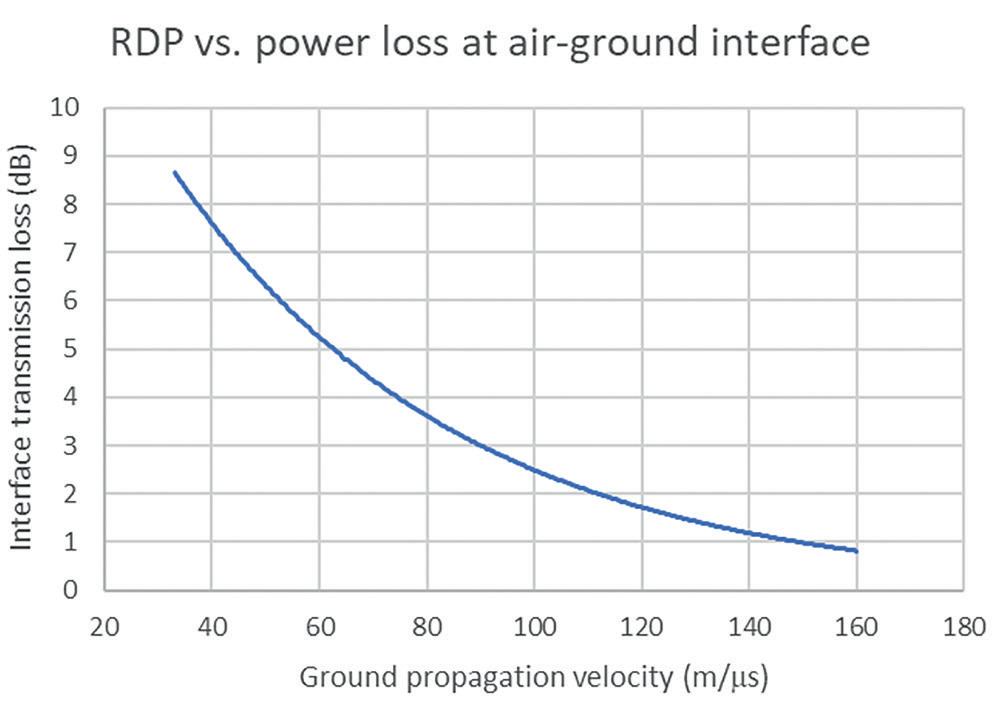
Figure 4 Power loss caused by the two-way passage of the radar wave through the air-ground interface.
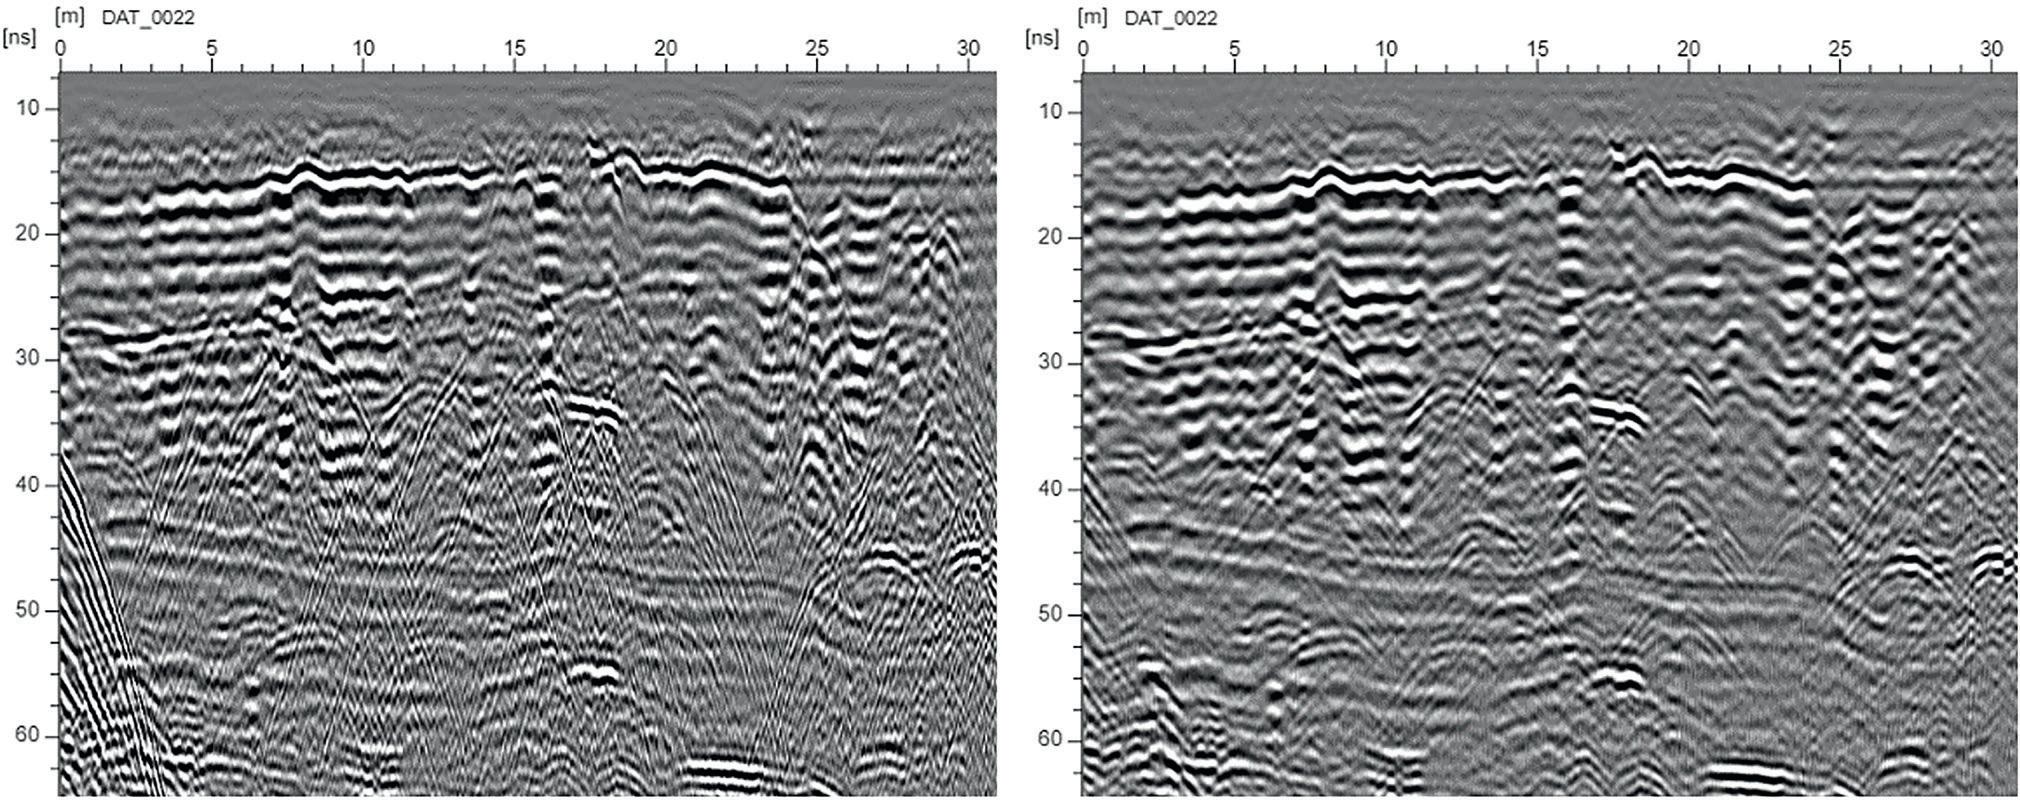
a fairly distinct appearance, and they can, to a large extent, be suppressed by removing events that indicate velocities near the speed of light from the radargram. Figure 3 shows an example of the efficacy of applying just such an air-reflection removal filter.
Power loss caused by surface reflection One often-mentioned issue that comes up when talking about air-launched GPR systems is the loss of depth penetration caused by the strong reflection of the radar wave at the air-ground interface. This is a real and significant effect, but how strong is it? Following Jiang and Georgakopoulous (2011) we can calculate the theoretical power loss that is caused by the two-way passage of the radar wave through the air-ground interface.
Figure 4 shows this theoretical loss as a function of the radar wave velocity at the ground surface, highlighting that the power loss increases with decreasing radar wave propagation velocity. The worst-case occurs above water (where velocities are at their lowest) and the loss is close to 9 dB, meaning that only about one eighth of the transmitted power will contribute to the imaging of the subsurface. Above water the main use case is bathymetry and lower frequency systems dominate. Our data archive demonstrates that, despite the power loss, depth penetration in non-saline water Case stories Applications are many and this article will conclude by describing a few scenarios where airborne GPR has been successfully used. Throughout the following studies, depending on the application, different MALÅ GeoDrone antennas have been used.
Securing hydropower production in Sweden – Courtesy of Vattenfall AB, Sweden In many places around the world, hydropower is an essential source of renewable energy. To secure electricity production in cold climates, it is of vital importance to continuously collect information regarding ice build-up around the power plant. This ice can result in a significant loss of power production depending upon its coverage, thickness, and structural integrity. Ice build-up not only causes head loss at the main intake but will also affect the performance of each individual water turbine in use (Karlsson 2009). Moreover, the horizontal load of the ice can affect dam safety, especially lower concrete dams (Johansson et al. 2013). Ice loads on dam structures are complicated to
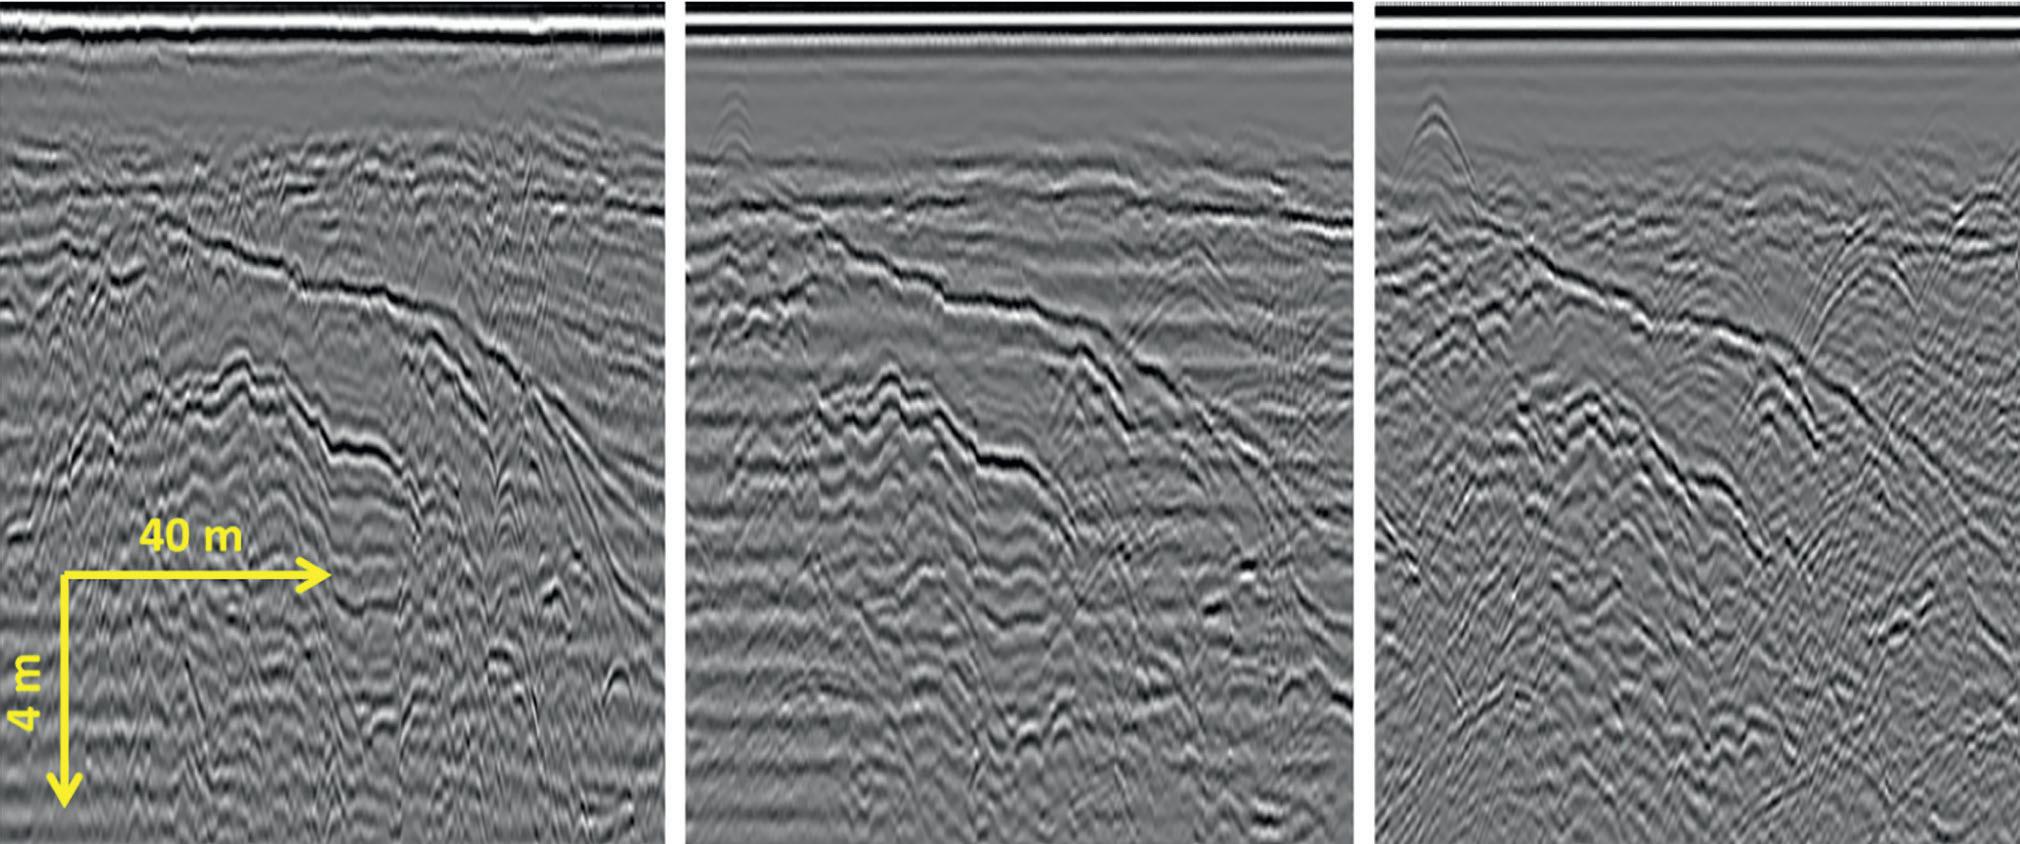
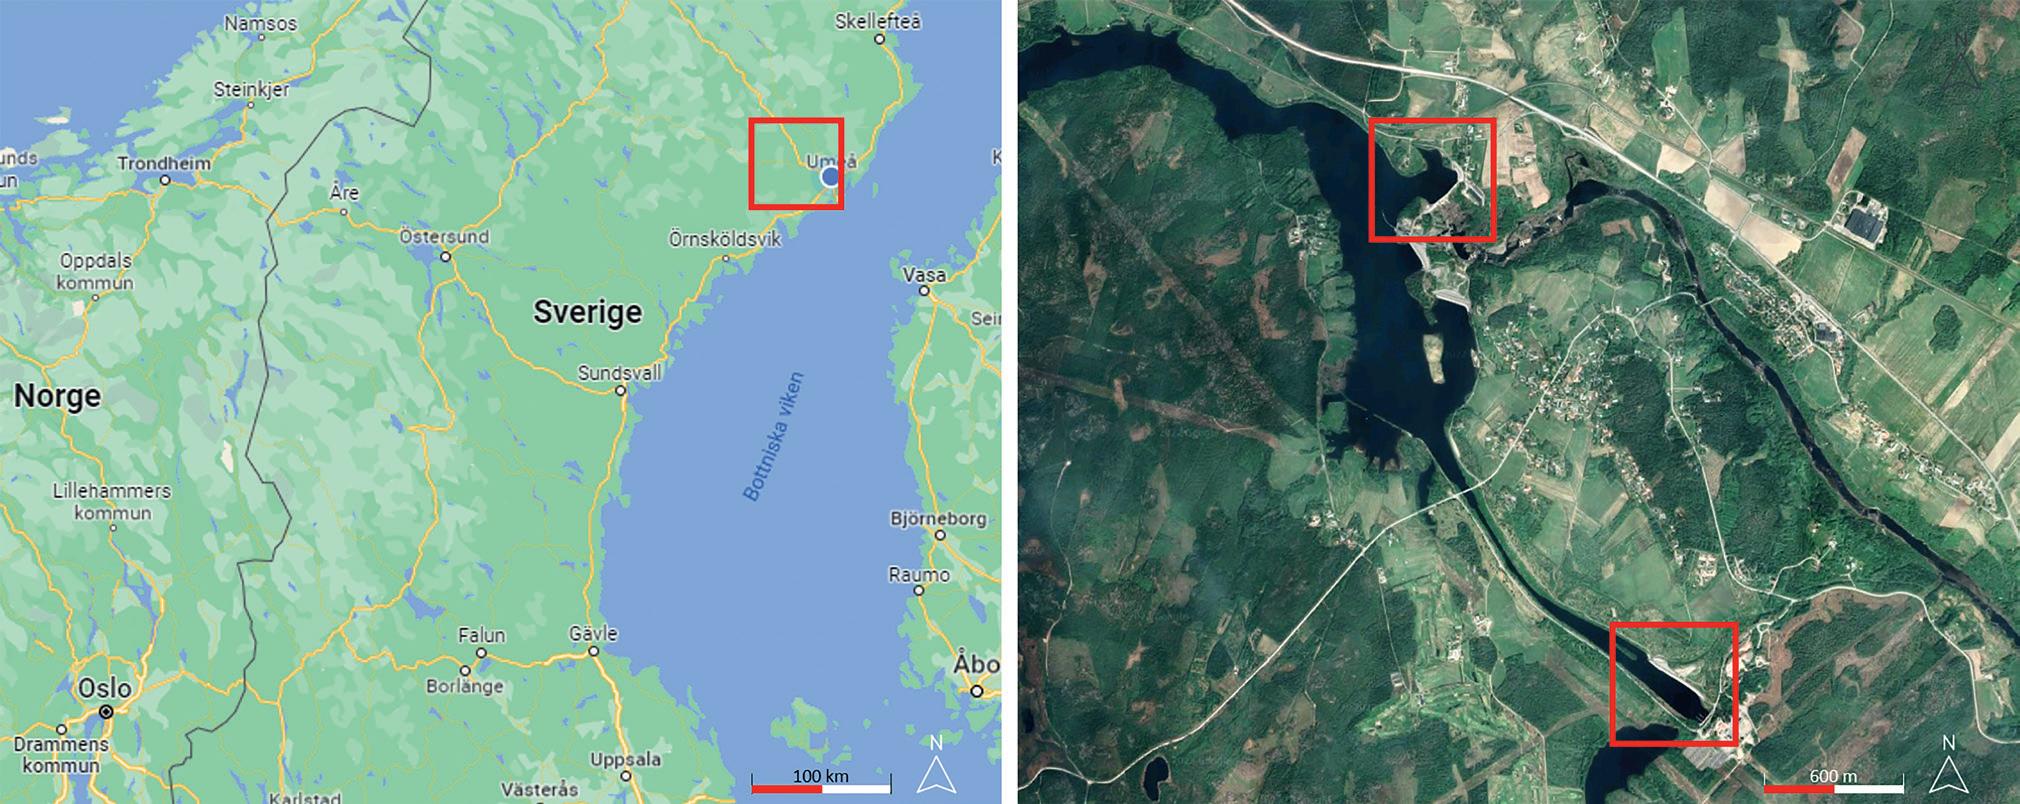
Figure 6 Left: Stornorrfors study area, northern Sweden; Right: Areas of interest, upper reservoir and main intake to power station.
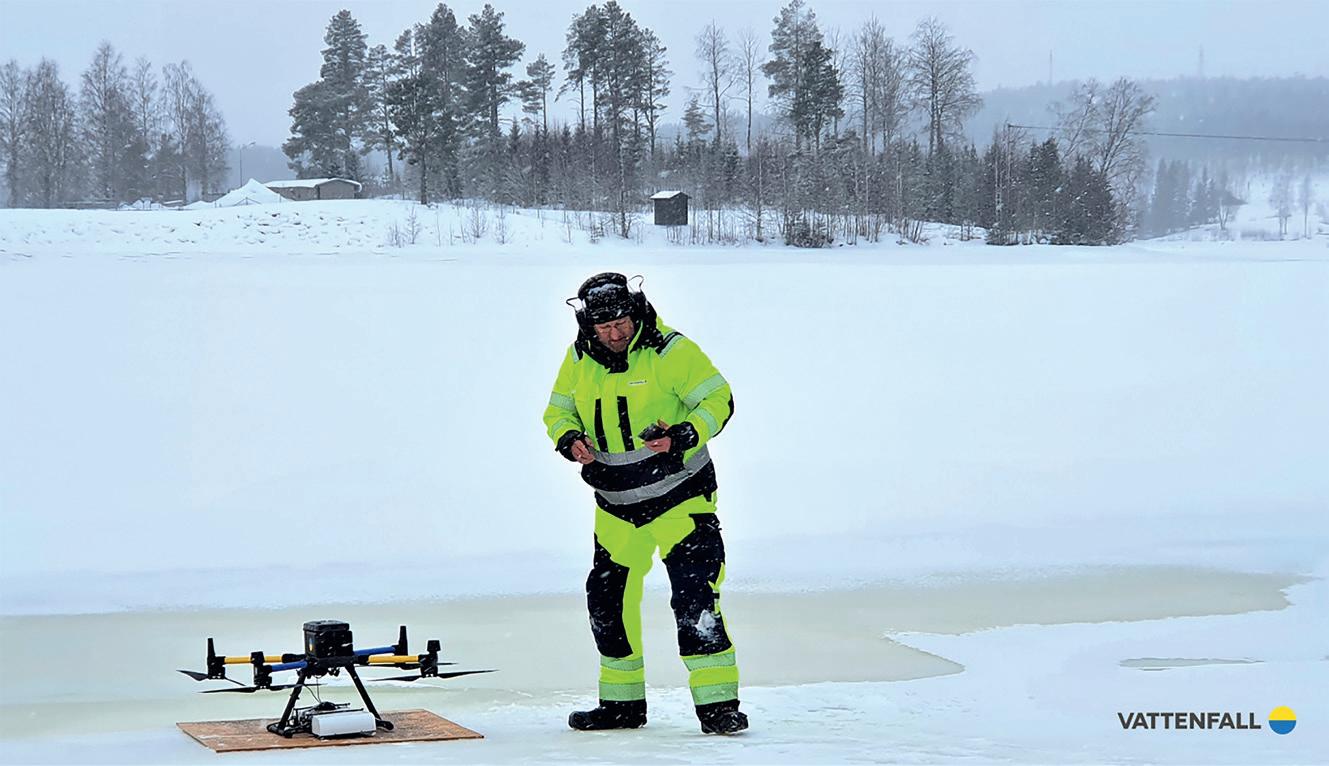
Figure 7 DJI Matrice 300 carrying the MALÅ GeoDrone 600 at the starting point near the upper reservoir.
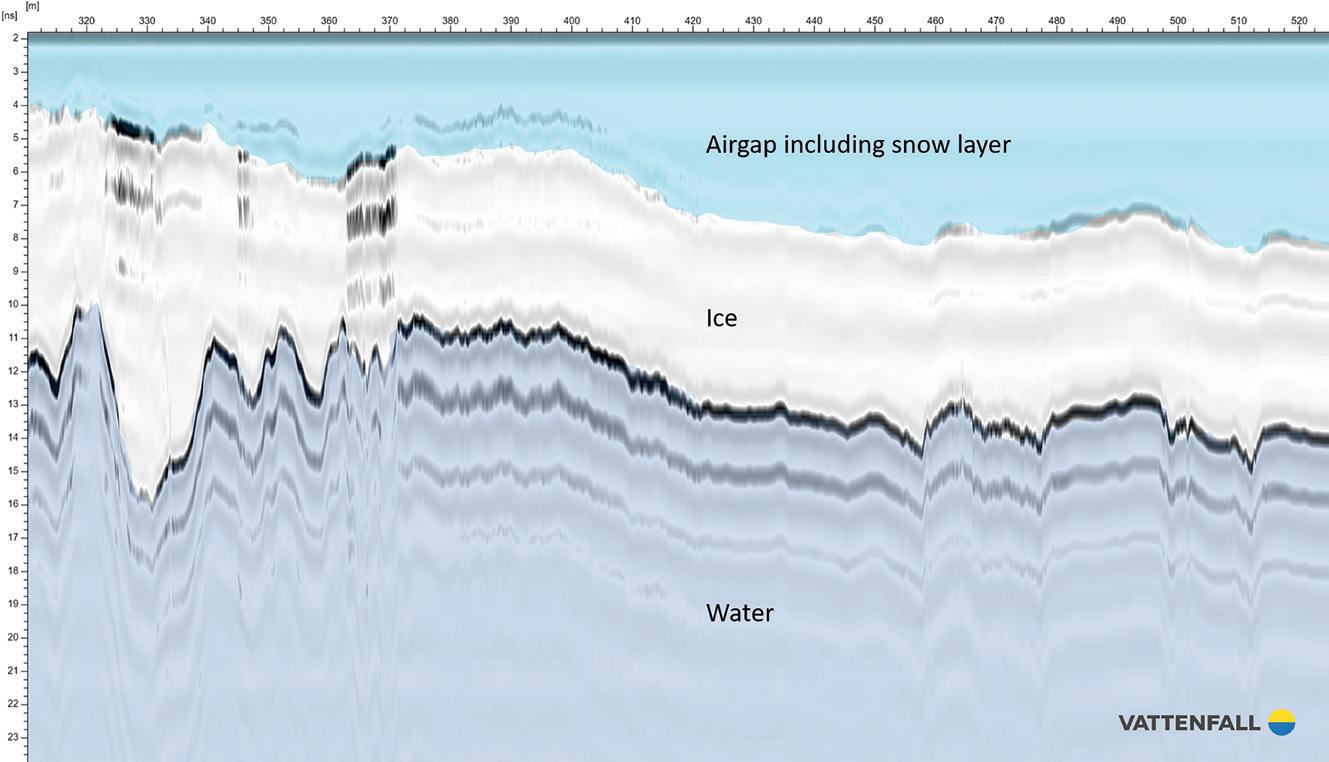
Figure 8 MALÅ GeoDrone 600 data including interpretation from upper reservoir dam. Data is displayed in MALÅ Vision with bandpass and background removal filters applied.
model and are influenced by many parameters but ice thickness is one of the most important elements (Hellgren 2022). Traditionally, ice thickness data is acquired, on foot, using drilling apparatus which is not only a safety issue but usually delivers too few data points to obtain an accurate model of the ice load. Moreover, the ice situation changes over the winter period, requiring repeated investigations throughout the season.
During the beginning of 2022, Vattenfall AB and Guideline Geo performed a feasibility study at one of their installations using an early version of the MALÅ GeoDrone 600 HDR antenna (Figure 6 and 7). For positioning the measurements, the built-in DGPS (SBAS) positioning system was used. The coordinate accuracy of the data is roughly +/-2 m and is considered sufficient for this study but is an area of improvement for future projects.
After velocity calibration and minor processing, data collected at the upper reservoir dam was mostly clear and easily interpreted (Figure 8). Coordinates for each data point and the interpreted thickness of the ice behind the upper dam was then exported and displayed on a map (Figure 9)
The MALÅ GeoDrone 600 antenna used in this project provided detailed and useful information from both the upper dam and from the more complex ice situation around the main intake to the power station. The centre frequency of 600 MHz proved to be a good choice for the application. The penetration through the ice cover, the resolution and resulting detail in the data were all very good.
This study proves that airborne GPR equipment can help with access to hazardous areas which then can be investigated safely and efficiently. Furthermore, in comparison to traditional methods, airborne GPR collects vast amounts of data points, thus helping to create better and more robust ice-load models.
Mapping volume change in European glaciers – Courtesy of ETH Zurich, Switzerland Due to ever increasing concern regarding the change in our global climate, the interest in mapping and monitoring of glaciers worldwide has risen dramatically. Not only are glaciers a sensitive indicator of the change in air temperature and precipitation, glaciers in mountain regions of the world are a critical water resource to local populations, providing a buffer to drought and a dependable supply of water during the dry season (Davies 2020).
Satellite-based remote sensing of glaciers is widely used to estimate their size and volume, but data is approximative at best. In situ measurements are preferable but field campaigns are time consuming and expensive. GPR has proven to be an excellent alternative method for mapping ice thickness and even structures of interest within and below the ice sheet. Ground-based GPR delivers excellent results but takes time to perform, especially since moving across the ice can be very dangerous. Helicop-
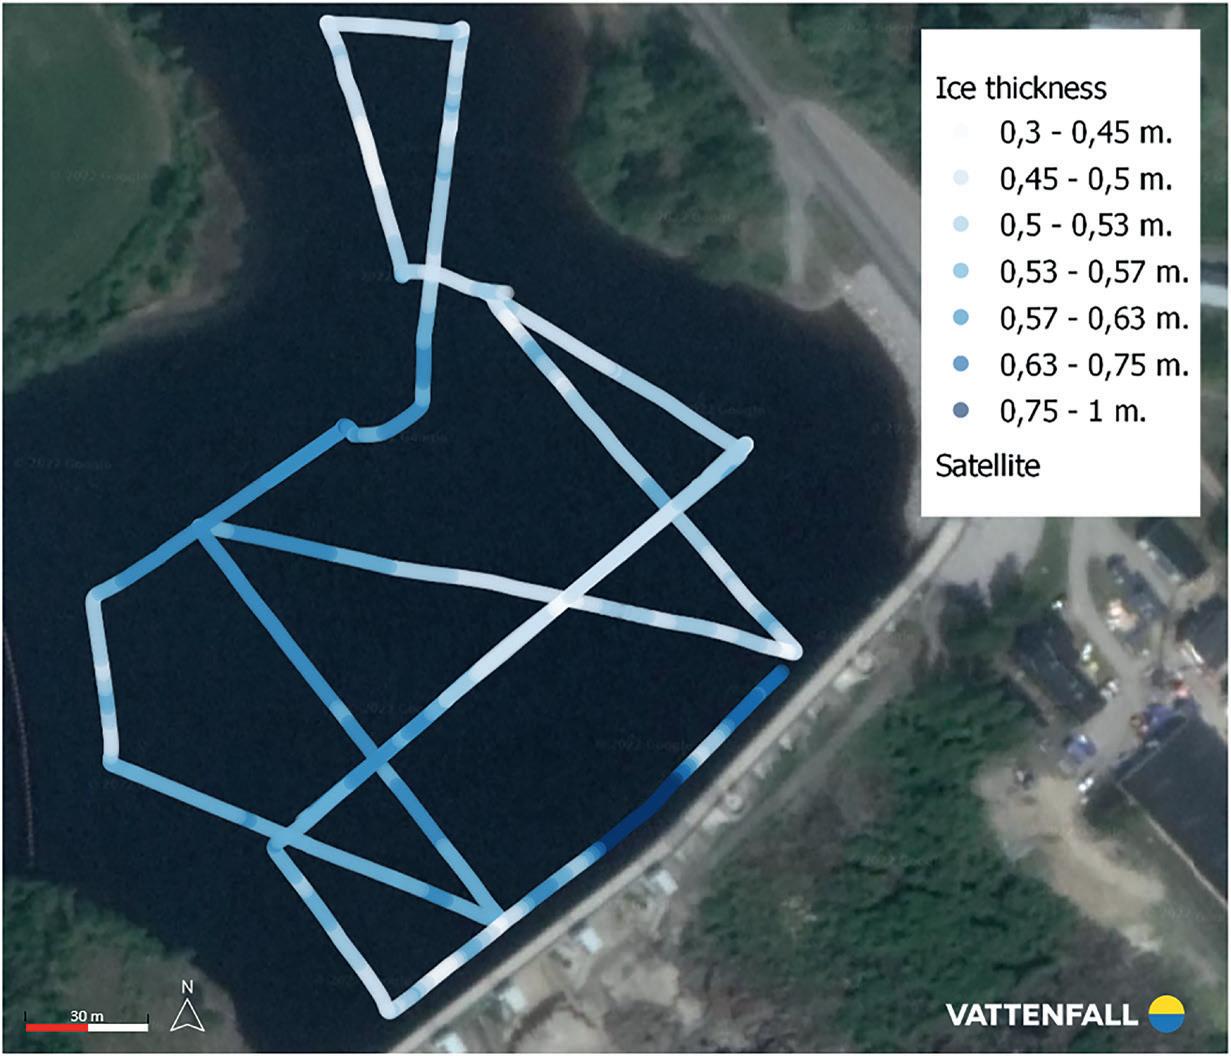
Figure 9 MALÅ GeoDrone ice-thickness results from upper reservoir dam.
ters are used for airborne measurements, but the ease of access comes at the expense of drastically increased campaign costs.
Small unmanned aerial systems (sUAS) using ground penetrating radar are advantageous from many perspectives. GPR delivers high-resolution data and the relative cost for undertaking UAV-GPR is low. It can be deployed rapidly over vast areas and it increases the safety situation of the operator.
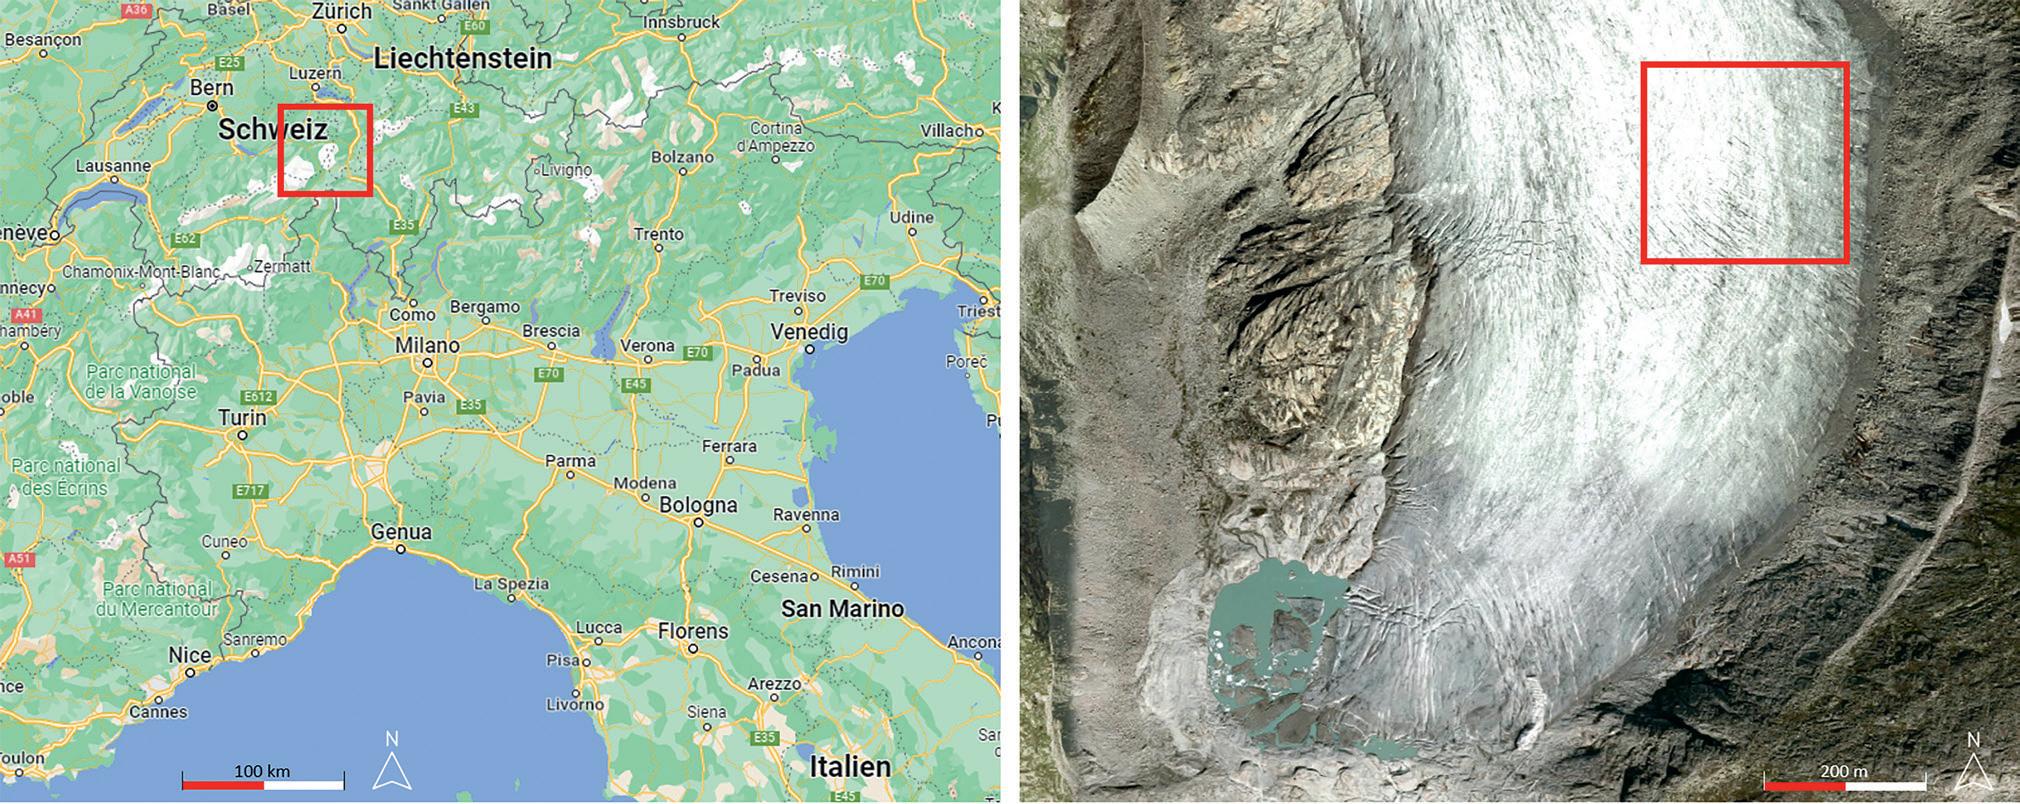
In 2020, ETH Zürich performed a pilot study using a slightly modified version of a MALÅ GeoDrone 80 at the Rhone glacier in Switzerland (Figure 10). The purpose of the study was to evaluate the GeoDrone 80 for detailed measurement of the glacier thickness. At an elevation of 2300 m and with a snow depth of not more than 0.5 m, the glacier thickness was expected to be around 100 m or more. The study area was considered appropriate since it had been previously measured in detail using ground-based GPR and other methods.
Data acquisition was controlled by the MALÅ Controller App installed on a tablet computer. The tablet connects to the MALÅ GeoDrone 80 antenna through Wi-Fi and continuously displays data in real-time during measurements. Throughout
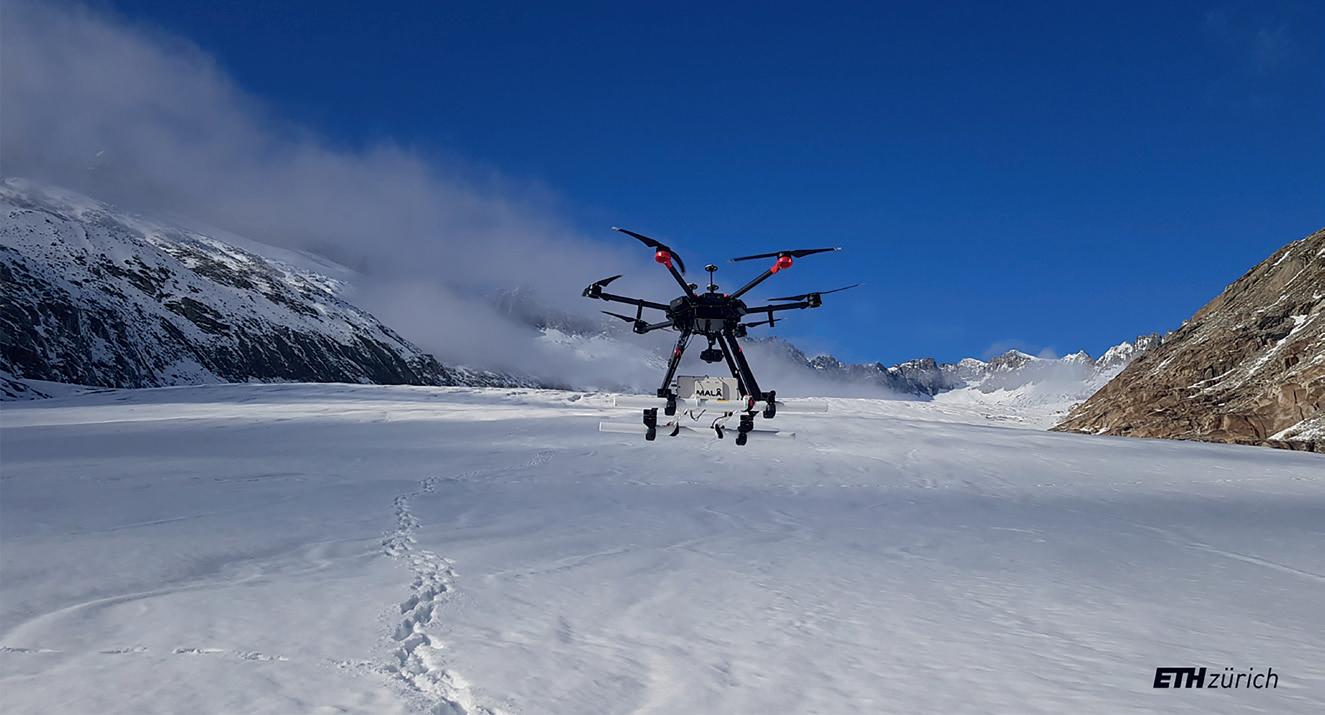
Figure 11 DJI Matrice 600P equipped with a MALÅ GeoDrone 80 taking off across the Rhone glacier.
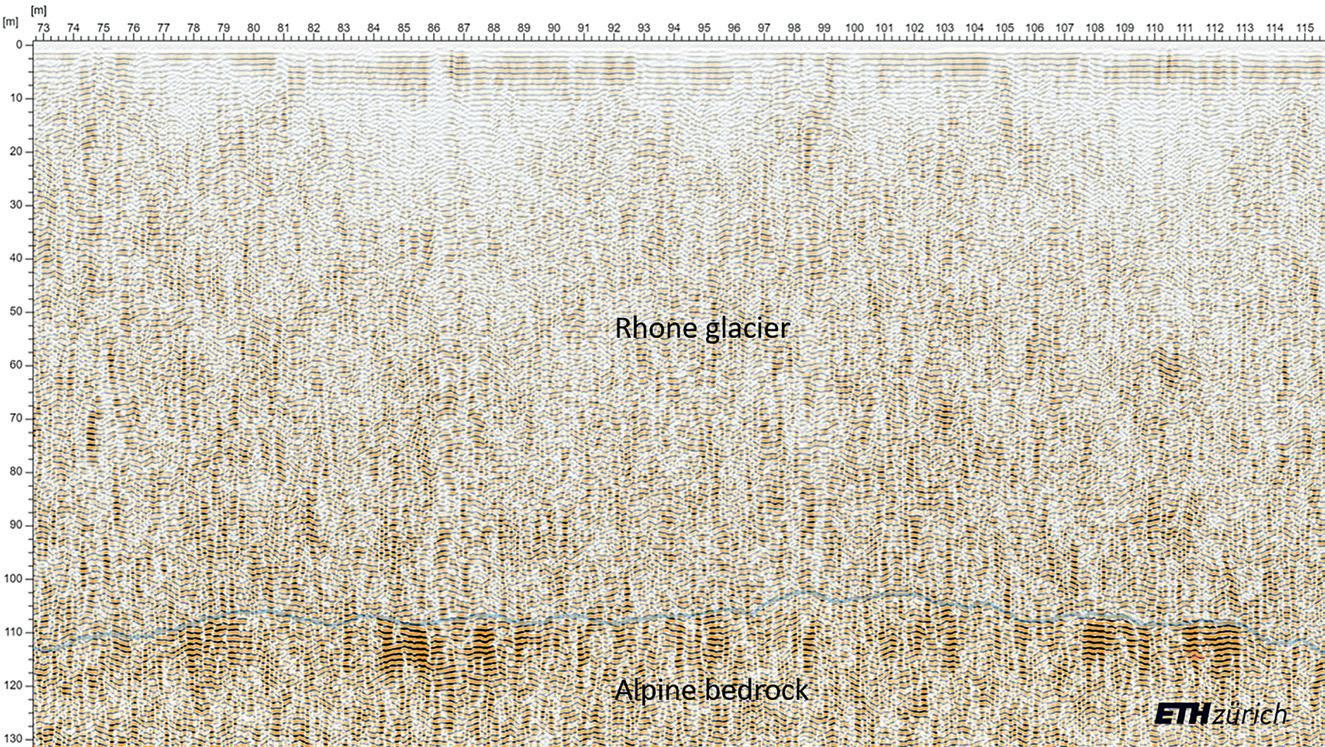
Figure 12 MALÅ GeoDrone 80 data and interpretation from the Rhone glacier. Data is displayed in MALÅ Vision, with bandpass, background removal and AGC filters applied.
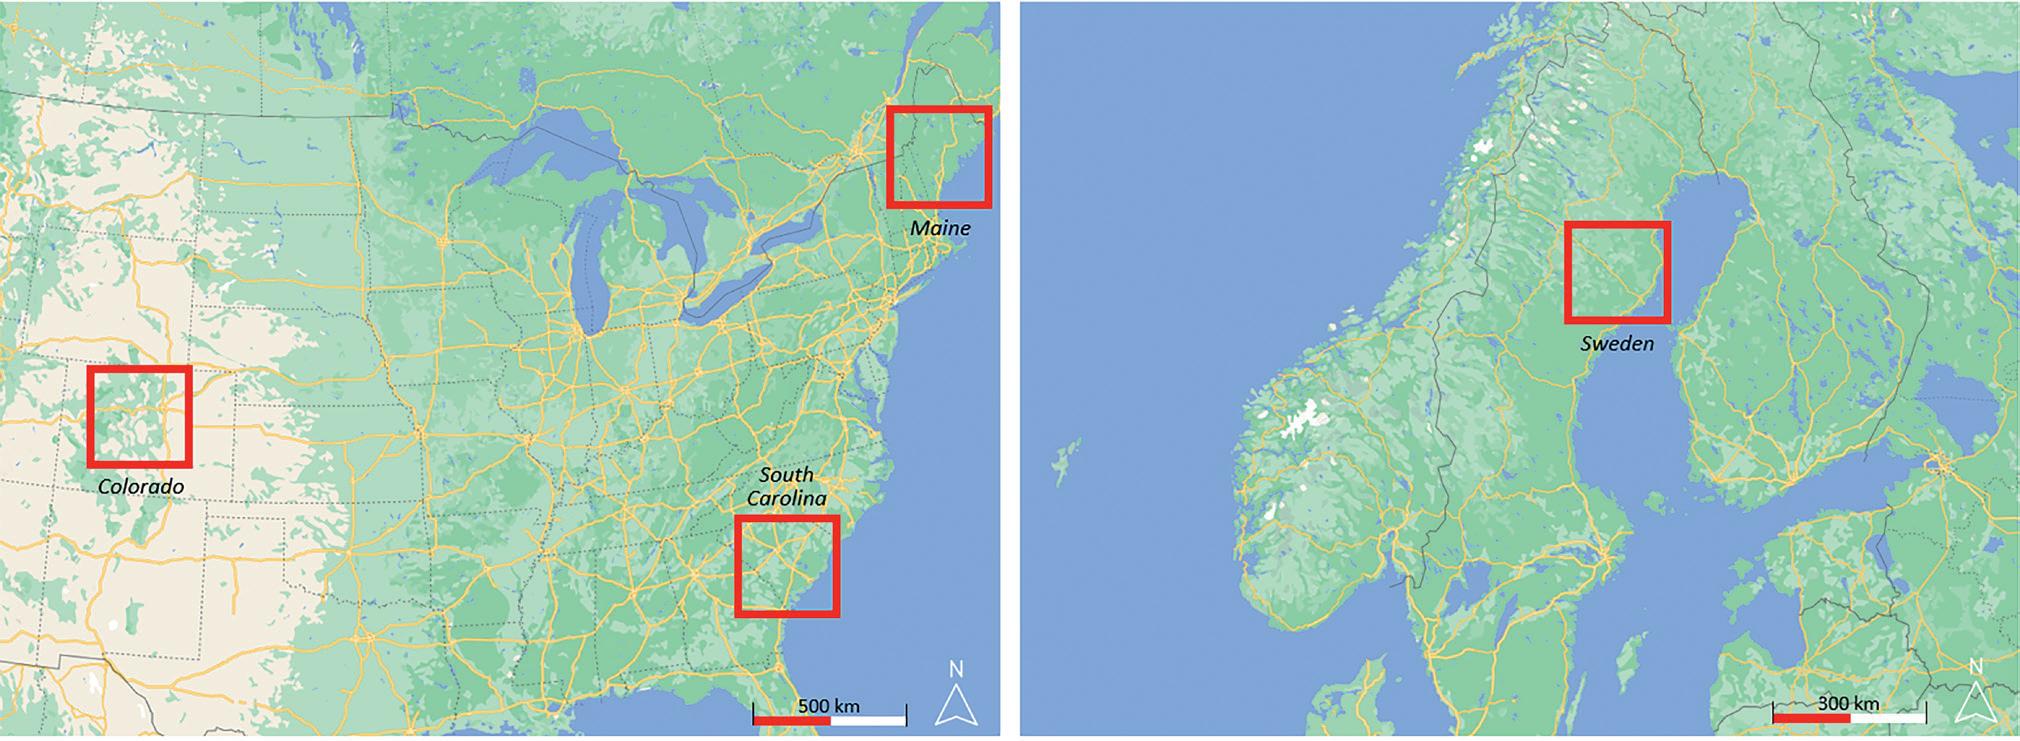
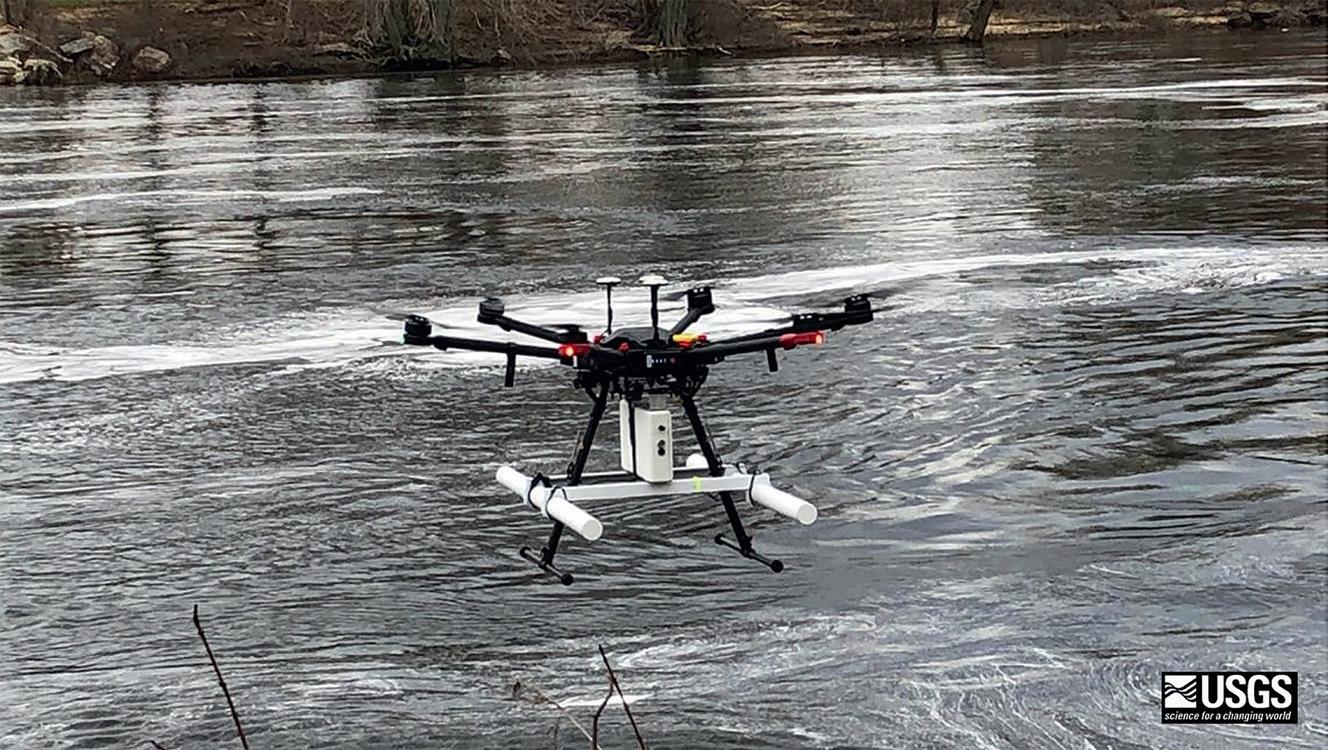
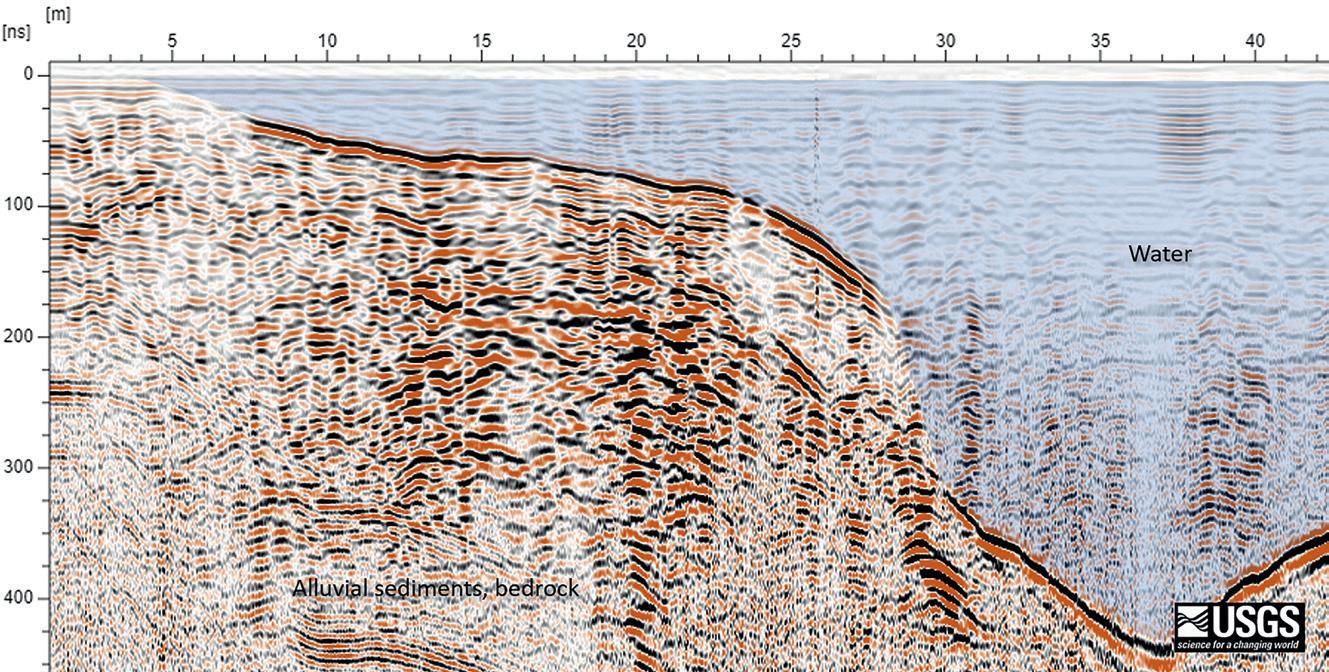
Figure 14 The MALÅ GeoDrone 160, mounted on a DJI Matrice 600, active at Colorado, US.
Figure 15 MALÅ GeoDrone 80 bathymetry data and interpretation from one of the project sites during initial trials. Data is processed in MALÅ Vision, with background removal, bandpass and AGC filters applied.
measurements, data is simultaneously recorded on the tablet and onboard the GeoDrone antenna. If the sUAS moves beyond the range of the Wi-Fi connection, the antenna continues to record and store data onboard and automatically syncs and displays that data on the tablet whenever the Wi-Fi connection is re-established. Planning a flight path that systematically returns close to the operator allows for monitoring the recorded data, even if most of it is collected far beyond the reach of a typical Wi-Fi network.
This modified version of the MALÅ GeoDrone 80 had a maximum time-window of two micro-seconds which is sufficient for the expected depth of the glacier at the test site. The modifications done to the antenna created some minor artefacts in data but nothing severe enough to hamper interpretation and nothing that could not be corrected during later processing stages.
At full battery capacity (both battery bays in use) the MALÅ GeoDrone 80 had an operating time of roughly 1 hour which corresponded well to the operation time of the DJI Matrice 600 drone used (Figure 11).
In most of the study area, the MALÅ GeoDrone 80 collected useful information throughout its time-window of 2000 ns. At roughly 1200 ns (105-120 m) the bedrock, underlying the Rhone glacier, is clearly visible within the data (Figure 12). The results correspond well with the expected thickness of the glacier, verified by ground-based surface measurements.
This study also concluded some areas for improvement, such as: making the MALÅ GeoDrone 80 more aerodynamic and less sensitive to side-winds; lidar support; increased time-window beyond 2000 ns in case it is needed for even deeper glaciological studies.
Freshwater bathymetry in USA – Courtesy of USGS, USA The United States Geological Survey (USGS) measures streamflow at sites several times a year across the US. In 2017 USGS hydrographers made about 80,000 streamflow measurements (Eberts et al. 2019), including stream width, depth, and velocity. These measurements need to be carried out, regardless of season or weather conditions, sometimes during high-flow conditions and in the presence of floating waterborne debris such as trees, ice, and more. Consequently, this is one of the most dangerous aspects of USGS hydrologic studies (Lane et al. 2019).
Despite the hazards, quantification of streamflow is critically important and must be undertaken regardless of site conditions. Streamflow data is important for multiple reasons, such as: flood forecasting; drought monitoring; water supply planning; health and safety; bridge and highway design; waste-load allocations etc.
To make this type of data collection safer and more efficient, the USGS is developing and testing tools and methods to enable fully ‘non-contact’ stream-discharge estimates from UAV-mounted sensors. As a part of this effort and through a USGS Cooperative Research and Development Agreement (CRADA), USGS has collaborated with Guideline Geo on the development of a lightweight, self-contained GPR system suitable for deployment from low-cost commercially available multirotor sUAS platforms. The goal of this cooperation is to develop an airborne GPR system capable of


measuring stream bathymetry in freshwater up to ten metres deep. For the purposes of testing, freshwater was defined as having an electrical conductivity of less than 800 mS per centimetre.
Two different MALÅ GeoDrone antennas were used in this project (Figure 13-15). The antennas had centre frequencies of 160 and 80 MHz respectively. The lower antenna frequency proved more useful and can successfully image river bottoms in a water depth up to about 10 m. The initial results from both Sweden and the US demonstrate the feasibility of sUAS-based GPR for non-contact bathymetry measurements of freshwater systems and additional applications currently in the domain of conventional ground-based GPR. In terms of the limitations experienced, attention to complexities such as very steep-sided banks (which can be difficult to image accurately) and overhanging vegetation canopies is required.
Conclusions The advent of efficient and relatively low-cost UAS/UAV platforms, with practical payload capabilities, has enabled smallscale airborne geophysics to become a cost-effective alternative to ground-based measurements. Using dedicated UAS-GPR hardware, such as the MALÅ GeoDrone from Guideline Geo, shows the quality and efficiency to be found in modern GPR solutions and helps users to survey sites that are otherwise inaccessible with ground-based GPR equipment.
In comparison to surface GPR, there are of course additional challenges with airborne GPR measurements that need to be addressed. There are practical, technical, and regulatory issues to consider but many of these challenges can be overcome with modern tools and techniques. Even if the recent increase in attention to UAS-GPR has led to manufacturers and developers finding solutions, it is important to add that a ground-based GPR solution should always be the first consideration when planning a survey.
If applied properly and for the right reasons, airborne GPR has a tremendous capacity to provide high-quality data at sites otherwise too difficult to survey in other ways.
References
Davies, B. [2020]. Mapping the World’s Glaciers. Retrieved 10 June 2022, from https://www.antarcticglaciers.org/glaciers-and-climate/ glacier-recession/mapping-worlds-glaciers/. Daniels, D. [2004]. Ground-penetrating radar (2. ed). London: Institution of Electrical Engineers. Eberts, S.M., Woodside, M.D., Landers, M.N. and Wagner, C.R. [2019].
Monitoring the pulse of our nation’s rivers and streams: The US
Geological Survey streamgaging network. US Geological Survey
Fact Sheet 2018–3081, 2 p., (https://doi.org/10.3133/fs20183081). Jiang, S. and Georgakopoulous, S. [2011]. Electromagnetic Wave Propagation into Fresh Water. Journal of Electromagnetic Analysis and
Applications, 3, 261-266. Johansson, F., Spross, J. and Fransson, L. [2013]. Islast mot dammkonstruktioner. Sammanställning av kunskapsläget samt förslag till forskning och utveckling. Elforsk Rapport 13:56, 24 p. In Swedish. Jol, H.M. [2009]. Ground Penetrating Radar Theory and Applications (1. ed). Amsterdam: Elsevier Science. Karlsson, J. [2009]. Isrelaterade produktionsförluster inom storskalig vattenkraft. Master Thesis, Luleå Technical University, 2009:078
CIV, 56 p. In Swedish. Lane, J.W., Fulton, J.W., Onufer, A. and Dawson, C.B. [2019]. Development of a drone-deployed ground-penetrating radar system for non-contact bathymetry of freshwater systems. 2019 American
Geophysical Union – Society of Exploration Geophysicists Airborne
Geophysics Workshop, June 11-13, 2019. Leckebusch, J. [2003]. Ground-penetrating Radar: A Modern Three-dimensional Prospection Method. Archaeological Prospection, 10, 213–240.
ADVERTISEMENT
Benefi t from an additional journal subscription!
02/07/2020 13:18
FIRST BREAK VOLUME 39 I ISSUE 1 I JANUARY 2021
VOLUME 39 I ISSUE 1 I JANUARY 2021 LIGHTNING: SEISMIC VIBRATOR
FROM SEISMIC MECHATRONICS
Electromechanic vibrating exploration seismic source for P and S wave excitation. www.geomatrix.co.uk/land-products/seismic/seismic-exploration-systems/lightning
WE ARE THE ONLY EUROPEAN RENTAL SUPPLIER
NEAR SURFACE GEOPHYSICS
SPECIAL TOPICLAND PRODUCTS Land Seismic
MARINE PRODUCTS SOFTWARE
Visit us online for survey planning tools; equipment training videos; magnetic forward modelling program EAGE NEWS Annual conference strikes optimistic note and comprehensive rental pool of engineering geophysical instruments – worldwide shipment. TECHNICAL ARTICLE Brittleness computation from rock moduli without density CROSSTALK What climate change mitigation has in store
UK OFFICE
20 Eden Way, Pages Industrial Park, Leighton Buzzard, Beds LU7 4TZ. UK. T: +44 (0)1525 383438 E: sales@geomatrix.co.uk
NETHERLANDS OFFICE NOW OPEN • Weena-zuid 130, 3012NC Rotterdam • Fully managed European shipping
VOLUME 19 · NUMBER 1 · FEBRUARY 2021
WSA1025261 Geomatrix-CMKY-280x210.indd 1 www.geomatrix.co.uk
15/12/2020 20:38 05/01/2021 17:15
Near Surface Geophysics
Volume 19 · Number 1 · February 2021
3 Editorial
P. Tsourlos
7 A geostatistical Markov chain Monte Carlo inversion algorithm for electrical resistivity tomography
M. Aleardi, A. Vinciguerra and A. Hojat
27 Determination of the resistivity distribution along underground pipes in urban contexts using galvanic and capacitive methods
S. Rejkjær, C. Finco, C. Schamper, F. Rejiba, A. Tabbagh,
J. König and T. Dahlin
43 Cross-borehole geoelectrical time-lapse monitoring of in situ chemical oxidation and permeability estimation through induced polarization
T. Bording, A.K. Kühl, G. Fiandaca, J.F. Christensen,
A.V. Christiansen and E. Auken
59 Transient electromagnetic inversion based on particle swarm optimization and differential evolution algorithm
R. Li, N. Yu, R. Li, Q. Zhuang and H. Zhang
73 Estimation of earthquake local site effects using microtremor observations for the Garhwal–Kumaun Himalaya, India
R. Pudi, P. Roy, T.R. Martha and K.V. Kumar
95 Detection of urban underground cavities using seismic scattered waves: a case study along the Xuzhou Metro Line 1 in China
J. Zhang, S. Liu, C. Yang, X. Liu and B. Wang
109 A numerical dispersion-suppressed method for shallow seismic migration
Y. Liu, Z. Li, J. Wang, M. Sun and Q. Liu
www.nearsurfacegeophysics.org
issn 1569-4445 (print) issn 1873-0604 (online) Basin Research SECOND EAGE DIGITALIZATION CONFERENCE AND EXHIBITION
Volume 33 . Number 1 . February 2021 . http://www.wileyonlinelibrary.com/journal/bre
Published in conjunction with the European Association of Geoscientists & Engineers and the International Association of Sedimentologists
THE ENERGY INDUSTRY IS GOING DIGITAL
AND SO ARE WE!
Geophysical Prospecting
Volume 69 Number 2 February 2021 pp 267 – 490
SUBMIT YOUR ABSTRACT!
Scan the QR code for more info!
18-21 OCTOBER 2021 I VIENNA I AUSTRIA
Editors: Atle Rotevatn (University of Bergen) Kerry Gallagher (University of Rennes) Peter Burgess (University of Liverpool) Cari Johnson (University of Utah) Craig Magee (University of Leeds) Nadine McQuarrie (University of Pittsburgh)
WWW.EAGEDIGITAL.ORG
DIGI21 V2GPR 69.2 F .indd(Februar1y 2021) cover.indd 1 04/01/2021 15: 605
Geophysical Prospecting
Volume 69 Number 2 February 2021
269 Kirchhoff pre-stack depth scalar migration in a simple triclinic velocity model for three-component P, S1, S2 and converted waves
V. Bucha
289 Order-controlled closed-loop focal beams and resolution comparison of primary and multiple refl ections for seismic acquisition geometries
W. Wei and G. Blacquière
307 Seismic data interpolation using deep learning with generative adversarial networks
H. Kaur , N. Pham and S. Fomel
327 Unifi ed elimination of 1D acoustic multiple refl ection
E. Slob and L. Zhang
349 Elastic wave-mode separation in 2D transversely isotropic media using optical fl ow
X. Wang , Y. Lu and J. Zhang
372 Stress prediction and evaluation approach based on azimuthal amplitude-versus-offset inversion of unconventional reservoirs
B. Du , G. Zhang , J. Zhang , J. Gao , X. Yong , W. Yang , R. Jiang , S. Wang , H. Li and E. Wang
388 The impact of seismic inversion methodology on rock property prediction
M. Martinho , T. Tylor-Jones and L. Azevedo
404 Elastic properties of a reservoir sandstone: a broadband interlaboratory benchmarking exercise
A. Ògúnsàmì , I. Jackson , J.V.M. Borgomano , J. Fortin , H. Sidi , A. Gerhardt , B. Gurevich , V. Mikhaltsevitch and M. Lebedev
419 Deep learning assisted well log inversion for fracture identifi cation
M. Tian , B. Li , H. Xu , D. Yan , Y. Gao and X. Lang
434 Subsurface structures of the Xiaorequanzi deposit, NW China: new insights from gravity, magnetic and electromagnetic data
A. Shaole , Z. Zhixin , Z. Kefa and W. Jinlin
448 Denoising of magnetotelluric data using K-SVD dictionary training
J. Li , Y. Peng , J. Tang and Y. Li
474 Improved controlled source audio-frequency magnetotelluric method apparent resistivity pseudo-sections based on the frequency and frequency–spatial gradients of electromagnetic fi elds
M. Zhang , C.G. Farquharson and C. Liu
69 ( 2 ) ( 2021 ) ISSN 0016-8025 (Print) ISSN 1365-2478 (Online) http://www.geophysicalprospecting.org
EAGE
EUROPEAN ASSOCIATION OF GEOSCIENTISTS & ENGINEERS
As an EAGE member, you have free online access to a journal of your own choice. But did you know that it is also possible to subscribe to other EAGE scientific journals for an additional fee?
FOR MORE INFORMATION PLEASE VISIT EAGE.ORG/MEMBERSHIP


