
13 minute read
Advanced imaging techniques provide new near surface details in 3D seismic exploration data and an application to new energy-related offshore shallow subsurface investigations


Julien Oukili1*, Terje Kultom Karlsen1, Bertrand Caselitz1, Jens Beenfeldt1 and Allan McKay1 demonstrate what abundant 3D exploration seismic data coverage could offer in the search of net zero energy solutions.
Introduction Decades of offshore oil and gas exploration have generated a significant amount of 3D seismic data, mainly collected to uncover relatively deep hydrocarbon reservoirs. Each survey has been optimized to meet project objectives while increasing efficiency but often leads to suboptimal solutions in terms of imaging and interpreting the very shallow subsurface. Many new energy solutions, such as offshore wind farms or carbon capture and storage (CCS), require very accurate information of the near surface over very large areas, which in multiple cases overlap past and present petroleum exploration and production licensing areas. However, the requirements are very different in terms of vertical and horizontal resolution. For example, typical hydrocarbon exploration surveys produce high-quality broadband images at 12.5 m x 12.5 m spatial sampling, 4 ms temporal sampling and long offsets. Ultra-high-resolution (UHR) surveys for new energy applications typically generate images at up to 1 m x 1 m x 0.25 ms sampling and near/zero offset recording. Applications of UHR techniques have been limited in 3D, due to their high costs and operational constraints (i.e., weather window versus efficiency).
Advertisement
In this article, we present the results of investigating what the abundant 3D exploration seismic data coverage could offer in the search of net zero energy solutions. The work is predominantly focused on applying state-of-the-art processing and imaging solutions to a 3D broadband dataset acquired in the UK North Sea in 2012-2013, where the water depth is around 100 m. The methods include, among other things: full deghosting, broadband processing, Full Waveform Inversion and Full Wavefield Migration. The latter takes advantage of surface-related multiples, often considered noise in traditional processing flows but which can yield significant information about the seabed and near surface. While a similar approach has been followed in the context of shallow hazard assessment prior to drilling operations (Smith et al., 2019 and Oukili et al., 2019), this work is more focused towards the first hundred metres from and below the seabed.
The objective is not to replace the requirements for ultra-high-resolution data but rather to exploit synergies between O&G-focused surveys and new energy needs to accelerate the energy transition at large scale.
Figure 1 PGS Viking Graben 3D data library for both UK and Norway. The orange polygon indicates the area for the pilot study, just south of the Beryl area.
1 PGS * Corresponding author, E-mail: Julien.Oukili@pgs.com DOI: 10.3997/1365-2397.fb2022069
Study area and dataset The area of study is in the mature South Viking Graben of the UK Continental Shelf (UKCS), near to the Beryl main and satellites fields, which are still producing. As shown in Figure 1, the reprocessing efforts were limited to a subset of a large 3D data library which covers tens of thousands of square kilometres. In this part of the Northern North Sea, the seabed lies at around 100 m deep and is flat or gently dipping.
The data is part of two large surveys acquired in two seasons (2012 and 2013) with multisensor streamer technology and is still considered of high quality today. Both campaigns were run with a single source/streamer vessel and a minimum inline offset of approximately 95 m, standard for exploration purposes but far too large for UHR purposes. Dual source configurations were employed, with 50 m separations and 12.5 m shot interval in a flip-flop mode (25 m same source). The vessel towed 10 and 12 streamers, respectively in 2012 and 2013, with a separation of 50 m, thus defining this dataset as high-density 3D (HD3D). Although 50 m cable separation is considered dense for exploration, the use of triple (or more) source solutions in recent years makes the study dataset comparable to today’s standards in terms of trace density, and therefore highly relevant in any case. The recording systems were set to 2 ms temporal sampling during acquisition, which was preserved through the reprocessing.
Although other areas and regions were considered for the work, the combination of HD3D data, expected complexity of the quaternary geology and the history of petroleum industry (and related surveying) activities have made this the ideal case for our open investigations.
Methodology: advanced imaging using multiples and near offset data Rejuvenation of the data library in 2019 employed the latest processing technology available and delivered updated subsurface images on a 12.5 m x 12.5 m x 4 ms grid. This dataset is briefly compared to the results of the two high-resolution processing routes: 1) 2 ms 2D imaging for the near offsets from the inner cable of the streamer spreads (referred to as 2D HR flow) and 2) 2 ms 3D imaging using multiples on a 3.125 m x 3.125 m x 2 ms grid (referred to as 3D HR flow). The first route followed a typical processing sequence, also common to other UHR processing flows with denoise, deghosting, demultiple, migration and post-processing. The second route employed Separated Wavefield Imaging (SWIM) (Whitmore et al., 2010), which has been further enhanced and is described in some more detail below.
Unlike conventional imaging methods where the primary reflections between sources and receivers produce an image through migration, SWIM employs receivers as virtual sources, which allows any reflection recorded between receivers to
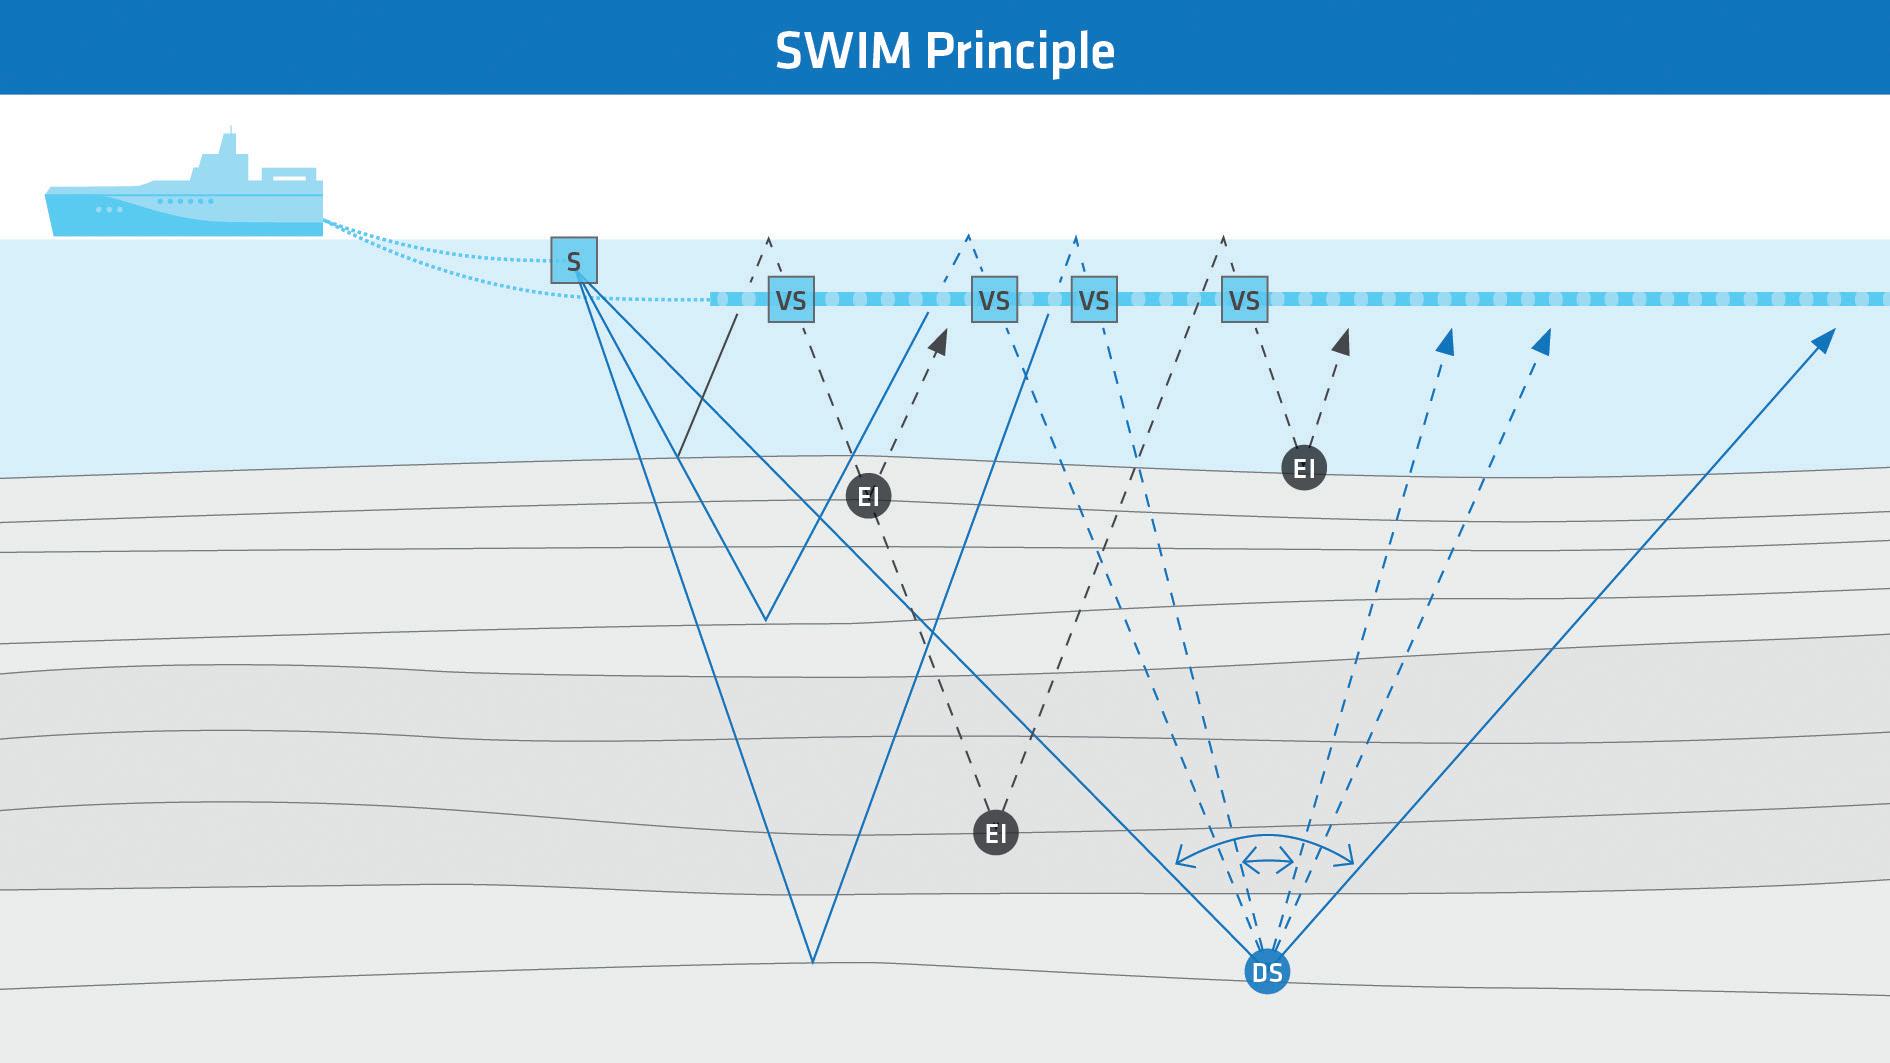
Figure 2 Separated Wavefield Imaging (SWIM) using virtual sources (VS) delivers extra illumination (EI) and denser sampling (DS). Higher order surface multiples also contribute.
Figure 3 New (left) versus standard (right) SWIM results. The vertical scale covers about 2.5 times the water bottom period. Higher image dips become more apparent once the crosstalk has been reduced (blues arrows). The orange arrows indicate the expected seabed reflection image, which is much dimmer on the left-hand side picture. However, very fine details are also more apparent around this location.
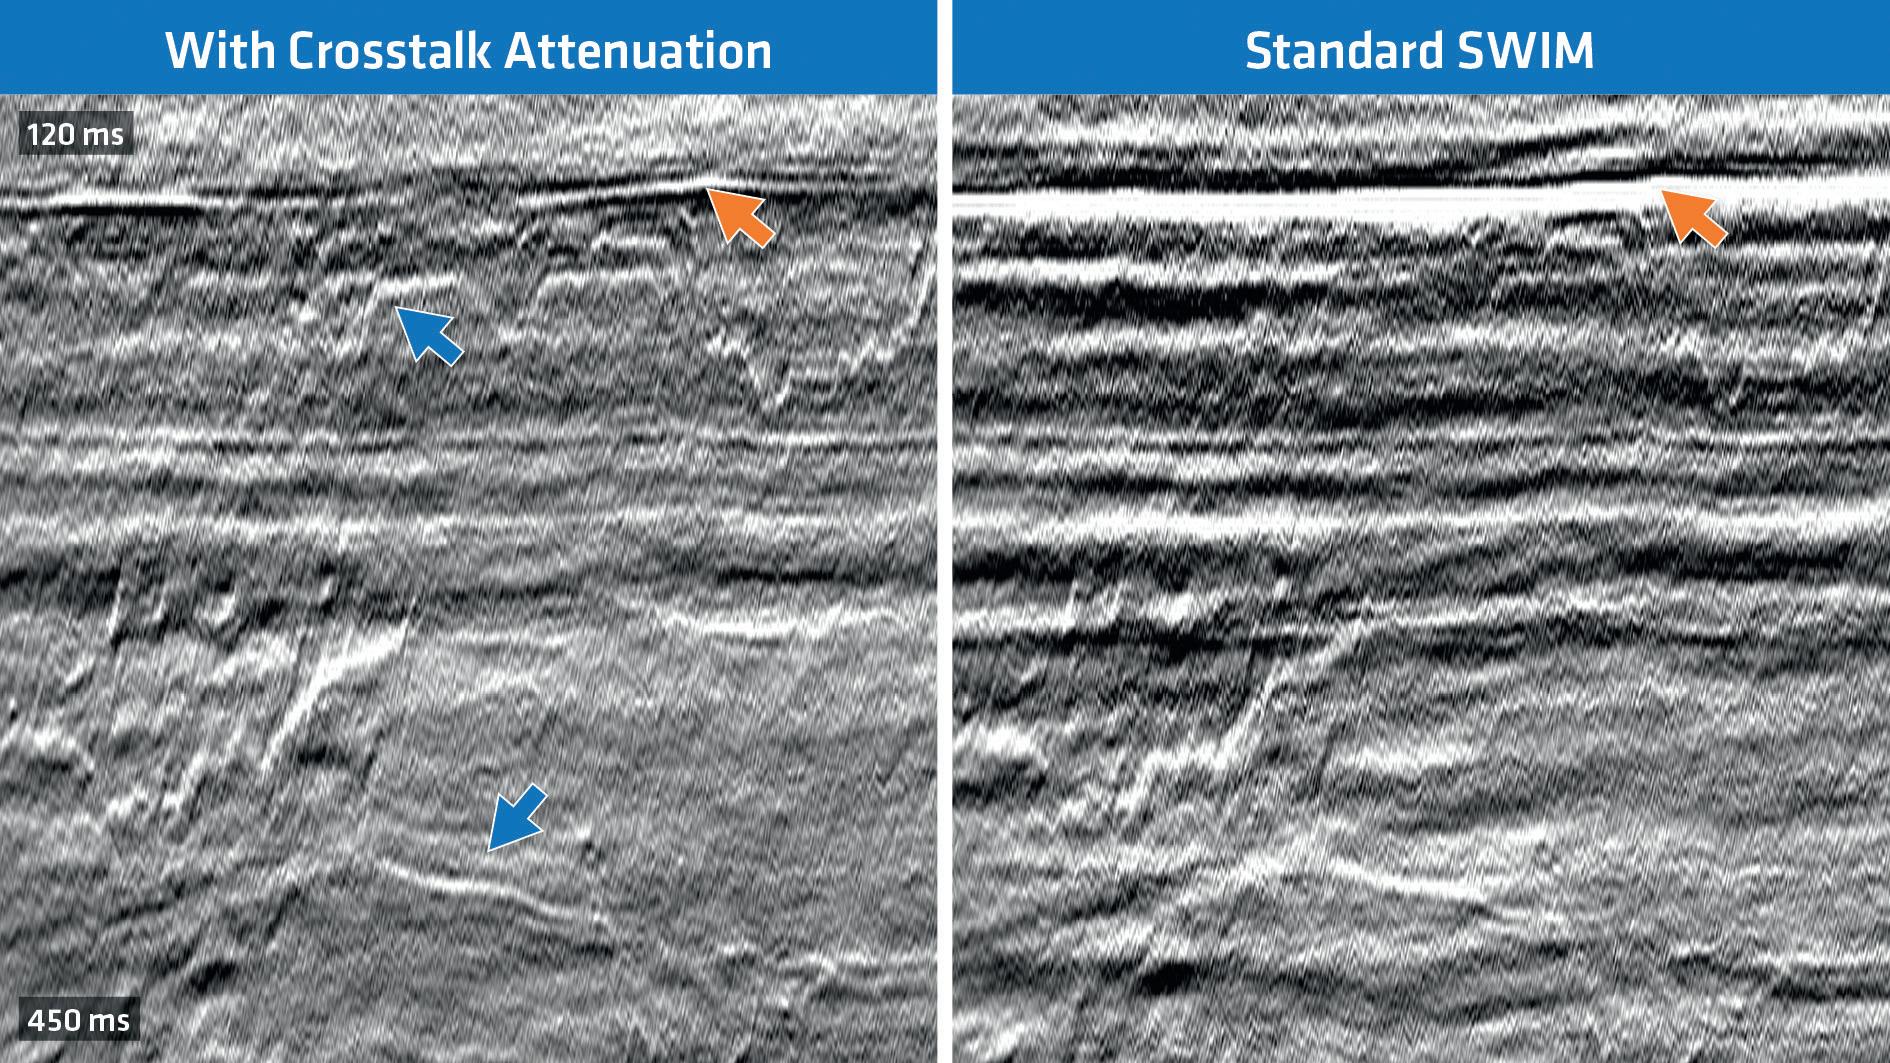
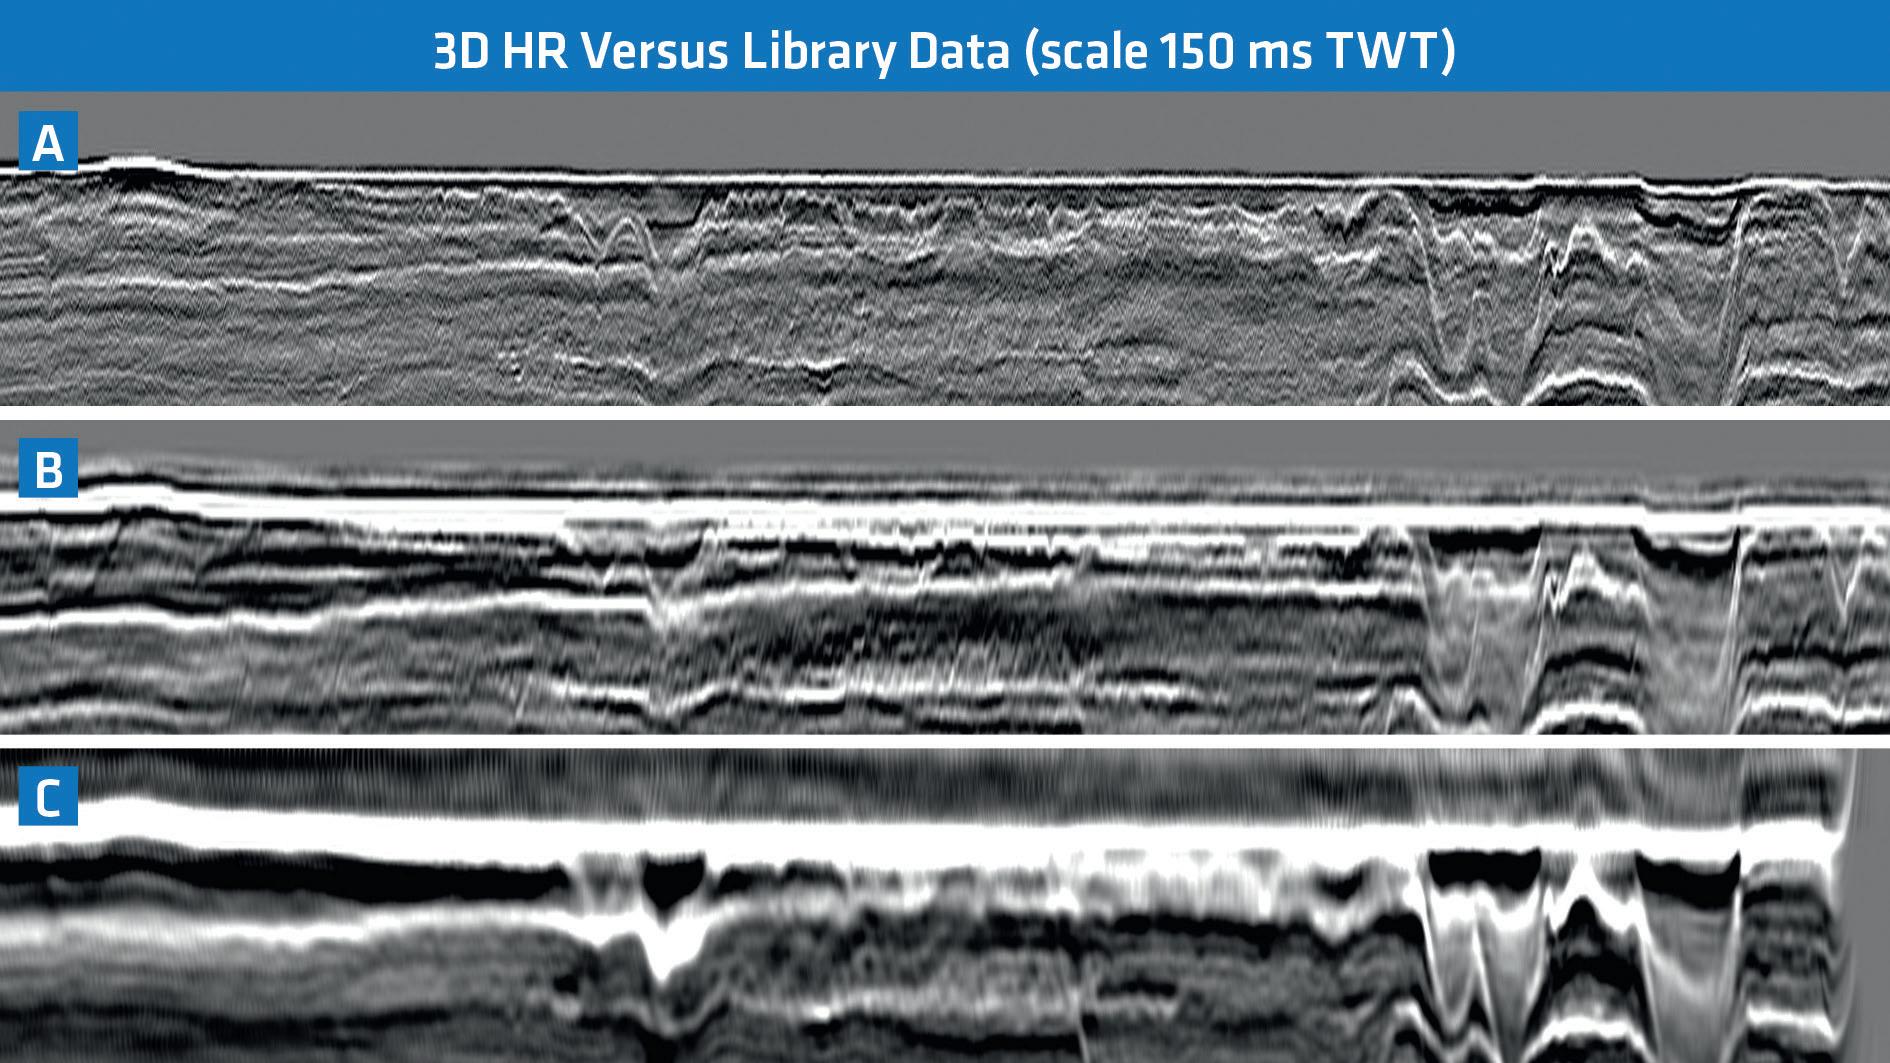
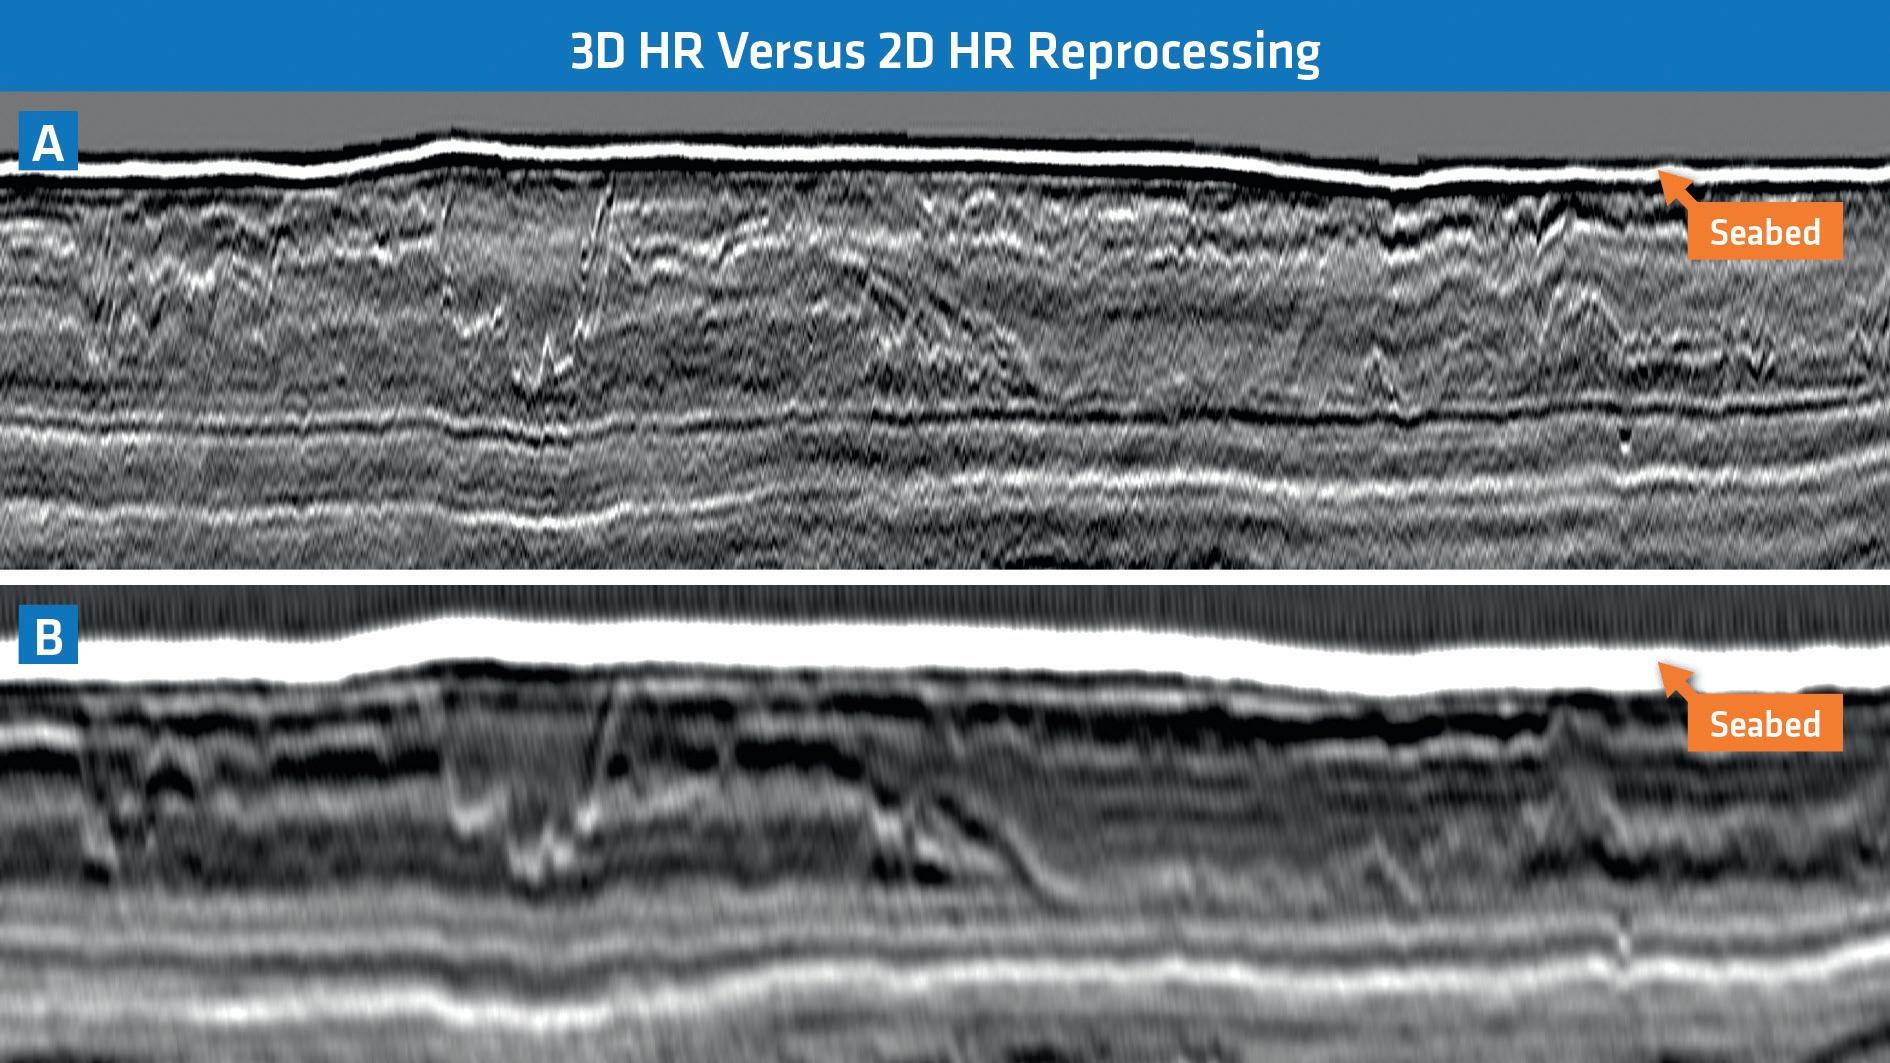
Figure 4 3D HR results (a) compared to the standard data library volumes: previous SWIM volume (b) and 2019 final pre-stack depth migration stack (c).
Figure 5 3D HR reprocessing results (a) compared to 2D HR reprocessing results (b), both at 2 ms sampling. Good structural conformity is observed between the volumes and more similarity can be drawn between the images compared to the volumes on Figure 4. The seabed reflection still appears stretched on the 2D HR reprocessing results (minimum offset around 95 m), in line with expectations.
be utilized in the imaging process (Figure 2). In effect, all surface-related multiples can be treated as signal. This is particularly of interest for the shallow subsurface since multiple ray-paths are not restricted by the source and receiver geometries, irrespective of whether simple multiples or pegleg multiples are being considered. Therefore, images produced with SWIM contain information of much shorter offsets than the acquisition setup dictates. However, the abundance and strength of these multiples, especially in shallow water environments, creates undesired artefacts, so-called crosstalks, as described by Lu et al. (2016). Following the same crosstalk modelling principles a crosstalk attenuation step which mainly targets seabed-generated noise was successfully implemented, as shown in Figure 3. At first glance, the new results seem to contain significantly less information than the more standard ones. After closer inspection, the difference is caused by sub-horizontal events, interfering with finer, smaller-scale structural details which appear more geologically plausible. Therefore, the new results are considered a better subsurface representation. Note that the seabed reflection also appears much dimmer, but this event is easily interpreted on the standard results and the information can be easily recombined at a later stage.
Figure 4 illustrates the significant improvement from the 2019 rejuvenation project to the new HR reprocessing which has significantly increased vertical and spatial resolution. For reference, the image obtained from multiples in the 2019 project which was used during the demultiple process is also shown (Oukili et al., 2015). The three-way comparison demonstrates how much more detail can be revealed by further improving a high-end technology.
To further validate the new results, the data processed in the 2D HR mode (route 1) is optimized with modern processing techniques (Figure 5). The 2D HR image shows higher resolution than the 3D library data of Figure 4, but still suffers from stretch artifacts in the very shallow section. Offsets shorter than 95 m are required in this area to image stretch-free primary reflections. The results are still useful in confirming the structural elements in the 3D HR results. In more modern acquisition configurations, employing a higher number and more distributed sources, as presented by Widmaier et al. (2021) and Oukili et al. (2021), a better coverage and distribution of very near offsets can be efficiently obtained during a 3D exploration grade survey, thus making 2D HR reprocessing even more relevant.
Applications for the energy transition Given the new level of details available from the 3D data library, further and adjusted interpretation workflows need to be designed to assess the suitability of 3D HR data in environmental- and cost-conscious shallow subsurface mapping projects. In the following paragraphs, we propose to take a first look at features that are of interest to many working with UHR data, bearing in
mind that further cross-validation based on overlapping UHR data will take place in the near future.
As a first example, Figure6 highlights some interpreted shallow gas pockets, frequently subjects of shallow hazard mapping and typically a prime target for site survey studies. Such features are highly relevant in the CCS context for example prior to any drilling activity, comparable to the O&G industry. Shallow gas movements and early signs of new shallow fluid accumulation would be of extreme importance during the monitoring phase of a CCS project. The 3D HR data demonstrate that data acquired for mapping of storage sites may be used for the necessary shallow overburden analysis.
In general, for both CCS and wind-farm site characterization applications, understanding the complexity of the seabed and the underlying geology are critical, not only for optimizing development costs but also ensuring safe and responsible operations. Figure 7 and 8 show highly complex geology in the first tens of metres beneath the seafloor. The smallest scale features currently being interpreted are about 7-10 m in spatial extent and about 2-3 m thick in the depth domain. Channels, tunnel valleys, faults, and small-scale objects (potentially boulders) overlap and follow various orientations which all seem to be equally well represented in the 3D HR images. This further highlights the need for a full 3D view of the shallow subsurface. It is too early to say if such 3D data will be used directly to build a 3D ground model or if this may simply support the interpretation and analysis of UHR data. However, it clearly enables the interpreters to differentiate and interpret the various amplitude responses seen in the seismic images, especially through cross-sections and slices.
Figure 8 is particularly interesting as it reveals multiple layers of channels and valleys within a distinct and larger valley itself. Referring back at Figure 4 (right side), one could identify deep tunnel valleys with internal and much shallower layering. However, the deeper valley appears truncated on the display, as it is being zoomed on the prime interval of interest. Having access to the deeper data increases confidence in the nature of the structure and allows for proper seismic velocity analysis of this interval all the way to the water bottom event. Even if the first hundred metres’ are of prime interest, e.g., for optimal design of wind farm foundations, deeper data is critical in fully understanding this interval and for conducting robust data analysis.
As a final example, Figure 9 shows various groups of features which may be isolated into single or multiple morphological systems. Once again, a map view of the data becomes critical in identifying areas which may be less consolidated than others. This may also bring more clarity to the geological history and to events which have led to the present sediment facies distribution, to map zones with potentially higher operational risks or which need further surveying.
In addition to supporting interpretation and providing input to the ground model, reprocessed 3D exploration seismic data can become a significant base for future planning of specific
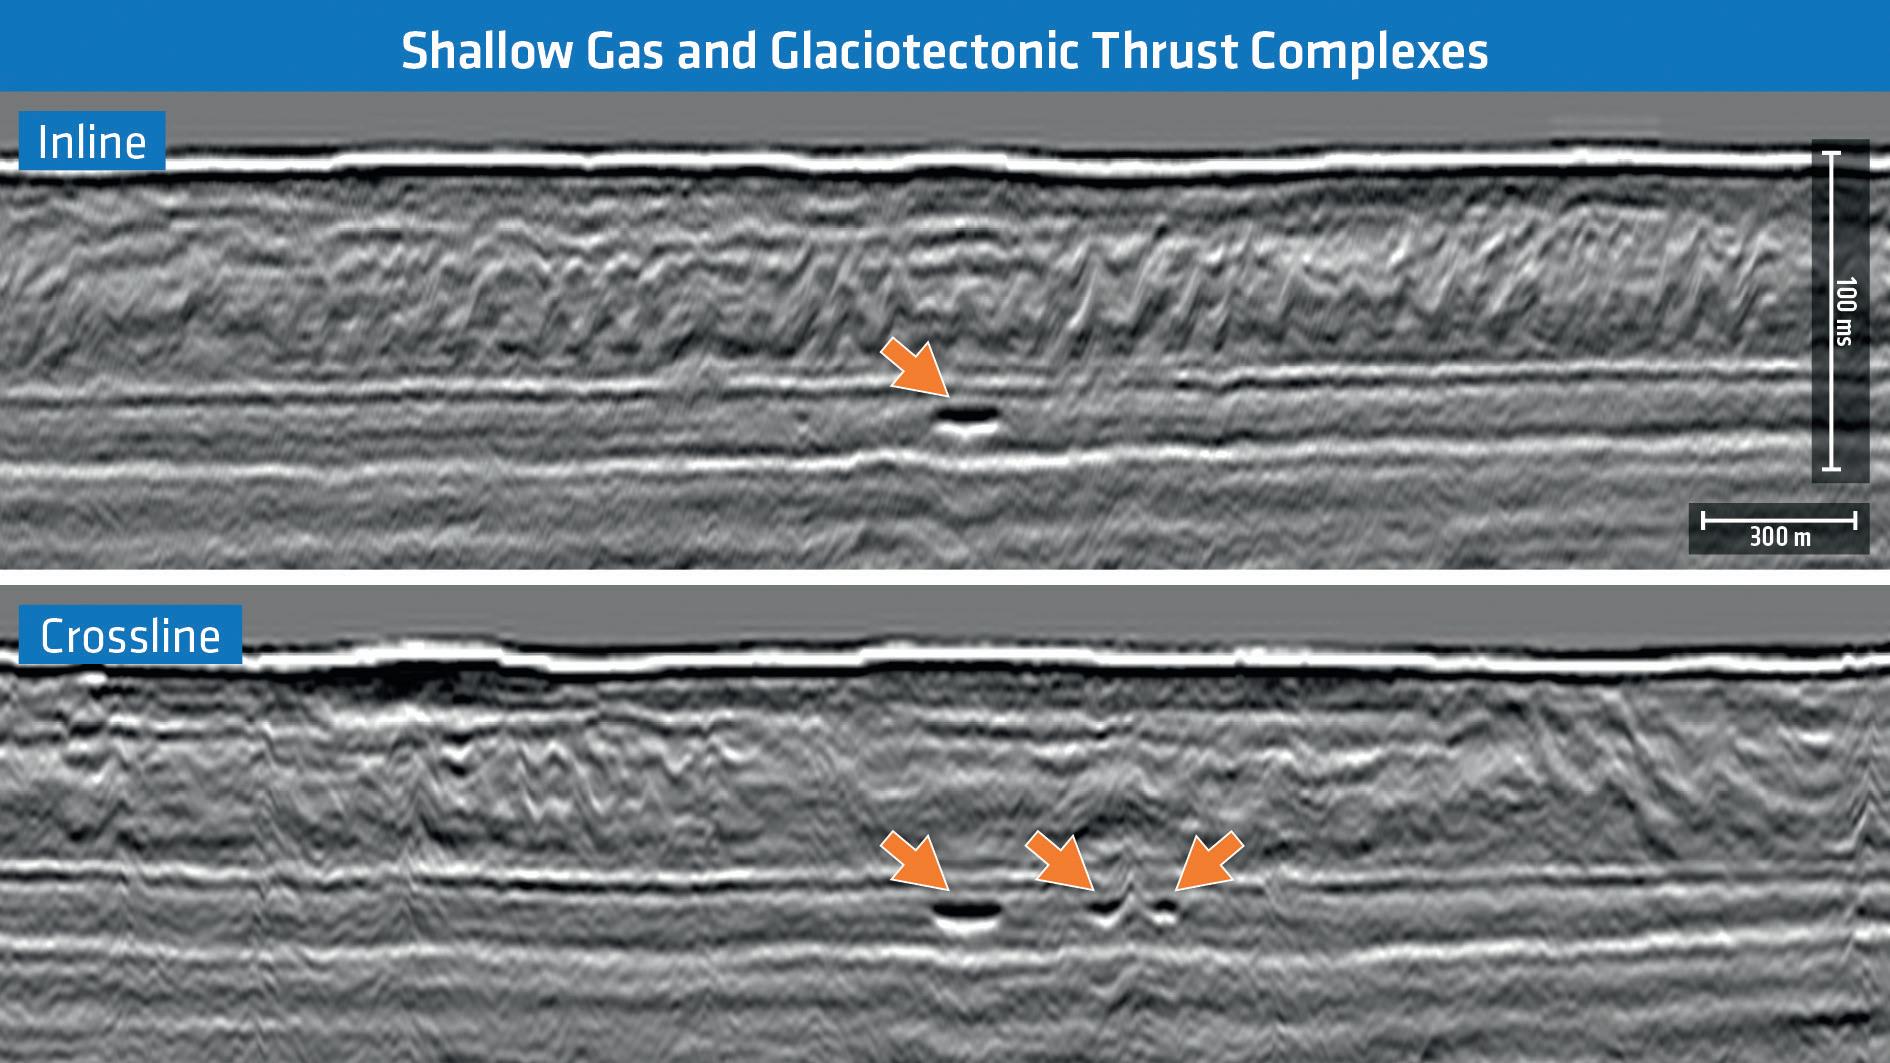
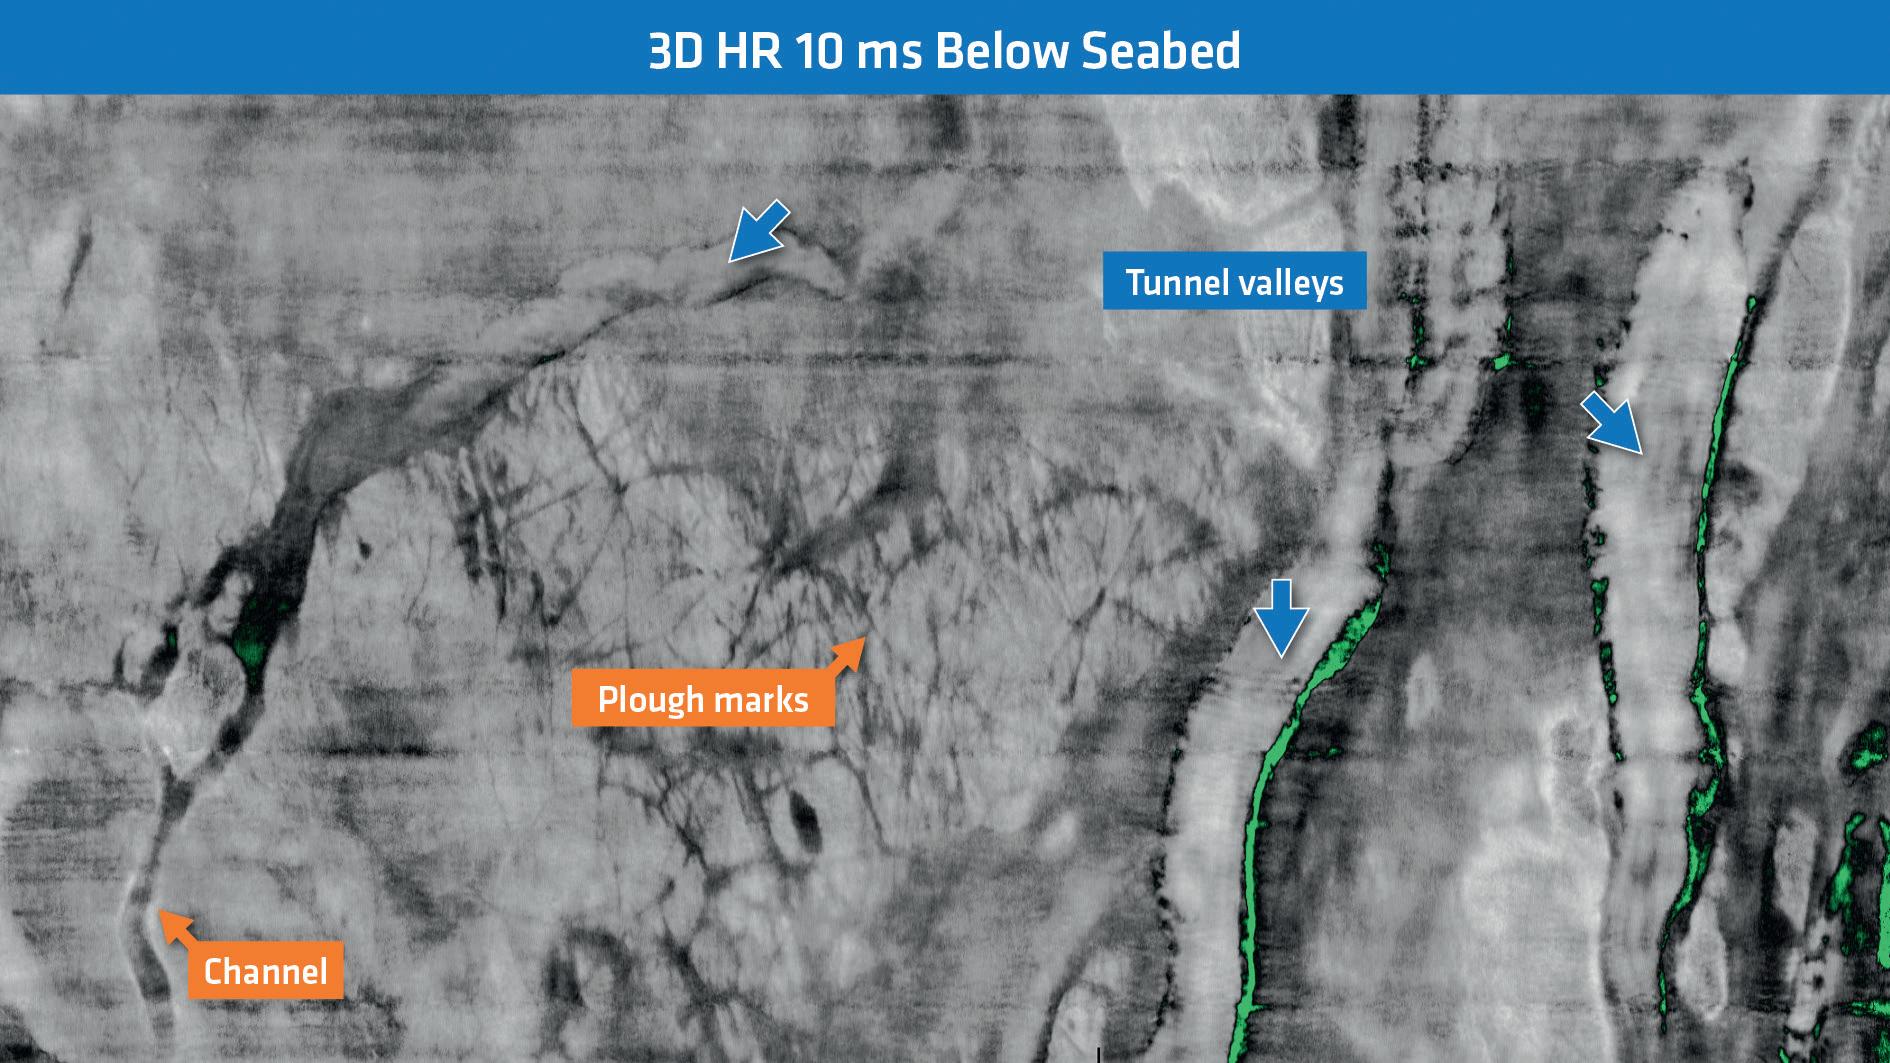
Figure 6 Illustration of challenges in interpreting near surface images on two orthogonal sections: both amplitude anomalies (the arrows indicate shallow gas) and structural shapes (e.g., the thrust features at 50-70 ms below the seabed reflection) can rapidly vary and need to be accurately mapped at regional scales.
Figure 7 Very shallow features may pose high risk for drilling operations and for foundations design. The arrows indicate large tunnel valleys with interesting features within and at the edges of it.
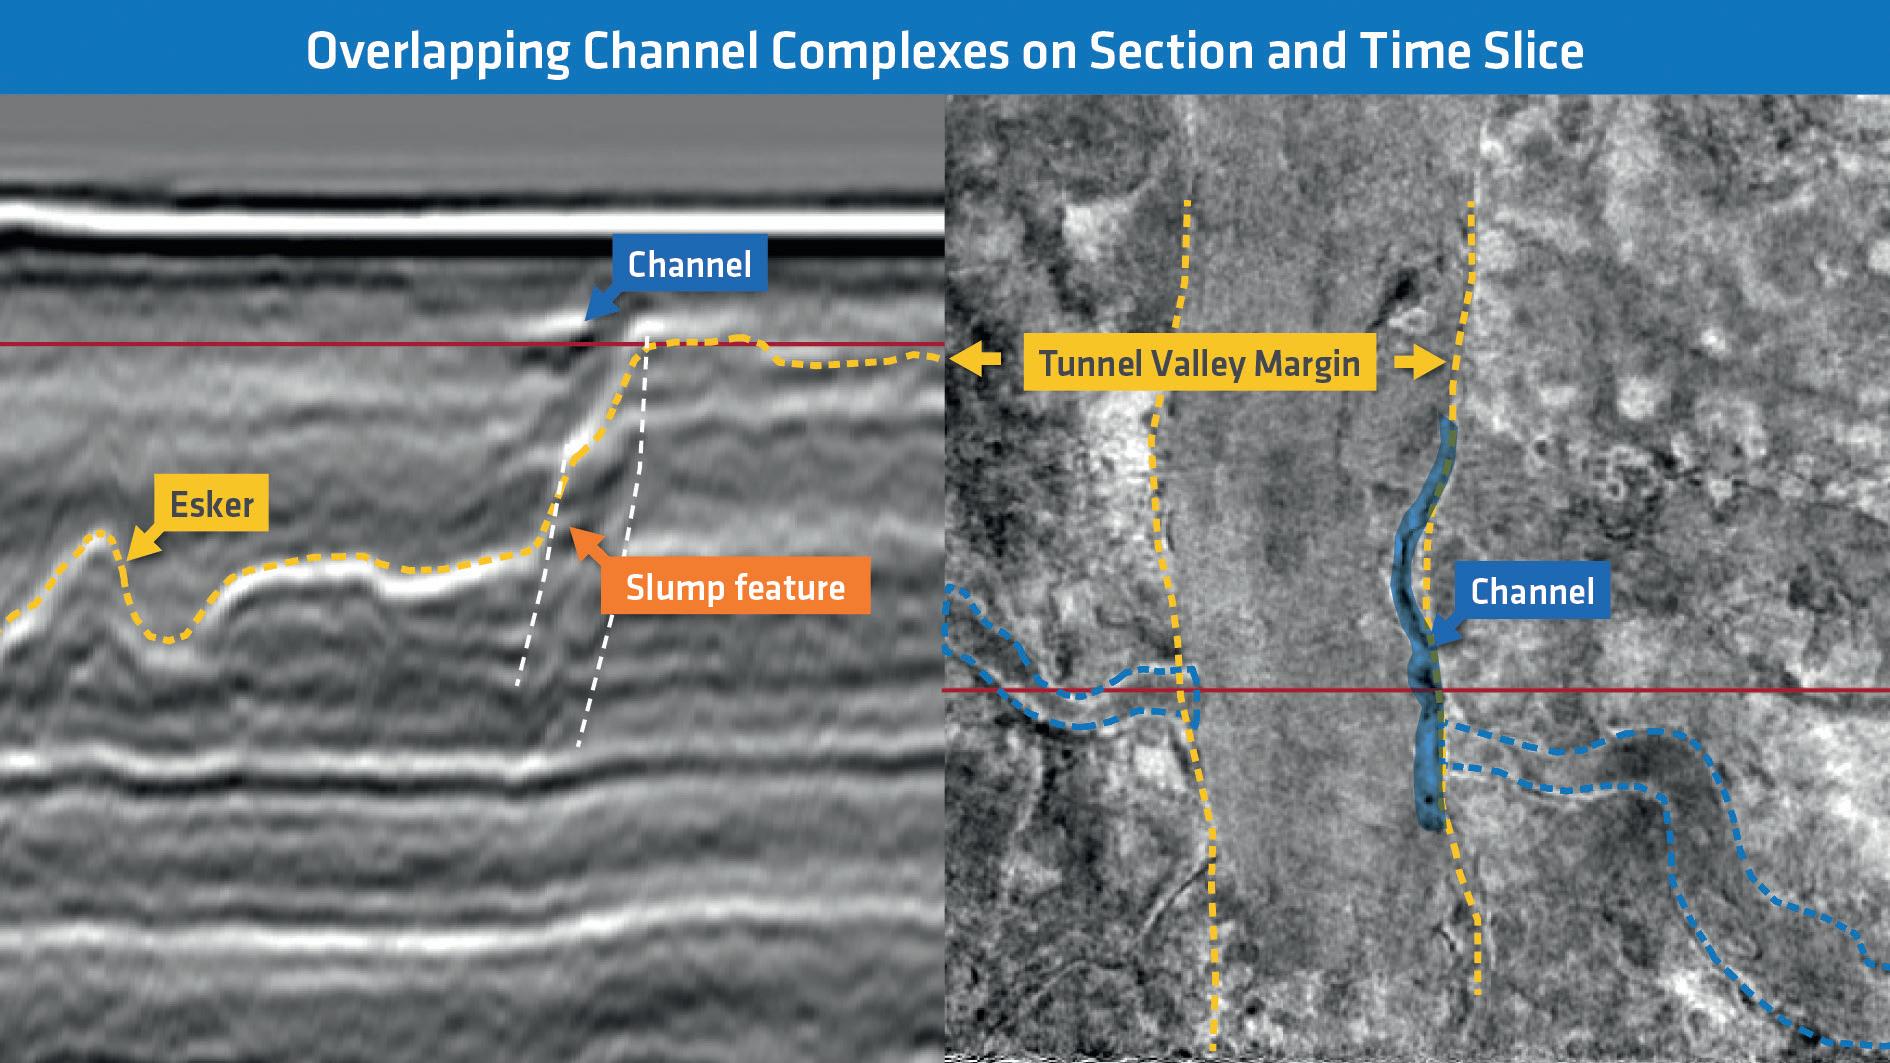
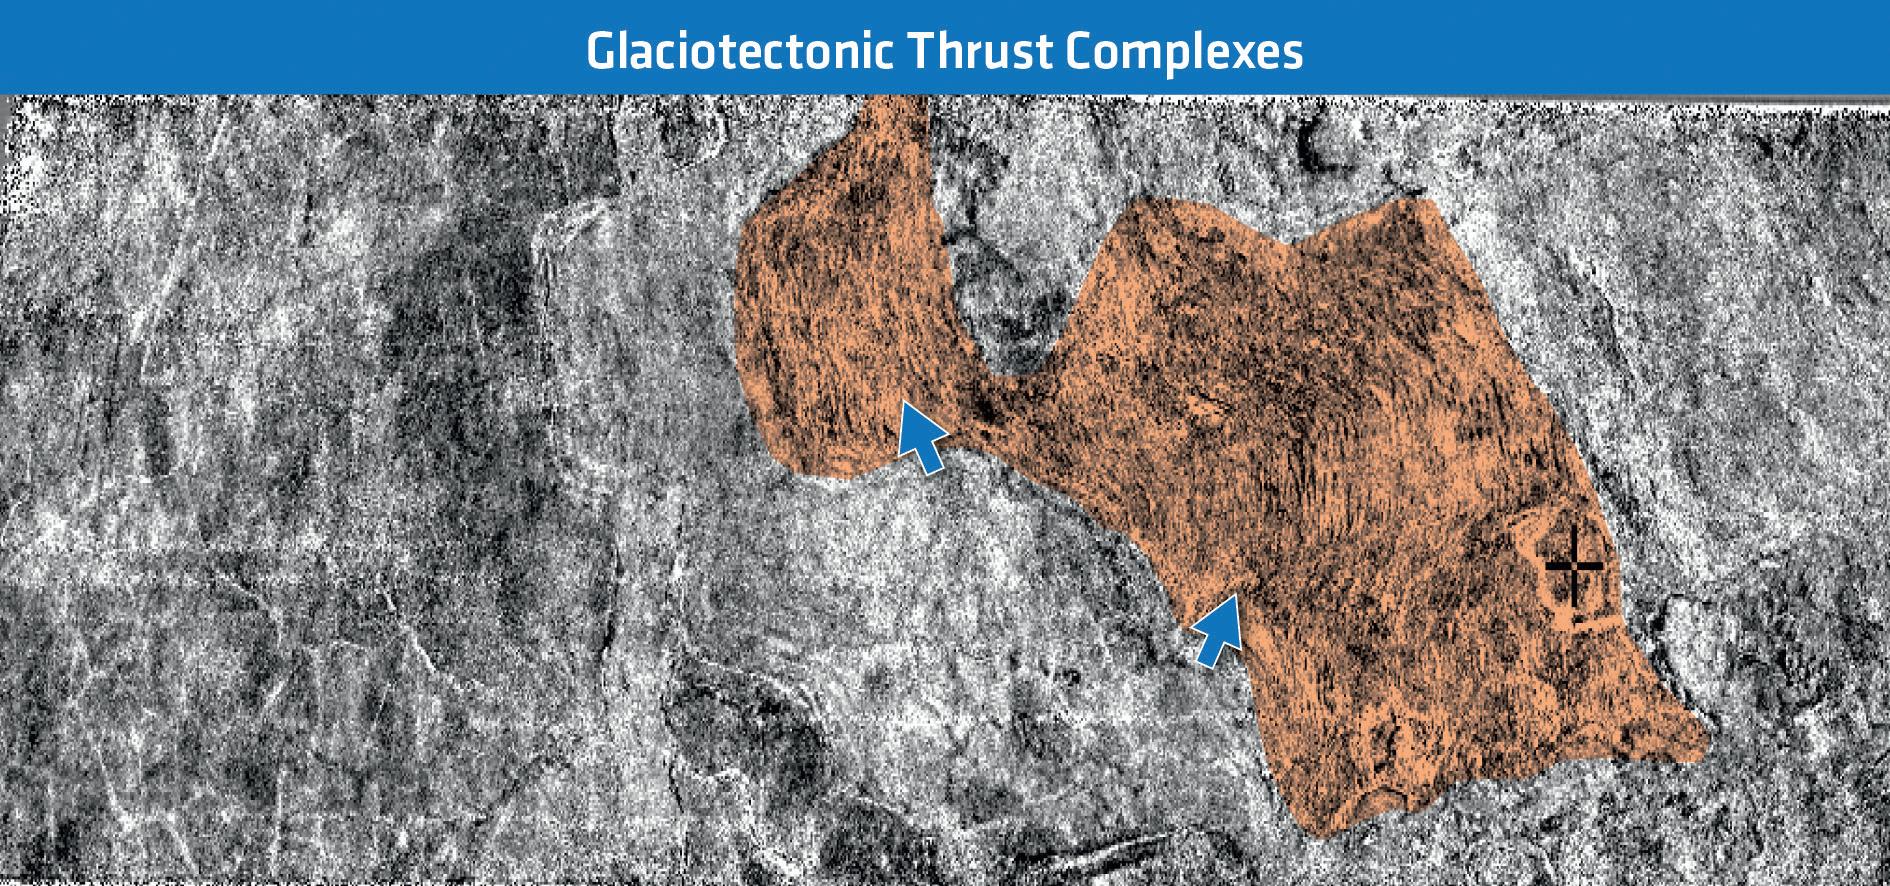
Figure 8 3D HR section and time slice (the red line indicates the intersection): tunnel valleys and channels bear high risks and can be very significant in size. Such features may also overlap and cross, requiring proper 3D interpretation.
Figure 9 Finer details may reveal geomorphological patterns which need further analysis and are not necessarily easy to detect and map as structural elements. The blue arrows indicate apparent changes in the direction of the internal structure of the features.
surveying activities. As seen within the O&G industry, it is common to complement existing data with new, for example by adding denser sampling or different offset/azimuth ranges. After a large-scale regional shallow mapping, UHR data may be collected in an efficient and still focused manner. Survey orientation, sampling, offset range, depth of penetration are all important and can be tuned, also within the same operation, to fully represent the highly varying complexity of the shallow geology. Therefore, there is a significant potential in optimizing future surveys for all offshore industries, by integrating the 3D seismic data and knowledge that were and still are being accumulated.
Conclusions and next steps We observe that processes and technologies can be optimized to recover valuable information at the seafloor and for the first hundred metres of the subsurface, revealing details which are often not available in the standard libraries of the O&G industry and which we believe have an important role to play in offshore industries, present and future.
The newly created HR data will be subject to further comparisons and reviews, including UHR seismic and geotechnical data. Our aim is to demonstrate that following an integrated approach may significantly reduce the overall timeline, risks, and costs of future offshore development projects.
Acknowledgements The authors would like to thank PGS for permission to publish this article. References
Lu., S., Whitmore, N.D., Valenciano, A.A., Chemingui, N. and Rønholt,
G. [2016]. A practical crosstalk attenuation method for separated wavefield imaging. 86th SEG Annual Technical Program, Expanded
Abstracts, 4235-4239. Oukili, J., Jokisch, T., Pankov, A., Farmani, B., Ronhølt, G., Korsmo,
Ø., Raya, P.Y. and Midttun, M. [2015]. A novel 3D demultiple workflow for shallow water environments – a case study from the
Brage field, North Sea. 77th EAGE Conference and Exhibition,
Expanded Abstracts, N114. Oukili, J., Gruffeille, J.-P., Otterbein, C., and Loidl, B. [2019].
Can high-resolution reprocessed data replace the traditional 2D high-resolution seismic data acquired for site surveys? First Break, 37, 49-54. Oukili, J., Widmaier, M., Roalkvam, C., Strand, C., Halbert, N. and
Baramony, O. [2021]. High resolution meets high efficiency with an ultra-wide-tow penta source solution in the Barents Sea. 82nd EAGE
Conference and Exhibition, Expanded Abstracts. Smith, P., Milne, R., Vey, G., Apeland, G., Way, S. [2019]. Can shallow hazard 3D seismic cubes enable leaner exploration workflows? 81st
EAGE Conference and Exhibition, Expanded Abstracts. Whitmore, N.D., Valenciano, A.A., Söllner, W. and Lu, S. [2010].
Imaging of primaries and multiples using a dual-sensor towed streamer, 80th SEG Annual Technical Program, Expanded Abstracts, 3187-3192. Widmaier, M., Roalkvam, C., Oukili, J. and Tønnessen, R. [2021].
Maximizing quality and efficiency with wide-tow multi-source configurations. First Break, 39, 75-80.


