8 minute read
Finding blind ore bodies using 3D seismic: St Ives-Victory Western Australia
Kevin Jarvis1*, A. Foley2, M. Falconer3, G. Turner1, J. Kinkela1, R. Smith1, S. Bright1 and S. Ziramov1 demonstrate how subsurface characterisation can provide a clear and detailed image of subsurface lithologies and is best achieved through joint, geostatistical inversion of both lithologies and elastic properties.
Introduction The St Ives gold camp consists of more than 60 separate deposits distributed over a 35 km corridor approximately 600 km ENE of Perth. St Ives is in the Kalgoorlie Terrane of the Eastern Goldfields Superterrane, within the Archean Yilgarn Craton of Western Australia. The Victory complex is within the St Ives Field close to the axis of a gently south-plunging anticline and is bounded by the Playa shear zone to the east and the Foster thrust to the west. Structurally controlled gold deposits have been identified in all stratigraphic units.
Advertisement
Inverting seismic data for elastic properties has significant advantages for subsurface characterization including increased resolution, removal of tuning effects and the conversion of interface properties to layer-based properties. Two very common inversion technologies are deterministic, constrained sparse-spike inversion (Pendrel and Dickson, 2003) and model-based inversion (Pendrel et. al., 2004). Deterministic inversions typically yield a single set of elastic properties on the same scale as the seismic data, whereas model-based inversions integrated with geostatistics yield multiple sets of properties at far greater detail, thus providing additional information such as estimates of uncertainty. While the benefits of seismic inversion for predicting elastic properties of rocks have been recognized for some time, the goal of subsurface characterization is often to provide a clear and detailed image of the distribution of lithologies. The methodology with the greatest potential for achieving this objective is based on the joint inversion of both lithologies and elastic properties. This approach fully exploits the distinctiveness of lithologies with bounded elastic properties and can predict finer detail than is possible with deterministic inversion technology.
What are lithologies? This may seem like an obvious question but ultimately the definition of any lithology is subjective. Rocks are made up of mineral mixtures that are neither constant nor consistent from place to place and are invariably heterogeneous due to the deposition of the minerals in highly variable geographic environments. This is further complicated in hard-rock scenarios as the rocks are often metamorphosed with associated compositional and mineralogical changes. If seismic inversion is to be successful for resolving lithologies, a critical part of the workflow thus consists of establishing an appropriate definition of lithology.
At St Ives the rocks are predominately igneous in origin, consisting of basalt, dolerite and komatiite with felsic intrusives. Other rocks and internal variations are also present (including gold mineralisation); however, the thickness and percentages are very small in comparison to the seismic wavelength scale of approximately 150 m.
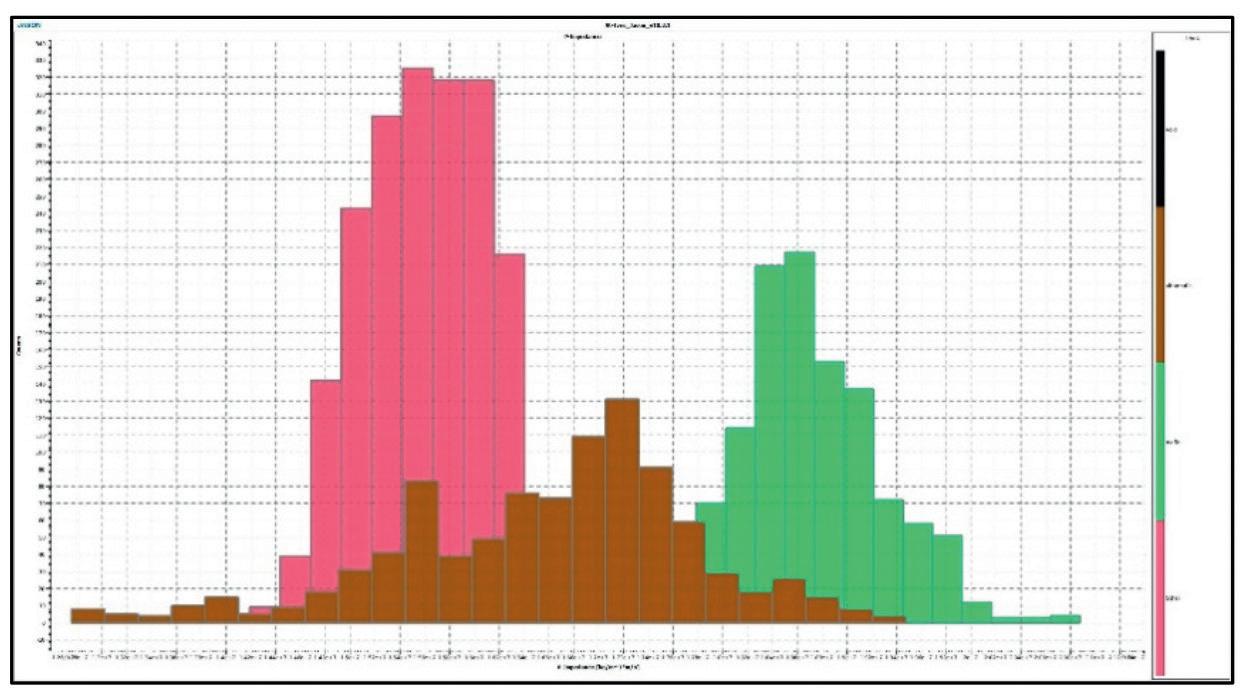
Figure 1 The probability density distribution of P-Impedance for the three rock types at St Ives showing fair separation.
1 HiSeis | 2 Gold Fields | 3 Kairos Minerals * Corresponding author, E-mail: k.jarvis@hiseis.com DOI: 10.3997/1365-2397.fb2022070
Method It is generally accepted that geostatistical inversion problems are best formulated within a Bayesian framework where multiple sources of disparate data can be integrated in an unbiased manner by representing each in a probabilistic fashion (described in Gilks et. al, 1996). The type of information typically involved includes lithotype probabilities, probability density functions (pdfs), spatial correlation patterns, wavelets and seismic data. Taken individually, these beliefs do not provide enough information to generate highly detailed and realistic models of the subsurface. However, taken collectively and with an explicit acknowledgment of the various sources of uncertainty, it is possible to generate a single highly dimensional probabilistic distribution of the subsurface given all known information. A Markov Chain Monte Carlo method can then be used to sample this distribution and obtain multiple plausible realizations. None of these realizations is necessarily perfect, but all are plausible and together give an intuitive and realistic representation of the underlying uncertainty associated with the seismic data. Optimum results are obtained from the geostatistical inversion algorithm if identified lithologies show a good separation of elastic properties (Jarvis and Saussus, 2009).
The degree to which different lithologies can be accurately identified from seismic data relates directly to how much these separate in the elastic property space. For a single seismic stack, this means examining the overlap between the histograms of P-impedance for each lithology type. The P-Impedance pdfs for St-Ives are shown in Figure 1. There are three main rock types: mafic, ultramafic and felsic, with the mafics showing the highest P-Impedance and the felsics the lowest.
It is important to understand the implications of coming up with a solution based on rock properties confined within reasonable bounds. This characteristic allows for the identification of lithologies probabilistically with finer detail than standard seismic resolution theory would suggest. Effectively it means testing the ‘detection limits’ of the seismic where any reflection that exceeds the noise level can be associated with a change in rock properties and potentially this is an indication of a change in lithology. Consider an example of a homogeneous rock with embedded bodies having a distinctly different set of properties. The background rock would not produce internal reflections

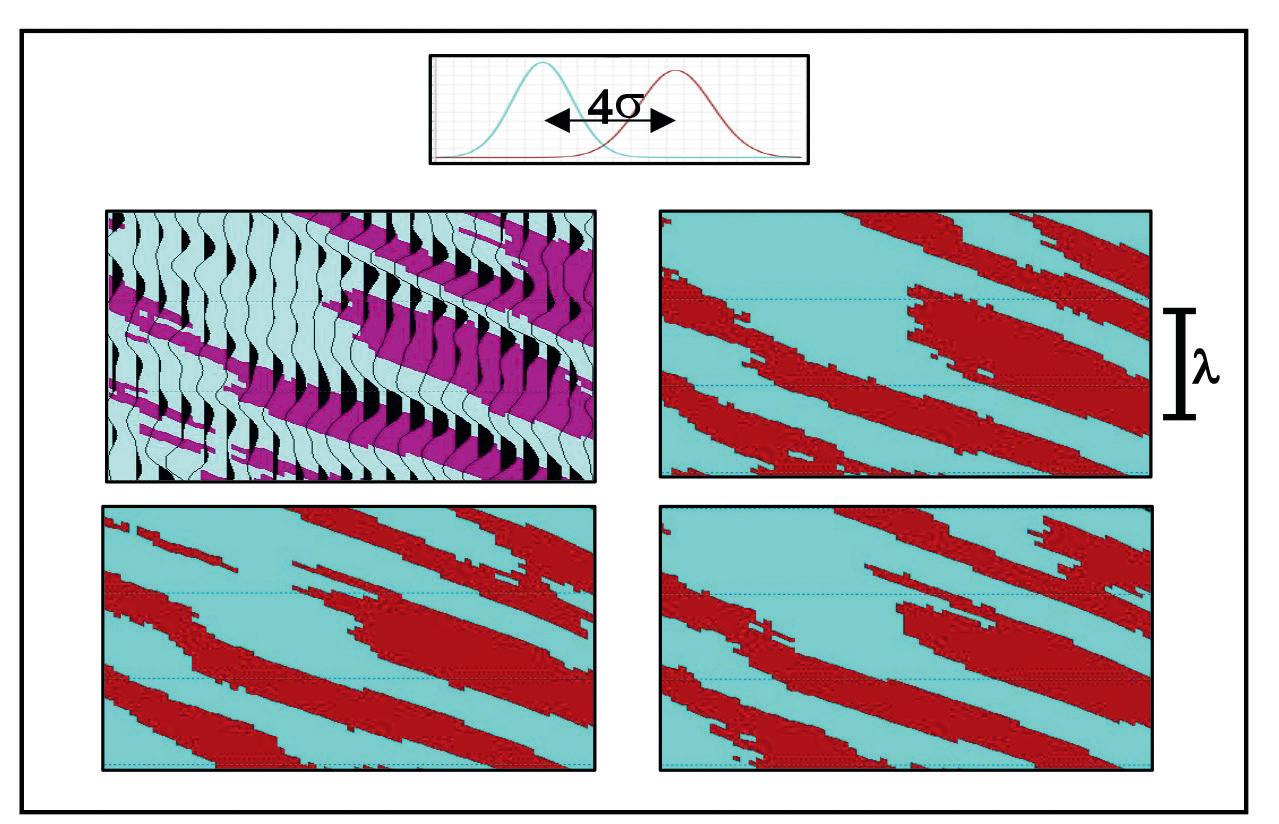
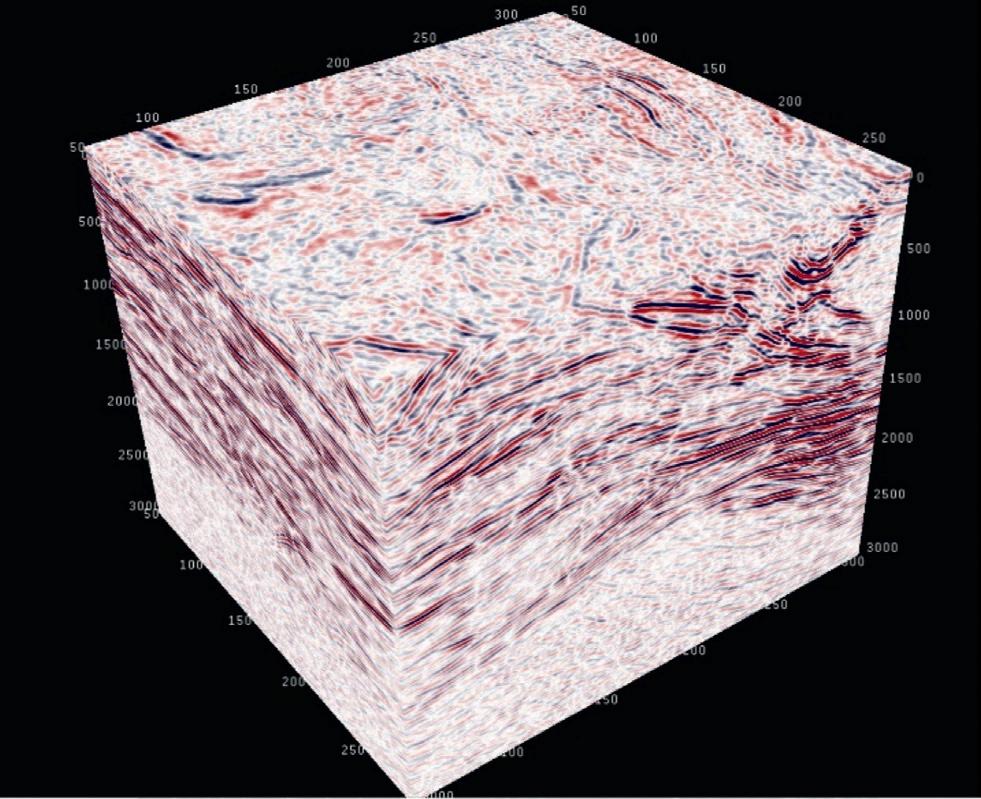
Figure 2 Synthetic model showing seismic and ‘true’ model in upper-left panel and three different lithology realizations from geostatistical inversion in the other three panels. Figure 3 Victory3D seismic volume showing good reflectivity in the upper 2500 m.

and any coherent reflections would thus be associated with the embedded bodies of varying thicknesses, even those below standard seismic resolution. A synthetic example illustrating this point is shown in Figure 2. The histograms of P-Impedance show a separation of properties and the three realizations of inverted lithology show an excellent match to the input model even at thicknesses below standard seismic resolution. There was no borehole data used in the inversion, so these are effectively blind predictions of the embedded bodies.
Application to the victory seismic Synthetic datasets can be oversimplified and are not necessarily a good indication of how an algorithm performs on actual seismic data. The Victory seismic volume has many complexities, including both random and coherent noise. A 3D view of the seismic volume is shown in Figure 3. The seismic volume shows reflectivity varying spatially and at depth. Some reflections are long, with continuous amplitudes while others are short with apparent breaks in them. These reflective zones are due to both structure and stratigraphy. The ‘quiet’ zone at the base of the volume is a large granite intrusive. There are 5000+ drillholes within the seismic volume but a majority of these only penetrate the upper 300 m. The inversion of the seismic volume requires an initial interpretation, tied to drilling, to understand the large-scale features and to define the general stratigraphy.
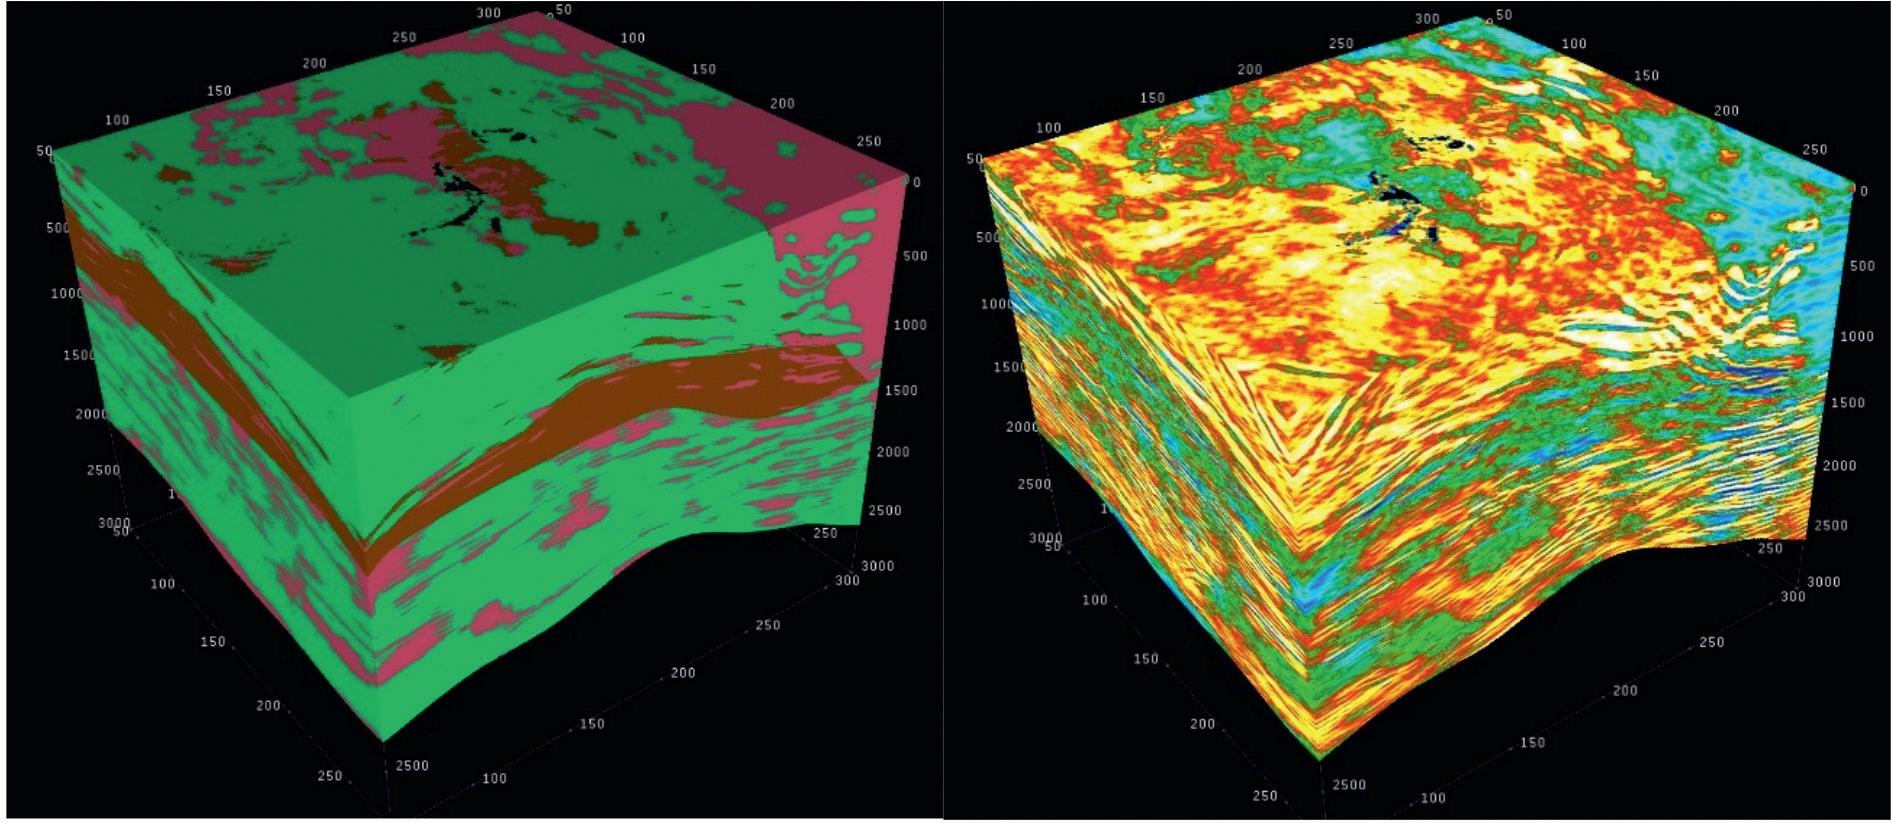
The advantage of using a statistical inversion on a seismic volume is the ability to summarize results statistically to show consistent patterns and to quantify uncertainty. Two of the summary outputs from the geostatistical inversion of the seismic data are shown in Figure 4. The complex reflectivity of the seismic volume has now been simplified into three distinct rock types that follow the known stratigraphy and honour the lithology seen in the 5000 drill holes. The P-Impedance model shows zones with high and low values that must be looked at together with the lithology volume to understand the significance.
To relate the changes in P-Impedance to something more meaningful requires a good understanding of the rocks and structural elements. The structure requires further analysis of the seismic data (e.g., Marsh et. al., 2022). Based on in situ measure-

Figure 4 Inversion statistical summary volumes of most probable lithology (left) and mean P-Impedance (right).
ments of P-Impedance via wireline logging or measurements on core samples a detailed categorization of possible rock type variations, and fault set intersections can be made to understand the significance of the different areas in the volumes. Understanding the properties of key features such as alteration zones provides a way to identify prospective zones with gold mineralization and potentially identify undrilled ore bodies within the volume.
Conclusions We have shown that the geostatistical inversion of the Victory seismic data can provide detailed rock models over a volume and at a resolution previously not possible. The key to the accuracy of these models lies in the joint inversion of lithology and P-Impedance. The geostatistical nature and the Bayesian framework upon which this methodology is based ensures that the predictions honour all known information and produce geologically plausible results with meaningful horizontal and vertical scales. The result is a set of volumes that can be used to characterize a large volume within the permit area, to identify zones likely to contain large ore bodies and to sterilize other zones not likely to be prospective. Acknowledgements We would like to thank Gold Fields for the use of their comprehensive St Ives/Victory datasets.
References
Gilks, W., Richardson, S. and Spiegelhalter, D. [1996]. Markov Chain
Monte Carlo in practice: Chapman & Hall/Crc, Interdisciplinary
Statistics, London, p. 486. Jarvis, K. and Saussus, D. [2009]. Extracting detailed lithology from seismic data, ASEG Extended Abstracts. Marsh, T., Young, C., Turner, G., Kinkela, J., Smith, R., Bright, S. and
Ziramov, S. [2022]. Fast, objective, structural frameworks from 3D seismic data: automated fault tracking tools and their ability to map minerals system controls and post mineralization structural offsets,
AIG Symposium: Structural Geology and Resources 2022 Kalgoorlie
Abstracts. Pendrel, J.V. and Dickson, T.D. [2003]. Simultaneous AVO Inversion to
P-Impedance and Vp/Vs, CSEG Annual Meeting Abstracts. Pendrel, J., Leggett, M. and Mesdag, P. [2004]. Geostatistical Simulation for Reservoir Characterization, CSEG Annual Meeting Abstracts.
ADVERTISEMENT
Publish with EAGE


To serve the interests of our members and the wider multidisciplinary geoscience and engineering community, EAGE publishes a range of books and scientific journals in-house. Our extensive, professional marketing network is used to ensure publications get the attention they deserve. EAGE is continually seeking submissions for both book publishing and articles for our journals.
A dedicated and qualified publishing team is available to support your publication at EAGE.
CONTACT OUR PUBLICATIONS DEPARTMENT AT PUBLICATIONS@EAGE.ORG!


