25 minute read
Aggregate (sand and gravel) exploration with 2D electrical resistivity imaging and test drilling on the western limits of the Balcones Fault Zone in Texas, US
Hector R. Hinojosa1* presents the results of an ERI survey that deployed eight electrical resistivity profiles and four continuous flight hollow-stem auger cores.
Introduction The current energy transition to a low-carbon society demands vast amounts of metallic and non-metallic minerals to develop renewable energy sources and other high-technology applications that require new infrastructure. The transition will consume different minerals, including critical metals, and vast amounts of common commodities such as base metals and aggregates (Ali et al., 2017). The global extraction of fossil fuels, biomass, metal ores, and non-metallic minerals has enormously accelerated over the past four decades, but more since 2000 (Schandl et al., 2018). Mainly, non-metallic minerals used in construction show the fastest-growing group of materials (Schandl et al., 2018). Aggregates such as sands, gravels, and crushed stone are non-metallic products of an open pit or quarry used worldwide in building and transport infrastructure (i.e., railways and roads). In North America and Europe, their consumption over the past 45 years has been linked to population growth (Miatto et al., 2017). This trend is unlikely to reverse.
Advertisement
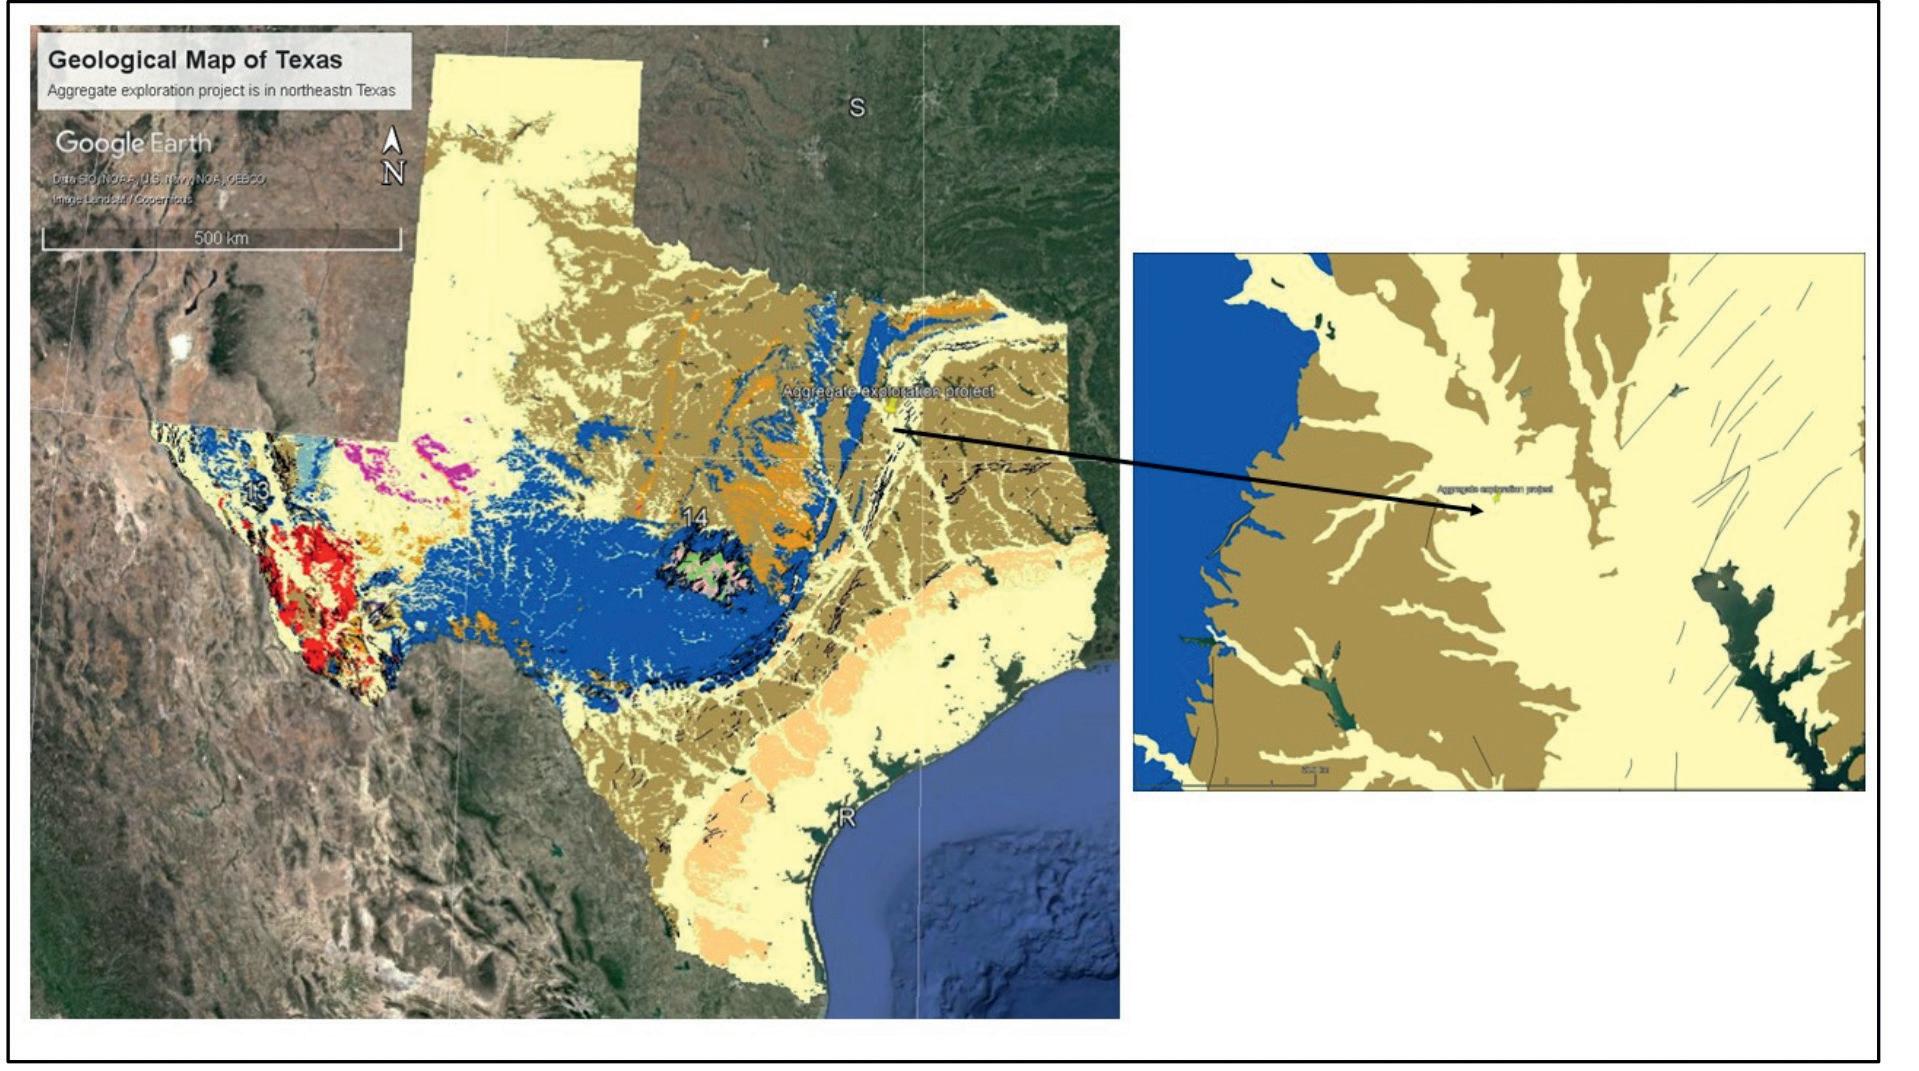
In Texas numerous aggregate quarries produce sand and gravel at or near-maximum capacity. So the need for new quarries in Texas is a necessity. A shallow two-dimensional (2D) electrical resistivity imaging (ERI) survey coupled with exploration drilling was used to explore for aggregate in northeastern Texas. The survey area (4.05 km2) is between two significant waterways tributaries of the Trinity River, which is nearly 2.5 km west. The study area is in the western limits of the northern tip of the Balcones Fault Zone (BFZ), a structural feature that traverses much of east-central Texas. The 2D ERI survey comprised eight electrical resistivity profiles, oriented east-west and north-south and equidistantly distributed throughout a survey area. The 2D ERI survey reached ~45 m and, with available upfront geological information, suggested an aggregate (sand and gravel) body between 6.20 and ~23 m in a prominent Quaternary alluvium blanket deposited over shale bedrock. Ground-truthing with four test hollow-stem auger drilling confirmed the occurrence of aggregates and enabled estimating of the aggregate’s average depth and stratigraphic thickness. Figure 1 shows the geographic location of the project area relative to the BFZ.
Background geology The project area is between two north-south-trending branches of a tributary near the Trinity River, so the site is frequently flooded.
It is also immediately west of the BFZ’s northern tip, as seen in Figure 1. The BFZ comprises a ~1000 km-long, curved belt network of major southwest-northeast-striking, seismically inactive, high-angle (40°-80°) en-echelon, dip-slip normal faults
Figure 1 The geological map of Texas shows the location of the project area relative to the Balcones Fault Zone (BFZ). The numerous thin black lines define the BFZ from southwest-central to northeastcentral Texas(source: https://mrdata.usgs.gov).
1 Cordillera Geo-Services * Corresponding author, E-mail: hector@cordillerageo.com DOI: 10.3997/1365-2397.fb2022068
(Ferrill et al., 2004, 2019). Most normal faults are generally downthrown to the east and southeast and have throws between < 0.5 to 245 m (Collins et al., 2002; Collins and Raney, 2002). The arc-shaped BFZ bitterly deforms much of central Texas, from the Del Rio-Nuevo Laredo region in south Texas to the Dallas-Texarkana region in northeast Texas. The BFZ’s width ranges between 10 and 60 km and trends east-west between Del Rio and San Antonio cities, and from there, it trends northward in Austin and northeastward from north Austin to the Dallas-Commerce area. Then it trends east-west between Commerce and Texarkana. Throughout much of the BFZ, its normal faults displace Cretaceous limestone, dolomite, marl, and shale of the Edwards Plateau, representing more than 600 m of a shelf and shelf-margin deposition (Collins and Raney, 2002). Hence, the BFZ controls major aquifers’ structural position and bounds many of the recharge zones, so it is a dominant structural feature that plays a significant hydrogeological and depositional role in Texas.
The surficial geology is entirely Holocene alluvium comprised of floodplain deposits of variable thickness, including distinct low terrace deposits, gravel, sand, silt, and moderately well-drained silty clay (McGowen et al., 1987), as shown in the geological map in Figure 2. The Quaternary geological map of the Dallas 4° × 6° quadrangle also documents alluvial sand silt, clay, and gravel intermixed or interbedded (Luza et al., 1994). Locally, it includes lenses of clay and layers of sheet wash alluvium. According to Luza et al. (1994), the stratigraphic thickness varies from 3 to 30 m, but mostly ~5-6 m. There are no identified geological faults within the project area; however, only one NE-SW-trending normal fault occurs west of the project area, affecting the Late Cretaceous Wolfe City Formation, comprising marl, sand, sandstone, and mudstone (Figure 2). Publicly available water well reports (report ID# 33372, 33373, 33379, 325680) by the Texas Water Development Board (TWDB, 1986, 1993, 2001, 2013) reveal the following stratigraphy from top to bottom: topsoil, clay, sand, wet sand-and-gravel, and wet shale bedrock. Field reconnaissance work around the project area indicates that the subsurface conditions contain a soft and unconsolidated clastic sequence deposited over soft shale. Kaufman County has
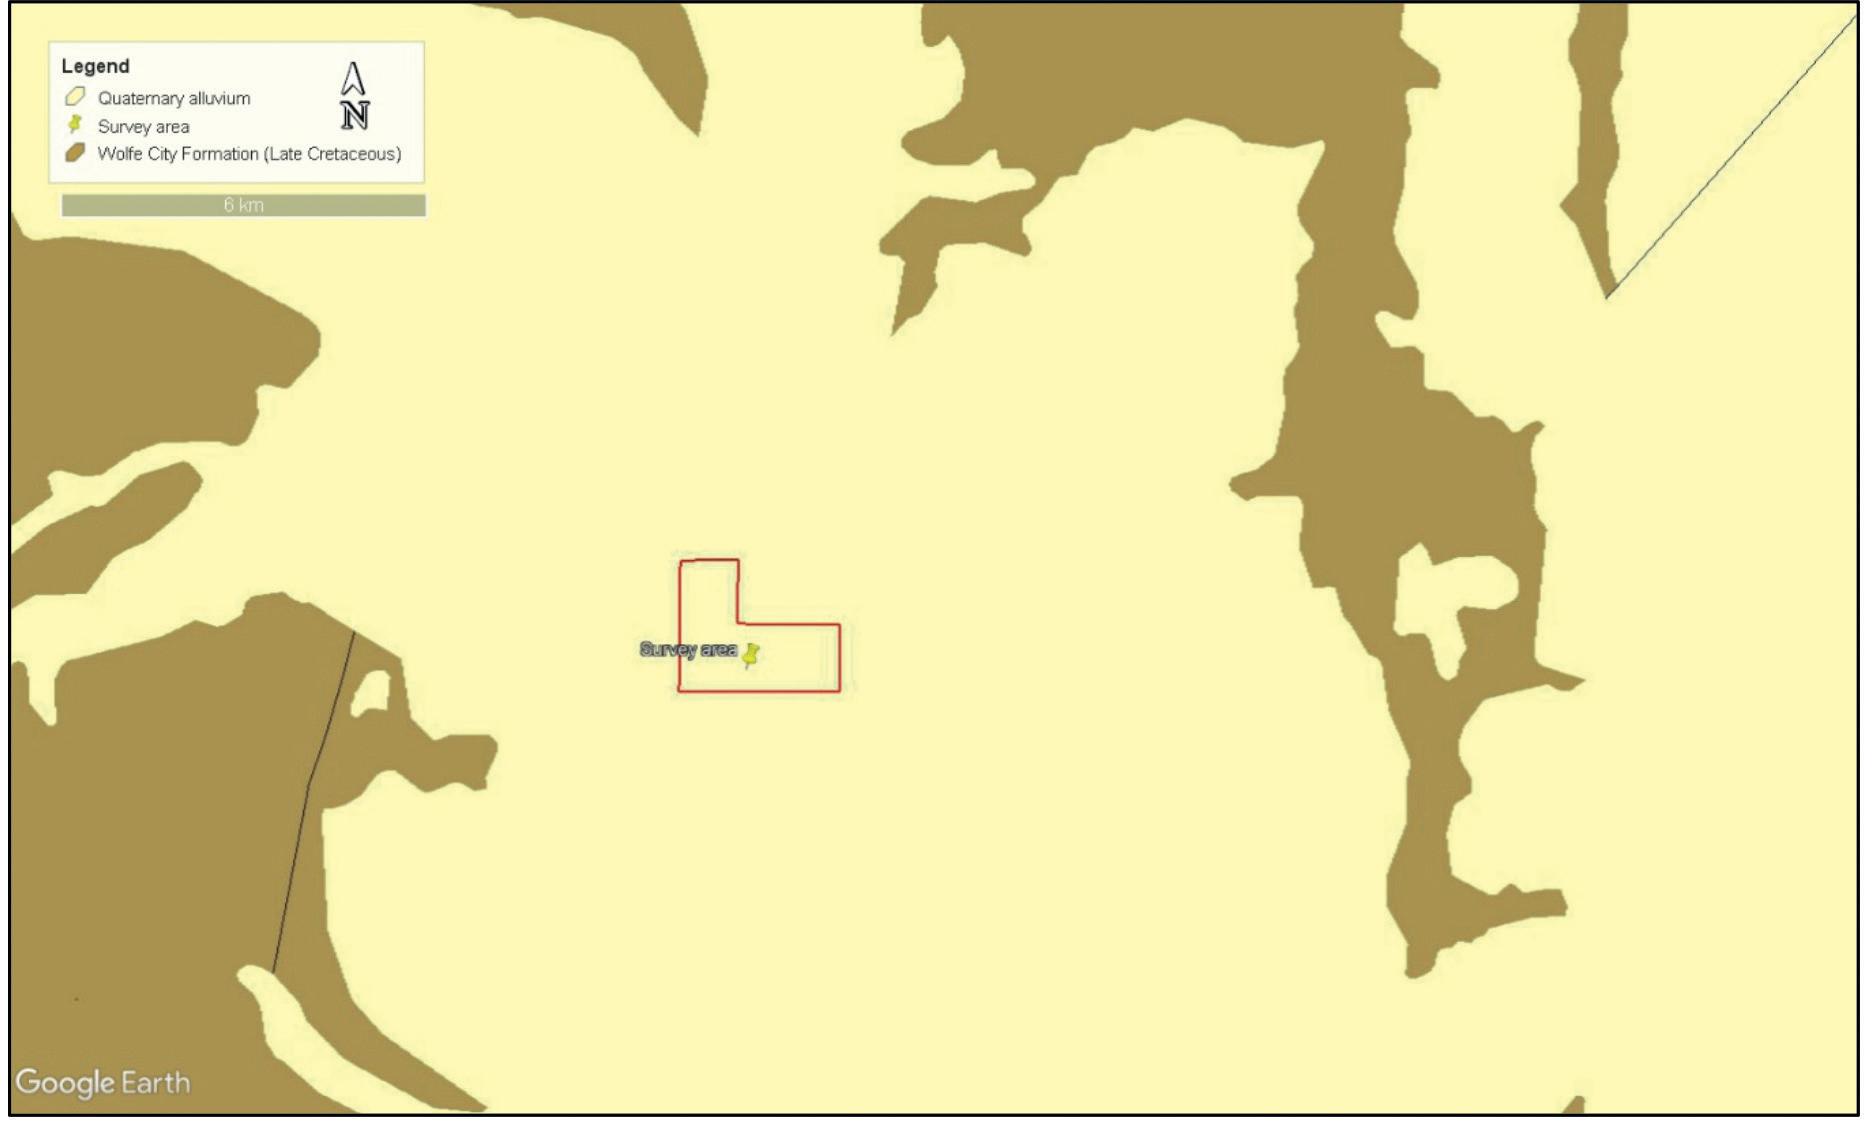
Figure 2 The simplified geological map of the project area (red polygon, 4.05 km2) shows the Quaternary alluvium’s surficial extent. The solid black lines are normal faults of the Balcones Fault Zone (source: https://mrdata.usgs.gov).
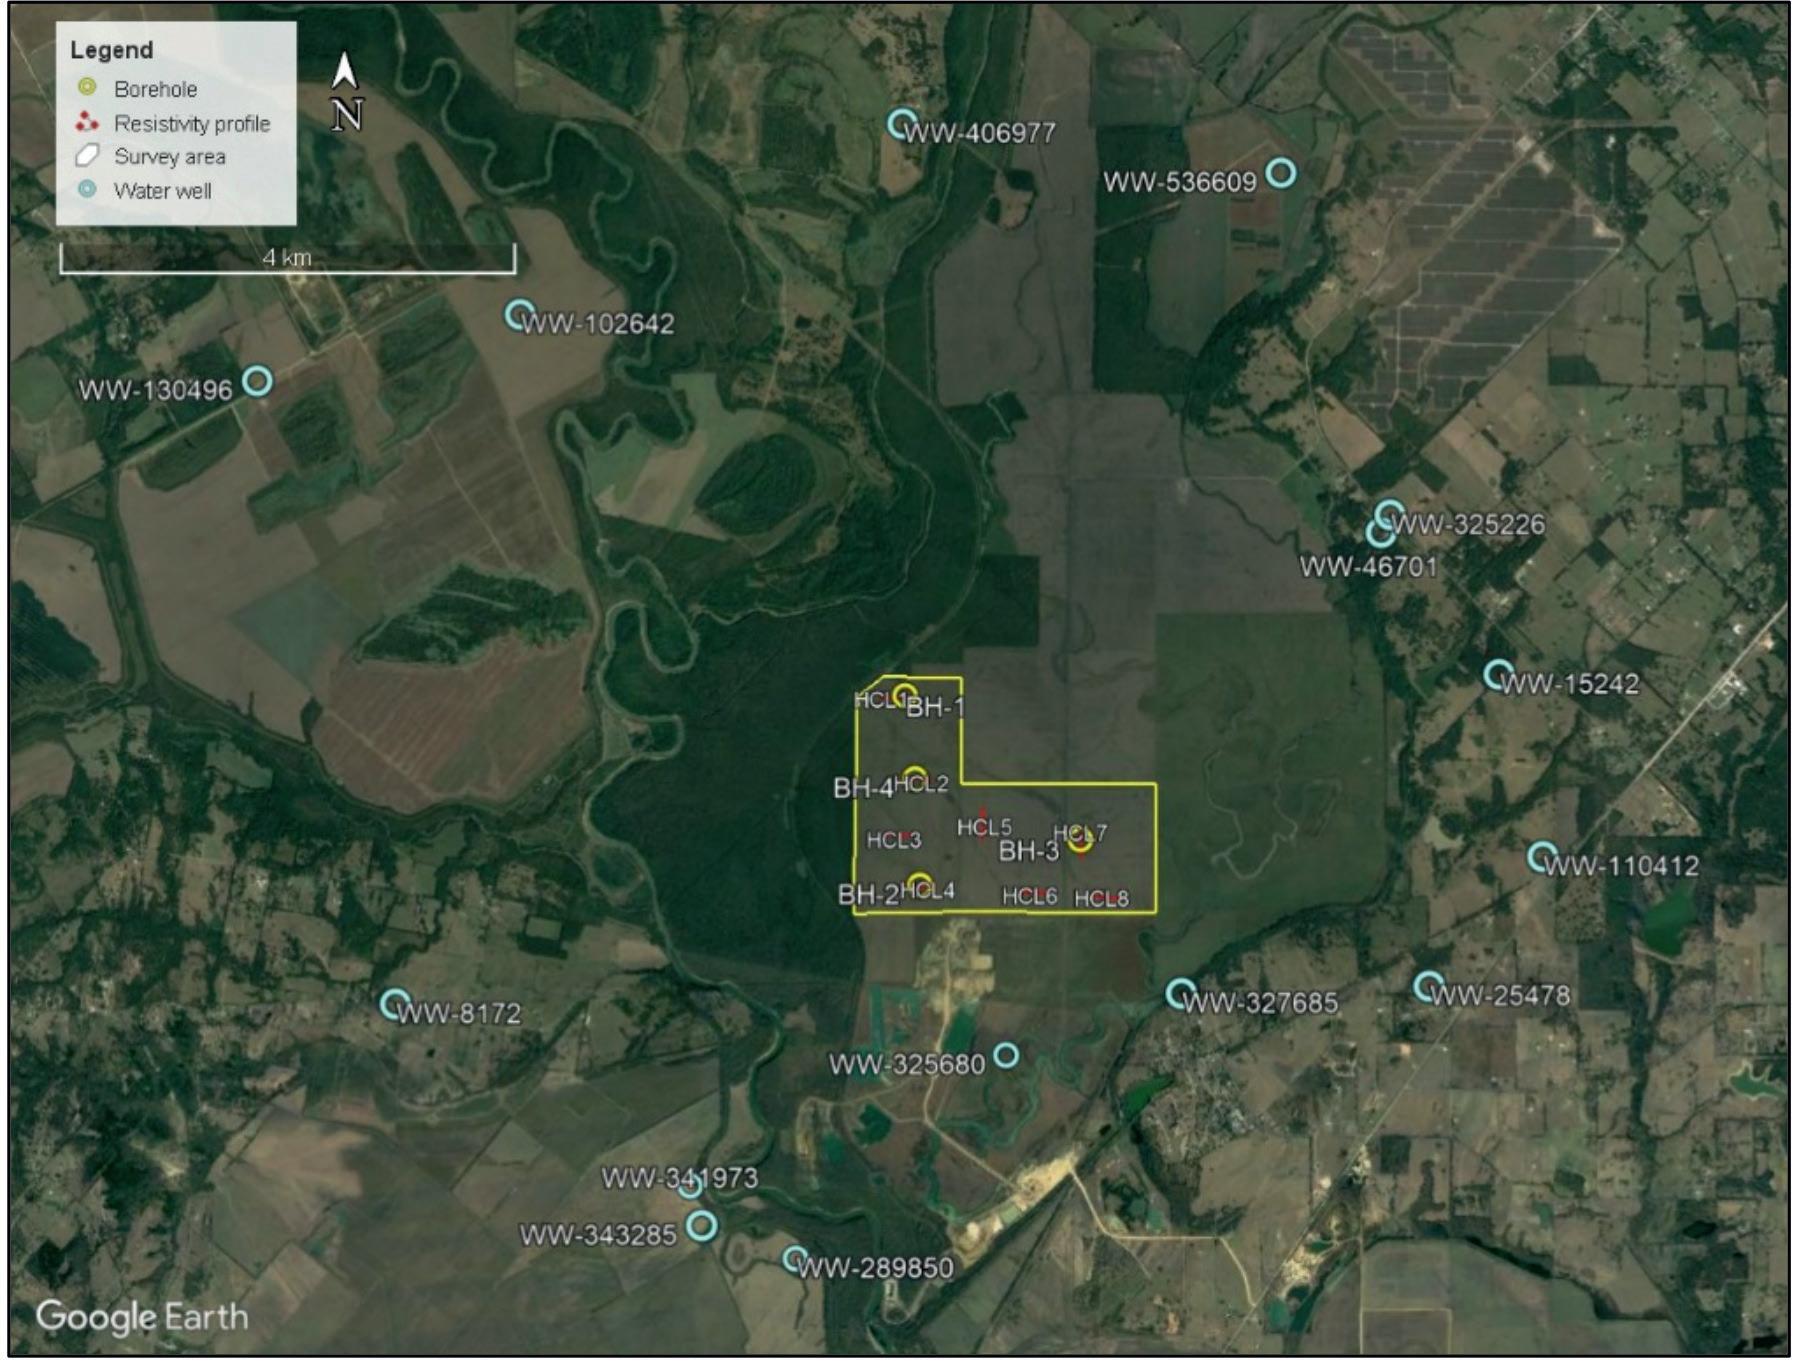
Figure 3 Aerial photograph showing the project area (yellow polygon) relative to the eight electrical resistivity profiles (red lines) four exploration holes (yellow circles) and the neighbouring water wells (blue circles: https://www3.twdb.texas.gov/apps/ waterdatainteractive/groundwaterdataviewer). The meandering Trinity River is left of the project area.
Profile Resistivity (Ω-m) Range RMS % L2-Norm
Yes/No Value Yes/No Value Quality factor
HCL1 2.6-17.3 Yes 2.29 No
HCL2
HCL3
HCL4
HCL5
HCL6
HCL7 3.0-9.8
1.0-77.0
1.0-63.0
1.6-32.3
1.9-15.0
2.5-12.9 Yes
Yes
Yes
Yes
No
No 2.97
2.69
2.91
2.47 No
No
No
No
Yes
Yes
HCL8 2.1-6.8 No - Yes
Table 1 Summary of inversion results for all 2D ERI profiles. Terrain correction was not required. - Excellent
Excellent
Excellent
- Excellent
- Excellent
0.90 Excellent
0.39 Excellent
0.53 Excellent Iteration Number
1
1
1
1
1
2
2
10
numerous water wells, particularly near the project area. Existing water well reports retrieved from the interactive Texas Water Development Board (TWDB) water data platform (https://www3. twdb.texas.gov/apps/waterdatainteractive/groundwaterdataviewer) provide supporting evidence that there is a sand-gravel deposit in the project area. Figure 3 illustrates the distribution of 16 neighbouring water wells relevant to this study. The water wells reveal the following general stratigraphy from top to bottom: topsoil, clay, fine-grained sand with gravel lenses and wet shale bedrock. More importantly, the gravel occurs in the sand or as discrete lenses.
Exploration methodology Five well-established and well-tested land geophysical exploration methods that aggregate producers can use to characterize known sand and gravel deposits include electrical resistivity, seismic refraction and reflection, ground-penetrating radar, time-domain electromagnetics, and frequency-domain electromagnetics, following Lucius et al. (2007). Depending on the site conditions and the selected exploration method(s), geophysical surveys can provide information regarding the aerial extent and thickness of the aggregate deposit, the thickness of the overburden, depth to the water table, critical geologic contacts, and location and correlation of geologic features. Furthermore, geophysical surveys can be conducted before intensive exploration or ground-truthing drilling to help locate auger or drill holes, reduce the number of drill holes required, calculate stripping ratios to help manage mining costs, and provide continuity between sampling sites to upgrade the confidence of reserve calculations from probable reserves to proved reserves. Perhaps the great value of geophysics to aggregate producers is the high speed of data acquisition, reduced overall cost, and improved subsurface characterization. The aggregate exploration strategy was twofold. First, the 2D ERI survey was deployed, and the results were used to guide the subsequent drilling campaign. This section discusses the geophysical survey methodology before the drilling campaign.
Geophysical survey: 2D ERI This aggregate exploration project used the direct current (DC) electrical resistivity survey method, one of the oldest and most frequently used geophysical methods (Reynolds, 2011). The method is extensively utilized in mineral exploration campaigns, engineering and environmental investigations, hydrogeological studies, and archaelogical prospecting (Loke et al., 2013, and references therein). The method has been proven to be successful in the geotechnical arena worldwide because of its non-destructive, cost-effective, and rapid ability to image natural subsurface material, structures, or features (Loke et al., 2013; Gunn et al., 2015), with a certain degree of resolution (Griffiths and Barker, 1994). It is a well-established, well-tested surface geophysical method suitable for characterizing sand and gravel deposits (Lucius et al., 2007). This project selected the method because the non-invasive electrical resistivity method can save time, cost, and effort in aggregate exploration and yield detailed images of the subsurface anomalies.
Data acquisition Eight profiles were acquired within the defined survey area (4.05 km2) in four full fieldwork days. All resistivity profiles were deployed under similar flat and open ground-surface conditions (Figure 3). The resistivity data were acquired with the same acquisition parameters for all profiles. The dipole-gradient electrode array was used with 56 electrodes spaced at 5 m. The injected current was set to a maximum of 2 amperes, two cycles, 2% maximum error, and 1.2 seconds measure time. The ground contact resistance at the project site was favourable during the ERI survey, with most resistance under ≤ 200 Ω, which facilitated the injection of electrical current into the ground. The low resistance is attributed to the subsurface clastic materials’ natural wet/ conductive conditions.
The resistivity data acquisition system consisted of the SuperSting R8/IP/SP Resistivity meter with an external 56-electrode switchbox and four passive cables. Before each measurement at each profile, the resistivity data acquisition system was tested to ensure proper functioning. Instrument testing included the receiver test, the relay test, and the resistance test. The receiver test examines the proper calibration of the (eight) internal receivers. The relay test checks the performance of the relays in the switchbox. The contact resistance test verifies continuity in the electric circuit using an electrode pair of
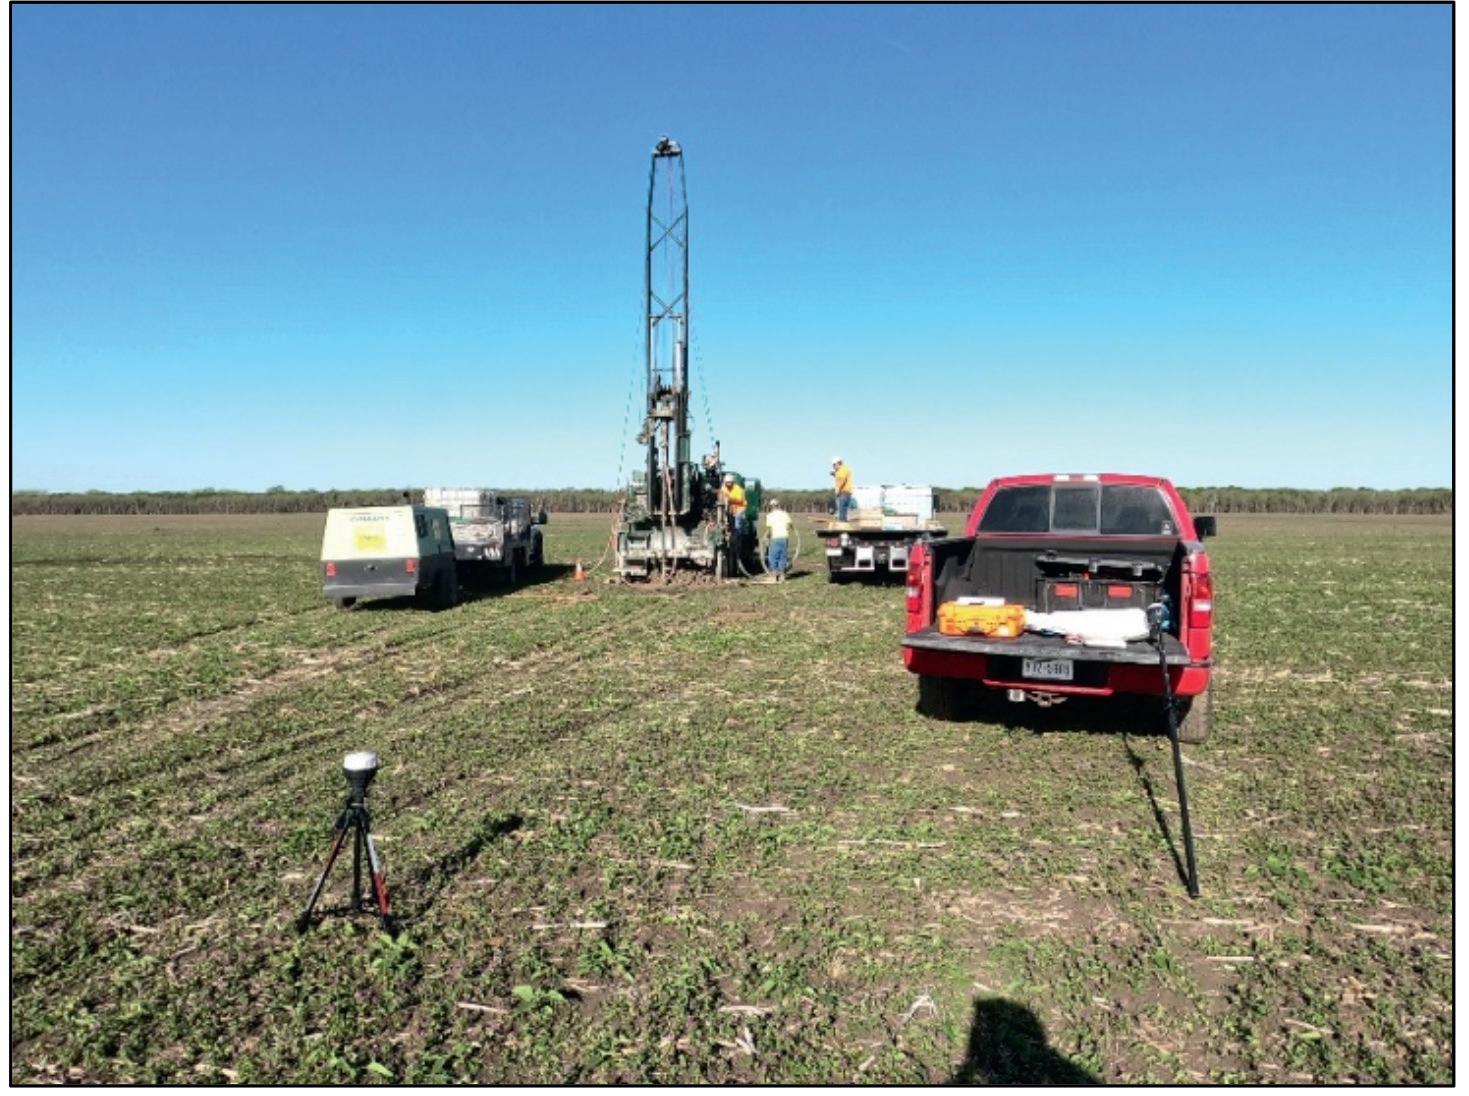
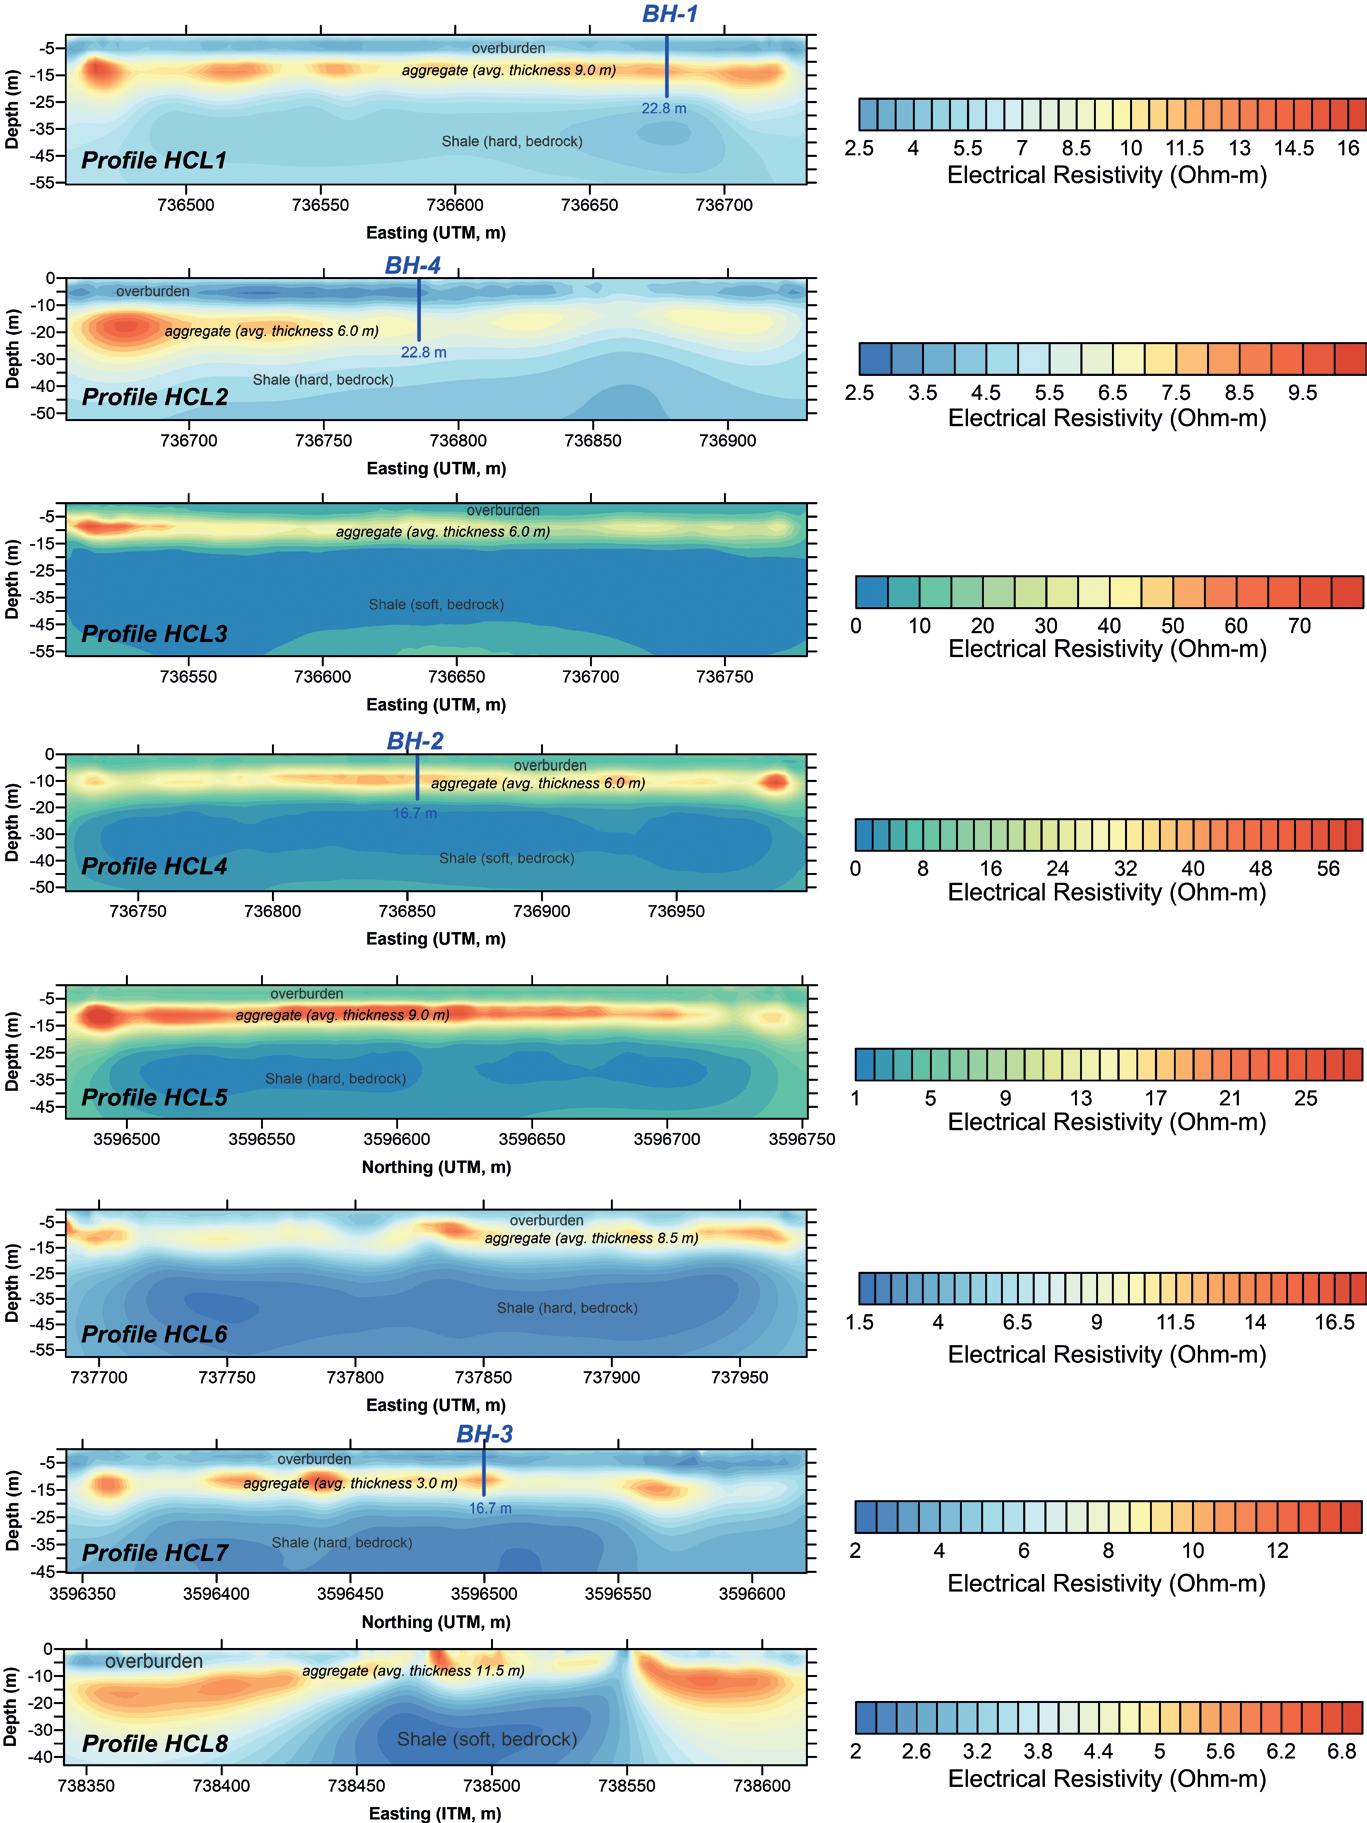
Figure 4 The CME-75 drill rig used in the exploration drilling campaign. The RTK GPS used to georeference the location of the exploration holes. The base station is on the left, and the rover station is on the right, with the drill rig in the background.
Figure 5 Inverted electrical resistivity models overlaid by corresponding boreholes (BH-1 to BH-4). The boreholes intersect the high-resistivity anomaly interpreted as the aggregate body comprised of fine-grained sand and gravel. The thickness of the aggregate is variable across the study area. The bottom of each borehole is indicated.
consecutive electrodes for each measurement. All tests passed successfully for each profile. The measured range of elevation of the resistivity profile end-points is 73.817 to 76.637 m above sea level, using the WGS 84 and EPSG:4326 coordinate system. The GPS hardware consisted of an EMLID Reach RS2 Real-Time Kinematic (RTK) system comprised of two GNSS receiver antennas that function as a base station and a rover station mounted pole.
Data processing and inversion Basic data reduction was made before data processing. The 2D dipole-gradient array data from all eight profiles did not require topographic corrections for the 2D inversion. The finite element method was chosen for the forward modelling. The smooth inversion method was used to invert all the raw 2D data files. The stopping criteria for the 2D inversion for the resistivity profiles were based on the root-mean-square (RMS) per cent error. The resulting RMS per cent error and L2-Norm value determine the inversion quality, determining the ‘quality factor’. An okay, good, and excellent quality factor is achieved when the resulting RMS % error and L2-Norm are < 20 %, <10 and < 5 % and < 10, < 5 % and ~1, respectively. The EarthImager 2D (version 2.4.4) software was used for the inversion. The stopping criteria for the resistivity inversion for sites 1 to 5 were based on the root-mean-square (RMS) per cent error. The stopping criteria for the resistivity inversion for sites 6 to 8 were based on the L-2 Norm. The value of the resulting RMS per cent error determines the quality of the inversion and, hence, the ‘quality factor’. Table 1 summarizes all profiles’ measured resistivity values and the geophysical data inversion results, including quality factors based on the resulting RMS % error and the L2-Norm. Therefore, one can be confident that the interpretation of the 2D inverted resistivity models is based on high-quality results. It is expected to have variability in the quality factor of the inversion due to the unique site conditions and associated noise levels. Exploration drilling After interpreting the resistivity profiles, the exploration drilling campaign comprised four exploratory holes, referred to as Borehole-1 to Borehole-4 (e.g., BH-1, BH-2, BH-3, and BH-4). The drilling method was continuous flight hollow-stem auger coring because it provides a casing for core drilling through the auger’s centre, yielding a continuous material sample. A CME-75 drilling rig with an outer bit diameter of 7 ¼” was used in an upward positions for all sites. All drilling sites occurred in a remote location with difficult access under flat, open, and dried ground surface conditions. The measured range of elevation is 73.817 to 76.637 m above sea level, using the WGS 84 and EPSG:4326 coordinate system. Each borehole location was also georeferenced with a RTK GPS unit. Figure 4 shows a field photograph of a drilling site. Boreholes BH-2 and BH-3 were drilled to 16.80 m and BH-1 and BH-4 to 22.86 m, as suggested by the results of the 2D ERI survey. Each drill hole probed a high-resistivity anomaly that stopped when it hit bedrock. Geological logging was performed on 1.5 m-long continuous core samples obtained with the split-spoon sampling method. The entire continuous core from each borehole was logged in increments of 1.5 m. The groundwater depth was read during various stages of drilling, including during drilling, at completion, and before leaving the site. On average, the water table was found at ~7 m below the surface.
Results and interpretation Electrical resistivity values are a means to explore the existence of alluvial material (i.e., aggregates) in the subsurface; however, the values are not diagnostic for identification or mapping purposes (Lucius et al., 2007). Typical electrical resistivity values can vary from 1 to 1000 Ω-m, depending on whether the materials are dry or wet. Clay, silt, sand, and gravel can yield electrical resistivity values varying from 1 to 100s in wet and higher in dry conditions.
The data inversion results, shown in Figure 5, are highly satisfactory. The results from each resistivity profile are presented
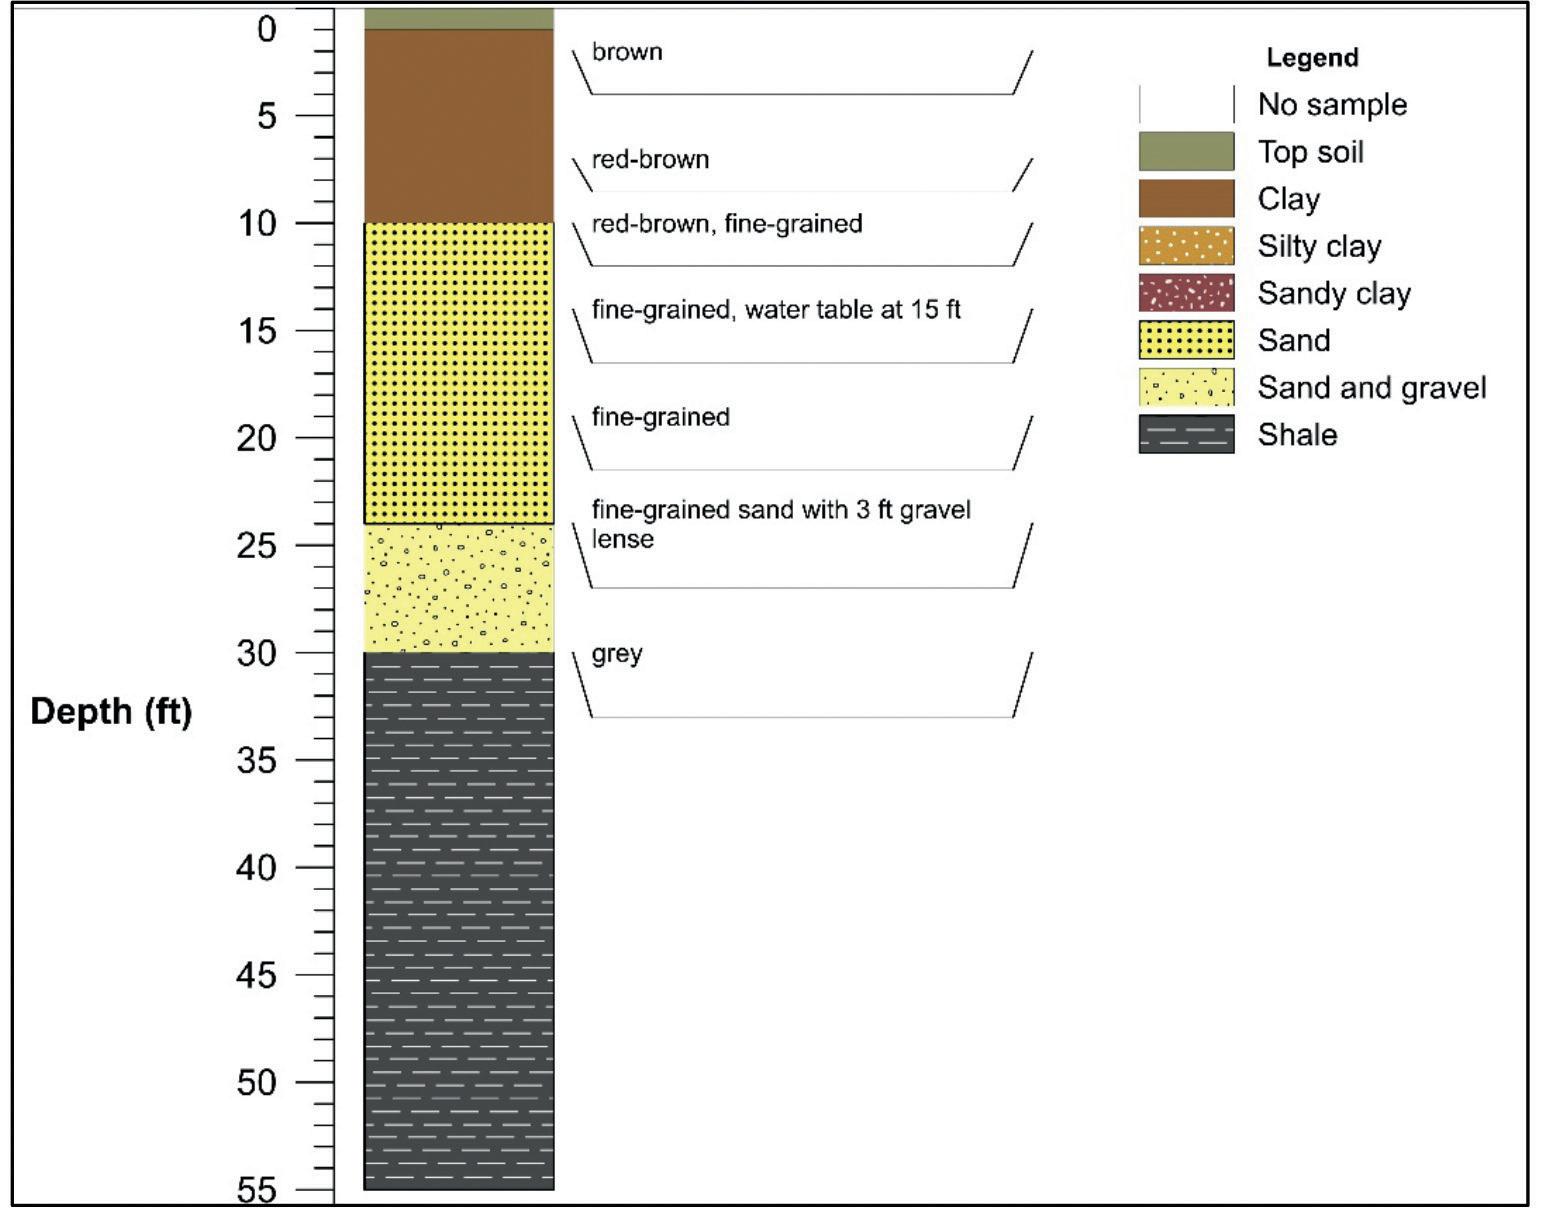
Figure 6 Geological log of exploratory borehole BH-2, drilled along the trace of electrical resistivity profile HCL4. The aggregate (sand and sand-gravel) layer corresponds to the high-resistivity anomaly in the electrical resistivity profile.
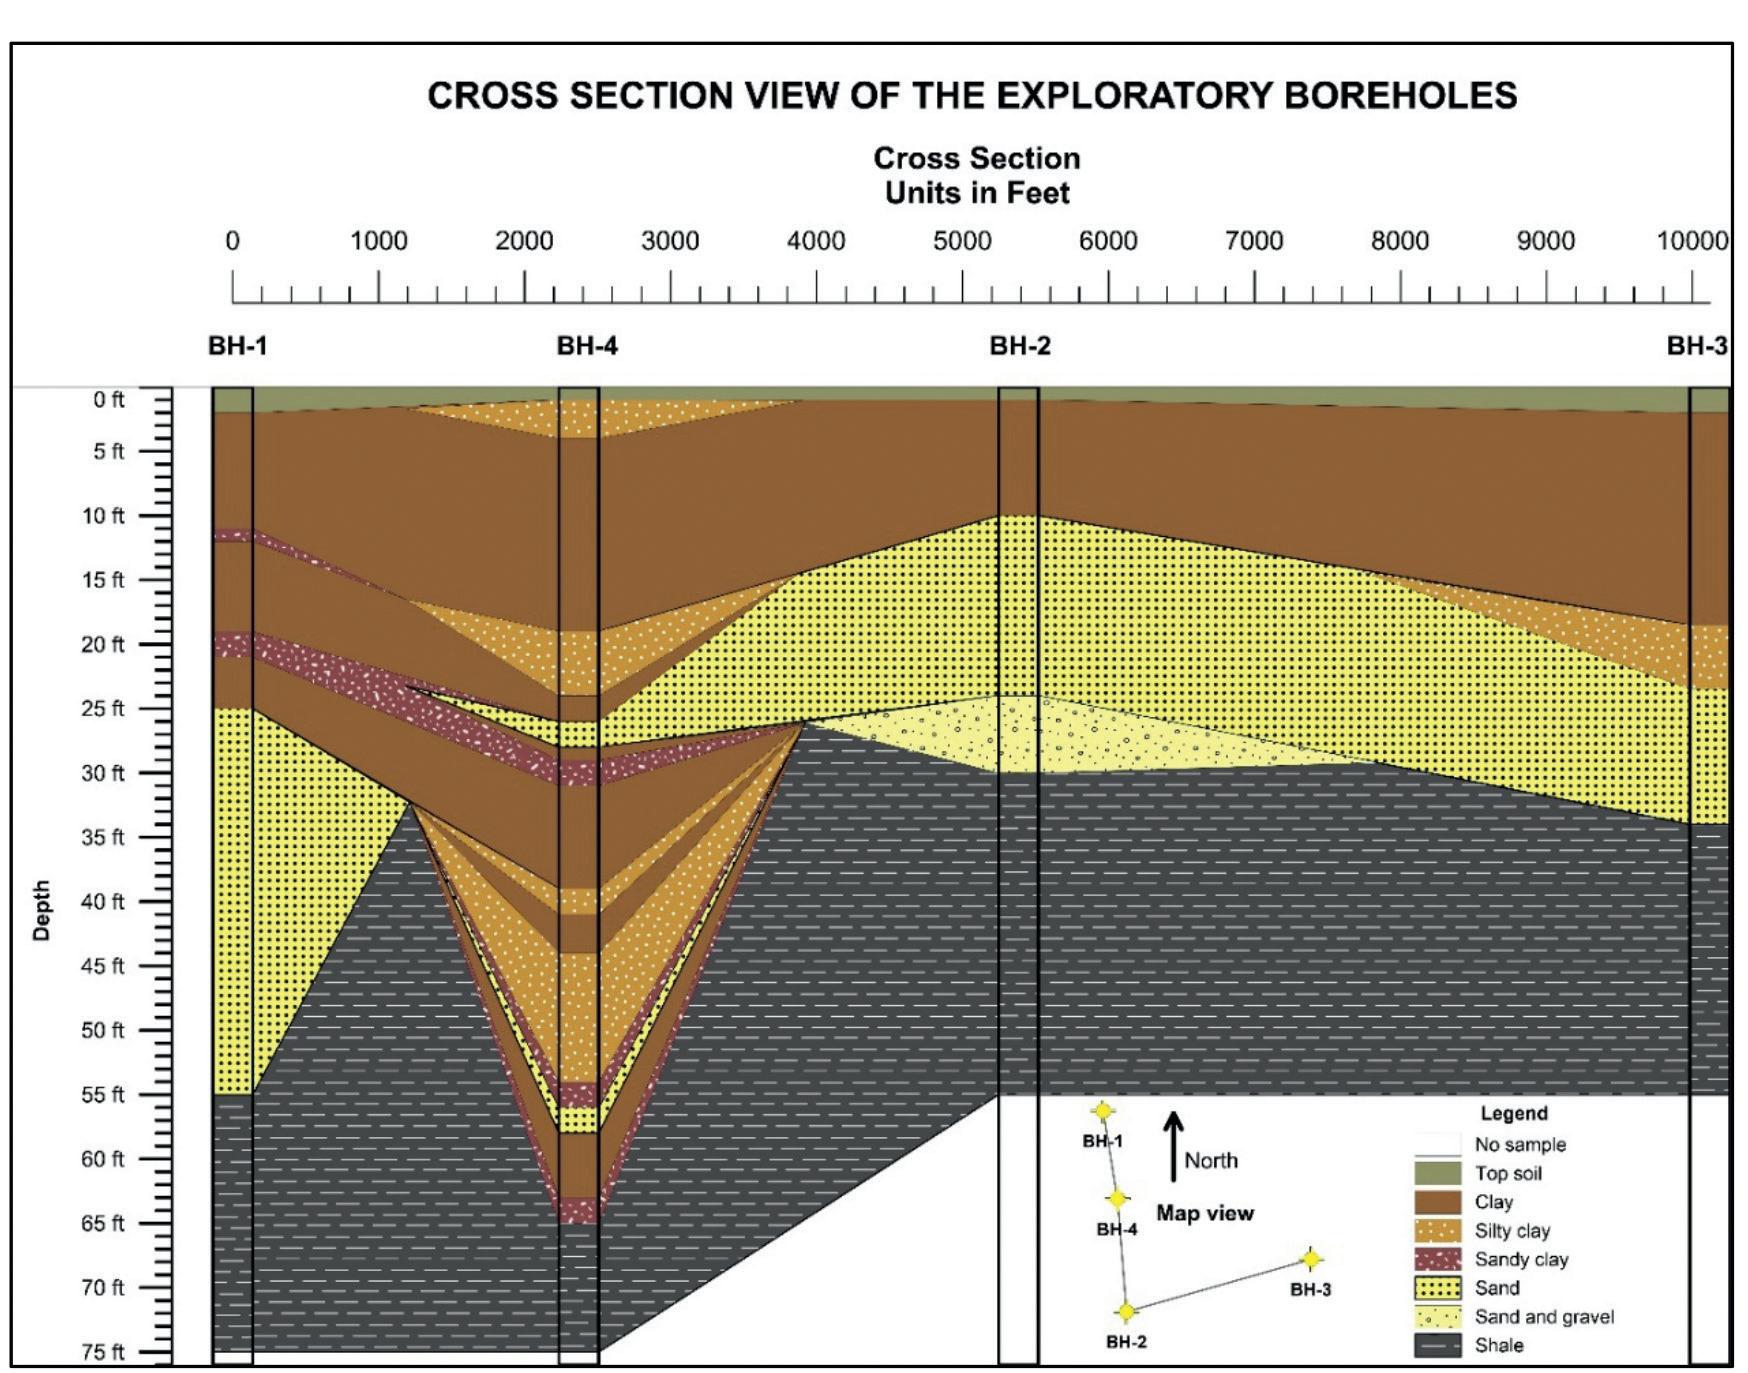
Figure 7 A conceptual geological cross-section developed from the lithology logs from the four exploratory boreholes. The lithology logs reveal a consistent fining-upwards clastic sequence of Holocene age deposited on shale.
and interpreted on a profile-by-profile basis along with its corresponding borehole. The separation between the eight resistivity profiles ranged from 300 to 700 m; however, the ERI survey results yielded a low electrical resistivity range (1.0 to 77 Ω-m.) In brief, all resistivity profiles show a consistent electrical resistivity structure compatible with wet Quaternary floodplain alluvium (e.g., silt, clay, sand, and gravel) deposited over shale bedrock. More importantly, a high-resistivity anomaly mapped in all profiles is consistent with an aggregate body (i.e., sand and gravel). The successful 2D ERI survey results guided the drilling campaign by defining suitable locations and depths. The exploratory boreholes’ lithology logs are pivotal in understanding the stratigraphy in the project area. The drilling results confirmed the aggregate presence. Figure 6 shows an example of a geological log, and all four geological logs were used to develop a geological cross-section, as shown in Figure 7. The geological cross-section reveals a three-layer stratigraphy: clay, aggregate (sand and gravel lenses) deposited on shale bedrock.
Profile HCL1 and Borehole 1 (BH-1) Figure 5 illustrates the interpreted inverted resistivity model. The electrical resistivity profile is 275 m long and yields a depth of investigation of ~56 m. The electrical resistivity values vary from 2.6 to 17.3 Ω-m and are attributed to wet subsurface conditions caused by the nearby Trinity River’s hydrologic setting. Lower resistivity values (<5 Ω-m) sandwich intermediate to high resistivity values (5-17.3 Ω-m), which are interpreted as wet alluvium comprised of an upper clay/silty clay layer deposited over intermixed sand and gravel. The deeper underlying area of low-resistivity values is taken as wet shale bedrock. The clay/silty clay layer thickness is estimated at 6 m. The sand-and-gravel layer is about 21.3 m thick, with top and bottom estimated at 6 and ~27 m, respectively. The stratigraphic contact between the alluvium and the underlying shale bedrock is mildly uneven. BH-1’s total drilled depth is 22.86 m, and the continuous core sample was geologically logged, as shown in Figure 7. Drilling intersected the water table at 7 m and a 9.14m-thick wet, light-brown sand layer between 7.62 and 16.76 m. Geological logging identifies it as fine-grained sand. The overburden, mainly clay with two thin (0.70 m) sandy clay lenses, is 7.6 m thick. The shale bedrock is intersected at 16.76 m. The mapped high-resistivity anomaly (8-17.3 Ω-m) coincides with the 9.14 m thick sand body identified by borehole BH-1, which is traceable across the entire resistivity profile.
Profile HCL2 and Borehole 4 (BH-4) Figure 5 illustrates the interpreted inverted resistivity model. The electrical resistivity profile is 275 m long, reaching a depth of investigation of ~53 m. The low range of electrical resistivity values (3.0 to 9.8 Ω-m) is linked to wet subsurface conditions caused by the nearby Trinity River’s hydrologic setting. Lower resistivity (<4.5 Ω-m) values sandwich intermediate to higher resistivity values (~4.5-9.8 Ω-m). Likewise, the intermediate to high resistivity values are interpreted as wet alluvium comprised of an upper clay/silty clay layer deposited over intermixed sand and gravel (i.e., the natural aggregates). The underlying area of low-resistivity values is taken as wet shale bedrock. The clay/ silty clay layer thickness is ~10.5 m. The stratigraphic thickness of the sand-and-gravel layer is estimated at 18.30 m, with the top and bottom estimated at 10.7 and ~29.0 m, respectively. The stratigraphic contact between the alluvium and the shale bedrock is mildly irregular. BH-4’s total drilled depth is 22.86 m. The geological log shows the water table at 7 m and two very thin (< 1 m) fine to coarse-grained sand lenses between 7.3-8.5 m and 17-17.7 m hosted in a ~ 20m-thick clastic sequence of clays, silty clays, and sandy clays. The shale bedrock is intersected at 19.81 m. The mapped high-resistivity anomaly yields an electrical resistivity range of 6 to 10 Ω-m. Long lenses of aggregate bodies (with sand-and-gravel to sand), 9 to 12 m thick, are interpreted on both sides of BH-4, which correlate with high-resistivity anomalies mappable across the resistivity profile.
Profile HCL3 Figure 5 illustrates the interpreted inverted resistivity model. The electrical resistivity profile is 275 m, reached a depth of ~57 m, and a low range of resistivity values from 1.0 to 77.0 Ω-m. Likewise, the resistivity range is attributed to wet alluvium. The interpreted shale bedrock yields resistivity values from 1.0 to 10.0 Ω-m because it is wet due to the high water table. Similarly, the wet alluvium comprises an upper clay/silty clay layer, with resistivity values from 5.0-20.0 Ω-m, deposited over intermixed sand and gravel (i.e., the natural aggregates) that yield 20.0-77.0 Ω-m. While the clay/silty clay layer thickness is estimated at ~10.70 m, the stratigraphic thickness of the sand-and-gravel layer is estimated at 14 m, with the top and bottom estimated at 3.65 and 17.70 m, respectively. The stratigraphic contact between the alluvium and the underlying shale bedrock is relatively flat.
Profile HCL4 and Borehole 2 (BH-2) The interpreted inverted electrical resistivity model is shown in Figure 5. It is 275 m-long, reaches ~52.0 m, and yields a low range of electrical resistivity values (1.0 to 63.0 Ω-m) consistent with wet alluvium over shale bedrock due to a high water table. The interpreted wet alluvium’s resistivity ranges vary from ~5.0 to 63.0 Ω-m, and the bedrock yields 1.0 to ~3.5 Ω-m. Similarly, the wet alluvium comprises an upper clay/silty clay layer, with resistivity values from 5.0-7.0 Ω-m, deposited over intermixed sand and gravel (i.e., the natural aggregates) that yield 9.063.0 Ω-m. While the clay/silty clay layer thickness is estimated at ~4.5 m, the stratigraphic thickness of the sand-and-gravel layer is estimated at ~14,0 m, with the top and bottom estimated at 4.6 and 18.3 m, respectively. The interface between the alluvium and bedrock is flat. BH-2’s total drilled depth is 16.76 m. The geological log shows the water table at 4.6 m and a 6.10 m-thick aggregate layer, whose first 4.3 m correspond to light-brown coarse-grained sand between 3.05 and 7.30 m. The following 1.8 m corresponds to a sand and gravel layer from 7.30 to 9.14 m, from which only ~1.0 m is gravel. The overburden is a ~3m-thick red-brown clay, and the shale bedrock is at 9.14 m. The resolved high-resistivity anomaly (22 to 63 Ω-m) matches the ~6 m-thick aggregate body (sand and sand-gravel lense) probed by borehole BH-2. The aggregate is traceable across the entire resistivity profile.
Profile HCL5 Figure 5 shows the interpreted inverted resistivity model. It is 275 m long, reaches ~49.5 m, and the resistivity values vary from 1.6 to 32.2 Ω-m suggesting wet alluvium over shale bedrock flooded by a high water table. The interpreted wet alluvium yields resistivity values from ~3.0 to 32.2 Ω-m. The shale bedrock yields resistivity values from 1.6 to ~4.0 Ω-m. The alluvium comprises an upper clay/silty clay layer, with resistivity values from approximately 4.0-20.0 Ω-m, deposited over intermixed sand and gravel (i.e., the natural aggregates) that yield >20.0-32.2 Ω-m. While the clay/silty clay layer thickness is estimated at ~7 m, the stratigraphic thickness of the sand-and-gravel layer is estimated at 12.2 m, with the top and bottom estimated at 7 and 19.20 m, respectively. The alluvium-bedrock interface is flat. Profile HCL6 Figure 5 shows the interpreted inverted resistivity model, which is 275 m long and reached a depth of ~58 m. The electrical resistivity values vary from 1.9 to 15 Ω-m and are linked to wet subsurface conditions. The interpreted wet alluvium yields resistivity values varying from ~4.0 to 15 Ω-m, and the shale bedrock yields 1.9 to ~3.5 Ω-m due to the high water table. The wet alluvium comprises an upper clay/silty clay layer, with resistivity values from approximately 4-7 Ω-m, deposited over intermixed sand and gravel (i.e., the natural aggregates) that yield >4-15 Ω-m. While the clay/silty clay layer thickness is estimated at ~3 m, the stratigraphic thickness of the sand-and-gravel layer is estimated at ~16.5 m, with top and bottom estimated at ~3 and 19.5 m, respectively. The stratigraphic contact between the alluvium and the shale bedrock is mildly undulating.
Profile HCL7 and Borehole 3 (BH-3) Figure 5 shows the interpreted inverted electrical resistivity model. The resistivity profile is 275 m long, reaches ~45 m, and yields a low and narrow electrical resistivity band (2.5 to 12.9 Ω-m). Similarly, the resistivity range is compatible with wet alluvium over shale bedrock under a high water table. Due to the high water table, the interpreted alluvium yields ~5 to ~13 Ω-m, and the shale bedrock yields 2.5 to ~4.5 Ω-m. The wet alluvium comprises an upper clay/silty clay layer, with resistivity values from approximately 3-5 Ω-m, deposited over intermixed sand and gravel (i.e., the natural aggregates) that yield >5 to ~13 Ω-m. While the clay/silty clay layer thickness is estimated at ~5.5 m, the stratigraphic thickness of the sand-and-gravel layer is estimated at ~16 m, with the top and bottom estimated at 5.5 and 21.3 m, respectively. The geologic contact between the alluvium and bedrock is uneven. BH-3’s total drilled depth is 16.76 m. Geological logging reveals the water table at 5.8 m and a 3m-thick, moist, light-brown, fine-grained, coarse-grained sand layer between 7.31 and 10.36 m. The 7.3 m thick overburden comprises mainly clays to silty clays. The shale bedrock is intersected at 10.36 m. The mapped high-resistivity anomaly of 8 to 13 Ω-m matches the 3m-thick sand and is mappable across the entire profile. The interface between the sand body and the underlying shale bedrock is diffuse, likely to do the soft nature of the shale revealed in core samples.
Profile HCL8 Figure 5 displays the interpreted inverted resistivity model. The electrical resistivity profile is 275 m long and imaged down to 43 m. The low range of electrical resistivity values varies from 2.1 to 6.8 Ω-m. Similarly, the resistivity band is related to wet alluvium, which yields ~3 to ~6.8 Ω-m. The shale bedrock yields 2.1 to ~3 Ω-m because it is under the water table. Likewise, the wet alluvium comprises an upper clay/silty clay layer, with resistivity values from approximately 2.5-6.8 Ω-m, deposited over intermixed sand and gravel (i.e., the natural aggregates) that yield >3 to 6.8 Ω-m. The clay/silty clay layer thickness is estimated at ~9 m. The sand-and-gravel layer is estimated at ~21 m, with the top and bottom projected at 9 and ~30 m, respectively. The stratigraphic contact between the alluvium unit and the underlying shale bedrock is uneven.
Conclusions Aggregate (sand and gravel) exploration was conducted in a 4.05 km2 property, which is adjacent to a major river and tributaries that have deposited clastic material over a large region. Available upfront geological information indicates Quaternary alluvium, interpreted as floodplain deposits containing clay, silt, silty clay, sand, and gravel, are deposited on shale bedrock along a disconformity. The exploration campaign first deployed eight electrical resistivity profiles and four continuous flight hollow-stem auger cores. The inverted resistivity models resolved high-resistivity anomalies consistent with the occurrence of a mappable aggregate body sandwiched by low-resistivity materials (overburden and bedrock). Second, the four auger cores probed the high-resistivity anomalies confirming aggregate presence. The drill holes’ geological logs reveal a three-layer stratigraphy: topsoil, clay-rich deposits comprised of intercalated clays, silty clays, and sandy clays underlain by fine-grained sand with gravel lenses, all deposited on clayey-to-shale bedrock. The aggregate body is between 3 to ~20 m deep and is covered by a 3 to 7.6 m-thick clay overburden. The aggregate’s thickness varies from 12 to 21 m. The fine-grained sand bodies are thicker and more abundant than the thinner gravel lenses. The results show a shallow water table (4.5 to 9 m), which explains the observed range of low electrical resistivity values (1 to 77 Ω-m).
Acknowledgements The work was funded by a private investor, so the details of the geographic coordinates remain confidential. The author thanks the client for allowing the publication of this paper.
The author also thanks Bruce Marcel Atencia-Arias and Hector Jesus Hinojosa-Garcia for their field support during geophysical data acquisition.
References
Ali, S.H., Giurco, D., Arndt, N., Nickless, E., Brown, G., Demetriades,
A., Durrheim, R., Enriquez, M.A., Kinnaird, J., Littleboy, A. and
Meinert, L.D. [2017]. Mineral supply for sustainable development requires resource governance. Nature, 543(7645), 367-372. Binley, A., and Kemna, A. [2005]. DC Resistivity and Induced Polarization Methods. In Hydrogeophysics (eds. Rubin, Y. and Hubbard, S.).
DOI: 10.1007/1-4020-3102-5_5. Collins, E.W., Woodruff Jr, C.M. and Tremblay, T.A. [2002]. Geologic
Framework of the Northern Edwards Aquifer, Central Texas. Gulf
Coast Association of Geological Societies Transactions. Volume 52, 135-137. Collins, E.W. and Raney, J.A. [2002]. Summary Report for the 20012002 STATEMAP Project: Geologic Mapping to Support Improved
Database Development and Understanding of Urban Corridors and
Critical Aquifers of Texas. Bureau of Economic Geology, The University of Texas at Austin, pp. 1–39. Retrieved from https://www.beg. utexas.edu/files/publications/contract-reports/CR2002-Collins-2.pdf. Ferrill, D.A., Sims, D.W., Waiting, D.J., Morris, A.P., Franklin, N.M. and Schultz, A.L. [2004]. Structural framework of the Edwards
Aquifer recharge zone in south-central Texas. Geological Society of America Bulletin. Volume 116, no. ¾, p. 407–418; https://doi: 10.1130/B25174.1. Ferrill, D.A., Morris, A.P. and McGinnis, R.N. [2019]. Geologic structure of the Edwards (Balcones Fault Zone) Aquifer, in Sharp, J.M.,
Jr., Green, R.T., and Schindel, G.M., eds., The Edwards Aquifer:
The Past, Present, and Future of a Vital Water Resource: Geological Society of America Memoir 215, p. 171–188, https://doi. org/10.1130/2019.1215(14). Griffiths, D.H. and Barker, R.D. [1994]. Electrical Imaging in Archaeology. Journal of Archaeological Science, 21, 153-158. Gunn, D.A., Chambers, J.E., Uhlemann, S., Wilkinson, P.B., Meldrum, P.
I., Dijkstra, T.A., Haslam, E., Kirkham, M., Wragg, J., Holyoake, S.,
Hughes, P.N., Hen-Jones, R. and Glendinning, S. [2015]. Moisture monitoring in clay embankments using electrical resistivity tomography. Construction and Building Materials, 92, 82-94. Loke, M.H., Chambers, J.E., Rucker, D.F. and Wilkinson, P.B. [2013].
Recent developments in the direct-current geoelectrical imaging method. Journal of Applied Geophysics. 95, 135-156. Lucius, J.E., Langer, W.H., and Ellefsen, K.L. [2007]. An Introduction to using surface geophysics to characterize sand and gravel deposits:
US Geological Survey Circular 1310, 33 p. [available online at http:// pubs.usgs.gov.circ/c1310/]. Luza, K.V., Jensen, K.M., Fishman, W.D., Wermund, E.G., Jr., Richmond, G.M., State compilations, Richmond, G.M., Christiansen,
A.C., eds. [1994]. Quaternary geologic map of the Dallas 4° x 6° quadrangle, United States: US Geological Survey Miscellaneous
Investigations Series Map I-1420 (NI–14), scale 1:1,000,000 [Bush,
C.A., Digital edition, 2013], https://pubs.usgs.gov/imap/i-1420/ ni-14/. McGowen, J.H., Proctor, C.V., Haenggi, W.T., Reaser, D.F. and Barnes,
V.E. [1987]. Geologic atlas of Texas, Dallas sheet (Gayle Scott
Memorial Edition). Geologic Atlas of Texas. Bureau of Economic
Geology, The University of Texas at Austin, Austin, 1(250,000). Miatto, A., Schandl, H., Fishman, T. and Tanikawa, H. [2017]. Global patterns and trends for non-metallic minerals used for construction.
Journal of Industrial Ecology, 21(4), 924-937. Milsom, J. and Eriksen, A. [2011]. Field Geophysics, 4th edn. John Wiley & Sons Ltd. England. Noel, M. and Xu, B. [1991]. Archeological investigation by electrical resistivity tomography: a preliminary study. Geophysical Journal
International, 107(1), 95-102. Schandl, H., Fischer-Kowalski, M., West, J., Giljum, S., Dittrich, M.,
Eisenmenger, N., Geschke, A., Lieber, M., Wieland, H., Schaffartzik,
A. and Krausmann, F. [2018]. Global material flows and resource productivity: forty years of evidence. Journal of Industrial Ecology, 22(4), 827-838. Reynolds, J.M. [2011]. An Introduction to Applied and Environmental
Geophysics, 2nd edn. John Wiley & Sons, England. Water Data Interactive. Web. 2022-06-13. Available by Texas Water
Development Board (TXDB): https://www3.twdb.texas.gov/ apps/waterdatainteractive/groundwaterdataviewer (Accessed: 06/13/2022).


