29 minute read
Application of 3D optical fibre reflection seismic in challenging surface conditions


Sasha Ziramov1*, Andrej Bona1, Konstantin Tertyshnikov1, Roman Pevzner1 and Milovan Urosevic1 show how the mineral sector could deliver an order of magnitude saving, while substantially increasing the data density and hence allow optimum performance of modern seismic imaging algorithms.
Abstract Distributed Acoustic Sensing (DAS), which uses strain-induced optical distortion effects to use optical fibres as multi-channel seismic arrays, enable efficient and inexpensive high-resolution seismic surveying in the challenging surface conditions, such as salt lakes. In this study, we present a first published 3D seismic survey completed with a fibre optic network.
Advertisement
Since DAS cables freely deployed on surface can be sensitive to ambient noise such as strong wind, which is common in many field conditions, we developed an efficient methodology for cable burring by fast ploughing it in both soft and hard ground conditions. Even a standard telecommunication fibre optic cable deployed beneath the surface by this ploughing method delivers reflection seismic recording performance comparable to conventional geophone systems, offering substantial cost savings in practice.
Combined with light and mobile seismic sources such as Betsy gun, DAS technology deployed in 3D surface reflection configuration across a hyper-saline salt-lake environment delivered a performance akin to modern nodal seismic systems. We show that the introduction of DAS technology into seismic surveying practice in the mineral sector could deliver an order of magnitude saving, while substantially increasing the data density and hence allowing optimum performance of modern seismic imaging algorithms.
Introduction The rate of new mineral discoveries in Australia has been declining for several decades. Hence resolving and mapping complex underground structures is of significant value in exploring for structurally hosted gold mineralisation that could reverse such a negative trend. While airborne geophysics can provide initial indications of potential mineralised zones, seismic reflection provides the only method by which complex structures can be mapped in detail (Urosevic et al., 2007; 2016). Seismic imaging is essentially unchallenged over a very large depth range in its capacity to provide clear images of subsurface structures (Pretorius et al., 2003; Urosevic et al., 2007; Melehmir et al., 2012). Reflection seismic is particularly effective in resolving complex structures (Stolz et al., 2004; Milkereit et al., 2000; Pretorius et al., 2011, Urosevic et al., 2017), and is often used in exploration for structurally controlled and structurally hosted gold mineralisation.
However, a range of factors including inconsistent application of seismic reflection methodologies, a lack of integration of seismic data with other geophysical, geological and mining information, a lack of experienced seismic analysts working in the mining sector and, of course, high cost and difficulty in implementation of seismic reflection methods, have long prevented seismic surveying from becoming a mainstream exploration method. Urosevic and Evans (2007) have addressed many of these issues and demonstrated that reflection seismic analysis delivers substantial value in understanding complex geological structures that can host gold. Since that time many 3D seismic surveys have been acquired over gold prospects across the world to resolve such structurally hosted mineralisation (Urosevic et al, 2017), including several 3D seismic surveys of exceptional quality acquired across the hyper-saline lake Lefroy in Western Australia. Despite their significant exploration value (Urosevic et al., 2012), common equipment loss and corrosion in the harsh salt lake operating environment has meant such surveys entail high risk of writing off the sensitive electronic hardware required, which may amount to multi-million dollar losses for service providers. This has resulted in many highly prospective areas under salt lakes in WA remaining underexplored, creating a potential value case for more appropriate exploration concepts and technologies suited to work in these challenging environments (Urosevic et al., 2019b). The most likely solution to this challenge is DAS as the sensitivity to a highly invasive hyper-saline environment is only on the data receiving end – interrogator. Securing the interrogator from the harmful environment is trivial, while on the sensor side, DAS technology is corrosion-proof, easy to deploy, and several orders of magnitude cheaper than equivalent conventional seismic acquisition systems. Considering that salt lakes of Australia are often hosting mineral deposits, DAS technology is of a particular importance for advancing mineral exploration in such environments.
1 Curtin University * Corresponding author, E-mail: S.Ziramov@curtin.edu.au DOI: 10.3997/1365-2397.fb2022071
Distributed acoustic sensing DAS systems utilise interferometry of backscattered laser light through a Distributed Optical Fibre Sensors approach to identify fibre strain changes caused by impinging seismic or acoustic wave by comparing sequential back-scattered laser pulses (e.g., Hartog, 2018). Because of the high rate of information transfer involved, fibre strain is measured through optical interferometry (Hartog, 2018; Issa et al., 2020).
Since DAS relies on interferometry of a backscattered laser pulse; the longer the pulse, the higher the signal-to-noise ratio (SNR) of the measured signal. However, a pulse of laser light will also average out any fibre deformations whose wavelength is shorter than the pulse length. This undesired effect can be avoided by reducing the pulse length at the expense of the SNR, hence introducing a trade-off between pulse length and SNR that needs to be optimised for a particular survey, depending on the seismic resolution required for the specific underground targets.
For interrogator systems that natively (optically) measure the spatial changes of the backscattered pulses, the distance between compared points is called Gauge Length (GL). Because these systems are measuring elongation of the fibre between locations separated by this gauge length, gauge length influences the recorded signal analogous to discrete differentiation, and the native measurement corresponds to the discrete strain (or strain rate). Hence Gauge Length has a smoothing effect on strain measurement like that of pulse length – it multiplies the spatial spectrum of the strain by a sinc function and introduces ‘notches’ in the spectrum (e.g., Correa et al. 2017).
The nature of DAS measurements influences the directional sensitivity of the measurement when a seismic P-wave impinges on the fibre at an angle. For systems that natively measure strain or strain change rate (e.g. Fotech or Silixa systems), signal strength decreases as the cosine squared of the incidence angle, whereas for deformation-based systems (e.g. Terra15 systems) the signal behaves like a geophone oriented along the fibre, with signal strength decreasing as the cosine of the incidence angle (Sidenko et al., 2020). In either case, the signal (backscattered light) is measured simultaneously along the entire length of the fibre-optic (FO) cable. The sensing locations along the cable are closely spaced at 0.5 to 1m intervals depending on the interrogator type and settings used, providing extraordinary data density in comparison to standard geophone seismic technology. This high data density offers many advantages: • A possibility to form digital arrays prior to processing. • Apply multi-channel filters more effectively and achieve improved imaging due to better (correct) spatial sampling. • Compensate DAS intrinsically low signal-to-noise ratio trough utilisation of high data density processing particularly in stacking and imaging.
Signal to noise ratio of an optical cable sensing seismic waves is controlled by many factors, including fibre thickness, purity, properties of the protective layers, geometry (straight, helical, hybrid), and length. Length of the cable influences the SNR by at least two factors. First, the longer the cable the smaller Pulse Repetition Frequency (PRF). PRF describes how many laser pulses are sent along the fibre per second. Since each pulse represents one measurement, PRF is an indicator of a ‘stacking’ power of the measurement. Second, the longer the cable the higher is the attenuation of the backscattered signal. Significant ongoing research efforts are devoted to development and testing of these cables to maximise the signal-to-noise ratio, improve consistency, improve directivity (omni-directivity) increase cable strength and flexibility, etc. Researchers at Curtin University have conducted various studies involving permanent DAS installation in a 900m-deep well at Curtin ground (Van Zaanen et al., 2017). Following early work of Daley et al (2013) at a CO2 sequestration site in Otway, Victoria, Australia, Curtin researchers have conducted various studies at that site testing different cable types, configuration, sensitivity, directivity, attenuation properties in both borehole and surface modes (Yavuz et al, 2016; Correa et al., 2017a and 2017b) as a function of different source types (Freifeld et al., 2016, Urosevic et al., 2019a). Sensor geometry represents the key distinction
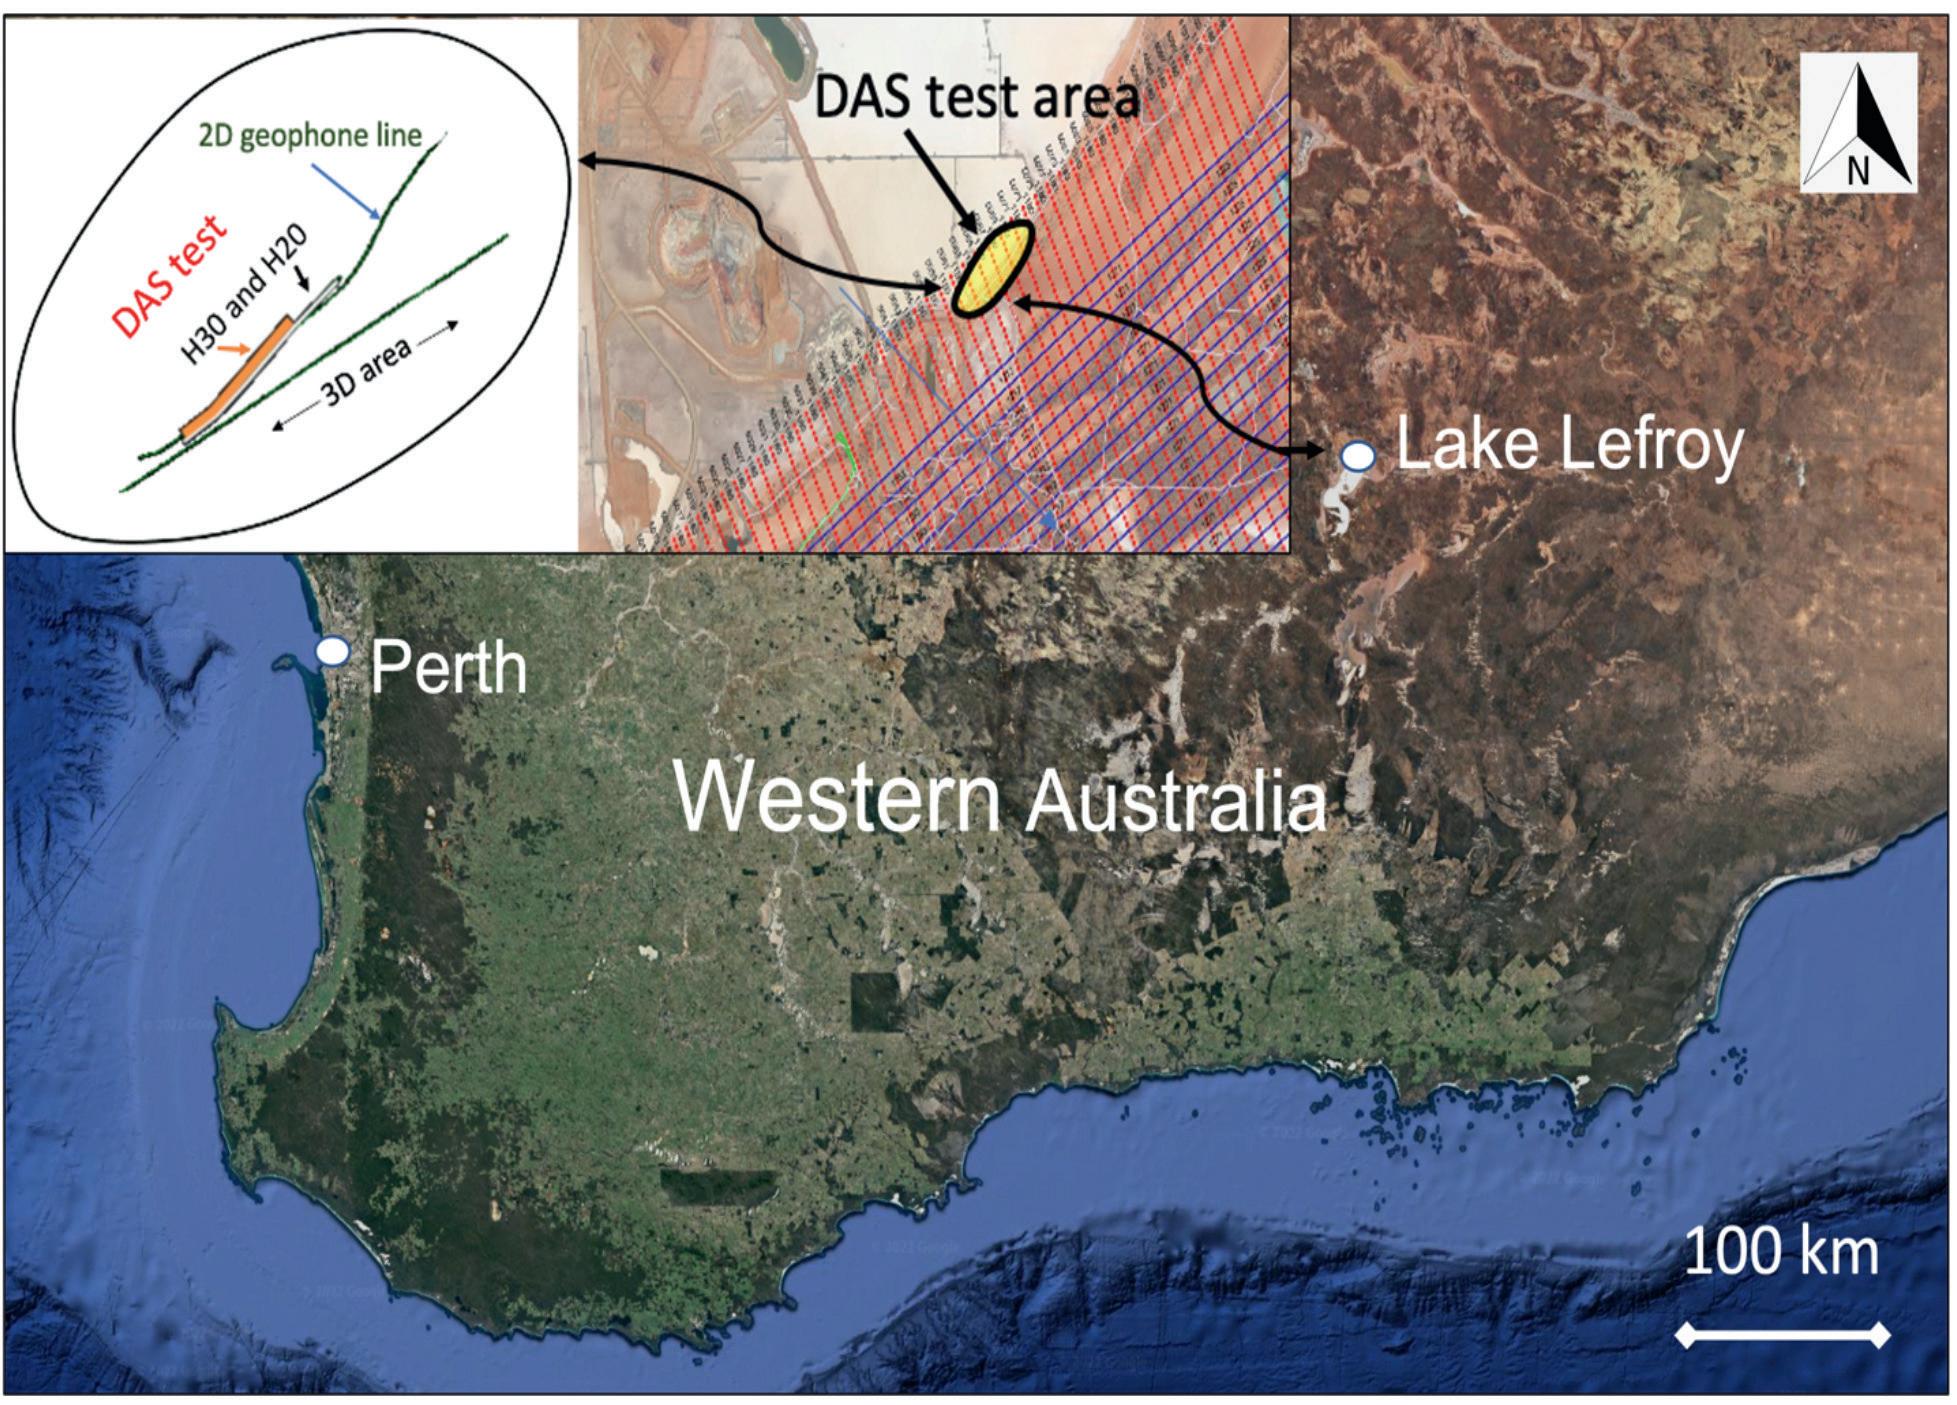
Figure 1 Satellite image of the southern half of Western Australia capturing the position of Lake Lefroy and the experimental setup: Conventional 3D seismic grid (middle insert) and DAS test area (left insert). Some 450 m length of helical 300 and 600 m of helical 200 were laid alongside 2D geophone line and close to the edge of a conventional 3D survey. Hypersaline virgin lake area has beige tonnes due to salt crust. Google earth (April 10, 2022). Western Australia, 33° 23’ 21”S, 118° 59’ 12”W, Eye alt 814 km. http://www.earth.google.com.
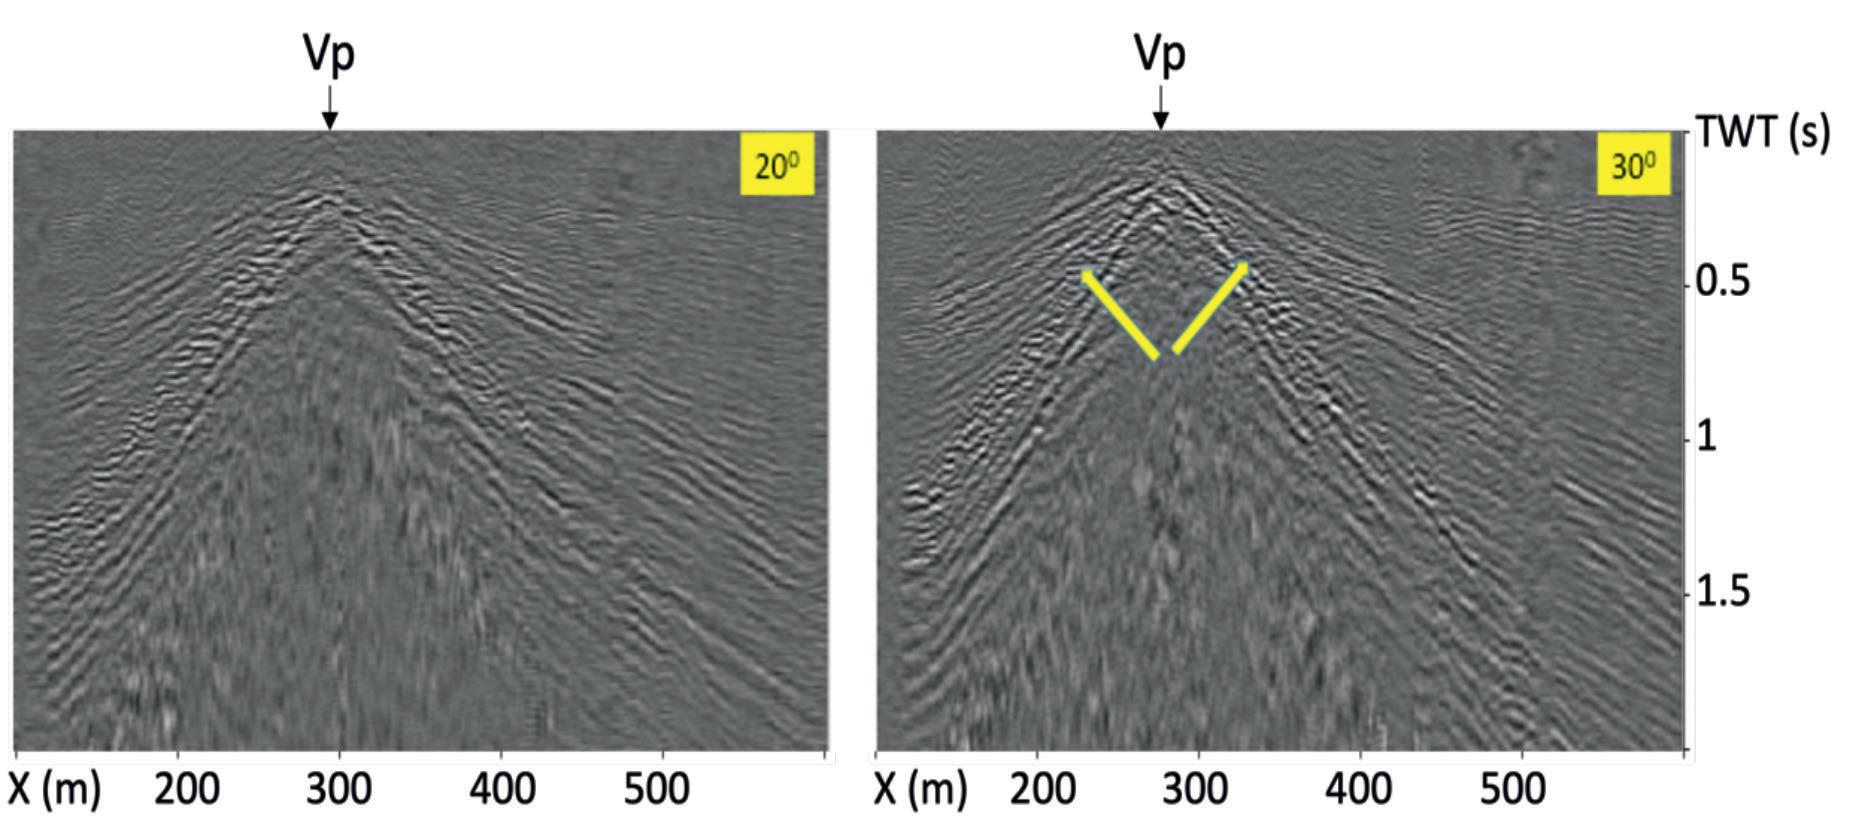
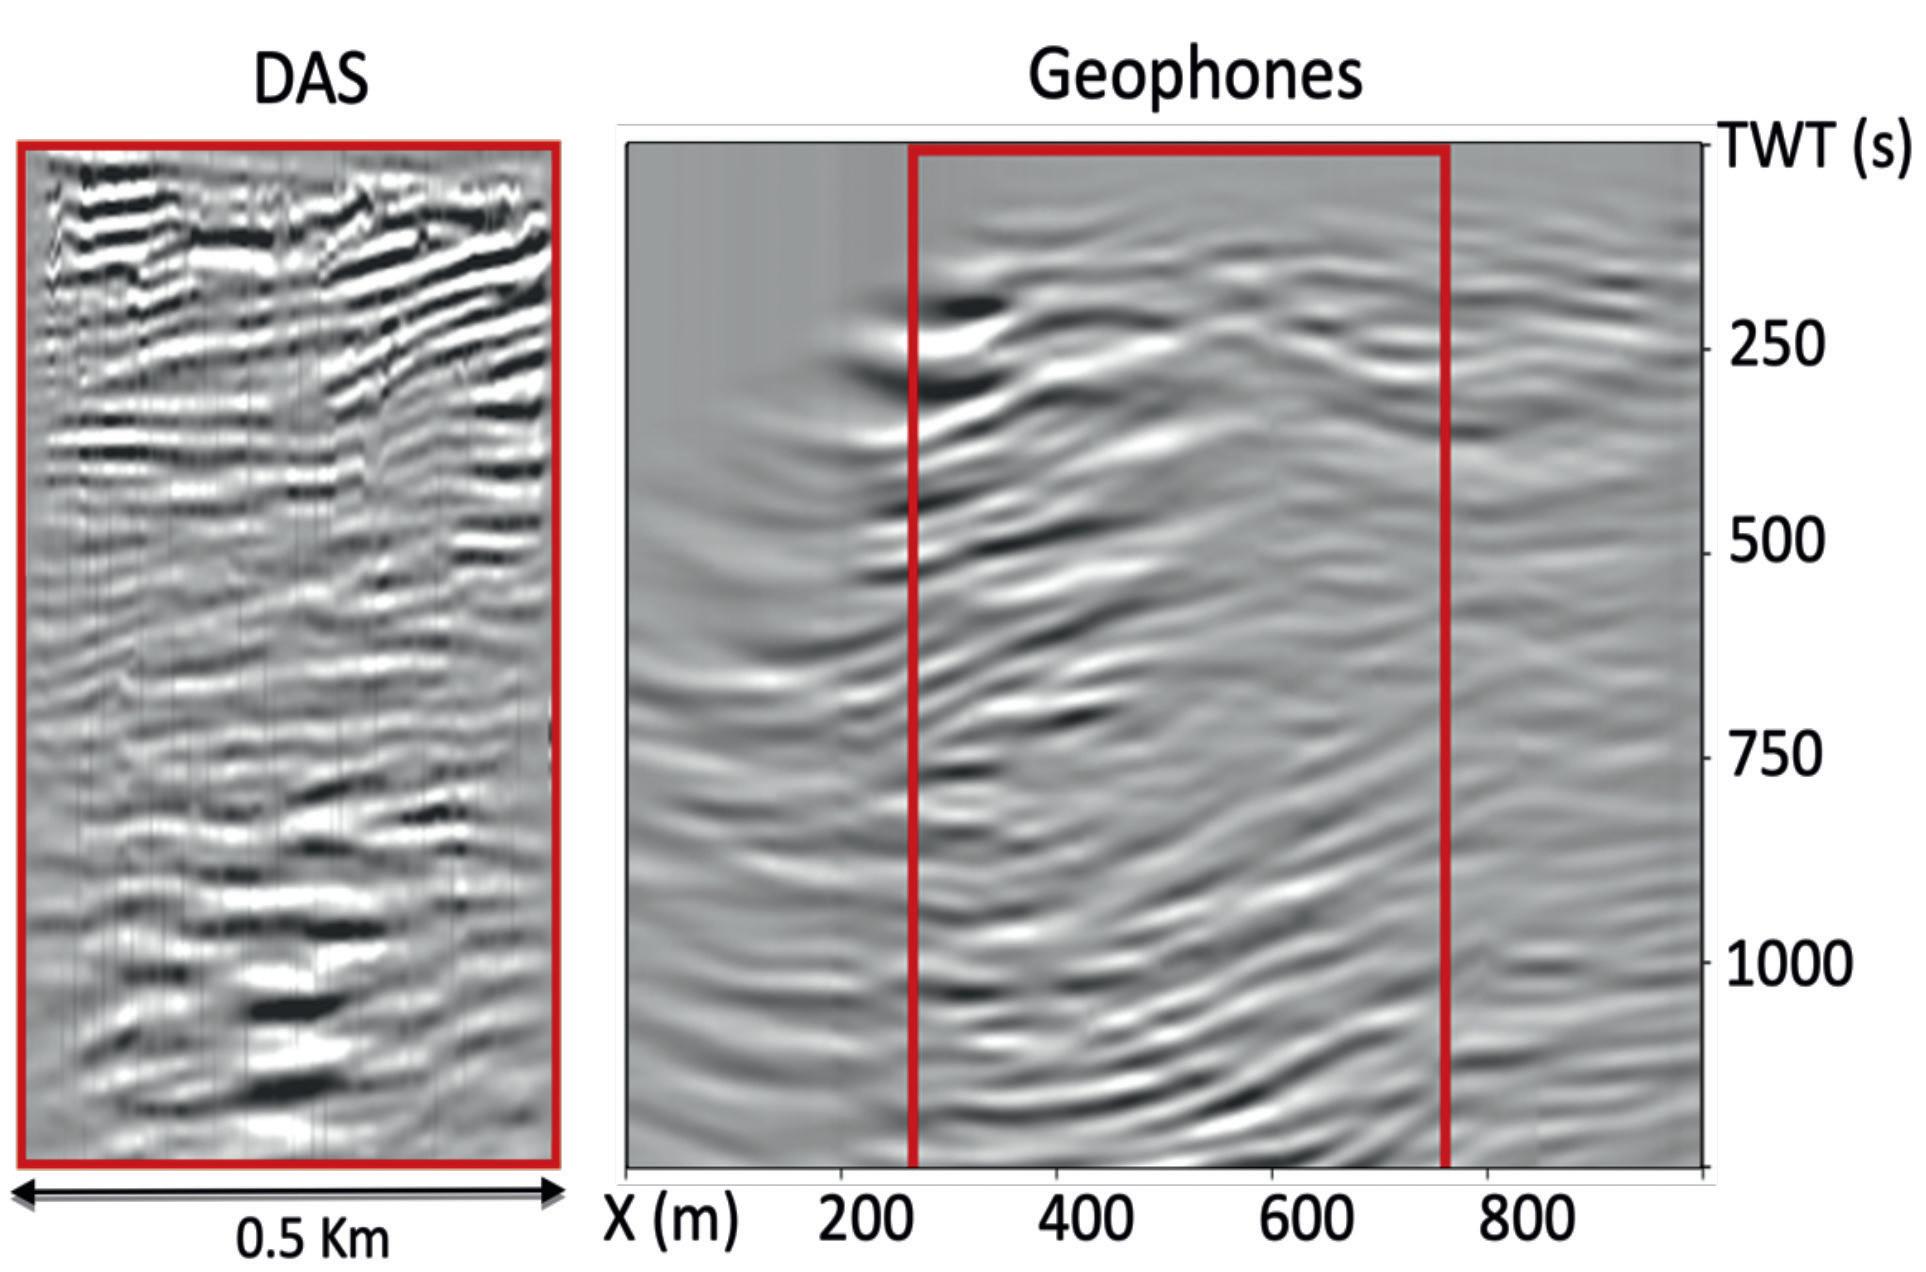
Figure 2 Raw shot records for vibroseis position (Vp) 18 (out of total 44 shots). Yellow arrows denote reflected waves, which are more prominent in the H30 cable data.
Figure 3 Comparison of short (450m) reflection profiles obtained in the initial vibroseis source Lake Lefroy survey using 300 DAS (left) and geophone receivers (right). Both stacks were depth-migrated after stacking. DAS image is of a superior quality at shallow depths.
between borehole and reflection seismic tests. VSP surveys utilise sensors positioned along a vertical axis, while reflection studies utilise sensors positioned along the ground surface. This geometric difference results in wave modes delivering different information in the two survey types. However, when comparing conventional sensors like geophones to DAS the difference exists between the two, even for the same geometry. The main reason lies in the directional sensitivity. Geophone has an omnidirectional response while fibre sensitivity is highest in the direction of fibre and drops of as cos2 of the angle (or cos of the angle for rate of deformation). This can be improved by winding the cable around some central support. A 600 pitch angle (cable helicity) will produce close to omnidirectional fibre optic sensitivity. Unfortunately, the higher the pitch the higher is the bend radius or the fibre wound in the same cable diameter, which often results in greater attenuation for the same distance. Moreover, specialised highly helical cables are an order of magnitude more expensive than straight or low pitch angle cables that are used in the telecommunication industry.
In the following sections we describe a series of surface seismic DAS acquisitions on salt lakes and the associated learnings that culminated in the first successful 3D DAS survey.
Lake Lefroy study Initial field testing of DAS technology for surface reflection seismic analysis in a hyper-saline environment was undertaken in 2018 during a conventional 3D seismic reflection survey conducted by HiSeis P/L at Lake Lefroy, WA (Fig.1). Some 44 shots were recorded into s 450 m length of helical 300 (H30) and 600 m of helical 200 FO cables that were laid directly onto the hypersaline lake surface, alongside a 2D geophone traverse located close to the edge of 3D seismic area (Figure 1). The geometry of the survey lines allowed for a direct comparison of the two DAS cable types, as well as qualitative comparison of the performance of new and conventional sensors. Raw shot records from the two optical fibres are shown in Figure 2. DAS data quality is similar for the two helical cables, with better resolution of the reflected waves in the H30 cable data. Overall signal-to-noise ratio (SNR) for the DAS data is low due to variable coupling, wind noise and in general lower directional sensitivity of DAS in comparison to conventional vertical geophones. Recording parameters were: Laser pulse – 50ns, Gauge length – 10m, PRF – 29kHz and output at every 1m. SIlixa iDAS-v2 was used for continuous recording. Geophone and H30 DAS data were fully processed to a stack and then migrated. DAS produced a good reflection profile over the upper 1000 m of the column (Figure 3). This can be attributed to the high data density provided by DAS, with cable sensing output sampled every 0.86m (=cos(30º)*1m), compared to the 15m spacing of geophones along the conventional line. This higher data density enables proper wave field sampling in the spatial domain, delivering alias-free recording. Furthermore, steep structures and discontinuities produce grazing reflections,
which favour DAS directivity and do not suit geophone recorders, which respond best to energy emerging at small angles to the surface (Urosevic et al., 2019a). While very encouraging results were obtained, the challenges identified in the application of DAS in this initial evaluation included: • Cable deployment is a significant mechanical challenge, particularly for the H30 helical cable, which is heavy, bulky and has low resistance to stretch. For this study we utilised skid steerer to carry the cable wound onto a large drum. The cable was manually unwound, which was a daunting task. • Deployment of the skid steerer was only possible at the edge of the salt lake where the ground supported its weight. Elsewhere such an operation would not be possible.
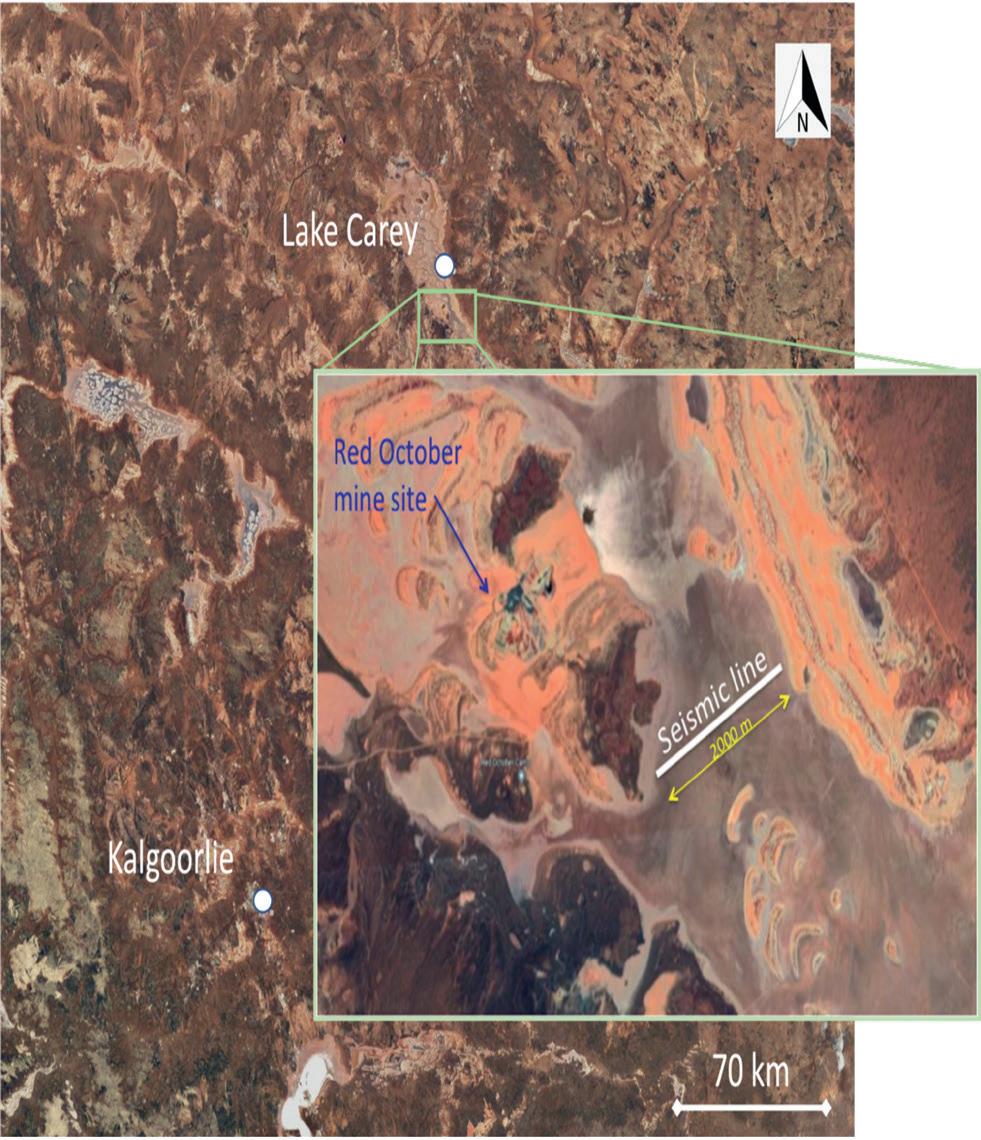
Figure 4 Satellite image of the Fortitude North test site. The studied area is located near to the southeast of the tailings facility from the existing Red October mine site. The experimental seismic line is 2 km long. Google earth (April 10, 2022). Lake Carey, WA, 30° 00’ 35”S, 122° 35’ 57”W, Eye alt 624 km. http://www.earth.google.com. • The vibroseis seismic source was used along the hard ground parallel to the sensor line. Such source would not be possible to deploy anywhere along salt lakes of WA. • Cable-ground coupling with the salt lake surface is variable as a function of surface roughness and temperature (due to cable thermal stretching).
Lake Carey study To improve upon the initial tests conducted at Lake Lefroy, the application of DAS across the salt lakes of WA took us to Lake Carey. The DAS experiment was situated across the lake encompassing soft to very soft saturated and hyper saline clay surface that was also flooded in parts (Figure 4). In a shortage of appropriate vehicles that could cope with such surface conditions, we selected much lighter FO cable and portable seismic source: a Betsy gun using a 12-gauge blank cartridge discharged at a depth of 10-15 cm. Geometry of the survey included 2D straight line length of 2000 m with parallel layout of FO cable and NuSeis nodal system that utilises a 10 Hz sensor at 15 cm depth. Hence the conventional sensor was fully protected from the ambient noise, while FO cable was exposed to it. Apart from the noise factor, the coupling of the FO cable with the ground varied along the line and during the day due to temperature variations (Figure 5). Geophones were placed at an interval of 10 m. DAS recording involved a Fotech interrogator with Laser pulse – 30ns, Gauge length – 12m, PRF – 30kHz and output at every 0.68 m.
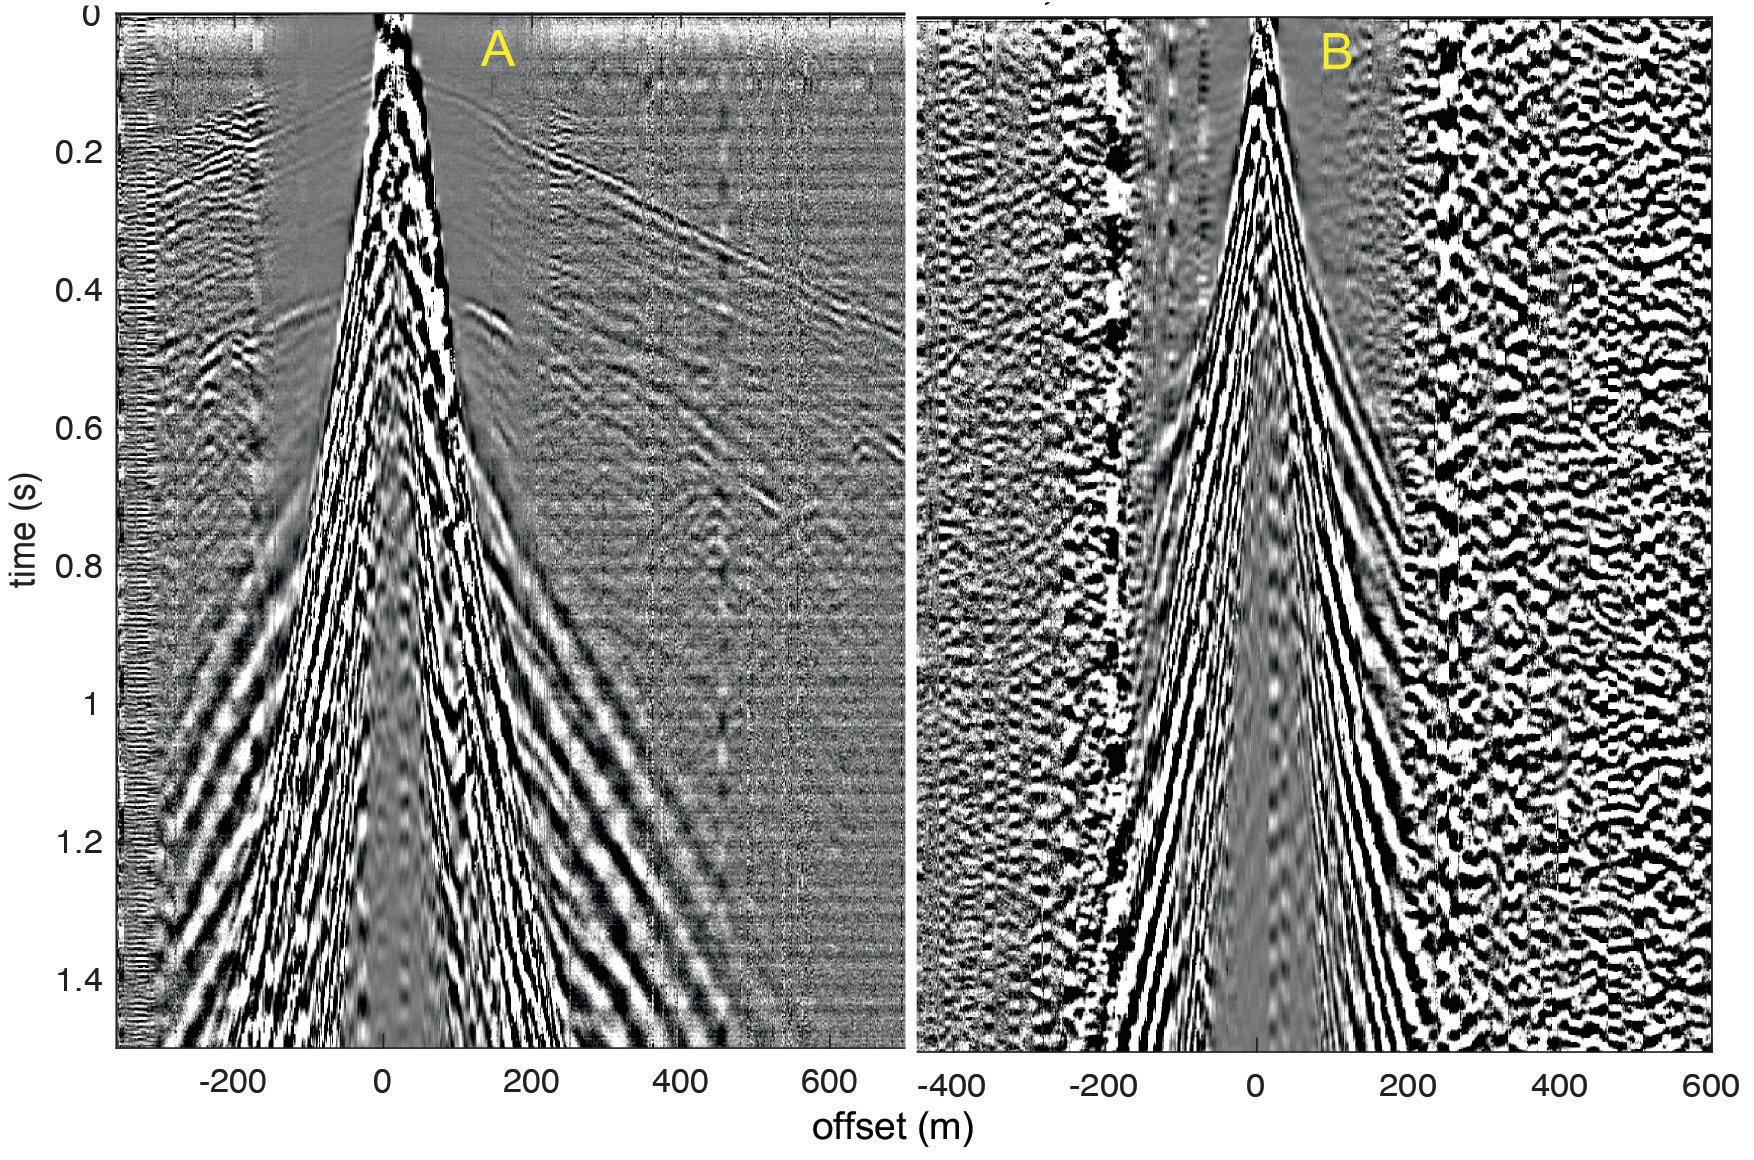
Weather conditions during the first day of recording were calm, resulting in acceptable record quality for the DAS system (Figure 6a). Excessive wind on day two, however, generated significant DAS noise, resulting in sub-optimal performance (Figure 6b). The best quality DAS shot record is displayed alongside the NuSeis geophone record for the same source (Figure 7). The main wave modes such as reflected and refracted (head) P-waves are clearly identifiable in the geophone data. The DAS data lacks refracted wave modes due its preferred sensitivity along the fibre and very poor sensitivity orthogonal to it (due to a low-fibre pitch angle of 11º), which corresponds to the emergence angle of head waves. However, surface waves are aliased in the geophone data due to the coarse 10m spatial sampling rate, and are much better resolved in the DAS data.
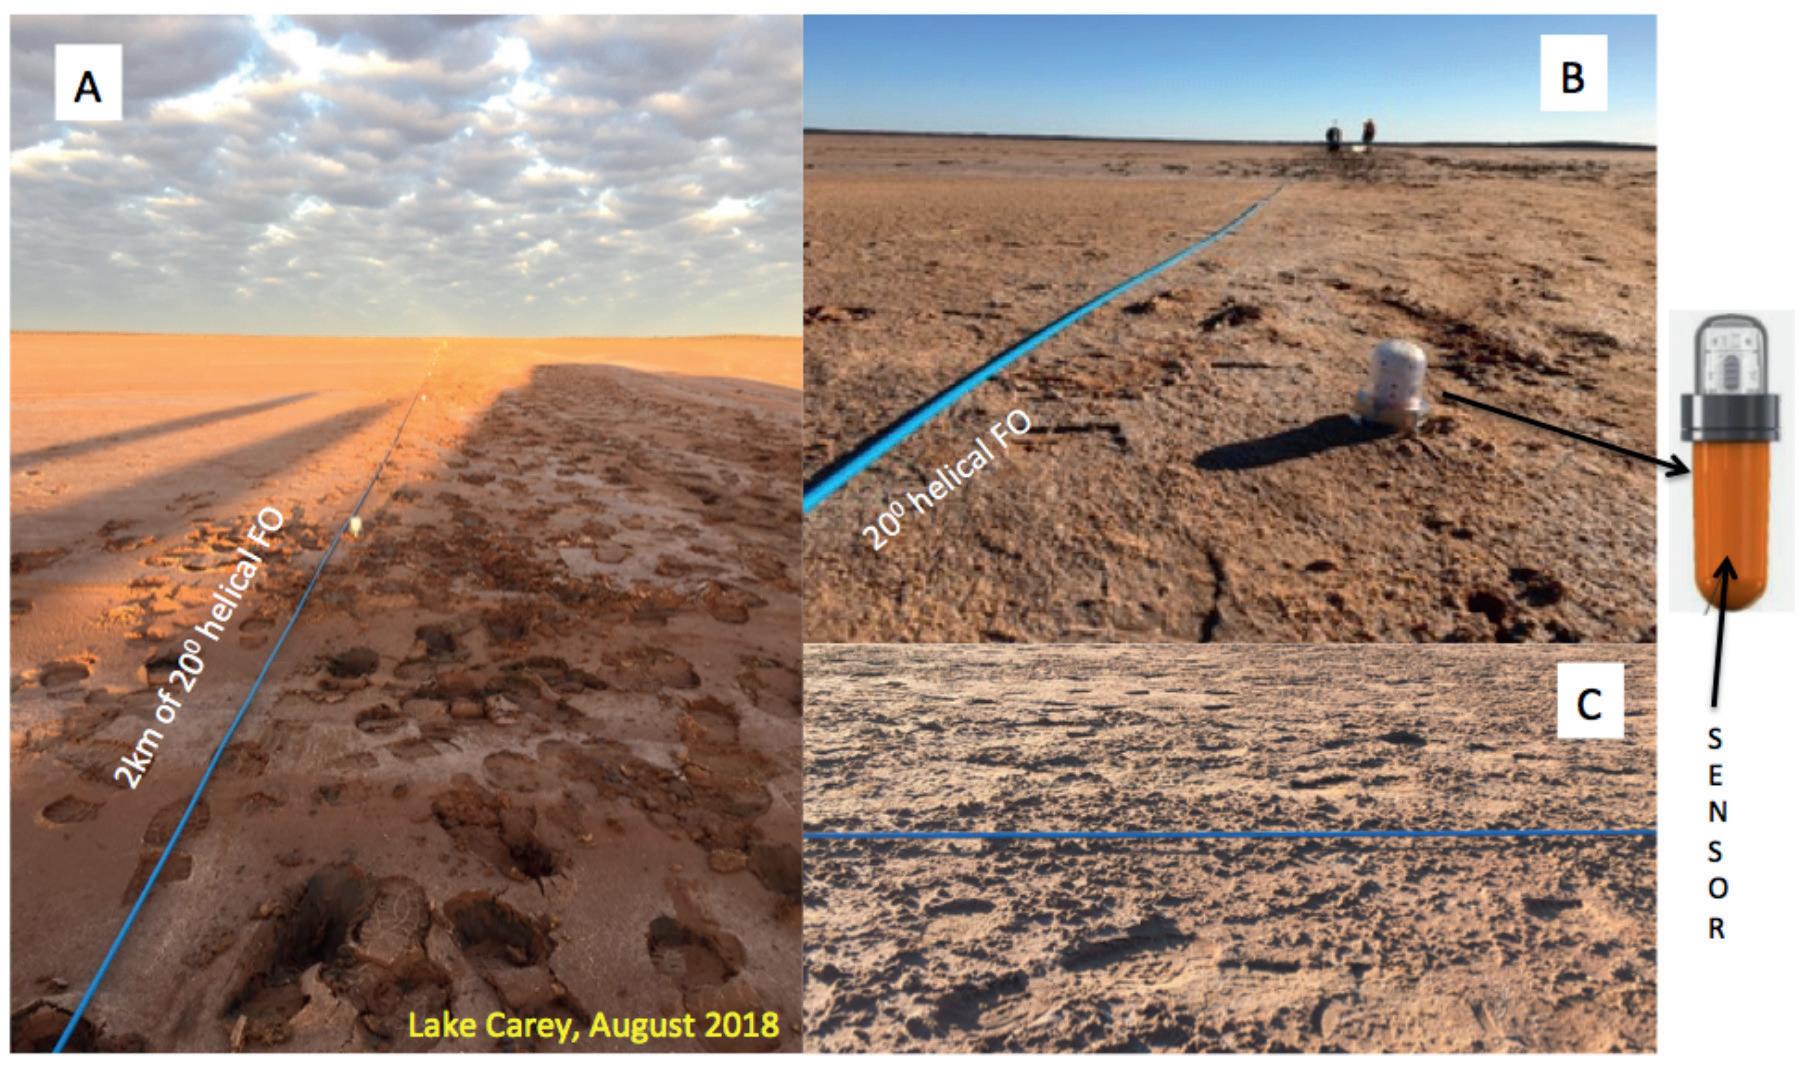
Figure 5 Fortitude North Lake Carey survey conditions: A) 2 km of FO cable stretch across the lake, B) Deployment of NuSeis geophone system alongside the FO cable and C) FO cable was only partially in contact with the ground surface resulting in poor cable-ground coupling. The quality of coupling varied during the day as a function of the ambient temperature, which affected the stiffness of the cable.
Geophone Data DAS Data
1 SEGD reformat to local SeisSpace (SS) format HDF5 reformatting to SGY then to local SS format
2 Geometry database and header load Geometry database and header load
3 First arrival onset picking and refraction static computation Solution from geophone data
4 Spike deconvolution Spike deconvolution
5 Amplitude compensation Amplitude compensation
6 Multi-channel filtering (surface wave attenuation in F-K domain)
Multi-channel filtering (Time Frequency De-noise) and Tau-P filetering 7 Constant Velocity Analysis (CVA) From geophone data for consistency of results 8 Brute stack Brute stack
9 Residual reflection statics Residual reflection statics
10 2nd pass CVA From geophone data for consistency of results 11 Dip move-out corrections (DMO) Common Reflection Surface (CRS) corrections 12 Final stack + F-X deconvolution Final stack + F-X deconvolution
13 Time and depth imaging (Migration) Time and fepth imaging (Migration)
Figure 6 Raw DAS shot record under (A) calm conditions on day 1, and (B) windy conditions on day 2 of the experiment. Note the lack of visible reflections resolved in panel B.
Table 1 Data processing workflows employed on North Fortitude 2D survey data (after Urosevic and Evans, 2007).
Raw signal data acquired from both geophones and DAS was processed using a ‘hard-rock’ processing flow modified from Urosevic and Evans (2007) (Table 1). Refraction statics were computed from the first arrivals in the geophone data, as this wave mode was not recorded by DAS. Computed delay times were then applied to both datasets for further processing. DAS output spacing of 0.67m (=0.68m*cos(11º)) produced 2857 data points over the ~2 km length of cable deployed, in comparison to the 200 geophone data points over the same distance. The higher DAS data density supported application of time-frequency domain (TFD) ambient noise suppression and coherent noise removal using limited apertured Tau-P transform. This conditioning approach has substantially increased SNR of DAS records.
With respect to imaging, migration after stack resulted in the best outcome. This method takes the full advantage of high fold coverage during common depth point (CDP) stacking, which further improves SNR. We applied a partial pre-stack migration in the form of common reflection point stacking (CRS) and a post-stack migration algorithm. The CRS method, which involves post-stack dip modelling, provided a more sophisticated partial pre-stack migration than standard dip move-out (DMO) correction.
Direct comparison of the final processed geophone and DAS signals is provided in Figures 8a and 8b, respectively. Deterioration in DAS image quality from left to right reflects the impact of wind noise during the latter period of data collection. Comparison of the geophone data with the initial km of DAS data collected in calm conditions (Figure 8c) shows the two sensor types produce similar results under calm conditions.
Overall results from the survey are evaluated by comparison to a nearby seismic line produced by Urosevic and Evans (2007) using an array of four 60,000 lb Vibroseis trucks (Figure 9). Comparable resolution of the two lines down to at least 2 km depth establishes the capacity of the Betsy gun source to deliver coherent seismic energy to at least this depth for a cost of less than $1 per shot. This establishes viable potential for low-cost, high-quality reflection seismic acquisition in the near-surface environment combining the cheapest sensor – DAS – with the cheapest source – the Betsy gun.
Overall, the results achieved with surface layout of DAS were satisfactory. However, it became clear that FO cable needs
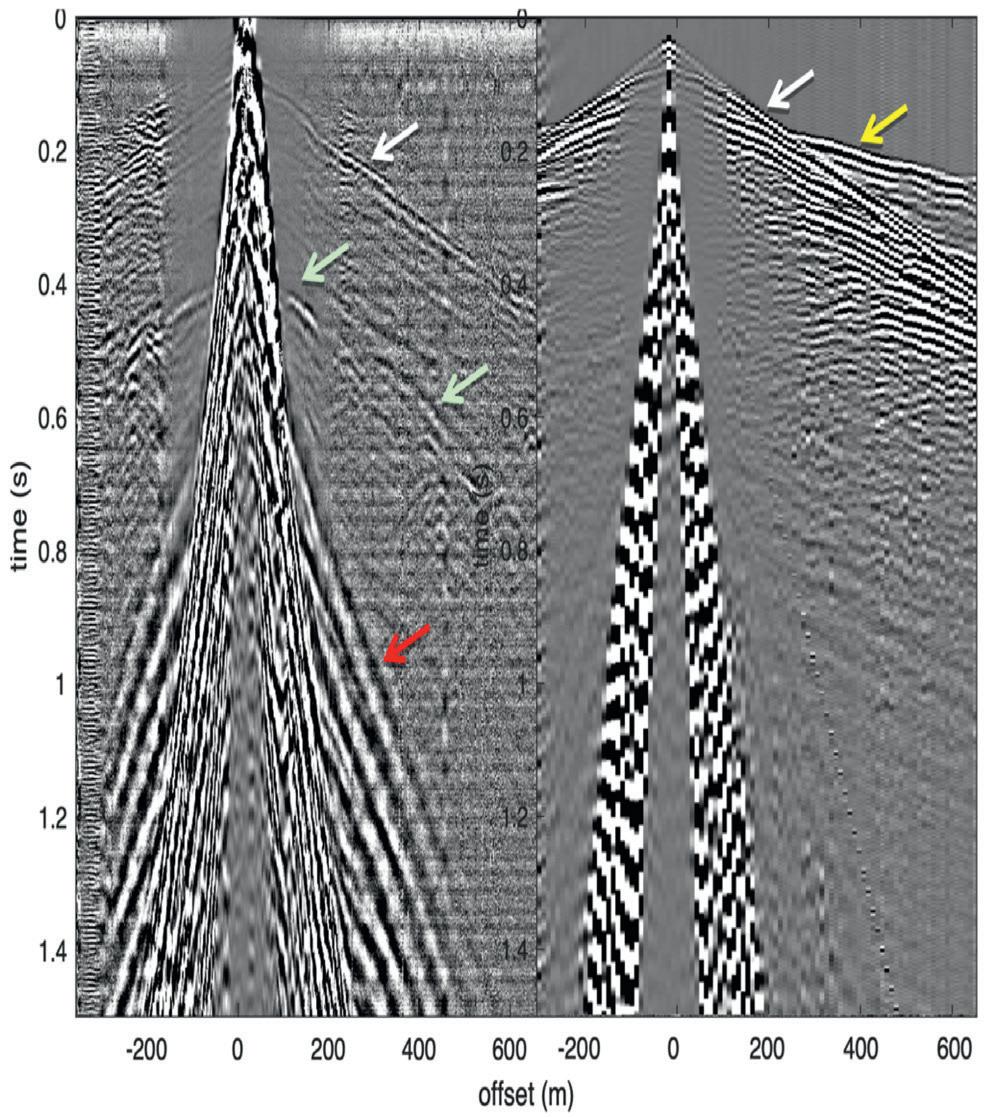
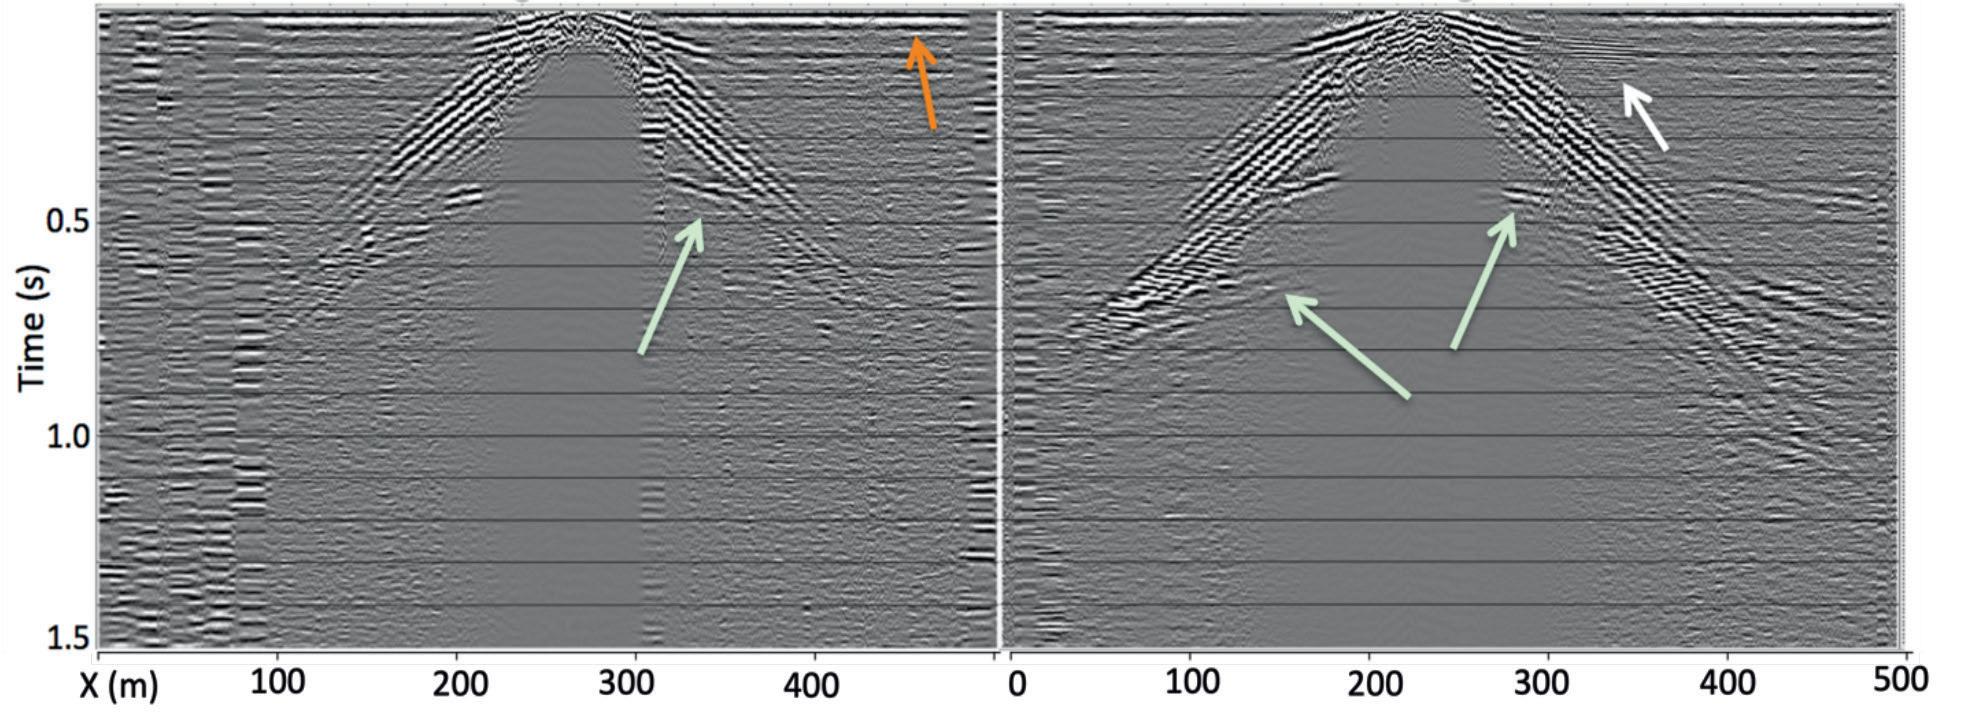
Figure 7 DAS data (left panel) and NuSeis shot record (right panel). Note that the NuSeis geophone array was active over only 1km while DAS was active over a 2km transect. NuSeis was deployed in two sections to match the overall DAS coverage. NuSeis exhibits a much higher SNR. Arrows depict the detection of specific wave arrivals as follows: white – direct wave; yellow – head wave; green – converted shear wave, and; red – surface waves. to be trenched and protected from often persistently strong wind. Thus, the optimum methodology for the harsh environment of hypersaline lakes could involve: • Light, portable seismic source • Light, buried FO cable • Sparse geophone grid providing near surface time delay information for processing
Geophone support may be avoided if, for example a highly helical FO cable with a pitch of 600, that would provide for close to omni-directional sensitivity, is deployed. However, soft lake surface makes deployment of helical cables difficult, if not impossible. The associated high cost makes currently highly helical cables impractical for a commercial exploration of mineral resources.
To effectively deploy DAS acquisition methodology over a length of exploration interest we need to utilise an inexpensive FO cable that can be efficiently machine trenched. Inexpensive FO cables are less ragged and in general contain only straight fibre. To analyse the possibility of replacing loose-tube telecommunication cable (slightly pitched) with a straight fibre we conducted another test that utilised a ‘bare’ fibre: 250mm diameter single mode: 8mm core, 125mm cladding and 250mm coat. A direct comparison between the two cables is shown in Figure 10, which shows that the bare fibre produced a higher SNR due to the lack of the protective layers that attenuate the seismic energy. This final test showed that a light weight, and at least one order of magnitude cheaper seismic exploration with DAS, is feasible in the harsh conditions of the hypersaline lake of WA (Urosevic et al., 2019b).
3D DAS reflection seismic over lake Carey The combination of Betsy gun source and ultra-lightweight bare optical cables delivered high-quality reflection seismic results in a salt lake setting. The next and an ultimate evaluation stage involved implementation of 3D reflection seismic survey across the hyper-saline surface of Lake Carey. The area selected was on the lake proper, close to the existing mine site, covering approximately 1.5 km2. The geometry of the DAS survey and the acquisition strategy is illustrated in Figure 11. Two interrogators by Terra15 were utilised to interrogate 7 km of FO cable each.
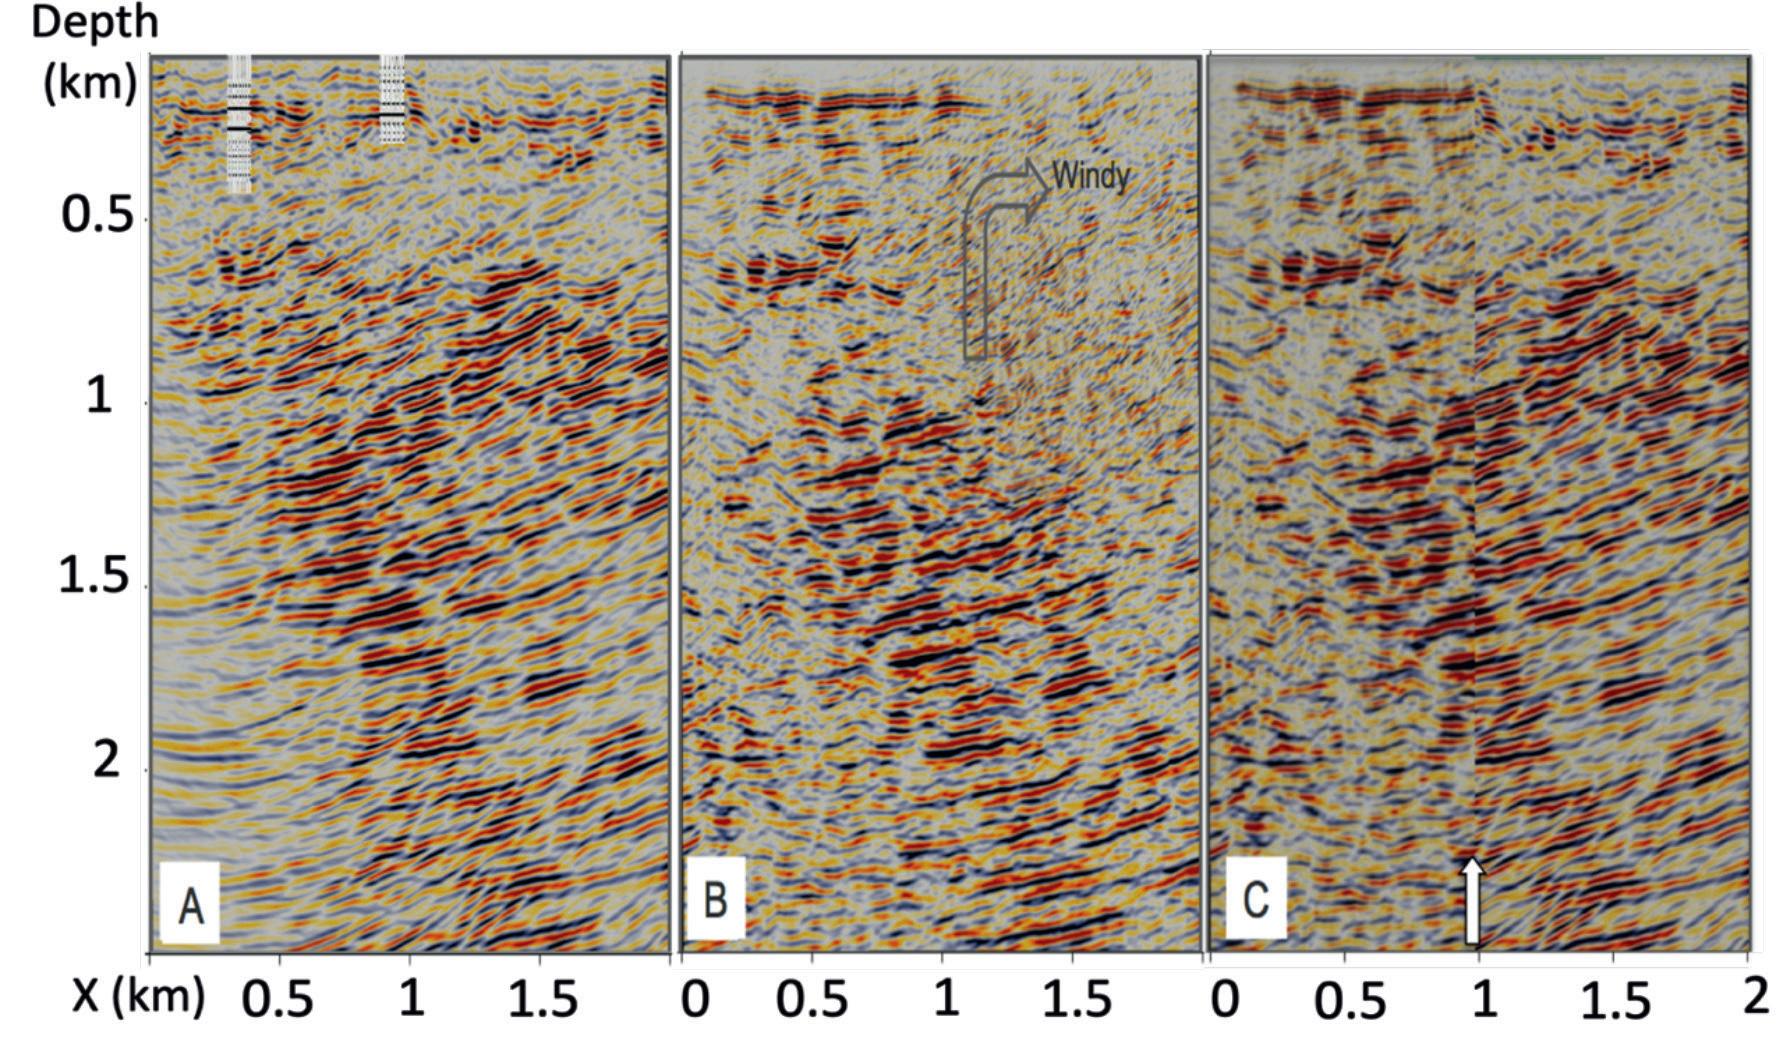
Figure 8 Final images. (A) Geophone data, (B) DAS data, and (C) 1 km of geophone data (left) and 1 km of DAS data (right). Quality of the geophone data (NuSeis) is superior under high-wind conditions, but not so during calm conditions.
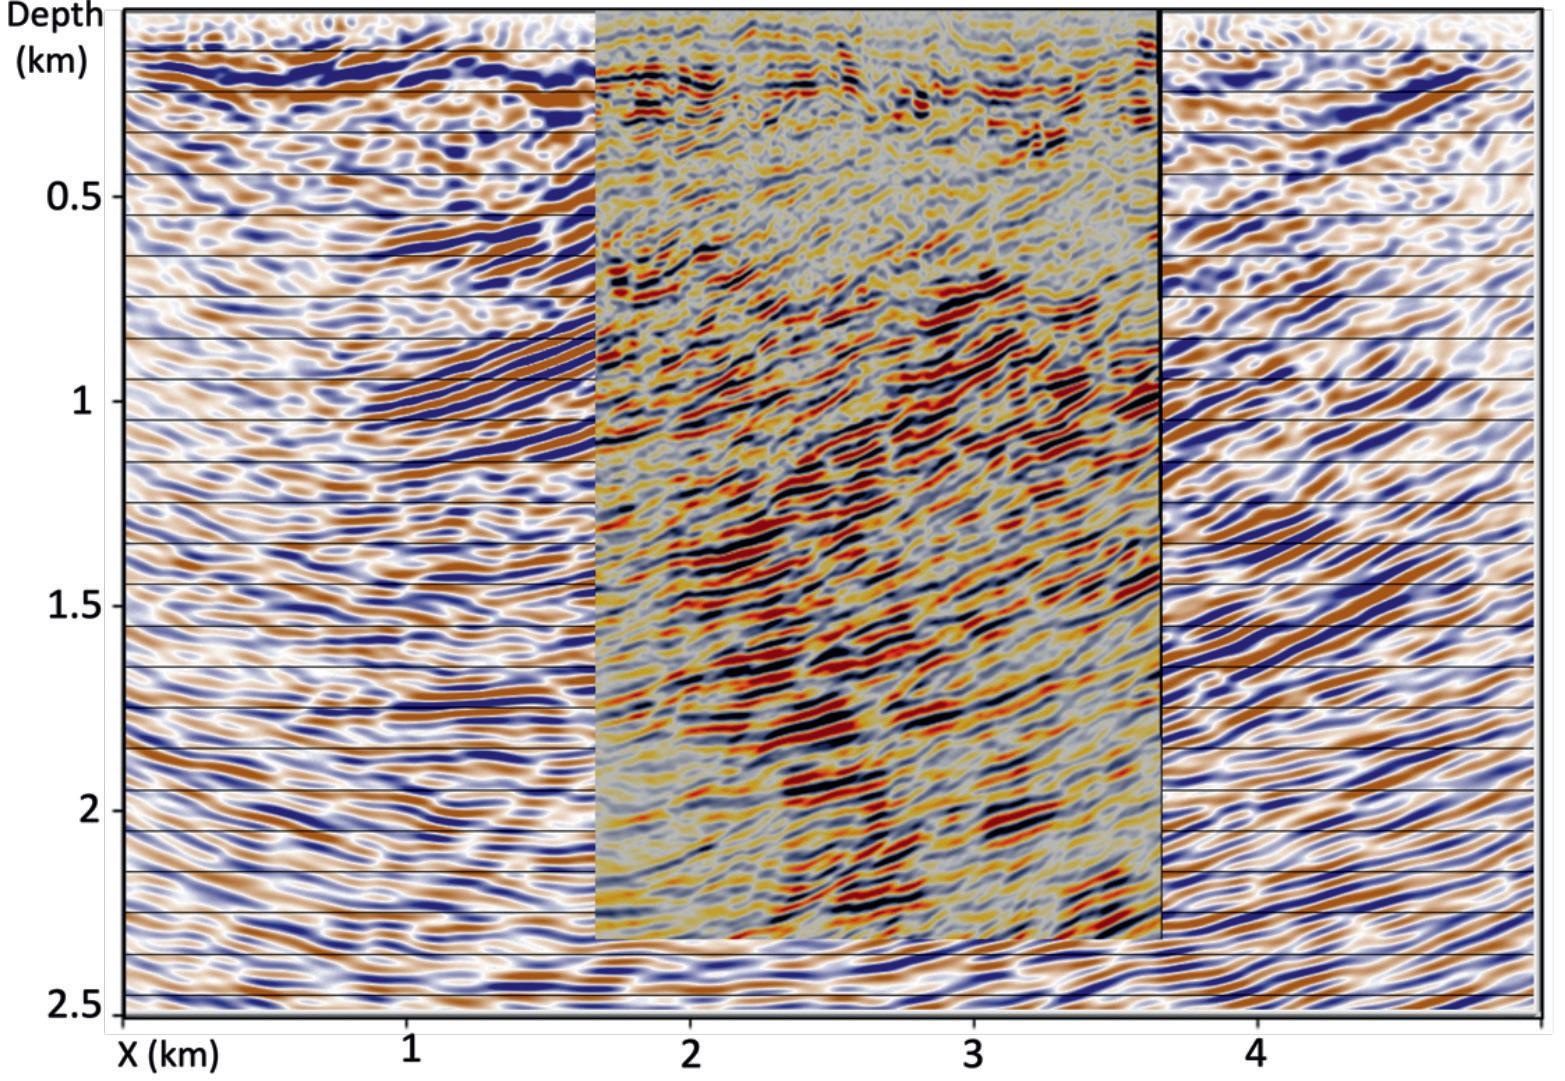
Figure 9 Betsy gun image overlain onto a Vibroseis image. Good correlation can be observed as both lines are recorded in the dip direction of the main geological structures. Lines are approximately 10 km apart but the same large shear structures can be seen in both images.
Figure 10 Raw field data comparing blue helical cable (left panel) and bare cable (right panel). Shots are displayed as a mirror image pairing for easier comparison. The ultra-light bare cable delivered superior performance to the blue helical cable, including capturing the P-wave reflection (white arrow) arrival which is not seen in the helical cable results. Green arrow denotes S-wave reflection arrival.
Figure 11 Optical cables were distributed in four patches of 6 km length each in a ‘snake-like’ pattern. Two patches at a time are connected to the two active interrogators. As shooting progresses from NW-SE the two, interrogators are shifted one patch down at the time. Hence there are three acquisition sets, covering patches 1-2, 2-3 and 3-4, respectively. Google earth (April 10, 2022). Lake Carey, WA, 29° 13’ 10”S, 122° 26’ 46”W, Eye alt 3.5 km. http://www.earth.google.com.
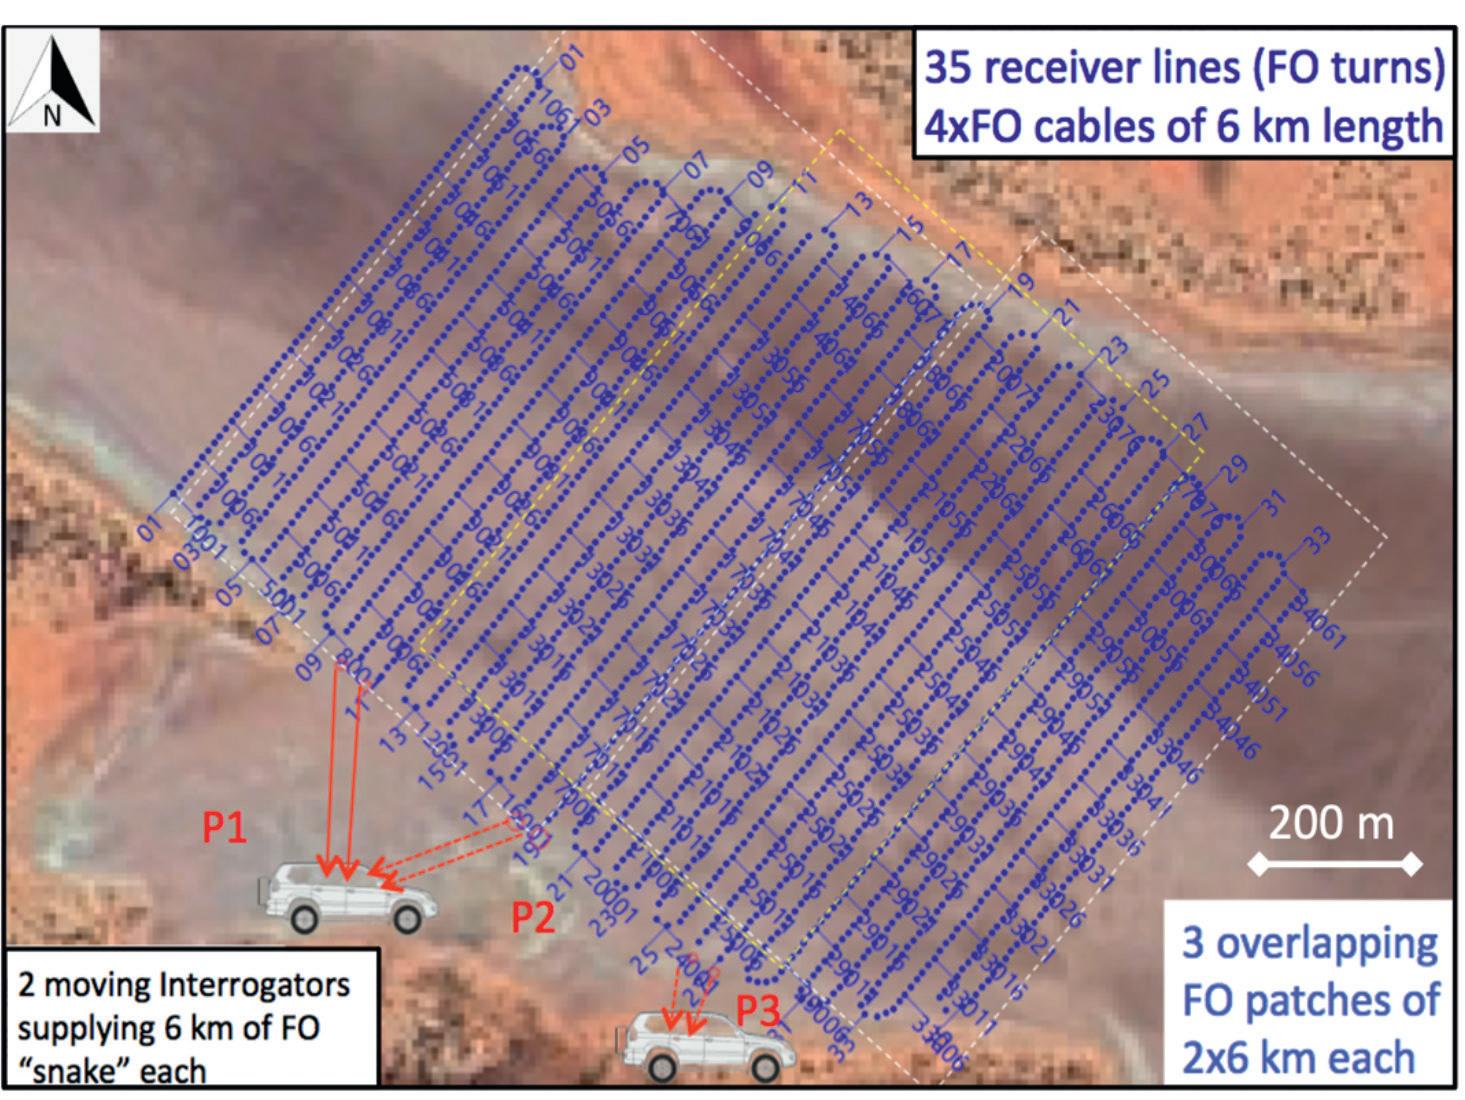
These interrogators record deformation rate rather than the strain or strain rate as do the other interrogators used in this study. The interrogator was set with Laser pulse – 200ns and output at every 0.82 m. PRF was set automatically to maximum based on the fibre length of up to 7 km.
Two Betsy guns were also utilised for shooting along 20x20 m grid pattern (Figure 12). As the shooting progressed, the two interrogators were shifted by one cable of 7000 m length. In total three DAS patters were utilised to complete the survey.
One hundred and three channels of Sercel Unites (with geophone extensions) were positioned in 90x100 m grid pattern (Figure 12). Utilisation of such sparse geophone grid will enable both refraction and reflection data analysis, provide support to DAS data processing and eventually allow for a direct comparison between the two data sets.
For this experiment, we used somewhat more rugged FO cable compared to the bare fibre used in the preceding experiment. In particular, we used tight buffer fibre with 8 µm core, 125 µm cladding and additional PVC reinforcement, taking the total diameter to 900 µm. While this is still very thin and inexpensive cable it provided sufficient tensile strength to allow for fully automatic trenching by plough mounted on a rubber-tracked Can-Am 4WD off-road vehicle (Figure 13). This plough was designed and manufactured at Curtin University. The trenching operation went flawlessly at a very high speed. A total of ~26,000 m of FO cable was trenched within 10 hours, by a single operator. Results The flow of Table 1 is used for processing of both geophone and DAS data. The bin size was 10x10 m for DAS and 20x20 m for geophone data. DAS data, recorded as deformation rate, was differentiated to provide output like geophones. Suboptimal parameters were unfortunately used in the survey. The pulse length of 20 m was too long and resulted in ghosting filtered with a in spatial domain. To avoid this issue, a shorter pulse length could have been used with a trade-off of smaller SNR. To compensate for this effect, we applied a deconvolution in spatial domain as a deghosting filter. However, it resulted in considerable artefacts.
An example of geophone stack and migrated data is provided in Figure 14, while equivalent DAS data is shown in Figure 15. Comparing the stacked sections, it is clear that even sparse geophones produced superior result over DAS, due to considerable artefacts remaining in DAS data after deghosting. However, after migration we have the better outcome and DAS data appears to
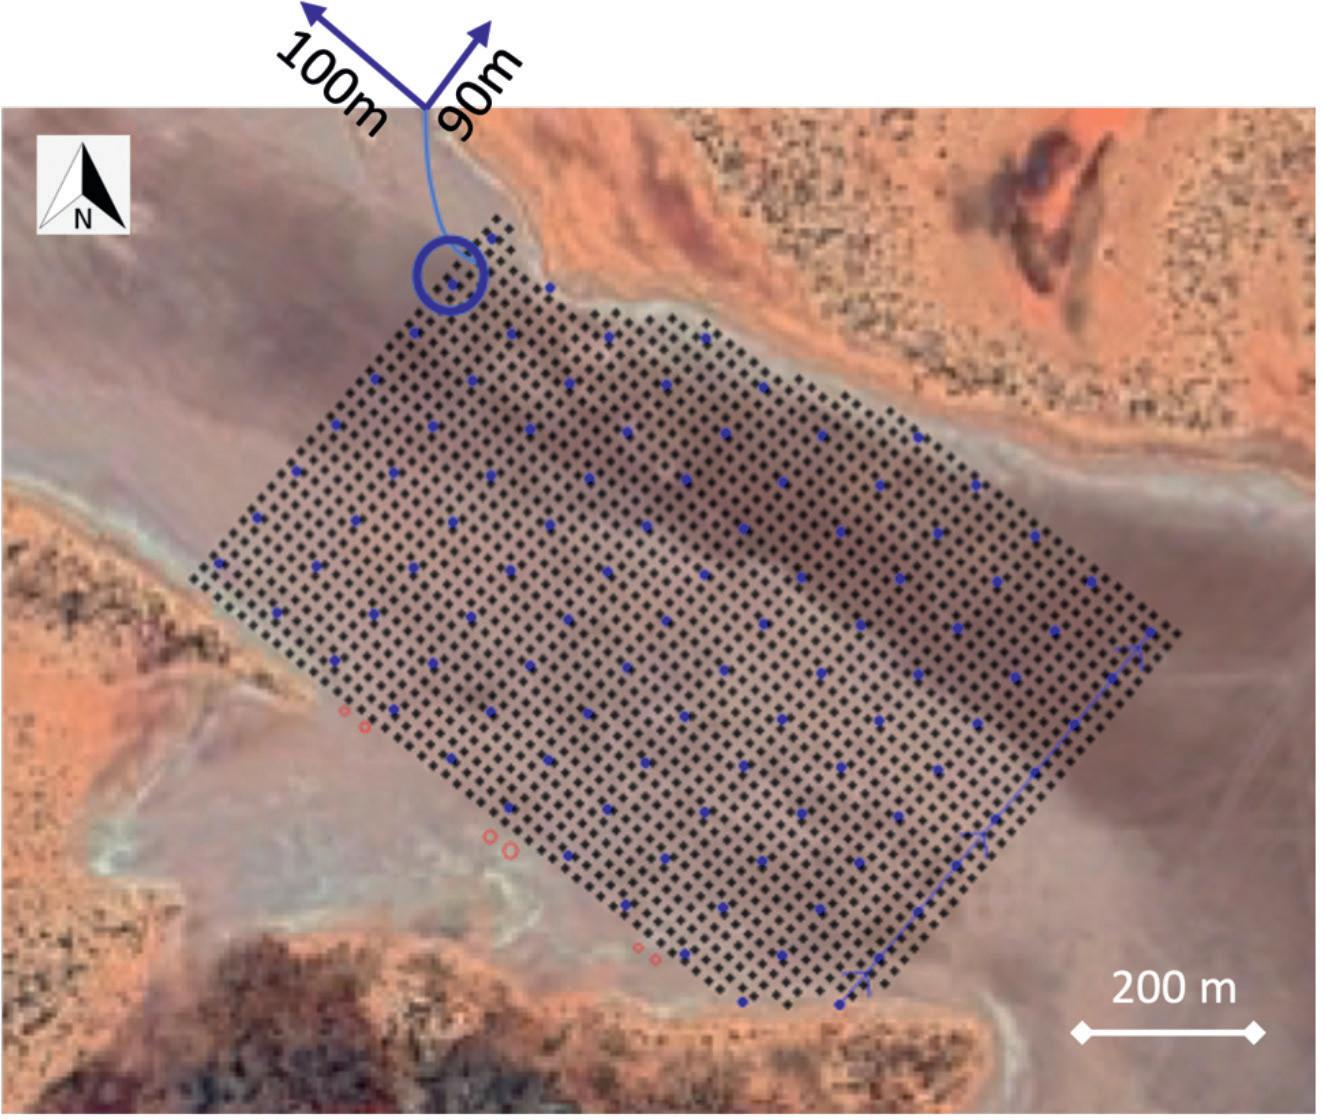
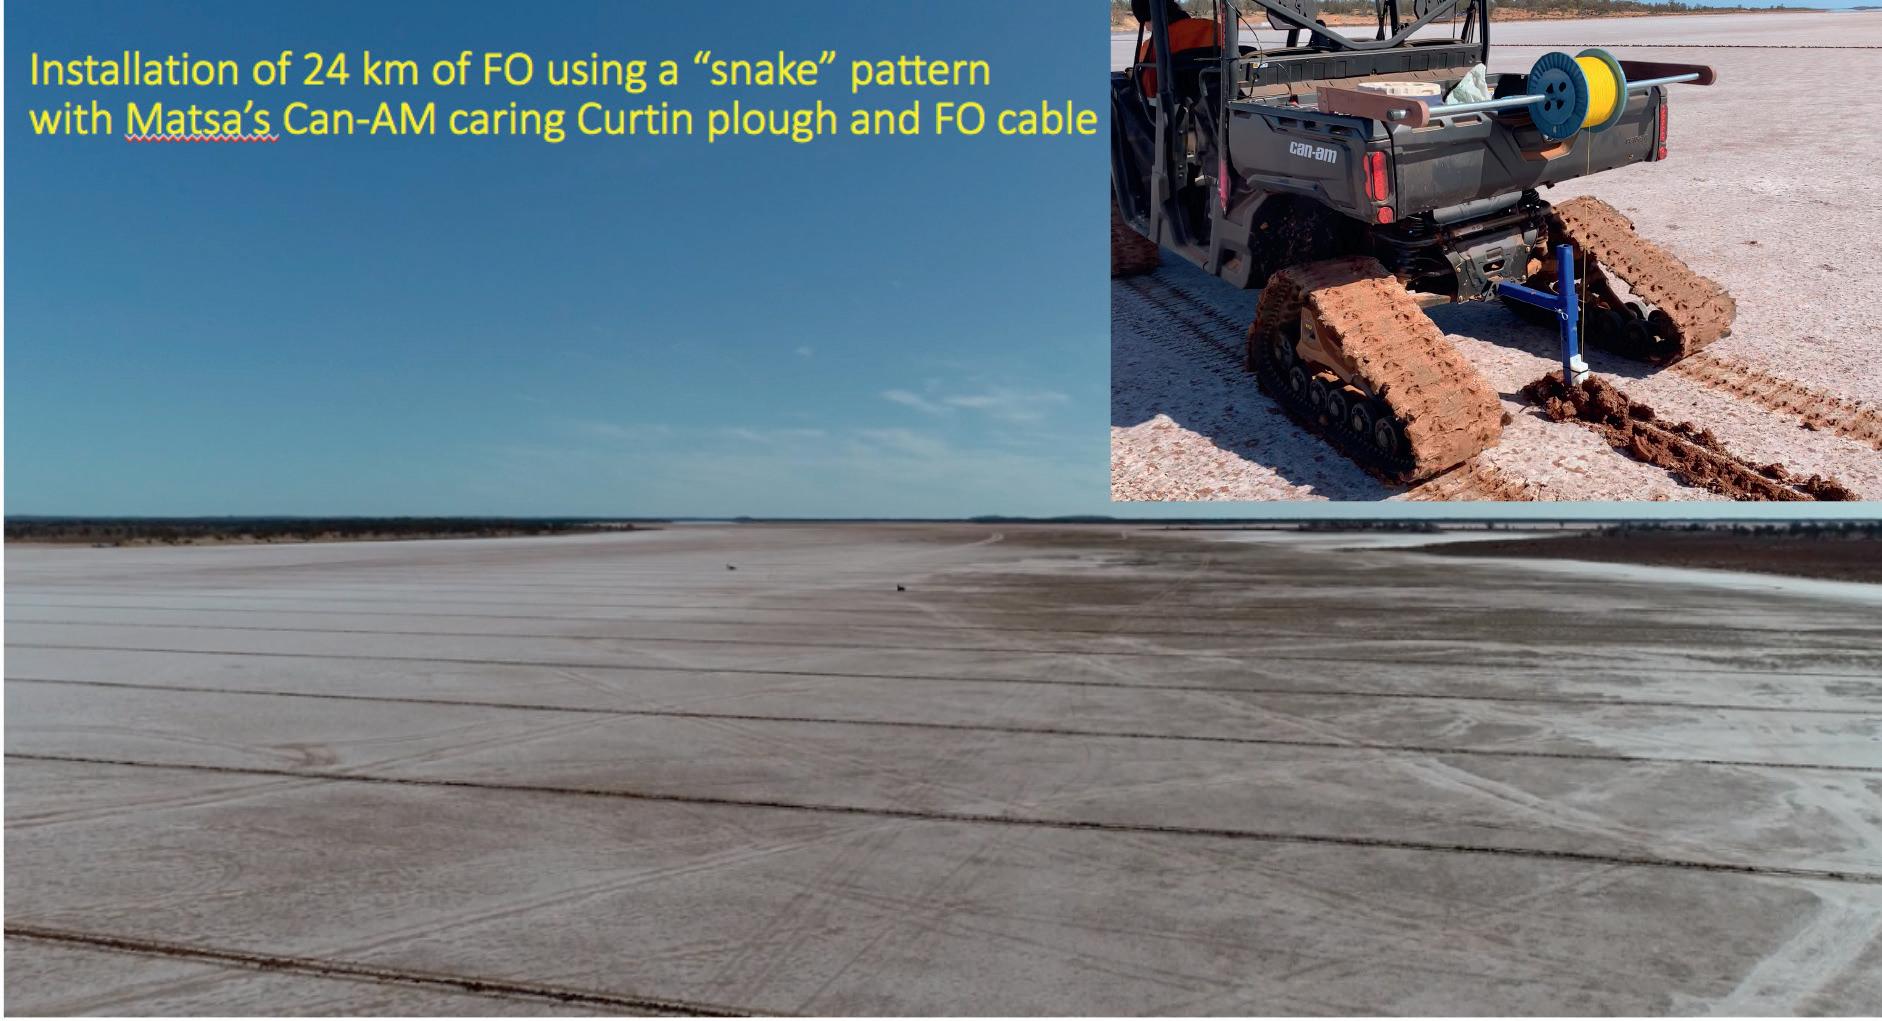
Figure 12 Source array and geophone receiver distribution. Betsy gun shots were delivered in a rectangular pattern on a 20x20m spacing. Geophones are arrayed in 90x100m grid using 100 Unite 3-component units and 200 extension cables to minimise use of electronic equipment. Lake Carey, WA, 29° 13’ 10”S, 122° 26’ 46”W, Eye alt 5 km. http://www.earth.google.com.
Figure 13 Curtin University designed and constructed cable plough attached to Can-Am 4WD vehicle. Provides very rapid deployment of FO cable approximately 0.1m beneath the lake surface. Some 24 km of cable was deployed in 10 h as a single man operation. This is equivalent of 32,000 sensors 0.8 m apart.
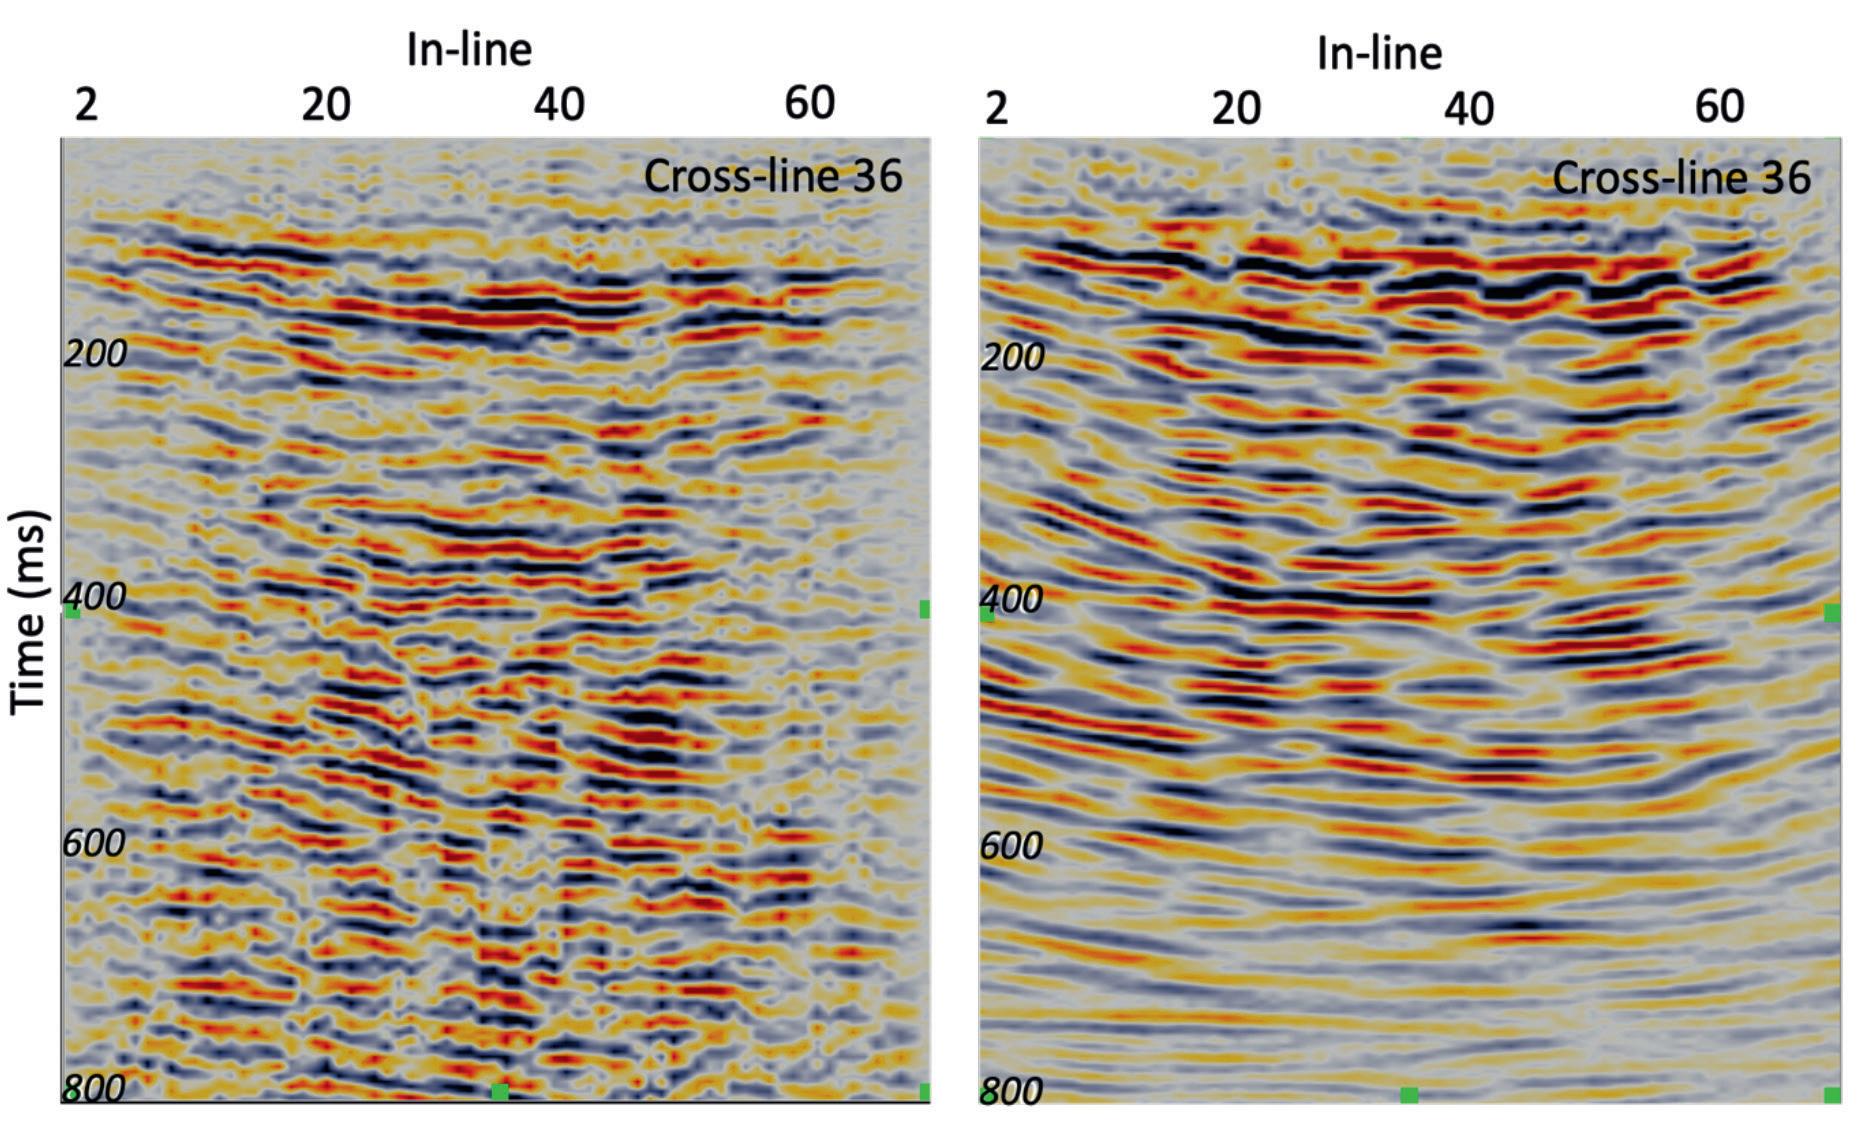
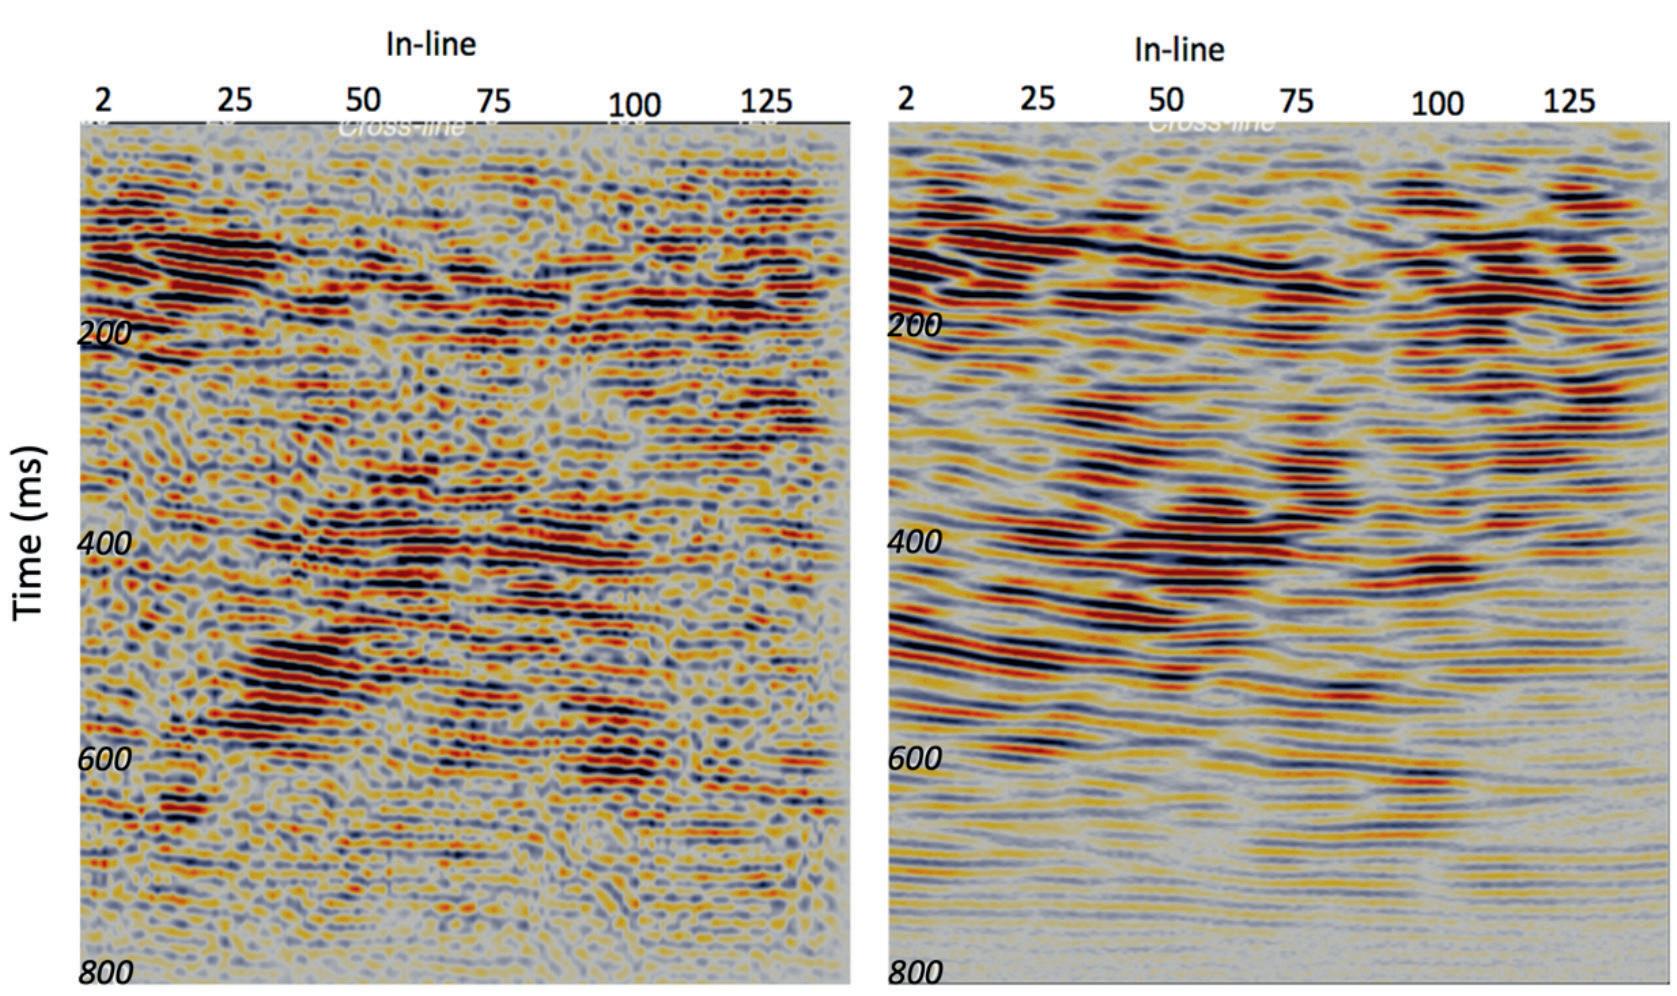
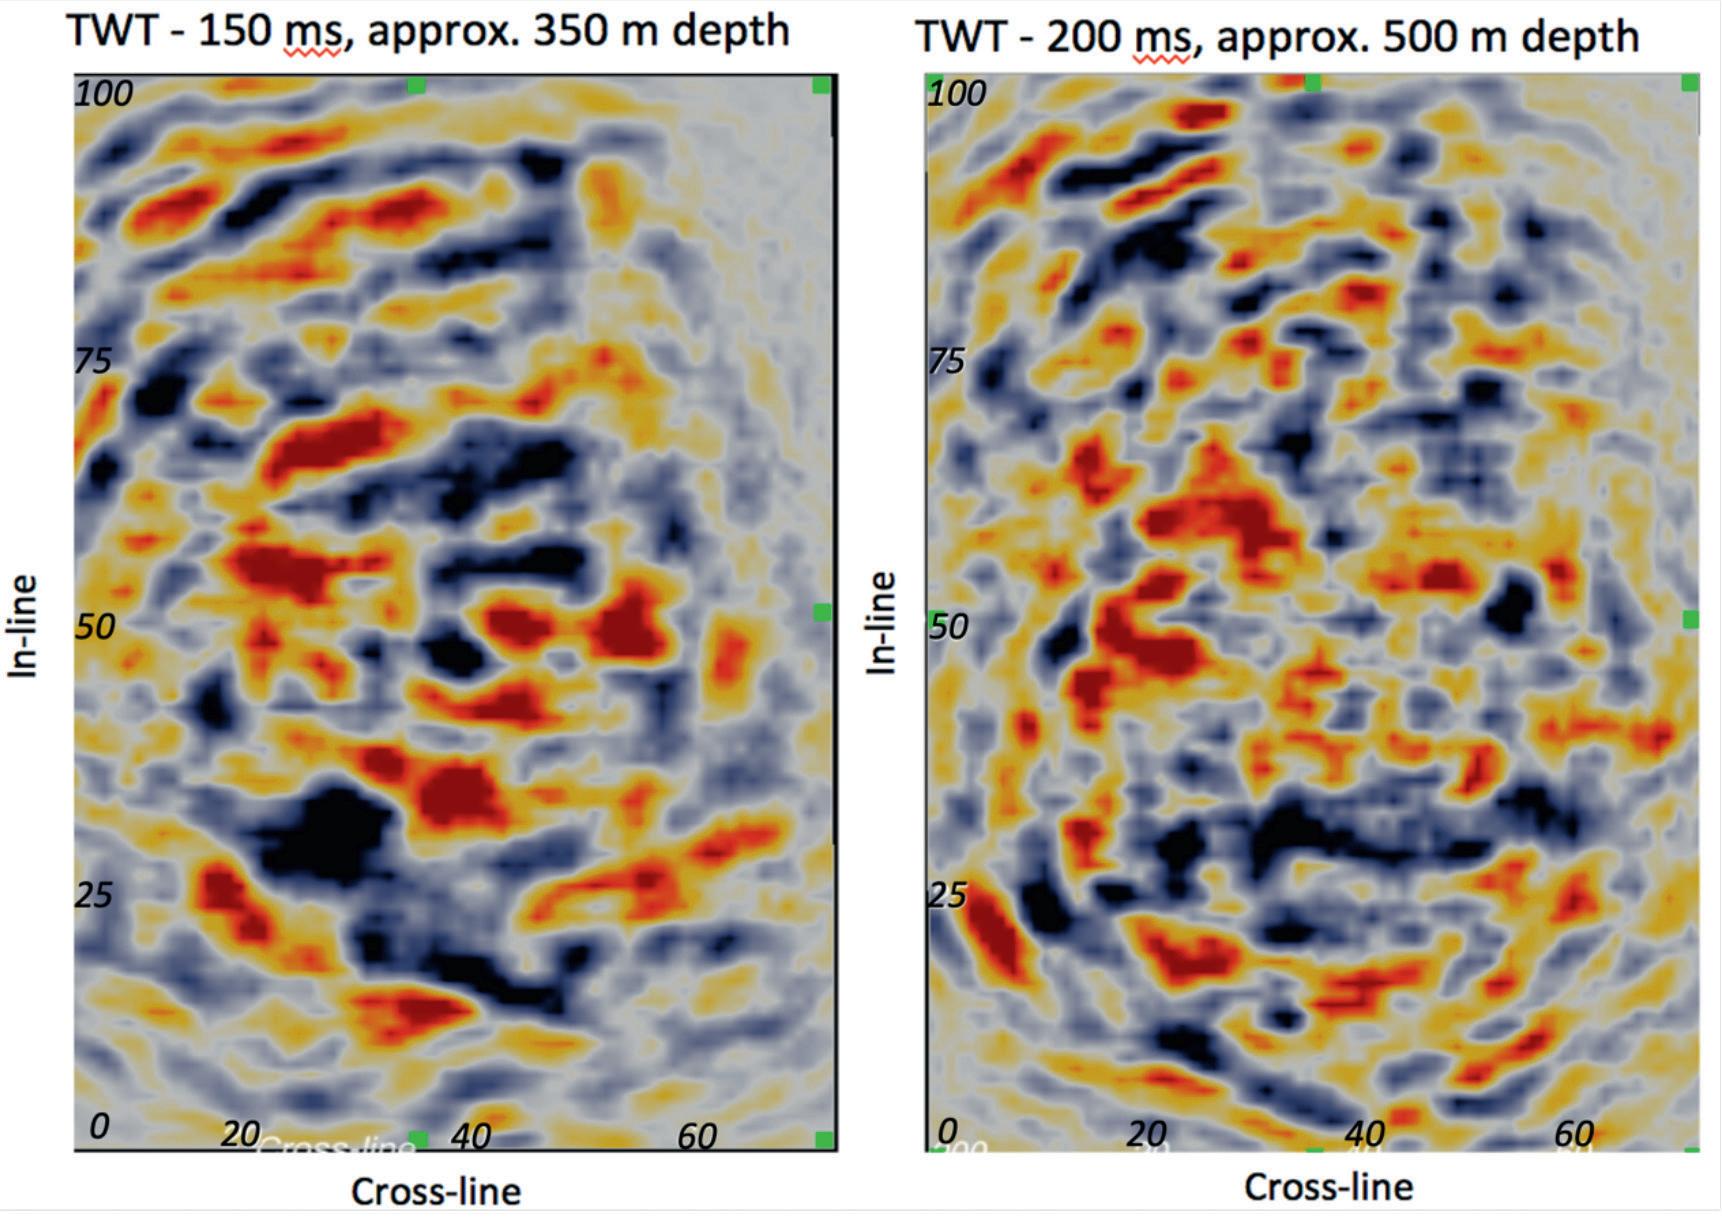
Figure 14 Cross-line 36 from geophone cube before migration (left), and after migration (right).
Figure 15 Cross-line 36 from DAS cube before migration (left), and after migration (right). Note significant SNR improvement after migration. This is attributed to high spatial data density.
Figure 16 Geophone cube time slices at 150 and 200ms two-way-travel time (TWT) corresponding to approximate depths of 350 and 500 m.
have more continuity and better SNR. This is attributed to higher density of DAS data.
Selected time slices are shown in Figures 16 and 17 for geophone and DAS data cubes after post stack migration, respectively. Again, it appears that DAS data produced a more coherent result. A chair type of data display is shown in Figure 18. The results are of a lower quality than expected but still of a sufficient SNR to be interpretable.
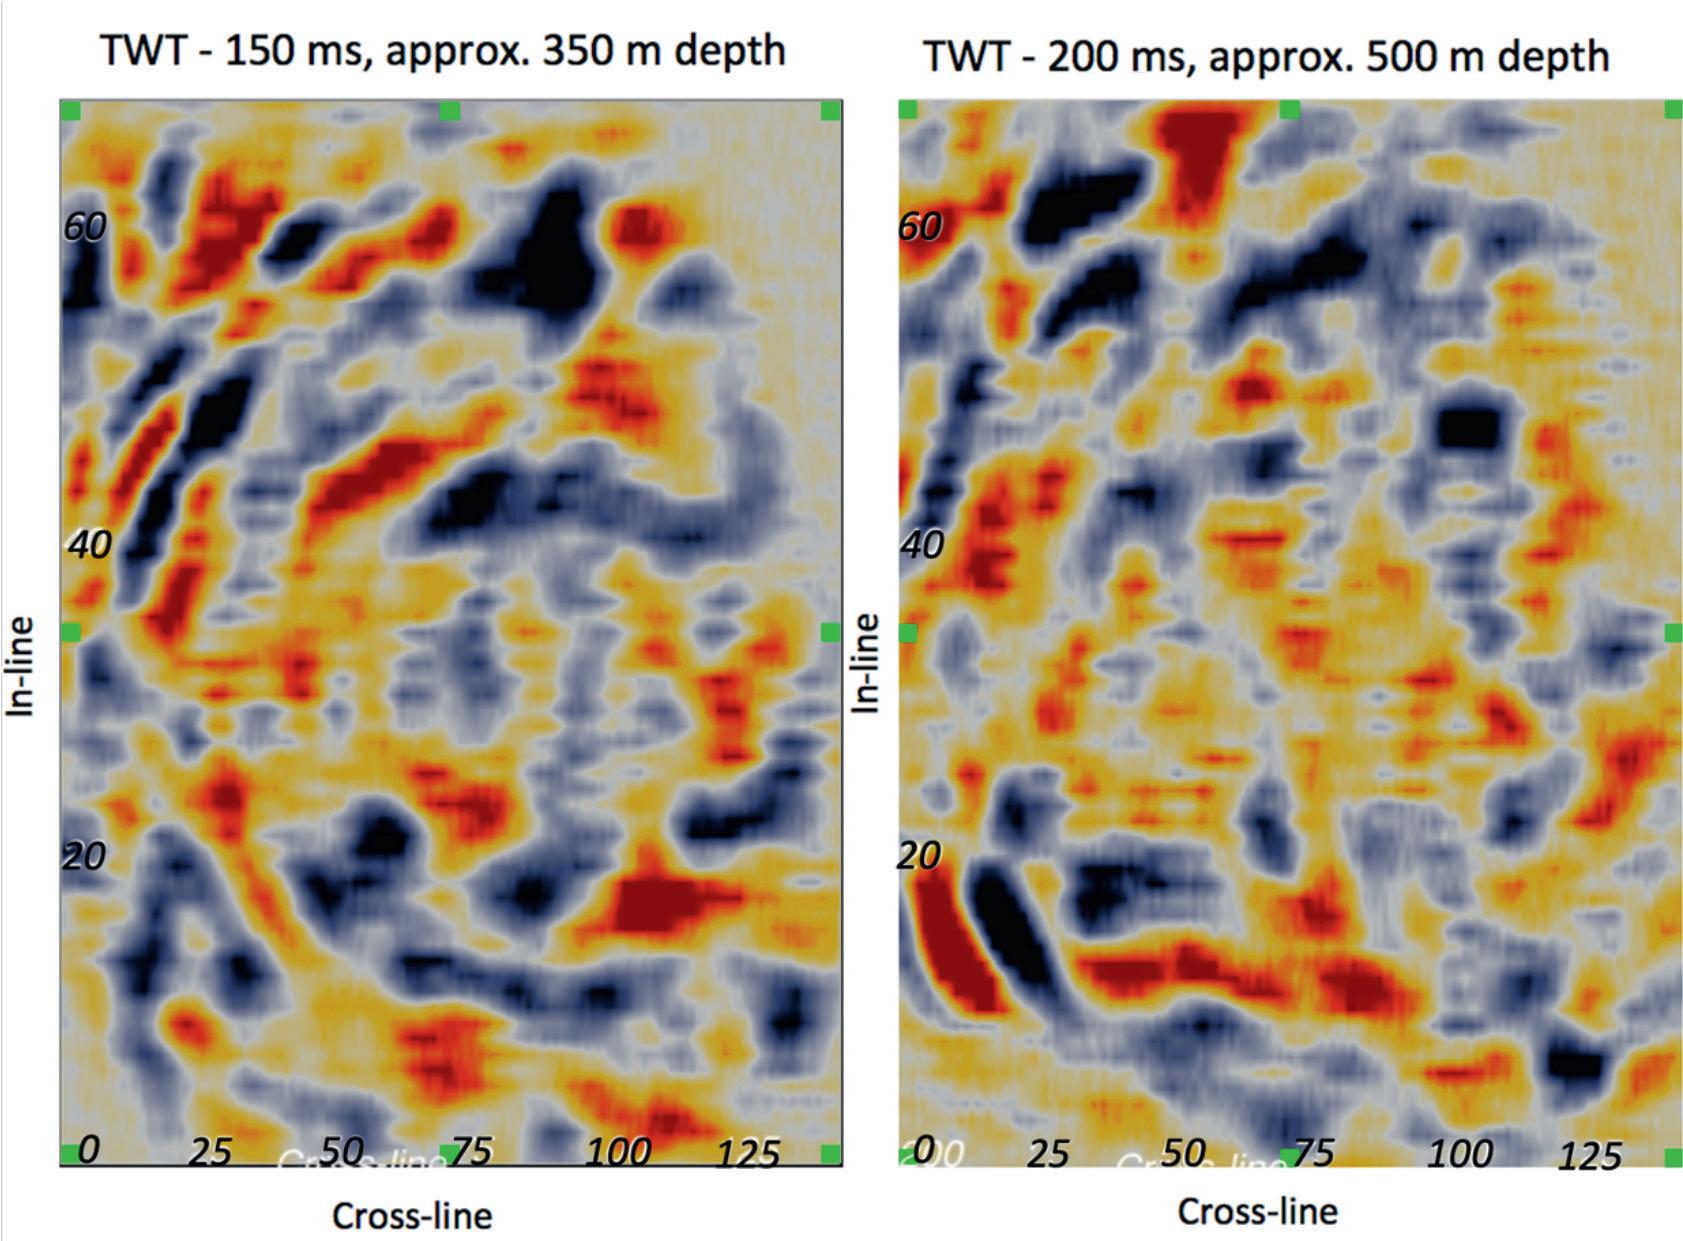
Figure 17 DAS cube time slices at 150 and 200 ms two-way-travel time (TWT) corresponding to approximate depths of 350 and 500 m, respectively.
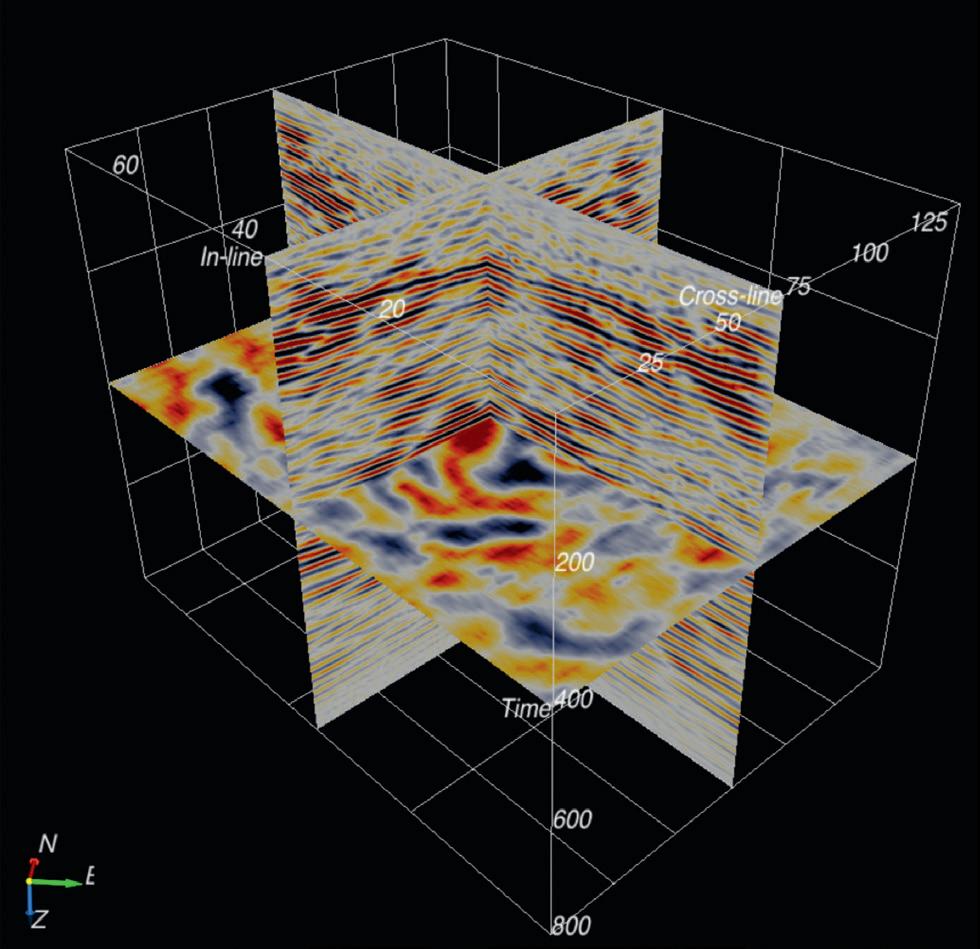
Figure 18 Chair display of migrated DAS data cube.
Conclusion The first application of DAS sensing technology to 2D and 3D seismic reflection imaging of complex underground structures in a mineral exploration context are presented. An evaluation of DAS technology against current seismic exploration practices is discussed briefly, omitting the long-term ominous efforts conducted in the background that led to the seismic experiments and the results present in this study. The field studies were of key importance in evaluating DAS technology and enabled us to develop an efficient methodology based on the new generation of sensors in combination with a specific type of acquisition geometry, combined with portable, efficient sources of seismic energy.
Some of the key achievements of this study are: • Completion of the world’s first successful 3D reflection seismic survey for mineral exploration using DAS technology • Design and construction of a plough for rapid trenching deployment of FO cable • Performance evaluation of different types of optical interrogators and FO cables for DAS imaging under mineral exploration conditions
This study sets a foundation for the future application of cost-efficient DAS seismic technology for exploration of mineral resources. Many lessons were learnt in the utilisation of DAS technology for the objectives of seismic reflection prospecting of mineral resources. While the learning continues it is becoming clear that DAS technology will play a crucial role in the mineral sector due to its efficacy, low cost and exceptional spatial data density that allows for new thinking in data processing and interpretation.
Acknowledgements We would like to thank Dave Felding and Camilo Guarin of Matsa Resource Company for providing key financial support, field support and equipment. We thank HiSeis for providing financial and field acquisition support.
We would also like to thank Dominic Howman, Murray Hehir, Alexei Yurikov and Pouya Ahmadi who made these complex data acquisition programs possible. We thank Mehdi Asgharzadehmeh for analysing borehole seismic experiments.
We would like to acknowledge the principal support of the Mineral Research Institute of Western Australia (MRIWA) under the program M514, co-sponsored by Matsa Resources and Hiseis. For more information on the program, refer to MRIWA M514 project report: Novel seismic methodologies for exploration of mineral resources in a hypersaline environment, 2018-2020. https://www.mriwa.wa.gov.au/research-projects/project-portfolio/novel-seismic-methodologies-for-exploration-of-mineral-resources-in-a-hypersaline-environment/
We thank Haliburton for providing seismic data processing package (SeisSpace).
Some support has also been provided by MinEx Corporative Research Centre, sponsored by the Australian Government.
References
Correa, J., Egorov, A., Tertyshnikov, K., Bona, A., Pevzner, R., Dean, T.,
Freifeld, B. and Marshall, S. [2017a]. Analysis of signal to noise and directivity characteristics of DAS VSP at near and far offsets — A
CO2CRC Otway Project data example. The Leading Edge 36(12), 994-1001.https://www.earthdoc.org/search?value1=J.+Correa&option1=author&noRedirect=true Correa, J, Van Zaanen, L., Tertyshnikov, K., Dean, T., Pevzner, R. and
Bona, A. [2017b]. DAS Versus Geophones: a Quantitative Comparison of a VSP Survey at a Dedicated Field Laboratory, Fourth EAGE
Borehole Geophysics Workshop. Daley, M. Freifeld, T., Ajo-Fanklin, M.J. and Dou, S. [2013]. Field testing of fiber-optic distributed acoustic sensing (DAS) for subsurface seismic monitoring, The Leading Edge, 699-706. Freifeld, B.M., Pevzner, R., Dou, S., Carrea, J, Daley, T.M, Robertson, M, Tertishnykov, K, Wood, Ajo-Franklin, T.J., Urosevic, M. and Gurevich, B. [2016]. The CO2CRC Otway Project deployment of a Distributed Acoustic Sensing Network Coupled with Permanent
Rotary Sources, 78th EAGE Conference and Exhibition, V1, 1-5. Hartog, A. [2018]. An introduction to distributed optical fibre sensors, series in fiber optic sensors. FL, USA: CRC Press Taylor & Francis
Group. ISBN 9781138082694. Issa, N., Roelens, M.A.F. and Frisken, S.J. [2020]. Distributed optical sensing systems and methods, US Pattent App. 16/633,706. Malehmir, A., Durrheim, R., Bellefleur, G., Urosevic, M., Juhlin, C.,
White, D. J., Milkereit, B. and Campbell, G. [2012]. Seismic methods in mineral exploration and mine planning: A general overview of past and present case histories and a look into the future: Geophysics, 77, 173-190. Milkereit, B., Berrer, E.K., King, A.R., Watts, A.H., Roberts, B., Adam,
E., Eaton, D.W., Wu, J. and Salisbury, M.H. [2000]. Development of 3-D seismic exploration technology for deep nickel-copper deposits; a case history from the Sudbury Basin, Canada. Geophysics, 65(6), pp.1890-1899. Pretorius, C.C., Jamison, A.A. and Irons, C. [1989]. Seismic exploration in the Witwatersrand Basin, Republic of South Africa: Proceedings
Exploration 87, Third Decennial International Conference on Geophysics and Geochemoical Exploration for Minerals and Groundwater: Special Publication, Ontario Geologic Survey, 3, 241–253. Pretorius, C.C., Muller M.R., Larroque, M. and Wilkins C. [2003]. A review of 16 years of hard rock seismics on the Kaapvaal Craton,in
Eaton, D. W., B. Milkereit, and M.H. Salisbury, eds., Hard rock seismic exploration: SEG, 247–268. Pretorius, C.C., Gibson, M. and Snyman, Q. [2011]. Development of high-resolution 3D vertical seismic profiles: Journal of the South
African Institute of Mining and Metallurgy, 111, 117-125. Sidenko, E., Pevzner, R., Bona, A. and Tertyshnikov, K. [2020]. Experimental Comparison of Directivity Patterns of Straight and Helically
Wound DAS Cables, in Conference Proceedings, 82nd EAGE
Annual Conference & Exhibition, Jul 2020, Volume 2020, p.1-5. Stolz, E., Urosevic, M. and Connors, K. [2004]. Reflection seismic surveys at St. Ives gold mine, WA: Preview, 111, 79. Urosevic, M., Kepic, A., Stolz E. and Juhlin, K. [2007]. Seismic exploration of mineral deposits in Yilgarn Craton, Western Australia:
Proceedings of Exploration 07: Fifth Decennial International Conference on Mineral Exploration, 525-534. Urosevic, M. and Evans., B.J. [2007]. Feasibility of seismic methods for imaging gold deposits in Western Australia, MRIWA Project, 363,
Report #267. Urosevic, M., Kepic, A., Sheppard, S. and Johnson, D. [2008]. Nickel exploration with 3D seismic – Lake Lefroy, Kambalda, WA:
Post-convention workshop on high resolution seismic methods, 77th
Annual SEG conference, Las Vegas, USA, Chairman. Urosevic, M., Bhat, G. and Grochau M.H. [2012]. Targeting nickel sulfide deposits from 3D seismic reflection data at Kambalda, Australia:
Geophysics, 77,123-132. Urosevic, M., Ziramov, S., Kinkela, J. and Dwyer, J. [2016]. Seismic exploration of mineral resources – an Australian prospective: The first conference on geophysics for mineral exploration and mining,
Proceedings; We Min PO5. Urosevic, M., Bona, A., Ziramov, S., Pevzner, R., Kepic, A., Egorov, A.,
Kinkela, J., Pridmore, D. and Dwyer, J. [2017]. Seismic for mineral resources – a mainstream method of the future: Exploration 07:
Seventh Decennial International Conference on Mineral Exploration,
Toronto, Canada. Urosevic, M., Bona, A., Ziramov, S., Martin, R., Dwyer, J. and Foley, A. [2019a]. Reflection seismic with DAS, why and where?: Near Surface Geoscience Conference & Exhibition, The Hague, Netherlands. Urosevic, M., Bona, A., Ziramov, S., Martin, R., Dwyer, J., Felding, D. and
Foley, A. [2019b]. Seismic prospecting of mineral reserves with DAS, 16th SAGA Biennial Conference and Exhibition, Durban, South Africa. Van Zaanen, L., Bona, A., Carrea, J., Pevzner, R. and Tertyshnikov, K. [2017]. A comparison of borehole seismic receivers, SEG International Exposition and 867th Annual Meeting, in press. Yavuz, S., Freifield, B., Pevzner, R., Tertyshnikov, K., Dzunic, A.,
Shulakova, V., Robertson, M., Daley, T. M., Kepic, A. and Urosevic,
M. [2016]. Subsurface Imaging Using Buried DAS and Geophone
Arrays – Preliminary Results from CO2CRC Otway Project: 78th
EAGE Conference & Exhibition, SBT4-04.


