
Instructions: AIR QUALITY KIT FOR MICRO:BIT V1a


TABLE OF CONTENTS Introduction 2 Parts NotesMonkMakesLearningTroubleshootingPoweringExperimentExperimentExperimentExperimentAirGetting..........................................................................................................................3Started...........................................................................................................4QualityandeCO251.AirQualityMeter...............................................................................62.Thermometer....................................................................................123.AirQualityAlarm............................................................................144.AirQualityDataLogger..................................................................17theAirQualitySensor.............................................................................20.......................................................................................................2122.............................................................................................................23........................................................................................................................24
Page 2
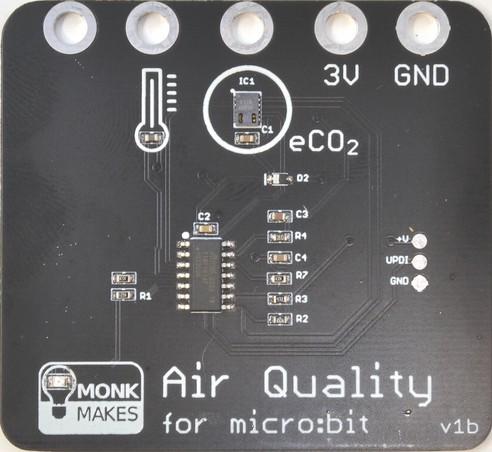
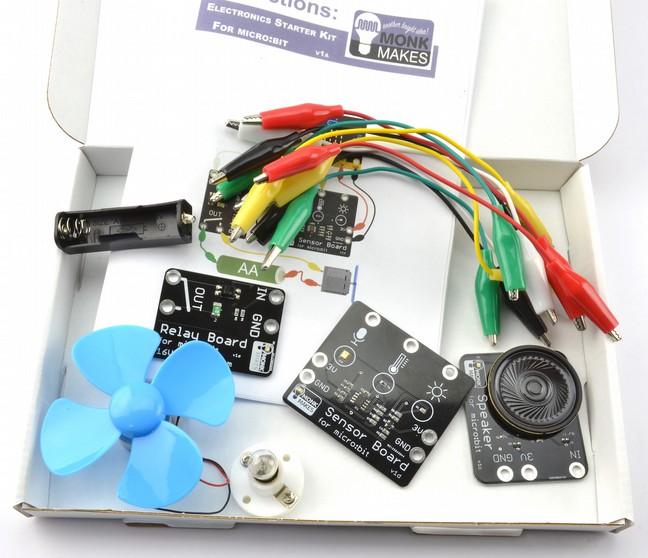
The MonkMakes Air Quality Kit for micro:bit is based around the MonkMakes Air Quality Sensor. This add-on for the BBC micro:bit measures the quality of the air in a room (how stale the air is) as well as the temperature. The outputs of the Air Quality Sensor board are analog (one for temperature and one for eCO2). These outputs can be read by a micro:bit and either displayed (for instance, as an air quality meter) or logged over a period of time for all sorts of interesting experiments. As well as the Air Quality Sensor itself, the kit also includes a set of alligator clip leads to connect it to the micro:bit and also a Speaker for micro:bit that can provide a warning of low air quality.
INTRODUCTION
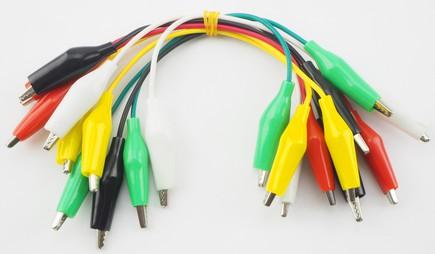
PARTS Please note that a BBC micro:bit is NOT included in this kit. Before you do anything else, check that your kit includes the following items. Air Quailty Sensor for micro:bit Speaker for micro:bit Set of alligator (also called crocodile) clip leads (10 leads) Google Chrome Browser Please note that Makecode and the BBC micro:bit work bets with Chrome as it allows direct download onto the micro:bit and USB communication with the micro:bit. In fact, Experiment 4 will only work with Google Chrome. Page 3
About Alligator Clips
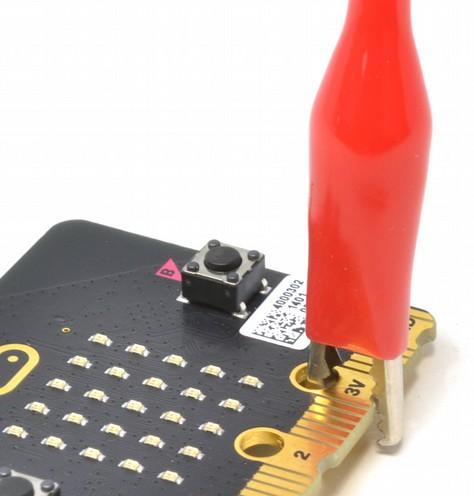
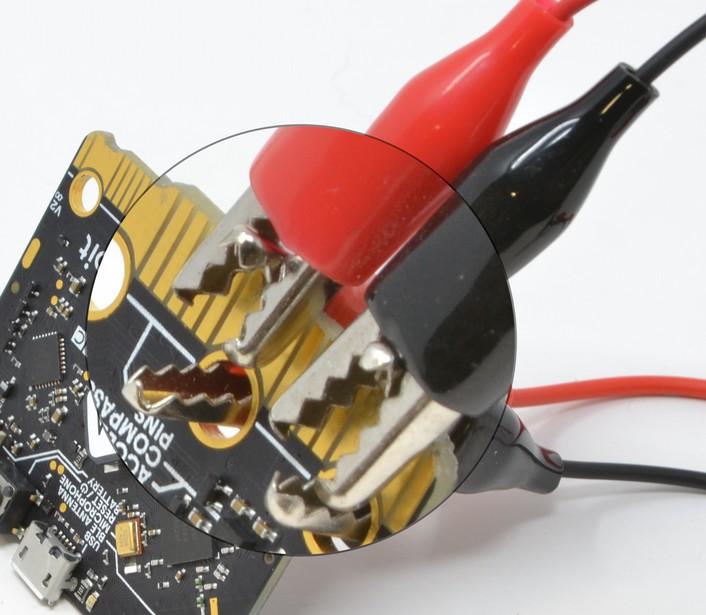
When using the alligator clips to connect your micro:bit to the MonkMakes boards, you have to be a bit careful how you connect the clips at the micro:bit end. The best way is to connect the clips vertically, as shownConnectingbelow.
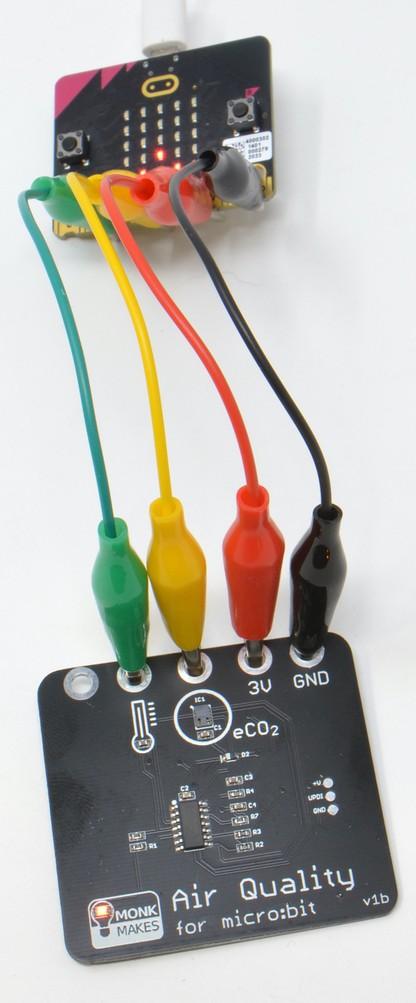
To measure both temperature and air quality, the Air Quality Sensor requires four connections to the micro:bit: GND and 3V (to supply it with power) and two of the other micro:bit rings for the temperature and eCO2 readings. Connect your micro:bit to the Air Quality Sensor as shown here. The yellow lead is connected to micro:bit ring 2 and the green lead to ring 1. It does not matter which colors you use for the leads, but it is a good idea to stick to black for GND, red for 3V and any other colors for the other two leads. This just makes it less likely that you will accidentally connect power the wrong way around – although if you do make that mistake, don't worry, it won't damage the board.
the alligator clips like this prevents any accidental connections between the large ring connectors with the holes in and the much smaller connectors (gold lines in the photo).
Connecting the Air Quality Sensor
Page 4
If you have a version 2 micro:bit, this is easier because it has notches to help keep stop the clip straying.
GETTING STARTED
AIR QUALITY AND ECO2
Level of CO2 (ppm) Notes 250-400 Normal concentration in ambient air.
Page
400-1000 Concentrations typical of occupied indoor spaces with good air exchange. 1000-2000 Complaints of drowsiness and poor air. 2000-5000 Headaches, sleepiness and stagnant, stale, stuffy air. Poor concentration, loss of attention, increased heart rate and slight nausea may also be present. 5000 Workplace exposure limit in most countries. >40000 Exposure may lead to serious oxygen deprivation resulting in permanent brain damage, coma, even death. 5
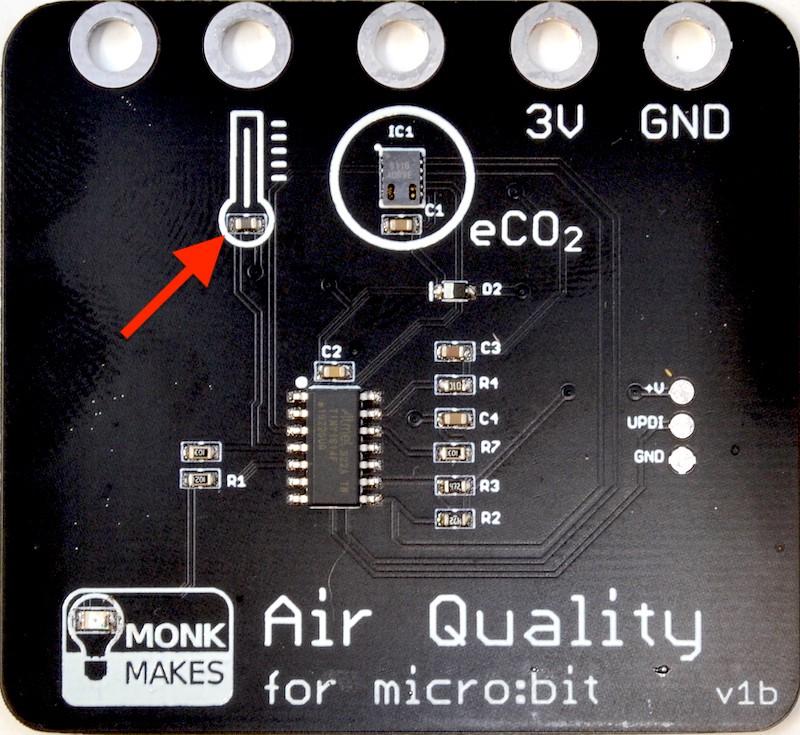
The Air Quality Sensor board uses a sensor with a part number of CCS811. This small chip does not actually measure the level of CO2 (carbon dioxide) but instead the level of a group of gasses called volatile organic compounds (VOCs). When indoors, the level of these gasses rises at a fairly similar rate to the level of CO2 and can therefore be used to estimate the level of CO2 (called the equivalent CO2 or TheeCO2).levelof CO2 in the air we breathe has a direct influence on our well-being. CO2 levels are of particular interest from a public health point of view as, to put it simply, they are a measure of how much we are breathing other people's air. We humans breathe out CO2 and so, if several people are in a poorly ventilated room, the level of CO2 will gradually increase. As will the viral aerosols that spread colds, flus and Coronavirus as people breathe both out together. Another important impact of CO2 levels is in cognitive function – how well you can think. This study (amongst many more) have some interesting findings. The following quote is from the National Centre for Biotechnology Information in the USA: “at 1,000 ppm CO2, moderate and statistically significant decrements occurred in six of nine scales of decision-making performance. At 2,500 ppm, large and statistically significant reductions occurred in seven scales of decision-making performance”
Source: https://www.ncbi.nlm.nih.gov/pmc/articles/PMC3548274/
The table below is based on information from https://www.kane.co.uk/knowledge-centre/whatare-safe-levels-of-co-and-co2-in-rooms and shows the levels at which CO2 can become unhealthy. The CO2 readings are in ppm (parts per million).
Makecode
For the Makecode version just go to this link and the code will appear in the browser. https://makecode.microbit.org/_TcPfHbikr20T Tip: If you download an electronic version of this instructions manual from https://monkmakes.com/mb_cc, you can click on the link above to get the code.
1. AIR QUALITY METER
Page 6
This first project displays the air quality as a bar graph. The more LEDs lit on the display, the lower the air quality. When all the LEDs are lit, this indicates an eCO2 (equivalent CO2) reading of 2000 parts per million. At any time, if you press button A, the micro:bit's display will show the eCO2 reading in parts per million. For more information about what these numbers mean, see the table on the previous page. For this project, you need your Air Quality Sensor to be connected to your micro:bit as shown on page 4. For this experiment, you can use either Makecode or MicroPython to program your micro:bit. We recommend that beginners use Makecode.
EXPERIMENT
the code from your computer to your micro:bit can be done a number of ways. Once set up, the most convenient way is direct from your web browser over USB by Pairing your micro:bit with the browser. This will only work if your micro:bit has a fairly new version of its built-in firmware. So, if the procedure below does not work for your micro:bit, then follow the instructions here (https://microbit.org/getstarted/user-guide/firmware/) to upgrade your micro:bit to the latest version. Its actually very easy to do. You will also need to be able to pair your micro:bit to your browser for Experiment 4. Now, to pair your micro:bit before downloading, click on the menu button (three dots) to the right of the Download button.
Gettinghere.
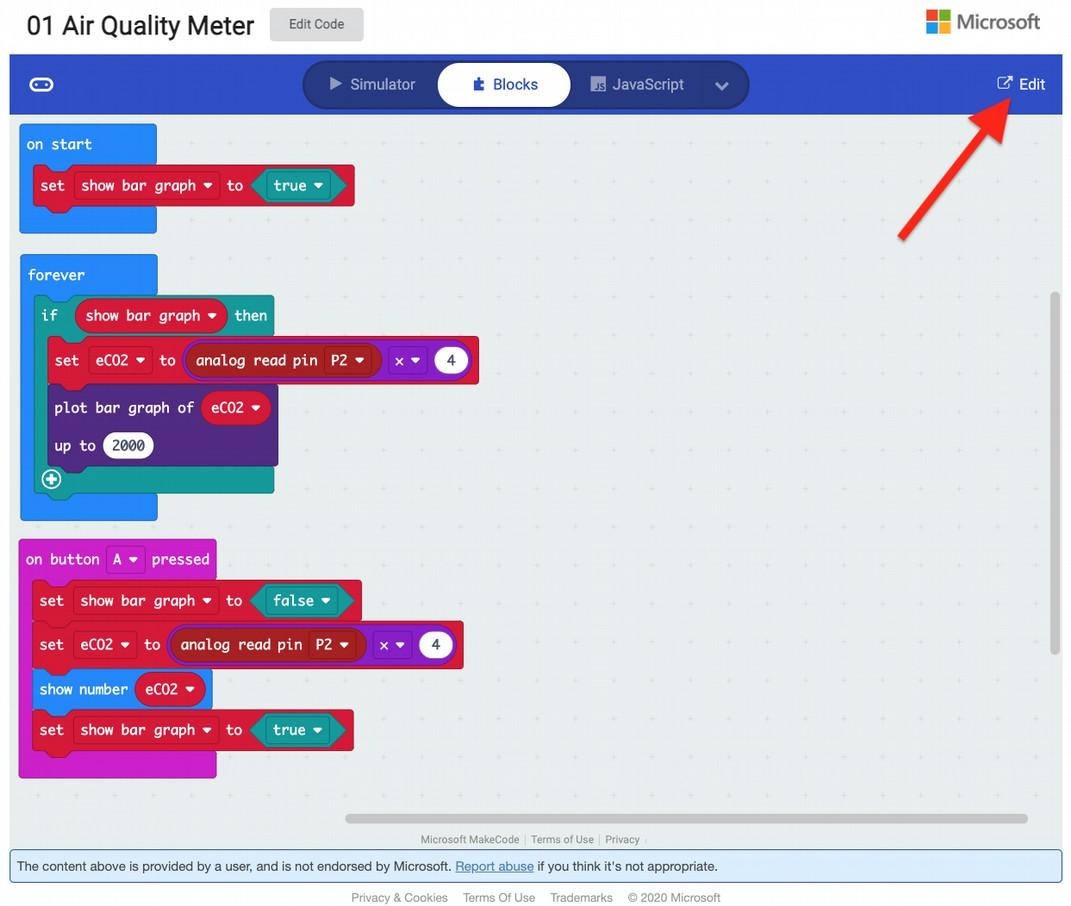
Click on the Edit button and the Makecode editor will open on the project as shown
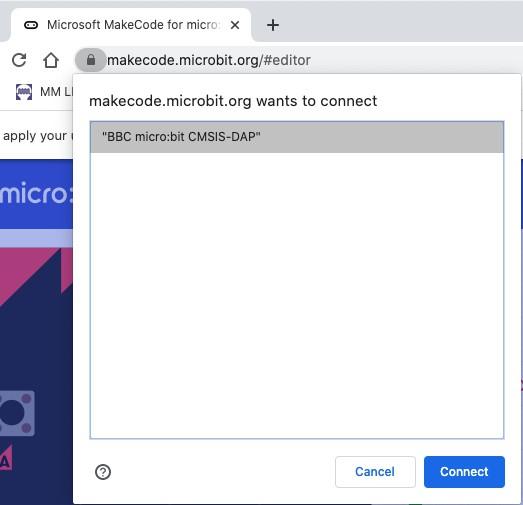
Then click on the Pair device option. This will lead you to a window attached to the padlock symbol on your browser, where you can identify your micro:bit to grant the Page 7

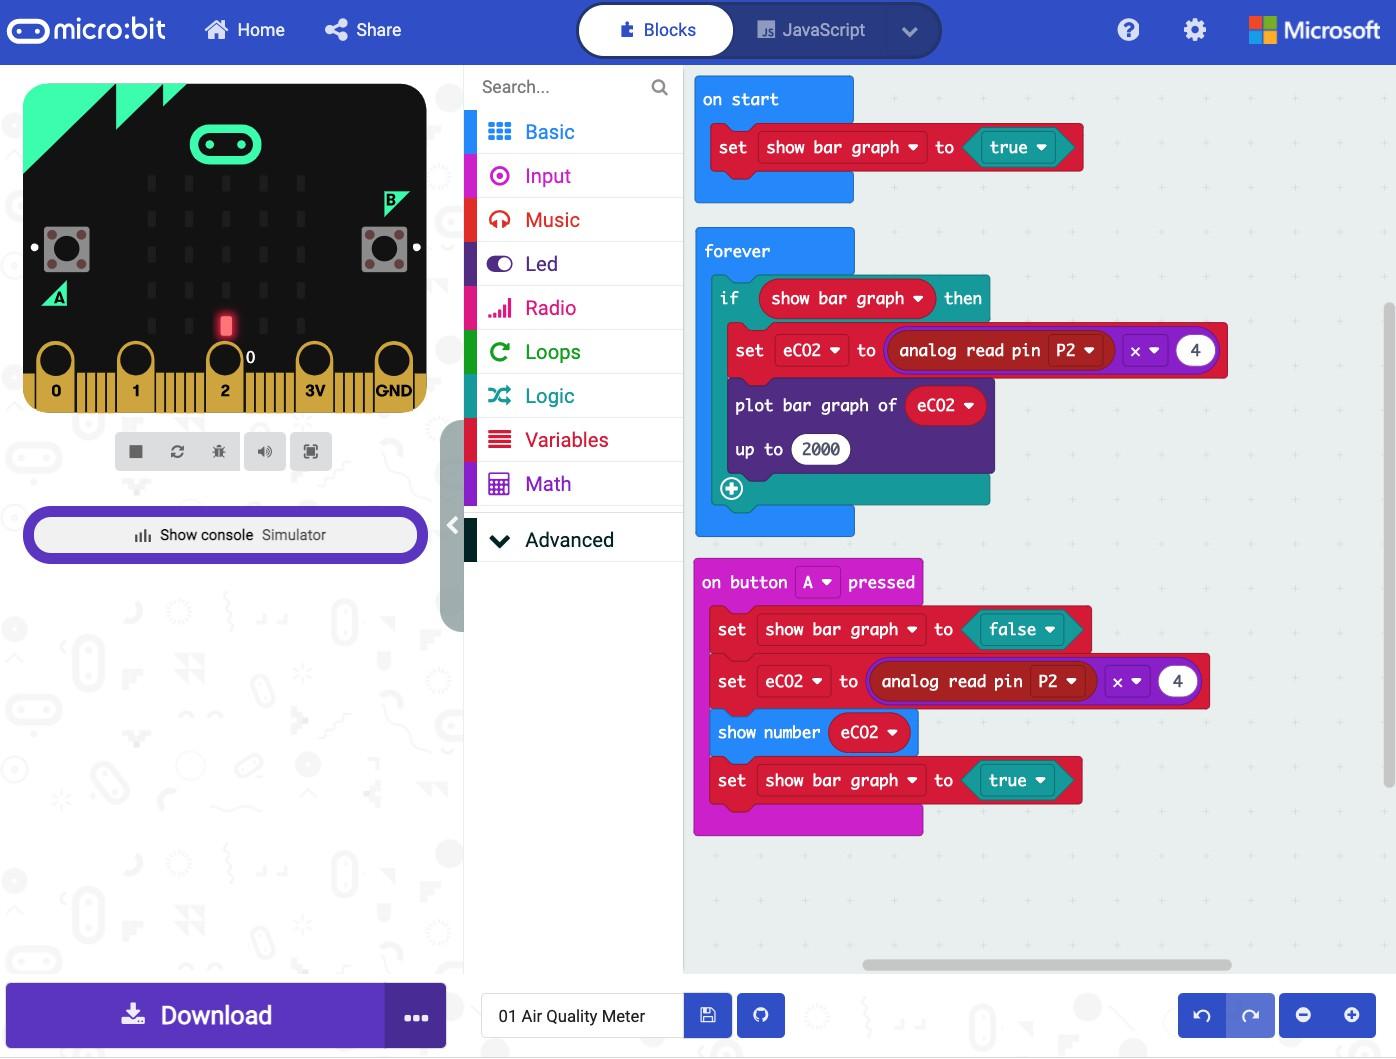
The on start block initialises a variable called show bar graph to true. This variable is used so that when we press Button A to display the current reading we can stop displaying the bar graph so that is does not obscure the number being displayed.
The m:b should now be showing a bar graph of the eCO2 level - probably just the bottom row of lights initially - and, if you breath gently near the sensor, you should see more LEDs light as the eCO2 level rises.
Lets take a quick look at the code:
Makecode editor permission to connect to it over USB by clicking on Connect. The exact name of your micro:bit will differ.
The forever block checks to see if the show bar graph variable is true, and if it is, it first sets the value of a variable called eCO2 to be the analog value read from pin P2 (which will be in the range 0 to 1023) times by 4. This gives a maximum eCO2 reading of 1023 x 4 = 4092 ppm. The plot bar graph of block is then used to display the eCO2 reading up to a maximum of 2000 ppm. When button A is pressed, the variable show bar graph is set to false to disable the bar graph display in the forever block and then the value of eCO2 is calculated and shown on the display. 8
When you click on the Download button it will transfer the program onto your micro:bit and display the message Download Completed!. Next time you want to download a program, it should remember that your micro:bit is paired.
Page
Page 9
MicroPython https://github.com/monkmakes/mb_aq https://python.microbit.org
To fetch all the MicroPython programs for this kit, you will need to download them from the Github website where they are hosted. You will find them here:
To download them, click on the green Code button and select the option Download ZIP. Extract the ZIP archive and you will find a directory containing the python programs for Experiments 1 to 3. There is no MicroPython version of the code for Experiment 4. To get this code into an editor and then onto your micro:bit we recommend that you use the online Python editor for micro:bit at:


Click on the Load/Save button. You can now drag one of the files you downloaded and unzipped into the Load area and it will appear in the editor. Here the file 01_air_quality_meter.py for this project has been loaded. Page 10

Now you just need to transfer the program onto your micro:bit. This involves pairing the micro:bit with your browser just like you would when using Makecode. So click on the Connect button and then select your micro:bit.
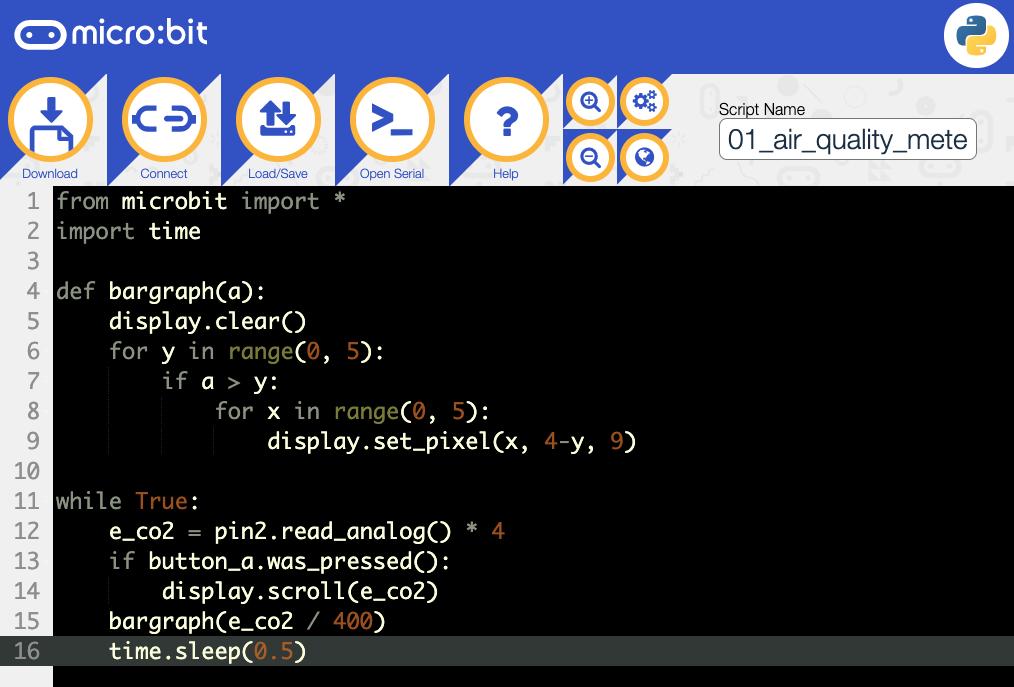
Turning to the code for Experiment 1. The MicroPython version is quite similar to the Makecode version. from microbit import * import time def fordisplay.clear()bargraph(a):yinrange(0, 5): if a > fory:x in range(0, display.set_pixel(x,5): 4-y, 9) whilee_co2True:= pin2.read_analog() * 4 if time.sleep(0.5)bargraph(e_co2button_a.was_pressed():display.scroll(e_co2)/400)
However, the MicroPython library does not have a built in bar graph feature, so this is taken care of by the bargraph function that takes a number between 0 and 5 and lights that number of rows of LEDs. Page 11
Finally to install the program onto your micro:bit click on the Flash button.

EXPERIMENT 2. THERMOMETER
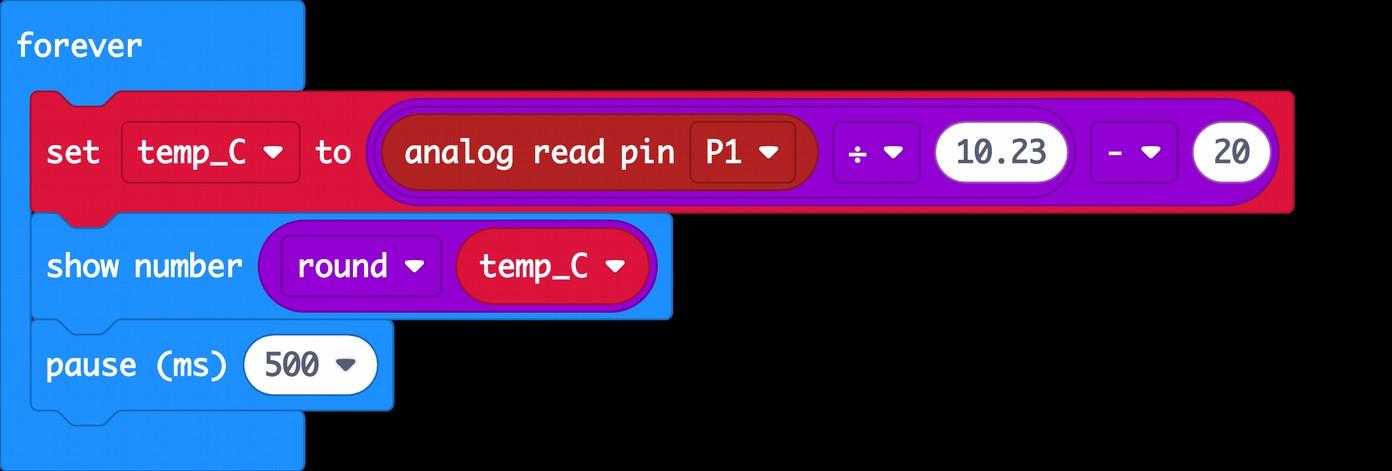
The Air Quality Sensor board contains a temperature sensor that is mainly used to provide the eCO2 sensor with a temperature value that it requires to make its readings more accurate. This temperature reading is also available as an analog output for you to use. We can test this out using the program you will find at this link: https://makecode.microbit.org/_CPqFxUcVeWFa Open this program in the Makecode editor and install it onto your micro:bit as you did for Program 1. This program displays the temperature, refreshing every half second. Put your finger on the temperature sensor to warm it and watch the displayed temperature
Theincrease.formula
for converting the analog reading into a temperature in degrees C is to divide it by 10.23 and then subtract 20. This means that an analog reading of 0 equates to a temperature of -20C and a maximum reading of 1023 equates to a temperature of (1023 / 10.23) – 20 = 80 degrees C. Page 12
Page 13
: Although the temperature sensor can theoretically sense a range from -20C to + 80C, taking your micro:bit and Air Quality Sensor board outdoors may result in them getting wet, which will probably break them. So, this is a kit that is best used indoors.
The temperature reading is only accurate to a couple of degrees C and if you prefer your temperatures in Fahrenheit, then this version of the program will do the conversion for you:
MicroPython
The MicroPython version of the code is listed below. This works just the same way as its Makecode equivalent and is in the file 02_aq_thermometer_c.py. from microbit import * import time whiletemp_cTrue:= int(pin1.read_analog() / 10.23 - 20) time.sleep(0.5)display.scroll(temp_c) There is also a Fahrenheit version of the program called 02_aq_thermometer_f.py.
WARNINGhttps://makecode.microbit.org/_YmwHJ8PhDbKu
EXPERIMENT
3. AIR QUALITY ALARM
To connect both boards to your micro:bit you will need three more alligator clip leads. A second red and black lead to connect power to the Speaker and also a white lead to connect from ring 0 of the micro:bit to the input to the Speaker.
Although the micro:bit version 2 has a built-in speaker, this one's a lot louder. To attach the second red and black leads to the micro:bit, push the original clips well into the rings on the micro:bit, so that enough alligator clip appears underneath the board to clip the new leads onto the original clips.
Page 14
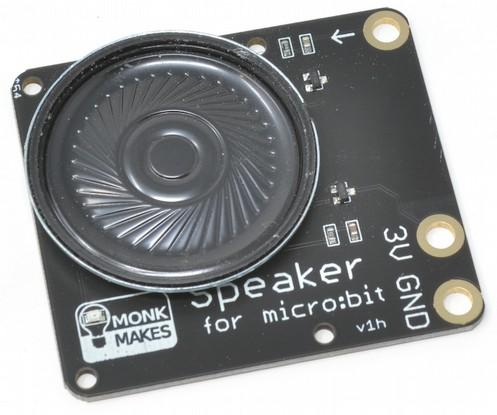
This project combines the Air Quality Sensor board with a MonkMakes Speaker for micro:bit, so that if the eCO2 reading exceeds a certain threshold then an alarm sounds and the display shows an X.
The program uses a variable called max eCO2, which is set to 1500 ppm by default. The if block checks to see if the eCO2 level has been exceeded and, if it has, it displays an X and plays a warning tome through the speaker.
The Makecode block program is based on the Program 1 and you can find it here: https://makecode.microbit.org/_JgHcLqbap8eX
Page 15

The MicroPython version of the program is 03_aq_alarm.py. This uses the same bargraph function as Experiment 1, but this time in the while loop, the current cCO2 reading in the variable e_co2 is compared with max_eco2 and if the limit is exceded the X (No) image is displayed and a musical note of frequency 196Hz is sounded for 500 milliseconds (half a second). from microbit import * import time import defmax_eco2music=1500bargraph(a):display.clear()foryinrange(0, 5): if a > fory:x in range(0, display.set_pixel(x,5): 4-y, 9) whilee_co2True:= pin2.read_analog() * 4 bargraph(e_co2 / 400) if e_co2 > time.sleep(0.5)music.pitch(196,display.show(Image.NO)max_eco2:500)
MicroPython
Page 16
EXPERIMENT 4. AIR QUALITY DATA LOGGER
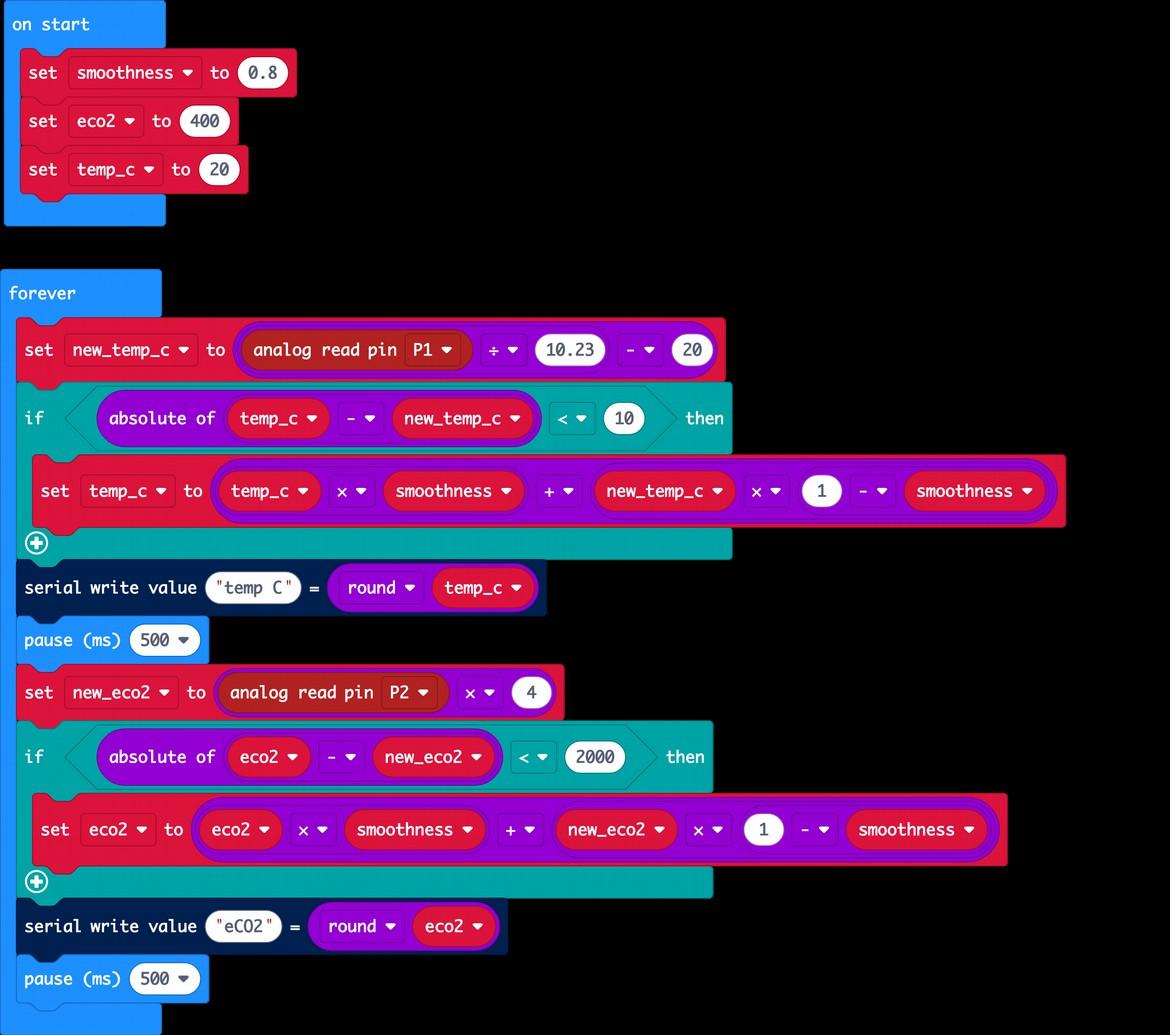
This program uses the Makecode Console plotter feature to provide a real-time display of changes to temperature and eCO2 readings. These readings can also be saved to a spreadsheet. This means that you could leave the project running overnight in your room and see how the temperature and eCO2 levels change overnight. For this project to work, you must pair it with your browser. If you have not done this yet, please refer back to Experiment 1. Here's the link for the Makecode program: https://makecode.microbit.org/_D245rmWmg8Yw
Page 17
If you are successfully paired, you should see a new button on the editor called Show Console Device. When you clock on this the real-time plot of your data should appear.

The Code
The code takes a bit more effort with the sensor readings than the previous programs, using a software filter to smooth out the readings.
You can export the data that has been logged onto your computer by clicking on the Export Data button. This will open the data in a spreadsheet for you.
Page 18


The program achieves its smoothing of the data by using a kind of rolling average of the readings controlled by a variable called smoothness. This value should always be less than 1 and typical useful values are between 0.7 and 0.95. The way it works is that each time a reading is taken (lets say an eCO2 reading) the variable eco2 is set to be the smoothness times the old reading, plus (one minus smoothness) times the new reading. So, if smoothness is 0.8 then when the reading is updated, it will comprise 80% of its current value plus just 20% of the new Onereading.effect of this type of filtering (called low-pass filtering) is that it will take a while for reading values to settle after a change. So, holding the temperature sensor or breathing on the CO2 sensor will take longer to have an effect on the values being Thelogged.filtering also weeds out rogue readings that may occur from time to time by ignoring values that jump very suddenly. In the case of temperature sudden jumps of over 10 degrees are ignored as are changes of eCO2 reading by 2000 or more. This is called removing outliers. The values are sent to the browser using the serial write value blocks. Page 19
POWERING THE AIR QUALITY SENSOR
If you want to power the project for a long period of time without an USB connection, then you can use a MonkMakes Power for micro:bit (pictured below) with an AC adaptor.
You can also use a MonkMakes Charger for micro:bit (also pictured below) that provides a steady output voltage using a rechargeable LiPo battery that charges using a USB lead.
You can find out more about these micro:bit accessories here: https://monkmakes.com/mb_power and here: https://monkmakes.com/mb_charger
Page 20


Solution: You need to update the firmware on your micro:bit by following the instructions here: https://microbit.org/get-started/user-guide/firmware/
Solution: Rapid blinking of the orange power LED in the MonkMakes logo indicates that there is an internal problem with the sensor IC. This may occasionally happen when connecting the Air Quality Sensor to your micro:bit. If you disconnect the red alligator clip lead from the Air Quality Sensor, and then connect it again, this should cure the problem and the LED should light without blinking.
Page 21
Problem: I can't get any readings of Air Quality and the power LED in the MonkMakes logo isn't lit.
Problem: The power LED in the MonkMakes logo is blinking rapidly. What's going on?
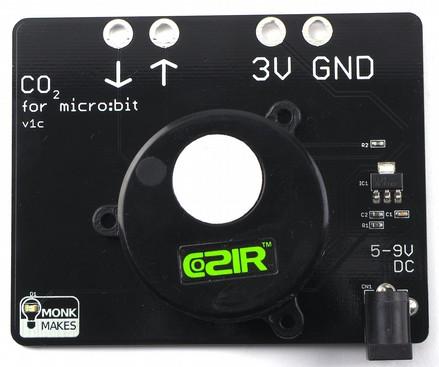
Solution: That's to be expected. The Air Quality Sensor estimates the CO2 concentration (that's what the 'e' is for in eCO2). If you want true measurement of the CO2 concentration then you should use the MonkMakes CO2 Sensor for micro:bit shown here. However true CO2 measurement comes at a price.
Problem: I'm trying to run Program 4, but there is no option on the Makecode editor to Pair with my micro:bit.
Problem: I'm comparing the readings from this sensor with a true CO2 meter and the readings are different.
Solution: The type of sensor used in the MonkMakes Air Quality Sensor, will start producing readings from the first time you connect it. However, the readings will become more accurate with time. The datasheet for the sensor IC suggests the readings will only start to become accurate after 20 minutes of running time.
Solution: Make sure that you have the 3V and GND connections between the micro:bit and the Air Quality Sensor the right way around (see page 5). Also make sure that there is power to your micro:bit.
Problem: I've just connected everything up, but the eCO2 readings seem wrong.
TROUBLESHOOTING

micro:bit Programming
LEARNING
If you want to learn more about programming the micro:bit in MicroPython, then you should consider buying Simon Monk's book Programming micro:bit: Getting Started with MicroPython, which is available from all major book sellers. For some interesting project ideas, you might also like micro:bit for the Mad Scientist from NoStarch Press. You can find out more about books by Simon Monk (the designer of this kit) at: http://simonmonk.org or follow him on Twitter where he is @simonmonk2
Page 22


For more information on this kit, the product's home page is here: Ashttps://monkmakes.com/mb_aqwellasthiskit,MonkMakesmakes
kits
all sorts of and gadgets to help with your maker projects. Find out more, as well as where to buy here: Youhttps://www.monkmakes.com/productscanalsofollowMonkMakesonTwitter
@monkmakes. Page 23 Electronics Starter Kit for micro:bit CO2 Sensor for micro:bit Power for micro:bit
MONKMAKES

NOTES Page 24
