
GROW GUIDE



A NOTE FROM OUR CEO
Front Row is excited to share our latest publication, The Grow Guide, with all of you. We poured our commercial cultivation experience, research and years of fertilizer manufacturing into this curated collection. Our goal, through evidence-based insights and research-driven practices, is to enhance your cultivation expertise.
As your fertilizer partner, we provide comprehensive operations and systems support while offering educational resources and access to expert advice.
We founded Front Row to provide cultivators unparalleled customer service through the industries most effective, highest quality fertilizers.
Stay tuned for more exciting things from Front Row Ag. Let’s keep pushing boundaries, sharing knowledge, and leading the way in cannabis cultivation.

Matthew Curran, CEO, Front Row Ag

WHO WE ARE

Matthew Curran Chief Executive Officer
Matthew Curran founded Front Row Ag in 2018 after years of exhaustive development and formulation of the Front Row 3-Part.
From caregiver to licensed commercial cultivator, Matthew has over 16 years of cultivation expertise in 3 countries, 16 states, 40+ operations, and millions of sq.ft. of canopy. This includes equity roles, executive and C-suite roles, and daily operations.
Curran Graduated from Colorado State University with a degree in Floriculture, his training ranged from agronomy to chemistry.


Egan O’Keefe Co-Founder
Egan O’Keefe, from Loveland, CO, joined the industry in 2008. He co-founded Calvin and Krebs Management Services in 2016 with Matt. In 2018, they launched Front Row Ag fertilizer line.
Egan helped Harvest Health and Recreation grow, leading to its 2021 acquisition by Trulieve.
Now at Story (a national MSO) as Director of Cultivation, he supports Front Row with industry expertise and connections.

Patrick Kanzler CEO of Solstice Ag
Patrick Kanzler’s journey in the cannabis industry catapulted him from managing a grow store in in 2007 to managing distribution for top fertilizer brands.
He launched Humboldt’s first cannabis vape brand in 2013 and his knack for spotting trends led to partnering with Front Row Ag as their exclusive distributor in 2019.
His background in managing cultivation supply chains and marketing top nutrient brands uniquely positions him for success as the exclusive distributor of Front Row Ag.

Zack Vondrak VP Sales, Solstice Ag
Zack Vondrak has an extensive history of managing sales relationships across the globe - adapting and evolving with the many changes in the industry.
His passion and tenacity has helped successfully launch several fertilizer brands. In the early 2000’s he was the top-performing sales rep in specialized fertilizers.
He has over a decade of experience with both liquid and soluble fertilizer sales.

MEET THE TEAM
The Front Row Ag and Solstice Ag team brings extensive commercial cultivation experience.
As current and former cultivation managers and executives, we understand challenges intimately and leverage operational experience for customers. Customers benefit from our team’s experience managing our own facilities as well as the several millions of square feet of canopy we’ve toured and advised.
Solstice Agriculture is the exclusive worldwide distributor for Front Row Ag. Solstice Ag handles sales, marketing and logistics for Front Row Ag products. Solstice has been a distributor of dry soluble fertilizers since 2015. Together the two companies work as one team to provide the best products and services in the industry.


WHAT WE DO

At Front Row Ag, we are more than just a fertilizer company; we are your dedicated nutrient partner.
Our mission is to empower cultivators with the tools, technology, and information they need to achieve success in every square foot of their cultivation efforts.
With years of experience in the industry, we understand the challenges you face and are here to support you every step of the way.
PREMIUM QUALITY AND CONSISTANT PRODUCTS
We pride ourselves on using the highest grade inputs to ensure consistency and reliability in our products. Our commitment to quality control is paramount, and our on-site lab allows us to maintain the rigorous standards that our partners expect.
This dedication ensures that you receive products that perform consistently, allowing you to focus on what you do best—cultivating excellence.
SUPPLY CHAIN AND MANUFACTURING
Front Row Ag empowers you with a secure supply chain sourcing only premium inputs and holding years of raw materials.
Our strategic blending partner offers you unfettered access to hydrology and analytical lab services. These on-site lab services ensure every lot meets our exacting standards.

DEDICATED ACCOUNT MANAGEMENT
At Front Row Ag, we believe in building strong, lasting relationships with our clients. Our dedicated account management team and crop advisors are here to provide personalized support tailored to your unique needs.
Whether you have a question about our products or need advice on optimizing your nutrient strategy, our team is always ready to assist.
“
Front Row Ag is your fertilizer partner and crop consultant. Our decades of combined, industry experience allows us to provide unparalleled customer service that helps cultivators maximize quality, yield, and exceed their next benchmark. We have consistently improved results for operators all over the globe.”
Formulator and CEO, Matthew Curran

EMPOWERING CULTIVATORS
We are committed to empowering cultivators by providing access to cuttingedge technology and comprehensive information. Our goal is to equip you with everything you need to maximize your yield and quality. This includes access to our partner network covering all aspects of cultivation operations.
By partnering with Front Row Ag, you gain a trusted ally invested in your success.
Join us and experience the difference of working with a partner who truly understands and supports your cultivation journey.
OUR SUPPORT SERVICES FOR COMMERCIAL CUSTOMERS

“nothing short
of excellent”
“Their customer service is amazing!”
Sq.Ft. Canopy Served Annually
“Quick to respond and value the relationship we have built. 10 out of 10”
“Super knowledgeable and always available to help. A true asset to my business.”
Nick Hadden, Leela Herb Co.
Shane, BeWell



Helping You Thrive & Surpass Your Goals
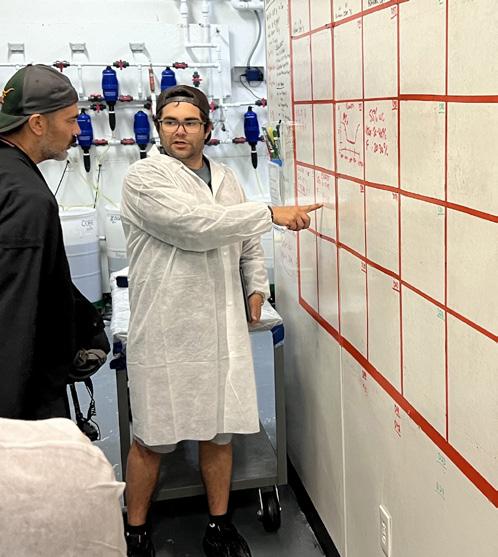
Front Row Ag offers comprehensive support services, including fertilizer usage estimation, KPI analysis, and onboarding for new and conversion customers. We provide water and mineral analysis at our Hydrology and Technical Lab. Our dedicated account managers and crop advisers provide continuous tech support, remote crop steering data reviews, and access to our partner network. We cater to any size or type of operation, providing handson support for licensed commercial cultivators and educational content for all. Customization is key; our team reviews your facility’s processes and limitations to offer tailored feedback on implementing Front Row Ag practices. Our approach to optimizing $/sqft/ day helps maximize your facility’s revenue, efficiency, and profitability. Our product performance has led to
multiple cannabis cup winners and increased thousands of cannabis brands quality, making sure they are on the Front Row of dispensary shelves across the globe.
We believe in continuous improvement and are constantly working to innovate new products that deliver agronomical value. Front Row Ag has expanded into international markets and continues to deliver tremendous value to established and emerging markets through education platforms like the Front Row Ag Certified Program.
Learn more about the Front Row Ag Certification Free Online Course at Frontrowagcertified.com
MORE RESOURCES

Stay Informed with Our Blog
and Certification Courses
At Front Row Ag, we understand how important it is for cultivation facilities to have well-trained, knowledgeable staff. That’s why we continually publish comprehensive educational resources and host our Certified Technician training course. (See pg. 114.) Our free online Technician Course gives you the essential Front Row Ag fertilizer information to thoroughly train new hires or improve the skills of current employees. Taught by Front Row Ag experts, the course covers essential topics like nutrient mixing, fertigation systems, runoff analysis, and more. Upon completion, your staff will have a solid technical foundation and be certified
in proper deployment of Front Row fertilizers.
Rather than spending hours creating your own materials or flying staff elsewhere for training, you can access our resources anytime from any device.
In addition to the Technician Course, we regularly publish new articles on our industry-leading blog. Written by top cultivation specialists, these in-depth reports break down the latest advances in hydroponics, cultivation management strategies, nutrient formulation updates, and more. Commercial cultivators also receive access to an exclusive library of resources. Apply for a commercial account today to learn more!
Get Connected To Our Industry Partners
Access our robust affiliate network of businesses that can support every aspect of your cultivation operation.
Apply for a commercial account today!

Check Plant Health with Leaf Tissue Testing
Set your team up for success with Front Row Ag onboarding. We offer leaf tissue testing to commercial customers to maximize crop health. Deploy best practices through your custom water test using our hydrology lab, and ensure every crop is fed with precision with our batch-to-batch mineral analysis.
Front Row Ag starts our relationships by testing customer water. Typically including but not limited to pre-filtered source water, filtered irrigation water, and irrigation water from zones. Our hydrology professionals identify filtration recommendations, ions of risk, bacteria and mold potential with treatment plan, plus outline best use practices for deploying Front Row Ag.
Your operation is unique. Leaf tissue testing enables you to exceed your goals by establishing baselines, relating data to environmental performance, and identifying areas to improve crop nutrition. Front Row Ag provides professional plant tissue analyses and recommendations to all our cultivator customers. Our proprietary testing processes establish a site-specific, nutrient management program improving crop performance harvest after harvest.
Front Row Ag manufacturing includes a robust Mineral Analytical Lab. On arrival, all our premium sourced inputs are tested for purity, guaranteed analysis, and are sorted. Every sub-batch of a larger lot is sampled and tested while each ingredient is added to blend to specification versus minimum guaranteed analysis. This means your fertilizer doesn’t vary in EC and provides unwavering performance.
Be proactive early through laboratory testing, it is key to avoiding more serious deficiencies down the line. It helps optimize harvest yields and quality. These reports also provide a record over time so you can monitor progress.
Don’t gamble with your crops’ health when Front Row Ag analysis services are an affordable way to check for issues. Our certified labs and accredited staff are here to support your growing operation’s success. Rely on data as part of an integrated nutrient management plan for top-tier results crop after crop.

OUR PRODUCTS


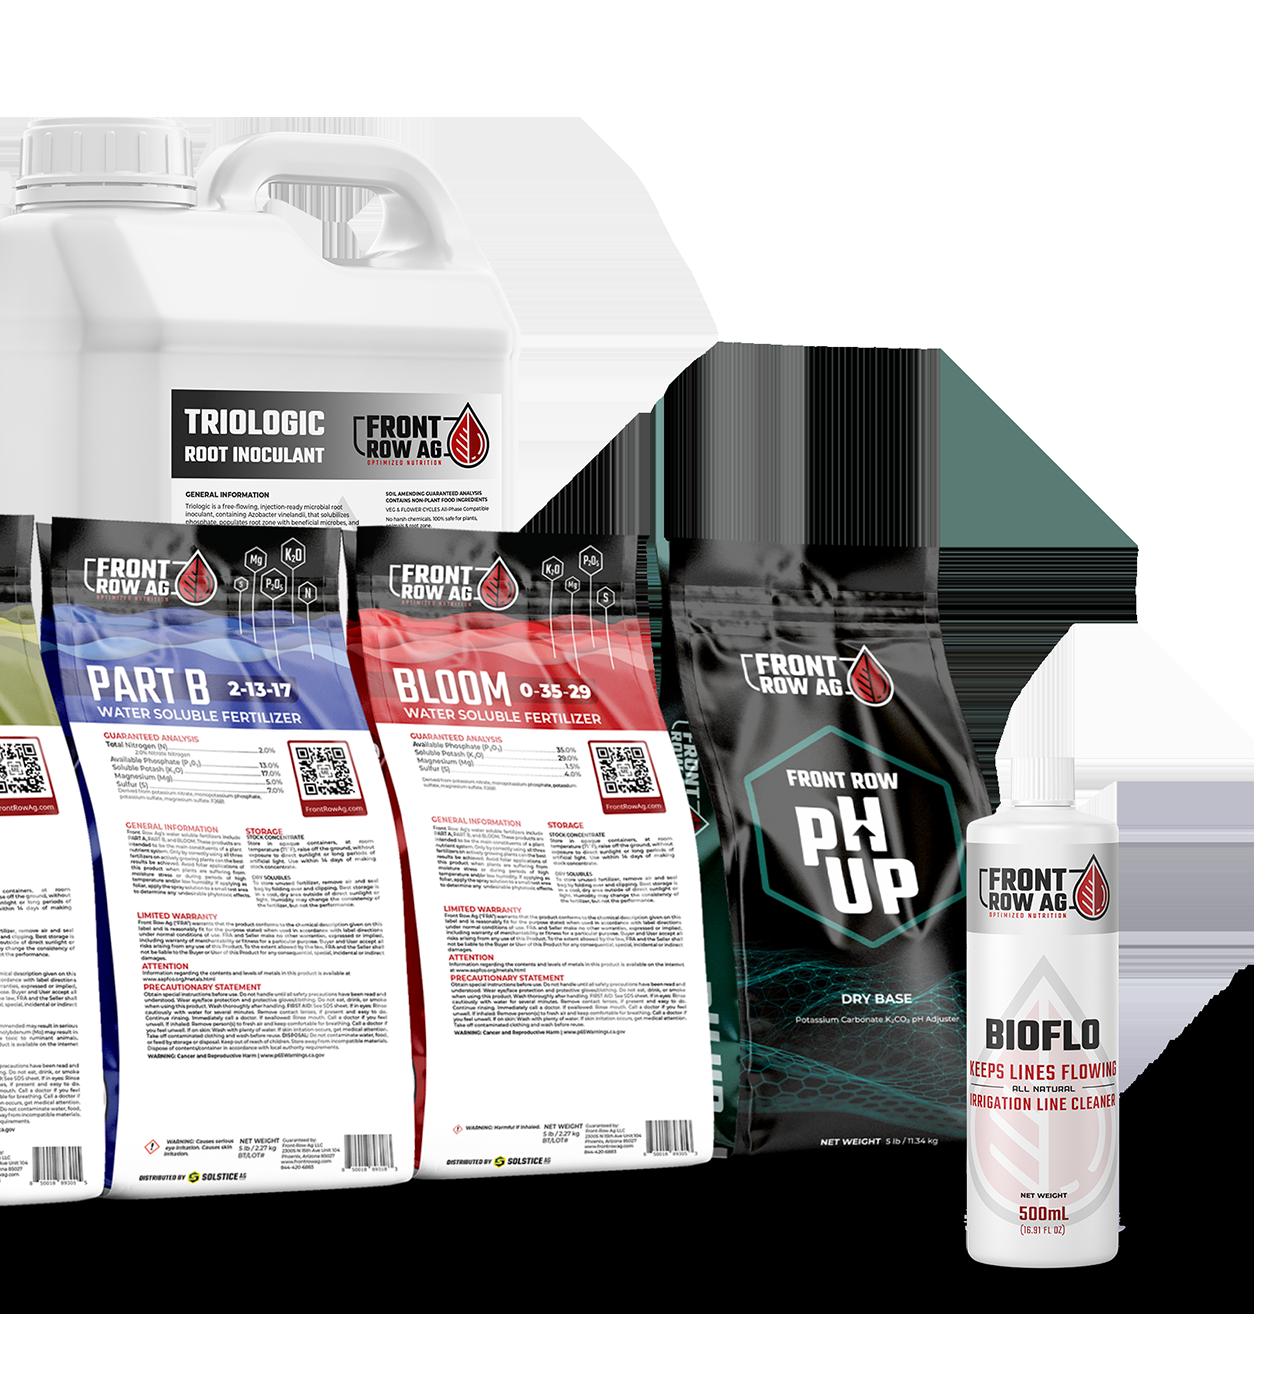

A/B/BLOOM
3-PART DRY SOLUBLE FERTILIZER
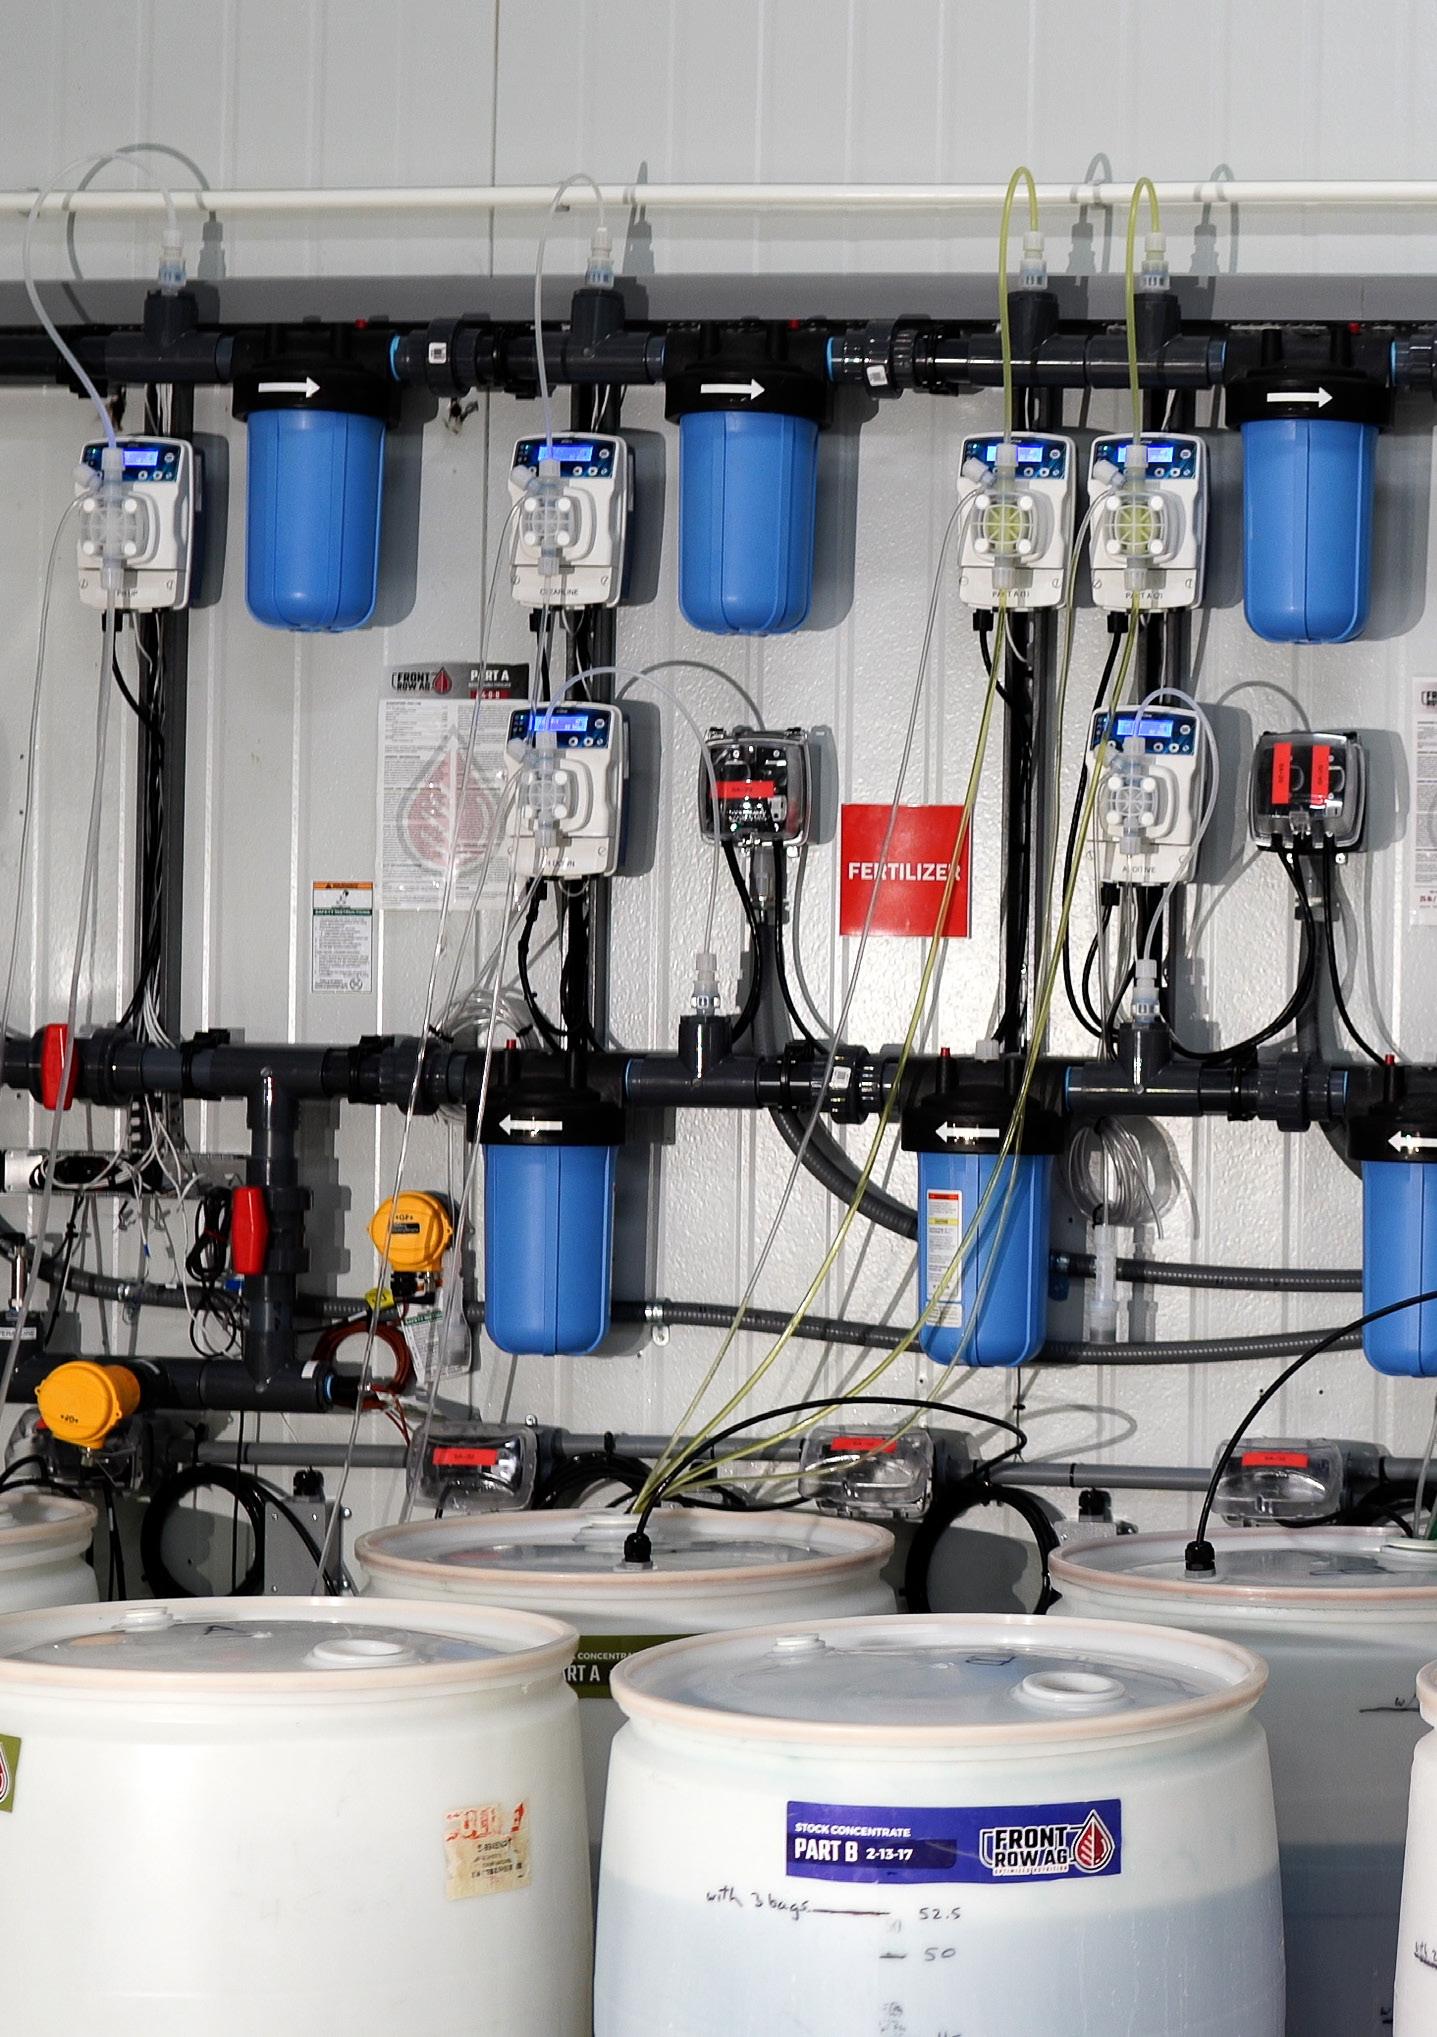
Front Row Ag’s three-part system creates a complete, balanced nutrient profile through the interaction of Part A, Part B and Bloom.
The ratios of these components can be adjusted to influence growth patterns, support specific developmental phases, enable precise crop steering and optimize plant responses.
Part A maximizes morphology, aromatics, and potency with a robust and diverse micronutrient package complimented by perfect quantities of calcium and nitrogen.
“
We like that their 5-phase recipe tapers nitrogen over the plant life cycle. Our trial run of A/B/Bloom outcompeted our dialied-in comparison run of a competitor product line. That’s why we switched.”
Lead Cultivator, Montana, Front Row Ag Client
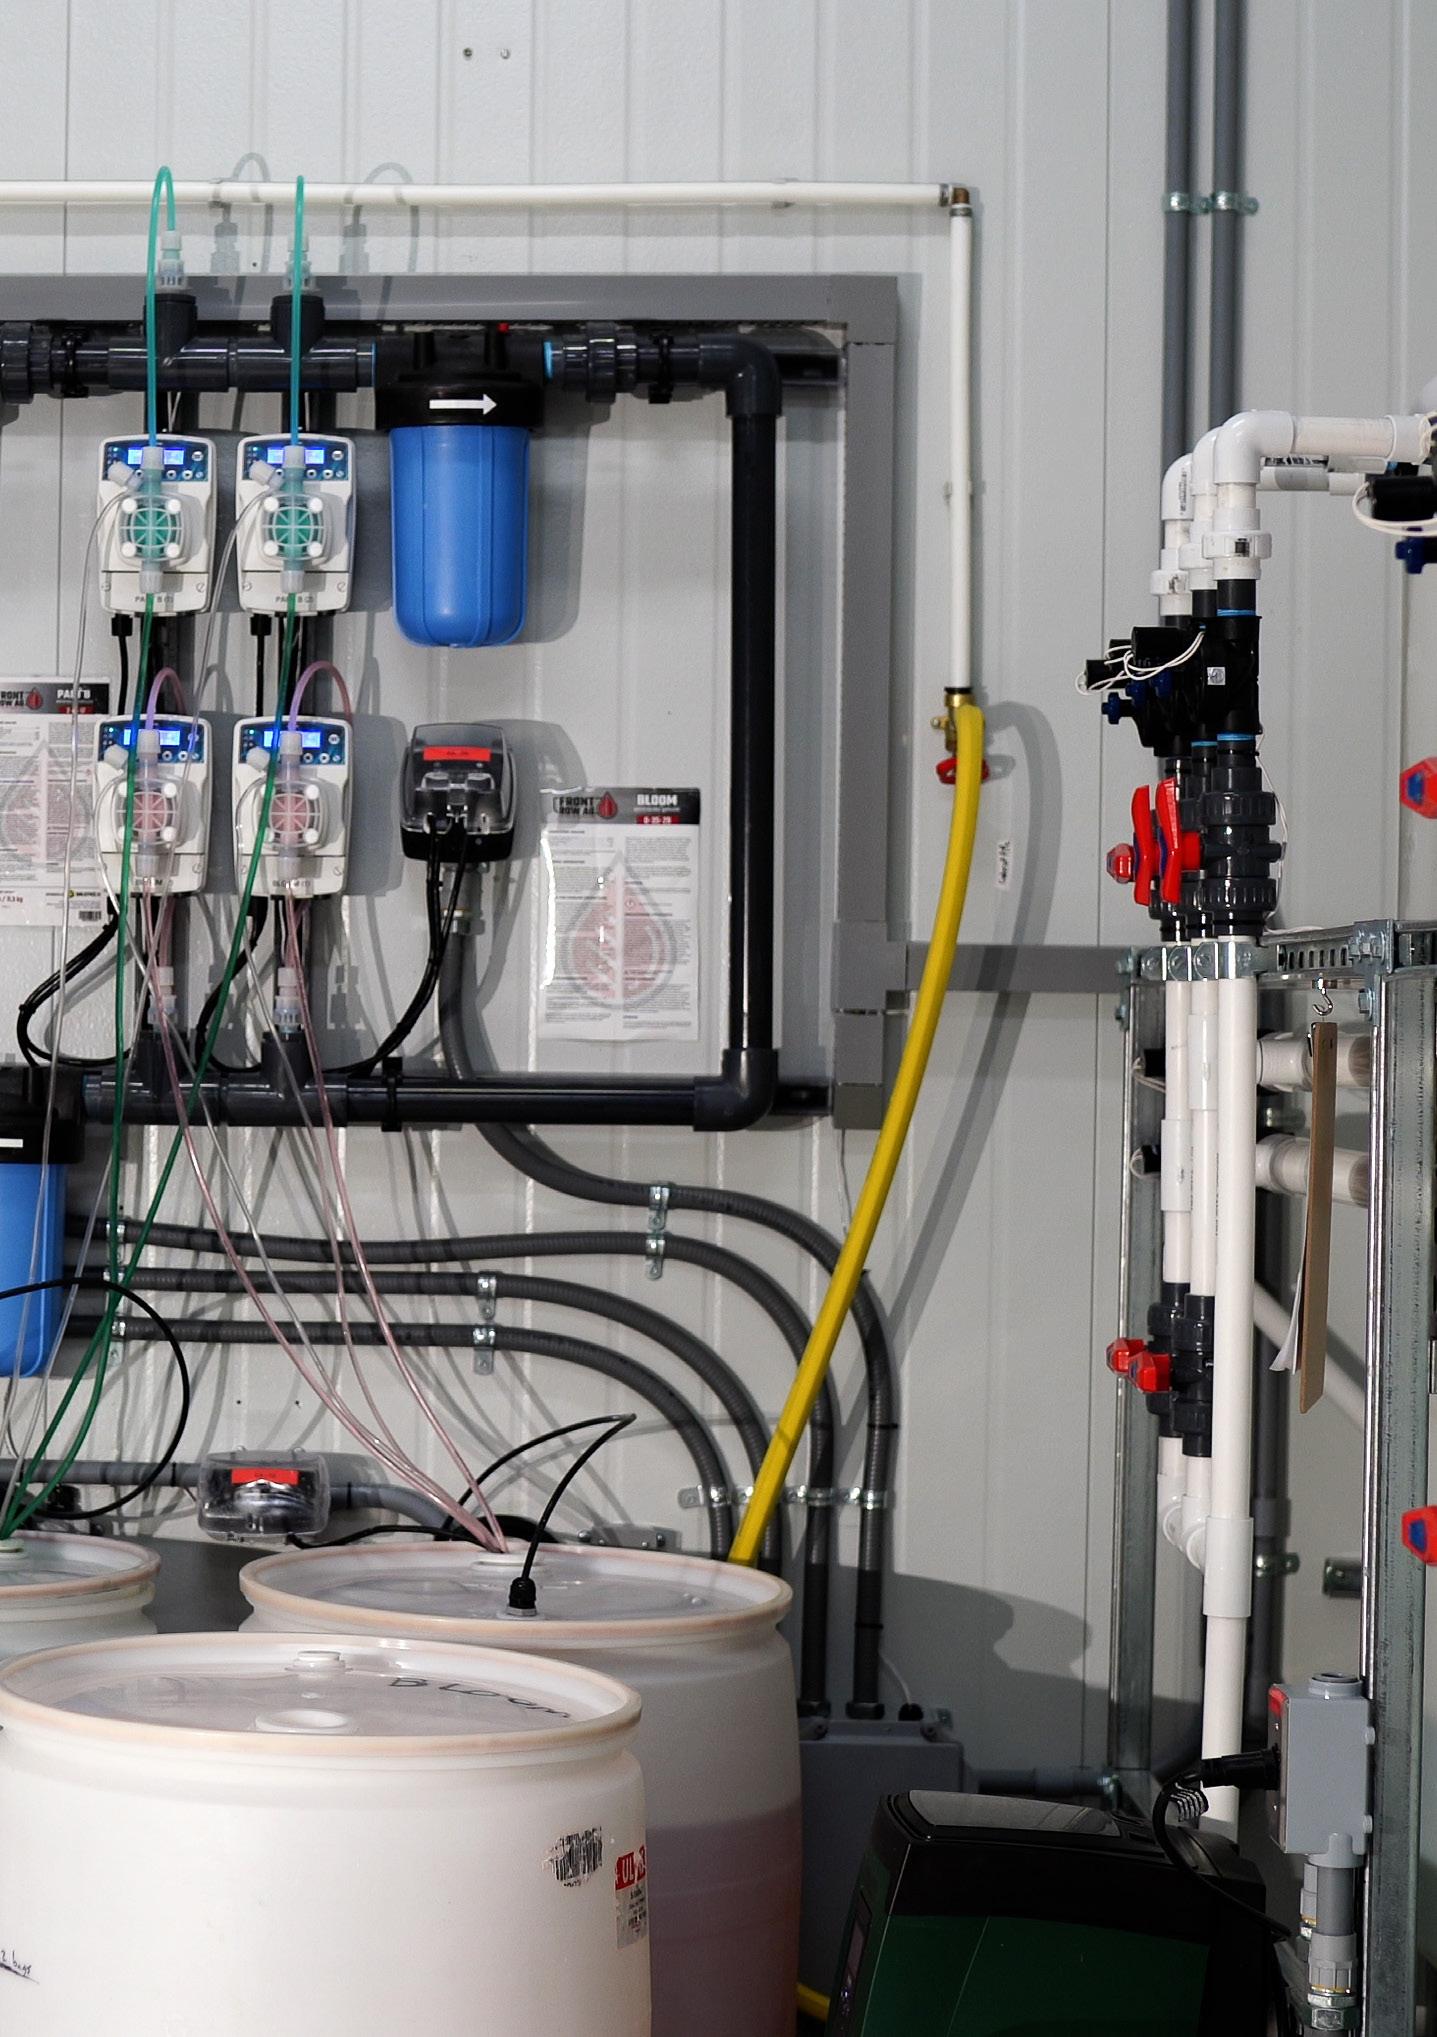

Part B optimizes photosynthesis with high magnesium concentrations, while sulfur, potassium and phosphorus set a foundation for high performance flowering.
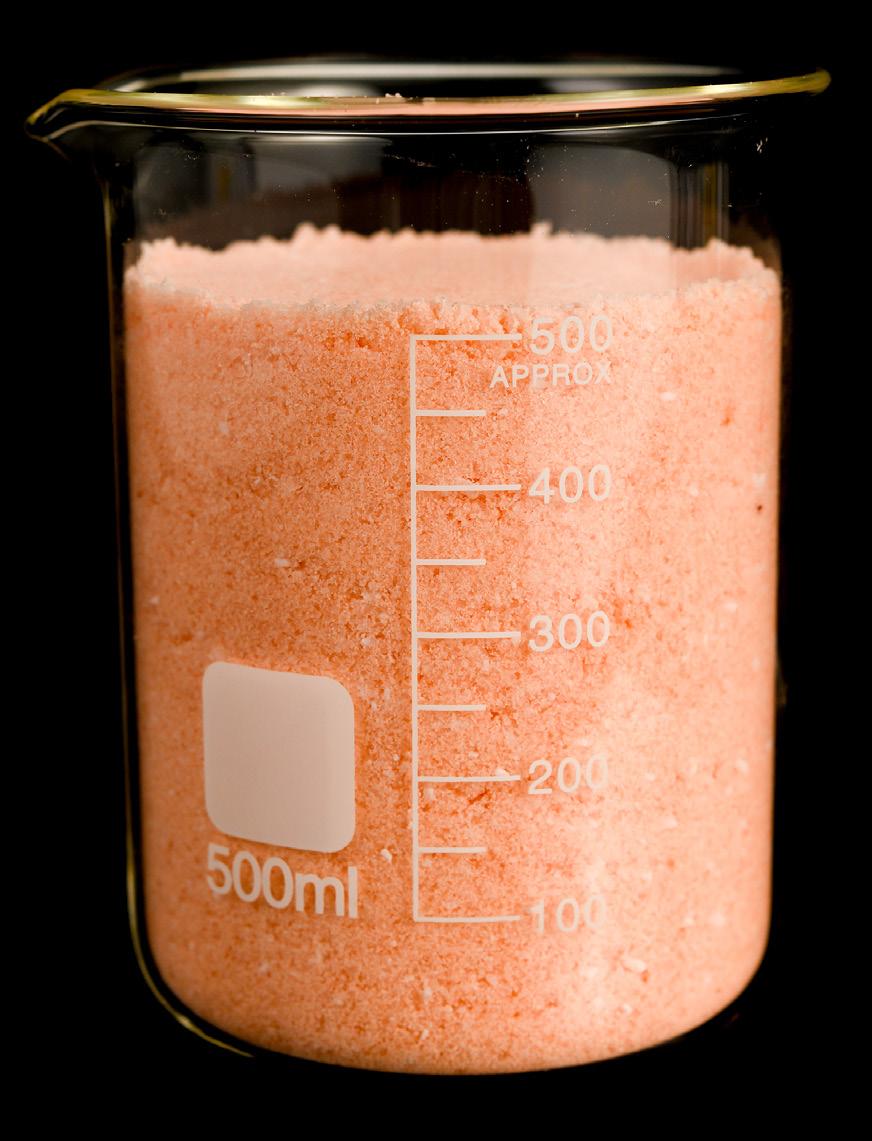
Bloom transitions metabolism from veg to flower by enhancing magnesium ratios and giving generative cues with boosted levels of potassium, phosphorus and sulfur.
A/B/BLOOM
GUARANTEED ANALYSIS DATA FOR REFERENCE
We know that you need to know what you are feeding your plants.
Here’s why our customers choose Front Row Ag:
ITS CONSISTENT
Our stringent quality assurance ensures that every batch meets the highest standards, so you never have to worry about inconsistencies.
YOU CAN COUNT ON IT
With our robust supply chain, even a global pandemic can’t disrupt your operation. Our inputs are reliable, and we deliver them right to your door.
WE ARE HERE TO HELP
We offer technical assistance as part of your onboarding package, giving you peace of mind and freeing you from operational headaches.
Choosing A/B/Bloom allows you to focus on what you do best — growing award-worthy plants.
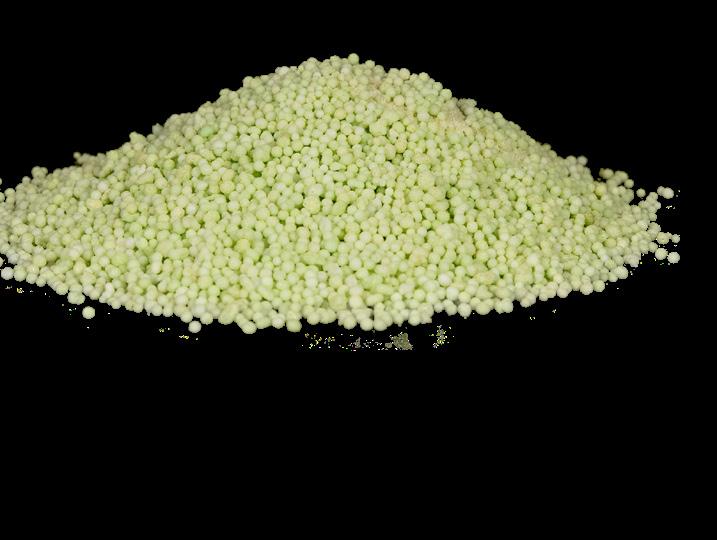
Derived from
• calcium nitrate
• potassium nitrate
• boric acid
• copper EDTA
• iron EDTA & iron DTPA
• manganese EDTA
• sodium molybdate
• zinc EDTA


PART B
2-13 -17

0-35-29
Derived from
• potassium nitrate
• monopotassium phosphate
• potassium sulfate
• magnesium sulfate
Derived from
• potassium nitrate
• monopotassium phosphate
• potassium sulfate
• magnesium sulfate
PHOSZYME
Boost Phosphorus Availability and Increase Water Uptake
WHAT IS IT?
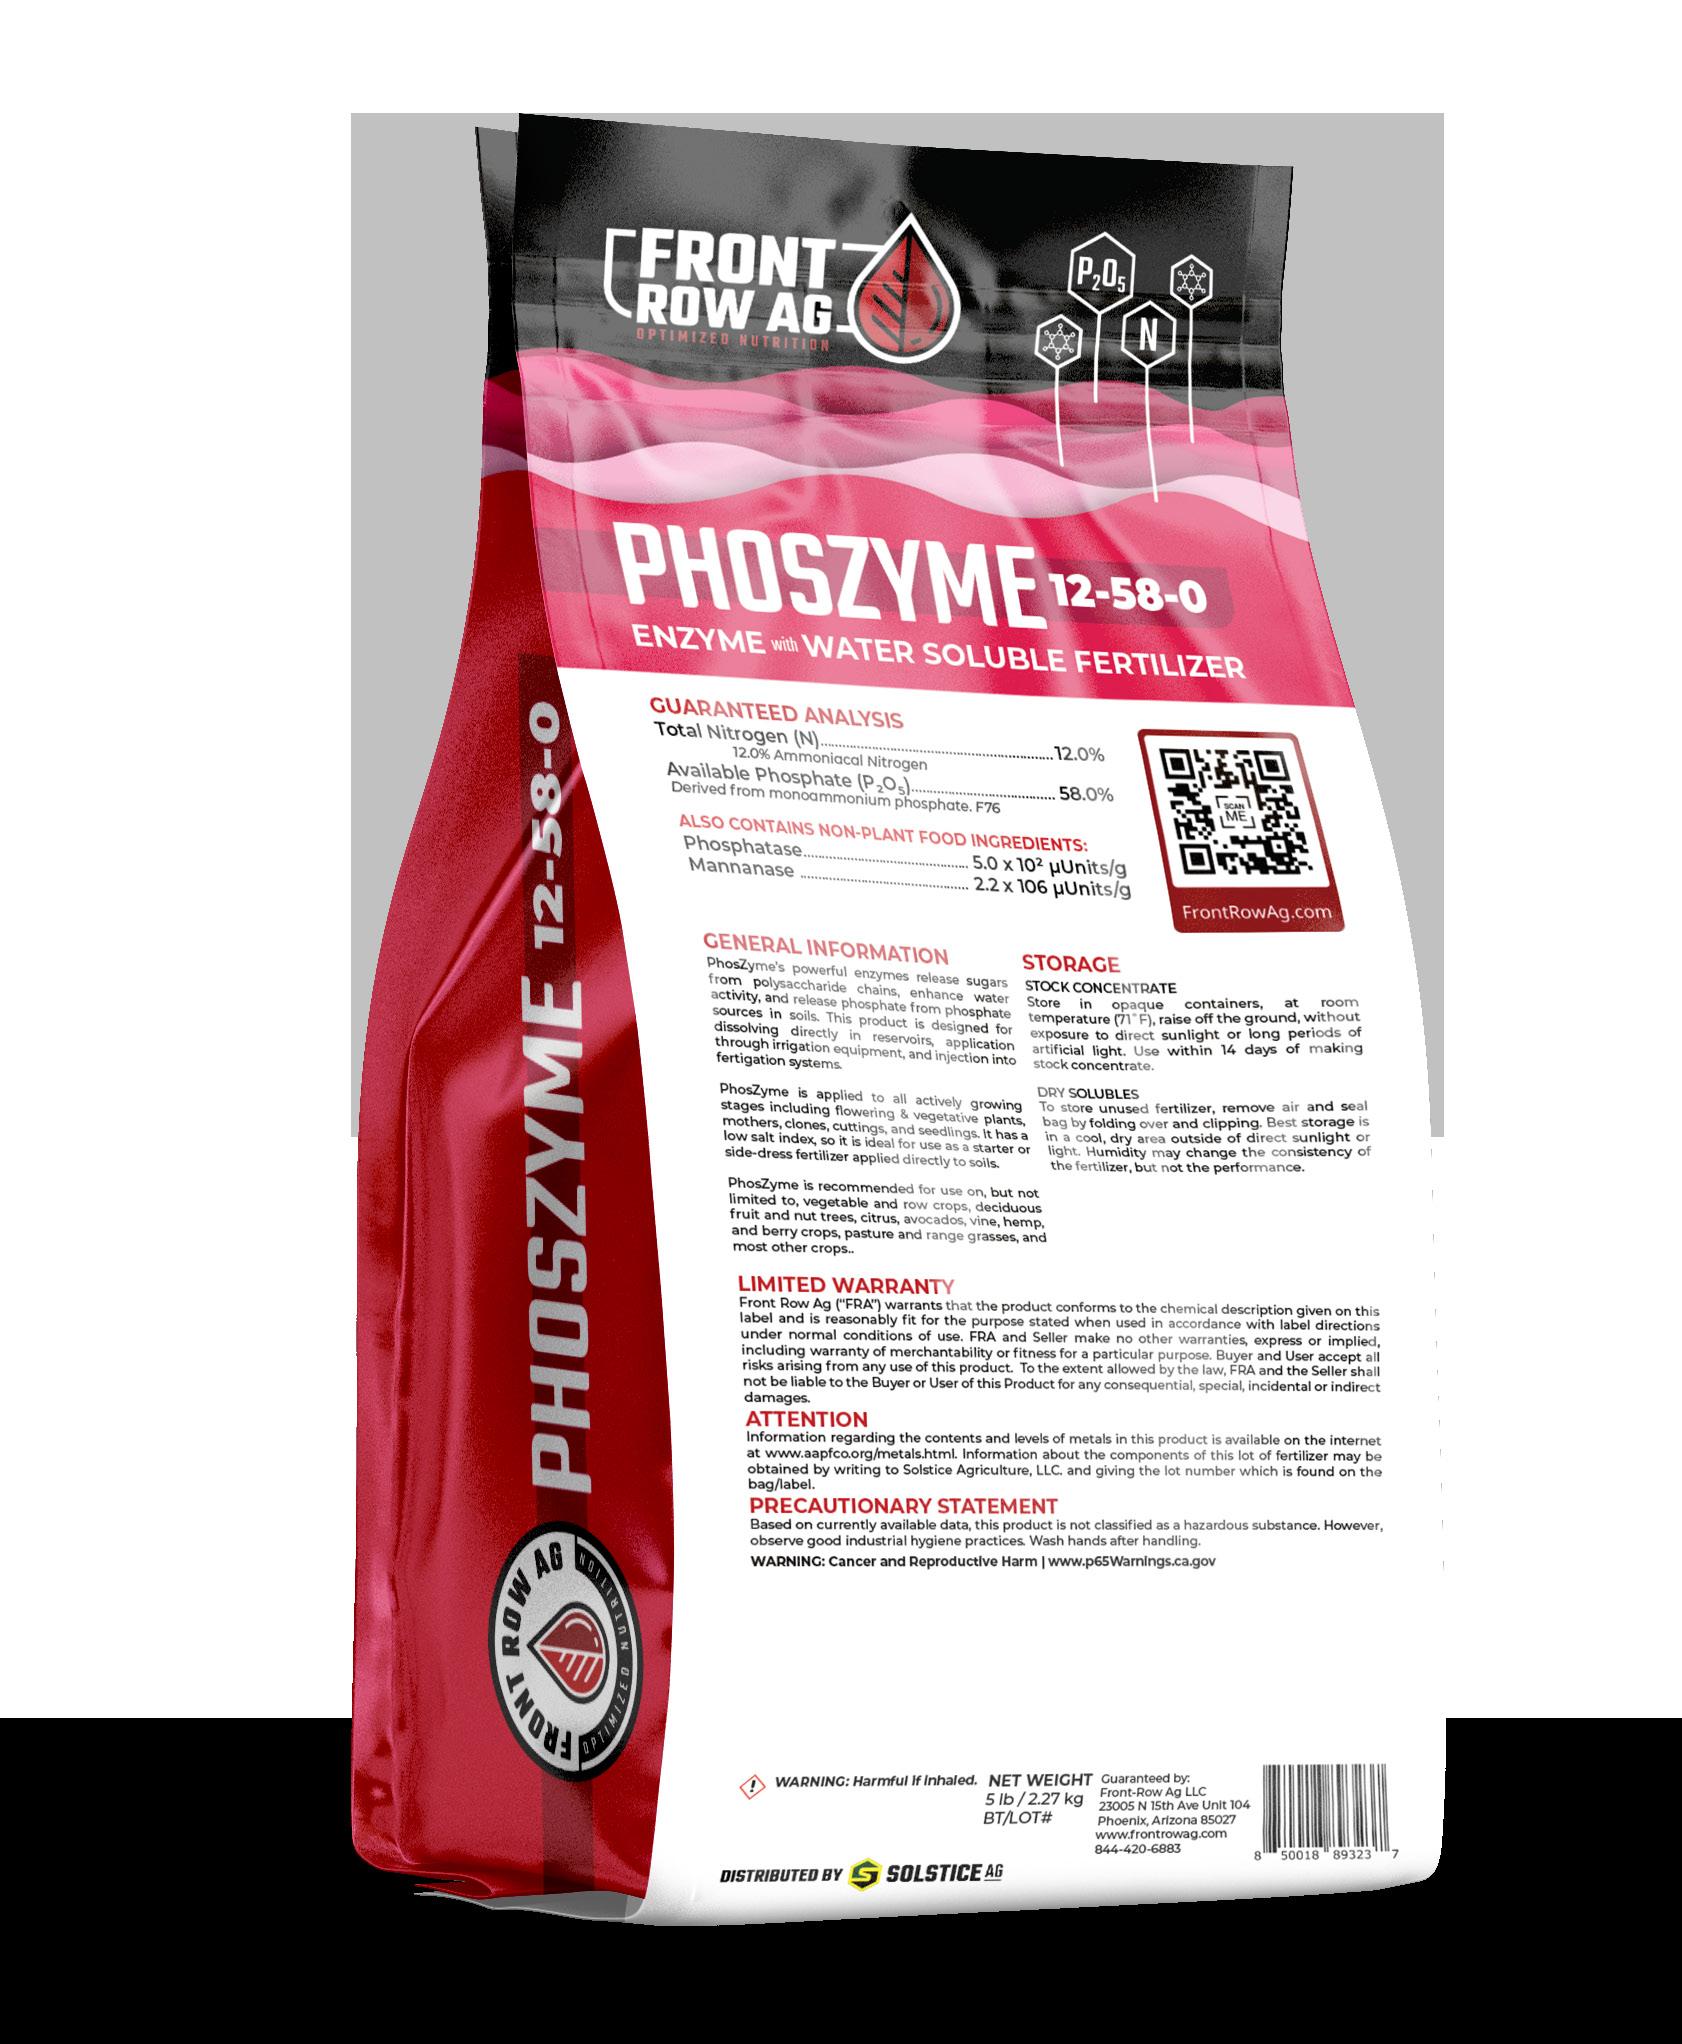
PhosZyme is a concentrated enzyme product with biostimulant effects targeted towards increasing yield and quality. It’s a soluble powder containing high concentrations of mannanase and phosphatase, enzymes that enhance water availability, nutrient uptake, and microbial activity.
WHY USE IT?
The activity of these enzymes have a number of positive effects on plants including:
• Increased water and nutrient absorption
• Greater fertilizer efficiency
• Enhanced microbial activity in rootzone
These effects contribute to improved stress and drought tolerance that ultimately leads to greater rates of photosynthesis, increased production of flowers, and secondary metabolic products including cannabinoids and terpenes.
HOW DOES IT WORK?
• Mannanase works by breaking down starches around the root exudate. This process draws water and nutrients towards the plant roots and yields plant available sugars for absorption at the roots. These sugars are used later for metabolism, protein creation, tissue building, and generating terpenes.
• Phosphatase enzyme catalyzes the conversion of phosphorus into forms that are readily available for absorption, without requiring additional microbial action in the root zone.
• Improvements to water and nutrient exchange plus the heightened phosphorus leads to a healthier rhizosphere that supports improved microbial activity.
DON’T LEAVE YOUR MONEY IN THE MEDIA
Why We Recommend Mixing PhosZyme with Part B
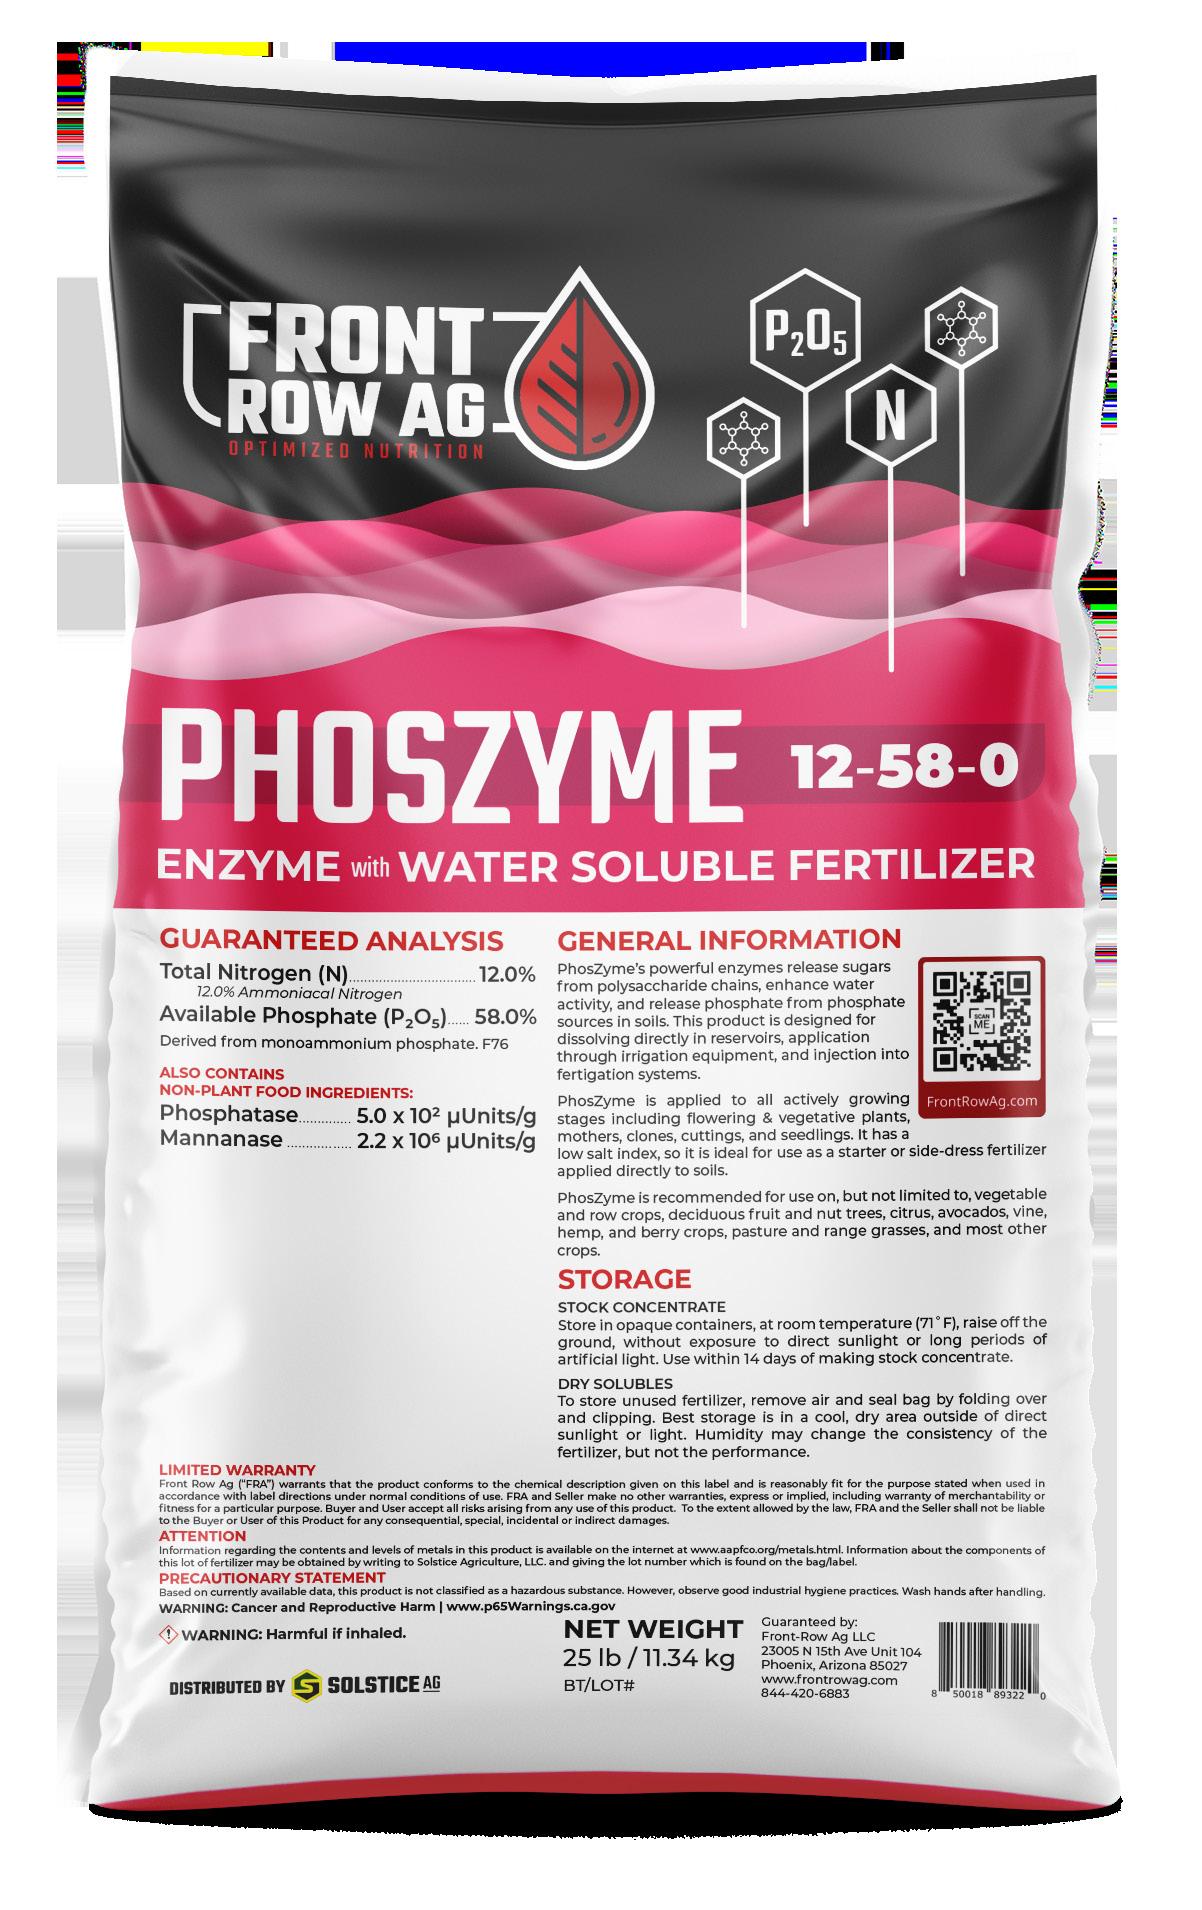

SHOP NOW
We now recommend mixing Phoszyme directly into the Part B stock tank rather than maintaining a separate Phoszyme stock tank. This change offers two benefits:
• Eliminates the need for a dedicated injector, freeing space in your fertigation panel
• Protects against bacterial contamination from source water, which can thrive on Phoszyme's MAP contentPart B's acidity and salinity prevent this bacterial growth
If your current standalone Phoszyme setup (160 g/gal) works well, you can continue using it. For alternative stock solution combinations, please consult the Phoszyme compatibility and rate charts at frontrowag.com/phoszyme

4 REASONS WHY INNOVATIVE CULTIVATORS ARE HARNESSING ENZYMES
IN HYDROPONICS
Enzymes such as phosphatase and mannanase drive critical processes like digestion and nutrient cycling. Learn how enzymatic products like Phoszyme are made, how they work, and the positive effects they have on your grow.
WHAT ARE ENZYMES?
Enzymes are remarkable biological molecules that act as catalysts, enabling and accelerating chemical reactions in both living and “non-living” systems. In the natural world, enzymes drive critical processes like digestion and nutrient cycling. For example, the human digestive system uses a suite of enzymes to break down food molecules into absorbable nutrients. In soil, enzymes produced by microbes depolymerize complex organic matter, releasing mineral nutrients for plant uptake. Now, innovative hydroponic cultivators are harnessing the power of enzymes to revolutionize their growing systems and maximize plant productivity.
Two enzymes that hold particular promise for hydroponics are phosphatase and mannanase.
Phosphatase enzymes catalyze the hydrolysis of organic phosphorus compounds, converting them into bioavailable inorganic phosphate that plants can readily take up. Many substrates contain abundant phosphorus, but it is locked up in forms that are inaccessible to plants without enzymatic mineralization. Harnessing phosphatase in hydroponic systems can liberate this trapped phosphorus pool. Mannanase’s primary function is to break down starches in the exudate that surrounds the outermost layer of the root tips. This chemical reaction creates a draw of water and nutrients to the root zone and releases sugars to the plant. This in turn boosts root growth and increases microbial activity. By supplementing hydroponic nutrient solutions with phosphatase and mannanase, growers can enhance phosphorus and micronutrient availability to their crops.
In nature, extracellular enzymes like phosphatase and mannanase are produced by a diverse array of soil bacteria and fungi. Researchers have identified certain bacterial genera as especially prolific enzyme producers:
• Bacillus
• Pseudomonas
• Streptomyces
These enzyme-secreting bacteria play a key role in organic matter decomposition and nutrient cycling in soil ecosystems. They help liberate carbon, nitrogen, phosphorus and micronutrients from complex organic polymers, making them available for uptake by plants and other microbes.
PRODUCING ENZYMES:
PATIENCE VS PRECISION
Some companies in the hydroponics industry are now culturing and packaging these enzyme-producing bacterial strains for use as microbial inoculants. Adding carefully selected bacterial cultures to hydroponic systems can create a “living” nutrient solution, continuously generating enzymes to optimize nutrient mineralization and uptake.
Microbial inoculant products often contain a combination of a food source, usually high in a sugar, supporting the living bacterial strain creating the perfect environment for explosive biofilm. Purified enzymes, like PhosZyme, eliminate the additional risk of biofilms and clogged emitters.
However, relying on microbes for the production of enzymes is a delicate strategy. Using enzymes produced via substrate microbes requires maintaining live organisms, building a large enough population size, and keeping substrate parameters within the right range for those microbes. With products like PhosZyme, cultivators can now get the benefit of enzymes directly, without having to maintain live microbial colonies.
4 REASONS WHY GROWERS ARE USING ENZYMATIC PRODUCTS
So what kind of benefits are hydroponic growers seeing with enzyme supplements? Numerous research trials and grower experiences have demonstrated promising results. Studies have found that crops grown with phosphatase and mannanase enzyme treatments show:
• Increased growth rates
• Greater final yields compared to untreated controls
• Higher concentration of bioactive compounds
• Enhanced root development
Trials
have reported 10-30% yield increases in crops treated with phosphatase enzymes. Enzymes appear to boost the efficiency of nutrient uptake and utilization by plants, leading to improved crop performance.
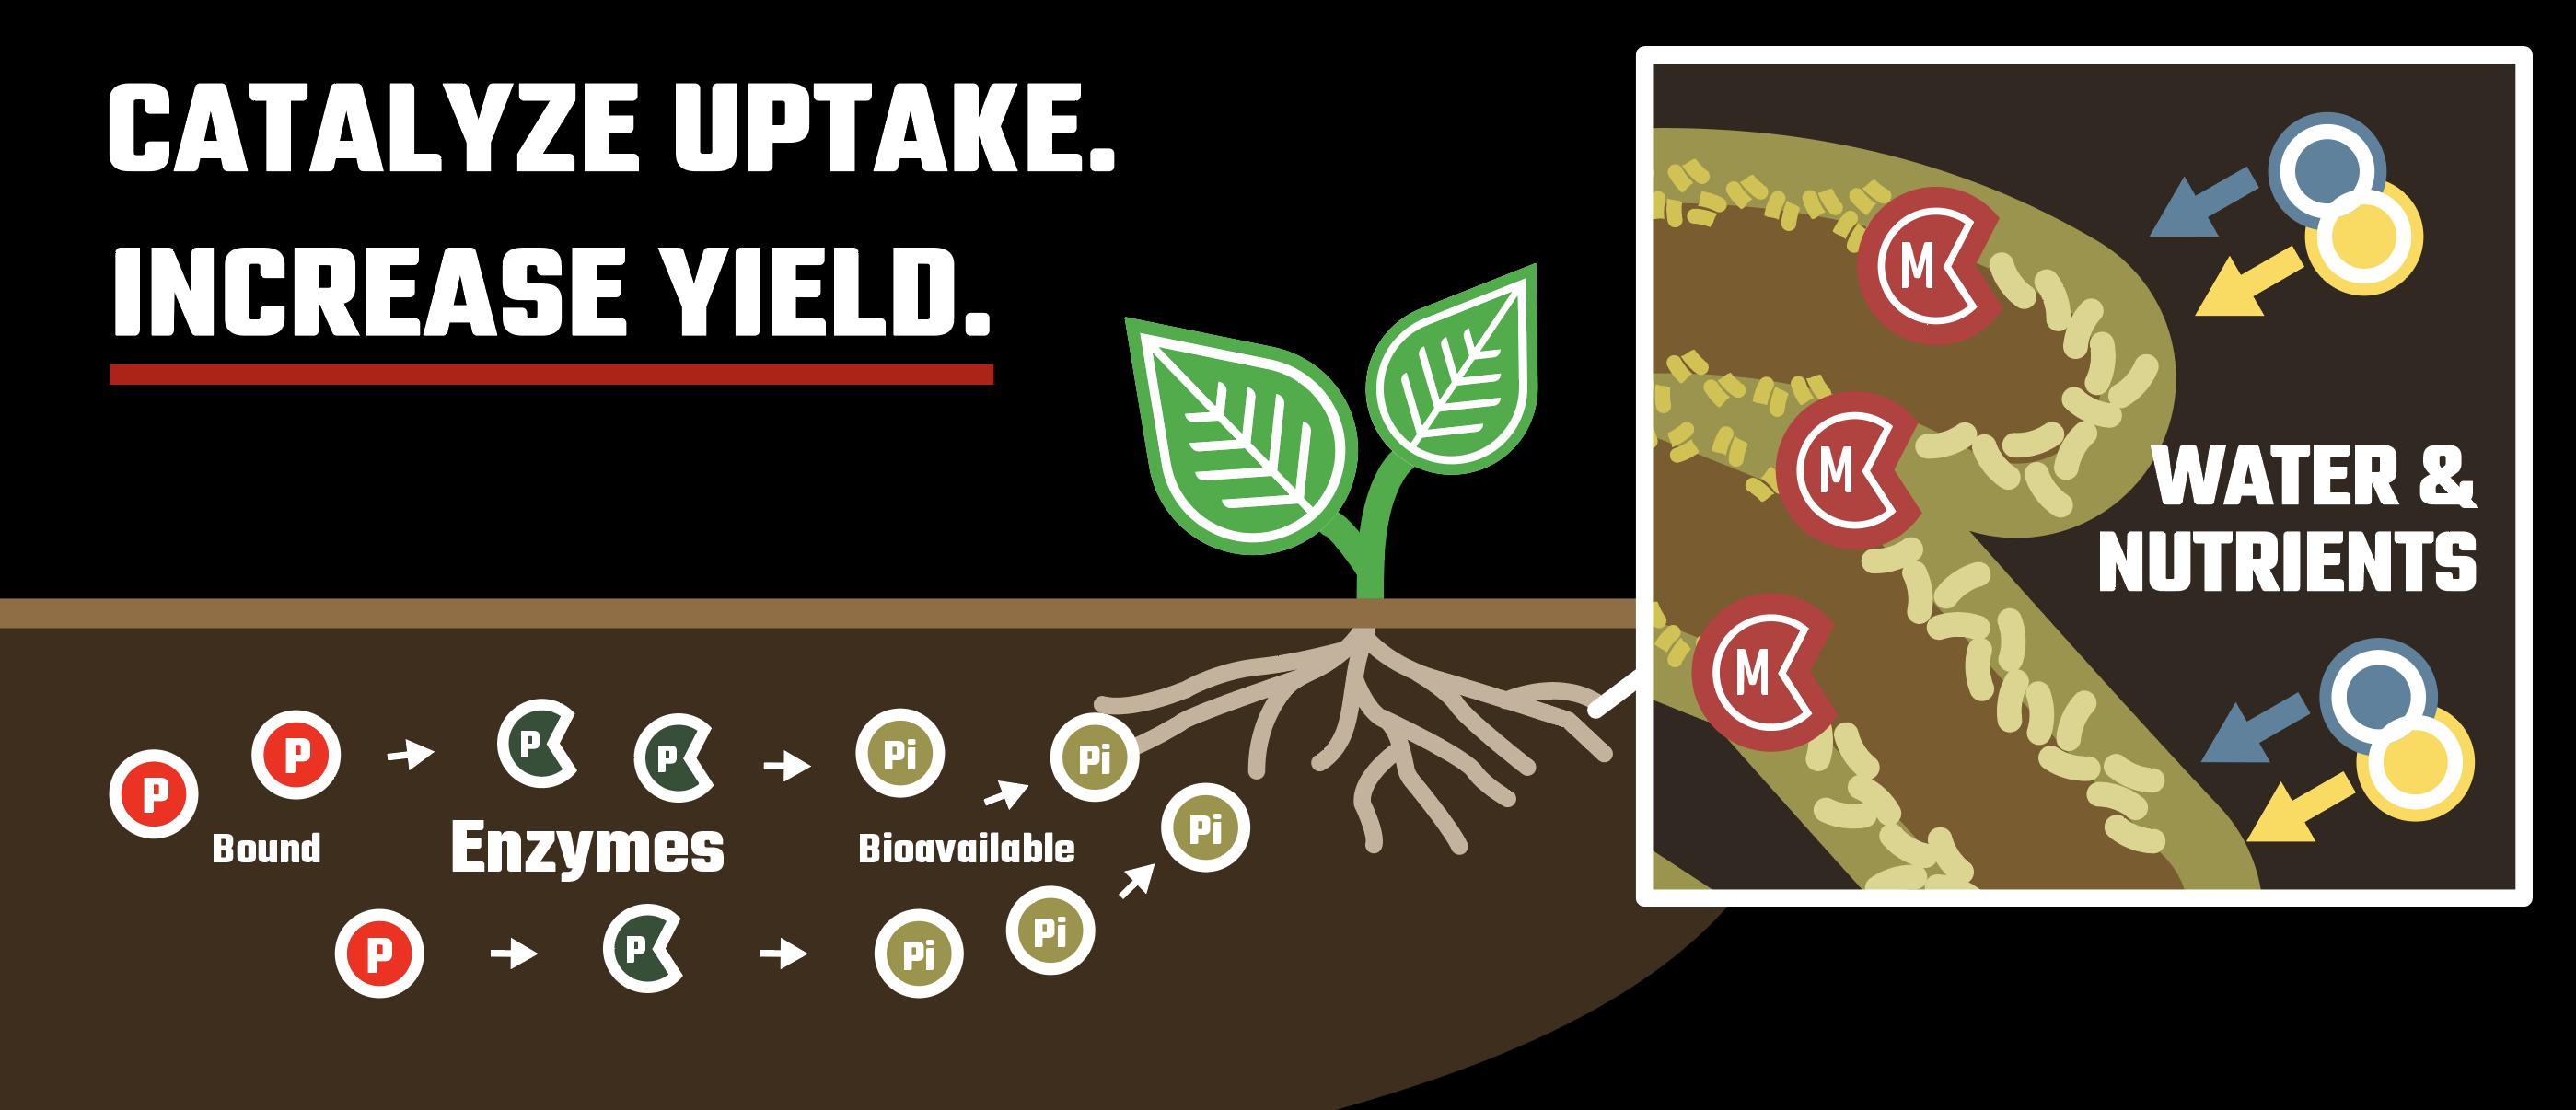
Phosphatase breaks chemical bonds that bind phosphorus to metal ions in the root zone, liberating it for plant uptake. Mannanase degrades mannans in plant cell walls, primarily at the root tips, potentially increasing the availability of sugars and micronutrients while drawing water and nutrients towards the root tip.
HOW PHOSZYME WORKS
One example of a precision enzyme product now available to hydroponic growers is Front Row Ag’s PhosZyme. PhosZyme is a soluble powder that combines phosphatase and mannanase enzymes with monoammonium phosphate fertilizer.
• The phosphatase breaks chemical bonds that bind phosphorus to metal ions in the root zone, liberating it for plant uptake.
• The mannanase degrades mannans in plant cell walls, primarily at the root tips, potentially increasing the availability of sugars and micronutrients while drawing water and nutrients towards the root tip.
• The monoammonium phosphate provides a targeted boost of nitrogen and phosphorus to further drive growth.
ENHANCE ROOT GROWTH & NUTRIENT UPTAKE WITH PHOSZYME
PhosZyme is applied at very low usage rates, and delivers high quantities of enzymes and almost undetectable levels of fertilizer. PhosZyme enhances root growth, nutrient uptake, and harvest weights across a range of hydroponic crops. It can be used alone or combined with other fertilizers to improve overall nutrient efficiency. Products like PhosZyme exemplify how innovative growers are leveraging enzymes to optimize hydroponic fertilizer programs.
ENZYMES IN HYDROPONICS: MORE RESEARCH ON THE HORIZON
The use of enzymes in hydroponics is still an emerging area with ample room for further research and optimization. Key questions include determining optimal enzyme dosage rates and application timing for different crops and growth stages. Potential interactions between enzymes and other hydroponic solution components also need to be evaluated to ensure compatibility. Continued research will help refine best practices for integrating enzymatic biostimulants into hydroponic production. Going forward, enzymes are an increasingly valuable tool in advancing hydroponic crop nutrition. By harnessing the metabolic power of soil microbes and translating it into bioavailable plant nutrition, enzyme supplements can help growers maximize fertilizer efficiency while reducing costs and environmental impact. Phosphatase and mannanase are two enzymes with demonstrated potential in hydroponics, but many other candidates are also being explored, including:
• Cellulases to break down root-bound cellulose
• Proteases to enhance nitrogen mineralization
• Phytases to liberate more phosphorus from inorganic sources As research progresses, an expanding toolbox of targeted enzymatic biostimulants is expected to emerge, tailored for different crops and growing conditions. The integration of hydroponic systems with microbial biotechnology and synthetic biology may open up new pathways. It’s our prediction that enzymes will likely play a central role in shaping the future of sustainable, productive hydroponic agriculture.

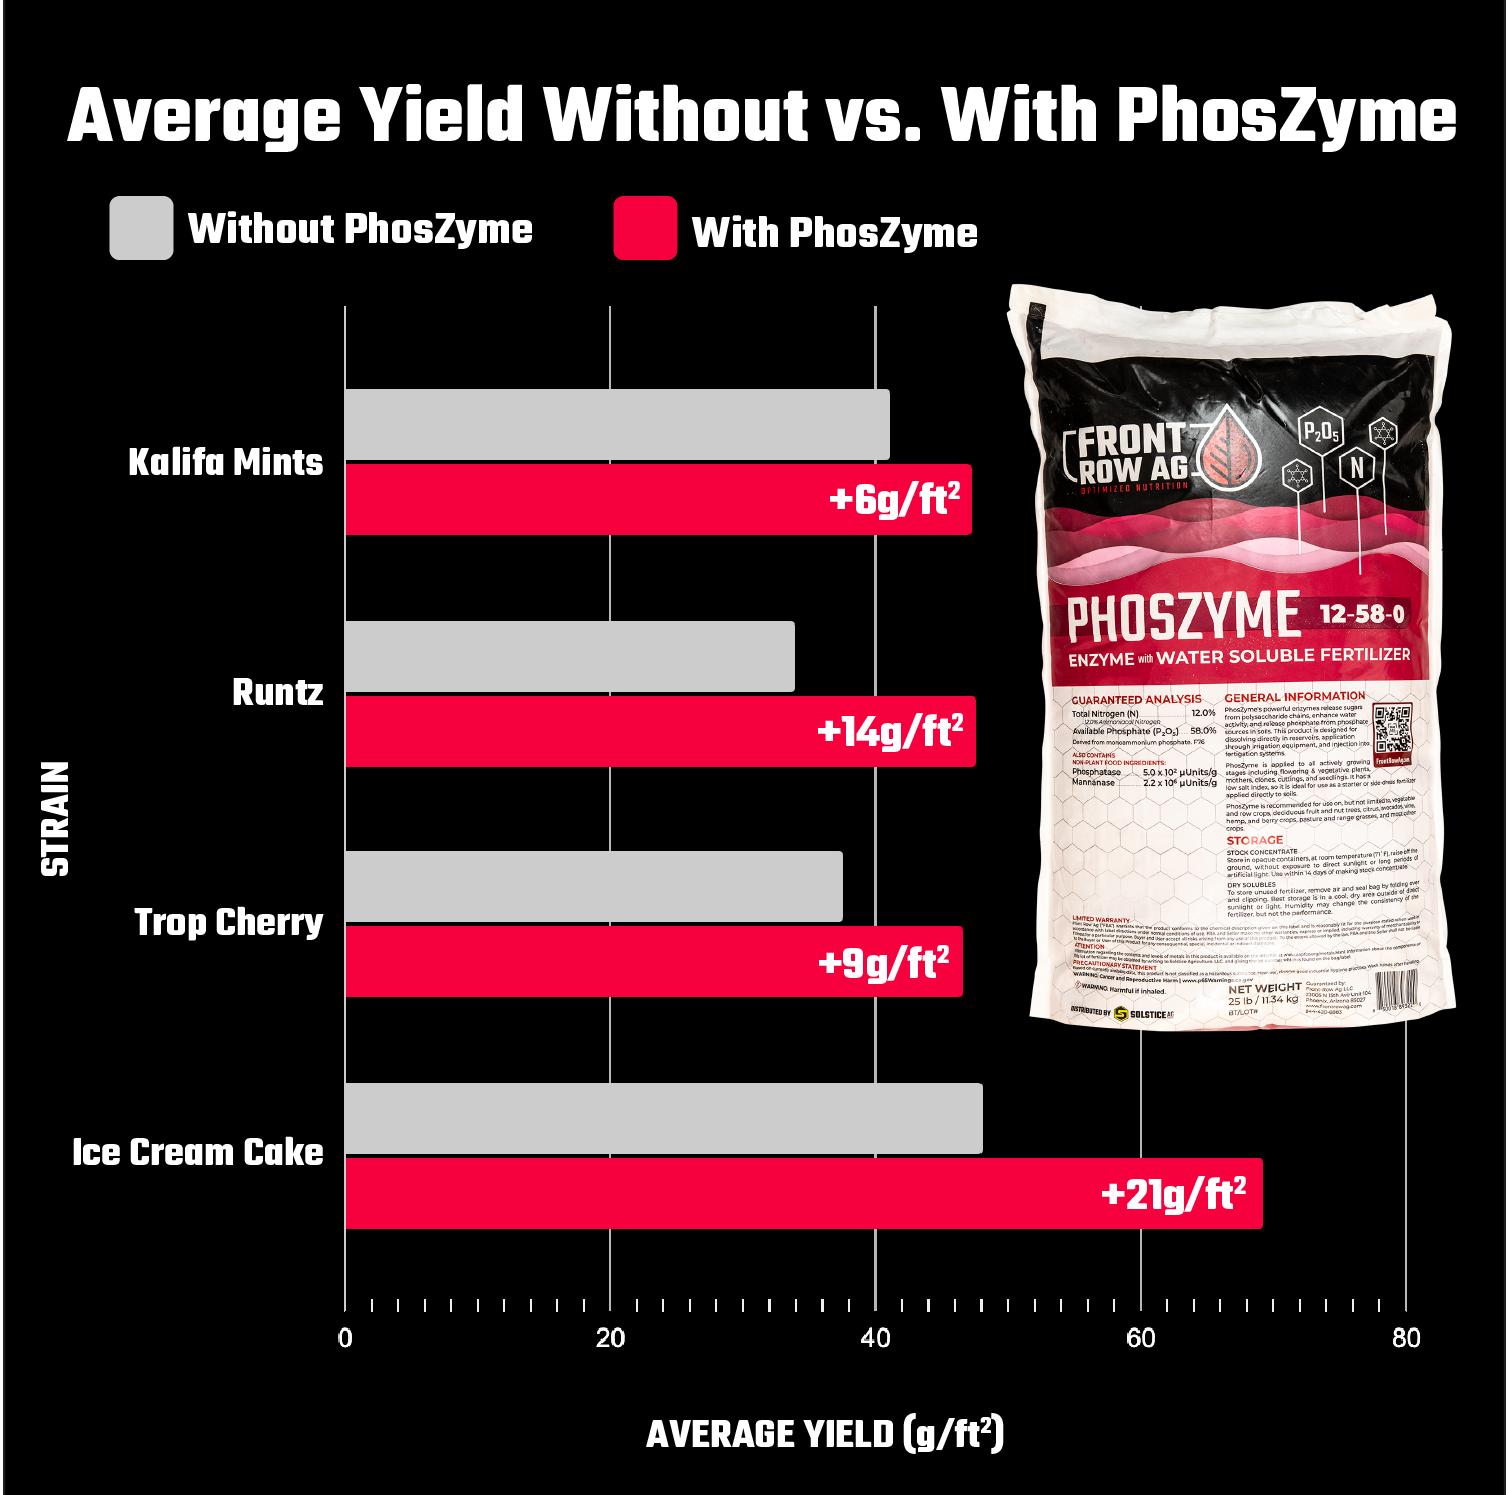
Customer-reported results provided by a Maryland commercial cultivator show an average yield boost of 31% after integrating PhosZyme into their nutrient program.

MONOSILICIC ACID
REQUIRED TO BE LABELED AS 10% SILICON DIOXIDE
HOW DOES SILICA WORK?
These beneficial outcomes are mediated through a number of pathways:
• Mechanical effects: As it’s incorporated into plant tissues, it increases the weight and strength of cell walls, creating a physical barrier to insects and fungal pathogens. The increased strength also leads to improved plant posture and resistance to drought, temperature, and wind.
• Nutrient absorption: Silica improves the uptake of beneficial elements and interferes with the absorption of harmful ones such as heavy metals.
• Water balance: By modulating the leaf transpiration rate and enhancing root water uptake, silica alleviates drought stress.
• Regulation of plant hormones and genetic expression under abiotic stress conditions.
• Enhanced activation of plant immune and antioxidant systems.
FRONT ROW Si USAGE TABLE



UNDERSTANDING SILICIC ACID
FORMS OF SILICON
Silica, silicates, and silicic acid Silicon (Si on the periodic table), while being the second most abundant element in the earth’s crust and 8th most abundant element in the universe, is not directly available for absorption into plants. Although some water-soluble Si exists naturally, the majority of Si on earth is in the form of insoluble oxides or silicates in the soil.
Silicon Dioxide (SiO2), commonly referred to as silica, is the main component of sand and quartz. Although silica affects the physical properties of soil, it’s also not directly available for plant absorption and has limited use in hydroponics as it takes months to years to break down into a form that can be absorbed by plants. The main use of silica sand in horticulture is as an additive to increase drainage and aeration of heavy soils, to help prevent waterlogged conditions. Silica sand can also be utilized as a growing media in certain types of hydroponic systems, such as subsurface drip irrigation, and when coated in plastic as a substrate for ebb and flow flood trays. Note that silica sand alone is an inadequate substrate for most types of plants as it does not provide nutrients or moisture-retention capabilities. When used properly as an additive in soil or certain hydroponic substrates, silica sand can open soil structure, improve aeration, and increase drainage.
Silicates refer to when Si is bonded with cations of Ca, K, Mg, and Na, forming a variety of crystalline compounds. The most common silicate used in horticulture is potassium silicate, K2SiO3, although calcium silicate and magnesium silicate can also be used. When dissolved into solution, these silicate products will yield a small amount of plantavailable silica (PAS) as monosilicic acid. At high concentrations, potassium silicate solutions can be unstable and gel. Potassium silicate is alkaline, so it must be used carefully in hydroponic fertilizer solutions to avoid changing the pH. Overall, silicate compounds are of limited use in hydroponics due to their low solubility, alkaline nature, and the small amount of plant-available silica they release.
Monosilicic acid (MSA) (Also known as orthosilicic acid) is H4SiO4, the only form of silicon that can be directly absorbed and used by plants. All of the previously mentioned forms of Si must break down into MSA to be absorbed and exert beneficial effects on plant physiology and structure. Since SiO2 and silicates break down slowly and yield a small amount of monosilicic acid, product formulations containing pure and stabilized MSA are desirable for hydroponics. These products, such as Front Row Si, contain fully plant-available silica in a stable aqueous solution. MSA products allow precise control of silica levels in hydroponic fertilizer, do not change pH, and can be applied as a foliar spray or root drench.
SILICA COMPOUNDS IN FERTILIZER
The chemistry of Si in fertilizer solutions can be quite complicated, but the important fact to keep in mind is that plants can only absorb MSA and that other forms of Si are only as beneficial as their capacity to yield MSA to the plant roots.
To achieve an equivalent ppm of MSA in the fertilizer solution with one of the various silicate compounds (e.g. potassium silicate), much higher usage rates are required. Front Row Si is 10 times stronger than most other Si alternatives, resulting in lower usage rate and cost savings. With alternative Si products, the higher usage rates comes with the complication of adding excess potassium or other ions to the fertilizer solutions and these changes must be accounted for in the overall elemental ratios of the fertilizer solution. For example, to achieve 13 ppm of soluble silica in the fertilizer solution using potassium silicate (assuming 8.5% plant available silica), the usage rate would be 0.6 g/gal, resulting in the addition of 40+ ppm potassium in addition to the silica. This excess potassium must be accounted for to maintain proper ratios of other major elements such as nitrogen and phosphorus. Additionally, silicates will significantly raise the pH of the fertilizer solution and must be mixed appropriately to prevent reaction with acidic ions. Front Row Si adds 13ppm of MSA in solution at a rate of 0.5 ml/gal, without contributing any additional K ions or changing solution pH.
Given the above issues, an increasing number of cultivators are using stabilized, high-purity MSA products to deliver silica directly in the form the plants can use, both in the feed solution and through foliar application.
BENEFITS OF SILICA AND SILICIC ACIDS
Silica’s beneficial effects are mediated through a variety of mechanisms including mechanical strengthening, controlling water balance, regulating nutrient absorption, gene regulation, and activation of plant immune systems. As plants incorporate silica into tissues, this increases the mechanical strength of stems, leaves, and cell walls creating a physical barrier to insects and fungal pathogens. Research in many varieties of high-value agricultural crops shows that silica substantially decreases the frequency and intensity of diseases and pest infections. The increased density and weight of plant tissues also contributes to the yield increases seen in a variety of crops with Si application. Silicon deposition in plant tissues provides abrasion and penetration resistance to
fungal hyphae and insect mouthparts, decreasing their ability to successfully invade plant tissues.
Water deficiency can be caused by low rootzone water content, excessive salinity in the rootzone, or high water loss from transpiration due to high VPD and wind. Si application improves the plant’s resistance to water stress and ability to maintain turgor by enhancing water uptake from the roots and adjustments to transpiration rate by reducing water loss through leaves. Silicon enhances aquaporin production, the water channel proteins responsible for rapid water movement through roots and leaves. By improving water uptake and reducing water loss, Si allows plants to maintain favorable water balance and turgor even under drought conditions. This leads to sustained photosynthesis, growth, and yield, even when water is limited.
Si also improves plant nutrition under adverse conditions by increasing the uptake of beneficial nutrients and interfering with the absorption of harmful ones, especially heavy metals. Research shows that plants treated with Si are protected against heavy metal toxicity and don’t show the drop in photosynthesis and growth that we would expect when exposed to heavy metals in the soil. At the same time, Si enhances activity of plasma membrane H+ATPase, improving nutrient uptake into root cells. By both blocking toxic elements and improving uptake of beneficial nutrients, Si helps plants maintain optimal nutrition even when growing in suboptimal conditions.
In summary, Si exerts a number of beneficial effects on plant physiology, leading to:
• Enhanced resistance to biotic stress: decreased frequency and degree of infection with powdery mildew, botrytis, and insect. Silicon deposition in plant tissues creates a physical barrier to penetration and feeding.
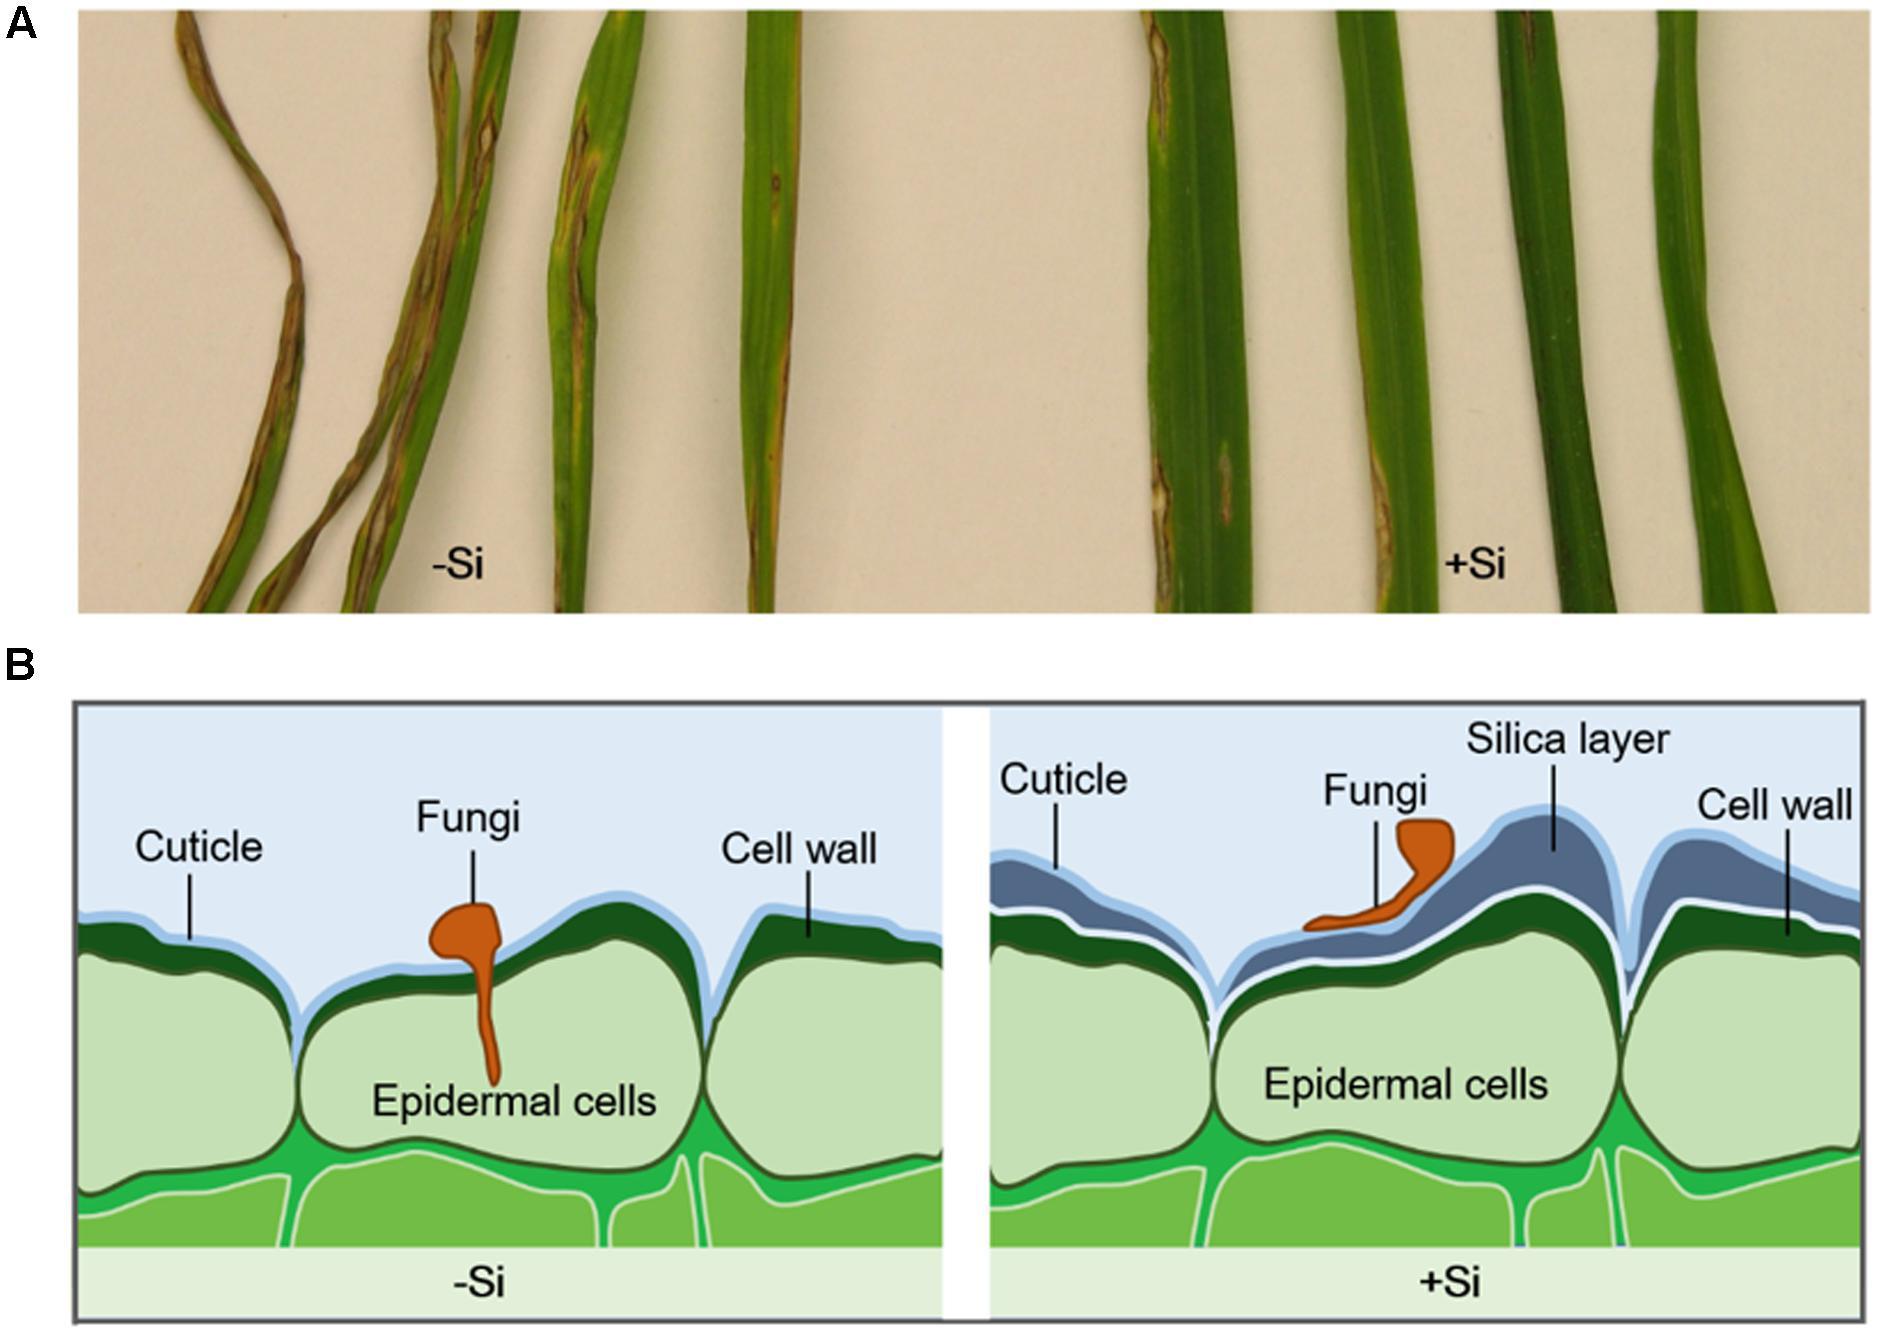
Figure 1. (A) Leaf blast symptoms in rice after inoculated with Magnaporthe grisea for 10 days. Rice plants were continuously treated with (+Si) or without silicon (–Si). (B) Silica layer was formed in the cell wall of Si-treated plants and enhanced plant resistance to fungi infection by physical barriers. (Wang et. all, 2017)
• Enhanced resistance to abiotic stress: better plant health and performance under conditions of water stress, high salinity, wind, and adverse climate conditions. Si enhances water uptake and reduces water loss, allowing plants to maintain turgor and growth under drought conditions.
• Increased yield and quality of crops: Stronger and heavier tissues as well as increased photosynthetic growth rates leading to yield and quality improvements.
• Improved nutrient absorption: Resistance to heavy metal toxicity and improved absorption of beneficial nutrients.
These benefits are seen from both rootzone application in hydroponics as well as foliar applications. Front Row Si allows for root drench or foliar application, helping deliver the benefits of MSA in your garden.
REFERENCES
Chen, D., Wang, S., Yin, L. and Deng, X., 2018. How Does Silicon Mediate Plant Water Uptake and Loss Under Water Deficiency?. Frontiers in Plant Science, 9.
Savvas, D. and Ntatsi, G., 2015. Biostimulant activity of silicon in horticulture. Scientia Horticulturae, 196, pp.66-81.
Wang, M., Gao, L., Dong, S., Sun, Y., Shen, Q., & Guo, S. (2017). Role of Silicon on Plant-Pathogen Interactions. Frontiers in plant science, 8, 701. Yongchao Liang, Wenhua Zhang, Qin Chen, Youliang Liu, Ruixing Ding, Effect of exogenous silicon (Si) on H+-ATPase activity, phospholipids and fluidity of plasma membrane in leaves of salt-stressed barley (Hordeum vulgare L.), Environmental and Experimental Botany, Volume 57, Issue 3, 2006, Pages 212-219.
Zellner, W., Tubaña, B., Rodrigues, F. and Datnoff, L., 2021. Silicon’s Role in Plant Stress Reduction and Why This Element Is Not Used Routinely for Managing Plant Health. Plant Disease, 105(8), pp.2033-2049.
STABILIZED MSA PRODUCTS IN HORTICULTURE:
UNLOCKING THE FULL POTENTIAL OF SILICA
Why we made Front Row Si with stabilized monosilicic acid (MSA).
Comparing various methods for stabilizing MSA. The unique advantages of polyol-stabilized MSA solutions, such as Front Row Si.
THE IMPORTANCE OF STABILIZING MONOSILICIC ACID
Silica products not only increase plant growth rates and yield, but also protect plants from various stresses, making them a valuable addition to any horticulture operation. These products are highly effective against biotic stresses (bacteria, fungi, viruses, insects) and abiotic stresses (heat, drought, acidity, salinity). One way or another, to confer these benefits all silica products must ultimately increase the MSA concentration around the roots or foliage.
It’s important to note that traditional forms of silica (potassium silicate, for example) generally aren’t absorbed via foliar action. While there is evidence of prevention of powdery mildew, applying foliar potassium silicate with this method won’t produce the growth or yield benefits that foliar MSA confers. Potassium silicate must remain at a very high pH to maintain solubility.
This points to another major benefit of stabilized MSA solutions: they don’t contain additional minerals that need to be compensated for in your main fertilizer formulation. For example, using potassium silicate at 0.3 g/gal will add 22ppm of K along with the 20ppm of elemental Si, and this will require compensation. As mentioned, plants benefit greatly from MSA, however it is highly reactive and needs to be stabilized to ensure that its reaching the plant surfaces as monosilicic or disilicic acid. At higher pH levels, MSA disassociates into silicate ions, and at high concentrations, unstabilized MSA polymerizes creating larger molecules. Since only the smaller molecules of mono- and di- silicic acid can be absorbed by
plants, this polymerization into oligomeric and polymeric silicic acid needs to be prevented. The commercial availability of MSA products has been made possible with the development of processes that prevent the polymerization of silicic acid, enhancing stability at a variety of concentrations, pH levels, and over longer durations.
STABILIZATION METHODS
One common method of stabilizing MSA solutions include acid stabilizations in combination with molybdenum, zinc, choline, or polyethylene glycol (PEG). These methods allow concentrations of up to 2.5% silicic acids, however these stabilized silica solutions must remain at a very low pH to prevent polymerization in concentrated form. Another method involves using organosilicon precursors, such as tetraethyl ortho-silicate. These products don’t contain water and are very concentrated, allowing up to 40% equivalent concentration of MSA after conversion. As precursors, they don’t actually contain MSA but their components break down into MSA once diluted in water. Unfortunately, they also produce other organic compounds such as ethanol (alcohol) in the solution, which can exert strong negative effects on root growth and plant development.
POLYOL-STABILIZED MSA SOLUTIONS: FRONT ROW Si
Among the various methods of stabilizing silica, polyol-stabilized MSA solutions stand out for their remarkable properties and effectiveness. One such example is Front Row Si, which contains 16% MSA (10% Silicon Dioxide). This product uses sugar alcohols, which form soluble 2/1 (sugar alcohol/silicic acid) silicate complexes with basic silicic acid. Silicate is very selective about the sugar alcohols it reacts with, but certain combinations result in readily soluble complexes at high concentrations.
While potassium silicate solutions require very high pH levels to stay in solution and
acid-stabilized MSA products require very low pH to prevent polymerization, the polyol stabilization process used in Front Row Si overcomes this challenge.
Front Row Si has significantly improved mixing properties compared to other silica products on the market; the mono- and disilicic acid components are stabilized to be soluble at all pH levels, making them easier to use in a variety of applications and methods. Additionally, Front Row Si does not contribute any potassium or other minerals that would
MATH INTERLUDE:
require adjustment of the overall nutrient recipe.
The low-molecular weight MSA in monoand di-silicic forms created by the polyol stabilization process in Front Row Si are easily available for plant absorption in contrast to the higher molecular weight Si polymers that are less effective for plant uptake. This superiority in terms of cost, stability, solubility, and availability for plant absorption makes polyol-stabilized MSA solutions like Front Row Si a valuable choice.
CALCULATING SOLUTION Si PPM
Much of the research literature reports the effective ppm ranges for elemental Si rather than a silica salt or of MSA. It may be useful to see how to calculate the elemental ppm of Si from MSA in a solution.
1A. WHAT % OF MSA IS Si?
Let’s walk through the steps for deriving the percentage by weight of Si in MSA.
MSA’s molecular composition is H4SiO4, or Si(OH)4, meaning it contains silicon, hydrogen, and oxygen.
To find the percentage of Si by weight, you need the molar masses of each of these elements:
• Silicon (Si): 28.085 g/mol
• Hydrogen (H): 1.008 g/mol
• Oxygen (O): 16.00 g/mol
• Calculate the total molar mass of MSA: Take the sum of the molar masses of all elements in the compound multiplied by their respective number of atoms:
• 1 Si atom: 1 × 28.085 g/mol
• 4 H atoms: 4 × 1.008 g/mol
• 4 O atoms: 4 × 16.00 g/mol
• Molar mass of MSA = (1 × 28.085) + (4 × 1.008) + (4 × 16.00) = 28.085 + 4.032 + 64.00 = 96.117 g/mol
• Calculate the percentage of Si by weight: Divide the molar mass of Si by the total molar mass of MSA and multiply by 100% to get the percentage:
• Percentage of Si by weight = (Molar mass of Si / Molar mass of orthosilicic acid) × 100% = (28.085 g/mol / 96.117 g/ mol) × 100% ≈ 29.20%
So, the percentage of Si by weight in MSA is approximately 29.20%.
1B. WHAT % OF SiO2 IS Si?
Many product labels or labs report Si concentrations as SiO2 equivalents.
To determine the percentage of silicon (Si) by weight in silicon dioxide (SiO2), we first need to know the molar masses of silicon and oxygen:
• Molar mass of silicon (Si): 28.0855 g/mol
• Molar mass of oxygen (O): 16.00 g/mol
Silicon dioxide has one silicon atom and two oxygen atoms, so its molar mass can be calculated as:
Molar mass of SiO2 = (1 x 28.0855 g/ mol) + (2 x 16.00 g/mol) = 28.0855 g/ mol + 32.00 g/mol = 60.0855 g/mol
Now we can calculate the percentage of silicon by weight in silicon dioxide:
Percentage of Si = (28.0855 g/mol / 60.0855 g/mol) x 100% ≈ 46.74%
Thus, the percentage of Si by weight in SiO2 is approximately 46.74%
WHAT DOES THE RESEARCH SHOW ABOUT FOLIAR MSA APPLICATIONS?
Since 2003 a number of trials in various crops have been carried out to determine the effects of foliar application of Si. Most research uses solutions of 7-45 ppm Si, sprayed 3-4 times starting early in the crop life cycle. The excellent 2018 review paper by Laane and colleagues reports on these effects, summarized below:
• Five studies exploring the effects of on potato growth, yield, and infection rate showed increased disease resistance, yield improvements of up to 40%, and other growth enhancements.
• Four sprays of 30 ppm Si applied to two different onion cultivars grown in clay soil in the Netherlands resulted in yield increases of 9.9% and 10.8% respectively.
• In a Colombian study, four sprays at 30 ppm Si using two different spraying regimes led to increased papaya plant height (6.3% and 7.8%), stem diameter (7.3% and 8.2%), fruit weight (11.9% and 13.2%), superior fruit flavor.
• Three studies on rice demonstrated that MSA sprays led to various growth and yield improvements, including increased grain size and quantity, shorter crop cycles, and enhanced nutrient uptake, with yield increases up to 32%. Additionally, the studies found that MSA application reduced infection rates, such as a 70% reduction in one study, and allowed for decreased pesticide usage while maintaining high yields.
• A study on strawberries found that three sprays with 7 and 14 ppm Si significantly improved growth parameters, including root length, root mass weight, diameter of root neck, and leaf blade area, across all tested soil types.
• Two studies on grapes found that MSA sprays at various concentrations led to significant improvements in growth parameters, yield, and quality, with one study reporting a maximum yield increase of 39%. The treatments positively influenced factors such as nutrient uptake, total soluble solids, acidity, total sugar, and reduced the percentage of rotten berries, while another study observed increased berry length, diameter, bunch weight, and overall quality.
• A study on ten different finger millet varieties found that two sprays of 15 and 30 ppm Si significantly increased grain and straw yield, with the greatest increase at the 4 mL/L rate, and improved Si uptake by 54.6% over the control. Additionally, the MSA sprays reduced blast disease by 50.469.8% across the different genotypes.
• MSA sprays led to various improvements in sugarcane growth, yield, and quality in three studies. One study found a 26% yield increase with foliar MSA sprays, and the combination of soil and leaf application provided a 33% yield increase. Another study demonstrated that MSA sprays significantly decreased mite populations and leaf dryness.
• A study on seasonal ornamental plants found that three sprays with 15 and 22 ppm Si from MSA led to increased growth and quality. The number of lateral shoots, buds, and flowers or inflorescences increased in all ornamental plant varieties, with flower diameter also dependent on the concentration of the spray.
• MSA sprays improved growth, yield, and quality in white oat and wheat. In wheat, the sprays increased nutrient concentrations, shoot dry matter, and resulted in a 26.9%
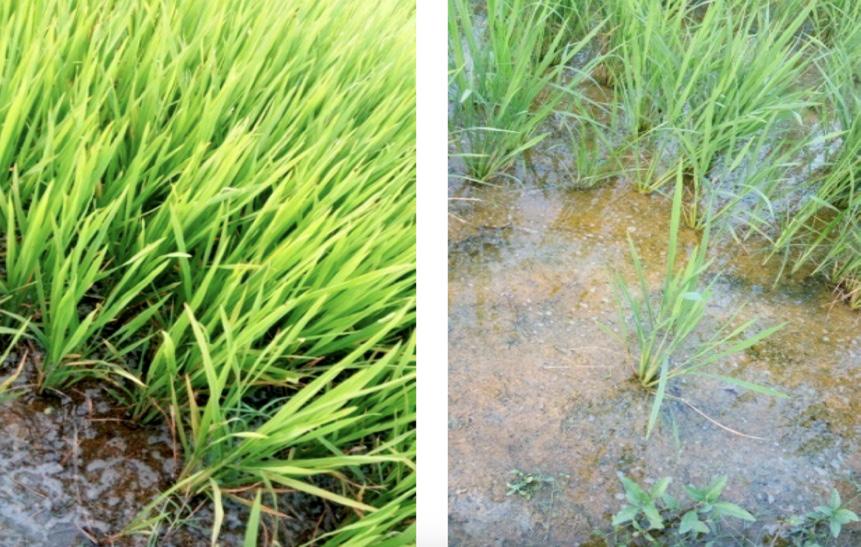
Rice plants grown on very acidic soil on a plot of 1.5 ha near Chennai (India), 2017. Half of the plot was sprayed with PEG-sSA. The visual differences between sprayed plants (a) and the control (b) can be seen.

The effects of foliar application of PEG-sSA on wheat grown in very saline soil (area of 3 ha) in Romania during 2014. Half of the plot was sprayed four times with AB Yellow® (=4 mL/L PEG-sSA plus B, Mo and Zn). The visual differences between the sprayed plants (taller plants) and the control (small plants) can be seen.
grain yield increase. MSA sprays also showed efficacy in alleviating drought stress, increasing relative water content, and improving growth and quality parameters.
• MSA sprays improved growth, yield, and quality in soybean, common bean, and peanut. Four sprays of 15 ppm Si from MSA increased seed yields by 14% for soybean, 15% for common bean, and 9.6% for peanuts. In soybean, three sprays were the most effective foliar application, increasing plant height, leaves, pod and seed yield, as well as protein and oil yield.
• MSA sprays improved growth, yield, quality, and infection rates in tomato plants. Three sprays of 30 ppm Si led to taller transplants with larger stem diameters and increased nutrient concentrations. MSA sprays of 15 and 30 ppm Si reduced powdery mildew disease by 26% and 56%, respectively, with the latter sprays being more effective than the standard fungicide.
• A study on maize found that MSA sprays at concentrations of 7, 15, and 22 ppm Si applied at 20-day intervals, along with the application of silicon granules, improved growth and yield parameters in both sandy loam and clay loam soils. The highest yield resulted from the combination of the foliar MSA application at 22 ppm Si with the soil application of silicon granules.
• A study on mango trees compared the efficacy of four 4 30 ppm Si from MSA sprays applied at three-week intervals with other silicon treatments and a control. All soil and foliar silicon applications enhanced growth and yield, but the MSA foliar sprays were more effective in terms of yield increase,
total soluble solids (TSS), and shelf life. The shelf life of the fruits from MSA treated trees increased by five days compared to other silicon-containing product applications.
• A study on mandarin plants evaluated the efficacy of one, two, and three MSA sprays at concentrations of 7, 15, and 30 ppm Si applied at 30-day intervals during the pea stage and ripening stages. Sprays with 15 ppm at the pea stage enhanced nutrient status, increased fruit size by 25%, and improved juice volume during the ripening stage, particularly with 30 ppm sprays. The treatments increased biogenic silicon layers in the rind, sugar content in the juice, nutrient ionic status, and fruit shelf life.
CONCLUSION
Stabilized silica products are a game changer in horticulture, offering numerous benefits to plant growth and protection. By understanding the importance of stabilizing monosilicic acid and the methods used to achieve this, growers can make informed decisions when selecting silica products for their horticultural operations. With the right stabilized silica product, such as the polyolstabilized Front Row Si, growers can enjoy higher growth rates, yields, and improved plant health.
Getting the benefits of MSA with Front Row Si is easy: In practice, 3 - 5 foliar applications with 1-2 ml/gal over the first 5 weeks of a plants life ensures the crop is receiving the benefits on growth rate, yield, disease resistance, and quality.
REFERENCES
Laane H. M. (2018). The Effects of Foliar Sprays with Different Silicon Compounds Plants (Basel, Switzerland), 7(2), 45. https://doi.org/10.3390/plants7020045

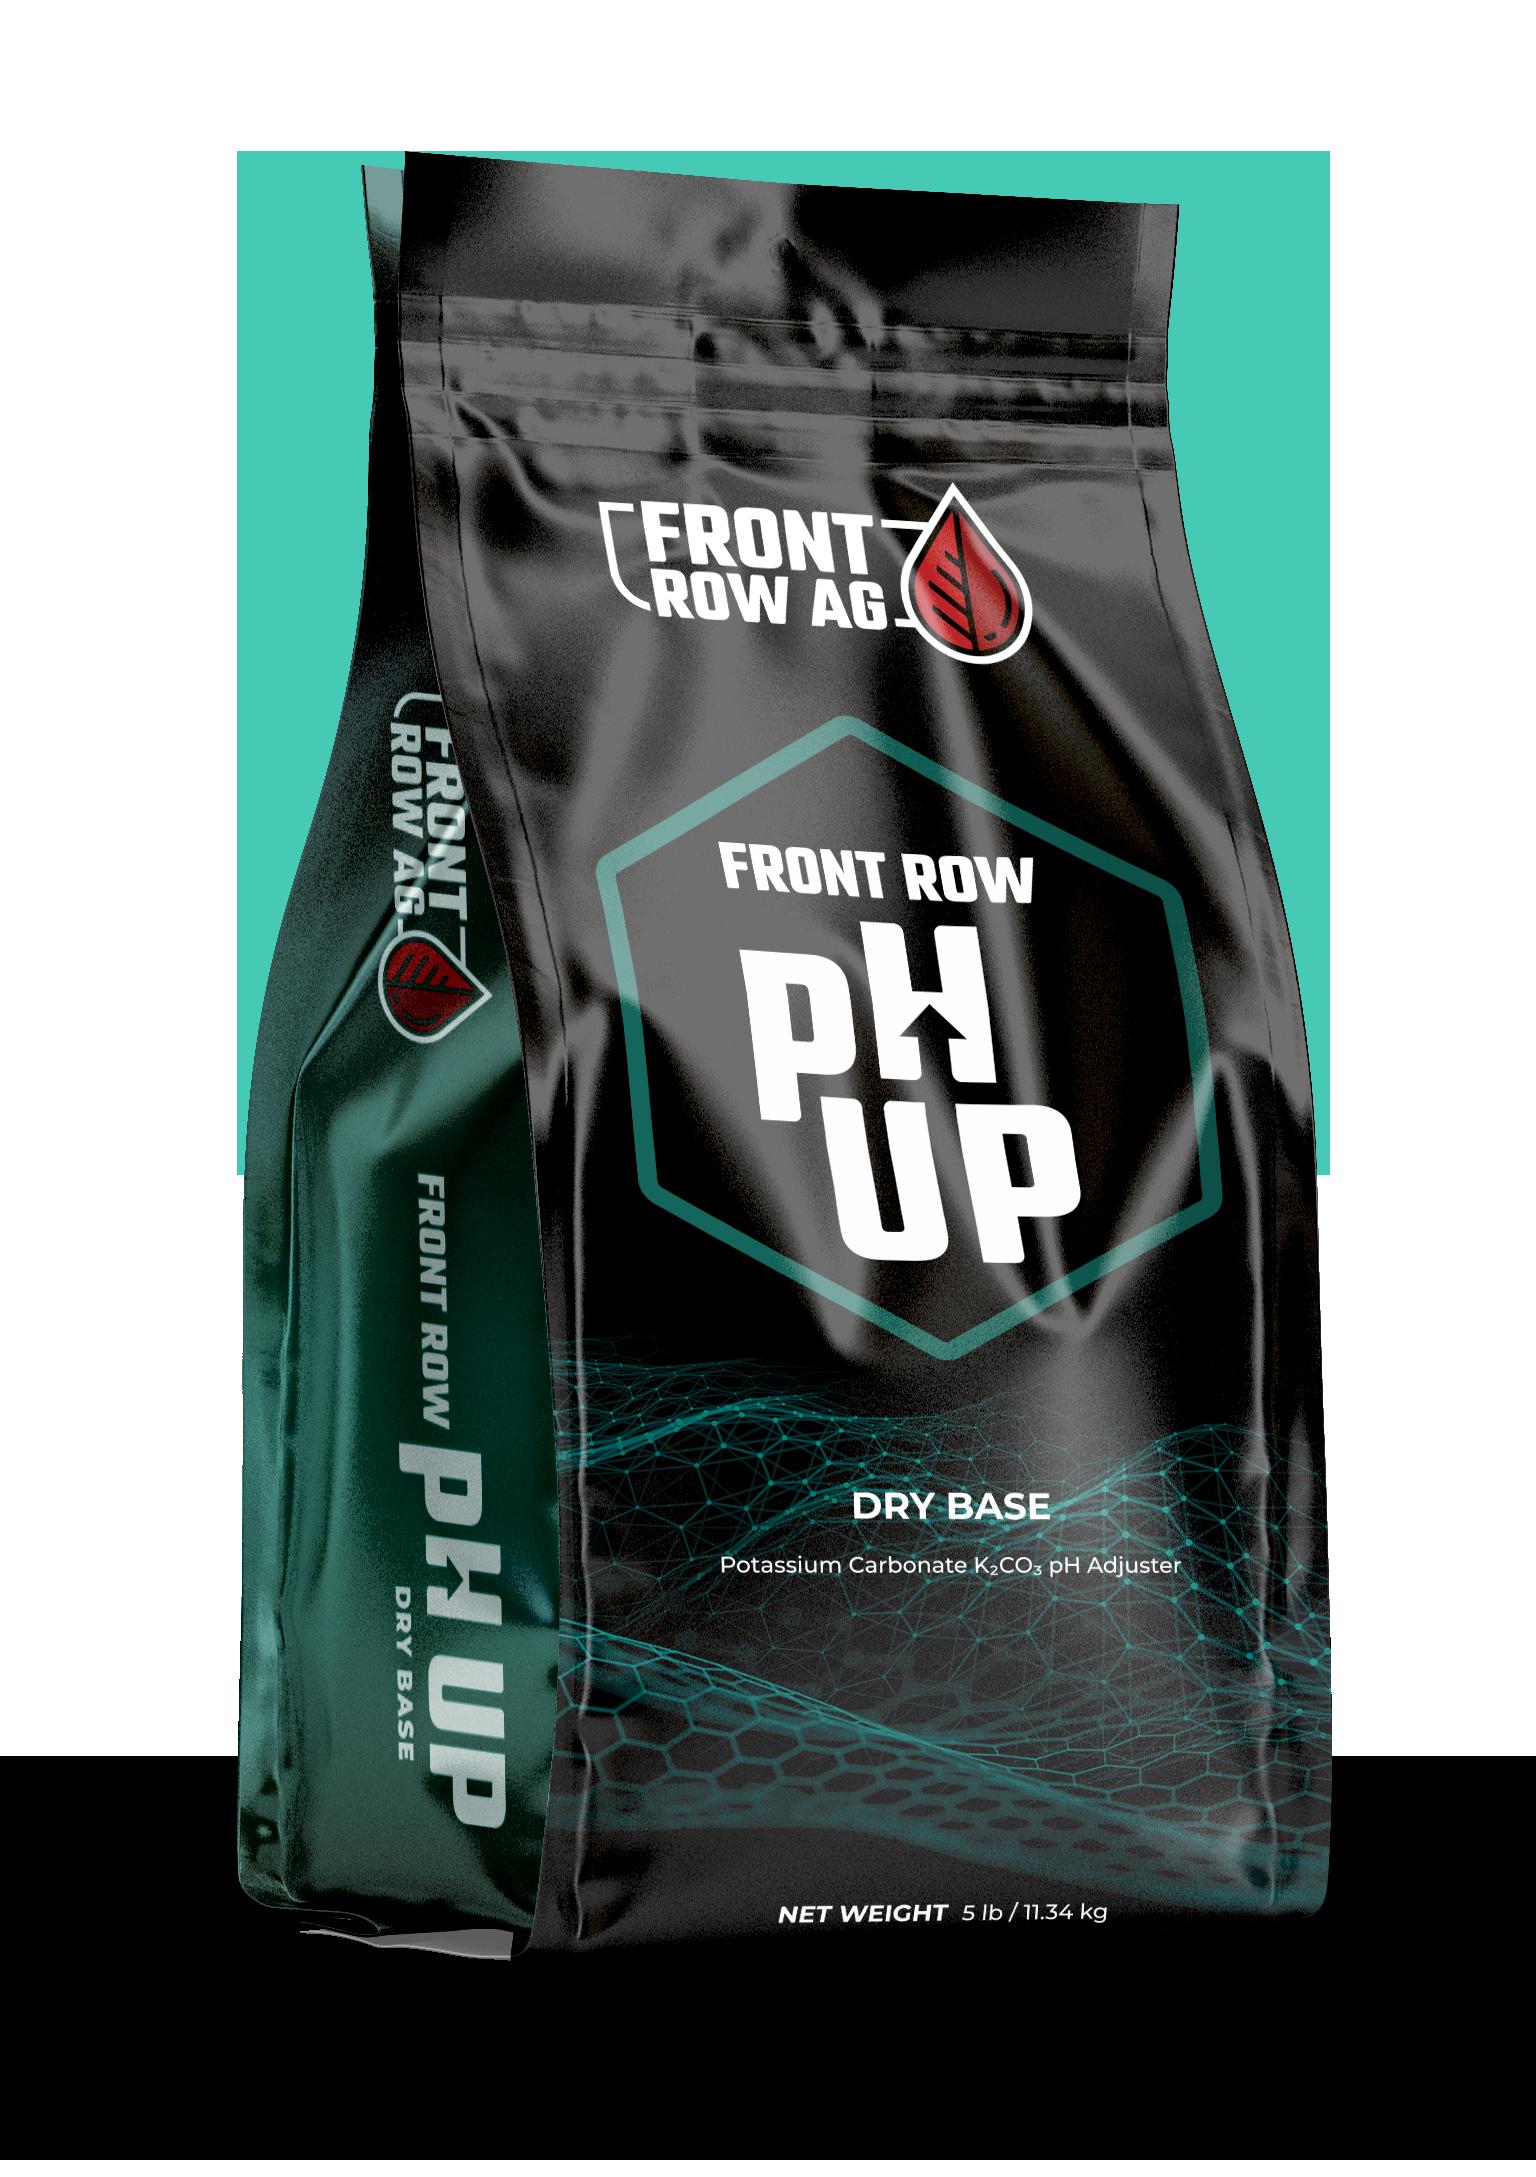
Front Row pH Up is a powdered, dry soluble water conditioner intended to control alkalinity.
Front Row pH Up uses potassium carbonate to buffer fertilizer acidity, thus increasing pH.
DRY BASE
Front Row pH Up is only for use with acidic nutrient programs and very low to zero alkalinity source water. Consult a hydrology expert or representative for appropriate usage and dosage for your system.
Use rate is based on solution conductivity and recipe. Make test solutions of all nutrient recipes and conductivities. When targeting a specific pH value, avoid using an acid and base in the same solution.
Use minimum amount of Front Row pH Up to achieve desired pH. Allow variance of ±0.1 pH. Check pH at the emitter or as close to the crop zone as possible. Carbonates take time to react. For automated systems, reading pH too close to Front Row pH Up injection or batch tank may lead to incorrect usage.

TRIOLOGIC ROOT INOCULANT
What is it?
Triologic is a powerful microbial root inoculant designed to boost plant growth by promoting mycorrhizal colonization. It contains high concentrations of rhizobacteria that facilitate the uptake of essential minerals, enhance fertility, and improve yield. These beneficial bacteria help plants utilize nutrients more efficiently and resist pests and diseases, especially when applied early in development. By fixing nitrogen and cycling essential nutrients like phosphorus and potassium, Triologic supports robust root health and aids mycorrhizae formation.
Why Use It?
Triologic’s highly concentrated bacteria work within the substrate to increase yield, improve fertility, and enhance resistance to pests and disease. Applying these bacteria to the root zone early in a plant’s development can reduce the effects of abiotic stresses while making more efficient use of fertilizers.
How Does it Work?
Plant growth-promoting rhizobacteria colonies in the substrate fix nitrogen and cycle essential nutrients, including phosphorus and potassium, into forms easily available to the plant roots. Additionally, these beneficial bacteria help supply nutrition to the mycorrhizae that protect the plant roots, aiding the formation of beneficial fungal colonies.
Recommended Usage
1 ml/Gal (0.26 ml/L), 1x per week. See Page 36-37 for more usage recommendations. Best used as a hand water drench.
With TRIOLOGIC, you can expect healthier, more resilient plants and higher yields.


HOW TRIOLOGIC FACILITATES MYCORRIZAL COLONIZATION
BY DR. TRACY LETAIN
Mycorrhizae are symbiotic fungi that colonize plant roots, offering several advantages for plants, including:
• Extending the root system for better access to nutrients and water
• Forming a protective barrier against root pathogens
• Mitigating plant stress response through multiple mechanisms. Given these advantages, it’s clear why many growers consider mycorrhizal products a key part of their growing system.
In this context, why recommend Triologic? Isn’t it a bacterial root inoculant that contains no mycorrhizae? The answer is straightforward: If you want to maximize plant nutrient uptake and mycorrhizal root colonization, incorporating Triologic into your grow program is essential.
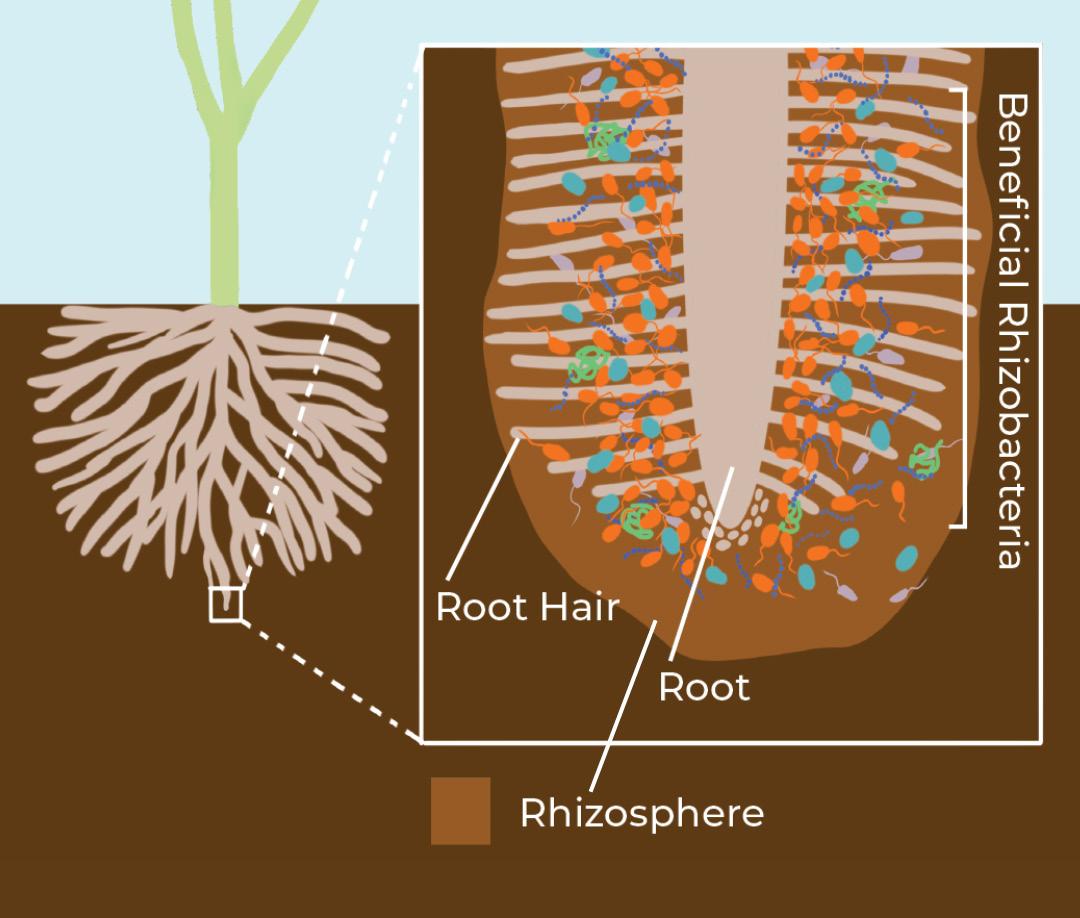
For mycorrhizae to effectively colonize plant roots, the surrounding root environment, called the rhizosphere, must support this colonization process. Triologic’s specialized group of bacteria, known as Mycorrhization Helper Bacteria (MHB), are central to this process.
The rhizosphere - area surrounding root and root hairs - supports mycorrhization when inoculated with Triologic The rhizosphere (area surrounding root and root hairs), supports mycorrhization when inoculated with Triologic.
MHB are not only essential for initiating mycorrhizal colonization but also play a vital role in maintaining the mycorrhizal-plant root relationship. A less successful colonization could lead to rapid mycorrhizae die-off, leaving the roots unprotected.


How Triologic Facilitates Mycorrhization
(continued)
The MHB in Triologic facilitate mycorrhizae-root colonization through various mechanisms:
Promotion of Mycorrhizae Spore Germination
In sterile soils, spore germination is much lower than in soils inoculated with MHB. MHB produce specific metabolites that are believed to act as signals for germination.
Promotion of mycorrhizal fungal growth prior to root colonization
MHB play a key role by forming a rhizosphere environment that can support mycorrhizae growth and development on plant roots. MHB do this by providing sufficient nutrients that mycorrhizae need to colonize plant roots, and by breaking down and removing harmful material – such as antifungal compounds – that actively prevents mycorrhizal growth.
Promotion of the plant root’s ability to allow mycorrhizal colonization
Mycorrhizae cannot randomly colonize any part of the plant root that they encounter. Instead, they preferentially grow on “short” or “fine” root hairs – newer root growth which has a softer cell wall that the mycorrhizae can penetrate. The ability of MHB to help promote new root growth is well-documented. MHB can also
“soften” older roots using a variety of enzymes, which can allow for mycorrhizal colonization on older root tissue.
Promotion of the root-mycorrhizae recognition process
The root colonization process is complex, with both fungi and plants producing a variety of chemical signals such as phytohormones, organic acids, sugars and adhesions during the initiation of colonization. MHB also produce these signaling compounds, and can alter existing compounds that may interfere with the colonization process.
How To Apply Triologic and Mycorrhizae in Your Cultivation Process
To practically apply these insights, consider the following strategies for using Triologic alongside mycorrhizae:
Initiate co-inoculation with mycorrhizae and Triologic via clone feeds as soon as the first roots emerge from the clone plug.
This early application ensures the plant’s root system benefits from both agents from the start.
Triologic can be applied at a rate of 1-2 ml per gallon of water, optimizing colonization without overwhelming the plant’s environment.


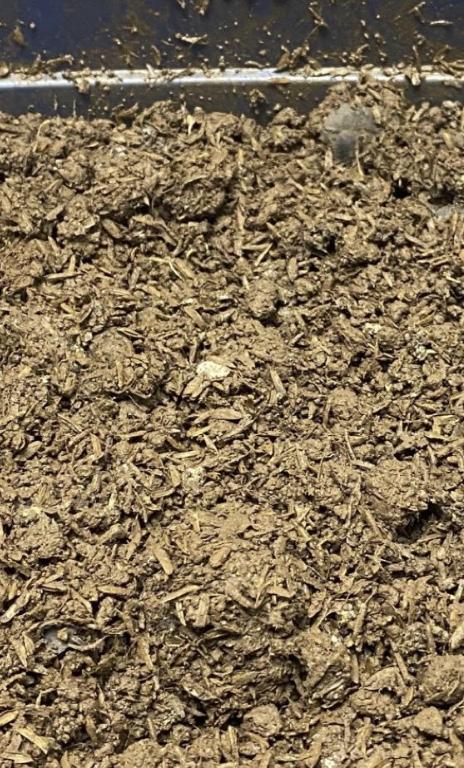
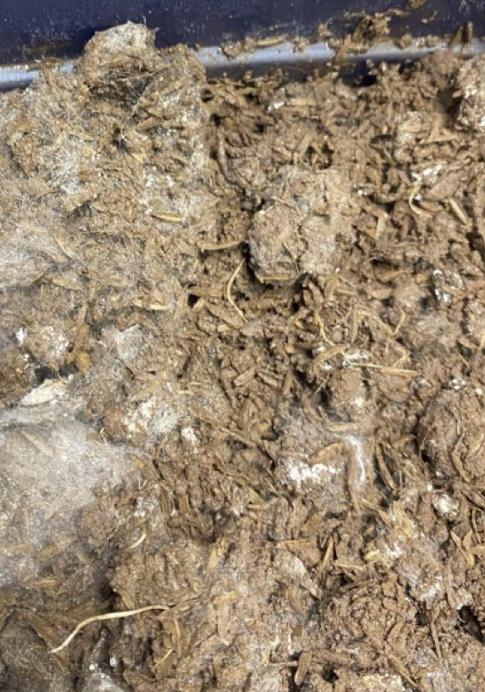
At the time of planting the clone, apply Triologic and mycorrhizae at 2ml per gallon, with granular mycorrhizae directly to the planting hole, supporting root growth in various mediums, including soil, rockwool, and coco. One test we use to ensure full activity involves inoculating Triologic into substrate containing seeds, and charting the growth of mycorrhizae compared to uninoculated substrate. With Triologic, we see rapid mycorrhizal growth within 72 hours which persists to the end of the two-week test, while with uninoculated substrate we find spotty growth which rapidly dies back. See photos below.
Conclusion
Front Row Ag’s protocols allow for a flexible, synganic approach that integrates the best synthetic nutrients with targeted biologicals to ensure high yields, healthy plants, and top quality.
The practical application of Triologic and mycorrhizae as detailed here exemplifies our commitment to enhancing plant health through innovative, synergistic approaches, ensuring growers can leverage the full benefits of mycorrhizal colonization.


SHOP NOW
UNLOCKING PLANT POTENTIAL WITH TRIOLOGIC
WHAT ARE THE BENEFITS OF TRIOLOGIC?
Triologic is a plant root inoculant formulated with a potent blend of plant growth promoting rhizobacteria. These beneficial microorganisms colonize plant roots, aiding in nutrient acquisition and stress response. Here’s what Triologic does for your plants:


Enhanced Nutrient Absorption: The healthy rhizosphere created by Triologic promotes better nutrient uptake during crucial growth stages, resulting in increased yields, improved plant health, and enhanced crop quality and uniformity.
Comprehensive Growth Support: Triologic supports plant development throughout the entire growth cycle, from clone to harvest. It ensures availability of a full range of nutrients, including NPK and trace elements, maximizing cannabinoid levels and contributing to improved plant health.
Stress Management: By reinforcing the plant’s natural defenses and fostering nutrient availability, Triologic helps plants cope with various stressors, such as disease, nutrient imbalances, and temperature extremes. It also aids in preventing stress-related injuries.
CUSTOMER-REPORTED RESULTS




31% Increased THC Levels in Cannabis
A 31% increase in THC content in Triologic-treated cannabis compared to the control group. The application of Triologic contributes to elevated THC levels, benefiting cannabis growers.
55% Table Grapes Yield Enhancement
Triologic treatment lead to a 55% higher yield of exportquality table grapes compared to the control group, resulting in increased revenue per acre and improved fruit quality.
6% Almond Yield Improvement
5-acre almond trees treated with Triologic experience a 6.19% higher almond meat yield, leading to increased revenue and positive Return on Investment (ROI).
23% Higher Strawberry Yield + Improved Quality
Triologic-treated strawberries show a 23% higher overall yield and improved fruit quality.
Brix levels and moisture content also indicate favorable outcomes.
The beneficial rhizobacteria form a living bridge between roots and nutrients, facilitating efficient nutrient absorption.
Triologic unlocks plant potential through a dynamic partnership between roots and beneficial rhizobacteria.
Within the rhizosphere, (the few millimeters of soil surrounding plant roots,) this partnership facilitates growth, resilience, and nutrient absorption.
Plants ‘feed’ Triologic microbes organic acids and oxygen, putting them in close proximity to the plant root. In return all nutrients the bacteria make available for themselves are also available to this plant root.
By nurturing mycorrhizal colonization, Triologic optimizes water and phosphate uptake, bolsters defense against pathogens, and ensures nutrient availability.



When and how do I use Triologic in my growing schedule?
Apply Triologic when starting fertilization or early in the growth cycle. Even if the season has begun, applying Triologic can still benefit plants.
Is Triologic compatible with other treatments? Triologic works well with most fertilizers, herbicides, and pesticides. Apply it before or after herbicide/pesticide use for optimal results.
FAQ
ROOT ANATOMY DIAGRAM
BIOFLO
ALL NATURAL IRRIGATION LINE CLEANER
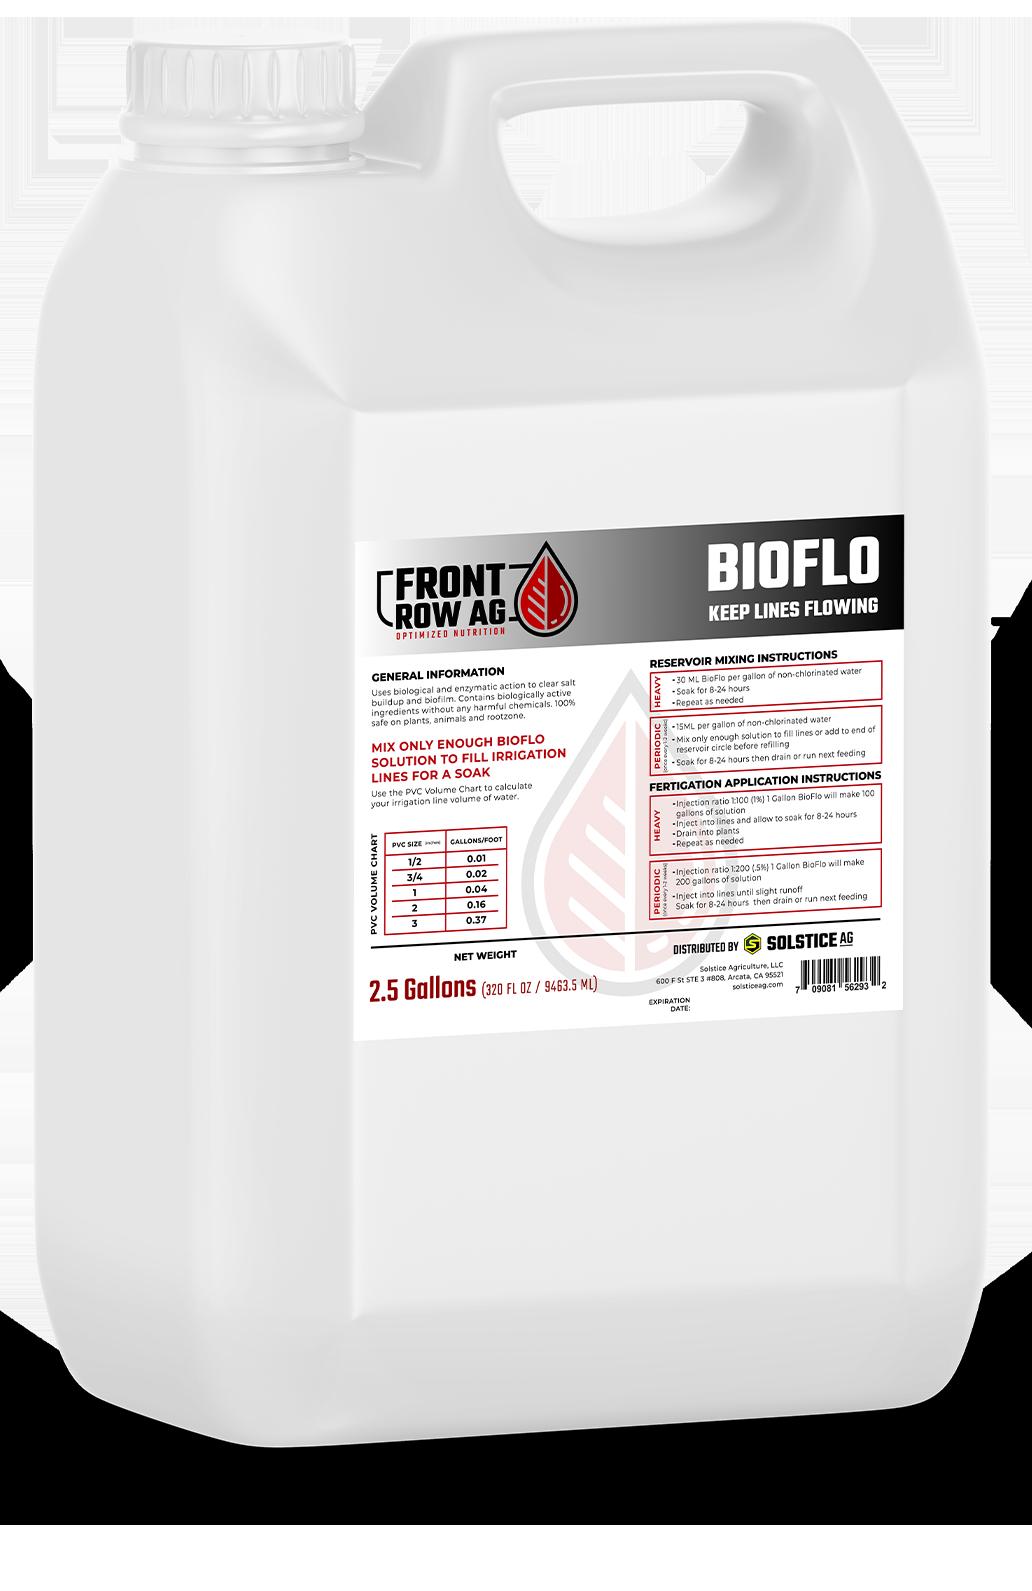
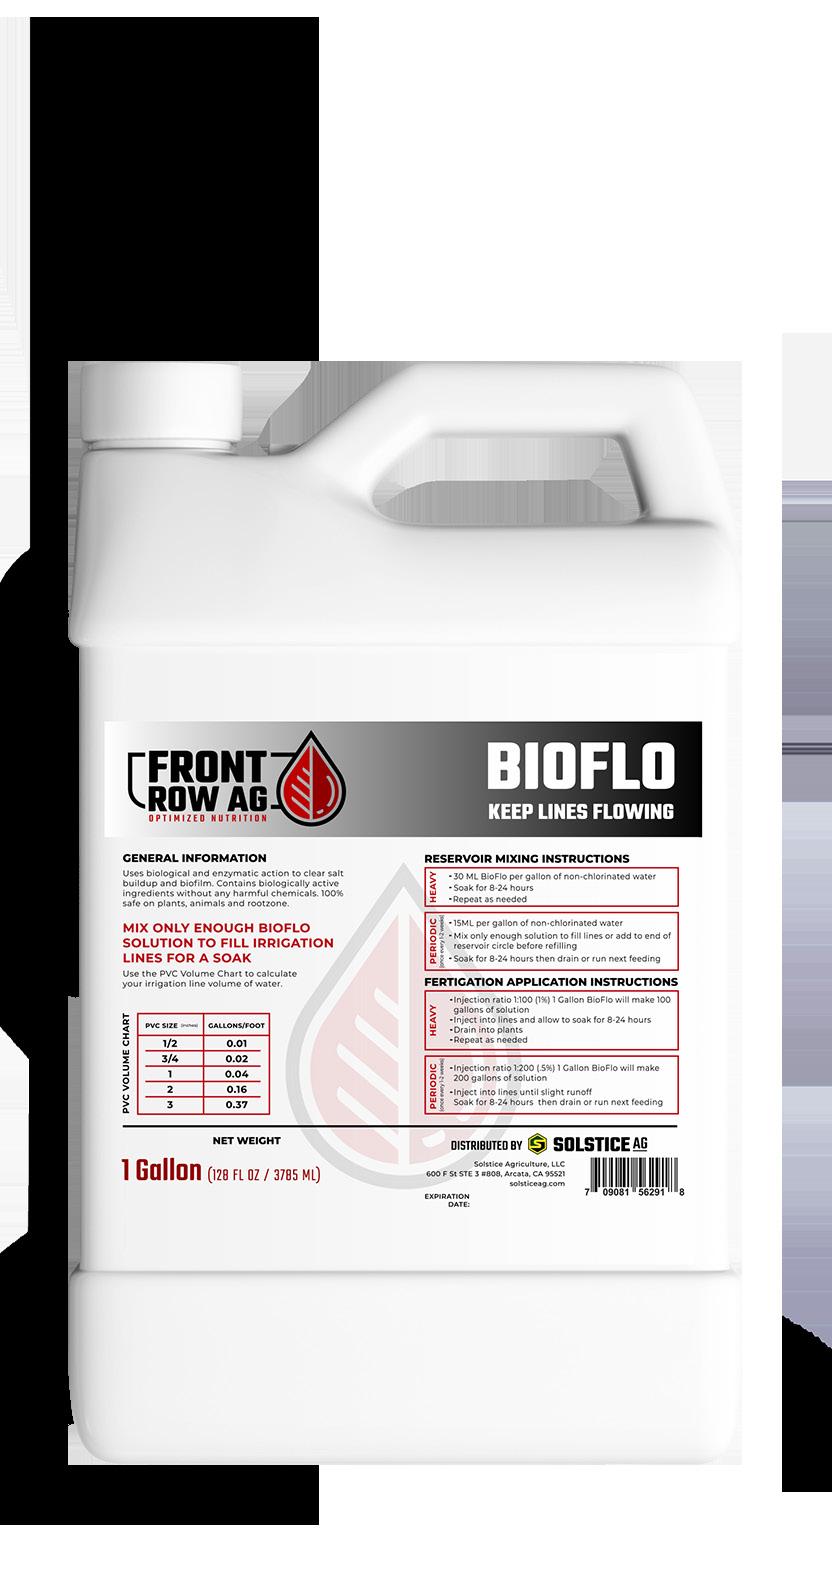
Clean your lines, emitters, & equipment without harming your plants or beneficial microbes downstream.

WHAT MAKES BIOFLO THE BEST CLEANER FOR BIOFILM?
BioFlo is an all-natural bio-enzyme solution that uses biological and enzymatic action to clear biofilm. Contains biologically active ingredients without any harmful chemicals and is 100% safe on plants, animals and rootzone.
• BioFlo restores irrigation systems to full capacity by clearing clogged lines and emitters.
• Unlike chemical irrigation line treatments, BioFlo does not harm plants or soil and is safe to use throughout the growing process.
• Compatible with injectors, reservoirs, and tank application systems.
• BioFlo can be used to treat existing clogs and to prevent future clogs.
• BioFlo cleans out hydroponic and nutrient water reservoir accumulations.
UNDERSTANDING BIOFILM CLOGS IN IRRIGATION SYSTEMS
Biofilm clogs form rapidly in cool, moist environments – exactly the environments found in irrigation lines. Microbes come from common additives such as fertilizers. Fertilizer nutrients act as food for biofilm microbe growth.
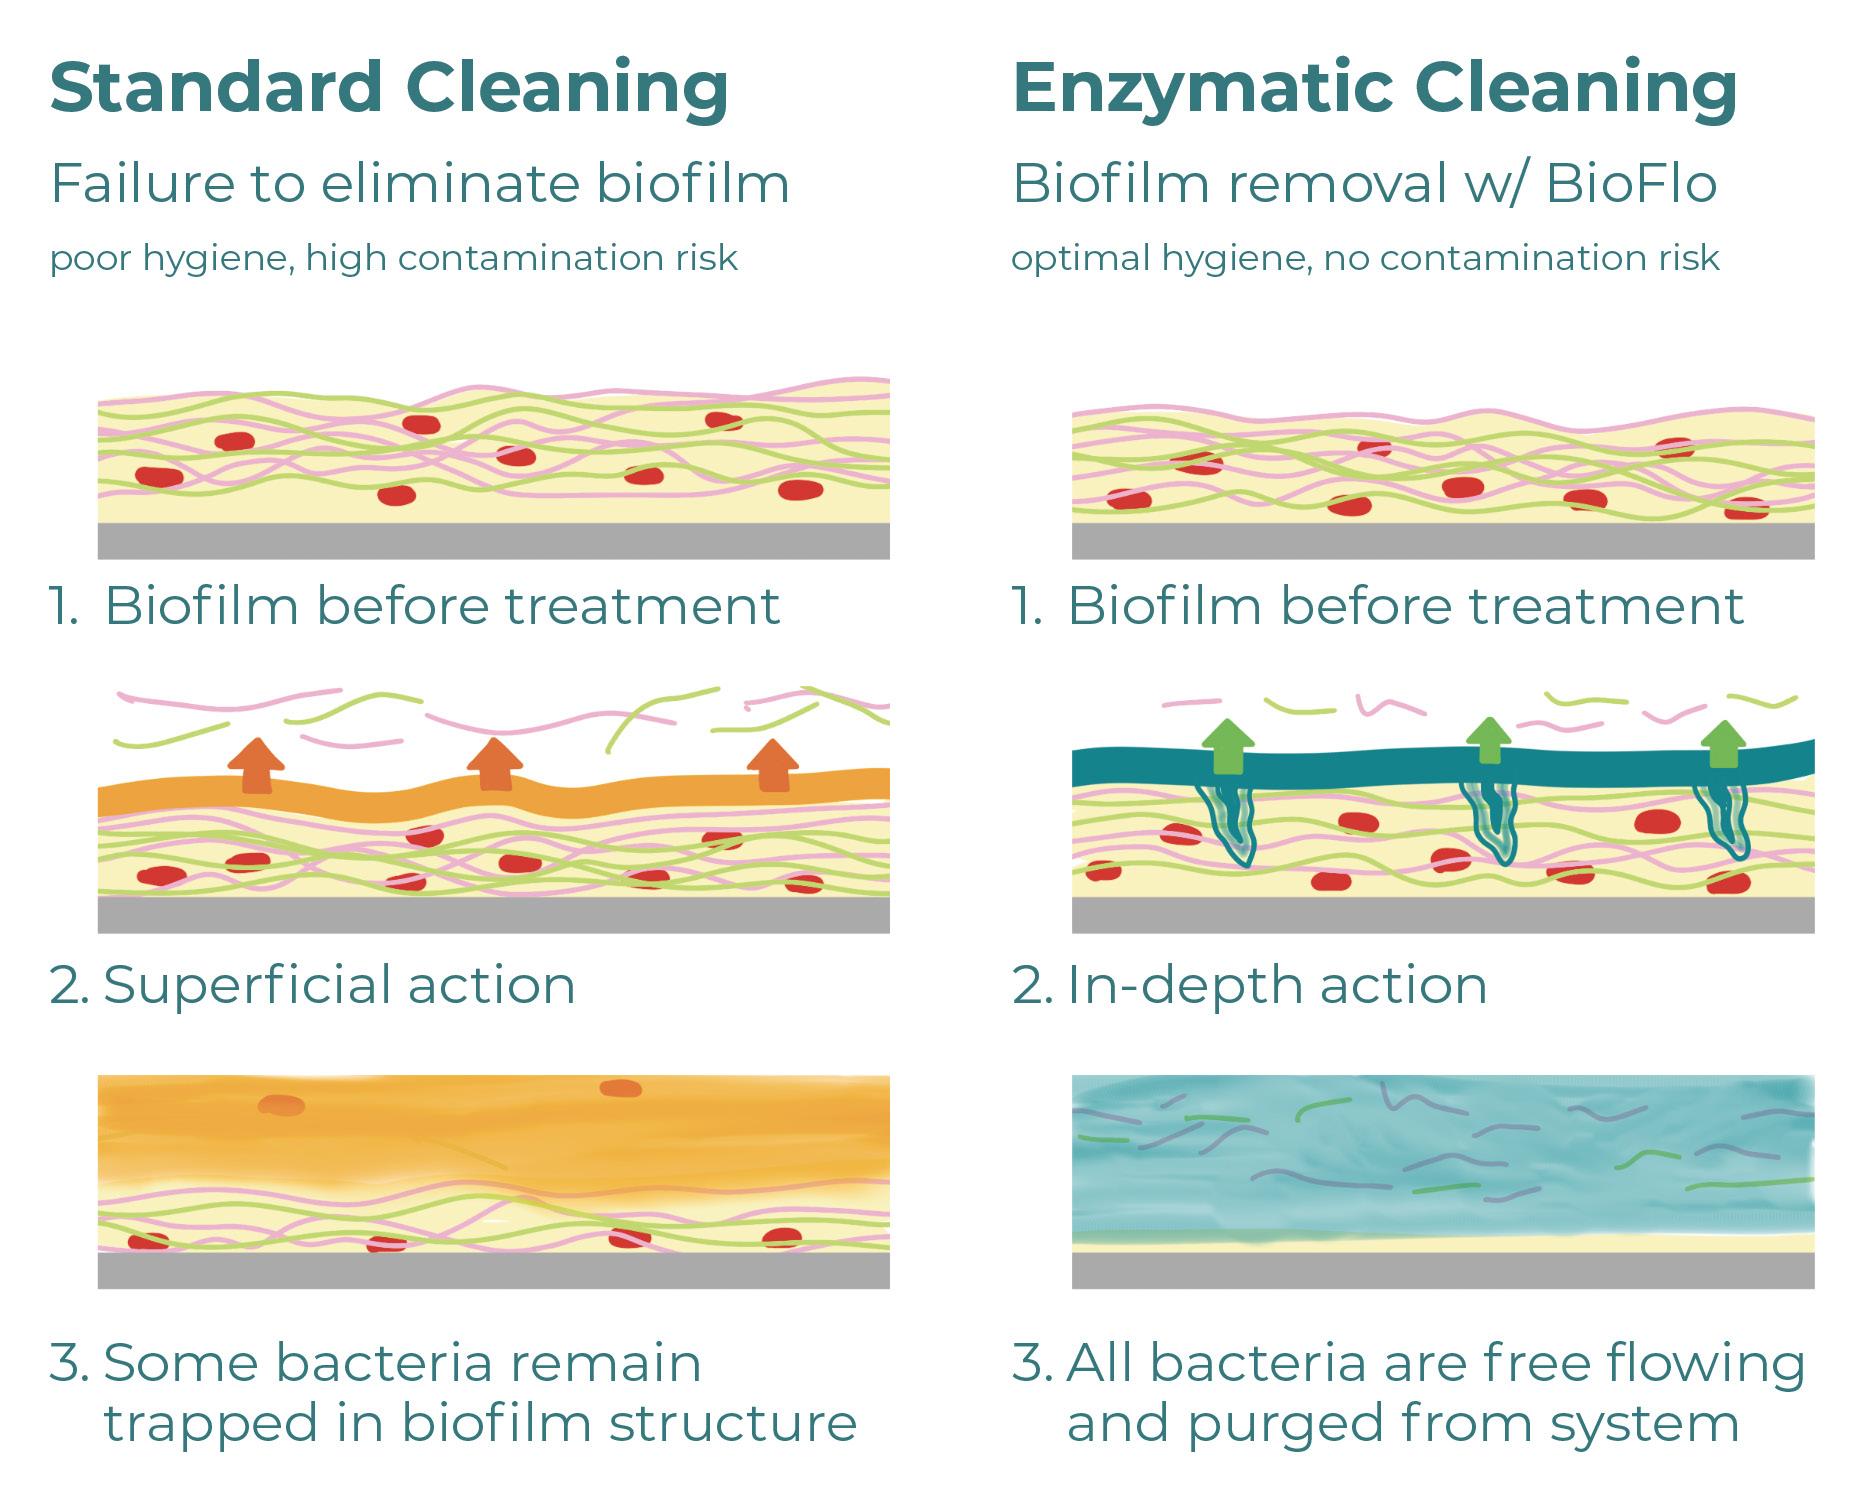
Once a biofilm starts to grow, it “sheds” microbes, which then make even more new biofilms. Biofilms are extremely difficult to remove, as chemical treatments can’t penetrate past the biofilm surface.
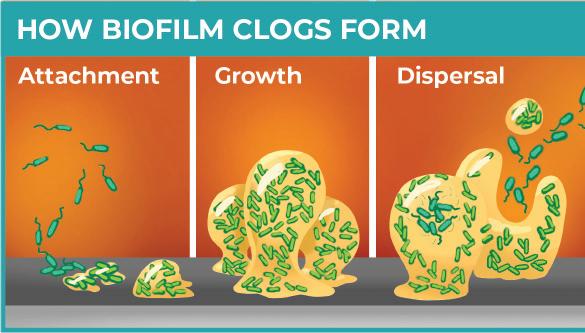

In order to clear biofilm irrigation line clogs, your line cleaner must have the ability to rapidly break down the macromolecules that make up the biofilms.

BIOFLO VS. STANDARD LINE CLEANERS
Standard irrigation line clog treatments use chemicals that only treat the surface of irrigation line clogs, and damage plants and soil. BioFlo is comprised of microbes that actively “digest” and break down biofilm
clogs entirely, not just clog surfaces. BioFlo microbes are 100% natural and can be used throughout the growing season. BioFlo works on irrigation lines, emitters, reservoirs - any surfaces with biofilm and scale accumulations.
BIOFLO USAGE INSTRUCTIONS
Use the PVC Volume Chart to calculate your irrigation line volume of water.
CLOGS 101
What Causes Irrigation Line Clogs? Monitoring & Maintenance Best Practices
A guide to irrigation system clogs in cultivation - their causes and effective solutions. Learn how to prevent, identify, and address blockages through best practices in water treatment, nutrient management, irrigation system design, monitoring, maintenance and more. 3 real life case studies are included!
Irrigation system problems are among the most common and costly issues faced by cultivators, leading to damage to crop health, reduced yields, and high labor costs for emergency repairs and replacements.
While hydroponic irrigation systems vary in design, this article focuses on the common issues found in precision drip systems (PDS), which are widely used in commercial controlled environment agriculture (CEA). These systems typically include mainline supply pipes, distribution lines, and small-diameter delivery tubes with emitters at each plant.
Proper flow in irrigation systems is essential for several key reasons:
○ Nutrient delivery: Adequate flow ensures that all plants receive the necessary nutrients in the right proportions. Uneven distribution due to clogs can lead to nutrient deficiencies and imbalances.
○ Uniform saturation and runoff: Irrigated volumes need to be consistent at each plant site to ensure that substrate water content and EC are correctly targeted, and to allow sufficient runoff at each plant for mineral replenishment.
○ System longevity: Clogs can cause undue stress on pumps, leading to premature failure. Maintaining proper flow ensures the system works efficiently and extends equipment life.
○ Labor savings: Dealing with clogs and poor irrigation uniformity impacts labor costs and reduces the labor availability for crop care.
Proper functioning of irrigation systems is required for optimal plant growth, nutrient uptake, and overall system health. Clogs disrupt flow, causing issues that negatively affect plant performance and system longevity. Beyond that, cultivators cannot effectively implement advanced irrigation techniques for comprehensive crop steering without uniform water/fertilizer delivery and consistent substrate conditions.
In the following sections, we will explore strategies and solutions to help cultivators address these common irrigation issues, ensuring optimal system performance and crop health.
TYPES OF CLOGS
As a cultivator, you may encounter three main types of clogs in your irrigation system: physical, chemical, and biological. Understanding the differences between these clogs is key for effectively addressing and preventing them.
PHYSICAL
Physical clogs are caused by suspended particles in the source or irrigation water. Sources of these particles include sand and other suspended debris that are too large to pump through the channels of drip emitters. These are the least common in hydroponic systems where source water is already quite clean (municipal) and easily ensured with basic sediment filters.
CHEMICAL/MINERAL
Emitter blockages often occur from chemical reactions due to...

Shi, K.; Lu, T.; Zheng, W.; Zhang, X.; Zhangzhong, L. A Review of the Category, Mechanism, and Controlling Methods of Chemical Clogging in Drip Irrigation System. Agriculture 2022, 12, 202. https://doi.org/10.3390/agriculture12020202


HOW TO USE FRONT ROW AG

HOW TO MIX & USE OUR PRODUCTS
The 2 Types of Fertilizer Preparation
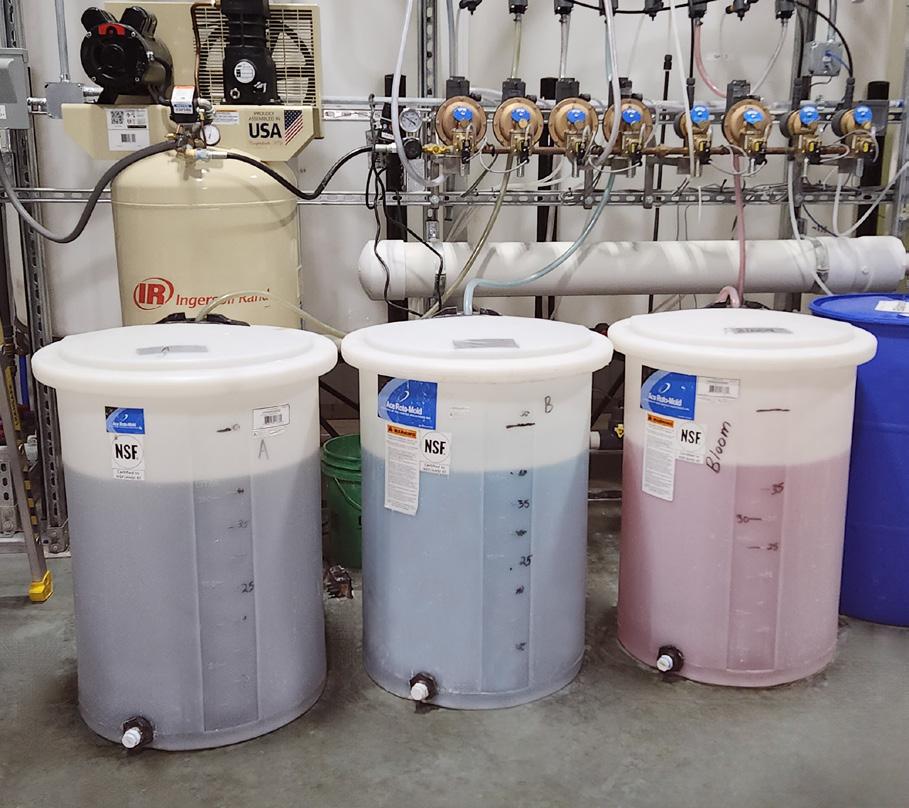
Stock Concentrates:
Turning dry soluble fertilizer into concentrated liquid fertilizer.
Stock Concentrates are highly concentrated solutions prepared in advance. They can be added as a DTR solution, or injected using dosing or fertigation equipment. This method allows for precise control and automation, less mixing frequencies, and lasts longer than DTR due to higher salinity.
Direct to Reservoir (DTR):
Adding fertilizer part-by-part into liquid to create ready-to-feed solution.
In DTR, fertilizer is directly added to a batch tank or reservoir following the prescribed order and mixing between each addition. This solution is fed directly to plants.
DTR a common practice for facilities that do not have access to dosing or fertigation equipment. Fertilizer can be added directly to water holding reservoirs of any size/capacity.
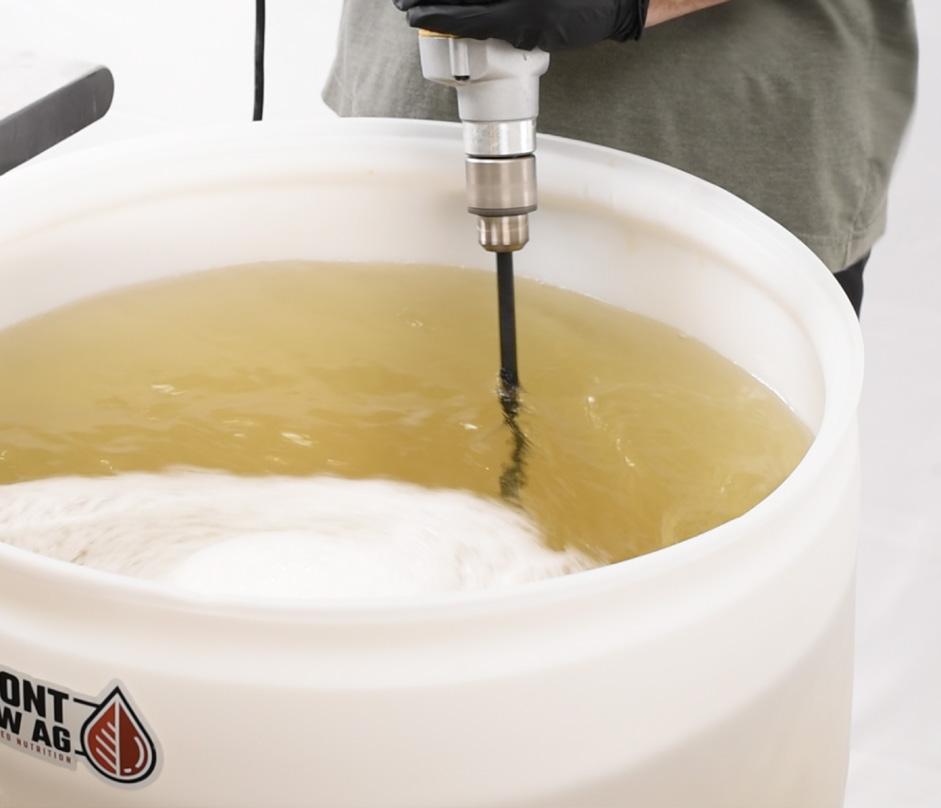
With either method, the order in which you mix the products matters.
By following the prescribed mixing order for Front Row Ag’s 3-part fertilizer system, you ensure optimal solubility, effective pH management, efficient micronutrient delivery, balanced nutrient ratios, and minimized risk of precipitation.
WHY MIXING ORDER MATTERS
When using Front Row Ag’s 3-part “A, B, and Bloom” dry-soluble fertilizer system, following the correct mixing order is important for creating an effective and stable Ready-To-Use (RTU) fertilizer solution. Here’s why the mixing order matters:
Optimizing Solubility
Part A goes in first because it contributes the most weight and electrical conductivity (EC). Starting with the highest weight product that has the least salinity makes it easier to dissolve. As we progress through Part B and Bloom, the EC and weight contributions gradually decrease while acidity of the parts increases. This helps maintain solubility as new components are added.
Preventing Precipitation
Non-organic additives that might form precipitates are added early in the process. This ensures they mix with the lowest EC water and are at their most dilute when encountering the main fertilizers, reducing the risk of precipitation.
Micronutrient Delivery
Micronutrients are included with Calcium Nitrate in Part A.
This strategy serves multiple purposes:
1. It provides a high concentration and quality ratio of micronutrients, which are crucial for plant performance.
2. By combining micronutrients with Calcium Nitrate, we ensure that an optimal and precise quantity of micronutrients will be applied automatically with the macronutrients.
3. This combination makes it easier to validate the presence of micronutrients, as independent micronutrient packages can be difficult to verify due to their low EC.
Balanced
Nutrient Ratios
While Calcium is important, it’s easy for a formulation to have too much. By including Potassium Nitrate in the mix, we maintain the necessary Nitrogen values while reducing Calcium to ideal levels.
pH Management
More acidic components are added later in the process to aid in solubility. Additionally, we recommend the principle of “pH down first, pH up last” to maintain optimal solubility throughout the mixing process. Most minerals have higher solubility at lower pH. By the time you reach the Bloom part, which is more acidic, the other components are already well-dissolved.


ABOUT OUR FEED CHARTS
Our Phases & Phase Recipes
On each Front Row Ag Feed Chart, you’ll see that there are several “Recipes” that are used strategically at different stages: Stretch, Stack, Swell and Ripen. These recipes represent different ratios of the input fertilizers, that create different elemental ratios of plant nutrients. This allows cultivators to deliver the general ratios of minerals appropriate for each phase of plant development.



Clones and Mother Plants
Most nitrogen forward recipe favoring calcium for biomass growth.
Weeks 1 & 2 of Flower
Introduces Bloom, first increases of P&K, giving cues to initiate flower.
Weeks 3, 4, 5 of Flower
Most balanced flower recipe. Heighten levels of P, K plus Mg and S.
Prefer to keep it simple?
Use The Stack Recipe
Weeks 6, 7, 8 of Flower
Highest P&K relative to equal parts A & B for promoting density and flower swell
Final 2 Weeks of Flower
Decreases N for finishing cues promoting optimal aroma, yield, color, and cure.
While using all the recipes can be quite beneficial, it’s important to note that most cultivars don’t need to have the recipe changed across the growth phases and perform optimally running the “Stack” recipe for the entire flowering cycle.
FEED CHARTS
ANATOMY OF A FEED CHART
2 Strength Options:
Standard or High Strength
Standard strength charts are designed for general use, high strength feed charts are tailored for more intensive agricultural practices where plants require higher concentrations of nutrients, often due to specific growth conditions, higher lighting intensity, and advanced cultivation techniques.
Units of Measurement
Feed Charts show the usage rate for each part in “grams per gallon” or “grams per liter” for dry powder and “mL per gallon” or “mL per liter” for liquids. When mixing tanks, multiply the usage rate by the total number of gallons or liters being mixed to determine how much fertilizer to use.
EC Contributions
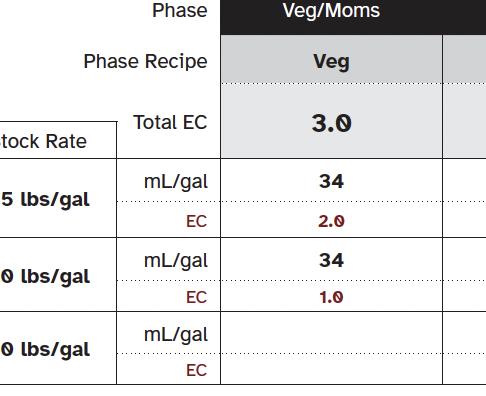
Each input row on the feed chart contains the usage rate e.g. g/gal or ml/gal as well as the EC contributed from that part. This indicates the EC in the batch tank that is directly contributed from that part alone. Ex. In the High Strength Chart Veg Recipe, Part A is contributing 2.0 EC, Part B is contributing 1.0 EC. This can be used as a good way to verify accurate additions of fertilizer.
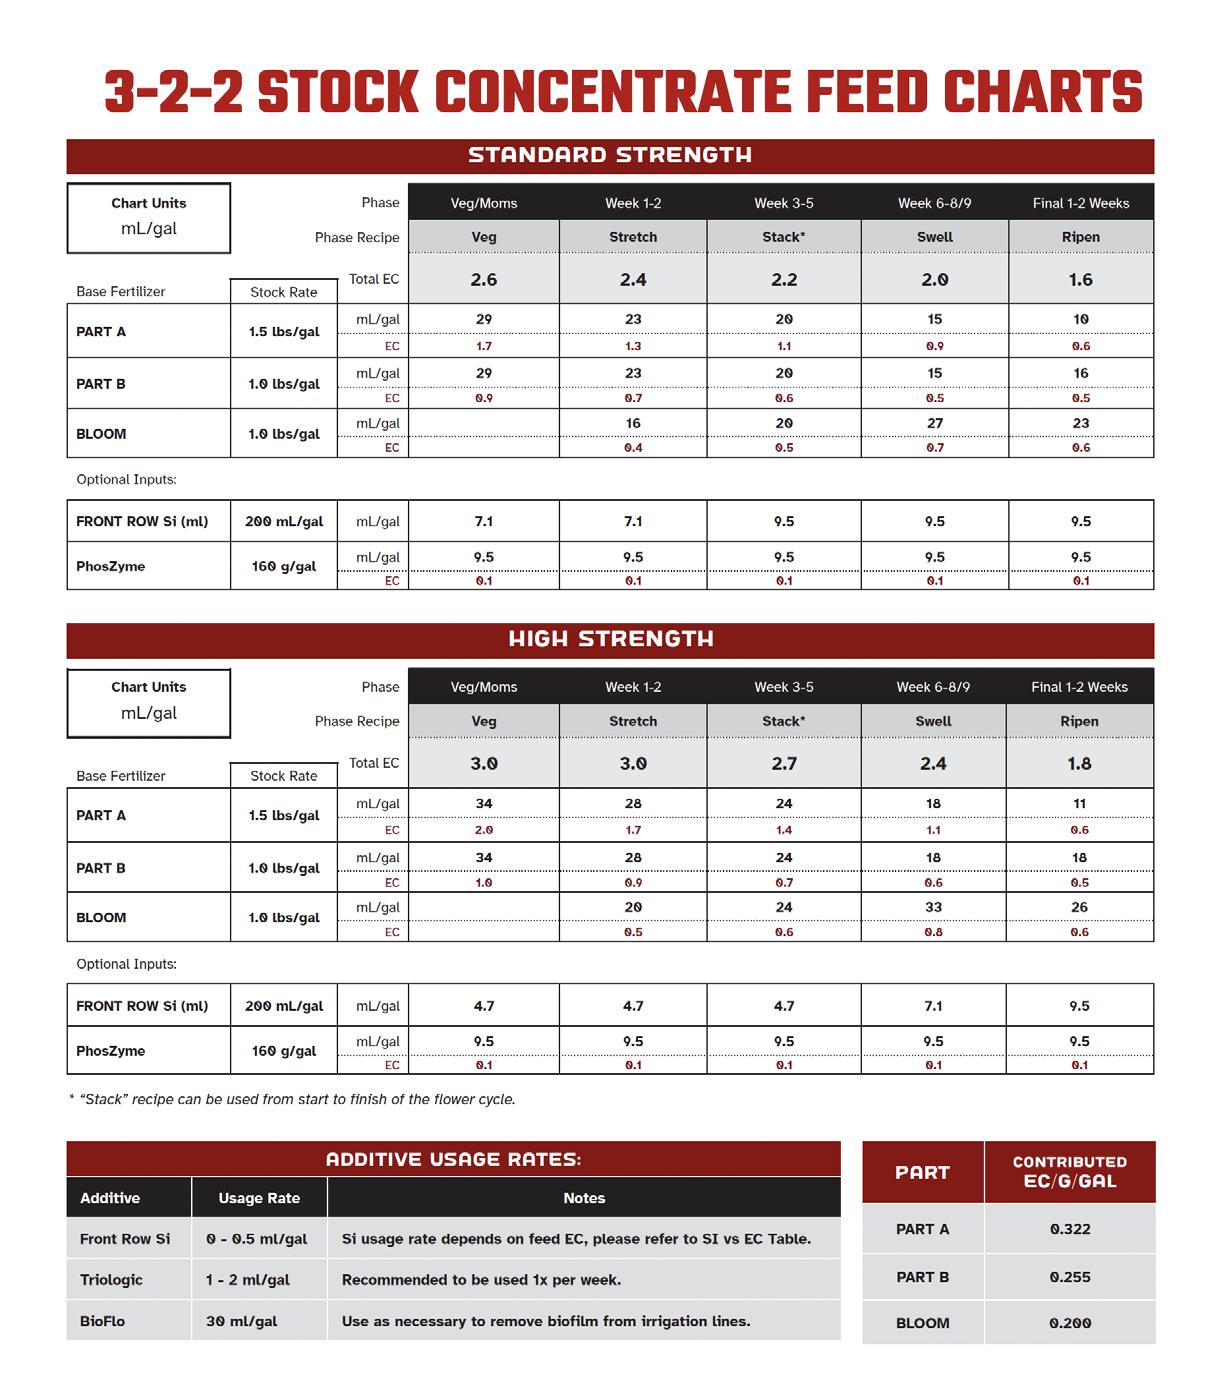
We also provide the Contributed EC per gram per gallon. We rounded to the nearest tenth on the chart in order to match most EC meter displays.
HOW TO CHOOSE THE RIGHT FEED CHART
Front Row Ag Feed Charts provide precise nutrient management protocols for controlled environment agriculture. This technical guide covers stock concentrate methods (3-2-2) and direct-to-reservoir (DTR) approaches, along with phase-specific recipes designed to optimize plant performance throughout the growth cycle.
QUICK START GUIDE
1. Choose Your Mixing Method: Stock Concentrate: For consistent, large-scale operations OR Direct to Reservoir: For smaller operations or specialized requirements
2. Select Strength Level: Standard Strength: General purpose OR High Strength: Intensive cultivation environments, highly controlled facilities
3. Determine Your Recipe Strategy: Stack Recipe: Simplified management, consistent results OR Phase-Specific: Optimized for particular growth stages or cultivar types (short/tall size and early/late flowering)
UNDERSTANDING COMPONENT RELATIONSHIPS
Key Points:
• Components work synergistically
• Ratios adjust to match growth phases
• Enables precise crop steering
Front Row Ag’s three-part system creates a complete, balanced nutrient profile through the interaction of:
Part A: Drives vegetative growth and provides essential micronutrients
Part B: Supports structural development and energy systems
Bloom: Enhances reproductive growth and secondary metabolism
The ratio between these components can be adjusted to:
• Influence growth patterns
• Support specific developmental phases
• Enable precise crop steering
• Optimize plant responses
FEED CHART FUNDAMENTALS
Key Points:
• EC requirements vary with cultivation factors
• Standard and High Strength options are available
• Component ratios drive plant responses
STRENGTH SELECTION FACTORS
Cultivation Factor Higher EC Lower EC
Container Size Reduced Larger
Irrigation Frequency Higher Reduced
Leachate Monitoring Consistent Limited
PPFD Levels Enhanced Moderate
CO2 Conditions Elevated Ambient
Environmental Control Tight Variable Genetics Heavy-feeding Light-feeding
STOCK CONCENTRATE METHODS
Key Points:
• 3-2-2 is standard for most facilities. Reach out to your sales rep if you require more concentrated stock solution or specfic injection ranges.
• Stock concentrates aren’t just for injection; they’re also the best choice for time savings, accuracy, and consistency for facilities that mix batch tanks by hand.
• Use only RO water at ~71°F
• Validate EC after mixing
• Store for up to 2-4 weeks
VALIDATION PROCESS
Stock concentrates must be validated before use to ensure proper mixing:
• For most accurate results, mix 250ml of stock concentrate into 5 gallons of RO water
• Check EC against validation values for your chosen method
• Higher validation values for 4-3-3 reflect the increased concentration of stock solutions
DIRECT TO RESERVOIR (DTR)
Key Points:
• Requires precise measurement
• Follow mixing sequence exactly
• Use within specified timeframes
• Monitor solution stability
MIXING PROCESS
Proper mixing sequence is critical for DTR applications:
1. Fill reservoir to target volume and begin agitation
2. Add Front Row Si (if using)
3. Add Part A and agitate for 3-5 minutes
4. Add Part B and agitate for 3-5 minutes
5. Add Bloom and agitate for 3-5 minutes
6. Adjust pH using pH Up in 0.05 g/ gal increments until reaching target pH (typically 5.8-6.0). Wait 15 minutes after mixing to validate.
7. Validate final EC and pH
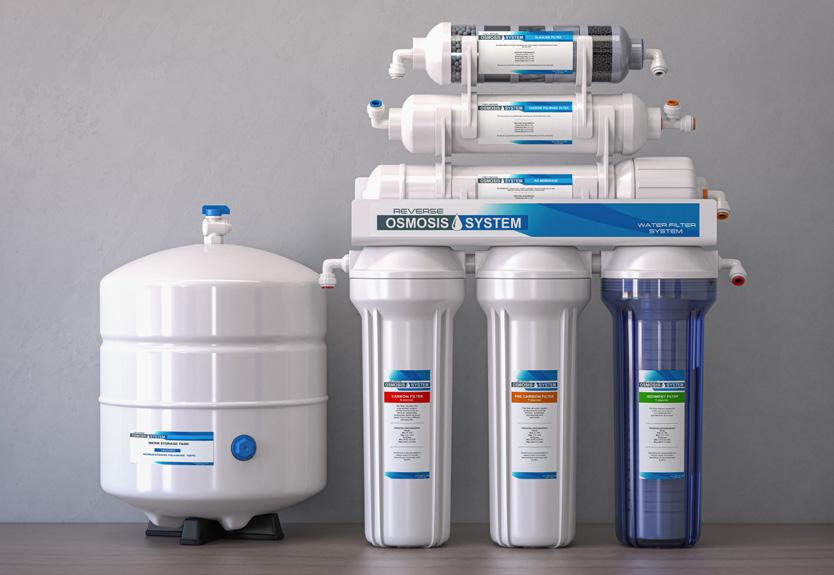
WATER QUALITY AND SANITIZATION
• Use only RO water for mixing
• Avoid using hydrogen peroxide or other strong oxidizers, as these can degrade micronutrients
• For sterile reservoir management, calcium hypochlorite at 1-3g/100 gallons is recommended. (Learn more on pages 66-71.)
FEED RECIPES AND PHASES
Key Points:
• Our Stack recipe is suitable for most applications
• Phase-specific recipes optimize growth responses as part of a crop steering strategy
• EC typically decreases through flower cycle
• Recipes support crop steering goals, providing vegetative and generative cues at strategic times
GROWTH PHASE CHARACTERISTICS
Recipe Primary Purpose
Veg Vegetative Growth
Stretch Vertical Development
Stack Full-Cycle Performance
Swell Flower Development
Ripen Finishing
Key Features
High N ratio; supports photosynthesis
Balanced ratios; promotes elongation
Consistent ratios; simplified management
Enhanced P-K ratio; balanced nutrition
Reduced N; enhanced secondary metabolism
SOLUTION STORAGE GUIDELINES
Best Used For
Initial growth phases; mother plants
Compact strains during stretch; canopy development
Standard production; most strains
Mid-to-late flower optimization
Late-stage development; long-flowering strains
Solution Type Storage Time Storage Requirements
Stock Concentrates 2-4 weeks
Opaque containers; climate-controlled area
DTR without Si 5-7 days Opaque containers; climate-controlled area
DTR with Si 48 hours
EC PROGRESSION THROUGH GROWTH CYCLE
Opaque containers; climate-controlled area
Feed EC typically starts higher in early growth stages and gradually decreases through the cycle. This pattern aligns with natural plant demands:
• Early stages (veg and first three weeks of flower) have highest nutritional requirements due to rapid growth and smaller root mass.
• As plants complete stretch phase, mineral requirements naturally decrease.
• Later stages benefit from reduced EC and/or increased runoff to manage substrate EC.
ADDITIVES
Each additive serves specific functions. Follow usage rates carefully. Consider compatibility with growth phase and monitor plant responses.
The best way to use Phoszyme with the 3-2-2 stock method is to mix it in the Part B stock solution at 54 g/gal (6lbs per 50 gal). Note that this will increase the stock validation EC to 1.69 EC.
The recommended rate for Triologic is 1 ml/Gal (0.26 ml/L), once per week. It is best applied as a hand water drench. It is most effective when applied early in plant development.
3-2-2 STOCK CONCENTRATE
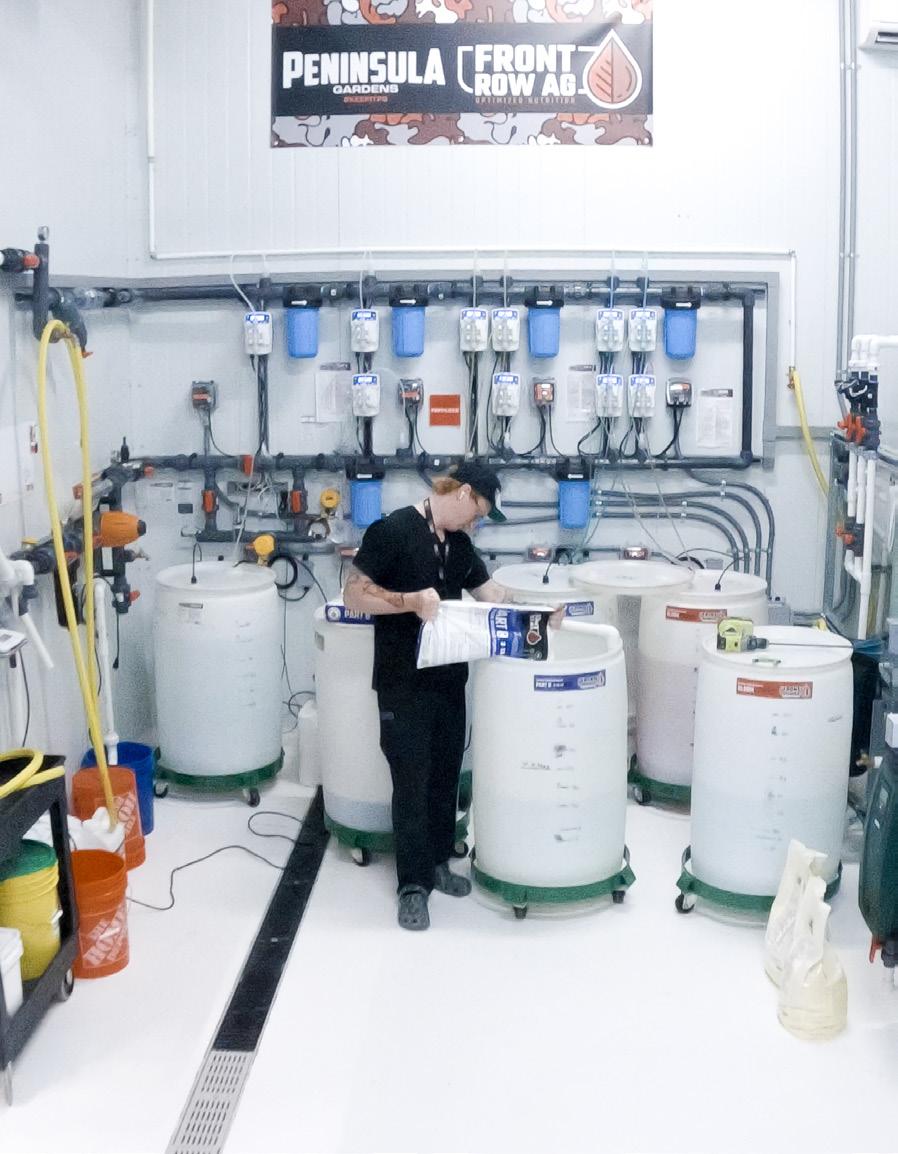
3-2-2 refers to the number of 25 lb. bags of each product that are added to individual stock concentrate drums:
• Part A: three 25 lb. bags per 50 gal. water
• Part B: two 25 lb. bags per 50 gal. water
• Bloom: two 25 lb. bags per 50 gal. water
Mixing with the 3-2-2 method allows each fertilizer part to be injected equally if using fertigation.
It’s use of whole bags to create equal volumes of stock concentrates which are used at the same rate makes it the perfect match for operations seeking consistency and simplification. Works great for facilities running fertigation.
Mixing Instructions


1. Start with clean stock tanks marked at target volume.
2. Add RO water to 50% of target volume; begin agitating the tank.
3. Add fertilizer over 5 minutes, while continuing to agitate the tank.
4. Add RO water to target volume; mix for 10 more minutes.
5. Validate and adjust stock tank as necessary.



Validation Instructions
• Remove exactly 250 ml of well-mixed stock concentrate and add to 5 gallons of RO water.
• Mix and check EC against validation chart. Adjust stock concentrate strength as necessary to match validation EC.
• Repeat for each stock concentrate, validating against EC.
3-2-2 STOCK CONCENTRATE FEED CHARTS
3-2-2
DIRECT TO RESERVOIR
Mixing Instructions
1. Fill reservoir to target volume; begin agitation.
2. Add Front Row Si*; agitate 3-5 minutes.
3. Add Part A; agitate 3-5 minutes.
4. Add Part B; agitate 3-5 minutes. If using PhosZyme, add & agitate 3-5 minutes.
5. Add Bloom; agitate 3-5 minutes.
6. Add Front Row pH Up in 0.05 g/gal steps until target pH is achieved.
* Only use Front Row Si if reservoir will be fully used within 48 hours.
Direct to Reservoir Notes
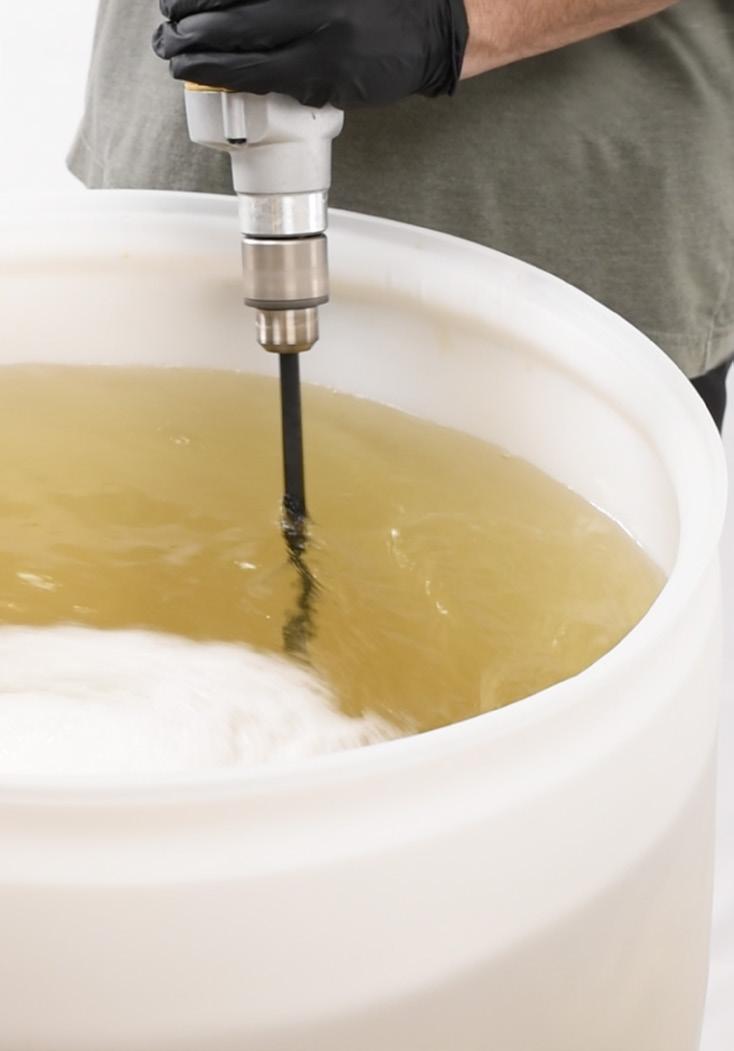
• When using Front Row Si, reservoirs should be fully used within 48 hours.
• Without Front Row Si, reservoirs should be used within 5-7 days.
• Avoid mixing strong oxidizers, especially peroxides into reservoirs. If running a sterile reservoir, use calcium hypochlorite at 1-3g / 100 gallons. Review our Cleaning Best Practices on page 58. All feed charts are based on using RO water. If your starting water has any EC, be sure to account for that in the total EC.

7. Validate ph/EC and adjust as necessary. ADD FRONT ROW while agitating. Wait 3-5 minutes between each component addition.

Continue agitation, adjust pH and check solution after 510 minutes
DIRECT TO RESERVOIR FEED CHARTS
DTR STANDARD STRENGTH
DTR HIGH STRENGTH
* “Stack” recipe can be used from start to finish of the flower cycle.
FEED CHART NOTES:
These feed charts are not a prescription, but an example of the general ranges and relationship of EC and recipes that can be used. Each facility and cultivation methodology will require customization of EC values. See the “EC Considerations” section on page 60.
FAQ
APPLICATION & USAGE
What is the proper injection order for Front Row Ag?
1. Front Row Si
2. Part A
3. Part B
4. Bloom
5. Front Row pH Up (or pH down if necessary)
See pg. 72 for fertigation set up examples.
What EC should I feed at?
Given the variance in facility infrastructure, cultivation methods, and cultivars, it’s impossible to give a specific EC prescription that applies to all scenarios. Most facilities feed at 2.0-3.0 EC with Front Row Ag, and our “Standard” and “High Strength” Feed Charts reflect effective feeding strategies in this range. The following table shows some considerations that affect EC choice:
CONSIDERATIONS
Why feed at higher EC early in the cycle?
Plant nutrition requirements are highest during the stages at which plants are growing most quickly, veg and during the first three weeks of flower. At this stage the crop will have a smaller root mass and drybacks will take much longer. As the plant finishes stretch, mineral requirements will be reduced and substrate EC should also be reduced via lower feed EC and/or increased runoff.
How much does each FRA part raise the EC per gram per gallon?
Do I need to use Cal Mag with Front Row Ag?
No, our formula contains ideal ratios of calcium and magnesium based on years of testing and plant tissue analysis. If deficiencies are observed, raise EC by increasing all parts equally to maintain ideal mineral ratios.
Do I need a bloom booster with Front Row Ag?
No. you will not need an additional bloom booster - Front Row Ag Bloom contains all the required micronutrients with ideal quantities of phosphorus and potassium to maximize density, yield, and quality.
How is Front Row Ag different from other mineral fertilizers?
Front Row delivers more micronutrients and magnesium which are some of the largest contributors to quality, density, yield, and aroma. We also have the added technology of the surfactants and proprietary, solubility agent.
What is the easiest way to use Front Row Ag?
Using our 3-2-2 stock concentrate mixing method with venturi injectors or with batch tanks. This allows use of whole 25lb bags in 50 gal stock barrels that can be injected at equal injection ratios.
For Direct to Reservoir mixing what is the required mixing time between adding each part?
• 3-5 minutes between Si, A, B, Bloom.
• 5-15 minutes between additions of Front Row pH Up, to allow for full pH adjustment effect.
How do I spray Front Row Si?
0.5-2 ml/gal, sprayed weekly up to day 21 of flower.
Can Front Row Si be injected?
Yes, at 0.1 - 0.5 ml/gal. There are two important considerations with injecting Si:
• Higher feed EC requires lower usage rate of Si.
• If the injection system is filling batch tanks, they must be fully used within 48 hours.
How long can Front Row Ag be stored for?
Solutions should be stored in opaque containers in climate controlled areas.
What is the cost per gallon for Front Row Ag using Part A, Part B, and Bloom?
How do I use Front Row Ag for clones or seedlings?
FAQ CONTINUED
CLEANING & MAINTENANCE
How often should I clean my batch tanks?
As needed, depending on each facility’s inputs and water quality. Generally every 10-14 days is recommended, although facilities running a sterile irrigation system will require cleaning less frequently and facilities running microbial additives may require more frequent cleaning.
How often should I clean my fertigation skid?
1-2 times per month is an ideal cleaning frequency to ensure cleanliness and consistent functioning of fertigation equipment.
How often should my irrigation components be replaced?
Generally everything downstream from hard plumbing (primarily poly line and drip emitters) should be replaced annually.
How do I prevent growths and contamination?
Run a sterile system by using the correct amount of calcium hypochlorite. Use cone bottom tanks and design systems so 100% of the water can be evacuated. Keep cleaning logs and SOPs.
TROUBLESHOOTING
What causes color change or cloudiness of fertilizer solution in a reservoir?
Turbidity or “haziness” of the feed solution can be caused primarily by bacteria or mold growths, swings in pH above 6.3, increases in water temperature, and/or oxidizing chemicals commonly used to clean, forming suspended particles and changing the solution color. While this does not cause any functional problems with the fertilizer, it can be an aesthetic or cleaning issue.
Turbidity can be avoided by following a few key practices in water quality and sanitation. Most often it is caused bacteria or mold growths, swings in pH above 6.3, increases in water temperature, and/or oxidizing chemicals commonly used to clean, especially hydrogen peroxide compounds, reacting with the high concentration of micronutrients in Front Row Ag.
Turbidity can be avoided or minimized with proper system design, controlled monitoring of pH and temperature, maintaining a sterile system, and by removing oxidizers from the feed solution and triplerinsing tanks prior to cleaning with these solutions.
GENERAL
Why does Front Row Ag improve quality, aroma, and yield?
Our formula’s high quality soluble minerals and full spectrum of micronutrients has been engineered specifically for the plant’s needs.
Do Front Row Ag users test for heavy metals?
Yes, we have hundreds of customers in markets with stringent heavy metal limits that use Front Row Ag to ensure finished products have low levels of heavy metals.


What’s the best way to contact Front Row Ag if I have a question?
Commercial Account Holders can contact their Rep directly. Otherwise we can be reached by phone email or DM.

WATER QUALITY CONSIDERATIONS
GUIDELINES + PARAMETERS
Proper water management is crucial for successful Controlled Environment Agriculture (CEA). This chapter highlights key aspects of water quality and sanitation to optimize plant health and system efficiency.
WATER SOURCES AND CONSIDERATIONS
Source Characteristics
Municipal
Well/Groundwater
Rainwater
Generally consistent; may contain chlorine
Potentially high mineral content, microbial content
Low minerals; may be acidic. Can harbor unwanted microbes.
Many facilities will opt to use Reverse Osmosis (RO) for their source water to remove any potential complicating factors and eliminate the variability that results from changes in municipal water handling.
Key Actions
Quarterly analysis; weekly EC/pH checks
Monthly analysis; weekly EC/ pH/microbial tests, sanitation
Regular pH adjustment; implement sanitation

ESSENTIAL WATER PARAMETERS
These parameters inform the decision making process around what water treatment and equipment is necessary.
Electrical Conductivity (EC)
Target: < 0.4 EC for direct use
If EC > 0.4: Consider RO or adjust fertilizer ratios - high levels of Ca, Mg, Fe, etc, may require adjustment to the Front Row Ag three-part ratios
Always use RO water (EC≈0) for stock solutions
pH Management
Target pH: 5.5 - 6.5 for most crops
Low EC water (RO, rain) typically needs pH up. Higher EC water often requires pH down.
Temperature
Optimal range: 65-68°F (18-20°C)
Benefits: Maximizes nutrient solubility and oxygen content
Other Key Factors
Mineral Content
Quarterly full-spectrum analysis
Dissolved Oxygen
Maintain > 6 ppm
WATER TREATMENT
Reverse Osmosis (RO)
Removes 98%+ of dissolved solids
Consider for EC > 0.4 or inconsistent water quality
Size system for 120% of peak daily use
Calcium Hypochlorite
Calcium Hypochlorite is an inexpensive and efficient way of enhancing water cleanliness and will prevent many common problems related to water source.
Target: 0.5-2 ppm free chlorine at plant site
Target: 300-500 mV ORP at dripper
Implement with injection system and ORP monitoring
MONITORING SCHEDULE
Remember: Consistent monitoring and maintenance practices are key to long-term performance.
Frequency Tasks
Daily
Weekly
Check EC, pH, temperature
Test free chlorine or ORP
Monthly Full microbial count
Quarterly
Comprehensive water analysis*
Contact your commercial Rep for water testing services.

WATER CLEANLINESS IN IRRIGATION SYSTEMS
Bacteria/mold contamination of source water is the primary cause of water quality issues, followed by interactions with source water EC and ions. Additional issues arise from seasonal changes, temperature shifts, and poor filter maintenance. This article compares effective pathogen risk reduction through disinfection methods like UV light, ozone, peroxides, hypochlorous acid, and chlorine compounds like Calcium Hypochlorite.
INTRODUCTION
This article focuses on the role of clean water in Controlled Environment Agriculture (CEA). Clean water is essential for preventing irrigation system problems and plant diseases caused by pathogens like Pythium, Phytophthora, and Fusarium. These can come from various sources, including water supplies, tanks, biofilms, and filters.
We’ll explore how issues arise from seasonal changes, temperature shifts, and poor filter maintenance. Our goal is effective pathogen risk reduction, not total sterilization. We’ll examine disinfection methods like UV light, ozone, peroxides, hypochlorous acid, and chlorine compounds like Calcium Hypochlorite.
You’ll learn about monitoring water cleanliness through Chlorine PPM and ORP levels. By the end, you’ll know how to maintain highquality water for healthy CEA crops.
WHY WATER CLEANLINESS IS ESSENTIAL
In CEA, water cleanliness is not just a bonus; it’s a necessity. Here’s why:
• Preventing Irrigation Disruptions: Dirty water can lead to clogs and biofilm formation in irrigation systems. Algae is also problematic as an indirect contributor to substrate and pest problems. These issues disrupt water flow and nutrient delivery, hindering plant growth.
• Avoiding Pathogen Transmission: Water is a common pathway for plant diseases. Pathogens like Pythium, Phytophthora, and Fusarium thrive in contaminated water and can quickly spread across your CEA system, affecting plant health.
SOURCES OF CONTAMINATION:
• Water Source: Natural water sources can introduce pathogens.
• Water Holding Tanks: Stagnant water can become a breeding ground for pathogens.
• Biofilm in Pipes: Accumulated biofilm is a habitat for harmful microbes.
• Surfaces, Injectors, Mixing Chambers, and Filters: Dirty surfaces and filters can harbor and spread pathogens. Fertigation equipment contains many areas that are easily inhabited by pathogenic microbes, leading to continuous reintroduction of those microbes downstream of the contamination site.
Many microbes that colonize tanks, lines, and fertigation equipment exist in the air with the potential to opportunistically colonize water system components.
Understanding these risks is the first step in implementing effective sanitation measures to maintain the health and productivity of your CEA crops.
HOW THINGS GO WRONG:
THE CHALLENGES IN WATER QUALITY MANAGEMENT
Maintaining water quality in CEA irrigation systems can be challenging due to various factors:
• Seasonal Changes: Different seasons bring different challenges. For example, warmer temperatures in summer can increase pathogen activity and growth, while colder temperatures in winter can affect water chemistry and plant resistance.
• Temperature Swings: Sudden temperature changes can stress plants, making them more susceptible to diseases. These fluctuations can also impact the effectiveness of disinfection methods and alter water chemistry.
• Filter Maintenance: Filters play a crucial role in keeping water clean. Neglected or poorly maintained filters become less effective over time, allowing pathogens and debris to pass through, which can lead to system-wide contamination.
THE GOALS OF DISINFECTION IN CEA SYSTEMS
Disinfection in CEA aims not to sterilize but to control risks effectively:
• Minimizing Pathogen Risk: The primary goal is to reduce the presence of harmful pathogens to levels that do not threaten plant health. Complete eradication is often unnecessary and impractical.
• Maintaining System Efficiency: By controlling biofilm and clogs, disinfection helps maintain efficient water and nutrient flow, ensuring plants receive what they need for optimal growth.
• Balancing Chemicals: Disinfection involves managing chemical levels to avoid harming plants while controlling pathogens. It’s a delicate balance that requires careful monitoring and adjustment.
CONSIDERATIONS FOR CHOOSING DISINFECTION METHODS
When selecting a disinfection method for CEA water systems, consider these factors:
1. Evaluate the initial setup costs and ongoing expenses. Some methods require more investment upfront but save money in the long run.
2. Consider how adaptable the method is to changes in your system, such as scaling up or dealing with varying water quality.
• Impact on Plants: Some methods might be more suitable for certain crops. It’s important to understand how each method affects plant health and growth.
• Ease of Use and Maintenance: Assess how user-friendly and maintenance-intensive each method is. This affects the overall workload and efficiency of your operation.
KEY POINTS:
• Source water contamination is the primary entry point for harmful pathogens like Pythium, Phytophthora, and Fusarium, as well as general bacteria/fungi.
• Poor water cleanliness leads to clogged irrigation lines, reduced nutrient delivery efficiency, and creates favorable conditions for pathogen transmission to plants.
• Regular treatment with calcium hypochlorite (maintained at 2ppm chlorine at the dripper) provides effective pathogen control while being safe for plants when properly monitored.
• Temperature fluctuations and seasonal changes require ongoing monitoring and adjustment of treatment protocols to maintain consistent water quality.
DISINFECTION METHODS
Ultraviolet (UV) Light Disinfection
Ultraviolet (UV) light disinfection is a non-chemical process that neutralizes a wide range of pathogens, including bacteria, viruses, and fungi, by damaging their DNA. Its effectiveness largely depends on the water’s clarity, as turbid water can shield microorganisms from UV exposure. The design of the UV system is crucial, needing to balance factors like flow rate and lamp intensity to ensure all water is adequately exposed. While UV disinfection is efficient, leaving no chemical residues and acting rapidly, it requires regular maintenance, such as cleaning the lamps and replacing them periodically. One significant limitation is the lack of residual disinfection; water can be re-contaminated posttreatment if it encounters pathogens again.
NON-CHLORINE BASED OXIDATION AGENTS
Ozone Disinfection
Ozone disinfection in irrigation systems utilizes ozone (O3), a powerful oxidizing agent, to eliminate pathogens and contaminants. Ozone is generated on-site and infused into the water, where it rapidly reacts with pollutants, breaking them down into less harmful substances. The process effectively inactivates a wide range of microorganisms, including bacteria, viruses, and fungi. One of the key benefits of ozone is its ability to decompose back into oxygen, leaving no toxic residues in the water. However, the system requires careful handling due to the reactive nature of ozone; it’s easy to damage plant roots through excessive ozone concentration. It can be more costly to set up and operate compared to other methods and requires precise control to avoid plant damage.
Hydrogen Peroxide Disinfection
Hydrogen Peroxide compounds such as Zerotol are another popular non-chlorine oxidizing agent used in CEA systems. Zerotol, a stabilized hydrogen peroxide solution, acts by releasing reactive oxygen species that target and destroy pathogens. It’s effective against a broad spectrum of pathogens and is relatively easy to dose and apply. One significant advantage is that it breaks down into water and oxygen, making it environmentally friendly. However, the interaction between peroxides and micronutrients/metals in the feed solution is one of the most consistent causes of reservoir turbidity; the peroxides oxidize some of the metals leading to “haziness” in the reservoir and increasing the difficulty of cleaning.
CHLORINE COMPOUNDS
Sodium Hypochlorite (NaOCl)
Commonly available as liquid bleach, sodium hypochlorite is a widely used disinfectant in CEA systems. When added to water, it produces hypochlorous acid (HOCl) and the hypochlorite ion, which are responsible for its sanitizing properties. The balance between these two chemicals is determined by the water’s pH, with hypochlorous acid being more effective as a sanitizer. Sodium hypochlorite is effective against a broad range of pathogens and helps in controlling algae and biofilm in the irrigation system but is a subpar choice in CEA systems as it is difficult to avoid sodium toxicity, especially for sodium-sensitive crops.
Hypochlorous Acid (HOCl)
Hypochlorous acid is the active sanitizing agent produced when either sodium or calcium hypochlorite is added to water. It is highly effective at a pH range of 6-7.5, making it a potent disinfectant against a wide array of pathogens. HOCl works through oxidation, disrupting the cellular structures of microbes. Its effectiveness as a sanitizer is significantly higher than that of the hypochlorite ion, especially in the lower pH range.
Calcium Hypochlorite (Ca(ClO)2)
Calcium hypochlorite, often used in solid form, shares similar disinfecting principles to sodium hypochlorite. Upon dissolution in water, it too generates hypochlorous acid and hypochlorite ion. It is effective against various pathogens and is useful in controlling algae and biofilm. Like NaOCl and HOCl, it works through oxidation of organic material including microbes. Calcium hypochlorite has a higher chlorine content (~65%) and longer shelf life compared to liquid bleach (NaOCl). It is especially beneficial in larger systems due to its high concentration, shelf life, and low cost. The effectiveness of hypochlorous acid as a disinfectant in water systems hinges on maintaining the correct pH balance to maximize its concentration relative to the hypochlorite ion.

WHY WE RECOMMEND THE USE OF CALCIUM HYPOCHLORITE IN CEA SYSTEMS
Why Calcium Hypochlorite?
Calcium hypochlorite is an excellent choice for CEA water disinfection due to its cost-effectiveness, ease of use, and flexibility. Its high chlorine concentration, makes it economical for large-scale operations. Its solid form ensures a longer shelf life and easier storage compared to liquid alternatives. Critically, calcium hypochlorite’s ability to effectively control a wide range of pathogens, algae, and biofilms makes it a versatile tool for maintaining water quality in diverse CEA setups.
Maintaining Calcium Hypochlorite Effectiveness
To maximize the effectiveness of calcium hypochlorite, certain factors must be managed:
• Storage Conditions: Proper storage is crucial to preserve its potency. It should be kept in a cool, dry place, away from direct sunlight and organic materials to prevent degradation and unsafe reactions. When mixed in stock solution, the container should be sealed to the air.
• Water pH Management: The effectiveness of calcium hypochlorite largely depends on the pH of the water. It works best in a slightly acidic to neutral pH range (<6.5 pH), where hypochlorous acid, the more potent sanitizing form, predominates.
Applied Chlorine, Chlorine Demand, and Residual Chlorine
Understanding the relationship between applied chlorine, chlorine demand, and residual chlorine is key to effective water treatment:
• Applied Chlorine: This is the initial chlorine ppm (supplied by calcium hypochlorite) added to the water. It needs to be sufficient to meet the system’s chlorine demand.
• Chlorine Demand: This represents the quantity of chlorine consumed to oxidize all organic and inorganic materials in the water, including pathogens and contaminants. Factors like water source, temperature, and the presence of biofilm can influence chlorine demand.
• Residual Chlorine at the Dripper: It’s the concentration of chlorine remaining in the water after it has satisfied the system’s chlorine demand. This residual chlorine is what provides ongoing protection as the water travels through the irrigation system. Monitoring and maintaining an appropriate level of residual chlorine at the dripper ensures effective ongoing disinfection while minimizing the risk of plant toxicity.
MONITORING WATER
CLEANLINESS: CHLORINE
PPM AND ORP
Chlorine PPM (Parts Per Million)
Monitoring chlorine concentration in parts per million (PPM) is a direct method to ensure water disinfection is performing adequately. Maintaining the correct chlorine PPM is essential for pathogen control while preventing phytotoxicity. Chlorine meters or color test kits can be used to measure free chlorine levels, which indicate the amount of disinfecting agent available after the chlorine demand has been met. For most fertigation systems, a residual free chlorine level between 0.5 to 2 PPM at the farthest point from injection is often sufficient for sanitization without harming plants. These levels need to be checked regularly as fluctuations in water source, temperature, and system use can alter chlorine demand and residual levels.
Oxidation-Reduction Potential (ORP)
Potential (ORP) is a measure of the water’s ability to break down contaminants, reflecting the overall sanitizing power of the water. ORP readings are taken in millivolts (mV) and higher readings typically indicate greater disinfection potential. For fertigation systems, an ORP level of 300-500 mV is generally considered adequate for effective pathogen control. ORP is an indirect measure that can be influenced by pH, temperature, and the presence of other oxidizing or reducing substances in the water. Therefore, it should be used in conjunction with PPM measurements for a more complete assessment of water cleanliness. ORP sensors provide real-time data, allowing for continuous monitoring and adjustments as needed to maintain proper sanitization levels.
Note that chlorine ppm and ORP don’t scale linearly; the ORP of a given chlorine ppm is highly dependent on the pH (and thus the ratios of hypochlorous acid to hypochlorite ion) in the irrigation water.
KEY RECOMMENDATIONS FOR USING CALCIUM HYPOCHLORITE IN CEA
In conclusion, our key usage recommendations for maintaining water cleanliness with Calcium Hypochlorite are centered on its significant benefits:
• Pathogen Suppression: Calcium Hypochlorite effectively suppresses a wide range of pathogens, ensuring the health of your CEA crops.
• Maintenance of Irrigation System Function: Regular use prevents the buildup of biofilm and turbidity, thus keeping emitters and filters free from clogs.
• Clean Water Storage and Fertilizer Injection: Ideal for use in reverse osmosis (RO) or clean water storage systems and can be injected along with fertilizers to maintain a sanitary nutrient solution.
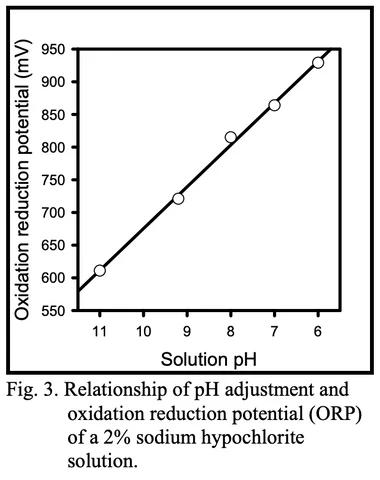
FOR PRECISE APPLICATION:
Monitoring at the Dripper: Keep a consistent eye on ORP and Chlorine levels at the dripper. Aim for ORP within the 300-500 mV range and maintain a free chlorine level of around 2 PPM. Adjust as necessary, taking into account the changes in chlorine demand which can be influenced by a variety of factors including water source, temperature, and crop type. Note that in a facility with varying lengths of irrigation runs, the shorter ones may have higher chlorine ppm at the dripper and adjust accordingly.
Stock Solution Mixing Ratios: Mix stock solutions at either 20g per gallon or 3g per gallon, matching the injection rate of your dosing equipment to ensure the proper disinfectant levels.
IN TERMS OF BEST PRACTICES FOR HANDLING STOCK SOLUTIONS:
• pH Management: Keep the pH of stock solutions at or below 6.5 to optimize the efficacy of the chlorine.
• Storage Conditions: Store stock solutions in sealed containers to avoid contamination and degradation.
• Protection from Light and Heat: Keep the stock solution away from light and heat, which can accelerate the decomposition of the chlorine compound.
• Replace stock solutions every 7-14 days to ensure the highest level of activity and to prevent the potential for diminished efficacy due to degradation over time.
The following table outlines the application rates, stock concentrations, and injector settings for a variety of facility needs.
Calcium Hypochlorite Usage Rates: Stock and Feed Solutions
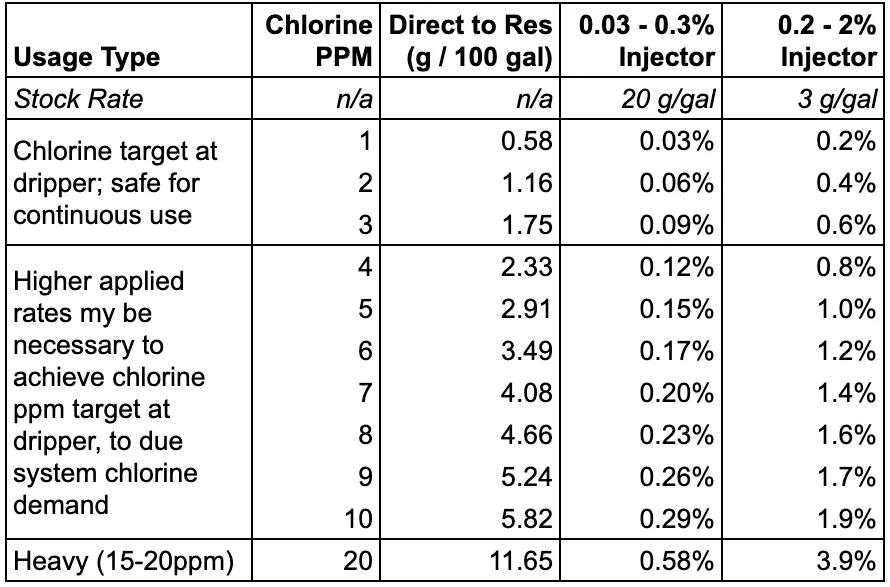
DOSATRON FERTIGATION EXAMPLE SET UPS
R.O. Water using pH Up


If using, add CalHypo and Si at the beginning:
R.O. Water Parts List
HYKSTART-STD x 1
D14MZ2VFBPHY x 3
D14MZ2AFBPHY x 1
HYKMC34 x 4
+MC34-SHADE x 4
WHA34-SS-KIT x 1
Optional
HYKMON x 1
Add 1 Doser+Mixer Set Each for Si and/or CalHypo:
D14MZ2VFBPHY
HYKMC34 +MC34-SHADE


City Water using pH Down


If using, add CalHypo at the beginning, and Si after pH Down:


City Water Parts List
HYKSTART-STD x 1
D14MZ2VFBPHY x 4
HYKMC34 x 4
+MC34-SHADE x 4
WHA34-SS-KIT x 1
Optional
HYKMON x 1
Add Doser+Mixer Set Each for Si and/or CalHypo:
D14MZ2VFBPHY
HYKMC34 +MC34-SHADE


Fertigation Set Up Notes
There are two options for start kits, depending on whether the water pressure is set prior to coming into the panel or needs to be regulated by the panel itself.
There are two seal options for pH adjustment dosers, for either acidic or basic solutions.
Use Aflas (AF) seals for pH up and Virkon (VF) seals for pH down. *D14MZ2AFBPHY is a special-order item.
When pH increase is required, that doser should be *last in the injection sequence.*
When pH lowering is required, that doser is best placed *first in the injection sequence.*
All Mixing Chambers should have a light protection sleeve part MC34-SHADE.
If using Calcium Hypochlorite for water sanitation, inject first in sequence using D14MZ2.
Why HYKMON is optional: We recommend monitoring the solution in the batch tank and at the dripper, NOT at the exit of the panel which may give false pH readings while the chemical reaction is still taking effect.
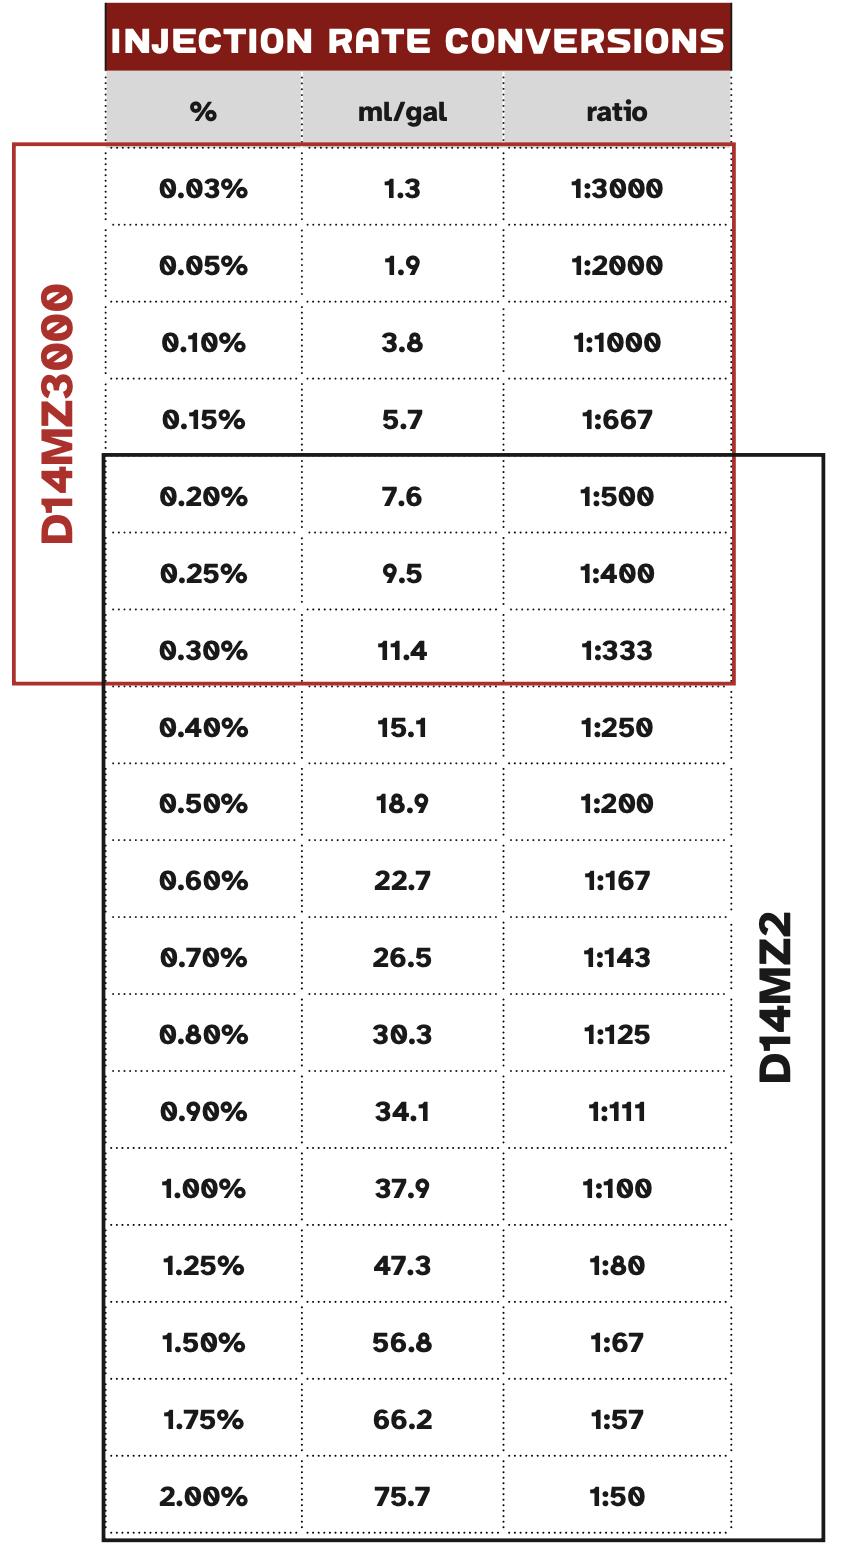
Need A Custom Fertigation Setup? We Can Help
Front Row Ag works with every commercial fertigation system. Contact your commercial rep for help with other systems and layouts.
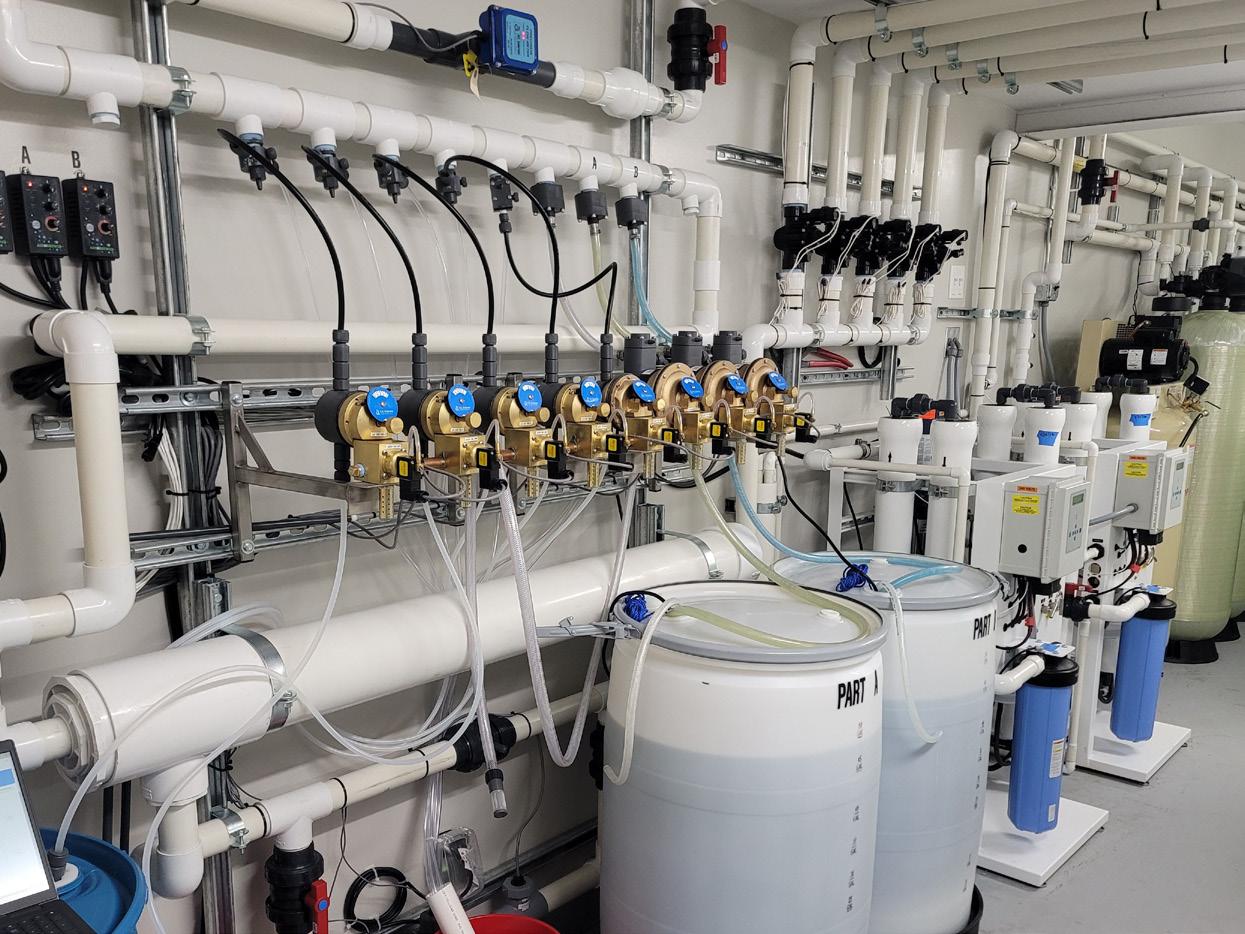
IRRIGATION COMPONENTS
Front Row Ag recommends using a high quality precision drip system for irrigation delivery.
An irrigation system needs to fulfill these key requirements:
Uniformity - every plant site needs to receive the same flow rate for accurate irrigation
Reliability - the system needs to work each day for up to dozens of individual irrigation events, without failure or degradation
Durability - components need to be resistant to a variety of conditions and operating environments over longer timelines
Intelligent system design, equipment selection, and maintenance practices allows for a system that can delivery precise irrigation events, dozens of times a day, for months to years.
BASIC IRRIGATION COMPONENTS
Zone control kits - these generally include a solenoid valve, disc filter, and pressure regulator as specified by the pressure and flow rate requirements for a given irrigation zone.
Solenoid valve: A 24v solenoid that is activated by the irrigation controller to allow flow to a system
Disc filter: This ensures that particulates are removed prior to irrigation solution reaching the drip emitters; recommend 120 mesh / 130 micron size
Pressure regulator: Keeps pressure within the pressure compensation range for the emitters.
Poly tubing - usually 1/2” tubing; runs the length of the benches, it’s where the emitters are punched into.
Drip emitter assembly
Pressure compensating (PC) emitter: Regulates to a consistent flow rate across a wide pressure range, ensuring each plant site receives the exact same volume of irrigation at any position in the irrigation system.
Irrigation tubing: connects the emitter to the drip stake, usually 3mm ID x 5mm OD
Drip stake: attached to the drip tubing, it secures into the media and directs the flow of irrigation solution down into the media.
Flush valves - connected to 1/2” tubing in each zone, or lateral run, it allows for flushing the system during the cleaning process.
EQUIPMENT CONSIDERATIONS
Drip emitters:
• Barb Position: Side outlet (SOL) or Top outlet
• Pressure Compensation: e.g. provides even flow rates between 16 - 50 PSI
• Minimum Opening Pressure: e.g. 10 PSI, this allows the system to be flushed during cleaning via the flush valves at less than 10 PSI without pushing anything through the emitters
• Flow Rate: Hydroponic substrates will perform best with very slow drip rates, e.g. 0.3 - 0.6 GPH, allowing the applied nutrient solution to wick horizontally into the media, avoiding channeling and false drain. An example pressure compensating drip emitter that we recommend is the Rivulis Supertif ND MOP.
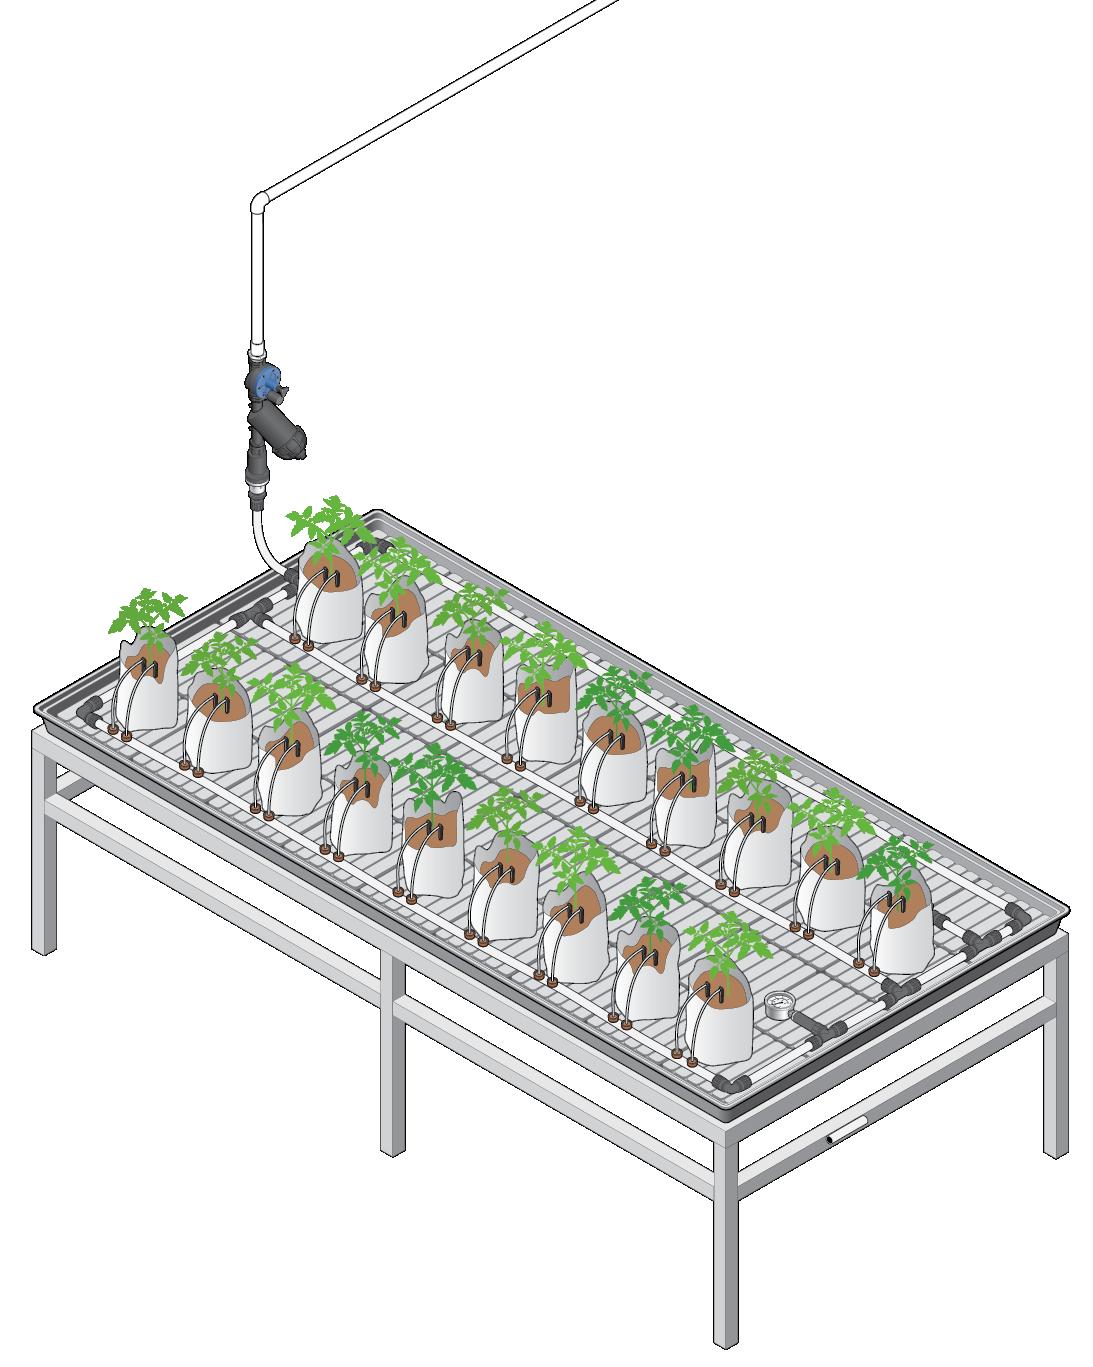
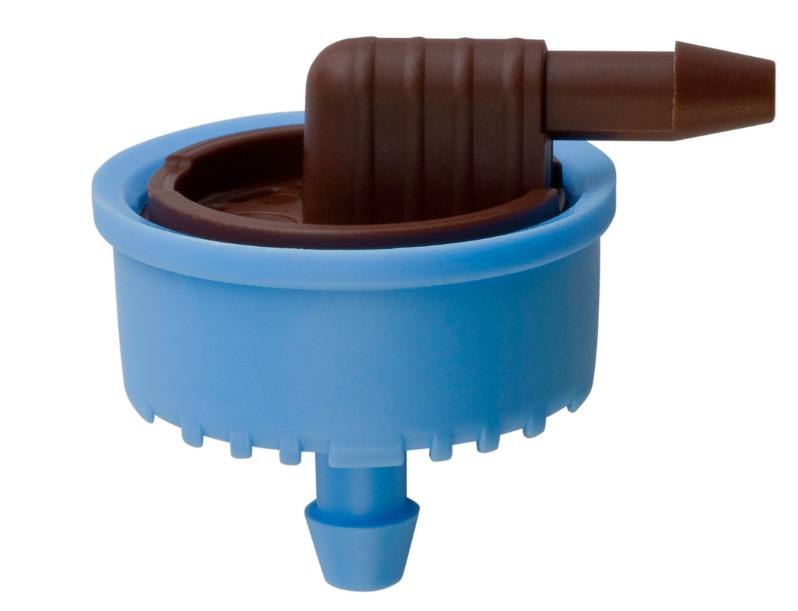
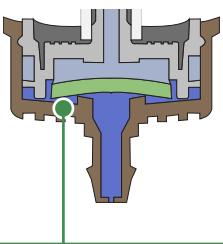
The Supertif ND MOP is designed with a mechanism that prevents contaminants from entering the dripper when flushing the line at 9psi. After system flushing, when operating the system at 14.2-50psi, only clean water passes through the dripper reducing plugging and ensuring the specified flow rate.
RUNOFF & DRAIN MANAGEMENT
GUIDELINES + PARAMETERS
Runoff, also known as drain or leachate, is the excess nutrient solution that drains from the growing substrate after irrigation. Analyzing runoff trends provides crucial insights into plant health, nutrient uptake, and overall system performance.
KEY RUNOFF METRICS
Volume
• Primary determinant of substrate EC
• Indicates mineral rebalancing in substrate
• Measured in mL and as a percentage of substrate volume.
Example: 500 mL runoff from 1 gallon (3785 mL) coco pot = (500/3785) = 13.2% drain
EC (Electrical Conductivity)
• Reflects input EC plus leached minerals from substrate
• Always higher than input EC
• Used to track progress towards substrate EC targets
pH
• Proxy for root zone pH
• Indicates nutrient availability
• Managed through feed pH adjustments
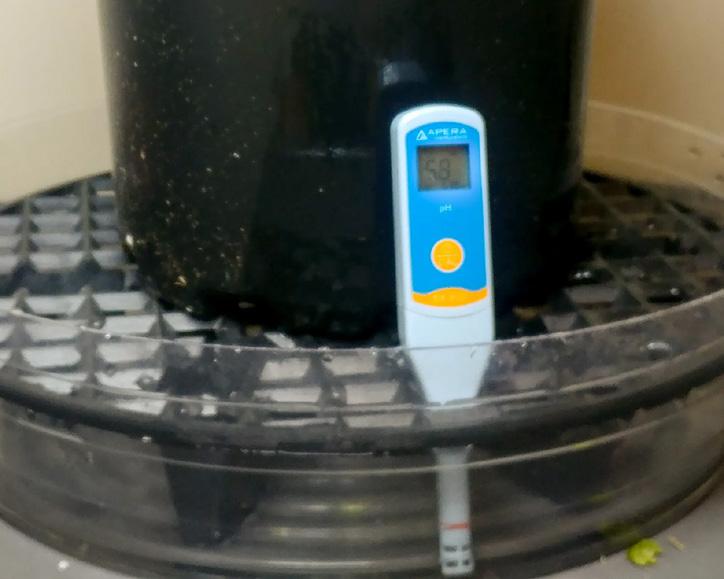
Why is Measuring Runoff
Important?
• Indicates possible imbalance in substrate mineral ratios
• Allows adjustment of runoff volumes to hit targets
• Indicates over- or under-watering
• Guides irrigation and nutrient adjustments
HOW TO COLLECT AND MEASURE RUNOFF
Setup:
• Choose representative plants (average size, normal light exposure, not on edges)
• Place a collection tray with a riser under each selected plant
• Install one collection site per irrigation zone
Daily Collection (after final irrigation):
• Carefully remove the tray, avoiding pot-to-solution contact
• Measure and record:
• Volume (mL)
• pH
• EC
Data Management:
• Enter all data into your designated system (e.g., Google Sheet, AROYA)
Best Practices:
• Maintain separation between pot and collected solution
• Clean and reset collection equipment daily
• Perform weekly deep cleaning to prevent salt buildup
• Collect data promptly to minimize evaporation effects
Regular runoff monitoring allows for precise irrigation and nutrient control
Suggested Runoff % and EC
• 10-30%
• Runoff EC will/should be slightly higher than feed EC.
*NOTE: This range is not exact, and depends on many factors.
• Adjust collection sites as needed to ensure representativeness
• Use larger containers if overflow occurs
Optimal Management:
• Consistent drain percentage maintains mineral balance
• Too little runoff can lead to unfavorable ion concentrations
• Too much runoff suggests overwatering or system issues
CLEANING PROTOCOLS
GUIDELINES + PARAMETERS
IRRIGATION SYSTEMS, TANKS, AND LINES
Irrigation System Cleaning
Mineral Buildup Removal
1. Prepare a 1% solution of GreenClean® Acid (38 ml/gal).
2. Inject the solution into the batch tank or fill directly.
3. Open flush valves to prevent forcing dislodged material through emitters.
4. Pump the GreenClean® solution through the irrigation system.
5. Close flush valves and shut off the system once filled.
6. Allow the solution to sit for 1-2 hours.
7. Flush thoroughly with fresh water.
Biofilm Removal and Sanitization (Chemical)
1. Prepare a 1% solution of SaniDate® 5.0 (38 ml/gal).
2. Inject the solution into the batch tank or fill directly.
3. Open flush valves to prevent forcing debris through emitters.
4. Pump the SaniDate® solution through the irrigation system.
5. Close flush valves and shut off the system once filled.
6. Allow the solution to sit for a minimum of 3 hours (up to 8-12 hours for heavily contaminated systems).
7. Flush thoroughly with fresh water.
Biofilm Removal and Sanitization (BioEnzymatic)
1. Use Front Row Ag Bioflo according to label instructions.
NOTE: Detaching biofilms may cause clogs. This is why you must purge your lines after cleaning to remove the films from your system.
Proper cleaning and sanitation of cultivation rooms and equipment are critical for maintaining consistent performance and preventing the spread of plant pathogens. This section outlines essential procedures to be followed between each harvest cycle, ensuring optimal functionality of your equipment and minimizing the risk of contamination.
OTHER POTENTIAL
CONTAMINATION SOURCES
Batch Tank Cleaning
1. Use Sanidate 5.0 at 38 ml/gal (1% solution).
2. Scrub thoroughly to remove all debris.
3. Triple rinse and flush with fresh water to eliminate all oxidizer residues.

Doser Suction Tubes
• Inspect for mold or biofilm.
• Clean with SaniDate® solution or replace if necessary.
Stock Tanks
• Inspect regularly
• Clean with SaniDate® solution as necessary.
Humidifiers
• Clean after each harvest cycle.
• Rinse interior thoroughly with SaniDate® solution.
HVAC Systems
• Inspect filters and ducting regularly.
• Clean according to manufacturer instructions.
Water Holding Tanks
• Inspect and clean regularly to prevent microbial growth.
• Consider implementing a continuous sanitation system for large tanks.

WHY TAPER NITROGEN?
RESEARCH HIGHLIGHT
THE IMPACT OF NITROGEN SUPPLY ON CANNABINOID AND TERPINOID PROFILES IN MEDICAL CANNABIS
This research highlight focuses on a comprehensive study that examines how the supply of nitrogen, a critical nutrient for plants, influences the Cannabinoid and terpinoid profiles of medical Cannabis. These experimental findings highlight the importance of nitrogen level and timing as part of an overall crop steering protocol, to maximized yield and production of TH* and terpines. Source - Saloner and Bernstein 2021: Nitrogen supply affects Cannabinoid and terpinoid profile in medical Cannabis (Cannabis sativa L.)
STUDY OVERVIEW
Nitrogen is known to significantly impact primary and secondary metabolism in plants, but its specific effects on the chemical profile of Cannabis plants have been largely unexplored. This study, conducted by Avia Saloner and Nirit Bernstein, evaluated the hypothesis that nitrogen supply affects the Cannabinoid and terpinoid profile of Cannabis. They investigated the impact
of nitrogen application on the chemical and functional-physiology phenotyping of medical Cannabis at the flowering stage, under five nitrogen treatments ranging from 30 to 320 mg L−1 (ppm). The results of the study demonstrate that nitrogen supply indeed affects Cannabinoid and terpinoid metabolism. The concentrations of most Cannabinoids and terpinoids tested were found to be highest under the deficient concentration of 30 ppm N and decreased with the increase in nitrogen supply. The concentrations of the two main Cannabinoids, THC and CBD, decreased by 69% and 63%, respectively, as the nitrogen supply increased from 30 to 320 ppm. Excessive nitrogen supply negatively impacts the production of secondary compounds in Cannabis, while promoting growth and biomass production. Nitrogen supply may serve to regulate the Cannabinoid and terpinoid profiles, or increase plant yield, depending on the desired production scheme.
BACKGROUND
Cannabis has been used for thousands of years for medicinal purposes. In recent years, the cultivation of Cannabis for modern agriculture and the demand for medical-grade Cannabis products have been sharply increasing. The therapeutic effects are derived from its chemical constituents, which encompass hundreds of biologically active secondary metabolites, including terpinoids, flavonoids, and the Cannabis-specific Cannabinoids. Commercial production is based on the cultivation of female plants, as the highest concentrations of therapeutic metabolites are found in female flowers. Thus, it’s crucial to produce plant material that is chemically standardized within and between plants and between cultivation batches. Despite the high demand for the plant’s product, there is limited science-based knowledge regarding the regulation of secondary metabolism in medical Cannabis plants, particularly concerning the effects of environmental and cultivation conditions.
MATERIALS AND METHODS
PLANT MATERIAL AND GROWING CONDITIONS
• Medical Cannabis plants of the ‘Annapurna’ cultivar were used as the model for the study.
• Rooted cuttings were planted in 3 L pots in perlite cultivation media 28 days after being cut from the mother plants.
• The plants were grown under five nitrogen treatments of 30, 80, 160, 240, and 320 ppm under environmentally controlled conditions.
Environmental conditions are well documented to affect secondary metabolism and the accumulation of secondary metabolites in plants. Experienced cultivators are now manipulating these factors strategically to control the portioning of plant energy as part of a crop steering protocol. Exogenous factors such as water supply, humidity, salinity, and nutrient availability can alter the production and concentration of secondary metabolites such as alkaloids, phenols, and terpinoids, and an effective crop steering recipe aims to achieve this. Mineral nutrients, and especially nitrogen, are among the main environmental factors affecting plant development, physiology, and metabolism. As nitrogen is consumed by plants in the largest quantities and is required for most metabolic processes, nitrogen input is a critical factor for plant development and function. There is substantial evidence suggesting Nitrogen impacts not only plant yield, but also secondary metabolism.
PLANT VISUAL CHARACTERISTICS
• The visual appearance of the plants varied between treatments.
• Leaf color changed dramatically from pale yellow to dark green with the increase in nitrogen supply.
• Leaves of the low nitrogen treatments (30−80 ppm N) were smaller compared to those in the higher nitrogen treatments (160−320 ppm N).
• A parallel trend was observed for the growth and physiologic state of the plants, which was optimal at supply rates of 160–320 ppm for this particular growing method.
DISCUSSION
The study aimed to provide a better understanding of the impact of nitrogen on medical Cannabis physiology. The results revealed that the optimal nitrogen level for yield quantity, while also allowing a relatively high content of secondary metabolites, is 160 ppm N. This data shows that high nitrogen supply can have adverse effects on the production of secondary metabolites in Cannabis, while it promotes growth and biomass production.
HEAVY NITROGEN SUPPLY, DECREASED SECONDARY METABOLITE PRODUCTION
The study showed that Cannabinoid and terpinoid concentrations were highest under deficient nitrogen concentration of 30 ppm N and declined as the nitrogen supply increased. Specifically, the concentrations of the two main Cannabinoids, THCA and CBDA, decreased by 69% and 63%, respectively, with the increase in nitrogen supply from 30 to 320 ppm N. This suggests that an excess of nitrogen may be detrimental to the production of these critical secondary metabolites in Cannabis. This is in line with previous research that has shown that nitrogen, while essential for plant growth, can alter secondary metabolic pathways if not supplied in the right amounts.
The actual N ppm that is optimal in real-world systems may be much higher.
Modern LED lighting, environmental control, and irrigation practices seem to increase plant nutrition requirements. The important takeaway is not the exact ppm used, but the general relationship, with excess N causing a decrease in secondary metabolites.
NITROGEN SUPPLY AND PLANT DEVELOPMENT
The study also found that plant development and function were restricted under nitrogen inputs lower than 160 ppm N, demonstrating nitrogen deficiency. On the other hand, the overall physiologic state and growth rate of the plants was optimal at supply rates of 160–320 ppm N. This data emphasizes the importance of managing nitrogen supply effectively in cultivation to promote optimal plant development and function. Too little nitrogen can lead to deficiencies and restrict plant growth, while too much can adversely affect secondary metabolite production. As we’ll discuss in the future, the timing of N application is also a critical factor in this balance.
NITROGEN SUPPLY AND YIELD
The researchers found that the yield increased with the increase in nitrogen supply up to 160 ppm N. However, further increase in nitrogen supply did not affect the yield. This suggests that 160 ppm N is a sufficient concentration for maximum yield in Cannabis cultivation, and higher nitrogen supply does not necessarily lead to a higher yield in this particular set of growing conditions.

Fig. 1. Visual appearance of inflorescences, leaves, and whole plants of medical cannabis cultivated under increasing N supply. From left to right: 30, 80, 160, 240, 320 mg L−1 N. Shown are the top inflorescence on the main stem and the youngest, fully developed leaf on the third branch from the plant’s top. The photos were taken 52 days after the initiation of the short photoperiod and the fertigation treatments.
CONCLUSION
This study provides critical insights into the role of nitrogen supply in the cultivation of medical Cannabis. It shows that the optimal nitrogen level under these experimental conditions for yield quantity, while allowing a relatively high content of secondary metabolites, is 160 ppm N. An excess of nitrogen can adversely affect the production of secondary compounds in Cannabis, while promoting growth and biomass production. Nitrogen supply can serve to regulate the Cannabinoid and terpinoid profiles or to increase plant yield, depending on the desired production scheme. These findings represent a significant step towards the optimization of medical Cannabis cultivation.
By understanding the impact of nitrogen supply on Cannabis physiology and secondary metabolite production, cultivators can better manage their cultivation practices to optimize yield and the production of beneficial secondary metabolites. This research underscores the importance of precise nutrient management and timing in Cannabis cultivation. That is why cultivators seeking the best and simplest nutrient line for Cannabis use Front Row Ag.
The 3-part Front Row Ag system allows cultivators to adjust the amount and ratios of Nitrogen strategically across the crop cycle to best take advantage of the growth promoting effects and optimize for secondary metabolism at the correct times.
Avia Saloner, Nirit Bernstein, Nitrogen supply affects cannabinoid and terpenoid profile in medical cannabis (Cannabis sativa L.), Industrial Crops and Products, Volume 167, 2021, 113516, ISSN 0926-6690, https://doi.org/10.1016/j.indcrop.2021.113516.
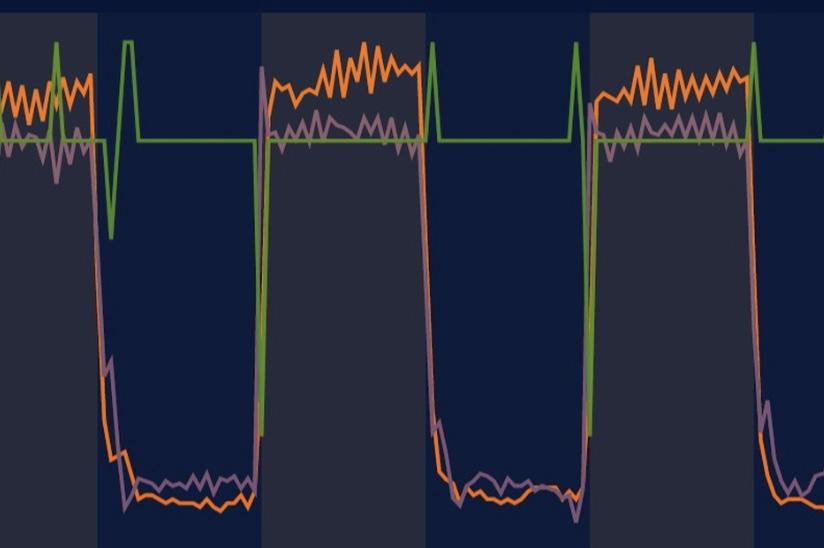
CROP STEERING

CROP STEERING IS
THE STRATEGIC
MANIPULATION OF A PLANT’S ENVIRONMENT TO INFLUENCE HOW IT ALLOCATES RESOURCES DURING DIFFERENT GROWTH STAGES.
This technique involves carefully controlling various factors such as lighting, climate, nutrient concentration (EC), substrate moisture, irrigation frequency, and net dryback to optimize yield, quality, and efficiency in cultivation.
The core concept of crop steering is based on the plant’s adaptive responses to environmental stimuli. By applying controlled stress or favorable conditions, growers can direct the plant’s growth towards either vegetative (roots, stems, shoots, and leaves) or generative (flowers and fruits) development.
While crop steering techniques have been used in agriculture for decades, particularly in tomato cultivation, their application in other crops has gained popularity more recently. It’s important to note that traditional growing practices have always influenced plant growth to some extent; crop steering simply makes this process more intentional and systematic.
LIGHTING CROP STEERING
GUIDELINES + PARAMETERS
Our primary measure of lighting intensity is PPFD (Photosynthetic Photon Flux Density), the measure of the number of photosynthetically active photons that fall on a given surface each second. It’s typically measured in μmol/m²/s (micromoles per square meter per second).
GENERAL INTENSITIES & ACCLIMATION
Optimal PPFD levels for cultivation vary significantly depending on phase, equipment, environmental constraints, and grower preferences. For any lighting strategy, light acclimation is a critical part of maintaining plant momentum and avoiding excessive light stress. Here’s an example of PPFD by stage with gradual acclimation:
The gradual increase in PPFD allows plants to acclimate to higher light levels without experiencing stress. Growers should increase PPFD levels incrementally, monitoring plant response and adjusting as necessary.
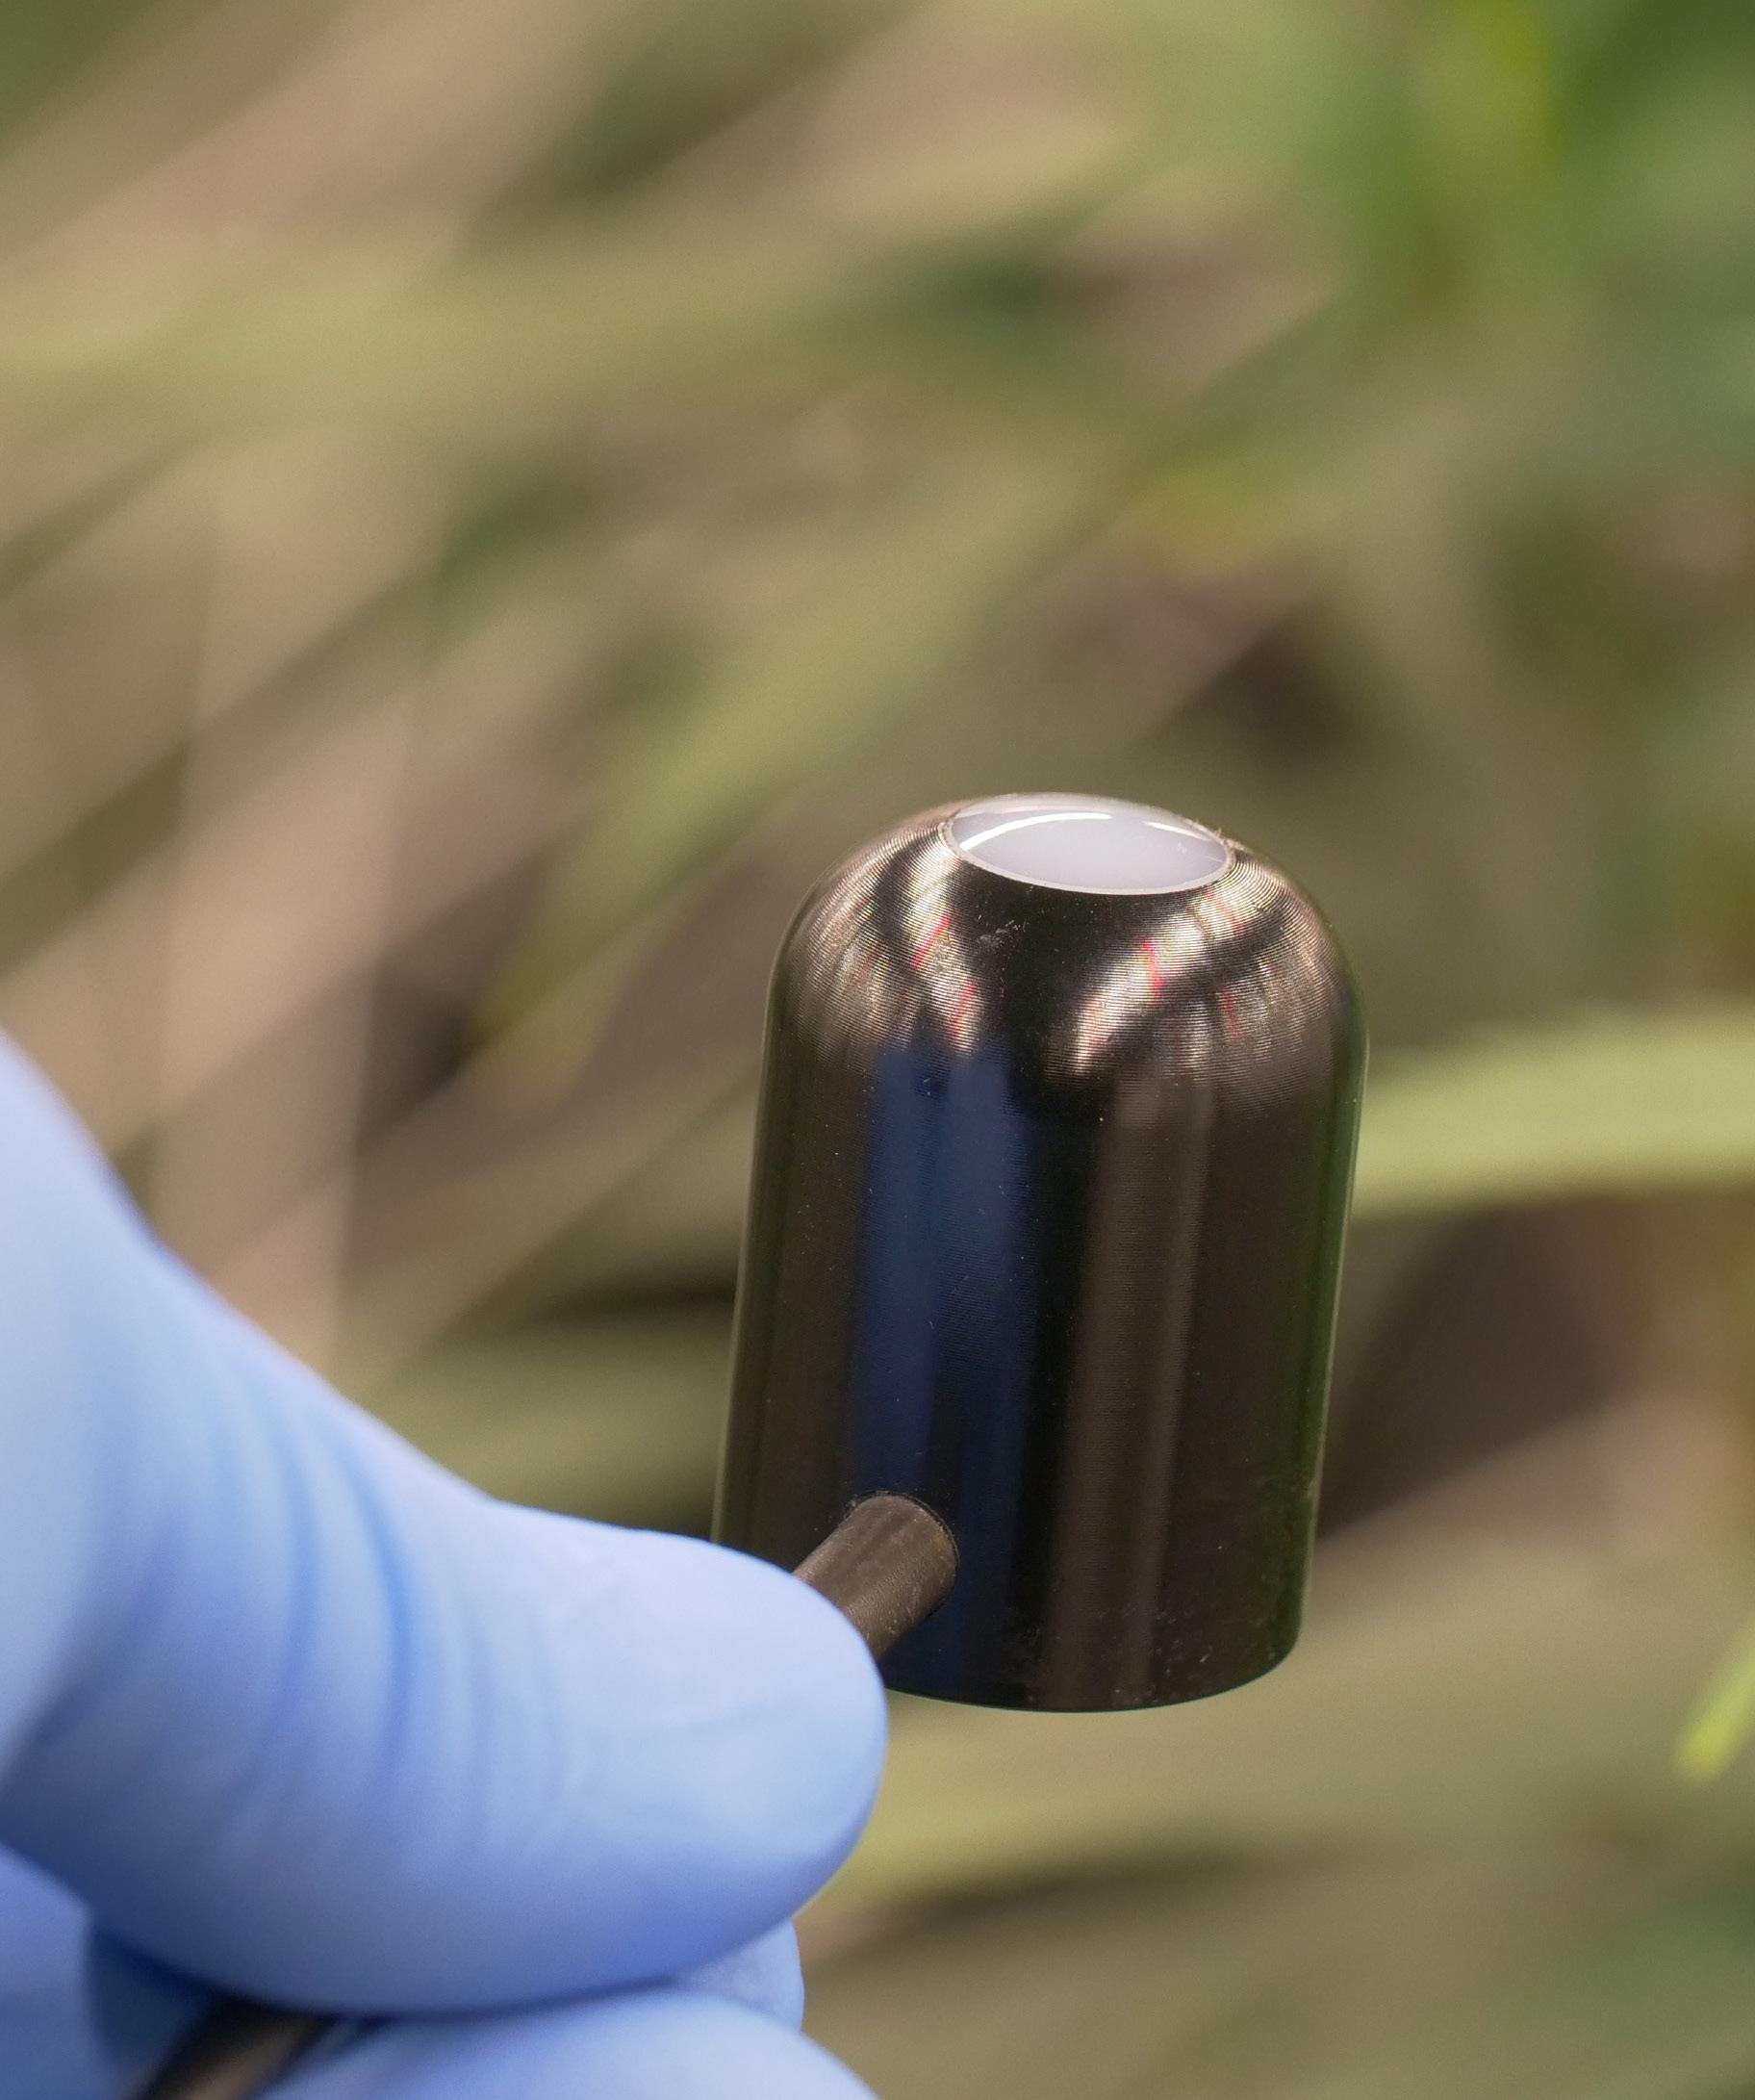
EVIRONMENTAL FACTORS
GUIDELINES + PARAMETERS
VPD (VAPOR PRESSURE DEFICIT)
Vapor Pressure Deficit (VPD) is a key factor in crop steering, representing the difference in water pressure between the inside of a leaf (assumed to be at 100% relative humidity) and the surrounding air.
Measured in kilopascals (kPa), VPD is determined by the interplay of leaf temperature, air temperature, and air humidity. It directly influences the plant’s transpiration rate and stomatal behavior, which in turn affects water uptake, nutrient transport, and photosynthesis.
In the context of crop steering, manipulating VPD allows growers to influence the plant’s water relations and, consequently, its growth patterns. Higher VPD values tend to create more generative conditions by increasing transpiration and creating mild water stress, while lower VPD values promote vegetative growth by reducing transpiration and maintaining higher turgor pressure in the plant tissues.
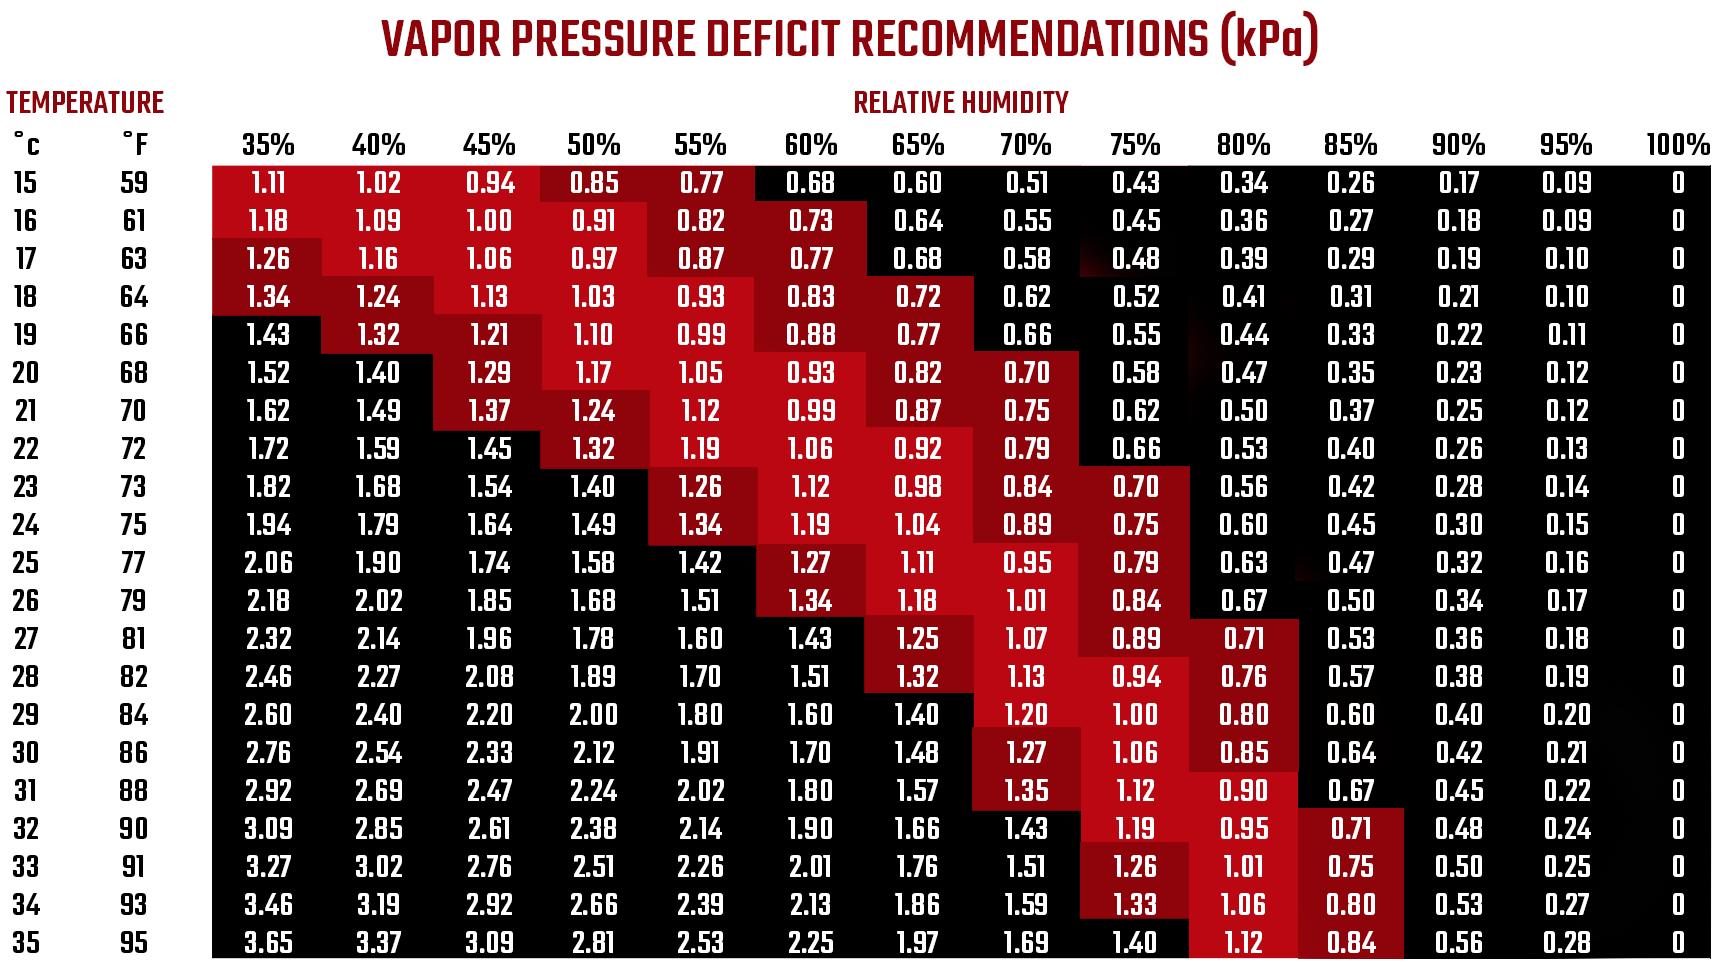
ENVIRONMENTAL TARGETS BY GROWTH STAGE
Here is an example of one way a grower might adjust the environment for a well-controlled and closely monitored facility with high light intensity. Note that there is no single optimal environmental strategy.
*During the Ripening stage, temperature and RH are gradually decreased to promote proper flower development and coloration.
EC (ELECTRICAL CONDUCTIVITY) & OSMOTIC POTENTIAL
EC management is crucial for crop steering. Here is one example for EC targets for different growth stages with high PPFD in coco coir:
OSMOTIC POTENTIAL & CROP STEERING
Osmotic potential is the force that plants must overcome to absorb water from the substrate, resulting from the difference in solute concentration between the substrate and the roots. In crop steering, manipulating EC directly affects osmotic potential. Higher EC increases osmotic potential, making it harder for plants to uptake water.
This creates a mild stress that can be used to influence growth patterns:
• Lower EC (lower osmotic potential) promotes vegetative growth by allowing easier water uptake.
• Higher EC (higher osmotic potential) promotes generative growth by creating mild water stress, encouraging the plant to focus on reproductive structures.
VWC
(VOLUMETRIC WATER CONTENT)
& MATRIC POTENTIAL
VWC is another crucial parameter in crop steering. VWC represents the volume of water contained in the substrate. Here is an example of VWC targets for different growth stages in coco coir. Note that the optimal VWC will be highly dependent on substrate characteristics and desired outcome.
MATRIC POTENTIAL
& CROP STEERING
Matric potential is the force that water experiences due to the physical properties of the substrate, such as surface tension and capillary action. It represents how tightly water is held by the substrate particles. In crop steering, understanding and manipulating matric potential is crucial:
• Lower matric potential (wetter substrate) promotes vegetative growth by making water easily available to the plant.
• Higher matric potential (drier substrate) creates mild water stress, promoting generative growth and root development.
By controlling irrigation frequency and volume, growers can manipulate matric potential to influence plant growth and development. This is particularly important in soilbased systems, where matric potential plays a more significant role than in hydroponic setups.

The interplay between osmotic potential (influenced by EC) and matric potential (influenced by VWC) allows for precise control over plant water relations and growth patterns throughout the cultivation cycle.
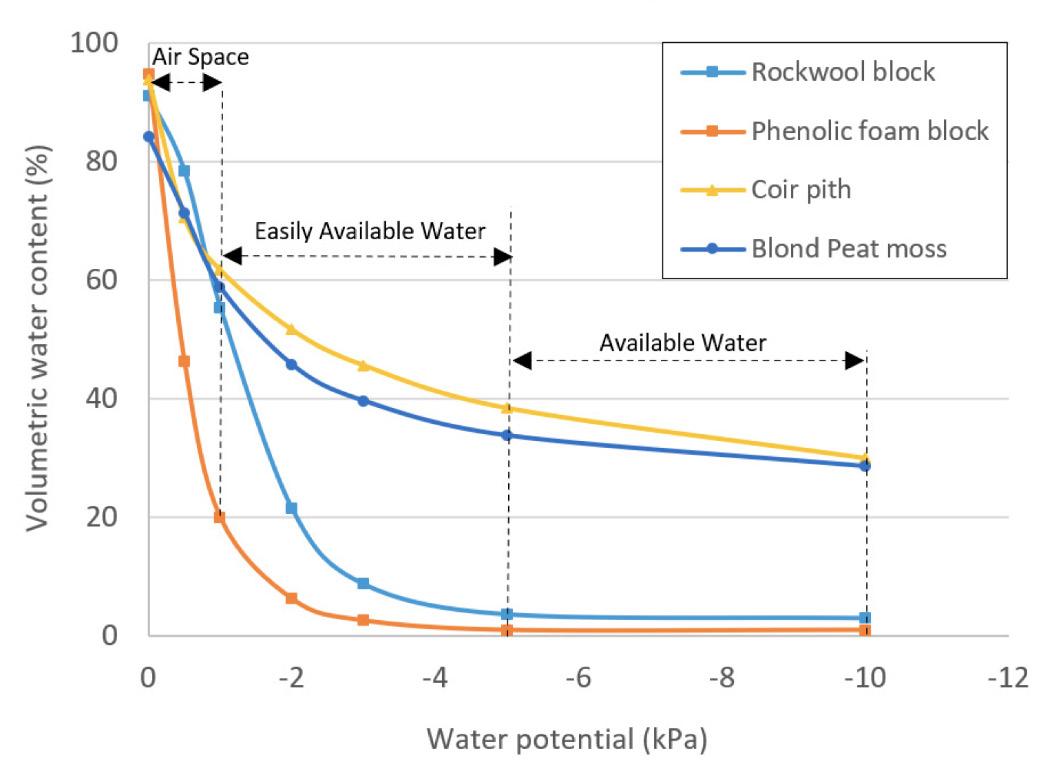
IRRIGATION STRATEGY

KEY TERMS
Irrigation strategy in crop steering is generally described in three phases that exist in each 24-hour period. Within these phases, “shots” and “drybacks” are used to achieve WC (Water Content) and ECpw (Electrical Conductivity of pore water) targets in the root zone, resulting in subsequent vegetative or generative effects.
Shots: Irrigation events of a given volume, measured as a percentage of the substrate volume, generally ranging from 2-10%. (See the “Substrate and Irrigation Math” section for details on calculating shot size, volume, and duration.)
Dryback: Refers to the decrease in WC% over a given timeframe between irrigation shots. Examples include:
Inter-shot dryback: The WC% drop between irrigation shots
P3 dryback: The total drop in WC% between the final irrigation of the day and the first irrigation of the next day
Lights-on dryback: The drop in WC% between the time when lights come on and the first irrigation
Additional Terms:
- WCmin: The lowest WC reading of the day
- WCmax: The peak WC of the day
- ECmax: The maximum substrate ECpw of the day
- ECmin: The lowest substrate ECpw of the day
- DUL (Drained Upper Limit): The maximum WC the substrate can hold against gravity
IRRIGATION PHASES
Phase 1 (P1) or Replenishment Phase:
Starts with the first irrigation of the day and concludes when the substrate has achieved its first runoff.
At the start: Substrate is at WCmin (lowest WC reading of the day) and ECmax (maximum substrate ECpw of day).
Generally initiated 1-4 hours after lights-on, after the crop has begun active transpiration. Duration: 1-3 hours.
As P1 ends: Substrate reaches WCmax (peak WC of the day) and approaches ECmin (lowest substrate ECpw of the day).
• Goals:
• Increase WC to the target level for the day.
• Replenish nutrient solution in the substrate.
• Allow the crop to begin transpiring before initiating irrigation.
• Achieve runoff within ~3 hours after initiating irrigation.
Phase 2 (P2) or Maintenance Phase:
Begins with the first runoff of the day when the substrate has reached the target WCmax. Ends with the final irrigation of the day.
Goals:
• Reduce ECpw during peak transpiration hours.
• Match shot size and frequency with dryback to maintain WC.
• Achieve at least 1-2% dryback between shots.
• Cease irrigation at the time that allows for desired P3 dryback.
Phase 3 (P3) or Overnight Dryback Phase:
Starts after the final irrigation of the day and ends with the first irrigation of the following day. The timing of the final P2 irrigation determines the total number of P3 dryback hours.
Goals:
• Achieve at least 2% dryback prior to lights-off.
• Control the total amount of overnight dryback.
• Be timed to achieve the target WC% and ECmax at the start of the following day’s P1.

OVERALL IRRIGATION STRATEGY:
VEG, STACK, SWELL, RIPEN
The irrigation strategy varies throughout the growth cycle:
Vegetative:
Focus on maintaining consistent moisture with small, frequent irrigations. This promotes vegetative growth and root development.
Stacking:
Initiate flower formation and reduce internodal spacing with larger, less frequent irrigations and higher substrate EC.
Bulk/Swell:
Higher water content, lower substrate EC, and more frequent irrigations to create a bulking effect.
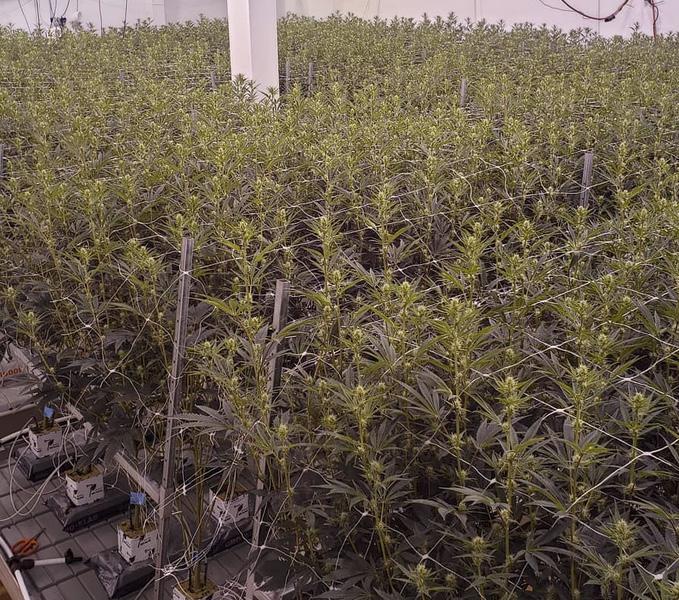
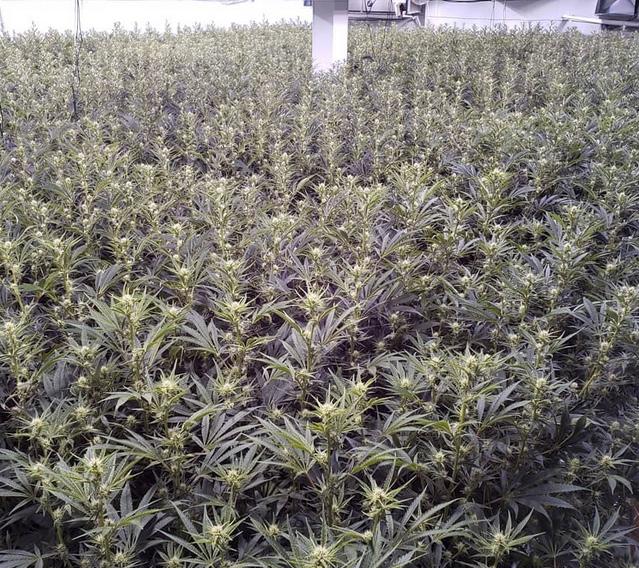
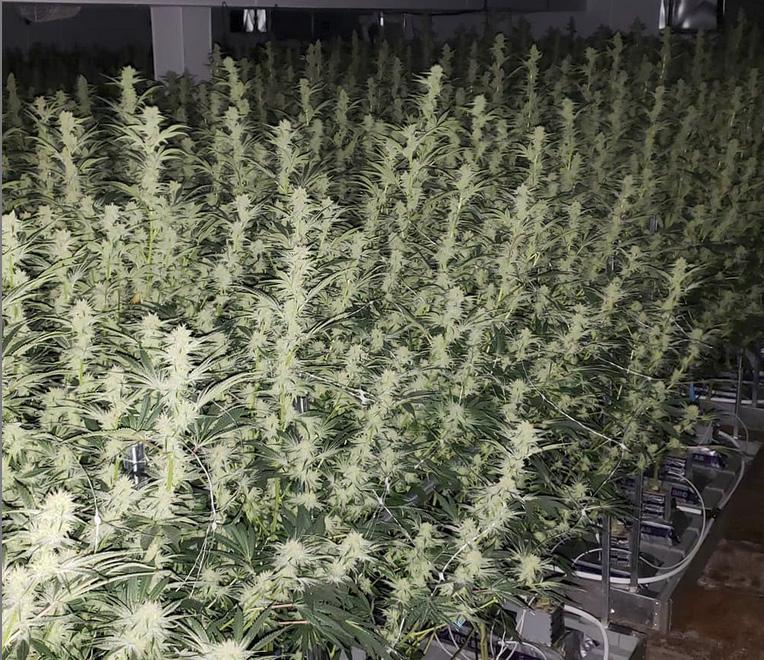

Ripening:
Larger shots with increased runoff and reduced N ratios partition resources towards secondary metabolism of cannabinoids, terpenes, color.
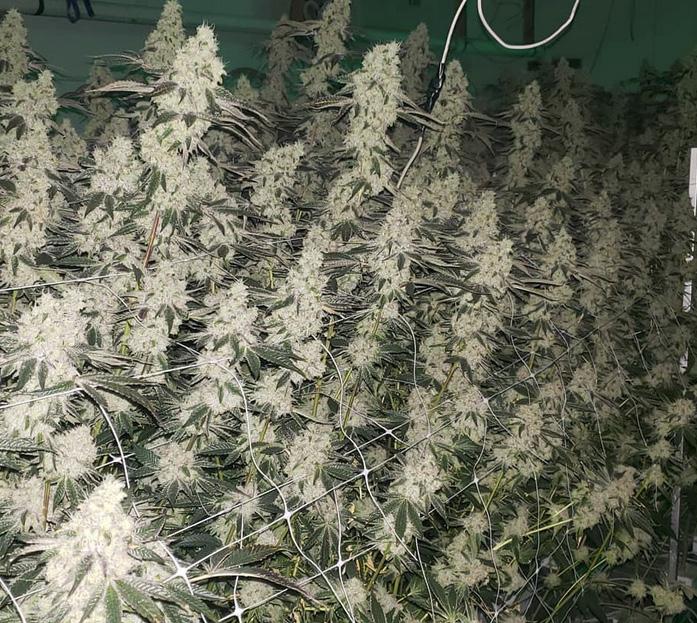
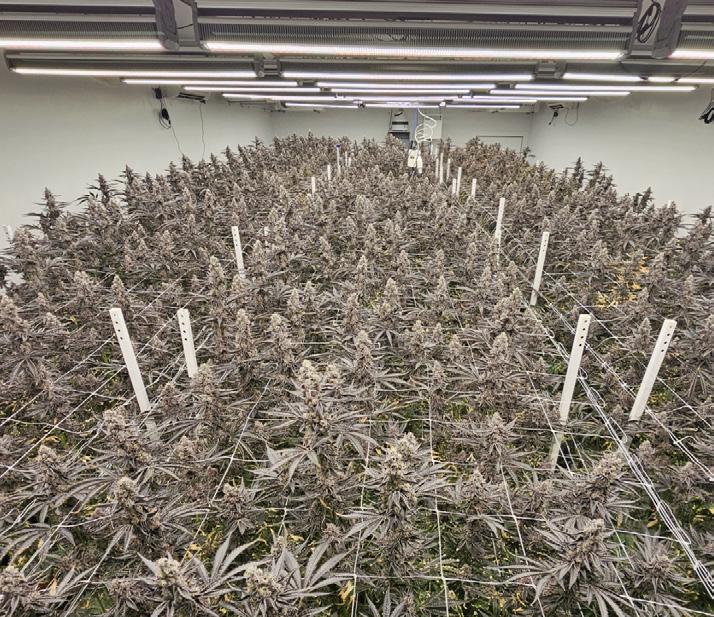
Phase Example Photos and Aroya Charts by permission, Copyright © 2024 Tyler Simmons
IRRIGATION PARAMETERS
& DRYBACK
One example of how a cultivator might steer their coco coir:
Shot strategy Small, frequent Large, infrequent Small, frequent Large, infrequent
By following these crop steering guidelines, growers can optimize their cultivation process, maximizing yield and quality through strategic environmental control and irrigation management.
Example AROYA Data:
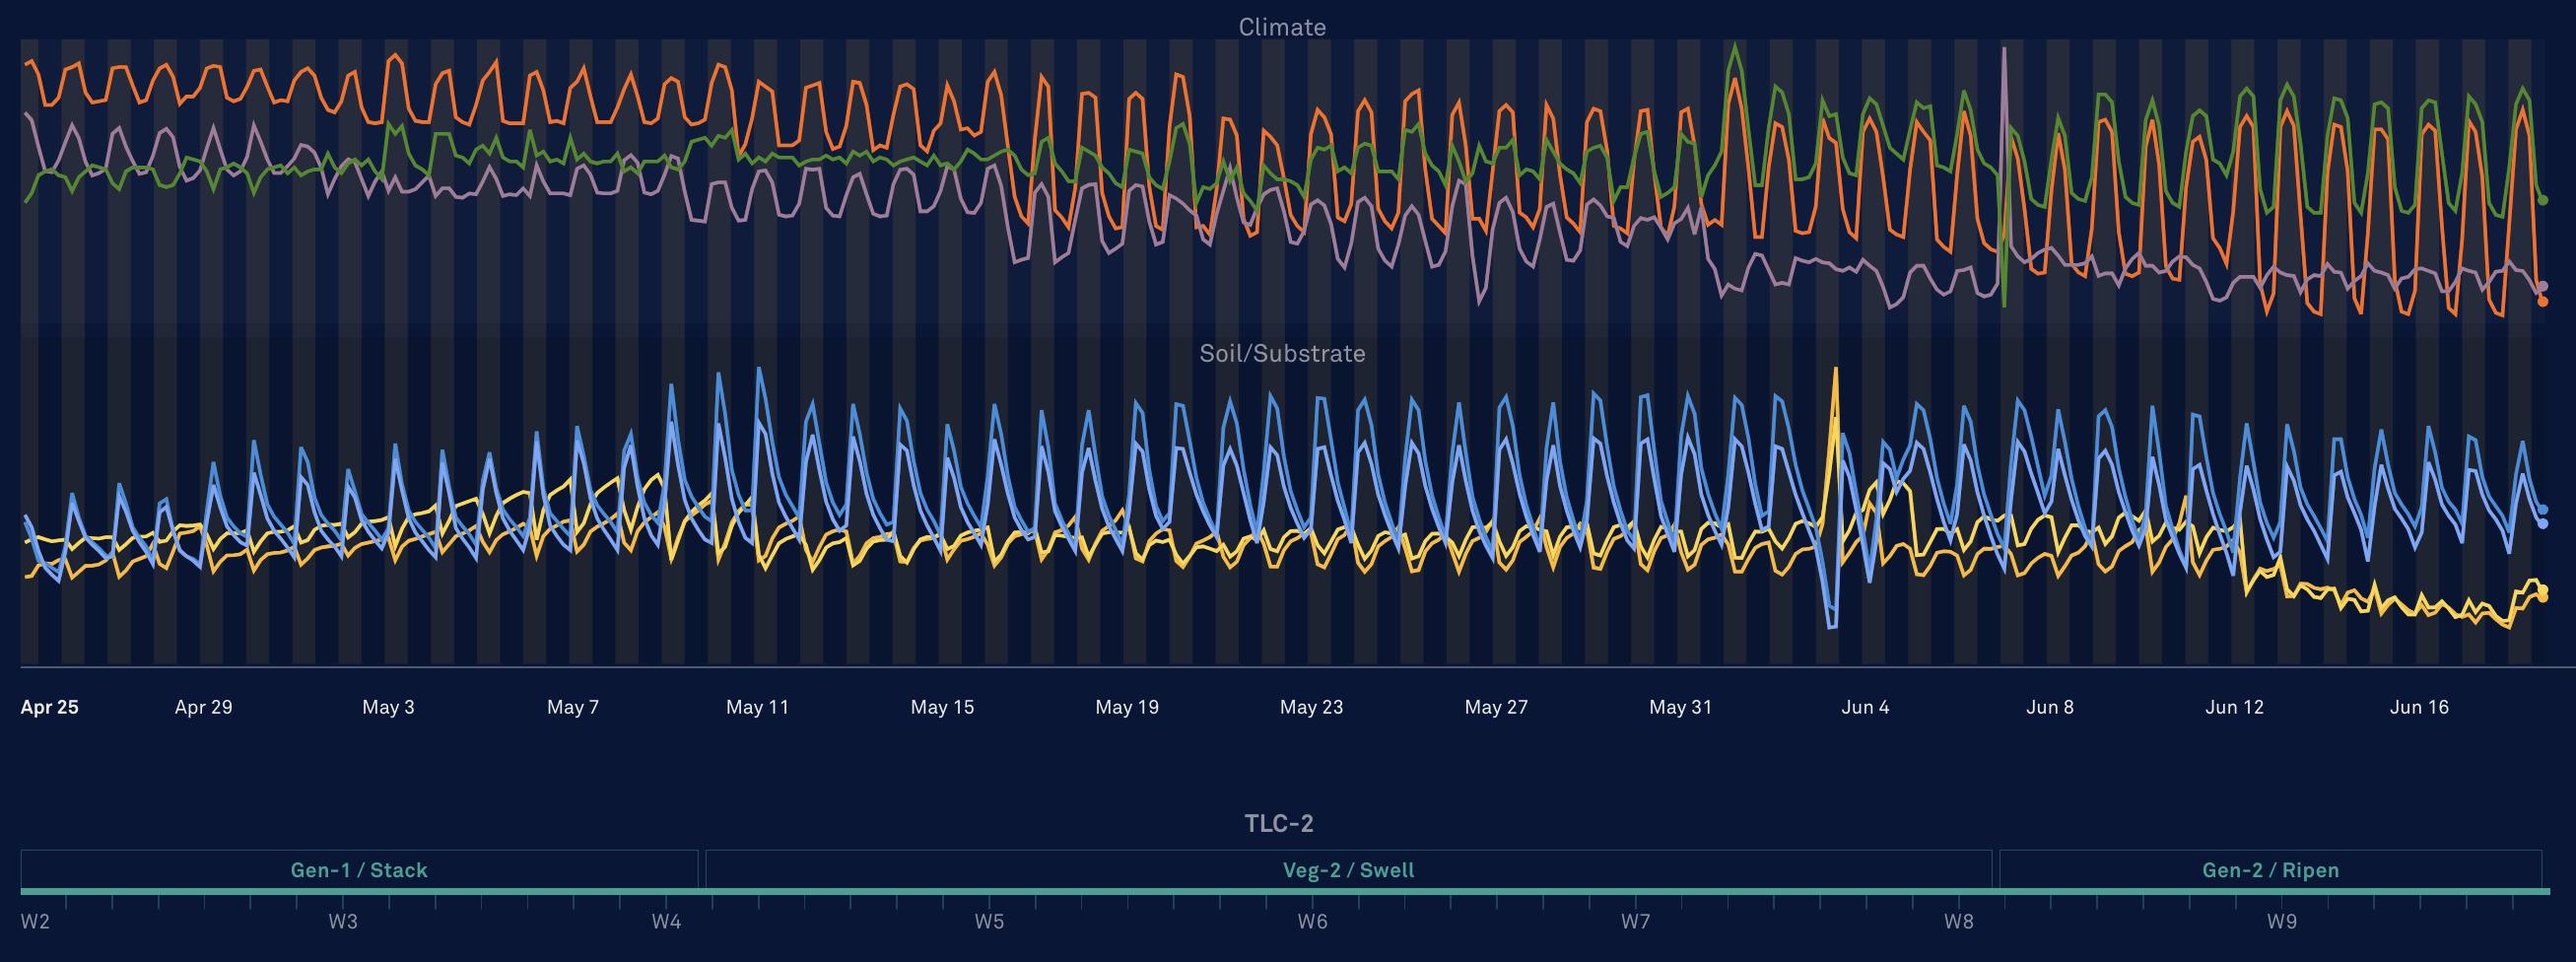
Gradual changes across the cultivation phases in climate (upper half) and substrate (lower half) match plant demands while “steering” the crop towards the desired growth characteristics.

3-day
SUBSTRATE & PLANT DENSITY CONSIDERATIONS
OPTIMIZING FLOWER SITE DENSITY
Maximizing yield and quality in cultivation hinges on optimizing the number of flower sites per cubic foot above a minimum PPFD. This optimization requires a careful balance of plant size, spacing, and vegetation duration. The key principle is to flip to flower 21-28 days before the canopy reaches desired density, allowing plants to fill out during the stretch phase.
PLANT SPACING & SUBSTRATE VOLUME
Effective cultivation can be achieved through two contrasting approaches:
Ideal for compact, multi-tier rooms; Higher cloning quantities
Suitable for singletier rooms with high PPFD; Lower plant quantities
The choice between these approaches depends on facility design, strain characteristics, and operational preferences.
BENEFITS OF HYDROPONIC SUBSTRATES
Hydroponic substrates like coco coir and rockwool offer significant advantages for cultivation, particularly in supporting effective crop steering techniques.


Coco coir provides excellent water retention and aeration with natural pH buffering capacity. It’s environmentally friendly and allows for frequent fertigation, supporting precise nutrient management.
Rockwool, being sterile and inert, reduces pest and disease risks. Its consistent structure ensures uniform water and nutrient distribution, enabling precise control over root zone conditions.
Both substrates allow for rapid adjustments to nutrient and irrigation programs, providing optimal root zone conditions. This flexibility is crucial for implementing effective crop steering strategies.
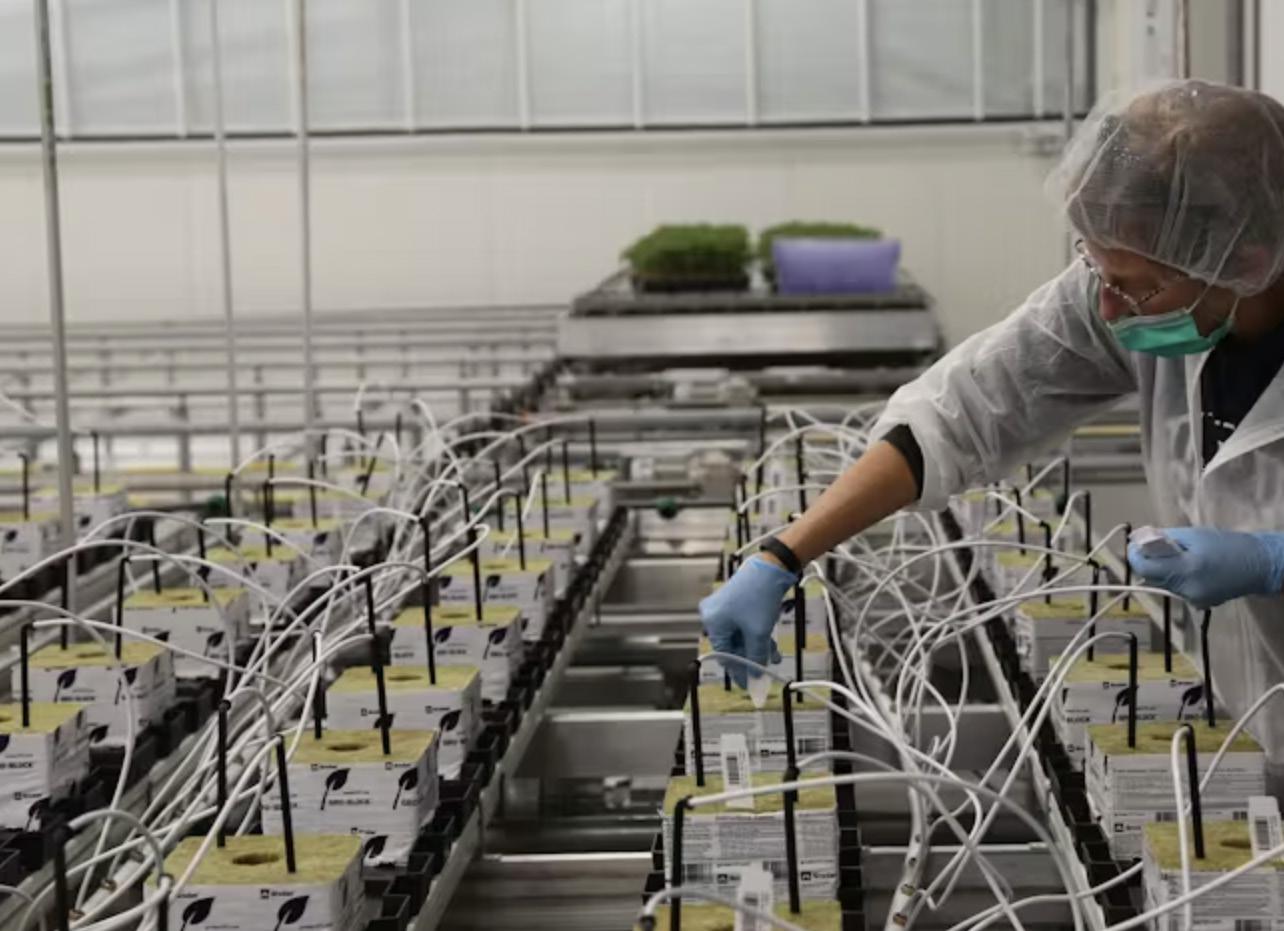
IDEAL SUBSTRATE DENSITY
The optimal substrate density for effective crop steering is between 20-30 L per m² of canopy. This range provides adequate support for plant growth while allowing for precise control over root zone conditions. Adhering to this density range enables growers to implement crop steering techniques effectively, balancing water retention, nutrient availability, and root development.
When selecting a substrate, consider its volume in relation to plant spacing and vegetation duration. Irrigation frequency and EC management should be adjusted to match the substrate volume and plant density. It’s crucial to ensure that the chosen substrate can support the desired plant size without leading to overcrowding.
Photo by permission, Copyright © 2024 Grodan®
OPTIMIZING FLOWER SITE DENSITY FOR MAXIMUM YIELD
Optimizing the density of flower sites within the canopy is essential for maximizing yield and quality in a garden. By following these recommendations, growers can optimize plant growth and yield while minimizing the need for extra pruning or wasted veg time, ultimately leading to a more profitable operation.
Most cultivators know that efficient cultivation requires maximizing the square footage of canopy area within the grow room. Techniques such as using rolling benches to minimize aisle space and highbay overlapping light plans to create a uniform canopy PPFD have improved yield and quality by increasing the efficiency of space utilization and light interception.
The next step in maximizing yield is optimizing the total cubic footage of the canopy, which takes canopy depth into account. With the right light intensity, a 1000 ft² canopy with 3 feet of depth can yield up to 50% more than the same 1000 ft² canopy with only 2 feet of depth.
The real key here is to maximize the number of flower sites within your target PPFD range in your available cubic footage. This metric, “flower sites/cubic ft at X PPFD,” is crucial for achieving the best possible yield for a given strain and facility.
Based on data collected from my facilities, I have developed a general rule of thumb:
5-7 days veg time for each ft² of canopy space per plant
For example, in a room where each plant has 2 ft² of canopy area, the ideal veg time will usually be 10-14 days.
Note that this rule of thumb only works under specific conditions:
ຈ Clones are healthy, fully rooted, and come from healthy mother plants.
ຈ Light intensity is adequate and matched with plant needs.
ຈ Climate conditions are in balance.
ຈ Root zone conditions and irrigation are in balance.
ຈ Veg substrate is charged at an appropriately high EC for vigorous growth.
ຈ Veg feed EC is matched with plant demands, climate, and light intensity.
ຈ Selected strains are not exceptionally slow or fast in veg (e.g., MAC or GMO).
THE WRONG WAY
There isn’t a single “best” way to manage plant size and spacing, but there are several wrong ways to do it. Here are two nonoptimal scenarios that exist on opposite ends of the canopy density spectrum:
Empty Canopy Volume
When plants are too small relative to their spacing (due to short veg time, wide spacing, or both), much of the light ends up hitting the tables or floor rather than being intercepted by the plants. This results in wasted photons that could otherwise contribute to yield and potency. Such plants tend to have a compact structure with minimal stretch and close node spacing. While quality is generally high, yield is relatively low due to the empty volume within the lit room.
Plant Overcrowding
Overcrowding occurs when plants are too large relative to their spacing. Although all the light is intercepted, the plants grow into each other, causing lower branches to be completely shaded. The high ratio of far-red to red wavelengths that reach the lower canopy triggers the “Shade Avoidance Response” (SAR), leading to energy being diverted into stem growth rather than flower/generative development. This excessive inter-plant competition for resources results in poor plant structure, increased susceptibility to disease, and greatly reduced flower quality, structure, color, and potency. Additionally, overcrowded plants require more pruning and labor to manage the canopies, greatly increasing production costs.
SOME RIGHT WAYS
Cultivators can achieve optimal flower site density with various plant spacing and veg durations, as long as the two factors are well-matched. Here are two effective examples on opposite ends of the plant density spectrum:
High Density, Short Veg Duration
An example of this approach is 1 ft² per plant with a 7-day veg time. This is more suitable for a compact, multitier flower room with height limitations. Cloning quantities and plant count will be much higher, but plants will spend less time in the veg room.
Low Density, Long Veg Duration
An example of this approach is 4 ft² per plant with up to a 28-day veg time. This scenario creates greater canopy depth and is better suited for a singletier flower room with high PPFD. Plant quantities will be much lower, but veg durations will be longer.
Ultimately, the choice between high density/short veg or low density/long veg will depend on factors like facility logistics, labor, space, strains, and preferences.
Regardless of the chosen option, the key concept is:
• The crop should be flipped into flower about 21-28 days before the canopy reaches the desired density.
• If timed correctly, the plants will fill out the canopy during the stretch phase, so that by the time it has ended, the cubic volume is full but not overcrowded.
OUR BLOG ARTICLES
Discover invaluable insights and stay ahead in the world of commercial cannabis cultivation with our blog articles at FrontRowAg.com Our articles cover common challenges and share innovative solutions, offering technical knowledge to enhance your operations. Explore the latest advancements in data tracking for informed financial decision-making and get detailed information about our products.

About the Author
Tyler Simmons
Cultivation science communicator, consultant, and technical advisor for Front Row Ag, Tyler Simmons has been a pioneer of data-driven cultivation methodologies. He is known for co-founding the California flower brand Northern Emeralds and his contributions to AROYA Education.

6 FACTORS AFFECTING FEED EC
Hydroponic systems provide plants with nutrients through a liquid solution that flows over their roots. The electrical conductivity (EC) of this solution is an important factor to consider, as it affects the health and yield of the crops. EC is a measure of the dissolved mineral content in the nutrient solution.
This article will discuss several factors that influence the ideal EC of the nutrient solution, including:
• IRRIGATION STRATEGY
• SUBSTRATE DRYBACK AND WATER CONTENT TARGETS
• LIGHT INTENSITY
• LIGHT QUALITY
• CLIMATE CONSIDERATIONS (VPD)
• PHASE OF GROWTH
1. IRRIGATION: FREQUENCY, VOLUME, AND RUNOFF
The frequency and volume of irrigation play a significant role in how much salt accumulates in the substrate and around the roots. Proper irrigation management is crucial to maintain a healthy substrate and ensure optimal plant growth.
It is necessary to monitor the substrate and irrigate frequently and with enough volume to create a minimum percentage of daily runoff. This helps avoid salt build-up and minimizes the risk of osmotic stress and nutrient toxicity. Measuring the pH and EC of the runoff and comparing it with the feed solution can provide insights into how the substrate’s salt content is changing and whether adjustments to the feed EC or runoff proportion are necessary.
2. DRYBACK AND WATER CONTENT TARGETS
Substrate dryback refers to the decrease in substrate water content between irrigation events or daily cycles. Managing substrate dryback is essential to maintain optimal plant growth, as too much or too little dryback can lead to drought stress, excessive ECs, overwatering, root diseases, and nutrient leaching.
Monitoring substrate water content (WC) and EC with sensors can provide valuable information about the substrate’s water retention and loss due to evaporation and transpiration.
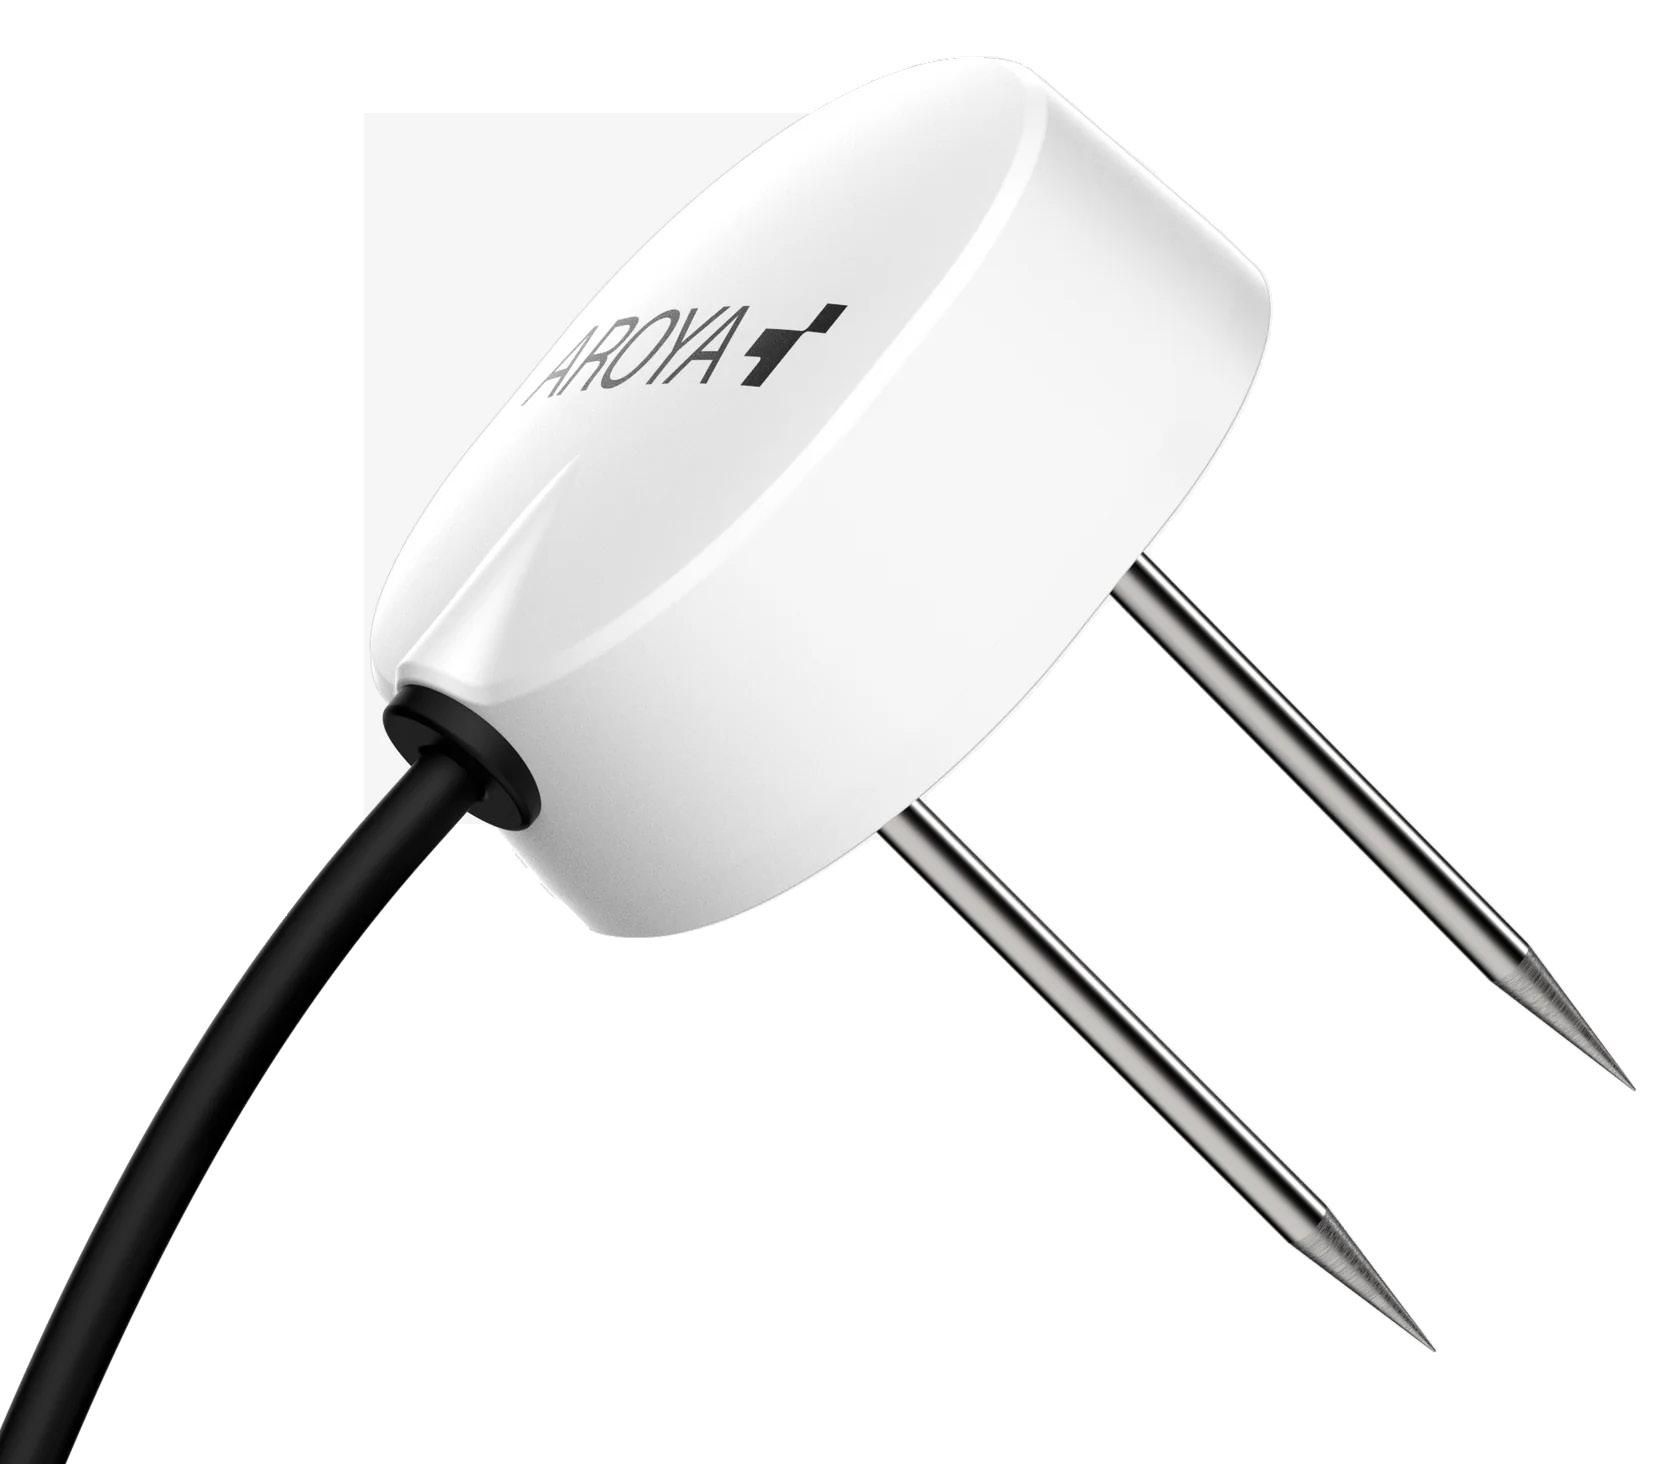
Considering the impact of substrate dryback on substrate EC is crucial. As water evaporates from the substrate, salts accumulate and increase the EC, potentially leading to salt toxicity and nutrient imbalance. Controlling dryback to prevent unfavorable EC spikes generally requires maintaining the WC within a specific range, relative to field capacity (FC).
Substrate sensors like the AROYA Teros 1 provide valuable data.
3. LIGHT INTENSITY:
PPFD LEVELS
Light intensity plays a vital role in plant growth, as it affects water and nutrient use. Higher light intensities lead to increased rates of photosynthesis and transpiration, requiring more water and nutrients to support growth. In hydroponics, this can be measured by the photosynthetic photon flux density (PPFD), which indicates the amount of light energy that reaches a given area per second.
Adjusting the feed solution EC for different PPFD levels ensures that plants receive adequate nutrients to avoid deficiencies while avoiding salt toxicity and osmotic stress. A general guideline is to increase the EC as light intensity (and the rates of photosynthesis) increase.
4. LIGHTING QUALITY:
LED VS HID
Different light sources, such as LED and HID (high-pressure sodium and metal halide) lamps, can have distinct effects on plant growth and development. One such effect relates to infrared (IR) radiation, which influences various aspects of plant growth, including photosynthesis, respiration, transpiration, flowering, and fruit ripening. LED lights typically emit less IR radiation than HID lamps. Plants grown under LEDs usually require higher EC levels, as they tend to transpire less and take up fewer nutrients from the substrate or solution. In contrast, plants grown under HID lamps may require lower EC levels due to increased transpiration and nutrient uptake.
5. PLANT CLIMATE AND VPD
Vapor pressure deficit (VPD) is an important factor that reflects the suction force of water vapor from plant stomata. Higher VPD values indicate increased transpiration rates,
which in turn affect the volume of water and minerals taken up by the plant from the substrate. Reducing the feed solution EC under high VPD conditions can help prevent salt buildup and toxicity while ensuring that plants receive adequate nutrients to support their growth and development.
6. PHASE OF GROWTH
The feed EC requirements for plants change throughout their life cycle. For example, plants typically require higher ECs during the initial substrate charging and conditioning phase, as well as during rapid growth stages, such as the vegetative and stretch phase of flowering. In contrast, mineral requirements tend to decrease after week 3-4 of flowering and during the final 1-2 weeks of flower, necessitating adjustments to the feed solution EC. It is essential to consider the specific needs of the plants during each growth phase and adjust the feed EC accordingly to support optimal growth and development while minimizing the risk of nutrient imbalances and salt toxicity.
HOW TO SELECT THE RIGHT EC FOR YOUR PLANTS
While it’s impossible to give specific recommendations due to the individual facility differences in the factors mentioned above, here are some of my recommendations...
• No tracking of runoff volumes or EC
• Lower PPFD levels
• Using HID lighting, full sun, or GH
• Low level of climate control with high temps and/or VPD
• If the following factors are present, use the FRA High Strength Feed Chart (2.43.0 EC), increasing in steps of 10% as necessary for optimal plant vigor: ...

UNDERSTANDING pH
We published the following series of blogs on pH with the intention to cover every aspect that affects cultivators. We started with the basics in Part 1, followed by a slightly more specialized set of facts in Part 2, then wrapped the series up with practical applications in the third and final blog, “pH in Practice.”
UNDERSTANDING pH:
MORE THAN YOU WANTED TO KNOW (PART 1)
• The chemistry of pH, acids, and bases
• Practical implications for cultivation
INTRODUCTION
We all accept the importance of pH in hydroponics as it relates to fertilizer and substrate management, but often ignore the underlying science. Given this fundamental importance of acids and bases in chemistry and their influence on a range of chemical reactions involved in hydroponics, I think a deeper understanding is warranted. This article aims to do this by starting with the chemistry of pH, acids, and bases and building up to the practical implications for cultivation. In part 2 we’ll explore more of the practical implications of this science, and best practices around pH management in hydroponics.
HYDROGEN, HYDROXIDE, AND HYDRONIUM IONS
Fundamentally, acids and bases are two types of substances defined by their ability to accept or donate protons (H+ ions). Understanding the dynamics of hydrogen (H) atoms is critical to understanding the nature of acids and bases.
• A hydrogen atom (consisting of one proton and one electron) can transform into a positively charged hydrogen ion (H+) (a lone proton) in a water-based solution as it loses its electron. However, in such solutions...
Scan here to read the rest of this article at frontrowag.com/blog

UNDERSTANDING pH:
MORE THAN YOU WANTED TO KNOW (PART 2)
• How nutrient absorption affects rootzone pH
• When to use acids or bases
• Commonly used acids and bases in hydroponics
• Considerations on pH management
pH CHANGES IN THE SUBSTRATE
As we’ve established, nutrients are generally best absorbed between 5.8 - 6.2 pH, but it’s not always quite as simple as just setting the pH of the feed solution and forgetting it. Several factors can influence the pH in the root zone, especially the interaction between the plant roots and the fertilizer solution.
The nutrients in hydroponic fertilizer solutions exist as positively charged ions (cations) and negatively charged ions (anions). To effectively absorb these ions, the plant roots needs to maintain electrical balance. When plants take up cations (with their positive charge) they release an equivalent number of H+ ions (also positive charge) and when they take up anions (negative charge), they release an equivalent number of hydroxide (OH-) so as to maintain electrical balance. The preferential uptake of different nutrient ions can cause the pH of the substrate to “drift” over time.
Common cations in hydroponic fertilizer solutions include potassium...
Scan here to read the rest of this article at frontrowag.com/blog

pH IN PRACTICE
• Adjusting pH levels,
• Choosing from common bases and acids for pH adjustment,
• Understanding the sequence of pH adjusters for fertigation systems
• The importance of calibration and accurate pH measurement.
INTRODUCTION: pH IN PRACTICE
In Controlled Environment Agriculture (CEA), managing the pH of nutrient solutions is a fundamental aspect of ensuring optimal plant health and growth. This article focuses on the importance of adjusting pH levels in facilities using low EC water sources like Reverse Osmosis (RO) or rain catchment systems, as well as those with higher EC city or well water. The article discusses choosing and using common bases and acids for pH adjustment, including Potassium Hydroxide, Potassium Carbonate, Phosphoric Acid, and Sulfuric Acid. It also covers the sequence of adding pH adjusters in fertigation systems and the importance of accurate pH measurement and calibration.
RAISING pH
This is generally required for facilities using very low EC water from Reverse Osmosis (RO) or rain catchment, due to low levels of preexisting alkalinity. The low buffering capacity that results from lack of alkalinity means that these water sources will be very sensitive to the pH effects from fertilizer and pH adjusters. These facilities will need to use one of the common bases to raise the pH of their fertilizer solution:
Potassium hydroxide (KOH) - This is a strong base that exerts large and immediate changes to solution pH. While this can be desirable in some situations, it’s very important to dilute it, then add it very gradually to not cause unfavorable...
Scan here to read the rest of this article at frontrowag.com/blog


SALTS ARE NOT JUST SALTS

Not all fertilizer blends are created equal.
Choosing the right blend can impact plant growth and crop quality. Discover the importance of elemental ratios, micronutrient packages, and the quality and consistency of the inputs used to create a fertilizer blend.
In the same way that “calories are just calories” oversimplifies the complex world of human nutrition, the idea that “salts are just salts” completely fails to capture the intricacies of plant fertilization. In this article, we’ll explore why not all fertilizer blends are created equal, and how choosing the right blend can impact plant growth and crop quality.
ELEMENTAL RATIOS AND PLANT GROWTH
While it’s true that all fertilizer salts are composed of ions, it’s important to understand that not all salt formulas are equivalent when it comes to plant nutrition. Just as the balance
and ratios of macronutrients (proteins, fats, and carbohydrates) in human diets affects our health and well-being, the ratio of elements in a fertilizer blend has critical impacts on plant growth. One example of this can be seen in the research surrounding nitrogen and its effect on secondary metabolic byproducts.
Excessive nitrogen, particularly in the late flowering phase, has been shown to reduce the production of secondary metabolic byproducts like trichomes and terpenes. Trichomes are tiny, hair-like structures on the surface of plants that serve various functions, including the production of essential oils, while terpenes are aromatic compounds that contribute to the unique flavors and scents of plants.
An imbalance of nitrogen can lead to a decrease in these valuable compounds, ultimately affecting the overall quality of the crop. With the premium placed on flower quality, it’s essential to choose a fertilizer blend that provides the proper elemental ratios at the right times to promote optimal plant growth and development. While having adequate nitrogen levels during
veg and stretch periods is critical to setting up the best plant architecture going into the swell period, many popular nutrition programs apply nitrogen in the incorrect ratios and amounts far too late into the flowering cycle. As a result, susceptible cultivars will remain vegetative when they should be ripening, causing a delayed maturation with low levels of terpenes.
BALANCING MACRONUTRIENTS AND MICRONUTRIENTS IN THE FERTILIZER PARTS
Fertilizers are typically composed of a blend of different salts, which provide plants with the essential macronutrients (nitrogen, phosphorus, and potassium) and micronutrients (such as calcium, magnesium, and iron) they need to thrive. The specific combinations of these salts in a fertilizer blend can have a profound impact on nutrient availability and plant health.
Macronutrient Ratios: The ratios of nitrogen (N), phosphorus (P), and potassium (K) in a fertilizer blend are often represented by the N-P-K values found on fertilizer labels. The optimal N-P-K ratio depends on the specific crop and its growth stage. Fertilizer blends high in nitrogen are suitable for promoting vegetative growth, while a blend with a higher phosphorus content is better for supporting flowering and fruiting. By tailoring the N-P-K ratios in your fertilizer blend to match the needs of your crop at various growth stages, you can optimize plant health and productivity. One example of this can be seen in the research surrounding nitrogen and its effect on secondary metabolic byproducts.
Excessive nitrogen, particularly in the late flowering phase, has been shown to reduce the production of secondary metabolic byproducts like trichomes and terpenes. Trichomes are tiny, hair-like structures on the surface of plants that serve various functions, including the production of essential oils, while terpenes are aromatic compounds that contribute to the unique flavors and scents of plants.
An imbalance of nitrogen can lead to a decrease in these valuable compounds, ultimately affecting the overall quality of the crop. With the
premium placed on flower quality, it’s essential to choose a fertilizer blend that provides the proper elemental ratios at the right times to promote optimal plant growth and development. While having adequate nitrogen levels during veg and stretch periods is critical to setting up the best plant architecture going into the swell period, many popular nutrition programs apply nitrogen in the incorrect ratios and amounts far too late into the flowering cycle. As a result, susceptible cultivars will remain vegetative when they should be ripening, causing a delayed maturation with low levels of terpenes.
Micronutrient Balance: While micronutrients are required in smaller quantities than macronutrients, they still play a vital role in plant growth and development. The specific combination of micronutrient salts in a fertilizer blend can impact their availability and uptake. For instance, chelated micronutrients (such as Fe-EDTA) are more readily available for plant uptake than their non-chelated counterparts. Ensuring that your fertilizer blend contains a balanced mix of micronutrients in forms that are easily accessible to plants can help prevent nutrient deficiencies and promote optimal growth. At best, an imbalance of micronutrients leads to diminished crop quality and compromised smell and visual characteristics. At worst, micronutrient deficiencies or toxicities can result in stunted growth, poor yield, or even crop failure.
SYNERGISTIC AND ANTAGONISTIC RELATIONSHIPS
As mentioned earlier, certain combinations of salts can have synergistic or antagonistic effects on nutrient availability and uptake. Understanding these relationships is essential for creating an effective fertilizer blend.
Synergistic Relationships: Synergistic relationships between nutrients can enhance the availability or uptake of one or more elements. For example, the presence of ammonium in a fertilizer blend can improve the uptake of potassium, while the inclusion of nitrate can enhance calcium uptake. By leveraging these synergistic relationships, you

NITRATE VS AMMONIUM IN CANNABIS
This Research Highlight is aimed at explaining key advancements in science relative to cultivation. In this article, we’ll evaluate a recent study that investigates the comparative impacts of ammonium (NH4) and nitrate (NO3) nitrogen sources on the physiology and growth of medical Cannabis in hydroponic systems. Through a comprehensive exploration of this research, we aspire to provide valuable insights into the optimization of hydroponic techniques and cultivation performance.
SALONER AND BERNSTEIN 2022
Nitrogen Source Matters: High NH4/NO3 Ratio Reduces Cannabinoids, Terpinoids, and Yield in Medical Cannabis
STUDY OVERVIEW
Nitrogen is a crucial nutrient for plants, and its form - either as ammonium (NH4+) or nitrate (NO3-) - can greatly affect plant function and metabolic responses. The balance between these two forms can specifically impact the production of certain valuable compounds in some plants. In this excellent study, Avia Saloner and colleagues investigated the effects of five different NH4/ NO3 ratios on plant growth and found that:
• A higher NH4 supply led to adverse responses in secondary metabolite production, yield, plant height, and other factors.
• Moderate levels of NH4 (10-30%) did not have a significant negative impact and were considered suitable for certain types of plant cultivation.
• Ratios above 30% NH4 are not recommended, as they can increase the potential for severe and fatal toxicity damage to the plant.
BACKGROUND
Competitive market conditions have lead to increasing demand for high-quality, chemically standardized medicinal Cannabis plants due to their potential in modern medicine. The production of various phytochemicals including
Cannabinoids and terpenes in these plants is influenced by environmental and cultivation conditions. Recent research has identified plant sensitivity to mineral nutrition, including nitrogen (N) and phosphorus (P) status, as well as humic acid supplementation. This current study aimed to investigate the effects of different ammonium (NH4+) to nitrate (NO3-) N source ratios on the morpho-development, physiology, and secondary metabolism of a particular medicinal plant.
Nitrogen uptake in plants is primarily through NO3- or NH4+ ions, which are then assimilated into amino acids and other N metabolites. NH4/ NO3 ratios play a critical role in plant energy status, pH adjustment, mineral uptake, and other metabolic and regulatory processes. Many agricultural plants can perform well with up to a certain level of NH4 relative to NO3 supply, at a range of 10-30% NH4/NO3 ratio. However, the optimal NH4/NO3 ratio for the cultivation of this specific medicinal plant is unknown.
MATERIALS AND METHODS
GROWING CONDITIONS
In this study, a specific medical cultivar was used as a model to investigate the effects of different ammonium (NH4+) to nitrate (NO3-) nitrogen source ratios. The plants were propagated from rooted cuttings, replanted to 3L plastic pots, and grown in perlite media under controlled environmental conditions. Uniform plants were selected and divided into five treatment groups with varying N-NH4+ supply: 0, 10, 30, 50, and 100%. The remaining nitrogen was supplied as N-NO3- to maintain a uniform total nitrogen level.
The plants were grown under specific photoperiods: initially, a long photoperiod (18/6 h light/dark) during the vegetative phase, followed by a short photoperiod (12/12 h light/ dark) to induce inflorescence development. Light, temperature, and relative humidity were regulated throughout the experiment. Irrigation was provided via pressure-compensated drippers, and mineral nutrients were supplied in the irrigation solution at each event.
The irrigation solution contained various
micronutrients and macronutrients, with concentrations selected based on previous studies to optimize plant development and function. The pH of the irrigation solution was adjusted to 5.6-6.0. The experiment followed a complete randomized design, with five replicated plants per treatment.
MINERAL ANALYSIS
Mineral nutrient concentrations in plant organs were analyzed at the end of the experiment, 59 days after the initiation of the NH4/NO3 treatments. Electrical conductivity (EC) and pH of the irrigation and leachate solutions were measured weekly.
Plants were sampled for physiological analyses 45 days after the start of the fertigation treatments, as treatment effects were expected to be prominent by this time and gas exchange activity was still active. Various physiological parameters, including photosynthetic pigments, osmotic potential, membrane leakage, relative water content (RWC), photosynthesis rate, transpiration rate, stomatal conductance, intercellular CO2 concentration, and water use efficiency (WUEi), were determined following established protocols.
PLANT DEVELOPMENT
Plant architecture and development parameters, including plant height, stem diameter, inflorescence length, and the number of nodes on the main stem, were measured one week before the end of the experiment. Biomass accumulation in plant organs (leaves, stems, inflorescences, inflorescence leaves, and roots) was assessed by destructive sampling 59 days after the initiation of the NH4/NO3 treatments. Dry weights were determined after drying the samples at 64°C for 48 hours (128 hours for inflorescences).
SECONDARY METABOLITE ANALYSIS
Secondary metabolite concentrations were evaluated in primary and secondary inflorescences at the end of the experiment, 59 days after the initiation of treatments. Samples were prepared by wet-trimming, drying, and curing.
For secondary metabolites, concentrations of several compounds were below detection limits. Total weights of relevant metabolites were calculated considering differences in mass between carboxylated and decarboxylated forms. Analysis of aromatic compounds involved extracting volatiles from 100 mg of dried plant material, using MTBE and ethyl myristate as an internal standard. Samples were analyzed with a GC-MSD system, and compounds were identified by comparing retention indices and mass spectra with authentic samples, literature, and GC-MS libraries. Content was not examined in plants from the 100% NH4 treatment group due to severe NH4 toxicity and wilting.
RESULTS
VISUAL CHARACTERISTICS
Plants in the 0-30% NH4 treatments appeared visually similar, with adequate structure and color. Plants in the 50% NH4 treatment appeared normal for most of the experiment, but in the last two weeks, leaves became necrotic and wilted, leading to the death of 40% of the plants. The 100% NH4 plants experienced stunted growth, toxicity symptoms, and necrosis from early stages, ultimately resulting in plant death. The visual response of the aerial parts of the plant corresponded with root development, which showed optimal development under 0-50% NH4 and severe damage under 100% NH4.
DEVELOPMENT AND BIOMASS
Plant development was significantly influenced by the NH4/NO3 ratio. Plant height and inflorescence length decreased with increased NH4, showing optimal growth with 0-10% NH4 and substantial damage with 100% NH4. Side inflorescences exhibited similar trends but were shorter than top inflorescences. Stem diameter and node count on the main stem were smaller in 100% NH4 plants.
Biomass production decreased with increased NH4 supply. Dry biomass of all organs and whole plants were highest under complete NO3 nutrition (0% NH4) and lowest under 100% NH4. Inflorescence, stem, and whole plant biomass were highest under 0% NH4, significantly lower

LEAN MANUFACTURING IN CANNABIS CULTIVATION
Implementing these lean manufacturing principles gives cultivators the best chance of improving and adapting in an uncertain and competitive production environment.
INTRODUCTION
Lean manufacturing, a widely acclaimed management philosophy, is playing an increasingly vital role in various industries worldwide. This approach, which emphasizes waste reduction, continuous improvement, and streamlined processes, has shown to be particularly beneficial in the burgeoning agriculture and cultivation sectors.
In this blog post, we will explore the significance of lean manufacturing in cultivation and discuss how its principles can be applied to optimize production processes, ensuring both efficiency and sustainability.
The agriculture industry has undergone rapid growth and transformation in recent years, fueled by the evolution of technology, shifting consumer preferences, and increasing global demand for various products.
As the sales environment becomes more competitive, cultivators are faced with the challenge of scaling their operations while maintaining high standards of quality and consistency and lowering costs. The adoption of lean manufacturing principles offers a solution to these challenges, enabling businesses to remain competitive and environmentally conscious in an industry characterized by rigorous regulations and shifting consumer preferences.
BACKGROUND OF LEAN MANUFACTURING
ORIGIN OF LEAN MANUFACTURING
Lean manufacturing, originating in the automotive industry by Toyota Motor Corporation in the 1930s-1940s, focuses on waste elimination and process efficiency. The approach has been widely adopted by organizations across industries, leading to enhanced productivity, quality, and cost reduction.
KEY PRINCIPLES OF LEAN MANUFACTURING
Lean manufacturing is based on these core principles:
1. Value: Define value from the customer’s perspective to understand the desired outcome.
2. Value Stream: Mapping the value stream helps visualize the production process and identify waste.
3. Flow: A smooth and continuous flow of work increases efficiency and reduces delays.
4. Pull: A pull-based system, driven by customer demand, reduces inventory waste and optimizes resource allocation.
5. Perfection: Striving for continuous improvement (Kaizen) encourages ongoing waste elimination and process enhancement.
BENEFITS OF ADOPTING LEAN MANUFACTURING PRACTICES
Lean manufacturing offers significant benefits for organizations, including:
• Improved Productivity: Streamlined processes result in higher output and efficiency.
• Reduced Costs: Waste reduction and effective resource allocation lead to cost savings.
• Higher Quality: Standardized processes and continuous improvement ensure consistent, high-quality products.
• Increased Flexibility: Lean manufacturing helps organizations adapt to changes in demand and market conditions.
• Enhanced Employee Engagement: Involving employees in continuous improvement and waste reduction boosts satisfaction, motivation, and retention.
THE CULTIVATION INDUSTRY CURRENT CHALLENGES FACED BY THE INDUSTRY
The cultivation industry is confronted with multiple challenges as it strives to meet the demand for quality product in an increasingly competitive and lower margin environment.
• Resource Management: Efficiently using resources such as water, energy, fertilizer, and materials is crucial for sustainable cultivation practices.
• Environmental Impact: Reducing the environmental footprint of cultivation operations, including minimizing waste, lowering emissions, reducing net water use, and promoting
biodiversity, is increasingly important.
• Regulations and Compliance: Navigating complex and evolving regulations while maintaining high product quality and safety standards is an ongoing challenge.
• Labor and Workforce: Retaining skilled workers and optimizing labor productivity is essential for the industry’s success.
• Market Fluctuations: Managing the impact of market fluctuations, such as changing consumer preferences and economic conditions, requires adaptability and resilience.
THE NEED FOR EFFICIENCY AND SUSTAINABILITY IN CULTIVATION
To overcome these challenges, the cultivation industry must continuously innovate and optimize its practices to remain competitive and sustainable. Adopting lean manufacturing principles can help cultivators improve their operational efficiency, minimize waste, and adapt to changing market conditions. Key areas to focus on in cultivation include:
• Facility design and logistics: Using math to determine the most efficient allocation of space and room sizes for a given facility is critical. Two key factors:
• Allocation of relative flowering, veg, and support areas.
• Division of growth areas into room numbers and sizes that eliminate downtime. The veg should be at the minimum size that allows the flower rooms to be refilled continuously. The dry area should be the minimum...

UNLOCK YOUR GROW’S POTENTIAL WITH THIS UNBELIEVABLY SIMPLE EQUATION: $/FT 2 /DAY
Calculate $/ft2/day for each cycle and cultivar, associate the outcome changes with their causes, then do whatever is required to further increase $/ft2/day. If a cheaper input (e.g. fertilizer) decreases price or yield - you can easily lose much more revenue than you saved in OpEx.
TL;DR
Calculate $/ft2/day for each cycle and cultivar, associate the outcome changes with their causes, then do whatever is required to further increase $/ft2/day. If a cheaper input (e.g. fertilizer) decreases price or yield - you can easily lose much more revenue than you saved in OpEx. Want us to walk you through it? Sign up for a free financial audit.
Cultivators who have an understanding of these 2 key financial dynamics in cultivation will make far better financial decisions for their grow than those who do not.
1. Optimizing Gross Revenue per Square Foot per Day ($/ft2/day) and how to use this metric as a key decision making tool.
2. Cost of Goods (COGs) Analysis: Which expenses are worth further optimization vs expenses where optimization can cause net losses.
In this article, we will cover how to calculate and make cultivation decisions with this KPI $/ft2/day.
Optimizing Gross Revenue per Square Foot per Day
The Fundamental Metric: $/ft2/day
HOW TO CALCULATE $/FT2/DAY
Cultivators should prioritize decisions based on the metric of revenue per square foot per day. $ per area per day equation - Multiply price by yield and divide by days in your harvest cycle.
This metric is a composite of three critical elements:
• The wholesale price per pound of processed flower
• Yield in grams/ft²/harvest
• Harvest duration
EXAMPLE CALCULATION :
• Average Wholesale Price / lb: $1500
• Days / Harvest: 63 days Yield / ft²: 80 grams
3. [ ($ / lb) x ( yield in g/ft2 / 454 g/lb ) / (cycle days)) ] = $ / ft2 / day [($1500 / lb) x (80 grams/ft² / 454 grams/lb) / 63 days] = $4.20/ft²/day
This metric encapsulates the key variables of wholesale price, yield per area, and harvest duration. Overemphasis on any single factor can be counterproductive if it compromises the composite total.
BATCH TRACKING CULTIVATION VARIABLES
It’s crucial to track this metric across different cultivars and batches, correlating it with cultivation variables. We refer to this as “Batch Tracking”. This will help you investigate what works and what doesn’t. Some cultivation variables to note in each batch include:
• cultivar selection
• input adjustments
• substrate
• fertilizer and additives
• methodology variations
• technology
• lighting
• irrigation and fertigation strategies
• substrate management
• pruning, etc.
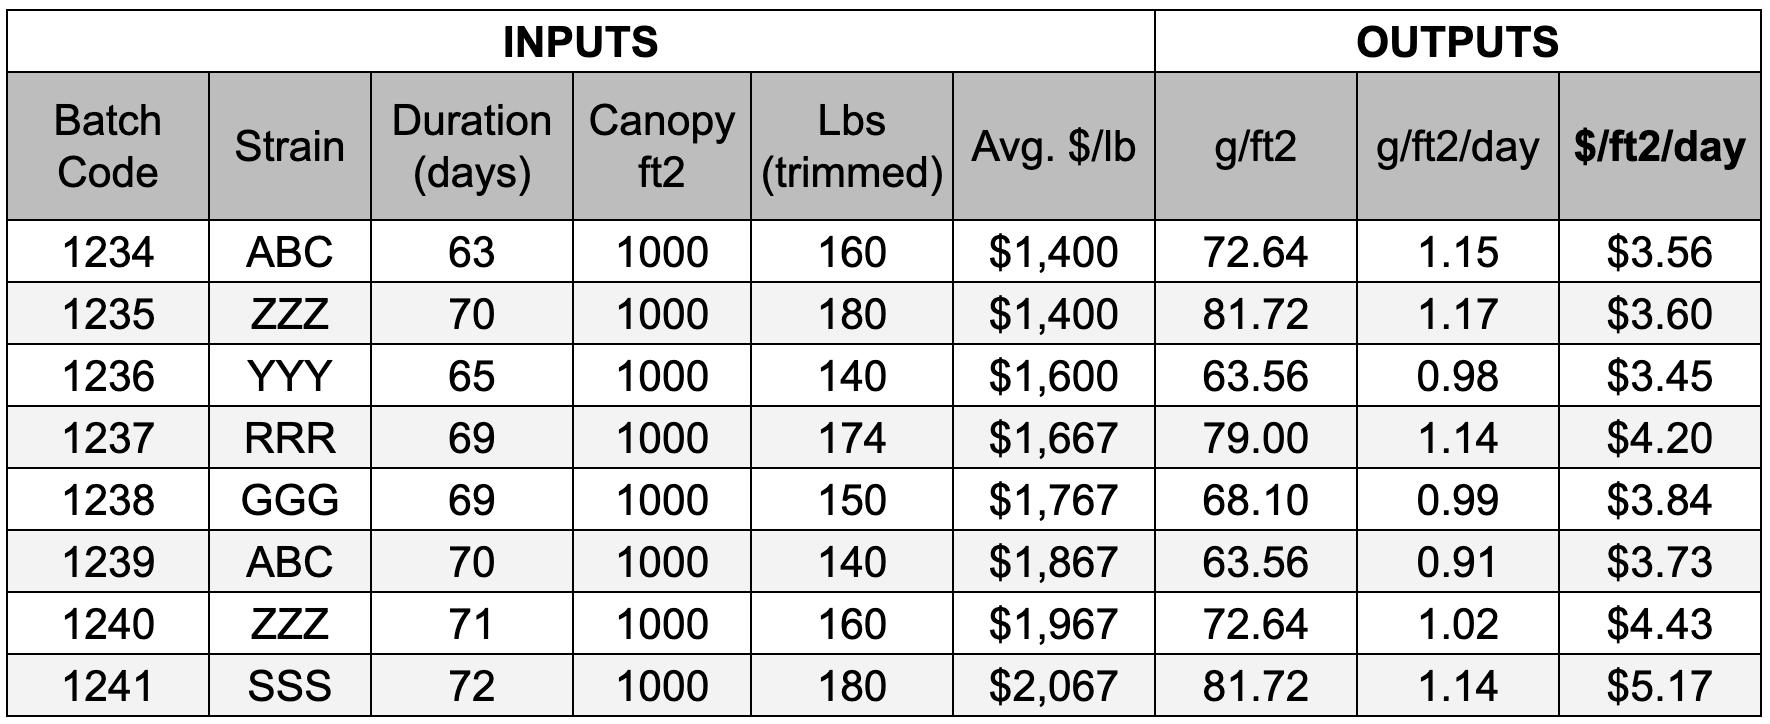
Batch Tracking in a spreadsheet would look like this. Data includes batch ID, duration of cycle, square footage of the space the batch was grown in, lbs of trimmed flower produced, average wholesale price per pound. Apply for a free financial audit if you’d like a copy of this spreadsheet template.
DYNAMICS THAT AFFECT REVENUE
If you accept that this metric is sufficient for decision making, it follows that it’s worth analyzing and forecasting how various changes will change the $/ft2/day. Here are some common dynamics and how they affect the equation:
REDUCING HARVEST DURATION:
Reducing the harvest cycle length can increase revenue efficiency.
For instance, reducing the cycle from 63 to 60 days can result in a roughly 5% increase in $/ft²/day, provided there’s no adverse effect on yield or wholesale price.
If the change that speeds up the cycle also happened to decrease yield or wholesale price by more than 5%, this would be a net loss.
For this reason, I strongly favor approaches that can speed up harvest cycles along with a neutral or positive effect on quality and yield. This is one of the main outcomes that makes Phoszyme valuable in production facilities as it has been observed to slightly accelerate harvest cycles while simultaneously enhancing yield and quality.
There are some other tricks with fertilizer and crop steering targets to slightly speed up harvest cycles, but this is the most “genetically determined” parameter
and thus has the least variability.
The real low hanging fruit is logistical constraints or mismanagement that result in delays between one harvest and flipping the next one.
INCREASING YIELD:
• Though outside the scope of this article, increases in yield linearly increase the revenue metric;
• all other things being equal, a 5% increase in yield (going from 80 to 84 g/ft2 average) will cause a 5% increase in $/ft2/day.
• The impact of cultivation processes and methodologies on yield is so large that it often “drowns out” variation from other sources;
• this should be the first place most facilities look for improvements.
• For a controlled-environment facility with 1000+ PFFD and running modern genetics, improvements here should be the absolute top priority if yields of trimmed flower are averaging below a minimum of 1 g/ft2/day (70 g/ft2 on a 70-day cultivar, for example).
RAISING WHOLESALE PRICE:
Optimizing wholesale price is mostly outside the scope of the article, but I do want to note the importance dynamic between wholesale price and yield.
To continue the above example, a 5% gain in wholesale price ($1500 to $1575) is functionally...
Scan here to read the rest of this article or apply for a free financial audit


CONTINUE YOUR EDUCATIONAL JOURNEY
CHECK OUT OUR FREE ONLINE COURSE
In March 2024, Front Row Ag opened an online school offering a free Technician certification course.
The Front Row Ag Certified Technician e-course is designed to provide comprehensive knowledge and practical skills for aspiring hydroponic fertilizer technicians. Professionals interested in learning about cutting-edge cultivation knowledge and techniques, this is for you. Scan the QR code on the next page to join today!
The Technician Course Curriculum includes:
Mixing Techniques & Equipment
• Accurate measurements & proper agitation
Stock Concentrates
• Preparing concentrated solutions & validation
Fertigation System Considerations
• Different fertigation systems, compatibility, & best practices
• Injection order & specific needs for systems
Runoff Collection & Analysis
Cleaning & Maintenance
• Procedures for regular & deep cleaning of Irrigation Systems
Sensors
• Troubleshooting common issues in fertigation systems
• Calibration & maintenance of pH and EC sensors to ensure accurate readings
