North Sea wrecks: Toxic legacies of war


Hydrography’s key role in a sustainable world


search for the Montevideo Maru Mapping northern Greenland waters A blank spot on nautical charts in ice-infested waters Empowering the subsea survey industry www.hydro-international.com Issue 3 2023 Volume 27 Special edition: PRESTIGIOUS PROJECTS
The


Director Strategy & Business Development: Durk Haarsma
Financial Director: Meine van der Bijl

Editorial Board: Huibert-Jan Lekkerkerk, Mark Pronk, BSc, Marck Smit, Auke van der Werf
Head of Content: Wim van Wegen
Copy Editors: Serena Lyon
Marketing Advisor: Myrthe van der Schuit
Circulation Manager: Adrian Holland
Design: ZeeDesign, Witmarsum, www.zeedesign.nl

Hydro International is an independent international magazine published six times a year by Geomares. The magazine and related e-newsletter inform worldwide professional, industrial and governmental readers of the latest news and developments in the hydrographic, surveying, marine cartographic and geomatics world. Hydro International encompasses all aspects, activities and equipment related to the acquisition, processing, presentation, control and management of hydrographic and surveyingrelated activities.
Subscription
Hydro International is available on a subscription basis. You can subscribe at any time via https://www.hydro-international.com/ subscribe. Subscriptions will be automatically renewed upon expiry, unless Geomares receives written notification of cancellation at least 60 days before the expiry date.
Advertisements
Information about advertising and deadlines are available in the Media Planner. For more information please contact our marketing advisor (myrthe.van.der.schuit@geomares.nl) or go to www.geomares-marketing.com.
Editorial Contributions

All material submitted to the publisher (Geomares) and relating to Hydro International will be treated as unconditionally assigned for publication under copyright subject to the Editor’s unrestricted right to edit and offer editorial comment. Geomares assumes no responsibility for unsolicited material or for the accuracy of information thus received. In addition, Geomares assumes no obligation for return postage of material if not explicitly requested. Contributions must be sent to the head of content wim.van.wegen@geomares.nl.
Renewable energy and the pivotal role of hydrography in offshore development take centre stage in a captivating interview with Professor Ed Hill, chief executive of the National Oceanography Centre (NOC). Illuminating the immense opportunities in renewables, he discusses the role of hydrography in seafloor mapping, turbine siting and offshore infrastructure monitoring.
HafenCity University Hamburg (HCU) focuses on advancing hydrographic research and education to prepare students for future challenges in the hydrography and the maritime sectors. With over 35 years of experience, HCU offers a two-year Master’s in Geodesy and Geoinformatics, featuring a CAT A certified specialization in Hydrography.
Understanding how glaciers interact with the ocean is crucial for better sea-level rise predictions. Seafloor mapping is especially vital where Greenland and Antarctica’s ice sheets meet the ocean.
Northern Greenland’s marine realm remains one of Earth’s least explored areas. In 2019, the Sherard Osborn Fjord was mapped by the Swedish icebreaker Oden, with the next unmapped fjord to the east the target for 2024.
Distinguished projects stand the test of time. Throughout the years, Hydro International has shared numerous captivating tales of endeavours in our field that spark the imagination. While some articles may have needed a little dusting off, a curated selection in our archives has given rise to an engaging series of tales. In this edition of our magazine, we offer a brief introduction to these stories.
Geomares
P.O. Box 112, 8530 AC Lemmer, The Netherlands

T: +31 (0) 514-56 18 54
F: +31 (0) 514-56 38 98 hydro-international@geomares.nl hydro-international.com
No material may be reproduced in whole or in part without written permission of Geomares.


Copyright © 2023, Geomares, The Netherlands


The ocean plays a crucial role in mitigating climate change, yet we lack detailed information on over 95% of the seafloor. This article explores planblue’s solution to accelerate time-to-data and the accuracy of seabed mapping. Overcoming challenges relating to geolocation, water column distortion and motion distortion, planblue’s data products add credibility to the blue carbon market.
The sinking of the Montevideo Maru in 1942 is the worst maritime disaster in Australia’s history. The vessel was carrying nearly 1,060 prisoners from 16 countries, when it was sunk off the Philippines by the USS Sturgeon. Fugro and the Silentworld Foundation took on a humanitarian expedition to find the Montevideo Maru’s final resting place and its passengers, to help bring closure to those affected by the tragedy.
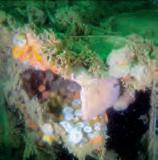
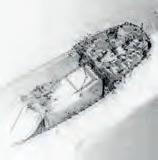
Some 290 shipwrecks lie in the Belgian part of the North Sea alone, with probably more than 1,000 in the entire North Sea, many of them silent witnesses to the two world wars. Until recently, the environmental impact of these wrecks was largely unknown and, as far as the presence of munitions is concerned, they represented a true Pandora’s box. The North Sea Wrecks project has changed this.
Swift AI, machine learning, and automation progress prompt the offshore industry to adopt innovations for efficient data acquisition and processing. Increasing datasets and tight deadlines make every time-saving solution invaluable. This article presents an effort to join the quest for data processing acceleration, with a solution for automated boulder detection on multibeam echosounder and side-scan sonar data.
Cover Story
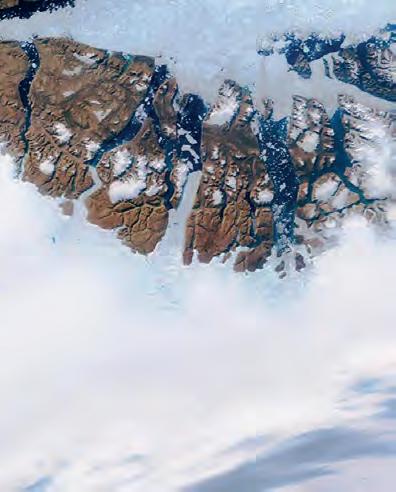
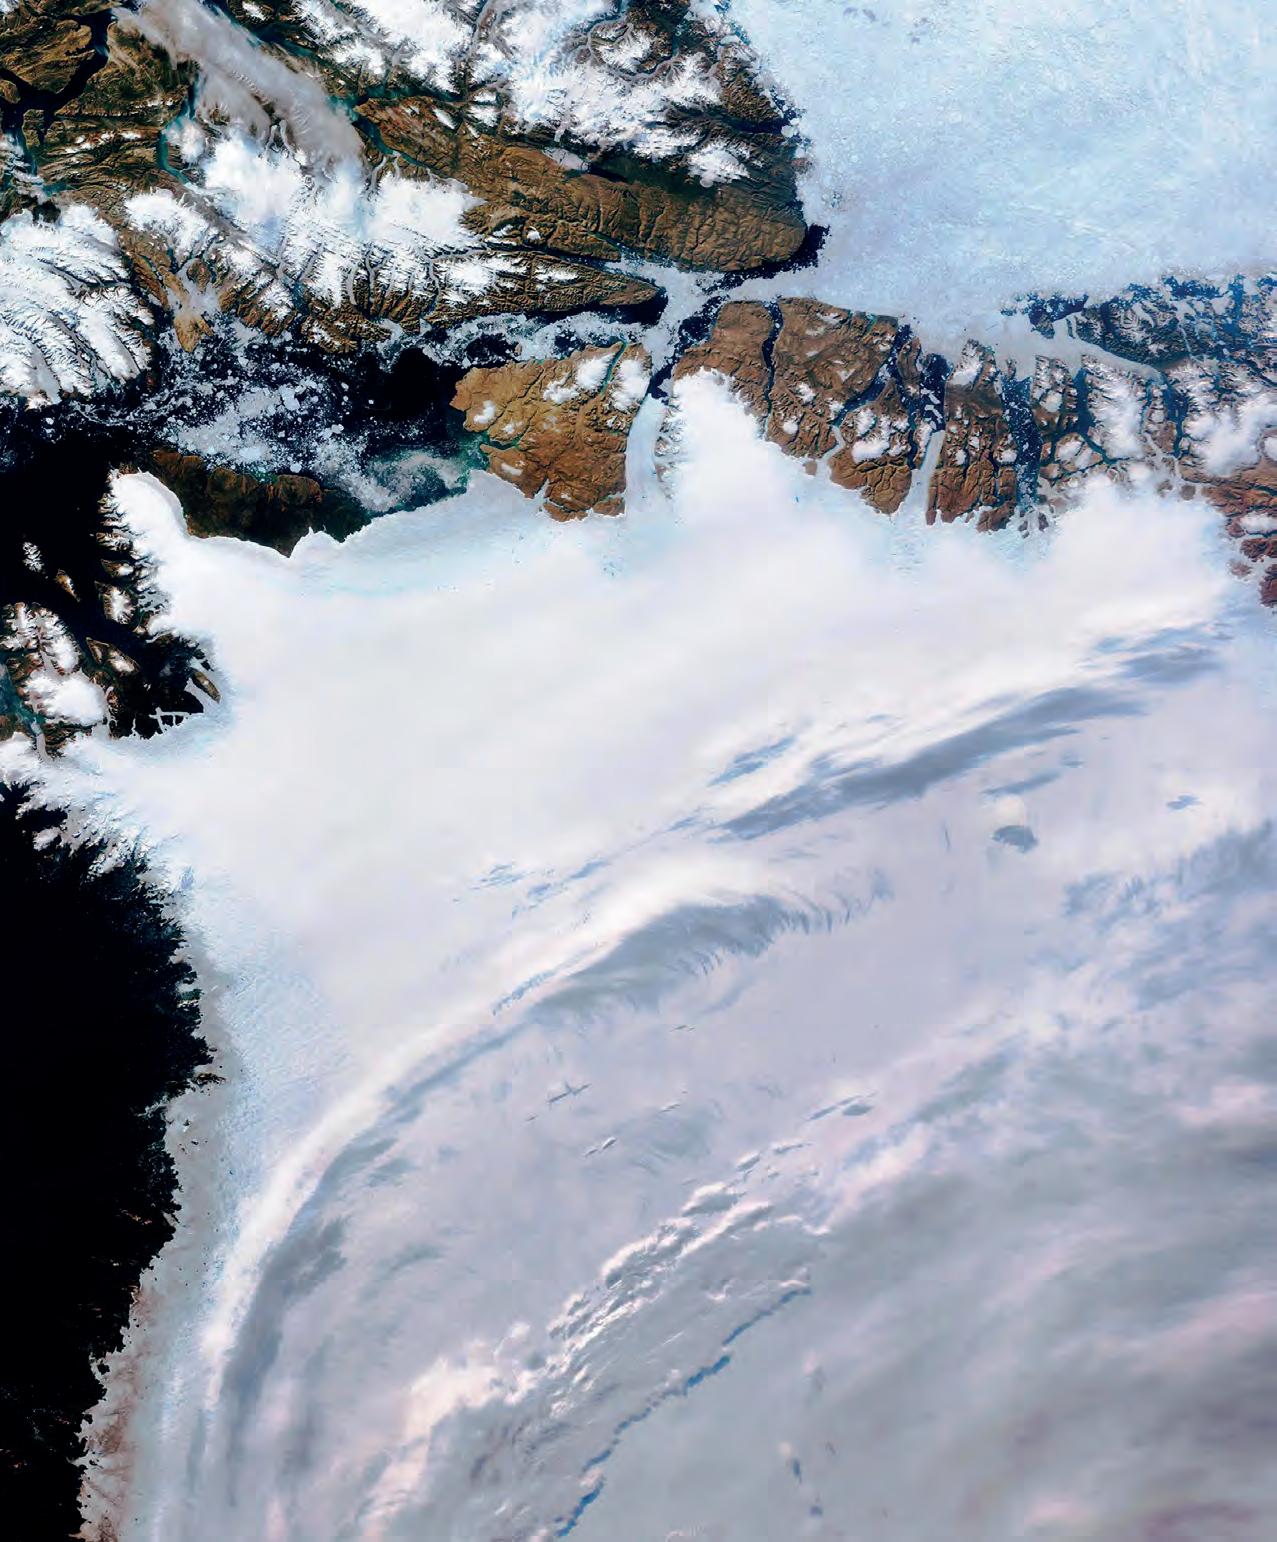
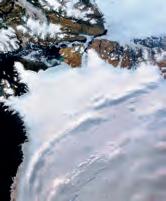
Taken by the Copernicus Sentinel-3 mission, this image beautifully presents the untouched vastness of north-west Greenland. Amid the icy panorama, Nares Strait comes into view in the upper left corner, unveiling a captivating scene of sea ice and icebergs. In this edition of Hydro International, you’ll discover a fascinating article about mapping the ice-laden waters of northern Greenland – still an uncharted area on nautical maps. (Image courtesy: Processed by ESA, using modified Copernicus Sentinel data (2019), licensed under CC BY-SA 3.0 IGO)
Issue 3 2023 3 Contents North Sea wrecks: Toxic legacies of war Hydrography’s key role The search for the Mapping northern Greenland waters A blank spot on nautical charts in ice-infested waters Empowering the subsea survey industry Special edition: PRESTIGIOUS PROJECTS
Editorial 6 Headlines 24 Sponsored article NORBIT 30 Sponsored article EXAIL 36 Sponsored article KUM Offshore
All rights reserved. ISSN 1566-9076 4
8 26 12 17 22
33 19 22
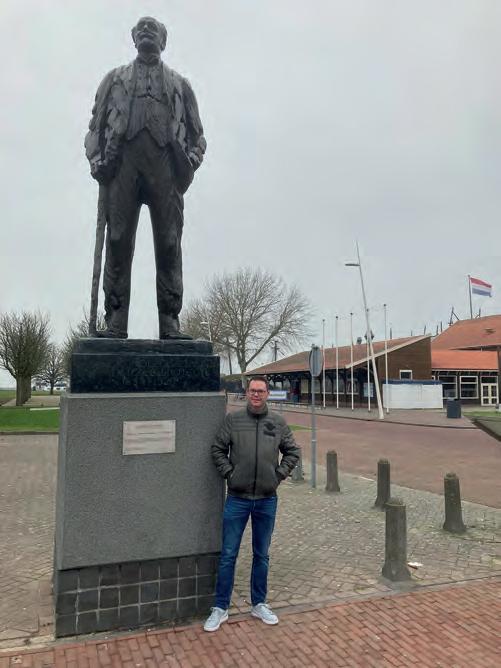
The prestigious heritage of Cornelis Lely
Hydro International
Prestigious Projects.
prestigious project can be debated, let us sidestep semantic
However, as the impacts of the challenges posed by climate change become increasingly apparent, a major upgrade for the Afsluitdijk has become imperative. Given the changing climate patterns, the heightened extremities in weather and the substantial portion of the Netherlands situated below sea level, vulnerability to flooding looms large. The initial motivation behind the Afsluitdijk’s construction a century ago was its ability to counter flooding threats; however, with projected sea-level rises, more substantial measures are now needed.
editorial, allow me
update on a colossal project whose prestigious status, in my view, is beyond contention: the Zuiderzee Works.
The Zuiderzee Works in the Netherlands effectively tamed the treacherous Zuiderzee, an inlet of the North Sea, by transforming it into the more manageable IJsselmeer and Markermeer lakes, while creating 1,650km2 of new land. The transformation was achieved with the construction of the Afsluitdijk dam, which effectively sealed off the Zuiderzee and turned it into a freshwater body. This visionary plan was engineered by Cornelis Lely, whose endeavours represent some of the most ambitious hydraulic engineering feats in history. The plan also involved the creation of polders, further exemplifying its prestige and earning widespread admiration, in the Netherlands and beyond.
The timeline for these accomplishments spans over three-quarters of a century, commencing with the publication of Cornelis Lely’s plan in 1891 and culminating in 1975 in the completion of the dam that connects the towns of Enkhuizen and Lelystad.
These measures include elevating and reinforcing the dam, ensuring its capacity to withstand water forces until at least 2050. The dam’s crest has been raised by two metres, and innovative concrete elements have been employed to shield its Wadden Sea side (the Wadden Sea is an intertidal zone located in the south-eastern expanse of the North Sea). These specialized components are both robust and adept at mitigating wave impact. The Afsluitdijk remains as a benchmark for contemporary Dutch hydraulic engineering – a status it has enjoyed from its inception.
Naturally, the disciplines of hydrography and geomatics played a pivotal role in the transition from a marine to freshwater lake environment, as well as the creation of the polders – including the monumental Flevoland land reclamation project. The contribution of hydrographers and surveyors to this truly prestigious project merits more than just a passing mention; it calls for a comprehensive article, if not a series of articles. Omitting these pioneers from our historical account would leave a significant gap. So, this is to be continued!
Wim van Wegen Head of content
Issue 3 2023 4
wim.van.wegen@geomares.nl
Wim van Wegen stands beside the statue of engineer Cornelis Lely, in the city that was named after this visionary: Lelystad.
Enhanced North Sea management through updated seabed sediment mapping


Activities such as sand extraction, cable trenching and pipelin e construction regularly churn up the top layer of the North Sea seabed. However, this top half metre is an important habitat for all kinds of animals and plants. The Geological Survey of the Netherlands, part of TNO, has used advanced technology to create an accurate digital map of the seabed. This map will enable public authorities and companies to make better decisions about
RIEGL and Schiebel cooperate to enhance UAV-Lidar bathymetric mapping
RIEGL Laser Measurement Systems and Schiebel have successfully completed the integration of a high-end laser scanning system, the RIEGL VQ-840-G topobathymetric Lidar sensor, on the Schiebel Camcopter S-100 uncrewed aerial system (UAS).
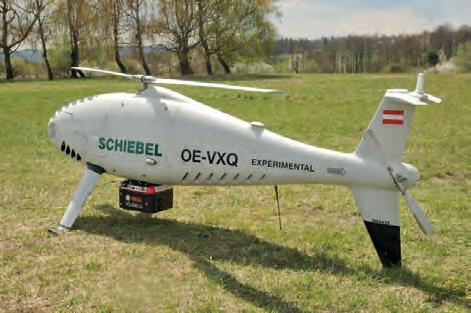
Operating a high-end laser scanning system remotely on an uncrewed aerial vehicle (UAV or ‘drone’) requires a tailored solution that goes beyond what is currently available off-the-shelf. To maintain the broad operating range of the UAS, it is imperative to keep the weight of the sensor payload low. Additionally, the effective execution of the survey mission requires full remote control of the payload instruments and real-time feedback to the operator via a data link.
The compact topobathymetric laser scanner was designed for use in a variety of maritime and hydrographic environments. The Lidar sensor payload system is controlled remotely via a data link, which is crucial for integration into the S-100 system. The scanner is controlled using the onboard software RiACQUIRE-Embedded via the available data link, while data acquisition and laser safety are also monitored. Once the survey is completed, the raw data seamlessly integrates into the RIEGL data processing workflow.
activities in the North Sea.
The North Sea is an extraordinarily busy area, full of all kinds of activities. Shipping, fishing, wind farm construction and operation, cable trenching and pipeline construction from wind farms and platforms to the coast, sand extraction, nature conservation and military exercises compete with each other in most cases. Knowledge-based seabed management is essential if we want to facilitate all of these uses in the same space or alongside each other.
By avoiding muddy or gravelly seabed sediments, damage to the natural environment can be minimized. Churned-up mud smothers nearby benthic life, and ecologically valuable gravel plains recover poorly from damage.
NOAA awards Woolpert US$7 million contract for hydrographic surveying in Alaska’s Nome region
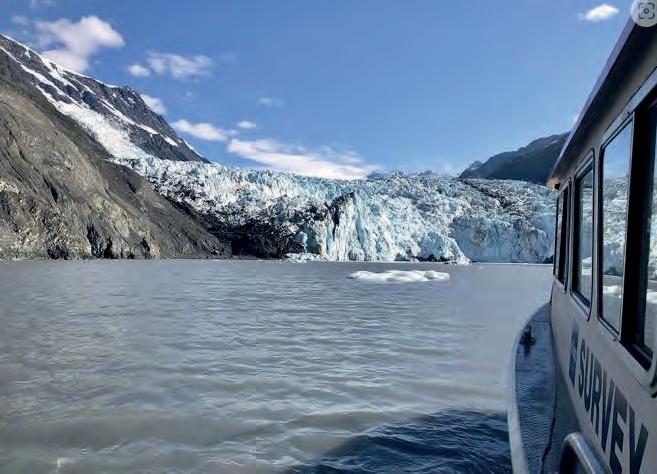
The National Oceanic and Atmospheric Administration (NOAA) has signed Woolpert to a US$7 million contract to perform hydrographic surveying and collect bathymetric data in and around Nome, Alaska. This data will support commercial fishing, shipping channels, coastal resilience, scientific research and Seabed 2030, a collaborative project that aims to map the world’s ocean floor by 2030.
Woolpert will collect data over 1,874 square nautical miles in Northern Norton Sound, which stretches from Golovin Bay through Nome to Cape Woolley on the eastern edge of Alaska. Nome is adjacent to the Bering Strait and central to America’s marine presence in the Arctic. The region serves as a major transit route for shipping traffic to the Port of Nome, which has supplied food, construction materials, equipment and other goods to over 60 Alaskan communities for more than a century.
Regional hydrographic data was most recently collected in the 1930s. This project will update National Ocean Service nautical charting products and services and will support the Seabed 2030 Project. This collaborative effort between the Nippon Foundation and the General Bathymetric Chart of the Oceans (GEBCO) aims to integrate and share all available bathymetric data to produce a definitive map of the world’s ocean floor by 2030.
5 Headlines Issue 3 2023
Norton Sound.
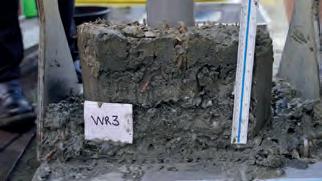
Side view of a box core showing the top few decimetres of seabed sediment. (Image courtesy: TNO)
The RIEGL VQ-840-G topobathymetric Lidar sensor mounted on the Schiebel Camcopter S-100 UAS. (Image courtesy: RIEGL)
Advanced Navigation’s new subsea centre boosts underwater technology production
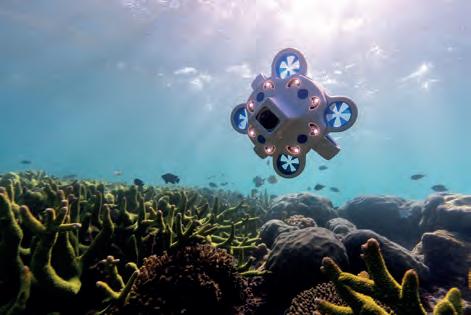
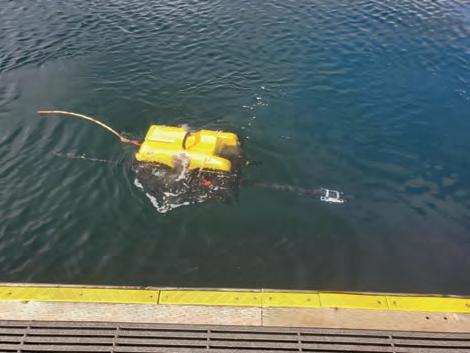
Advanced Navigation recently announced the opening of the largest subsea robotics facility in Australia, located in Balca tta, Western Australia. This modern manufacturing and R&D facility aims to accelerate the production of the company’s revolutionary underwater technologies, such as its autonomous underwater robot, Hydrus.
Spanning a massive 2.2-hectare site, the subsea centre is divided into development and manufacturing sections for high-volume production and ongoing research and expansion of subsea navigation and robotics technologies. This expansion also encompasses the growth of the company’s underwater artificial intelligence division.
Advanced Navigation’s independent, in-house design and vertical integration have led to numerous innovations, including the miniaturization of pressure-tolerant electronics, advanced sonar technologies and AI-based autonomous systems. The new facility also features comprehensive testing facilities with multiple marine simulation environments, ensuring reliable performance and high-quality production.

Uncharted Roman shipwrecks discovered off Tunisian coast
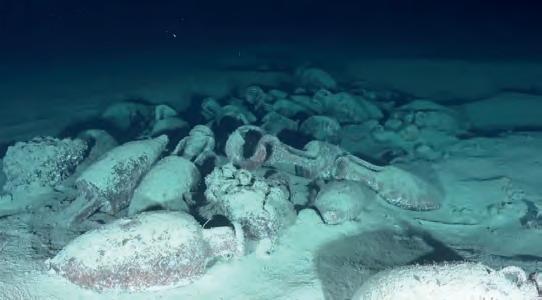
Using a robot and multibeam sonar, underwater archaeologists have discovered three previously unknown Roman shipwrecks off the Tunisian coast. The researchers hail from Algeria, Croatia, Egypt, France, Italy, Morocco, Spain and Tunisia. In their recent mission, coordinated by UNESCO, they found three new shipwrecks. One wreck dates back to between 100 BCE and 200 CE, while the other two date from around the turn of the 20th century. The researchers presented their findings at a press conference held at UNESCO headquarters in Paris, where they had gathered to examine the shipwrecks resting at the bottom of the water body that separated them.


Using multibeam sonar and remotely operated underwater vehicles (ROVs), the archaeologists mapped the seafloor and the unfortunate vessels sitting on it. They specifically investigated the continental shelves off Tunisia and Sicily as part of distinct projects led by Tunisia and Italy, respectively. The newly discovered shipwrecks are located near Keith Reef, a particularly treacherous region of the Skerki Bank. Multibeam sonar was used to create a photogrammetric map of the Skerki Bank, which revealed several anomalies on the seafloor that turned out to be archaeological remains.
UKHO establishes MoUs with Port of London Authority and Peel Ports Group
The UK Hydrographic Office (UKHO) has signed new Memorandums of Understanding (MoUs) with the Port of London Authority (PLA) and Peel Ports Group to enable greater collaboration in the port sector. The new strategic partnerships will help to improve the supply, management and sharing of hydrographic and marine data and support the UKHO’s ambitions to work more closely with the UK ports and harbours community.
The agreements will help to foster improved data exchange between the ports and the UKHO. Taken together, PLA and Peel Ports Group are responsible for handling more than 120 million tons of cargo every year. Data from the port groups’ operations will be securely shared with the UKHO for the purposes of improving safety and efficiency at these critical hubs of domestic trade.
The MoUs will also enable closer collaboration on the development and implementation of next-generation navigational services. This will include the testing of new solutions based on the International Hydrographic Organization’s new S-100 data standards and joint efforts to find more opportunities to digitalize the port environment.
6 Issue 3 2023
One of the recently discovered shipwrecks on the Skerki Bank. (Image courtesy: UNESCO)
production of underwater technologies, such as the autonomous underwater robot, Hydrus. (Image courtesy: Advanced Navigation)
MBARI and 3D at Depth collaborate to advance seafloor mapping technology
In a bid to uncover the secrets of the deep seafloor, the Monterey Bay Aquarium Research Institute (MBARI) has joined forces with 3D at Depth, a leading expert in commercial subsea Lidar technology. This dynamic partnership aims to revolutioniz e seafloor mapping by developing an advanced subsea Lidar system.
Imaging the structure of the deep seafloor is crucial for comprehending the biology and ecology of the largest living space on our planet. However, only approximately 20% of the ocean floor has been mapped at a resolution suitable for scientific study. Over the past decade, MBARI has collaborated with 3D at Depth to develop innovative tools utilizing Lidar technology for seafloor mapping. This partnership aims to create the next generation of
Seamor Marine’s Chinook ROV enhances UXO detection with magnetometer integration
Seamor Marine’s Chinook ROV is making waves in the field of undetonated explosive ordnance (UXO) detection after successfully integrating a compact magnetometer together with subsea engineers at Ocean Floor Geophysics. Magnetometers detect disturbances in the Earth’s magnetic field and are critical instruments for locating undetonated explosives along the ocean floor, referred to as UXOs by the military. Typically, magnetometers are bulky and towed by manned marine vessels or pickup truck-sized autonomous underwater vehicles (AUVs). They scan the seafloor through an arduous, time-consuming and expensive process.
The compact manoeuvrability offered by ROVs such as Seamor Marine’s Chinook ROV has always held great promise for subsea engineers designing magnetometer scanning systems. However, technicians have been challenged by the electromagnetic interference created by the electrical systems of these smaller units, until recently.
subsea Lidar technology capable of generating highly detailed and high-resolution maps of underwater features.


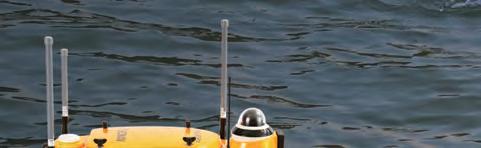
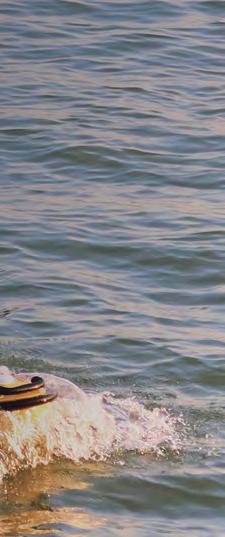
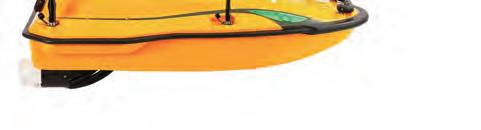
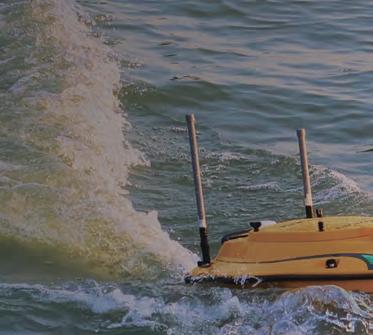
Ørsted unveils patented uncrewed surface measuring vessel
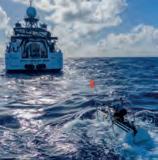
Ørsted, one of the world’s foremost offshore wind farm developers, has designed and developed an uncrewed surface vessel (USV) specifically for offshore metocean measurement campaigns. The collected measurement data plays a crucial role in reducing uncertainties in the projected annual energy production of new offshore wind farms. Having patented the USV concept, Ørsted recognizes the immense potential of this technology and has initiated serial production based on the success of its prototype USV.
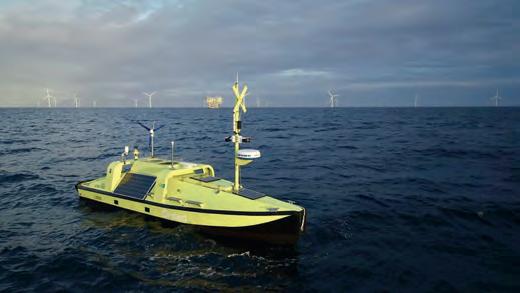
The prototype USV is named Hugin USV. It is designed for continuous operation in the harshest offshore conditions for a year at a time. The USV has a built-in navigation system, which enables it to transit from shore at various degrees of autonomy, and it can be controlled both in line-of-sight or from a beyond-line-of-sight remote control centre.
The USV is a versatile sensor platform that gathers a wealth of data on wind conditions, seabed status and ecology. These measurements are crucial for Ørsted’s early-phase development activities before constructing new wind farms. The USV concept was created by employees and is patented. The company collaborated with industry partners to design, develop, construct and test the prototype USV as part of its innovation programme. The Danish shipbuilder Tuco Marine Group constructed the prototype, while the USV control system was provided by
7 Headlines Issue 3 2023
has been operational during hurricane conditions.
With its compact profile, the Chinook can operate in tight spaces and is easily stowed when not in use.
Hydro International speaks to Prof Ed Hill, National Oceanography Centre
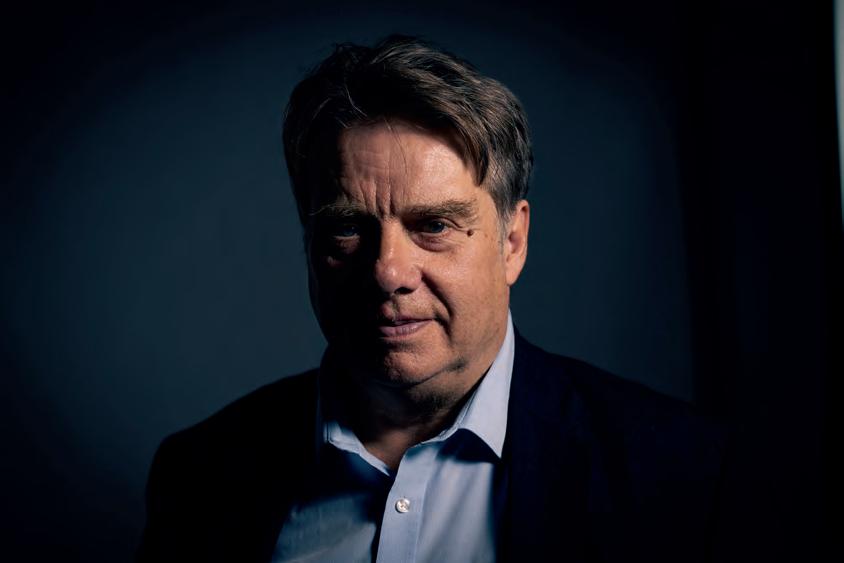
From seafloor mapping to clean energy: hydrography’s key role in a sustainable world
Renewable energy and the pivotal role of hydrography in offshore development take centre stage in a captivating interview with Professor Ed Hill, chief executive of the National Oceanography Centre (NOC). Illuminating the immense opportunities in renewables, he discusses the role of hydrography in seafloor mapping, turbine siting and offshore infrastructure monitoring. Additionally, the interview addresses the contributions of hydrographers and ocean technologists in advancing sustainability and harnessing the potential of renewables and big data. Emphasizing the importance of public-private partnerships and the ocean’s potential to provide climate change solutions, Professor Hill presents a compelling vision for a sustainable ocean economy.
Renewable energy is a trending topic in today’s hydrography and oceanology industry. What do you regard as the key opportunities associated with it? Renewable energy is an essential element of the clean energy transition – both onshore and offshore. Hydrography information is crucial to understanding the development of offshore forms of renewables, such as offshore wind, tidal power and, in due course, offshore waves. Key opportunities are related to the more effective mapping of the seafloor, for example to identify where the tidal stream energy might be concentrated. The power generated by offshore tidal turbines can be very sensitive to the location, and moving the turbines just a few hundred metres can lead to considerable differences in energy output, due to the way in which tidal streams can be focused, particularly by bathymetric conditions. Understanding this is crucial for siting turbines.
Issue 3 2023 8
Also, as we build very large wind farm arrays, issues such as scouring and evolution of the seafloor and coastal morphology will need to be monitored. There is clearly a role for hydrography in both the siting and monitoring of these arrays and, eventually, the decommissioning of offshore infrastructures. This also applies to the cabled power infrastructure from offshore installations, whether tidal wave or wind, to shore-side locations.
Sustainability should be a crucial consideration for all industries, including hydrographic surveying. How do you think the industry can continue to improve in this area in the coming years?
To date, hydrographic surveying has been very dependent on offshore survey vessels and, as we know, shipping is a particularly hard sector to decarbonize. The carbon footprints of survey vessels can be significant, both individually and collectively, and are one of the major drivers of cost in offshore surveys. Consequently, opportunities exist in exploring suitable alternatives to the use of survey vessels. Some of those options may reduce the carbon footprint while also having cost benefits. These options include satellite measurements of seafloor bathymetry and the use of Lidar techniques in shallow waters, uncrewed surface vehicles with swath bathymetry suites installed and underwater autonomous vehicles.
Uncrewed surface vehicles are particularly promising, as they can have a considerable range and endurance, which not only reduces the carbon footprint but also removes some of the other costs associated with hydrographic surveying, including the number of people at sea.
There will always be a role for hydrographic survey vessels, at least for the foreseeable future. The question is how to optimize and use them in appropriate circumstances, to minimize the carbon footprint and obtain the most efficient data return for the emissions incurred.
At this year’s Ocean Business, you gave an opening keynote in which you stated that the ocean is not just a victim of climate change, but also a solution. Could you elaborate on this? There are many ways in which the ocean offers solutions to a number of climate-related issues. The installation of offshore renewable energy systems is a clear example, and the UK is a leader in the installation of offshore wind, while it is growing in other regions too. Tidal power is less developed, but will come on stream and clearly has the ability to offset some of the known disadvantages of offshore wind.
Beyond renewable energy, there are a number of other areas where the ocean offers a solution. For example, trajectories to net zero emissions and moving to reduce future atmospheric CO2 levels need mechanisms that can capture and sequester CO2 in natural or artificial carbon sinks. Subsea carbon capture and storage is an area that is important to develop. Combined with biofuel reduction, this can lead to negative carbon emissions. Carbon capture and storage is certainly very high on the agenda and some of the first sites are being developed now.
Another area that is attracting considerable attention is marine nature-based solutions. The idea is that there are areas where
Professor Ed Hill CBE
Professor Ed Hill CBE is chief executive of the National Oceanography Centre (NOC), one of the world’s most innovative oceanographic institutions. He has a research background in physical oceanography, specializing in the circulation of continental shelf seas, and has participated in over 20 research expeditions. Professor Hill received his MSc and PhD degrees in oceanography from Bangor University and his BSc in Applied Mathematics from the University of Sheffield. He was appointed Commander of the Most Excellent Order of the British Empire (CBE) in 2020 for services to environmental sciences. Professor Hill has served, and continues to serve, on numerous national and international advisory bodies.
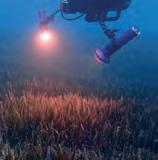
protecting biodiversity, particularly in coastal habitats such as seagrass meadows, mangroves and salt marshes, not only benefits biodiversity (which is a major concern), but also improves the habitat’s ability to act as a natural carbon sink. This is potentially a win-win situation: protecting biodiversity, protecting and even enhancing carbon sinks, thereby removing carbon from the atmosphere, and economic benefits ranging from tourism, to benefits to local communities to providing natural flood protection.
There is also the question of the relative benefits of taking food from the sea (whether through wild fisheries or aquaculture) or producing food on agricultural land, and there are differences in the carbon trade-offs in doing this. Land-based agriculture is very energy- and water-intensive, whereas the water supply is clearly not an issue for marine food, which is potentially less energy-intensive too. There are however other concerns about the sustainability of aquaculture and wild fisheries. But, provided that sustainable approaches are developed, the use of marine food to supplement and complement energy- and water-intensive agriculture can provide important carbon and health benefits.
The High Level Panel for the Sustainable Ocean Economy produced a report looking specifically at the ocean as a source of climate solutions. Their estimate was that about 20% of the gap between current emissions and the CO2 reductions needed to be on track for the Paris targets could be achieved by a mix of ocean-based solutions of the kinds I’ve just described.
What should be done to harness the enormous potential of renewables and the role of hydrographers and ocean technology professionals in it?
There is enormous potential for offshore renewables. There is a continuous need to upscale the use of renewable energy, including for offshore wind moving into deeper waters, because the further offshore one goes, the greater the available energy resource. Moving into deeper waters is therefore one area, but also expanding into other regions of the world with high levels of wind energy that is not yet being exploited at scale.
Another opportunity is to combine offshore renewables, including wind, with other activities to produce mutual synergies. For example,
Issue 3 2023 9 Interview
offshore wind arrays provide natural marine protected areas, given that it is not possible to fish intensively in these areas. More research is needed, but it is also important to monitor these areas to see if those co-benefits are being realized. These kinds of opportunities therefore combine an element of habitat and biodiversity surveying and traditional hydrographic surveying.
Big data is seen as a technology that can help solve the climate change challenge. What is your vision on this?
Traditionally, in terms of ocean observation, our problem has been gross undersampling in space and time, so that sparsity of data has been the challenge in interpreting change and variability. This is very much changing with the advent of new technologies that are capable of more continuous observation, both of the seafloor and of an increasing number of ecological and chemical variables.
Consequently, the big data revolution is hitting ocean science and hydrography, to the extent that vast datasets can now be generated. As a result of this technology innovation, it will be possible to obtain information about habitats and ecological systems on the seafloor as routinely as it has been for the more traditional variables. This opens up really important opportunities for forecasting how ecosystems will change in response to human activities.
Some of the artificial intelligence techniques that are now being developed will help to identify species and, in due course, to understand changes and which ecosystems are associated with which types of seabed morphology, as well as to potentially predict the physical and ecological impacts of offshore development. Even if it had been technologically possible to make these observations before AI, it would have been impossible to interpret them using human analysis alone. AI is therefore essential for handling vast quantities of data generated in this way, and is a huge opportunity. It means that our offshore surveys can now take these ecological and habitat dimensions into account, which will become integral to offshore surveying in many future applications.
How do you envision the collaboration between public and private sector organizations in hydrographic surveying, in the light of climate change and the
Hydrographic surveying has long involved public and private partnerships. Public bodies often set the requirements for data gathering, through hydrographic surveying programmes for civil
or military use, and public bodies/regulators increasingly set the regulatory environments or conditions offshore, including for environmental impact assessments and the setting out and development of marine spatial plans and protected areas. The private sector’s strength is being able to undertake the necessary surveys to inform these public requirements and to enable other private sector actors to operate in compliance with them.
The private sector also plays a key role in innovating the application of new technology in hydrographic surveying. Research institutions such as my own have been important in pioneering the use of autonomous underwater and surface vehicles for scientific applications, very often in extreme and deepwater environments.
The commercialization of these technologies and their widespread upscaling and application is really the key role for the private sector. The scaling up is completely reliant on private sector investment and being able to respond to the demands set by public body regulators.
The transition towards renewable energy is fuelled by the desire to combat climate change. Are you optimistic about the path we are taking?
Fundamentally, yes, I am. I think there is little alternative but to be optimistic. The path to stabilizing CO2 emissions and therefore levels in the atmosphere and indeed reducing them is an important one. All scientific evidence points to increasingly severe adverse impacts on human society and the ecology of the planet if the global temperature rise is allowed to exceed 2°C. We are seeking to minimize the impacts of this. It is a very significant challenge that involves a whole range of issues, which makes it highly complex.
Although it is technically feasible, it also involves significant economic impacts in the short term as part of the transition. It will also necessitate behavioural changes in society and imaginative policy options. It is important that the transition is a ‘just’ transition – in other words, we already know that those likely to be most adversely affected by climate change are some of the poorest in the world, but the costs of the transition to cleaner energy may also fall on the most disadvantaged and least able to
Issue 3 2023 10
afford it. If this transition is not managed in such a way as to continue to secure public and political consent, we risk making progress in achieving what is technically possible.
We therefore need a concrete set of plans for how to achieve these transitions, which will be different in different circumstances, but which have clear steps and timelines set out for how to achieve them and what the best options are. There is currently a high level of ambition, at the global, national and even regional and corporate levels, to set targets for these reductions, but these will run into trouble unless followed by clear, concrete and realistic plans. Of course, some sectors are more difficult to decarbonize than others, which is why, in the first instance, we are talking about achieving net zero emissions – where those sectors that are hard to decarbonize are compensated in other ways by reducing emissions elsewhere. However, these are by no means a substitute and can never get close to reducing emissions to the level that is actually needed and which demands the transition of fossil fuel energy sources.
I am therefore optimistic but realistic concerning the complexity and difficulty of the change, and aware that we need to move fast to a phase beyond aspirational to realizable and verifiable plans.
Are there any specific climate change measures in which the hydrography and oceanography profession can play a pivotal role, based on your knowledge as a scientist?
The quick answer is that the main thrust is in developing the offshore renewable sector and subsea carbon capture and storage options. There are also clear opportunities in the generation of hydrogen offshore as an energy store but also as a fuel. Although hydrogen is not the answer alone and comes with a number of challenges, these are the main areas to focus on in the short term.
Some scientists are pursuing research relating to the removal of CO2 from the atmosphere through manipulation of the ocean chemical and biological carbon uptake processes using artificial means. While this is important to undertake, it is a hugely contentious area. The main risk is completely unintended consequences of large-scale manipulation of ocean systems’ natural processes. It is therefore important to research, if only to identify the full scope of risks involved.
Is there anything else you want to share with the hydrographic community?
The role of the ocean in providing solutions to climate change, but also opportunities to develop a sustainable ocean economy, is considerable. It is an exciting time to be a hydrographer and oceanographer, as for a very long time we have operated behind the scenes without the recognition that we thought our work merited. The work of marine is moving centre stage and is pivotal in addressing the world’s greatest challenges of today.
Designed for seamless workflow
Issue 3 2023 11 Interview
Discover the SWiFT range
Nurturing knowledge and innovation for the maritime sector
Going deep: hydrography at HafenCity University Hamburg

 By Ellen Werner, Dilip Adhikari, Lukas Klatt and Harald Sternberg
The HafenCity University Hamburg (HCU) is committed to advancing hydrographic research and education to equip students with the necessary knowledge and skills to address the challenges of future demands in hydrography and the maritime sector. With more than 35 years of experience in hydrographic education, the HCU offers a two-year Master’s programme in Geodesy and Geoinformatics with a CAT A certified specialization in Hydrography. The university-owned survey vessel DVocean is equipped with newly purchased state-of-the-art instrumentation, showcasing the institution’s commitment to practical learning. The employed team is growing, with currently ten scientific researchers in the field of hydrography working in various research and dissertation projects.
Located in Hamburg, Germany, near the river Elbe and the port of Hamburg, the HCU is the University of the Built Environment and Metropolitan Development (Figure 1). It brings together a comprehensive range of disciplines, including building and design, engineering and natural sciences. With a strong focus on climate, sustainability and digitization, the HCU prioritizes these key topics in its overall research agenda. These
principles are effectively integrated into the university’s various degree programmes, catering to diverse areas of study.
One of the notable fields offered at the HCU is hydrography, which is taught as a specialization within the Geodesy and Geoinformatics MSc programme. This specialized programme spans four semesters. To ensure the high quality and international recognition of the English-taught specialization, it has earned accreditation as a Category A programme – the highest level – by the FIG-IHO-ICA International Board on Standards of Competence for Hydrographic Surveyors and Nautical Cartographers (IBSC) (Sternberg & Dufek, 2018). In May 2023, the hydrography specialization at the HCU received recertification as a Category
Issue 3 2023 12
Figure 1: Location of the HCU next to the river Elbe (left) and its interior (right). (Image courtesy: David Altrath)
A programme for another six years. This unique certification places the HCU among a select group of only 19 internationally recognized training programmes, with just 11 of them accessible to the public.
The Master’s specialization in Hydrography at the HCU follows a progressive approach, introducing students to complex problems and equipping them with scientific methodologies to tackle these effectively. The curriculum places particular emphasis on developing the methodological and analytical skills necessary for independently integrating scientific techniques. Complementing the theoretical aspects, the hydrography lectures are accompanied by a variety of exercises and tutorials, providing students with crucial practical experiences in the field (Lütjens & Sternberg, 2022). As part of their education, students undertake a final project that enables them to plan, conduct and evaluate a comprehensive hydrographic scenario individually. This supplementary field training includes the formulation of research questions and encourages individual elaborations, allowing students to apply their knowledge and skills gained throughout the programme.
The HCU places great value on providing students with insights into the professional world. To achieve this, the university maintains close cooperation with numerous institutes and authorities, such as the Hydrographic Agency of Germany (BSH) and the Hamburg Port Authority (HPA), as well as companies in the offshore industry and bathymetric field. As a result, students can apply for internships or collaborate with these partners in writing their final theses, enabling them to gain practical experience and connect with industry professionals.
Students may also participate in the university’s research as working students along with their studies, giving them an insight into the ongoing research projects at the HCU and qualifying them as future scientists. In addition to the hydrographic education, hydrographic knowledge is expanded in national research projects at the HCU. In comprehensive consortia projects, knowledge is developed and published for science and industry.
The CIAM research project
The CIAM (Comprehensive Integrated and Fully Autonomous Subsea Monitoring) research project is a joint project of nine project partners from science and industry. It is funded by the German Federal Ministry of Economic Affairs and Climate Action.
About the authors
Ellen Werner completed her Master’s in Geodesy and Geoinformatics at the HCU as a hydrographic surveyor (CAT A). She currently works as a research assistant at the HCU and teaches classes and practical exercises in the hydrographic programme at the Bachelor’s and Master’s levels.
Dilip Adhikari is a hydrographic surveyor (CAT A) working as a research assistant at the HCU. He is involved in the hydrographic part of the Indian Ocean Exploration (INDEX) project and teaches basic and advanced hydrography subjects in the HCU Master’s programme.
Lukas Klatt has several years of professional experience in the development of autonomous and unmanned hydrographic survey systems. He is currently working in the HCU CIAM project on enhancing the navigation of AUVs.
Harald Sternberg has a PhD in surveying and has been working with kinematic measurement systems and multi-sensor systems for decades. He has been a professor of hydrography and geodesy at the HCU since 2017.

A worldwide network of underwater pipelines continuously transports various energy sources such as oil, gas and renewable energies over great distances. It connects numerous countries and continents, representing a critical infrastructure for today’s society. Possible damage or accidents would generate serious ecological and economic damage due to the leakage of the transported medium. As a result, regular monitoring and maintenance of the pipelines is necessary for early damage detection and hazard protection to minimize this risk.
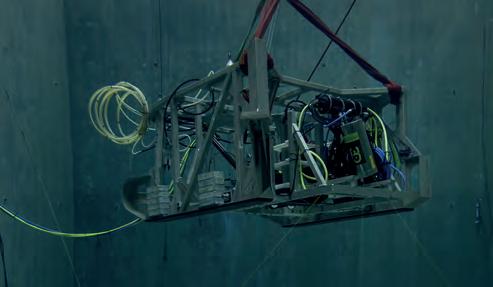
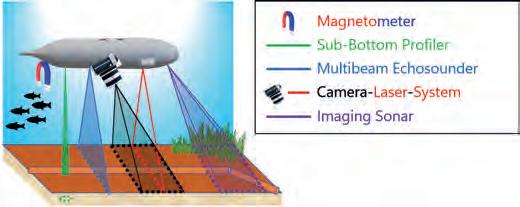
The main objective of the CIAM project is the development and construction of autonomous underwater vehicles (AUVs) equipped with various sensors (Figure 2). This will enable continuous monitoring of underwater assets and infrastructure such as oil and gas pipelines, hydrogen pipelines, power cables and telecommunication cables, thus preventing damage. The project focuses on researching the autonomous execution of missions, which will be conducted port-to-port without the need for expensive escort vessels. One component is the automated recognition of objects based on optical and acoustic sensors.
Issue 3 2023 13 Feature
Figure 2: Schematic representation of the various sensor options that can be installed on an autonomous underwater vehicle designed to automatically survey a pipeline (Schild et al., 2023).
The resulting semantic environment representation will be developed for navigation as well as the detection of possible damage. The project also aims to extend mission duration using fuel cells, and new types of sensors based on electromagnetic probes will be tested and developed.
The HCU staff usefully contribute their hydrographic experience and provide specific expertise in cooperation with engineers from the other disciplines of the project partners.
The Indian Ocean Exploration (INDEX) project
The exploration of polymetallic sulphides in the German Exploration Licence Area in the Indian Ocean aims to identify and investigate sulphide deposits, which form at active hydrothermal sites. These ‘black smokers’ discharge plumes of hot hydrothermal fluid and the sulphide deposits develop through precipitation.
On contract with the Federal Institute for Geosciences and Natural Resources (BGR), the HCU is involved in the hydrographic part of the project, which includes multibeam echosounder (MBES) data acquisition, post-processing and analysis of the MBES backscatter properties of the seafloor and water column.
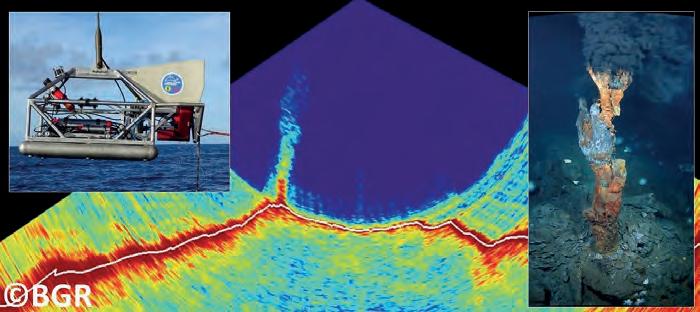
The HOMESIDE sled (BGR-owned deeptowed system) is used to collect high-
resolution MBES data (<3m resolution) containing detailed seafloor morphology. An inertial navigation system (INS) aided by USBL, DVL and CTD is used for underwater positioning of HOMESIDE and, due to the challenging data acquisition conditions (e.g. deepwater settings, properties of the water column), navigational errors may occur which need to be corrected.
Besides collecting high-resolution MBES data for terrain models, HOMESIDE is used to identify the locations of hydrothermal venting sites, as their plumes are visible in the water column data during deployment (Figure 3). Once their location is known, ROVs and/or video sleds installed with high-resolution cameras are deployed to examine the extent of hydrothermal fields and their surroundings.
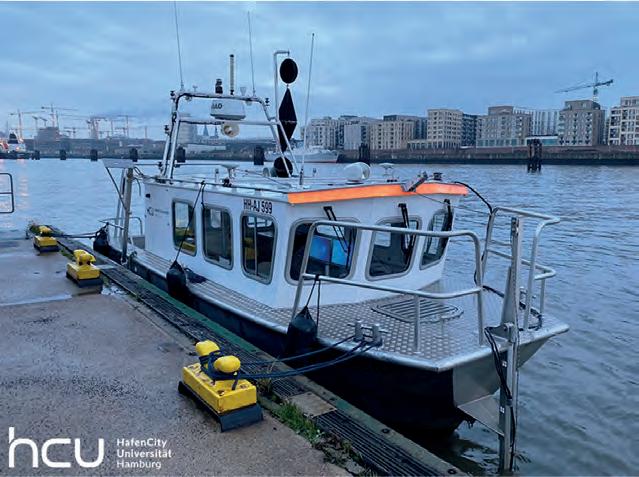
The survey vessel DVocean
The HCU obtained a newly built inshore survey vessel named DVocean in 2019, which can be used for both teaching and research projects (Figure 4). It was designed for operation in shallow waters and, with a length of about 8m and a width of 2.5m, it can be trailered to the research area. DVocean is equipped with state-of-the-art instrumentation: a newly purchased multibeam echosounder (Kongsberg EM2040P MKII), a sub-bottom profiler (Innomar compact system), a magnetometer (Marine Magnetics Explorer), a sound velocity profiler (AML-3 LGR), an inertial navigation system (iXblue Hydrins) and a GNSS positioning system (Septentrio AsteRx-U3) with two antennas.
Issue 3 2023 14
Figure 3: Hydrothermal venting site visible in the water column data with the HOMESIDE sled on the top left and black smoker on the right.
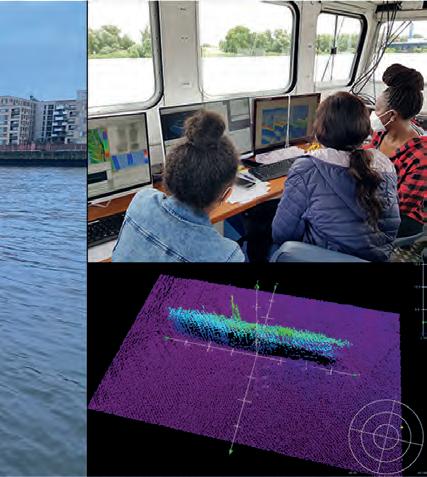
Figure 4: HCU-owned survey vessel DVocean in the port of Hamburg and students during a wreck search as part of their practical courses.
The mounting of these systems is modular so that they can be installed and exchanged depending on the application. Borrowed or additional equipment can also easily be integrated into the vessel system. The hydrographic systems can be mounted on the bow, on both sides of the vessel and on the stern to record data simultaneously. It is additionally possible to mount a laser scanner on the roof to record the surroundings above the waterline. Future investigations will also include testing of an underwater Lidar system.
In addition to this high-end hydrographic equipment, students and researchers can assess different low-cost systems on board. The HCU owns for example various single-beam echosounders, a fish finder and a small PowerRay ROV for visual inspections. Students can also build and test their own open-source sensors; for example, there have been projects building an OpenROV and an OpenCTD.
Conclusion
Through its specialized programmes, practical training, diverse research projects and collaborative partnerships, the HCU offers a comprehensive and enriching hydrography course that prepares students for successful careers in the maritime and surveying industries. The hydrographic team at the HCU works in notable research projects such as the CIAM project and the INDEX project. Hydrography education at the HCU focuses on theoretical and practical learning, and the university-owned survey vessel DVocean is equipped with state-of-the-art instrumentation to support education
References
BGR (2022): Marine polymetallic sulphides (INDEX) –Germany’s exploration license in the Indian Ocean. Retrieved July 05, 2023, from https://www.bgr.bund.de/EN/Themen/ Min_rohstoffe/Projekte/Meeresforschung-Projekte-laufend_ en/Index2011-2013_en.html?nn=1548238

Lütjens, Mona; Sternberg, Harald (2022): Hydrographic education and research at the HafenCity University

Hamburg. Hydrographische Nachrichten, 123. doi: 10.23784/ HN123-02
Schild, Niklas-Maximilian; Lukas Klatt; Markus Kraft (2023): Subsea Pipeline Tracking Using a Forward-Looking Imaging Sonar for Autonomous Underwater Vehicle, FIG Working Week 2023, Orlando, USA
Sternberg, Harald; Dufek, Tanja (2018): Hydrographieausbildung an der HafenCity Universität
Hamburg. Hydrographische Nachrichten, 109. doi: 10.23784/ HN109-04
and research. Around 30 students every year decide to undertake the CAT A certified hydrography programme, coming from all over the world to study in Hamburg. This demonstrates how the HCU is eager to continue to contribute to the advancement of hydrography.
Issue 3 2023 15 Feature
EMPOWERING UNDERWATER INSPECTION


R7 COMPACT OBSERVATION CLASS ROV
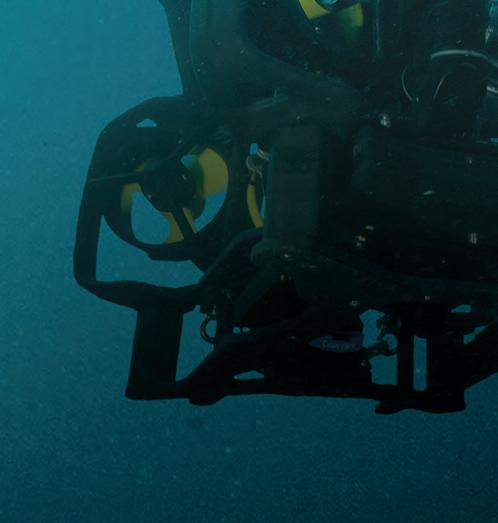
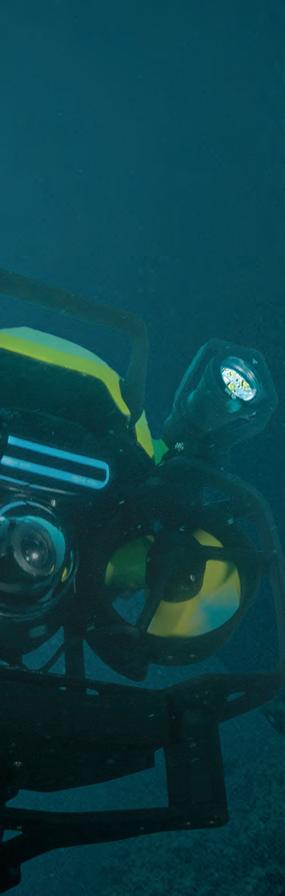
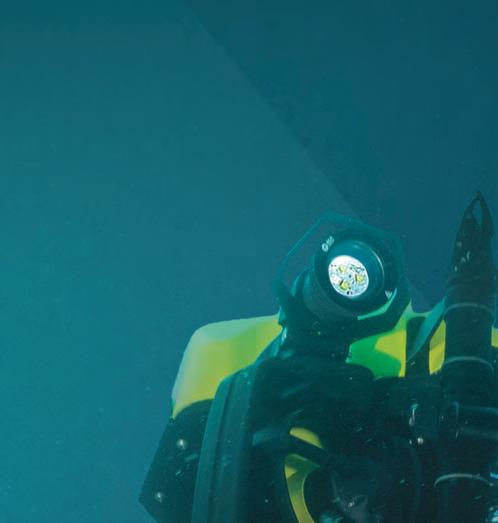
A perfect balance of power and portability
Enhanced navigability and stability due to high-performance embedded sensors

Open frame design for easy payload integration
Powerful, robust & easy to deploy
formerly ECA Group & iXblue

A blank spot on nautical charts in ice-infested waters
Mapping northern Greenland waters
By Martin Jakobsson, Stockholm University, Sweden, and Larry Mayer, Center for Coastal and Ocean Mapping, USA
An understanding of the interplay between glaciers and the ocean is needed to improve sea-level rise projections. Seafloor mapping is critical in this pursuit, particularly where the ice sheets of Greenland and Antarctica meet the ocean. Northern Greenland’s marine realm remains one of Earth’s least explored areas, with completely uncharted fjords. In 2019, one of these fjords was mapped by the Swedish icebreaker Oden, with the next unmapped fjord to the east the target for 2024.
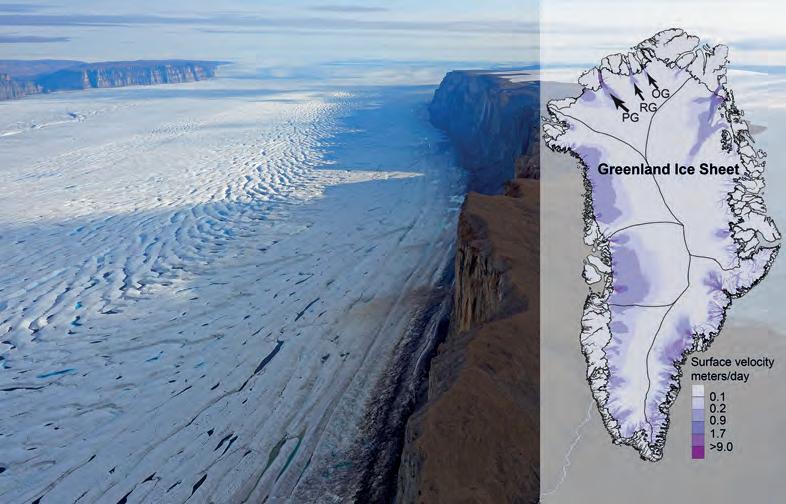
The large ice sheets on Greenland and Antarctica consist of merged glaciers that drain areas of the ice sheets into the ocean through ice streams, similar to how rivers drain confined regions on land (Figure 1). These glaciers play a crucial role in maintaining the ice sheets’ mass balance over time. The annual ice accumulation primarily occurs through precipitation within the ice sheets’ interiors, while mass loss results from melting and calving. Calving is the process whereby ice chunks break off from the glaciers’ fronts, forming icebergs that eventually melt and mix with the ocean, causing sea-level rise. In recent decades, the stability of glaciers that drain into the ocean, known as ‘marine outlet glaciers’, has become a concern due to their alarming acceleration in mass loss. These marine outlet glaciers are highly dynamic and can respond rapidly to environmental changes such as warming oceans, which can cause submarine ice-melting. Their dynamics are also heavily influenced by the characteristics of the substrate they rest on and the shape and depth of the seafloor at their grounded margins or nearby.
The observed average global mean sea-level rise was about 1.6mm/year between 1900 and 2018, but accelerated in the 1990s to about 3.4mm/year between 1993 and 20181. The single largest contributor to this rise in recent decades has been the melting of the Greenland Ice Sheet, accounting for nearly 0.5mm/year2. The Greenland Ice
Sheet has a total volume equivalent to about 7.4 metres of global mean sea level, but few if any scientists believe that this immense ice mass will completely disappear over hundreds of years, even under the worst global warming scenarios. However, there are concerns that this could happen within the next 1,000 years3. Nevertheless, a sea-level rise of just one metre, which some projections approach by the end of this century4, would impact millions of people globally. It is therefore crucial that we understand the rate at which the Greenland and Antarctic Ice Sheets can lose mass and contribute to global mean sea-level rise. This challenging task was emphasized in the IPCC’s special report on the ocean, cryosphere and
Issue 3 2023 17 Feature
Figure 1: Photo showing the ice tongue of Ryder Glacier in northern Greenland. The ice tongue comprises a floating extension of Ryder Glacier, one of the marine outlet glaciers that drain the Greenland Ice Sheet into the ocean. The accompanying map illustrates the major drainage sectors within the Greenland Ice Sheet and displays the ice-flow surface velocity in metres per day. The locations of the glaciers discussed in this article are shown by arrows aligned with their flow paths: OG = C.H. Ostenfeld Glacier; PG = Petermann Glacier; RG = Ryder Glacier.
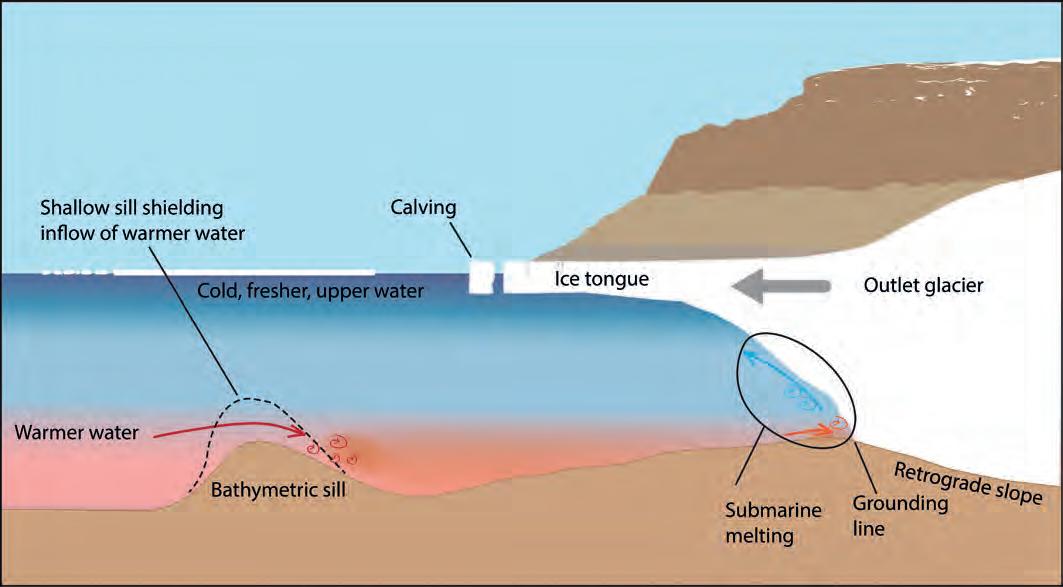
warmer water. Some fjords have bathymetric sills that are shallow enough to prevent warmer deeper water entering the fjord, as illustrated by the stippled line. The blue arrow shows how meltwater rises along the underside of the glacier and interacts with the ocean water. If the bed below the glacier slopes towards land as illustrated (retrograde slope), the warmer water will follow the glacier as it retreats and continue to cause melting. This may lead to a process called ‘marine ice-sheet instability’, where the glacier becomes progressively thicker as it retreats at the grounding line into deeper water implying flotation, instability and increased calving. A positive feedback loop is initiated. Floating ice tongues have buttressing effects, and when they are removed the glacier flow may accelerate in response.
sea-level change, which highlighted the urgent need to understand these processes and find viable solutions.
The importance of seafloor mapping
To improve future global mean sea-level rise projections, the complex ice-ocean interactions must be understood and their geographical locations identified. This requires both seafloor mapping and the collection of oceanographic measurements in some of the world’s most remote areas: the polar regions. Seafloor mapping is essential as it helps determine the bathymetry, which plays a crucial role in identifying areas where warmer ocean water can reach marine outlet glaciers or flow beneath their floating extensions, known as ice shelves or ice tongues when confined within fjords, and contribute to melting.
Fjords are commonly overdeepened after having served as pathways for outlet glaciers during several glaciations. The seafloors of these fjords are filled with traces from the
past glaciers in the form of submarine glacial landforms. Some of the fjords have prominent shallow sills that can act as thresholds at their entrances. These sills are often comprised of glacially eroded material covering a resistant rock formation. They may be shallow enough to prevent inflow of warmer subsurface waters reaching the outlet glaciers’ margins (which promotes melting), while other sills are small or contain deeper channels that let the warmer water pass (Figure 2). In northern Greenland, warmer subsurface water of Atlantic origin has been observed in several fjords. This water has, after entering Fram Strait between Svalbard and Greenland or across the Barents Sea, circulated all the way around the Arctic Ocean before reaching the northern Greenland glaciers. The water is only slightly warmer than 0°C when reaching the glaciers, but this is enough to cause substantial melting. It flows below fresher and very cold water (less than -1°C), typically representing meltwater. The warmer saltier water is heavier and therefore flows at depths where the seafloor morphology will greatly influence its path.
Mapping Petermann Fjord in northern Greenland
The Petermann 2015 expedition with the Swedish icebreaker Oden mapped the entire Petermann Fjord, into which Petermann Glacier drains, and the adjacent section of Nares Strait in northern Greenland (Figure 3). This glacier received a lot of international attention when it lost approximately 40% of its floating ice tongue during two major calving events in 2010 and 2012. The largest event occurred in 2010 when the calved tabular iceberg was about 251km2 in size, which is slightly larger than the area of Amsterdam. Oceanographers subsequently discovered that warmer water of Atlantic origin enters the fjord5
Multibeam mapping in 2015 revealed the presence of a well-developed sill at the fjord entrance, although of insufficient size to prevent the warmer water from reaching the glacier
Issue 3 2023 18
Figure 2: Schematic illustration of a marine outlet glacier with a floating ice tongue being subjected to submarine melting from inflow of subsurface
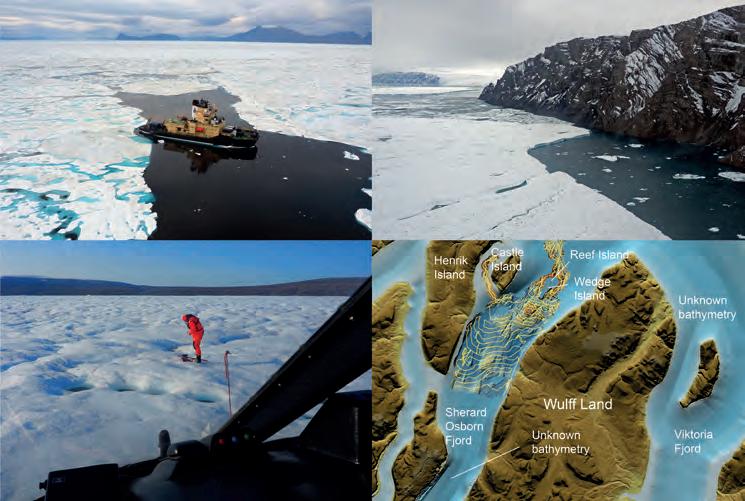
(Figure 4)6. In contrast to Petermann Glacier, Ryder Glacier, which drains into Sherard Osborn Fjord further to the north-east, had been stable for decades. Sherard Osborn Fjord had never been explored by a surface vessel and there were no soundings available to suggest what the seafloor might look like. The reason for this is the seaice conditions in the Lincoln Sea, which are the most severe in the Arctic Ocean. The bathymetry in the southern Lincoln Sea is based on a very sparse grid of spot soundings acquired by the Canadian Hydrographic Service. Consequently, it was decided to prioritize the mapping and investigation of Sherard Osborn Fjord for the next expedition with icebreaker Oden: the Ryder 2019 expedition.
The uncharted Sherard Osborn Fjord
The northern end of Nares Strait was reached without too many difficulties in 2019, thanks to the strong icebreaker Oden and the relatively light sea ice in the strait that year. However, Oden hit a wall of hard multiyear sea ice more than four metres thick as it entered the Lincoln Sea. The transit of approximately 46 nautical miles diagonally across the southern Lincoln Sea to Sherard Osborn Fjord therefore had to be planned using numerous ice-reconnaissance flights with the helicopters carried onboard. The purpose was to locate fracture systems in the sea ice that facilitated icebreaking.
About the authors
Martin Jakobsson is professor of Marine Geology and Geophysics at Stockholm University. His research interests include the marine cryosphere, with a current focus on northern Greenland, glacial landforms and seafloor mapping. He has served as co-chief scientist on nine polar expeditions and led several sea-going mapping missions.
Larry Mayer is a professor and director of the Center for Coastal and Ocean Mapping at the University of New Hampshire. His research deals with sonar imaging and remote characterization of the seafloor, advanced applications of 3D visualization to ocean mapping and mapping in support of Law of the Sea and paleoceanography, particularly in the Arctic.
After completing this crossing in approximately 1.5 days, the next challenge awaited – huge tabular icebergs in Sherard Osborn Fjord (Figure 5). These icebergs had remained trapped in the fjord since previous calving events because the sea ice in the Lincoln Sea prevents them from escaping, in contrast to Petermann Fjord where the icebergs are expelled into Nares Strait, where they begin their journey southward and eventually disintegrate and melt. During the initial helicopter reconnaissance of Sherard Osborn Fjord, the entire entrance was blocked by tabular icebergs, except for a narrow passage along the shore of Castle Island (Figure 5). However, entering the fjord through such a small passage into uncharted waters was deemed unsafe. Understanding the movement of the icebergs within the fjord was essential – was there a risk of becoming trapped inside? In addition to analyses of satellite imagery, GPS transponders were placed on a couple of selected icebergs to track them in real time (Figure 5).
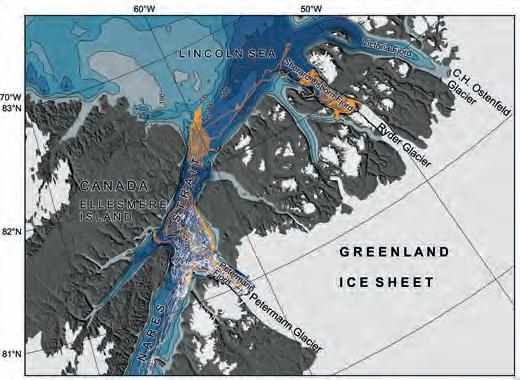
Figure 3: Northern Greenland featuring its three largest fjords, each hosting a marine outlet glacier that drains the northern sector of the Greenland Ice Sheet. The overview bathymetry is based on the International Bathymetric Chart of the Arctic Ocean (IBCAO)7, which has been merged with the BedMachine compilation of under-ice topography8. The BedMachine compilation employs a kriging algorithm to interpolate the bathymetry in fjords with limited data, utilizing the under-ice topography. This implies, for example, that the depth of an outlet glacier’s grounding line will be used. In the case of Victoria Fjord, where sounding data is unavailable, the bathymetry represents an interpolated extension between the depth of C.H. Ostenfeld’s grounding line and the few spot soundings available outside of the fjord in the Lincoln Sea. From a mariner’s perspective, this is practically the same as a blank chart. The track of the Petermann 2015 expedition with Swedish icebreaker Oden is shown with a white line, and that of the Ryder 2019 expedition with an orange line.
It was discovered that the icebergs circulated more or less regularly in an anticlockwise direction within the fjord, indicating that, with careful monitoring, there would always be a navigable path through them to exit the fjord. Another major challenge was the fact that the fjord was completely uncharted. Two small islands, Reef and Wedge islands, indicated that it was not possible to just steam into the fjord and expect it to be deep everywhere. Instead, the installed Kongsberg EM122 (1°×1°, 12kHz) multibeam had to be used to its full extent. Systematically mapping back and forth across the fjord, with the beams extending into the uncharted fjord during each pass, enabled safe navigation. While this mode of operation was time consuming, it had the advantage of providing high-quality bathymetry. Mapping was done in this way during the nights, while sediment coring and other sampling operations filled the days. Two weeks were spent mapping and sampling in Sherard Osborn Fjord and the entire fjord was covered, apart from some small holes where icebergs were constantly in the way.
The bathymetry of Sherard Osborn Fjord is notably complex with two major sills: one at the fjord entrance and another just in front of the
Issue 3 2023 19 Feature
current position of the ice-tongue margin (Figure 6). Oceanographic measurements revealed that while the outer sill would allow the passage of warmer water into the fjord, the inner sill is shallow enough to shield Ryder Glacier from most of the inflowing warmer water. The inner sill in Sherard Osborn Fjord is believed to be a crucial factor in explaining the contrasting behaviour of Ryder and Petermann glaciers over the past few decades9. It underscores the importance of incorporating seafloor bathymetry into numerical models used to accurately project the contribution of glaciers to future sealevel rise.
The North of Greenland 2024 expedition
C.H. Ostenfeld Glacier, which drains into Victoria Fjord, lies to the east of Ryder Glacier. Currently, Victoria Fjord remains completely unmapped, with no ship having entered it (Figure 3). C.H. Ostenfeld Glacier recently lost nearly all its floating ice tongue
and will be the primary focus of the North of Greenland 2024 expedition, which is part of the North Greenland Earth-Ocean-Ecosystem Observatory (GEOEO) research theme. The Swedish Polar Research Secretariat adopted this theme following a proposal submitted to its Polar Research Process. The expedition builds on the achievements of the Petermann 2015 and Ryder 2019 expeditions and will again utilize the Swedish icebreaker Oden
The overarching goal of GEOEO is to improve our understanding of North Greenland’s marine cryosphere’s dynamic history and response to climate change. This includes investigating the implications for marine and terrestrial ecosystems in North Greenland, the adjacent Arctic Ocean, and the contribution of the North Greenland Ice Sheet to future sea-level rise. If the expedition successfully maps Victoria Fjord, it will complete the mapping of all three major outlet glaciers north of 80° that drain the northern sector of the Greenland Ice Sheet.
The bathymetric data collected will be contributed to both IBCAO and BedMachine through the Nippon Foundation - GEBCO Seabed 2030 project. This global initiative, launched in 2017, aims to comprehensively map the world’s entire ocean floor by 2030. While the southern Fram Strait is one of the better-mapped regions in the world’s oceans, the Lincoln Sea and areas in the central Arctic Ocean, north of Greenland and north of the eastern part of the Canadian Arctic Archipelago, remain among the least mapped regions. Looking at the entire world’s oceans, the Nippon Foundation-GEBCO Seabed 2030 project reported a mapping coverage of 24.9% when the latest GEBCO grid was released in spring 2023 (https:// seabed2030.org/; https://www.gebco.net/).
122, 1°x1°, 12kHz). There is a pronounced bathymetric sill at the fjord entrance; however, warmer water of Atlantic origin (red line) makes it past this sill and below the floating ice tongue of Petermann Glacier where it causes melting. The seafloor bathymetry is dominated by glacial landforms produced by past glacier activities. Crag and tails are classical glacial landforms, formed when a glacier passes over a hill of resistant bedrock in the seafloor and ‘smears out’ eroded material in the wake of the resistant crag. These are good indicators of past ice-flow directions, here shown by brown arrows.
(Multibeam:
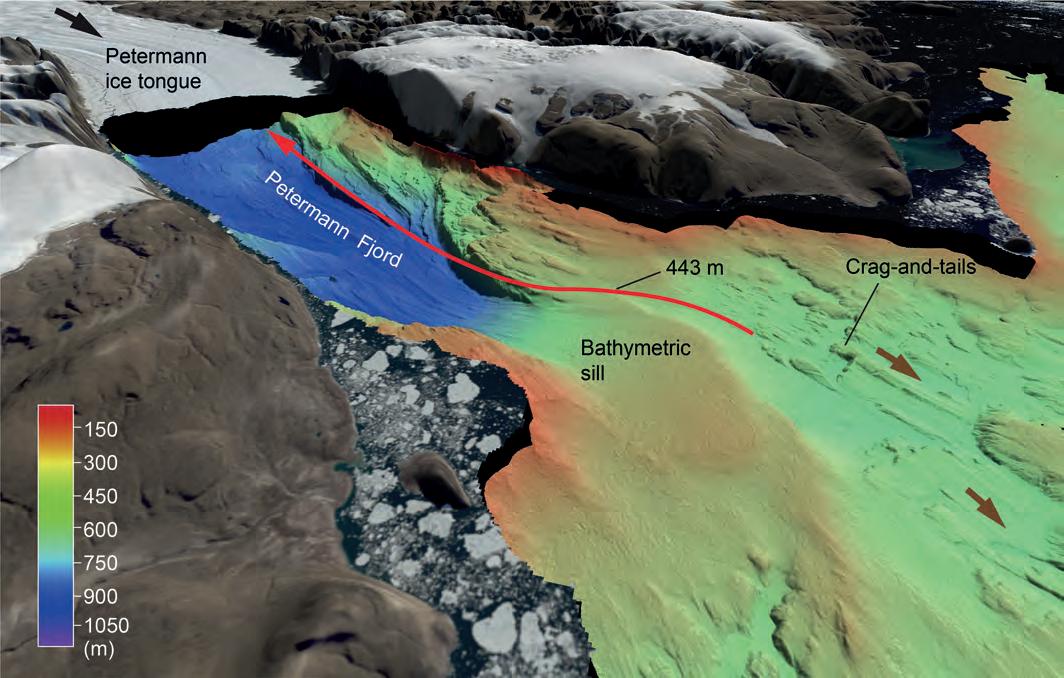
Issue 3 2023 20
Figure 4: Multibeam bathymetry of Petermann Fjord and the adjacent area of Nares Strait acquired during the Petermann 2015 expedition with the Swedish icebreaker Oden
Kongsberg EM
Cited literature
1 Frederikse, T. et al. The causes of sea-level rise since 1900. Nature 584, 393-397, doi:10.1038/ s41586-020-2591-3 (2020).
2 Mottram, R. et al. An Integrated View of Greenland Ice Sheet Mass Changes Based on Models and Satellite Observations. Remote Sensing 11, 1407, doi:10.3390/rs11121407 (2019).
3 Aschwanden, A. et al. Contribution of the Greenland Ice Sheet to sea level over the next millennium. Science Advances 5, eaav9396, doi:doi:10.1126/sciadv.aav9396 (2019).
4 Van de Wal, R. S. W. et al. A High-End Estimate of Sea Level Rise for Practitioners. Earth’s Future 10, e2022EF002751, doi:https://doi. org/10.1029/2022EF002751 (2022).
5 Münchow, A., Padman, L., Washam, P. & Nicholls, K. W. The ice shelf of Petermann Gletscher, North Greenland, and its connection to the Arctic and Atlantic Oceans. Oceanography 29, 84–95, doi:10.5670/ oceanog.2016.101 (2016).
6 Jakobsson, M. et al. The Holocene retreat dynamics and stability of Petermann Glacier in northwest Greenland. Nature Communications 9, 2104, doi:10.1038/s41467-018-04573-2 (2018).
7 Jakobsson, M. et al. The International Bathymetric Chart of the Arctic Ocean Version 4.0. Scientific Data 7, 176, doi:10.1038/s41597020-0520-9 (2020).
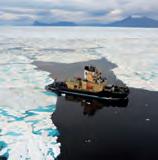
Figure 5: (Upper left) Icebreaker Oden in the area outside Sherard Osborn Fjord. (Upper right) Tabular iceberg, calved from Ryder Glacier, blocking the entrance to Sherard Osborn Fjord, apart from leaving a small passage next to Castle Island. (Lower left) Installation of a GPS transponder on one of the large tabular icebergs. (Lower right) Map showing the track of Oden mapping its way into Sherard Osborn Fjord.
8 Morlighem, M. et al. BedMachine v3: Complete Bed Topography and Ocean Bathymetry Mapping of Greenland From Multibeam Echo Sounding Combined With Mass Conservation. Geophysical Research Letters 44, 11,051-011,061, doi:10.1002/2017GL074954 (2017).
9 Jakobsson, M. et al. Ryder Glacier in northwest Greenland is shielded from warm Atlantic water by a bathymetric sill. Communications Earth & Environment 1, 45, doi:10.1038/s43247-020-00043-0 (2020).
6: Multibeam bathymetry of Sherard Osborn Fjord acquired during the Ryder 2019 expedition with the Swedish icebreaker Oden. Two prominent bathymetric sills were mapped in the fjord. The inner sill was found to be shallow enough to shield Ryder Glacier from inflowing warmer Atlantic water, which was observed by oceanographic measurements. The inset shows a close-up of the inner sill from a slightly different view. Note that a narrow deeper channel exists where some warmer water may pass and flow towards Ryder Glacier.
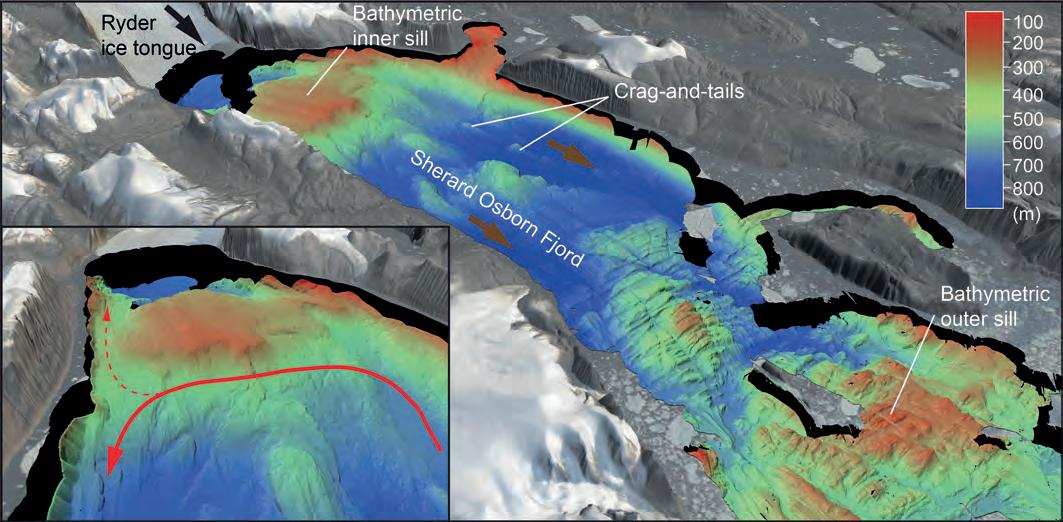
Issue 3 2023 21 Feature
Figure
Prestigious projects from the archives!
Distinguished projects stand the test of time. Throughout the years, Hydro International has shared numerous captivating tales of endeavours in our field that spark the imagination. While some articles may have needed a little dusting off, a curated selection in our archives has given rise to an engaging series of tales. In the following pages, we provide a brief introduction to these stories, inviting you to explore them at your convenience on our website. Embrace the experience and enjoy reading!
Exploring the deepest points on planet Earth

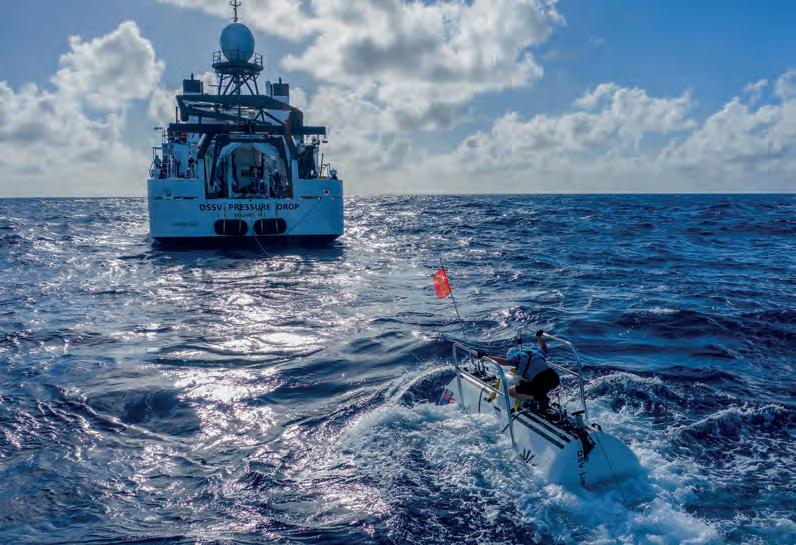
As extreme explorer Victor Vescovo continues his round-the-world expedition to become the first person to descend to the five deepest points in the Earth’s five oceans using the custom-built deep submergence vehicle Limiting Factor, it prompts the question: ‘Do we know as much about the deepest places on our planet as we thought?’ The primary mission was for Vescovo to dive alone to the deepest point in the Arctic, Atlantic, Pacific, Indian, and Southern oceans. The expedition centered around the deep submergence support vessel (DSSV) Pressure Drop, which was fitted with a stateof-the-art Kongsberg EM124 multibeam echosounder system. It also included the newly designed and constructed two-person deep submergence vehicle (DSV) Limiting Factor, along with three fullocean-depth lander systems. These lander systems complemented the scientific outputs of each dive and acted as sub-navigation points
Titanic disaster and its aftermath
In the night of 14 April 1912, the unthinkable happened. The mightiest ship afloat, the brand new White Star Line ship Titanic, was on its maiden voyage from Southampton, England, to New York. The ship was advertised as unsinkable. And, if unsinkable, why should

Issue 3 2023 22
EMPOWERING World leading electric underwater robotics
Seaeye saabseaeye.com
DSV Limiting Factor operated at the Mariana Trench. (Image courtesy:
Saab
ship departed from Southampton on 10 April. Less than five days later, it was at the bottom of the Atlantic Ocean. More than 1,500 people perished within three hours of the ship striking an iceberg, which ripped the bottom out of the ship. Since the discovery in 1985, a series of expeditions have visited the Titanic with a variety of goals. The last few decades have witnessed a revolutionary expansion of humanity’s capacity to not only locate deep-sea shipwrecks, but increasingly to capture imagery and data that essentially ‘virtually raises’ these wrecks for ongoing research as well as public education. In many ways, the Titanic and the surrounding area are likely to be the best-studied section of the deep ocean floor.
Underwater noise monitoring in the North Sea

Sound is of vital importance for marine animals but, due to the increase in human activities in the sea, sound pollution is a growing concern for marine environmental managers. High levels of anthropogenic noise disturb animals, but the integrated impact of noise on the marine ecosystem is largely unknown. Eleven institutes from the countries bordering the North Sea have joined forces in the Joint Monitoring Programme of Ambient Noise in the North Sea (Jomopans) project to implement a novel monitoring strategy for underwater sound. In this project, measurements at sea are combined with noise maps from numerical modelling to assess the quantitative levels of sound at sea. At the time this article was written, the Jomopans project had been developing a monitoring programme for continuous sound in the North Sea. It had combined numerical propagation modelling and field measurements to obtain high-quality maps of the sound level in the North Sea. These maps were intended to be used for assessing the Good Environmental Status in relation to underwater sound.
Increased-resolution bathymetry in the southeast Indian Ocean
The disappearance of Malaysian Airlines flight MH370 on 8 March 2014 led to a deep ocean search effort of unprecedented scale and detail in the remote south-eastern Indian Ocean. Between June 2014 and January 2017, two mapping phases took place: (1) a shipborne bathymetric survey, and (2) a higher-resolution search in areas where accurate mapping of the seafloor was required to guide the detailed underwater search aimed at locating the aircraft wreckage. The latter phase used sidescan, multibeam and synthetic aperture sonar mounted on towed or autonomous underwater vehicles (AUVs). This article describes the mapping of the area where the aircraft was expected to be found. The search area covered an arcuate, NE-SW oriented swath of ~2500km long centred on Broken Ridge. When the survey began, the best bathymetric model available was almost entirely (95%) derived from satellite-altimetry data. However, over the search period, ~710,000km2 of shipboard multibeam data (search and transit data), 4,900 line-kilometres of sub-bottom profiler, and over 120,000km2 underwater systems data were acquired.
Mapping a hyper-acid crater lake with a USV


The 2,708m-high Poás Volcano is one of the most active volcanoes in Costa Rica, located 35km north-west of the capital San José. This stratovolcano contains a 300m-wide crater lake called the Laguna Caliente (‘hot lagoon’) filled with naturally hot, very acidic concentrated chloride-sulphate brine. Knowing the volume and bathymetry of the lake is crucial in monitoring and predicting the behaviour of this active volcano, but there is no recent bathymetric data available. In this article, the authors explain how they developed a cheap and portable, sonar-equipped unmanned surface vehicle (USV) and used it to survey the lake.

Issue 3 2023 23 From the archives
Jomopans project crew preparing the equipment.
Offshore renewables and blue economy boom bring new opportunities for hydrographic surveyors


 By John Fraser, NORBIT UK and Middle East director
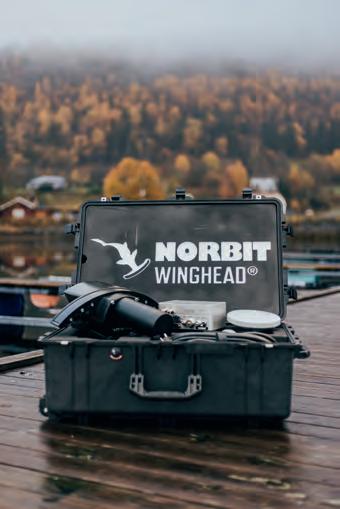
Sonar systems such as the NORBIT WINGHEAD i80S and iSTX360 and the NORdredge software are designed for next-generation marine operations.
An estimated 95% of the oceans remains unexplored today, implying a huge market opportunity for innovative marine survey solutions. While the boom in offshore renewables projects will certainly continue, the blue economy is bringing new opportunities for hydrographers. Common across all applications is use of state-of-the-art sonar equipment that is operable from different platforms.
Sonar systems have long served as the “eyes” of underwater exploration. However, challenging environments – rough, unpredictable seas and the need to work under or near structures such as wind turbine monopiles – have remained an impediment to survey operations. A primary innovation facilitating today’s offshore renewables market is therefore the integration of active motion stabilization into small form factor, low power draw, tightly integrated multibeam echosounder systems. These new developments give hydrographers powerful tools, eliminating the need to compromise between swath width, speed of data collection and data density. The latest technologies bring challenges too, as both the clientoperator and contractor need to understand the capabilities to maximize their benefits.
Increased data quality and survey efficiency


NORBIT Subsea integrates active motion stabilization into a family of compact, highresolution, wide swath multibeam echosounder systems such as the WINGHEAD i80S and the just launched iWBMSh Stabilized system. Active stabilization is different from motion correction for georeferencing purposes in that the beam is actively steered to compensate for vessel roll, pitch and yaw.
Fully Active Stabilization by NORBIT Subsea


Steerable transmission functionality for superior feature identification
Steerable transmission functionality (STX), built into the NORBIT WINGHEAD “S” series and WBMS STX sonars, is another key advancement aiding offshore applications. STX scanning lets the operator direct the transmit beam by ±10° in a scanning pattern. The result is a revolutionary new data deliverable utilizing multi-look capabilities to reduce shadows and improve feature characterization. This aids inspection surveys by giving a more complete picture of the survey area or target. Additionally, it can be used to capture extra detail on complex structures, such as offshore turbine jackets and transformer platforms, during a single pass or measurement.
Issue 3 2023 24
Figure 1: Sonar use for dredge and scouring.
Other applications of STX scanning include obstacle avoidance, dredge monitoring and cable lay operations. The system can be mounted in any orientation to change the scanning pattern. For example, rotating the sonar to face athwart-ships with a slight upward tilt allows the sonar to scan a ±10° sector ahead of the vessel, providing highaccuracy, forward-looking bathymetric data.
The STX system can be mounted with a rotator to provide 360° real-time monitoring of the seabed and water column from a static platform. This iSTX360 solution, together with its intuitive software, simplifies the survey experience and provides a concurrent work platform for both vessel operators and hydrographers. It is suited for any uncrewed surface vessel (USV) or other surface vessel, including barges, or for deployment from static locations such as breakwaters or quay walls.
The iSTX360 offers key efficiency benefits that include quick mobilization, fewer personnel needed on-site, the ability to acquire pre-/post-datasets during operations, real-time placement and in-fill monitoring without waiting for a survey vessel, and the ability to identify and avoid hazards in real time. This enables operations to be focused where needed, minimizing equipment moves and expensive rework.


The NORdredge software environment (Figure 4) provides simultaneous, multiuser access for expedited communication across the project team. This allows remote change detection and analysis, quality control and instant remote upload of design templates/adjustments to plan for real-time progress reporting and optimized resource management.
Bringing gains in processing power and cloud computing to the hydrographic space


“Collect once, use many times” approaches to data gathering are evident across hydrography. This implies harvesting maximum data from field operations and making rich datasets available for multiple users and multiple uses, at different locations around the globe.
NORdredge is a web-oriented utility that directly interfaces to the NORBIT iSTX360 multibeam sonar system. It is based on the NORBIT Open Hydrography Platform (OHP) and represents a continued development of the company’s bathymetry data acquisition software, DCT. Because the architecture of NORdredge facilitates remote access, a remotely located hydrographer or engineer can perform advanced tasks – from survey design to real-time data acquisition and quality assurance – while the operator conducts the survey using a handheld device such as a mobile phone or tablet.

Concurrently, other personnel can monitor survey operations from any location around the world, which may even involve the remote deployment of USV platforms for further investigative or other tasks.
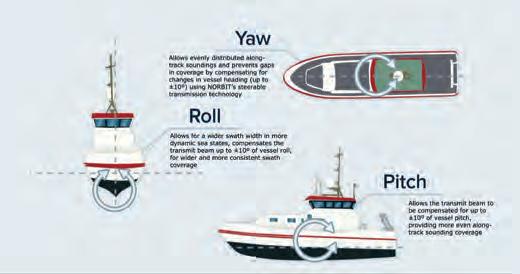

Simplifying bathymetry survey operations with DCT
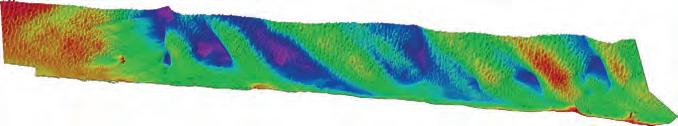
NORBIT’s Integrated Data Acquisition Software, DCT, similarly simplifies standard bathymetry survey operations. The bathymetry grid is
displayed in a web browser, providing a quick indication of coverage and data quality while running the survey. DCT is ideal for inexperienced multibeam sonar operators, small vessels and single-person operations, as well as USVs with low-bandwidth radio connectivity to the operator. It can be operated from a simple touch screen on a navigation plotter, tablet, smartphone or PC. The four available real-time displays (depth, sounding density, backscatter and standard deviation) can run concurrently on one or several clients, so while the skipper views the depth display, a surveyor or remote QA assistant can view standard deviation and sounding density.

DCT offers a simple, reliable data collection method with predictable and known data outputs. All data is collected in NORBIT wbm files and in the popular s7k file format. Collecting everything with respect to the ellipsoid can allow larger organizations to send less experienced personnel into the field without the worry that geodetic settings will be incorrect.

NORBIT Subsea is part of the Oceans division of NORBIT ASA. Its solutions are based on the latest in analogue and digital signal processing and its products provide widecoverage monitoring combined with high sensitivity and accuracy.


References
World Dredging, Mining & Construction, Vol. 53, Nos. 11/12-3/21 (WorldDREDGING.com)


NORBIT Data Sheets, April 2023

Sponsored article Issue 3 2023 25
Figure 5: Bathymetry of river bottom.
Figure 3: Pitch, roll and yaw stabilization
Figure 4: iSTX360 and NORdredge work environment.
From seabed to cloud: ground-truthing seagrass data
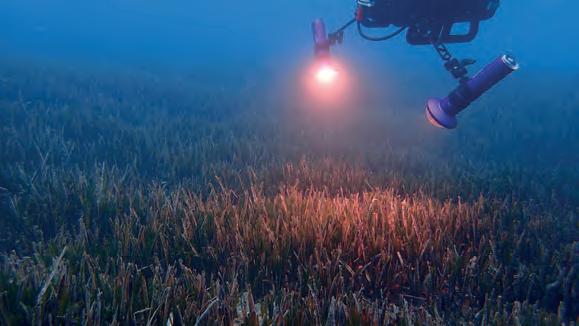
Adding credibility and scalability to the blue carbon market
By Guy Rigot and Raja Kandukuri, planblue, Germany
The ocean plays a crucial role in mitigating climate change, yet we lack detailed information on over 95% of the seafloor. This article explores planblue’s solution to accelerate time-to-data and the accuracy of seabed mapping, showcased by several successful case studies. Planblue’s technology combines underwater hyperspectral imaging, RGB imaging and underwater navigation with an AI-driven automated data processing pipeline. Overcoming challenges relating to geolocation, water column distortion and motion distortion, planblue’s data products add credibility to the blue carbon market.
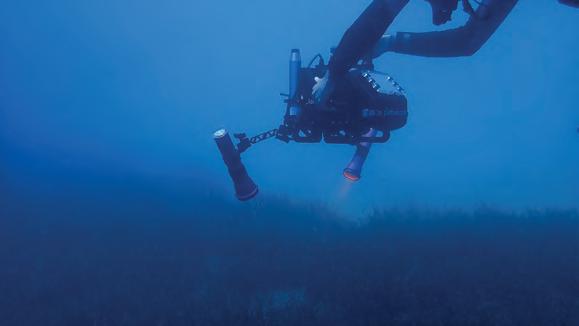
70% of the Earth’s surface is covered by the ocean, which regulates the climate, absorbs carbon dioxide, provides food and supports biodiversity. The seafloor, as far as we know, is the best carbon sequester available, and can fix CO2 up to 30 times faster than trees on land. Notably, seagrass exhibits remarkable CO2 capture efficiency. Despite their pivotal role in mitigating climate change, seagrass meadows face inadequate recognition and protection due to limited data on their distribution. They are heavily underrepresented in policy-making and finance decisions around climate mitigation. In fact, of all the United Nations Sustainable
Development Goals, Goal 14 ‘Life below water’ has received the least amount of public money. To tap into the large carbon sequestration potential of the ocean, we need to finance projects for seafloor restoration and preservation. Access to credible data is essential to accelerate the blue carbon market, including blue carbon credits and Nationally Determined Contributions (NDCs) to meet the Paris Agreement.
Mapping the seafloor and measuring carbon Planblue was founded in 2017 by two former marine scientists and two engineers to enable high-quality seafloor mapping, inspired by satellite technology. Based in Bremen, Germany, the company now has over 25 employees. Using a novel seafloor mapping solution, planblue processes seafloor data from around the globe with the explicit goal to highlight the ecologic and economic value of the seafloor.
Replacing traditional seafloor mapping methods with highly automated and scalable processing pipelines, planblue can produce georeferenced seafloor maps at pace. Its goal
Issue 3 2023 26
DiveRay mapping seagrass in Nice, France.
DiveRay mapping seagrass near Bodrum, Turkey.
is to add in-depth information to bathymetric maps, including the health state of the seafloor, carbon sequestration potential, biomass and biodiversity. The technology is capable of surveying anything on the seabed and mapping a variety of carbon sequestering ecosystems, including corals and seaweeds. For its first application, planblue has focused on seagrass meadows.
Speed and scale
As the world is running out of time to turn the tide on climate change and protect biodiversity, an important part of planblue’s mission is to provide speed and scale for the protection of vital ecosystems, replacing manual processes with automated pipelines based on state-of-the-art computing and AI. Traditional methods of groundtruthing aerial and satellite data require a time-intensive process of in situ collection of core samples from the seafloor and subsequent lab analysis. Planblue’s technology largely replaces this with near in situ remote sensing, using hyperspectral cameras and a selection of sensors to correct distortions of the images in the water column. As planblue controls the entire data chain, it can ensure a seamless and speedy process, even in areas with limited internet access during field campaigns. By implementing these streamlined processes, planblue can reduce time-to-data from weeks or sometimes months to days or even hours.
Measuring Mediterranean seagrass
Normalization of data is essential to meaningfully compare results over time, between locations or with other remote sensing technologies. Since planblue started six years ago, its technology has been tested and improved through several campaigns around the world. This article zooms in on two crucial surveys in the Mediterranean, in France and Turkey. In October 2022, planblue first tested a selection of new sensors in Nice, France, that were added to increase the accuracy of the AI and other algorithms. The survey in May 2023, east of Bodrum in Turkey, gave a unique opportunity to compare the outcomes of the algorithms with the manual measurements collected at the location over the past years and with the data from the Nice campaign.
A new dimension to seafloor mapping
With the ambition to create a comprehensive representation of underwater areas and their changes over time, the first step for planblue is the creation of orthoimagery of the seafloor. Through its automated pipelines, planblue’s technology can stitch thousands of images together in less than 24 hours after the seafloor data has been collected. Underwater navigation and geolocation are however essential for accurate mapping and meaningful data processing. While AUVs have this technology built in, planblue developed its own in-house navigation system for the diver-operated DiveRay. This technology ensures precise positioning of the imagery on the seabed, making accurate mapping and year-on-year comparison possible.
Working with hyperspectral data presented an additional challenge. The hyperspectral camera is a push-broom scanner, which means that movement of the camera through the water introduces distortions in the captured images. Using data from the navigation and other sensors, planblue was able to adjust for the motion in the data processing. By combining this with the georeferenced data, planblue can create an overlay of hyperspectral data on top of an
Guy Rigot is chief technology officer and co-founder of planblue. Before planblue, he worked on the Attitude and Orbit Control System (AOCS) of the MeteoSat Third Generation (MTG) satellite and was co-founder of a company turning sound into art. Guy received his Master’s degree in aerospace engineering, graduating with honours from the Delft University of Technology.
Raja Kandukuri is data engineer and co-founder of planblue. He is skilled in data analysis, engineering, manufacturing and software development. He holds a Master’s degree in Electrical, Electronics and Communications Engineering from Bremen University of Applied Sciences.

RGB image and produce advanced maps of the seafloor. There are however a few more obstacles to overcome to deliver high-quality, accurate and meaningful information.
Making turbid water crystal clear
As with any form of remote sensing, one of the challenges that planblue needs to address is the correction of distortion of the observations. Planblue’s DiveRay typically operates about two metres above the seafloor. To accurately assess the properties of the vegetation or sediment, the observations need to be compensated for the water column between the DiveRay and the seabed.
While the space community has worked on compensation for light travelling through the atmosphere for many decades, this kind of work is still in very early stages underwater. The survey in Nice in 2022 was the first opportunity for planblue to test new sensors that gather data required to adjust for varying conditions such as depth, weather, turbidity and other environmental properties. One of the sensors that was introduced measures downwelling irradiance, which makes it possible to determine how the light is diffused by depth, turbidity and other disruptions in the water column.
After Nice, the follow-up campaign in Turkey presented an opportunity to test the effectiveness of the data processing further by comparing measurements from the two campaigns. Both surveys took place in the Mediterranean Sea with similar ecosystems, observing the same species of seagrass, Posidonia oceanica. However, the environmental conditions differed. In Nice, the conditions were consistent, slightly sunny weather and observations at a depth of 5–6 metres. In Turkey, the water was deeper, at 25–30 metres, as the project measured the edge of the seagrass. The weather conditions were also variable, with some sunny days but also rain. The findings
Issue 3 2023 27 Feature
About the authors
of these two campaigns provided valuable input to enhance the data processing pipelines.
Size matters
Another challenge with underwater imaging is scaling. Objects underwater seem closer than they really are, and how much closer depends on the water conditions. For this reason, scaling is a fundamental challenge to anyone working with underwater photogrammetry. Usually, a correction is carried out manually with a variety of visual aids, such as markers and scale bars, and incorporated into the post processing workflow to estimate the scaling introduced by the water. As planblue’s mission is to automate as much as possible, it developed its own proprietary field of view correction model to manage this. Combining the geolocation from the navigation solution and distance of the camera to the seafloor, planblue’s technology can calculate the scaling factor of the water.
Big picture
Planblue has therefore made some extensive adjustments to its data processing flow to derive georeferenced benthic reflectance. In the case of hyperspectral images, it is essential to apply corrections to the data. Instead of creating visual images, the observations from the hyperspectral camera generate numbers that are used to compute indices, which would be meaningless if not calibrated and validated. The purpose is to obtain objective measurements that are independent of the conditions encountered in the field or caused by the device. All
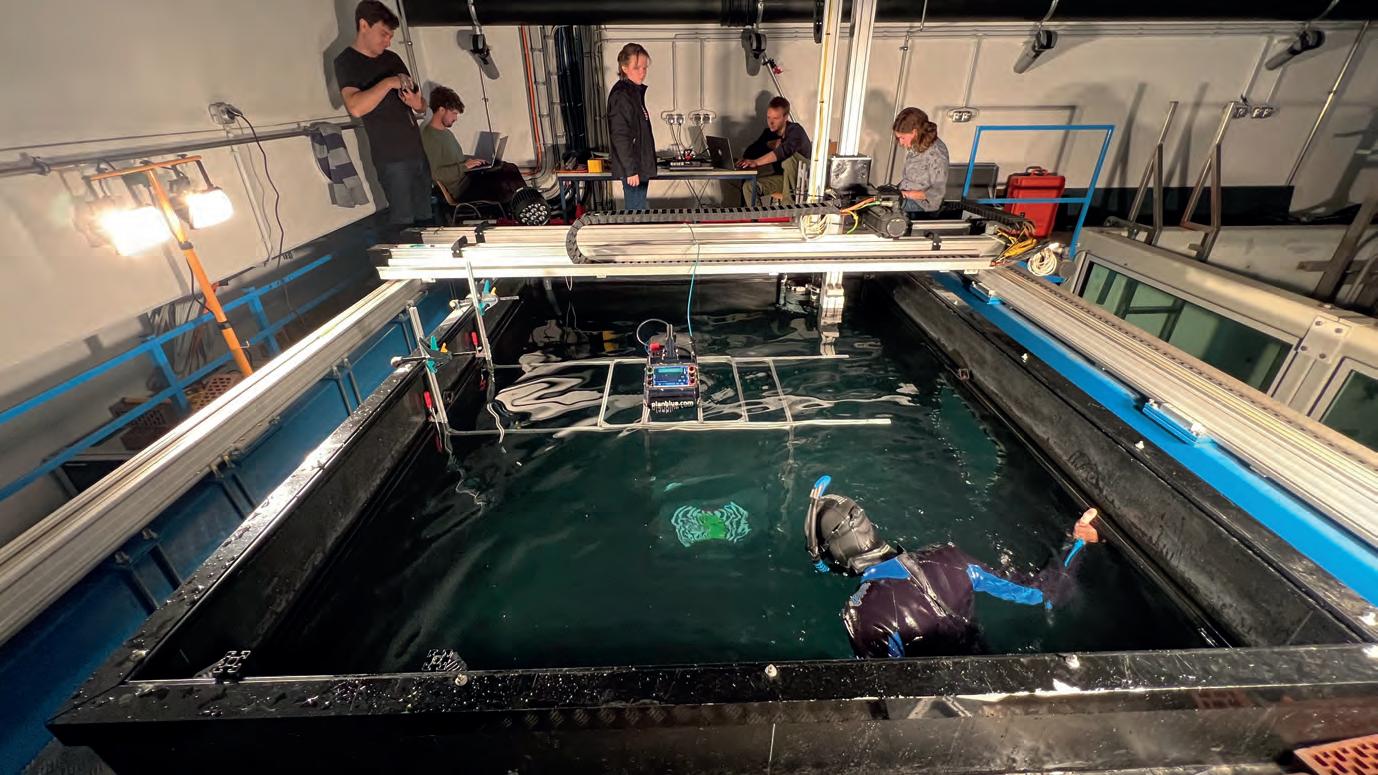
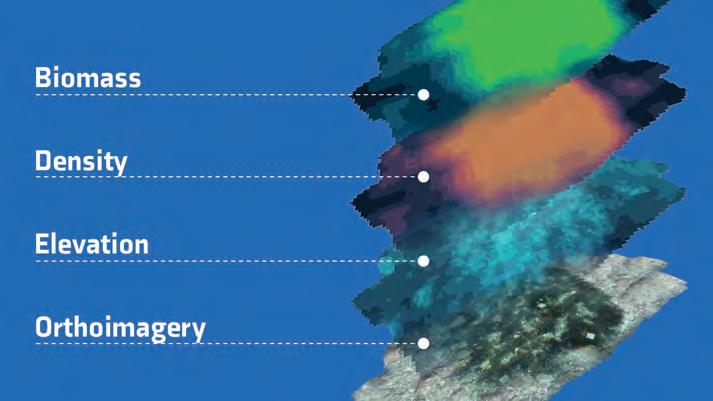
Issue 3 2023 28
Orthographic map with overlays.
Planblue’s team in action testing the technology.
the metadata measured in the field is time stamped and carefully logged to feed the intermediate processing pipelines that will generate the maps and overlays.
Although a lot of this is now integrated into the automated workflow, full automation of the data analysis remains a work in progress – fine tuning and optimizing the process. As more of these technical challenges are solved in the data processing pipelines, it speeds up how quickly final data products can be delivered to customers. This reduction in timeto-data conversion can support more data-driven decision-making for sustainable marine management. To scale up the reach of the data products, planblue is expanding its operational capacity by integrating its technology as a sensor package into existing underwater drones.
Adding credibility to the blue carbon market
The comprehensive datasets collected using planblue’s technology can be used to visualize seasonal changes in marine ecosystems. The hyperspectral overlays on the orthoimagery of the seafloor get to the essence of what planblue’s technology has to offer. The data collected with the hyperspectral and RGB cameras provides detailed insights, for example into the health, biomass and density of seagrass. This information can revolutionize marine conservation, preservation and restoration. Knowing not just whether seagrass is present, but also the state it is in, can ensure that policymakers focus on the areas where most impact can be made. After all, unhealthy seagrass meadows can become net emitters of CO2, while healthy seagrass sequesters carbon up to 30
times faster than a rainforest. This thorough assessment of seagrass meadows can take blue carbon projects to the next level and provide the credibility needed to attract investors and accelerate the market.
Conclusion

Planblue’s underwater geospatial technology is driving a transformation in the blue carbon industry, speeding up the protection of vital marine ecosystems with almost instant, credible and accurate data. The seafloor plays a critical role in regulating the climate, absorbing carbon dioxide and supporting biodiversity. However, it remains an undervalued and underfinanced carbon sink, lacking detailed information to drive meaningful conservation efforts. In the recent surveys in France and Turkey, planblue tested and improved its innovative seafloor mapping solution. Equipped with hyperspectral and RGB imaging capabilities, the company has successfully created objective ground truth data by overcoming challenges with water column distortions and georeferencing. The comprehensive datasets generated during these campaigns offer detailed insight into seagrass health, biomass, density and carbon sequestration potential. With reliable data, investors and policymakers can focus their efforts where they can make the most significant impact, both economically and ecologically.
www.planblue.com
Issue 3 2023 29 Feature
More information
Bringing operational efficiency to the offshore wind industry
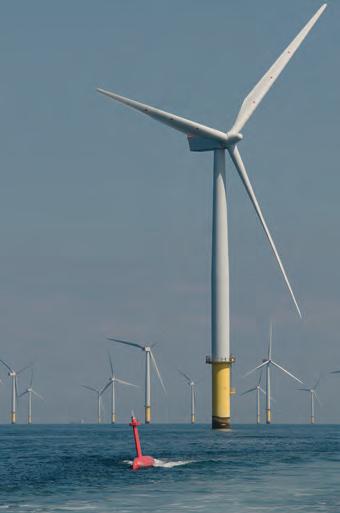
With hundreds of new offshore wind projects in development around the world and annual growth of almost 30%, offshore wind is a rapidly maturing renewable energy technology that offers great potential. Bolstered by national policies and decreasing technological costs, the global offshore wind market is set to expand strongly in the coming decades, whether in Europe, Asia or the US, and is forecast to increase 15-fold to 2040, becoming a $1 trillion industry over the next two decades.
Leveraging decades of offshore energy expertise, Exail is a trusted partner in this transition towards more sustainable offshore energy. Already used on offshore wind farm projects around the world, the company’s innovative technologies (inertial navigation systems, subsea positioning and imagery solutions, as well as uncrewed autonomous platforms) offer proven performance and reliability in the challenging environments of offshore wind energy posed by shallow waters and high winds. Requiring less equipment to be deployed at sea and offering disruptive yet proven uncrewed
solutions and advanced subsea sensors, Exail helps operators to improve operational efficiency by reducing costs and the time spent at sea while improving safety and cutting carbon emissions. From environmental studies, UXO surveys and site investigation to construction, operations and predictive maintenance, Exail is a trusted technology provider at every stage of a wind farm’s development and operating life.
Unique versatile uncrewed platforms for more flexible operations at sea
As a major provider of advanced marine and autonomy technologies, Exail is playing a central role in advancing operational efficiency in the offshore industry. With its DriX uncrewed surface vehicle (USV), FlipiX remotely operated towed vehicle (ROTV) and R7 remotely operated vehicle (ROV), the company provides comprehensive autonomous survey capabilities that offer improved performance and greater operational efficiency for various applications, including environmental, geophysical, UXO and as-laid surveys, inspection, maintenance and repair (IMR) and biomass assessment.
Offering outstanding sea-keeping capabilities (up to sea state 5) thanks to its unique design, the DriX USV is perfectly suited to challenging offshore wind farm environments. Able to host a wide range of payloads for multi-mission capabilities (MBES, SBP, USBL, INS, FLS, etc.), its high stability ensures the collection of high-quality and accurate data, even in high sea states (incidentally, recent operations using DriX showed that data cleaning could be reduced by 90%). Combined with the FlipiX ROTV – a unique conveyance platform for sidescan
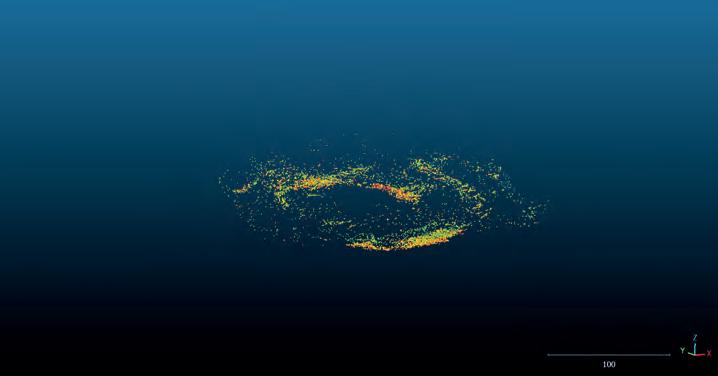
Issue 3 2023 30
Figure 1: DriX conducting a bathymetric survey on Gwynt y Môr offshore wind farm off the coast of Wales.
Figure 2: Fish detection around a wind farm turbine using the SeapiX-R sonar.
sonars (SSS) and magnetometers – this global uncrewed solution enhances the autonomous survey scope, making it possible to conduct bathymetric, geophysical and UXO surveys in a single run and therefore drastically reducing survey time and removing the need for costly support vessels.
The new R7, a compact observation-class ROV, further offers advanced subsea exploration and inspection capabilities down to 300 metres. Combining the portability and ease of deployment of mini-ROVs with the performance, speed and payload carryingcapacity of professional observation-class ROVs, the R7 can be deployed to inspect the integrity of subsea assets and UWILD operations. Incorporating the latest developments in digital technology, the R7 provides operators with very high-quality images, even in low visibility conditions.
Deploying Exail autonomous platforms on offshore wind farm sites also means conducting operations with a reduced impact on the environment. Consuming only 50 litres of fuel per day, the DriX USV can replace ships of about 60 metres with a daily fuel consumption of some 5,000 litres. The ecological footprint of operations at sea can therefore be reduced by a factor of 100 compared to traditional vessels.
Finally, as pioneers in uncrewed maritime solutions, Exail helps to ensure the safety of personnel by reducing their exposure at sea. The company’s uncrewed solutions can be supervised from remote control centres (located either onshore or on a mother vessel) using reliable over-thehorizon capabilities thanks to advanced communication and obstacle avoidance systems.
Advanced sensors offer unrivalled performance and reliability in shallow waters
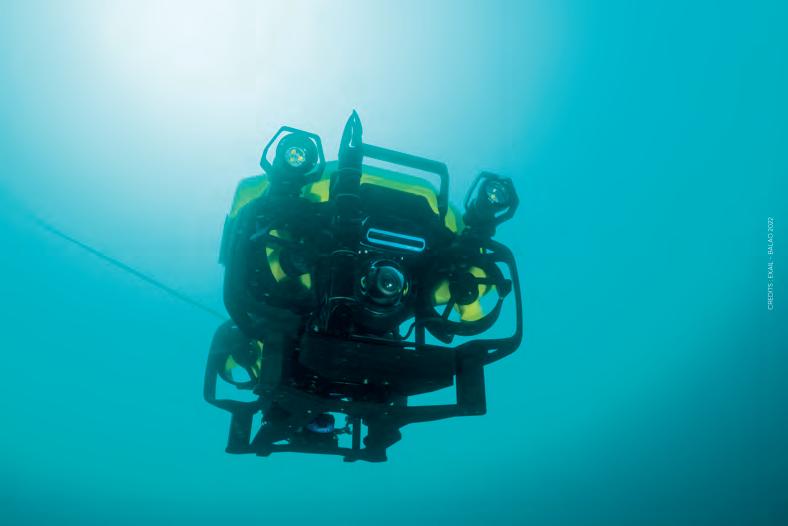
Increased efficiency can further be reached when combining Exail’s uncrewed solutions with its trusted subsea positioning and imaging solutions, such as the Gaps series of USBL subsea positioning systems, the complete range of inertial navigation systems (INS), the Sams synthetic aperture mapping sonars, the Echoes sub-bottom profilers and SeapiX 3D multibeam echosounders. Compatible with third-party assets for better interoperability, all Exail sensors can be
deployed from a wide range of platforms, ranging from traditional vessels to uncrewed surface and subsea vehicles, and are easy to integrate into existing pools of equipment and operational fields with no compromise on performance or reliability, ultimately bringing increased flexibility and efficiency.
Compact and lightweight, the Gaps series is already being used in the renewable energy industry to conduct various operations such as UXO pre-survey and structure deployments. Easy to deploy, the Gaps USBL systems embed their own motion sensors and do not require any in-the-field calibration. Offering unmatched accuracy in very shallow waters and horizontal tracking, they are especially suited to the environments encountered on wind farm development sites. Coupled to Exail’s subsea inertial navigation systems (INS/AHRS), which already equip over 80% of the subsea vehicles used in the energy and geoscience industries, the Gaps series powers the highly accurate positioning and tracking of subsea assets such as AUVs, ROVs or towfish. It is also the perfect technology for cable laying and touch-down monitoring operations that require a highly robust horizontal tracking capability.
Exail’s unique subsea imagery solutions are also perfectly adapted to wind farm applications. Relying on 20 years of fieldproven technologies, the wide range of Exail subsea imagery solutions extends from water column analysis to seabed mapping and monitoring and meets all renewable energy installation and surveillance needs.
The Sams synthetic aperture mapping sonars provide unprecedented performance compared to conventional sidescan sonars, even in the very shallow waters encountered in wind farm environments. They deliver, in real time, both high-resolution images of the seabed and interferometric bathymetry required for site and route surveys. The Echoes series of sub-bottom profilers highlight the sedimentary deposits architecture and gas release, as well as highly reflective buried objects, such as cables, pipelines and boulders. The Exail Sams and Echoes Series are therefore particularly useful for field extension phases, cable route surveillance and inspection and maintenance operations.
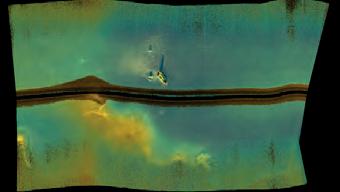
Finally, the company’s SeapiX 3D multibeam echosounder enables the highly accurate classification of marine ecosystems and the quantification of biomass, fish and shoal dynamics. This real-time biomass monitoring in a static position makes it possible to study natural resource evolution throughout the offshore wind project life cycle.
Overall, Exail’s comprehensive set of technologies, from sensors to autonomous conveyance platforms, offer unmatched performance, reliability and versatility, allowing operators to conduct accurate but efficient operations in a reduced time frame and with increased safety. Smaller and smarter technologies that do not require large vessels and big crews to be deployed reduce the hours spent at sea and will play a central role in the offshore energy industry’s transition towards a more sustainable future.
Sponsored article Issue 3 2023 31
Figure 3: Merging of high-resolution SAS imagery and bathymetric data produced by Sams 150.
Figure 4: The R7 incorporates the latest developments in digital technology, giving operators some of the highest quality images on the market.


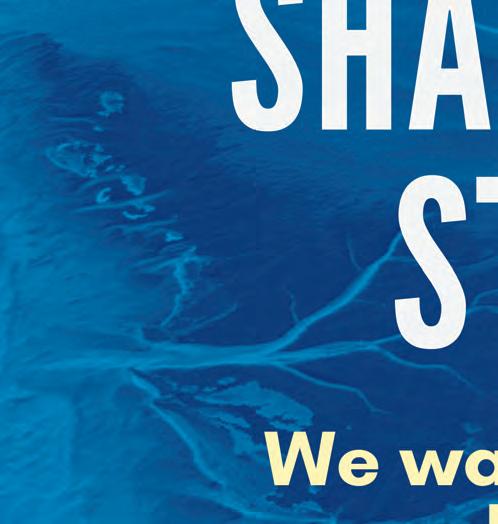
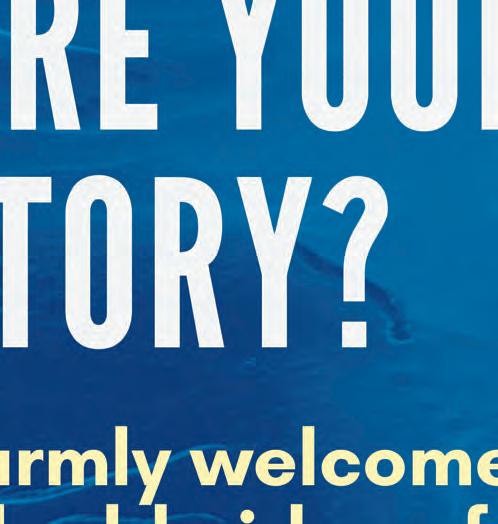

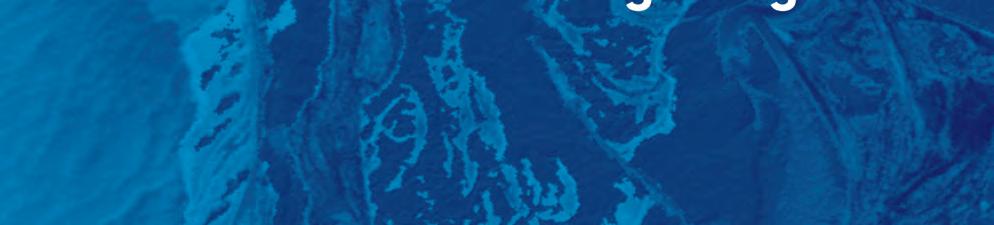
Fugro’s hydrographic expertise locates sunken warship
The search for the Montevideo Maru
By Paul Seaton, Fugro, Australia
The sinking of the Montevideo Maru in 1942 is the worst maritime disaster in Australia’s history. The vessel was carrying nearly 1,060 prisoners from 16 countries, including 850 Australian prisoners of war, and over 200 civilians aged 16 to over 60, when it was sunk off the Philippines by the USS Sturgeon. The ship was not marked as carrying prisoners and, while the fate of those onboard was not known until the end of the Second World War, the ship’s location remained a mystery. Fugro and the Silentworld Foundation took on a humanitarian expedition to find the Montevideo Maru’s final resting place and its passengers, to help bring closure to those affected by the tragedy.
Fugro’s company purpose is to contribute to a safe and liveable world. Hydrography plays a key role in this mission, supporting a range of scientific research for a better understanding of our oceans and helping to create a sustainable and resilient future. The Montevideo Maru project was important to Fugro, as its skilled employees were able to
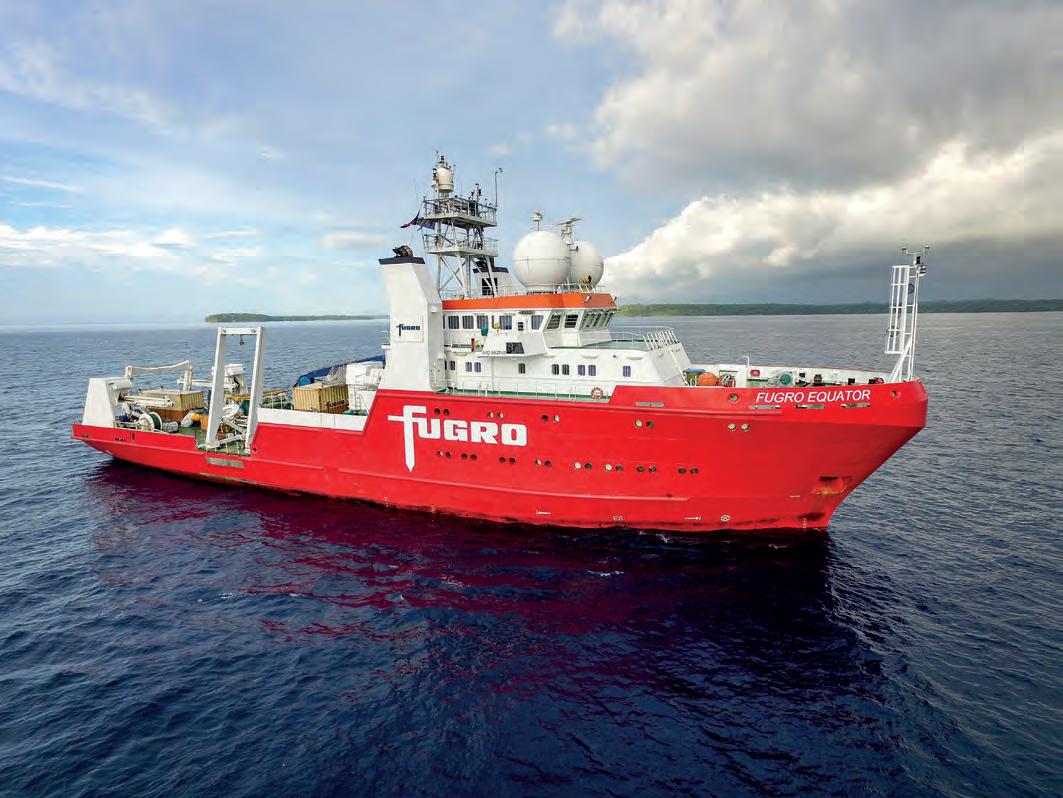
use their cutting-edge hydrographic technology to make a difference and unravel a mystery that had devastated the lives of many of the families involved; the hope being that the project would bring closure and peace at long last.
Before the search
Fugro and the Silentworld Foundation had previously worked together in 2017 on an expedition to locate Australia’s first lost submarine, the HMAS AE1. The submarine’s fate
33 Feature
successful collaboration, discussion began almost immediately on the prospect of a future search, and the Montevideo Maru became that next expedition. And so Fugro began five years of careful planning with the Silentworld Foundation and the Rabaul and the Montevideo Maru Memorial, with support from Australia’s Department of Defence. On 6 April 2023, 110km north-west of Luzon in the Philippines, the team started the highly anticipated search.
Vessels and technology
Fugro provided hydrographic support for the search in the form of its state-of-the-art equipment, together with a highly qualified and experienced team that planned and delivered the project. The Fugro Equator, a cutting-edge survey vessel equipped with a deepwater multibeam echosounder (MBES), led the search. The Fugro Equator can carry out a full range of offshore survey services, from simultaneous analogue and digital site surveys to full route surveys. The vessel is also permanently equipped with the latest hydrographic and positioning equipment.
The underwater work was performed by the Echo Surveyor VIII (ES8), a Hugin autonomous underwater vehicle (AUV). AUVs are the ultimate tool for high-resolution imaging and accurate positioning of seabed and sub-seabed features and infrastructure. The ES8 is highly manoeuvrable and fitted with high-resolution MBES, synthetic aperture sonar and a high-resolution laser and camera that can reach a depth of 4,500m. This meant the AUV could cope with the search area’s deep water, collecting information without disturbing the seabed or the possible wreck site, all while the fast turnaround of deliverables transferred critical information into the right hands in real time.
The search and data processing
The project started with a reconnaissance of the search area west of the Philippines in water deeper than 4,000m. This initial survey used the deepwater MBES mounted to the hull of the Fugro Equator to establish a general understanding of the seabed geomorphology. These results and the acquired geodata were then used to plan the deployment of the AUV. The ES8 was used for the following high-resolution hydrographic search. ES8 collects geodata, including MBES and high-resolution
interferometric synthetic aperture sonar (HISAS), and uses a Cathx camera to acquire highresolution imagery of the seabed. The AUV was flown at altitudes of 100m above the seabed to identify the wreck site, with each mission lasting for 40 hours, followed by 10 hours of data processing onboard the vessel for each deployment. Once the site had been located via this hydrographic search, the ES8 was sent back into the ocean for lower altitude missions of between 45m and 6m to gather higher-resolution geodata. With each mission, the desired result came closer.
Echo Surveyor VIII (ES8), Kongsberg Hugin AUV, equipped with payload of:
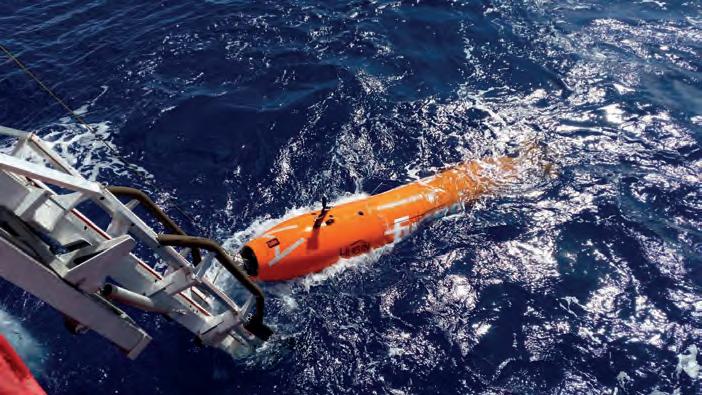
Multibeam echosounder Kongsberg EM2040
Synthetic aperture sonar Kongsberg HISAS 1032
Sub-bottom profiler EdgeTech 2205 (2–16kHz)
Camera Cathx colour stills camera with LED light panel
Cathx laser camera and laser system
Magnetometer OFG self-compensating magnetometer
CTD SAIV, SD208
A key requirement for the search team was to ensure that the right wreck had been located; the search area covered multiple wreck sites and identification needed to be conclusive. Members of the research team onboard the vessel worked together with a team from the Australian Department of Defence led by Unrecovered War Casualties – Army, with onshore support from the Australian Hydrographic Office. Together, they played a key role in the search planning and identifying features from the wreck used for positive identification. The search team needed to be able to clearly demonstrate those features before the final survey of the wreck and acquisition of the high-resolution geodata.
Hundreds of hours of data processing commenced. Once the project team of maritime archaeologists, conservators and research specialists worked through the geodata, it was clear that the Montevideo Maru had been found. The wreck site was located at a depth of over 4,000m, with the vessel having broken in two and lying in a debris field of cargo, including trucks, on the seafloor. The team worked hard to capture as much detailed information as possible without disturbing the site, to preserve it for further study by researchers and marine archaeologists.
Crew impact
The search started on 6 April 2023. After 12 days, the team had a first positive sighting with the AUV, but the geodata still had to be processed and the team had to wait for the results to be able to identify the wreck. The moment when the confirmation came through was incredibly emotional and exciting for the crew. The team was very proud of what they had achieved, but at the same time they were humbled. Many families have been touched by the Montevideo Maru never forget the positive, grateful and relieved reactions from the families after the news was
Issue 3 2023 34
The Echo Surveyor VIII (ES8) is deployed into the ocean.
confirmed. Remembering those whose lives were lost that day will also continue around the world as numerous memorials are planned.
As John Mullen, chair of the Silentworld Foundation, commented: “Working with Fugro to successfully locate the Montevideo Maru was a fascinating and rewarding technical achievement, but it is the human dimension that has left the greatest impression. We have been overwhelmed by the extraordinary number of messages from descendant families who had never given up hope that one day the resting place of their family members would be found. It has been humbling to have been able, in a way, to bring a measure of closure to those families after so many years.”
Challenges of deepwater surveying Fugro’s team of highly trained and dedicated survey professionals is experienced in deepwater operations and has the right vessels and equipment for a search like this, where the biggest challenge was identifying the most likely search area. Historians and archaeologists from the Silentworld Foundation were responsible for delineating the search area, while Fugro complemented this research with its understanding of the expected metocean conditions. After the search area was identified, the right team needed to be put in place for efficient logistical support on the project. A detailed reconnaissance plan of the area was also needed to make sure the ES8 could complete the search in the time available. This careful planning ensured that the ships and AUVs followed optimal search lines and avoided any hazards.
Future
The huge amount of geodata acquired during the search will be further analysed by marine archaeologists and researchers. This not only brings closure to those directly linked to the tragedy, but also contributes to our collective history and culture. The work underway from Fugro, the Silentworld Foundation and other partners will result in further releases of the detailed imagery, and so we can expect to see powerful visualizations based on these large quantities of acquired geodata.
Through maritime archaeology projects such as the Montevideo Maru, the community gains a greater awareness of the role of hydrography and our collective understanding of ocean science. They provide an important opportunity for outreach, demonstrate the advances in technology needed for a successful search, and
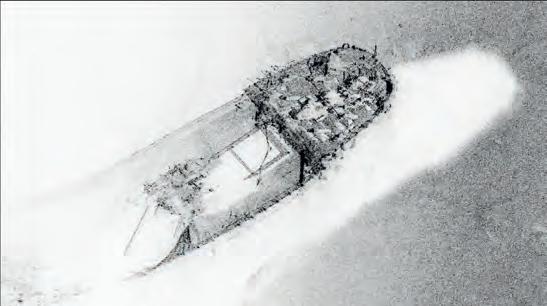
About the author
Paul Seaton is Fugro’s Director for Hydrography and Coastal Resilience in Asia Pacific. Focused on commercializing remote sensing innovations and harnessing geodata expertise to create a safe and liveable world, he is one of the leaders shaping Fugro’s contribution to sustainability and public private partnerships for ocean science.

showcase the benefits of underwater mapping. These all contribute to the conservation of marine ecosystems and align with Fugro’s sustainable development goals.
The Fugro Equator and its team have many more hydrographic and geophysical projects planned. The need for ocean data is greater than ever before and Fugro is involved in a range of global marine projects, from energy transition and the development of offshore wind farms to important sustainable infrastructure. Understanding the ocean, including its fascinating and sometimes tragic history, will play a key role in all our futures. Mark Heine, CEO of Fugro, concluded: “This maritime tragedy involved many countries and families, and all paid a terrible price. I am proud that our skills and technology can help find resolutions to historical projects such as this and, in this way, make a real difference to people’s lives. At Fugro, we’re using our hydrographic and oceanographic solutions to contribute to relief efforts and live up to our purpose of creating a safe and liveable world.”
For more information
p.seaton@fugro.com
Issue 3 2023 35 Feature
Sonar image of the stern section of the Montevideo Maru
Shipwreck sonar image comparison to blueprints of the Montevideo Maru
KUM Offshore collects subsea core samples in challenging conditions
When research institution the Geological Survey of Denmark and Greenland (GEUS) needed to survey the ocean floor in Davis Strait off the coast of Greenland, it partnered with KUM Offshore (KUMO), a leading global provider of advanced subsea equipment, to deliver the expertise and technology to take sediment core samples.
KUMO’s vibrocorer technology (originally developed by German company MED-C, now part of the KUM Group of Companies) uses an electrical motor to generate a vibration force that drives a barrel into sediment. The core barrel has an inner diameter of 10cm, length of 5.7m and vibration of 28Hz, making it ideal for extracting any type of dense and compacted sediments. The equipment is DNV-certified, which provides assurance of its high quality and suitability for use in the marine industry.
Using vibrocorer technology rather than alternative coring methods allowed GEUS to obtain undisturbed cores of lengths of up to almost six metres, which is crucial for investigating the geological properties of seafloor sediments.
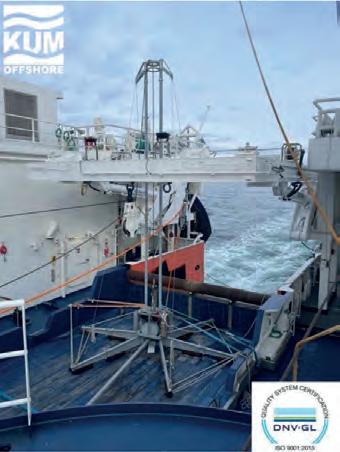
KUMO was engaged in the four-week survey with four of its staff aboard the 61m
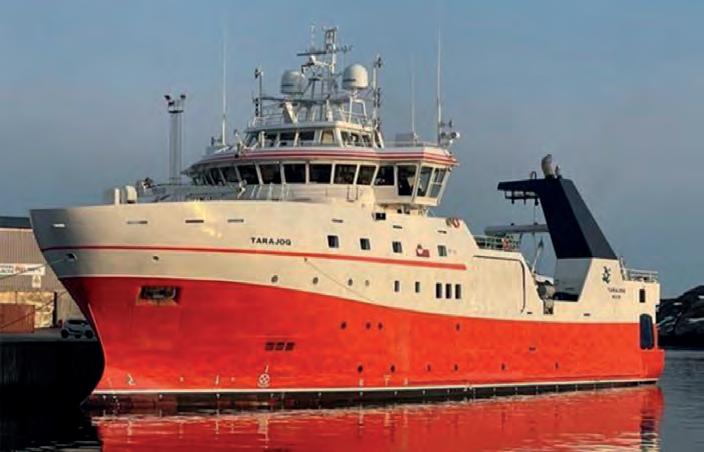
research vessel, R/V Tarajoq, to operate equipment and provide support. The ice-reinforced ship is operated by the Greenland Institute of Natural Resources and is specially designed for scientific work in arctic waters, with advanced navigation, communications and acoustic equipment, cranes, hoists and laboratories. The ship is also equipped with an A-frame that was used to deploy the vibrocorer to the sea bed.
Hitting hard rock
KUMO’s projects typically take place in shallower, nearshore waters; however, during this expedition, the location was remote and the water depth varied between 90m and 200m. This is the first time that the KUMO team has worked in Greenland’s waters and conditions were extreme. As such, the team faced some challenges throughout the expedition.
“No two projects are the same, and while we can anticipate what conditions will be like, we can never be certain until we are in situ. There were a few challenges in this project, including the geology, the weather and the sea state,” said Ivan Starostin, director at KUMO Europe. “Thanks to our highly qualified team, we were able to overcome any issues with our quick thinking and ingenuity, and to adapt our practices while out at sea. On a typical expedition, we would expect some mud, sand, gravel and rocks and experience up to 3.5 tons of pull when extracting the core,” explained Ivan, “but the geology of Greenland means there is a glacial sediment called till present, which is like a very wet and dense cement mix. This is the first time that we have worked with till sediments, and we were experiencing eight to nine tons of pull while trying to extract the core. This had an adverse impact on the top plug of the
Issue 3 2023 36
Vibrocorer on the deck in transit in fjord. RV Tarajoq.
vibrocorer and the catcher, which struggled to resist the pressure, and we needed to rectify this immediately.”
Overcoming challenges
As a service provider, KUMO has vast experience in not simply supplying equipment, but working closely with its clients to deliver their projects and overcome any challenges. For example, with no heave compensators on the A-frame, the team needed a way to bring the cores up under changing levels of pull force. They were able to achieve this by redesigning the shackles and top plug.
“We replaced the existing shackles with heavy-duty 16-ton shackles. However, because these shackles are much larger than
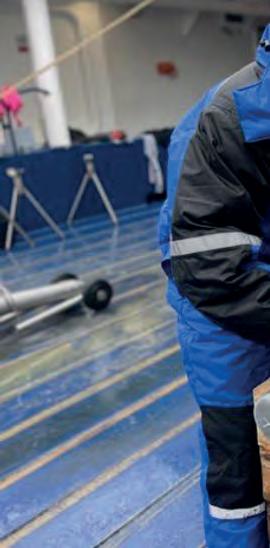
the previous ones, there was a risk of them catching on the equipment. We engineered on the fly and welded preventers to avoid any damage and bring the cores up safely and intact,” continued Ivan.
Operating in extreme weather
The weather conditions and resulting sea swell also posed a challenge. The team was operating in forces of up to 7 Beaufort and 3.5m waves, which created issues with tension on the winch. The KUMO team was able to solve this by adapting the extraction procedure to ensure a constant tension on the winch to limit the pull force. They also established a more responsive communication method between the winch and the vibrocorer operators, resulting in less extraction force needed and a reduced risk of equipment damage.
Successful expedition
Despite the harsh conditions of the geology and the weather, a total of 79 cores were taken. These cores were cut into 1.4m lengths and placed in a container for further
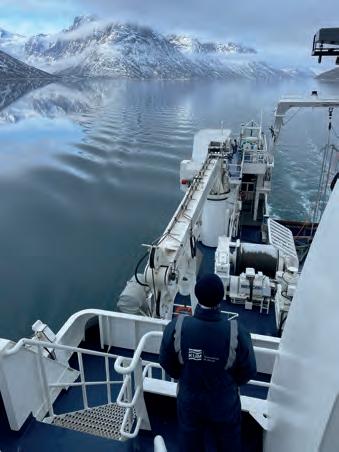
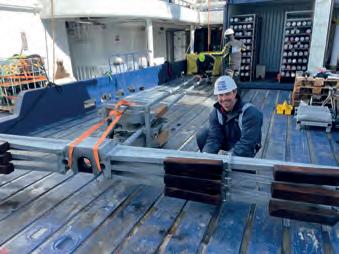
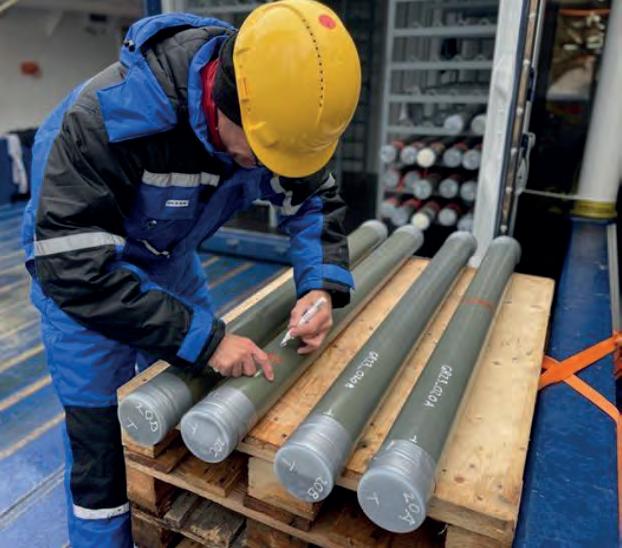
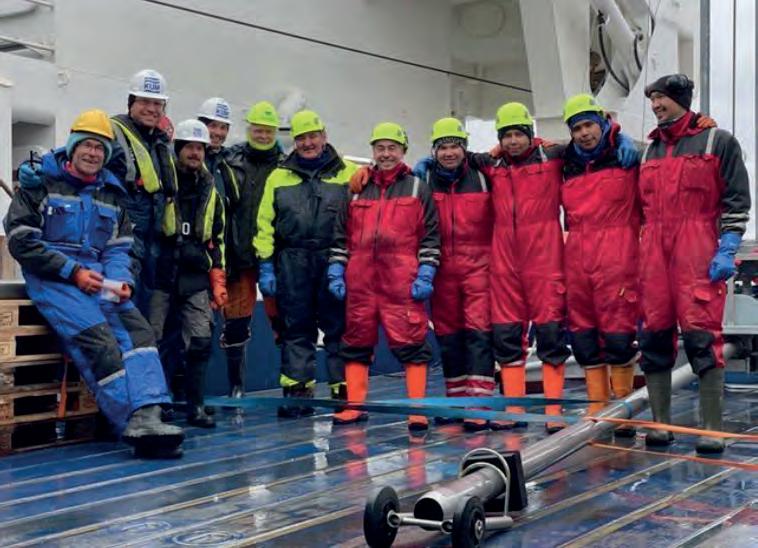
analysis on dry land. GEUS was impressed with the way in which the KUMO team worked to resolve challenges.
“We are incredibly pleased with the outcome of the project and how our team overcame the challenges, working efficiently to obtain a high volume of samples in just four weeks,” concluded Ivan. “Thanks to the clever thinking and robust vibrocorer equipment, this has been a successful expedition.”
KUMO’s vibrocorer was originally developed by MED-C in Rostock, Germany, and has been successfully used in projects worldwide since 1989. The equipment has been continuously developed and improved upon, and with MED-C becoming part of KUM Group of Companies in 2022, the vibrocoring service has reached new heights.
P: +44 (0)122 4953078
E: sales@kumoffshore.com
W: www.kumoffshore.com
Sponsored article Issue 3 2023 37
KUMO coring team and Trajoq deck crew.
Logging in new core samples.
Investigating abandoned munitions on the seabed
North Sea wrecks: toxic legacies of war
By Bart De Smet, Flanders Marine Institute, Belgium
Some 290 shipwrecks lie in the Belgian part of the North Sea alone, with probably more than 1,000 in the entire North Sea, many of them silent witnesses to the two world wars. Until recently, the environmental impact of these wrecks was largely unknown and, as far as the presence of munitions is concerned, they represented a true Pandora’s box. The North Sea Wrecks project has changed this. Researchers examined the munitions and the possible release of toxic substances from a few selected wrecks in the North Sea. Are these wrecks really leaving us a toxic legacy of war, or are we worrying about nothing? In this article, we try to discover the answer.
On 11 February 1942, with World War II showing no sign of abating, German naval forces launched a risky operation in the English Channel. The battleships Scharnhorst and Gneisenau and the heavy cruiser Prinz Eugen needed to return from the French port of Brest to their German home ports as soon as possible. They were to be assisted in this
by numerous escort ships. The riskiest but shortest route was through the sea strait between England and France, and the Germans decided to take their chances. On 13 February, they managed to pilot the ships – not entirely unscathed – into German waters: a successful military operation that came to be known as Operation Cerberus, or the Channel Dash.
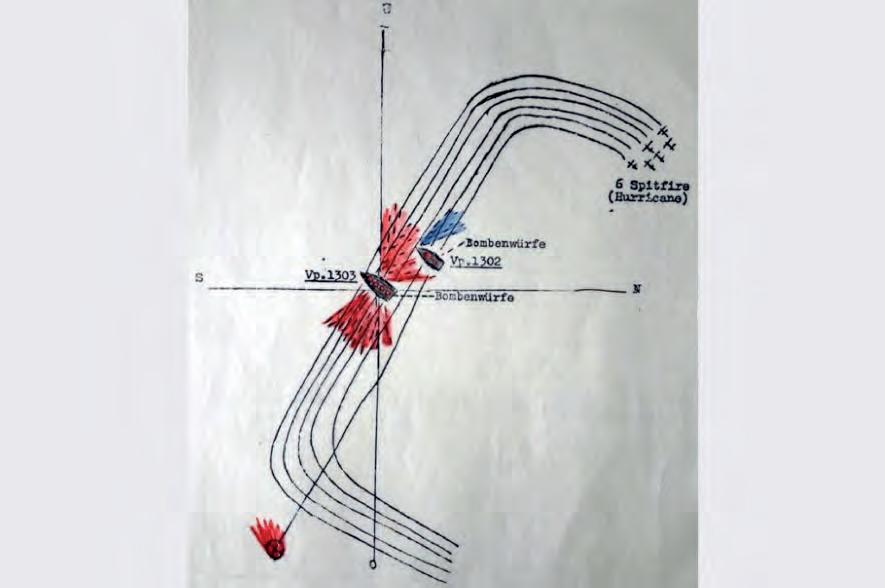
What the history books fail to report, however, is that one of the escort ships fared less well. In the afternoon of 12 February, six British Air Force bombers took the German patrol boat V-1302 John Mahn under fire off the coast of Ostend. The first bomb struck the vessel midships and exploded in the boiler room. The second, fatal bomb hit the stern tube and sank the John Mahn in barely half a minute. Although 27 crew members were rescued by other patrol boats and vessels of the 2nd Mine Sweeper Flotilla, 11 sailors were missing and presumed dead.
The wreck of the John Mahn still lies some 35 metres down at the bottom of the Belgian part of the North Sea. Apart from the missing superstructure and a large crack on the port side, the wreck is largely intact. The John Mahn is just one of many ships to have met such an inglorious end, as it is estimated that there are some 290 shipwrecks on the Belgian North Sea floor, many of them silent witnesses to the two world wars. However, the cultural heritage value of these shipwrecks and the stories of human suffering that they represent mean that many of them still arouse fascination, decades later.
Unknown environmental impact
Wrecks at the bottom of the sea are relatively well known for their potential to increase biodiversity in an otherwise sandy environment. Slowly, the wooden or steel structure becomes buried under a layer of sand and overgrown with a variety of algae and animals such as sponges and anemones; species that would not naturally occur in the area due to the lack of a hard substrate. Wrecks therefore create biodiversity hotspots.
Less well known are the locations, identities and conditions of these shipwrecks, along with their negative environmental impacts due to the oil, lubricants, paints, fire extinguishing materials, metals, bombs and cargo left in them. Up to now, we have only been able to guess at the effect of these on fauna and flora.
Issue 3 2023 38
Drawing of the attack by six British Air Force bombers on the German patrol boat V-1302 John Mahn. From the report by Leutnant zur See und Kommandant Telgmann. (Source: report by Leutnant zur See und Kommandant Telgmann of the John Mahn)
Oil pollution is one well-studied environmental issue, with examples such as the wreck of the US battleship Arizona at the bottom of Pearl Harbor in Hawaii, which is still leaking oil since sinking in World War II, 82 years ago. Other wrecks may not leak oil straight away, but come to do so in time due to corrosion of the oil tanks on board. While pumping the oil out of shipwrecks can avoid such unpleasant surprises, it is a costly operation, and there are simply too many wrecks for this to be a feasible option: 8,569 potentially polluting wrecks lie on the seabed worldwide. Together, these wrecks are estimated to contain between 2.5 and 20.4 million tons of oil. To give an idea of what this means, it is about 2 to 20 times the amount of oil that was released during the Deepwater Horizon drilling rig disaster in the Gulf of Mexico in 2010 (about 1.1 million tons of leaked oil).
Bart De Smet is a marine biologist and the senior science officer for science communications at the Flanders Marine Institute (VLIZ). The institute’s primary mission is to enhance science-based knowledge about our coasts, seas and oceans and to disseminate this knowledge as widely as possible. De Smet earned his Bachelor’s degree in Biology from Ghent University, Belgium, and completed his Master of Science in Marine Biodiversity and Conservation jointly at Ghent University and Klaipėda University, Lithuania. Furthermore, he has served as a PhD student and subsequently as a postdoctoral researcher at Ghent University.
condition? How much munition is left on board? Is it still dangerous and is it leaking? And, how can we best deal with these wrecks and their toxic cargoes? These are all questions that, until recently, there were no answers to. Answers needed to be found, however, especially considering the blue economy activities currently being developed in the North Sea (e.g. wind farms, aquaculture, coastal defence). A transnational approach was therefore needed.
North Sea Wrecks project
The EU-funded North Sea Wrecks project was initiated in 2018 and united nine partners from Belgium, the Netherlands, Germany, Denmark and Norway. The project aimed to develop a tool to estimate the potential environmental impact of wrecks and war wrecks before commencing sea-related activities.
To study the presence of munitions and the potential leakage and spread of toxic substances, the researchers focused on 15 case studies selected from over 1,000 known shipwrecks in the North Sea region.
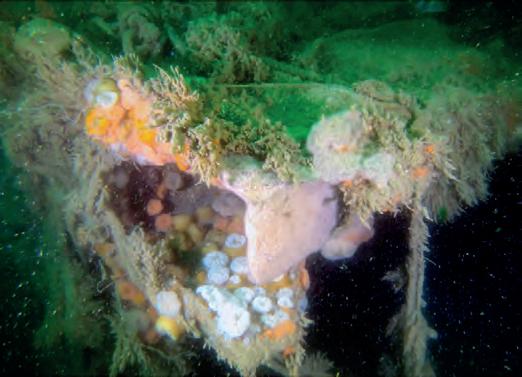
As well as oil, sunken ships can contain coal, lubricants, anti-fouling paint and other chemicals needed for ship operations, as well as hazardous cargo. The most well-known example of the latter is that of submarine U-864, which attempted to smuggle a cargo of 67 tons of mercury from Germany to Japan. The submarine was sunk on 9 February 1945 near Bergen in Norway, where it now lies at the bottom of a 150-metre-deep fjord. It is impossible to remove the mercury on board due to the submarine’s position on the edge of the continental slope, as disrupting the wreck could worsen the problem rather than fix it, which of course needs to be avoided at all costs.
Finally, there is the issue of war munition. Almost all war wrecks have munition on board to a greater or lesser extent, but what is its
The Flanders Marine Institute (VLIZ) conducted a preliminary study of the 290 known wrecks in the Belgian North Sea, from which it selected three for further research. The selection criteria were based on archive material and information on the location, depth, condition, legal protection status and accessibility of the shipwrecks, as well as on the type of wreck and munition. The selected wrecks were the JohnMahn (a refitted fishing trawler that sank right in the middle of the Belgian North Sea), the SS EmpireBlessing (a Liberty ship that sank with a full cargo of munition off the coast of Knokke and was then blown up and levelled after WWII) and the HMS Basilisk (a British destroyer that took part in the evacuation of Dunkirk in WWII –Operation Dynamo – before sinking off the coast of Koksijde).
The researchers collected water and sediment samples from around the wrecks to examine toxicity, and divers placed mussels
Issue 3 2023 39 Feature
The frilled anemone lives on the torn deck plates of the sunken John Mahn: a common anemone on shipwrecks and offshore structures in the Belgian North Sea. (Image courtesy: VLIZ | Sven Van Haelst)
About the author
Almost all war wrecks have munition on board to a greater or lesser extent, but what is its condition?
in the vicinity of the wrecks to be used as bioindicators: organisms that provide information about, in this case, the water quality. Mussels are filter feeders, which means that they create a flow of water over their gills and filter out small particles and substances, which they feed on. If toxic substances are leaking from the munitions in a wreck, the researchers are very likely to find them in the mussel flesh after the mussels have been feeding in the vicinity of the wreck for several months. The researchers also analysed the tissues of fish sheltering in or around the wreck.
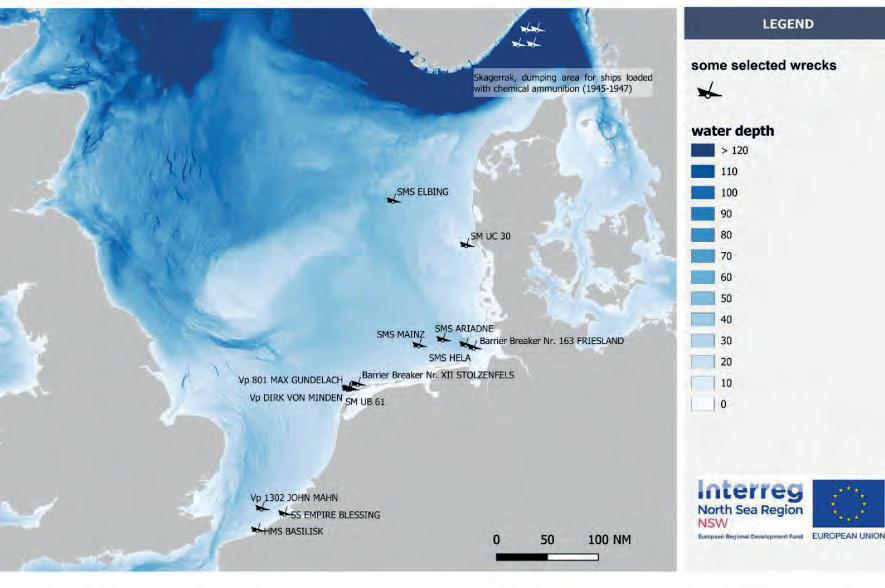
harmful to humans and animals, as the first mild symptoms of chronic toxicity are observed from about one microgram per kilogram. As alarming as the toxic leaks may seem, there is therefore no cause for alarm.
Furthermore, studies of the bacterial communities at the wrecks show that the wrecks are in fact ‘self-cleaning’, as the community of microorganisms around wrecks comprises many families of bacteria that naturally break down the toxic substances. Major human intervention to clean up these war wrecks therefore seems to be unnecessary for now.
The wrecks in the Belgian part of the North Sea are not an isolated case, as wrecks surveyed in the waters of other North Sea countries also harbour considerable cargoes of munition and are also leaking toxic substances.
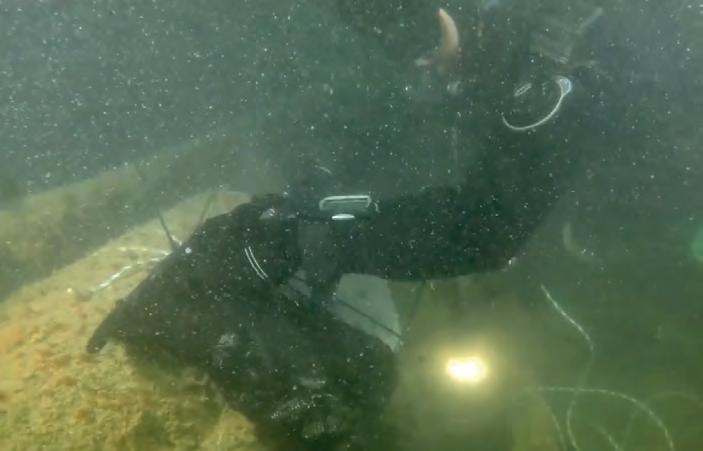
New insights
As it turned out, two of the three wrecks still contained munitions. Only in the heavily battered wreck of the SS Empire Blessing were no munitions found. The John Mahn and the HMS Basilisk are estimated to still contain one and two tons of munitions, respectively, which are leaking due to corrosion of the metal casings under the influence of their long exposure to salt water. The researchers found elevated concentrations of the carcinogenic explosive TNT (trinitrotoluene) and its degradation products in the water, the sediment and the flesh of the sampled mussels and fish.
The question then quickly arises: is this something we need to worry about? The concentrations measured (a few nanograms per kilogram, or one billionth of a gram per kilogram) were well below levels that are
Issue 3 2023 40
Map showing the shipwrecks selected for research in the North Sea Wrecks project. (Image courtesy: AmuCad.org / north.io)
Scientific divers from VLIZ take samples from the wreck of the patrol boat V-1302 John Mahn at a depth of 35 metres in the Belgian part of the North Sea. As well as collecting sediment and water samples, they released mussels that act as bioindicators of the water quality around the wreck. (Image courtesy: VLIZ | Sven Van Haelst)
It is clear that, 80 years after the last world war ended, many tons of munitions are still leaking in and on the seabed
Risk assessment
The researchers fed all the data collected –from properties of the wreck, hydrological models and observations by divers to data on human activities around the wreck – into an application: a tool to help policymakers conduct a risk assessment of the impact of a wreck. Questions that the tool can help to answer include: “What is the likelihood of a particular wreck releasing hazardous substances into the environment?” and: “Which wrecks are potentially the most polluting and require the most attention?” The extensive round of testing and presentation of the risk assessment tool to stakeholders has been completed, so that the application is now ready for wider use.
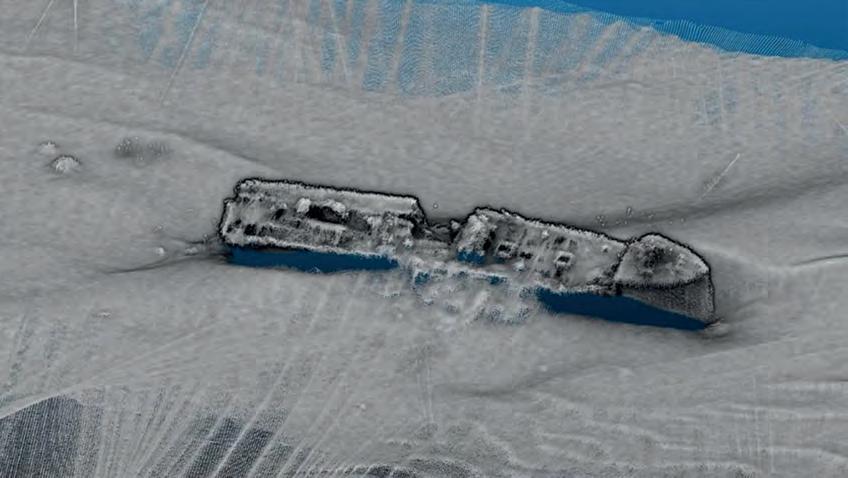
The approach has meanwhile been embraced by OSPAR, an organization that aims to protect the marine environment in the north-east Atlantic Ocean (including the North Sea) through international cooperation.
What does the future hold?
North Sea Wrecks is the first project to carry out detailed research at the scale of the North Sea into the impact of the munitions still present in war wrecks on the bottom of the North Sea. It is clear that, 80 years after the last world war ended, many tons of munitions are still leaking in and on the seabed; a previously unknown and unstudied environmental risk.
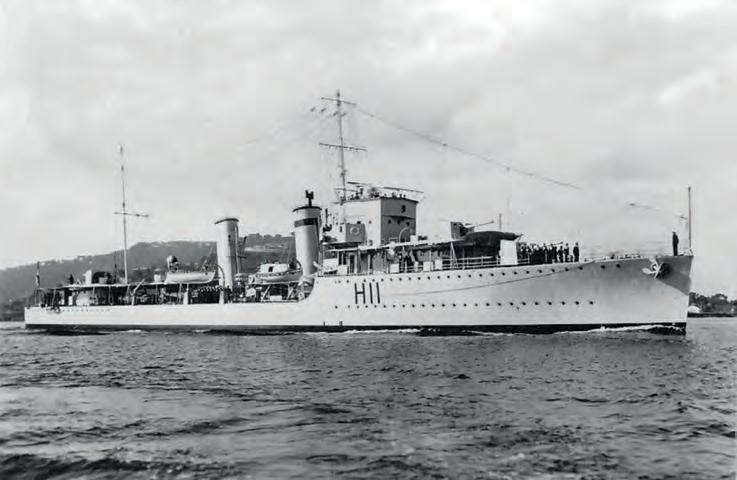
Even though current concentrations are too low to be alarming, close monitoring and further investigation of these war wrecks are imperative, as is a plan of action should a problem arise. To address this, the follow-up project REMARCO (Remediation, Management, Monitoring and Cooperation addressing North Sea UXO) was recently approved by the EU. Led by the Alfred Wegener Institute for Polar and Marine Research, the Flanders Marine Institute (VLIZ) and the Royal Belgian Institute of Natural Sciences (OD Nature) will collaborate with various international partners to develop better detection techniques for munition leaks and to explore strategies to combat pollution caused by war wrecks.
More information
The North Sea Wrecks project was funded under Priority 3 of the Interreg North Sea Region Programme, which works to protect the environment and ensure the sustainable management of the North Sea.
More information can be found on the Interreg North Sea Region website: https://northsearegion.eu/nsw/about.
Issue 3 2023 41 Feature
The wreck of the John Mahn is situated at a depth of 35 metres on the floor of the North Sea off the coast of Belgium, depicted here in a sonar image. (Image courtesy: VLIZ)
This photograph captures the Royal Navy destroyer HMS Basilisk (H11) in the serene waters of the Mediterranean Sea on 21 October 1937.


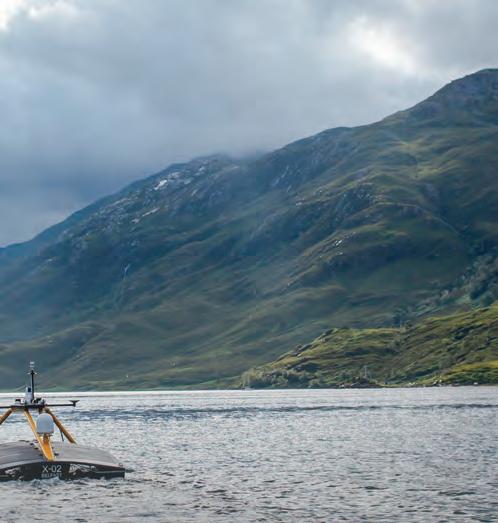
Making manual boulder detection a thing of the past
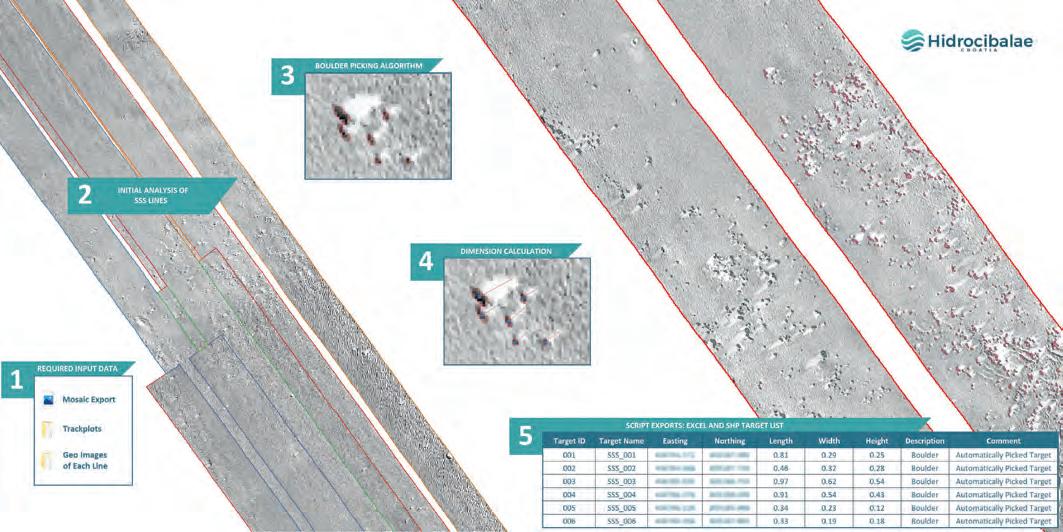
An automated data processing approach to boulder detection
By Dino Dragun, Srećko Kajić and Andrijana Horvat, Hidrocibalae, Croatia
Rapid technological advancements in AI, machine learning and automation urge the offshore industry to keep up to date with innovations and use them to make data acquisition and data processing more effective. Ever-growing datasets and ever-tightening deadlines make each time-saving solution worth its weight in gold. With this in mind, this article presents an effort to join the quest for data processing acceleration, with a solution for automated boulder detection on multibeam echosounder and side-scan sonar data.
Artificial intelligence, machine learning and automation have become major areas of research and development in almost every field or industry, and the hydrographic industry is no exception. Looking at the results of Hydro International’s most recent yearly survey: 15% of the participants consider machine learning and AI as the
most influential driver of innovation in hydrography in the near future, 33% are reading up on it and 24% are developing solutions. Such results clearly demonstrate that the industry is starting to realize the importance of such advances.
Together with the advances in technology, an upturn in renewable energy sources and blue economy investments are causing increased industry demands. Although a cause for optimism, this tendency has a flip side. Scopes and dataset sizes increase in parallel with industry demands, but project time frames do not follow the same trend. Thus, time – along
Issue 3 2023 43 Feature
Figure 1: Automated boulder detection workflow.
with the associated cost – becomes an ever more essential resource for the hydrographic industry. Consequently, R&D solutions for the automation of laborious manual processes are crucial to the industry’s progress in terms of data processing and management. The need for automation to enhance efficiency becomes evident, for example, in situations where ten data processors spend months manually detecting boulders on side-scan sonar or multibeam echosounder data or invest many hours in manually adjusting geological profiles.
At Hidrocibalae, a marine geophysical data centre, there is a strong focus on strategic development in automated processing and smart data management solutions. This encompasses various tasks, from processing large datasets to handling exports, events and listings. It is crucial to maintain this approach and way of thinking to ensure continuous progress and efficiency in managing and processing data.
Automated data processing
Data processing software plays a significant role in achieving a high-quality and efficient approach to data processing, aiming to maximize effectiveness. Examples of such automatable processes
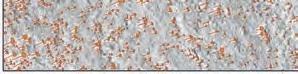
are sediment classification, detection of boulders’ three dimensions and pipeline eventing which, the possibility of their automation notwithstanding, remain primarily conducted through manual labour. The key reason is the uncertainty of the data quality obtained by automated processes, which begs the question: in data processing, can automation surpass human intervention in terms of the resulting data quality?
On the one hand, the mathematical approach utilized in the automated methods can be considered more reliable, as it avoids the inconsistencies caused by differing personal interpretations or survey variations. On the other hand, no matter how reliable and efficient any automated tool is, human intervention is a fundamental part of this process; a paradigm which seems to be here to stay, despite advancements in automation.
The human part of automation
The human role in automated data processing is that of quality control and assurance. Of course, such a role, although significantly less time-consuming, requires the operators to be trained and empowered to perform structural and quality analysis of the automated solutions, becoming IT and data specialists, not just geophysical specialists.
Boulder fields
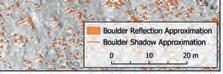
One marine geophysical data processing activity that lends itself to automation is side-scan sonar object detection, a process that is especially slow and cumbersome in boulder field areas.
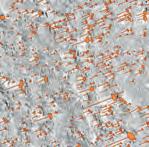
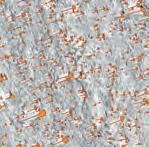
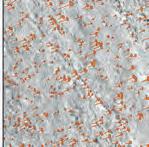
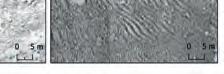
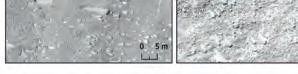
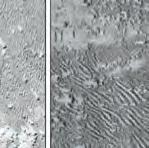
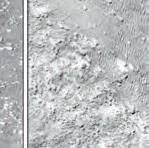
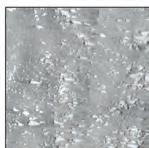
Boulder fields are a seabed morphological type that consist, as the name suggests, of boulders – rock objects whose size varies from a few tens of centimetres up to several metres. They are found in intertidal and shallow-water areas throughout the world, with their formation tied to a multitude of geological, geomorphological and marine processes. However, the focus of the offshore industry lies primarily on boulder fields of glacial origin, found in high-latitude coastal seas of the northern and southern hemispheres. Boulder fields of such origin primarily consist of eroded glacial till surfaces and morainic material left by glaciers receding during the last glacial period and further eroded by subsequent abrasion.
Automation of boulder detection
Hidrocibalae’s automated boulder detection tool employs a specifically developed algorithm to effectively analyse large amounts of data and quickly and accurately detect and isolate the crucial components of reflections and shadows, which are fundamental for the representation, identification and measurement of boulders in side-scan sonar (SSS) data. The greatest challenge in developing the automated boulder detection tool was enabling the measurement of boulder heights. While the detection and measurement of length and width can be achieved using the SSS mosaic alone, determining the third dimension (height) requires knowledge of the boulder’s distance from the sensor and the sensor’s height above the seabed at the time of data acquisition. To obtain this essential data, the detection process needs to be performed on each individual SSS line, which introduces the need for automated boulder correlation across multiple SSS lines and the potential risk of double detection.
Issue 3 2023 44
Figure 3: Automated detection solution output in the medium-density boulder field.
Figure 2: Example of homogeneous (first image) and heterogeneous (second and third images) seabed areas.
The estimation of the time required for automated boulder detection is based on three main criteria: boulder density, seabed morphology and sedimentation, and total area. The first criterion, boulder density, is classified in three categories: low-density boulder field (100–1,000 boulders per 0.01km²), medium-density boulder field (1,000–3,000 boulders per 0.01km²) and high-density boulder field (>3,000 boulders per 0.01km²).
Seabed forms and sedimentation specifics highly affect the time needed to complete the automation process, where silt and sand flat seabed areas are less time-consuming than heterogeneous seabed areas (e.g. sand ripples area with gravelly sand sediment).
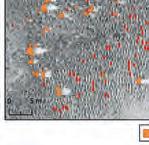

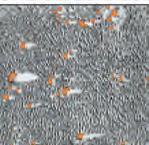
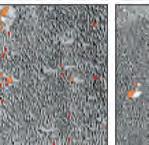
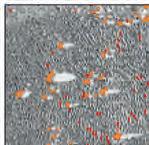
When applying the automated boulder detection solution to the survey dataset, the required time for manual quality control is directly proportional to the total size of the survey area.
Human intervention comes into play right at the start of the boulder detection process. Influenced by numerous factors such as variations in seafloor morphology, sediment types, data quality and detection requirements, the SSS data used for automated boulder detection is not consistent in appearance. Thus, applying a single set of detection parameters that would yield consistent precision and accuracy across different instances is not viable. The solution lies in fine-tuning the detection parameters – illustrated in Figure 3 – done by experts with insight into the data, with the goal of achieving optimal performance based on the specific characteristics of each dataset. This high adaptability of the solution capabilities ensures significant versatility across diverse datasets and sources.
The accuracy of this tool’s detection varies between 90% and 95%, depending on the morphology of the seabed and the data quality. However, since even higher boulder detection accuracy is requisite for most projects, the results of the automated detection are designed with another processing phase in mind – the QC phase. Given that for each boulder, the automated detection yields a polygon that outlines the reflection and a line that outlines the shadow, in the QC phase the processor checks whether the detection results correspond to the real boulder by size and location, making adjustments if necessary. If available, multibeam echosounder data is used as a reference for positioning reliability verification.
About the authors
Dino Dragun is CEO and founder of Hidrocibalae, a marine geophysical data centre, with over ten years of experience in the offshore industry as a data processor/surveyor/party chief, covering geophysical surveys to offshore construction projects. His professional approach focuses on continually seeking advancements in offshore data processing solutions and management.
Srećko Kajić is reporting lead and GIS engineer at Hidrocibalae, with a Master’s in Geography from the University of Zagreb. His professional interests include GIS, cartography, hydrography and spatial planning, with a current focus on the implementation of GIS in marine geophysical reporting and spatial analyses.
Andrijana Horvat is R&D lead geophysicist and GIS specialist at Hidrocibalae, with a Master’s in Geography from the University of Zagreb. Her professional interests include hydrography, GIS, Python programming and cartography, with a current focus on the automation of processes in marine geophysical data processing.

Manual quality control therefore enables the processor to ensure accurate and reliable detection results, adjust the results where needed, and improve the overall quality of the detection process. This is different from detection systems whose direct output is a point shapefile with the location of the boulder and dimensions in an attribute table, or a square that outlines the extent of the boulder, where we have no control over what the system precisely measures and recognizes as a boulder.
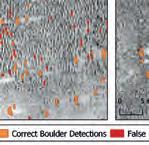
When requested to identify the same boulder from several SSS lines, a specifically developed tool compares boulder position and dimension on different lines and creates average values for one representative boulder. This task is especially challenging inside highdensity boulder fields where boulder reflection varies between the lines.
The automated boulder detection solution has been implemented on several projects worldwide, and through monitoring the process, the ratio of time required for automatic and manual detection based on the number of boulders has been estimated, as shown in Figure
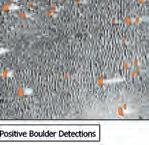
Issue 3 2023 45 Feature
Figure 4: Example of the automated detection difference between default and adjusted parameters.
5. It is evident that the effectiveness of this solution grows exponentially with an increase in the number of boulders. By implementing this solution, valuable time and resources could be saved in the process of detecting boulders on the seabed.

Conclusions


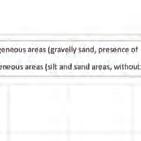
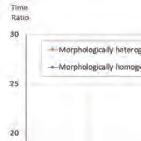
The prospective of making data processing activities more efficient is real. Although automated processing solutions enable faster obtainment of results, recognizing the role of human intervention is crucial, especially in quality control and assurance. This applies particularly to the boulder detection process, which is often a timeconsuming manual process that requires automation intervention to save resources.


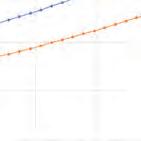
The presented solution is continuously undergoing adjustments and improvements, and this is expected to continue in the foreseeable future. The reasons for these ongoing changes lie in the differences in seabed morphology and data quality across various datasets. What remains unchanged

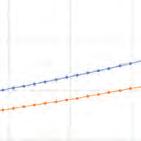
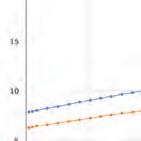

is the demonstrated superiority of this solution in terms of efficiency compared with any manual process or approach. Looking ahead, we anticipate that automated boulder detection tools will become the industry standard in the coming years.
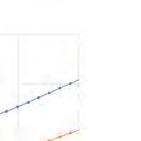
The level of automation will be upgraded in subsequent iterations of the analysis of this workflow. The potential to improve data processing efficiency through automation is significant, and the industry should continue to embrace technological advancements to stay at the forefront of innovation.
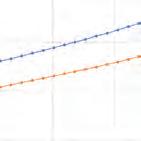
Issue 3 2023 46
Figure 5: The relation of the time ratio between automated and manual boulder detection (automated/manual) in morphologically homogeneous and heterogeneous areas and total number of boulders in the area.
Wet-mate connectors


Recognised throughout the industry Full range of Ethernet connectors More than 40 years proven track record
Denmark Norway Sweden Finland United Kingdom Netherlands Germany Poland France Spain Portugal Italy UAE Israel Turkey Africa USA Canada Mexico Colombia Chile Brazil Singapore China India Pakistan South Korea Japan Taiwan Australia Available worldwide
SMART SUBSEA SOLUTIONS


Delivering data in most adverse conditions: underwater acoustic modems with advanced communication technology and networking


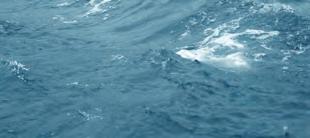
Accurate USBL and LBL positioning of underwater assets
Modem emulator and other cost-saving developer tools
Autonomous surface vehicle for bathymetry, monitoring, search & rescue, and AUV support
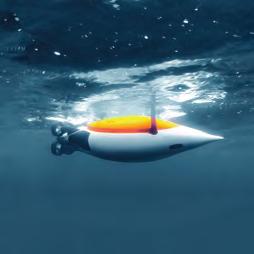
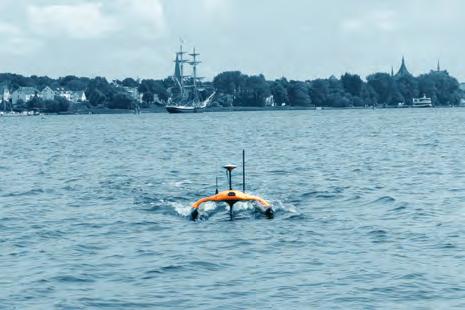


sales@evologics.com sales-us@evologics.com

EvoLogics.de New MULTIBEAM SONAR for the Sonobot 5 vehicle available now!
