8 minute read
Diversity
The ethnic history of the study area sheds light on the origins and development of what the studios has identified as one of the important character-defining features of we have identified as one of the most important character-defining features of the neighborhood’s architectural fabric today: a diversity of residents. Beginning in hte middle of hte nineteenth century, the study of the area was defined by its high degree of racial and ethnic diversity. Several groundbreaking policies enacted during Seth Low's second term as Mayor of Brooklyn illustrate the pressing issue sof race and ethnicicity in the study area even at that time. For example in 1881, Low conditionally allowed the German beer gardens and other “saloons” to remain open during the Sabbath, despite strict prohibitions on other activities.1 The conciliatory move by Low demonstrates the ways in which the multicultural society of Brooklyn at the same time was able to extert a powerful influence on politics. Mayor Low also passed radical education reforms that desegregated schools and provided textbooks to all students for free.2 Again, these policies highlight the fact that the borough as a whole had a significant degree of racial and ethnic diversity at the time. Ultimately however, Seth Low awas considered an unpopular mayor overall, especially after raising property taxs in 1883..3 By 1890, the population density on developed land in Brooklyn was 53.16 persons to the acre, with 82,282 dwellings in the city housing an average occupancy of 9.8 persons.4 As we have observed, the population density of the study area was initially low, but dramatically increased by the turn of the century as a significant number of immigrants settled in the United States. By 1855, 35.1% of Brooklyn residents reported New York as place of birth, a significant drop from the 51.9% just ten years earlier in 1845.5 During the late nineteenth, early twentieth century, the study area was beset by epidemics including yellow fever and cholera beset and decimated the study area population, a loss soon filled by an influx of immigrants from Ireland, Italy, and Germany.6 An especially diverse immigrant and migrant population resided in the study area in the twentieth century and made an important impact on the built environment. The different groups included Germans, Irish, Italians, Syrians, and especially beginning in the 1950s, Puerto Ricans and African Americans. During this period of the mid-twentieth century, the City of New York cleared six blocks in the area below what is now Boerum Hill and replaced the leveled area with affordable public housing projects. These projects included the 1948 Gowanus Houses, and later the 1966, Wyckoff Gardens.7
The significance of the study area is drawn in part from its diverse groups of residents and the influence they had on the architectural fabric of the area. The study area is significant for its reflection of rapidly changing community values within a built environment that in some places has changed very little, especially in terms of scale, materials, and typology. Given the pressures of a growing population and the associated need for housing development, as well as a widening disparity of wealth and income across the country, this small area of Brooklyn presents an important opportunity to look at how the preservation of buildings can and cannot meet the needs of a transitioning community. The study area’s consistency in scale has partially contributed to an inconsistency in the different groups of people who “had to” live here, “chose to” live here, or are “able to afford to” live here (i.e. immigrants, then first waves of “brownstoners,” and then high-income residents of today).
With all of this to consider, the study area presents an opportunity to develop strategies for including historically diverse residents and their different needs within a community that architecturally is restricted--considered underbuilt but also in some areas, legally regulated--in its ability to respond to change.
1 Gerald Kurland, Seth Low: the Reformer in an Urban and Industrial Age. (1971), 149 2 Ibid., 42-3 3 Ibid., 41 4 Vital Statistics of New York City and Brooklyn (1890), 165 5 Jacob Judd, The history of Brooklyn: 1834-1855. (diss. 1959), 21 6 Boerum Hill Historic District Extension Proposal, 9 7 Boerum Hill Historic District Extension Proposal, 11
Foreign - Born Population
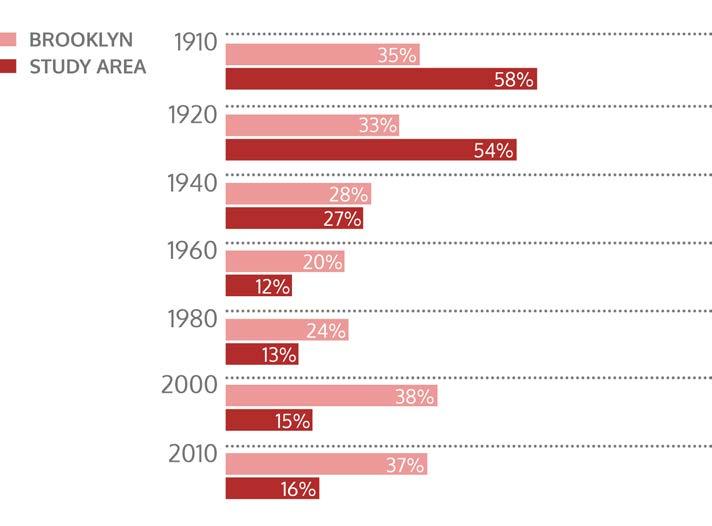
Our statistical analysis revealed important trends in the study area’s population, in terms of country of origin and ethnicity. From 1910-2010 the foreign born composition of the total study area population dropped significantly, from 58% in 1910 to 16% in 2010; yet these numbers did not decrease nearly as significantly across the population of Brooklyn as a whole. The overall population of the study area remained relatively stable during that time, indicating a significant change in the culture of the study area. In other words, the study area has become significantly less diverse, in terms of country of birth, over the past century. The population of Brooklyn as a whole increased by about 50% from 1910-2010. While not surprising given a decline in immigration rates during the 20th century and the establishment of subsequent generations of nativeborn residents of foreign parentage, this trend suggests that significant change occurred in the study area’s population.
Student-created infographic Sources: Social Explorere and US Federal Census tract tables
This studio looked closely at the ethnic composition of the study area by country of birth, and identified several significant ethnic groups based on country of birth, including England, Ireland, Italy, Germany, Sweden, Greater Syria, USA-Puerto Rican, and African American. In order to further examine the impact of all of these different groups on the built environment of the study area, we selected representative buildings from each group to examine closely in terms of use, aesthetics, and alteration over time.
Overview of selected trends in the ethnic diversity of the study area:
Swedish population peaks at around 3% in 1910-1920, but despite this seemingly low number we have found the Swedish community to have had a significant impact on the architectural fabric of the study area.
Irish and Italians were the largest foreign-born groups in 1910 (10% and 8% of study area population respectively). Both are around 8% in 1920, but there was also a 4% “Syrian” foreign-born population in the study area, which represents the peak population of the Syrian community in this area.
By 1950, most foreign-born ethnic groups each make up less than 1% of the study area population, with the exception of Italian (5%)
1960: Italy at 10%, Puerto Rico at 34%
The Black population through 1960 was never more than 5% of the total study area population. But by 1970, the Black population is 24%: all foreign-born ethnic groups that we have been looking at were each below 1% in 1970, except Italians: 2%
For 1980 forward, we looked at data for native born, foreign parentage (defined also as “ancestry”) to start to look at subsequent generations of immigrant communities and ethnic minorities.
1980: native-born, foreign parentage: Ireland 4%, Italy 6%, Puerto Rico 30%, Black 22%
1990: Black population 29%
2000: Ireland 9%, Germany 8%, Italy 8%, England 6%, Puerto Rico 28%, Black 22%
2010: Numbers are about the same, except Puerto Rican population drops to around 12% of the study area population. A return to around 2% Swedish ancestry.
Ethnicity distribution by country of birth (pre-1980) and by ancestry (1980 and later)

Student-created infographic representing the largest ethnic groups in the study area Source: U.S. Federal Census data and SocialExplorer
Languages Spoken at Home
This study also reviewed languages spoken at home in the study area, using the U.S. Federal Census tracts, as another indicator of diversity in the study area. The graphic below indicates that 70% of the study area speaks only English at home, and 19% speaks Spanish or Spanish Creole. The non-English categories do not necessarily represent individuals who don’t speak English as a second language. The remaining 11% of the study area population speaks either Italian, Chinese, Arabic, or “other” languages. These were selected just to give a sense of some of the languages spoken, but really this “other” category includes over 30 different languages with origins all over the world, that are all spoken in the study area.

Challenges
Our studio has addressed the challenges of describing and analyzing the ethnic history and diversity of the study area, and our data collection and analysis is ultimately limited by inconsistencies in how data was compiled historically. The changing and therefore incompatible geographic boundaries of the sanitary districts, census enumeration districts, and census tracts, combined with changes to the data collection categories themselves, have made it difficult to normalize our data over a geographic area that aligns as close as possible with our study area while also being consistent from year to year. Some data, such as the 1930s census tract tables, seem to be incomplete or missing entirely. We have selected geographic boundaries that match each other as closely as possible over time, and we have narrowed our analysis to include to the extent possible only the data categories which we can expect to correspond closely enough with each other over time to yield meaningful results. Student-created infographic Sources: U.S. Federal Census data and SocialExplorer
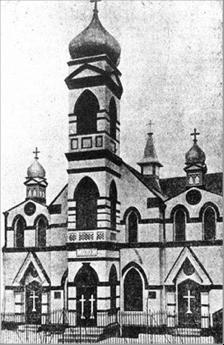
The First Spanish Baptist Church on Pacific Street stands as a powerful example of religious diversity in the study area. Studying its turnover in congregations over the years reveals how this single building was used by a wide range of religious groups that reflect the historic diversity of the study area’s residents. Before it became the First Spanish Baptist church, it was used at different times by the Swedish and Syrian communities as well.
The study area also contains examples of separate buildings which, considered together in such a small area, also indicate religious diversity. Here you can see a synagogue (built 1855) a Buddhist temple (also originally built 1855, altered in 1923), and an Orthodox Christian Church that has been occupied since 1920.
Period
1886-1875
1875-1882
1882-1902
1902-1920
1921-1947
Since 1947 Owner
The First Presbyterian Church of Brooklyn (Old School3
Clinton Street Presbyterian Church
Swedish Evangelical Lutheran Bethlehem Church of Brooklyn
Raphael Hawaweeny Syrian Orthodox Mission of North America
John Wesley Methodist Church of Brooklyn
The First Spanish Baptist Church

First Presbyterian Church Source: Municpal Archives, New York

First Presbyterian Church - 2016 Source: student photo


