10 minute read
Affordability
Redlining
The Federal Housing Administration was established in 1934 to fight against the loss of homeownership due to the Great Depression. The FHA worked with the insurance and banking industries to provide federally insured, long-term, low-interest loans to potential homebuyers. To ensure the security of their investment, the FHA created the Home Owners’ Loan Corporation (HOLC) to set up guidelines. The primary accomplishment of the HOLC was the creation of “residential security maps” in 1935.1 These maps indicate areas that were most likely to receive loans from the HOLC (green zones), to areas that are least likely to receive ones (red zones). The “red lined”areas were usually older districts in the city center, with a substantial presence of minority and immigrant populations. Our study area, including Boerum Hill and Cobble Hill , was coded as a red zone in the 1938 map.
Redlining led to low property value and low rental value. In the 1940s, families living in Boerum Hill and Cobble Hill were paying a moderate monthly rental of $30 to $49 (equivalent to $492 - $803 in 2012). During the same period, houses in Brooklyn Heights (color-coded blue), were worth $50 to $99. In comparison, a prime-location apartment near Central Park was worth more than $1502 (equivalent to $2,458 in 2012, or 5 times the price of an apartment in Boerum or Cobble Hill). The devastating effect of redlining on property values continued for about three decades.

Map of Brooklyn Source: Brooklyn Community Map 1938, NARA II RG 195 Entry 39 Folder “Brooklyn (Kings Co.)” Box 58, National Archives. http://www.urbanoasis.org/ projects/holc-fha/digital-holc-maps/ Rent Levels Across NYC in 1940 Source: Rent Level across NYC based on 1940 Census, Center for Urban Research at CUNY Graduate Center, http:// www.1940snewyork.com/
1 Spellen, Suzanne (2016), “From Redlining to Predatory Lending: A Secret Economic History of Brooklyn,” Brownstoner, March 30, 2016. 2 Rent Level across NYC based on 1940 Census, Center for Urban Research at CUNY Graduate Center, http://www.1940snewyork.com/
In the 1970s, redlining was gradually abandoned. Instead, the accessibility and the architectural heritage of Boerum Hill and Cobble Hill attracted an early group of ‘Brownstoners’. In order to revitalize the disinvested and neglected area, some active residents sought to designate their community as historic districts with the hope of maintaining the historic character of the place while enhancing the property (and rental) values Subsequently, the Cobble Hill Historic District and the Boerum Hill Historic Districts were listed on the New York City Landmark, and the National Register of Historic Places in 1976 and 1983.
Forty years later, the area is one of the most desirable and expensive locations in the city of New York. Consequently, the difference in rental value between Boerum-Cobble Hill and that of Downtown Brooklyn or Manhattan has been largely reduced. The average rent of a one bedroom located at the utmost prime location in Manhattan is only 1.5 times the rent of an apartment in Boerum-Cobble Hill. Meanwhile, the booming real estate market in Boerum-Cobble Hill has caused many former lodging houses, or multi-family, to be converted into million-dollar-single-family homes. As a consequence, there is a fear that the influx of higherincome households will increase property tax, and that high rental rate will price out some residents that were once attracted to the area for its cheap housing prices.


Median 1-bedroom rent across NYC as of Summer 2015 source: O’Brien, Devin, “The Cheapest and Most Expensive Neighborhoods to Rent in NYC this spring,” Zumper, May 20, 2015.
Income
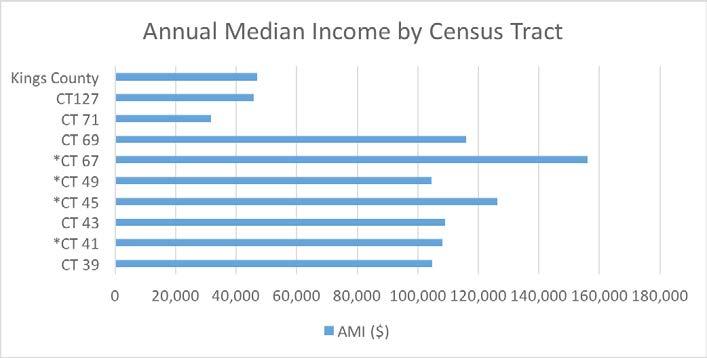
The chart to the right shows annual median household income levels for different sections of the study area and for Kings County as a whole.
Since 1980, the Boerum Hill and Cobble Hill Historic Districts have maintained the highest income levels within the study area, which are both higher than for Kings County as a whole. In contrast, areas to the east and southeast of the Boerum Hill Historic District have the lowest income level and remained lower than the level of Kings County. These areas contain public housing projects, such as Gowanus Houses and Wyckoff Gardens.
Since 1990, the income levels of the area between the Boerum Hill and Cobble Hill historic districts and the area to the northeast of Boerum Hill Historic District have seen a significant increase in income.
However, even if the study area has a relatively high income level in the Brooklyn, the affordability is still a problem here.

Annual Median Household Income Levels Source: Social Explorer, median household income, census tract 39, 41, 43, 45, 49, 67, 69, 71, 127, 1980-2010, http://www.socialexplorer.com/. Accessed April 5, 2016.
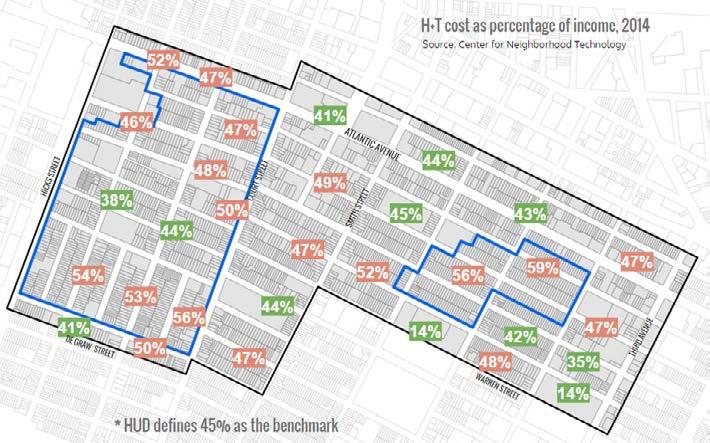
The socio-economic status of the study area is mapped on the area’s annual median income (AMI). The AMI data is based on census tracts. Within the study area, 71 and 127 (Wycoff Public Housing) are the only two census tracts with an AMI lower than the Kings County average. The majority of the other census tracts have an AMI that is double the level of Kings County, and triple that of 67 (part of Cobble Hill Historic District). The highest AMI, at $156,118 (three times that of the Kings County AMI) can be found in Census Tract 67, which corresponds to the southern part of the Cobble Hill Historic District. However, the AMI alone is not capable of measuring the degree of social inclusiveness or exclusiveness of a certain area. The Center of Neighborhood Technology introduced the Housing and Transportation (H+T) Affordability Index map by block groups. Taking transportation (a household’s second-largest expenditure) into consideration, this map marks geographical units with combined housing and transportation costs as a percentage of median household income.

Overall, as shown on the map, the combined H+T cost has a median of 47% of household income in the study area, in which 6% goes into transportation and 41% goes into housing. Perhaps due to the area’s proximity to Manhattan and easy access to public transportation, the typical household’s average transportation cost as a percentage of the income is less than half of the 15% benchmark suggested by The Department of Housing and Urban Development (HUD). However, it seems that the money saved from transportation costs is not enough to relieve the burden of the local residents. The high housing costs largely skew the combined data. As the map below illustrates, only 40% of the 25 block groups in the study area are considered affordable or have combined cost below 45% as defined by HUD. The combined H+T cost in Boerum-Cobble Hill is much higher than that of the Kings County’s typical 37%, and New York City’s typical 39%.
Housing and Transportation
To break down the entire area, the block groups corresponding to Boerum Hill Historic District are the least affordable areas with a combined H+T cost totaling 56% and 59%. The block groups to the north and south ends of the Cobble Hill Historic District have the highest H+T the data, ranging from 46% to 56%. The central part of The Cobble Hill Historic District is the most affordable area in the historic districts with a combined costs at 37% and 44%. The neighborhoods between and surrounding the two historic districts have relatively higher combined costs ranging from 41% to 53%. The two most affordable block groups fall in the boundary of the Gowanus and Wyckoff public houses, with a combined H+T cost less than 14% of the household income, in which housing itself costs less than 8%. The data seems to suggest that the historic district designation may correlate with higher living costs, and have a spillover effect to adjacent neighborhoods. Yet, the status of the historic district is neither the only nor the major factors influencing affordability.1
1 H+T Affordability Index, Center for Neighborhood Technology, http:// htaindex.cnt.org/map/

Affordable Housing Units
In the study area, there are 189 structures providing about 3,500 affordable housing units. The two properties developed with Low-Income Housing Tax Credits (LIHTC), the YWCA and the Muhlenberg Residence are midway houses providing 480 housing units while the two public housing projects provide 404 income-restricted units.1 The majority of affordable housing units are rent regulated buildings that provide the remainder of the 2,600 units. Among them, 39.7% percent are located inside the two historic districts, with 69 buildings in Cobble Hill, and 9 buildings in Boerum Hill. Despite the seemingly widespread rent regulated buildings, the majority of them are small-scale rowhouses providing 1 to 6 affordable units, the overall number of which is far from sufficient. Comparing the affordability index map with the affordable housing units map, it is obvious that the high living cost of Boerum Hill Historic District coincides with the observation that there are very few affordable housing units (6 structures) currently available within the 7-partial-blocks.
Meanwhile, a high concentration of rent regulated units between Baltic Street and Kane Street seem to contribute to a higher affordability (38% and 44%) in the central part of the Cobble Hill Historic District. This would indicated that the variation of the affordability index throughout the entire study area has a strong correlation with the supply and distribution of affordable housing units.

1 Since 2014, the Muhlenberg Corporation gained the full ownership of the low-income supported housing facility associated the Lutheran Social Service. If the corporation sells 510 Atlantic Avenue for conversion to luxury apartments, the Boerum-Cobble Hill area would suffer from more severe social exclusiveness.) Bleeker, Rachael (program director at Lutheran Social Service of New York) Personal Interview. 6 November 2015.
To better understand the demand for affordable housing, a chart showing the distribution of different income groups within the study area was created. As shown, people living in the two public housing areas (Gowanus and Wyckoff) only add up to half of the total population of households making less than $50,000, the annual median income of Kings County. Without rent-regulated units, the other half of those lower-income households would be severely burdened by the high market-rate rental units in Boerum Hill and Cobble Hill. Hence, despite the high concentration of middle and upper-middle class households in the historic district and the area in between, there is still a strong need for affordable housing units in those neighborhoods. Hence, calling for political intervention to preserve and increase the number of affordable housing units is necessary to ensure the quality of life for those making less than $50,000.
In conclusion, while the affordability index varies among all the nine census tracts of the study area, Boerum-Cobble Hill in general is less affordable for those making a median income of the census tract they live in. The status of historic districts may increase the rent/property value of the area while creating spillover effect in nearby neighborhoods. However, it is the supply and distribution of the affordable housing units rather than the designation of historic district that has more influential impact on the affordability of each census tract. Additionally, even though the study area has a high concentration of higher-income households, it is not socially exclusive, and there is socio-economic diversity. Since there is a shortage of affordable housings units overall, especially in the Boerum Hill Historic District, in order to retain the longtime residents and to prevent the potential aggravation of social exclusiveness, the planning and housing departments of the city should encourage more traditional and creative ways of introducing affordable housing units into the BoerumCobble Hill area.

Design break: 357-359 Atlantic Avenue
This site is located on a through lot between Atlantic Avenue and State Street, falls within the Atlantic Avenue Special Zoning District on one half of the lot, making it a challenge to design two different facades with very different requirements.
The first design grappled with issues of affordability in the neighborhood, using Zoning for Quality and Affordability guidelines, while also dealing with the increased height limits permitted in a historically low-scale neighbhoorhood.
The second of these projects dealt with the concept of authenticity and integrity on Atlantic Avenue in reusing the existing one-story buildings and adding new program above them.
See pages 190-210 for complete design projects.
Atlantic Avenue elevation by Ariane Prache Atlantic Avenue rendering by Mayssa Jallad


TITLE


