I J S PT


INTERNATIONAL JOURNAL OF
An Official Publication of A North American Sports Medicine Institute Publication
SPORTS PHYSICAL THERAPY


NOW c. 1994 the original. the best. | visit us at woodway.com BOOST is a positive air-pressure off-weighting treadmill built on a WOODWAY slat-belt base. Learn more by visiting the link below.
has
off-weighting
evolved,
so have we.
One probe. Whole-body imaging.
Deliver precise care. Engage patients with real-time injury monitoring and biofeedback assessment, and guide interventions for accuracy.
Learn more
Rx only (USA). For use by trained healthcare practitioners.
(For UK & EU countries) Butterfly iQ+ is a Class IIa portable ultrasound system designed for ultrasound imaging by trained healthcare professionals. Carefully read and understand all cautions, warnings and operational instructions prior to use.
(For AUS) Butterfly iQ+ is a Class IIa portable ultrasound system designed for ultrasound imaging by trained healthcare professionals. This product is not available for purchase by the general public. Carefully read and understand all cautions, warnings and operational instructions prior to use.
(For CAN) For healthcare professionals only. Réservé aux professionnels de santé. Not all presets, imaging modes and features are available everywhere. Check for availability in your country.

[FREE, ON-DEMAND WEBINAR]
WHAT YOU DON’T KNOW ABOUT ESWT
Extracorporeal Shockwave Therapy (ESWT) is a versatile modality that can be used to treat a variety of musculoskeletal dysfunctions. In this free, on-demand webinar, Dr. Pavel Novak, Director of Science and Technology at Storz Medical AG in Tägerwilen, Switzerland, provides insight that will help you drive positive outcomes with this technology.

Dr. Novak has been involved with the design of shockwave equipment for the past 25 years in addition to conducting other biomedical research for almost 50 years. In that time, he has developed 90 patents and written more than 100 research papers and presentations. Dr. Novak’s extensive experience with shockwave technology, biomedical research, and product development makes for an illuminating discussion. Topics of discussion include the following:
• Identifying an inferior piece of ESWT equipment
• RPW vs FSW
• Mechanisms behind treatment outcomes
• The future of ESWT technology


Register using the QR code above or visit learn.chattanoogarehab.com/ ijspt-apr-23-journal

Copyright © 2023 by DJO, LLC • MKT00-12867 Rev A Individual results may vary. Neither DJO, LLC nor any of the Enovis companies dispense medical advice. The contents of this document do not constitute medical, legal, or any other type of professional advice. Rather, please consult your healthcare professional for information on the courses of treatment, if any, which may be appropriate for you.
IJSPT
international JOURNAL OF SPORTS PHYSICAL THERAPY
Board of Directors / Business Advisory Board
Turner A Blackburn, APTA Life Member, AT-Ret, AOSSM-Ret President
Mary Wilkinson Executive Director
Michael Voight Executive Editor and Publisher
Joe Black, PT, DPT, SCS, ATC
Eric Fernandez
Jay Greenstein, DC
Skip Hunter, PT, ATC-Ret
Russ Paine, PT, DPT
Mike Reinold, PT, DPT, SCS, ATC, CSCS, C-PS
Tim Tyler, PT, ATC
Sports Legacy Advisory Board
Turner A. Blackburn, PT, ATC
George Davies, PT, DPT, MEd, SCS, ATC, LAT, CSCS, PES, FAPTA
Terry Malone, PT, PhD
Bob Mangine, PT
Barb Sanders, PT, PhD
Tim Tyler, PT, ATC
Kevin Wilk, PT, DPT, FAPTA
Staff
Executive Editor/Publisher
Michael L. Voight, PT, DHSc, OCS, SCS, ATC, CSCS Executive Director/Operations and Marketing
Mary Wilkinson
Editor in Chief
Barbara Hoogenboom, PT, EdD, SCS, ATC Managing Editor
Ashley Campbell, PT, DPT, SCS, CSCS
Manuscript Coordinator
Casey Lewis, PTA, ATC
NORTH AMERICAN SPORTS MEDICINE INSTITUTE
Publisher
Contact Information
International Journal of Sports Physical Therapy 6011 Hillsboro Pike
Nashville, TN 37215, US, http://www.ijspt.org
IJSPT is a bimonthly publication, with release dates in February, April, June, August, October and December.
ISSN 2159-2896
Founding Sponsors
Arthrex
Biodex
Butterly IQ
DJO Global
Exertools
Foot Levelers
Hydroworx
Hyperice
Genie Health
Trazer
Woodway
Platinum Sponsors
ATI
Elvation
Gold Sponsors
Hawkgrips
Squid
Structure + Function Education
Winback
IJSPT is an official journal of the International Federation of Sports Physical Therapy (IFSPT) Countries with access to IJSPT as a member benefit:
Argentina
Australia
Austria
Belgium
Bulgaria
Brazil
Cameroon
Canada
Chile
Cyprus
Denmark
Finland
France
Germany
Greece
Hong Kong
Indonesia
Ireland
Israel
Italy
Japan
Luxembourg
The Netherlands
New Zealand
Nigeria
Norway
Portugal
Saudi Arabia
Reach us at www.ifspt.org.
IJSPT is an official journal of the ICCUS Society for Sports Rehabilitation. www.iccus.org


Slovenia
South Africa
South Korea
Spain
Sweden
Switzerland
Thailand
Turkey
United Kingdom
Zambia
PITCHERSANDCATCHERS REPORTING
to ATI’s SVP of Clinical Excellence Chuck Thigpen on IJSPT’s Journal Club Podcast on the throwing athlete
ATI’s newest publication on the development of the throwing athlete


about ATI’s Upper Extremity Throwing Fellowship, which has graduates on 10 MLB sta昀s

LISTENREADLEARN
ACHIEVEMENT. IJSPT 2022 AWARDS


Ashley Cambell, Managing Editor of IJSPT, displays the Arthrex®-IJSPT Best MD-PT Collaboration Manuscript award presented for Isometric Knee Strength is Greater in Individuals who Score Higher on Psychological Readiness to Return to Sport after Primary Anterior Cruciate Ligament Reconstruction at the APTA Combined Sections Meeting in San Diego. Congratulations to our winners!


PROVE YOU ARE THE BEST OF THE BEST.
Join the International Journal of Sports Physical Therapy at OSET 2023 by submitting your best work for its annual research forum!


Abstracts are now being accepted for poster presentations that will be open to all OSET attendees.
Submissions are due by midnight, July 1, 2023. Please send submissions via email to osetsubmissions@ijspt.org Submitters notified by August 1, 2023.
Selected submissions will be displayed in standard poster format at the OSET Conference in Boston, the evening of Friday, September 22, 2023 at the IJSPT Research Forum Reception. All submissions will also appear in the International Journal of Sports Physical Therapy’s October issue.


Please follow the appropriate abstract formatting for the IJSPT found in our author instructions and in the abstract submission guidelines here>https://ijspt.org/oset_ijspt.
If you have any questions, please contact Ashley Campbell at acampbell@ijspt.org.
Help us continue the IJSPT’s tradition of high-quality sports physical therapy research and participate in this special competition!


sales@biodex.com 1-800-224-6339 OPS-4316 07/2022 Copyright © 2022 Mirion Technologies, Inc. or its a�liates. All rights reserved. Mirion, the Mirion logo, and other trade names of Mirion products listed herein are registered trademarks or trademarks of Mirion Technologies, Inc. or its a�liates in the United States and other countries. Third party trademarks mentioned are the property of their respective owners. Learn more about our Sports Medicine Solutions Gold Standard Sports Medicine Solutions From Pre-Op to Return-to-Play Biodex™ advanced rehabilitation technology allows clinicians to quantify performance parameters – before and after an injury occurs. Understand Test Results at a Glance Return-to-Play Reports help to simplify the RTP decision with clear pass/fail results. Detailed reports track recovery and provide the medical team with quantitative data to help with the return-to-play decision

IJSP T
Executive Editor/Publisher
INTERNATIONAL JOURNAL OF SPORTS PHYSICAL THERAPY
Lindsay Becker, PT, DPT, SCS, USAW
Michael L. Voight, PT, DHSc, OCS, SCS, ATC, CSCS
Belmont University
Nashville, Tennessee – USA
Editor in Chief
Barbara Hoogenboom, PT, EdD, SCS, ATC
Grand Valley State University
Grand Rapids, Michigan - USA
Managing Editor
Ashley Campbell, PT, DPT, SCS, CSCS
Nashville Sports Medicine and Orthopaedic Center
Nashville, Tennessee – USA
Manuscript Coordinator
Casey Lewis, PTA, ATC
Nashville Sports Medicine and Orthopaedic Center
Nashville, Tennessee – USA
Executive Director/Marketing
Mary Wilkinson
Indianapolis, Indiana – USA
Editors
Robert Manske PT, DPT, Med, SCS, ATC, CSCS
University of Wichita
Wichita, KS, USA
Terry Grindstaff, PT, PhD, ATC, SCS, CSCS
Creighton University
Omaha, NE, USA
Phil Page PT, PhD, ATC, CSCS
Franciscan University DPT Program
Baton Rouge, LA, USA
Kevin Wilk PT, DPT, FAPTA
Clinical Viewpoint Editor
Champion Sports Medicine
Birmingham, AL, USA
International Editors
Luciana De Michelis Mendonça, PT, PhD
UFVJM
Diamantina, Brazil
Colin Paterson PT, MSc PGCert(Ed), MCSP, RISPT, SFHEA
University of Brighton
Brighton, England, UK
Chris Napier, PT, PhD
Clinical Assistant Professor
University of British Coumbia, Vancouver, BC, Canada
Nicola Phillips, OBE, PT, PhD, FCSP
Professor School of Healthcare Sciences
Cardiff University, Cardiff, Wales, UK
Associate Editors
Eva Ageberg, PT, PhD
Professor, Lund University
Lund, Sweden
Buckeye Performance Golf
Dublin, Ohio, USA
Keelan Enseki, PT, MS, OCS, SCS, ATC
University of Pittsburgh
Pittsburgh, PA, USA
John Heick, PT, PhD, DPT, OCS, NCS, SCS
Northern Arizona University
Flagstaff, AZ, USA
Julie Sandell Jacobsen, MHSc, PhD
VIA University
Aarhus, Denmark
RobRoy L. Martin, PhD, PT, CSCS
Duquesne University
Pittsburgh, PA, USA
Andrea Mosler, PhD, FACP, FASMF
La Trobe Sport and Exercise Medicine Research
Centre, School of Allied Health, Human Services and Sport, La Trobe University
Melbourne, Victoria, Australia
Brandon Schmitt, DPT, ATC
PRO Sports Physical Therapy
Scarsdale, NY, USA
Barry Shafer, PT, DPT Elite Motion Physical Therapy
Arcadia, CA, USA
Laurie Stickler, PT, DHSc, OCS
Grand Valley State University
Grand Rapids, MI, USA
Editorial Board
James Andrews, MD
Andrews Institute & Sports Medicine Center
Gulf Breeze, AL, USA
Amelia (Amy) Arundale, PT, PhD, DPT, SCS
Red Bull/Ichan School of Medicine
Salzburg, Austria/New York, NY, USA
Gary Austin, PT PhD
Belmont University
Nashville, TN, USA
Roald Bahr, MD
Oslo Sports Trauma Research Center
Oslo, Norway
Lane Bailey, PT, PhD
Memorial Hermann IRONMAN Sports Medicine Institute
Houston, Texas, USA
Gül Baltaci, PT,Ph.D. Professor, CKTI, FACSM
Private Guven Hospital
Ankara, Turkey
Asheesh Bedi, MD
University of Michigan
Ann Arbor, MI, USA
EDITORIAL BOARD
David Behm, PhD
Memorial University of Newfoundland
St. John's, Newfoundland, Canada
Barton N. Bishop, PT, DPT, SCS, CSCS
Kaizo Clinical Research Institute
Rockville, Maryland, USA
Mario Bizzini, PhD, PT
Schulthess Clinic Human Performance Lab
Zürich, Switzerland
Joe Black, PT, DPT, SCS, ATC
Total Rehabilitation
Maryville, Tennesse, USA
Turner A. "Tab" Blackburn, APTA Life Member, ATC-Ret, AOSSM-Ret
NASMI
Lanett, AL, USA
Lori Bolgla, PT, PhD, MAcc, ATC
Augusta University
Augusta, Georgia, USA
Matthew Briggs
The Ohio State University
Columbus, OH, USA
Tony Brosky, PT, PhD
Bellarmine University
Louisville, KY, USA
Brian Busconi, MD
UMass Memorial Hospital
Boston, MA, USA
Robert J. Butler, PT, PhD
St. Louis Cardinals
St. Louis, MO, USA
Duane Button, PhD
Memorial University
St. Johns, Newfoundland, Canada
J. W. Thomas Byrd, MD
Nashville Sports Medicine and Orthopaedic Center
Nashville, TN, USA
Lyle Cain, MD
Andrews Institute & Sports Medicine Center
Birmingham, AL, USA
Gary Calabrese, PT, DPT
Cleveland Clinic
Cleveland, Ohio, USA
Meredith Chaput, PT, DPT, SCS
Ohio University
Athens, OH, USA
Rita Chorba, PT, DPT, MAT, SCS, ATC, CSCS
United States Army Special Operations Command
Fort Campbell, KY, USA
John Christoferreti, MD
Texas Health
Dallas, TX, USA
Richard Clark, PT, PhD
Tennessee State University
Nashville, TN, USA
Juan Colado, PT, PhD
University of Valencia
Valencia, Spain
Brian Cole, MD
Midwest Orthopaedics at Rush
Chicago, IL, USA
Ann Cools, PT, PhD
Ghent University
Ghent, Belgium
Andrew Contreras, DPT, SCS
Washington, DC, USA
George Davies, PT, DPT, MEd, SCS, ATC, LAT, CSCS, PES, FAPTA
Georgia Southern University
Savannah, Georgia, USA
Pete Draovich, PT
Jacksonville Jaguars Footbal
Jacksonvile, FL, USA
Jeffrey Dugas, MD
Andrews Institute & Sports Medicine Center
Birmingham, AL, USA
Jiri Dvorak, MD
Schulthess Clinic
Zurich, Switzerland
Todd Ellenbecker
Rehab Plus
Phoenix, AZ, USA
Carolyn Emery, PT, PhD
University of Calgary
Calgary, Alberta, Canada
Ernest Esteve Caupena, PT, PhD
University of Girona
Girona, Spain
Sue Falsone, PT, MS, SCS, ATC, CSCS, COMT
Structure and Function Education and A.T. Still University
Phoenix, Arizona, USA
J. Craig Garrison, PhD, PT, ATC, SCS
Texas Health Sports Medicine
Fort Worth, Texas, USA
Maggie Gebhardt, PT, DPT, OCS, FAAOMPT Fit Core Physical Therapy/Myopain Seminars
Atlanta, GA and Bethesda, MD, USA
Lance Gill, ATC
LG Performance-TPI
Oceanside, CA, USA
Phil Glasgow, PhD, MTh, MRes, MCSP
Sports Institute of Northern Ireland
Belfast, Northern Ireland, UK
Robert S. Gray, MS, AT
Cleveland Clinic Sports Health
Cleveland, Ohio, USA
Jay Greenstein, DC
Kaizo Health
Baltimore, MD, USA
EDITORIAL BOARD
Martin Hagglund, PT PhD
Linkoping University
Linkoping, Sweden
Allen Hardin, PT, SCS, ATC, CSCS
University of Texas
Austin, TX, USA
Richard Hawkins, MD
Professor of surgery, University of South Carolina
Adjunct Professor, Clemson University
Principal, Steadman Hawkins, Greenville and Denver (CU)
John D.Heick, PT, PhD, DPT, OCS, NCS, SCS
Northern Arizona University
Flagstaff, AZ, USA
Tim Hewett, PhD
Hewett Consulting
Minneapolis, Minnesota, USA
Per Hølmich, MD
Copenhagen University Hospital
Copenhagen, Denmark
Kara Mae Hughes, PT, DPT, CSCS
Wolfe PT
Nashville, TN, USA
Lasse Ishøi, PT, MSc
Sports Orthopedic Research Center
Copenhagen University Hospital
Hvidovre, Denmark
Jon Karlsson, MD
Sahlgrenska University
Goteborg, Sweden
Brian Kelly, MD Hospital for Special Surgery
New York, NY, USA
Benjamin R. Kivlan, PhD, PT, OCS, SCS
Duquesne University
Pittsburgh, PA, USA
Dave Kohlrieser, PT, DPT, SCS, OCS, CSCS
Ortho One
Columbus, OH, USA
Andre Labbe PT, MOPT
Tulane Institute of Sports Medicine
New Orleans, LA USA
Henning Langberg, PT, PhD
University of Copenhagen
Copenhagen, Denmark
Robert LaPrade, MD
Twin Cities Orthopedics
Edina, MN, USA
Lace Luedke, PT, DPT
University of Wisconsin Oshkosh
Oshkosh, WI, USA
Lenny Macrina, PT, SCS, CSCS, C-PS
Champion Physical Therapy and Performance
Boston, MA, USA
Phillip Malloy, PT, PhD
Arcadia University/Rush University Medical Center
Glenside, PA and Chicago, IL, USA
Terry Malone, PT, EdD, ATC, FAPTA
University of Kentucky
Lexington, KY, USA
Robert Mangine, PT
University of Cincinnati
Cincinnati, OH, USA
Eric McCarty, MD
University of Colorado
Boulder, CO, USA
Ryan P. McGovern, PhD, LAT, ATC
Texas Health Sports Medicine Specialists
Dallas/Fort Worth, Texas, USA
Mal McHugh, PhD
NISMAT
New York, NY, USA
Joseph Miller, PT, DSc, OCS, SCS, CSCS
Pikes Peak Community College
Colorado Springs, CO, USA
Havard Moksnes, PT PhD
Oslo Sports Trauma Research Center
Oslo, Norway
Michael J. Mullaney, PT, SCS
NISMAT
Mullaney & Associates Physical Therapy
New York, NY and Matawan, NJ, USA
Andrew Murray, MD, PhD
European PGA Tour
Edinburgh, Scotland, UK
Andrew Naylor, PT, DPT, SCS
Bellin Health
Green Bay, WI, USA
Stephen Nicholas, MD
NISMAT New York
New York, NY, USA
John O'Donnel, MD
Royal Melbourne Hospital
Melbourne, Australia
Russ Paine, PT
McGovern Medical School
Houston, TX, USA
Snehal Patel, PT, MSPT, SCD
HSS Sports Rehabilitation Institute
New York, NY, USA
Marc Philippon, MD
Steadman-Hawkins Clinic
Vail, CO, USA
Kevin Plancher, MD, MPH, FAAOS
Plancher Orthopedics and Sports Medicine
New York, NY USA
EDITORIAL BOARD
Marisa Pontillo, PT, PhD, DPT, SCS University of Pennsylvania Health System
Philadelphia, PA, USA
Matthew Provencher, MD
Steadman Hawkins Clinic
Vail, CO, USA
Charles E. Rainey, PT, DSc, DPT, MS, OCS, SCS, CSCS, FAAOMPT
United States Public Health Service
Springfield, MO, USA
Alexandre Rambaud, PT PhD
Saint-Etienne, France
Carlo Ramponi, PT Physiotherapist, Kinè Rehabilitation and Orthopaedic Center
Treviso, Italy
Michael Reiman, PT, PhD
Duke University
Durham, NC, USA
Mark F. Reinking, PT, PhD, SCS, ATC Regis University
Denver, CO, USA
Mike Reinold, PT, DPT, SCS, ATC, CSCS, C-PS Champion Physical Therapy and Performance
Boston, MA, USA
Mark Ryan, ATC
Steadman-Hawkins Clinic
Vail, CO, USA
David Sachse, PT, DPT, OCS, SCS USAF
San Antonio, TX, USA
Marc Safran, MD
Stanford University
Palo Alto, CA, USA
Alanna Salituro, PT, DPT, SCS, CSCS
New York Mets
Port Saint Lucie, FL, USA
Mina Samukawa, PT, PhD, AT (JSPO) Hokkaido University
Sapporo, Japan
Barbara Sanders, PT, PhD, FAPTA, Board Certified Sports Physical Therapy Emeritus Professor and Chair, Department of Physical Therapy Texas State University
Round Rock, TX, USA
Felix “Buddy” Savoie, MD, FAAOS
Tulane Institute of Sport Medicine
New Orleans, LA, USA
Teresa Schuemann, PT, DPT, ATC, CSCS, Board Certified Specialist in Sports Physical Therapy Evidence in Motion
Fort Collins, CO, USA
Timothy Sell, PhD, PT, FACSM
Atrium Health Musculoskeletal Institute
Charlotte, NC, USA
Andreas Serner, PT PhD Aspetar Orthopedic and Sports Medicine Hospital
Doha, Qatar
Ellen Shanley, PT, PhD ATI
Spartanburg, SC, USA
Karin Silbernagel, PT, PhD University of Delaware
Newark, DE, USA
Holly Silvers, PT, PhD Velocity Physical Therapy
Los Angeles, CA, USA
Lynn Snyder-Mackler, PT, ScD, FAPTA STAR University of Delaware
Newark, DE, USA
Alston Stubbs, MD
Wake Forest University
Winston-Salem, NC, USA
Amir Takla, B.Phys, Mast.Physio (Manip), A/Prof
Australian Sports Physiotherapy
The University of Melbourne
Melbourne, Australia
Charles Thigpen, PhD, PT, ATC ATI
Spartanburg, SC, USA
Steven Tippett, PT, PhD, ATC, SCS
Bradley University
Peoria, IL, USA
Tim Tyler, PT, ATC NISMAT
New York, NY, USA
Timothy Uhl, PT, PhD, ATC University of Kentucky
Lexington, KY, USA
Bakare Ummukulthoum, PT University of the Witswatersrand
Johannesburg, Gauteng, South Africa
Yuling Leo Wang, PT, PhD
Sun Yat-sen University
Guangzhou, China
Mark D. Weber, PT, PhD, SCS, ATC
Texas Women’s University
Dallas, TX, USA
Richard B. Westrick, PT, DPT, DSc, OCS, SCS
US Army Research Institute
Boston, MA, USA
Chris Wolfe, PT, DPT
Belmont University
Nashville, TN, USA
Tobias Wörner, PT, MSc
Lund University
Stockholm, Sweden
EDITORIAL
The Deceleration Index - Is it the missing link in rehabilitation? Wolfe C, Page P, Voight ML, Norman C.
INTERNATIONAL PERSPECTIVE
285 Alternative Flexibility Training: Do we need alternative methods for improving range of motion? Behm DG, Jose Carlos Aragão-Santos JC, Korooshfard N, Anvar SH.
CLINICAL VIEWPOINT
288 Adductor Strains in Athletes. McHugh MP, Nicholas SJ, Tyler TF.
SCOPING REVIEW
293 Identifying Conservative Interventions for Individuals with Subacromial Pain Syndrome Prior to Undergoing a Subacromial Decompression: A Scoping Review. Signorino JA, Thompson AG, Young JL, et al.
SYSTEMATIC REVIEW
309 The Effect of Percussive Therapy On Musculoskeletal Performance and Experiences of Pain: A Systematic Literature Review. Sams L, Langdown BL, Simons J, et al.
328 Effect of Conservative Interventions For Musculoskeletal Disorders In Preprofessional And Professional Dancers: A Systematic Review. Benoit-Piau J, Benoit-Piau C, Gaudreault N, et al.
ORIGINAL RESEARCH
338 Spatiotemporal Parameters of Gait Among Adolescent Athletes with Concussion When Performing a Visuospatial Cognitive Task. Lowe L, Castillo F, Allen M, et al.
348 Muscle Strength, Oxygen Saturation and Physical Activity in Patients with Chronic Exertional Compartment Syndrome Compared to Asymptomatic Controls. Tønning LU, Mygind-Klavsen B, Kjeldsen T, et al.
358 Landing Technique and Ankle-dorsiflexion Range of Motion are not Associated with the History of Lower Limb Injuries among Youth Basketball Athletes. Borges Gomes LA, da Cunha RA, Dias Lopez A, et al.
368 The Falcon Test: An Observer Agreement Study in Subjects With and Without Anterior Knee Pain. Cibulka M, Wunderlich P, Klockenga H, et al.
375 The Effects of Differing Density of Swim-Training Sessions on Shoulder Range of Motion and Isometric Force Production in National and University Level Swimmers. Yoma M, Herrington L, Mackenzie T.
388 Effects of Repetitive Pitching on Trunk Muscle Endurance and Thoracic and Shoulder Kinematics. Aso T, Kagaya Y.
397 Elbow Injuries Among MLB Pitchers Increased During Covid-19 Disrupted Season, But Not Other Baseball Injuries. Martin C, Palasiewicz J, Grullon J, et al.
409 Upper Quarter Injury Rates and Risk in United States High School Athletes Prior To and During the Prolonged Sport Stoppage. Bullock G, Thigpen C, Prats-Uribe A, et al.
PAGE TITLE
TABLE OF CONTENTS VOLUME 18, NUMBER 2
TABLE OF CONTENTS (continued)
PAGE TITLE
419 Missing the Forest for the Trees: A Lack of Upper Extremity Physical Performance Testing in Sports Physical Therapy.
Gauthier ML, Unverzagt CA, De Michelis Mendonca, L, et al.
431 Diagnostic Imaging for Distal Extremity Injuries in Direct Access Physical Therapy: An Observational Study.
Crowell MS, Mason JS, Morris JB, et al.
439 Self-Movement Screening using the Symmio Application is Reliable and Valid for Identifying Musculoskeletal Risk Factors.
Matsel K, Kirsch J, Netelbeek T, et al.
CASE REPORT
450 The Development of a Return to Performance Pathway Involving A Professional Soccer Player Returning From A Multi-Structural Knee Injury: A Case Report. Mitchell A.
467 The Longitudinal Neurophysiological Adaptation of a Division I Female Lacrosse Player Following Anterior Cruciate Rupture and Repair: A Case Report.
Mangine R, Tersak J, Palmer T, et al.
CLINICAL COMMENTARY
477 Criteria-Based Rehabilitation Following Revision Hip Arthroscopy: A Clinical Commentary.
Leo H, Shelton T, Bradley H.
493 Graft-Specific Surgical and Rehabilitation Considerations for Anterior Cruciate Ligament Reconstruction with the Quadriceps Tendon Autograft.
Solie B, Monsoon J, Larson C.
513 The Implementation of a Return-to-Play Protocol with Standardized Physical Therapy Referrals in a Collegiate Football Program: PT’s Role in Return-to-Play.
Teare-Ketter A, Ebert J, Todd H.
526 Ecological and Specific Evidence-Based Safe Return To Play After Anterior Cruciate Ligament Reconstruction In Soccer Players: A New International Paradigm.
Forelli F, Le Coroller N, Gaspar M, et al.
541 Periodization in Anterior Cruciate Ligament Rehabilitation: New Framework Versus Old Model? A Clinical Commentary.
Kakavas G, Forelli F, Malliaropoulos N, et al.
MSK ULTRASOUND BITES
The Use of MSK Ultrasound in the Evaluation of Elbow Ulnar Collateral Ligament Injuries. Manske RC, Voight ML, Wolfe C, Page P.
VOLUME 18, NUMBER 2
Stimulates the body’s natural repair mechanisms with our non-invasive current. The unique combination of Winback energy & manual treatments offers great rehabilitation results and a faster recovery of muscle and joint functions.


Relieve pain. Free up movement. Speed up healing. Contact us for more information: contact@winback.us www.winback.us Winback America 1133 Westchester Avenue Suite -220 White Plains, NY 10604
SQUID
!"#$%#$&'&(%")*+,'&*-#".'#/'01/2*)".'+1(/+/)01$--*/%


3$0$%&"4.$'"%&'&51"4.$ 677$+#*8$.('"..$8*"#$-'0"*%'"%&'$&$)" 9/':"#$1,'.*;<#:$*;<#,'1$+<"1;$"4.$ =$--'#<"%'/%$')*%5#$'-$#50 !"#$%&'(')%*+,--&)#('+")./,+$*"( !"#$%&"" ()*+,-". /.012 3&4," 5674 8,9*:''''''''''''''''''!"#$4&""':.6; :02) #", ;674 !"#$%&'()$*$+", -#%,)./00)) !#%-"$$1%&'()$*$+", -#%,).200 !"#$%&'($"&#) *+,-./01203 BETTER DESIGN, BETTER OUTCOME
The Belgian Federation os Sports Physical Therapy is pleased to announce that it will host an International congress on Sports Physiotherapy, partnered with the IFSPT, on 22th and 23th of September 2023
It will be a unique opportunity to network with the global community of Sports Physiotherapists. The themes of the congress will be Evidence update on the rehabilitation of sports injuries and Sports-specific rehabilitation. Gain the latest insights in optimising your rehabilitation and return to performance strategies!
An IFSPT General Meeting and networking session will be held the afternoon of 21 September.
The location in Brussels is the Holiday Inn Brussels Airport, with easy access to the airport, trains and the historical city center of Brussels. Registration is now open and special rates for the hotel are currently available. Join us in Brussels this fall!

Supported by IFSPT Platinum Sponsor


Abstract Submissions due 30of April 2023
Submit at abstract@bfsp.be
TOPICS
• Promoting Physical Activity for Health: Strategies
• Ankle Rehabilitation
• Knee Rehabilitation
• Shoulder Rehabilitation
• Rehabilitation of Lower Extremity Tendinopathy
• Muscle Injury Rehabilitation
• The Olympic Athlete in 2024
• Strategic Considerations in Sport-Specific Rehabilitation
EVENTS
• Exposition hall
• Includes breaks and lunch
• Networking dinner and awards ceremony (extra)
• AlfaCare award ceremony
CONFIRMED SPEAKERS
Professor Clare Ardern
Professor Dr. Ann Cools
Suzanne Gard, PT, Msc
Professor Jean-Francois Kaux
Olav Spahl (COIB)
Professor Dr. Bruno Tassignon
Professor Dr. Jo Verschueren
Professor Erik Witvrouw
...and many more!
REGISTER NOW AND RESERVE YOUR ACCOMMODATIONS!
https://www.bfsp.be/nl/Congres/Registration
Welcome to the Fifth World Congress of Sports Physical Therapy, presented by the International Federation of Sports Physical Therapy and NFFs Faggruppe for Idrettsfysioterapi og Aktivitesmedisin!


Join us June 14-15, 2024 in beautiful Oslo, Norway for a fantastic experience, whether you are a novice or experienced clinician. You will meet up with colleagues from all around the world, sharing knowledge, best practices, create networks and have a lot of fun. Enjoy an exciting schedule full of interesting lectures and engaging workshops!
Key Dates:
February 28, 2024
March 28, 2024
May 14, 2024
June 13, 2024
June 14-15, 2024
Abstract Submission
Early Bird Pricing Deadline
Workshops
IFSPT General Meeting
Congress
From Research to Clinical Practice
• 18 practical Workshops
• Oral presentations
• Posters
PRESENTED BY
TITLE SPONSOR SUPPORTED BY


REGISTRATION IS NOW OPEN AT WCSPT.ORG!


sports genie PT genie woRx genie digital physical therapy solution combining remote monitoring and telehealth in-clinic and remote sports/functional assessment and management risk assessment and remote management tools for occupational health revenue staffing challenges accessibility Founded by two prominent orthopedic surgeons and leveraged by two of the top 10 largest orthopedic groups in the country, Genie Health is managed by therapists and industry experts. Featuring a monitored HEP using computer vision, Genie Health offers both fee-for-service and valuebased-care models on the same platform. genie health at a glance... deliver a virtual therapy solution tech platform & optional clinical staff turn-key solution to your organization genie.health | sales@genie.health | 321-558-6855 improve Drive revenue through remote monitoring
u Patients and athletes who walk in a HydroWorx pool are better equipped to transfer what they learn to land than their counterparts who engage in self-directed shallow water walking.

u Aquatic therapy is bene昀cial to achieve threshold-intensity training while lowering the stress on the joints that is caused by land running.
u The bene昀ts of water therapy on the underwater treadmill included reduced soreness, body fat and in昀ammation while also improving muscle mass and strength performance.
u Clinical results show that athletes who participate in water rehabilitation and land-based post rehabilitation have better scores on postural sway, indicating better balance and fewer episodes of re-injury.
u Bene昀ts of hydrotherapy exercises included a lean body mass increase with underwater treadmill training, with gain seen mainly in the legs.
HydroWorx now has options designed for existing facilities and treatment areas. R E S E A R C H S H O W S T H A T A QUA T I C T H E R A P Y E N H A N C E S R E H A B O U T C O M E S . RESEARCH SHOWS THAT AQUATIC THERAPY ENHANCES REHAB OUTCOMES. hydroworx.com | 800.753.9633
THE DECELERATION INDEX IS IT THE MISSING LINK IN REHABILITATION?
Chris Wolfe PT, DPT, OCS, Cert MDT Assistant Professor, Doctor of Physical Therapy Program – Belmont University
Phil Page PT, PhD, ATC, CSCS, FACSM Associate Professor, Doctor of Physical Therapy Program – Franciscan University
Michael Voight PT, DHSc, SCS, OCS, ATC, CSCS, FAPTA Professor, Doctor of Physical Therapy Program – Belmont University
Connor Norman PT, DPT, ATC, SCS, NREMT Director of Sports Medicine-Football, University of Georgia Athletic Association
Peter Draovitch PT, MS, ATC, CSCS Athletic Performance Specialist/Associate Athletic Trainer, Jacksonville Jaguars
ABSTRACT
The ability to decelerate is a key component of any successful rehabilitation program, yet it is often overlooked in favor of more traditional forms of rehabilitation and training. Deceleration, which is defined as the ability to reduce speed or momentum and stop or change direction, can be a key component of successful rehabilitation. The deceleration index is a new metric being used by some physical therapists and rehabilitation specialists to improve patient outcomes. The index is based on the principle that deceleration forces should match those created with acceleration. When patients can quickly and efficiently decelerate during physical activity, they are less likely to experience pain or injury. While the deceleration index is still in its early stages of development, there is promising evidence that it could be the missing link in effective rehabilitation. In this editorial commentary, we'll explore what the deceleration index is and why it is important to the rehabilitation process.
Key Words: Rehabilitation, momentum, deceleration, deceleration index, acceleration.
Rehabilitation providers know that the ability to change direction quickly is essential for the success of any athlete. Performance relies heavily on athletes’ ability to react quickly in sports-specific situations, especially with regards to agility, coordination, and change of direction (COD). Higher intensity accelerations and decelerations are fundamental components of COD movements and are integral to successful performance of COD. To date, change of direction speed (COD-S) tests
are commonly used to identify an athlete’s performance capability and potential risk of injury. To fully assess an athlete’s ability to quickly change direction, a measurable evaluation tool should be used. Unfortunately, change of direction has been measured as a time-to-completion to perform the task. When using the total time for a change of direction test, one assumes that the COD is simply one measure of the athlete’s ability. While this measure can grossly compare left and right COD ability and asymmetry, it gives very little insight into the component parts of COD. COD incorporates key qualities associated with athletic performance such as acceleration, deceleration, and directional changes.1 In addition to these key qualities, the demands of deceleration are increased in athletes that have a greater body mass. This is related to the fact that these athletes achieve a higher level of momentum (mass x velocity) before initiating a deceleration maneuver.
Nimphius et al1 proposed that the change of direction deficit (COD-D) may better distinguish an athlete’s COD ability compared to a simple time-tocompletion in a COD-S test. Specifically, the COD-D is calculated as the difference between COD-S test time and the time taken to cover the same total distance in a linear sprint.2,3 Some investigations have reported that athletes with faster sprint times displayed a larger COD-D,4-8 while others have found the contrary.3,9,10 It is possible that sprint momentum, which is a function of velocity and body mass, may be more closely linked to COD-D because momentum better represents the mechanical
EDITORIAL
demands associated with the COD than velocity alone.11
While most research and training have been directed at increasing an athlete’s power or ability to accelerate, the ability to decelerate may be more important and the missing link in rehabilitation. Deceleration refers to the ability to slow down quickly and efficiently from one activity or movement to another, thereby allowing the individual to adjust their momentum and reduce the risk of injury. The ability to decelerate is a key component of any successful rehabilitation program, yet it is often overlooked in favor of more traditional forms of increasing power and speed. In this paper, we will examine the role deceleration plays in rehabilitation and how the change of direction deficit can impact patient outcomes.
What is Deceleration and Why is it Important for Rehabilitation
Deceleration can be defined as the ability to reduce speed or momentum with respect to time. Harper12 has defined deceleration as a player’s ability to proficiently reduce whole body momentum, within constraints, and in accordance with the specific objectives of the task (i.e., braking force control), while skillfully attenuating and distributing the forces associated with braking (i.e., braking force attenuation). Deceleration is vital in change of direction, and a deficit in this category can have a major impact on the patient's performance. Therefore, deceleration is a fundamental skill that must be developed in order for an athlete’s to successfully complete their rehabilitation program. In addition to having an impact on the athlete’s performance, a decrease in the ability to quickly decelerate or quickly reduce momentum could lead to injury.11 Poor deceleration capability has been identified as a potential mechanism associated with non-contact ACL injury due to the high forces generated during the deceleration.13,14 Additionally, due to the high eccentric braking demands associated with deceleration, this may have the potential to induce muscle damage.15 High deceleration forces may be linked to eccentric induced muscle damage. Researchers have reported elevated levels of indirect muscle damage biomarkers such as creatine kinase (CK) during the 72 hour period following repeated sprints with intense decelerations.16,17
Similar findings have been reported between the number of high-intensity deceleration actions and CK levels post-competitive match play in team sports, such as soccer.18,19 In these instances, the eccentric braking force requirements of deceleration can impart damage on soft-tissue structures through high muscular tensions that can disrupt the structural integrity of the muscle fibers and result in myofibrillar degeneration, which may leak CK into the blood plasma.15,20 If the muscular system has a decreased capacity to attenuate high eccentric loading forces, it may lead to loading beyond the tissues structural capability, causing muscle strain or tearing.
Introducing the Deceleration Index - What is it and why is it important for athletes. Measuring an athlete’s ability to decelerate and accelerate quickly is essential for assessing their performance. Using motion capture devices, force plates, and wearable technology, a clinician can observe changes in speed throughout the movement. The deceleration index is a measure of the rate at which an object slows down relative to its ability to accelerate. This measure has typically been used to describe the braking performance of a vehicle. In the automotive industry, the deceleration index is usually expressed in terms of gravitational-force, where 1 g is the acceleration due to gravity. For example, if a car has a deceleration index of 0.5 g, it means that it can slow down at a rate of 0.5 times the acceleration due to gravity. The higher the deceleration index, the faster the vehicle can stop. The deceleration index can be used to compare the braking performance of different vehicles and to determine whether a vehicle's brakes are operating properly.
In both performance and rehabilitation, it is important to focus on both acceleration and deceleration to ensure that the body is able to move efficiently and safely. Acceleration time is the time it takes for the same athlete to reach their maximum speed from a standing start or a slower pace. In this case, both acceleration and deceleration are determined using speed difference and time. The basic formula for calculating acceleration is the change in velocity (Δv) over the change in
time (Δt), represented by the equation a = Δv/Δt. This allows you to measure how fast velocity changes in meters per second squared (m/s^2). Deceleration can be described as the opposite of acceleration and is the time it takes for an athlete to come to a complete stop after sprinting or performing another high-speed activity. Deceleration can be calculated by dividing the final velocity minus the initial velocity, by the amount of time taken for this drop in velocity. Much like acceleration, deceleration plays a key role in an athlete's change of direction speed. Athletes can increase their COD-S by improving deceleration techniques and learning how to properly use deceleration throughout their movement. Ideally, an individual should be able to create a deceleration force equal to or better than the acceleration force.
By dividing the deceleration time by the acceleration time, the deceleration index provides a measure of how quickly athletes can slow down relative to how quickly they can speed up. The deceleration index refers to the ratio of deceleration (or braking) force to acceleration force in the body's movement patterns. This measurement is important in rehabilitation because it can indicate how well an individual is able to control their movements and prevent injury. A high deceleration index suggests that an individual is able to effectively control their movements and reduce the risk of injury, while a low deceleration index suggests a lack of control and a potential for increased risk of injury. Therefore, tracking the Deceleration Index can help athletes maximize their performance and safety in competition.
The Deceleration Index (DI) offers a straightforward measure of how an athlete's deceleration compares to their acceleration. The deceleration index can be useful in a number of contexts. For example, in team sports, such as basketball or soccer, the ability to quickly decelerate and change direction is often critical for success. A high deceleration index indicates that an athlete is able to slow down quickly and efficiently, which may give them an advantage on the court or field. To improve an athletes' change of direction speed or deficit, employing the DI as a measurable metric ensures that their COD-S development is monitored
through both acceleration and deceleration phases. This can lead to increased performance, improved safety, and higher quality training for athletes.
The DI can be used to monitor an athlete's progress over time. By tracking changes in an athlete's deceleration index, rehabilitation providers can assess the effectiveness of rehabilitation and training programs, thereby identifying identify areas for improvement. For example, if an athlete's DI is consistently low, it may indicate that they need to focus more on eccentric training and deceleration drills in their training. Therefore, the DI can be used as a tool to track progress in rehabilitation and identify areas that need improvement.
With rising numbers of sports injuries, there is growing interest in finding solutions through training and rehabilitation. Going beyond just focusing on power and acceleration in training, deceleration training can be a useful tool in the rehabilitation program. COD-S is an integral aspect of an athlete's performance and having an effective measure of deceleration is key to injury prevention and efficient rehab. The Deceleration Index provides a comprehensive understanding of an individual's ability to decelerate versus their acceleration speed. Using this metric, clinicians are able to observe and measure an individual's ability to slow down as well as speed up, thus providing insight into the risk for injury. While research into its efficacy is still ongoing, initial findings suggest that the Deceleration Index has the ability to improve rehabilitation and may reduce the risk for further injury. The use of this metric could have significant implications for those working in the fields of sports medicine and physical therapy. As such, the Deceleration Index is poised to be the missing link in rehabilitation, allowing practitioners to make informed decisions with regards to an individual's training. With further research, athletes may soon reap the benefits of a reliable way to measure progress during rehabilitation exercises and reduce injury risk.
REFERENCES
1. Nimphius S, Callaghan S, Spiteri T, et al. Change of direction deficit: A more isolated measure of change of direction performance than total 505 time. J Strength Cond Res. 2016;30:3024–3032.
2. Nimphius S, Geib G, Spiteri T, et al. “Change of direction deficit” measurement in division I American football players. J Aust Strength Cond. 2013;21:115–117.
3. Nimphius S, Callaghan SL, Bezodis NE, et al. Change of direction and agility tests: Challenging our current measures of performance. Strength Cond. 2018;40(1):26-38.
4. Loturco I, Nimphius S, Kobal R, et al. Change-of direction deficit in elite young soccer players. The limited relationship between conventional speed and power measures and change-of-direction performance. German J Exerc Sport Res. 2018; 48:228–234.
5. Pereira LA, Nimphius S, Kobal R, et al. Relationship between change of direction, speed, and power in male and female National Olympic Team handball athletes. J Strength Cond Res. 2018;32:2987–2994.
6. Dos’Santos T, Thomas C, Jones PA, et al. Assessing asymmetries in change of direction speed performance: application of change of direction deficit. J Strength Cond Res. 2019;33(11):2953–2961.
7. Freitas TT, Alcaraz PE, Bishop C, et al. Change of direction deficit in national team rugby union players: is there an influence of playing position? Sports. 2018;7:2, 2018.
8. Freitas TT, Alcaraz PE, Calleja-González J, et al. Differences in change of direction speed and deficit between male and female national rugby sevens players [published online ahead of print May 24, 2019]. J Strength Cond Res.
9. Cuthbert M, Thomas C, Dos’Santos T, et al. Application of change of direction deficit to evaluate cutting ability. J Strength Cond Res. 2019; 33:2138–2144.
10. Dos’Santos T, Thomas C, Comfort P, et al. Comparison of change of direction speed performance and asymmetries between team-sport athletes: application of change of direction deficit. Sports. 2018;26:174.
11. Dos’Santos T, Thomas C, Comfort P, et al. The effect of angle and velocity on change of direction biomechanics: an angle-velocity trade-off. Sports Med. 2018;48:2235–2253.
12. Harper DJ, McBurnie AJ, Santos TD, et al. Biomechanical and neuromuscular performance requirements of horizontal deceleration: A review with implications for random intermittent multi-directional sports. Sports Med. 2022; 52(10):2321-2354.
13. Boden BP, Torg JS, Knowles SB, et al. Video analysis of anterior cruciate ligament injury: abnormalities in hip and ankle kinematics. Am J Sports Med. 2009; 37:252–259.
14. Brophy RH, Stepan JG, Silvers HJ, et al. Defending puts the anterior cruciate ligament at risk during soccer: agender-based analysis. Sports Health. 2015; 7:244–249.
15. McBurniel AJ, Harper DJ, Jones PA, et al. Deceleration training in team sports: Another potential ‘vaccine’ for sports-related njury? Sports Med. 2022;52:1–12.
16. Howatson G, Milak A. Exercise-induced muscle damage following a bout of sport specific repeated sprints. J Strength Cond Res. 2009;23:2419–2424.
17. Faulkner J. Multiple sprint exercise with a short deceleration induces muscle damage and performance impairment in young, physically active males. J Athl Enhanc. 2014;3:2.
18. Russell M, Northeast J, Atkinson G, et al. Between-match variability of peak power output and creatine kinase responses to soccer match-play. J Strength Cond Res. 2015;29:2079–2085.
19. Varley I, Lewin R, Needham R, et al. Association between match activity variables, measures of fatigue and neuromuscular performance capacity following elite competitive soccer matches. J Hum Kinet. 2017; 60:93–99.
20. Gastin PB, Hunkin SL, Fahrner B, et al Deceleration, acceleration, and impacts are strong contributors to muscle damage in professional Australian Football. J Strength Cond Res. 2019;33:3374–3383.
ALTERNATIVE FLEXIBILITY TRAINING:DO WE NEED ALTERNATIVE METHODS FOR IMPROVING RANGE OF MOTION?
David G Behm,1 Jose Carlos Aragão-Santos,1,2 Negar Korooshfard,1,3 Saman Hadjizadeh Anvar.1
Introduction
Static stretching was a mainstay for decades for warm-ups before activities, training to increase range of motion (ROM), and rehabilitation from injuries.1 The popularity of static stretching came into question starting in the late 1990s with research reporting acute static stretching-induced performance (i.e., strength, power, balance, sprint speed) decrements.1,2 Recent research has elucidated the weakness of these prior studies, including a lack of ecological validity in terms of static stretching durations, testing times, lack of inclusion of dynamic activities within a warm-up, and nocebo effects among others.1,2 Static stretching produces trivial effects on subsequent performance when less than 60 seconds of stretching per muscle group is incorporated into warm-ups that included dynamic activities.1,2
Static stretching has recently taken another hit, with commentaries suggesting that stretching need not be incorporated as a fitness component like training for muscle strength and endurance, cardiorespiratory endurance, or body composition since activities such as resistance training, foam rolling, and local vibration can similarly increase flexibility.3,4 Though static stretching has fallen out of favour as a warmup activity, it still has merit as a means to increase ROM.
While the popularity of static stretching has diminished, the implementation of dynamic stretching during warm-ups has increased.1,2 Our recent metaanalysis reported no significant differences between static stretching, dynamic stretching, and proprioceptive neuromuscular facilitation (PNF) for increasing ROM.5 There were also no significant differences between stretching at higher or lower intensities. Therefore, though dynamic stretching may be an important warm-up component, it does not offer improvements over static stretching for increasing ROM.
Furthermore, the advent of new techniques to increase ROM does not necessarily mean that these
alternative methods are better. Therefore, this perspective aims to expound on these alternatives.
Resistance Training Effects on Range of Motion
Although it has been known for centuries that resistance training can improve muscle strength, power, and endurance, our recent meta-analysis documented that resistance training (free weights, machines, Pilates, but not calisthenics) can provide similar ROM increases as static stretching.6
Subgroup analyses found that “untrained and sedentary” individuals had significantly higher, large magnitude ROM improvements than the small increases with “trained or active people”. Since resistance training can provide moderate magnitude improvements in ROM, stretching before or after resistance training may not be necessary.
Institutions:
1 School of Human Kinetics and Recreation
Memorial University of Newfoundland
St. John’s, Newfoundland and Labrador, Canada
2 Post-graduate Program of Health Sciences Universidade Federal de Sergipe, Brazil
3 Department of Sport Sciences, Faculties of Educational Science and Psychology
University of Shiraz, Shiraz, Iran
Corresponding Author:
David G Behm
School of Human Kinetics and Recreation
Memorial University of Newfoundland
St. John’s, Newfoundland and Labrador, Canada, A1M 3L8
dbehm@mun.ca
tel: 709-864-3408
fax: 709-864-3979
Acknowledgements:
This study was supported by Dr. David Behm’s Discovery Grant from the Natural Science and Engineering Research Council (NSERC) of Canada
INTERNATIONAL PERSPECTIVE
Foam Rolling Effects on Range of Motion
Foam rolling is a popular modality that acutely and chronically increases ROM7 without performance deficits.8 Our recent meta-analysis concluded that foam rolling had a moderate magnitude effect on ROM with >4 weeks of foam rolling training.7 There were differences between muscles, as foam rolling increased joint ROM when used on the hamstrings and quadriceps, but not ankle dorsiflexion when foam rolling was employed on the triceps surae. We suggested that certain joints with more limited ROM, such as the ankle, or with a prior history of injuries (e.g., sprains) may not be as receptive to foam rolling. Another meta-analysis from our lab revealed no significant ROM differences between single bouts of stretching and foam rolling suggesting they are equally effective.9 As such, the underlying mechanisms of increased stretch tolerance or soft-tissue compliance would likely be similar for static stretching and foam rolling.
Vibration
Local muscle vibration alone and combined with static stretching have been used to increase ROM.1 The research findings are diverse, with vibration (35 Hz with 2 mm amplitude) and static stretching augmenting hamstring flexibility more than static stretching alone, while in other studies, local vibration (i.e., 30 Hz at 4 mm displacement, 44 Hz with 0.1 mm displacement) alone induced similar ROM improvements as static stretching, and was more effective than dynamic stretching.1 The reported mechanisms underlying vibration-induced increases in ROM are increased stretch threshold, augmented blood flow, diminishing muscle viscosity, and decreases in the phasic and static stretch reflexes.1
Don’t count out static stretching (yet)!
For individuals with injuries that do not permit resistance training, another static stretching benefit is increased muscle strength and hypertrophy with daily static stretching of 10-60 minutes.10 Prior reviews have reported that static stretching did not have positive effects to prevent all cause injuries.11
However, our current reviews reported reduced musculotendinous injury incidence, improved balance,11 and reduced pain12 with static stretching as part of the warm-up before an activity or as part of
a separate training program (≥30 seconds per muscle group with a total duration of ≥5 minutes). Unilateral static stretching can also have global body effects with large magnitude ROM increases in non-stretched limbs.1
Summary
Hence, while there are other activities, such as dynamic stretching, PNF, resistance training, foam rolling, and vibration, that can increase ROM, the reported demise of static stretching may be premature, as it provides an array of fitness, performance, and health benefits and can be used in conjunction with other modalities where increased ROM is a priority of the goal activity. While resistance training and foam rolling can contribute to moderate magnitude increases in ROM, individuals who seek greater improvements may wish to augment these activities with stretch training.
References
1. Behm DG. The Science and Physiology of Flexibility and Stretching: Implications and Applications in Sport Performance and Health. Routledge Publishers; 2018:100.
2. Behm DG, Kay AD, Trajano GS, et al. Mechanisms underlying performance impairments following prolonged static stretching without a comprehensive warm-up. Eur J Appl Physiol. 2021;121(1):67-94.
3. Afonso J, Olivares-Jabalera J, Andrade R. Time to move From mandatory stretching? We need to differentiate "Can I?" from "Do I have to?" Front Physiol. 2021;12:714166.
4. Nuzzo JL. The case for retiring flexibility as a major component of physical fitness. Sports Med. 2020;50(5):853-870.
5. Behm DG, Alizadeh S, Daneshjoo A, et al. Acute effects of various stretching techniques on range of motion: A systematic review with meta-analysis. Sports Med. 2023;in press.
6. Alizadeh S, Daneshjoo A, Zahiri A, et al. Resistance training induces improvements in range of motion: A systematic review and meta-analysis. Sports Med. 2023;doi:10.1007/s40279-022-01804-x.
7. Konrad A, Nakamura M, Tilp M, et al. Foam rolling training effects on range of motion: A systematic review and meta-analysis. Sports Med. 2022;52(10):2523-2535.
8. Konrad A, Nakamura M, Behm DG. The effects of foam rolling training on performance parameters: A systematic review and meta-analysis including controlled and randomized controlled trials. Int J Environ Res Public Health. 2022;19(18).
9. Konrad A, Nakamura M, Paternoster FK, et al. A comparison of a single bout of stretching or foam rolling on range of motion in healthy adults. Eur J Appl Physiol. 2022;122(7):1545-1557.
10. Arntz F, Markov A, Behm DG, et al. Chronic effects of static stretching exercises on muscle strength and power in healthy individuals across the lifespan: A systematic review with multi-level meta-analysis. Sports Med. 2023;doi:10.1007/s40279-022-01806-9.
11. Behm DG, Kay AD, Trajano GS, et al. Effects of stretching on injury risk reduction and balance. J Clin Exerc Physiol. 2021;10(3):106-116.
12. Behm DG, Kay AD, Trajano GS, et al. Effects of acute and chronic stretching on pain control. J Clin Exerc Physiol. 2021;10(4):150-159.
Scoping Review
Identifying Conservative Interventions for Individuals with Subacromial Pain Syndrome Prior to Undergoing a Subacromial Decompression: A Scoping Review
Joseph A Signorino1 a , Aubrey G. Thompson2 , Jodi L Young3 , Benjamin R Hando
1 Division of Physical Therapy, Shenandoah University, 2 DScPT Program, Bellin College, 3 Special Warfare Training Wing
Keywords:
 decompression, shoulder impingement syndrome, shoulder pain, surgical https://doi.org/10.26603/001c.73312
International Journal of Sports Physical Therapy
Background
Subacromial decompression (SAD) surgery remains a common treatment for individuals suffering from subacromial pain syndrome (SAPS), despite numerous studies indicating that SAD provides no benefit over conservative care. Surgical protocols typically recommend surgery only after exhausting conservative measures; however, there is no consensus in the published literature detailing what constitutes conservative care “best practice” before undergoing surgery
Purpose
To describe conservative interventions received by individuals with SAPS prior to undergoing a SAD.
Study Design
Scoping review
Methods
An electronic search using MEDLINE, CINAHL, PubMed, and Scopus databases was conducted. Peer-reviewed randomized controlled control trials and cohort studies published between January 2000 and February 2022 that included subjects diagnosed with SAPS who progressed to receive a SAD were eligible. Subjects who received previous or concurrent rotator cuff repair with SAPS were excluded. Conservative interventions and treatment details that subjects received prior to undergoing a SAD were extracted.
Results
Forty-seven studies were included after screening 1,426 studies. Thirty-six studies (76.6%) provided physical therapy (PT) services, and six studies (12.8%) included only a home exercise program. Twelve studies (25.5%) specifically detailed the delivered PT services, and 20 studies (42.6%) stated who provided the PT interventions. Subacromial injections (SI) (55.3%, n=26) and non-steroidal anti-inflammatories (NSAIDs) (31.9%, n=15) were the next most frequently delivered interventions. Thirteen studies (27.7%) included combined PT and SI. The duration of conservative care varied from 1.5 months to 16 months.
Conclusion
Conservative care that individuals with SAPS receive to prevent advancement to SAD appears inadequate based on the literature. Interventions, such as PT, SI, and NSAIDs, are either underreported or not offered to individuals with SAP prior to advancing to surgery Many questions regarding optimal conservative management for SAPS persists.
Corresponding Author
a
Joseph Signorino, Shenandoah University, Division of Physical Therapy. 44160 Scholar Plaza, Ste 100, Leesburg, VA 20176. Email: jsignori@su.edu
Signorino JA, Thompson AG, Young JL, Hando BR. Identifying Conservative Interventions for Individuals with Subacromial Pain Syndrome Prior to Undergoing a Subacromial Decompression: A Scoping Review. IJSPT. Published online April 1, 2023:293-308. doi:10.26603/001c.73312
INTRODUCTION
Shoulder pain affects approximately one-third of individuals in a lifetime, and 36-70% of those who experience shoulder pain are diagnosed with either subacromial impingement syndrome or subacromial pain syndrome (SAPS).1–3 Subacromial decompression (SAD) surgery is one of the most common orthopedic procedures utilized to address SAPS with rates increasing 117-254% between 1990 to the early 2000s in the United States.4,5 In the United Kingdom, 21,000 SAD procedures were performed in 2010 costing nearly £50 million.6 Individuals with shoulder pain who receive a SAD exhibit similar clinical outcomes in pain, function, and quality of life when compared to those who receive conservative management, yet the procedure is frequently performed when individuals fail conservative management.3,6–9
There is no accepted definition for “adequate nonoperative treatment.” This requires judgment by the medical team and patient to determine if conservative treatment was sufficient before progressing to surgery.10 Completing conservative care is a common inclusion criterion to receive a SAD in the literature; however, studies seldom describe the provided interventions. This omission does not assist clinicians or patients in determining if adequate care was exhausted, a common clinical challenge, prior to recommending SAD. Standard care for SAPS is outlined in a recent clinical practice guideline (CPG) suggesting the exhaustion of conservative interventions prior to performing a SAD, and recommending that individuals only receive a SAD if functional loss persists following completion of conservative care.3,6 The CPG recommendations include physical therapy (PT), a guided home exercise program (HEP), non-steroidal anti-inflammatory drugs (NSAIDs), education, and subacromial injections (SI).6
PT intervention has high-level supportive evidence to treat individuals suffering from SAPS.11 Several randomized control trials exist highlighting equivalent outcomes and cost savings when individuals receive supervised exercise compared to receiving a SAD 12,13 Additional authors have found enhanced benefits from combined manual therapy (MT) and exercise over exercise alone.14–17 However, to date, PT is not always delivered to individuals with SAPS prior to undergoing a SAD 11,18 Therefore, identifying the PT interventions offered to people with SAPS prior to undergoing a SAD is needed in the attempt to understand why individuals continue on to surgery 19
Based on the current evidence, it is unclear if adequate conservative management is provided to individuals with SAPS prior to considering a SAD. Therefore, the purpose of this review was to describe the conservative interventions received by individuals with SAPS prior to undergoing a SAD in the published research. This information will allow for future critical appraisals (e.g. systematic reviews) in attempt to define adequate management to prevent SAD as well as assist clinicians and patients to determine if ad-
equate care was exhausted before advancing to surgery A scoping review allows for data extraction without the need for a critical analysis, and it can provide an overview of the available evidence without producing an answer to a discrete research question.20
METHODS
The Preferred Reporting Items for Systematic Reviews and Meta-Analyses - Extension for Scoping Reviews (PRISMAScR) Checklist guided the design for this scoping review.21 The question was registered with the Open Science Framework and OSF Registries (Identification: https://doi.org/10.17605/OSF.IO/EUP9C).
SEARCH STRATEGY
A librarian assisted with the creation of a database specific search strategy for MEDLINE, CINAHL, PubMed, and Scopus. Keywords, boolean operators, MeSH terms, and MeSH subheadings were used. The search was conducted on February 11, 2022. The search strategy for PubMed is as follows and was adjusted to support each database search criteria: (((((((((shoulder[MeSH Terms]) OR (“shoulder impingement syndrome”[MeSH Terms])) OR ("shoulder pain[MeSH Terms])) OR (shoulder*[Title/Abstract])) OR (“shoulder impingement syndrome”[Title/Abstract])) OR (shoulder impingement syndrome)) OR (subacromial pain syndrome)) OR (“subacromial pain syndrome”[Title/Abstract])) AND (((subacromial decompression) OR (“SAD”)) OR (“subacromial decompression”))) AND (((orthopedics[MeSH Terms]) OR (surgery[MeSH Subheading])) OR (surgery[Title/Abstract]))
ELIGIBILITY CRITERIA
Peer-reviewed randomized control and cohort studies with subjects diagnosed with SAPS, subacromial impingement syndrome, or subacromial shoulder pain were included since these terms are interchangeable.13,22–24 Both open or arthroscopic SAD procedures were included.
Studies published between January 2000 and February 2022 were considered since literature from the early to late 2000’s began to highlight non-superior results associated with SAD outcomes.9,15,25 Other inclusion criteria consisted of studies: (1) evaluating conservative interventions for SAPS, subacromial impingement syndrome, or subacromial shoulder pain when compared to SAD, (2) including subjects listed as having completed conservative care but ultimately received a SAD, and (3) subjects who did not receive any conservative care prior to undergoing a SAD There was no language restriction in order to maximize study inclusion. An attempt to identify a translated study was made if not published in English.
If one or more of the following conditions were present, the study was excluded: (1) subjects had a concurrent
Level of Evidence n/a
International Journal of Sports Physical Therapy
Identifying Conservative Interventions for Individuals with Subacromial Pain Syndrome Prior to Undergoing a Subacromial.
acromioclavicular or glenohumeral joint separation or dislocation, rotator cuff muscle tear(s), humeral head avascular necrosis, humerus or clavicle fracture, glenohumeral labral tear or insufficiency, calcified tendinopathy, or glenohumeral joint osteoarthritis, (2) subjects had a history of undergoing a prior SAD or rotator cuff repair, a surgical procedure other than a SAD for shoulder pain, a procedure to address either a complete or partial rotator cuff repair concurrently with a SAD, or a total or reverse shoulder replacement, (3) cadaver studies, (4) subjects with SAPS receiving conservative management but unclear if advancement to surgery occurred, (5) follow-up studies performed on the same study population as the initial publication, (6) pharmacological studies focusing on pain management for consecutively scheduled SAD procedure, or (7) the study design was a systematic review, protocol, conference abstract, case study, narrative review, treatment clinical practice guidelines, or was published in a non-peer reviewed journal.
DATA EXTRACTION AND ANALYSIS
Title/abstract and full-text screening was performed independently by two reviewers (JS and GT). Disagreements regarding inclusion were resolved by discussion, and a third reviewer (JY) resolved the discrepancy if no consensus occurred. A quality assessment was not conducted given the purpose of this scoping review.

The same reviewers independently extracted the data meeting the inclusion criteria and collaborated to organize and validate the findings. The data extracted from each included study were: (1) the types and number of conservative interventions (if provided) completed by subjects prior to undergoing a SAD, and (2) duration of care (months) and/or treatment sessions completed, if available. Details for each extracted intervention were collected, such as the number of SI and/or injected medications, NSAIDs dosage and frequency, interventions and exercises used during PT, and exercises prescribed in the HEP as the details were available.
PT specificity was captured since it is a common conservative intervention received by individuals with SAPS.12,13,18 PT was defined as an intervention or a group of interventions provided by a physical therapist or physiotherapist. Additionally, only a licensed physical therapist can offer PT services, and the PT provider was identified to ensure a licensed professional rendered PT services. An intervention including no specific provider was categorized as an independent intervention. For example, if PT and ultrasound were separately listed but the provider delivering these interventions remained absent, these were identified as two separate interventions. If there was or was not a specific description of the treatment provided during PT services, it was categorized into specific-PT or non-specific PT, respectively
For the purposes of this review, a HEP was defined as an unsupervised exercise regimen prescribed by any healthcare provider. The HEP compliance rate, if available, was collected since intervention adherence is associated with improved outcomes.26 If a physical therapist delivered the
ACJ acromioclavicular joint; GHJ glenohumeral joint; AVN avascular necrosis; OA osteoarthritis; SAD = subacromial decompression
HEP, it would be categorized as a part of PT. For example, if a study mentioned PT and a HEP separately but did not clearly state the HEP was provided during PT services, then these were classified as two separate interventions. If PT included a HEP, then it was combined with PT and considered one intervention.
The data were subsequently reviewed to identify intervention clusters. Intervention clusters were defined post hoc as the most common combinations of interventions (e.g. both PT and SI is one intervention cluster).
RESULTS
The electronic database searches identified 1,426 studies. The scoping review included 47 studies7,14,18,27–70 after duplicate removal, title/abstract screen, and full-text review (Figure 1). A hand search produced one additional study.38 Two protocol studies71,72 were excluded; the two primary results studies7,60 based on the initial protocol publications were included. Lastly, Haahr and Anderson73 was excluded as this was a follow-up study on the same subject population from Haahr et al.42 The reviewer interrater agreement for the title/abstract screen was strong (⯑=.76) and moderate for the full-text review (⯑=.66). The two reviewers discussed and resolved all discrepancies. See Table 1 for a summary of results.
PHYSICAL THERAPY
Thirty-six studies7,14,18,27,30–37,39–42,44,46,47,50,51,54,55,57–60,63–68,72,75–77 (76.6%) included PT/physiotherapy or supervised exercise.
Figure 1. Flow diagram for study inclusion
Identifying Conservative Interventions for Individuals with Subacromial Pain Syndrome Prior to Undergoing a Subacromial. International Journal of Sports Physical Therapy
Table 1. Extracted interventions and details per study for scoping review.
• Physiotherapy:
◦ ROM
◦ Isometric strengthening exercises
• NSAIDs
• Conservative treatment
• Physiotherapy
◦ Stretching
◦ Strengthening
• Activity modification
• NSAIDs
• Steroidal anti-inflammatory medication
• Moist heat
• NSAIDs
• HEP including isometric contractions for 6-10 seconds, 10-20 repetitions per day for 5-6 days per week up to 12; then for 12-24 weeks progressive resistance exercise 5 times per week
• Physiotherapy:
◦ Remedial exercise regimen
• At least one steroid injection
• At least one steroid injection
• Physiotherapy
• Physiotherapy
• At least one subacromial steroid injection
• Local anesthetic injection
• Physiotherapy:
◦ Heat/cold pack
◦ Soft tissue treatment
◦ Active training of the periscapular muscles and strengthening of the stabilizing muscles of the shoulder joint
◦ HEP (2-3 times per week)
• Physiotherapy:
◦ Eccentric exercise for the rotator cuff
◦ Eccentric and concentric exercise for scapula-stabilizing musculature
• One or more steroid injections
• Physiotherapy
• Physical Therapy:
◦ Cold pack 10-15 minutes prior to exercise
◦ Specific exercises following a protocol
◦ Joint mobilization with muscle energy techniques
◦ Cross friction massage
• Physiotherapy:
◦ Advice/instruction
◦ Exercise therapy
Study Conservative interventions and dosing, if provided+ Number of conservative interventions provided Physical therapy description and provider* Amount and duration of conservative treatment Aydin et al. 201427 2 Specific, performed by physiotherapist 6 months Back et al. 202128 1 None Listed 3 months Baltaci et al. 200770 4 Non-specific, performed by unknown provider 6 months Basharat et al. 202129 3 None Listed 6 months Beard et al. 20187 2 Non-specific, performed by unknown provider 3 months Bengtsson et al. 200630 2 Non-specific, performed by physiotherapist 6 months Bhattacharyya et al. 201431 3 Non-specific, performed by physiotherapist 6 months Biberthaler et al.
32 1 Specific, performed by unknown provider 16 sessions for 60 minutes for 3 months Bjornsson Hallgren et al. 201733 1 Specific, performed by physiotherapist in Physical Therapy Department 3 months Butt et al. 201534 2 Non-specific, performed by unknown provider 6 months Cederqvist et al. 202035 1 Specific, performed by physical therapists 15 sessions within 3 months Christiansen et al. 201618 1 Specific, performed by physiotherapist Greater than 5 sessions
2013
Identifying Conservative Interventions for Individuals with Subacromial Pain Syndrome Prior to Undergoing a Subacromial. International Journal of Sports Physical Therapy
◦ Manual
◦ Physical modalities
• Physiotherapy
• NSAIDs
• Subacromial steroid injections
• NSAIDs
• Physiotherapy
• At least one subacromial steroid injection
• Three subacromial steroid injections at six week intervals
• Physical Therapy:
◦ Strengthening and stretching exercises
◦ Manual therapy
• Oral analgesics
• NSAIDs
• Injections of corticosteroid
• Radial extracorporeal shockwave therapy
• Physical Therapy:
◦ Pain-free exercises with gravity forces removed
◦ Strengthening of rotator cuff and scapulastabilizing muscles
◦ Exercises with corresponding leisure activities
• Physical Therapy
• NSAIDs
• Local steroid injection
• Physical Therapy:
◦ Heat/cold pack
◦ Soft tissue treatments
◦ Exercise:
◦ Active training of the periscapular muscles
◦ Strengthening of the stabilizing muscles of the shoulder
◦ Daily HEP
• No prior interventions listed
• Corticosteroid injection
• Physical Therapy:
◦ Eccentric strengthening of rotator cuff (3 sets, 15 reps, 2 times per day)
◦ Concentric/Eccentric exercises for scapular stabilizers (3 sets, 15 reps, 2 times per day)
◦ Posterior shoulder stretch (hold 30-60 sec, 3 reps, 2 times per day)
◦ Shoulder abduction, shoulder retraction, shoulder elevation, neck retraction, stretch of upper trapezius, stretch of pectoralis major
◦ Manual intervention of posterior GH capsule and pectoralis minor stretching
◦ Education on posture (thoracic spine extension and scapular retraction)
• Local anesthetic injection
• Physiotherapy
DeWachter et al. 200536 3 Non-specific, performed by physiotherapist 6 months Diab et al. 200937 3 Non-specific, performed by physiotherapist 3-6 months Dickens et al. 200538 1 n/a 4.5 months Dorum et al. 201739 5 Non-specific, performed by physical therapist 3 months Farfaras et al. 201640 1 Specific, performed by physiotherapist 3-6 months Farfaras et al. 201841 3 Non-specific, performed by physiotherapist 3-6 months Haahr et al. 200542 1 Specific, performed by physical therapist 3 months including 19 sessions for 60 minutes Hawkins et al. 200143 0 n/a Not Listed Holmgren et al. 201214 2 Specific, performed by physiotherapist 3 months (then HEP for 2 more months) Holmgren et al. 201244 2 Non-specific, performed by Physical Therapist 3 months
therapy
Identifying Conservative Interventions for Individuals with Subacromial Pain Syndrome Prior to Undergoing a Subacromial. International Journal of Sports Physical Therapy
• No prior interventions listed
• NSAIDs
• Local steroid injections
• Physical Therapy:
◦ Ultrasound
• Physical Therapy:
◦ Daily HEP
◦ Supervised training of rotator cuff muscles and scapular stabilizers
• Glucocorticoid injections
• Conservative treatment
• No prior interventions listed
• Oral analgesics
• Physical Therapy
• Rest
• NSAIDs
• Subacromial glucocorticosteroid injections
• Physical Therapy:
◦ Exercise programs:
◦ increase dynamic stability of the glenohumeral joint and scapula (performed 4 times per week, 9 different exercises, 30-40 reps with 3 sets)
◦ Massage
◦ Heat
◦ TENS
◦ HEP
• Conservative treatment
• No prior interventions listed
• Physical Therapy: 3 times per week for 2 weeks then 2 times per week for 4 weeks
◦ Exercises
▪ Shoulder stabilization
▪ Lifting against gravity
▪ Exercises that focus on extending the spine
▪ Exercise therapy using equipment
◦ Manual Therapy
Mobilization of the scapula, cervical, and thoracic spine
▪ Friction massage
▪ Caudal gliding
▪ Traction
◦ Additional Therapies
▪ Ultrasound
▪ Kinesiotaping
▪ Electrotherapy
• Subacromial injections
◦ Bupivacaine with dexamethazone (maximum of 3 with minimum intervals of 2 weeks)
• Physical Therapy
Hultenheim Klintberg et al. 201145 0 n/a Not Listed Husby et al. 200346 3 Non-specific, performed by physical therapist 6 months Jacobsen et al. 201747 2 Specific, performed by physiotherapist 3 months Jarvela et al. 201048 1 None Listed 6 months Jenkins et al. 202049 0 n/a Not Listed Kappe et al. 201550 2 Non-specific, performed by unknown Not Listed Ketola et al. 200951 4 Specific, performed by physiotherapist Not Listed Khare et al. 201552 1 None Listed 3 months Klintberg et al. 201053 0 n/a Not Listed Kohler et al. 202054 2 Specific, performed by physiotherapist or physician 1.5 months
et 2 Non-specific, 6 months
Konradsen
Identifying Conservative Interventions for Individuals with Subacromial Pain Syndrome Prior to Undergoing a Subacromial. International Journal of Sports Physical Therapy
•
◦ Global strengthening exercises
◦ Lifestyle and ADL changes to change posture and strengthen appropriate
◦ Taping for biofeedback
• NSAIDs
• Subacromial steroid injection
• Physical Therapy:
◦ Individually designed progressive HEP
• Physiotherapy
• NSAIDs
• Corticosteroid injection
• Rest
• Conservative treatment
• Conservative treatment
• At least 1 steroid injection
• Rest
• Exercises
• NSAIDs
• Physiotherapy
• Subacromial steroid injection
• Local anesthetic injection
• Physiotherapy
• Analgesics
• Physical Therapy:
◦ ROM Strengthening
◦ Ice
• Subacromial corticosteroid injection(s)
• NSAIDs
• Activity modification
• Rest
• Physical Therapy:
◦ Moist Heat
◦ Ice
• NSAIDs
• Steroid injections
al. 201555 performed by unknown provider Lim et al. 2007 56 4 Non-specific, performed by unknown provider 2-16 months (mean: 4.6 months) Lunsjo et al. 201157 2 Non-specific, performed by unknown provider 6 months Magaji et al. 201258 3 Non-specific, performed by a physiotherapist Not Listed Odenbring et al. 200859 3 Non-specific, performed by unknown provider 6 months Paavola et al. 201860 1 Specific, performed by physiotherapist 15 visits Paavola et al. 202161 4 Non-specific, performed by physiotherapist 3 months Rehman et al. 200974 1 Non-specific, performed by unknown provider 6 months Rombach et al. 201962 2 None listed Not listed Rudbeck et al. 201363 3 Non-specific, performed by unknown provider Not listed Singh et al. 201464 3 Non-specific, performed by physiotherapist 3 months Nizam Siron et al. 202165 2 Non-specific, performed by unknown provider 1.5 months to 3 months Taverna et al. 200766 5 Non-specific, performed by unknown provider 6 months Wright et al. 200067 3 Non-specific, performed by unknown provider 4-6 months • Steroid injections • Rest • Physiotherapy • NSAIDs • Steroid injections in subacromial space • Subacromial glucocorticoid steroid injection • Physical Therapy
At
steroid
Local anesthetic
Physiotherapy:
•
least 1 subacromial injection of
•
injection •
Physical Therapy
Identifying Conservative Interventions for Individuals with Subacromial Pain Syndrome Prior to Undergoing a Subacromial. International Journal of Sports Physical Therapy
• Physiotherapy
• Two steroid injections
+ Identified conservative care interventions noted within each study Dosage, frequency, and other details were listed when available.
* Physical therapy was defined as specific or non-specific. “Specific” included a description of the physical therapy interventions (e.g. manual therapy, home exercise program). “Nonspecific” provided no description. The provider for physical therapy services was identified (e.g. physical therapist, physiotherapy, physician, etc.), or labeled as unknown if no provider was stated.

(ADL = activities of daily living. NSAIDs = non-steroidal anti-inflammatory drug. HEP = home exercise program. ROM = range of motion).
Twenty-four studies7,30,31,34,36,37,39,41,44,46,50,55,57–59,63–68,70,72,77 (51.1%) identified non-specific PT and did not provide details for the provided interventions. Twelve studies14,18,27,32,33,35,40,42,47,51,54,60 (25.5%) explicitly described specific-PT interventions. The specific-PT interventions commonly included eccentric or isometric strengthening of the rotator cuff muscles, scapular stabilization activities, modalities, joint mobilizations, painfree range of motion, or a prescribed HEP. (Figure 2)
Fourteen studies7,32,34,50,55,57,59,63,65–68,70,77 (29.8%) did not identify if a physical therapist provided the interventions (Table 1). Twenty studies14,18,27,30,31,35–37,39–42,44,46,47,51,58,60,64,72 (42.6%) specifically mentioned that a physical therapist/physiotherapist provided the PT service. One study54 (2.1%) provided PT services from either a physical therapist or a physician, and one study33 (2.1%) rendered services in the Physical Therapy Department. (Figure 3)

Eight studies14,18,32,35,39,42,51,54 (17.0%) included MT MT, soft tissue treatment, or massage were common terms. Only Holmgren et al.14 gave a specific description of the manual therapy method, technique, or targeted body region.
Seven studies29,32,35,42,51,66,67 (14.9%) included thermotherapy, and one study39 (2.1%) provided radial extracorporeal shockwave therapy Several studies included elec-
trotherapy,51,54 ultrasound,46,54 and taping.54,58 One study noted physical modality application within PT 18
MEDICATION AND INJECTIONS
Fifteen studies27,29,36,37,39,41,46,51,56,59,63,66,67,70,72 (31.9%) mentioned NSAIDs, and two studies39,50 (4.3%) provided oral analgesic medications. One study65 noted “analgesics” while another study70 mentioned “steroidal anti-inflammatory medication” without specifying application methods.
Twenty-six studies7,14,30,31,34,36–39,41,44,46,47,51,54–59,62,64,66–68,72 (55.3%) provided SI. Ten studies7,30,31,34,37,38,54,58,62,68 (21.3%) included subjects receiving at least one SI or more while 16 studies14,36,39,41,44,46,47,51,55–57,59,64,66,67,72 (34.0%) mentioned an unspecified amount of shoulder-related injections. Three studies47,51,57 (6.4%) mentioned receiving glucocorticosteroid injections, 17 studies7,30,31,34,36–38,41,46,55,56,58,59,62,64,67,68 (36.2%) noted steroid, and four studies14,39,66,72 (8.5%) described corticosteroid or cortisone injections. Eleven studies31,36–38,51,54,56,58,59,64,66 (23.4%) mentioned providing an injection directly into the subacromial space while the remaining studies were non-descript. See Table 1 for a summary of results.
HOME EXERCISE PROGRAM
Six studies29,32,42,47,51,60 (12.8%) included a HEP prescribed by an unknown healthcare provider or a physical
68
Non-specific,
by unknown provider
months
Yeoman et al. 2012
2
performed
6
Figure 2. Physical therapy and home exercise use in the included studies.
Figure 3. Identified physical therapy provider. Unique providers were used for those studies that stated physical therapy services were provided, but by either a department or physician.
Identifying Conservative Interventions for Individuals with Subacromial Pain Syndrome Prior to Undergoing a Subacromial. International Journal of Sports Physical Therapy
therapist. Five studies32,42,47,51,60 (10.6%) used a prescribed HEP within PT services while one study29 (2.1%) included a HEP without PT Basharat et al.29 provided a HEP with specific exercise descriptions and dosages; all other studies32,42,47,51 provided no HEP detail. Four studies29,32,42,47 (8.5%) provided performance frequency associated with the prescribed HEP Frequency was given as daily,42,47 five times per week,29 or a two to three times per week.32 No study mentioned compliance tracking or adherence to the HEP See Table 1 and Figure 2 for a summary of results.
DURATION OF CONSERVATIVE TREATMENT
Three studies37,40,41 (6.4%) provided conservative measures for a range of three to six months. One study75 (2.1%) delivered services for 12-16 months and another 15 studies27,29–31,34,36,46,48,55,57,59,66–68,70 (31.9%) provided interventions for six months. Ten studies7,28,33,39,42,44,47,52,64,72 (21.3%) provided three months of conservative care. One study56 (2.1%) ranged from two to sixteen months, one study38 delivered treatment for 4.5 months, and another provided intervention for 1.5 months.54 Two studies35,60 (4.3%) provided interventions for 15 conservative care sessions, one study32 (2.1%) completed 16 sessions, and one study18 (2.1%) provided more than five visits before undergoing a procedure. Holmgren et al.14 provided conservative measures for three months followed by two months of a HEP See Table 1 for specific details.
CONSERVATIVE INTERVENTION CLUSTERS
Interventions were clustered based on the most common combinations of interventions as reported in the reviewed studies (Figure 4).7,14,18,27–60,62–70,72 Four studies43,45,49,53 (8.5%) listed no conservative interventions, and four studies28,48,52,69 (8.5%) mentioned “conservative treatment” without description; one study mentioned conservative treatment in addition to receiving at least one steroid injection.62 Thirteen studies7,14,30,31,34,44,47,54,55,57,58,64,68 (27.7%) reported subjects received at least one or more injections combined with PT. Six studies36,37,41,46,59,67 (12.8%) included PT, NSAIDs, and injections. Four studies51,56,66,72 (8.5%) included PT, NSAIDs, injections, and rest or activity modification. One study38 (2.1%) included only injections, and three studies27,50,65 (6.4%) included combined PT and NSAIDS or oral analgesics. One study70 (2.1%) included PT, NSAIDs, and activity modification. Three studies29,39,63 (6.4%) included conservative care interventions unique to that study Seven studies18,32,33,35,40,42,60 (14.9%) included PT only (Figure 4)
DISCUSSION
This scoping review highlights the variability in the conservative interventions provided to individuals with SAPS before undergoing a SAD, further emphasizing the need for a
standard of what is deemed “adequate conservative management.” Few studies provided specific intervention descriptions, such as dosage, type, frequency, medication, or duration of care. Additionally, the interventions received by individuals were provided by physical therapists less than half of the time. The findings from this review call attention to the need for specific criteria that should be met in individuals with SAPS, including maximizing the use of conservative management, before advancing to a SAD.
The majority (76.6%) of subjects in this review received some form of PT service. This finding aligns with research indicating PT, including MT and exercise, can positively impact outcomes for individuals suffering from SAPS17; however, it questions why individuals continue to undergo surgery It brings into question whether the PT services rendered are “adequate.” The next most commonly delivered interventions included SI (55.3%) and NSAIDs (31.9%). This further brings into question if the standards of care as suggested by Vandvik et al.6 is sufficient to limit progression to SAD. This finding should be taken lightly as many conservative measures may be underreported; therefore, not allowing for a full comparison to recommended standards of care. Lastly, only one quarter of the studies offered specific details related to PT intervention, and less than half indicated that a physical therapist rendered PT services. This lack of transparency does not allow for the determination of whether or not adequate PT was provided.
It is concerning that non-invasive interventions are not consistent or exhausted despite being safe, beneficial, and cost effective since SAD procedures produce similar outcomes to conservative care.3,6–9 Furthermore, no conservative interventions were reported in 8.2% (n=4) of the included studies.43,45,49,53 This finding supports the inadequate attempts to offer effective conservative intervention prior to undergoing a SAD, and aligns with prior research on rotator cuff related pain conducted by Naunton et al.12 However, caution in making this conclusion is important as operative studies are not typically focused on detailing conservative measures prescribed prior to undergoing a SAD Vandvik et al.6 recommended that individuals with SAPS receive a guided PT program, including a supervised exercise program and patient education, before undergoing surgery. A majority of the included studies offered PT services to subjects prior to receiving a SAD, which aligns with conservative treatment recommendations3,6,12; however, over half of the studies lacked an exercise description and purpose for the intervention. Only a quarter of the studies included exercise specifications, such as exercise protocols to the rotator cuff musculature or general information about posture improvements. Additionally, few of the PT interventions included MT while only a third of the studies incorporated modalities. Less than a quarter of the studies included a well-designed HEP despite the potential benefits from prescribing a HEP with adequate dosing and frequency 78 No studies measured exercise compliance or compliance to attending PT appointments.79 These findings highlight the literature is not descriptive enough to define if adequate PT intervention was conducted.
Identifying Conservative Interventions for Individuals with Subacromial Pain Syndrome Prior to Undergoing a Subacromial. International Journal of Sports Physical Therapy
Treatment provided by physical therapists should include specific exercise to the shoulder muscular, thoracic spine, and scapular stabilizers, along with information on psychosocial factors, pain neuroscience education, and behavior change.7,14–17,35,80 Future research should provide specific PT intervention details, if rendered PT services prevented SAD, and who provided the PT services since about a third of the studies did not list the provider of PT services. Providing specific intervention details allow for a better understanding of the completed services. Omitting intervention descriptions consequently limits outcome reproducibility in future research or in a clinical environment. Clinicians do not know the specific intervention type or dosage to use to enhance patient outcomes. Therefore, it is recommended to use a set structure to improve the recreation of a study’s result. The Template for Intervention Description and Replication (TIDieR) or Consensus on Exercise Reporting Template (CERT) can guide exercise intervention description81,82; the modified CERT could guide MT intervention and dosage.83 Enhanced intervention description, including exercise and MT, will allow for treatment efficacy to be measured and act as a valid comparator to surgery.81
SI served as the second most provided conservative intervention. Despite the high prevalence for this intervention in the reviewed literature, few studies mentioned the site of the injection, medication, or dosage. Approximately one-third of the included studies in this scoping review did not provide the injected medication or specify the number of injections, which aligns with prior research findings.84 Sun et al.84 observed irregularities in treatment protocols including the maximum number of injections to administer to a patient with SAPS prior to determining if they failed treatment. If SI are considered for an intervention to ad-
dress pain associated with SAPS, the anatomical structure to receive the injection is to the subacromial bursa.85,86 The outcomes following SI do not appear to be significantly impacted if performed with ultrasound guidance or with anatomic landmarks when conducted by a trained clinician.86,87 A 21 gauge needle can be used to inject a methylprednisolone 40 milligrams and one milliliter one percent lidocaine mix directly into the subacromial bursa but recognize individual medical providers may alter the mixture based on experience and the treatment goal.85,86,88
Clinical management for SAPS often includes a multimodal approach. Combined PT and SI accounted for the most common (27.7%) conservative intervention grouping prior to undergoing surgery. These interventions were typically provided over a wide range of time (1.5-16 months). Unfortunately, an effective duration of conservative care prior to considering advancement to surgery remains unclear. Additionally, the timing of when conservative care is delivered remains unknown. For example, it is unknown if receiving PT and SI concurrently leads to an optimal outcome, or if sequential intervention prescription may work best (e.g. PT followed by SI, or vice versa). Several unknowns remain to best define adequate conservative management for SAPS to limit advancement to surgery
LIMITATIONS
Only studies in the English language were included in the review despite attempts to identify translated studies. Also, no quality assessment was performed, which may limit the impact of the findings but can guide future systematic reviews. Lastly, there is a lack of high-quality PT CPGs for the treatment of nontraumatic shoulder pain. This makes
 Figure 4. Common conservative intervention clusters.
Identifying Conservative Interventions for Individuals with Subacromial Pain Syndrome Prior to Undergoing a Subacromial. International Journal of Sports Physical Therapy
determining exercise type, dose, duration, timing, and expected outcomes recommendations difficult.13,89
CONCLUSION
Conservative management for SAPS offers an equally advantageous outcome when compared to SAD Many individuals continue to receive a SAD despite conservative care, bringing into question what is “adequate care” for individuals with shoulder pain. The findings from this scoping review indicate that typical interventions to conservatively manage pain, such as PT, NSAIDs and SI, are underreported or not offered to individuals with SAPS prior to undergoing a SAD PT intervention shown to positively impact outcomes was underutilized in many studies, further highlighting that adequate care may not be utilized. The inadequate level of conservative care offered does not allow for a valid comparison to surgery. There is a significant need to investigate successful conservative interventions to prevent SAD.
FUNDING
There was no funding associated with this research.
ACKNOWLEDGEMENTS
Thank you to Cindy Reinl, Bellin College librarian, who assisted with the electronic searches.
AUTHORS DISCLOSURES
The authors certify that they have no affiliations with or financial involvement in any organization or entity with a direct financial interest in the subject matter or materials discussed in the study
Submitted: August 15, 2022 CDT, Accepted: January 27, 2023
CDT This is an open-access article distributed under the terms of the Creative Commons Attribution 4.0 International License (CCBY-NC-4.0). View this license’s legal deed at https://creativecommons.org/licenses/by-nc/4.0 and legal code at https://creativecommons.org/licenses/by-nc/4.0/legalcode for more information.
Identifying Conservative Interventions for Individuals with Subacromial Pain Syndrome Prior to Undergoing a Subacromial. International Journal of Sports Physical Therapy
REFERENCES
1. Mitchell C, Adebajo A, Hay E, Carr A. Shoulder pain: Diagnosis and management in primary care. BMJ. 2005;331(7525):1124-1128. doi:10.1136/bmj.33 1.7525.1124
2. Juel NG, Natvig B. Shoulder diagnoses in secondary care, a one year cohort. BMC Musculoskelet Disord. 2014;15(1):89. doi:10.1186/1471-2474-15-89
3. Dong W, Goost H, Lin XB, et al. Treatments for shoulder impingement syndrome: A PRISMA systematic review and network meta-analysis. Medicine 2015;94(10):e510. doi:10.1097/md.0000000 000000510
4. Paloneva J, Lepola V, Karppinen J, Ylinen J, Äärimaa V, Mattila VM. Declining incidence of acromioplasty in Finland. Acta Orthop. 2015;86(2):220-224. doi:10.3109/17453674.2014.9777 03
5. Vitale MA, Arons RR, Hurwitz S, Ahmad CS, Levine WN. The rising incidence of acromioplasty. J Bone Joint Surg Am 2010;92(9):1842-1850. doi:10.2106/jbj s.i.01003
6. Vandvik PO, Lähdeoja T, Ardern C, et al. Subacromial decompression surgery for adults with shoulder pain: a clinical practice guideline. BMJ 2019;364:l294. doi:10.1136/bmj.l294
7 Beard DJ, Rees JL, Cook JA, et al. Arthroscopic subacromial decompression for subacromial shoulder pain (CSAW): a multicentre, pragmatic, parallel group, placebo-controlled, three-group, randomised surgical trial. Lancet 2018;391(10118):329-338. doi:1 0.1016/s0140-6736(17)32457-1
8. Jones T, Carr AJ, Beard D, et al. Longitudinal study of use and cost of subacromial decompression surgery: The need for effective evaluation of surgical procedures to prevent overtreatment and wasted resources. BMJ Open 2019;9(8):e030229. doi:10.1136/ bmjopen-2019-030229
9. Dorrestijn O, Stevens M, Winters JC, van der Meer K, Diercks RL. Conservative or surgical treatment for subacromial impingement syndrome? A systematic review J Shoulder Elbow Surg 2009;18(4):652-660. do i:10.1016/j.jse.2009.01.010
10. Young JL, Wright AA, Rhon DI. Nonoperative management prior to hip arthroscopy for femoroacetabular impingement syndrome: An investigation into the utilization and content of physical therapy J Orthop Sports Phys Ther 2019;49(8):593-600. doi:10.2519/jospt.2019.8581
11. Amin J, Gohir S, Qaiser U, Siddiqui AA, Alshammary F, Alam MK. Is physiotherapy an underused approach to prevent surgery in selective musculoskeletal disorders? Bangladesh J Med Sci 2021;20(2):409-413. doi:10.3329/bjms.v20i2.51557
12. Naunton J, Street G, Littlewood C, Haines T, Malliaras P Effectiveness of progressive and resisted and non-progressive or non-resisted exercise in rotator cuff related shoulder pain: a systematic review and meta-analysis of randomized controlled trials. Clin Rehabil 2020;34(9):1198-1216. doi:10.117 7/0269215520934147
13. Pieters L, Lewis J, Kuppens K, et al. An update of systematic reviews examining the effectiveness of conservative physical therapy interventions for subacromial shoulder pain. J Orthop Sports Phys Ther 2020;50(3):131-141. doi:10.2519/jospt.2020.8498
14. Holmgren T, Björnsson Hallgren H, Öberg B, Adolfsson L, Johansson K. Effect of specific exercise strategy on need for surgery in patients with subacromial impingement syndrome: randomised controlled study BMJ 2012;344:e787 doi:10.1136/bm j.e787
15. Cummins CA, Sasso LM, Nicholson D. Impingement syndrome: Temporal outcomes of nonoperative treatment. J Shoulder Elbow Surg 2009;18(2):172-177. doi:10.1016/j.jse.2008.09.005
16. Tate AR, McClure PW, Young IA, Salvatori R, Michener LA. Comprehensive impairment-based exercise and manual therapy intervention for patients with subacromial impingement syndrome: A case series. J Orthop Sports Phys Ther 2010;40(8):474-493. doi:10.2519/jospt.2010.3223
17. Hanratty CE, McVeigh JG, Kerr DP, et al. The effectiveness of physiotherapy exercises in subacromial impingement syndrome: A systematic review and meta-analysis. Semin Arthritis Rheum 2012;42(3):297-316. doi:10.1016/j.semarthrit.2012.0 3.015
18. Christiansen DH, Frost P, Frich LH, Falla D, Svendsen SW The use of physiotherapy among patients with subacromial impingement syndrome: Impact of sex, socio-demographic and clinical factors. PLoS ONE 2016;11(3):e0151077 doi:10.1371/ journal.pone.0151077
19. Ketola S, Lehtinen J, Arnala I. Arthroscopic decompression not recommended in the treatment of rotator cuff tendinopathy. Bone Joint J. 2017;99-B:799-805. doi:10.1302/0301-620X.99B6
Identifying Conservative Interventions for Individuals with Subacromial Pain Syndrome Prior to Undergoing a Subacromial. International Journal of Sports Physical Therapy
20. Sucharew H, Macaluso M. Progress notes: Methods for research evidence synthesis: The scoping review approach. J Hosp Med 2019;14(7):416-418. do i:10.12788/jhm.3248
21. Tricco AC, Lillie E, Zarin W, et al. PRISMA Extension for Scoping Reviews (PRISMA-ScR): Checklist and Explanation. Ann Intern Med 2018;169(7):467-473. doi:10.7326/m18-0850
22. Cools AM, Michener LA. Shoulder pain: can one label satisfy everyone and everything? Br J Sports Med. 2017;51(5):416-417. doi:10.1136/bjsports-201 6-096772
23. Ludewig PM, Lawrence RL, Braman JP What’s in a name? Using movement system diagnoses versus pathoanatomic diagnoses. J Orthop Sports Phys Ther 2013;43(5):280-283. doi:10.2519/jospt.2013.0104
24. de Witte PB, de Groot JH, van Zwet EW, et al. Communication breakdown: clinicians disagree on subacromial impingement. Med Biol Eng Comput 2014;52(3):221-231. doi:10.1007/s11517-013-1075-0
25. Coghlan JA, Buchbinder R, Green S, Johnston RV, Bell SN. Surgery for rotator cuff disease. Cochrane Database Syst Rev. 2008;(1):CD005619. doi:10.1002/1 4651858.cd005619.pub2
26. Newman-Beinart NA, Norton S, Dowling D, et al. The development and initial psychometric evaluation of a measure assessing adherence to prescribed exercise: the Exercise Adherence Rating Scale (EARS). Physiotherapy. 2017;103(2):180-185. doi:10.1 016/j.physio.2016.11.001
27 Aydin A, Yildiz V, Topal M, Tuncer K, Köse M, Şenocak E. Effects of conservative therapy applied before arthroscopic subacromial decompression on the clinical outcome in patients with stage 2 shoulder impingement syndrome. Turk J Med Sci. 2014;44(5):871-874. doi:10.3906/sag-1303-91
28. Bäck M, Paavola M, Aronen P, Järvinen TLN, Taimela S, Finnish Shoulder Impingement Arthroscopy Controlled Trial (FIMPACT)
Investigators. Return to work after subacromial decompression, diagnostic arthroscopy, or exercise therapy for shoulder impingement: a randomised, placebo-surgery controlled FIMPACT clinical trial with five-year follow-up. BMC Musculoskelet Disord. 2021;22(1):889. doi:10.1186/s12891-021-04768-7
29. Basharat A, Qamar MM, Javaid M, Ali S, Basharat S, Ali M. Conservative treatment can reduce the rate of arthroscopic subacromial decompression surgery: A randomised control trial. J Liaquat Uni Med Health Sci. 2021;20(3):214-218. doi:10.22442/jlumhs.2021.00
847
30. Bengtsson M, Lunsjö K, Hermodsson Y, Nordqvist A, Abu-Zidan FM. High patient satisfaction after arthroscopic subacromial decompression for shoulder impingement: a prospective study of 50 patients. Acta Orthop 2006;77(1):138-142. doi:10.1080/174536 70610045821
31. Bhattacharyya R, Edwards K, Wallace AW Does arthroscopic sub-acromial decompression really work for sub-acromial impingement syndrome: a cohort study. BMC Musculoskelet Disord. 2014;15(100968565):324. doi:10.1186/1471-2474-1
5-324
32. Biberthaler P, Beirer M, Kirchhoff S, Braunstein V, Wiedemann E, Kirchhoff C. Significant benefit for older patients after arthroscopic subacromial decompression: a long-term follow-up study. Int Orthop 2013;37(3):457-462. doi:10.1007/s00264-01 2-1760-x
33. Björnsson Hallgren HC, Adolfsson LE, Johansson K, Öberg B, Peterson A, Holmgren TM. Specific exercises for subacromial pain: Good results maintained for 5 years. Acta Orthop. 2017;88(6):600-605. doi:10.1080/17453674.2017.1364 069
34. Butt U, Whiteman A, Wilson J, Paul E, Roy B. Does arthroscopic subacromial decompression improve quality of life. Ann R Coll Surg Engl 2015;97(3):221-223. doi:10.1308/003588414x1405592 5061478
35. Cederqvist S, Flinkkilä T, Sormaala M, et al. Nonsurgical and surgical treatments for rotator cuff disease: a pragmatic randomised clinical trial with 2-year follow-up after initial rehabilitation. Ann Rheum Dis. 2021;80(6):796-802. doi:10.1136/annrheu mdis-2020-219099
36. De Wachter J, Van Glabbeek F, van Riet R, Van Leemput W, Vermeyen K, Somville J. Surrounding soft tissue pressure during shoulder arthroscopy. Acta Orthop Belg 2005;71(5):521-527 https://www.ncbi.nl m.nih.gov/pubmed/16305075
37. Diab MA, Fernandez GN, Elsorafy K. Time and cost savings in arthroscopic subacromial decompression: the use of bipolar versus monopolar radiofrequency. Int Orthop. 2009;33(1):175-179. doi:1 0.1007/s00264-008-0541-z
38. Dickens VA, Williams JL, Bhamra MS. Role of physiotherapy in the treatment of subacromial impingement syndrome: a prospective study Physiotherapy 2005;91(3):159-164. doi:10.1016/j.phy sio.2004.10.008
Identifying Conservative Interventions for Individuals with Subacromial Pain Syndrome Prior to Undergoing a Subacromial. International Journal of Sports Physical Therapy
39. Dørum IH, Heir S, Solheim E, Magnussen LH. Implementation of conservative treatment prior to arthroscopic subacromial decompression of the shoulder. Knee Surg Sports Traumatol Arthrosc. 2017;25(7):2060-2066. doi:10.1007/s00167-016-409 1-4
40. Farfaras S, Sernert N, Hallström E, Kartus J. Comparison of open acromioplasty, arthroscopic acromioplasty and physiotherapy in patients with subacromial impingement syndrome: a prospective randomised study Knee Surg Sports Traumatol Arthrosc 2016;24(7):2181-2191. doi:10.1007/s0016 7-014-3416-4
41. Farfaras S, Sernert N, Rostgard Christensen L, Hallström EK, Kartus JT Subacromial decompression yields a better clinical outcome than therapy alone: A prospective randomized study of patients with a minimum 10-year follow-up. Am J Sports Med 2018;46(6):1397-1407. doi:10.1177/036354651875575 9
42. Haahr JP, Ostergaard S, Dalsgaard J, et al. Exercises versus arthroscopic decompression in patients with subacromial impingement: a randomised, controlled study in 90 cases with a one year follow up. Ann Rheum Dis. 2005;64(5):760-764. d oi:10.1136/ard.2004.021188
43. Hawkins RJ, Plancher KD, Saddemi SR, Brezenoff LS, Moor JT. Arthroscopic subacromial decompression. J Shoulder Elbow Surg 2001;10(3):225-230. doi:10.1067/mse.2001.114679
44. Holmgren T, Oberg B, Sjoberg I, Johansson K. Supervised strengthening exercises versus homebased movement exercises after arthroscopic acromioplasty: a randomized clinical trial. J Rehabil Med 2012;44(1):12-18. doi:10.2340/16501977-0889
45. Hultenheim Klintberg I, Karlsson J, Svantesson U. Health-related quality of life, patient satisfaction, and physical activity 8-11 years after arthroscopic subacromial decompression. J Shoulder Elbow Surg 2011;20(4):598-608. doi:10.1016/j.jse.2010.08.021
46. Husby T, Haugstvedt JR, Brandt M, Holm I, Steen H. Open versus arthroscopic subacromial decompression: a prospective, randomized study of 34 patients followed for 8 years. Acta Orthop Scand. 2003;74(4):408-414. doi:10.1080/00016470310017703
47 Jacobsen JR, Jensen CM, Deutch SR. Acromioplasty in patients selected for operation by national guidelines. J Shoulder Elbow Surg 2017;26(10):1854-1861. doi:10.1016/j.jse.2017.03.028
48. Järvelä S, Järvelä T, Aho H, Kiviranta I. Arthroscopic subacromial decompression: outcome comparison between outpatient and hospitalized patients with 2- to 5-year follow-up. Scand J Surg. 2010;99(1):50-54. doi:10.1177/145749691009900111
49. Jenkins PJ, Stirling PH, Ireland J, Elias-Jones C, Brooksband AJ. The changing incidence of arthroscopic subacromial decompression in Scotland. Bone Joint J 2020;102-B(3):360-364. doi:10.1302/030 1-620X.102B3
50. Kappe T, Knappe K, Elsharkawi M, Reichel H, Cakir B. Predictive value of preoperative clinical examination for subacromial decompression in impingement syndrome. Knee Surg Sports Traumatol Arthrosc 2015;23(2):443-448. doi:10.1007/s00167-01
3-2386-2
51. Ketola S, Lehtinen J, Arnala I, et al. Does arthroscopic acromioplasty provide any additional value in the treatment of shoulder impingement syndrome?: a two-year randomised controlled trial. J Bone Joint Surg Br 2009;91(10):1326-1334. doi:10.130 2/0301-620x.91b10.22094
52. Khare R, Srivastava V, Lal H. Clinical and radiological outcomes of arthroscopic subacromial decompression for stage-II impingement of shoulder J Arthrosc Jt Surg. 2015;2(3):122-127. doi:10.1016/j.jaj s.2015.11.004
53. Klintberg IH, Svantesson U, Karlsson J. Long-term patient satisfaction and functional outcome 8-11 years after subacromial decompression. Knee Surg Sports Traumatol Arthrosc 2010;18(3):394-403. d oi:10.1007/s00167-009-0963-1
54. Köhler HC, Tischer T, Hacke C, Gutcke A, Schulze C. Outcome of surgical and conservative treatment of patients with shoulder impingement syndrome: A prospective comparative clinical study Acta Chir Orthop Traumatol Cech 2020;87(5):340-345.
55. Konradsen LA, Jensen CH. Arthroscopic subacromial decompression results in normal shoulder function after two years in less than 50% of patients. Dan Med J. 2015;62(3).
56. Lim KK, Chang HC, Tan JL, Chan BK. Arthroscopic subacromial decompression for stage-II impingement. J Orthop Surg. 2007;15(2):197-200. do i:10.1177/230949900701500215
57 Lunsjö K, Bengtsson M, Nordqvist A, Abu-Zidan FM. Patients with shoulder impingement remain satisfied 6 years after arthroscopic subacromial decompression: a prospective study of 46 patients. Acta Orthop. 2011;82(6):711-713. doi:10.3109/174536 74.2011.623571
Identifying Conservative Interventions for Individuals with Subacromial Pain Syndrome Prior to Undergoing a Subacromial. International Journal of Sports Physical Therapy
58. Magaji SA, Singh HP, Pandey RK. Arthroscopic subacromial decompression is effective in selected patients with shoulder impingement syndrome. J Bone Joint Surg Br. 2012;94 B(8):1086-1089. doi:10.13 02/0301-620X.94B8
59. Odenbring S, Wagner P, Atroshi I. Long-term outcomes of arthroscopic acromioplasty for chronic shoulder impingement syndrome: A prospective cohort study with a minimum of 12 years’ follow-up. Arthrosc - J Arthrosc Relat Surg. 2008;24(10):1092-1098. doi:10.1016/j.arthro.2008.0
4.073
60. Paavola M, Malmivaara A, Taimela S, et al. Subacromial decompression versus diagnostic arthroscopy for shoulder impingement: randomised, placebo surgery controlled clinical trial. BMJ. 2018;362:k2860. doi:10.1136/bmj.k2860
61. Paavola M, Kanto K, Ranstam J, et al. Subacromial decompression versus diagnostic arthroscopy for shoulder impingement: a 5-year follow-up of a randomised, placebo surgery controlled clinical trial. Br J Sports Med. 2021;55(2):99-107. doi:10.1136/bjspo rts-2020-102216
62. Rombach I, Merritt N, Shirkey BA, et al. Costeffectiveness analysis of a placebo-controlled randomized trial evaluating the effectiveness of arthroscopic subacromial decompression in patients with subacromial shoulder pain. Bone Joint J. 2019;101-B(1):55-62. doi:10.1302/0301-620x.101b1.b jj-2018-0555.r1
63. Rudbeck M, Jensen SL, Fonager K. Arthroscopic subacromial decompression and predictors of longterm sick leave benefit and permanent benefits. J Shoulder Elbow Surg. 2013;22(9):1167-1172. doi:10.10 16/j.jse.2012.12.003
64. Singh HP, Mehta SS, Pandey R. A preoperative scoring system to select patients for arthroscopic subacromial decompression. J Shoulder Elbow Surg. 2014;23(9):1251-1256. doi:10.1016/j.jse.2014.05.030
65. Nizam Siron K, Mat Lani MT, Low CL, Kow RY Arthroscopic subacromial decompression in the treatment of shoulder impingement syndrome: A prospective study in Malaysia. Cureus 2021;13(11):e19254. doi:10.7759/cureus.19254
66. Taverna E, Battistella F, Sansone V, Perfetti C, Tasto JP Radiofrequency-based plasma microtenotomy compared with arthroscopic subacromial decompression yields equivalent outcomes for rotator cuff tendinosis. Arthroscopy 2007;23(10):1042-1051. doi:10.1016/j.arthro.2007.0
4.018
67 Wright RW, Heller MA, Quick DC, Buss DD Arthroscopic decompression for impingement syndrome secondary to an unstable os acromiale. Arthroscopy. 2000;16(6):595-599. doi:10.1053/jars.200 0.9239
68. Yeoman TFM, Wigderowitz CA. The effect of psychological status on pain and surgical outcome in patients requiring arthroscopic subacromial decompression. Eur J Orthop Surg Traumatol 2012;22(7):549-553. doi:10.1007/s00590-011-0886-7
69. Rehman AU, Wajid MA, Ahmad T. Shoulder impingement syndrome: Outcome of arthroscopic subacromial decompression. Journal of the College of Physicians and Surgeons Pakistan. 2009;19(10):636. ht tps://ecommons.aku.edu/pakistan_fhs_mc_surg_ortho p/3/
70. Baltaci G, Bayrakci Tunay V, Binnet M, Ergun N. Rehabilitation in arthroscopic subacromial decompression: Six-year follow-up. Fizyoter Rehabil 2007;18(3):201-208.
71. Beard D, Rees J, Rombach I, et al. The CSAW Study (Can Shoulder Arthroscopy Work?) – a placebocontrolled surgical intervention trial assessing the clinical and cost effectiveness of arthroscopic subacromial decompression for shoulder pain: study protocol for a randomised controlled trial. Trials. 2015;16(1):210. doi:10.1186/s13063-015-0725-y
72. Paavola M, Malmivaara A, Taimela S, Kanto K, Järvinen TL, FIMPACT Investigators. Finnish Subacromial Impingement Arthroscopy Controlled Trial (FIMPACT): a protocol for a randomised trial comparing arthroscopic subacromial decompression and diagnostic arthroscopy (placebo control), with an exercise therapy control, in the treatment of shoulder impingement syndrome. BMJ Open 2017;7(5):e014087 doi:10.1136/bmjopen-2016-01408
73. Haahr JP, Andersen JH. Exercises may be as efficient as subacromial decompression in patients with subacromial stage II impingement: 4–8-years’ follow-up in a prospective, randomized study Scand J Rheumatol 2006;35(3):224-228. doi:10.1080/0300974
0600556167
74. Rehman AU, Wajid MA, Ahmad T. Shoulder impingement syndrome: Outcome of arthroscopic subacromial decompression. J Coll Physicians Surg Pak 2009;19(10):636-639.
75. Dhillon KS. Subacromial impingement syndrome of the shoulder: A musculoskeletal disorder or a medical myth? Malays Orthop J. 2019;13(3):1-7. doi:1 0.5704/moj.1911.001
7
Identifying Conservative Interventions for Individuals with Subacromial Pain Syndrome Prior to Undergoing a Subacromial. International Journal of Sports Physical Therapy
76. Gacaferi H, Kolk A, Visser CPJ. Arthroscopic bursectomy less effective in the degenerative shoulder with chronic subacromial pain. JSES Int 2021;5(2):220-227. doi:10.1016/j.jseint.2020.10.021
77. Lim JTK, Acornley A, Dodenhoff RM. Recovery after arthroscopic subacromial decompression: prognostic value of the subacromial injection test. Arthroscopy. 2005;21(6):680-683. doi:10.1016/j.arthr o.2005.03.015
78. Christiansen DH, Hjort J. Group-based exercise, individually supervised exercise and home-based exercise have similar clinical effects and costeffectiveness in people with subacromial pain: a randomised trial. J Physiother. 2021;67(2):124-131. do i:10.1016/j.jphys.2021.02.015
79. Clausen MB, Hölmich P, Rathleff M, et al. Effectiveness of Adding a Large Dose of Shoulder Strengthening to Current Nonoperative Care for Subacromial Impingement: A Pragmatic, DoubleBlind Randomized Controlled Trial (SExSI Trial). Am J Sports Med 2021;49(11):3040-3049. doi:10.1177/0363 5465211016008
80. Meehan K, Wassinger C, Roy JS, Sole G. Seven key themes in physical therapy advice for patients living with subacromial shoulder pain: A scoping review J Orthop Sports Phys Ther. 2020;50(6):285-293. doi:10.2 519/jospt.2020.9152
81. Hoffmann TC, Glasziou PP, Boutron I, et al. Better reporting of interventions: template for intervention description and replication (TIDieR) checklist and guide. BMJ 2014;348:g1687 doi:10.1136/bmj.g1687
82. Slade SC, Dionne CE, Underwood M, et al. Consensus on Exercise Reporting Template (CERT): Modified Delphi Study Phys Ther 2016;96(10):1514-1524. doi:10.2522/ptj.20150668
83. Leech JB, Owen WE, Young JL, Rhon DI. Incomplete reporting of manual therapy interventions and a lack of clinician and setting diversity in clinical trials for neck pain limits replication and real-world translation. A scoping review. J Man Manip Ther. Published online September 1, 2022:1-10. doi:10.1080/10669817.202
2.2113295
84. Sun Y, Chen J, Li H, Jiang J, Chen S. Steroid Injection and Nonsteroidal Anti-inflammatory Agents for Shoulder Pain: A PRISMA Systematic Review and Meta-Analysis of Randomized Controlled Trials. Medicine 2015;94(50):e2216. doi:10.1097/md.0 000000000002216
85. Ellegaard K, Christensen R, Rosager S, et al. Exercise therapy after ultrasound-guided corticosteroid injections in patients with subacromial pain syndrome: a randomized controlled trial. Arthritis Res Ther 2016;18(1):129. doi:10.1186/s1307
5-016-1002-5
86. Roddy E, Ogollah RO, Oppong R, et al. Optimising outcomes of exercise and corticosteroid injection in patients with subacromial pain (impingement) syndrome: a factorial randomised trial. Br J Sports Med 2021;55(5):262-271. doi:10.1136/bjsports-201
9-101268
87 Deng X, Zhu S, Li D, et al. Effectiveness of ultrasound-guided versus anatomic landmark-guided corticosteroid injection on pain, physical function and safety in patients with subacromial impingement syndrome: A systematic review and meta-analysis. Am J Phys Med Rehabil 2021;101(12):1087-1098. do i:10.1097/phm.0000000000001940
88. Chean CS, Raval P, Ogollah RO, Hall A, Roddy E, Foster NE. Accuracy of placement of ultrasoundguided corticosteroid injection for subacromial pain (impingement) syndrome does not influence pain and function: Secondary analysis of a randomised controlled trial. Musculoskeletal Care. 2022;20(4):831-838. doi:10.1002/msc.1634
89. Barrett E, Larkin L, Caulfield S, et al. Physical therapy management of nontraumatic shoulder problems lacks high-quality clinical practice guidelines: A systematic review with quality assessment using the AGREE II checklist. J Orthop Sports Phys Ther 2021;51(2):63-71. doi:10.2519/josp
t.2021.9397
Identifying
Prior to Undergoing a Subacromial. International Journal of Sports Physical Therapy
Conservative Interventions for Individuals with Subacromial Pain Syndrome
The Effect Of Percussive Therapy On Musculoskeletal Performance And Experiences
Of Pain: A Systematic Literature Review
Lorna Sams1 a , Ben L Langdown1 , Joan Simons1 , Jitka Vseteckova1
1 Faculty of welfare, education and language, The Open University
Keywords: physiological adaptations, physical therapy, muscle strength, flexibility, pain https://doi.org/10.26603/001c.73795
International Journal of Sports Physical Therapy
Background
There is a lack of specific research on the effect of percussive therapy (PT) delivered by massage guns on physiological adaptations. This systematic literature review investigates research conducted on the effects of PT interventions on performance in strength and conditioning settings, and on experiences of musculoskeletal pain.
Purpose
To determine the effect of PT delivered by massage guns on physiological adaptations: muscle strength, explosive muscle strength and flexibility, and experiences of musculoskeletal pain.
Study Design
Systematic literature review
Methods
Data sources (CINAHL, Cochrane Library, Psychinfo, PubMed, SportDISCUS and OpenGrey) were searched from January 2006 onwards for full text literature in any language involving adult populations receiving PT delivered by massage guns, directly to any muscle belly or tendon, with comparisons to an alternative treatment, placebo or no treatment. Literature with outcomes relating to acute or chronic physiological adaptations in muscle strength, explosive muscle strength, flexibility or experiences of musculoskeletal pain were included. Articles were assessed for quality using the Critical Appraisal Skills Programme and PEDro scores.
Results
Thirteen studies met the inclusion criteria. All studies had limitations in methodological quality or reporting of findings but still included contextually-rich details that contributed to the overall narrative synthesis. A significant relationship was found between a single application of PT delivered by massage guns and an acute increase in muscle strength, explosive muscle strength and flexibility, with multiple treatments eliciting a reduction in experiences of musculoskeletal pain.
Conclusion
PT delivered by massage guns can help improve acute muscle strength, explosive muscle strength and flexibility, and reduce experiences of musculoskeletal pain. These devices may provide a portable and cost-effective alternative to other forms of vibration and interventions.
Corresponding author: Lorna Sams, Faculty of Wellbeing, Education and Language Studies, The Open University, Milton Keynes: Lorna.sams@open.ac.uk
Systematic Review/Meta-Analysis
a Sams L,
BL,
J, Vseteckova J. The Effect Of Percussive Therapy On
Of Pain: A Systematic Literature Review.
April 1, 2023:309-327. doi:10.26603/001c.73795
Langdown
Simons
Musculoskeletal Performance And Experiences
IJSPT. Published online
INTRODUCTION RATIONALE
Percussive therapy (PT) was developed in the 1950’s by Robert Fulford through the introduction of the percussion vibrator which was applied to local areas of the body for deep tissue osteopathic treatment for musculoskeletal pain.1 The first commercial massage gun was invented in 2008 and in recent years, there has been an increase in popularity of handheld devices for personal and professional therapeutic use, as well as by strength and conditioning coaches and athletes to elicit potential performance gains.2 The use of massage gun technology, often referred to as PT, involves “floating” the device over the surface of the skin, applying vibration and rapid pulses in short bursts of pressure to the muscle belly or tendon.3,4 The application is comprised of a triad of characteristics; frequency (Hz), amplitude (mm) and torque (lbs),4 and mimics the therapeutic effects of tapotement massage therapy, where rhythmic percussive strokes are applied to the body with a cupped hand.5
The impact of vibration on physical performance parameters and experiences of pain has been extensively researched, using an array of devices. Vibration is delivered by mechanical vibration, where the energy is transferred from the device directly to the tendon or muscle6 or indirectly through the feet while standing on a platform or the hands by holding a device.7 These forms of delivery can include cycloidal vibration,8 oscillation vibration,9 local vibration therapy,10 whole body vibration therapy (WBV)11 and handheld vibrating equipment.12 Reviews to date have adopted an umbrella term of “vibration therapy” to encompass a range of devices and treatments.13 Vibration treatment has been found effective in promoting acute adaptations in pain reduction,14 increasing strength15 and improving flexibility16 after single and multiple treatments.
Despite this extensive literature there is a lack of specific research on PT delivered by massage guns and the effect on physiological adaptations. A systematic literature review was deemed appropriate to investigate research conducted on PT and the effects of PT interventions on performance in strength and conditioning settings and on experiences of musculoskeletal pain. Identifying the most effective PT protocols would allow researchers to develop targeted interventions to support physiological adaptations and reduce experiences of musculoskeletal pain.
For the purpose of this review the following definitions were applied:
• Muscle strength – ability of a muscle or muscle group to exert force on an external resistance.17
• Explosive muscle strength – ability of a muscle or muscle group to rapidly produce speed or large forces.18
• Flexibility – ability of muscles and tendons to elongate around a joint.19
• Musculoskeletal pain – unpleasant sensory experience associated with the bones, joints or tissues of the body 20
The purpose of this review was to determine the effect of PT delivered by massage guns on physiological adaptations: muscle strength, explosive muscle strength and flexibility, and experiences of musculoskeletal pain.
METHODS PROTOCOL AND REGISTRATION
The systematic literature review protocol21 was registered with Prospero. Registration number: CRD42021253767
ELIGIBILITY CRITERIA
Databases were searched from January 2006 to capture any preliminary research prior to the introduction of PT massage guns in 2008, with a final search before completion of the study to include any recent articles. Table 1 details the full eligibility criteria.
The PICO criteria were used to frame the research questions and define the eligibility criteria:
• Participants - adult populations aged 18 years and older
• Interventions - PT applied by massage guns directly to the muscle belly or tendon of the intended muscle for treatment in any location on the body
• Comparators – alternative, placebo or no treatment.
• Outcomes - physiological adaptations: muscle strength, explosive muscle strength, flexibility or experiences of musculoskeletal pain. Measures of these outcomes included self-reported scores and units of measurement, such as degrees, distance and time.
INFORMATION SOURCES
To provide a comprehensive overview, all existing literature was included, for example primary research studies, systematic reviews and conference papers, providing the fulltext version of the articles were available. The search strategy was created in collaboration with all authors (Supplementary file 1). The following electronic databases were searched: PubMed, SportDISCUS, CINAHL, Cochrane Library and Psychinfo. Grey literature was searched for in Google, Google Scholar and OpenGrey using a combination of key words, massage gun, percussion therapy, percussive massage and percussive therapy In addition, all sources were searched using the following brand names; Addsfit, Exogun, Fluxmassage, Hydragun, Hyperice, Hypervolt, Muscle Gun, Myopro, Physion®, Powerplate®, Recovapro, Therabody, Theragun and Timtam. Finally, reference lists of all relevant studies, reviews and reports were searched.
STUDY SELECTION
Study selection at title, abstract and full text screening was performed by one reviewer and checked for consistency and completeness by all reviewers. Any disagreements were resolved using Table 1 as a basis for discussion. After eliminating any duplicates, an initial screening of titles and abstracts excluded records that did not meet the inclusion
The Effect Of Percussive Therapy On Musculoskeletal Performance And Experiences Of Pain: A Systematic Literature Review International Journal of Sports Physical Therapy
Table 1. Inclusion and exclusion criteria
Inclusion criteria
Studies were included if they meet all the following criteria
All adult populations ≥18 years
Investigated percussive therapy delivered by massage guns
Percussive therapy administered directly to the targeted muscles or tendons for treatment in any location on the body
Literature published in any language. (Articles not in English were translated)
Comparators of alternative, placebo or no treatment
Full-text version of the article was available
Published from January 2006
criteria. Each record was classified as ‘include’, ‘exclude’ or ‘maybe’ to identify relevant and exclude irrelevant literature. The researcher was inclusive at this stage and, if uncertain about the relevance of a publication, it remained in. For records that potentially met the inclusion criteria, the full text was obtained and screened. Studies written in a foreign language were professionally translated into English and screened for eligibility Seven papers required translation from Portuguese, Turkish, Korean, Indonesian, Czech and Spanish. Studies that did not meet the inclusion criteria were listed with the exclusion reason(s) (Supplementary file 2). Two attempts in one month were made to contact original authors to locate publicly unavailable full texts or obtain missing data. Any missing data was not inferred. A flowchart that documents the process outlined above can be found in Supplementary file 3.
DATA EXTRACTION
Data for analysis was extracted from the included studies to assess that all relevant data was captured and that it could be reliably interpreted. Extracted data included participants, study design, interventions, comparators, outcomes, authors, year of study, aim/purpose, type of paper, geographical area, sample size, intervention length, treatment methods, measures of acute or chronic adaptations and key findings that related to the review questions. One reviewer extracted data which was checked for consistency and completeness by all other reviewers, with disagreements resolved by discussion.
CRITICAL APPRAISAL OF INDIVIDUAL SOURCES OF EVIDENCE
The included studies were evaluated using quality appraisal tools. The Mixed Methods Appraisal Tool (MMAT) Version 201822 and Critical Appraisal Skills Programme (CASP) tool23 were tested on two full papers. Both tools have been standardized and validated24,25 and are widely used for systematic review purposes. The CASP tool was selected due to its criteria providing the best cover of the methodologies used in the included studies.
Exclusion criteria
Studies were excluded if they meet any of the following criteria
Populations ≤18 years
Investigated vibration techniques other than percussive therapy delivered by massage guns
Percussive therapy administered indirectly and not directly to the targeted muscle or tendon for treatment in any location on the body
None
No comparative treatment
Full-text version of the article was not available
Published prior to January 2006
RISK OF BIAS IN INDIVIDUAL STUDIES
One reviewer assessed the risk of bias and methodological quality using the Physiotherapy Evidence Database (PEDro) scale26 which was checked for consistency and completeness by all other reviewers. The PEDro scale awards points ranging from 0-10 and studies were deemed high risk of bias and low quality with a score of <3.27
SYNTHESIS OF RESULTS
Findings from the included studies were synthesised narratively with reference to the narrative synthesis guidance, in order to draw conclusions based on the body of evidence. This guidance focusses on synthesising findings from multiple studies which rely on the use of text to summarise and explain findings, and details specific tools and techniques that can be used in the synthesis,28 the purpose of which is to gain insight into the body of knowledge derived from the review.
RESULTS STUDY SELECTION
A preferred reporting items for systematic reviews and meta-analyses (PRISMA) flow-chart of the study selection is shown in Figure 1.29
STUDY CHARACTERISTICS
Study characteristics are summarised in Table 2. A total of 255 adult participants were involved in the studies (n = 13), with at least 18.8% of these being female. There were five studies which involved mixed genders, one female case study, four studies focussing only on males and three studies not reporting participant genders.
Eleven studies considered the effect of PT delivered by massage guns on the lower body (n = 7) and the back (n = 4), with the remaining two focussing on the shoulders. Ten studies examined the effect of PT on flexibility, with five of these combining outcomes of pain, muscle strength
The Effect Of Percussive Therapy On Musculoskeletal Performance And Experiences Of Pain: A Systematic Literature Review International Journal of Sports Physical Therapy
The Effect Of Percussive Therapy On Musculoskeletal Performance And Experiences Of Pain: A Systematic Literature Review
Table 2. Overview of characteristics of included studies
Study Geographical location
Aim Participants Study design Intervention
Konrad et al. (2020)30 Austria Investigate the effects of PT on the calf muscles on ROM and MVC of the plantar flexor muscles
16 healthy recreational male athletes; 27.2±4.2 yrs, 1.79±0.05 m, 79.4±9.1 kg
Blinded cross over randomised control trial
Standardized warm up. PT at 53 Hz with soft attachment head applied to the right calf muscles for 5 min (2.5 min on medial gastrocnemius muscle and 2.5 min on lateral gastrocnemius muscle). PT started at medial side and finished at lateral side, applying same pressure to skin. 1 application of treatment
Comparators Outcomes Key findings
No treatment control group seated in same position as PT group for 6 min
ROM measured with isokinetic dynamometer and MVC measured with dynamometer
ROM: Significant increase in the PT group (p = .002, d = 1.36), no significant change in the control group (p = 0.18, d = .51). The pre-test comparison of both groups showed no significant difference (p = .81).
MVC: No significant difference changes for the PT group (p = .99, r = .17) and control group (p = .65, r = .31). The pre-test comparison of both groups showed no significant difference (p = .67).
Hernandez (2020)31 California, USA Assess effects of PT on athletic performance and passive ROM on muscles of lower body
20 recreational volleyball or basketball college students.
50% female; 25.5±2.5 yrs, 1.69 ±0.10 m, 71.13±14.89 kg
Within subject repeated measures
Standardized warm up. PT applied at 40 Hz bilaterally on quadriceps, hamstrings, gluteus maximus and medius, calves, peroneals and planter muscle group. 30 s per muscle group using standard head attachment. PT performed from proximal to distal, followed by muscle belly at continuous tolerable pressure.
1 application of treatment
Tests performed on each participant with and without treatment
Hip and rectus femoris ROM used Thomas test, 90-90 test for knee ROM and weight bearing lunge test for ankle ROM. Countermovement jump and drop jump landing
ROM: Significant increase after PT in hip (p < .001), ankle (p < .001). Hamstring ROM also increased (p = .001) with no significant increase in rectus femoris (p = .399).
Explosive muscle strength: No significant difference in countermovement jump (p = .65) or drop jump (p = .07).
Park (2020)32
Unknown Examine the effects of PT on the triceps
20 healthy adults Male and
Controlled trial Lying in prone position PT applied to calves along
Static stretch group which
Weight bearing lunge test for closed chain ROM
ROM: Significant increases in both groups (p < .05) and no significant difference between
International Journal of Sports Physical Therapy
Patel & Patel (2020)33
The Effect Of Percussive Therapy On Musculoskeletal Performance And Experiences Of Pain: A Systematic Literature Review
surae on ankle dorsiflexion
ROM
Unknown Assess effects of PT on hamstring flexibility
female direction of muscle fibres for 5min at speed of 30 Hz and amplitude of 10 mm, with head with narrowest side. 3 applications with 30 s break after each minute.
1 application of treatment
stood on triangular wedge with height of 160 mm with bent knees, after 1 min, 30 s rest was given for total of 5 min
and open and closed ROM measured with goniometer on dominant leg only
groups (p = .672) suggesting that PT is as effective as static stretch at increasing ROM.
Mansuri & Patel (2021)34
Visnagar, India Examine effects of PT and ergonomic advice on low back pain among bus drivers
1 adult male 25-year-old
Case Study Lying prone PT applied daily for 1 week at 50 Hz for 5 min on muscle belly of hamstrings with up and down movement using large ball head attachment
Pre and post testing Sit and reach test and 90-90 test for hamstring flexibility
ROM: Flexibility increased.
Seju & Rajput (2021)35
Visnagar, India Investigate the efficacy of PT and surge faradic stimulation in subjects with trapezitis pain
30 adult bus drivers aged 21 to 60 years old
Randomized controlled trial
Lying prone PT applied to lower back for 10 min, 5 times a week for 3 weeks.
Intensity 1st Week level 1 and 2
2nd Week level 3 and 4 3rd week level 5 and 6 Ergonomic advice also given
Control group receiving no treatment
Pain measured on Oswestry low back pain disability questionnaire and NPRS
Pain: Reduced on Oswestry low back pain disability questionnaire (p = .041) and NPRS (p = .004) when PT and ergonomic advice group was compared to control group.
45 recreational volleyball or basketball college students. Male and female. Age 18-30.
Randomized controlled trial
In a sitting position, PT treatment applied to trapezius distal to proximal 3 times a week for 2 weeks for 5 min.
Session 1 and 2level 1 and 2 Session 3 and 4 -
Control group receiving no treatment and group receiving surge faradic treatment at 50 Hz with
Pain measured on VAS and ROM measured by tool and process for cervical spine active range of motion
Pain: Significant improvement after PT compared to surge faradic treatment and no treatment for VAS where score reduced from 2.60 to 1.00 for PT (p < .01).
ROM: Cervical spine active range of motion tool for ROM score improved from 26.2° to
Study Geographical location Aim Participants Study design Intervention
Comparators Outcomes Key findings
International Journal of Sports Physical Therapy
Study
The Effect Of Percussive Therapy On Musculoskeletal Performance And Experiences Of Pain: A Systematic Literature Review
Geographical location Aim Participants Study design Intervention
25.5±2.5 yrs, 1.69±0.10 m, 71.13±14.89 kg
Comparators Outcomes Key findings
Jung & Ha (2020)36 South Korea To establish the effect of PT on shoulder flexibility
level 3 and 4 Session 5 and 6level 5 and 6
contractions decreasing over sessions
36.6°.
Kayoda (2019)37
Unknown Evaluate the effects of PT on shoulder flexibility, strength and pain following rotator cuff repair surgery
13 male adults with less than 50% of normal ROM age 23.9±1.5 yrs, height
168.8±7.0 cm, weight
66.6±14.1 kg
77-year-old female
Within subject repeated measures
Lying on side PT applied for 5min while moving to posterior shoulder muscle (posterior deltoid, infraspinatus, and teres minor muscles) at 30 Hz using round head attachment
Case study PT applied for 5 min at 53 Hz with ball head attachment along supraspinatus muscle belly and midscapular region, 2 days a week for 4 weeks. Also took cannabidiol oil for 1st week of the trial
Pre and post testing Horizontal adduction and internal rotation measured with Image J program
ROM: Horizontal adduction increased 17.7° to 40.8° (p < .05) and internal rotation increased from 32.4° to 59.3° (p < .05).
Pre and post testing VAS for pain, manual muscle test score for strength and degree of movement used for flexibility
Pain: VAS reduced from 5-6 to 0-1 after PT.
ROM: Shoulder abduction improved by 70° with no change in shoulder flexion.
Muscle strength: Improved from 4/5 to 3/5 in manual muscle test score
Godemeche (2020)38
Porto, Portugal Examine the effect of PT on flexibility of lower limbs and lower spine.
25 male adults
24.36±0.68 yrs,
75.48±2.00 kg,
1.78±0.01 m, 23.69±0.48 kg/m2
Crossover randomized controlled study
Lying prone PT applied for 16 min at 33 Hz for 30 s followed by 43 Hz for 30 s and 53 Hz for 1 min to gastrocnemius, hamstrings, gluteus and lumbar muscles with each muscle group being massaged for 2 min unilaterally, for a total of 16 min
Ultrasound for 16 min with device turned off and global re-education posture held for 16 min
Sit and reach test measured with Wells bench used to record flexibility
ROM: Sit and reach showed significant increases after PT (p < .05). Results indicated a significant difference (p < .001) when PT was compared to placebo group and a nonsignificant difference when compared to global reeducation posture (p = .149). PT promoted greater results relative to the global reeducation posture in very active participants.
International Journal of Sports Physical Therapy
Michal (2021)39 Prague, The Czech Republic
The Effect Of Percussive Therapy On Musculoskeletal Performance And Experiences Of Pain: A Systematic Literature Review
Investigate the effect of PT on muscle contraction an indication of explosive strength
6 adults (3 male/3 female) average 22.5 yrs, 173.16 cm and 71.6 kg
Within subject repeated measures
Lying supine PT at 30 Hz for 30 s on quadriceps (10 s vastus medialis/ rectus femoris/ vastus lateralis
Sports massage for 4 min on the front of lower limbs after 5 days’ rest
Tensiomyography to measure change in muscle contraction
Explosive muscle strength: Significant increases in muscle contraction of quadriceps only in participants regularly using PT or massage. Average rate of contraction of vastus medialis increased by 1.21 ms after PT and 1.41 ms after sports massage. Average rate of contraction in vastus lateralis slowed by 0.50 ms in PT and increased by 0.89 ms with sports massage.
GarcíaSillero et al. (2021)4
Malaga, Spain Compare PT against alternative interventions on explosive muscle strength
40 adults (38 male/2 female)
24.3±2.6 yrs; 77.45± 8.3kg; 177.0± 6.4 cm; 24.66± 1.6 kg·m2
Randomized repeated measures
Laying prone, PT with standard ball applied to gastrocnemius muscle at 16 mm amplitude at 30 Hz to muscle origin to insertion for 2 min following direction of muscle fibers to right leg only ensuring constant pressure
Non treated leg. Manual therapy of 15 min therapeutic massage, mechanical vibration on a vibrating platform at 40 Hz for 1 min. Foam rolling of 2 sets of 30 reps
Time of contraction (Tc) and radial displacement (DM) measured with tensiomyography
Explosive muscle strength: Significant increase in Tc post treatment after PT compared to manual vibration (p = .025) and after 24 h compared to manual therapy (p = .023). Significant difference in DM after PT after 24 h in manual therapy (p = .023), manual vibration (p = 0.33) and foam rolling (p < .001). TC changes in PT greatest immediately post treatment (21.1 ms to 20.8 ms). DM changes in PT greatest after 24 h (4.2 mm to 4.6 mm).
Piñero (2019)40
Unknown Consider the effect of Myofascial Induction plus Hypervolt® versus Massage plus Manual Vibration on flexibility and pain
20 adult healthy professional football players with no injuries and injuryfree in the last 2 months.
PT group
22.75±1.41 yrs, 76.85±5.4
Crossover repeated measures
30 min of treatments of myofascial plus PT 15 days between treatments
Massage plus manual vibration Details not clear of specific treatment
Pain measured on VAS, ROM measured with goniometer and explosive strength in cm in jumping longitudinally
ROM: Statistical differences (p < .001) between PT group (9.60°) and alternative treatment (5.20°) inactive knee extension and hamstring extensibility.
Pain: Significant differences in VAS (p = .017) with a mean of 3.80 in PT group compared to 2.80 in the other group.
Explosive muscle strength: After PT there was a significant improvement in explosive muscle strength (p < .001) of
Participants
Key
Study Geographical location Aim
Study design Intervention Comparators Outcomes
findings
International Journal of Sports Physical Therapy
The
Effect Of Percussive Therapy On Musculoskeletal Performance And Experiences Of Pain: A Systematic Literature Review
Kethüdaoğlu & Demirdel E (2021)41
Turkey Investigate the effects of thoracolumbal fascia release techniques on range of motion
181.45±4.62 cm. Other group 22.851.63 yrs, 76.85±5.4 kg; 181.45±4.62 cm.
18 healthy adults (6 male/12 female) average age 24 years, average BMI 27.71 kg/m2
Randomized controlled trial
Laying prone, PT applied to thorocolumbar fascia for 10 min at 12 mm amplitude at 40 Hz in all directions across the lower back. Using 3 different head attachments (large ball, bullet and spinal). Vaseline used for lubrication
Graston techniques applied in the prone position for 10 min, with the device at a 45° angle to the skin and moved in all directions.
Vaseline used for lubrication
Flexibility (lumbar extension and flexion) measured with digital protractor
10.20 ±4.51 cm compared to the application of the alternative treatment where a significant difference (p < .001) was recorded 5.10 ±4.15 cm.
ROM: Non-significant increase between groups in lumbar extension (p = .144) and flexion (p = .185) after PT with no superiority between both treatments. Pre and post data indicated increase after PT of 5 units for flexion (p = .008) and 10 units for extension (p = .008) and after graston technique of 2 units for flexion (p = .012) and 6.7 units for extension (p = .011).
Geographical location Aim Participants Study
Intervention
Key
Study
design
Comparators Outcomes
findings kg;
Notes: PT = Percussive therapy, ROM = range of motion, MVC = maximum voluntary contraction, NPRS = numerical pain rating score, VAS = visual analogue scale Effect sizes interpretation - d = 0.2 small, 0.5 medium, 0.8 large. r = <0.3 small, 0.3-0.5 medium, >0.5 large42
International Journal of Sports Physical Therapy
Figure 1. Preferred reporting items for systematic reviews and meta-analyses flow-chart showing steps followed for selection and inclusion of studies

and/or explosive muscle strength. The remaining three papers focussed solely on either explosive muscle strength or pain. Eleven studies included a control group using a range of comparators, such as no treatment, static stretching and foam rolling, and the final two were case studies. Nine of the studies involved one application of PT with treatment ranging from 30 s to 30 min, and four studies administered multiple treatments over a period of one to four weeks. Only one study reported on the effect of PT 24 h and 48 h post treatment, with the remaining studies assessing the acute effects. A variety of outcome measures and application protocols were used across the studies (Table 3), with twelve (92%) studies using a Theragun or Hypervolt massage gun.
CRITICAL APPRAISAL WITHIN SOURCES OF EVIDENCE
CASP tool quality data for the included studies is presented in Supplementary file 4. All studies had limitations in methodological quality or reporting of findings but still included contextually-rich details that contributed to the overall narrative synthesis and the research questions. Caution was therefore taken when drawing on these details. It was deemed in all studies that the benefits of the intervention outweighed any harms and financial costs, and results could be applied to local populations.
RISK OF BIAS
The PEDro scale risk of bias analysis is presented in Supplementary file 5. PEDro scale scores of 0-3 are considered ‘poor’, 4-5 ‘fair’, 6-8 ‘good’, and 9-10 ‘excellent’.27 Total scores of included studies ranged between two and nine,
with an average score of 5.92±2.1. It was not possible to distinguish between the methodological quality of the trials and the quality of reporting. No studies reported blinding of participants to the intervention they were receiving, or of the therapists to the intervention they were administering. Although blinding of participants and therapists can minimise bias, it is challenging to achieve as physical therapy cannot be masked in a way as, for example, pharmacological substances can.46 It is unclear in ten of the included papers if assessors were blinded when analyzing outcomes, risking potential bias to findings.47
SYNTHESIS OF RESULTS
This systematic review identified 13 studies addressing the effects of PT delivered by massage guns on the physiological adaptations of muscle strength, explosive muscle strength and flexibility, and on experiences of pain. Results of the individual studies are detailed in Table 2
EFFECT ON MUSCLE STRENGTH
Two studies considered the effect of PT on muscle strength; lower body30 and shoulder,37 representing a minor proportion of the population, with a large variance in age, suggesting results may vary with a broader intervention and limiting a wider application of findings into practice.
LOWER BODY
The application of PT had no influence on planter flexor strength immediately after a single treatment as tested us-
The Effect Of Percussive Therapy On Musculoskeletal Performance And Experiences Of Pain: A Systematic Literature Review International Journal of Sports Physical Therapy
Table 3. Specification of percussive therapy massage guns used in the included studies
dynamometer, but
effects of multiple treatments or other strength measures were not considered.30
UPPER BODY
The case study focussing on shoulder strength following rotator cuff surgery indicated an increase in muscle strength for the participant who was eight months post-surgery 37 While case study designs are important, they limit the application of results to the wider population. However, results from this case study must be viewed with caution due to the limitation of strength being assessed by Manual Muscle Testing (MMT) which lacks inter and intra tester reproducibility owing to the subjective nature of the test.48
EFFECT ON EXPLOSIVE MUSCLE STRENGTH
Four studies considered the effect of PT on lower body explosive muscle strength.4,31,39,40
OUTCOME MEASURES
According to studies which measured outcome data with tensiomyography (TMG)4,39 and jumping longitudinally40 there was evidence of improvements in explosive muscle strength. This is in contrast to Hernandez (2020) where PT, when added to a warm-up, had no impact on explosive muscle strength when assessed by counter-jump testing.31 However, this was the only study to report that participants were instructed to wear compressions shorts and no instructions were provided on jumping techniques or squat depth for the counter-jump, which may have impacted the results.
COMBINATION OF TREATMENTS
Piñero (2019) conducted the only study to involve combined treatments.40 Myofascial induction (i.e., mechanical stimuli such as pressure or stretching) was paired with PT and administered 15 days after the first treatment of massage and manual vibration. The results did not consider any long-term effect of the first treatment, and it was impossible to establish whether PT alone was responsible for the significant improvement in explosive muscle strength or the proportion attributable to the other treatments.40
LONG TERM EFFECT
In one study the largest increases in muscle contraction were measured in regular users of massage guns suggesting potential benefits of long-term use of PT, however, these results are limited by the omission of statistical data analysis.39 García-Sillero et al. (2021) re-examined the effect of PT both 24 h and 48 h after treatment, with the greatest changes reported in time of contraction (Tc) (i.e., the time between 10% and 90% of muscle contraction32) immediately following PT and after 24 h for radial displacement.4
GENDER
Of the few studies including male and female participants, only Michal (2021) reported results separately 39 These results showed that PT had a greater effect on explosive muscle strength in women compared to men, with an average increase in the rate of change of contraction as measured by TMG of 4.47±11.67% and 3.64±4.53% respectively.
Study Device Frequency Amplitude Head attachment Konrad et al. (2020) Hypervolt 53Hz 12mma Soft Hernandez (2020) Theragun 40Hzb 16mmb Standard ball Park (2020) Yunmai 30Hz 10mm Narrow sided Patel & Patel (2020) Theragun 50Hz 16mmb Large ball Mansuri & Patel (2021) Theragun Unknownc 16mmb Unknownc Seju & Rajput (2019) Theragun Increasingc 16mmb Balld Jung & Ha (2020) Hypervolt 33Hz 12mme Ball Kayoda (2019) Hypervolt 53Hz 10mme Ball Godemeche (2020) Hypervolt 33/43/53Hz 12mme Ball Michal (2021) Theragun 30Hz 16mmb Unknownc García-Sillero et al. (2021) Theragun 30Hz 16mm Standard balld Piñero (2019) Hypervolt Unknownc Unknownc Unknownc Kethüdaoğlu and Demirdel (2021) Hypervoltd 40Hzd 12mm Large ball, spinal, bulletd a Author confirmed use of normal device with amplitude verified on Hyperice website43 b Amplitude confirmed on Theragun website44 c Unable to contact author to verify d Details confirmed directly with author e Details confirmed verified on Hyperice website45
ing a
the
The Effect Of Percussive Therapy On Musculoskeletal Performance And Experiences Of Pain: A Systematic Literature Review International Journal of Sports Physical Therapy
EFFECT ON FLEXIBILITY
Ten studies focussed on the effect of PT on flexibility, including the back,35,38,41 lower body3,30,31,33,40 and shoulder.36,37 Overall, results indicated an improvement in flexibility in all anatomical locations after PT
MULTIPLE TREATMENTS
There were three studies which considered multiple treatments of PT.33,35,37 Kayoda (2019) highlighted the potential positive effect of long-term use of PT on shoulder flexibility over four weeks, but did not report statistical analysis.37 The remaining studies investigated the impact of PT on flexibility of the trapezius after two weeks of treatment35 and hamstrings after one week.33 All protocols applied a consistent frequency, with the exception of Seju and Rajput (2021), where the frequency set on the massage gun was gradually increased over the period of the intervention35 (Table 2).
SINGLE TREATMENT
There were two other studies which reported on back flexibility; thoracolumbar41 and lumbar,38 and one focusing on the shoulder,36 with all three reporting significant improvements after one application of PT However, one study used Vaseline when applying PT which may have influenced the positive results observed on thoracolumbar flexibility 41 Vaseline is a lubricant which would have enabled the PT gun to glide more easily over the skin but could have impacted body mechanics by applying too much pressure to the targeted muscle.49 Further analysis of the study by Godemeche (2020) suggested that PT promoted greater results in lumbar flexibility only in the very active participants, after increasing the intensity on the massage gun over 16 min of treatment.38 The effect of PT on the calf muscle was considered by three studies3,30,44 with a further study focusing on hamstrings.40 Significant acute improvements in flexibility were reported in all studies after one application of PT, despite the variation in measures used to assess outcome data, brand of massage gun, frequency protocol, amplitude and head attachment. Despite these positive findings, there was also evidence to suggest that the alternative method of static stretching was as effective as a single treatment of PT for increasing flexibility.3
EFFECT ON EXPERIENCES OF PAIN
Considerations of the effect of PT on experiences of pain were made by four studies, which involved the back,34,35 shoulder37 and lower body.40 All the included studies used validated measures of pain; numeric pain rating scale (NPRS), visual analogue scale (VAS)50 and Oswestry Low Back Pain Disability Questionnaire.51
SINGLE TREATMENT
Piñero (2019) examined the effect of PT on pain experienced hamstrings after one application and reported a re-
duction in experiences of pain.40 However, the study did not report on the cause of pain and results did not consider any long-term effect of the first treatment administered 15 days prior to PT, making it impossible to establish whether PT alone was responsible for the reduction in pain, or the proportion attributable to the other treatments.
MULTIPLE TREATMENTS
Two studies investigated experiences of back pain and involved PT five times per week for three weeks34 or three times per week for two weeks35 with a gradual increase in frequency set on the massage gun (Table 2). The significant positive results of these studies suggest benefits of longterm PT use, with the potential to explore increasing the intensity of treatment. Mansuri and Patel (2021) also included a further intervention of ergonomic advice, making it difficult to determine the extent of the positive effect of PT alone.34 This study focussed on bus drivers so there is no evidence to suggest the results would be transferable to other populations. Koyada (2019) investigated the effects on shoulder pain by applying PT twice per week for four weeks, reporting an increase in flexibility 37 However, the participant also took cannabidiol (CBD) oil for the first week of the trial which may have influenced the results, as CBD oil has been used to manage pain.52
COMPARISON TO ALTERNATIVE, PLACEBO OR NO TREATMENT
Overall, there were greater positive results from PT interventions when compared to placebo protocols, no treatment, or alternative treatments, suggesting a superior effectiveness of PT against treatments such as sports massage, WBV and foam rolling.
NO TREATMENT
Six studies reported statistically significant increases in muscle strength, explosive muscle strength, and flexibility after PT when compared with no treatment.4,30,31,34–36 A further two studies did not report statistics, but PT demonstrated an increase in the outcomes of muscle strength, perceptions of pain and flexibility 33,37
ALTERNATIVE TREATMENT
A further five studies compared PT against an alternative treatment (see Table 2) and demonstrated statistically significant increases in explosive muscle strength, flexibility and perceptions of pain after PT.4,35,38,40,41 One study reported a statistically significant increase in flexibility from pre to post PT intervention, with the result being comparable with the alternative treatment of static stretching.3 Michal (2021) did not report statistical results, but the PT intervention demonstrated a greater increase in pre to post explosive muscle strength compared to the alternative treatment of sports massage.39
The Effect Of Percussive Therapy On Musculoskeletal Performance And Experiences Of Pain: A Systematic Literature Review International Journal of Sports Physical Therapy
PLACEBO
Finally, one study reported no improvement in flexibility after the placebo treatment of ultrasound, compared to a statistically significant improvement after PT.38 However, it was not evident if the de-activated ultrasound device touched the skin or hovered over, and whether this may have promoted a physiological response.46
METHODOLOGICAL CHARACTERISTICS
An issue found throughout the literature was the variety of methods used to record the outcome measures. These included dynamometer and manual muscle test for muscle strength, counter jump and TMG for explosive muscle strength, dynamometer and lunge test for flexibility, and NPRS and VAS for experiences of musculoskeletal pain (Table 2). Further heterogeneity was evident in the specification set on the PT massage guns and Table 3 summarises the comparison between protocols used across the 13 included studies. This variety of methods makes it difficult to draw overall conclusions on the studies included and future research should consider developing a standardised protocol.
DISCUSSION SUMMARY OF EVIDENCE
MUSCLE STRENGTH
Although only represented by limited number of studies, this review found there was a positive effect of PT on upper body muscle strength,37 with no changes observed in the lower body 30 It should be recognised that this evidence for the positive impact on muscle strength is limited as it is based on a single case-study that utilized a subjective method of strength assessment (MMT), thus questioning the reliability and validity of the results. However, comparisons can be made to a systematic review by Alghadir et al. (2018) which considered the effect of localized vibration on muscle strength. The types of vibration included in the review varied and included, for example, a percussion hammer, electric-powered dumbbell and vibrating cable. While 82% of the included studies found a significant improvement in upper and lower body strength, it was noted there was a lack of robustness and consistency in methodology, thus hindering the recommendation for an effective protocol.15 This is consistent with findings in this current review It should be considered that a review of the application of vibration in sport suggested that a duration of 630 minutes could lead to a decrease in muscle strength.53 Furthermore, a study that considered the effect of vibration on peak torque of the quadriceps 300 days after anterior cruciate ligament (ACL) reconstruction surgery supported the positive results of vibration treatment. There was a statistically significant difference in peak torque between the treated group and the control group, with results indicating an almost complete recovery following vibration treatment.54
EXPLOSIVE MUSCLE STRENGTH
The results of the current review concluded that PT can promote an increase in explosive muscle strength4,31,39,40 supporting the narrative review by Germann et al. (2018) on the effect of local vibration on various outcomes, such as muscle strength, power and flexibility.13 Overall, the 21 studies reported that local vibration elicits beneficial changes in the outcomes being measured. The term “local vibration” encompassed a wide range of devices such as WBV, vibrating cables and devices strapped over the muscle, resulting in an array of vibration protocols and adding to the uncertainty about the most effective treatment.13
In contrast, the results of this current review on the positive effect of PT on explosive muscle strength contradicts research which investigated the effect of tapotement on ankle flexibility and explosive power 55 It is deemed that PT delivered by massage guns mimics the therapeutic effects of tapotement massage therapy5 and Mckechnie et al. (2007) reported results which indicated an increase in flexibility, but no change in explosive power 55 This is further supported by recent studies investigating the impact of PT on vertical jump height which concluded there was no acute effect on explosive muscle strength after two minutes56 or five minutes57 of treatment.
FLEXIBILITY
Multiple studies included in this review reported an increase in flexibility after PT 3,30,31,33,35–38,40,41 However, there was no significant difference in improvements in flexibility observed after PT, when compared to traditional static stretching.3 This indicates that the impact of PT may not be particularly novel in this outcome. There is conflicting evidence of the effect of PT on flexibility of the lower body, with some studies reporting positive effects58,59 and other investigations observing no significant adaptation.60,61 The positive results are supported the meta-analysis by Osawa and Oguma (2013) which investigated the acute and chronic effects of vibration on flexibility. Conclusions were similar to this current review, in that positive associations were recorded following vibration treatment. The review included 19 articles involving a combination of WBV, cycloid vibration and specifically made equipment. Again, there was diversity in the vibration device settings which prevents identification of the most effective protocol for promoting flexibility adaptations.16 A review of the application of vibration in sport suggested a duration of four minutes could elicit increases in flexibility53 and the results of the meta-analysis by Osawa and Oguma (2013) are further supported by a recent study which suggested that vibration foam rolling, with the intensity of vibration set at a frequency of 48 Hz, significantly increased flexibility without compromising muscle strength or performance.62
EXPERIENCES OF PAIN
This current review indicates that multiple treatments of PT could reduce experiences of musculoskeletal pain.34,35,37,40 This was also evident from a recent meta-
The Effect Of Percussive Therapy On Musculoskeletal Performance And Experiences Of Pain: A Systematic Literature Review International Journal of Sports Physical Therapy
analysis and systematic review which focussed on the benefits of vibration on delayed-onset of muscle soreness (DOMS).14 Ten studies were included in the review which measured changes using the VAS after a variety of vibration interventions, such as WBV, cycloid vibration and sonic vibration. Results indicated that vibration reduced DOMS at 24 h, 48 h and 72 h, with the suggestion that the greatest effect was evident after 48 h. A number of exercises were used to elicit DOMS, such as downhill walking and strength training which contributed to the heterogeneity between studies, along with the variety in application protocols. This result is further supported by research which concluded that PT was effective in acutely reducing lower body pain resulting from DOMS.61,63
PAIN VS FLEXIBILITY
Studies in this review reported that reductions in experiences of musculoskeletal pain also demonstrated improvements in flexibility 35,37,40 It is worth considering if improvements in flexibility in response to PT play a significant role in pain reduction. Data from previous studies have indicated a relationship between stretching-based programmes and reduced hamstring,64 low back,65 quadriceps and anterior knee pain.66 Interestingly, the Patel and Patel (2020) hamstring flexibility study, also considered changes in experiences of lumbar pain following the same treatment applied to hamstrings. Pain, measured using the NPRS, indicated a reduction in pre (score = 8) to post treatment (score = 2) suggesting that PT had a positive effect on experiences of back pain, and highlighting possible advantages of indirect treatment.
GATE CONTROL THEORY OF PAIN
When PT is applied to the muscle belly or tendon it activates the muscle fibres67 and induces a tonic vibration reflex, which involves the sustained contraction of the vibrated muscle and relaxation of its antagonist.68,69 This stimulation further promotes excitability in the muscle spindles afferent nerve fibres70 and these impulses are transmitted to the spinal cord and are believed to trigger an analgesic effect, as suggested by the gate control theory of pain. This theory suggests vibration causes a more closed position of the ‘gate’, thereby reducing the sensation of pain.71
METABOLIC CHANGES FROM PERCUSSIVE THERAPY
Research suggests that exposure to vibration or PT promotes an increased metabolic activity occurring within the muscles, including increased blood flow,72 oxygen saturation73 and temperature.74 These acute physiological responses may be contributing to the positive muscle strength and explosive muscle strength results seen in this review
LIMITATIONS
The methodological characteristics of included studies were heterogenetic in the variety of methods used to record the outcome measures and the specific vibration parameters. This makes it inappropriate to compare the results of the included studies and draw conclusions concerning the most reliable and effective protocol. As 62.4% of participants across the studies were healthy active young adults, with another 30.2% experiencing pain, the effect of PT on the specified outcomes appears to be most advantageous for these populations and may not be generalisable to other groups. There were a number of studies identified by the search criteria which were published only as conference papers, which did not have full papers available, and these were excluded.
There are also number of strengths we would like to highlight:
• PRISMA guidelines were followed, and stringent inclusion and exclusion criteria were adhered to in the selection of the review articles ensuring transparency and robustness throughout.
• The review used broad inclusion criteria for the paper type (e.g. primary studies, conference presentations, Doctoral theses) resulting in an extensive literature search, enabling literature to be included that would otherwise be missed.
• Some articles were professionally translated from different languages (Portuguese, Turkish, Korean, Indonesian, Czech and Spanish) as it was deemed important to include these studies as they provided information in line with the research questions of this paper.
CONCLUSION
The results of this systematic literature review infer that PT, delivered by massage guns, can promote an acute response in muscle strength, explosive muscle strength, flexibility, and experiences of pain, when compared to alternative, placebo or no treatment. The evidence suggests that PT has an acute effect on improving musculoskeletal performance with a single application, whereas multiple treatments are required to reduce experiences of back and shoulder pain. In addition, there is an under representation of females in sports science and sports therapy research75,76 and future studies should look to establish any differences between genders or just the impact of PT on females as a cohort, to achieve an equal knowledge about female participants. Further research should establish a standard, validated treatment protocol to allow analysis across populations and those with specific performance needs or pain, as well as considering the chronic effects of PT and the impact of multiple treatments.
The Effect Of Percussive Therapy On Musculoskeletal Performance And Experiences Of Pain: A Systematic Literature Review International Journal of Sports Physical Therapy
CONFLICTS OF INTEREST
The authors have no conflicts of interest.
Submitted: September 06, 2022 CDT, Accepted: February 13, 2023 CDT
This is an open-access article distributed under the terms of the Creative Commons Attribution 4.0 International License (CCBY-NC-4.0). View this license’s legal deed at https://creativecommons.org/licenses/by-nc/4.0 and legal code at https://creativecommons.org/licenses/by-nc/4.0/legalcode for more information.
The Effect Of Percussive Therapy On Musculoskeletal Performance And Experiences Of Pain: A Systematic Literature Review International Journal of Sports Physical Therapy
REFERENCES
1. Comeaux Z. Dynamic fascial release and the role of mechanical/vibrational assist devices in manual therapies. J Bodyw Mov Ther. 2010;15(1):35-41. doi:1 0.1016/j.jbmt.2010.02.006
2. Martin J. A critical evaluation of percussion massage gun devices as a rehabilitation tool focusing on lower limb mobility: A literature review SportRvix Published online 2021. doi:10.31236/osf.io/j9ya8
3. Park S. Effect of local vibration on triceps surae flexibility compared to static stretching. J Kor Phys Ther 2020;32(4):245-249. doi:10.18857/jkpt.2020.3
2.4.245
4. García-Sillero M, Benítez-Porres J, García-Romero J, Bonilla DA, Petro JL, Vargas-Molina S. Comparison of interventional strategies to improve recovery after eccentric exercise-induced muscle fatigue. Int J Environ Res Public Health 2021;18(2):647 doi:10.339 0/ijerph18020647
5. Moraska A. Sports massage: A comprehensive review J Sports Med Phys Fitness 2005;45:370-380.
6. Wu S, Ning HT, Xiao SM, et al. Effects of vibration therapy on muscle mass, muscle strength and physical function in older adults with sarcopenia: A systematic review and meta-analysis. Eur Rev Aging Phys Act. 2020;17(1):14. doi:10.1186/s11556-020-002 47-5
7 Barss TS, Collins DF, Miller D, Pujari AN. Indirect vibration of the upper limbs alters transmission along spinal but not corticospinal pathways. Front Hum Neurosci 2021;15. doi:10.3389/fnhum.2021.6176 69
8. Fuller JT, Thomson RL, Howe PRC, Buckley JD Vibration therapy is no more effective than the standard practice of massage and stretching for promoting recovery from muscle damage after eccentric exercise. Clin J Sport Med 2015;25(4):332-337. doi:10.1097/jsm.0000000000000 149
9. Kraft K, Kanter S, Janik H. Safety and effectiveness of vibration massage by deep oscillations: A prospective observational study Evid-based Complement Alternat Med 2013;2013:679210-679248. doi:10.1155/2013/679248
10. de Benito Trigueros AM, Valldecabres R, Ceca D, Richards J, Barrachina Igual J, Pablos A. Effect of vibration vs non-vibration foam rolling techniques on flexibility, dynamic balance and perceived joint stability after fatigue. PeerJ 2019;7:e8000. doi:10.771 7/peerj.8000
11. Rasti E, Rojhani-Shirazi Z, Ebrahimi N, Sobhan MR. Effects of whole body vibration with exercise therapy versus exercise therapy alone on flexibility, vertical jump height, agility and pain in athletes with patellofemoral pain: a randomized clinical trial. BMC Musculoskelet Disord. 2020;21(1):705. doi:10.1186/s12 891-020-03732-1
12. Poston B, Holcomb WR, Guadagnoli MA, Linn LL. The acute effects of mechanical vibration on power output in the bench press. J Strength Cond Res 2007;21(1):199-203. doi:10.1519/00124278-20070200 0-00036
13. Germann D, Bouse A el, Shnier J, Abdelkader N, Kazemi M. Effects of local vibration therapy on various performance parameters: A narrative literature review J Can Chiropr Assoc 2018;62(3):170-181. http://libezproxy.open.ac.uk/logi n?url=https://search.ebscohost.com/login.aspx?direc t=true&db=s3h&AN=133718166&site=ehost-live&sc ope=site
14. Lu X, Wang Y, Lu J, et al. Does vibration benefit delayed-onset muscle soreness?: a meta-analysis and systematic review J Int Med Res 2019;47(1):3-18. do i:10.1177/0300060518814999
15. Alghadir AH, Anwer S, Zafar H, Iqbal ZA. Effect of localised vibration on muscle strength in healthy adults: a systematic review. Physiotherapy. 2018;104(1):18-24. doi:10.1016/j.physio.2017.06.006
16. Osawa Y, Oguma Y Effects of vibration on flexibility: A meta-analysis. J Musculoskel Neuron. 2013;13(4):442-453.
17 Jones P, Comfort P Strength and conditioning. A comprehensive guide to sports physiology and injury management. Published online 2020:25-45. doi:10.10 16/b978-0-7020-7489-9.00004-1
18. Dunleavy K, Lulofs-MacPherson K, Slowik AK. Relationship between impairments and function. Therap Exerc Prescrip Published online 2019:60-81. d oi:10.1016/b978-0-323-28053-2.00003-x
The Effect Of Percussive Therapy On Musculoskeletal Performance And Experiences Of Pain: A Systematic Literature Review International Journal of Sports Physical Therapy
19. Kurt C. Alternative to traditional stretching methods for flexibility enhancement in well-trained combat athletes: Local vibration versus whole-body vibration. Biol Sport. 2015;32(3):225-233. doi:10.560 4/20831862.1150305
20. Treede RD The International Association for the Study of Pain definition of pain: as valid in 2018 as in 1979, but in need of regularly updated footnotes. Pain Rep 2018;3(2):e643. doi:10.1097/pr9.0000000000000 643
21. Shamseer L, Moher D, Clarke M, et al. Preferred reporting items for systematic review and metaanalysis protocols (PRISMA-P) 2015: elaboration and explanation. Brit Med J. 2015;349:g7647. doi:10.1136/ bmj.g7647
22. Hong Q, Pluye P, Fàbregues S, et al. Mixed Methods Appraisal Tool (MMAT) Version 2018 User Guide. Published 2018. Accessed March 18, 2021. htt p://mixedmethodsappraisaltoolpublic.pbworks.com/
23. CASP. CASP CHECKLISTS - CASP - Critical Appraisal Skills Programme. Published 2020. Accessed March 18, 2021. https://casp-uk.net/casp-to ols-checklists/
24. Long HA, French DP, Brooks JM. Optimising the value of the critical appraisal skills programme (CASP) tool for quality appraisal in qualitative evidence synthesis. Res Methods Med Health Sci 2020;1(1):31-42. doi:10.1177/2632084320947559
25. Hong QN, Pluye P, Fàbregues S, et al. Improving the content validity of the mixed methods appraisal tool: a modified e-Delphi study J Clin Epidemiol 2019;111:49-59.e1. doi:10.1016/j.jclinepi.2019.03.008
26. Moseley AM, Rahman P, Wells GA, et al. Agreement between the Cochrane risk of bias tool and Physiotherapy Evidence Database (PEDro) scale: A meta-epidemiological study of randomized controlled trials of physical therapy interventions. PLoS One. 2019;14(9):e0222770. doi:10.1371/journa l.pone.0222770
27 Cashin AG, McAuley JH. Clinimetrics: Physiotherapy Evidence Database (PEDro) Scale. J Physiother 2020;66(1):59. doi:10.1016/j.jphys.2019.0 8.005
28. Popay J, Roberts H, Sowden A, et al. Guidance on the Conduct of Narrative Synthesis in Systematic Reviews: A Product from the ESRC Methods Programme. Lancaster University; 2006. doi:10.13140/ 2.1.1018.4643
29. Moher D, Liberati A, Tetzlaff J, Altman DG. Preferred Reporting Items for Systematic Reviews and Meta-Analyses: The PRISMA Statement. PLoS Med 2009;6(7):e1000097. doi:10.1371/journal.pmed.10000 97
30. Konrad A, Glashüttner C, Reiner MM, Bernsteiner D, Tilp M. The acute effects of a percussive massage treatment with a hypervolt device on plantar flexor muscles’ range of motion and performance. J Sports Sci Med. 2020;19(4):690-694.
31. Hernandez FA. Effects of Percussion Therapy (TheragunTM) on Range of Motion and Athletic Performance California State University, Long Beach; 2020.
32. Park S. Theory and usage of tensiomyography and the analysis method for the patient with low back pain. J Exerc Rehabil. 2020;16(4):325-331. doi:10.1296 5/jer.2040420.210
33. Patel R, Patel A. Effect of Theragun on the improvement of back flexibility: A case study. J Med Dent Sci 2020;32(5):15-16.
34. Mansuri U, Patel S. Effectiveness of Theragun and ergonomic advice in patients with low back pain among bus drivers-A randomized controlled trial. Int J Sci Res Published online 2021. Accessed October 26, 2021. https://www.researchgate.net/profile/Shivani-P atel-88/publication/354857663_Effectiveness_of_Ther agun_and_Ergonomic_Advice_in_Patients_with_Low_B ack_Pain_among_Bus_Drivers_-_A_Randomized_Contr olled_Trial/links/6151507bf8c9c51a8af662a2/Effective ness-of-Theragun-and-Ergonomic-Advice-in-Patient s-with-Low-Back-Pain-among-Bus-Drivers-A-Rando mized-Controlled-Trial.pdf
35. Seju Y, Rajput V Efficacy of Theragun and surge faradic stimulation in subjects with trapezitis: a randomized controlled trial. Int J Sci Res 2021;10(4):46-49.
36. Jung SH, Ha SM. Effects of local vibration on shoulder horizontal adduction and internal rotation range of motion in subject with posterior shoulder tightness. J Musculoskelet Sci Technol. 2020;4(2):66-69. doi:10.29273/jmst.2020.4.2.66
37 Kayoda K. The influence of the HypervoltTM on shoulder range of motion, strength, and pain following rotator cuff repair surgery Published online 2019. Accessed October 25, 2021. https://searc h.proquest.com/openview/28922e36eda51495d44667 32aa39a4bf/1?pq-origsite=gscholar&cbl=51922&dis s=y
The Effect Of Percussive Therapy On Musculoskeletal Performance And Experiences Of Pain: A Systematic Literature Review International Journal of Sports Physical Therapy
38. Godemeche N. Eficácia da massagem por vibração localizada, na flexibilidade dos músculos da cadeia posterior em adultos ativos e desportistas. Published online 2020. Accessed October 25, 2021. https://bdigi tal.ufp.pt/handle/10284/9120
39. Michal L. Komparace změny rychlosti kontrakce svalu pomocí masážní pistole" TheraGun" a sportovní masáže. Published online 2021. Accessed October 25, 2021. https://dspace.cuni.cz/bitstream/handle/20.50 0.11956/147640/130316774.pdf?sequence=1
40. Piñero MM. Análisis de la efectividad de la inducción miofascial más hypervolt® frente a masaje más vibración manual en musculatura isquiotibial para la prevención de lesiones. Published online 2019. Accessed October 25, 2021. http://repositorio.u cjc.edu/handle/20.500.12020/876
41. Kethüdaoğlu MO, Demirdel E. Sağlıklı bireylerde torakolumbal fasya gevşetme tekniklerinin eklem hareket açıklığı, eklem pozisyon hissi ve enduransa etkilerinin incelenmesi: pilot çalışma. dergipark.org.tr Published online 2021. Accessed October 25, 2021. https://dergipark.org.tr/en/pub/tjh r/issue/65154/970912
42. Cohen J. Statistical Power Analysis for the Behavioral Sciences 2nd ed. Lawrence Erlbaum Associates, Publishers; 1988.
43. Hyperice. CompareHypervoltModels.png (1198×1404). Published 2021. Accessed October 21, 2021. https://hypericeuk.zendesk.com/hc/en-gb/articl e_attachments/4402962898203/CompareHypervoltMo dels.png
44. Therabody. Theragun Pro. Accessed September 30, 2021. https://www.therabody.com/us/en-us/pro-u s.html
45. Hypervolt. Specifications (Hypervolt) – Hyperice. Specifications. Accessed March 31, 2022. https://hype rice.zendesk.com/hc/en-us/articles/360056728033-Sp ecifications-Hypervolt-
46. Hecksteden A, Faude O, Meyer T, Donath L. How to construct, conduct and analyze an exercise training study? Front Physiol. 2018;9(JUL). doi:10.338 9/fphys.2018.01007
47 Minns Lowe CJ, Wilson MS, Sackley CM, Barker KL. Blind outcome assessment: The development and use of procedures to maintain and describe blinding in a pragmatic physiotherapy rehabilitation trial. Clin Rehabil. 2010;25(3):264-274. doi:10.1177/0269215510
380824
48. Bittmann FN, Dech S, Aehle M, Schaefer L v Manual muscle testing—force profiles and their reproducibility Diagnostics 2020;10(12):996. doi:10.3 390/diagnostics10120996
49. Salvo SG. Massage therapy : principles and practice. Published online 2015:820.
50. Hawker GA, Mian S, Kendzerska T, French M. Measures of adult pain: Visual Analog Scale for Pain (VAS Pain), Numeric Rating Scale for Pain (NRS Pain), McGill Pain Questionnaire (MPQ), Short-Form McGill Pain Questionnaire (SF-MPQ), Chronic Pain Grade Scale (CPGS), Short Form-36 Bodily Pain Scale (SF-36 BPS), and Measure of Intermittent and Constant Osteoarthritis Pain (ICOAP). Arthritis Care Res 2011;63(SUPPL. 11):S240-S252. doi:10.1002/ac r.20543
51. Yates M, Shastri-Hurst N. The Oswestry Disability Index. Occup Med 2017;67(3):241-242. doi:10.1093/o ccmed/kqw051
52. Gamelin FX, Cuvelier G, Mendes A, et al. Cannabidiol in sport: Ergogenic or else? Pharmacol Res 2020;156:104764. doi:10.1016/j.phrs.2020.10476
53. Issurin V Vibrations and their applications in sport: A review J Sports Med Phys Fitness 2005;45:324-336.
54. Brunetti O, Filippi GM, Lorenzini M, et al. Improvement of posture stability by vibratory stimulation following anterior cruciate ligament reconstruction. Knee Surg Sports Traumatol Arthrosc 2006;14(11):1180-1187 doi:10.1007/s00167-006-010 1-2
55. McKechnie GJB, Young WB, Behm DG. Acute effects of two massage techniques on ankle joint flexibility and power of the plantar flexors. J Sports Sci Med 2007;6(4):498-504. https://pubmed.ncbi.nl m.nih.gov/24149484
56. Byrne P, Aquino M, Spor C, et al. The effect of percussive massage versus foam rolling aided warmup on vertical jump performance: 3818 Board #135 May 30 8:00 AM - 9:30 AM. Med Sci Sports Exerc. 2020;52(7 Suppl):1047 doi:10.1249/01.mss.00006869 96.99371.25
57 Kujala R, Davis C, Young L. The effect of handheld percussion treatment on vertical jump height. Int J Exerc Sci 2019;8(7). Accessed June 1, 2021. https://di gitalcommons.wku.edu/ijesab/vol8/iss7/75
4
The Effect Of Percussive Therapy On Musculoskeletal Performance And Experiences Of Pain: A Systematic Literature Review International Journal of Sports Physical Therapy
58. Guzman S, Blanchet DA, Cook L, et al. The effects of a single percussive therapy application on active lower body range of motion. Med Sci Accessed May 14, 2021. https://www.cpp.edu/~honorscollege/docu ments/convocation/SCI/KIN_Guzman.pdf
59. Diaz J, Spor C, Mullin R, et al. The acute effect of percussive massage or static stretching on hamstring flexibility. Med Sci Sports Exerc. 2020;52(7 Suppl):1048. doi:10.1249/01.mss.0000687004.99525.2 4
60. Rogers NL, Rogers ME. Effects of percussion massage on hamstring and low back flexibility Med Sci Sports Exerc 2020;52(7 Suppl):33. doi:10.1249/0 1.mss.0000670348.23875.a0
61. Schneider B, VunCannon B, Crawford M. Manual massage compared to instrument assisted percussive massage effects related to acute doms and range of motion in collegiate track athletes. maatad5.org. Accessed October 25, 2021. https://www.maatad5.or g/wp-content/uploads/2021/03/Brandy-Schneider-Bra ndy-Schneider-2021-Virtual-Poster.pdf
62. Nakamura M, Sato S, Kiyono R, et al. Comparison between foam rolling with and without vibration on passive and active plantar flexor muscle properties. J Strength Cond Res 2021;36(12):3339-3344. doi:10.151 9/jsc.0000000000004123
63. Rogers ME, Rogers NL. effects of percussion massage on delayed onset muscle soreness. Med Sci Sports Exerc. 2020;52(7 Suppl):33. doi:10.1249/01.ms s.0000670344.19320.57
64. Kim G, Kim H, Kim WK, Kim J. Effect of stretching-based rehabilitation on pain, flexibility and muscle strength in dancers with hamstring injury: a single-blind, prospective, randomized clinical trial. J Sports Med Phys Fitness. 2018;58(9):1287-1295. doi:10.23736/s0022-4707.17.07
554-5
65. Lawand P, Lombardi Júnior I, Jones A, Sardim C, Ribeiro LH, Natour J. Effect of a muscle stretching program using the global postural reeducation method for patients with chronic low back pain: A randomized controlled trial. Joint Bone Spine 2015;82(4):272-277 doi:10.1016/j.jbspin.2015.01.015
66. Behm DG, Kay AD, Trajano GS, Alizadeh S, Blazevich AJ. Effects of acute and chronic stretching on pain control. J Clin Exerc Physiol 2021;10(4):150-159. doi:10.31189/2165-6193-10.4.15
67 Melzack R, Wall PD Pain Mechanisms: A new theory. Science. 1965;150(3699):971-979. doi:10.1126/ science.150.3699.971
68. Cochrane DJ. The potential neural mechanisms of acute indirect vibration. J Sports Sci Med. 2011;10(1):19-30.
69. Saggini R, ed. The Mechanical Vibration: Therapeutic Effects and Applications. Bentham Science Publishers; 2017 doi:10.2174/9781681085081117010
70. Roll JP, Vedel JP, Ribot E. Alteration of proprioceptive messages induced by tendon vibration in man: a microneurographic study Exp Brain Res 1989;76(1):213-222. doi:10.1007/bf00253639
71. Hollins M, McDermott K, Harper D. How does vibration reduce pain? Perception 2014;43(1):70-84. doi:10.1068/p7637
72. Venslauskas M, Ostasevicius V, Vilkinis P. Influence of low-frequency vibrations on blood flow improvement in human’s limbs. Biomed Mater Eng 2017;28(2):117-130. doi:10.3233/bme-171661
73. Percival S, Sims DT, Stebbings GK. Local vibration therapy increases oxygen re-saturation rate and maintains muscle strength following exerciseinduced muscle damage. J Athl Train 2021;57(5):502-509. doi:10.4085/1062-6050-0064.21
74. Cochrane DJ, Stannard SR, Firth EC, Rittweger J. Comparing muscle temperature during static and dynamic squatting with and without whole-body vibration. Clin Physiol Funct Imaging. 2010;30(4):223-229. doi:10.1111/j.1475-097x.2010.00 931.x
75. Paul RW, Sonnier JH, Johnson EE, et al. Inequalities in the evaluation of male versus female athletes in sports medicine research: a systematic review. Am J Sports Med. 2022;0(0):036354652211312. doi:10.1177/03635465221131281
76. Elliott-Sale KJ, Minahan CL, de Jonge XAKJ, et al. Methodological considerations for studies in sport and exercise science with women as participants: a working guide for standards of practice for research on women. Sports Med. 2021;51(5):843-861. doi:10.10 07/s40279-021-01435-8
0
1
The Effect Of Percussive Therapy On Musculoskeletal Performance And Experiences Of Pain: A Systematic Literature Review International Journal of Sports Physical Therapy
SUPPLEMENTARY MATERIALS
Supplementary file 1
Download: https://ijspt.scholasticahq.com/article/73795-the-effect-of-percussive-therapy-on-musculoskeletalperformance-and-experiences-of-pain-a-systematic-literature-review/attachment/ 154167.docx?auth_token=8KYDPPBSSCSzSReqnemp
Supplementary file 2
Download: https://ijspt.scholasticahq.com/article/73795-the-effect-of-percussive-therapy-on-musculoskeletalperformance-and-experiences-of-pain-a-systematic-literature-review/attachment/ 154887.docx?auth_token=8KYDPPBSSCSzSReqnemp
Supplementary file 3
Download: https://ijspt.scholasticahq.com/article/73795-the-effect-of-percussive-therapy-on-musculoskeletalperformance-and-experiences-of-pain-a-systematic-literature-review/attachment/ 154888.docx?auth_token=8KYDPPBSSCSzSReqnemp
Supplementary file 4
Download: https://ijspt.scholasticahq.com/article/73795-the-effect-of-percussive-therapy-on-musculoskeletalperformance-and-experiences-of-pain-a-systematic-literature-review/attachment/ 154889.docx?auth_token=8KYDPPBSSCSzSReqnemp
Supplementary file 5
Download: https://ijspt.scholasticahq.com/article/73795-the-effect-of-percussive-therapy-on-musculoskeletalperformance-and-experiences-of-pain-a-systematic-literature-review/attachment/ 154890.docx?auth_token=8KYDPPBSSCSzSReqnemp
The Effect Of Percussive Therapy On Musculoskeletal Performance And Experiences Of Pain: A Systematic Literature Review International Journal of Sports Physical Therapy
Benoit-Piau J, Benoit-Piau C, Gaudreault N, Morin M. Effect of Conservative Interventions for Musculoskeletal Disorders in Preprofessional and Professional Dancers: A Systematic Review. IJSPT. Published online April 1, 2023:328-337. doi:10.26603/001c.73793
Systematic Review/Meta-Analysis
Effect of Conservative Interventions for Musculoskeletal Disorders in Preprofessional and Professional Dancers: A Systematic Review
Justine Benoit-Piau1 , Christophe Benoit-Piau2 , Nathaly Gaudreault1 , Mélanie Morin1a
1 Faculty of medicine and health sciences, Université de Sherbrooke, 2 Faculty of dance, Université du Québec à Montréal
Keywords: dancer, conservative treatment, prevention https://doi.org/10.26603/001c.73793
International Journal of Sports Physical Therapy
Background
Preprofessional and professional dancers are among the athletes who sustain the most musculoskeletal disorders. In recent years, conservative treatment and preventive measures have been investigated in this population. However, no systematic review regarding their effectiveness has been conducted.
Hypothesis/Purpose
The aim of this systematic review was to locate, appraise and synthesize the available information on conservative interventions currently used for treating and preventing MSK disorders and their effect on pain and function in preprofessional and professional dancers.
Study design Systematic review Methods
A systematic literature search was conducted using PubMed, CINHAL, ERIC, SportDiscus and Psychology and behavioral science collection. Prospective and retrospective cohort studies, as well as randomized and non-randomized controlled trials investigating conservative interventions for musculoskeletal disorders in preprofessional and professional dancers were included in this study. The main outcome measures included pain intensity, function, and performance. All included studies were evaluated for risk of bias using the Downs and Black checklist.
Results
Eight studies were included in the review These studies included ballet and contemporary dancers, as well as professional and preprofessional dancers. In total, the studies included 312 dancers, 108 male and 204 female. Studies had a risk of bias that ranged from poor (8/28) to good (21/28) on the Downs and Black checklist. The conservative interventions used included customized toe caps, dry-needling, motor imagery, and strength and conditioning programs. The use of customized toe caps, motor imagery and strength and conditioning programs had promising results regarding pain and function in dancers.
Conclusion
In order to reach a solid conclusion, more quality studies are needed. The addition of control groups to studies, as well as multimodal interventions should be considered.
Corresponding author
Melanie.m.morin@usherbrooke.ca
Faculty of Health Medicine and Science
Université de Sherbrooke
3001 12e avenue N
Sherbrooke QC Canada J1H5N4
Tel : 819-821-8000 P.13818
a
INTRODUCTION
Preprofessional and professional dancers have a 90% lifetime incidence of developing musculoskeletal (MSK) disorders, including injuries and pain.1 Dancers will sustain an average of one to two injuries per season.2–6 Dance related MSK disorders affect dancers’ physical and mental health, sometimes even threatening their careers.7,8 Hamilton et al. have found that the most injured are the preprofessional dancers who end their career prematurely 8 MSK disorders can also have serious consequences for the school or company where the dancers train.4 A dancer’s absence will affect the training of the other dancers and put financial pressure on their company.7 MSK disorders also carry a heavy personal and societal economic burden, as 60% of injured dancers will require a costly imaging examination or referral for their psychological health.1,3 MSK disorders can occur as a result of trauma or overuse of the MSK system. Overuse injuries account for 66-79% of all MSK disorders.2,3,6,9 Among dancers, overuse injuries are often related to a repeated faulty movement pattern or an excessive mechanical load that increases over time with the progression of their career.9 This highlights the importance of identifying best practices to either prevent or treat MSK disorders.
Even though dance is considered an art form, dancers are often regarded as athletes due to the high physical demand of their practice and therefore benefit from training to prevent injury 10 Many authors have supported the idea that conservative interventions such as strengthening and conditioning programs are one way of improving the dancers’ fitness and decreasing injury risk factors.11–15
Regarding treatment, conservative modalities specific to dancers have emerged in recent years. These types of interventions include physical therapy (e.g., manual therapy, strength and conditioning programs), massage therapy as well as interventions provided by other health care professionals.
However, scientific evidence on the effects and efficacy of conservative interventions to prevent and treat MSK disorders has never been synthesized, and the level of proof for these interventions has not been reported. Considering the high level of injuries among dancers and the unique physical demands of this art form, there is an urgent need for practitioners to identify effective conservative treatments to prevent or treat MSK disorders in dancers.
The aim of this systematic review was to locate, appraise and synthesize the available information on conservative interventions currently used for treating and preventing MSK disorders and their effect on pain and function in preprofessional and professional dancers.
METHODS
This systematic review was conducted according to the Preferred Reporting Items for Systematic Reviews and MetaAnalyses (PRISMA) guidelines. The protocol was registered on the international prospective register of systematic reviews (PROSPERO CRD42021258563).
SEARCH STRATEGY
The following bibliographic databases were searched from inception to August 21st , 2022: Cinahl, Medline, ERIC, Sportdiscus, Psychology and behavioral science collection. A combination of keywords associated to the population (dance, preprofessional, professional) and outcomes (pain, function, performance) were used in the search. The full search strategy is presented in Appendix 1. No language restrictions were applied to the search. Grey literature was searched on the websites of Healthy Dancer Canada and the International Association for Dance Medicine and Science. The reference lists of eligible articles found in the main search were also screened for additional articles.
ELIGIBILITY CRITERIA
The literature review included prospective and retrospective cohort studies as well as randomized controlled trials (RCTs) investigating the effect of at least one conservative intervention on professional and preprofessional dancers. Both injured and uninjured dancers at the time of intervention were included for treatment or prevention of MSK disorders. Case series and case reports were excluded.
Studies involving preprofessional and professional dancers, including ballet, classical, contemporary, hip hop, modern, ballet jazz and/or jazz dancers were included, as long as they represented 75% or more of the sample. Gymnasts, circus artists, tumblers, cheerleaders, and dancers whose main style was not ballet, jazz or contemporary (e.g., folk, irish, spanish, native and traditional dancers) were excluded from this review. These other sports and dance styles were excluded because the physical demands are very different from ballet, jazz or contemporary dance.
Regarding treatments, studies were included if they evaluated non-invasive interventions that aimed to prevent or treat a MSK condition (exercise/stretching, physical therapy, manual therapy, taping, electrotherapy, dry needling, acupuncture, osteopathy, chiropractor, massage therapy, kinesiology, proprioception, motor imagery, and nutrition). Studies investigating surgical procedures, pharmacological treatments, homeopathy or self-treatment were excluded.
Given the limited literature available on the effects of conservative treatment in dancers, no specific comparators were identified. Therefore, studies with conservative treatments versus no treatment, sham treatment or placebo or other types of interventions, including non-conservative treatments were included. Studies including co-interven-
Level of
I
Evidence
Effect of Conservative Interventions for Musculoskeletal Disorders in Preprofessional and Professional Dancers: A. International Journal of Sports Physical Therapy
tions were included if they were applied equally to both the intervention and control group.
Two main outcomes were selected in this systematic review: pain and function. Pain outcomes included pain intensity and quality Included function outcomes were related to range of motion (ROM) or position, flexibility, balance, strength and conditioning (e.g., strength, power, muscular or aerobic performance); movement performance (e.g., task completion, movement quality); motor control (e.g., muscle activation); and time that participants had to refrain from dancing or change their technique.
STUDY SELECTION
The literature search results were uploaded to the Zotero software and duplicates were removed. Teams of two reviewers determined the eligibility of each article by reading the titles and abstracts. Every abstract that appeared to match the eligibility criteria was assessed using the full text. The final selection of articles included in this systematic review was made using the full text. For all three phases, disagreements were resolved by consensus. If a consensus could not be reached, a third reviewer (JBP) was involved.
DATA EXTRACTION
Two teams, composed of two reviewers each, then independently extracted the information for each study included using a standardized data extraction table. The following information was extracted: design of the study, population, sex, sample size, intervention details, outcome measures used, relevant results of the study and risk of bias score. Authors were contacted if necessary
RISK OF BIAS ASSESSMENT
The articles included were reviewed for risk of bias using the Downs and Black checklist by two independent groups of reviewers.16 This checklist allows the assessment of both RCTs and non-RCTs, and comprises 10 items evaluating reporting of data, three items evaluating external validity, 13 items regarding internal validity and one item evaluating power Each item is rated 0 (no or unable to determine) or 1 (yes), with the exception of the fifth item on the description of confounders that is rated 2 (yes), 1 (partially) or 0 (no). This tool showed good test-retest and inter-rater reliability with high quality index and internal consistency 16 A total score was calculated by summing all items, and quality was interpreted as excellent (26-28), good (20-25), fair (15-19) or poor (≤14).17
STRATEGY FOR DATA SYNTHESIS
Data was aggregated and a narrative critical analysis was conducted. Descriptive data were used to characterize the study population. A narrative report on the findings was completed to provide avenues for future research and practice. A meta-analysis was not attempted.
RESULTS
A total of 2,011 titles were identified following the database search (Figure 1). Once duplicates were removed, 1,112 titles remained. Of those, 1,089 were excluded based on inclusion and exclusion criteria using the titles and abstracts. The full text of 23 articles were obtained and assessed, and 15 were excluded, yielding eight studies that were included in this systematic review.
RISK OF BIAS
According to the risk of bias assessment, two studies were scored as poor,10,18 four were evaluated as fair19–22 and two were rated as good.11,12 Table 1 presents evaluations for each study’s risk of bias using the Downs and Black checklist.
The risk of bias was derived from several factors. Most studies did not clearly describe the distribution of the principal confounders and the adjustments that were made in the analysis to account for those confounders. No studies reported on the possible adverse events of their intervention. Moreover, five out of eight studies failed to describe whether the participants contacted at recruitment were representative of the population and likewise, if the participants included in the study represented the population. Many of the studies had a high risk of bias due to the lack of blinding of the intervention from the participants, health care workers, and staff. Few studies used randomization, which was also one of the main risks of bias. Finally, no studies described how their sample size was sufficient to detect a clinically important change.
STUDY CHARACTERISTICS
Table 2 presents a summary of the characteristics of the included studies. Study designs included two prospective cohort studies, one uncontrolled trial, one within subject quasi-experimental study, one randomized cross-over study, one within-subject experimental study, one pilot RCT and only one RCT
DANCE SHOES
One crossover study examined two types of toe caps for pointe shoes in professional ballet dancers, who had an onset of hallux valgus or a sprained first metatarsal medial collateral ligament (N=10).19 The effects on pain intensity using the visual analog scale (VAS) and on the hallux deviation angle using X-rays were measured in a single session, where the dancers used two different toe caps. The study found that the customized toe cap caused less pain when dancing en pointe than the standard toe cap. The hallux deviation angle was lower with the customized toe cap compared to the standard toe cap.
DRY NEEDLING
One pilot study explored whether dry needling applied to trigger points on the triceps surae of dancers affects pain,
Effect of Conservative Interventions for Musculoskeletal Disorders in Preprofessional and Professional Dancers: A. International Journal of Sports Physical Therapy
ankle range of motion and ankle joint torque in plantar flexion at 60, 90 and 120 degrees/second.20 The researchers randomized dancers to a dry needling intervention (N=5) or a sham dry needling intervention (N=4). Dry needling was applied to trigger points on the triceps surae muscles of professional dancers. Dancers also received two 30-second stretches on a slanted board after the dry needling or sham dry needling intervention. No significant differences in pain (p≥0.246) or ROM (p≥0.093) were observed within and between groups. There was a decrease in temperature bilaterally, in the triceps surae trigger points, following the sham dry needling treatment (p=0.008) and in the right calf for the dry-needling group (p=0.048). Ankle torque at 60 degrees/second increased for the left calf in the dry needling group from pre- to post-treatment (p=0.027). Ankle torque at 90 and 120 degrees/second showed no significant difference pre- to post-treatment within or between each group (p≥0.108).
MOTOR IMAGERY
The non-randomized study by Gildea et al. investigated trunk stiffness and damping of the trunk during a forward or backward perturbation was applied to the trunk. They compared the natural postural response at the pre-treatment condition versus the postural response following a motor imagery intervention that aimed to elicit a fluid response in healthy dancers with (N=22) and without (N=8) a history of low back pain (LBP).23 The authors found no
difference in stiffness between dancers with or without a history of LBP in the natural postural response pre-treatment condition, however there was a significant decrease observed in both groups following motor imagery They also found that dancers without LBP had significantly higher trunk damping than dancers with a history of LBP (p=0.034) in the natural response condition. However, when using motor imagery to elicit a fluid reaction to the trunk perturbations, dancers with LBP had a similar level of trunk damping to dancers without LBP (p=0.226).
CONDITIONING/TRAINING PROGRAMS
The conditioning and training programs used with dancers were investigated in five studies.10–12,18,21 The programs used were either the same for all dancers10–12,18 or tailored to an individual’s specific needs.21
Only one RCT was conducted on training programs to prevent injuries in dancers.11 Roussel et al. found no differences in aerobic capacity and explosive strength after a four-month conditioning program compared to the control group, which followed a health promotion program without any active exercises.11 It was nonetheless noted that the group that completed the conditioning program showed a decrease in their pain scores on the SF-36 and had fewer lower back pain complaints compared to the control group.11
All other studies were prospective and had no control group.10,12,18,21 Multiple outcomes were investigated, in-
 Figure 1. Flowchart of study selection
Effect of Conservative Interventions for Musculoskeletal Disorders in Preprofessional and Professional Dancers: A. International Journal of Sports Physical Therapy
Table 1. Risk of bias
Allen et al. 2013 Gildea et al. 2015 Janowski et al. 2021 Long et al. 2021 Mistiaen et al. 2012 Roussel et al. 2014 Salzano et al. 2019 Welsh et al. 1998 Reporting (clearly described) Hypothesis/aim + + + + + + + + Main outcomes + + + + + + + + Characteristics of patients - + + - + - +Interventions of interest and placebo - + + + + + + + Distributions of principal confounders ± ± - - - + - ± Main findings + + + + + + + + Estimates of the random variability + + + + + + +Adverse events - - - - - - -Characteristics of loss to follow-up + + + + + + + + Actual probability values + + + + + + +External validity Selection of participants + - - - + + -Subjects are representative of the population + - - - + + -Staff, places and facilities representative + + - + + + -Internal validity – bias Attempt to blind the interventions - - - - - - +Attempt to blind the evaluator - - + - - + -Data dredging + + + + + + +Adjusted for different lengths of follow-up + + + + + + +Statistical tests appropriate + + + + + + +Compliance with intervention reliable - + - - + - +Main outcome measures valid and reliable + + + + + + +Internal validity – confounding Patients in groups from the same population + + + + + + - + Patients in groups from the same time period - + - - + - -Effect of Conservative Interventions for Musculoskeletal Disorders in Preprofessional and Professional Dancers: A. International Journal of Sports Physical Therapy
cluding aerobic endurance, strength, function, balance, stability and injury incidence.
Aerobic endurance was investigated using the Aerobic Power Index submaximal test in a study by Mistiaen et al. (N=40).12 They administered a weekly training program for six months that included aerobic endurance, local muscle strengthening and endurance, motor control, proprioception and coordination. A significant increase in aerobic capacity was found in the dancers who completed the training program. However, a similar program was used in the above-mentioned RCT by Roussel et al., and no differences were found between the experimental and control groups.
Strength was measured using the standing broad jump test12 and a subjective assessment of dancers.18 Following their training program, Mistiaen et al. found that the explosive strength of the dancers increased from pre- to posttreatment.12 However, no differences between the intervention and control groups were found when introducing a control group, as was done in the study by Roussel et al.11 Based on subjective data, Welsh et al. (N=8) found that dancers, who initially mentioned that their dancing was negatively affected by poor back strength, did not feel this way anymore following the strength training program.18
Function was evaluated using the Dance Functional Outcome Survey,10 and arabesque height was measured using the angle on a printed photograph.18 Long et al. administered a bi-weekly training program for a five-week period to professional contemporary ballet dancers (N=6).10 This training program included basic movement pattern exercises (bridges, planks, single leg deadlifts, lunges, squats, step ups and jumping). The movements became more specific to dance as the program progressed. They found that dancers had higher function following the program, as measured by the Dance Functional Outcome Survey.10 Welsh et al. compared mean arabesque height in dancers following a back strengthening program from pre- to posttreatment.18 They found an increase in arabesque height on
photographs, although this difference was not supported by inferential statistical analysis.18
Balance was evaluated using the modified Star Excursion Balance Test in one within subject quasi-experimental study.10 Following the training program, balance increased in dancers from pre- to post-treatment.10 However, a within-group difference was found from the pre- to fourmonth follow-up for only one composite score of balance.10
Stability was evaluated only in one within subject quasiexperimental study, using the single-leg hop for distance for ankle and knee stability, as well as the Closed Kinetic Chain Upper Extremity Stability Test for upper extremity stability 10 Following the training program, the ankle and knee stability of the dancers increased from pre- to posttreatment, as well as from pre- to four-month follow-up.10 Similar results were obtained for upper extremity stability, although there was no within-group difference from pre- to four-month follow-up.10
Injury incidence was evaluated using the time-loss definition and assessed by an in-house physiotherapist. In a prospective cohort study, Allen et al. followed professional ballet dancers for three years (Year 1 N=52, Year 2 N=58, Year 3 N=53).21 The program for the first year was based solely on results from a pre-season screening using the Functional Movement Screen (FMSTM). The program for years two and three was based on both the FMSTM results and the dancer’s injuries, cause of injuries, and the final outcome of the previous injuries (still injured, recovered with compensations, or recovered). It was found that the injury rate dropped in the second and third year compared to the first year The RCT by Roussel et al. also found a decrease in reported injuries following a conditioning program, although this was specific to low back injuries.11
Allen et al. 2013 Gildea et al. 2015 Janowski et al. 2021 Long et al. 2021 Mistiaen et al. 2012 Roussel et al. 2014 Salzano et al. 2019 Welsh et al. 1998 Randomization - - - - - + +Intervention concealed from patients and health care staff - - - - - - -Adjustment for confounding in analyses - - - - + + -Loss to follow-up taken into account + + + + + + + + Power Sufficient power to detect clinically important effect - - - - - - -Total score 16 18 15 14 20 21 16 8 Legend: Yes + Partially ± No or Unable to determine -
Effect of Conservative Interventions for Musculoskeletal Disorders in Preprofessional and Professional Dancers: A. International Journal of Sports Physical Therapy
DISCUSSION
The aim of this systematic review was to describe the different conservative interventions commonly used and their effect on MSK disorders in preprofessional and professional dancers. MSK disorders are a major concern for dancers, and this review identifies different conservative treatments that have been used, as well as the level of evidence supporting each intervention. The most commonly reported treatment was the training or conditioning program, whether it be general or individualized. The use of dryneedling, customized toe caps and motor imagery was also described in literature. The interpretation of these findings is however limited by the low number of studies as well as weak methodological designs and moderate to high risk of bias for the majority of the included studies.
The use of appropriate footwear is crucial for dancers. For example, the use of “dead” pointe shoes, i.e., pointe shoes that have lost structural integrity in the toe box or shank, was reported to affect muscle activation and biomechanics, which makes it more demanding for dancers to execute common movements, such as relevé or arabesque.24 In a randomized crossover study with a moderate risk of bias, the use of customized toe caps seemed to yield positive results for pain and the deviation angle of dancers with hallux valgus or first metatarsal hypermobility However, costly customized toe caps are not commonly available to most dancers, and few dancers would have access to this kind of comprehensive assessment. Therefore, while interesting, this treatment would be difficult to implement in current clinical practice. Moreover, since the study included only a single session with pre- and post-treatment evaluations, long-term use should also be investigated. An analysis of costs and benefits could be conducted to evaluate the relevance of implementing this intervention in dance schools and companies.
The investigation of novel treatment strategies, such as dry-needling, customized toe caps and motor imagery, while interesting, showed a high risk of bias that impeded strong conclusions. Dry needling is a treatment technique that is usually delivered by a physical therapist, which has yielded promising results for decreasing pain, increasing range of motion and improving functional outcomes as well as strength in athletes.25–27 Indeed, in overhead throwing athletes with scapular dyskinesia, a RCT showed that the combination of dry-needling and manual therapy was more effective than manual therapy alone to reduce pain while playing and increase function during sport.25 Similarly, dry needling of trigger points in the gluteus medius and quadratus lumbarum combined to exercise therapy was more effective than exercise therapy alone to reduce pain and increase function in female athletes with patellofemoral pain.26 Another RCT found that, in elite soccer players, dry needling was more beneficial for hip flexors endurance and hip range of motion in the hip, after the treatment but also 4-weeks post-treatment compared to placebo laser 27 In the current systematic review, although there was a decrease in temperature, as measured by a thermometer, of the trigger points and an increase in plantar flexor torque at 60 de-
grees/second from pre- to post-treatment, the results from the pilot RCT by Janowski et al. had a high risk of bias. Some dancers were familiar with the twitch response that can be elicited through dry needling, and they could have thus guessed their allocation group. There were also two dancers who were not blinded in the sham group because they requested not to receive the dry needling intervention. Moreover, the sample was small and probably could not detect significant change. Considering the literature on dry needling and its positive effect on other athletes, this intervention should be further investigated in dancers.
While research on motor imagery in dancers is still emerging, the effect of this technique on performance is supported in different populations of athletes.28–30 In athletes, it has been mostly studied in terms of its effect on performance rather than prevention or treatment of injuries. In basketball players, it was found that motor imagery protocol was more effective to improve physical performance compared to a control and preintervention group.28 Its use has also been supported in non-athletes in the rehabilitation of knee injuries by a recent scoping review.31 Indeed, motor imagery interventions contributed to a better clinical outcome of function and pain.31 In dancers, motor imagery practice seems to improve performance of movements,32 and even mood.33 Moreover, dance teachers have been using images to convey the proper way of completing movements for decades.32 The study by Gildea et al. is of particular interest as it shows that dancers with a history of LBP and impairments in trunk stabilizer activation22,34 can use motor imagery to increase their damping abilities to the same level as dancers without a history of LBP Motor imagery practice is especially interesting since it requires no costly equipment and could be implemented by either health care professionals or dance teachers. However, this study had a moderate risk of bias. Future studies should investigate the use of motor imagery in combination with other interventions to prevent or treat dancers with MSK conditions.
The majority of studies included in this review investigated conditioning or training programs. These interventions have been widely researched in other athletes and have proven to be effective to prevent certain injuries, especially among female athletes.35–37 Indeed, a systematic review found that neuromuscular training, including interventions such as strength, balance and proprioceptive exercises, was effective to prevent ankle injuries in female athletes.35 In another systematic review, it was found that strength, balance and plyometric exercises were effective to prevent anterior cruciate ligament injuries in male and female athletes.36 An additional systematic review on female athletes found that neuromuscular training including plyometric exercises was the most beneficial to prevent anterior cruciate ligament injuries.37 While these findings are important and relevant, dancers are a unique population as they are both artists and athletes. The studies included in this review combined multiple components in their programs. They were delivered between one and three times per week, for a period ranging from five weeks to three years.10–12,18,21 Uncontrolled prospective studies with
Effect of Conservative Interventions for Musculoskeletal Disorders in Preprofessional and Professional Dancers: A. International Journal of Sports Physical Therapy
varying risk of bias showed improvements in pain, aerobic capacity, explosive strength, balance and stability.10,12,18,21
It should however be noted that the only study with a robust design (RCT) and low risk of bias did not find any difference in aerobic capacity and explosive strength between groups, but found a decrease in pain and lower back injuries pre- to post-treatment.11 As no sample size calculation was provided in this study, it is not possible to exclude the fact that the non-significant differences observed between groups could be attributable to lack of statistical power. Therefore, additional RCTs with a sufficient sample size would be necessary to confirm the benefits observed in the included studies.
FUTURE DIRECTIONS
In a sport with such specific demands and high expectations of performance, effective treatment that allows the artist to return to dancing is imperative. In the literature on the treatment and prevention of MSK disorders in athletes, multimodal interventions seem to be key in improvements of pain, function, and a prompt return to sport.
Future research on the treatment of MSK disorders in dancers should therefore include multimodal approaches, including training and conditioning programs integrated to novel components like motor imagery and dry-needling. Moreover, future research should focus on conservative interventions adapted to the athlete and type of dance, as well as to the athlete’s development during the rehabilitation or prevention program. More importantly, studies need to use a robust design and include control groups to ensure that the sole taking care of dancers or placebo effect does not interfere. In order to analyze the changes in the incidence of MSK disorders and injuries following conservative treatments, there is an urgent need to establish a clear and standardized definition for MSK disorders in dancers.
LIMITATIONS
This systematic review is inherently limited by the quantity and quality of the studies included. Since there were no exclusion criteria based on the risk of bias assessment, all studies were retained for the review regardless of their quality. Interpretation of results are limited as most studies did not include a control group or blind the dancers to their group allocation. Moreover, most studies also had a small
sample size and no sample size calculation to justify such a limited number of participants.
The few studies included in this review had widely different populations in terms of professional or preprofessional status and dance style. Robust conclusions that would apply to the entire population of dancers that were studied is therefore difficult considering the different training, schedule, and mindset of these dancers.
CONCLUSION
Although this review highlights some promising treatment and prevention avenues for dancers, a strong interpretation of results was limited by the insufficient acknowledgement of confounders, concerns regarding external validity, insufficient power, as well as lack of randomization and blinding participants, health workers and staff More high-quality studies are needed to reach any solid conclusions. Dance researchers should focus on the addition of control groups to their studies, as well as multimodal interventions. Indeed, the use of multimodal conditioning programs yielded significant early results on pain, function, and balance in uncontrolled prospective studies. This multimodal treatment should be investigated in RCTs. Moreover, researchers should explore the idea of individualized conditioning programs, tailored to the dancers’ limitations.
ACKNOWLEDGEMENTS
The authors would like to acknowledge the collaboration of Marie Chrysagis, Carolane Giroux, Janne Pintal, Audrey Thibert, Romy Lambert-Hevey, Liliane Dubé and Laurie Morelli-Valiquette for their assistance with the search strategy
CONFLICTS OF INTEREST
The authors report no conflict of interest.
Submitted: August 28, 2022 CDT, Accepted: February 13, 2023 CDT
This is an open-access article distributed under the terms of the Creative Commons Attribution 4.0 International License (CCBY-NC-4.0). View this license’s legal deed at https://creativecommons.org/licenses/by-nc/4.0 and legal code at https://creativecommons.org/licenses/by-nc/4.0/legalcode for more information.
Effect of Conservative Interventions for Musculoskeletal Disorders in Preprofessional and Professional Dancers: A. International Journal of Sports Physical Therapy
REFERENCES
1. Pollitt EE, Hutt K. Viewing injury in dancers from a psychological perspective - A literature review J Dance Med Sci. 2021;25(2):75-79. doi:10.12678/108 9-313x.061521a
2. Caine D, Bergeron G, Goodwin BJ, et al. A survey of injuries affecting pre-professional ballet dancers. J Dance Med Sci 2016;20(3):115-126. doi:10.12678/108 9-313x.20.3.115
3. Ekegren CL, Quested R, Brodrick A. Injuries in preprofessional ballet dancers: Incidence, characteristics and consequences. J Sci Med Sport 2014;17(3):271-275. doi:10.1016/j.jsams.2013.07.013
4. Ramkumar PN, Farber J, Arnouk J, Varner KE, Mcculloch PC. Injuries in a professional ballet dance company: A 10-year retrospective study. J Dance Med Sci 2016;20(1):30-37 doi:10.12678/1089-313x.20.1.3
5. Smith PJ, Gerrie BJ, Varner KE, McCulloch PC, Lintner DM, Harris JD. Incidence and prevalence of musculoskeletal injury in ballet: A systematic review Orthop J Sports Med. 2015;3(7):2325967115592621. do i:10.1177/2325967115592621
6. Yau RK, Golightly YM, Richardson DB, Runfola CD, Waller AE, Marshall SW Potential predictors of injury among pre-professional ballet and contemporary dancers. J Dance Med Sci 2017;21(2):53-63. doi:10.12 678/1089-313x.21.2.53
7. Mainwaring LM, Finney C. Psychological risk factors and outcomes of dance injury: A systematic review J Dance Med Sci 2017;21(3):87-96. doi:10.126 78/1089-313x.21.3.87
8. Hamilton LH, Hamilton WG, Warren MP, Keller K, Molnar M. Factors contributing to the attrition rate in elite ballet students. J Dance Med Sci. 1997;1(4):131-138.
9. Sobrino FJ, Guillén P Overuse injuries in professional ballet: Influence of age and years of professional practice. Orthop J Sports Med 2017;5(6):2325967117712704. doi:10.1177/232596711 7712704
10. Long KL, Milidonis MK, Wildermuth VL, Kruse AN, Parham UT The impact of dance-specific neuromuscular conditioning and injury prevention training on motor control, stability, balance, function and injury in professional ballet dancers: A mixedmethods quasi-experimental study. Int J Sports Phys Ther 2021;16(2):404-417 doi:10.26603/001c.21150
11. Roussel NA, Vissers D, Kuppens K, et al. Effect of a physical conditioning versus health promotion intervention in dancers: A randomized controlled trial. Man Ther 2014;19(6):562-568. doi:10.1016/j.ma th.2014.05.008
12. Mistiaen W, Roussel NA, Vissers D, Daenen L, Truijen S, Nijs J. Effects of aerobic endurance, muscle strength, and motor control exercise on physical fitness and musculoskeletal injury rate in preprofessional dancers: An uncontrolled trial. J Manipulative Physiol Ther 2012;35(5):381-389. doi:1 0.1016/j.jmpt.2012.04.014
13. Twitchett E, Brodrick A, Nevill AM, Koutedakis Y, Angioi M, Wyon M. Does physical fitness affect injury occurrence and time loss due to injury in elite vocational ballet students? J Dance Med Sci 2010;14(1):26-31.
14. Fuhrmann TL, Brayer A, Andrus N, McIntosh S. Injury prevention for modern dancers: a pilot study of an educational intervention. J Community Health 2010;35(5):527-533. doi:10.1007/s10900-010-9223-z
15. Sohl P, Bowling A. Injuries to dancers: Prevalence, treatment and prevention. / Traumatismes des danseurs; prevalence, traitement et prevention. Sports Med 1990;9(5):317-322. doi:10.2165/0000725 6-199009050-00006
16. Downs SH, Black N. The feasibility of creating a checklist for the assessment of the methodological quality both of randomised and non-randomised studies of health care interventions. J Epidemiol Community Health 1998;52(6):377-384. doi:10.1136/j ech.52.6.377
17. O’Connor SR, Tully MA, Ryan B, Bradley JM, Baxter GD, McDonough SM. Failure of a numerical quality assessment scale to identify potential risk of bias in a systematic review: a comparison study. BMC Res Notes 2015;8:224. doi:10.1186/s13104-015-118
18. Welsh TM, Jones P, Lucker KD, Weaver BC. Back strengthening for dancers: A within-subject experimental analysis. J Dance Med Sci 1998;2(4):141-148.
19. Salzano A, Camuso F, Sepe M, Sellami M, Ardigò LP, Padulo J. Acute effect of toe cap choice on toe deviation angle and perceived pain in female professional ballet dancers. BioMed Res Int. 2019;2019:1-8. doi:10.1155/2019/9515079
0
1-1
Effect of Conservative Interventions for Musculoskeletal Disorders in Preprofessional and Professional Dancers: A. International Journal of Sports Physical Therapy
20. Janowski JA, Phelan-Smith DML, Kroat Brady MN, et al. Acute effects of dry needling on myofascial trigger points in the triceps surae of ballet dancers: A pilot randomized controlled trial. Int J Sports Phys Ther 2021;16(2):418-430. doi:10.26603/001c.21475
21. Allen N, Nevill AM, Brooks JHM, Koutedakis Y, Wyon MA. The effect of a comprehensive injury audit program on injury incidence in ballet: A 3-year prospective study Clin J Sport Med 2013;23(5):373-378. doi:10.1097/jsm.0b013e3182887f
22. Gildea JE, Hides JA, Hodges PW Morphology of the abdominal muscles in ballet dancers with and without low back pain: A magnetic resonance imaging study J Sci Med Sport 2014;17(5):452-456. d oi:10.1016/j.jsams.2013.09.002
23. Gildea JE, van den Hoorn W, Hides JA, Hodges PW Trunk dynamics are impaired in ballet dancers with back pain but improve with imagery Med Sci Sports Exerc. 2015;47(8):1665-1671. doi:10.1249/ms
s.0000000000000594
24. Aquino J, Amasay T, Shapiro S, Kuo YT, Ambegaonkar JP. Lower extremity biomechanics and muscle activity differ between ‘new’ and ‘dead’ pointe shoes in professional ballet dancers. Sports Biomech. 2021;20(4):469-480. doi:10.1080/1476314 1.2018.1561931
25. Kheradmandi A, Kamali F, Ebrahimian M, Abbasi L. Comparison between dry needling plus manual therapy with manual therapy alone on pain and function in overhead athletes with scapular dyskinesia: A randomized clinical trial. J Bodyw Mov Ther 2021;26:339-346. doi:10.1016/j.jbmt.2020.11.01
26. Zarei H, Bervis S, Piroozi S, Motealleh A. Added Value of Gluteus Medius and Quadratus Lumborum Dry Needling in Improving Knee Pain and Function in Female Athletes With Patellofemoral Pain Syndrome: A Randomized Clinical Trial. Arch Phys Med Rehabil. 2020;101(2):265-274. doi:10.1016/j.apm
r.2019.07.009
27 Haser C, Stöggl T, Kriner M, et al. Effect of Dry Needling on Thigh Muscle Strength and Hip Flexion in Elite Soccer Players. Med Sci Sports Exerc. 2017;49(2):378-383. doi:10.1249/mss.0000000000001
28. Dello Iacono A, Ashcroft K, Zubac D Ain’t Just Imagination! Effects of Motor Imagery Training on Strength and Power Performance of Athletes during Detraining. Med Sci Sports Exerc. 2021;53(11):2324-2332. doi:10.1249/mss.0000000000 002706
29. McNeil DG, Spittle M, Mesagno C. Imagery training for reactive agility: Performance improvements for decision time but not overall reactive agility. Int J Sport Exerc Psychol. 2021;19(3):429-445. doi:10.1080/1612197x.2019.1696 866
30. Fortes LS, Freitas-Júnior CG, Paes PP, et al. Effect of an eight-week imagery training programme on passing decision-making of young volleyball players. Int J Sport Exerc Psychol. 2020;18(1):120-128. doi:10.1 080/1612197x.2018.1462229
31. Nanbancha A, Mawhinney C, Sinsurin K. The effect of motor imagery and action observation in the rehabilitation of lower limb injuries: A scoping review Clin Rehabil 2023;37(2):145-161. doi:10.1177/ 02692155221123546
32. Abraham A, Dunsky A, Dickstein R. The effect of motor imagery practice on elevé performance in adolescent female dance students: A randomized controlled trial. J Imag Res Sport Phys Act. 2017;12(1). doi:10.1515/jirspa-2016-0006
33. Pavlik K, Nordin-Bates S. Imagery in dance: A literature review. J Dance Med Sci. 2016;20(2):51-63. d oi:10.12678/1089-313x.20.2.51
34. Roussel N, De Kooning M, Schutt A, et al. Motor control and low back pain in dancers. Int J Sports Med 2013;34(2):138-143.
35. Caldemeyer LE, Brown SM, Mulcahey MK. Neuromuscular training for the prevention of ankle sprains in female athletes: A systematic review Phys Sportsmed 2020;48(4):363-369. doi:10.1080/0091384 7.2020.1732246
36. Stojanovic MD, Ostojic SM. Preventing ACL injuries in team-sport athletes: A systematic review of training interventions. Res Sports Med. 2012;20(3-4):223-238. doi:10.1080/15438627.2012.68 0988
37 Stevenson JH, Beattie CS, Schwartz JB, Busconi BD. Assessing the effectiveness of neuromuscular training programs in reducing the incidence of anterior cruciate ligament injuries in female athletes: A systematic review Am J Sports Med 2015;43(2):482-490. doi:10.1177/0363546514523388
32
7
111
Effect of Conservative Interventions for Musculoskeletal Disorders in Preprofessional and Professional Dancers: A. International Journal of Sports Physical Therapy
Spatiotemporal Parameters of Gait Among Adolescent Athletes with Concussion When Performing a Visuospatial Cognitive Task
Leah Lowe1a , Fernando Castillo1 , Melissa Allen1 , Michael Israel2 , Charlotte Yates3
1
Physical Therapy, University of Central Arkansas, 2 Orthopedics, Pediatrics, Arkansas Children's Hospital, University of Arkansas for Medical Sciences, 3 Physical Therapy, University of Central Arkansas, University of Arkansas for Medical Sciences
Keywords: adolescent, concussion, dual-task, gait https://doi.org/10.26603/001c.71361
International Journal of Sports Physical Therapy
Background
Adolescent athletes aged 10 to 19 years are at the highest risk of experiencing sport-related concussions (SRCs). Despite the known deficits and battery of assessments following concussion, postural stability during dual-task gait remains understudied in this population.
Purpose
The purpose of this study was to evaluate the dual-task cost (DTC) in adolescents with an acute or chronic SRC compared to reference values from healthy athlete peers for spatiotemporal parameters of gait during walking with and without a concurrent visuospatial memory task presented on a hand-held tablet. Researchers hypothesized that adolescents during the acute phase of concussion would be likely to experience a greater DTC compared to healthy peers in at least one spatiotemporal parameter of gait when walking within the dual-task paradigm.
Study Design
Cross-sectional, observational cohort design
Methods
Adolescents with concussion were recruited to participate. Subjects were divided into acute and chronic categories based on significant differences in the neuropsychological function after a period of 28 days. They walked at a self-selected speed along the 5.186-meter GAITRite® Walkway System with and without a concurrent visuospatial cognitive task presented on a hand-held tablet. Outcomes included normalized velocity (m/s), step length (m), and double limb (DLS) and single limb support (SLS) (defined as the percent of a gait cycle [%GC]). The data were then compared to the previously published reference values established using the same methods in the healthy athlete participants for all spatiotemporal parameters of gait.
Results
Data was collected on 29 adolescent athletes with SRC. Among males (15.53+/-1.12 years) with SRC, 20% of acute and 10% of chronic cases experienced a greater DTC compared to healthy athlete reference values. A similarly increased DTC was experienced by 83% of acute and 29% of chronic SRC cases for females (15.58+/-1.16 years).
Corresponding author:
Dr. Leah Lowe, Department of Physical Therapy, University of Central Arkansas, Physical Therapy Center, Suite 319, 201 Donaghey Avenue, Conway, Arkansas 72035
Email: llowe@uca.edu
Tel: 1-501-450-5545 Fax: 1-501-450-5822
Original Research
a
Lowe L, Castillo F, Allen M, Israel M, Yates C. Spatiotemporal Parameters of Gait Among Adolescent Athletes with Concussion When Performing a Visuospatial Cognitive Task. IJSPT. Published online April 1, 2023:338-347. doi:10.26603/001c.71361
Conclusions
Adolescent athletes with concussion may continue demonstrating deficits in gait capabilities even in the chronic phase, and compensatory gait strategies were not the same between males and females. Dual-task cost assessment using the GAITRite® may be a valuable adjunct to comprehensive analysis of gait following SRC.
Level of Evidence
2
INTRODUCTION
In a 2018 report to Congress, the Centers for Disease Control and Prevention (CDC) classified mild traumatic brain injuries (mTBI) among children aged 18 years and younger as a major public health burden.1 Sports are a leading source of concussion, a form of mTBI, with approximately 1.6 to 3.8 million sport-related concussions (SRC) occurring each year 2 Athletes in the adolescent age group of 10 to 19 years comprise the largest athletic cohort at nearly 44 million participants annually 3 Additionally, nearly 70% of all SRC cases in the United States were reported among adolescent athletes.4 As a response to the growing rate of emergency department visits secondary to concussion among adolescents,5 concussion management groups including the American Medical Society for Sports Medicine (AMSSM)2 and Concussion in Sport Group (CISG)6 have promulgated recommendations for improvements in the recognition, diagnosis, rehabilitation, treatment, and overall mitigation of SRC.
The most common symptoms following SRC in adolescent athletes include deficits in somatic, vestibular, oculomotor, and cognitive systems as well as abnormalities in emotional regulation and sleep.6,7 Postural instability has been identified as a hallmark of SRC8,9 and authors have established that prolonged dizziness, reported in approximately 65-75% of athletes with concussion, is most predictive of protracted recovery.10 For this reason, multimodal sideline assessment batteries assess a variety of symptom characteristics as well as neuromotor capabilities.2,6–8 Specifically, researchers have shown that SRCs commonly disrupt important neurological processes that allow for communication between the vestibular system, cerebellum, and motor cortex, which play critical concerted roles in controlling posture and balance during gait.9,11 Although previous authors have reported that neurocognitive impairments persist beyond subjective symptom resolution, dynamic motor tasks such as gait following concussion may not be adequately assessed clinically.11
Authors exploring deficits in gait among athletes with SRC have shown that no significant differences exist when compared to healthy controls while ambulating alone.12,13 In contrast, researchers have identified deficits in neuromotor capabilities athletes of varying ages with and without concussion during walking within a dual-task paradigm, which combines cognitive and motor demands.14–19 Additionally, a significant dual-task cost (DTC), or the relative change between single-task and dual-task performance,14 has been reported for specific spatiotemporal parameters of gait, including gait speed,13,16–20
cadence,12–14,16,17 stride length,12–14,16,17 step length,18,20 double limb support time (DLS),16,18–20 and single limb support time (SLS)18–20 in athletes with and without concussion using computerized technology Howell et al21 previously reported good to excellent consistency for DTCs when assessing adolescents during single- and dualtask walking, concluding that healthy controls are effective comparators when assessing subjects with injury Cognitive tasks incorporated into dual-task gait paradigms have challenged different constructs of cognition, memory, and coordination. The Mini-Mental Examination (MMSE), Auditory Stroop Test, and Brooks Visuospatial Memory Task, which incorporate constructs of memory, auditory perception, and recall, have been used to demonstrate that significant differences in gait parameters exist between adolescents with and without SRC in dual-task, but not always single-task, gait paradigms.12,13,21,22 Authors examining dual-task gait paradigms have also established normative reference values for adolescent athletes using varying methodologies and cognitive tasks, which have provided great insight into remaining deficits even after symptom resolution; however, many studies lack a closed environment mirroring aspects of athletic play wherein athletes’ attention is focused on a manipulatable hand-held object during gait.
Ambulation while manipulating a hand-held object, such as a phone or sports ball, is commonplace in daily activities (e.g., maneuvering through class or school spaces while texting) and athletic play (e.g., catching or focusing on a ball in football or soccer, among other sports, while running in a specific direction). In 2018, Howell et al23 revealed that collegiate athletes with a history of concussion demonstrated significantly decreased walking speed during dual-task gait with neurocognitive tests presented on a hand-held tablet compared to healthy controls. Furthermore, in 2019, Lowe et al20 established baseline data for healthy adolescent athletes during single-task gait without a cognitive component and dual-task gait using a handheld tablet to perform a visuospatial memory task while walking along the GAITRite® Walkway System. In that study, authors found that both male and female healthy athletes experienced a significant DTC (p<0.0001) for gait velocity, step length, DLS, and SLS.20 However, data for concussed adolescents combining a motor and cognitive (visuospatial memory) task with altered visual attention has not been published. An altered, or larger than expected DTC during a combined motor and cognitive task post-concussion could pose a risk to adolescents returning to daily activity and especially athletic play.24 Studies have highlighted the complexity of concussion as a formal diagnosis given variability in symptomology and recovery time-
Spatiotemporal Parameters of Gait Among Adolescent Athletes with Concussion When Performing a Visuospatial Cognitive Task International Journal of Sports Physical Therapy
frames.1,2 Despite the existence of widely adopted return to play (RTP) protocols based on symptomology, no consensus has been reached regarding the consistent assessment of postural stability during gait. Therefore, examining DTC may be a viable and insightful addition to comprehensive assessments of concussion.
Compensatory strategies may not be entirely consistent between individual athletes with SRC.25 Given that individuals with concussion often present with such a variety of compensatory mechanisms during movement, the authors of the current study believe it is essential to examine athletes individually while assessing multiple parameters. For the purpose of the current study, authors focused on normalized velocity (m/s), step length (m), and SLS and DLS as a percentage of a gait cycle (%GC), which may present quite differently from one injured athlete to the next. Consistent with common methodologies in physical therapy for assessing children with deficit,26 the chosen cutoff for considering a parameter to be of concern and warrant further attention is one standard deviation (SD). Specifically, the outcome measure of interest was the DTC experienced by adolescent athletes with SRC on each spatiotemporal parameter of gait.
Therefore, the purpose of this study was to evaluate the DTC in adolescents with an acute or chronic SRC compared to reference values from healthy athlete peers22 for spatiotemporal parameters of gait during walking with and without a concurrent visuospatial memory task presented on a hand-held tablet. Researchers hypothesized that adolescents during the acute phase of concussion and seeking a medical evaluation or follow-up would be likely to experience a DTC greater than one SD compared to healthy athlete peers in at least one spatiotemporal parameter of gait when walking within the dual-task paradigm. This study also aimed to explore any residual deficits compared to their healthy athlete peers that might present during the chronic phase of concussion that could aid in RTP decisions.
METHODS PARTICIPANTS
A convenience sample of 29 athletes, between the ages of 14-18 years old, with documented SRC was recruited from a regional sports medicine concussion clinic. The Institutional Review Board at the University of Arkansas for Medical Sciences approved the study All participants and guardians provided written informed consent to participate in the study Participants were included in the study if they were being treated at a regional sports medicine clinic for a sport related concussion, had participated in sport programs through their school, were between the ages of 14-18 years old, and had a completed informed consent from the parent/guardian. Participants were excluded if they had a recent lower extremity injury or were deemed medically unfit to participate in assessments by the clinic sports medicine physician. Using the protocol outlined below, participants were assessed at each clinic visit until discharge (minimum of one and maximum of three assessments).
Therefore, an individual participant in the current study could contribute up to three assessments if that participant continued to be seen in the clinic for a protracted recovery Data from these assessments were divided into acute and chronic categories based on significant differences in neuropsychological function after a period of 28 days.27
PROTOCOL
Gait parameters were assessed by instructing the participants (n=29) to walk at a self-selected speed on the 5.186 meters long GAITRite® (CIR Systems, Inc.; Franklin, NJ) portable gait analysis walkway for three undivided attention trials in addition to three divided attention trials. During each divided attention trial, a visuospatial memory task was given to the subjects to complete on a tablet (Microsoft Surface Pro, 2016) while walking. Participants used a tablet rather than their own cell phones to achieve novelty and require attention to the device. The task (Pattern Memory by ProProfs.com, available at www.memory-improvementtips.com), similar to the visuospatial memory tasks commonly included in the neurocognitive testing used in concussion management, consisted of a one-second period of time to view a pattern of shapes arranged spatially on the tablet screen. After this time period, the shapes disappeared. The participants then had to place the shapes in the original position relying upon visuospatial working memory. Participants who typically wear corrective eyewear (e.g., glasses or contact lens) wore them during the assessment. All participants performed this task in the same manner with three practice attempts to learn the task in static stance and data collection during gait beginning at level four of the task. Additionally, the participants initiated the task 2.5 meters prior to stepping onto the pathway to allow the task to continue throughout the entirety of the sensor pathway and to account for acceleration. Investigators monitored each trial to ensure that the participant was actively completing the task throughout the data recording time period. If the participant failed at the task, causing the game to discontinue during a trial, that trial was repeated to ensure that the participant was actively completing the task throughout.
The GAITRite® portable gait analysis walkway and the corresponding GAITRite® software were used to record temporal and spatial parameters. Prior to each participant’s trials, investigators entered data for leg length, which was measured as the distance from greater trochanter to floor for each leg. For the purposes of this study, parameters that were captured by the GAITRite® include: gait velocity (cm/ s); step length (cm); DLS, defined as the percent of the gait cycle (%GC) when both feet are on the ground; and SLS, defined as the %GC weight bearing through a single limb. The walkway is 5.186 meters long and embedded with sensors recording footfall pressures at 80 Hz, which allows calculation of temporal and spatial markers of gait. The software averages the three gait trials under each walking condition providing means for each parameter The GAITRite® system has been shown to be a reliable and valid measure of gait for healthy individuals.28
Spatiotemporal Parameters of Gait Among Adolescent Athletes with Concussion When Performing a Visuospatial Cognitive Task International Journal of Sports Physical Therapy
STATISTICAL METHODS
Normalized velocity is calculated by the GAITRite® system by dividing the gait velocity captured by the GAITRite® (cm/s) by the participant’s leg length (cm) and then converting the value to meters per second (m/s) for reporting. The data were then compared to the reference values established using the same methods in the healthy athlete participants for all spatiotemporal parameters of gait by Lowe et al.20 Comparisons were stratified based on the frequency of female and male acute and chronic cases that experienced a DTC for each of the parameters of interest that were either within or above one SD of values produced by healthy athletes. Additionally, as concussion management protocols are typically personalized to athletes’ specific capabilities, symptoms, and concussion severity, individual DTC values for each spatiotemporal parameter of gait were also recorded for male and female athletes with acute and chronic concussion during a preliminary and follow-up testing timeline.
RESULTS
Twenty-nine adolescent athletes with concussion (Table 1) contributed to data collection in several assessment periods during their time in a sport medicine concussion clinic. The 17 male participants with SRC contributed to 25 total assessments, 15 of which were acute and 10 of which were chronic. For the 12 females with concussion, 20 total assessments were recorded, 6 of which were acute and 14 of which were chronic. Table 2 provides means and standard deviations for healthy subjects with and without a concurrent visual cognitive task.20 Table 3 demonstrates the percentage of male and female acute and chronic cases that experienced a DTC greater than one SD compared to healthy subjects for at least one parameter
Twenty percent of male and 83% of female acute assessments demonstrated such a DTC. The percentage of acute assessments that demonstrated a greater DTC compared to reference values from healthy counterparts was different between males and females for each of the spatiotemporal parameters of gait (Figure 1a and 2a, respectively). In general, most male participants in the acute phase experienced the higher DTC for normalized velocity while most females did so for SLS.
Additionally, 10% of male and 29% of female chronic assessments demonstrated a DTC greater than one SD compared to healthy athletes. For the 10% of male participants assessed in the chronic phase, the increased DTC was experienced in DLS only (Figure 1b). For the female participants assessed in the chronic phase, the higher DTC was distributed across the four parameters (Figure 2b).
DISCUSSION
The present study adds important insight into the need for comprehensive clinical assessments of gait in adolescent athletes with SRC. Lingering deficits in dynamic balance during stance have been previously identified by the current authors utilizing clinical assessments of balance.29 Additionally, for the past decade, the literature has highlighted the importance of assessing dual-task gait among adolescent, collegiate, and adult athletes. Moreover, healthy reference values and DTCs have been frequently used to assess adolescent athletes with concussion when exploring the impact of dual-task paradigms on spatiotemporal parameters of gait. The current study contributes novel findings suggesting that varying compensatory mechanisms exist in male and female adolescent athletes with acute or chronic SRC when combining a cognitive and gait task, further promoting the use of the DTC as a viable adjunct assessment following SRC.
Results from the present study reveal that a considerable number of male and female cases with acute concussion, approximately three out of 15 male assessments and five out of six female assessments, experienced a DTC greater than one SD compared to peers without injury This finding is similar to those of previous studies that have revealed significant differences between healthy adolescent athletes and those with concussion (typically tested within 10 days after injury) in several spatiotemporal parameters of gait.13,14,16,18 The current study also found that the increased DTC was not experienced for the same spatiotemporal parameters of gait or to the same degree by males and females with acute SRC, suggesting that different compensatory patterns to perform dual-task gait may be evident based on sex in similar samples. Recently, Kieffer et al30 found that even in collegiate athletes, who are presumed to function with more developed neuromuscular abilities, DTCs for several parameters of gait varied irrespective of sex but were overall higher for females. When assessing adolescent athletes within 14 days of concussion, Howell et al16 found that females typically experienced a significantly greater DTC for cadence (not measured in the current study), whereas a separate study reported inconsistent variability in several cognitive, neuromotor, and oculomotor functions according to sex.30 With respect to varying gait strategies, Table 4 provides valuable data for individual assessments by each participant during initial testing who experienced a DTC greater than one SD compared to healthy references in at least one parameter of gait. Male participant A and female participant B, both with acute SRC, experienced the DTC on at least three parameters, representing athletes with the most negative side effects
Race Males (n=17) Females (n=12) Caucasian 17 11 African American 0 1 2 or More 0 0 Ethnicity Hispanic 0 0 Non-Hispanic 17 12
Table 1. Participant demographics by sex, race, and ethnicity.
Spatiotemporal Parameters of Gait Among Adolescent Athletes with Concussion When Performing a Visuospatial Cognitive Task International Journal of Sports Physical Therapy
Table 2. Table 2 published by Lowe et al20 demonstrating “the means and standard deviations of the gait parameters when [healthy] subjects walked without a concurrent visual-cognitive task (Single-Task) and with a concurrent visual-cognitive task (Dual Task). The means and standard deviations for the dual-task cost for each parameter (DTC).”
*Statistically significant DTC at p<0.0001
Table 3. Percentage of male (25 assessments) and female (20 assessments) acute and chronic cases that experienced a DTC at least one SD greater than those of healthy subjects from the study by Lowe et al20 in each of the spatiotemporal parameters of gait recorded using the GAITRite® Walkway System.
Asterisk (*) denotes the percentage of the male and female acute (20% and 83%, respectively) and chronic (10%, and 29%, respectively) cases that experienced a DTC greater than one SD compared to healthy athlete reference values for at least one spatiotemporal parameter of gait.
Figure 1. Percentage of male acute (1a; three out of 15) and chronic (1b; one out of 10) cases that experienced a DTC at least one SD greater than those of healthy athletes from the study by Lowe et al20 in each of the spatiotemporal parameters of gait.

Single Task Dual Task DTC Parameter Male Female Male Female Male Female Velocity 1.236 1.449 1.030 1.232 -0.205* -0.217* (m/s) (0.163) (0.199) (0.185) (0.196) (0.140) (0.113) Step Length 68.031 65.483 60.073 58.650 -7.958* -6.833* (cm) (6.779) (6.021) (7.858) (5.885) (5.046) (3.777) % in DLS 29.077 26.922 31.92 29.542 +2.847%* +2.620%* (2.631) (2.648) (3.461) (3.085) (2.753) (1.783) % in SLS 35.390 36.522 34.05 35.112 -1.343%* -1.410%* (1.504) (1.352) (1.901) (1.549) (1.665) (1.129)
Males Females (n = 25 assessments) (n = 20 assessments) Parameter Acute % Chronic % Acute % Chronic % Cases (n=15*) Cases (n=10*) Cases (n=6*) Cases (n=14*) Normalized Velocity 20% 0% 17% 20% Step Length 13% 0% 17% 30% SLS (%GC) 7% 0% 83 30% DLS (%GC) 7% 10% 33% 10%
Spatiotemporal Parameters of Gait Among Adolescent Athletes with Concussion When Performing a Visuospatial Cognitive Task International Journal of Sports Physical Therapy
of a concussion who may require personalized balance and gait training in addition to eventually progressing through a RTP protocol. Perhaps more alarming was the presence of participants who were already classified as having chronic SRC at initial testing, namely female participants E and H, and still experiencing a higher DTC than references on at least one parameter of gait. This finding suggests that a classification of chronicity and perhaps symptom resolution may not be sufficient alone in determining an athlete’s readiness to safely return to sport.
The current study also revealed further inconsistencies in the progression of biomechanical strategies for gait in a dual-task paradigm after participants still in the concussion clinic surpassed the threshold for chronicity (>28 days27) during follow-up testing. Table 5 provides information for male and female athletes with chronic SRC who continued to experience a DTC greater than one SD compared to healthy athlete controls. Female participants D and G experienced a DTC within one SD compared to healthy athletes in normalized velocity during the acute phase (Table 4), but then demonstrated a DTC higher than one SD for the same parameter after meeting the threshold for chronic classification. Given that slowed average gait speed has been highly correlated with concussion severity and prolonged recovery after SRC,14,17,24 special attention may be warranted for athletes with elevated DTCs in this parameter Additionally, although male participant B improved the DTC of his average gait speed and step length, he may have shifted his compensatory strategy to DLS, as evidenced by an increased DTC during the chronic phase (Table 4 and 5). These scenarios of fluid compensatory strategies were not consistent for each participant and varied between males and females; however, athletes like participants B, D, and G, who continued to experience gait deficits 28 days after initial injury, may be at higher risk for reinjury even after progressing through a symptom based RTP protocol.
Modern protocols suggest that, on average, symptom resolution may occur as soon as seven to 10 days following SRC, and most graduated RTP programs progress student athletes back to physical activity mainly guided by subjective symptom resolution.2,6 However, other researchers have identified athletes who reported symptom resolution after 21 to >28 days of initial injury and continued to either walk with significantly slower average gait speeds, smaller cadences, and shorter stride lengths or experience significant DTCs compared to healthy controls. Furthermore, Howell and colleagues24 found that adolescent athletes who experienced reinjury after RTP had consistently demonstrated a significant gait speed DTC across time, similar to participants D and G from our study Therefore, it is evident that more work needs to be done to adequately assess postural stability in gait for adolescent athletes after SRC in addition to symptoms based RTP protocols. Currently, there is no consensus on a viable tool for assessing spatiotemporal parameters of gait following concussion. Based on the findings of the current study, the GAITRite® Walkway System combined with DTC assessment may provide data valuable in identifying deficits in gait that may otherwise go undetected by multimodal assessments such as the Sport Concussion Assessment Tool (SCAT-third or fifth edition), which assesses subjective aspects of ambulation and limited constructs of postural stability during a tandem gait test.2,6
LIMITATIONS
This study used a sample of convenience in a relatively small group of adolescents with a narrow age range. Ideally, all athletes would have been assessed first during the acute phase of SRC and again in a progressive manner throughout the chronic stage. Additionally, not all athletes were able to contribute to assessments beyond initial testing, either due to worsening symptoms or meeting criteria to initiate a RTP
 Figure 2. Percentage of female acute (2a; five out of six) and chronic (2b; four out of 14) cases that experienced a DTC at least one SD greater than those of healthy athletes from the study by Lowe et al20 in each of the spatiotemporal parameters of gait.
Spatiotemporal Parameters of Gait Among Adolescent Athletes with Concussion When Performing a Visuospatial Cognitive Task International Journal of Sports Physical Therapy
Spatiotemporal Parameters of Gait Among Adolescent Athletes with Concussion When Performing a Visuospatial Cognitive Task
Table 4. Subjects with a DTC greater than one SD compared to published values for at least one parameter at initial assessment for the current study.
Values with * indicate either single- or dual-task trials that were at least one SD less compared to healthy athletes. Bolded values with † denote DTCs that were at least one SD greater than those of healthy athletes.
Table 5. Subjects with a DTC greater than one SD compared to published values for at least one parameter during follow-up assessment.
Values with * indicate either single- or dual-task trials that were at least one SD less compared to healthy athletes. Bolded values with † denote DTCs that were at least one SD greater than those of healthy athletes.
Subject Sex Acuity Normalized Velocity Step Length SLS (%GC) DLS (%GC) Single Dual DTC Single Dual DTC Single Dual DTC Single Dual DTC A Male Acute 0.9* 0.53* 0.37† 63.16 44.23* 18.94† 34.9 30.9* 4.0† 29.7 37.3 7.6† B Male Acute 1.2 0.78* 0.42† 68.03 54.48 13.55† 34.2 35.8 1.6 29.7 27.8* 1.9 C Male Acute 1.16 0.8 0.36† 62.75 50.16* 12.59 34.6 33.5 1.1 30.0 32.7 2.7 D Female Acute 1.22 0.89* 0.33 62.4 52.37* 10.03 33.5* 31.0* 5.1† 32.8 37.9 5.1† E Female Chronic 1.86 1.1 0.76 79.63 60.26 19.37† 40.7 37.0* 0.8 18.4* 17.6* 0.8 F Female Acute 0.86* 0.64* 0.22 52.09* 40.63 11.46† 35.0 32.8* 5.1† 28.3 33.4 5.1† G Female Acute 1.19* 0.85* 0.34 60.69 52.05* 8.64 34.0* 32.8* 4.4† 31.2 35.6 4.4 H Female Chronic 1.08* 0.75* 0.33 61.23 92.27* 31.04† 35.4 32.2* 6.6† 28.8 35.4* 6.6† I Female Acute 1.38 1.0 0.38† 63.29 54.46 8.83 36.7 35.5 3.0† 26.8 29.8 3.0 J Female Acute 1.36 1.16 0.2 63.86 59.19 4.67 36.9 34.7 3.4† 25.9 29.3 3.4
Subject Sex Acuity Normalized Velocity Step Length SLS (%GC) DLS (%GC) Single Dual DTC Single Dual DTC Single Dual DTC Single Dual DTC B Male Chronic 1.44 1.14 0.3 77.48* 65.9 11.58 35.8 34.3 1.5 20.8* 31 10.2† D Female Chronic 1.11* 0.76* 0.35† 61.91 50.38* 11.53† 32.7* 29.8* 2.9† G Female Chronic 1.25 0.89* 0.36† 59.01* 49.4* 9.61 38.1* 35.4 2.7†
International Journal of Sports Physical Therapy
protocol. More robust studies with a longer duration and a sample population from more than one medical facility would contribute to improved generalizability of these findings. Furthermore, a more racially and ethnically diverse sample of adolescents with concussion would contribute to generalizability. Data collection was performed using an expensive piece of equipment, not readily available to most clinicians. Further research comparing data obtained using the same visuospatial memory task during gait with incorporation of more traditional and clinically feasible tools (e.g., 10 Meter Walk Test) could provide valuable and practical insight to more clinicians in a variety of settings. Additionally, the complexity of the visuospatial memory task was not customized to the subject’s individual cognitive or motor capacities. Therefore, given the broad potential impact of concussion on neurocognitive capabilities, the attention, detailed understanding, and processing of all testing requirements may have varied for each participant.
CONCLUSIONS
The findings of the current study support the continued need for comprehensive assessments of postural stability in gait for adolescent athletes with SRC. High variation in DTCs that were greater than one SD compared to healthy subjects for several spatiotemporal parameters of gait highlights the potential need for customized rehabilitation plans prior to eventual RTS. No two athletes in the limited sample of the current study demonstrated the same com-
pensatory strategies, mitigation patterns, or potential deficits during single- and dual-task gait with a SRC classified as either acute or chronic in nature. DTC analysis using the GAITRite® Walkway System may be a valuable adjunct to current assessment strategies following concussion among adolescent athletes. However, given potential constraints regarding financial, set-up time, and training requirements for the GAITRite®, future work is warranted to explore viable clinical assessment tools and/or strategies with strong agreement with higher order technologies for evaluating spatiotemporal parameters of gait. Additionally, future studies may build upon the framework established by this preliminary study by incorporating longitudinal designs with assessment of all subjects at varying stages following concussion with inclusion of matched controls from similar schools.
CONFLICTS OF INTEREST
The authors have no conflicts of interest.
FUNDING
Supported by NIGMS IDeA Program award P30 GM110702 through the Center for Translational Neuroscience at the University of Arkansas for Medical Sciences.
Submitted: July 22, 2022 CDT, Accepted: January 15, 2023 CDT
This is an open-access article distributed under the terms of the Creative Commons Attribution 4.0 International License (CCBY-NC-4.0). View this license’s legal deed at https://creativecommons.org/licenses/by-nc/4.0 and legal code at https://creativecommons.org/licenses/by-nc/4.0/legalcode for more information.
Spatiotemporal Parameters of Gait Among Adolescent Athletes with Concussion When Performing a Visuospatial Cognitive Task International Journal of Sports Physical Therapy
REFERENCES
1. Report to Congress: The management of traumatic brain injury in children, National Center for Injury Prevention and Control; Division of Unintentional Injury Prevention. Centers for Disease Control and Prevention. Published January 22, 2016. Accessed February 8, 2023. https://www.cdc.gov/traumaticbrai ninjury/pubs/congress-childrentbi.html
2. Harmon KG, Drezner JA, Gammons M, et al. American Medical Society for Sports Medicine position statement: concussion in sport. Br J Sports Med 2013;47(1):15-26. doi:10.1136/bjsports-2012-09
1941
3. Bryan MA, Rowhani-Rahbar A, Comstock RD, Rivara F. Sports- and recreation-related concussions in US youth. Pediatrics. 2016;138(1):1-8. doi:10.1542/ peds.2015-4635
4. Coronado VG, Haileyesus T, Cheng TA, et al. Trends in sports- and recreation-related traumatic brain injuries treated in US emergency departments: the national electronic injury surveillance system-all injury program (NEISS-AIP) 2001-2012. J Head Trauma Rehabil 2015;30(3):185-197 doi:10.1097/ht r.0000000000000156
5. Sarmiento K, Thomas KE, Daugherty J, et al. Emergency department visits for sports- and recreation-related traumatic brain injuries among children – United States, 2010- 2016. MMWR Morb Mortal Wkly Rep 2019;68(10):237-242. doi:10.15585/ mmwr.mm6810a2
6. McCrory P, Meeuwisse W, Dvorak J, et al. Consensus statement on concussion in sport – the 5th international conference on concussion in sport held in Berlin, October 2016. Br J Sports Med. 2018;51:838-844.
7 Halstead ME, Walter KD, Moffatt K, et al. Sportrelated concussion in children and adolescents. Pediatrics 2018;142(6):1-24. doi:10.1542/peds.2018-3 074
8. Guskiewicz KM. Assessment of postural stability following sport-related concussion. Curr Sports Med Rep 2003;2(1):24-30. doi:10.1249/00149619-2003020 00-00006
9. Oldham JR, DiFabio MS, Kaminski TW, DeWolf RM, Buckley TA. Normative tandem gait in collegiate student-athletes: implications for clinical concussion assessment. Sports Health. 2017;9(4):305-311. doi:1 0.1177/1941738116680999
10. Lau BC, Kontos AP, Collins MW, Mucha A, Lovell MR. Which on-field signs/symptoms predict protracted recovery from sport-related concussion among high school football players? Am J Sports Med 2011;39(11):2311-2318. doi:10.1177/03635465114106 55
11. Mitchell KM, Cinelli ME. Balance control in youth hockey players with and without a history of concussions during a lower limb reaching task. Clin Biomech 2019;67:142-147 doi:10.1016/j.clinbiomec h.2019.05.006
12. Howell DR, Oldham JR, DiFabio M, et al. Singletask and dual-task gait among collegiate athletes of different sport classifications: implications for concussion management. J Appl Biomech. 2017;33(1):24-31. doi:10.1123/jab.2015-0323
13. Berkner J, Meehan WP III, Master CL, Howell DR. Gait and quiet-stance performance among adolescents after concussion-symptom resolution. J Athl Train 2017;52(12):1089-1095. doi:10.4085/106 2-6050-52.11.23
14. Howell DR, Brilliant A, Berkstresser B, Wang F, Fraser J, Meehan WP III. The association between dual-task gait after concussion and prolonged symptom duration. J Neurotrauma 2017;34(23):3288-3294. doi:10.1089/neu.2017.5191
15. Howell DR, Oldham J, Lanois C, et al. Dual-task gait recovery after concussion among female and male collegiate athletes. Med Sci Sports Exerc 2020;52(5):1015-1021. doi:10.1249/mss.00000000000 02225
16. Howell DR, Stracciolini A, Geminiani E, Meehan WP III. Dual-task gait differences in female and male adolescents following sport-related concussion. Gait Posture 2017;54:284-289. doi:10.1016/j.gaitpost.201 7.03.034
17. Howell DR, Buckley TA, Berkstresser B, Wang F, Meehan WP Identification of postconcussion dualtask gait abnormalities using normative reference values. J Appl Biomech. 2019;35(4):290-296. doi:10.11 23/jab.2018-0454
18. Howell DR, Osternig LR, Chou LS. Dual-task effect on gait balance control in adolescents with concussion. Arch Phys Med Rehabil 2013;94(8):1513-1520. doi:10.1016/j.apmr.2013.04.01
5 Spatiotemporal
When Performing a Visuospatial Cognitive Task International Journal of Sports Physical Therapy
Parameters of Gait Among Adolescent Athletes with Concussion
19. Martini DN, Sabin MJ, DePesa SA, et al. The chronic effects of concussion on gait. Arch Phys Med Rehabil 2011;92(4):585-589. doi:10.1016/j.apmr.201 0.11.029
20. Lowe LM, Gokun Y, Williams DK, Yates C. Spatiotemporal parameters of adolescent gait when performing a visuospatial memory task. Intl J Sports Phys Ther. 2019;14(5):753-760. doi:10.26603/ijspt201 90753
21. Howell DR, Osternig LR, Chou LS. Consistency and cost of dual-task gait balance measure in healthy adolescents and young adults. Gait Posture 2016;49:176-180. doi:10.1016/j.gaitpost.2016.07.008
22. Catena RD, Donkelaar PV, Chou LS. The effects of attention capacity on dynamic balance control following concussion. J Neuroeng Rehabil 2011;8(1):1-8. doi:10.1186/1743-0003-8-8
23. Howell DR, Stillman A, Buckley TA, Berkstresser B, Wang F, Meehan WP III. The utility of instrumented dual-task gait and tablet-based neurocognitive measurements after concussion. J Sci Med Sport 2018;21(4):358-362. doi:10.1016/j.jsams.2 017.08.004
24. Howell DR, Buckley TA, Lynall RC, Meehan WP III. Worsening dual-task gait costs after concussion and their association with subsequent sport-related injury J Neurotrauma 2018;35(14):1630-1636. doi:1 0.1089/neu.2017.5570
25. Alkathiry AA, Sparto PJ, Freund B, et al. Using accelerometers to record postural sway in adolescents with concussion: a cross-sectional study J Athl Train 2018;53(12):1166-1172. doi:10.4085/1062-6050-51 8-17
26. Fay D, Brock E, Peneton S, et al. Physical therapists’ use and alteration of standardized assessments of motor function in children. Pediatr Phys Ther 2018;30(4):318-325. doi:10.1097/pep.0000 000000000532
27. Parker TM, Osternig LR, Donkelaar PV, Chou LS. Recovery of cognitive and dynamic motor function following concussion. Br J Sports Med 2007;41(12):868-873. doi:10.1136/bjsm.2006.033761
28. Webster KE, Wittwer JE, Feller JA. Validity of the GAITRite® walkway system for the measurement of averaged and individual step parameters of gait. Gait Posture 2005;22(4):317-321. doi:10.1016/j.gaitpost.2 004.10.005
29. Lowe L, Castillo F, Gokun Y, et al. Static and dynamic balance assessment in health and concussed adolescent athletes. Clin J Sport Med 2021;00:1-6.
30. Kieffer EE, Brolinson PG, Rowson S. Dual-task gait performance following head impact exposure in male and female collegiate rugby players. Int J Sports Phys Ther. 2022;17(3):355-365. doi:10.26603/001c.32 591
Spatiotemporal Parameters of Gait Among Adolescent Athletes with Concussion When Performing a Visuospatial Cognitive Task International Journal of Sports Physical Therapy
Muscle Strength, Oxygen Saturation and Physical Activity in Patients with Chronic Exertional Compartment Syndrome Compared to Asymptomatic Controls
3
Lisa Urup Tønning
1 a ,
Bjarne Mygind-Klavsen
1 , Troels
Kjeldsen
1 , Ulrik
Dalgas
2 , John
Brincks
, Inger Mechlenburg1
1 Orthopedic Surgery, Aarhus University Hospital, 2 Public Health, Aarhus University, 3 Research Centre for Health and Welfare Technology, Programme for Rehabilitation & Department of Physiotherapy, VIA University College
Keywords: Chronic Exertional Compartment Syndrome, Muscle Strength, Exercise-Induced Leg Pain, Oxygen saturation, Physical activity https://doi.org/10.26603/001c.71357
International Journal of Sports Physical Therapy
Background
One of the most common causes of exercise-induced pain in the lower leg is chronic exertional compartment syndrome (CECS). Research is limited on muscle strength, oxygen saturation and physical activity in patients with CECS.
Purpose
To compare muscle strength, oxygen saturation, and daily physical activity between patients with CECS and matched asymptomatic controls. A secondary purpose was to investigate the association between oxygen saturation and lower leg pain in patients with CECS.
Study Design
Case-control study.
Method
Maximal isometric muscle strength of the ankle plantar and dorsiflexors was tested in patients with CECS and sex- and age-matched controls using an isokinetic dynamometer and oxygen saturation (StO2) during running was tested by near infrared spectroscopy. Perceived pain and exertion were measured during the test using the Numeric Rating Scale and Borg Rating of Perceived Exertion scale and the exercise-induced leg pain questionnaire. Physical activity was assessed by accelerometry
Results
Twenty-four patients with CECS and 24 controls were included. There were no differences in maximal isometric plantar or dorsiflexion muscle strength between patients and controls. Baseline StO2 was 4.5pp (95% CI: 0.7;8.3) lower for patients with CECS than for controls, whereas no difference existed when they experienced pain or reached exhaustion. No differences were found in daily physical activities, except that on average, patients with CECS spent less time cycling daily. During the StO2 measurement, patients experienced pain or reached exhaustion while running significantly earlier than the controls (p<0.001). StO2 was not associated with leg pain.
Corresponding author:
Lisa Urup Tønning
Department of Orthopedic Surgery, Aarhus University Hospital
Palle Juul-Jensens Boulevard 99, 8200 Aarhus, Denmark
E-mail: lisatoenning@clin.au.dk
Telephone: +4526474080
Research
Original
a
Tønning LU, Mygind-Klavsen B, Kjeldsen T, Dalgas U, Brincks J, Mechlenburg I. Muscle Strength, Oxygen Saturation and Physical Activity in Patients with Chronic Exertional Compartment Syndrome Compared to Asymptomatic Controls. IJSPT. Published online April 1, 2023:348-357. doi:10.26603/001c.71357
Conclusion
Patients with CECS have similar leg muscle strength, oxygen saturation and physical activity levels as asymptomatic controls. However, patients with CECS experienced significantly higher levels of lower leg pain than the controls during running, daily activities and at rest. Oxygen saturation and lower leg pain were not associated.
Level of Evidence
Level 3b.
INTRODUCTION
One of the most common causes of exercise-induced pain in the lower leg is chronic exertional compartment syndrome (CECS).1 The cause of this syndrome has been debated and is still not fully clarified.2,3 CECS has been defined as pain due to exertion-increased muscle compartment pressure, causing tissue perfusion and ischemic pain.2,4 Symptoms include cramping pain, paraesthesia and muscle weakness.5 Most often, the anterior compartment is affected, but the deep posterior compartment, the lateral compartment and the superficial posterior compartment may also be affected.6 CECS has been described as a problem exclusively in athletes, but the condition has also been observed in both nonathletic individuals as well as in individuals with a sedentary lifestyle.2 Running and walking were reported as the main activity causing pain among 36 patients with CECS.2
The CECS diagnosis relies on a medical history of exercise-induced pain in the lower leg with symptom resolution after exercise cessation, and CECS may further be accompanied by increased intramuscular pressure after exercise.2,4,6
The intra-compartmental pressure can be measured using a needle or catheter inserted into the muscular compartment.4 However, this is an invasive and painful intervention, and near-infrared spectroscopy (NIRS) has been suggested as a non-invasive alternative allowing assessment of tissue oxygen saturation (StO2) and muscle hemodynamics in both patients and healthy populations.3
First-line treatment for CECS includes reduced exercise volume, gait alteration, running alteration and/or strengthening exercises.6,7 If a conservative approach fails, CECS can be treated surgically with subcutaneous fasciotomy 8 A recent systematic review based on 68 studies evaluated results of a total of 3783 patients of whom 95% were surgically treated for CECS.9 The review found an overall satisfaction rate of 85% after surgery compared to a satisfaction rate after conservative treatment of 47%.9 The overall return to physical activity rate was 80% after surgery and 50% after conservative treatment.9 Thus, further studies aiming to identify potential physiological treatment targets in patients with CECS are highly warranted.
The primary aim of the study was to compare muscle strength, StO2 and physical activity among patients with CECS and a group of sex- and age-matched asymptomatic controls. It was hypothesized that patients with CECS would have (i) higher maximal muscle strength in the plantar and dorsiflexion of the ankle joints, (ii) lower StO2 in the affected compartment during running and (iii) higher daily physical activity levels compared to a group of sex-
and age-matched asymptomatic controls. The secondary aim was to investigate any association between oxygen saturation and lower leg pain.
METHODS
The present case-control study compared a group of patients with CECS and a group of sex- and age-matched asymptomatic controls. The study was conducted in accordance with the Helsinki declaration. The design, aim and procedures were presented to the local research ethics committee (record number: 183/2018). According to Danish law, no ethics approval was needed for this type of study The Danish Data Protection Agency approved handling of personal data (record number: 1-16-02-181-19), and all included participants provided written consent prior to data collection.
PATIENTS
Patients with suspected CECS were recruited at Department of Orthopaedic Surgery at Aarhus University Hospital between November 2019 and June 2021. Inclusion criteria were unilateral or bilateral symptoms of CECS, such as intense anterior lower leg pain or intense tightness after approximately 10 minutes of physical activity, muscle cramps and/or decreased muscular function of one of the compartments in combination with pain. In addition, symptoms had to have persisted for three months, and symptoms had to be normalized within ~30 minutes of exercise cessation. Patients were excluded if they demonstrated symptoms of nerve or artery entrapment, lumbar spine disease, muscle herniation, tibial stress fracture, or tibial stress syndromes. As the NIRS technology might be less accurate in patients with highly pigmented skin or a fat layer of more than 4 cm subcutaneous at the testing area, these patients were excluded from the study after assessment.
ASYMPTOMATIC CONTROLS
Asymptomatic controls were recruited by advertisements at the educational institution VIA University College, Aarhus University Hospital and through social media. Controls were matched by sex and age (+/- 5 years) with patients with CECS and were able to read and understand Danish. Controls were not considered eligible if they (i) had been diagnosed with CECS, (ii) had a chronic disease or a musculoskeletal injury affecting their gait or muscle function, (iii) were undergoing elective surgery in the lower extremities within the next six months, (iv) had undergone surgery in
International Journal of Sports Physical Therapy
Muscle Strength, Oxygen Saturation and Physical Activity in Patients with Chronic Exertional Compartment Syndrome Compared.
the lower extremities within the prior two years or (v) were pregnant.
TEST PROCEDURE
Patients and controls were tested by a physiotherapist or an exercise physiologist trained in the test procedure at Department of Public Health, Aarhus University. Weight was measured using a Tanita weight (SC-330MA, Tanita Corporation of America, Illinois, USA), and height was measured using a telescopic height measuring device from ADE (MZ10023, DES Germany Gmbh, Hamburg, Germany).
ISOMETRIC MUSCLE STRENGTH
Maximum voluntary isometric contraction of the plantar and dorsiflexors of the foot was measured in an isokinetic dynamometer (Humac Norm CSMi, Stoughton, Massachusetts, USA). Motor-driven dynamometry has been described as the gold standard in assessment of muscle strength.10 Isometric plantar flexion was tested first, starting with the contralateral leg, followed by dorsiflexion of the same leg (Figure 1). The test was performed with the patient in a prone position, without shoes and with the knee in 0o The dynamometer rotation axis was aligned with the lateral malleolus on the tested leg when the foot was in a neutral position (0o). Plantarflexion was tested in this position, while dorsiflexion was tested in 25o plantar flexion. Patients and controls were instructed to press against the dynamometer pad with as much force and as fast as possible for about four seconds. Subsequently, isometric plantar flexion followed by dorsiflexion was tested in the affected/ paired leg. Between each attempt, a rest period of 30 seconds was provided. To correct for gravity, the weight of the leg was measured for each movement. One test attempt was made followed by at least three maximum voluntary contraction attempts. If an improvement of more than 10% in the last attempt was detected, an additional attempt was performed. However, a maximum of five attempts was completed to avoid muscle fatigue. A test-retest was performed for the first six patients. The intraclass coefficient (ICC) was 0.92 (95% CI: 0.66;0.98) for the measure of plantar flexion and 0.77 (95% CI: 0.24;0.95) for dorsi flexion in the affected leg. For the nonaffected leg, the ICC was 0.77 (95% CI: 0.26;0.95) for plantarflexion and 0.76 (95% CI: 0.18;0.95) for dorsiflexion.
NEAR-INFRARED SPECTROSCOPY
StO2 was measured using NIRS. The PortaMon, a wearable wireless NIRS unit (Artinis Medical System, Elst, The Netherlands), was placed on the affected leg at the affected compartment in patients and on the right leg at the matched compartment in controls (Figure 1). First, fibula length was measured, and 1/3 of the fibula length was marked distal from the head of the fibula. If the anterior compartment was affected, the PortaMon was placed 2 cm laterally from the forward facing bone margin (margo anterior) on tibia and in line with the mark on fibula. If the lateral compartment was affected, the PortaMon was placed 6
cm laterally from margo anterior on tibia and in line with the mark on fibula. If the posterior superficial compartment was affected, the PortaMon was placed on the muscle belly of the medial gastrocnemius. The area was shaved and cleansed before placing the PortaMon with two bandages to keep free of light. Data were collected using the OxySoft software (Artinis Medical System, Elst, The Netherlands). All participants were instructed to run on a treadmill starting at 10 km/hour The speed was increased by 1 km/hour every two minutes until the patients experienced intense recognizable leg pain or reached exhaustion. Information on perceived pain and exertion was obtained using a Numeric Rating Scale (NRS)11 and the Borg Rating of Perceived Exertion scale12 every minute. The test was terminated for controls when they reached exhaustion. Patients and controls were then instructed to sit down and relax for 10 min. while still measuring StO2 During the test, the timepoints for starting, stopping, and terminating the test were registered in the OxySoft software. After the test, baseline StO2 was registered as an average of 15 StO2 registrations prior to the baseline mark and peak StO2 as an average of 15 StO2 registrations prior to the stop mark and the absolute and relative (percentage) change was calculated.13 A test-retest was performed for the first six patients. The ICC was 0.73 (95% CI: 0.02;0.96) for the measure of baseline StO2 and 0.92 (95% CI: 0.59;0.99) for the peak exercise StO2 NIRS has been found to be a valid and reliable noninvasive measurement to measuring StO2 and diagnose CECS, compared to intracompartmental pressure, with a sensitivity of 85%.4
PHYSICAL ACTIVITY
Daily physical activity was measured using tri-axial accelerometry by placing an accelerometer (AX3 Axivity Ltd., Newcastle, UK) on the lateral side of the thigh, at half the
 Figure 1. Procedure for testing isometric muscle strength in plantar and dorsiflexion, and oxygen saturation with Near Infrared Spectroscopy.
International Journal of Sports Physical Therapy
Muscle Strength, Oxygen Saturation and Physical Activity in Patients with Chronic Exertional Compartment Syndrome Compared.
distance from the major trochanter to the lateral femoral condyle, on the affected leg in patients and on the right leg in controls (Figure 2). The accelerometers were small wearable sensors measuring acceleration in three dimensions at 100 Hz. Patients and controls were asked to wear the accelerometer for seven consecutive days following the physical tests and to remove the accelerometer at night. Each day, patients registered information on when they had put on and removed the accelerometer and whether it had been removed during the day In the same logbook, the patients rated their daily level of pain during rest and activity on a 100-millimetre-long visual analogue scale (VAS). The accelerometer and the logbook were returned to the hospital and data was downloaded using the OMGUI Configuration and Analysis Tool (Version 1.0.0.43, Newcastle, UK). Data were split into days and analysed using a validated algorithm to identify different types of activities based on the average magnitudes of the three acceleration vectors and the gait cycle frequency 14 Furthermore, an intensity parameter was constructed, grouping each 10-second data window into one of the following categories; (i) very low intensity activity (0-0.05 g) e.g., sitting or standing, (ii) low intensity activity (0.05-0.1 g) e.g., standing or shuffling, (iii) moderate intensity activity (0.1-0.2 g) e.g., slow or normal walking and (iv) high intensity activity (>0.2 g) e.g., fast walking, running or jumping.14 Days containing less than 10 hours of data were excluded.15 To describe the daily physical activity collected with accelerometers, the four dimensions of physical activity according to the World Health Organization (WHO): Frequency, Intensity, Time and Type (F.I.T T ) were used.16
THE EXERCISE-INDUCED LEG PAIN QUESTIONNAIRE
The exercise-induced leg pain questionnaire (EILP) was originally developed for German-speaking patients (EILPG) with exercise-induced leg pain such as CECS, medial tibial stress syndrome and stress fractures.17 The German version of the questionnaire has been found to have excellent

reliability, with an Intraclass Correlation Coefficient ranging from 0.86-0.99, as well as good face and construct validity to measure the severity of symptoms and functional limitations for patients with exercise-induced leg pain.17 The questionnaire consists of 10 items scored on a five-point Likert scale ranging from no difficulty to unable to do (0-4). The total score was calculated by dividing the sum score with the maximum possible points and then converted to a score from 0-100, where 0 indicated severe problems and 100 indicated no problems. A Danish version of the questionnaire was used, translated in accordance with international standards18 and approved by the authors of the original German version.
STATISTICAL ANALYSIS
Categorical variables were presented as numbers with percentages and analysed using the chi-squared test. Continuous variables were presented as means with 95% confidence intervals (95% CI) if normally distributed, otherwise as medians with interquartile ranges (IQR). The assessment of normality was performed using probability plots and histograms. Comparisons between the two groups were made using the student t-test when data were normally distributed, and the Mann-Whitney U test was used to compare the not normally distributed EILP-D and VAS scores between groups. The Spearman’s Rank Correlation Coefficient assessed associations between StO2 and lower leg pain. Correlations were interpreted as follows: a correlation >0.90 was interpreted as very strong, 0.70-0.89 as strong, 0.50-0.69 as moderate, 0.30-0.49 as weak and <0.29 as low 19 All statistical analyses were performed in Stata version 17.0 (StataCorp LLC, College Station, TX, USA).
RESULTS
Twenty-four patients with CECS and 24 age- and sexmatched controls were included in this study Characteristics of patients and controls are presented in Table 1
ISOMETRIC MUSCLE STRENGTH
There were no significant differences between the two groups in either isometric plantar or dorsiflexion, nor in the affected/matched leg or the contralateral leg (Table 2). In addition, the difference between the affected and the contralateral leg in plantarflexion for patients with CECS was 1.8 Nm (95% CI -10.3;14.0), though not statistically significant (p=0.76). The difference was 0.6 Nm (95% CI -2.4;3.5) for dorsiflexion, which was not statistically significant (p=0.69).
OXYGEN SATURATION
The baseline StO2 in the affected or matched compartment was 4.5pp (95% CI: 0.7;8.3) lower for patients with CECS compared with controls (Table 2). The peak exercise StO2 was similar for the two groups as the mean peak exercise StO2 was 51.4% (SD 11.2) for patients and 52.9% (SD 16.7) for controls. There were no significant differences in the ab-
Figure 2. Procedure for testing daily physical activity using tri-axial accelerometry
International Journal of Sports Physical Therapy
Muscle Strength, Oxygen Saturation and Physical Activity in Patients with Chronic Exertional Compartment Syndrome Compared.
patients. b21 patients. c23 patients. d16 patients. Abbreviations: BMI: Body Mass Index. CECS: chronic exertional compartment syndrome; EILP-D: Exercise Induced Leg Pain
p-value, SD: standard deviation. VAS: Visual Analogue Scale.
solute and relative change scores between the two groups (Table 2). However, the treadmill running time during the test was 3.5 minutes (95% CI: 1.7;5.3) lower for patients compared with controls.
PHYSICAL ACTIVITY
Unfortunately, four patients did not return the accelerometers and these patients were thus excluded from the analysis of physical activity. In addition, two days of physical activity measurement from two patients with CECS and seven days from seven controls were excluded as these days contained less than 10 hours of data collection (range 2.5-9.9
Patients with CECS Controls p-value Number of participants, n (%) 24 (100) 24 (100) Males, n (%) 14 (58) 14 (58) Age 27 (8.0) 27 (6.6) 0.68 Height (cm), mean (SD) 177.6 (7.6) 176.6 (10.6) 0.68 Weight (kg), mean (SD) 79.7 (11.7) 77.3 (13.3) 0.50 BMI (kg/m2), mean (SD) 25.2 (2.7) 24.7 (2.9) 0.53 Right leg was affected, n (%) 17 (71) Previously undergone fasciotomy, n (%) 4 (20)a Scheduled for fasciotomy after participating in the study, n (%) 11 (21)b Localisation of compartment Anterior compartment of the leg, n (%) 7 (29) Lateral compartment of the leg, n (%) 3 (13) Posterior superficial compartment of the leg, n (%) 14 (58) Patient-reported leg pain EILP-D score, median (IQR) 60 (52.5;67.5)c 100 (91.1;100) <0.001 VAS in rest, median (IQR) 9 (4;18)d 0 (0;0) <0.001 VAS in activity, median (IQR) 24 (15;36)d 0 (0;0) <0.001 a
–
P:
Table 1. Participant characteristics.
20
Danish.
Patients with CECS Controls Difference n Mean (SD) n Mean (SD) Mean (95% CI) pvalue Isometric muscle strength, Nm Plantar flexion, affected/matched leg 24 109.2 (46.5) 24 115.0 (41.4) -5.9 (-31.5;19.7) 0.65 Plantar flexion, contralateral leg 24 107.3 (35.6) 24 93.9 (42.3) 13.4 (-9.3;36.1) 0.24 Dorsiflexion, affected/matched leg 24 42.1 (10.8) 24 37.4 (9.3) 4.7 (-1.2;10.5) 0.12 Dorsiflexion, contralateral leg 24 41.5 (10.2) 24 41.2 (8.4) 0.3 (-5.2;5.8) 0.92 Near Infrared Spectroscopy (NIRS) measurement Baseline StO2, % 24 64.3 (5.4) 22 68.8 (7.4) -4.5 (-8.3;-0.7) 0.02 Peak exercise StO2, % 24 51.4 (11.2) 22 52.9 (16.7) -1.5 (-9.9;6.9) 0.72 Absolute change StO2, % 24 13.0 (8.6) 22 16.0 (13.9) -3.0 (-9.8;3.8) 0.39 Relative change StO2, % 24 20.5 (13.4) 22 23.7 (20.5) -3.2 (-13.4;7.1) 0.54 Time from start to end of test, min. 24 5.9 (3.0) 22 9.4 (3.1) -3.5 (-5.3;-1.7) <0.001 NRS at the end of the running test 24 5.6 (2.6) 22 0.8 (1.4) 4.8 (3.6;6.0) <0.001 Borg at the end of the running test 24 15.8 (2.5) 22 18.3 (2.1) -2.5 (-3.9;-1.1) <0.001 Abbreviations: CECS: chronic exertional compartment syndrome; NRS: Numeric Raking Scale. StO2: oxygen saturation.
Table 2. Isometric muscle strength of plantar and dorsiflexion, and Near Infrared Spectroscopy measurement of oxygen saturation in patients with chronic exertional compartment syndrome and controls.
Muscle Strength, Oxygen Saturation and Physical Activity in Patients
Chronic Exertional
International Journal of Sports Physical Therapy
with
Compartment Syndrome Compared.
hours). Patients had worn the accelerometer for an average of 6.6 days, ranging from two to seven days, and controls had worn the accelerometer for an average of 6.6 days, ranging from five to seven days. During a day, comparable levels of walking, standing and being sedentary were observed in persons with CECS and controls, respectively. Controls spent 11.0 minutes (95% CI: 3.6;18.3) more cycling per day than patients with CECS (p=0.004). On average, the two groups performed the same amount of very low, moderate, and high intensity activity per day, but patients performed 4.0pp (95% CI: 0.5;7.5) more low intensity activity than controls (p=0.02). There were no significant differences between the groups in number of daily steps, walking cadence or number of sit to stand transfers (Table 3).
PATIENT-REPORTED LEG PAIN
The last obtained NRS and Borg values were significantly higher for patients than controls (p<0.001) (Table 2). There was no association between either peak or absolute change StO2 and patient-reported leg pain (Table 4).
DISCUSSION
No differences were found in maximal isometric plantar- or dorsiflexion muscle strength between patients with CECS and a group of sex- and age-matched asymptomatic controls. Baseline StO2 was lower for patients with CECS than controls, however no difference existed when they experienced pain or reached exhaustion, even though patients
with CECS did this significantly earlier than controls. Overall, no differences were found in daily physical activities and StO2 was not associated with leg pain.
Patients with CECS did not have greater muscle strength in isometric ankle plantar- or dorsiflexion compared with controls. In addition, no differences were found between the CECS-affected leg and the contralateral leg. Birtles et al. also observed no difference between isometric dorsiflexion in patients with CECS and asymptomatic controls.20 However, they did report a significant difference in eccentric dorsiflexion, favouring patients with CECS.20 Furthermore, Birtles et al. did not observe a difference in muscle thickness or change in muscle size after the exercise between patients and controls.
In the present study, patients with CECS had significant lower StO2 in the affected compartment before running on the treadmill compared to controls. However, the baseline group difference was no longer apparent at peak exercise StO2 This result contrasts with the study by van den Brand et al., who did not find a difference in baseline StO2 between 13 patients with CECS and eight healthy volunteers, but observed a significant group difference at peak exercise StO2 13 Moreover, patients with CECS had a lower peak exercise StO2 than the healthy volunteers and also lower change scores.13 The mean baseline StO2 was 87 (SD 11) for the 20 legs of patients with CECS and 91 (SD 5) for the 16 legs of the healthy volunteers in the study by van den Brand et al.13 In the current study, baseline StO2 was 64.3 (SD 5.4) among the 24 patients with CECS and 68.8 (SD 7.4) among the 24 controls. Baseline StO2 was thus very different between this study and the study by van den Brand et
Dimension Parameter Patients with CECS Mean (SD) n = 20 Controls Mean (SD) n = 24 Difference Mean (95% CI) p-value Frequency Steps total, n 7257 (2087) 7982 (1876) -725 (-1931;481) 0.23 Intensity Average cadence, steps/min 94.9 (7.1) 92.6 (8.9) 2.3 (-2.7;7.3) 0.36 Very low intensity activity, % 67.9 (9.7) 73.3 (9.0) -5.3 (-11.0;0.4) 0.07 Low intensity activity, % 17.4 (5.7) 13.4 (5.7) 4.0 (0.5;7.5) 0.02 Moderate intensity activity, % 8.5 (3.9) 6.7 (2.7) 1.8 (-0.3;3.8) 0.08 High intensity activity, % 6.2 (2.7) 6.6 (2.1) -0.4 (-1.9;1.0) 0.55 Time Wear time, hours 14.2 (1.0) 14.8 (0.8) -0.6 (-1.2;-0.1) 0.02 Walking, hours 1.7 (0.5) 1.9 (0.4) -0.2 (-0.5;0.04) 0.10 Standing, hours 3.1 (1.1) 3.4 (0.8) -0.4 (-1.0;0.2) 0.21 Sedentary, hours 9.3 (1.4) 9.2 (1.2) 0.2 (-0.6;1.0) 0.66 Running, min 1.1 (1.6) 1.6 (2.9) -0.5 (-1.9;0.9) 0.47 Cycling, min 7.2 (10.7) 18.1 (13.1) -11.0 (-18.3;-3.6) 0.004 Type Sit to stand transfers, n 48 (12.9) 53 (13.6) -5 (-13;3) 0.21 Physical activity was measured for 2-7 days and presented as means. Abbreviations: CECS: chronic exertional compartment syndrome; F.I.T T: frequency, intensity, time and type.
Table 3. Daily physical activity levels in patients with chronic exertional compartment syndrome and controls described by the WHO dimensions of F.I.T.T.
Muscle
International Journal of Sports Physical Therapy
Strength, Oxygen Saturation and Physical Activity in Patients with Chronic Exertional Compartment Syndrome Compared.
Table 4. Associations between oxygen saturation and patient-reported leg pain in patients with chronic exertional compartment syndrome and controls.
al., which is probably explained by differences in study population as the patients in the study by van den Brand et al. were all in the army and were predominantly young men. In addition, the difference could indicate a possible systematic difference between the two measurement systems as well as the testing procedures, as van den Brand et al. used two InSpectraTM Spectrometers (Hutchinson Technology Inc., Hutchinson, Minnesota) and tested both legs.
Patients with CECS did not spend more time walking and standing than controls and sedentary time was also similar between groups. In addition, there were no differences between the groups in the number of daily steps, walking cadence or number of sit to stand transfers. Controls, however, spent 11 minutes more cycling per day than patients with CECS. This could indicate that patients with CECS avoid cycling. This is interesting as cycling has been reported as both a conservative treatment in CECS as well as part of rehabilitation after fasciotomy 21 Furthermore, both patients and controls had a mean number of daily steps and walking cadence exceeding the minimum recommendations for physical activity (7000-8000 steps per day for healthy adults with a cadence of 100 steps per minute22). The physical activity level among controls included in this study was generally comparable to the physical activity level in a group of asymptomatic controls included in a similar study of young individuals from the same geographical area, although different recruitment methods had been applied.23 The physical activity level found among controls in the current study thus seems representative for young Danish individuals.
There was a statistically significant difference in running time during testing, as patients on average experienced
pain or reached exhaustion 3.5 min. (95% CI: 1.7;5.3) earlier than controls. Despite this, there was no association between StO2 and leg pain. The included patients with CECS experienced more exercise-induced leg pain than controls. Also, patients had statistically significant more lower leg pain when resting and during activity throughout the day than controls. Patient-reported pain of the lower leg was measured using EILP-D and VAS, both valid and reliable methods.17,24 Birtles et al. used a Numeric Rating Scale (NRS) ranging from 0-10 to assess pain among patients with CECS and a group of asymptomatic controls, 24 and 48 hours after assessment.20 They also observed a statistically significant difference in pain levels between patients and asymptomatic controls during activities. Thus, pain is the primary parameter that distinguishes patients with CECS from controls.
STRENGTHS AND LIMITATIONS
A strength of this study is the relatively high number of patients and controls compared to similar studies in patients with CECS.13,20 The study by van den Brand et al. included 13 patients and eight healthy volunteers,13 while Birtles et al. included 10 patients and 14 healthy controls.20 However, a sample size calculation was not performed, and the study population was thus based on a convenience sample. Moreover, the comprehensive test procedure, allowing investigation of both muscle strength, StO2, daily physical activity and patient-reported leg pain is a strength. A limitation to the NIRS measurement was that ultrasound was not used to evaluate the placement of the PortaMon above the painful
Patients with CECS Controls n Correlationa Interpretation p n Correlationa Interpretation p Correlation between NRS and peak exercise StO2 24 -0.27 Low 0.20 22 0.14 Low 0.53 Correlation between NRS and absolute change StO2 24 0.16 Low 0.45 22 -0.22 Low 0.32 Correlation between EILP-D and peak exercise StO2 23 0.05 Low 0.82 22 0.02 Low 0.93 Correlation between EILP-D and absolute change StO2 23 0.04 Low 0.87 22 0.07 Low 0.77 aSpearman’s Rank Correlation. Abbreviations: CECS: chronic exertional compartment syndrome; NRS: Numeric Rating Scale; EILP-D: Exercise Induced Leg Pain Danish; StO2: oxygen saturation.
Muscle Strength, Oxygen Saturation and Physical Activity in Patients with Chronic Exertional Compartment Syndrome Compared. International Journal of Sports Physical Therapy
compartment. The NIRS measurement may thus be biased by measurement errors.
CONCLUSION
The included patients with CECS did not differ from the asymptomatic controls in lower leg muscle strength, oxygen saturation, or physical activity However, patients experienced higher levels of lower leg pain than controls during running, daily activities and at rest. There was no association between oxygen saturation and lower leg pain between groups.
ACKNOWLEDGEMENT
The authors would like to thank Anna Karina Beck and Signe Schütt Kobberrød for testing all the asymptomatic controls, as well as Kathrine Krone, Katrine Salling Kjøller, Mathias Floor Andersen, Nana Hedegaard Kristensen and Niklas Munk for testing the first half of the patients.
CONFLICTS OF INTEREST
The authors report no conflicts of interest.
FUNDING
No funding was received in relation to this project.
Submitted: September 12, 2022 CDT, Accepted: January 15, 2023 CDT
This is an open-access article distributed under the terms of the Creative Commons Attribution 4.0 International License (CCBY-NC-4.0). View this license’s legal deed at https://creativecommons.org/licenses/by-nc/4.0 and legal code at https://creativecommons.org/licenses/by-nc/4.0/legalcode for more information.
International Journal of Sports Physical Therapy
Muscle Strength, Oxygen Saturation and Physical Activity in Patients with Chronic Exertional Compartment Syndrome Compared.
REFERENCES
1. Styf J. Diagnosis of exercise-induced pain in the anterior aspect of the lower leg. Am J Sports Med 1988;16(2):165-169. doi:10.1177/03635465880160021
2. Edmundsson D, Toolanen G, Sojka P Chronic compartment syndrome also affects nonathletic subjects: A prospective study of 63 cases with exercise-induced lower leg pain. Acta Orthop 2007;78(1):136-142. doi:10.1080/17453670610013547
3. George CA, Hutchinson MR. Chronic exertional compartment syndrome. Clin Sports Med 2012;31(2):307-319. doi:10.1016/j.csm.2011.09.013
4. van den Brand JGH, Nelson T, Verleisdonk EJMM, van der Werken C. The diagnostic value of intracompartmental pressure measurement, magnetic resonance imaging, and near-infrared spectroscopy in chronic exertional compartment syndrome: a prospective study in 50 patients. Am J Sports Med 2005;33(5):699-704. doi:10.1177/0363546
504270565
5. Edwards P, Myerson MS. Exertional compartment syndrome of the leg. Phys Sportsmed 1996;24(4):31-46. doi:10.1080/00913847.1996.119479
38
6. Diebal AR, Gregory R, Alitz C, Gerber JP. Forefoot running improves pain and disability associated with chronic exertional compartment syndrome. Am J Sports Med. 2012;40(5):1060-1067. doi:10.1177/03635
46512439182
7 Vogels S, Ritchie ED, van Dongen TTCF, Scheltinga MRM, Zimmermann WO, Hoencamp R. Systematic review of outcome parameters following treatment of chronic exertional compartment syndrome in the lower leg. Scand J Med Sci Sports. 2020;30(10):1827-1845. doi:10.1111/sms.13747
8. Winkes MB, Hoogeveen AR, Houterman S, Giesberts A, Wijn PF, Scheltinga MR. Compartment pressure curves predict surgical outcome in chronic deep posterior compartment syndrome. Am J Sports Med. 2012;40(8):1899-1905. doi:10.1177/0363546512
449324
9. Fronek J, Mubarak SJ, Hargens AR, et al. Management of chronic exertional anterior compartment syndrome of the lower extremity Clin Orthop Relat Res. 1987;220:217-227. doi:10.1097/0000 3086-198707000-00030
10. Meyer C, Corten K, Wesseling M, et al. Test-retest reliability of innovated strength tests for hip muscles. PLoS ONE. 2013;8(11):e81149. doi:10.1371/journal.po ne.0081149
11. Jensen MP, Karoly P, Braver S. The measurement of clinical pain intensity: a comparison of six methods. Pain 1986;27(1):117-126. doi:10.1016/030 4-3959(86)90228-9
12. Borg GAV. Psychophysical bases of perceived exertion. Med Sci Sports Exerc 1982;14(5):377-381. do i:10.1249/00005768-198205000-00012
13. Van Den Brand JGH, Verleisdonk EJMM, Van Der Werken C. Near infrared spectroscopy in the diagnosis of chronic exertional compartment syndrome. Am J Sports Med. 2004;32(2):452-456. do i:10.1177/0363546503261733
14. Lipperts M, van Laarhoven S, Senden R, Heyligers I, Grimm B. Clinical validation of a body-fixed 3D accelerometer and algorithm for activity monitoring in orthopaedic patients. J Orthop Translat 2017;11:19-29. doi:10.1016/j.jot.2017.02.003
15. Sliepen M, Lipperts M, Tjur M, Mechlenburg I. Use of accelerometer-based activity monitoring in orthopaedics: benefits, impact and practical considerations. EFORT Open Rev. 2020;4(12):678-685. doi:10.1302/2058-5241.4.180041
16. Cavill N, Kahlmeier S, Racioppi F. Physical Activity and Health in Europe: Evidence for Action. WHO Library Cataloguing in Publication Data; 2006.
17 Nauck T, Lohrer H, Padhiar N, King JB. Development and validation of a questionnaire to measure the severity of functional limitations and reduction of sports ability in German-speaking patients with exercise-induced leg pain. Br J Sports Med 2015;49(2):113-117 doi:10.1136/bjsports-201 2-091745
18. Beaton DE, Bombardier C, Guillemin F, Ferraz MB. Guidelines for the process of cross-cultural adaptation of self-report measures. Spine 2000;25(24):3186-3191. doi:10.1097/00007632-20001 2150-00014
19. Koo TK, Li MY A guideline of selecting and reporting intraclass correlation coefficients for reliability research. J Chiropr Med 2016;15(2):155-163. doi:10.1016/j.jcm.2016.02.012
4
International Journal of Sports Physical Therapy
Muscle Strength, Oxygen Saturation and Physical Activity in Patients with Chronic Exertional Compartment Syndrome Compared.
20. Birtles D, Rayson M, Jones D, Padhiar N, Casey A, Newham D. Effect of eccentric exercise on patients with chronic exertional compartment syndrome. Eur J Appl Physiol. 2003;88(6):565-571. doi:10.1007/s0042 1-002-0740-z
21. Tucker AK. Chronic exertional compartment syndrome of the leg. Curr Rev Musculoskelet Med 2010;3(1-4):32-37. doi:10.1007/s12178-010-9065-4
22. Tudor-Locke C, Craig CL, Brown WJ, et al. How many steps/day are enough? For adults. Int J Behav Nutr Phys Act. 2011;8(79). doi:10.2165/00007256-200 232120-00004
23. Reimer LCU, Kierkegaard S, Mechlenburg I, Jacobsen JS. Does daily physical activity differ between patients with femoroacetabular impingement syndrome and patients with hip dysplasia? A cross-sectional study in 157 patients and 60 healthy volunteers. Int J Sports Phys Ther 2021;16(4):1084-1092. doi:10.26603/001c.25523
24. Hawker GA, Mian S, Kendzerska T, French M. Measures of adult pain: Visual Analog Scale for Pain (VAS Pain), Numeric Rating Scale for Pain (NRS Pain), McGill Pain Questionnaire (MPQ), Short-Form McGill Pain Questionnaire (SF-MPQ), Chronic Pain Grade Scale (CPGS), Short Form-36 Bodily Pain Scale (SF. Arthritis Care Res 2011;63(S11):S240-S252. doi:1 0.1002/acr.20543
International Journal of Sports Physical Therapy
Muscle Strength, Oxygen Saturation and Physical Activity in Patients with Chronic Exertional Compartment Syndrome Compared.
Borges Gomes LA, Alves da Cunha R, Dias Lopes A, Andrelino de Souza F, Cruvinel Costa F, Vicente Andreoli C. Landing Technique and Ankle-dorsiflexion Range of Motion are not Associated with the History of Lower Limb Injuries among Youth Basketball Athletes. IJSPT. Published online April 1, 2023:358-367. doi:10.26603/001c.73033
Technique and Ankle-dorsiflexion Range of Motion are not Associated with the History of Lower Limb Injuries among Youth Basketball Athletes
Landing
Luiz Augusto Borges Gomes, PT, MS1 a , Ronaldo Alves da Cunha, PT, MS1 , Alexandre Dias Lopes, PT, PhD.2 , Fábio Andrelino de Souza, PT1 , Felipe Cruvinel Costa, PT1 , Carlos Vicente Andreoli, MD, PhD.1
1 Department of Orthopaedics and Traumatology, Universidade Federal de São Paulo, 2 Department of Physical Therapy, Movement & Rehabilitation Sciences, Northeastern University
Keywords: ankle-dorsiflexion range of motion, athletic injury, basketball, landing error scoring system, youth sports https://doi.org/10.26603/001c.73033
International Journal of Sports Physical Therapy
Background
Lower limb injuries generate a significant health burden in basketball. Landing technique and ankle-dorsiflexion range of motion have been suggested as risk factors for lower limb injuries among youth athletes, but studies conducted specifically with basketball athletes are lacking.
Hypothesis/Purpose
To describe the period prevalence of basketball-related injuries and to examine the association of the history of lower limb injuries with landing technique and ankle-dorsiflexion range of motion asymmetry among youth basketball athletes.
Study Design
Cross-Sectional Survey.
Methods
Youth basketball athletes were asked to complete a paper-based survey to investigate personal characteristics, training characteristics and their three-month history of basketball-related injuries. The Landing Error Scoring System and the Weight-Bearing Lunge Test were used to evaluate landing technique and ankle-dorsiflexion range of motion. Binary logistic regression was utilized to examine the association of the investigated variables with the presence of history of lower limb injuries among the athletes.
Results
A total of 534 athletes participated. The three-month prevalence of basketball-related injuries was 23.2% (95% CI 19.7 – 27), and the majority of the reported injuries affected the lower limbs (69.7%; n=110). Sprains were the most frequent type of injury (29.1%; n=46), and the ankle (30.4%; n=48) and knee (21.5%; n=34) were the most affected anatomic locations. Landing technique (p = 0.105) and ankle-dorsiflexion range of motion asymmetry (p = 0.529) were not associated with the history of lower limb injuries.
Conclusion
The three-month prevalence of basketball-related injuries was 23.2%. Although ankle sprains were the most frequent injury, landing technique and ankle-dorsiflexion range of
a
Corresponding Author:
Luiz Augusto Borges Gomes, Postgraduate Program in Health Sciences Applied to Sport and Physical Activity, Universidade Federal de São Paulo, Rua Estado de Israel, 636, São Paulo/SP (01000-000), CEP 04022-900, Brazil.
E-mail address: lab.gomes@gmail.com
Telephone number: +5511941149842
Original Research
motion asymmetry were not associated with the history of lower limb injuries among youth basketball athletes.
INTRODUCTION
Basketball is one of the most popular youth sports worldwide.1 In the United States, basketball is the most popular sport among boys and girls aged 12-17 years and, in Brazil, it represents the sixth most practiced team sport among Brazilians aged 15-19 years.2,3 As a physical activity, basketball provides a myriad of physical, mental and psychosocial health benefits to these age groups, but it also imposes a risk of sustaining an injury during participation.4–7 The incidence of basketball-related injuries (BRIs) varies depending on factors related to the investigated population –age, sex, level of participation – and the injury definition adopted by the study authors, but according to prospective cohort studies and a recent systematic review, the vast majority of BRIs affect the lower limbs.8–12
The prevention of lower limb injuries has become a topic of great concern in basketball.2 The identification of modifiable risk factors is an important step for injury prevention.13,14 In basketball, two commonly reported risk factors for lower limb injuries are landing technique and ankledorsiflexion range of motion (ROM), and previous studies recommended the application of specific screening methods to evaluate these variables among basketball athletes.15,16 Two of those methods include the Landing Error Scoring System (LESS) and the Weight Bearing Lunge Test (WBLT), which have already proven their validity and reliability for evaluation of landing technique and ankle-dorsiflexion ROM, respectively.17,18
Despite the use of these screening methods, the influence of landing technique and ankle-dorsiflexion ROM on injury risk is unclear A previous case-control study conducted with high school and collegiate athletes of eight different varsity sports found no relationship between LESS score and the risk of sustaining an anterior cruciate ligament (ACL) injury, but a more recent prospective cohort study showed that a LESS score of < 5 significantly increased the risk of sustaining an ACL injury among eliteyouth soccer athletes.19,20 Studies addressing the role of ankle-dorsiflexion ROM on injury risk also show inconclusive results. A prospective cohort study conducted specifically with youth basketball athletes showed an association between lower ankle-dorsiflexion ROM and the risk of developing patellar tendinopathy 21 Regarding lateral ankle sprains, a case-control study conducted with collegiate athletes found an association between greater ankle-dorsiflexion ROM and the risk of sustaining recurrent lateral ankle sprains,22 but a previous prospective cohort study conducted with army recruits showed that the occurrence of lateral ankle sprains was associated with a reduction in ankle-dorsiflexion ROM.23
The sport and age of the investigated athletes are important reasons for these observed divergencies.20,22 To move
the research forward, it is important to investigate these variables among athletes of different ages and sports. Considering the high lower limb injury rate in basketball, the purposes of this study were to describe the period prevalence of BRIs and (2) to examine the association of the history of lower limb injuries with landing technique and ankle-dorsiflexion ROM asymmetry among youth basketball athletes.
METHODS
STUDY DESIGN AND PARTICIPANTS
This cross-sectional study was developed in association with a state basketball federation in Brazil. The state basketball federation aimed to enhance injury prevention efforts among youth athletes affiliated with the organization. The investigation of the history of BRIs and the evaluation of landing technique and ankle-dorsiflexion ROM by using two screening methods were proposed as a first step. The objectives were presented to the basketball teams during the 2018 pre-season conference and all youth basketball teams competing in the 2018 state basketball championship were invited to participate in the study. Training and match locations were visited by the researchers in previously scheduled days to recruit athletes to participate. Recruitment and data collection occurred between February and July 2018. Eligibility criteria included (1) youth athletes of both sexes, (2) aged between 10 and 19 years old. Professional athletes were not included in the study Youth athletes who were not able to complete ankle-dorsiflexion ROM and/or landing technique evaluation due to any physical complaint were included in the study, but they participated only by completing the baseline questionnaire. All participants and their parents or legal guardians, for athletes younger than 18 years old, signed a consent or assent form prior to inclusion in the study The study was approved by the Ethics Committee of the Universidade Federal de São Paulo (number 2880146).
DATA COLLECTION
Data collection was accomplished in two steps. First, athletes completed a paper-based questionnaire to investigate personal characteristics, training characteristics, and their history of BRIs in the prior three months. In the second step, athletes performed landing technique and ankle-dorsiflexion ROM evaluation in a random order. Data collection occurred after training sessions or official matches, providing a minimum period of ten minutes rest between the end of the activity and the beginning of the evaluations.
3
Level of Evidence
Landing Technique and Ankle-dorsiflexion Range of Motion are not Associated with the History of Lower Limb Injuries among. International Journal of Sports Physical Therapy
BASELINE QUESTIONNAIRE
The baseline questionnaire was completely self-reported and composed of open-ended and closed-ended questions. The initial version of the questionnaire was developed by the first author of the study and later discussed and validated by all the authors in a roundtable discussion. Variables related to personal characteristics (age, sex, height, weight), training characteristics (sport experience, sport specialization, frequency and duration of practice sessions) and history of BRIs in the prior three months were collected. The investigation of the history of BRIs was carried out through two open-ended questions about the type and the anatomical location of injuries. Subsequently, all selfreported injuries were categorized by two of the authors of the study based on the first two digits of the classification The Orchard Sports Injury Classification System (OSICS) Version 10.24 Any disagreement was solved by a third author of the study The adopted injury definition during data collection was “ any physical complaint sustained by a player that resulted from a basketball match or basketball training, irrespective of the need for medical attention or time loss from basketball activities”.25
LANDING TECHNIQUE EVALUATION
The Landing Error Scoring System (LESS) was used to evaluate landing technique.17 All athletes received instructions and observed a test demonstration prior to the start of the assessment. Test procedures followed the description made by Padua et al.17 Athletes were positioned on a 30-cm-high box and instructed to jump horizontally towards a rectangular landing area – 100-cm-long, 50-cm-wide, and 1-cmhigh – positioned at a distance of approximately 50% of their height in front of the box. Immediately after landing, they had to jump vertically as high as they were able and land again on the platform (Figure 1). Athletes completed at least three repetitions for familiarization with the jumpinglanding task, which were followed by three valid trials. All valid trials were captured by two webcams (Logitech C920 Hd Pro Full Hd 1080p) placed at a distance of 3.5 m from the lens of the webcams to front of and to the side of the landing area. Both webcams were positioned on a tripod fixed at a height of 1.2 m from lens to floor The webcams were connected to two independent notebooks and synchronized to the software provided by the manufacturer (Logitech Webcam Software, version 2.80.853.0a).
The jump was considered valid when the athlete (1) jumped from the box with both feet simultaneously, (2) jumped forward and did not perform an excessive vertical movement to reach the landing platform, (3) landed with the entire feet on the platform and (4) completed the task in a fluid motion.17
The authors did not provide any instruction to athletes regarding their landing technique during the test unless they were performing the test incorrectly. All examiners were physiotherapists who had participated in a previous two-hour training session, where they received theoretical and practical instruction about LESS.
After data collection, in a second step, the videos were analyzed by three of the study authors, who were blinded to injury history. Intrarater and interrater reliability were estimated prior to the beginning of the analysis. For reliability analysis, the authors independently scored 24 jumping-landing task videos from eight different athletes at two time points, separated by one week. The intraclass correlation coefficients (ICC’s) were estimated based on a meanrating, consistency, 2-way mixed-effects model. The ICC’s for intrarater and interrater reliability were 0.87 and 0.81, respectively
The software Kinovea for motion analysis (version 0.8.15; Copyright 2006-2011 - Joan Charmant & Contrib.) was used during all the LESS analysis. The raters gave scores to each of the three valid attempts completed by each athlete and the final score was represented by the average value obtained in the three attempts. All LESS items were assessed bilaterally, and a preferred limb was not chosen for the analysis. The score for each item was awarded in cases where the athlete presented the landing error in at least one of the valid attempts made, regardless of whether the error was observed in only one or both lower limbs, in the cases of the items assessed bilaterally
ANKLE-DORSIFLEXION RANGE OF MOTION EVALUATION
Weight-Bearing Lunge Test (WBLT), as described by previous authors, was used to evaluate the ankle-dorsiflexion ROM.18,21–23 A one-meter tape line was drawn on the floor and continued up to the wall for one more meter. Athletes were positioned with their heel and second toe aligned on the line. After positioning, the athlete was instructed to lunge forward to touch the vertical line in the wall with their knee, while maintaining foot alignment and heel contact with the floor The evaluated foot was gradually moved away from the wall until the athlete was able to make only a slight contact with their knee on the vertical line. At that moment, ankle-dorsiflexion ROM was measured placing a smartphone 10 centimeters below the proximal region
 Figure 1. Landing Error Scoring System
Landing Technique and Ankle-dorsiflexion Range of Motion are not Associated with the History of Lower Limb Injuries among. International Journal of Sports Physical Therapy
of the tibial tuberosity (Figure 2). The Ankle-dorsiflexion measurement was performed using the iHandy Level app (iHandy Ltd.), which is a valid and reliable tool for joint angle measurement.26 Lower limbs were randomly evaluated, and the final score was represented by the ankle-dorsiflexion ROM asymmetry observed.
All raters were physiotherapists who had participated in a previous two-hour face-to-face training where they received theoretical and practical instruction on the test. Raters were blinded to the presence of injury history during data collection. We did not conduct an intrarater and interrater reliability analysis of the measurements for ankledorsiflexion ROM before data collection.
STATISTICAL ANALYSIS
All youth basketball teams affiliated with the state basketball federation were invited to participate in this study and a convenience sample of youth athletes was utilized to describe the three-month prevalence of BRI, landing technique and ankle-dorsiflexion ROM asymmetry in this population.

Descriptive statistics were used to present the distribution of the investigated variables. Shapiro-Wilk test was used to verify the distribution of the data. An univariate analysis, using Independent Student’s t-test and MannWhitney test, was conducted to verify differences in LESS scores and ankle-dorsiflexion ROM asymmetry between athletes with and without history of lower limb injuries. Additionally, binary logistic regression was used in a multivariate analysis to investigate the association of the investigated variables with the presence of history of lower limb injuries among the athletes. Covariates and variables identified as associated factors in previous studies were
used in the model. The model was adjusted considering multicollinearity and goodness-of-fit. The results were presented as odds ratios (OR) and 95% CI. For continuous variables the ORs indicate the change in odds for a one-unit increase in the independent variable. P-values less than 0.05 were considered statistically significant. The software Jamovi (version 1.6.21.0) was used for the analysis.
RESULTS
One hundred and forty-three male and female youth basketball teams belonging to 44 clubs participated in the 2018 state basketball championship. The state basketball championship categorizes youth by age to form the teams. Male competitions were played in seven categories: U-12 (17 teams), U-13 (20 teams), U-14 (17 teams), U-15 (17 teams), U-16 (16 teams), U-17 (13 teams) and U-19 (14 teams). Female competitions were played in five categories: U-13 (five teams), U-14 (four teams), U-15 (six teams), U-17 (nine teams) and U-19 (five teams).
In total, 540 athletes were recruited to participate in the study. After checking and confirming the eligibility criteria, 534 athletes belonging to 42 teams from 23 clubs were included in the final sample. Six athletes were not included because they were also members of the professional teams in their clubs.
All participants completed the baseline questionnaire. Landing technique and ankle-dorsiflexion ROM assessments were completed by 448 and 500 athletes, respectively However, LESS results of 86 athletes were not included in the final analysis due to technical problems with the quality of the videos and / or execution errors identified during the analysis, which invalidated one or more jumps performed by the athlete.
CHARACTERISTICS
The majority of the participants were male (88.7%; n = 474). The median age of the athletes was 12 (IQR = 2) years old and 77.5% (n = 414) of them reported basketball as the only sport modality in which they participate. Detailed information about athletes’ characteristics is described in Table 1.
PREVALENCE OF BASKETBALL-RELATED INJURIES
The three-month prevalence of BRIs was 23.2% (95% CI 19.7 – 27), with 158 injuries sustained by 124 athletes. Sprains were the most frequent type of injury (29.1%; n = 46) (Table 2).
The ankle (30.4%; n = 48) and knee (21.5%; n = 34) were the most affected anatomic locations (Table 3). Lower limb injuries accounted for the majority of the reported musculoskeletal injuries (69.7%; n = 110) and the threemonth prevalence of lower limb musculoskeletal injuries was 17.2% (95% CI 14.1 – 20.7).
Figure 2. Weight-Bearing Lunge Test
Landing Technique and Ankle-dorsiflexion Range of Motion are not Associated with the History of Lower Limb Injuries among. International Journal of Sports Physical Therapy
Table 1. Athletes Characteristics. All continuous variables are expressed by the median and interquartile range. Categorical variables are expressed in percentage and total number of athletes.
a The type of basketball-related injuries are expressed in percentage and total number of injuries.
a The anatomic location of basketball-related injuries are expressed in percentage and total number of injuries.
Variable Total sample (n=534) With history of lower limb injuries (n=86) Without history of lower limb injuries (n=414) Sexb Male 88.7 (474) 15.8 (75) 84.2 (399) Female 11.3 (60) 28.4 (17) 71.6 (43) Age (years)a 12 (2) 12 (3.25) 12 (1.75) BMI (kg/m²)a 20.1 (4.94) 21.3 (3.90) 19.8 (4.92) Sport experience (months)a 24 (24) 36 (30.3) 24 (24) Basketball exposure (hours/week)a 7.5 (4) 8 (7.63) 7.5 (3) Categoryb U-12 39.5 (211) 11.8 (25) 88.2 (186) U-13 43.4 (232) 14.2 (33) 85.8 (199) U-14 4.7 (25) 20 (5) 80 (20) U-15 4.7 (25) 44 (11) 56 (14) U-17 4.4 (24) 41.6 (10) 58.4 (14) U-19 3.2 (17) 47 (8) 53 (9) Sport specializationb Specialist 77.5 (414) 17.4 (72) 82.6 (342) Generalist 22.5 (120) 16.7 (20) 83.3 (100) BMI = body mass index, a Continuous variables b Categorical variables
Type of injury % (n)a Non specific injury 17.1 (27) Bruising/haematoma 1.9 (3) Laceration/abrasion 1.3 (2) Whiplash 0 (0) Muscle injury 12.6 (20) Tendon injury 10.1 (16) Joint sprains 29.1 (46) Cartilage injury 0 (0) Joint dislocations 7 (11) Chronic instability 0 (0) Synovitis, impingement, bursitis 1.3 (2) Fracture 12 (19) Stress fracture 0 (0) Other stress/overuse injury 6.3 (10) Organ injury 0 (0) Nerve injury 0 (0) Vascular injury 0 (0) Arthritis 0 (0) Other injury not elsewhere specified 1.3 (2)
Table 2. Type of Basketball-related Injuries
Anatomic location % (n)a Head 1.9 (3) Neck 0.6 (1) Shoulder 6.3 (10) Upper arm 1.3 (2) Elbow 0.6 (1) Forearm 1.9 (3) Wrist and hand 9.5 (15) Chest 0.6 (1) Trunk and abdomen 0 (0) Thoracic spine 0 (0) Lumbar spine 7 (11) Pelvis and buttock 0.6 (1) Hip and groin 1.3 (2) Thigh 3.2 (5) Knee 21.5 (34) Lower leg 5.1 (8) Ankle 30.4 (48) Foot 7.6 (12) Location unspecified 0.6 (1)
Table 3. Anatomic Location of Basketball-related Injuries
Landing Technique and Ankle-dorsiflexion Range of Motion are not Associated with the History of Lower Limb Injuries among. International Journal of Sports Physical Therapy
Table 5. Ankle-dorsiflexion Range of Motion Asymmetry of the Athletes. ADROM asymmetry is expressed by the median and interquartile range.
ADROM = ankle-dorsiflexion range of motion
LANDING TECHNIQUE AND ANKLE-DORSIFLEXION RANGE OF MOTION
The mean LESS score among the investigated athletes was 5.45 (± 2.34) points. There was no statistically significant difference between LESS scores in the groups with and without a three-month history of lower limb injuries (p = 0.167) (Table 4).
The median ankle-dorsiflexion ROM obtained was 37.2° (IQR 9.1°). There was no statistically significant difference between the ROM asymmetry values obtained by the groups with and without a three-month history of lower limb injuries (p = 0.961) (Table 5).
FACTORS ASSOCIATED WITH LOWER LIMB INJURIES
Table 6 describes the results of the multivariate analysis. Binomial logistic regression model showed that the category of the athlete was the only factor associated with the presence of a three-month history of lower limb injuries. LESS score (p = 0.105) and ankle-dorsiflexion ROM asymmetry (p = 0.529) were not associated with the presence of a three-month history of lower limb injuries.
DISCUSSION
The aims of this study were to describe the period prevalence of BRIs and to examine the association of lower limb injuries with landing technique and ankle-dorsiflexion ROM asymmetry among youth basketball athletes. The three-month prevalence of BRIs among the investigated athletes was 23.2% and the majority of the reported injuries affected the lower limbs. The ankle and knee were the most common anatomical locations affected by injuries and sprains were the most common type of injury There was no association of landing technique and ankle-dorsiflexion ROM asymmetry with the history of lower limb injuries. Multivariate analysis showed that the category – meaning youth athletes were categorized by age for competition –was the only variable associated with the history of lower limb injuries.
Two previous studies conducted with youth basketball athletes found different period prevalence of BRIs, with values varying from 19.6% to 39%.27,28 The prevalence of BRIs may vary according to injury definition, seasonality of data collection, population characteristics and recall bias. Both previous studies adopted a ‘time loss’ injury definition and investigated a one-year prevalence of BRIs among youth basketball athletes with a similar mean age, but the level of participation and the weekly basketball exposure of the athletes varied across the studies. According to the age category, some athletes tend to present a greater probability of suffering a BRI. Pappas et al. also found an increase in injury rates for the five most common basketball injuries presenting to emergency departments when comparing 7to 11-year-old category to 12- to 17-year-old category.29 One possible explanation for this difference is an increase in total exposure and intensity of basketball activities and findings of the multivariate analysis may offer support for this hypothesis.29,30 Leppänen et al. investigated competitive athletes participating in basketball activities for 9-10 hours/week and Vanderlei et al. investigated boys and girls participating in a sport initiation program – with a low level of training and competitiveness – during 6-7 hours/ week.27,28 A broader injury definition was adopted in this study to investigate the three-month prevalence of BRIs in a sample of competitive athletes, but the injury prevalence found was similar to that reported by Vanderlei et al.27 It may have occurred because the recall period was lower, and the majority of the participants were from categories of initiation in competitive basketball – U-12 and U-13 – and presented a low weekly basketball exposure. A three-month recall period was adopted to reduce the influence of recall bias that may have affected prevalence estimations, but on the other hand this choice increased the influence of the seasonality of data collection in the results. Data collection was conducted during the beginning of the 2018 regular season and the three-month recall period included off-season months. Regarding anatomical location and type of the reported injuries, the current findings are similar to those reported in a recent systematic review and two prospective cohort studies conducted with high school and collegiate athletes. These studies results indicated that the majority
Variable Total sample (n=362) With history of lower limb injuries (n=57) Without history of lower limb injuries (n=305) p-value LESS score 5.45 (± 2.34) 5.06 (± 2.41) 5.52 (± 2.32) 0.167 LESS = landing error scoring system
Table 4. Landing Technique of the Athletes. LESS Score is expressed by the mean and standard deviation.
Variable Total sample (n=500) With history of lower limb injuries (n=86) Without history of lower limb injuries (n=414) p-value ADROM asymmetry 2.30 (2.70) 2.15 (2.60) 2.30 (2.70) 0.961
Landing Technique and Ankle-dorsiflexion Range of Motion are not Associated with the History of Lower Limb Injuries among. International Journal of Sports Physical Therapy
Table 6. Binary Logistic Regression Model
OR = odds ratio, CI = confidence interval, BMI = body mass index, ADROM = ankle-dorsiflexion range of motion, LESS = landing error scoring system. Collinearity statistics of the included variables (tolerance): sex (0.80), BMI (0.93), category (0.94), ADROM asymmetry (0.97), LESS (0.95)
Predictive Measures of the model: accuracy (0.83), specificity (0.98), sensitivity (0.05) Nagelkerke s R2 = 0.143
of the BRIs affected the ankle and knee, and sprains were the most common type of injury 10–12
There was no association between landing technique and ankle-dorsiflexion ROM and the history of lower limb injuries. These associations are not well established in the literature. Smith et al. found no association between LESS scores and ACL injuries among high-school and collegiate athletes of eight different sport modalities, but Padua et al. showed that a LESS score > 5 was associated to an increased risk of sustaining an ACL injury specifically among elite-youth soccer athletes.19,20 In the present study only basketball athletes were investigated, and the outcome was not ACL injury. Mean LESS score for total sample was 5.34 and both groups
with and without history of lower limb injuries, had a mean LESS score > 5. Regarding ankle-dorsiflexion ROM, three previous studies identified an association between ankle-dorsiflexion ROM, measured using the WBLT, and lower limb injuries. Backman and Danielson prospectively investigated youth basketball athletes and showed that an ankle-dorsiflexion ROM < 36.5° were associated with an increased risk of developing patellar tendinopathy during the season.21 In a case-control study conducted with collegiate athletes of eight different modalities, Kobayashi et al. found that an ankle-dorsiflexion ROM > 49.5° were associated with an increased risk of suffering recurrent lateral ankle sprain, but, on the other hand, a large prospective cohort study conducted with army recruits showed that an ankle-dorsiflexion ROM < 34° was associated with a five-fold risk of suffering a lateral ankle sprain.22,23 Based on these results, it is unclear if restriction of or excess of ankle-dorsiflexion ROM are associated with the occurrence of lower limb injuries. All three previous studies used the absolute ankle-dorsiflexion ROM value as the outcome. In the present study, ankle-dorsiflexion ROM asymmetry was adopted. Mean ankle-dorsiflexion ROM asymmetry for total sample was 2.30 and there was no difference when comparing the group with and without
history of lower limb injuries. Absolute ankle-dorsiflexion ROM may be a more relevant variable to be further investigated. Age, sex, sport, and the injury defined as the outcome are potential factors that could influence this association.19,20 This study investigated only basketball athletes and participants were younger than the athletes investigated in these three previous studies. The majority of them were beginning in competitive basketball with a low weekly basketball exposure. Additionally, the outcome was lower limb injuries in general and not restricted to ACL injuries, patellar tendinopathy, or lateral ankle sprains. LESS and WBLT were proposed and previously investigated as screening tools for specific lower limb injuries, but the statistical power did not enable the consideration of these specific injuries as the outcomes in the current analysis.15,16 Statistical power was cited as a limitation by the authors of a previous study, and they raised the need for multicenter initiatives to better elucidate these associations.19
This study described the prevalence of BRI’s and investigated landing technique and ankle-dorsiflexion ROM among a large sample of youth athletes from a specific sport. Regardless of these strengths, the study has some limitations. First, a cross-sectional study is not the ideal study design to measure injury rates and describe injury patterns due to the seasonality of data collection. Additionally, the associations found in a cross-sectional study are subjected to reverse causation and cannot establish causal relationships between the investigated variables and the occurrence of lower limb injuries. Second, a broader injury definition was adopted, all BRIs were self-reported and, due to recall bias, athletes were more prone to report substantial injuries and to potentially forget minor complaints. For ankle-dorsiflexion ROM evaluation, although previous face-to-face training on data collection procedures was conducted, it was not possible to conduct a reliability analysis of the raters because data collection occurred in different locations and had a different set of raters in each
Variable Distribution % (n) OR (95% CI) p-value Sex Female 16 (58) 1 Male 84 (304) 1.26 (0.52-3.03) 0.599 BMI (Kg/cm²) 0.97 (0.89-1.07) 0.641 Category U-12 51 (185) 1 U-13 25.7 (93) 1.82 (0.79-4.15) 0.155 U-14 7 (25) 3.04 (0.92-10.03) 0.067 U-15 6.1 (22) 7.66 (2.50-23.48) <0.001 U-17 6.3 (23) 7.64 (2.55-22.88) <0.001 U-19 3.9 (14) 10.34 (2.47-43.13) 0.001 LESS score 0.89 (0.77-1.02) 0.105 ADROM asymmetry 0.95 (0.83-1.10) 0.529
–
Landing Technique and Ankle-dorsiflexion Range of Motion are not Associated with the History of Lower Limb Injuries among. International Journal of Sports Physical Therapy
location. Ankle-dorsiflexion ROM asymmetry was used as the outcome because the laterality of the injuries was not collected. Previous studies adopted the absolute ROM of the affected limb as the outcome of the analysis which may affect the association.21–23 Lastly, although broader inclusion criteria were established, the majority of the sample was composed by male athletes from U-12 and U-13 basketball teams. All male U-12 basketball teams and 75% of the male U-13 basketball teams affiliated with the State Basketball Federation were investigated, but difficulties recruiting female and older male athletes reduced the external validity of the current findings.
Establishing the epidemiology and modifiable risk factors for injuries are essential to inform the development and the implementation of injury prevention interventions among different group of athletes.13,14 These results may influence future studies including prospective investigations to bring more solid data about the epidemiology of BRIs among youth basketball athletes and to better elucidate the role of landing technique and ankle-dorsiflexion ROM as risk factors for lower limb injuries in this population. For clinical practice, although the current prevalence data is insufficient, in the absence of large prospective cohort studies, these results may be useful for clinicians to direct their injury prevention efforts for the most common BRIs observed among youth basketball athletes. Finally, clinicians should be cautious to infer the injury risk of youth basketball athletes solely based on the results of
screening tests, such as LESS and WBLT Screening tests may be applied, but we need to consider the multicausality of sports-related injuries and the predictive capacity of these tests when interpreting their results.
CONCLUSION
The three-month BRIs prevalence among youth basketball athletes was 23.2%. Although ankle sprains were the most frequent injury, landing technique and ankle-dorsiflexion ROM asymmetry were not associated with the history of lower limb injuries. The age category of the athlete was the only variable associated with the history of lower limb injuries.
COMPETING INTERESTS
The authors declare that they have no competing interests in the subject matter or materials discussed in this manuscript.
Submitted: August 28, 2022 CDT, Accepted: January 15, 2023
This is an open-access article distributed under the terms of the Creative Commons Attribution 4.0 International License (CCBY-NC-4.0). View this license’s legal deed at https://creativecommons.org/licenses/by-nc/4.0 and legal code at https://creativecommons.org/licenses/by-nc/4.0/legalcode for more information.
CDT
Landing
International Journal of Sports Physical Therapy
Technique and Ankle-dorsiflexion Range of Motion are not Associated with the History of Lower Limb Injuries among.
REFERENCES
1. Kilic Ö, van Os V, Kemler E, Barendrecht M, Gouttebarge V The ‘Sequence of Prevention’ for musculoskeletal injuries among recreational basketballers: a systematic review of the scientific literature. Phys Sportsmed 2018;46(2):197-212. doi:1 0.1080/00913847.2018.1424496
2. DiFiori JP, Güllich A, Brenner JS, et al. The NBA and youth basketball: Recommendations for promoting a healthy and positive experience. Sports Med 2018;48(9):2053-2065. doi:10.1007/s40279-01 8-0950-0
3. Ministério do Esporte (BR). Diagnóstico Nacional Do Esporte (DIESPORTE). Published 2015. Accessed January 9, 2022. http://arquivo.esporte.gov.br/diespor te/7.php
4. Ekelund U, Luan J, Sherar L, Esliger D, Griew P, Cooper A. Moderate to vigorous physical activity and sedentary time and cardiometabolic risk factors in children and adolescents. JAMA 2012;307(7):704. do i:10.1001/jama.2012.156
5. Specker B, Thiex NW, Sudhagoni RG. Does exercise influence pediatric bone? A systematic review Clin Orthop Relat Res 2015;473(11):3658-3672. doi:10.100 7/s11999-015-4467-7
6. Eime RM, Young JA, Harvey JT, Charity MJ, Payne WR. A systematic review of the psychological and social benefits of participation in sport for children and adolescents: Informing development of a conceptual model of health through sport. Int J Behav Nutr Phys Act. 2013;10(1):98. doi:10.1186/1479-586 8-10-98
7 Bahr R. Risk factors for sports injuries a methodological approach. Br J Sports Med. 2003;37(5):384-392. doi:10.1136/bjsm.37.5.384
8. Deitch JR, Starkey C, Walters SL, Moseley JB. Injury risk in professional basketball players. Am J Sports Med. 2006;34(7):1077-1083. doi:10.1177/0363546505 285383
9. Borowski LA, Yard EE, Fields SK, Comstock RD The epidemiology of US high school basketball injuries, 2005–2007 Am J Sports Med 2008;36(12):2328-2335. doi:10.1177/0363546508322893
10. Clifton DR, Onate JA, Hertel J, et al. The first decade of web-based sports injury surveillance: Descriptive epidemiology of injuries in US high school boys’ basketball (2005–2006 through 2013–2014) and National Collegiate Athletic Association men’s basketball (2004–2005 through 2013–2014). J Athl Train 2018;53(11):1025-1036. do i:10.4085/1062-6050-148-17
11. Clifton DR, Hertel J, Onate JA, et al. The first decade of web-based sports injury surveillance: Descriptive epidemiology of injuries in US high school girls’ basketball (2005–2006 through 2013–2014) and National Collegiate Athletic Association women’s basketball (2004–2005 through 2013–2014). J Athl Train 2018;53(11):1037-1048. do i:10.4085/1062-6050-150-17
12. Andreoli CV, Chiaramonti BC, Biruel E, Pochini A de C, Ejnisman B, Cohen M. Epidemiology of sports injuries in basketball: integrative systematic review BMJ Open Sport Exerc Med. 2018;4(1):e000468. doi:1 0.1136/bmjsem-2018-000468
13. van Mechelen W, Hlobil H, Kemper HCG. Incidence, severity, aetiology and prevention of sports injuries. Sports Med. 1992;14(2):82-99. doi:1 0.2165/00007256-199214020-00002
14. Finch C. A new framework for research leading to sports injury prevention. J Sci Med Sport. 2006;9(1-2):3-9. doi:10.1016/j.jsams.2006.02.009
15. Bird SP, Markwick WJ. Musculoskeletal screening and functional testing: considerations for basketball athletes. Int J Sports Phys Ther 2016;11(5):784-802.
16. Fox AS, Bonacci J, McLean SG, Spittle M, Saunders N. A systematic evaluation of field-based screening methods for the assessment of anterior cruciate ligament (ACL) injury risk. Sports Med 2016;46(5):715-735. doi:10.1007/s40279-015-0443-3
17. Padua DA, Marshall SW, Boling MC, Thigpen CA, Garrett WE Jr, Beutler AI. The Landing Error Scoring System (LESS) is a valid and reliable clinical assessment tool of jump-landing biomechanics. Am J Sports Med 2009;37(10):1996-2002. doi:10.1177/0363 546509343200
18. Bennell K, Talbot R, Wajswelner H, Techovanich W, Kelly D, Hall A. Intra-rater and inter-rater reliability of a weight-bearing lunge measure of ankle dorsiflexion. Aust J Physiother. 1998;44(3):175-180. d oi:10.1016/s0004-9514(14)60377-9
Landing Technique and Ankle-dorsiflexion Range of Motion are not Associated with the History of Lower Limb Injuries among. International Journal of Sports Physical Therapy
19. Smith HC, Johnson RJ, Shultz SJ, et al. A prospective evaluation of the Landing Error Scoring System (LESS) as a screening tool for anterior cruciate ligament injury risk. Am J Sports Med. 2012;40(3):521-526. doi:10.1177/0363546511429776
20. Padua DA, DiStefano LJ, Beutler AI, de la Motte SJ, DiStefano MJ, Marshall SW The Landing Error Scoring System as a screening tool for an anterior cruciate ligament injury–prevention program in elite-youth soccer athletes. J Athl Train. 2015;50(6):589-595. doi:10.4085/1062-6050-50.1.10
21. Backman LJ, Danielson P Low range of ankle dorsiflexion predisposes for patellar tendinopathy in junior elite basketball players. Am J Sports Med. 2011;39(12):2626-2633. doi:10.1177/03635465114205 52
22. Kobayashi T, Yoshida M, Yoshida M, Gamada K. Intrinsic predictive factors of noncontact lateral ankle sprain in collegiate athletes. Orthop J Sports Med. 2013;1(7):232596711351816. doi:10.1177/23259
67113518163
23. Pope R, Herbert R, Kirwan J. Effects of ankle dorsiflexion range and pre-exercise calf muscle stretching on injury risk in Army recruits. Aust J Physiother 1998;44(3):165-172. doi:10.1016/s0004-95 14(14)60376-7
24. Rae K, Orchard J. The Orchard Sports Injury Classification System (OSICS) Version 10. Clin J Sport Med. 2007;17(3):201-204. doi:10.1097/jsm.0b013e318
059b536
25. Fuller CW Consensus statement on injury definitions and data collection procedures in studies of football (soccer) injuries. Br J Sports Med 2006;40(3):193-201. doi:10.1136/bjsm.2005.025270
26. Milani P, Coccetta CA, Rabini A, Sciarra T, Massazza G, Ferriero G. Mobile smartphone applications for body position measurement in rehabilitation: A review of goniometric tools. PM R. 2014;6(11):1038-1043. doi:10.1016/j.pmrj.2014.05.00 3
27. Vanderlei FM, Bastos FN, de Lemes ÍR, Vanderlei LCM, Júnior JN, Pastre CM. Sports injuries among adolescent basketball players according to position on the court. Int Arch Med. 2013;6(1):5. doi:10.1186/1 755-7682-6-5
28. Leppänen M, Pasanen K, Kujala UM, Parkkari J. Overuse injuries in youth basketball and floorball. Open Access J Sports Med 2015;2015(173):173. doi:1 0.2147/oajsm.s82305
29. Pappas E, Zazulak BT, Yard EE, Hewett TE. The epidemiology of pediatric basketball injuries presenting to US emergency departments: 2000-2006. Sports Health. 2011;3(4):331-335. doi:10.1177/194173 8111409861
30. Theisen D, Frisch A, Malisoux L, Urhausen A, Croisier JL, Seil R. Injury risk is different in team and individual youth sport. J Sci Med Sport 2013;16(3):200-204. doi:10.1016/j.jsams.2012.07.007
International Journal of Sports Physical Therapy
Landing Technique and Ankle-dorsiflexion Range of Motion are not Associated with the History of Lower Limb Injuries among.
Original Research
The Falcon Test: An Observer Agreement Study in Subjects With and Without Anterior Knee Pain
Michael T. Cibulka1 a , Payton Wunderlich1 , Hayden Klockenga1 , Andrew Reed1 , John Sandman1
1 Physical Therapy, Maryville University
Keywords: Rectus femoris muscle, muscle length test, Ely’s test, reliability https://doi.org/10.26603/001c.73190
International Journal of Sports Physical Therapy
Introduction
A shortened rectus femoris muscle has been associated with many different musculoskeletal problems. Assessing rectus femoris muscle length is commonly performed using the Modified Thomas Test. However, this test position is often difficult to assume and there are difficulties with reliably measuring rectus femoris length. A method that that uses an easier position to assume and could be more reliable would be beneficial to therapists. The purpose of this study was to determine observer agreement using a new test for assessment of rectus femoris length. A second purpose was to determine if those with anterior knee pain have different rectus femoris muscle length than those without anterior knee pain.
Method
Fifty-three participants with and without anterior knee pain were enrolled. Rectus femoris muscle length was measured lying prone with the leg measured on the table while the non-measured leg was off the table in a position of 90° hip flexion. Rectus femoris muscle was lengthened by passively bending the knee until a firm end-feel. The angle of knee flexion was then measured. The process was then repeated after a brief rest period.
Results
Observer agreement assessing rectus femoris length using this method showed “almost perfect” reliability for both intra- and inter-rater testing: intra-rater: ICC = .99, [CI95: .98-.99], inter-rater: ICC = .96, [CI95: .92- .98]. Agreement for the sub-sample of those with anterior knee pain (N=16) showed “almost perfect” reliability for intra-rater (ICC 1,1 = .98); [CI95: 0.94-.99] and inter-rater reliability (ICC 2,1 = 0.88); [CI95: 0.70 -.95]. No differences were noted in rectus femoris length between those without and those with anterior knee pain (t= 0.82, p> 0.01); [CI95: -7.8 -3.33]; (SEM = 1.3°; MDC=3.6°).
Conclusion
This new method of assessing rectus femoris length is reliable between and within raters. No differences were noted in rectus femoris length between those with anterior knee pain and those without.
INTRODUCTION
Assessing the length of the rectus femoris muscle is a standard part of a lower extremity examination for physical therapists. The rectus femoris is the only two-joint muscle
Corresponding Author: Michael Cibulka
Walker College of Health Professions. Anheuser-Busch Hall 1265 St. Louis, MO, 63141 Phone: 314.529.6540. Email: mcibulka@maryville.edu
of the quadriceps group, and like many of the other lower extremity two-joint muscles, it can lose muscle length. A shortened rectus femoris muscle is associated with a number of different lower extremity problems including adolescent apophysitis of the tibial tubercle (Osgood-Schlatter’s
a
The Falcon Test:
in
Anterior Knee Pain. IJSPT
online April 1, 2023:368-374. doi:10.26603/001c.73190
Cibulka MT, Wunderlich P, Klockenga H, Reed A, Sandman J.
An Observer Agreement Study
Subjects With and Without
Published
disease),1–7 rectus femoris muscle strain,8–10 calcific tendinitis of the rectus femoris muscle,11 osteoarthritis of the knee,12–14 as well as anterior knee pain.15–17 Thus, an assessment of rectus femoris length is an important part of a physical therapy examination.
The most commonly described method used to assess rectus femoris muscle length is the Thomas test.18 Only a few researchers have examined the reliability of the Thomas test to assess the length of the rectus femoris muscle. Eng et al. reported “almost perfect” reliability (ICC = 0.94) test-retest reliability for quadriceps femoris muscle angle, but they failed to describe their method of how they measured quadriceps femoris angle or to report what kind of reliability tests were performed, either intra or interrater observer agreement.19 Horneij et al. assessed rectus femoris muscle length on 44 nurses or aides with and without back pain using a modified Thomas test, however they only rated rectus femoris muscle length using a nominal measurement scale as either “tight” or “excessive” muscle length.20 In another study, Harvey et al. assessed the length of all of the thigh two-joint muscles, however, the flexibility data was pooled so there is no way to determine observer agreement of any of the specific muscle tests.21 Peeler and Anderson, in an observer agreement study examining the Modified Thomas Test, assessed rectus femoris length measures taken by three athletic trainers and found moderate to fair test-retest intra-rater (ICC = 0.67) and inter-rater (ICC = 0.50) reliability 22 The “moderate” reliability findings may, in part, be due to the difficulty in properly performing the Modified Thomas test. Peeler and Anderson report that the Thomas test can be challenging for clinicians to perform.22 Cady et al assessed rectus femoris length using the Thomas test in 20 healthy men using digital photographs, among six raters, but they did not record goniometric measures and only used a nominal rating of pass or fail.23 Thus, from one suitable study, the reliability of the Modified Thomas test to assess rectus femoris muscle length, was “high” for inter-rater reliability with a Chronbach’s alpha of 0.80.23 A drawback in this study was that used nominal data, which increased their likelihood of agreement.
A current method that is easier for patients to assume and for therapists to perform, that does not stress the lower back or hips is Ely’s test. Ely’s test, used to assess rectus femoris muscle length, is a method that does not include holding the contralateral hip in full flexion, thus making it easier to perform. Peeler and Anderson assessed Ely’s test for inter and intra-rater reliability using measurements taken by three athletic trainers on 54 participants with no history of trauma.24 Their results showed moderate reliability with ICC values of 0.69 for intra-rater reliability and 0.66 for inter-rater reliability.24 However, they only used active, not passive knee flexion, when assessing rectus femoris muscle.24 Olivencia et al. also assessed rectus femoris muscle length using Ely’s test and found good inter-rater reliability (ICC = .90) and good intra-rater reliability (ICC = 0.91).25 But, they also only used active knee flexion to assess rectus femoris muscle length.25 According to Kendall muscle length testing is performed using passive
not active movement that increases the distance from the origin and insertion which elongates the muscle in the opposite direction of the muscles action.18 Additionally, a muscle crossing two-joints like the hamstrings, are incapable of shortening sufficiently to produce complete range of knee flexion with the hip extended.18 Thus, the “true” or actual amount of rectus femoris muscle length, and thus the reliability which was recorded in these studies, using Ely’s test is questionable.
Another method similar to Ely’s test was previously described in the literature by Witvrouw et al.26 Witvrouw et al assessed rectus femoris muscle length in athletes with anterior knee pain.26 They described a method where the athlete assumes a prone position placing the contralateral (not measured) hip in a position of 90° of hip flexion to stabilize the pelvis and then flexing the ipsilateral (measured) knee assessing rectus femoris length.26 This position fo assessing rectus femoris muscle length is often easier for patients to assume and easier for therapists to perform the test. An advantage of this test method over Ely’s is that it allows for better pelvic stabilization by preventing unwanted pelvic movement. The new test examined in this study mimics the Thomas test position to some extent by flexing the contralateral hip when lying prone. It may also be desirable in those who are very flexible. When using Ely’s test with flexible patients, full knee flexion can be halted because the heel reaches the buttocks and prevents any further knee flexion. This new test rarely has that problem and can often discriminate left to right rectus femoris muscle length imbalances in flexible patients.
The purpose of this study was to determine observer agreement using a new test for assessment of rectus femoris length. A second purpose was to determine if those with anterior knee pain have different rectus femoris muscle length than those without anterior knee pain.
The authors hypothesized that this new method of assessing rectus femoris muscle length is reliable, and that those with anterior knee pain will demonstrate shorter rectus femoris muscle length than those who do not have anterior knee pain.
METHODS
PARTICIPANT
Fourteen men and thirty-nine women (N = 53) participated in this study after volunteering through convenience sampling from Maryville University and the surrounding community looking for subjects with and without anterior knee pain. Anterior knee pain was defined as pain in an around the patella without having recent injury or surgery and whose pain level was below 5/10 on a numeric pain rating scale. Demographic data were gathered on all participants. Participants were included if they were between 18 to 65 years of age and could tolerate lying prone for at least 15 minutes. Exclusion criteria: if they could not speak or understand the English language, were mentally disabled, had undergone previous surgery on one or both knees, had recent injury or trauma to either knee within the prior six months (where their knee was assessed by a licensed health
The Falcon Test: An Observer Agreement Study in Subjects With and Without Anterior Knee Pain International Journal of Sports Physical Therapy
care provider), needed an assistive device for gait, had a history of structural problems of the ligaments of either knee (such as sprains due to any causative factor), or were pregnant. The study was approved by the IRB committee at Maryville University in St. Louis, MO
A flip of a coin was used to determine which side to measure the left (heads) or right (tails) side, to avoid the issue of “double-dipping” the data.27,28 All participants completed a Lower Extremity Functional Scale (LEFS).29 A Numeric Pain Rating Scale (NPRS) was used to assess current, worst, and best pain.30 A high-low treatment table was used for participants to lie on while measurements were taken. A standard 12-inch plastic goniometer was used to measure hip flexion of 90° while in prone position prior to data collection.31

Participants reviewed and signed an informed consent form and were assigned a random participation number used throughout data collection. Eligibility to participate in the study was verified with an inclusion and exclusion, yes or no, questionnaire. The participants’ demographic information was gathered, and the participants were asked to fill out two self-reported measures. The first measure was related to functional ability using the LEFS. Then participants’ pain level was assessed for present anterior knee pain they were having at this time and for their worst pain level perceived in the prior six months on a 0 to 10 NPRS, with 0 = no pain and 10 at its worst. If both knees met inclusion and exclusion criterion, or if both knees had pain, a coin was flipped to determine which knee, left or right, would be measured.
Rectus femoris muscle length (in the new measurement being studied) was measured using a new test, called the Falcon test, with the participants lying prone on a treatment table with the leg to be measured on the table while the other leg was placed off the side of the treatment table into a position of 90° of hip flexion with the foot placed on the ground (Figure 1) and the participant was told to maintain this position throughout the measuring process. One therapist measured the length of rectus femoris muscle by slowly passively bending the knee until a firm end-feel was first perceived. Another therapist, on the opposite side, measured the angle of passive knee flexion using a standard 12-inch plastic goniometer. (Figure 2) This process was completed three times, and the measurements were recorded by the measuring therapist. The mean of the three measurements were then used in statistical analysis.

After approximately five minutes of rest time, the process was repeated using the same methods and measurements were taken by another rater. The second-rater therapist was blinded to all of the goniometric recordings made by the first rater
DATA ANALYSIS
Data analysis was performed using R, a Language and environment for statistical computing. 32 Descriptive statistics, including means, standard deviations, skewness, and kurtosis of age, BMI, LEFS29 scores, and NPRS scores (now, best, and worst pain score), were calculated using R.32 In-
traclass Correlation Coefficients (ICC) were calculated for inter- and intra-rater reliability of assessing rectus femoris length with the Falcon test using R32 for the entire sample (those with and without anterior knee pain) and also for just the sample with anterior knee pain. A shortened rectus femoris was examined to determine if this was related to those with anterior knee pain using the student’s t-test and also calculated the SEM and Minimal Detectable Change (MDC) using MDC = 2 * 1.41 * SEM for rectus femoris muscle length using the reliability data.25
Figure 1. Placing the contralateral hip in 90 degrees of hip flexion
Figure 2. Measuring knee flexion, rectus femoris length
The Falcon Test: An Observer Agreement Study in Subjects With and Without Anterior Knee Pain International Journal of Sports Physical Therapy
Table 1. Demographic Descriptive Statistics
Table 2. Outcome Measures Descriptive Statistics
RESULTS
Age, height, and weight of participants are described in Table 1.
The mean amount of maximum knee flexion (e.g., rectus femoris muscle length) for the Falcon test was 134° (Table 2); knee flexion motion ranged between 100 to 158°.
Observer agreement of assessing rectus femoris length for the full sample (N=53) using the Falcon test to assess rectus femoris length showed “almost perfect” reliability for both intra and inter-rater testing: intra-rater reliability ICC = .99, [CI95: .98-.99] and inter-rater reliability; inter ICC = .96, [CI95: .92- .98].
Observer agreement for the sub-sample of only those with anterior knee pain (N=16) showed “almost perfect” reliability for intra-rater reliability (ICC 1,1 = .98); [CI95: 0.94-.99] and for inter-rater reliability (ICC 2,1 = 0.88); [CI95: 0.70 -.95]. The SEM = 1.3°; MDC=3.6°.
There was no statistically significant difference between measurements in those without and with anterior knee pain (t= 0.82, p = 0.41); [CI95: -7.8 -3.33].
DISCUSSION
Observer agreement using this new prone position rectus femoris length test named the Falcon test was found to be “almost perfect” with ICC’s above .95 for both inter- and intra-tester reliability This method may improve upon the Modified Thomas test because with this position, having one leg off the treatment table, effectively stabilizes the pelvis without extra stabilization methods. Thus, unlike the Modified Thomas test, the therapist does not have to be concerned about maintaining the contralateral hip in full flexion to keep the lumbar spine flat on the treatment table. Also, this test position was much easier to assume, maintain, and get up from for all of the participants in this study. From experience using this test, this is also true for the patients with low back pain and hip pain, who often have considerable difficulty and pain trying to assume the Thomas test position.
The commonly used Modified Thomas test is not always easily performed. As many therapists know from experience, the sequencing of the many tasks involved with setting up a patient for the Modified Thomas Test can be difficult and often limit the ability of obtaining an accurate measurement of rectus femoris muscle length. For example, when flexing the ipsilateral knee, it is often difficult to prevent the contralateral hip from coming out of its fully flexed, knee to chest, position because of shortened hip flexor muscles. While trying to maintain the position of both hips and the ipsilateral knee, therapist then must measure the degree of knee flexion, while at the same time trying to maintain both hips positioning above the treatment table. Thus, in the clinic, for an accurate goniometric reading this test usually requires two therapists, one to stabilize and control unwanted pelvis or hip motion and the other to measure knee range of motion. Added to that, if the patient has more than a mild amount of pain, this can be very difficult for patients to assume as well as hold this position long enough to be measured. In a busy clinic this test is often difficult to accomplish.
This new test position is termed the Falcon test owing to its somewhat “bird” like pose of the patient when assuming this position, which needed a simple name so that therapist can easily describe to other colleagues the test position they used when assessing rectus femoris muscle length, rather than just calling the test the “ prone, contralateral hip flexion to 90°, Ely’s test for rectus femoris muscle length” The Falcon test may prove to be a better test than the Thomas test and Ely’s test because the pelvis can be stabilized better by flexing the contralateral hip to 90° and having the participant place their foot on the floor for stabilization. Placing the hip in full flexion, stabilizes the pelvis, preventing an unwanted increase in lumbar lordosis as well as any pelvic tilting, thus resulting in more reliable rectus femoris muscle length measurements. Thus, the Falcon test is just a Modified Thomas test turned “ upside down”
Using an Ely’s test to assess rectus femoris muscle length in some patients may be adequate for assessing rectus femoris muscle length. However, a common problem en-
Range Minimum Maximum Mean Std. Deviation Age (yr) 35 18 53 22.7 6.0 Height (cm) 36.8 153.7 190.5 164.2 13.6 Weight (kg) 67.7 50.5 115.4 71.6 8.3 BMI (kg/m2) 15.6 16.4 32.1 24.5 3.4
N Range Minimum Maximum Mean Std. Deviation Worst Pain (NPRS) 53 6 0 6 1.0 1.66 LEFS 53 20 60 80 78.9 3.25 Rectus Femoris Length (degrees) 53 58.00 100.50 158.50 134.53 10.13
The Falcon Test: An Observer Agreement Study in Subjects With and Without Anterior Knee Pain International Journal of Sports Physical Therapy
countered with the Ely’s test is that when flexing the knee is that an end feel may not be achieved because range is limited by the heel contacting the buttock, creating a “ceiling effect”. This problem is found more often in females and in those with generalized hypermobility A study by Sweeney et al. found that only six out of 67 female gymnast had rectus femoris limitation where they were not able to touch their heel to their buttocks with Ely’s test.33 Thus, although rectus femoris muscle length would not be considered short, the tests cannot distinguish if a muscle length difference may exist between the left and right sides. Side to side differences in rectus femoris muscle length do occur in patients, including patients after total knee arthroplasty, those with osteoarthritis of the patella and knee, patients with low back pain, and in athletes who sustain a rectus femoris muscle strain or injury The Falcon tests allows a quick, easy assessment of rectus femoris muscle length in those with hypermobility, and after surgery or injury.
When comparing those with anterior knee pain to those without anterior knee pain there was not a significant difference in rectus femoris length between groups. However, this study was underpowered, likely by of those with anterior knee pain. Also, only one person in the group with anterior knee pain currently had considerable knee pain (6/ 10 NPRS) and the mean for the “worst pain” for the anterior knee pain group was only 2/10 on a NPRS while the mean current pain was 1/10. Thus, this sample may not have been representative of most who have anterior knee pain. Witvrouw et al. in a study of 430 athletes, showed that athletes with anterior knee pain had reduced rectus femoris muscle length when compared to those without anterior knee pain (124.6 versus 132.2 degrees).9 The inclusion criteria in the current study only included those with a 5/10 anterior knee pain or lower. Because the aim of the current study was to determine the intra and inter-tester reliability of the Falcon Test, patients with reported knee pain above 5/10 were not included to ensure that knee pain did not interfere with achieving an end range on the test, indicating a false positive for short rectus femoris muscle length.
LIMITATIONS
Although there were 53 participants in this study, most of the participants were female (N=39), also the average population age was younger (mean age = 22.7 years). Only 16 of the participants reported a history of anterior knee pain and of those most had only minor anterior knee pain (1/10). A limitation of the Falcon test as studied herein is that two therapists were used to assess rectus femoris muscle length, one to assess muscle end feel and maintain end range knee flexion, the other to measure the degree of knee flexion. Extreme care was taken to make sure that the second therapist did not observe the other therapist when measuring knee flexion. In hindsight, using a bubble goniometer or an electric goniometer would have eliminated the need for two therapists to measure rectus femoris muscle length. However, the position, not the measuring device, was the main focus in this study. A minor limitation to the Falcon test is that larger or pregnant patients may have difficulty lying prone.
CONCLUSIONS
A new test, named the Falcon test, showed “almost perfect” reliability for both intra and inter-rater agreement, indicating that this test can be used repeatably in clinical practice. The MDC for the Falcon test was found to be 3.6 degrees. No difference in rectus femoris muscle length measurements were found between those with anterior knee pain and those without anterior knee pain, however, the sample size was small.
CONFLICTS OF INTEREST
The authors report no conflicts of interests.
Submitted: April 19, 2022 CDT, Accepted: January 15, 2023
This is an open-access article distributed under the terms of the Creative Commons Attribution 4.0 International License (CCBY-NC-4.0). View this license’s legal deed at https://creativecommons.org/licenses/by-nc/4.0 and legal code at https://creativecommons.org/licenses/by-nc/4.0/legalcode for more information.
CDT
The Falcon Test: An Observer Agreement Study in Subjects With and Without Anterior Knee Pain International Journal of Sports Physical Therapy
REFERENCES
1. Ladenhauf HN, Seitlinger G, Green DW Osgood–Schlatter disease: a 2020 update of a common knee condition in children. Curr Opin Pediatr 2020;32(1):107-112. doi:10.1097/mop.000000
0000000842
2. Nakase J, Goshima K, Numata H, Oshima T, Takata Y, Tsuchiya H. Precise risk factors for Osgood–Schlatter disease. Arch Orthop Trauma Surg 2015;135(9):1277-1281. doi:10.1007/s00402-015-227 0-2
3. Neuhaus C, Appenzeller-Herzog C, Faude O A systematic review on conservative treatment options for OSGOOD-Schlatter disease. Phys Ther Sport 2021;49:178-187 doi:10.1016/j.ptsp.2021.03.002
4. Omodaka T, Ohsawa T, Tajika T, et al. Relationship between lower limb tightness and practice time among adolescent baseball players with symptomatic Osgood-Schlatter disease. Orthop J Sports Med. 2019;7(5):232596711984797 doi:10.1177/2325967119
847978
5. de Lucena GL, dos Santos Gomes C, Guerra RO. Prevalence and associated factors of OsgoodSchlatter syndrome in a population-based sample of Brazilian adolescents. Am J Sports Med. 2011;39(2):415-420. doi:10.1177/0363546510383835
6. Beaubois Y, Dessus F, Boudenot A. Maladie d’Osgood-Schlatter : de l’arrêt sportif vers la gestion des troubles biomécaniques. Kinésithérapie, la Revue. 2016;16(175):2-6. doi:10.1016/j.kine.2016.03.073
7 Krause BL, Williams JPR, Catterall A. Natural history of Osgood-Schlatter disease. J Pediatr Orthop. 1990;10(1):65-68. doi:10.1097/01241398-19900100
0-00012
8. Kumazaki T, Sakai T. High risk of muscle strain in the rectus femoris muscle: Anatomical and physiological analysis. Juntendo Medical Journal 2016;62(5):392-398. doi:10.14789/jmj.62.392
9. Witvrouw E, Danneels L, Asselman P, D’Have T, Cambier D Muscle flexibility as a risk factor for developing muscle injuries in male professional soccer players: a prospective study Am J Sports Med 2003;31(1):41-46. doi:10.1177/0363546503031001180
10. Fousekis K, Tsepis E, Poulmedis P, Athanasopoulos S, Vagenas G. Intrinsic risk factors of non-contact quadriceps and hamstring strains in soccer: a prospective study of 100 professional players. Br J Sports Med 2011;45(9):709-714. doi:10.1 136/bjsm.2010.077560
11. Braun-Moscovici Y, Schapira D, Nahir AM. Calcific tendinitis of the rectus femoris. J Clin Rheumatol 2006;12(6):298-300. doi:10.1097/01.rhu.000024989 6.43792.62
12. Iversen MD, Price LL, von Heideken J, Harvey WF, Wang C. Physical examination findings and their relationship with performance-based function in adults with knee osteoarthritis. BMC Musculoskelet Disord. 2016;17(1):1-12. doi:10.1186/s12891-016-115 1-3
13. Jyoti S, Yadav V Knee joint muscle flexibility in knee osteoarthritis patients and healthy individuals. Int J Health Sci Res 2019;9(6):156-163.
14. Abolahrari Shirazi S, Ghafari Nezhad F, Ebrahimian M, Nouraddini E, Mansoorian A, Emami F. Flexibility of knee Joint muscles in women with knee osteoarthritis and healthy controls. JRSR 2015;2(3):47-52.
15. Kunene SH, Ramklass S, Taukobong NP. Anterior knee pain and its intrinsic risk factors among runners in under-resourced communities in Ekurhuleni, Gauteng. S Afr J PhysTher. 2018;74(1). doi:10.4102/saj p.v74i1.452
16. Smith AD, Stroud L, McQueen C. Flexibility and anterior knee pain in adolescent elite figure skaters. J Pediatr Orthop 1991;11(1):77-82. doi:10.1097/012413 98-199101000-00015
17. Kibler W. Strength and flexibility findings in anterior knee pain syndrome in athletes. Am J Sports Med 1987;15(410):20.
18. Kendall F, McCreary E, Provance P. Muscles: Testing and Function 4th ed. Williams & Wilkins; 1993.
19. Eng JJ, Pierrynowski MR. Evaluation of soft foot orthotics in the treatment of patellofemoral pain syndrome. Phys Ther 1993;73(2):62-68. doi:10.1093/ ptj/73.2.62
20. Horneij E, Hemborg B, Johnsson B, Ekdahl C. Clinical tests on impairment level related to low back pain: a study of test reliability J Rehabil Med 2002;34(4):176-182. doi:10.1080/16501970213235
1
The Falcon Test: An Observer Agreement Study in Subjects With and Without Anterior Knee Pain International Journal of Sports Physical Therapy
21. Harvey D Assessment of the flexibility of elite athletes using the modified Thomas test. Br J Sports Med 1998;32(1):68-70. doi:10.1136/bjsm.32.1.68
22. Peeler JD, Anderson JE. Reliability limits of the modified Thomas test for assessing rectus femoris muscle flexibility about the knee joint. J Athl Train 2008;43(5):470-476. doi:10.4085/1062-6050-43.5.470
23. Cady K, Powis M, Hopgood K. Intrarater and interrater reliability of the modified Thomas Test. J Bodyw Mov Ther 2022;29:86-91. doi:10.1016/j.jbmt.2 021.09.014
24. Peeler J, Anderson JE. Reliability of the Ely’s test for assessing rectus femoris muscle flexibility and joint range of motion. J Orthop Res. 2008;26(6):793-799. doi:10.1002/jor.20556
25. Olivencia O, Godinez GM, Dages J, Duda C, Kaplan K, Kolber MJ. The reliability and minimal detectable change of the Ely and active knee extension tests. Int J Sports Phys Ther 2020;15(5):776-782. doi:10.26603/ijspt20200776
26. Witvrouw E, Van Tiggelen D, Thijs Y. Intrinsic risk factors for patellofemoral pain syndrome: Implications for prevention and treatment. J Sci Med Sport 2011;14:e118. doi:10.1016/j.jsams.2011.11.246
27 Park MS, Kim SJ, Chung CY, Choi IH, Lee SH, Lee KM. Statistical consideration for bilateral cases in orthopaedic research. JBJS. 2010;92(8):1732-1737. do i:10.2106/jbjs.i.00724
28. Menz HB. Analysis of paired data in physical therapy research: time to stop double-dipping? J Orthop Sports Phys Ther 2005;35(8):477-478. doi:10.2 519/jospt.2005.0108
29. Binkley JM, Stratford PW, Lott SA, Riddle DL, Network NAORR. The Lower Extremity Functional Scale (LEFS): scale development, measurement properties, and clinical application. Phys Ther. 1999;79(4):371-383.
30. Jensen MP, Turner JA, Romano JM, Fisher LD Comparative reliability and validity of chronic pain intensity measures. Pain 1999;83(2):157-162. doi:1 0.1016/s0304-3959(99)00101-3
31. Gogia PP, Braatz JH, Rose SJ, Norton BJ. Reliability and validity of goniometric measurements at the knee. Phys Ther 1987;67(2):192-195. doi:10.10 93/ptj/67.2.192
32. R: A Language and environment for statistical computing Team RC; 2021. http://www.R-project.org/
33. Sweeney EA, Daoud AK, Potter MN, Ritchie L, Howell DR. Association between flexibility and low back pain in female adolescent gymnasts. Clin J Sport Med. 2019;29(5):379-383. doi:10.1097/jsm.000000000
0000660
The Falcon Test: An Observer Agreement Study in Subjects With and Without Anterior Knee Pain International Journal of Sports Physical Therapy
The Effects Of Differing Density Of Swim-Training Sessions On Shoulder Range Of Motion and Isometric Force Production In National and University Level Swimmers
Matias Yoma1 a , Lee Herrington1 , Tanya Mackenzie1
1 Centre for Health Sciences, School of Health and Society, University of Salford
Keywords:
shoulder pain, swimming, training loads.
https://doi.org/10.26603/001c.72717
International Journal of Sports Physical Therapy
Background
Well-developed physical qualities (i.e., greater load capacity) in athletes can provide protection against injuries. Although higher competitive level swimmers have more developed physical qualities, no studies have investigated how physical qualities of the shoulder respond to a swim-training session in different competitive levels.
Purpose
To compare baseline shoulder external rotation range of motion (ER ROM) and isometric peak torque of the shoulder internal rotators (IR) and external rotators (ER) between national and university level swimmers with differing training volumes. To compare the post-swim changes of these physical qualities between groups.
Study design
Cross-sectional.
Methods
Ten male swimmers (age= 18.7 ± 1.2 years) were divided into high-load (N= 5 national-level, weekly swim-volume= 37.0 ± 2.7 km) and low-load groups (N= 5 university-level, weekly swim-volume= 6.8 ± 1.8 km). For each group, shoulder active ER ROM and isometric peak torque of the shoulder IR and ER were measured before and immediately after a high-intensity swim-training session (for each group, the hardest swim-session of the week was analyzed). The results were evaluated by the level of significance (p-value), effect size, and whether changes exceeded the measurement error
Results
University-level swimmers had lower baseline ER torque (p= 0.006; d= 2.55) and IR torque (p= 0.011; d= 2.42) than national-level swimmers. For post-swim analysis, ER ROM decreased more in university swimmers (change= -6.3° to -8.4°; d= 0.75-1.05) than national counterparts (change= -1.9° to -5.7°; d= 0.43-0.95). Greater drops in rotation torque were found in university swimmers (IR change= -15% to -21.0%; d= 0.83-1.66; ER change= -9.0% to -17.0%; d= 1.14-1.28) compared to national swimmers (IR change= -10.0% to -13.0%; d= 0.61-0.91; ER change= -3.7% to -9.1%; d= 0.50-0.96). The average change of all tests in university swimmers exceeded the minimal detectable change (MDC), whereas in national level swimmers some tests exceeded the MDC. Despite this, only post-swim ER torque in the dominant side (p= 0.003; d= 1.18) was significantly lower in university swimmers (possibly due to the small sample size).
Corresponding author
Matias Yoma, PhD. University of Salford.
Allerton Building University of Salford M6 6PU, UK.
Phone number: 0161 295 5000
Email: matiasyoma@gmail.com
Original Research
a Yoma M, Herrington L, Mackenzie T. The Effects Of Differing Density Of Swim-Training Sessions On Shoulder Range Of Motion and Isometric Force Production In National and University Level Swimmers. IJSPT. Published online April 1, 2023:375-387. doi:10.26603/001c.72717
Conclusions
University swimmers have less baseline shoulder external and internal rotator torque and had greater drops of all shoulder physical qualities after a swim-training session, which may have implications for injury risk. However, due to the sample size, the results have to be interpreted with caution.
Level of evidence
3
INTRODUCTION
The shoulder is the most commonly injured body part in swimmers with a prevalence reported as high as 91%.1 Level of competition has been reported as a potential nonmodifiable risk factor for shoulder pain in this population.2 This might be explained as swimmers of a higher competitive level are exposed to greater chronic loads (e.g. weekly swim-training volume and number of training sessions).3 However, higher levels of competition have been also associated with more developed physical qualities such as aerobic capacity and shoulder strength,4,5 which might be also protective against injury in swimmers (‘training load-injury paradox’).6 Feijen et al.7 found that club-level swimmers had a higher risk of shoulder pain than regional-level counterparts during a two-year follow-up. A possible explanation for this is that fitter and stronger athletes (i.e., higher load capacity) can better tolerate the amount of and changes in workloads.8,9
Some authors have investigated how swimmers respond to training loads.10–13 These researchers found that a swim-training session negatively affects shoulder physical qualities such as rotation strength,12 rotation ROM,10–12 pectoralis minor length,10 and joint position sense.10,11 Since some of these physical qualities have been considered potential risk factors for shoulder pain in swimmers,2,14 their acute impairments can increase the risk of shoulder injury.15 The injury-etiology model proposed by Windt & Gabbett15 suggests that the risk of injury can increase as a result of training loads applied and the negative effects on modifiable risk factors (e.g., physical qualities). Although these studies investigated different levels of competition, it is difficult to make comparisons as the swim-sessions studied varied in terms of volume, intensity, and time. Therefore, it is unknown whether higher-level swimmers (i.e., stronger and fitter athletes) have less significant decreases in physical qualities than lower-level counterparts after a similar swim-training session.
To date, some authors have shown that swimmers of a higher competitive level have more developed shoulder physical qualities.4,5 However, no studies have compared the postswim changes in shoulder physical qualities between different levels of competition. Investigating this can help to understand whether higher chronic loads and welldeveloped physical qualities affect post-training shoulder responses. This might have implications in the prevention of shoulder pain in specific groups. The primary aim of this study was to compare the baseline differences in shoulder ER ROM and isometric peak torque of the shoulder internal and external rotators between university and national level
swimmers with differing training volumes. A secondary aim was to compare the postswim changes of these physical qualities between groups. It was hypothesized university swimmers would have less developed physical qualities at baseline. Also, that these physical qualities would be more affected after the training session in university swimmers.
MATERIALS AND METHODS PARTICIPANTS
A sample of ten male participants was included in the study Participants were divided into two groups according to their level of competition: high-load (university level; N = 5) and low-load (national level; N = 5). Participants of both groups were matched by gender, age, and years of swim experience, but differed in training volume. All swimmers trained within the same group during the year, completed the same practices regularly, and participated in either university or national championships. The exclusion criteria included a history of shoulder surgery, shoulder pain at the time of the study, and any pain in the two weeks prior to study that interfered with the ability to train or compete fully 10 All participants provided written informed consent. This study was approved by the university’s ethics board and conducted in accordance with the Declaration of Helsinki (Ref.no.HSR1718-100).
PROCEDURES
The same researcher (MY) performed all the tests in both groups. For each swimmer, measurements were recorded before and after a swim-training session. On the testing day, general demographic information of participants, such as sex, age, limb dominance, height, mass, and forearm length, were recorded. Before the procedure testing, participants performed a standardized land-based warm-up consisting of shoulder movements. Immediately after the warm-up, baseline measurements were recorded in the following order: shoulder ER ROM, and isometric peak torque of the shoulder internal and external rotators. All the tests were standardized, and the dominant arm was assessed first. Three subsequent testing trials of each test were performed in both limbs, and the results were averaged for further analysis. Immediately after completion of the training, swimmers exited the pool and repeated baseline testing.
INSTRUMENTATION AND OUTCOME MEASURES
Regarding shoulder-rotation ROM, only ER was measured. The reason for this was because previous authors10–12 have
The Effects Of Differing Density Of Swim-Training Sessions On Shoulder Range Of Motion and Isometric Force Production In. International Journal of Sports Physical Therapy
Table 1. Two-Hour Test-Retest Reliability for the Outcome Measures Calculated from the Pilot Study (N = 10)
low
b Standard deviation x √1 – intraclass correlation coefficient.
c Calculated as standard error of measurement x 1.96 x √2.
d Standard error of measurement and minimal detectable change % were calculated by dividing their respective value with the average of the test and retest values.
found changes in ER ROM, but not in internal rotation (IR) after a swim-session. Shoulder ER ROM was measured using the ‘Goniometer Pro’ (5fuf5 Co, 159 Bloomfield, NJ) digital inclinometer application for the iPhone (Apple, Inc, Cupertino, CA), which is valid compared to the universal goniometer 16 Participants were positioned in supine with the shoulder in 90° of abduction and were instructed to actively rotate the limb back until the available end range.17
A towel roll was placed under the humerus to ensure correct alignment in the frontal plane. This was based on visual inspection, making sure that the humerus was levelled to the acromion process. The end range was determined by the available range without any stabilization.17
Isometric peak torque of the shoulder internal and external rotators was measured using a hand-held dynamometer (Hoggan MicroFET2; 166 Scientific LLC, Salt Lake City, UT), which is reliable and valid compared to the gold standard isokinetic dynamometry 18 Participants were positioned in supine with the shoulder in 90° of abduction. Before testing, one submaximal trial was performed to ensure correct technique. The HHD was placed on the palmar surface of the forearm for IR and on the dorsal aspect of the forearm for ER, proximal to the radioulnar joint crease. Then, participants were instructed to push against the HHD as hard as possible for three seconds, with a resting period of 10 seconds. Then, two further trials were performed. Force was converted into torque (newton meters) by multiplying the force (in newtons) by the lever arm length (meters) of the dominant and nondominant sides. Next, torque was normalized to body mass (Nm/kg) and expressed as the percentage of change between measurements. To assess muscle balance, the ratio between external and internal rotator isometric peak torque was calculated (ER: IR ratio).
Intrarater test-retest reliability for shoulder ER ROM and rotation torque was established before in a pilot study. Each measurement was taken before and after a two-hour period (average duration of a swim-training session). The intraclass correlation coefficient, standard error of measurement (SEM), and minimal detectable change (MDC) with 95% of confidence interval for each test were calculated (Table 1).
DESCRIPTION OF THE TRAINING SESSIONS
For each group, the hardest swim-session of the week was analyzed. The rationale for this was because studies have found changes in shoulder physical qualities after a highintensity swim-training but not after a moderate to low training session.12,13 Based on the coach’s perception, the Wednesday evening session was chosen. Both groups data were collected on the same day of the week, time, and period of the year Both sessions lasted one hour The only difference between sessions was the total swim-volume performed; national level swimmers performed a greater volume (3 km) than university swimmers (2 km). To assess how swimmers perceived the intensity of the training, the session-RPE (sRPE) was calculated. sRPE is a valid and reliable method to monitor training load in various sports and populations.19 Two methods of sRPE were used to quantify the internal training load: sRPEh and sRPEkm 20
First, the intensity of the session was quantified by the RPE based on the modified version of the category-ratio scale of Borg.21 Immediately after completing the training, the swimmers were asked, “how hard was your workout”, using an 11-point scale with 0 corresponding to ‘rest’ and 10 to ‘maximal’ effort. For sRPEh , the RPE score was multiplied by the session duration (min) and expressed in arbitrary units (AU). Whereas, for sRPEkm , the RPE was multiplied by the volume (km) and also expressed in arbitrary units (AU). This method has been used especially in swimmers to quantify internal training loads as includes the volume swam.20,22 Collette et al.20 found that the sRPEkm was the strongest measure associated with the recovery-stress status of swimmers during a training season.
STATISTICAL ANALYSIS
For statistical analysis, SPSS version 25 for Windows (Inc, Chicago, IL) was used. Demographic data were initially screened for between-group differences using independent sample t-tests for normally distributed data and Mann Whitney test for non-normally distributed data. For postswim changes, results were expressed as means and
Test Side Intraclass Correlation Coefficient (3,3)a (95% CI) Standard Error of Measurementb Standard Error of Measurementd (%) Minimal Detectable Changec Minimal Detectable Changed (%) External rotation range of motion, ° Dominant 0.980 (0.922-0.995) 2.39 2.30 6.61 6.37 Nondominant 0.990 (0.919-0.998) 1.70 1.66 4.72 4.61 External rotation torque, Nm/kg Dominant 0.992 (0.905-0.998) 0.02 4.47 0.05 12.39 Nondominant 0.999 (0.994-1.000) 0.01 2.04 0.02 5.65 Internal rotation torque, Nm/kg Dominant 0.982 (0.925-0.996) 0.03 6.34 0.07 17.56 Nondominant 0.997 (0.990-0.999) 0.01 2.62 0.03 7.26 Abbreviations: CI, confidence interval. a Two-way mixed model. A coefficient ≥ 0.90 is considered excellent reliability, ≤0.89 to ≥ 0.80, good, ≤0.79 to ≥ 0.70, moderate, and < 0.70,
The Effects Of Differing Density Of Swim-Training Sessions On Shoulder Range Of Motion and Isometric Force Production In. International Journal of Sports Physical Therapy
standard deviation (SD) as all data presented a normal distribution (Shapiro-Wilk’s test). Paired student t-test was used to assess within-group differences between pre- and post-measurements and independent sample t-tests were used to assess between-group differences. Differences were considered as significant when p values were ≤ 0.05. Also, Cohen’s d effect size (ES) was calculated to determine the magnitude of any difference between measurements.23 The following ES values were considered: > 0.8 (large), between 0.5 and 0.79 (medium), between 0.49 and 0.20 (small), and < 0.2 (trivial). Finally, whether the results exceeded or not the measurement error (MDC) was also used to analyze differences. Given the small sample size (n = 10), results were presented in scatterplots to examine data distribution.
RESULTS
No differences were found between groups for age, sex, height, years of swim, and history of shoulder pain (Table 2). The high-level group reporter greater swim-training volume (p < 0.001), hours of training (p < 0.001), training sessions (p < 0.001), and less body mass (p = 0.009) than the low-level group.
BASELINE DIFFERENCES BETWEEN GROUPS
Table 3 shows baseline differences of the outcome measures. University swimmers presented a lower baseline torque than national counterparts for external rotators (dominant side: p = .007; d = 2.50 and nondominant side: p = 0.006; d = 2.55) and internal rotators (dominant side: p = 0.011; d = 2.12 and nondominant side: p = 0.014; d = 2.42). There was no significant difference between groups for ER ROM and ER: IR ratio. Individual analysis showed that 80% and 100% of national swimmers had higher baseline rotator torque than university counterparts in dominant and nondominant side, respectively
POST-SWIM SHOULDER EXTERNAL ROTATION ROM
Table 4 shows pre-post differences of the outcome measures. Figure 1 presents the results for shoulder ER ROM. University swimmers reported mean decrease in ER ROM with moderate ES for the dominant side (p = 0.003; change
= -8.4°; d = 0.74). Although decreases in the nondominant side had large ES (d = 1.05; change = -6.4°), the difference was not significant (p = .062). The mean value of change on both sides exceeded the MDC. Individual analysis showed that all participants in this group reduced the ER ROM on both sides. Furthermore, 80% of the participants exceeded the MDC in the dominant side and 40% in the nondominant side.
In national swimmers, no significant pre-post differences were found on either side. Despite this, the ES was large for the dominant side (d = 0.95) and moderate for the nondominant side (d = 0.43). The mean value of change on the dominant side only exceeded the SEM, whereas, on the nondominant side, did not exceed the measurement error Individual analysis showed that all participants reduced ER ROM on the dominant side and 80% on the nondominant side. Furthermore, 20% of the participants exceeded the MDC on both sides. There was no significant difference between groups.
POST SWIM SHOULDER ROTATION ISOMETRIC TORQUE
Figure 2 presents the results for shoulder rotator peak torque and shoulder ER:IR ratio. Regarding internal rotator torque, university swimmers reported a significant mean decrease with large ES for the dominant side (p = 0.024; change = 21.5%: d = 1.66). Although the decreases in the nondominant side had large ES (change = 15.1%: d = 0.83) the difference was not significant (p = 0.108). On both sides, the mean value of change exceeded the MDC. Individual analysis showed torque reductions in all participants in the dominant side and 80% in the nondominant side. Furthermore, 60% of the participants exceeded the MDC values in both sides. National swimmers had significant decreases with large ES for the dominant side (p = 0.002; change = 13.9%: d = 0.91) and moderate ES for the nondominant side (p = 0.001; change = 10.7%: d = 0.61). The mean value of change exceeded the MDC in the nondominant side and only the SEM in the dominant side. Individual analysis showed torque reductions in all participants in both sides. Furthermore, 20% of the participants exceeded the MDC in the dominant side and 80% in the nondominant side.
For external rotator torque, university swimmers reported a significant mean decrease with large ES for the
University swimmers (n = 5) National swimmers (n = 5) Between group Mean ± SD Range (min-max) Mean ± SD Range (min-max) p- Value Age (y) 19.4 ± 0.9 2.0 (19 – 21) 18.0 ± 1.2 3.0 (17.0 – 20.0) 0.062 Body mass (kg) 83.2 ± 5.2 14.0 (75.0 – 89.0) 69.9 ± 6.9 19.1 (60.3 – 79.4) 0.009a Height (cm) 176.0 ± 12.3 30.0 (155.0 – 185.0) 171.8 ± 10.5 27.0 (155.0 – 182.0) 0.578 Weekly swim-volume (km) 6.8 ± 1.8 4.0 (6.0 – 10.0) 37.0 ± 2.7 5.0 (35.0 – 40.0) <0.001a Weekly training sessions (n) 2.6 ± 0.9 2.0 (2- 4) 8.2 ± 1.1 2.0 (8-9) <0.001a Weekly training hours (hr) 5.2 ± 1.8 4.0 (4-8) 16.8 ± 1.1 2.0 (16-18) <0.001a Swimming experience (y) 8.8 ± 1.6 3.0 (7.0 – 10.0) 8.0 ± 0.84 2.0 (7.0 – 9.0) 0.260 History of shoulder pain (yes: no) 4:1 4:1 1.0 a Significant
0.05).
Table 2. Descriptive characteristics of participants
difference between groups (p <
The Effects Of Differing Density Of Swim-Training Sessions On Shoulder Range Of Motion and Isometric Force Production In. International Journal of Sports Physical Therapy
A, dominant
dominant side (p = 0.004; change = 17.2%: d = 1.28). Although reductions in the nondominant side had large ES (change = 9.0%: d = 1.14), the difference was not significant (p = 0.075). On both sides, the mean value exceeded the MDC. Individual analysis showed torque reductions in all participants in the dominant side and 80% on the nondominant side. Furthermore, 80% of the participants exceeded the MDC in the dominant side and 60% on the nondominant side. National swimmers had no significant differences in the dominant (p = 0.103; change = 3.7%: d = 0.50) and nondominant sides (p = 0.145; change = 9.1%: d = 0.96). On the dominant side, the mean value of change did not exceed the measurement error, and on the nondominant side, it exceeded the MDC. Individual analysis showed torque reductions in 80% of the participants on both sides. Furthermore, none of the participants exceeded the MDC in the dominant side and 60% in the nondominant side.
There was no significant difference between groups for internal rotator torque (both sides) and for nondominant side external rotator torque. However, external rotator torque of the dominant side was significantly lower in university swimmers compared to national counterparts (p = 0.003; d = 1.18).
SHOULDER ER: IR RATIO
University swimmers reported no significant differences between sides. Individual analysis showed increases in 80% of the participants in the dominant side and 60% in the nondominant. National swimmers reported a significant increase in the dominant side with large ES (p = 0.004; d = 0.80) but no differences in the nondominant side (p = 0.311). Individual analysis showed ratio increases in all participants in the dominant side and 80% in the nondominant.

Test University swimmers National swimmers Mean difference p Value Effect size External Rotation ROM, ° D 105.3 ± 10.9 100.3 ± 3.3 5.00 0.376 0.70 ND 97.4 ± 5.6 98.2 ± 4.0 0.80 0.973 0.17 External rotator torque, Nm/kg D 0.43 ± 0.05 0.53 ± 0.03 0.10 0.007a 2.50 ND 0.39 ± 0.05 0.53 ± 0.06 0.14 0.006a 2.55 Internal rotator torque, Nm/kg D 0.41 ± 0.08 0.59 ± 0.09 0.18 0.011a 2.12 ND 0.40 ± 0.06 0.63 ± 0.13 0.24 0.014a 2.42 ER: IR ratio D 1.08 ± 0.11 0.92 ± 0.14 0.16 0.081 1.28 ND 0.97 ± 0.12 0.85 ± 0.12 0.12 0.167 1.00 D= dominant shoulder, ND= non-dominant shoulder a Significant difference between groups (p < 0.05).
Table 3. Baseline difference between groups for shoulder external rotation range of motion and rotation isometric peak torque normalized to body weight.
Figure 1. Scatterplots showing preswim and postswim changes in shoulder ER ROM for university and national swimmers.
shoulder B, nondominant shoulder The bold lines indicate the mean value.
The Effects Of Differing Density Of Swim-Training Sessions On Shoulder Range Of Motion and Isometric Force Production In. International Journal of Sports Physical Therapy
The Effects Of Differing Density Of Swim-Training Sessions On Shoulder Range Of Motion and Isometric Force Production In.
Table 4. Mean Results from Preswim and Postswim of High-Intensity Training Sessions for Rotation Range of Motion and Isometric Peak Torque Normalized to Body Weight.
NA, not applicable, D=dominant, ND= non dominant
a Significant difference within group (p < 0.05).
b Significant difference between groups (p < 0.05).
Test Side Preswim Postswim Mean difference Mean % change Within group Between groups p-value Effect size p-value Effect size University swimmers External rotation ROM, ° D 105.3 ± 10.9 96.9 ± 11.9 -8.4 -8.1 ± 3.0 0.003a 0.74 0.444 0.35 ND 97.4 ± 5.6 91.1 ± 6.3 -6.3 -6.4 ± 5.5 0.062 1.05 0.200 0.85 External rotator torque, Nm/kg D 0.43 ± 0.05 0.36 ± 0.04 -0.07 -17.2 ± 6.0 0.004a 1.28 0.003b 1.18 ND 0.39 ± 0.05 0.35 ± 0.04 -0.04 -9.0 ± 8.8 0.075 1.14 0.914 0.19 Internal rotator torque, Nm/kg D 0.41 ± 0.08 0.32 ± 0.06 -0.09 -21.5 ± 9.4 0.024a 1.66 0.160 0.13 ND 0.40 ± 0.06 0.35 ± 0.03 -0.05 -15.1 ± 18.1 0.108 0.83 0.615 0.33 ER: IR ratio D 1.08 ± 0.11 1.14 ± 0.11 +0.06 +6.3 ± 10.8 0.273 0.57 0.329 0.41 ND 0.97 ± 0.12 0.99 ± 0.06 +0.03 +3.9 ± 11.3 0.600 0.12 0.763 0.18 National swimmers External rotation ROM, ° D 100.3 ± 3.3 94.6 ± 4.5 -5.7 -5.7 ± 6.9 .127 0.95 NA NA ND 98.2 ± 4.0 96.4 ± 4.5 -1.8 -1.9 ± 4.6 .421 0.43 NA NA External rotator torque, Nm/kg D 0.53 ± 0.03 0.51 ± 0.05 -0.02 -3.7 ± 4.0 .103 0.50 NA NA ND 0.53 ± 0.06 0.48 ± 0.06 -0.05 -9.1 ± 9.6 .145 0.96 NA NA Internal rotator torque, Nm/kg D 0.59 ± 0.09 0.51 ± 0.09 -0.08 -13.9 ± 4.0 .002a 0.91 NA NA ND 0.63 ± 0.13 0.55 ± 0.14 -0.08 -10.7 ± 5.1 .001a 0.61 NA NA ER: IR ratio D 0.92 ± 0.14 1.03 ± 0.13 +0.11 +12.0 ± 5.2 .004a 0.80 NA NA ND 0.85 ± 0.12 0.90 ± 0.15 +0.05 +6.2 ± 11.9 .311 0.35 NA NA Abbreviation:
International Journal of Sports Physical Therapy
SESSION-RPE
University swimmers reported an RPE average of 6.4 ± 1.5 (min-max = 5-9), whereas national counterparts an average of 8.2 ± 1.1 (min-max = 7-9). Considering that both groups performed a 60 minute session, sRPEh average was 384 ± 91 AU (min-max = 300 – 540 AU) for university swimmers and 492 ± 65.7 AU (min-max = 420 – 540 AU) for national counterparts. The difference between groups was not significant (p = 0.064). Individual analysis showed that 80% of national swimmers reported higher RPE and sRPEh than university Regarding sRPEkm , university swimmers reported an average of 12.8 ± 3.0 AU (min-max = 10 – 18 AU) and national swimmers an average of 24.6 ± 3.3 AU (min-max = 21 -27 AU). In this case, the difference was significant with large ES (p < 0.001; d = 3.75). Furthermore, all national swimmers reported higher sRPEkm than university counterparts.
DISCUSSION
The current study explored the relationship between training loads, physical qualities of the shoulder, and competitive level in swimmers. Due to the small sample size, the results were analyzed by the level of significance (p-value), magnitude of the difference (ES) and whether changes exceeded or not the measurement error (MDC). For the primary objective, the hypothesis was partially rejected. University swimmers had significantly less shoulder rotator torque at baseline. However, there was no baseline difference in shoulder ER ROM between groups. For the secondary objective, the hypothesis was also partially rejected. University swimmers experienced greater drops than national counterparts after a high-intensity swim-session. Despite this, only external rotator torque of the dominant side was significantly lower in university swimmers. The lack of significant differences in some variables might be explained by the small sample size. If groups are compared using ES and whether the results exceeded the measurement error or not, university swimmers showed more meaningful decreases in all the physical qualities after the training session. This is important as the ES and MDC are less affected by the sample size.24
These results suggest that higher chronic loads and welldeveloped physical qualities (i.e., greater baseline rotator torque) seem to be a protective factor of postswim drops in shoulder physical qualities. Furthermore, that lower-level swimmers (i.e., lower load capacity) are possibly at higher risk of shoulder injury after swim-training than their higher-level counterparts. Since shoulder ER ROM and rotation isometric peak torque are potential risk factors for development of shoulder pain in swimmers,2,14 their monitoring before and after a training session, especially in lower-level swimmers, might have implications for injury risk. However, the results must be interpreted with caution due to the small sample size.
GROUP CHARACTERISTICS
Both groups were composed of male swimmers of a similar age and years of swimming experience. The main differences between groups were the amount of training they had been exposed to. As competitive level increases, so does the number of sessions and swim-training volume.3 In our study, national swimmers performed on average 37.0 ± 2.7 km per week, which is 5.4 times more than the university swimmers (average = 6.8 ± 1.8 km). Furthermore, national swimmers performed an average of 11.6 hours and 5.6 sessions of extra training per week compared to university counterparts. This shows that national swimmers were exposed to higher chronic loads.
SHOULDER ROTATION TORQUE
Baseline rotation torque was significantly higher in national swimmers than university counterparts with large effect sizes (d = 2.12 to 2.55). All national swimmers were stronger than university swimmers in the dominant side and 80% were in nondominant side. This is supported by Bae et al.4 who found that international swimmers had greater shoulder rotator force measured by isokinetic dynamometry than national swimmers. A later study5 reported that elite swimmers had also greater strength in the shoulder extensors, flexors, abductors, and adductors muscles than recreational counterparts measured by a handheld dynamometer. The current results are in accordance with these studies showing that swimmers of a higher competitive level have greater baseline shoulder force, which might be explained by the greater chronic loads they are exposed to. This is important as greater upper body strength has been associated with swimming performance.25–27 Furthermore, athletes with lower shoulder ER strength have higher shoulder injury rates after an increase of training loads,9 which might have implication for injury risk.
For postswim changes, internal rotation torque was significantly decreased in both groups, particularly in the dominant arm. Despite this, university swimmers reported greater mean decreases as a percentage of body weight (15% to 21%) than national swimmers (10% to 13%). Furthermore, they had more clinically meaningful drops (large ES and values exceeding MDC) than national counterparts (moderate to large ES and only the nondominant side exceeding MDC). Importantly, a higher percentage of university swimmers had drops exceeding the MDC. Despite this, there was no significant difference between groups, which might be explained by the small sample size. Shoulder internal rotator muscles are constantly activated during the pull-through phase of the stroke28 which can lead to muscle fatigue after a high-intensity swim-session.12 Two cross-sectional studies have found that internal rotator force deficits in swimmers with shoulder pain.29,30 However, due to the cross-sectional design, of these studies, it is unclear whether the decreases in internal rotator force is the cause or consequence of shoulder pain.
External rotation torque was also decreased in both groups. Although none of the groups reported significant decreases in the nondominant side, the percentage of
The Effects Of Differing Density Of Swim-Training Sessions On Shoulder Range Of Motion and Isometric Force Production In. International Journal of Sports Physical Therapy
national and university swimmers.
A, External rotators in the dominant shoulder B, External rotators in the nondominant shoulder C, Internal rotators in the dominant shoulder D, Internal rotators in the nondominant. E, ER:IR ratio in the dominant side. F, ER:IR ratio in the nondominant side. The bold lines indicate the mean value.
 Figure 2. Scatterplots showing preswim and postswim scores in shoulder rotation torque for
The Effects Of Differing Density Of Swim-Training Sessions On Shoulder Range Of Motion and Isometric Force Production In. International Journal of Sports Physical Therapy
change (9.0% and 9.1%), large ES, and swimmers exceeding the MDC value (60%) was similar between groups. The main difference was seen on the dominant side. Reductions in university swimmers (17% of body weight) were significant, with large ES, and with 80% of participants exceeding the MDC. On the contrary, national swimmers reported nonsignificant drops (3.7% of body weight) with small ES and none of the swimmers exceeding the MDC. These results support why external rotation torque in the dominant side was the only variable significantly different between groups (p = 0.003; d = 1.18). Although shoulder external rotator muscles are less activated during swimming, their role is to control internal rotator forces.28 Labriola et al.31 have indicated that decreased infraspinatus activity can lead to glenohumeral instability, which may result in functional impingement. A recent study showed acute decreases of shoulder external rotator torque after a high-intensity swim-session.12 Interestingly, deficits in shoulder external rotator endurance rather than peak force have been reported as a potential risk factor for shoulder pain in swimmers in a cross-sectional32 and two prospective studies.7,33
Considering this, the authors recommend that future research explore postswim changes in shoulder external rotator endurance in this population.
Both groups increased their ER:IR ratio after a high-intensity swim-session, mainly in the dominant side. This means that proportionally, internal rotator torque was more affected than external rotator after a single training. Interestingly, national swimmers had greater increases in this ratio (6.2% to 12%) than university counterparts (3.9% to 6.3%). However, only the changes in the dominant side of national swimmers were significant. Contrary to the result of this study, Batalha et al.13 found no changes in shoulder ER:IR ratio after a swim-training session in competitive swimmers. This might be explained as the intensity of the session in the present study was high, whereas in Batalha et al.13 study was medium to low Several authors have also investigated the changes in this ratio over a longer period,34–36 reporting reductions between 4% to 14% during a training period in young competitive swimmers. This shows that internal rotator torque increases proportionately more than external rotator during a training season.35 Therefore, while a training season decreases the ER:IR ratio, a single swim-session increases it. However, it remains unclear whether this imbalance (increase or decrease) is related to shoulder injuries. Two cross-sectional studies have found no relationship between the ER:IR ratio and shoulder pain32,37 and one prospective study found a relationship38 in competitive swimmers. This prospective38 study found that low preseason shoulder ER:IR ratio was associated to an increase risk of injury during a season.
In summary, the results of this study showed that a highintensity swim-session decreased shoulder rotator torque and increased the ER:IR ratio in both groups. However, university-level swimmers reported more meaningful changes. Lower-level swimmers have less tolerance to maintain loads during a high-intensity swim-session, which result in greater fatigue of shoulder rotator muscles. Possibly, lower
competitive level swimmers might be at higher risk of shoulder injury after a high-intensity swim-session.
SHOULDER ER ROM
Baseline shoulder ER ROM was similar between groups. Although one university swimmer presented more range in his dominant side, this was not consistent (Figure 1). To the authors knowledge, this is the first study to investigate baseline differences of shoulder ER ROM between levels of competition in swimmers. One study found that elite swimmers had more shoulder ER ROM (average of 15°) compared to a non-swimmer group.39 The greater ROM found in swimmers was explained by the repetitive shoulder elevation during the stroke.39 Although in the current study national swimmers were exposed to greater chronic loads (i.e., more repetitive shoulder elevation), the results showed no baseline difference between groups. This probably indicates that higher chronic loads in swimmers are more related to baseline differences in shoulder rotation force than ER ROM.
Regarding postswim changes, both groups reduced their shoulder ER ROM, predominantly in the dominant arm. However, the average decrease in university swimmers was greater (6.3° to 8.4°) and more meaningful (large ES and values exceeding MDC) than national counterparts (1.9° to 5.7° with small to large ES and values exceeding the SEM only). Despite this, only the changes in the dominant arm of university swimmers were significant. Individually, almost all swimmers reduced their ROM after the training session in both groups. Only one national swimmer increased the ROM in the nondominant side (Figure 1), which might explain the less significant result in this group. Interestingly, university swimmers presented a higher proportion of swimmers exceeding the MDC (40 to 80%) than national counterparts (20%). Despite this, the difference between groups was not significant. The results showed that, after a high-intensity swim-session, shoulder ER ROM decreased in both groups with more meaningful changes in low-level swimmers. Similarly, studies have also found reductions of ER ROM as a result of a single swim session10–12 and the accumulation of loads during a week.40 Importantly, deficits in shoulder ER ROM is a risk factor for shoulder pain in competitive swimmers.41 Since shoulder ER ROM is necessary during the mid-recovery phase when the arm is abducted at 90°, limitations of this movement may increase the probability of mechanical shoulder impingement.41
The findings are consistent with previous studies reporting decreases in shoulder ER ROM after a swim-training session in elite10 and national level swimmers.11,12 Interestingly, the study assessing the highest level of competition (i.e. elite) found the lowest drops in ER ROM (average = 3.4°),10 while the highest drops were found in the university group of the present study (average = 8.4° in the dominant side). This supports these results and suggests that higher competitive levels have less postswim reductions of shoulder ER ROM. However, it is difficult to make comparisons as the sessions are different in terms of intensity and distance. More studies with bigger sample sizes comparing
The Effects Of Differing Density Of Swim-Training Sessions On Shoulder Range Of Motion and Isometric Force Production In. International Journal of Sports Physical Therapy
the effect of the same session in different groups might be necessary to confirm the current findings.
INTENSITY OF TRAINING SESSIONS
Despite national swimmers reporting less postswim changes in shoulder physical qualities, this group perceived the training session as harder. Both groups performed a one-hour session, but the national swimmers completed more volume (3 km) than university counterparts (2 km). To illustrate this, in the same period, national swimmers performed 33% more volume, which implies a higher intensity of the session and probably less recovery time throughout the session. This was expected as higher levels of competition perform greater swim-volumes and intensities. However, both training sessions were the hardest of the week which is proportional to the level of competition.
Comparing the sRPEh , national swimmers perceived the session slightly harder, however, the differences between groups were not significant (p = 0.064; d = 1.35). Yet, if the sRPEkm is compared, national swimmers perceived the session harder with significant differences and larger ES (p < 0.000; d = 3.75). The difference obtained between the two methods might be explained because sRPEkm considers the volume instead of time. This shows that, in this study, sRPEkm was more appropriate than sRPEh to compare internal training loads between groups. This is supported by Collette et al.20 who recommended the use of sRPEkm to monitor internal training loads as the influence of volume on the perceived exertion is greater than the training time in swimmers. Another explanation for the higher RPE found in national swimmers is the accumulation of training loads over the week. Although both groups were assessed the same day (Wednesday evening), at the testing day national swimmers had already performed five training sessions that week (average = 8.2 training sessions/week). Furthermore, they had done a morning session on the same day, while the university swimmers had only performed one or two sessions before the Wednesday session (average = 2.6 training sessions/week) and did not have a morning training on the testing day
LIMITATIONS
This study presents limitations. First, although the study reported some findings (e.g., level of competition presenting more developed physical qualities and less postswim changes), it is underpowered (type II error). To be confident of the post-swim changes and differences between groups the study would have needed at least 16 participants per
group (version 3.1.9.2; G*Power). Because of the small sample size, the value of the analysis was increased in several ways.42 An homogeneous sample investigated a: males between 17 and 20 years old with similar swimming experience. Although this can decrease the between-subject variability and increase the power of the study, the results cannot be generalized to other populations. Repeated measures of the dependent variables (shoulder physical qualities) were also performed to decrease the variability and increase the number of measurements. Finally, reliable tools were used to measure the participants. Unreliable tools can increase variability and affect outcomes.42 Another limitation might be the structure of the swim-session. Although the swim-sessions were the hardest for each group, there might have been some differences in terms of structure which could have influenced the results. Further research should investigate a larger sample size including other levels of competition and development of physical qualities (e.g., elite group). Also, understanding whether postswim changes of shoulder physical qualities are related to the development of shoulder pain might be necessary
CONCLUSIONS
University level swimmers have lower baseline shoulder rotator torque than their national level counterparts, which might be explained by the lower chronic loads they are exposed to. This might, to some extent, explain the greater postswim drops of shoulder physical qualities in this group. However, due to the small sample size, the results have to be interpreted with caution. The current results might have practical implications for recreational swimmers and triathletes (lower chronic loads). Since higher baseline shoulder rotator torque and chronic loads seem to be a protective factor of postswim drops in shoulder physical qualities, lower-level swimmers (i.e., lower load capacity) may be at higher risk of shoulder injury after swim-training than higher-level swimmers (more trained, thus greater load capacity). A shoulder strengthening program and monitoring of shoulder physical characteristics before and after a training session might be beneficial for lower-level swimmers. However, it is unknown whether the postswim impairments on shoulder force and ROM are associated with shoulder injury in this population.
Submitted: August 10, 2022 CDT, Accepted: January 27, 2023 CDT
This is an open-access article distributed under the terms of the Creative Commons Attribution 4.0 International License (CCBY-NC-4.0). View this license’s legal deed at https://creativecommons.org/licenses/by-nc/4.0 and legal code at https://creativecommons.org/licenses/by-nc/4.0/legalcode for more information.
The Effects Of Differing Density Of Swim-Training Sessions On Shoulder Range Of Motion and Isometric Force Production In. International Journal of Sports Physical Therapy
REFERENCES
1. Sein ML, Walton J, Linklater J, et al. Shoulder pain in elite swimmers: primarily due to swim-volumeinduced supraspinatus tendinopathy. Br J Sports Med. 2010;44(2):105-113. doi:10.1136/bjsm.2008.047282
2. Hill L, Collins M, Posthumus M. Risk factors for shoulder pain and injury in swimmers: A critical systematic review Phys Sportsmed 2015;43(4):412-420. doi:10.1080/00913847.2015.1077 097
3. Feijen S, Tate A, Kuppens K, Claes A, Struyf F. Swim-training volume and shoulder pain across the life span of the competitive swimmer: A systematic review J Athl Train 2020;55(1):32-41. doi:10.4085/10 62-6050-439-18
4. Bae YH, Yu JH, Lee SM. Comparison of basic physical fitness, aerobic capacity, and isokinetic strength between national and international level high school freestyle swimmers. J Phys Ther Sci. 2016;28(3):891-895. doi:10.1589/jpts.28.891
5. Cheung ATH, Ma AWW, Fong SSM, et al. A comparison of shoulder muscular performance and lean mass between elite and recreational swimmers. Medicine (Baltimore) 2018;97(47):e13258. doi:10.109 7/md.0000000000013258
6. Gabbett TJ. The training-injury prevention paradox: should athletes be training smarterandharder? Br J Sports Med. 2016;50(5):273-280. doi:10.1136/bjsports-2015-0957 88
7 Feijen S, Struyf T, Kuppens K, Tate A, Struyf F. Prediction of shoulder pain in youth competitive swimmers: The development and internal validation of a prognostic prediction model. Am J Sports Med. 2020;49(1):154-161. doi:10.1177/0363546520969913
8. Malone S, Hughes B, Doran DA, Collins K, Gabbett TJ. Can the workload–injury relationship be moderated by improved strength, speed and repeated-sprint qualities? J Sci Med Sport 2019;22(1):29-34. doi:10.1016/j.jsams.2018.01.010
9. Møller M, Nielsen RO, Attermann J, et al. Handball load and shoulder injury rate: a 31-week cohort study of 679 elite youth handball players. Br J Sports Med 2017;51(4):231-237. doi:10.1136/bjsports-2016-09692
10. Higson E, Herrington L, Butler C, Horsley I. The short-term effect of swimming training load on shoulder rotational range of motion, shoulder joint position sense and pectoralis minor length. Shoulder Elbow 2018;10(4):285-291. doi:10.1177/17585732187 73539
11. Matthews MJ, Green D, Matthews H, Swanwick E. The effects of swimming fatigue on shoulder strength, range of motion, joint control, and performance in swimmers. Phys Ther Sport 2017;23:118-122. doi:10.1016/j.ptsp.2016.08.011
12. Yoma M, Herrington L, Mackenzie TA, Almond TA. Training intensity and shoulder musculoskeletal physical quality responses in competitive swimmers. J Athl Train. 2020;55(11):11.
13. Batalha N, Parraca JA, Marinho DA, et al. The acute effects of a swimming session on the shoulder rotators strength and balance of age group swimmers. Int J Environ Res Public Health 2021;18(15):8109. doi:10.3390/ijerph18158109
14. Struyf F, Tate A, Kuppens K, Feijen S, Michener LA. Musculoskeletal dysfunctions associated with swimmers’ shoulder Br J Sports Med 2017;51(10):775-780. doi:10.1136/bjsports-2016-096 847
15. Windt J, Gabbett TJ. How do training and competition workloads relate to injury? The workload—injury aetiology model. Br J Sports Med. 2017;51(5):428-435. doi:10.1136/bjsports-2016-0960 40
16. Melian A, Laguarta S, Varillas D. Reliability and concurrent validity of the goniometer-pro app vs a universal goniometer in determining passive flexion of knee. Int J Comput Appl. 2017;173(1):30-34. doi:1 0.5120/ijca2017915229
17 Furness J, Johnstone S, Hing W, Abbott A, Climstein M. Assessment of shoulder active range of motion in prone versus supine: a reliability and concurrent validity study. Physiother Theory Pract. 2015;31(7):489-495. doi:10.3109/09593985.2015.1027 070
18. Stark T, Walker B, Phillips JK, Fejer R, Beck R. Hand-held dynamometry correlation with the gold standard isokinetic dynamometry: A systematic review. PM R. 2011;3(5):472-479. doi:10.1016/j.pmr j.2010.10.025
7
The Effects Of Differing Density Of Swim-Training Sessions On Shoulder Range Of Motion and Isometric Force Production In. International Journal of Sports Physical Therapy
19. Haddad M, Stylianides G, Djaoui L, Dellal A, Chamari K. Session-RPE method for training load monitoring: validity, ecological usefulness, and influencing factors. Front Neurosci. 2017;11:612. do i:10.3389/fnins.2017.00612
20. Collette R, Kellmann M, Ferrauti A, Meyer T, Pfeiffer M. Relation between training load and recovery-stress state in high-performance swimming. Front Physiol 2018;9. doi:10.3389/fphys.2018.00845
21. Foster C, Florhaug JA, Franklin J, et al. A new approach to monitoring exercise training. J Strength Cond Res 2001;15(1):109-115.
22. Zera JN, McMillan JL, Munkasy BA, Joyner AB, Rossi SJ. Changes in swim performance and perceived stress and recovery in female collegiate swimmers across a competitive season. J Swim Res Published online 2015:44-55.
23. Cohen J. Statistical Power Analysis for the Behavioral Sciences 2nd ed. L. Erlbaum Associates; 1988.
24. Lininger M, Riemann BL. Statistical primer for athletic trrainers: using confidence intervals and effect sizes to evaluate clinical meaningfulness. J Athl Train 2016;51(12):1045-1048. doi:10.4085/1062-605 0-51.12.14
25. Garrido ND, Silva AJ, Fernandes RJ, et al. High level swimming performance and its relation to nonspecific parameters: a cross-sectional study on maximum handgrip isometric strength. Percept Mot Skills 2012;114(3):936-948. doi:10.2466/05.10.25.pm s.114.3.936-948
26. Gola R, Urbanik C, Iwańska D, Madej A. Relationship between muscle strength and front crawl swimming velocity Hum Mov 2014;15(2):110-115. doi:10.2478/humo-2014-0011
27. Saavedra JM, Escalante Y, Rodríguez FA. A multivariate analysis of performance in young swimmers. Pediatr Exerc Sci 2010;22(1):135-151. do i:10.1123/pes.22.1.135
28. Pink M, Perry J, Browne A, Scovazzo ML, Kerrigan J. The normal shoulder during freestyle swimming: An electromyographic and cinematographic analysis of twelve muscles. Am J Sports Med 1991;19(6):569-576. doi:10.1177/03635465910190060
30. Tate A, Turner GN, Knab SE, Jorgensen C, Strittmatter A, Michener LA. Risk factors associated with shoulder pain and disability across the lifespan of competitive swimmers. J Athl Train. 2012;47(2):149-158. doi:10.4085/1062-6050-47.2.149
31. Labriola JE, Lee TQ, Debski RE, McMahon PJ. Stability and instability of the glenohumeral joint: The role of shoulder muscles. J Shoulder Elbow Surg. 2005;14(1, Supplement):S32-S38. doi:10.1016/j.jse.20 04.09.014
32. Beach ML, Whitney SL, Dickoff-Hoffman SA. Relationship of shoulder flexibility, strength, and endurance to shoulder pain in competitive swimmers. J Orthop Sports Phys Ther. 1992;16(6):262-268. doi:1 0.2519/jospt.1992.16.6.262
33. Tate A, Sarver J, DiPaola L, Yim J, Paul R, Thomas SJ. Changes in clinical measures and tissue adaptations in collegiate swimmers across a competitive season. J Shoulder Elbow Surg 2020;29(11):2375-2384. doi:10.1016/j.jse.2020.03.028
34. Batalha NM, Raimundo AM, Tomas-Carus P, Barbosa TM, Silva AJ. Shoulder rotator cuff balance, strength, and endurance in young swimmers during a competitive season. J Strength Cond Res 2013;27(9):2562-2568. doi:10.1519/jsc.0b013e31827f d849
35. Batalha N, Marmeleira J, Garrido N, Silva AJ. Does a water-training macrocycle really create imbalances in swimmers’ shoulder rotator muscles? Eur J Sport Sci 2015;15(2):167-172. doi:10.1080/17461391.2014.9 08957
36. Ramsi M, Swanik KA, Swanik C, Straub S, Mattacola C. Shoulder-rotator strength of high school swimmers over the course of a competitive season. J Sport Rehabil. 2004;13(1):9-18. doi:10.1123/jsr.13.1.9
37 Boettcher C, Halaki M, Holt K, Ginn KA. Is the normal shoulder rotation strength ratio altered in elite swimmers? Med Sci Sports Exerc. 2020;52(3):680-684. doi:10.1249/mss.0000000000002 177
38. Drigny J, Gauthier A, Reboursière E, Guermont H, Gremeaux V, Edouard P Shoulder muscle imbalance as a risk for shoulder injury in elite adolescent swimmers: A prospective study. J Hum Kinet. 2020;75(1):103-113. doi:10.2478/hukin-2020-0041
29. Bak K, Magnusson SP Shoulder strength and range of motion in symptomatic and pain-free elite swimmers. Am J Sports Med. 1997;25(4):454-459. do i:10.1177/036354659702500407
39. Holt K, Boettcher C, Halaki M, Ginn KA. Humeral torsion and shoulder rotation range of motion parameters in elite swimmers. J Sci Med Sport 2017;20(5):469-474. doi:10.1016/j.jsams.2016.10.002
3
The Effects Of Differing Density Of Swim-Training Sessions On Shoulder Range Of Motion and Isometric Force Production In. International Journal of Sports Physical Therapy
40. Yoma M, Herrington L, Mackenzie TA. Cumulative effects of a week’s training loads on shoulder physical qualities and wellness in competitive swimmers. Int J Sports Phys Ther. 2021;16(6):1470-1484. doi:10.2660 3/001c.29875
41. Walker H, Gabbe B, Wajswelner H, Blanch P, Bennell K. Shoulder pain in swimmers: a 12-month prospective cohort study of incidence and risk factors. Phys Ther Sport 2012;13(4):243-249. doi:10.1 016/j.ptsp.2012.01.001
42. Lininger MR, Riemann BL. Statistical primer for athletic trainers: understanding the role of statistical power in comparative athletic training research. J Athl Train. 2018;53(7):716-719. doi:10.4085/1062-605 0-284-17
The Effects Of Differing Density Of Swim-Training Sessions On Shoulder Range Of Motion and Isometric Force Production In. International Journal of Sports Physical Therapy
Original Research
Effects of Repetitive Pitching on Trunk Muscle Endurance and Thoracic and Shoulder Kinematics
Takuya Aso1a , Yoshinori Kagaya2
1 Department of Rehabilitation, Showa University Fujigaoka Rehabilitation Hospital, 2 Department of Physical Therapy, Showa University School of Nursing and Rehabilitation Sciences
Keywords: baseball, kinematics, shoulder, torso, muscles https://doi.org/10.26603/001c.73038
International Journal of Sports Physical Therapy
Background
Baseball players are aware of the potential of shoulder problems due to repetitive throwing. However, few studies have examined how pitching repeatedly affects the thoracic spine and shoulder
Purpose
This study aimed to determine the effects of pitching repeatedly on the endurance of trunk muscles and kinematics of the thoracic spine and shoulder
Study design
Cohort study
Methods
Trunk muscle endurance was assessed in flexion, extension, and lateral flexion positions in 12 healthy amateur baseball players. The positions of stride foot contact (SFC) during the early cocking phase and maximal shoulder external rotation (MER) during the late cocking phase were used to compute the thoracic and shoulder kinematics in degrees. Participants were then asked to throw 135 fastballs (~9 innings with 15 throws per inning). Throwing motions were monitored throughout the first, seventh, eighth, and nine innings, whereas trunk muscular endurance was assessed before and after the repetitive throwing activity Ball speed during pitching was measured using a radar gun. All outcome measures were statistically compared to examine differences over time.
Results
The trunk muscle endurance declined after the throwing task. In the eighth inning, compared with the first inning, the thoracic rotation angle at the SFC increased toward the throwing side. In contrast, the shoulder horizontal adduction angle at MER decreased in the seventh and ninth innings.
Conclusion
With repeated pitching, trunk muscle endurance gradually declines, and repetitive throwing significantly altered kinematics of the thoracic rotation at SFC and shoulder horizontal plane at MER.
Level of Evidence
2a
Corresponding author:
Takuya Aso
Department of Rehabilitation, Showa University Fujigaoka Rehabilitation Hospital, Kanagawa, Japan
TEL: (045)974-2221
Fax: (045)974-2485
Email: aso4201@yahoo.co.jp
a Aso T,
Y. Effects of Repetitive Pitching on Trunk Muscle Endurance and
Shoulder Kinematics. IJSPT. Published online April 2, 2023. doi:10.26603/001c.73038
Kagaya
Thoracic and
INTRODUCTION
Baseball is one of the most popular sports in Japan, and on average, shoulder injuries occur in baseball players at a rate of 13%–35%.1–4 Additionally, it is difficult for an athlete to recover from a shoulder injury and resume their preinjury performance levels. After undergoing surgery for intrinsic shoulder impingement, Peduzzi et al.5 evaluated the effects of getting back into sports. However, 120 of 135 patients (90%) who underwent surgery returned to their athletic activities thereafter, with 52% engaging in the same sports at the same level. Only 48% of pitchers who received surgical therapy for superior labral lesions could resume playing, according to Fedoriw et al.,6 and only 7% of participants maintained their performance level. Considering all these factors, it is important to investigate the risk factors for shoulder injuries, as these are often multifactorial.3,7,8 Among them, repetitive throwing has recently been in focus.3,9 In 2014, the Major League Baseball published the Pitch Smart guidelines.10 These guidelines include specific pitch count limits, such as 120 pitches per day for athletes aged 19–22 years. Additionally, Murray et al.11 showed that the maximum shoulder external rotation angle during pitching decreased because of repetitive throwing. Chou et al.12 found that after 100 repeated tosses by high school baseball pitchers, their shoulder horizontal adduction angles at their maximum shoulder external rotation positions (MER) increased. Escamilla et al.13 reported that shoulder kinematics did not change after 105–135 pitches. According to these studies, there is no agreement on how repetitive throwing alters the shoulder’s kinematics. Few studies have examined how the shoulder kinematics change with repeated throwing; therefore, further research is required.
When someone pitches, motion and energy are transferred from the lower extremities to the upper extremity in what is known as a kinetic chain.14 For the upper extremities to move smoothly and stay injury-free, the thoracic spine, which sits between the lower and upper extremities, must be controlled, which requires strong trunk muscles.15 Aguinaldo et al.16 investigated the connection between pitching-related thoracic movement and shoulder joint strain. In the early cocking phase, Aguinaldo et al.16 suggested that early thoracic rotation enhanced shoulder rotational force and speculated that early thoracic rotation may contribute to throwing-related overuse injuries. Furthermore, according to Douoguih et al.,17 early thoracic rotation during the early cocking phase was linked to a noticeably increased risk of upper extremity injuries that required surgery.
Although thoracic movement control is essential to prevent shoulder injury, changes in thoracic kinematics occur during pitching. Therefore, all adverse effects of recurrent throwing on trunk muscle function should be examined.
This study aimed to determine the effects of pitching repeatedly on the endurance of trunk muscles and kinematics of the thoracic spine and shoulder After repeated tossing, hypothesized that the trunk muscular function would decline and the throwing action would change.
MATERIALS AND METHODS PARTICIPANTS
Twelve healthy male recreational baseball players were recruited to participate in this study. Players who had previously injured upper or lower extremities injuries or who had shoulder pain at the time of testing were excluded. The study protocol was approved by the Research Ethics Committee. Informed consent was obtained from all the participants.
EXPERIMENTAL PROTOCOL
The repetitive throwing task and measurement protocol are shown in Figure 1 The repetitive throwing task was based on the reports of Dale et al.18 and Yanagisawa and Taniguchi.19 All participants were allowed five minutes to warm up and stretch using their preferred routine before the repetitive throwing task (i.e., shoulder and trunk stretching and plyometrics). Next, they threw 135 fastballs (~9 innings with 15 throws per inning at ball intervals of 15 seconds) at maximum effort from the set position toward the target. The distance between the pivot foot of the participants and the target was set at 3 m, and the size of the target was 1.1 × 1.1 m. The target was placed on the extension line of the force plate that was used during 3D motion capture (Figure 2). An official baseball (ZETT Corporation, Osaka, Japan) that weighed 145.0–147.0 g was used during the repetitive throwing task. Five minutes were provided as rest time between each inning.
Before and following the repetitive throwing motion, trunk muscular function was assessed. The throwing motion was monitored during the 1st, 2nd, and 3rd pitches (1st inning), the 103rd, 104th, and 105th pitches (7th inning), the 118th, 119th, and 120th pitches (8th inning), and the 133rd, 134th, and 135th pitches (9th inning). Additionally, the ball speed was measured using a radar gun (Pocket Radar; Pocket Radar Inc., Santa Rosa, CA USA) while assessing the throwing motion. An analysis of ball velocity was performed to ensure that the ball speed had not dropped. Moreover, ball velocity did not drop in all innings (1st inning, 54.1 ± 6.7 mph; 7th inning, 55.6 ± 6.1 mph; 8th inning, 55.6 ± 5.5 mph; 9th inning, 56.9 ± 6.4 mph).
TRUNK MUSCLE ENDURANCE ASSESSMENT
Trunk muscle endurance was measured using a stopwatch (ADME001; Seiko Watch Corporation, Tokyo, Japan) for flexion (Figure 3a), extension (Figure 3b), and throwing and nonthrowing lateral flexion (Figure 3c).20–22 The measurement of trunk muscle endurance used in this study is straightforward, and the reliability of the measurement is high.20,21 The trunk flexion muscle endurance was measured in the supine position with the hips and knees flexed at 90° and arms crossed over the chest. It was timed after the participant bent their trunk so that both elbows met the front of their thighs and when both elbows left the thighs. Trunk extension muscle endurance was assessed in the prone position with the pelvis aligned with the edge of
International Journal of Sports Physical Therapy
Effects of Repetitive Pitching on Trunk Muscle Endurance and Thoracic and Shoulder Kinematics
1. Repetitive throwing task and experimental protocol
The repetitive throwing task was conducted for nine innings with 15 pitches per inning. Trunk muscle endurance was measured before and after the repetitive throwing task. The throwing motion was measured in the first, seventh, eighth, and ninth innings.

MOTION ANALYSIS
the bed and arms crossed over the chest. The participants kept their trunk parallel to the floor and the time until failure to preserve this trunk position. The trunk lateral flexion muscle endurance was measured in the side-lying position, with the shoulder abducted at 90° and elbow flexed at 90°. Participants maintained a straight position, and the duration between failures to maintain these postures failures were recorded.
Throwing motions were measured using a three-dimensional motion analysis system (Vicon MX; Vicon Motion Systems Ltd., London, UK), which utilizes nine infrared strobe cameras and two force plates (BP400600-OP-2KSTT; Advanced Mechanical Technology, Inc., Watertown, MA, USA). Data were captured at 1000Hz, and force plate data were collected at 1000Hz. Thirty-nine reflective markers were fixed to anatomic landmarks according to the PlugIn Gait model (Vicon Motion Systems Ltd.) (spinous process of the 7th cervical vertebra, spinous process of the 10th thoracic vertebra, sternal notch, xiphoid process, right scapula, bilateral anterior/posterior head, acromioclavicular joint, lateral upper arm, lateral humeral epicondyle, lateral forearm, radial/ulnar styloid, second metacarpal head, anterior/posterior superior iliac spine, lateral thigh, lateral femoral condyle, lateral shank, lateral malleoli, second metatarsal head, and calcaneus). The thoracic angles (anterior/posterior tilt, throwing/nonthrowing side lateral tilt, and nonthrowing/throwing side rotation) and shoulder angles (horizontal adduction/abduction, abduction/adduction, and internal/external rotation) at stride foot contact during the early cocking phase (SFC) and at the maximum shoulder external rotation position during the late cocking phase (MER) were calculated based on the Vicon Plug-In Gait model.23 The SFC was defined as the instant when the vertical ground reaction force from the nonthrowing side foot exceeded 10 N, and the MER was determined using the joint angle data.24 Marker trajectory data were low-pass filtered using a fourth-order Butterworth filter with a cutoff frequency set at 13.4 Hz.25 The axes were defined as fol-
 Figure
 2. Laboratory setup
The distance from the pivot foot position to the target was set at 3 m. The pivot foot position was on the force plate located at the back.
Figure
Figure 2. Laboratory setup
The distance from the pivot foot position to the target was set at 3 m. The pivot foot position was on the force plate located at the back.
Effects of Repetitive Pitching on Trunk Muscle Endurance and Thoracic and Shoulder Kinematics International Journal of Sports Physical Therapy
lows: the Y-axis extended toward the pitch, the X-axis extended from the first base toward the third base and was orthogonal to the Y-axis, and the Z-axis was perpendicular to both the Y- and X-axes. The thoracic angle was defined as the absolute angle of the thoracic segment to the laboratory axis (Figure 4). The shoulder adduction angle was defined as the angle between the thoracic segment and the upper arm segment.
STATISTICAL ANALYSIS
IBM SPSS Statistics, version 23 (IBM Corp., Armonk, NY, USA) was used for statistical analysis. Shapiro and Wilk’s W-statistic was used to screen all data for normality of distribution. The paired t-test or Wilcoxon signed-rank test was used to compare trunk muscle endurance before and after throwing, depending on whether normality was present or not. The changes in kinematics were analyzed in innings 7, 8, and 9, depending on normality, and the significance level was adjusted by Bonferroni analysis for multiple comparisons. Statistical significance was set at p < 0.05. Effect sizes and 95% (CI) between each measure were also calculated. Effect sizes (Cohen’s d) using the paired t-test were rated small (0.20≤d<0.50), moderate (0.50≤d<0.80), and large (d ≥ 0.80).26 Effect sizes (r) using the Wilcoxon signed-rank test were rated small (0.10 ≤ r < 0.30), moderate (0.30 ≤ r < 0.50), and large (r ≥ 0.50).26
RESULTS
Twelve athletes participated in this study (mean age, 22.8 ± 2.9 years; mean body mass, 67.5 ± 8.7 kg; mean height, 170.4 ± 5.4 cm; mean experience, 13.6 ± 1.9 years) (Table 1).
Changes in the trunk muscle endurance before and after repetitive throwing are shown in Table 2. Endurance of the trunk flexors [p = 0.001, d = 1.10 (95% CI: 3.8,10.6)], extensors [p = 0.002, d = 1.30 (95% CI: 3.7,12.8)], lateral flexors on the throwing side [p < 0.001, d = 1.11 (95% CI: 6.0,11.7)], and lateral flexors on the nonthrowing side [p < 0.001, d = 1.76 (95% CI: 7.1,15.7)] was significantly decreased after repetitive throwing.

Table 3 shows thoracic spine and shoulder kinematics at SFC and MER in the first, seventh, eighth, and ninth innings. The thoracic rotation angle at the SFC in the eighth inning was significantly lower than that in the first inning [p = 0.013, d = 0.20 (95% CI: 0.4,3.0)]. The shoulder horizontal adduction angle at MER in the seventh [p = 0.013, d = 0.38 (95% CI: 0.7,4.7)] and ninth [p = 0.004, d = 0.42 (95% CI: 1.1,4.6)] innings was significantly lower than that in the first inning. No differences were found in other variables.
DISCUSSION
Because shoulder injuries related to pitching occur in 13%–35% of baseball players,1–4 and the likelihood of performance recovery is low,5,6 the link between repetitive throwing and shoulder injury has recently come under scrutiny 3,9 There is a lack of consensus agreement on specific changes that repetitive throwing might cause in shoulder kinematics.11–13 While the most agree that good trunk function is essential in controlling shoulder kinematics, the changes in thoracic kinematics and trunk muscle strength related to repetitive pitching are unclear 15 The results of the current study reveal that the trunk muscle endurance
Figure 3. Trunk muscle endurance assessment
a. Trunk flexion muscle endurance; b. trunk extension muscle endurance; c. trunk lateral flexion muscle endurance
Effects
International Journal of Sports Physical Therapy
of Repetitive Pitching on Trunk Muscle Endurance and Thoracic and Shoulder Kinematics
a. Coordinate system; b. definition of thoracic rotation
CL, laboratory coordinate system; CT, thoracic coordinate system.
XL, X-axis of CL; YL, Y-axis of CL; ZL, Z-axis of CL
The thoracic angle was defined as an absolute angle with respect to a coordinate system, with the flat floor in the laboratory as a reference plane. The rotation to the nonthrowing side was taken as a positive value for the rotation angle of the thoracic (In the case of right-handed throws, the left rotation was taken as a positive value).
line, Mullaney et al.27 showed that shoulder internal rotation strength decreased after about 100 pitches, whereas Yanagisawa and Taniguchi19 showed that hip adduction and abduction strength decreased after 117 pitches. Although the body segments assessed varied, the current study conforms to previous reports.
Table
Data are presented as mean ± standard deviation.
diminished and thoracic rotation and shoulder horizontal plane kinematics were altered by repetitive throwing.

Despite studies on how shoulder and hip muscle function changes when throwing repeatedly,19,27 variations in trunk muscle function have not yet been examined. In this
Hirashima et al.28 examined the rectus abdominis and external oblique muscles activity during throwing using surface electromyography. They showed that the external oblique muscles on the nonthrowing side were active in inhibiting early thoracic rotation during the early cocking phase. In contrast, the external oblique muscles on the throwing side were active to direct the thorax toward the throwing direction during the late cocking phase. However, the rectus abdominis muscle was shown to be active immediately before ball release. The paraspinal muscles have been described as active from SFC to ball release for postural control of the trunk.29 Based on these observations, the authors of the current study hypothesized that abdominals and trunk extensors were engaged to control the thoracic movement during each phase of throwing and that repeated throwing reduced trunk muscle endurance.
Early thoracic rotation at the SFC is one of the thoracic kinematics during throwing that should be focused on since it is frequently linked to shoulder injury.16,17 Although trunk muscle endurance decreases occurred in this trial, the thoracic rotation angle to the nonthrowing side at the SFC did not increase. In healthy participants, the decrease in trunk muscle endurance might not necessarily lead to poor trunk motion, such as early thoracic rotation. However, the thoracic rotation angle at the SFC increased toward the throwing side in the eighth inning. The variations observed in this study do not have therapeutic relevance
Figure 4. Coordinate system for the thoracic segment and definition of thoracic rotation
Mean ± SD Range Age (years) 22.8 ± 2.9 20–28 Body mass (kg) 67.5 ± 8.7 57–85 Height (cm) 170.4 ± 5.4 165–180 Experience (years) 13.6 ± 2.9 11–16
Table 1. Characteristics of the participants (n = 12)
SD, standard deviation
Variable Before After pvalue Trunk muscle endurance (s) Flexion 22.7 ± 7.3 15.5 ± 5.7 0.001 Extension 32.9 ± 7.2 24.7 ± 5.3 0.002 Lateral flexion in the throwing side 23.9 ± 8.4 15.0 ± 7.6 <0.001 Lateral flexion in the nonthrowing side 25.9 ± 8.1 14.5 ± 4.3 <0.001
2. Data regarding trunk muscle endurance before and after repetitive throwing
Effects of Repetitive Pitching on Trunk Muscle Endurance and Thoracic and Shoulder Kinematics International Journal of Sports Physical Therapy
Data are presented as mean ± standard deviation and medians and interquartile. [] indicates interquartile.
Each variable was compared in the 1st vs. 7th inning, 1st vs. 8th inning, and 1st vs. 9th inning.
MER = maximum external rotation during the late cocking phase; SFC = stride foot contact during the early cocking phase
because no reports demonstrate a connection between the changes in thoracic kinematics exhibited herein and shoulder injury
The shoulder horizontal adduction angle at MER dropped in the seventh and ninth innings. However, the effect size for the change in shoulder horizontal adduction angle with recurrent throwing was small in this study Several studies have focused on how repetitive throwing affects the shoulder’s horizontal adduction angle. Chou et al.12 showed that 100 pitches increased the shoulder horizontal adduction angle at the MER in top-level high school baseball players. Conversely, Escamilla et al.13 showed that 105–135 repetitive throws did not change the shoulder horizontal adduction angle in Division I college baseball players. Considering factors that lead to a decrease in the shoul-
der horizontal adduction angle at MER, Mullaney et al.27 reported that the shoulder internal rotation strength decreased after 100 pitches. Additionally, Dale et al.18 showed that fatigue of the shoulder internal rotator muscles began even after 60 pitches. Throwing repeatedly is likely to reduce the shoulder internal rotation strength because the subscapularis, pectoralis major, and latissimus dorsi muscles are very active from the late cocking phase to the acceleration period.30 Jobe31 considered that a decrease in the function of the shoulder anterior components may contribute to a decrease in the shoulder horizontal adduction angle during the late cocking phase. Furthermore, of the subscapularis, pectoralis major, and latissimus dorsi muscles, the subscapularis and pectoralis major are thought to contribute to the maintaining of the glenohumeral joint
Inning 1st 7th 8th 9th SFC Thoracic angle (degrees) Anterior tilt p-value 2.7 ± 9.3 −3.5 ± 6.7 2.0 ± 10.4 1.5 ± 9.6 0.073 0.836 0.702 Lateral tilt p-value −4.9 ± 6.8 −1.9 ± 9.2 −6.8 ± 5.8 −4.8 ± 5.7 0.424 0.122 0.971 Rotation p-value −13.7 ± 8.7 −15.5 ± 8.8 −15.4 ± 8.3 −14.5 ± 10.6 0.017 0.013 0.541 Shoulder angle (degrees) Horizontal adduction p-value −26.7 ± 15.8 −29.8 ± 14.8 −28.8 ± 15.4 −28.2 ± 15.0 0.125 0.323 0.422 Abduction p-value 75.7 ± 18.4 74.3 ± 17.4 73.4 ± 17.0 74.5 ± 17.3 0.443 0.352 0.595 Internal rotation p-value −24.7 [−48.9, −13.0] −19.0[−31.7,3.7] −12.0[−47.3,6.4] −20.4[−39.3,−4.2] 0.019 0.041 0.638 MER Thoracic angle (degrees) Anterior tilt p-value −4.2 ± 20.6 11.2 ± 15.8 9.2 ± 22.0 13.9 ± 17.1 0.075 0.118 0.033 Lateral tilt p-value 18.3 ± 7.9 19.4 ± 12.1 18.5 ± 8.3 18.7 ± 11.0 0.791 0.892 0.902 Rotation p-value 100.4 ± 6.9 102.3 ± 10.4 100.5 ± 6.6 99.7 ± 6.9 0.447 0.970 0.636 Shoulder angle (degrees) Horizontal adduction p-value 9.2 ± 6.7 6.6 ± 7.0 7.0 ± 6.5 6.4 ± 6.6 0.013 0.035 0.004 Abduction p-value 97.9 ± 9.4 98.4 ± 9.9 98.7 ± 10.6 98.4 ± 10.7 0.563 0.475 0.655 Internal rotation p-value −147.9 ± 14.7 −149.8 ± 15.0 −150.2 ± 15.5 −150.6 ± 16.4 0.146 0.122 0.031
Table 3. Thoracic and shoulder kinematics in each inning
International Journal of Sports Physical Therapy
Effects of Repetitive Pitching on Trunk Muscle Endurance and Thoracic and Shoulder Kinematics
horizontal adduction position.30 However, although there were no changes in thoracic kinematics affecting shoulder kinematics in this study, a deficit in muscle function of the anterior shoulder components, such as the subscapularis and pectoralis major muscles, may lead to a change in the shoulder horizontal plane kinematics at MER.
A decreased shoulder horizontal adduction angle at MER is closely associated with shoulder injuries and is a risk factor for posterior superior impingement syndrome.31,32 Posterior superior impingement syndrome is a phenomenon in which the rotator cuff is trapped between the humeral head and glenoid fossa during the late cocking phase.31,32 Mihata et al.33 reproduced the MER position in cadaveric shoulders and reported that the pressure between the greater tuberosity and glenoid increased as the shoulder horizontal adduction angle decreased. In this study, the shoulder horizontal adduction angle at MER decreased in the seventh and ninth innings, suggesting that pitching >100 pitches may contribute to increased mechanical stress within the shoulder.
This study has some limitations. First, the trunk muscle endurance was evaluated using a method that is easy to use in clinical and field situations. However, the technique used in this study could not deny subjectivity In the future, we should employ a more accurate method of assessment. Second, the throwing motion function was only assessed during specific innings. Japanese starting pitchers often throw more than seven innings, but in the United States, they barely reach this number. Whether the throwing motion will change in less than seven innings needs to be determined. Therefore, assessing pitching data in every inning would be relevant, particularly in American baseball. Third, based on previous reports, the authors speculate that the decreased shoulder horizontal adduction angle at MER increases mechanical stress within the shoulder 31–33
This study only showed changes in shoulder motion with repetitive throwing in healthy participants, and whether a healthy athlete whose shoulder motion is altered by repetitive throwing will develop shoulder injuries in the future remains unknown. If the relationship between changes in shoulder motion with repeated throwing and the incidence of shoulder injury can be clarified, this may lead to preventive actions for future injuries.
CONCLUSION
The results of this study indicate that with 135 repeated throws trunk muscular endurance was reduced. In addition, thoracic rotation at SFC and shoulder horizontal plane at MER kinematics were altered by repetitive throwing.
FUNDING
This study was not funded.
DISCLAIMERS
No potential conflict of interest was reported by the authors.
ACKNOWLEDGMENTS
The authors would like to thank all the individuals who participated in this study. The authors would like to thank Enago (www.enago.jp) for the manuscript review and editing support.
Submitted: August 27, 2022 CDT, Accepted: February 13, 2023 CDT
This is an open-access article distributed under the terms of the Creative Commons Attribution 4.0 International License (CCBY-NC-4.0). View this license’s legal deed at https://creativecommons.org/licenses/by-nc/4.0 and legal code at https://creativecommons.org/licenses/by-nc/4.0/legalcode for more information.
International Journal of Sports Physical Therapy
Effects of Repetitive Pitching on Trunk Muscle Endurance and Thoracic and Shoulder Kinematics
REFERENCES
1. Hibberd EE, Oyama S, Myers JB. Rate of upper extremity injury in high school baseball pitchers who played catcher as a secondary position. J Athl Train. 2018;53(5):510-513. doi:10.4085/1062-6050-322-16
2. Kanematsu Y, Matsuura T, Kashiwaguchi S, et al. Epidemiology of shoulder injuries in young baseball players and grading of radiologic findings of Little Leaguer’s shoulder J Med Invest 2015;62(3.4):123-125. doi:10.2152/jmi.62.123
3. Lyman S, Fleisig GS, Andrews JR, Osinski ED Effect of pitch type, pitch count, and pitching mechanics on risk of elbow and shoulder pain in youth baseball pitchers. Am J Sports Med 2002;30(4):463-468. doi:1 0.1177/03635465020300040201
4. Lyman S, Fleisig GS, Waterbor JW, et al. Longitudinal study of elbow and shoulder pain in youth baseball pitchers. Med Sci Sports Exerc 2001;33(11):1803-1810. doi:10.1097/00005768-20011 1000-00002
5. Peduzzi L, Grimberg J, Chelli M, et al. Internal impingement of the shoulder in overhead athletes: retrospective multicentre study in 135 arthroscopically-treated patients. Orthop Traumatol Surg Res. 2019;105(8):S201-S206. doi:10.1016/j.otsr.2 019.09.006
6. Fedoriw WW, Ramkumar P, McCulloch PC, Lintner DM. Return to play after treatment of superior labral tears in professional baseball players. Am J Sports Med 2014;42(5):1155-1160. doi:10.1177/0363546514 528096
7. Chalmers PN, Sgroi T, Riff AJ, et al. Correlates with history of injury in youth and adolescent pitchers. Arthroscopy. 2015;31(7):1349-1357. doi:10.1016/j.arth ro.2015.03.017
8. Erickson BJ, Chalmers PN, Bush-Joseph CA, Romeo AA. Predicting and preventing injury in Major League Baseball. Am J Orthop (Belle Mead NJ). 2016;45:152-156.
9. Erickson BJ, Sgori T, Chalmers PN, et al. The impact of fatigue on baseball pitching mechanics in adolescent male pitchers. Arthroscopy 2016;32(5):762-771. doi:10.1016/j.arthro.2015.11.051
10. Major League Baseball. Pitch Smart. Accessed February 18, 2022. https://www.mlb.com/pitch-smar t/pitching-guidelines
11. Murray TA, Cook TD, Werner SL, Schlegel TF, Hawkins RJ. The effects of extended play on professional baseball pitchers. Am J Sports Med. 2001;29(2):137-142. doi:10.1177/03635465010290020 501
12. Chou PPH, Huang YP, Gu YH, et al. Change in pitching biomechanics in the late-inning in Taiwanese high school baseball pitchers. J Strength Cond Res. 2015;29(6):1500-1508. doi:10.1519/jsc.0000 000000000791
13. Escamilla RF, Barrentine SW, Fleisig GS, et al. Pitching biomechanics as a pitcher approaches muscular fatigue during a simulated baseball game. Am J Sports Med 2007;35(1):23-33. doi:10.1177/0363 546506293025
14. Braun S, Kokmeyer D, Millett PJ. Shoulder injuries in the throwing athlete. J Bone Joint Surg Am 2009;91(4):966-978. doi:10.2106/jbjs.h.01341
15. Wilk KE, Macrina LC, Cain EL, Dugas JR, Andrews JR. Rehabilitation of the overhead athlete’s elbow Sports Health. 2012;4(5):404-414. doi:10.1177/194173 8112455006
16. Aguinaldo AL, Buttermore J, Chambers H. Effects of upper trunk rotation on shoulder joint torque among baseball pitchers of various levels. J Appl Biomech 2007;23(1):42-51. doi:10.1123/jab.23.1.42
17 Douoguih WA, Dolce DL, Lincoln AE. Early cocking phase mechanics and upper extremity surgery risk in starting professional baseball pitchers. Orthop J Sports Med 2015;3(4):232596711558159. do i:10.1177/2325967115581594
18. Dale RB, Kovaleski JE, Ogletree T, Heitman RJ, Norrell PM. The effects of repetitive overhead throwing on shoulder rotator isokinetic work-fatigue. N Am J Sports Phys Ther 2007;2:74-80.
19. Yanagisawa O, Taniguchi H. Changes in lower extremity function and pitching performance with increasing numbers of pitches in baseball pitchers. J Exerc Rehabil 2018;14(3):430-435. doi:10.12965/jer.1 836196.098
20. Ito T, Shirado O, Suzuki H, Takahashi M, Kaneda K, Strax TE. Lumbar trunk muscle endurance testing: an inexpensive alternative to a machine for evaluation. Arch Phys Med Rehabil 1996;77(1):75-79. doi:10.1016/s0003-9993(96)90224-5
Effects of Repetitive Pitching on Trunk Muscle Endurance and Thoracic and Shoulder Kinematics International Journal of Sports Physical Therapy
21. McGill SM, Childs A, Liebenson C. Endurance times for low back stabilization exercises: clinical targets for testing and training from a normal database. Arch Phys Med Rehabil. 1999;80(8):941-944. doi:10.1016/s0003-9993(99)90087-4
22. Myrick KM, Pallone AS, Feinn RS, Ford KM, Garbalosa JC. Trunk muscle endurance, flexibility, stride foot balance, and contralateral trunk lean in collegiate baseball pitchers. J Strength Cond Res 2019;33(10):2641-2647. doi:10.1519/jsc.00000000000 03292
23. Miyazaki S, Yamako G, Totoribe K, et al. Shadow pitching deviates ball release position: kinematic analysis in high school baseball pitchers. BMC Sports Sci Med Rehabil 2021;13(1):26. doi:10.1186/s13102-0 21-00255-7
24. Oyama S, Yu B, Blackburn JT, Padua DA, Li L, Myers JB. Effect of excessive contralateral trunk tilt on pitching biomechanics and performance in high school baseball pitchers. Am J Sports Med. 2013;41(10):2430-2438. doi:10.1177/03635465134965 47
25. Escamilla RF, Fleisig GS, Barrentine SW, Zheng N, Andrews JR. Kinematic comparisons of throwing different types of baseball pitches. J Appl Biomech 1998;14(1):1-23. doi:10.1123/jab.14.1.1
26. Cohen J. Statistical Power Analysis for the Behavioral Science 2nd ed. Lawrence Erlbaum Associates, Inc; 1988.
27 Mullaney MJ, McHugh MP, Donofrio TM, Nicholas SJ. Upper and lower extremity muscle fatigue after a baseball pitching performance. Am J Sports Med. 2005;33(1):108-113. doi:10.1177/0363546504266071
28. Hirashima M, Kadota H, Sakurai S, Kudo K, Ohtsuki T. Sequential muscle activity and its functional role in the upper extremity and trunk during overarm throwing. J Sports Sci. 2002;20(4):301-310. doi:10.1080/02640410275357607
29. Watkins RG, Dennis S, Dillin WH, et al. Dynamic EMG analysis of torque transfer in professional baseball pitchers. Spine 1989;14(4):404-408. doi:10.1 097/00007632-198904000-00011
30. DiGiovine NM, Jobe FW, Pink M, Perry J. An electromyographic analysis of the upper extremity in pitching. J Shoulder Elbow Surg 1992;1(1):15-25. do i:10.1016/s1058-2746(09)80011-6
31. Jobe CM. Posterior superior glenoid impingement: expanded spectrum. Arthroscopy 1995;11(5):530-536. doi:10.1016/0749-8063(95)9012 8-0
32. Walch G, Boileau P, Noel E, Donell ST Impingement of the deep surface of the supraspinatus tendon on the posterosuperior glenoid rim: an arthroscopic study J Shoulder Elbow Surg 1992;1(5):238-245. doi:10.1016/s1058-2746(09)8006 5-7
33. Mihata T, McGarry MH, Kinoshita M, Lee TQ Excessive glenohumeral horizontal abduction as occurs during the late cocking phase of the throwing motion can be critical for internal impingement. Am J Sports Med. 2010;38(2):369-374. doi:10.1177/0363546 509346408
1
International Journal of Sports Physical Therapy
Effects of Repetitive Pitching on Trunk Muscle Endurance and Thoracic and Shoulder Kinematics
Elbow Injuries Among MLB Pitchers Increased During Covid-19 Disrupted Season, But Not Other Baseball Injuries
Chelsea Martin1a , Jozef Palasiewicz2 , Jesse Grullon2 , Ellen Shanley2 , Charles Thigpen2 , Daniel Kline2 , Stefan Kluzek3 , Gary Collins4 , Garrett Bullock5
1 Gillings School of Global Public Heath, Department of Epidemiology, UNC Chapel Hill, 2 ATI Physical Therapy, 3 Nuffield Department of Orthopaedics, Rheumatology, and Musculoskeletal Sciences, University of Oxford, Oxford, United Kingdom, 4 Centre for Statistics in Medicine, Nuffield Department of Orthopaedics, Rheumatology, and Musculoskeletal Sciences, University of Oxford, Oxford UK, 5 Department of Orthopaedic Surgery, Wake Forest School of Medicine, Winston-Salem, NC, USA
Keywords: Professional Baseball, Elbow Injuries, Injury Surveillance https://doi.org/10.26603/001c.71359
International Journal of Sports Physical Therapy
Background
The 2020 Major League Baseball Season (MLB) demonstrated season disruptions due to the COVID-19 pandemic. Changes in training and seasonal time frames may be associated with higher rates of injury
Purpose
To use publicly available data to compare injury rates during the 2015-2019 seasons, COVID-19 shortened season (2020), and the 2021 season stratified by body region and position (pitchers versus position players).
Study Design
A retrospective cohort study utilizing publicly available data
Methods
MLB players who competed in 1+ seasons between 2015-2021 were included and stratified by position (pitcher, position player). Incidence rate (IR), reported by 1000 x Athlete-Game Exposures (AGEs), was calculated for each season, and stratified by position and body region. Poisson regressions were performed for all injuries and stratified by position to determine association between season and injury incidence. Subgroup analyses were performed on the elbow, groin/hip/thigh, shoulder
Results
Four thousand, two hundred and seventy-four injuries and 796,502 AGEs across 15,152 players were documented. Overall IR was similar across seasons (2015-2019:5.39; 2020:5.85; 2021:5.04 per 1000 AGEs). IR remained high for the groin/hip/thigh for position players (2015-2019:1.7; 2020:2.0; 2021:1.7 per 1000 AGEs). There was no difference in injury rates between 2015-2019 and 2020 seasons [1.1 (0.9-1.2), p=0.310]. The 2020 season demonstrated a significant increase in elbow injuries [2.7 (1.8-4.0), p<0.001]; when stratified by position, this increase remained significant for pitchers [pitchers: 3.5 (2.1-5.9), p<0.001; position players: 1.8 (0.9-3.6), p=0.073]. No other differences were observed.
Corresponding author:
Chelsea Leonard Martin
ATI Physical Therapy
Gillings School of Global Public Health
Department of Epidemiology, UNC Chapel Hill
Chapel Hill, NC, USA
Tel: (336)309-5017
martinlc@unc.edu; chelsea.martin@atipt.com
Original Research
a
Injuries Among MLB Pitchers Increased During Covid-19 Disrupted Season, But Not Other Baseball Injuries. IJSPT. Published online April 1, 2023:397-408. doi:10.26603/001c.71359
Martin C, Palasiewicz J, Grullon J, et al. Elbow
Conclusion
The groin/hip/thigh demonstrated the highest IR in 2020 among position players across all season time frames, indicating that continued injury mitigation for this region is necessary. When stratified by body region, elbow injury rates among pitchers demonstrated 3.5 times the rate of injury in 2020 compared to previous seasons, impacting injury burden for the most vulnerable body region among pitchers.
Level of Evidence Level III
INTRODUCTION
Major League Baseball (MLB) is the professional baseball league in North America representing 30 teams in the United States and Canada.1 Standard season format consists of six weeks of preseason spring training, 162 game regular season, and a ten team post-season format.1 Over the course of a typical season, injury incidence rates have ranged between 0.7-5.13 per 1000 athlete exposures (AEs) across all positions.2–4 These injuries result in significant league wide missed playing time and monetary losses; previous analyses have estimated the cost of placing players on the disabled list to be between $136-695 million per year between 1998 to 2015.5 Due to the physical and financial burden associated with MLB injuries, baseball stakeholders including coaches, owners, players, and clinicians have sought to mitigate injuries.6 A systematic approach to injury prevention research has been suggested by van Mechelen, beginning with injury surveillance to increase understanding of incidence rate over time.
based on anatomic zones3 versus recommended standardized reporting by body region/area,14 or reported on a single pathology,11 making comparison to previous literature difficult.
7
In contrast to the standard season layout, the 2020 MLB season format was disrupted due to the COVID-19 pandemic. Pre-season spring training was cancelled and four months later resumed in a condensed two-to-three-week format.8 The regular season was condensed to a 60 game schedule over two months, with an expanded 16 team post season schedule. This schedule adjustment increased the number of double headers played within the season and decreased the number of rest days.8 Disruption to pre-season training, inconsistent training regimens, isolation requirements for players who tested positive for COVID-19, decreased equipment access, and increased schedule density8 likely impacted players ability to manage training and playing loads.9 One study investigating injury incidence during the COVID-19 shortened MLB season demonstrated an increased injury incidence rate compared to the previous season (2020 season: 8.66 per 1000 AEs; 2019 season: 5.13 per 1000 AEs).3 Previous studies across multiple professional leagues including the National Basketball Association,10 National Football League,11,12 European professional soccer leagues,13 have also reported an increase in injury rates during the 2020 shortened season. However, most of these studies reported comparisons to a single previous season. Sparse information is available on previous five season data, which may be more representative of injury rate (IR trends), or on the subsequent 2021 season to determine if IR stabilized the following year. Furthermore, previous injury surveillance literature among professional leagues during the 2020 COVID-19 season reported injuries
One way to identify injury incidence among MLB players is through publicly available data.15–17 Publicly available data improves transparency, and allows for collaboration among organizations to improve data robustness and distribution among stakeholders.18,19 This transparency and collaboration amongst organizations is essential to promote an open science environment.20–22 An open science approach allows researchers to independently assess, reproduce, and perform studies for further independent research with data that is easily accessible.20,22 Publicly available data is an example of data that is in line with this open science recommendation, and has been utilized across professional leagues with a high reporting reliability 15,23 Publicly available data is accessed through a computer iterative repeatable process which involves an automated collection of information from webpages, an efficient method of data extraction.15,24 This process improves repeatability, and offers the potential for collaborative league wide injury risk identification and injury mitigation programs.15 The primary aim of this study was to use publicly available data to compare injury rates during the 2015-2019 seasons, COVID-19 shortened season (2020), and the 2021 season stratified by body region and position (pitchers versus position players).
METHODS STUDY DESIGN
This was a retrospective cohort study among MLB players utilizing publicly available data through a computer iterative reproducible method18 that has been previously described.15,17 Two data repositories were used to create a data set for this study (Supplemental File 1). The data can be accessed through the Open Science Framework data repository https://osf.io/5akxt/. MLB stakeholders (coaches, sports medicine clinicians, and performance coaches) were included to aid in development of the research question and clinical interpretability of the results. This study was reported following the Strengthening the Reporting of Observational Studies in Epidemiology for Sport Injury and Illness Surveillance (STROBE-SIIS) guideline.14
Elbow Injuries Among MLB Pitchers Increased During Covid-19 Disrupted Season, But Not Other Baseball Injuries International Journal of Sports Physical Therapy
PARTICIPANTS
Participants were MLB players 18 years or older who competed in at least one season between 2015 to 2021 seasons. For subgroup analyses, players were labeled as a pitcher (starters, middle relievers, relievers) or position player (infield, outfield, catcher, designated hitter) for injury incidence comparisons.
INJURY CLASSIFICATION
Injuries were included in this study that occurred from the first game of the regular season to the last game of the post season during team sanctioned events, including games or practices. Injuries that occurred during the preseason or off-season were not included due to inconsistencies observed in the data and inability to corroborate if injuries occurred during team sanctioned events. Injury was defined as any tissue damage or derangement of normal physical function that occurred during a training session or competition that resulted in time loss of one or more days.25 Injury was defined based on a specific joint or body segment as recommended by STROBE-SIIS body region and area guidelines.14
ATHLETE EXPOSURE
Seasons were defined as 2015-2019 season, COVID-19 shortened season (2020), and 2021 season. Athlete exposure was calculated based on game exposure (AGE) only as determining practice exposure was not possible with this data set. For the 2015-2019 seasons, AGEs were calculated based on all 30 MLB teams playing 162 regular season games per season, 25-man active roster, over the five seasons.3,4 For 2020 season, rule changes to roster size took effect two weeks into the season.3 Thus, AGEs were calculated based on 30 MLB teams playing 60 regular season games, a 30 man roster the first two weeks, 28-man roster the second two weeks, and a 26-man roster for the remaining weeks of play 3,4,8 For 2021 season, AGEs were calculated based on 30 MLB teams playing 162 regular season games per season and a 26-man roster. For all seasons, a postseason exposure adjustment was included to account for post season injuries based on the number of playoff games that occurred each season, with a reduction in the number of active players as teams were eliminated.26
DATA EXTRACTION, DATA REDUCTION AND EXTERNAL VALIDATION
For a detailed description of data repository used refer to Supplemental File 1. Data were extracted on November 3, 2021. Data extraction, data reduction, and external validation used have been previously described.15,17,25 External validation was performed by two independent examiners using a number generator, randomly selected 100 data points from the data set. External validation was performed for date of injury and injury type for each selected player from other publicly available websites (i.e., ESPN.com, mlb.com, team websites). 83% of randomly selected records
were confirmed in outside reports demonstrating excellent reliability for injury reporting. Refer to Supplemental File 1 and 2 for detailed methods and data extraction code.
STATISTICAL ANALYSES
Injury and illness count data was converted to seasonal incidence rate (IR). IR was calculated by sum of injuries and divided by the sum of player-games, multiplied by 1000 x Athlete-Game Exposures (AGEs)17 and adjusted for number of regular and post-season games each year 26 IR for overall injuries for in-season time frame was calculated by adjusting for monthly AGEs. Rate ratios (RR) were calculated by specific position incidence rate (pitcher or position player) and divided by all other position incidence rate for pre 2015-2019 seasons, COVID-19 shortened season (2020), and 2021 season. A Poisson Regression was performed to investigate the potential differences in injury rates between season time frames (2015-2019; 2020; 2021). AGE was used as an offset for the model to control for differences in athlete exposure each year Poisson models were performed for all injuries and stratified by position (pitchers and position players). Additional exploratory models were performed on the most commonly injured body regions, including the shoulder, elbow, and groin/hip/thigh region and stratified by position. All analyses were performed in R version 4.1.3 (R Core Team, 2020) using the rvest, tm, and xm12 packages.
RESULTS INJURY INCIDENCE ALL POSITIONS
Between 2015 to 2021 seasons, 4,274 injuries were documented across 796,502 AGEs. The 2015-2019 seasons incidence rate was 5.4 per 1000 AGEs overall, followed by an increase to 5.9 per 1000 AGEs during the 2020 COVID-19 shortened season, before decreasing to 5.0 per 1000 AGEs during the 2021 season (Table 1). By month, the IR peaked and was higher during the first two months in 2020 (month 1: 8.2 per 1000 AGEs, month 2: 7.9 per 1000 AGEs), compared to 2015-2019 (month 1: 4.5 per 2000 AGEs, month 2: 5.8 per 1000 AGEs) and 2021 (month 1: 5.6 per 1000 AGEs, month 2: 7.5 per 1000 AGEs) (Figure 1). Compared to previous years, the IR remained elevated in month 1 (5.6 per 1000 AGEs), and month 2 (7.5 per 1000 AGEs) compared to first two months in 2015-2019 (Figure 1).
INJURY INCIDENCE AMONG PITCHERS
For pitchers the highest IR was observed in 2020 at 2.2 per 1000 AGEs compared to the 2015-2019 (1.9 per 1000 AGEs), and 2021 (1.0 per 1000 AGEs) seasons. By body region, the highest elbow injury IR of 0.7 per 1000 AGEs compared to 2015-2019 (elbow: 0.2 per 1000 AGEs), and 2021 (elbow: 0.1 per 1000 AGEs) seasons (Table 2). Pitchers demonstrated an increased risk of 3.5 (95% CI: 2.1, 6.0) of sustaining an elbow injury during the COVID-19 shortened season compared to the previous five seasons (Supplemental File 3).
Elbow Injuries Among MLB Pitchers Increased During Covid-19 Disrupted Season, But Not Other Baseball Injuries International Journal of Sports Physical Therapy
INJURY INCIDENCE AMONG POSITION PLAYERS
For position players the highest overall IR was observed in 2020 at 9.5 injuries per 1000 AGEs compared to 2015-2019 (9.1 per 1000 AGEs), and 2021 (9.0 per 1000 AGEs) seasons. During the 2020 season, the groin/hip/thigh (2.0 per 1000 AGEs) was the most commonly injured body regions during the COVID-19 shortened season; these IRs were elevated compared to the 2015-2019 (groin/hip/thigh: 1.7 per 1000 AGEs) and 2021 (groin/hip/thigh: 1.7 per 1000 AGEs) seasons (Table 3). Although elbow injuries were less commonly reported in position players, elbow injuries were observed
the highest in 2020; position players, with a RR of 1.8 (95% CIs: 1.0-3.6) times more likely to acquire an elbow injury during the 2020 shortened season compared to 2015-2019; this risk remained elevated in 2021 compared to 2015-2019 season (1.6, 95% CIs: 1.0, 2.6) (Supplemental File 3).
POISSON REGRESSION
Across all injuries and positions, Poisson regression results revealed no difference in injury rates between 2015-2019 and 2020 seasons (1.1 95% CIs: 0.9, 1.2, p = 0.310) but a reduction occurred in the 2021 season compared to the

Position Seasons Number of Injuries Incidence Rateb 95% CIs All Positions 2015-2019 3325 5.39 5.21, 5.58 2020 303 5.85 5.19, 6.51 2021 646 5.04 4.65, 5.42 Pitchers 2015-2019 593 1.85 1.70, 2.00 2020 57 2.20 1.63, 2.77 2021 63 0.98 0.74, 1.22 Position Players 2015-2019 2698 9.12 8.77, 9.46 2020 245 9.47 8.28, 10.65 2021 583 9.09 8.35, 9.83 b Incidence rate was calculate per 1000 Athlete Game Exposures
Table 1. Overall Injury Incidence Rate
1000 Athlete
Figure 1. Overall Injury Incidence Rate by Month
Incidence rate was calculated per
Game Exposures; AGE: Athlete Game Exposures
Elbow Injuries Among MLB Pitchers Increased During Covid-19 Disrupted Season, But Not Other Baseball Injuries International Journal of Sports Physical Therapy
Table 2. Pitchers Injury Incidence Rate by Body Region
b Incidence rate was calculate per 1000 Athlete Game Exposures
2015-2019 seasons (0.9, 95% CIs: 0.8, 1.0 p = 0.046). The 2020 season saw an increase in elbow injuries during the 2020 season compared to 2015-2019 seasons (2.7, 95% CIs:
p <0.001); when stratified by position, this increase
Body Region Season Number of Injuries Incidence Rateb 95% CIs Ankle 2015-2019 13 0.04 0.02, 0.06 2020 1 0.04 -0.04, 0.11 2021 0 0.00 0, 0 Lower Leg 2015-2019 15 0.05 0.02, 0.07 2020 2 0.08 -0.03, 0.18 2021 3 0.05 -0.01, 0.10 Knee 2015-2019 29 0.09 0.06, 0.12 2020 2 0.08 -0.03, 0.18 2021 4 0.06 0.00, 0.12 Leg 2015-2019 15 0.05 0.02, 0.07 2020 0 0.00 0, 0 2021 1 0.02 -0.01, 0.05 Groin/Hip/Thigh 2015-2019 66 0.21 0.16, 0.26 2020 4 0.15 0.00, 0.31 2021 7 0.11 0.03, 0.19 Hand 2015-2019 46 0.14 0.10, 0.18 2020 4 0.15 0.00, 0.31 2021 5 0.08 0.01, 0.15 Wrist 2015-2019 9 0.03 0.01, 0.05 2020 0 0.00 0, 0 2021 1 0.02 -0.01, 0.05 Forearm 2015-2019 25 0.08 0.05, 0.11 2020 4 0.15 0.00, 0.31 2021 2 0.03 -0.01, 0.07 Elbow 2015-2019 63 0.20 0.15, 0.25 2020 18 0.70 0.37, 1.02 2021 4 0.06 0.00, 0.12 Upper Arm 2015-2019 19 0.06 0.03, 0.09 2020 2 0.08 -0.03, 0.18 2021 4 0.06 0.00, 0.12 Shoulder 2015-2019 76 0.24 0.18, 0.29 2020 3 0.12 -0.02, 0.25 2021 7 0.11 0.03, 0.19 Head/Neck 2015-2019 36 0.11 0.08, 0.15 2020 3 0.12 -0.02, 0.25 2021 2 0.03 -0.01, 0.07 Trunk/Back/Buttock 2015-2019 91 0.28 0.23, 0.34 2020 11 0.42 0.17, 0.68 2021 4 0.06 0.00, 0.12
1.8,
Elbow Injuries Among MLB Pitchers Increased During Covid-19 Disrupted Season, But Not Other Baseball Injuries International Journal of Sports Physical Therapy
4.0,
Table 3. Position Player Injury Incidence Rate by Body Region
b Incidence rate was calculate per 1000 Athlete Game Exposures
only remained significant for pitchers in 2020 (pitchers: 3.5 95% CIs: 2.1, 6.0, p < 0.001; position players: 1.8 95% CI:
Body Region Season Number of Injuries Incidence Rateb 95% CIs Ankle 2015-2019 110 0.37 0.30, 0.44 2020 8 0.31 0.10, 0.52 2021 24 0.37 0.22, 0.52 Lower Leg 2015-2019 91 0.31 0.24, 0.37 2020 9 0.35 0.12, 0.57 2021 29 0.45 0.29, 0.62 Knee 2015-2019 258 0.87 0.77, 0.98 2020 18 0.70 0.37, 1.02 2021 48 0.75 0.54, 0.96 Leg 2015-2019 48 0.16 0.12, 0.21 2020 5 0.19 0.024, 0.36 2021 24 0.37 0.22, 0.52 Groin/Hip/Thigh 2015-2019 498 1.68 1.54, 1.83 2020 51 1.97 1.43, 2.51 2021 110 1.71 1.39, 2.04 Hand 2015-2019 282 0.95 0.84, 1.06 2020 26 1.00 0.62, 1.39 2021 57 0.89 0.66, 1.12 Wrist 2015-2019 149 0.50 0.42, 0.58 2020 18 0.70 0.37, 1.02 2021 38 0.59 0.40, 0.78 Forearm 2015-2019 36 0.12 0.08, 0.16 2020 3 0.12 -0.02, 0.24 2021 8 0.12 0.04, 0.21 Elbow 2015-2019 62 0.21 0.16, 0.26 2020 10 0.39 0.15, 0.63 2021 21 0.33 0.19, 0.47 Upper Arm 2015-2019 15 0.05 0.03, 0.08 2020 1 0.04 -0.04, 0.11 2021 4 0.06 0.00, 0.12 Shoulder 2015-2019 144 0.49 0.41, 0.57 2020 11 0.42 0.17, 0.68 2021 22 0.34 0.20, 0.49 Head/Neck 2015-2019 203 0.69 0.59, 0.78 2020 12 0.46 0.20, 0.73 2021 29 0.45 0.29, 0.62 Trunk/Back/Buttock 2015-2019 415 1.40 1.27, 1.54 2020 41 1.58 1.10, 2.07 2021 94 1.47 1.17, 1.76
Elbow Injuries Among MLB Pitchers Increased During Covid-19 Disrupted Season, But Not Other Baseball Injuries International Journal of Sports Physical Therapy
1.0, 3.6, p = 0.073). No other differences were observed in the shoulder or groin/hip/thigh. Refer to Supplemental File 4 for further Poisson regression analyses results.
DISCUSSION
Injury rates were similar during the COVID-19 shortened season among pitchers and position players compared to the 2015-2019 and 2021 seasons for combined injuries. Specific to body region, pitchers demonstrated the highest IR for the elbow during the 2020 with the elbow demonstrating an increase in 3.5 times the rate compared to the previous five seasons. Among position players, the groin/ hip/thigh was the most commonly injured body region during the COVID-19 shortened season at 2.0 per 1000 AGEs; however, this difference was not significantly different from the pre- COVID-19 seasons.
OVERALL INJURY INCIDENCE
Injury rates increased minimally during the 2020 season, but not to a clinically meaningful level compared to 2015-2019 and 2021 season. Notably, the IR during the first two months of the season demonstrated peak IR that was higher than the first two months of 2015-2019 season IR. During the COVID-19 shortened season, players experienced a delayed and condensed spring training, a period of time in which MLB players are usually able to gradually increase their skill specific workload prior to the regular season.8 Access to training facilities after the postponement of spring training was variable prior to the delayed start of spring training in July 2020.8 Once resumed, spring training was reduced to two to three weeks, less than half the allotted time compared to previous seasons.8 Additionally, a condensed schedule (60 games in two months, versus 162 games in six months) with an expanded post season (16 versus eight teams) occurred, increasing the amount of doubleheaders played in a season with decreased rest days.8 Furthermore, COVID-19 isolation protocols restricted players from playing or training once they tested positive to prevent the spread COVID-19, likely having a de-training effect on individual players.8 Although protocols were in place throughout the league, abrupt cancellations due to COVID-19 outbreaks amongst teams likely impacted training regimens and game schedules.8 Despite these abrupt changes in routine among players, overall injury rates were not significantly different based on crude injury rates or the Poisson model results. Only one study was identified that investigated IR changes among MLB players comparing 2019 and 2020 IR across multiple body regions.3 Platt BN et al confirmed the current findings that injury rates increased during the COVID-19 shortened 2020 season compared to previous seasons.3 However, Platt BN et al demonstrated a higher IR in 2020 compared to the current results (8.66 per 1000 AEs versus 5.84 per 1000 AGEs), and regression modeling strategies were not performed impacting the ability to control for variation in athlete exposure for seasonal comparisons. The differences in IR noted may also be due to varying season time frame comparisons (2019, ver-
sus 2015-2019 and 2021) or differences in exposure calculation (AGE versus AE); furthermore, our study accounted for post-season AGEs which may have attributed to our lower IR reported. However, external validation was performed and reported in this study which demonstrated excellent reliability for injury reporting improving clinical interpretability Further studies investigating incidence rates stratified by season time frame and body region are recommended to determine if specific body regions are impacted at varying times of the season by changes to preseason or season formats.
INJURY INCIDENCE AMONG PITCHERS
The elbow demonstrated the highest injury incidence among pitchers during the 2020 season, representing an increase of 3.5 times the rate of the previous five seasons. Elbow injuries often lead to significant disability among MLB pitchers, leading to highest number of days on the MLB Injury List.27 In a 2017 study examining 15 seasons from 1998-2015, 30% of elbow injuries among MLB pitchers were season ending, 28.4% involved ligamentous structures, and pitchers that incurred an elbow injury lead to surgery more often than position players (pitchers: 40% versus position players: 17.6%).27 The baseball pitching motion places substantial forces at the elbow, at upwards of 115 N/m.28–30 The structures at the elbow working to resist these high forces at the elbow are static structures including the ulnar collateral ligament30 working in conjunction with dynamic structures such as the flexor carpi ulnaris, two structures often implicated at the elbow when pathology occcurs.31 Furthermore, kinematic variables including shoulder abduction angle,22 timing and amount of trunk rotation and lateral tilt,28,32 play a role in forces measured at the elbow However, as a pitcher presents with fatigue via acute work load changes, kinematic variable changes have been documented. Electromyographic activation of the flexor carpi ulnaris decreases,31 maximum external rotation decreases, and knee extension at ball release decreases. These kinematic and EMG activation changes likely contribute to the subsequent decrease ball velocity in a single extended pitch outing.33 The influence of fatigue on kinematic variables, change to spring training schedule, and the increased density of games played during the 2020 season may have played a role in the increased incidence rate of elbow injuries observed,8 despite the in season changes to expand roster size during the 2020 season.3 Sports clinicians should carefully monitor pitchers for changes in pitch volume that acutely increase or are sustained for longer bouts of time and implement appropriate recovery and injury mitigation strategies to minimize elbow injuries.
INJURY INCIDENCE AMONG POSITION PLAYERS
During the COVID-19 shortened season, the groin/hip/ thigh demonstrated the greatest IR by body region among position players at 2.0 per 1000 AGEs, this body region is often the most commonly reported injury site among position players in previous seasons.34 Previous literature demonstrates a similar AE for combined lower extremity
Elbow Injuries Among MLB Pitchers Increased During Covid-19 Disrupted Season, But Not Other Baseball Injuries International Journal of Sports Physical Therapy
injuries at 2.0 per 1000 AEs.3 Amongst major and minor league players during the 2011-2016 season, hamstring strains were the most commonly reported pathology 34 Other injuries reported among baseball players to this region include extra-articular injuries such as adductor and quadriceps muscle strains or avulsions, and contusions; intra-articular injuries can also occur including labral pathologies and femoral acetabular impingement.35 Groin/ hip/thigh injuries can occur during acute bouts of quick acceleration or deceleration moments during base running or fielding, or via cumulative sport demands of repetitive fielding, throwing, batting, representing longer chronicity of symptoms.35 Although there is an elevation in IR in the groin/hip/thigh region observed during the COVID-19 shortened season compared to previous seasons, the results of the Poisson regression did not demonstrate this to be statistically significant, likely due to the wide and overlapping 95% CIs reported. However, it is notable to consider the potential detraining effects as impacted by density and disruption of the 2020 game schedule and isolation protocols that may have influenced recovery and training strategies contributing to the groin/hip/thigh injuries reported.8 Detraining of type II muscle fibers occur in as little as two weeks of inactivity, and 8% of one rep max strength decreases have been shown after one month of detraining periods.36 These disruptions may have also impacted acute and chronic workload increases compared to previous seasons.37–40 Increased cumulative training workloads have been previously associated with susceptibility to overtraining syndrome9,41 and acute injury25,42 which may have influenced the IR seen in the groin/hip/thigh.
CLINICAL IMPLICATIONS
This study and previous literature provide a framework for injury surveillance, the first step in the sequence of injury prevention recommended by van Mechelen and colleagues.7 Furthermore, this paper informs baseball stakeholders on the resulting injury burden when abrupt changes in season and training occur (i.e. COVID-19 pandemic, seasonal lockouts during negotiations) followed by an accelerated return to sport. Although the differences in overall injury incidence may not be clinically significant, players are at the highest risk for the most vulnerable injuries, particularly the elbow among pitchers, and groin/ hip/thigh injuries among position players. By investigating the 2021 season, which demonstrated decreases in injury incidence, this allows for strong pre and post season comparisons when abrupt seasonal changes occur. Longer periods of ramp up with titrated loading strategies, coinciding with targeted elbow and thigh injury prevention programs may allow for improved recovery and injury mitigation
strategies needed to combat the increased risk for acute elbow and groin/hip/thigh injuries during return to baseball following abrupt cessation of sport such as the COVID-19 pandemic or other work stoppage scenarios.2,40
LIMITATIONS
This study is not without limitations. Only MLB players were assessed, decreasing generalizability of the results to other professional baseball leagues or amateur baseball players. Further, the public data set utilized does not allow for missing data to be quantified, which may impact the precision of these results. However, external data validation was performed with other publicly available data to increase the interpretability of these results. Additionally, injuries were classified by IOC standard labels to the nearest anatomical body part14; injuries reported based on pathology (i.e. ulnar collateral ligament tear, hamstring strain, oblique strain) were inconsistently reported, decreasing the potential clinical interpretability of these findings. Finally, an estimated player-game exposures were used to calculate IR based on typical games played each season. Athletes by position may have different exposure to sport, which was not possible to calculate with these data, impacting the clinical interpretability of these findings.
CONCLUSION
Combined injury rates were similar during the Covid-19 shortened 2020 season among all positions compared to the 2015-2019 and 2021 seasons. By body region, the elbow was the most commonly injured body region in 2020 among pitchers, with the elbow demonstrating an increase in 3.5 times the rate compared to the previous five seasons. Among position players, the groin/hip/thigh demonstrated the highest IR in 2020. Baseball stakeholders may consider longer periods of ramp up and loading strategies; these loading strategies may allow for improved recovery and injury mitigation strategies following training disruptions. Injury mitigation strategies should give attention to the most vulnerable injuries, particularly the elbow and groin/ hip/thigh region among all MLB players.
CONFLICT OF INTEREST
The authors report no conflict of interest.
Submitted: September 05, 2022 CDT, Accepted: January 15, 2023 CDT
This is an open-access article distributed under the terms of the Creative Commons Attribution 4.0 International License (CCBY-NC-4.0). View this license’s legal deed at https://creativecommons.org/licenses/by-nc/4.0 and legal code at https://creativecommons.org/licenses/by-nc/4.0/legalcode for more information.
But Not Other Baseball Injuries International Journal of Sports Physical Therapy
Elbow Injuries Among MLB Pitchers Increased During Covid-19 Disrupted Season,
REFERENCES
1. Major League Baseball. Accessed April 20, 2022. htt ps://en.wikipedia.org/wiki/Major_League_Baseball
2. Bullock GS, Uhan J, Harriss EK, Arden NK, Filbay SR. The relationship between baseball participation and health: a systematic scoping review J Orthop Sports Phys Ther. 2020;50(2):55-66. doi:10.2519/josp t.2020.9281
3. Platt BN, Uhl TL, Sciascia AD, Zacharias AJ, Lemaster NG, Stone AV. Injury rates in Major League Baseball during the 2020 COVID-19 season. Orthop J Sports Med 2021;9(3):232596712199964. doi:10.1177/ 2325967121999646
4. Posner M, Cameron KL, Wolf JM, Belmont PJ Jr, Owens BD Epidemiology of Major League Baseball injuries. Am J Sports Med. 2011;39(8):1675-1691. do i:10.1177/0363546511411700
5. Conte S, Camp CL, Dines JS. Injury trends in Major League Baseball over 18 seasons: 1998-2015. Am J Orthop. 2016;45(3):116-123.
6. Melugin HP, Leafblad ND, Camp CL, Conte S. Injury prevention in baseball: from youth to the pros. Curr Rev Musculoskelet Med. 2018;11(1):26-34. doi:1 0.1007/s12178-018-9456-5
7 van Mechelen W, Hlobil H, Kemper HCG. Incidence, severity, aetiology and prevention of sports injuries. A review of concepts. Sports Med 1992;14(2):82-99. d oi:10.2165/00007256-199214020-00002
8. Timeline of how the COVID-19 pandemic has impacted the 2020 Major League Baseball season. CBSSports.com. Accessed April 25, 2022. https://ww w.cbssports.com/mlb/news/timeline-of-how-the-covi d-19-pandemic-has-impacted-the-2020-major-leagu e-baseball-season/
9. Rogalski B, Dawson B, Heasman J, Gabbett TJ. Training and game loads and injury risk in elite Australian footballers. J Sci Med Sport 2013;16(6):499-503. doi:10.1016/j.jsams.2012.12.004
10. Torres-Ronda L, Gámez I, Robertson S, Fernández J. Epidemiology and injury trends in the National Basketball Association: Pre- and per-COVID-19 (2017–2021). PLoS ONE. 2022;17(2):e0263354. doi:1 0.1371/journal.pone.0263354
11. Allahabadi S, Gatto AP, Pandya NK. ACL Tears in the National Football League from 2013 to 2020: analysis of the 2020 season after delays and schedule changes from the early COVID-19 Pandemic relative to rrior seasons. Orthop J Sports Med 2022;10(2):23259671221076044. doi:10.1177/2325967 1221076045
12. Bailey EP, Goodloe JB, McNeely RA, Traven SA, Woolf SK, Slone HS. COVID-19 modifications of offseason and preseason training for NFL athletes are associated with increased risk of regular season injuries. Phys Sportsmed. 2021;0(0):1-5.
13. Marotta N, de Sire A, Gimigliano A, et al. Impact of COVID-19 lockdown on the epidemiology of soccer muscle injuries in Italian Serie A professional football players. J Sports Med Phys Fitness 2022;62(3):356-360. doi:10.23736/s0022-4707.21.129 03-2
14. Bahr R, Clarsen B, Derman W, et al. International Olympic Committee consensus statement: methods for recording and reporting of epidemiological data on injury and illness in sport 2020 (including STROBE Extension for Sport Injury and Illness Surveillance (STROBE-SIIS)). Br J Sports Med. 2020;54(7):372-389. doi:10.1136/bjsports-2019-101969
15. Bullock GS, Murray E, Vaughan J, et al. Temporal trends in incidence of time-loss injuries in four male professional North American sports over 13 seasons. Sci Rep 2021;11:8278.
16. Groothuis PA, Hill JR, Perri TJ. Early Entry in the NBA Draft: The influence of unraveling, human capital, and pption value. J Sports Econom 2007;8(3):223-243. doi:10.1177/1527002505281228
17. Martin CL, Arundale AJH, Kluzek S, Ferguson T, Collins GS, Bullock GS. Characterization of rookie season injury and illness and career longevity among National Basketball Association players. JAMA Netw Open 2021;4(10):e2128199. doi:10.1001/jamanetwor kopen.2021.28199
18. Newman K. Go public! Using publicly available data to understand the foreclosure crisis. J Am Planning Assoc. 2010;76(2):160-171. doi:10.1080/0194 4360903586738
19. Oki NO, Nelms MD, Bell SM, Mortensen HM, Edwards SW. Accelerating adverse outcome pathway development using publicly available data sources. Curr Environ Health Rep 2016;3(1):53-63. doi:10.100 7/s40572-016-0079-y
Elbow Injuries Among MLB Pitchers Increased During Covid-19 Disrupted Season, But Not Other Baseball Injuries International Journal of Sports Physical Therapy
20. Bullock GS, Ward P, Peters S, et al. Call for open science in sports medicine [published online ahead of print, 2022 Jun 9]. Br J Sports Med 2022;bjsports-2022-105719.
21. Rockhold F, Nisen P, Freeman A. Data sharing at a crossroads. N Engl J Med 2016;375(12):1115-1117 do i:10.1056/nejmp1608086
22. Wilkinson MD, Dumontier M, Aalbersberg IJ, et al. The FAIR Guiding Principles for scientific data management and stewardship. Sci Data 2016;3(1):1-9. doi:10.1038/sdata.2016.18
23. Hayes J, Orchard J. Using the World Wide Web to conduct epidemiological research: an example using the National Basketball Association. Inte SportMed J. 2001;2(2):1-15.
24. Landers RN, Brusso RC, Cavanaugh KJ, Collmus AB. A primer on theory-driven web scraping: Automatic extraction of big data from the Internet for use in psychological research. Psych Methods 2016;21(4):475-492. doi:10.1037/met0000081
25. Bullock GS, Ferguson T, Vaughan J, Gillespie D, Collins G, Kluzek S. Temporal trends and severity in injury and illness incidence in the National Basketball Association over 11 seasons. Orthop J Sports Med 2021;9(6):232596712110040. doi:10.1177/ 23259671211004094
26. McKay CD, Tufts RJ, Shaffer B, Meeuwisse WH. The epidemiology of professional ice hockey injuries: a prospective report of six NHL seasons. Br J Sports Med 2014;48(1):57-62. doi:10.1136/bjsports-2013-09 2860
27 Ciccotti MG, Pollack KM, Ciccotti MC, et al. Elbow injuries in professional baseball: Epidemiological findings from the Major League Baseball injury surveillance system. Am J Sports Med. 2017;45(10):2319-2328. doi:10.1177/03635465177069 64
28. Bullock GS, Menon G, Nicholson K, Butler RJ, Arden NK, Filbay SR. Baseball pitching biomechanics in relation to pain, injury, and surgery: A systematic review. J Sci Med Sport. 2021;24(1):13-20. doi:10.101 6/j.jsams.2020.06.015
29. Feltner M, Dapena J. Dynamics of the shoulder and elbow joints of the throwing arm during a baseball pitch. J Appl Biomech. 1986;2(4):235-259. do i:10.1123/ijsb.2.4.235
30. Werner SL, Murray TA, Hawkins RJ, Gill TJ. Relationship between throwing mechanics and elbow valgus in professional baseball pitchers. J Shoulder Elbow Surg 2002;11(2):151-155. doi:10.1067/mse.200
2.121481
31. Wang LH, Lo KC, Jou IM, Kuo LC, Tai TW, Su FC. The effects of forearm fatigue on baseball fastball pitching, with implications about elbow injury J Sports Sci. 2016;34(12):1182-1189. doi:10.1080/02640 414.2015.1101481
32. Matsuo T, Fleisig GS, Zheng N, Andrews JR. Influence of shoulder abduction and lateral trunk tilt on peak elbow varus torque for college baseball pitchers during simulated pitching. J Appl Biomech 2006;22(2):93-102. doi:10.1123/jab.22.2.93
33. Murray TA, Cook TD, Werner SL, Schlegel TF, Hawkins RJ. The effects of extended play on professional baseball pitchers. Am J Sports Med 2001;29(2):137-142. doi:10.1177/03635465010290020 501
34. Camp CL, Dines JS, van der List JP, et al. Summative report on time out of play for Major and Minor League Baseball: An analysis of 49,955 injuries from 2011 through 2016. Am J Sports Med 2018;46(7):1727-1732. doi:10.1177/036354651876515 8
35. Mlynarek RA, Coleman SH. Hip and groin Injuries in baseball players. Curr Rev Musculoskelet Med. 2018;11(1):19-25. doi:10.1007/s12178-018-9455-6
36. Peña J, Altarriba-Bartés A, Vicens-Bordas J, et al. Sports in time of COVID-19: Impact of the lockdown on team activity Apunts Sports Med 2021;56(209):100340. doi:10.1016/j.apunsm.2020.100 340
37 Taichman DB, Backus J, Baethge C, et al. Sharing clinical trial data a proposal from the International Committee of Medical Journal Editors. N Engl J Med. 2016;374(4):384-386. doi:10.1056/nejme1515172
38. Schwellnus M, Soligard T, Alonso JM, et al. How much is too much? (Part 2) International Olympic Committee consensus statement on load in sport and risk of illness. Br J Sports Med 2016;50(17):1043-1052. doi:10.1136/bjsports-2016-0 96572
39. Soligard T, Schwellnus M, Alonso JM, et al. How much is too much? (Part 1) International Olympic Committee consensus statement on load in sport and risk of injury Br J Sports Med 2016;50(17):1030-1041. doi:10.1136/bjsports-2016-096581
40. Andrade R, Wik EH, Rebelo-Marques A, et al. Is the acute: chronic workload ratio (ACWR) associated with risk of time-loss injury in professional team sports? A Systematic Review of methodology, variables and injury risk in practical situations. Sports Med. 2020;50(9):1613-1635. doi:10.1007/s40279-02 0-01308-6
Elbow Injuries Among MLB Pitchers Increased During Covid-19 Disrupted Season, But Not Other Baseball Injuries International Journal of Sports Physical Therapy
41. Kellmann M. Preventing overtraining in athletes in high-intensity sports and stress/recovery monitoring. Scand J Med Sci Sports 2010;20:95-102. d oi:10.1111/j.1600-0838.2010.01192.x
42. Bowen L, Gross AS, Gimpel M, Bruce-Low S, Li FX. Spikes in acute:chronic workload ratio (ACWR) associated with a 5–7 times greater injury rate in English Premier League football players: a comprehensive 3-year study Br J Sports Med 2020;54(12):731-738. doi:10.1136/bjsports-2018-099 422
Elbow Injuries Among MLB Pitchers Increased During Covid-19 Disrupted Season, But Not Other Baseball Injuries International Journal of Sports Physical Therapy
Bullock G, Thigpen C, Prats-Uribe A, Gilliand RG, Shanley E. Upper Quarter Injury Rates and Risk in United States High School Athletes Prior To and During the Prolonged Sport Stoppage. IJSPT. Published online April
Upper Quarter Injury Rates and Risk in United States High School Athletes Prior To and During the Prolonged Sport Stoppage
Garrett Bullock1a , Charles Thigpen2 , Albert Prats-Uribe3 , R. Gill Gilliand4 , Ellen Shanley2
1 Orthopaedic Surgery, Wake Forest University School of Medicine, 2 ATI Physical Therapy, 3 Pharmaco Device Epidemiology Unit, NDORMS, 4 PRISMA Health
Keywords: Coronavirus, Loading, Upper Extremity, Natural Experiment, Interrupted Time Series https://doi.org/10.26603/001c.71353
International Journal of Sports Physical Therapy
Background
Upper quarter injuries are a serious problem in high school sports. The distinctive differences in males and females and within sports concerning specific upper quarter body parts necessitates the need to evaluate these injuries across these groups. The COVID-19 pandemic has created an opportunity to evaluate the potential added burden abrupt and prolonged sport stoppage had on upper quarter injury risk.
Hypothesis/Purpose
To 1) describe and compare upper quarter injury rates and risk in high school athletes in the 2019-2020 and 2020-2021 academic school years; 2) examine injuries by gender, sport, injury type, and location of injury
Methods
An ecological study of the athletes from 176 high schools over six states, matching high schools between 2019-2020 (19-20) and 2020-2021 (20-21) years was performed. Injuries were reported by at least one high school athletic trainer assigned to each school into a centralized database and data collected from July 1, 2019, to June 30, 2021. Injury rates were calculated per 1,000 athletes per academic year. Interrupted time series models assessed the incidence ratio between academic years.
Results
A total of 98,487 athletes from all sports participated in 19-20 and 72,521 in 20-21. Upper quarter injury rates increased in from 19-20 [41.9 (40.6, 43.1)] to 20-21 [50.7 (48.1, 51.3)].
Upper quarter injury risk [1.5 (1.1, 2.2)] was greater in 20-21 compared to 19-20. Females did not demonstrate increased injury rates between 19-20 [31.1 (29.4, 32.7)] to 20-21 [28.1 (26.4, 30.0)]. Males reported increased injury rates from 19-20 [50.3 (48.5, 52.2)] to 20-21 [67.7 (65.2, 70.2)]. Increased injury for the shoulder, elbow, and hand were reported in 20-21. Collision, field, and court upper quarter injury rates were increased in 20-21.
Discussion
Upper quarter injury rates and injury risk were greater during the 2020-2021 school year than in the prior year Males demonstrated increased upper quarter injury rates, while females did not. Return to play protocols for high school athletes should be considered following abrupt sport stoppage.
Corresponding author:
Garrett S. Bullock PT, DPT, DPhil
Department of Orthopaedic Surgery
Wake Forest School of Medicine
475 Vine St Winston-Salem, NC 27233
(336) 716-4264
gbullock@wakehealth.edu
Original Research
a
1, 2023:397-408. doi:10.26603/001c.71353
INTRODUCTION
Upper quarter injuries are a serious problem in high school athletes,1–3 with 21% of all athletic injuries sustained to the upper extremity.1 Almost 600,000 acute traumatic arm fractures occur annually, representing one in ten of all injuries sustained in high school athletes annually.4 The highest incidence of upper extremity injury is in the shoulder and elbow, with almost half of adolescent upper quarter injuries occurring at the shoulder 5 Upper quarter injuries have a high medical burden, costing over $13,000 per injury in high school athletes.6
There are distinct differences in high school athlete upper quarter injury incidence between genders, with male high school athletes more likely to suffer severe injuries compared to females.7 When comparing similar sports between high school males and females, males have a greater prevalence of upper quarter injuries, with up to 2.04 times greater odds and 18.3 upper quarter injuries per 100,000 athletes.8,9 Different sports also have dissimilarities in upper quarter incidence. Athletes in collision sports have suffered up to 42% of total injuries to the upper quarter7,10; while athletes in field and court sports have sustained up to 55% of upper quarter injuries.10,11
The escalation of COVID-19 infections within the United States led to the cancellation of high school sports, beginning in March 2020.12 The sudden and prolonged interruption of high school practices and competition led to decreased physical activity and sport training over time.13 This sport specific training and competition stoppage resulted in decreased cardiovascular fitness, strength and power,14,15 potentially increasing musculoskeletal injury risk during return to sport the following academic year The interruption of high school sport practice and competition, coinciding with the COVID-19 pandemic, provides a distinctive chance to evaluate upper quarter injury patterns in high school athletes following an abrupt sport stoppage. While COVID-19 is the exact mechanism for sport stoppage, this provides an opportunity to consider the effects of abrupt sport stoppage on upper quarter injury incidence and risk, when resuming sport.
There are currently no studies comprehensively evaluating upper quarter injury that occur in high school sports. The distinctive differences in males and females, and within sports concerning specific upper quarter joints, necessitates the evaluation of injuries across these groups. The COVID-19 pandemic has created an opportunity to evaluate the potential added burden abrupt and prolonged sport stoppage has on upper quarter injury risk. Therefore, the purpose of this study was to 1) describe and compare upper quarter injury rates and risk in high school athletes in the 2019-2020 and 2020-2021 academic school years; 2) examine injuries by gender, sport, injury type, and location of injury
MATERIALS AND METHODS STUDY DESIGN
An ecological study on high school upper quarter injuries was performed. The Strengthening the Reporting of Observational Studies in Epidemiology for Sport Injury and Illness Surveillance (STROBE-SIIS) were followed (Please see STROBE checklist as supplement).16 This study was approved by the PRISMA Health Institutional Review Board. Data cannot be shared for ethical/privacy reasons.
PARTICIPANTS
High school athletes, from six states [Alabama (AL); Delaware (DE); Illinois (IL); Maryland (MD); Michigan (MI); Pennsylvania (PA)] were included in this study. High schools were matched between 2019-2020 and 2020-2021 academic years. High school matching was based on participating in high school sports during the 2020-2021 academic year High schools had to at minimum participate in a portion of all three sport seasons (e.g., fall, winter, and spring). If the high school did not report or participate in high school athletics during the 2020-2021 year, they were excluded from the analyses (Refer to Appendix 1 for study flow chart). All injury records were also matched for months of sport participation. As sport participation abruptly stopped in March 2020, injury records for the 2020-2021 academic year were matched through March 1, 2021. A total of 176 high schools were included.
DATA COLLECTION
Athlete injuries reported their injuries to the high school athletic trainer. The athletic trainer recorded all injuries by date and recorded time loss during any team-sponsored practices or games. Athletic trainer sport coverage was based on the individual high school sport participation, not on high school or school district funding or socioeconomic status. Athletic trainers checked high school athlete participation daily. Athlete health was monitored by the full-time athletic trainer assigned to each school. Internal validity data checks were performed by the regional athletic trainer supervisor and the regional and national quality control supervisors on a quarterly basis.17,18
ATHLETE EXPOSURE
An athlete-exposure (AE) was defined as one athlete participating in one practice or competition where a player was at risk of sustaining an injury 10 Athlete exposure was not calculated for days of school suspension, medical visits that were not musculoskeletal related (e.g., general medical visit), or extramural school activities not related to sport. School holidays and teacher work days (e.g., Thanksgiving and Christmas) and high school or school district level stoppage of in person academic learning and sport partic-
Level of Evidence 2
Upper Quarter Injury Rates and Risk in United States High School Athletes Prior To and During the Prolonged Sport Stoppage International Journal of Sports Physical Therapy
ipation due to COVID-19 were marked and not considered athlete exposure. Due to the ecological nature of this study, it was not possible to obtain individual athlete exposure for epidemiological calculations, only if an athlete sustained a time loss illness or injury that was related to athlete exposure. Exposure was calculated per high school.
INJURY DEFINITION
An injury was defined as tissue damage or other derangement of normal physical function occurring during any training session or competition that resulted in at least one day lost to training and/or competition and required medical attention.16 Athlete complaints that resulted in cessation of a competition or training session but the athlete returned to training or competition the same session or following day were recorded as zero days of time loss and did not result in a recorded injury 16 Injured body segments and body parts were defined by the Orchard Sports Injury Classification System.19 Due to the nature and mechanism of injury, concussions were excluded from this analyses. Specific anatomic body parts were recorded. Injury type was categorized as a cartilage injury, contusion, dislocation/ subluxation/instability, fracture, sprain, strain, or other.19 Injury time loss was calculated in number of days.16 Injury severity was calculated as overall time loss, with injury severity stratified using 8-28 days (moderate) and >28 (severe) days.16
CONFOUNDERS
Self-identified gender, state, sport, and socioeconomic status were identified as confounders. Socioeconomic status was controlled through 1:1 high school matching between academic years. Due to the large number of sports played, sport was collapsed into four categories: collision (American football, lacrosse, wrestling, ice hockey, rugby), field and court (basketball, field hockey, soccer, tennis, volleyball, gymnastics, softball, baseball), individual (track and field, swimming, mixed rifle, mixed skiing, golf, dance, diving, cross country, bowling, archery, rowing, cheerleading), and other The category of “other” was utilized for non-descript sport records.
STATISTICAL ANALYSES
All data were assessed for missingness prior to analyses (Gender: 0%; Age: 0%; Date of Injury: 3%; Sport: 1.7%; Body Part: 1.6%; Return to Play: <0.1%), and complete case analyses were performed. Participant statistics were described using mean (standard deviation) for continuous normally distributed variables, median (25th quartile, 75th quartile) for non-normally distributed continuous variables, and frequencies (percentages) for categorical variables. Injury rates, with 95% confidence intervals (95% CI) was calculated per 1,000 athletes that participated within one academic year (August through March, per matching).6 Results were stratified by academic year, gender, state, sport, mechanism of injury, and type of injury.
To assess potential differences in upper quarter injury incidence between academic years, a mixed effects negative binomial interrupted time series model with robust errors was performed. Potential excess injuries for the 2020-2021 academic year were calculated on the expected upper quarter injury count from the 2019-2020 year. A dummy variable was included for the 2019-2020 academic year (0) and the 2020-2021 academic year (1). Further, an interaction between academic calendar year and month was included in the model. Random effects were modeled at the high school level. Model fixed effects were controlled using state, school holidays, and seasonality To account for changes in athlete exposure due to the academic calendar, the number of school holidays, teacher work days, and days lost to COVID-19 exposure per month were included as a continuous variable. Seasonality was controlled for by assessing potential nonlinear relationships between month as a continuous variables and injury incidence through fractional polynomials. Non-linear relationship was observed to be a 2, -2 non-linear term. The log of high school athlete participation was included as an offset. All analyses were performed in R version 4.01 (R Core Team (2013). R: A language and environment for statistical computing. R Foundation for Statistical Computing, Vienna, Austria. URL http://www.R-project.org/), using the naniar package for missingness assessment and the GLMMadaptive package for zero inflated mixed effects negative binomial modelling.
RESULTS
A total of 98,487 athletes (Female: 43,249; Male: 55,238) participated in high school sport in 2019-2020 and 72,521 athletes (Female: 32,968; Male: 39,553) in the 2020-2021 academic year. A total of 4,125 upper quarter injuries occurred in the 2019-2020 academic year and 3,606 upper quarter injuries in the 2020-2021 academic year. The median time loss suffered from an upper quarter injury was 21 (1, 46) days during the 2019-2020 academic year and 17 (1, 34) days during the 2020-2021 academic year The median time loss suffered from upper quarter injury for females was 21 (1, 47) days during the 2019-2020 academic year and 16 (1, 33) days during the 2020-2021 academic year The median time loss suffered from upper quarter injury for males was 21 (1, 46) days during the 2019-2020 academic year and 17 (1, 35) days during the 2020-2021 academic year.
UPPER QUARTER INJURY RATES AND RISK
There was an overall increase in upper quarter injury rates per 1,000 athletes between the 2019-2020 and 2020-2021 academic years and for males (Table 1). The greatest increase in male upper quarter injury rates were in the category of moderate injuries. For upper quarter injury rates stratified by state, please refer to Appendix 2. Crude analyses demonstrated that upper quarter injuries increased by a ratio of 1.2 [(95% CI: 1.1, 1.3), p < 0.001] during the 2020-2021 academic school year When accounting for calendar month and days lost to shelter in place and school holidays throughout the academic year, upper quarter in-
Upper Quarter Injury Rates and Risk in United States High School Athletes Prior To and During the Prolonged Sport Stoppage International Journal of Sports Physical Therapy
jury increased by a ratio of 1.5 [(95% CI: 1.1, 2.2), p = 0.022] during the 2020-2021 academic school year.
UPPER
QUARTER INJURY RATES BY INJURY TYPES
The 2020-2021 academic demonstrated increased upper quarter injury rates per 1,000 athletes for contusions, dislocation/subluxation/instability, sprains, and strains compared to the 2019-2020 academic year (Table 2).
UPPER QUARTER INJURY RATES BY SPORT
Collision and field and court sports reported increased upper quarter injury rates per 1,000 athletes during the 2020-2021 academic year compared to the 2019-2020 academic year. Individual sport upper quarter injury rates per 1,000 athletes were similar between academic years (Table 3). Injury rates by body part for collision and field and court are reported in Appendix 3.
UPPER QUARTER INJURY RATES BY BODY PART AND ANATOMIC LOCATION
There were increased shoulder/proximal humerus, elbow, wrist, and hand injury rates per 1,000 athletes in the 2020-2021 compared to the 2019-2020 academic year (Table 4). Concerning shoulder specific injuries, there were increased acromioclavicular, clavicle, labrum, and rotator cuff injury rates per 1,000 athletes in 2020-2021 compared to the 2019-2020 academic year Concerning elbow injuries, there were increased ulnar collateral ligament injury rates per 1,000 athletes in 2020-2021 compared to the 2019-2020 academic year. Concerning forearm specific injuries, there were increased pronator-flexor mass injury rates per 1,000 athletes in 2020-2021 compared to the 2019-2020 academic year (Table 5).
DISCUSSION
The main findings of this study were that there was increased upper quarter injury rates during the 2020-2021 compared to 2019-2020 academic school year. When controlling for confounders, upper quarter injury risk was also increased. Male upper quarter injury rates increased, while female injury rates were similar between academic years. Shoulder, elbow, and hand injury rates increased in the 2020-2021 academic year. Collision and field and court sport upper quarter injury rates increased, while individual sports demonstrated similar injury rates between academic years.
Upper quarter injury rates and risk were greater for the 2020-2021 academic year This is not surprising considering the long layoff period and delayed return to sport for these high school athletes. High school sport interruption and the sudden subsequent resuming of sport may have influenced the increase in upper quarter injury rates and risk. In a survey of 13,000 high school athletes during the recent high school sport pause, they reported a 20% reduction in physical activity compared to pre-pandemic physical activity levels.20 In another study, high school athletes during
the cessation of sport reported performing almost two hours less of strength training, 1.5 hours less of endurance training, and over 6 hours less sport specific training per week.21 A decrease in physical activity and exercise has been recognized as an important injury risk factor in high school physical education students22 and college athletes.14 The resultant deconditioning and lower load tolerance from decreased training may predispose the athlete to excessive loads upon returning to high school sport, potentially increasing upper quarter injury risk.15 Further research is needed to understand the implications of deconditioning and load tolerance on upper quarter injury risk in high school athletes.
Male high school athletes reported increased upper quarter injury rates, compared to female athletes that sustained similar upper quarter injury rates between academic school years. The greatest increase in male injury rates were in the category of moderate injuries. These gender differences may be attributed to potential discrepancies in style of play,7,9,23 sports played,24 or overall gender specific differences in injury risk.23,25,26 Previous researchers have observed that high school male athletes are more likely to sustain severe upper quarter musculoskeletal injuries and traumatic injuries compared to female athletes.7,9 Male high school athletes are also more likely to suffer head/ neck, shoulder, and hand injuries that require surgery compared to females in comparable sports.24 Within high school baseball and softball, male baseball players are more likely to suffer an initial upper extremity injury compared to female softball players.27
Athletes in collision and field and court sports demonstrated increased injury rates during the 2020-2021 academic year Field and court sports, such as tennis and baseball use the upper extremity for ball propulsion.28 This results in increased upper extremity injury risk.27 However, other field and court sports such as basketball and soccer have demonstrated a high prevalence of shoulder injuries due to player contact and guarding, suggesting moderate upper extremity sport involvement.29 Collision sports such as football, lacrosse, and wrestling have also previously demonstrated high injury prevalence and incidence in high school athletes. Athletes in collision sports are more susceptible to traumatic upper quarter injuries, which may be related to decreased collision physical preparedness as they return to sport.1,8 General decreased upper extremity involvement in individual sports, such as cross country running or track and field, has demonstrated less upper extremity injury prevalence compared to the trunk or lower extremity.30
Shoulder, elbow, and hand/finger injury rates were greater during the 2020-2021 academic year These findings support previous research, with the shoulder, elbow and hand/finger demonstrating the greatest prevalence in injuries to the upper quarter in high school athletes.7,10,11 Hand/finger injuries are predominantly traumatic fracture injuries,31,32 while shoulder and elbow injuries have previously been identified as traumatic or overuse injuries.7,10,11 Within sport, overuse injuries predominantly occur from
Upper Quarter Injury Rates and Risk in United States High School Athletes Prior To and During the Prolonged Sport Stoppage International Journal of Sports Physical Therapy
Upper Quarter Injury Rates and Risk in United States High School Athletes Prior To and During the Prolonged Sport Stoppage
Table 1. Upper Quarter Injury Rates per 1,000 Athletes per Academic Year by Gender and Severity. All injury rates are reported per 1,000 athletes, with 95% confidence intervals
Upper Quarter Injury Upper Quarter Injury Severity Minor Moderate Severe 19-20 20-21 19-20 20-21 19-20 20-21 19-20 20-21 Overall 19-20: n = 98,487 20-21: n = 72, 521 41.9 (40.6, 43.1) 50.7 (48.1, 51.3) 13.0 (12.3, 13.7) 14.0 (13.2, 14.9) 10.7 (10.1, 11.4) 17.8 (16.8, 18.8) 18.0 (17.2, 18.8) 17.5 (16.5, 18.4) Female 19-20: n = 43,250 20-21: n = 32,968 31.1 (29.4, 32.7) 28.1 (26.4, 30.0) 10.2 (9.3, 11.1) 8.7 (7.7, 9.7) 7.3 (6.5, 8.1) 9.5 (8.4, 10.5) 13.4 (12.2, 14.4) 9.4 (8.4, 10.5) Male 19-20: n = 55,239 20-21: n = 39,554 50.3 (48.5, 52.2) 67.7 (65.2, 70.2) 16.1 (14.1, 16.2) 18.5 (17.2, 19.8) 13.5 (12.5, 14.5) 24.7 (23.2, 26.3) 21.7 (20.4, 22.9) 24.2 (22.7, 25.7) 19-20 = Pre-pandemic academic year 20-21 = Pandemic academic year
International Journal of Sports Physical Therapy
throwing, swinging an implement such as a golf club or tennis racket, or prolonged gripping.33
PRACTICAL CLINICAL IMPLICATIONS
The increase in upper quarter injury rates, most notably in males, and those participating in collision sports, and field and court sports, suggest that return to loading strategies should be considered, and may focus on acclimating athletes to collision (i.e., tackling and blocking) physical demands. Further, athletes in sports with higher upper extremity demands, such as baseball and tennis, should have a slower ramp up for throwing, serving, or other similar sport activities. Sports medical clinicians should consider educating high school athletes, sport coaches, and their parents on performing gradual increases in training and practices when returning to sport following any unexpected or prolonged sport stoppage. Sports medicine clinicians should also consider creating return to play protocols with high school sport stakeholders in their community, in case of sport stoppages such as natural disasters (i.e., hurricanes, earthquakes), prolonged illness/injury or pandemics to help reduce the risk of upper quarter injuries.
STRENGTHS AND POTENTIAL LIMITATIONS
Athletes from six states, two regions of the United States, and 176 high schools were included in this study, increasing the generalizability of these findings. Upper quarter injuries were stratified by gender, state, sport, injury type, and anatomic body part providing a comprehensive and in depth reporting and analysis of upper quarter injuries in high school athletes. The variability of sports for each high school and state required sport groupings to be collapsed,
Table
19-20 Pre pandemic academic year; Total of 98,487 athletes participated in sport
20-21 = Pandemic academic year; Total of 72,521 athletes participated in sport
Other consists of deformity, disorder, laceration, and non-descript injury type records
*Injury rates that increased from 2019-2020 to 2020-2021 are bolded
Table 3. Upper Quarter Injury Rates per 1,000 Athletes per Academic Year by Sport. All injury rates are reported per 1,000 athletes, with 95% confidence intervals
19-20 Pre pandemic academic year; Total of 98,487 athletes participated in sport 20-21 Pandemic academic year; Total of 72,521 athletes participated in sport *Injury rates that increased from 2019-2020 to 2020-2021 are bolded
decreasing the precision in these findings. Due to the ecological nature of this study, training and competition minutes could not be obtained, preventing rate calculations, decreasing the precision in injury incidence analyses. However, the number of days missed due to holidays, workdays, and shelter in place days during the academic school year were controlled for, improving the risk analyses precision. These results may be affected by the potential confounding of selection bias of schools participated in sport participation during the 2020-2021 academic school year. One state reported an increase of over 3,000 students that participated in sports during the 2020-2021 year The increased sport participation prevalence may be related to the exclusion of other after school activities during the 2020-2021 year. However, the exact cause is not known, increasing selection bias.
CONCLUSION
Upper quarter injury rates were greater for the 2020-2021 academic school year in this sample of high school athletes. When controlling for confounders, models demonstrated increased injury risk for the 2020-2021 academic school year While males reported increased upper quarter injury rates, females demonstrated comparable injury rates between academic years. Shoulder, elbow, and hand injury rates among all athletes increased in the 2020-2021 academic year. Athletes participating in collision and field and court sports reported an increase in upper quarter injuries, while athletes in individual sports reported similar injury rates for both school years. The results of this research may have implications beyond the COVID-19 pandemic, including natural disasters and work stoppages. Further research is required to understand the generalizability of these findings to different abrupt sport stoppage scenarios and the safe dose response required when returning to training for high school athletes and other competition levels.
Academic Year 19-20 20-21 Cartilage 1.4 (1.2, 1.6) 1.6 (1.3, 1.9) Contusion 4.7 (4.3, 5.1) 5.8 (5.3, 6.4) Dislocation/Subluxation/ Instability 3.0 (2.7, 3.4) 4.8 (4.3, 5.3) Fracture 6.4 (5.9, 6.9) 9.7 (9.0, 10.5) Sprain 11.0 (10.3, 11.6) 14.0 (13.1, 14.9) Strain 6.0 (5.5, 6.4) 7.1 (6.5, 7.7) Other 9.1 (8.5, 9.7) 6.5 (6.0, 7.1)
2. Upper Quarter Injury Rates per 1,000 Athletes per Academic Year by Type. Injury rates are reported per 1,000 athletes per academic year, and with 95% confidence intervals.
Academic Year 19-20 20-21 Collision 17.1 (16.3, 17.9) 26.2 (25.0, 27.3) Field & Court 12.2 (11.5, 12.9) 17.9 (16.9, 18.9) Individual 3.7 (3.3, 4.1) 4.4 (3.9, 4.9) Other 8.9 (8.3, 9.5) 1.2 (1.0, 1.5)
Upper Quarter Injury Rates and Risk in United States High School Athletes Prior To and During the Prolonged Sport Stoppage International Journal of Sports Physical Therapy
Table 4. Upper Quarter Injury Rates per 1,000 Athletes per Academic Year by Body Part. All injury rates are reported per 1,000 athletes with 95% confidence intervals
Table 5. Injury Rates per 1,000 Athletes per Academic Year by Anatomic Region or Diagnosis for Shoulder and Elbow Injuries. All injury rates are reported per 1,000 athletes, with 95% confidence intervals
19-20 = Pre pandemic academic year; Total of 98,487 athletes participated in sport
20-21 = Pandemic academic year; Total of 72,521 athletes participated in sport
*Injury rates that increased from 2019-2020 to 2020-2021 are bolded
CONFLICT OF INTEREST
The authors have no conflicts of interest
19-20 = Pre pandemic academic year
20-21 = Pandemic academic year
*Injury rates that increased from 2019-2020 to 2020-2021 are bolded
This is an open-access article distributed under the terms of the Creative Commons Attribution 4.0 International License (CCBY-NC-4.0). View this license’s legal deed at https://creativecommons.org/licenses/by-nc/4.0 and legal code at https://creativecommons.org/licenses/by-nc/4.0/legalcode for more information.
Upper Quarter Body Part Academic Year 19-20 20-21 Head/Face 4.4 (4.0, 4.9) 3.7 (3.2, 4.1) Cervical 3.5 (3.2, 3.9) 2.0 (1.6, 2.3) Shoulder/Proximal Humerus 15.8 (15.0, 16.6) 19.8 (18.8, 20.8) Elbow 4.0 (3.6, 4.4) 5.1 (4.6, 5.6) Forearm 1.0 (0.8, 1.2) 1.5 (1.2, 1.8) Wrist 4.0 (3.6, 4.4) 6.0 (5.4, 6.5) Hand/Finger 9.1 (8.5, 9.7) 11.7 (11.0, 12.5)
Anatomic Region or Diagnosis 19-20 n = 98,487 20-21 n = 72,521 Shoulder Acromioclavicular (AC) Joint 1.5 (1.2, 1.7) 2.3 (1.9, 2.6) Bicep 0.9 (0.7, 1.1) 1.5 (1.2, 1.8) Clavicle 0.6 (0.4, 0.7) 1.3 (1.0, 1.5) Glenohumeral Joint 2.2 (1.9, 2.5) 2.5 (2.1, 2.9) Labrum 0.9 (0.8, 1.1) 1.9 (1.5, 2.2) Neurovascular 0.2 (0.1, 0.3) 0.5 (0.3, 0.6) Rotator Cuff 3.5 (3.2, 3.9) 5.9 (5.3, 6.4) Scapula 0.3 (0.2, 0.4) 0.4 (0.2, 0.5) Elbow Olecranon 0.1 (0.05, 0.2) 0.1 (0.04, 0.2) Neurovascular 0.1 (0.02, 0.2) 0.2 (0.1, 0.3) Pronator-Flexor Mass 0.5 (0.4, 0.7) 1.3 (1.0, 1.5) Radius 0.2 (0.1, 0.3) 0.3 (0.2, 0.5) Triceps 0.2 (0.1, 0.3) 0.3 (0.2, 0.4) Ulna 0.1 (0.06, 0.2) 0.2 (0.1, 0.3) Ulna Humeral Joint 0.3 (0.2, 0.4) 0.3 (0.2, 0.4) Ulnar Collateral Ligament 0.6 (0.5, 0.8) 1.2 (0.9, 1.4)
Submitted: October 06, 2022 CDT, Accepted:
CDT
January 15, 2023
Upper Quarter Injury Rates and Risk in United States High School Athletes Prior To and During the Prolonged Sport Stoppage International Journal of Sports Physical Therapy
REFERENCES
1. Rechel JA, Yard EE, Comstock RD An epidemiologic comparison of high school sports injuries sustained in practice and competition. J Athl Train 2008;43(2):197-204. doi:10.4085/1062-6050-4 3.2.197
2. McCarthy MM, Bihl JH, Frank RM, Salem HS, McCarty EC, Comstock RD Epidemiology of clavicle fractures among US high school athletes, 2008-2009 through 2016-2017. Orthop J Sport Med. 2019;7(7):2325967119861812. doi:10.1177/232596711 9861812
3. Scheffler P, Wolter NE, Namavarian A, Propst EJ, Chan Y Contact sport related head and neck injuries in pediatric athletes. Int J Ped Otorhinolaryngology 2019;121:6-9. doi:10.1016/j.ijporl.2019.02.036
4. Swenson DM, Yard EE, Collins CL, Fields SK, Comstock RD Epidemiology of US high school sports-related fractures, 2005-2009. Clin J Sport Med. 2010;20(4):293-299. doi:10.1097/jsm.0b013e3181e8fa
e8
5. Andrish J. Upper extremity injuries in the skeletally immature athlete. In: The Upper Extremity in Sports Medicine CV Mosby St. Louis; 1990:675-690.
6. Knowles SB, Marshall SW, Guskiewicz KM. Issues in estimating risks and rates in sports injury research. J Athl Train 2006;41(2):207
7 Darrow CJ, Collins CL, Yard EE, Comstock RD Epidemiology of severe injuries among United States high school athletes: 2005-2007 Am J Sports Med 2009;37(9):1798-1805. doi:10.1177/036354650933301
8. Emery CA, Meeuwisse WH, McAllister JR. Survey of sport participation and sport injury in Calgary and area high schools. Clin J Sport Med. 2006;16(1):20-26. doi:10.1097/01.jsm.0000184638.72075.b7
9. Liavaag S, Svenningsen S, Reikerås O, et al. The epidemiology of shoulder dislocations in Oslo. Scand J Med Sci Sports 2011;21(6):e334-e340. doi:10.1111/ j.1600-0838.2011.01300.x
10. Powell JW, Barber-Foss KD. Sex-related injury patterns among selected high school sports. Am J Sports Med 2000;28(3):385-391. doi:10.1177/0363546 5000280031801
11. Bullock GS, Uhan J, Harriss EK, Arden NK, Filbay SR. The relationship between baseball participation and health: a systematic scoping review. J Orthop Sports Phys Ther 2020;50(2):55-66. doi:10.2519/josp t.2020.9281
12. Dorn E, Hancock B, Sarakatsannis J, Viruleg E. COVID-19 and Student Learning in the United States: The Hurt Could Last a Lifetime McKinsey & Company; 2020:1.
13. McGuine TA, Biese K, Hetzel SJ, et al. High School Sports During the COVID-19 Pandemic: The Effect of Sport Participation on the Health of Adolescents. J Athl Train 2021;57(1):51-58. doi:10.4085/1062-605 0-0121.21
14. Caterisano A, Decker D, Snyder B, et al. CSCCa and NSCA joint consensus guidelines for transition periods: safe return to training following inactivity Strength Cond J. 2019;41(3):1-23. doi:10.1519/ssc.000 0000000000477
15. Gabbett TJ. The training—injury prevention paradox: should athletes be training smarterandharder? Br J Sports Med 2016;50(5):273-280. doi:10.1136/bjsports-2015-0957 88
16. International Olympic Committee Injury and Illness Epidemiology Consensus Group, Bahr R, Clarsen B, et al. International Olympic Committee consensus statement: methods for recording and reporting of epidemiological data on injury and illness in sports 2020 (including the STROBE extension for sports injury and illness surveillance (STROBE-SIIS)). Orthop J Sport Med 2020;8(2):2325967120902908.
17. Bullock GS, Prats-Uribe A, Thigpen CA, et al. The impact of statewide limitations of practice on high school injury incidence during the COVID-19 season: An ecological study Sports Health 2022;14(5):656-664. doi:10.1177/19417381221106693
18. Shanley E, Thigpen CA, Prats-Uribe A, Norhen T, Staley T, Bullock GS. Subsequent musculoskeletal injury incidence are similar between general infection and COVID-19 among high school athletes in the Unites States despite higher illness incidence during academic years 2019-2020 and 2020-2021. J Orthop Sport Phys Ther. 2022;52(8):546-553. doi:10.2 519/jospt.2022.11200
5
Upper Quarter Injury Rates and Risk in United States High School Athletes Prior To and During the Prolonged Sport Stoppage International Journal of Sports Physical Therapy
19. Rae K, Orchard J. The Orchard Sports Injury Classification System (OSICS) version 10. Clin J Sport Med 2007;17(3):201-204. doi:10.1097/jsm.0b013e318 059b536
20. McGuine TA, Biese KM, Petrovska L, et al. Mental health, physical activity, and quality of life of US adolescent athletes during COVID-19–related school closures and sport cancellations: a study of 13 000 athletes. J Athl Train 2021;56(1):11-19. doi:10.4085/1 062-6050-0478.20
21. Jagim AR, Luedke J, Fitzpatrick A, et al. The impact of COVID-19-related shutdown measures on the training habits and perceptions of Athletes in the United States: a brief research report. Front Sports Act Living 2020;2:208. doi:10.3389/fspor.2020.623068
22. Bloemers F, Collard D, Paw MCA, Van Mechelen W, Twisk J, Verhagen E. Physical inactivity is a risk factor for physical activity-related injuries in children. Br J Sports Med 2012;46(9):669-674. doi:1 0.1136/bjsports-2011-090546
23. McQuillan R, Campbell H. Gender differences in adolescent injury characteristics: a population-based study of hospital A&E data. Public Health. 2006;120(8):732-741. doi:10.1016/j.puhe.2006.02.011
24. Rechel JA, Collins CL, Comstock RD Epidemiology of injuries requiring surgery among high school athletes in the United States, 2005 to 2010. J Trauma Acute Care Surg 2011;71(4):982-989. doi:10.1097/ta.0b013e318230e716
25. Garrick JG, Requa RK. Injuries in high school sports. Pediatrics 1978;61(3):465-469. doi:10.1542/pe ds.61.3.465
26. Lenaway DD, Ambler AG, Beaudoin DE. The epidemiology of school-related injuries: new perspectives. Am J Prevent Med. 1992;8(3):193-198. d oi:10.1016/s0749-3797(18)30831-6
27 Shanley E, Rauh MJ, Michener LA, Ellenbecker TS. Incidence of injuries in high school softball and baseball players. J Athl Train 2011;46(6):648-654. do i:10.4085/1062-6050-46.6.648
28. Roetert EP, Ellenbecker TS, Reid M. Biomechanics of the tennis serve: implications for strength training. Strength Cond J 2009;31(4):35-40. doi:10.15 19/ssc.0b013e3181af65e1
29. Durand WM, Goodman AD, Giglio P, Etzel C, Owens BD Epidemiology of upper extremity soccer injuries among high school and college-aged players in the United States: an analysis of the 1999-2016 NEISS Database. Sports Health 2018;10(6):552-557 d oi:10.1177/1941738118795483
30. Rauh MJ, Margherita AJ, Rice SG, Koepsell TD, Rivara FP High school cross country running injuries: a longitudinal study. Clin J Sport Med. 2000;10(2):110-116. doi:10.1097/00042752-20000400 0-00005
31. Aitken S, Court-Brown CM. The epidemiology of sports-related fractures of the hand. Injury 2008;39(12):1377-1383. doi:10.1016/j.injury.2008.0 4.012
32. Rettig AC. Epidemiology of hand and wrist injuries in sports. Clin Sports Med 1998;17(3):401-406. doi:10.1016/s0278-5919(05)7009 2-2
33. Ciccotti MC, Schwartz MA, Ciccotti MG. Diagnosis and treatment of medial epicondylitis of the elbow. Clin Sports Med 2004;23(4):693-705. doi:10.1016/j.cs m.2004.04.011
Upper Quarter Injury Rates and Risk in United States High School Athletes Prior To and During the Prolonged Sport Stoppage International Journal of Sports Physical Therapy
SUPPLEMENTARY MATERIALS
Appendix 1
Download: https://ijspt.scholasticahq.com/article/71353-upper-quarter-injury-rates-and-risk-in-united-states-highschool-athletes-prior-to-and-during-the-prolonged-sport-stoppage/attachment/ 148700.docx?auth_token=hc2x4E_eWB8Mut9fT1qo
Appendix 2
Download: https://ijspt.scholasticahq.com/article/71353-upper-quarter-injury-rates-and-risk-in-united-states-highschool-athletes-prior-to-and-during-the-prolonged-sport-stoppage/attachment/ 149092.docx?auth_token=hc2x4E_eWB8Mut9fT1qo
Appendix 3
Download: https://ijspt.scholasticahq.com/article/71353-upper-quarter-injury-rates-and-risk-in-united-states-highschool-athletes-prior-to-and-during-the-prolonged-sport-stoppage/attachment/ 149093.docx?auth_token=hc2x4E_eWB8Mut9fT1qo
Upper Quarter Injury Rates and Risk in United States High School Athletes Prior To and During the Prolonged Sport Stoppage International Journal of Sports Physical Therapy
SUPPLEMENTARY MATERIALS
Supplemental Files
Download: https://ijspt.scholasticahq.com/article/71359-elbow-injuries-among-mlb-pitchers-increased-duringcovid-19-disrupted-season-but-not-other-baseball-injuries/attachment/ 148728.docx?auth_token=Jt_yhwQ7FGl027ENq7o-
Elbow Injuries Among MLB Pitchers Increased During Covid-19 Disrupted Season, But Not Other Baseball Injuries International Journal of Sports Physical Therapy
Missing The Forest For The Trees: A Lack Of Upper Extremity Physical Performance Testing In Sports Physical Therapy
Matthew L Gauthier1 a , Casey A Unverzagt2 , Luciana De Michelis Mendonça3 , Amee L Seitz4
1
Department of Physical Therapy, University of Illinois at Chicago, 2 Department of Physical Therapy, Baylor University, 3 Physical Therapy, Universidade Federal de Minas Gerais, 4 Department of Physical Therapy and Human Movement Sciences, Northwestern University
Keywords: upper extremity, return to sport, shoulder, elbow, physical performance https://doi.org/10.26603/001c.73791
International Journal of Sports Physical Therapy
Background
Despite shoulder and elbow injuries being common in athletics, return to sport and reinjury rates are less than ideal. These outcomes may be driven by the absence of evidence-informed testing to determine an athlete’s readiness for sport.
Purpose
The purpose of this study was to explore the reported frequency of physical performance testing for return to sport readiness by physical therapists treating athletes with upper extremity injuries and to identify potential barriers that may limit use of these tests. A secondary aim was to compare practice patterns of clinicians with sports physical therapy specialty certification to clinicians without.
Study Design
International, cross-sectional survey using purposive sampling.
Methods
A survey instrument was created to assess the frequency of use of physical performance tests by physical therapists treating athletes with upper extremity injuries, as well as the barriers limiting the use of these tests. The 19-question online survey was distributed via email and Twitter among sports physical therapists. Independent t-tests and Chi Square analyses were conducted to determine differences in practice patterns between physical therapists with and without specialization and the frequency of potential barriers that may limit the use of these tests.
Results
Four hundred ninety-eight participants met study eligibility and completed the survey. Fewer than half of participants reported using any physical performance test in making return to sport decisions for athletes with upper extremity injuries. The greatest barriers to the use of physical performance tests were a lack of equipment followed by lack of understanding of the literature, lack of time, and lack of supporting literature. Sports specialist clinicians were significantly more likely (p<0.001) to use physical performance tests than non-specialist clinicians (71.6% versus 36.3%).
Conclusion
In this survey of physical therapists (n=498), the majority admit to not using physical performance tests when making return to sport decisions for athletes with upper extremity injuries regardless of specialization.
Corresponding Author: Matthew L Gauthier, Department of Physical Therapy, College of Applied Health Sciences, University of Illinois at Chicago, Chicago, IL 60608
P: 312.355.1465
E: matt.gauthier34@gmail.com
F: 312.413.8333
Original Research
a Gauthier ML, Unverzagt CA,
LDM, Seitz AL. Missing The Forest For The Trees: A Lack Of Upper Extremity Physical Performance Testing In Sports Physical Therapy. IJSPT. Published online April 1, 2023:419-430. doi:10.26603/001c.73791
Mendonça
Physical therapists have an opportunity to improve the utilization physical performance testing in the upper extremity athlete in hopes of reducing injury recurrence and enhance return to sport rates.
Level of Evidence
Level 3b
INTRODUCTION
Injuries to the shoulder and elbow are commonplace in the athletic population and regularly occur in both contact and non-contact sports. In contact and collision sports such as American football, rugby, hockey and soccer, the shoulder accounts for up to 20% of all injuries, most commonly acromioclavicular joint sprains and glenohumeral instability 1–5 In college athletes attending the National Football League (NFL) combine, reported prevalence of previous shoulder injuries is 50-52%.1,6 In overhead sports such as baseball, softball, volleyball, tennis, swimming, and water polo, the shoulder accounts for 17-35% of all musculoskeletal injuries, most commonly involving labral and rotator cuff pathology.7–11 In baseball and softball athletes alone, elbow injury is also a significant source of disability accounting for up to 22% of injuries.12–14 Despite high upper extremity injury rates, athletes often seek care with the goal of returning to sport and pre-injury levels of performance.
The proportion of athletes who are successfully able to return to sport following upper extremity injury varies based on the injury type and surgical status. In athletes with shoulder instability, 40-88% of athletes managed nonoperatively15–17 and 86-90% managed with surgical stabilization were able to successfully return to sport.18,19 However, only 50-73% of athletes return to sport at their previous level following surgical intervention.18,19 When considering overhead athletes with ulnar collateral ligament (UCL) injuries, 85-93% of athletes managed non-operatively and 75-100% of athletes managed with surgical reconstruction were able to successfully return to sport.20–22 However, only 84-93% of athletes managed non-operatively and 63-90% of those managed surgically returned to their previous level of competition.20–22
Recurrence rates for upper extremity injuries vary based on injury type and surgical status as well. The rate of reinjury after shoulder stabilization surgery has been found to be as high as 23%, but can be reduced to 10% with a comprehensive rehabilitation program.18,23,24 Following UCL reconstruction, revision rates are ultimately low (1-7%) but in a study following the outcomes of 147 athletes after UCL reconstruction, 26% of athletes returned to the injured list at some point in their career due to additional elbow injuries.25,26 These varied and less-than-ideal outcomes in return to sport and reinjury rates may be driven, in part, by the absence of an evidence-informed battery of tests used to determine an athlete’s physical performance and readiness for sport, ultimately resulting in athletes returning to sport before they achieve full physical performance of the involved upper extremity and kinetic chain.23,27
Physical performance tests, defined as assessments in which an athlete performs a physical task believed to be a component of a sports activity, can provide insight into an athlete’s readiness for return to sport.28 In athletes recovering from lower extremity injuries, the passing of physical performance tests (e.g., hop testing, agility testing) has been found to be effective in decreasing reinjury 29–32 However, current evidence on return to sport outcomes following upper extremity injury is comparatively lacking and limited to case series and clinical commentary.23,33 It is possible that this lack of outcomes research on the utility of upper extremity physical performance tests may be attributed to a lack of clinical use. If clinicians do not use upper extremity performance tests to make return to sport readiness decisions, there may be large variance in return to sport decision making and higher recurrence risk for upper extremity injuries in sports. Therefore, the purpose of this study was to explore the reported frequency of physical performance testing for return to sport readiness by physical therapists treating athletes with upper extremity injuries and the perceived potential barriers that may limit the use of these tests. A secondary aim of this study was to compare the practice patterns of clinicians with a sports physical therapy specialty certification to clinicians without this certification. The authors hypothesized that the majority of clinicians do not utilize upper extremity physical performance tests with their athletic patient population, and that the greatest barriers to their use would be a lack of awareness and understanding of current available evidence.
METHODS SURVEY CONTENTS
A survey instrument was created to assess the frequency of use of physical performance tests by physical therapists treating athletes with upper extremity injuries, as well as the perceived barriers limiting the use of these tests. (Appendix) A team of three physical therapists highly experienced in the management of upper extremity athletes collaborated to develop the electronic survey using Qualtrics software (Qualtrics, Provo, UT). The development team reviewed and tested the survey among themselves, after which face and content validity were assessed by piloting the survey among a group of eight physical therapists. Feedback was gathered on the survey and modifications were completed in order to enhance survey clarity and functionality. The survey was designed to be completed in 5-10 minutes.
The survey was separated into three sections. Section I gathered information regarding the country the participant was currently practicing in, their years of experience, and specialty certifications as recognized by the International
Missing The Forest For The Trees: A Lack Of Upper Extremity Physical Performance Testing In Sports Physical Therapy International Journal of Sports Physical Therapy
Table 1. Clinical criteria evaluated using the International Classification of Function, Disability, and Health (ICF) framework
Contextual Factors
Timeline from Injury
Patient’s self-reported readiness for return to sport
Patient Reported Outcome Measures (FOTO, DASH, WOSI, ASES, KJOC, etc.)
Impairments
Range of motion
Manual muscle testing
Hand-held dynamometry
Isokinetic testing
Proprioception
Federation of Sports Physical Therapy Section II assessed the participant’s percentage of patient population that included patients with shoulder and/or elbow injuries, as well as those that had goals that included unrestricted return to sport. Specific clinical information grouped by the International Classification of Function, Disability, and Health (ICF) framework was assessed for utilization (Table 1). Participants were also asked if their testing battery changed based on the sport that the athlete was returning to and whether they would like to use more physical performance testing in their discharge planning. Section III of the survey investigated the participant’s reported barriers limiting the use of physical performance tests to assess activity limitations, the estimated percentage of patients who pass all pre-established physical performance tests prior to discharge, as well any reasons why patients are discharged prior to passing the physical performance tests. Categorical data were used for the frequency of patients passing all physical performance tests with responses of 25% or less considered “rarely,” 26 to 50% considered “sometimes,” 51% to 75% considered “frequently,” and greater than 75% of patients considered “consistently ” The survey instrument is available in APPENDIX 1.
The Consensus-Based Checklist for Reporting of Survey Studies (CROSS) guidelines were followed.34 All survey materials were approved prior to survey distribution by the Institutional Review Board at Baylor University (IRB# 1690573). Participants provided online consent before participating in the study. Inclusion criteria for survey participants were as follows: active, licensed physical therapist; currently treating in a sports or orthopaedic setting. All but three participants completed the survey in its entirety, failing to document their years of experience. However, all data captured was included in the data analysis.
SURVEY DISTRIBUTION
The study design was an international, cross-sectional survey using purposive sampling. The 19-question online survey was distributed via email and social media (Twitter) among sports physical therapists. The survey was sent to members of the American Academy of Sports Physical Therapy (sent to 6,797 members), International Federation
Activity Limitations
Seated Shot-Put Test
Closed Kinetic Chain Upper Extremity Stability Test
Upper Quarter Y-Balance Test
Timed Pushup Test
One Arm Hop Test
Athletic Shoulder Test
Shoulder Arm Return to Sport Test
of Sports Physical Therapy (14,350 members), American Society of Shoulder and Elbow Therapists (106 members), and the European Society for Shoulder and Elbow Rehabilitation (517 members). One reminder was sent to each membership organization one month after the initial email to maximize survey responses. The survey was written in English and was accessible between December 2020 and April 2021.
STATISTICAL ANALYSES
Data were analyzed with SAS statistical software (JMP 16.3, Cary, NC). Participating physical therapist demographics were compared between those with and without sports specialization. Independent t-tests and Chi Square analyses were conducted to determine differences in practice pattern use of physical performance tests by physical therapists with and without specialization and the frequency of potential barriers that may limit the use of these tests. Significance was set at p=.05 with a Bonferroni adjustment to account for multiple comparisons.
RESULTS
Over the four-month collection period, 703 surveys were initiated with 512 being completed with consent (72.83% completion rate). Of those 512 participants, 498 were actively treating patients in a sports or orthopaedics setting (Figure 1). Of the 498 included participants, the mean years of clinical experience reported was 13.1(SD 10.6). The majority of participants (85.1%) were actively treating in the United States (n=424) and 14.9% were actively treating outside of the United States (n=74). Fewer participants (26.9%, n=134) had a sports specialization recognized by their respective country compared to 73.1% (n=364) of participants without. Of all participants, 70% (n=350) estimated that at least a quarter of their patient population present with shoulder or elbow injuries, and 56% (n=218) of participants estimated that at least a quarter of their patients with shoulder or elbow injuries have a goal of return to sport.
Missing The Forest For The Trees: A Lack Of Upper Extremity Physical Performance Testing In Sports Physical Therapy International Journal of Sports Physical Therapy
INFORMATION USED IN RETURN TO SPORT DECISIONS
Using the ICF framework, results for the frequency of items used to make return to sport decisions are shown in Table 2. The most commonly reported factors used by physical therapists to make return to sport decisions using the ICF framework were: 1) impairments identified with range of motion and manual muscle tests, and 2) contextual factors such as patient subjective readiness to return to sport and patient reported outcome measures. Nearly all participants used time from injury to make return to sport decisions, while few participants reported using activity limitations with upper extremity physical performance tests when making return to sport decisions. Almost all participants stated that they tailored their battery of tests based on the sport to which the athlete is returning, and expressed the desire to use more physical performance tests in their return to sport assessments.
Results comparing responses reported by physical therapists with and without sports specialization in the criteria used with upper extremity athletes in return to sport decisions are shown in Figure 2 There were no significant differences (p>0.05) in the use of time from injury or contextual factors. However, sports specialists reported greater use of quantitative evaluation of muscle performance with hand-held-dynamometry (70.5%) than non-specialists (50.3%) (p<0.001). Although commonly used by both groups, non-sports specialists also rely on more frequent use of manual muscle testing (p<0.001) in return to sport decisions. Due to the low reported frequency of use isokinetic testing (<20%) overall, there were no significant differences between sports specialists than non-specialists. Most remarkably, sports specialists reported greater use of activity limitation assessments with physical performance
tests. Specifically, 71.6% of sports specialists compared to less than 37% of non-sports specialists use the Closed Kinetic Chain Upper Extremity Stability Test. This was similar with the Upper Quarter Y-Balance Test that was used by 60.5% of sports-specialists compared to 36.0% of nonsports specialists (p<0.001). All the other physical performance tests were used infrequently (<28%) by sports specialists and non-sports specialists (<16%).
BARRIERS TO THE USE OF PHYSICAL PERFORMANCE TESTS
As shown in Table 3, reported barriers to the use of physical performance tests included a lack of time (44.2%) and equipment (51.8%), a perceived lack of evidence supporting the use of upper extremity physical performance tests (38.0%), and a clinician’s lack of understanding of available evidence (50.2%). Lack of patient interest (7.6%) and lack of referral source interest (19.5%) were less commonly cited barriers. There were a few differences between barriers reported by sports specialists and non-sports specialists. Sports specialists were more likely (p<0.001) to cite a perceived lack of evidence supporting the use of upper extremity physical performance tests compared to non-specialists (48.5% versus 34.1%) and less likely (p<0.001) to cite a lack of understanding of available evidence (26.9% versus 58.8%). No other differences in perceived barriers were found between sports specialist and non-specialist groups.

THE FREQUENCY OF USE OF PHYSICAL PERFORMANCE TESTS IN DISCHARGE/RETURN TO SPORT PLANNING
Overall, less than 25% of participants reported that their patients consistently passed all physical performance tests
Figure 1. Participant flow chart
Missing The Forest For The Trees: A Lack Of Upper Extremity Physical Performance Testing In Sports Physical Therapy International Journal of Sports Physical Therapy
*p<0.001

ICF category Frequency that Criteria is Used in RTS Decisions All Respondents (n=498) n % Contextual Factors Timeline from injury 487 97.8 Patient self-reported readiness 464 93.2 Patient reported outcome measures 403 80.9 Impairments, Body Structure, and Function Range of motion 491 98.6 Manual muscle testing 411 82.5 Hand-held dynamometry 277 55.6 Isokinetic testing 98 19.7 Proprioception 283 56.8 Activity Restrictions Seated Shot-Put Test 115 23.1 Closed Kinetic Chain Upper Extremity Stability Test 228 45.8 Upper Quarter Y-Balance Test 212 42.6 Timed Pushup Test 93 18.7 One Arm Hop Test 45 9.0 Athletic Shoulder Test 60 12.0 Shoulder Arm Return to Sport Test 54 10.8
Table 2. Frequency (n and %) of criteria used in return to sports (RTS) decisions by International Classification of Function, Disability, and Health (ICF) framework
Figure 2. Comparison of information used in return to sport decisions between sports specialists (N=134) and non-specialists (N=364).
Missing The Forest For The Trees: A Lack Of Upper Extremity Physical Performance Testing In Sports Physical Therapy International Journal of Sports Physical Therapy
before discharge (Figure 3A). More than a third (36.6%) of sports specialists report patients consistently pass physical performance tests (Figure 3B) compared to less than a quarter (20.6%) of non-specialists (Figure 3C) (p=0.001).
The most cited reason participants report patients with return to sport goals being discharged prior to full physical performance was insurance visit limitation (68.9%), followed by patient self-discharge (67.9%), financial reasons (54.5%), clearance from another healthcare provider (52.8%), and external pressure for the athlete to return to sport (34.5%). Despite the infrequent use of physical performance tests, very few of the participants (2.2%) felt that physical performance tests were not important in discharge planning patients with return to sport goals, suggesting that most therapists believe physical performance tests should be used.
DISCUSSION
The overarching purpose of this study was to explore the reported frequency of physical performance testing in assessing return to sport readiness by physical therapists
treating athletes with upper extremity injuries, and the perceived potential barriers that may limit the use of these tests. The hypothesis that the majority of participants do not use these tests was confirmed as fewer than half of participants reported using any physical performance test in making return to sport decisions for athletic patients with shoulder or elbow injuries. Similarly, the hypothesis that the greatest reported barriers to the use of physical performance tests would be a lack of understanding and awareness of current available literature was partially confirmed as lack of equipment was the most commonly reported barrier, followed by lack of understanding of the literature, lack of time, and perceived lack of literature supporting these tests. The secondary aim of this study was to compare practice patterns of clinicians with sports physical therapy specialty certification to clinicians without this certification. This hypothesis was confirmed as sports specialist clinicians were significantly more likely to use physical performance tests than non-specialist clinicians.

Barrier All Participants (n=498) Sports Specialists (n=134) Non-Specialists (n=364) n % n % n % Lack of time 220 44.2 56 41.8 164 45.1 Lack of equipment 258 51.8 67 50.0 191 52.5 Lack of understanding of literature supporting PPTs 250 50.2 36 26.9 214 58.8 Perceived lack of research supporting use of PPTs 189 38.0 65 48.5 124 34.1 Lack of referral source interest 97 19.5 29 21.6 68 18.7 Lack of patient interest 37 7.6 12 9.0 26 7.1
Table 3. Frequency of reported barriers to the use of physical performance tests
Figure 3. Reported frequency that patients pass all physical performance tests (PPTs) before discharge.
A. All Participants (n=498), B. Sports Specialists (n=134), and C. Non-Sports Specialists (n=364).
Missing The Forest For The Trees: A Lack Of Upper Extremity Physical Performance Testing In Sports Physical Therapy International Journal of Sports Physical Therapy
INFORMATION USED IN RETURN TO SPORT DECISIONS
A particularly striking finding was that fewer than half of all participants (45.2%) utilized any physical performance tests to determine if a patient was appropriate to be cleared for sport, thereby neglecting to assess an athlete’s activity limitations. This percentage is even lower in non-specialist clinicians with only 36.2% of participants using physical performance tests compared to the 71.6% of sports specialist clinicians utilizing physical performance tests. This disparity may be partially explained by the advanced training sports specialists receive in return to sport assessment. However, in addition to assessing impairments, participation, and contextual factors, evaluating activity limitations is considered an entry-level skill by the American Physical Therapy Association (APTA) per their Guide to Physical Therapy Practice 35 The data suggests that, regardless of a clinician’s sports-specialization status, the physical therapy profession is overlooking a significant opportunity to assess activity limitations in this population.
One consideration is whether return to sport testing itself is an assessment that should be employed only with specialized training. The relative paucity of physical performance tests used in return to sport testing coupled with the reported lack of understanding of relevant evidence often results in a knee-jerk reaction to push physical performance tests into entry-level curriculum. However, it is important to first ask whether return to sport testing is truly an entry-level skill or that of an advanced practitioner If it is the latter, this suggests the focus should not be on changing entry-level DPT curriculum but improving post-professional opportunities instead. For US-based specialists, the Description of Specialty Practice (DSP)36 for sports lists the implementation of “functional tests to determine athlete’s ability and readiness to return to sports activities” and implementing “sport-specific criteria and recommendations regarding the athlete’s readiness to return to sport” as activities performed by the board-certified specialist. The Description of Residency Practice (DRP)37 also notes that a residency program must utilize a curriculum that is inclusive of all the learning domains as noted in the Description of Specialty Practice, suggesting that the skills associated with return to sport decision-making are indeed better suited for residency-level education as opposed to entrylevel, and that return to sport decisions are in line with specialty practice. Thus, in order to improve the utilization of physical performance tests in return to sport decision-making, barriers and challenges associated with accessing quality post-professional education should be explored.
BARRIERS TO THE USE OF PHYSICAL PERFORMANCE TESTS IN RETURN TO SPORT PLANNING
A final takeaway from these findings is the distinct need for guidance on the clinical use of upper extremity physical performance tests. There has long been a call for higher quality research on upper extremity physical performance tests in both the healthy and injured athletic population,38 and sports specialists who participated in this study echoed this call as nearly half responded that a perceived lack of
quality evidence is a significant barrier to their use of physical performance tests. However, the most cited barriers for the use of physical performance tests for upper extremity injuries from all participants were a lack of understanding of the current research, a lack of time, and a lack of equipment. These barriers are intricately linked, as a large percentage of physical performance tests currently available require minimal time and equipment to perform. With new literature providing guidance on how to utilize existing physical performance tests, each of these barriers can be considerably lessened. Considering these responses, the authors believe that the need for literature providing guidance on the use of upper extremity physical performance tests may be greater than the need for literature validating their use.
This study is not without limitations. First, while the study was distributed through the mailing lists of several professional organizations, it was also shared via social media limiting the ability to calculate an overall response rate. Second, in distributing through the mailing list of sports rehabilitation-specific organizations, there may have been somewhat of a selection bias as this clinician population may be more inclined to use physical performance tests than clinicians that do not belong to these sports rehabilitation organizations. That said, based on the current data comparing sports specialists to non-specialist clinicians, it is very possible that including a greater population of non-specialist clinicians would result in an even lower percentage of individuals reporting the use of upper extremity physical performance tests. Finally, while the survey was distributed internationally, most participants were US clinicians. As a result, these practice patterns may be generalized to physical therapist practice within the United States, but not necessarily indicative of practice patterns globally.
CONCLUSION
The results of this survey suggest that the vast majority of clinicians are not using physical performance tests in making return to sport decisions for athletes with upper extremity injuries. By omitting these tests, and neglecting to assess an athlete’s activity limitations, physical therapists are “missing the forest for the trees” and may be returning athletes to sport before full physical performance. While sports specialist clinicians are more likely to utilize these tests to assess an athlete’s activity limitations, all participants highlighted a perceived lack of supporting research, a lack of understanding of current research, and a lack of time and equipment to perform these tests in the clinic. Strategies recommended to overcome these barriers include increasing the emphasis on assessing activity limitations for return to sport clinical decision making in entry-level and post-professional education, reducing the barriers and challenges associated with accessing post-professional education, and developing clinical guidelines for the utilization of physical performance tests in athletes with upper extremity injuries.
Missing The Forest For The Trees: A Lack Of Upper Extremity Physical Performance Testing In Sports Physical Therapy International Journal of Sports Physical Therapy
CONFLICTS OF INTEREST
Authors have no reported conflicts of interest.
Submitted: November 08, 2022 CDT, Accepted: February 13, 2023 CDT
This is an open-access article distributed under the terms of the Creative Commons Attribution 4.0 International License (CCBY-NC-4.0). View this license’s legal deed at https://creativecommons.org/licenses/by-nc/4.0 and legal code at https://creativecommons.org/licenses/by-nc/4.0/legalcode for more information.
Missing The Forest For The Trees: A Lack Of Upper Extremity Physical Performance Testing In Sports Physical Therapy International Journal of Sports Physical Therapy
REFERENCES
1. Beaulieu-Jones BR, Rossy WH, Sanchez G, et al. Epidemiology of injuries identified at the NFL scouting combine and their impact on performance in the National Football League: Evaluation of 2203 athletes from 2009 to 2015. Orthop J Sports Med 2017;5(7):2325967117708744. doi:10.1177/232596711 7708744
2. Pritchard C, Mills S, Funk L, Batty P Incidence and management of shoulder injuries in Premier League professional football players. Br J Sports Med 2011;45(15):A15-A15. doi:10.1136/bjsports-2011-090 606.48
3. Goodman AD, Raducha JE, DeFroda SF, Gil JA, Owens BD Shoulder and elbow injuries in NCAA football players, 2009–2010 through 2013–2014. Phys Sportsmed 2019;47(3):323-328. doi:10.1080/0091384 7.2018.1554167
4. Gardner EC, Chan WW, Sutton KM, Blaine TA. Shoulder injuries in men’s collegiate lacrosse, 2004-2009. Am J Sports Med 2016;44(10):2675-2681. doi:10.1177/0363546516644246
5. Tummala SV, Hartigan DE, Patel KA, Makovicka JL, Chhabra A. Shoulder injuries in National Collegiate Athletic Association quarterbacks: 10-year epidemiology of incidence, risk factors, and trends. Orthop J Sports Med 2018;6(2):232596711875682. do i:10.1177/2325967118756826
6. Kaplan LD, Flanigan DC, Norwig J, Jost P, Bradley J. Prevalence and variance of shoulder injuries in elite collegiate football players. Am J Sports Med. 2005;33(8):1142-1146. doi:10.1177/036354650527471 8
7. Hams A, Evans K, Adams R, Waddington G, Witchalls J. Epidemiology of shoulder injury in subelite level water polo players. Phys Ther Sport 2019;35:127-132. doi:10.1016/j.ptsp.2018.12.001
8. Fares MY, Fares J, Baydoun H, Fares Y. Prevalence and patterns of shoulder injuries in Major League Baseball. Phys Sportsmed. 2020;48(1):63-67. doi:10.10 80/00913847.2019.1629705
9. Laudner K, Sipes R. The incidence of shoulder injury among collegiate overhead athletes. J Intercoll Sport. 2009;2(2):260-268. doi:10.1123/jis.2.2.260
10. Conte S, Requa RK, Garrick JG. Disability days in major league baseball. Am J Sports Med 2001;29(4):431-436. doi:10.1177/03635465010290040 801
11. Maier J, Oak SR, Soloff L, Schickendantz M, Frangiamore S. Management of common upper extremity injuries in throwing athletes: A critical review of current outcomes. JSES Rev Rep Tech 2021;1(4):295-300. doi:10.1016/j.xrrt.2021.08.007
12. Ciccotti MG, Pollack KM, Ciccotti MC, et al. Elbow injuries in professional baseball: Epidemiological findings from the Major League Baseball injury surveillance system. Am J Sports Med. 2017;45(10):2319-2328. doi:10.1177/03635465177069 64
13. Conte SA, Fleisig GS, Dines JS, et al. Prevalence of ulnar collateral ligament surgery in professional baseball players. Am J Sports Med 2015;43(7):1764-1769. doi:10.1177/036354651558079
14. Pytiak AV, Kraeutler MJ, Currie DW, McCarty EC, Comstock RD. An epidemiological comparison of elbow injuries among United States high school baseball and softball players, 2005-2006 through 2014-2015. Sports Health. 2017;10(2):119-124. doi:1 0.1177/1941738117736493
15. Kwapisz A, Shanley E, Momaya AM, et al. Does functional bracing of the unstable shoulder improve return to play in scholastic athletes? Returning the unstable shoulder to play Sports Health 2021;13(1):45-48. doi:10.1177/1941738120942239
16. Shanley E, Thigpen C, Brooks J, et al. Return to sport as an outcome measure for shoulder instability: Surprising findings in nonoperative management in a high school athlete population. Am J Sports Med 2019;47(5):1062-1067 doi:10.1177/036354651982976 5
17. Dickens JF, Rue JP, Cameron KL, et al. Successful return to sport after arthroscopic shoulder stabilization versus nonoperative management in contact athletes with anterior shoulder instability: A prospective multicenter study Am J Sports Med 2017;45(11):2540-2546. doi:10.1177/03635465177125 05
18. Alentorn-Geli E, Álvarez-Díaz P, Doblas J, et al. Return to sports after arthroscopic capsulolabral repair using knotless suture anchors for anterior shoulder instability in soccer players: Minimum 5-year follow-up study. Knee Surg Sports Traumatol Arthrosc 2016;24(2):440-446. doi:10.1007/s00167-01
5-3895-y
2
Missing The Forest For The Trees: A Lack Of Upper Extremity Physical Performance Testing In Sports Physical Therapy International Journal of Sports Physical Therapy
19. Aboalata M, Plath JE, Seppel G, Juretzko J, Vogt S, Imhoff AB. Results of arthroscopic bankart repair for anterior-inferior shoulder instability at 13-year follow-up. Am J Sports Med. 2017;45(4):782-787. doi:1 0.1177/0363546516675145
20. Walker CM, Genuario JW, Houck DA, Murayama S, Mendez H, Noonan TJ. Return-to-play outcomes in professional baseball players after nonoperative treatment of incomplete medial ulnar collateral ligament injuries: A long-term follow-up study. Am J Sports Med 2021;49(5):1137-1144. doi:10.1177/03635
46521996706
21. Ford GM, Genuario J, Kinkartz J, Githens T, Noonan T. Return-to-play outcomes in professional baseball players after medial ulnar collateral ligament injuries: Comparison of operative versus nonoperative treatment based on magnetic resonance imaging findings. Am J Sports Med 2016;44(3):723-728. doi:10.1177/0363546515621756
22. Saper M, Shung J, Pearce S, Bompadre V, Andrews JR. Outcomes and return to sport after ulnar collateral ligament reconstruction in adolescent baseball players. Orthop J Sports Med 2018;6(4):2325967118769328. doi:10.1177/232596711
8769328
23. Wilk KE, Bagwell MS, Davies GJ, Arrigo CA. Return to sport participation criteria following shoulder injury: A clinical commentary. Int J Sports Phys Ther 2020;15(4):624-642. doi:10.26603/ijspt202
00624
24. Wilson KW, Popchak A, Li RT, Kane G, Lin A. Return to sport testing at 6 months after arthroscopic shoulder stabilization reveals residual strength and functional deficits. J Shoulder Elbow Surg. 2020;29(7):S107-S114. doi:10.1016/j.jse.2020.04.035
25. Makhni EC, Lee RW, Morrow ZS, Gualtieri AP, Gorroochurn P, Ahmad CS. Performance, return to competition, and reinjury after Tommy John surgery in Major League Baseball pitchers: A review of 147 cases. Am J Sports Med. 2014;42(6):1323-1332. doi:1 0.1177/0363546514528864
26. Carr JB II, Camp CL, Dines JS. Elbow ulnar collateral ligament injuries: Indications, management, and outcomes. Arthroscopy. 2020;36(5):1221-1222. doi:10.1016/j.arthro.2020.02.0 22
27. Policastro PO, Camargo PR. Return to play after a shoulder injury: Let’s not put the cart before the horse! Int J Sports Phys Ther 2022;17(4):548-550. do i:10.26603/001c.35574
28. Hegedus EJ, Cook CE. Return to play and physical performance tests: evidence-based, rough guess or charade? Br J Sports Med 2015;49(20):1288-1289. do i:10.1136/bjsports-2015-094796
29. Kaplan Y, Witvrouw E. When is it safe to return to sport after ACL reconstruction? Reviewing the criteria. Sports Health 2019;11(4):301-305. doi:10.11 77/1941738119846502
30. Burgi CR, Peters S, Ardern CL, et al. Which criteria are used to clear patients to return to sport after primary ACL reconstruction? A scoping review. Br J Sports Med 2019;53(18):1154-1161. doi:10.1136/ bjsports-2018-099982
31. Kyritsis P, Bahr R, Landreau P, Miladi R, Witvrouw E. Likelihood of ACL graft rupture: Not meeting six clinical discharge criteria before return to sport is associated with a four times greater risk of rupture. Br J Sports Med 2016;50(15):946-951. doi:10.1136/bjs ports-2015-095908
32. Unverzagt C, Andreyo E, Tompkins J. ACL return to sport testing: It’s time to step up our game. Int J Sports Phys Ther 2017;16(4):1169-1177 doi:10.2660 3/001c.25463
33. Pontillo M, Sennett BJ, Bellm E. Use of an upper extremity functional testing algorithm to determine return to play readiness in collegiate football players: A case series. Int J Sports Phys Ther 2020;15(6):1141-1150. doi:10.26603/ijspt20201141
34. Sharma A, Minh Duc NT, Luu Lam Thang T, et al. A consensus-based checklist for reporting of survey studies (CROSS). J Gen Intern Med 2021;36(10):3179-3187. doi:10.1007/s11606-021-0673
7-1
35. American Physical Therapy Association. APTA Guide to Physical Therapist Practice 3.0. APTA Guide to Physical Therapist Practice. Published 2019. Accessed August 17, 2022. https://guide.apta.org/
36. American Board of Physical Therapy Specialties. Sports Physical Therapy Description of Specialty Practice. APTA Specialist Certification - Governed by ABPTS. Published January 1, 2013. Accessed August 17, 2022. https://specialization.apta.org/become-a-sp ecialist/sports/dsp
37 American Board of Physical Therapy Education Residency and Fellowship. Sports Physical Therapy Description of Residency Practice. American Board of Physical Therapy Education Residency and Fellowship. Published June 1, 2017 Accessed September 6, 2022. https://abptrfe.apta.org/for-progr ams/clinical-programs/sports
Missing The Forest For The Trees: A Lack Of Upper Extremity Physical Performance Testing In Sports Physical Therapy International Journal of Sports Physical Therapy
38. Tarara DT, Fogaca LK, Taylor JB, Hegedus EJ. Clinician-friendly physical performance tests in athletes part 3: a systematic review of measurement properties and correlations to injury for tests in the upper extremity Br J Sports Med 2016;50(9):545-551. doi:10.1136/bjsports-2015-095198
Missing The Forest For The Trees: A Lack Of Upper Extremity Physical Performance Testing In Sports Physical Therapy International Journal of Sports Physical Therapy
SUPPLEMENTARY MATERIALS
Appendix
Download: https://ijspt.scholasticahq.com/article/73791-missing-the-forest-for-the-trees-a-lack-of-upper-extremityphysical-performance-testing-in-sports-physical-therapy/attachment/ 154143.docx?auth_token=_8nk9HwaeoY1WrrTS0Ou
Missing The Forest For The Trees: A Lack Of Upper Extremity Physical Performance Testing In Sports Physical Therapy International Journal of Sports Physical Therapy
Diagnostic Imaging for Distal Extremity Injuries in Direct Access Physical Therapy: An Observational Study
Michael S Crowell
1
1 a ,
John S Mason
2 ,
Jamie B Morris
1 ,
Max K Dummar
1 ,
Paul A Kuwik1
Baylor University - Keller Army Community Hospital Division 1 Sports Physical Therapy Fellowship, 2 Army-Baylor Doctoral Program in Physical Therapy
Keywords: physical therapy, direct-access, fracture. https://doi.org/10.26603/001c.73314
International Journal of Sports Physical Therapy
Background
Military physical therapists practicing direct-access routinely utilize diagnostic imaging and numerous published case reports demonstrate the ability of physical therapists to diagnose and appropriately disposition patients with foot/ankle and wrist/hand fractures. However, no larger cohort studies have explored the utilization of diagnostic imaging by physical therapists to detect fractures.
Hypothesis/Purpose
To describe the utilization of diagnostic imaging in foot/ankle and wrist/hand injuries by physical therapists in a direct-access sports physical therapy clinic.
Study Design
Retrospective cohort study
Methods
The Agfa Impax Client 6 image viewing software (IMPAX) was searched from 2014 to 2018 for patients with diagnostic imaging ordered for foot/ankle and wrist/hand injuries. The Armed Forces Health Longitudinal Technology Application (AHLTA) electronic medical record was independently reviewed by the principal and co-investigator physical therapists. Data extracted were demographics and elements from the patient history and physical examination.
Results
In foot/ankle injuries, physical therapists diagnosed a fracture in 16% of the 177 cases and waited for an average of 3.9 days and 1.3 visits before ordering imaging. In wrist/ hand injuries, physical therapists diagnosed a fracture in 24% of the 178 cases and waited for an average of 3.7 days and 1.2 visits before ordering imaging. The time to definitive care from the initial physical therapy evaluation was significantly different (p = 0.04) for foot/ankle fractures (0.6 days) compared to wrist/hand fractures (5.0 days). The Ottawa Ankle Rules demonstrated a negative likelihood ratio (-LR) of 0.11 (0.02, 0.72) and a positive likelihood ratio (+LR) of 1.99 (1.62, 2.44) for the diagnosis of foot/ankle fracture.
Conclusions
Physical therapists utilizing diagnostic imaging in a direct-access sports physical therapy clinic diagnosed fractures in similar proportions for foot/ankle and wrist/hand injuries and quickly dispositioned patients to definitive care for those fractures. The diagnostic accuracy of the Ottawa Ankle Rules was similar to previously reported values.
CORRESPONDING AUTHOR: Michael S Crowell, PT, DSc Baylor University – Keller Army Community Hospital Division 1 Sports Physical Therapy Fellowship 900 Washington Road, West Point, NY, 10966, USA michaelcrowell99@gmail.com; (912) 656-1562
Original Research
a Crowell MS,
JB,
MK, Kuwik PA. Diagnostic Imaging for Distal Extremity Injuries in Direct Access Physical Therapy: An Observational Study. IJSPT Published online April 2, 2023:431-438. doi:10.26603/001c.73314
Mason JS, Morris
Dummar
INTRODUCTION
Musculoskeletal injuries are the leading cause of disability worldwide, affecting approximately 1.7 billion people.1 In the United States, musculoskeletal injuries affect one in two Americans, resulting in 62.7 million medical visits and $53.1 billion in direct treatment costs.2 The annual cost for treatment and lost wages is a staggering $980 billion.2 In addition to monetary cost, musculoskeletal injuries limit mobility, leading to early retirement, reduced well-being, and reduced societal participation.1
Participation in athletic activities produces a substantial number of injuries. Each year, 4.2 million sports injuries require medical attention; 61% of these injuries involve the musculoskeletal system.2 In collegiate athletics, the overall rate of injury is estimated to be 13.8 per 1000 exposures during games and 4.0 injuries per 1000 exposures during practices.3 For a team of 50 athletes, this equates to one injury for every two games and one injury for every five practices.
Severe injuries (those that restrict participation for greater than three weeks, cause an athlete to discontinue the season, or extend beyond the current athletic season) comprise 9.5% of all injuries reported to the National Collegiate Athletic Association (NCAA), with an estimated rate of 0.7 per 1000 exposures.4 Of all severe injuries, 14.4% were fractures.4 Severe injuries to the foot/ankle and wrist/ hand are common. In NCAA football, foot/ankle injuries occur at a rate of 1.5 per 1000 exposures, with the most common being fractures of the metatarsal (0.03 per 1000 exposures), malleolus (0.02 per 1000 exposures), and phalanx (0.01 per 1000 exposures).5 When examining differences in ankle injuries between athletic settings, fractures account for 3.8% of high school injuries but only 0.8% of collegiate injuries.6 The rate of wrist/hand injuries in all NCAA sports is 0.5 per 1000 exposures, with the most common being metacarpal fractures (0.51 per 1000 exposures) and phalangeal fractures (0.5 per 1000 exposures).7
In the military, 50% of Army soldiers sustain a new injury annually 8–11 These injuries contribute to over one million medical encounters and over 10 million limited duty days per year 8,10–12 In a two-month study of 1,475 Soldiers across a variety of units, medical care associated with the treatment of musculoskeletal injuries exceeded $1.3 million ($1.9K per injury).9 Among 417 Marine Corps recruits, over 50% sustained a musculoskeletal injury during the 11 or 12-week training period.13
Physical therapists practicing direct-access care in the military routinely utilize diagnostic imaging within their differential diagnosis and clinical reasoning processes. This model of early access to physical therapy reduces unnecessary imaging and healthcare costs and improves outcomes.14–16 Two recent studies of diagnostic imaging in physical therapy demonstrated that physical therapists order imaging appropriately, with 83-91% of cases judged to be appropriate according to the American College of
Radiology (ACR) Criteria.17,18 Physical therapists also utilize imaging safely; no adverse events were reported in over 1,000 imaging studies in a recent study examining the practice of military physical therapists.16 When comparing physical therapists to primary care providers using data from a nationally standardized healthcare performance measure, physical therapists were more likely to adhere to low back pain imaging guidelines in young, athletic patients.19
Physical therapists have demonstrated the ability to identify fractures when operating in a direct-access setting. Numerous case reports from a direct-access sports physical therapy clinic have been published that highlight the ability of physical therapists to appropriately recognize and disposition patients with foot/ankle and wrist/hand fractures.20–30 Among non-military physical therapists who are not currently able to refer patients directly to a radiologist, 55 to 95% reported routinely performing the nine fundamental skills in their clinical practice that are necessary to utilize diagnostic imaging effectively.31 The Ottawa Ankle Rules are a valid screening tool for foot/ankle fractures,32,33 but have not been studied in a physical therapy direct-access setting.
To the authors’ knowledge, no published cohort studies have explored the utilization of diagnostic imaging to detect fractures by physical therapists in a direct-access practice setting. The purpose of this study was to describe the utilization of diagnostic imaging in acute foot/ankle and wrist/hand injuries by physical therapists in a direct-access sports physical therapy clinic. Based on clinical experience and observations, it was hypothesized that: 1. upper extremity imaging would result in a significantly greater proportion of confirmed fracture diagnoses than lower extremity imaging; 2. the average time from initial evaluation to definitive care for patients evaluated by physical therapists and diagnosed with a fracture would be less than five days; 3. the Ottawa Ankle Rules would perform similarly in a direct-access physical therapy setting as in an emergency department; 4. no individual examination item would result in clinically meaningful diagnostic accuracy for the diagnosis of wrist/hand or foot/ankle fractures.
METHODS
This was a retrospective cohort study conducted at Keller Army Community Hospital (KACH) at the United States Military Academy (USMA) at West Point. The Arvin Cadet Physical Therapy Clinic is a direct-access clinic where nearly all USMA Cadets with musculoskeletal injuries and/ or pain are evaluated and treated. All physical therapists possess clinical privileges with the ability to order diagnostic imaging and prescribe a limited number of medications, including non-steroidal anti-inflammatory medications (NSAIDs) and non-opioid analgesics. The Naval Medical Center – Portsmouth Institutional Review Board
Level of Evidence Level 3.
Diagnostic Imaging for Distal Extremity Injuries in Direct Access Physical Therapy: An Observational Study International Journal of Sports Physical Therapy
approved the research design and protocol before data collection.
The Agfa Impax Client 6 (Agfa Healthcare) image viewing software program (IMPAX) was searched with a location code for the Arvin Physical Therapy Clinic from June 2014 to June 2018 for patients with diagnostic imaging ordered for foot/ankle and wrist/hand injuries. More recent records were not utilized due to a nomenclature change that prevented an accurate search for the specific body regions of interest. For each patient identified, the Armed Forces Health Longitudinal Technology Application (AHLTA) electronic medical records (EMR) were independently reviewed by the principal and co-investigator physical therapists. All reviewing physical therapists held board certification in orthopaedic or sports physical therapy Documentation from physical therapy encounters and radiology exams was extracted and de-identified. Demographic data included patient age and sex, duration of symptoms, and location of symptoms. If a provider’s note did not explicitly state the duration of symptoms in days/weeks/months, seven days was input for acute symptoms, 30 days for subacute symptoms, and 90 days for chronic symptoms.34 Table 1 shows specific variables of interest for foot/ankle and wrist/hand injury data extraction, which were identified based on the clinical experience of the authors practicing in this setting. The status on the Ottawa Ankle Rules was recorded for all foot and ankle injuries. When an element of the patient history or physical examination was not reported in the patient note, it was coded as a “negative” finding. Variables of interest for all injuries included: (1) diagnosis of a fracture, (2) number of physical therapy visits before the imaging order, (3) amount of time from initial physical therapy evaluation to the imaging order, and (4) amount of time from initial physical therapy evaluation to definitive care. As treatment of fractures is beyond the scope of physical therapist practice, the time to definitive care was defined as when an orthopaedic surgeon or orthopaedic physician’s assistant was consulted on the patient’s case, either by the physical therapist via telephone or by the patient in person.
Statistical analyses were performed in Microsoft Excel 365 (Microsoft, Inc) and SPSS version 28.0 (IBM Corp) with α = 0.05 set a priori for all analyses. Descriptive statistics were calculated for demographics, the number of imaging orders resulting in fracture, the time between the initial evaluation and the imaging order, and the time from the initial evaluation to definitive care for fractures. Homogeneity of the data was assessed using Levene’s test and all data were assessed for normal distribution using a ShapiroWilk test. Skewness and kurtosis were also calculated to assess for normal distribution. The nonparametric MannWhitney U test examined differences in time to imaging, visits to imaging, and time from physical therapy evaluation to definitive care between upper and lower extremity injuries, as these data were not normally distributed and had unequal variances. A Chi-square test was used to compare the proportion of fractures identified with upper versus lower extremity imaging orders. The diagnostic accuracy of items from the patient history and physical exam, including the Ottawa Ankle Rules, was examined by cal-
culating sensitivity, specificity, and likelihood ratios with 95% confidence intervals using the PEDro Confidence Interval Calculator (Herbert R. Confidence Interval Calculator (2013). https://pedro.org.au/english/resources/confidenceinterval-calculator/).
RESULTS
From June 2014 to June 2018 with a location code for the Arvin Physical Therapy Clinic, there were 267 imaging orders for foot/ankle injuries and 254 imaging orders for wrist/hand injuries (Figure 1). Because the search was filtered by location and not ordering provider, records were returned that were not ordered by a physical therapist. The final analysis included 177 cases of foot/ankle injuries and 178 cases of wrist/hand injuries ordered by 15 physical therapists. There were 90 cases of foot/ankle injuries and 76 cases of wrist/hand injuries excluded when the imaging was ordered by other medical providers. Demographics are shown in Table 2.
Table 3 shows the cases diagnosed as fractures, the time/ visits to imaging from the initial physical therapy evaluation, and the time to definitive care for diagnosed fractures. Fractures were noted in the radiology report for 16% of the foot/ankle cases and 24% of the wrist/hand cases. There were no significant differences between foot/ankle and wrist/hand injuries for the percentage of imaging orders diagnosed with a fracture or the time in days/visits from initial evaluation to imaging. The physical therapist waited for an average of 3.9 days and 1.3 visits before ordering imaging for foot/ankle injuries and 3.7 days and 1.2 visits for wrist/hand injuries. The time to definitive care from the initial physical therapy evaluation was significantly different (p = 0.04) for foot/ankle fractures (0.6 days) compared to wrist/hand fractures (5.0 days).
The diagnostic accuracy of the Ottawa Ankle Rules in screening for fractures is shown in Figure 2, with a negative likelihood ratio (-LR) of 0.11 (0.02, 0.72) and positive likelihood ratio (+LR) of 1.99 (1.62, 2.44). The diagnostic accuracy of other elements of the patient history and physical examination are shown in Table 4; no individual element of the examination demonstrated acceptable diagnostic accuracy to either rule out or rule in fractures in foot and ankle or wrist and hand injuries.
DISCUSSION
The purpose of this study was to describe the utilization of diagnostic imaging in acute foot/ankle and wrist/hand injuries by physical therapists in a direct-access sports physical therapy clinic. Orders for radiographs resulted in the diagnosis of a fracture in 16% of foot/ankle cases and 24% of wrist/hand cases. The results partially confirmed the hypotheses. For screening for fracture, the diagnostic accuracy of the Ottawa Ankle Rules was similar in this directaccess physical therapy setting as was previously reported in emergency departments. No individual examination item had a clinically meaningful likelihood ratio for the diagnosis of foot/ankle or wrist/hand fractures. The average time
Diagnostic Imaging for Distal Extremity Injuries in Direct Access Physical Therapy: An Observational Study International Journal of Sports Physical Therapy
Table 1. Variables of interest were extracted from the patient history and physical examination within the patient care notes.
Patient History
Patient self-reported outcomes
Injury description/MOI
Physical Examination
Observation
Palpation
Limited range of motion
Special Tests
Foot/Ankle
SANE, NPRS SANE, NPRS
Able to continue activity? (+) pop at time of injury?
Swelling? Ecchymosis?
Location of tenderness
Ankle dorsiflexion
Ankle plantarflexion
Ankle inversion
Ankle eversion
Anterior drawer
Talar tilt
External rotation stress
Squeeze test
Wrist/Hand
Able to continue activity? (+) pop at time of injury?
Swelling? Ecchymosis?
Location of tenderness
Wrist flexion
Wrist extension
Wrist ulnar deviation
Wrist radial deviation
Forearm pronation
Forearm supination
Scaphoid shift
1st MCP varus/valgus
IP varus/valgus
Abbreviations: SANE, Single Assessment Numerical Evaluation; NPRS, Numerical Pain Rating Scale; MOI, mechanism of injury; MCP, metacarpophalangeal.
from the initial physical therapy evaluation to definitive care was less than five days for foot/ankle fractures, but equal to five days for wrist/hand fractures. There were no significant differences in the rate of imaging that resulted in the diagnosis of foot/ankle or wrist/hand fractures. This is the first study to describe how physical therapists working in a direct-access setting utilize diagnostic imaging to diagnose fractures.
The Ottawa Ankle Rules performed similarly in this sample of young, athletic patients evaluated by physical therapists without physician referral compared to patients eval-
 Figure 1. Flow diagram of included and excluded cases. Abbreviations: ER, emergency room.
Foot & Ankle (n=177) Mean (SD) % (n) Age (years) 20.2 (2.0) Sex (female) 22.6% (40) Body Region 0.6% (1) 52.0% (92) 44.6% (79) 2.8% (5) Duration of Symptoms (days) 10.1 (22.9) 82.5% (146) 13.6% (24) 4.0% (7) Wrist & Hand (n=178) Mean (SD) % (n) Age (years) 20.5 (1.9) Sex (female) 19.7% (35) Body Region 55.1% (98) 28.1% (50) 16.9% (30) Duration of Symptoms (days) 18.9 (51.4) 76.4% (136) 18.5% (33) 5.1% (9)
Table 2. Demographics for Patients with Foot/Ankle and Wrist/Hand Radiographs from June 2014 to June 2018.
Abbreviations: SD, standard deviation.
• Tibia • Ankle • Foot • Toe • Acute • Subacute • Chronic • Wrist • Hand • Finger • Acute • Subacute • Chronic Diagnostic Imaging for Distal Extremity Injuries in Direct Access Physical Therapy: An Observational Study International Journal of Sports Physical Therapy
When the element was not reported in the patient note, it was coded as a “negative finding.
uated in an emergency department by emergency medicine physicians and a previous study of similar patients evaluated by orthopaedic surgeons and physical therapists. The Ottawa Ankle Rules were designed to be a screening test, where the -LR is the statistic of most interest. In a 2003 systematic review, the -LR was 0.06 (0.02, 0.19) when applied at less than 48 hours from injury and 0.11 (0.07, 0.18)
when applied greater than 48 hours from injury.32 In a similar population as this study, the Sn of the Ottawa Ankle Rules when used by both orthopaedic surgeons and physical therapists was 1.0 (0.93, 1.0) (because there were no false negative tests, a -LR was unable to be calculated).35 In this study, the -LR was 0.11 (95% CI 0.02, 0.72), with a very large proportion of acute foot/ankle injuries (82.5%, mean dura-
Foot & Ankle (n=177) Mean (SD); % (n) Wrist & Hand (n=178) Mean (SD); % (n) p-value Diagnosis of Fracture (+) 16% (29) 24% (42) 0.09 Time from Evaluation to Imaging (days) 3.9 (12.2) 3.7 (10.2) 0.18 Time from Evaluation to Imaging (visits) 1.3 (0.8) 1.2 (0.6) 0.11 Time from Evaluation to Definitive Care (days) 0.6 (3.5) 5.0 (16.6) 0.04
Table 3. Diagnosis of Fractures and Practice Patterns.
Fracture No Fracture Total Ottawa Ankle Rules (+) 17 69 86 Ottawa Ankle Rules (-) 1 76 77 Ottawa Rules N/A 11 3 14 Total 29 148 177 Sn = 0.94 (0.74, 0.99); Sp 0.52 (0.44, 0.60) +LR 1.99 (1.62, 2.44); -LR 0.11 (0.02, 0.72)
Figure 2. Diagnostic Test Properties of Ottawa Ankle Rules.
Sn Sp +LR -LR Foot & Ankle (n=177) Able to bear weight (patient report) 0.90 (0.74, 0.96) 0.18 (0.12, 0.25) 1.09 (0.94, 1.26) 0.59 (0.19, 1.82) Able to continue activity (patient report) 0.45 (0.28, 0.62) 0.53 (0.45, 0.61) 0.96 (0.62, 1.49) 1.03 (0.42, 2.07) (+) Report of “pop” (patient report) 0.10 (0.04, 0.26) 0.89 (0.83, 0.92) 0.96 (0.30, 3.07) 1.00 (0.88, 1.15) (+) Swelling (physical exam) 0.59 (0.41, 0.74) 0.35 (0.28, 0.43) 0.90 (0.65, 1.26) 1.18 (0.73, 1.91) (+) Ecchymosis (physical exam) 0.24 (0.12, 0.42) 0.79 (0.71, 0.84) 1.15 (0.56, 2.36) 0.96 (0.77, 1.20) (+) Tenderness to palpation (physical exam) 1.00 (0.83, 1.00) 0.03 (0.01, 0.07) 1.03 (1.00, 1.06) 0.00 --Wrist & Hand (n=178) Able to continue activity (patient report) 0.38 (0.25, 0.52) 0.62 (0.53, 0.70) 1.00 (0.64, 1.55) 1.00 (0.76, 1.32) (+) Report of “pop” (patient report) 0.07 (0.02, 0.19) 0.96 (0.91, 0.98) 1.62 (0.42, 6.20) 0.97 (0.89, 1.06) (+) Swelling (physical exam) 0.60 (0.44, 0.73) 0.52 (0.44, 0.60) 1.25 (0.92, 1.69) 0.78 (0.52, 1.16) (+) Ecchymosis (physical exam) 0.26 (0.15, 0.41) 0.86 (0.79, 0.91) 1.88 (0.97, 3.62) 0.86 (0.71, 1.04) (+) Tenderness to palpation (physical exam) 0.88 (0.75, 0.95) 0.09 (0.05, 0.15) 0.97 (0.85, 1.09) 1.35 (0.50, 3.61)
Table 4. Diagnostic Test Properties for Elements of the Patient History and Physical Examination.
Diagnostic Imaging for Distal Extremity Injuries in Direct Access Physical Therapy: An Observational Study International Journal of Sports Physical Therapy
tion of symptoms 10.1 days), equal to the value reported by Bachman et al at greater 48 hours from injury.
Although the time from the initial physical therapy evaluation to definitive treatment was significantly different for foot/ankle and wrist/hand fractures, it was less than one week in both regions. On average, those with foot/ankle fractures were definitively treated within 24 hours, while those with wrist/hand fractures were definitively treated in less than one week. According to the American College of Radiology (ACR) Appropriateness Criteria for acute ankle pain, the current clinical imaging guidelines to determine if radiographs are necessary are the Ottawa Ankle Rules.36 For the initial imaging of suspected acute hand and wrist trauma, the ACR Appropriateness Criteria state that radiography is always indicated.37 It was not feasible to determine the proportion of patients that had imaging ordered and the ACR Appropriateness Criteria recommendations for radiographs are more clear for acute foot/ankle injuries than acute wrist/hand injuries. Differences between the two regions may be due to the absence of clinical decision rules in the upper extremity and/or the need for repeat radiographs to effectively rule out fractures in the early stages (i.e., scaphoid).
Fractures were diagnosed by physical therapists in 1.6 out of every ten foot/ankle radiographs and 2.4 out of every ten wrist/hand radiographs. While radiographs are often ordered to rule out fractures, this means that physical therapists “hit the target” more frequently when ordering wrist/ hand radiographs. Keil et al retrospectively analyzed 108 diagnostic imaging referrals by civilian physical therapists practicing in a direct-access setting.17 Among 13 orders for foot/ankle or wrist/hand radiographs, they reported seven fractures, which equates to 54% of all radiographs. The difference in the proportion of radiograph orders that resulted in a fracture diagnosis may have been due to differences in the patient populations, although the demographics of the patients were not reported in the Keil et al study
There are several limitations to this study. The patients whose cases were reviewed were all young, physically active Cadets at a single military medical facility, which may limit generalizability to other populations and age groups. This was a retrospective study While the patient notes for each case were thoroughly reviewed, providers may have made verbal recommendations or failed to document information that was not reflected in the electronic medical record. Specifically, when an element of the patient history or physical exam was missing (i.e., ability to continue play, etc.), we coded that element as negative. While many military physical therapists do not document all negative find-
ings, this may have affected the calculation of diagnostic accuracy. Five board-certified physical therapists reviewed imaging orders and extracted results from the official radiologist’s report, which is a potential source of bias for the observational results. The physical therapists reviewing the cases had to make judgments on the presence or absence of elements of the examination when there was missing or incomplete information. The only cases of foot/ankle and wrist/hand injuries studied were those referred for diagnostic imaging and do not represent the entire sample of patients with injuries to those regions, thus creating selection bias in the calculation of diagnostic accuracy
CONCLUSION
Physical therapists utilizing diagnostic imaging in a directaccess sports physical therapy clinic diagnosed fractures when ordering radiographs in 16% of foot/ankle cases and 24% of wrist/hand cases. The diagnostic accuracy of the Ottawa Ankle Rules was similar to previously reported values and no individual examination item was able to assist in fracture diagnosis. The average time from the initial physical therapy evaluation to definitive care was short in both foot/ankle and wrist/hand fractures. Future research should utilize larger data sets available in both civilian and military electronic medical record systems to explore the impact of direct-access physical therapy on fracture management and identify clusters of tests that may assist in the diagnosis of various wrist/hand and foot/ankle fractures.
DISCLAIMER
The opinions or assertions contained herein are the private views of the authors and are not to be construed as official or reflecting the views of the United States Army or Department of Defense.
ETHICS APPROVAL
Study was approved by the Naval Medical Center Portsmouth Institutional Review Board (RHC-A-20-051).
Submitted: December 16, 2022 CDT, Accepted: February 13, 2023 CDT This is an open-access article distributed under the terms of the Creative Commons Attribution 4.0 International License (CCBY-NC-4.0). View this license’s legal deed at https://creativecommons.org/licenses/by-nc/4.0 and legal code at https://creativecommons.org/licenses/by-nc/4.0/legalcode for more information.
Diagnostic Imaging for Distal Extremity Injuries in Direct Access Physical Therapy: An Observational Study International Journal of Sports Physical Therapy
REFERENCES
1. Musculoskeletal Health [Fact Sheet]. Published July 14, 2022. Accessed November 2, 2022. https://www w ho.int/news-room/fact-sheets/detail/musculoskeleta l-conditions
2. United States Bone and Joint Initiative. The burden of musculoskeletal diseases in the United States. Accessed November 2, 2022. https://www.boneandjoi ntburden.org/
3. Hootman JM, Dick R, Agel J. Epidemiology of collegiate injuries for 15 sports: Summary and recommendations for injury prevention initiatives. J Athl Train. 2007;42(2):9.
4. Kay MC, Register-Mihalik JK, Gray AD, Djoko A, Dompier TP, Kerr ZY The epidemiology of severe injuries sustained by National Collegiate Athletic Association student-athletes, 2009–2010 through 2014–2015. J Athl Train 2017;52(2):117-128. doi:10.4 085/1062-6050-52.1.01
5. Lievers WB, Adamic PF. Incidence and severity of foot and ankle injuries in men’s collegiate American football. Orthop J Sports Med. 2015;3(5):232596711558159. doi:10.1177/2325967115 581593
6. Wiersma AJ, Brou L, Fields SK, Comstock RD, Kerr ZY. Epidemiologic comparison of ankle injuries presenting to US emergency departments versus high school and collegiate athletic training settings. Inj Epidemiol. 2018;5(1):33. doi:10.1186/s40621-018-016 3-x
7 Holoyda KA, Donato DP, Magno-Padron DA, Simpson AM, Agarwal JP. Hand and wrist injuries among collegiate athletes vary with athlete division. Inj Epidemiol. 2021;8(1):69. doi:10.1186/s40621-021-0 0363-5
8. Hauret KG, Bedno S, Loringer K, Kao TC, Mallon T, Jones BH. Epidemiology of exercise- and sportsrelated injuries in a population of young, physically active adults: a survey of military servicemembers. Am J Sports Med. 2015;43(11):2645-2653. doi:10.117 7/0363546515601990
9. Teyhen DS, Goffar SL, Shaffer SW, et al. Incidence of musculoskeletal injury in US Army unit types: a prospective cohort study. J Orthop Sports Phys Ther. 2018;48(10):749-757 doi:10.2519/jospt.2018.7979
10. US Army Public Health Center 2017 Health of the Force Report US Army Public Health Center; 2018. Accessed November 26, 2019. https://phc.amedd.arm y.mil/news/Pages/PublicationDetails.aspx?type=Healt h+of+the+Force+Report
11. US Army Public Health Center. 2018 Health of the Force Report US Army Public Health Center; 2019. Accessed November 26, 2019. https://phc.amedd.arm y.mil/news/Pages/PublicationDetails.aspx?type=Healt h+of+the+Force+Report
12. Hauret KG, Jones BH, Bullock SH, CanhamChervak M, Canada S. Musculoskeletal injuries description of an under-recognized injury problem among military personnel. Am J Prev Med 2010;38(1 Suppl):S61-70. doi:10.1016/j.amepre.2009.10.021
13. Almeida SA, Trone DW, Leone DM, Shaffer RA, Patheal SL, Long K. Gender differences in musculoskeletal injury rates: a function of symptom reporting? Med Sci Sports Exerc 1999;31(12):1807 do i:10.1097/00005768-199912000-00017
14. Daker-White G, Carr AJ, Harvey I, et al. A randomised controlled trial. Shifting boundaries of doctors and physiotherapists in orthopaedic outpatient departments. J Epidemiol Community Health 1999;53(10):643-650. doi:10.1136/jech.53.1 0.643
15. Ojha HA, Snyder RS, Davenport TE. Direct access compared with referred physical therapy episodes of care: a systematic review Phys Ther 2014;94(1):14-30. doi:10.2522/ptj.20130096
16. Mabry LM, Notestine JP, Moore JH, Bleakley CM, Taylor JB. Safety events and privilege utilization rates in advanced practice physical therapy compared to traditional primary care: an observational study. Mil Med Published online July 19, 2019:usz176. doi:10.10 93/milmed/usz176
17. Keil AP, Baranyi B, Mehta S, Maurer A. Ordering of diagnostic imaging by physical therapists: a 5-Year retrospective practice analysis. Phys Ther. 2019;99(8):1020-1026. doi:10.1093/ptj/pzz015
18. Crowell MS, Dedekam EA, Johnson MR, Dembowski SC, Westrick RB, Goss DL. Diagnostic imaging in a direct-access sports physical therapy clinic: a 2-year retrospective practice analysis. Int J Sports Phys Ther. 2016;11(5):708-717.
Diagnostic Imaging for Distal Extremity Injuries in Direct Access Physical Therapy: An Observational Study International Journal of Sports Physical Therapy
19. Crowell MS, Mason JS, McGinniss JH. Musculoskeletal imaging for low back pain in direct access physical therapy compared to primary care: an observational study. Int J Sports Phys Ther. 2022;17(2). doi:10.26603/001c.31720
20. Borawski J, Dawson LK, Crowell MS. Anterior process of the calcaneus fracture following an acute ankle sprain. JOSPT Cases. Published online November 15, 2021:220-221. doi:10.2519/josptcases.2 021.10563
21. Carreño LM, Crowell MS. Lateral process of the talus fracture. JOSPT Cases Published online October 17, 2022:1-6. doi:10.2519/josptcases.2022.11138
22. Dauber JA, Naspinsky SR. Radial head fracture following a fall. J Orthop Sports Phys Ther 2010;40(1):30-30. doi:10.2519/jospt.2010.0401
23. East K, Dedekam E, Goss D. Acute fracture of the third metacarpal in a handball player J Orthop Sports Phys Ther 2020;50(1):44-44. doi:10.2519/jospt.2020.9 034
24. Johnson MR, Fogarty BT, Alitz C, Gerber JP. NonFOOSH scaphoid fractures in young athletes: a case series and short clinical review. Sports Health. 2013;5(2):183-185. doi:10.1177/1941738112464762
25. Mason JS, Crowell MS, Goss DL. Fracture of the scaphoid during a bench-press exercise. J Orthop Sports Phys Ther. 2015;45(8):642-642. doi:10.2519/jos pt.2015.0408
26. Shepard NP, Westrick RB, Johnson MR. Fracture of the capitate. J Orthop Sports Phys Ther. 2014;44(7):541-541. doi:10.2519/jospt.2014.0408
27 Thelen MD Identification of a high-risk anterior tibial stress fracture. J Orthop Sports Phys Ther. 2010;40(12):833-833. doi:10.2519/jospt.2010.0420
28. Watson DJ, Dolbeer JA. C6 Spinous process fracture in a young adult. J Orthop Sports Phys Ther. 2017;47(9):692-692. doi:10.2519/jospt.2017.7357
29. Westrick RB, Diebal AR, Gerber JP Dorsal triquetrum fracture. J Orthop Sports Phys Ther 2012;42(4):380-380. doi:10.2519/jospt.2012.0407
30. Goss DL, Moore JH, Thomas DB, DeBerardino TM. Identification of a fibular fracture in an intercollegiate football player in a physical therapy setting. J Orthop Sports Phys Ther. 2004;34(4):182-186. doi:10.2519/jospt.2004.1310
31. Mabry LM, Severin R, Gisselman AS, et al. Physical therapists are routinely performing the requisite skills to directly refer for musculoskeletal imaging: an observational study J Man Manip Ther 2022;30(5):261-272. doi:10.1080/10669817.2022.2106 729
32. Bachmann LM, Kolb E, Koller MT, Steurer J. Accuracy of Ottawa ankle rules to exclude fractures of the ankle and mid-foot: systematic review. 2003;326:7
33. Stiell IG. Decision rules for the use of radiography in acute ankle injuries. Refinement and prospective validation. J Am Med Assoc 1993;269(9):1127-1132. d oi:10.1001/jama.269.9.1127
34. Banerjee S, Argáez C. Multidisciplinary Treatment Programs for Patients with Acute or Subacute Pain: A Review of Clinical Effectiveness, Cost-Effectiveness, and Guidelines. Canadian Agency for Drugs and Technologies in Health; 2019. Accessed January 23, 2023. http://www.ncbi.nlm.nih.gov/books/NBK54600 2/
35. Springer BA, Arciero RA, Tenuta JJ, Taylor DC. A prospective study of modified Ottawa ankle rules in a military population: interobserver agreement between physical therapists and orthopaedic surgeons. Am J Sports Med 2000;28(6):864-868. doi:1 0.1177/03635465000280061501
36. American College of Radiology ACR
Appropriateness Criteria®: Acute Trauma to the Ankle. Accessed January 25, 2023. https://acsearch.ac r.org/docs/69436/Narrative/
37 American College of Radiology ACR
Appropriateness Criteria®: Acute Hand and Wrist Trauma. Accessed January 25, 2023. https://acsearc h.acr.org/docs/69418/Narrative/
Diagnostic Imaging for Distal Extremity Injuries in Direct Access Physical Therapy: An Observational Study International Journal of Sports Physical Therapy
Self-Movement Screening using the Symmio Application is Reliable and Valid for Identifying Musculoskeletal Risk Factors
Kyle Matsel1 a , Jonathan Kirsch2 , Tessa Netelbeek3 , Rolando Rodriguez3 , Ervin Velic3 , Kate Schwartzkopf-Phifer1 1 Physical Therapy, University of Evansville, 2 Los Angeles Dodgers Baseball Organization, Los Angeles, CA, 3 ProRehab, PC
Keywords: Movement systems, reliability, self-screen, validity https://doi.org/10.26603/001c.73319
International Journal of Sports Physical Therapy
Background
Musculoskeletal health problems are one of the greatest healthcare expenses in the United States but patient-driven screening procedures to detect risk factors do not exist.
Hypothesis/Purpose
The purpose was to establish the inter-rater reliability of the Symmio Self-Screen application in untrained individuals and to investigate its accuracy to detect MSK risk factors such as pain with movement, movement dysfunction, and decreased dynamic balance.
Study Design
Cross-Sectional Methods
Eighty (42 male, 38 female) healthy individuals mean age 26.5 ± 9.4 participated in the study The inter-rater reliability of Symmio application was established by comparing self-screen scores from untrained subjects with the results simultaneously determined by a trained healthcare provider Each subject was evaluated for pain with movement, movement dysfunction, and deficits in dynamic balance by two trained evaluators who were blinded to the Symmio results. The validity of Symmio was determined by comparing self-screen performance dichotomized as pass or fail with the reference standard of pain with movement, failure on the Functional Movement Screen™, and asymmetry on the Y Balance Test-Lower Quarter™ using three separate 2x2 contingency tables.
Results
The mean Cohen’s kappa coefficient was 0.68 (95% CI, 0.47-0.87) and the absolute agreement was 89% between self-assessment of subjects and the observation of a trained healthcare provider There were significant associations for the presence of pain with movement (p=0.003), movement dysfunction (p=0.001), and dynamic balance deficits (p=0.003) relative to poor Symmio performance. The accuracy of Symmio to identify pain with movement, movement dysfunction, and dynamic balance deficits were 0.74 (95% CI, 0.63-0.83), 0.73 (95% CI, 0.62-0.82), and 0.69 (95% CI, 0.57-0.79), respectively
Conclusions
The Symmio Self-Screen application is a reliable and feasible screening tool that can be used to identify MSK risk factors.
Corresponding Author:
Kyle Matsel PT, DPT, PhD University of Evansville
515 Bob Jones Way Evansville, IN 47708
Phone: (812) 488-5105
Email: km218@evansville.edu
Original Research
a
Matsel K, Kirsch J, Netelbeek T, Rodriguez R, Velic E, Schwartzkopf-Phifer K. SelfMovement Screening using the Symmio Application is Reliable and Valid for Identifying Musculoskeletal Risk Factors. IJSPT. Published online April 1, 2023:439-449. doi:10.26603/001c.73319
INTRODUCTION
Musculoskeletal (MSK) health problems are one of the greatest healthcare expenses in the United States.1 Poor MSK health can cause significant loss of time from work and recreational activities, and it is strongly correlated with the development of chronic pain syndrome and opioid use.2 According to data from the World Health Organization, MSK health problems are second only to mental health disorders as the primary contributor to years of life with disability and 19th in years of life lost across the globe.3 Over a 15-year period, the total number of years living with disability due to MSK conditions has increased from 77 million to 103 million and years of life loss have risen by more than 40 percent.3 Consequently, the economic and functional burden of MSK disorders will continue to increase as the general population becomes older due to longer life expectancies.4
The risk of sustaining an MSK injury is increased by the presence of modifiable risk factors that can be assessed by a trained healthcare professional.5–8 The Functional Movement Screen (FMS™) and Y Balance Test-Lower Quarter (YBT-LQ™) are reliable, movement-based tests that have a relationship to heightened injury risk when deficits are identified.9–12 When multiple risk factors are considered using an evidence-based injury risk prediction algorithm, individuals identified as high-risk were 3.4 times more likely to sustain a non-contact MSK injury 13 Additionally, the more risk factors an individual possesses the more likely an MSK injury that limits participation in physical activity is to occur 7 Early identification of the development of risk factors or declining physical function could allow patients to take a more active role in preventive strategies,14 which researchers have shown can decrease the financial burden on both the individual and the healthcare system.15,16
Patient-driven screening is widespread in its application among other healthcare specialties to create awareness of potential risk factors or conditions. Multiple body systems such as the cardiovascular, integumentary, endocrine, and lymphatic systems have patient-driven screens for early detection and subsequent intervention recommendations. The health of the cardiovascular system can be screened with a sphygmomanometer for blood pressure measurements, which is reliable in identifying possible cardiovascular disease.17 The use of educational materials and skin self-examinations allows for early detection and proper treatment of melanoma18,19 and breast cancer which has significantly increased survival rates.20,21 Glucometers have been useful in helping those with a diagnosis of diabetes to monitor the impact of medication and lifestyle factors on blood sugar levels.22,23 However, self-screening options for the MSK system are limited despite the growing need to combat rising disability and attenuating quality of life associated with poor MSK health. The increasing prevalence of MSK disorders warrants a user-friendly self-screen-
ing tool that can be administrated by the general public to aid in creating awareness of physical risk factors.
To date, there are no studies that have explored a patient-driven self-screening tool to reliably identify MSK risk factors. The Symmio Self-Screen (Symmio) is a downloadable application developed to be a user-friendly and costeffective tool for the early identification of physical risk factors that may lead to MSK injuries. The primary purpose of this study was to establish the inter-rater reliability of the Symmio application in untrained individuals. It was hypothesized that Symmio will demonstrate moderate inter-rater reliability with a Cohen’s kappa value >0.40 when administered by untrained individuals. The secondary purpose of this study was to investigate the accuracy of Symmio to detect MSK risk factors such as pain with movement, movement dysfunction, and decreased dynamic balance. It was hypothesized that poor performance on Symmio would increase the odds of having pain with movement, dysfunctional movement quality on the FMS™, and deficient dynamic balance on the YBT-LQ™.
MATERIALS AND METHODS STUDY DESIGN
A prospective cross-sectional design was used to establish the inter-rater reliability and discriminant validity of Symmio to identify the presence of painful or dysfunctional movement and dynamic balance deficits among a cohort of active individuals. The Standards for Reporting Diagnostic Accuracy Studies (STARD) statement for a diagnostic accuracy study design was followed for standardized reporting.24 Approval was granted from the institutional review board at the University of Evansville and informed consent forms were obtained before data collection.
PARTICIPANTS
A minimum sample size of 50 participants was needed to achieve a Cohen’s kappa value of 0.40 with an alpha of 0.05 and 80% power for a two-tailed test. To detect a sensitivity of 0.90, at least 58 participants would be required considering a prevalence of 0.60 and a 0.10 confidence interval width allowance.25 Anticipating 10% of the participants enrolled may have incomplete data, the final planned minimum target sample size was 64 participants.
A convenience sample of 80 individuals between the ages of 18 and 70 of either sex was enrolled in the study Participants were excluded from enrollment in the study for lower-extremity amputation, vestibular disorder, lack of medical clearance for participation, current treatment for the inner ear, sinus or upper respiratory infection or head cold, cerebral concussion within the past three months, or inability to read or comprehend English.
Level of Evidence Level 2
Self-Movement Screening using the Symmio Application is Reliable and Valid for Identifying Musculoskeletal Risk Factors International Journal of Sports Physical Therapy
PROCEDURES
Physical testing occurred during a single session with no follow-up required. After informed consent was obtained, the participants completed a demographic and medical history questionnaire and then completed Symmio, FMS™, and YBT-LQ™ testing. The order of physical testing was randomized to control for fatigue and changes in movement quality. All testers were blinded to the results of the tests.
The Symmio Self-Screen is a movement-based screening tool intended to identify MSK disorders using an instructional application on a smart phone or tablet. Symmio consists of five tests with two levels of difficulty for each movement including, 1) tandem toe touch, 2) shoulder mobility, 3) rotation, 4) deep squat, and 5) balance and reach (Figure 1). Participants were allowed three attempts to perform each movement and each test was scored as pass or fail per the criteria below on both right and left sides when applicable. Subjective report of pain with movement was recorded for each movement.
1. Tandem Toe Touch: While standing with feet in tandem stance, the participants were instructed to reach down and attempt to touch the toes of their forward foot while maintaining knee extension (Level 1). The test was repeated on the opposite side. The participants then attempted a more challenging test by repeating the movement but now attempting to touch the toes of their back foot (Level 2). Inability to touch the toes of the front foot on both sides at the Level 1 standard was considered failure.
2. Shoulder Mobility: The participants stood with feet together holding a horizontally folded standard piece of paper (8.5 x 11 in) in one hand. In one smooth motion, the participants simultaneously reached one hand behind their head (in a flexed and externally rotated position), and the other hand behind and up their back (in an extended and internally rotated position) attempting to pass the paper from one hand to the other (Level 1). The test was repeated on the opposite side. The participants then performed the test without the folded paper, attempting to touch their fingertips together (Level 2). Inability to pass the folded paper between hands on both sides at the Level 1 standard was considered failure.
3. Deep Squat: The participants stood with their feet together, shoulders flexed to 90°, and fingers extended. Maintaining the heels in contact with the ground, the participants descended into a deep squat and attempted to touch their fingertips to the ground within their footprint (Level 1). The participants then attempted a more challenging test by repeating the movement but with their fists closed (Level 2). Inability to touch the fingertips to the ground at the Level 1 standard was considered failure.
4. Rotation: The participants stood with feet together and shoulders flexed to 90° with fingers interlocked. Maintaining tall posture, the participants attempted to rotate their trunk and hips greater than 90° using
their arms as a gauge (Level 1). The test was repeated on the opposite side. The participants then attempted a more challenging test by positioning their feet in tandem stance and repeating the rotation toward the forward leg (Level 2). Inability to rotate greater than 90° with feet together at the Level 1 standard on both sides was considered failure.
5. Balance and Reach: The participants stood two shoe lengths away from a wall, and while maintaining single leg balance on one foot with the heel down, the participants reached with the opposite foot to attempt to touch the point on the wall just above the ground five consecutive times without the foot touching down or losing balance (Level 1). The test was repeated on the opposite side. The participants then stepped back 2.5 shoe lengths from the wall and repeated the movement (Level 2). Inability to touch the wall five consecutive times without loss of balance at two shoe lengths from the wall on both sides was considered failure.
INTER-RATER RELIABILITY
Each participant self-screened themselves using the Symmio application. The participants followed the standard video guidance and instructions from the application using a tablet (IPadOS, 15.6.1, 9th generation) while a healthcare professional simultaneously scored each movement in real time. The healthcare professional (TAN) was a physical therapist (PT) trained in evaluating the Symmio movements. The participants nonverbally recorded their scores in the Symmio application and on a data collection form. The PT rater stood far enough away from the participants to remain blinded to the participants’ scores. The participant’s self-screen scores and the PT rater’s observed scores for each Symmio test were compared to establish interrater reliability.
DISCRIMINANT VALIDITY
To determine the validity of Symmio, scores on individual components of the self-screen were compared to established movement screening and motor control testing procedures. Two PTs who were certified in the FMS™ and YBTLQ™ performed all functional testing and were blinded to the Symmio results. To improve reliability, the same PT performed the FMS™ (RJR) to appraise movement dysfunction while the other PT tested dynamic balance deficits with the YBT-LQ™ (EV).
1. Pain with Movement: Any subjective report of pain, which was defined as discomfort beyond normal stretch or soreness, with any of the physical testing was considered painful.8
2. Functional Movement Screen: This screening tool is used to identify limitations or asymmetries in seven movement patterns that are key to functional movement quality The FMS™ consists of the overhead deep squat, hurdle step, inline lunge, shoulder mobility, active straight leg raise, trunk stability pushup, and rotary stability tests which are each scored
Self-Movement Screening using the Symmio Application is Reliable and Valid for Identifying Musculoskeletal Risk Factors International Journal of Sports Physical Therapy
Figure 1. Symmio Self-Screen Tests
on a four-point ordinal scale. Procedures and scoring for the FMS™ were consistent with recommendations from Cook et al.26 Failure was defined as a score of a 1 (movement limitation) or asymmetry on any individual FMS™ movement patterns.27
3. Y Balance Test-Lower Quarter: The YBT-LQ™ tests tri-planar dynamic balance near the limits of an individual’s stability. Testing procedures and scoring were consistent with the protocol and testing kit developed by Plisky et al.28 Failure was defined as an anterior reach asymmetry >3.5 cm, posteromedial and posterolateral asymmetries >5.5 cm, or ankle dorsiflexion ROM limitation (<40°) or asymmetry (≥5°).7,29

STATISTICAL METHODS
Descriptive statistics including means and standard deviations (SD) were calculated. Inter-rater reliability for the categorical scores of each component of Symmio was compared between both raters using Cohen’s kappa coefficient with 95% confidence intervals (CI 95%) and percent absolute agreement. The Cohen’s kappa coefficient quantifies the strength of agreement and was interpreted as: 0.01-0.20 = none to slight, 0.21-0.39 = fair, 0.40-0.60 = moderate, 0.61-0.80 = substantial, ≥0.81 = near perfect.30
The accuracy of Symmio to discriminate between participants with pain, movement dysfunction, and dynamic balance deficits was determined using cross-tabulations. The presence of pain, movement dysfunction, and dynamic balance limitations were dichotomized as described previously and entered into separate 2x2 tables. Univariate analyses were performed using the chi-square test for categorical variables to evaluate significant differences between Sym-
mio performance and the presence of pain, movement dysfunction, or dynamic balance deficits. A Fisher’s Exact test was used to measure the association if one or more cells had an expected count of less than five. Sensitivity, specificity, positive predictive value (PPV), negative predictive value (NPV), likelihood ratios (LR), and odds ratios (OR) were calculated with 95% confidence intervals to describe the accuracy of the Symmio self-screen to detect MSK risk factors. All data analyses were performed with R for Mac OS 4.1.2 statistical software (RStudio for Mac, Version 1.4). An alpha level of p < 0.05 was considered statistically significant for all tests.
RESULTS
Demographic information for all participants is provided in Table 1. Eighty participants completed all testing procedures, and the data were used for analysis. The mean age ± SD of the participants in this sample was 26.5 ± 9.4 and ranged from 18 to 68 years old. All participants reported engaging in some physical activity with 80% (n=64/80) reporting that they were moderately or highly active. A total of 25% (n=20/80) of participants reported current pain with activities of daily living before testing.
INTER-RATER RELIABILITY
Results for the inter-rater reliability (kappa, 95% CI, and % agreement) for both raters are presented in Table 2 Cohen kappa values ranged from fair to near perfect agreement between both raters. The tandem toe touch tests had the highest inter-rater reliability with Cohen kappa values that ranged from 0.85 (95% CI, 0.68-1.0) to 0.90 (95% CI, 0.77-1.0) and represented near perfect agreement. The bal-
1a=Tandem toe touch (front toes), 1b=Tandem toe touch (back toes), 2a=Shoulder mobility (paper), 2b=Shoulder mobility (fingertips), 3a=Feet together rotation, 3b=Tandem rotation, 4a=Deep squat (fingertips), 4b=Deep squat (fists), 5a=Balance and reach (2 foot lengths), 5b=Balance and reach (2.5 foot lengths)
Self-Movement Screening using the Symmio Application is Reliable and Valid for Identifying Musculoskeletal Risk Factors International Journal of Sports Physical Therapy
Table 1. Descriptive Characteristics of Participants (n=80)
p=0.001). The diagnostic accuracy of Symmio to capture mobility dysfunction on the FMS™ was 73 percent (95% CI, 0.62-0.82). There was no significant association between the presence of movement dysfunction on the FMS™ and Symmio when failure on the FMS™ was defined as the presence of 1’s or asymmetries (p=0.31), or when failure was defined as a composite score of less than 14 (p=0.33).
DYNAMIC BALANCE DEFICITS
The 2x2 table created to examine the discriminant validity of Symmio to identify poor dynamic balance compared to the YBT-LQ™ is presented in Table 3c There was a significant association between individuals who failed the Symmio Self-Screen and poor performance on the YBT-LQ™ (X2=9.13, p=0.003). Poor performance on Symmio had a 69 percent (95% CI, 0.57-0.79) accuracy in detecting individuals who also failed the YBT-LQ™. The Symmio Self-Screen demonstrated similar sensitivity (0.69, 95% CI, 0.55-0.82) and specificity (0.68, 95% CI, 0.49-0.83) for detecting the presence of dynamic balance deficits. Participants who scored poorly on Symmio were more than two-fold more likely (+LR=2.15, 95% CI, 1.25-3.70) to have dynamic balance deficits on the YBT-LQ™ with an odds ratio of 4.76 (95% CI, 1.81-12.5).
DISCUSSION
ance and reach test at 2.5-foot lengths from the wall demonstrated the lowest inter-rater reliability with Cohen kappa scores ranging from fair to moderate agreement on the left (k=0.34, 95% CI, 0.20-0.48) and right (k=0.43, 95% CI, 0.26-0.60) leg, respectively.
PAIN WITH MOVEMENT
The accuracy of Symmio to discriminate between those who had pain with movement on the FMS™ is reported in Table 3a The chi-square test showed a significant association for the 2x2 contingency table created (X2=8.73, p=0.003) for participants’ reporting pain with movement on the FMS™ and Symmio. The Symmio Self-Screen was 74 percent (95% CI, 0.63-0.83) accurate in identifying pain with movement on the FMS™. The sensitivity (0.71, 95% CI, 0.49-0.87) and specificity (0.75, 95% CI, 0.62-0.86) for detecting the presence of pain with functional movement were only marginally different. Participants with pain on the FMS™ were 2.8 times (+LR=2.83, 95% CI, 1.68-4.77) more likely also to have pain on Symmio. Overall, participants who had pain on the FMS™ were 7.29 (95% CI, 2.51-21.2) greater odds of reporting pain on Symmio compared to those without pain on the FMS™.
MOVEMENT DYSFUNCTION
The 2x2 table created to examine the discriminant validity of Symmio to identify movement dysfunction compared to the FMS™ is presented in Table 3b There was a significant association between the presence of poor movement quality on the Symmio Self-Screen and failure of the FMS™ tests which were more mobility focused (X2=15.67,
The goal of the Symmio Self-Screen is to create MSK health awareness through a user-friendly electronic application that the general public can administer without dependence on a trained healthcare professional. The findings from this study support the primary hypothesis that untrained individuals can reliably administer the Symmio application to self-screen for MSK risk factors that may contribute to physical limitations and determine the need for further evaluation by a healthcare professional. All subtests of Symmio, scored as pass or fail, exhibited fair to near perfect inter-rater reliability between both raters regardless of their movement screening experience.
Movement screening performed by trained healthcare providers or fitness coaches has demonstrated moderate to excellent levels of agreement.10,31 Additionally, untrained individuals with limited experience screening movement have demonstrated the ability to reliably screen movement.32 Leeder et al.33 reported that untrained practitioners with limited clinical experience were able to correctly identify dysfunction in the FMS™. Likewise, high school baseball coaches with no screening experience and minimal training were able to screen movement quality similarly to a clinician with 10 years of expertise in movement screening.34 However, the investigation of self-appraisal of functional movement in untrained, non-healthcare individuals is a novel concept.
To the authors’ knowledge, this is the first study to examine the ability of untrained individuals to screen their own movement patterns without the aid of an external observer. Participants without previous knowledge of the Symmio scoring criteria could follow the application’s in-
Continuous variables Mean ± SD Age, y 26.5 ± 9.4 Height, cm 174.6 ± 11.6 Weight, kg 79.1 ± 16.8 Categorical variables n (%) Sex, n (%) Male 42 (52.5) Female 38 (47.5) Current pain, n (%) Yes 20 (25.0) No 60 (75.0) Previous injury, n (%) Yes 6 (7.5) No 74 (92.5) Activity level, n (%) Lightly Active 16 (20.0) Moderately Active 42 (52.5) Highly active 22 (27.5)
deviation, y=years, n=count
*SD=standard
Self-Movement Screening using the Symmio Application is Reliable and Valid for Identifying Musculoskeletal Risk Factors International Journal of Sports Physical Therapy
structional video and score similarly to a trained healthcare provider. Each Symmio subtest was dichotomized as pass or fail with clear biomarkers for success which likely reduced the scoring complexity and minimized errors among the participants. Other movement screening tools and assessments such as the FMS™, Selective Functional Movement Assessment (SFMA™), and Landing Error Scoring System (LESS) have more complex scoring criteria or more category scoring options which is more suitable for trained professionals.35,36
It is particularly important for untrained individuals who are administering a self-screen to have a simplified scoring system to maximize reproducibility. Interestingly, the balance and reach subtest, which is like the anterior reach of the star excursion balance test (SEBT), demonstrated only fair to moderate agreement and had the lowest agreement of all the Symmio subtests. In a systematic review, Powden et al.11 reported excellent inter-rater reliability (0.88, 0.83-0.96) and intra-rater reliability (0.88, 0.84-0.93) on the anterior reach of SEBT. In the current study, the participants performing the balance and reach test may have had difficulty perceiving when their stance leg heel lifted off the ground which may have been more apparent to a trained observer
The findings from this study partially support the secondary hypothesis that the Symmio tests can accurately discriminate between individuals with or without MSK risk factors. The Symmio subtests were comprehensive enough to reproduce painful movement similar to the FMS™. Painful movement on the FMS™ has been shown to be a meaningful risk factor associated with seven-fold increased injury risk.8 However, an association between movement dysfunction and asymmetries or overall composite score on the FMS™ and Symmio was lacking. Though a stronger association between Symmio performance and FMS™ results was expected, it is interesting to note that Symmio demonstrated a higher specificity (0.75, 95% CI, 0.62-0.86) for detecting the presence of movement dysfunction on the FMS™ mobility tests compared to sensitivity (0.71, 95% CI, 0.49-0.87). Participants with movement dysfunction on the FMS™ mobility tests were nearly three times (+LR=2.86, 95% CI, 1.35-4.88) more likely to also have dysfunctional movement on Symmio. Overall, participants who demonstrated dysfunctional mobility tests on the FMS™ were more than seven (7.40, 95% CI, 2.60-21.0) times greater odds of performing poorly on Symmio compared to those who passed. Symmio was intentionally designed to have a mobility bias to reflect current research findings linking mobility deficits to future injury risk.37,38 Saddler et al.39 reported that individuals with limited hamstring flexibility were more likely to develop low back pain, whereas, ankle dorsiflexion restrictions can increase the odds of an injury and medical discharge in Army recruits.40,41 The creation of a patient-driven, self-screening tool for the reliable detection of MSK risk factors can alert individuals of impending MSK needs. The Symmio self-screen can allow individuals to seek evaluation and treatment prior to MSK injury,
which may lead to decreased healthcare dollars spent on preventable issues. Future research should explore the prospective longitudinal correlation between poor Symmio performance and the development of MSK conditions throughout the lifespan.
LIMITATIONS
This study is not without limitations. First, the prevalence of MSK risk factors was high in this sample limiting confidence in the interpretation of PPV and accuracy due to the oversaturation of risk factors. This is especially true when screening movement dysfunction and dynamic balance as the accuracy does not exceed the upper bound 95% CI for the prevalence. Second, the mean age of participants was relatively young at 26.5 ± 9.4. This decreases generalizability, as the sample may not reflect the general population. Although the sample included individuals in their 50s and 60s, most participants were college-aged limiting generalization throughout the lifespan. Thirdly, only 15% of participants reported current pain prior to testing, but many more experienced pain during the movement and balance testing. Though the goal of Symmio is to detect these issues, the mismatch in awareness may have impacted results. Finally, the reference standards used to establish the criterion validity of Symmio did not include additional movement-based screens beyond the FMS™ and YBT-LQ™. Although comparison utilizing other movement-based screens could be meaningful, the authors determined that no other movement-based screen or dynamic balance test has been as robustly examined in relation to reliability, predictive validity, and modifiability as the FMS™ and YBTLQ™.
CONCLUSION
The Symmio Self-Screen application is a reliable, userfriendly, and feasible screening tool that can be used to identify MSK risk factors including pain with movement, movement dysfunction, and dynamic balance deficits in untrained, non-healthcare individuals. This application can be used by the general public to create awareness of the user’s current movement health and encourage preventative action before the development of disability.
ACKNOWLEDGMENTS
The authors of this study would like to thank the University of Evansville Doctor of Physical Students Mattie Franklin, Skylar Walden, Rachel Howey, and Kris Bale for their assistance with study organization and data collection.
Submitted: December 02, 2022 CDT, Accepted: February 13, 2023 CDT
Self-Movement Screening using the Symmio Application is Reliable and Valid for Identifying Musculoskeletal Risk Factors International Journal of Sports Physical Therapy
Self-Movement Screening using the Symmio Application is Reliable and Valid for Identifying Musculoskeletal Risk Factors
Participant Rater vs. PT Rater Symmio Test Cohen Kappa (95% CI) % Agree p value R Tandem Toe Touch – Front toe touch 0.86 (0.67, 1.0) 97.5 <0.001 L Tandem Toe Touch – Front toe touch 0.86 (0.67, 1.0) 97.5 <0.001 R Tandem Toe Touch – Back toe touch 0.90 (0.77, 1.0) 97.5 <0.001 L Tandem Toe Touch – Back toe touch 0.85 (0.68, 1.0) 97.5 <0.001 R Shoulder Mobility – Paper grab 0.65 (0.28, 1.0) 96.2 <0.001 L Shoulder Mobility – Paper grab 0.86 (0.67, 1.0) 97.5 <0.001 R Shoulder Mobility – Fingertips touch 0.84 (0.71, 0.96) 92.5 <0.001 L Shoulder Mobility – Fingertips touch 0.87 (0.76, 0.98) 93.8 <0.001 R Rotation – Feet together 0.49 (0.17, 0.81) 91.2 <0.001 L Rotation – Feet together 0.47 (0.03, 0.91) 95.0 <0.001 R Rotation – Tandem stance 0.70 (0.53, 0.86) 86.2 <0.001 L Rotation – Tandem stance 0.59 (0.40, 0.78) 82.5 <0.001 Deep Squat – Fingertips to ground 0.74 (0.57, 0.91) 90.0 <0.001 Deep Squat – Fists to ground 0.67 (0.50, 0.83) 83.8 <0.001 R Balance and Reach – 2-foot lengths 0.49 (0.25, 0.73) 85.0 <0.001 L Balance and Reach – 2-foot lengths 0.62 (0.37, 0.87) 91.2 <0.001 R Balance and Reach – 2.5-foot lengths 0.43 (0.26, 0.60) 70.0 <0.001 L Balance and Reach – 2.5-foot lengths 0.34 (0.20, 0.48) 62.5 0.027 Mean 0.68 (0.47, 0.87) 89.3 SD 0.17 9.85
L=left, 95% CI=95% confidence interval
Table 2. Inter-rater Reliability of Symmio Tests (n=80)
*R=right,
International Journal of Sports Physical Therapy
Self-Movement Screening using the Symmio Application is Reliable and Valid for Identifying Musculoskeletal Risk Factors
*FMS=Functional Movement Screen, YBT-LQ=Y Balance Test-Lower Quarter, +LR=Positive Likelihood Ratio, -LR=Negative Likelihood Ratio, PPV=positive predictive value, NPV=negative predictive value
This is an open-access article distributed under the terms of the Creative Commons Attribution 4.0 International License (CCBY-NC-4.0). View this license’s legal deed at https://creativecommons.org/licenses/by-nc/4.0 and legal code at https://creativecommons.org/licenses/by-nc/4.0/legalcode for more information.
a. Pain with Movement b. Movement Dysfunction c. Dynamic Balance Deficits Pain on FMS™ Fail FMS™ Mobility Fail YBT-LQ™ Pain on Symmio Yes No Symmio Yes No Symmio Yes No Yes 17 14 Yes 37 7 Yes 34 10 No 7 42 No 15 21 No 15 21 X2 = 8.73, p value = 0.003 X2 = 15.67, p value = 0.001 X2 = 9.13, p value = 0.003 Est. 95% CI Est. 95% CI Est. 95% CI Accuracy 0.74 0.63, 0.83 Accuracy 0.73 0.62, 0.82 Accuracy 0.69 0.57, 0.79 Prevalence 0.30 0.20, 0.41 Prevalence 0.65 0.54, 0.75 Prevalence 0.61 0.50, 0.72 Odds Ratio 7.29 2.51, 21.2 Odds Ratio 7.40 2.60, 21.0 Odds Ratio 4.76 1.81, 12.5 Sensitivity 0.71 0.49, 0.87 Sensitivity 0.71 0.57, 0.83 Sensitivity 0.69 0.55, 0.82 Specificity 0.75 0.62, 0.86 Specificity 0.75 0.55, 0.89 Specificity 0.68 0.49, 0.83 + LR 2.83 1.68, 4.77 + LR 2.85 1.46, 5.53 + LR 2.15 1.25, 3.70 – LR 0.39 0.20, 0.74 – LR 0.38 0.24, 0.62 – LR 0.45 0.28, 0.74 PPV 0.55 0.36, 0.73 PPV 0.84 0.70, 0.93 PPV 0.77 0.62, 0.89 NPV 0.86 0.73, 0.94 NPV 0.58 0.41, 0.74 NPV 0.58 0.41, 0.74
Table 3. Accuracy of Symmio to Detect Musculoskeletal Pain and Dysfunction (n=80)
International Journal of Sports Physical Therapy
REFERENCES
1. Yelin E, Weinstein S, King T The burden of musculoskeletal diseases in the United States. Semin Arthritis Rheum. 2016;46(3):259-260. doi:10.1016/j.se marthrit.2016.07.013
2. Vraa ML, Myers CA, Young JL, Rhon DI. More than 1 in 3 patients with chronic low back pain continue to use opioids long-term after spinal fusion: A systematic review Clin J Pain 2021;38(3):222-230. do i:10.1097/ajp.0000000000001006
3. Sebbag E, Felten R, Sagez F, Sibilia J, Devilliers H, Arnaud L. The world-wide burden of musculoskeletal diseases: a systematic analysis of the World Health Organization Burden of Diseases Database. Ann Rheum Dis 2019;78(6):844-848. doi:10.1136/annrheu mdis-2019-215142
4. Leveille SG. Musculoskeletal aging. Curr Opin Rheumatol 2004;16(2):114-118. doi:10.1097/0000228 1-200403000-00007
5. Kiesel KB, Butler RJ, Plisky PJ. Prediction of injury by limited and asymmetrical fundamental movement patterns in american football players. J Sport Rehabil. 2014;23(2):88-94. doi:10.1123/jsr.2012-0130
6. Butler RJ, Lehr ME, Fink ML, Kiesel KB, Plisky PJ. Dynamic balance performance and noncontact lower extremity injury in college football players: an initial study Sports Health 2013;5(5):417-422. doi:10.1177/ 1941738113498703
7. Teyhen DS, Shaffer SW, Goffar SL, et al. Identification of risk factors prospectively associated with musculoskeletal injury in a warrior athlete population. Sports Health. 2020;12(6):564-572. doi:1 0.1177/1941738120902991
8. Alemany JA, Bushman TT, Grier T, et al. Functional Movement Screen: Pain versus composite score and injury risk. J Sci Med Sport 2017;20(Suppl 4):S40-S44. doi:10.1016/j.jsams.2017.08.001
9. Plisky P, Schwartkopf-Phifer K, Huebner B, Garner MB, Bullock G. Systematic review and meta-analysis of the y-balance test lower quarter: Reliability, discriminant validity, and predictive validity. Int J Sports Phys Ther 2021;16(5):1190-1209. doi:10.2660 3/001c.27634
10. Bonazza NA, Smuin D, Onks CA, Silvis ML, Dhawan A. Reliability, validity, and injury predictive value of the functional movement screen: a systematic review and meta-analysis. Am J Sports Med 2017;45(3):725-732. doi:10.1177/036354651664 1937
11. Powden CJ, Dodds TK, Gabriel EH. The reliability of the star excursion balance test and lower quarter y-balance test in healthy adults: a systematic review. Int J Sports Phys Ther 2019;14(5):683-694. doi:10.266 03/ijspt20190683
12. Bunn PDS, Rodrigues AI, Bezerra da Silva E. The association between the functional movement screen outcome and the incidence of musculoskeletal injuries: A systematic review with meta-analysis. Phys Ther Sport 2018;35:146-158. doi:10.1016/j.pts p.2018.11.011
13. Lehr ME, Plisky PJ, Butler RJ, Fink ML, Kiesel KB, Underwood FB. Field-expedient screening and injury risk algorithm categories as predictors of noncontact lower extremity injury. Scand J Med Sci Sports. 2013;23(4):e225-e232. doi:10.1111/sms.12062
14. Clark SC, Rowe ND, Adnan M, Brown SM, Mulcahey MK. Effective interventions for improving functional movement screen scores among “highrisk” athletes: a systematic review Int J Sports Phys Ther. 2022;17(2):131-138. doi:10.26603/001c.31001
15. Childs JD, Fritz JM, Wu SS, et al. Implications of early and guideline adherent physical therapy for low back pain on utilization and costs. BMC Health Serv Res 2015;15(1):150. doi:10.1186/s12913-015-0830-3
16. Ojha HA, Wyrsta NJ, Davenport TE, Egan WE, Gellhorn AC. Timing of physical therapy initiation for nonsurgical management of musculoskeletal disorders and effects on patient outcomes: A systematic review. J Orthop Sports Phys Ther. 2016;46(2):56-70. doi:10.2519/jospt.2016.6138
17 Fleming S, Atherton H, McCartney D, et al. Selfscreening and non-physician screening for hypertension in communities: A systematic review. Am J Hypertens 2015;28(11):1316-1324. doi:10.1093/ ajh/hpv029
18. Quéreux G, N’Guyen JM, Cary M, Jumbou O, Lequeux Y, Dréno B. Validation of the selfassessment of melanoma risk score for a melanomatargeted screening. Eur J Cancer Prev. 2012;21(6):588-595. doi:10.1097/cej.0b013e328353ed 68
19. Yagerman S, Marghoob A. Melanoma patient selfdetection: a review of efficacy of the skin selfexamination and patient-directed educational efforts. Expert Rev Anticancer Ther. 2013;13(12):1423-1431. d oi:10.1586/14737140.2013.856272
Self-Movement Screening using the Symmio Application is Reliable and Valid for Identifying Musculoskeletal Risk Factors International Journal of Sports Physical Therapy
20. Coleman C. Early detection and screening for breast cancer. Semin Oncol Nurs. 2017;33(2):141-155. doi:10.1016/j.soncn.2017.02.009
21. Pace LE, Keating NL. A systematic assessment of benefits and risks to guide breast cancer screening decisions. JAMA 2014;311(13):1327-1335. doi:10.100 1/jama.2014.1398
22. Francescato MP, Geat M, Stel G, Cauci S. Accuracy of a portable glucose meter and of a Continuous Glucose Monitoring device used at home by patients with type 1 diabetes. Clin Chim Acta. 2012;413(1-2):312-318. doi:10.1016/j.cca.2011.10.012
23. Lim S, Kang SM, Kim KM, et al. Multifactorial intervention in diabetes care using real-time monitoring and tailored feedback in type 2 diabetes. Acta Diabetol 2016;53(2):189-198. doi:10.1007/s0059 2-015-0754-8
24. Bossuyt PM, Reitsma JB, Bruns DE, et al. STARD 2015: an updated list of essential items for reporting diagnostic accuracy studies. Bmj. 2015;351:h5527. do i:10.1136/bmj.h5527
25. Buderer NMF. Statistical methodology: I. Incorporating the prevalence of disease into the sample size calculation for sensitivity and specificity Acad Emerg Med 1996;3(9):895-900. doi:10.1111/j.15 53-2712.1996.tb03538.x
26. Cook G, Burton L, Hoogenboom B. Preparticipation screening: the use of fundamental movements as an assessment of function - part 1. N Am J Sports Phys Ther 2006;1(2):62-72.
27 Mokha M, Sprague PA, Gatens DR. Predicting musculoskeletal injury in national collegiate athletic association division ii athletes from asymmetries and individual-test versus composite functional movement screen scores. J Athl Train. 2016;51(4):276-282. doi:10.4085/1062-6050-51.2.07
28. Plisky PJ, Gorman PP, Butler RJ, Kiesel KB, Underwood FB, Elkins B. The reliability of an instrumented device for measuring components of the star excursion balance test. N Am J Sports Phys Ther. 2009;4(2):92-99.
29. Plisky PJ, Rauh MJ, Kaminski TW, Underwood FB. Star Excursion Balance Test as a predictor of lower extremity injury in high school basketball players. J Orthop Sports Phys Ther. 2006;36(12):911-919. doi:1 0.2519/jospt.2006.2244
30. McHugh ML. Interrater reliability: the kappa statistic. Biochem Med. 2012;22(3):276-282. doi:10.11 613/bm.2012.031
31. Cuchna JW, Hoch MC, Hoch JM. The interrater and intrarater reliability of the functional movement screen: A systematic review with meta-analysis. Phys Ther Sport. 2016;19:57-65. doi:10.1016/j.ptsp.2015.1 2.002
32. Harper BA, Glass SM. Item-level and compositelevel interrater reliability of functional movement screenTM scores following condensed training in novice raters. Int J Sports Phys Ther 2021;16(4):1016-1024. doi:10.26603/001c.25793
33. Leeder JE, Horsley IG, Herrington LC. The interrater reliability of the functional movement screen within an athletic population using untrained raters. J Strength Cond Res. 2016;30(9):2591-2599. doi:10.151 9/jsc.0b013e3182a1ff1d
34. Matsel KA, Brown SN, Hoch MC, et al. The intraand inter-rater reliability of an arm care screening tool in high school baseball coaches. Int J Sports Phys Ther 2021;16(6):1532-1540. doi:10.26603/001c.29680
35. Cook G. Movement: Functional Movement Systems: Screening, Assessment, Corrective Strategies. Vol ed. On Target Publ.; 2011.
36. Padua DA, Marshall SW, Boling MC, Thigpen CA, Garrett WE Jr, Beutler AI. The Landing Error Scoring System (LESS) Is a valid and reliable clinical assessment tool of jump-landing biomechanics: The JUMP-ACL study. Am J Sports Med. 2009;37(10):1996-2002. doi:10.1177/03635465093432 00
37. Riddle DL, Pulisic M, Pidcoe P, Johnson RE. Risk factors for Plantar fasciitis: a matched case-control study J Bone Joint Surg Am 2003;85(5):872-877 doi:1 0.2106/00004623-200305000-00015
38. Koźlenia D, Domaradzki J. Prediction and injury risk based on movement patterns and flexibility in a 6-month prospective study among physically active adults. PeerJ 2021;9:e11399. doi:10.7717/peerj.11399
39. Sadler SG, Spink MJ, Ho A, De Jonge XJ, Chuter VH. Restriction in lateral bending range of motion, lumbar lordosis, and hamstring flexibility predicts the development of low back pain: a systematic review of prospective cohort studies. BMC Musculoskelet Disord 2017;18(1):179. doi:10.1186/s12 891-017-1534-0
40. Teyhen DS, Shaffer SW, Butler RJ, et al. What risk factors are associated with musculoskeletal injury in us army rangers? A prospective prognostic study Clin Orthop Relat Res. 2015;473(9):2948-2958. doi:10.100 7/s11999-015-4342-6
Self-Movement Screening using the Symmio Application is Reliable and Valid for Identifying Musculoskeletal Risk Factors International Journal of Sports Physical Therapy
. 1998;44(3):165-172. doi:10.1016/s0004-95
14(14)60376-7
41. Pope R, Herbert R, Kirwan J. Effects of ankle dorsiflexion range and pre-exercise calf muscle stretching on injury risk in Army recruits. Aust J Physiother
Self-Movement
Reliable
Identifying Musculoskeletal
International Journal of Sports Physical Therapy
Screening using the Symmio Application is
and Valid for
Risk Factors
The Development of a Return to Performance Pathway Involving A Professional Soccer Player Returning From A Multi-Structural Knee Injury: A Case Report
Andrew Mitchell1a , Ollie Waite2 , Craig Holding3 , Matt Greig4 1 Medical Department, RB Leipzig Football Club, 2 Medical Department, Crystal Palace Football Club, 3 Medical Department, Stoke City Football Club, 4 Sports Injuries Research Group, Edge Hill University
Keywords: soccer, anterior cruciate ligament, rehabilitation, return to performance
https://doi.org/10.26603/001c.73317
International Journal of Sports Physical Therapy
This case report describes a male professional soccer player returning to match play (English Championship League) following a medial meniscectomy that occurred during the course of rehabilitation after Anterior Cruciate Ligament (ACL) reconstruction. The player underwent a medial meniscectomy eight months into an ACL rehabilitation program and following 10 weeks of rehabilitation successfully returned to competitive first team match play This report outlines description of the pathology, the rehabilitation progressions, and the sports specific performance requirements of the player as they progressed through the return to performance pathway (RTP).
The RTP pathway included nine distinct phases with evidenced based criteria required to exit each phase. The first five phases were indoor as the player progressed from the medial meniscectomy, through the rehabilitation pathways to the “ gym exit Phase” The gym exit Phase was assessed with multiple criteria: a) capacity; b) strength; c) isokinetic dynamometry (IKD); d) hop test battery; e) force plate jumps; and f) supine isometric hamstring rate of force (RFD) development qualities to evaluate the players readiness to start sport specific rehabilitation. The last four phases of the RTP pathway are designed to regain the maximal physical capabilities (plyometric and explosive qualities) in the gym and included the retraining of on-field sport specific qualities utilizing the ‘control-chaos continuum.’ The player successfully returned to team play in the ninth and final phase of the RTP pathway. The purpose of this case report was to outline a RTP for a professional soccer player who successfully restored specific injury criteria (strength, capacity and movement quality), physical capabilities (plyometric and explosive qualities). and on-field sport specific criteria utilizing the ‘control-chaos continuum.’
Level of Evidence
Level 4
INTRODUCTION
ACL injuries are one of the most troublesome and debilitating injuries in professional soccer often resulting in career threatening consequences. In European professional soccer an ACL injury occurs at a rate of 0.066 per 1000 hours of training or match play.1,2 This equates to 0.4 ACL injuries
Corresponding Author: Andrew Mitchell
RB Leipzig Football Club, Medical Department, Cottaweg 7, 04177. Leipzig, Germany
Email: andrew.mitchell@redbulls.com
Tel: (+49) 15151701470
per team per season which means there will be on average one per team every two seasons.1 The average length of time a player is side-lined is 241 (± 63) days highlighting the severity of this injury 3 Only 55% of athletes post ACL surgery to return competitive sport4 and in soccer following ACL surgery only 65% of players were still be competing at the same level three years post-surgery.1 In professional soccer ACL reinjury rates are also high at 17.8%3 with
Case Reports
a
to Performance
Mitchell A, Waite O, Holding C, Greig M. The Development of a Return
Pathway Involving A Professional Soccer Player Returning From A Multi-Structural Knee Injury: A Case Report. IJSPT. Published online April 2, 2023:450-466. doi:10.26603/001c.73317
pressure to return players back into competition as quickly as possible.5 Webster et al,6 have reported this may be because of practitioners continuing to use time-based criteria instead of criteria-based outcomes as only 23% of athletes have completed objective functional criteria prior to return to sport (RTS). van Melick et al.7 has recommended the use of strength tests, hops tests, and on-field sports specific assessments during ACL rehabilitation before a RTS is permitted. Further work by Kyritsis et al,8 highlighted athletes were at four times greater risk of sustaining an ACL graft rupture when they fail to meet six well defined criteria (IKD testing at 60, 180 and 300°/s, single leg (SL) hop, SL triple hop, SL crossover hop, and on-field sports-specific assessments) than those who have passed RTS criteria.
The first phases of a RTS program include the diagnosis and planning Phase, the acute management and contralateral limb loading Phase and finally the Phase for restoration of normal movement and early loading. Following these three phases is the gym Phase 4. Gym Phase 4 starts the rehabilitation process of the forementioned injury specific criteria including strength,9,10 capacity,11–13 and movement quality.14,15 In gym Phase 5 the athlete is objectively evaluated for a) capacity11–13; b) strength9,10; c) isokinetic dynamometry (IKD)16–18; d) hopping using a hop test battery19–21; e) force plate jumps22–25; and f) supine isometric hamstring RFD qualities26 to ensure a safe transition into grass Phase 1.
On entering grass Phase 1 an athlete begins to retrain their on-field sport specific criteria utilizing the ‘controlchaos continuum.’27 This starts with high control and low variability exercises as an athlete completes simple ball exercises and low intensity running (<65% maximum speed) to regain confidence and aerobic fitness. Further power qualities are also evaluated in grass Phase 1 (SL triple hop,19–21 SL medial hop19,21 and SL countermovement jump)22–24 to ensure that a >90% limb symmetry index (LSI) and pre-injury scores had been achieved. In grass Phase 2, running speeds (<85% maximum speed) and the intensity of sports specific actions are increased as controlled chaos and multidirectional actions were used. Underpinning grass Phase 2 was also the restoration of all explosive qualities (SL drop jump,25 IKD peak torque at 0.18ms28 and supine isometric hamstring RFD at 100ms)26 to ensure a >90% LSI and pre-injury scores had been achieved before entering grass Phase 3. Grass Phase 3 consists of high chaos and high variability through positional specific exercises where a maximum speed and intensity was employed. Exposing an athlete to exercises of a similar physical, technical and cognitive demand to team training was the aim which provided the necessary base for grass Phase 4. During grass Phase 4 the athlete is reintroduced to team training and return to match play. The purpose of this case report was to outline a RTP for a professional soccer player who successfully restored specific injury criteria (strength, capacity and movement quality), physical capabilities (plyometric and explosive qualities). and on-field sport specific criteria utilizing the ‘control-chaos continuum.’
THE REHABILITATION TO PERFORMANCE PATHWAY
The RTP pathway (Figure 1) provides a clear plan and a progressive pathway for injured players, members of the multidisciplinary team (MDT) and coaches to follow The philosophy has nine distinct Phases: 1-5 are predominately gym based, Phases 6-8 blend grass and gym rehabilitation, and Phase 9 is the training transition Phase. The injured player and members of the MDT go through the pathway in a stepby-step manner to provide a safe and successful RTP after injury.
In Phase 1 the initial injury has taken place. Examinations, scans and consultations are provided as required. An accurate and early diagnosis is fundamental, and the RTP plan is clearly communicated to the player. In gym Phase 2 the injured player starts acute management and can continue contralateral limb exercising when able. Treatment is given daily as the acuteness of the injury subsides. In gym Phase 3 (Figure 1) the injured player regains normal movement patterns through gait retraining and starts to initiate early injury loading with basic exercises such as double leg (DL) squats, lunges, bridge patterns and also heel raises exercises for the calf complex. Achieving fundamental exercise patterns without the injury reacting which is determined by an increase in pain levels (increase greater than >1 on a numerical rating scale)29 and effusion levels (an increase measured using the stroke test grading system)30,31 is paramount to start the rehabilitation pathways in gym Phase 4. Appropriate pacing and honest communication during the first three phases help to manage and synchronize expectations of the player, coaches, and members of the MDT
Gym Phase 4 is a key phase of the process when the player and injured structures start to recondition through the eight rehabilitation pathways and the step-by-step progressions (Figure 2). These rehabilitations pathways are programmed utilizing a daily undulating periodization (DUP) method as this allows for daily variations in intensity and volume32,33 (Figure 3).
The pathways all work on the theme of graded exposure and by varying the rehabilitation stimuli daily it is more conducive to neuromuscular adaptations than concurrent training.34,35 Each of the rehabilitation pathways targets a different physical quality and by alternating these through DUP superior adaptations can be achieved (Figure 3).32,33 Developing each of these eight rehabilitation pathways in gym Phase 4 provides three distinct advantages to the injured player: progressive exposure and adaptation of the tissue, variability through the eight distinct pathways, and confidence and trust in the injury
The rehabilitation theme of DUP is continued in gym Phase 5 which consists of the gym exit profiling where five of the rehabilitation pathways are objectively profiled (Figure 2). The plyometric pathway (hop battery and force plate [dual force plate system at 1000Hz, PASPORT force plate, model number: PS 2141; Pasco Roseville, CA, USA and integrated force plate form customized software package, NMP ForceDecks.] jump profiling) and injury specifics
The Development of a Return to Performance Pathway Involving A Professional Soccer Player Returning From A. International Journal of Sports Physical Therapy

The Development of a Return to Performance Pathway Involving A Professional Soccer Player Returning From A. International Journal of Sports Physical Therapy
Figure 1. The rehabilitation philosophy visualized in the 9 Phased ‘Return to Performance Pathway.’ (RDLs = Roman deadlifts. IKD = Isokinetic dynamometry COD = Change of direction. CMJ = Countermovement jump. RFD = Rate of force development. Hams = Hamstrings. Max = Maximum. Accels = Acclerations. Decels= Decelerations. GPS = Global positioning system.)
pathway (SL supine isometric hamstring RFD qualities) are practiced, and data is observed but are more formally assessed utilizing the force plates during the grass rehabilitation phases. The injury specifics pathway is used to address any outlying metrics that are not covered in the other pathways and deemed to be relevant for that specific injury or player In this case, the measurement of the players SL supine isometric hamstring RFD qualities due to this being an ACL with a hamstring graft were considered important to assess.10,36 The five pathways are rarely completed all in one day as they stress different physical qualities such as strength (maximum strength profiling9,10 and IKD, [BIODEX, Biodex system 3, Biodex Medical System Corp., NY, USA.] profiling) endurance (capacity profiling) and movement quality (running preparation profiling and indoor ball skills profiling). Despite the development from the outset of plyometric and explosive qualities in gym Phase 4 the completion of the power hop battery,19–21 countermovement jump profiling22–24 and RFD (SL drop jump,25 IKD quadriceps peak torque at 0.18ms28 and isometric hamstring RFD at 100ms)26 profiling occur in a sequential fashion later in the pathway. Plyometric profiling being completed during the grass Phase 1 (Figure 5B) and explosive qualities like RFD profiling during grass Phase 2 (Figure 5C).
For a player to start the grass Phase 1 it is paramount to have adequately fulfilled the running preparation pathway and achieved >90% LSI and pre-injury scores on the non-negotiable prerequisites in gym Phase 5 (Figure 4A). These specifically involve the capacity profiling (SL squat,11 calf raise gastrocnemius bias and soleus bias,12 hamstring bridge in 90° and 30°),13 the maximum strength profiling (SL leg press, rear foot elevated split squat, [RFESS] trapbar deadlift and barbell floor thrust)9,10 and IKD profiling (quadriceps and hamstrings concentric tests) involving five reps at 60°/s and 15 reps at 300°/s.37–39
After successfully exiting gym Phase 5 the player starts grass Phase 1, “jogging and reintroductions”. During this phase the player is gradually exposed to their individualized match day total distances, typically running at speeds <65% of their maximum speed. It is a first step with high control and low variability as it aims to reintroduce the player to low intensity ball drills and regain aerobic fitness through 100m pitch runs27 and Hoff dribble circuits.40 Despite grass Phase 1 having an outdoor theme there are still necessary indoor gym parameters that need to be achieved to progress: >90% LSI and pre-injury scores in their power profiling (SL triple hop,19–21 SL medial hop,19,21 SL countermovement jump height and flight time:contraction time) (Figure 5B).22–24
During grass Phase 2, high speed running (HSR) and change of direction drills (COD) are developed with a gym focus on RFD All grass intensities are below 85% of their maximum (speed and volume parameters) while the final RFD characteristics are achieved in the gym. During grass Phase 2 achieving >90% LSI and pre-injury scores in their RFD profiling (SL drop jump height and reactive strength index [RSI],25 IKD quadriceps peak torque at 0.18ms28 and isometric hamstrings RFD at 100ms)26 along with their
grass metrics is the prerequisite to progress. In grass Phase 3 the player is exposed to their maximum speeds, intensities, and specific positional demands as the exercises are chaotic and highly variable.27 Intensities above 85% place an exponential load on the tissues39 and it is vital all strength, power and RFD profiling has been completed to >90% LSI and pre-injury scores to ensure safety before they enter the grass Phase 3 (Figure 5C).
Throughout grass Phase 3 the player completes positional drills and achieves maximum speeds in preparation for grass Phase 4 where they will transition into team training and match play It should not be forgotten that despite gym metrics been achieved regularly exposing the player to the appropriate strength, power and RFD stimuli may reduce their risk of reinjury and improve their athletic performance. Once in grass Phase 4 the player trains in a normal pattern with the rest of the team as they increase their match exposure in a pragmatic fashion depending on their length of injury
CASE PRESENTATION
A 26-year-old male professional soccer player with no previous history of injuries sustained a traumatic right knee injury. The player had a history of having played 300 professional matches as a midfielder / forward. He was a predominately right footed player and had an average playing mass of 78kg and height of 176cms.
Mid-way through the first half of a competitive match he received shoulder contact from an opposing player during a deceleration action. This contributed to a change in the following two to three steps of his normal deceleration pattern forcing his right knee into the classic dynamic valgus position of abduction, flexion, and internal rotation.41 The knee was in the ‘position of no return’ leading to an instant rupture of the ACL.42,43
After being removed from the field of play the initial examination showed reduced range of knee flexion 80° and an unwillingness to actively or passive extend the knee into hyperextension. The ACL was absent on Lachman testing and the player was experiencing high levels of pain 7-8/10 on a numerical rating scale.29 Within 48 hours a magnetic resonance imaging scan (MRI) was performed which confirmed a full thickness rupture of the ACL and partial thickness tears of the posterior horn to the medial and lateral menisci. The PCL and collateral ligaments were intact and there was no chondral damage.
Within seven days the player was assessed by an orthopaedic surgeon and the decision was made to have a surgical intervention. The plan was clearly outlined to the player: it would take a minimum of nine months to return to competitive sport and there was a 30-40% chance the medial meniscus repair might fail and require a further surgical intervention at some stage.44,45 The surgical opinion was that initially repairing the medial meniscus would reduce the tension on the harvested ACL graft in the early phases of the rehabilitation process.46–48 The player underwent a successful 90-minute operation during which the surgeon harvested a four-strand autologous hamstring
The Development of a Return to Performance Pathway Involving A Professional Soccer Player Returning From A. International Journal of Sports Physical Therapy
semitendinosus and gracilis graft from the contralateral limb (left leg).49 This was inserted into the right knee as the new ACL. The player underwent meniscal repair of the posterior horn sections of both the medial and lateral menisci.
The player initially completed eight months of ACL rehabilitation. In accordance with Buckthorpe and Della Villa´s work14 this consisted of three distinct stages of ACL rehabilitation. Stage 1 was the early stage (Figure 1, gym Phases 2 and 3) where focus was placed on the player reducing pain and swelling and recovering normal gait and activities of daily living. Following this, the player went into the midstage (Figure 1, gym Phases 4 and 5) to regain muscular strength, power, and movement quality before entering the final sports specific stage to redevelop the underling explosive qualities and necessary soccer qualities to perform with the team.7,8,10,27 At the eight-month stage (Figure 1, grass Phase 2) despite the player completing HSR and COD drills on the grass the player felt a sharp pain in the medial aspect of the right knee during some routine hopping exercises. An MRI revealed he had re-torn the surgically repaired posterior horn of the medial meniscus. This distinct possibility had been outlined from day 1 so despite initial disappoint-

ment and frustration it was not a shock to the player or his support team. The player underwent the necessary medial meniscectomy of the posterior horn, and the following outlines the 10-week rehabilitation the athlete engaged in after the meniscectomy, in order to return to competitive soccer.
INTERVENTION
GYM
PHASES 1, 2 AND 3 –‘ EXPECTATIONS’
The aim of the first 3 phases (Figure 1) were to set the expectations and prepare the player for the loading and progressive gym Phase 4. Holistic care begins in all injuries during Phase 1 (diagnosis and planning). In this case the player underwent the necessary scans, consultations, and a surgical intervention to the posterior horn of the medial meniscus of his right knee. A routine surgical operation excised the small section of the posterior horn that was loose and simultaneously allowed for an arthroscopic examination of the previously reconstructed ACL and the lateral meniscus that were both reported to be healing well. Absolute clarity in communication between all members of
Figure 2. Showing the ‘Rehabilitation Pathways and Progressions’ of gym Phase 4 and the gym exit profiling in gym Phase 5.
(IKD Isokinetic dynamometry Prep Preparation. Intro Introduction. A Skip A skipping pattern in a linear direction emphasizing the hip drive phase of running. B skip A skipping pattern in a linear direction emphasizing the hip extension phase of running. Alter G Anti-gravity treadmill. RM Repetition maximum. SL Single leg. Reps Repetitions.)
The Development of a Return to Performance Pathway Involving A Professional Soccer Player Returning From A. International Journal of Sports Physical Therapy
the MDT during Phase 1 was paramount. The player and his support team inside and outside of the club along with the coaches were given clear understandable information about what had happened and the process ahead. Addressing and agreeing on the expectations of all the key people helps to start the process in a realistic and unison manner.
The acute and contralateral limb loading Phase (Figure 1 - Phase 2) lasted for the first seven days post-surgery. Wound management was prioritized along with daily use of the game ready (Model GRPro 2.1, Betchworth House 57-65 Station Road Redhill. RH1 1DL. UK.) to reduce post-surgical swelling and pain. Effleurage massage and range of motion exercises were used to restore mobility especially into knee flexion and extension and to reduce the formation of a capsular contraction.50,51 Controlled non-weight bearing exercises and the Compex muscle stimulator (electrical muscular stimulation was performed with model No SP 8.0, MI-scan, wireless, 120 mA, 400 us, 150 Hz. Guildford, Surrey, GU2 8XG, UK.) were used to address muscular atrophy and regain normal muscular recruitment patterns.52 Also in this Phase, contralateral limb exercise training53 and cardiovascular conditioning (seated battle ropes, boxing, upper body circuits, core and arm bike) sessions were completed to complement the nutritional advice given (provided by team nutritionist) and to maintain team involvement for the player wherever possible.54

This player exited gym Phase 2 at seven days postsurgery. For this, he exhibited full knee extension, flexion of >125°, the grading of a trace of joint effusion measured by the stroke test (Scale - Zero = No wave produced on downstroke. Trace = Small wave on medial side with downstroke. 1+ = Larger bulge on medial side with downstroke.
2+ = Effusion spontaneously returns to medial side after upstroke [no downstroke necessary]. 3+ = So much fluid that it is not possible to move the effusion out of the medial aspect of the knee)30,31 and a pain level never above 2/10 on a numerical rating scale.29–31 He had strictly adhered to the prescribed protocol, was competent in his non-weight bearing exercises and had subsiding pain and swelling levels. Patience within and respect during these first two phases allowed the player to appropriately start the gym Phase 3.
With a low pain score (<2/10 numerical rating scale) and trace joint effusion the player progressed into the gym Phase 3 to start early loading and regain normal movement patterns (Figure 1). Competency in the fundamental weight bearing exercises and gait variations was the primary goal of this phase. Firstly, he completed the key exercises like squats, lunge patterns, Roman deadlifts (RDL), heel raises, and gait exercises with reduced body weight in the pool and was then transitioned to the gym. Movement quality was deemed to be a key factor and assessed visually to ensure there was no loss of balance, contralateral hip drop, ipsilateral knee valgus or any excessive trunk movement.55,56 During gym Phase 3 the player was required to complete 3 sets x 8 repetitions with normal movement strategies and no post-session reaction to be able to start gym Phase 4. By day 10 the player had achieved these criteria and could start the rehabilitation pathways outlined in gym Phase 4 (Figure 2). Experience suggests premature entry into gym Phase 4 will lead to recurrent episodes of swelling, pain and compensatory movement strategies55,56 that reduce the players well-being and overall confidence.
Figure 3. Demonstrating the use of a daily undulating periodization plan in gym Phase 4 (Week 3 Post-Surgery). (Prep Preparation. IKD Isokinetic dynamometry Mod Moderate. ACL Anterior cruciate ligament. SL Single leg. A Skip A skipping pattern in a linear direction emphasizing the hip drive phase of running. B skip = A skipping pattern in a linear direction emphasizing the hip extension phase of running. S = Seconds.)
The Development of a Return to Performance Pathway Involving A Professional Soccer Player Returning From A. International Journal of Sports Physical Therapy
GYM PHASE 4 - REHABILITATION PATHWAYS AND PROGRESSIONS
This phase started at the 10-day mark post-surgery and continued into week four when the player started to complete the necessary gym exit profiling tests in gym Phase 5. The aim of gym Phase 4 was to expose the injured lower extremity to different physical demands through the variety of rehabilitation pathways outlined in Figure 2 The pathways are clearly outlined in a progressive manner as the demands increase in a step-by-step fashion ensuring the player and the injury can safely perform the profiling tests in gym Phase 5.
During gym Phase 4 not all the rehabilitation pathways were worked on each day as a DUP theme was applied throughout the week (Figure 3). For this player a normal working week consisted of rehabilitation days on Monday and Tuesday with Wednesday set as regeneration day Similarly, Thursday and Friday were rehabilitation days and often Saturday was free to work on any specific aspects as required. Sunday was traditionally set as a day off which was aligned with normal team training schedules. The aim of the undulated process was to expose the player to the most complex and neuromuscular challenging demands at the start of the session and the safer exercises towards the end of the session when arguably he was more fatigued.
Similarly, the player completed more neuromuscular challenging pathways (indoor ball skills pathways, plyometric pathway, maximum strength pathway, IKD pathways and anaerobic and upper body type conditioning) on Monday and Thursdays when the player was most fresh compared to lower intensity and higher volume type sessions on Tuesday and Fridays (running preparation pathway, injury specifics pathways, capacity pathway, aerobic conditioning and core exercises) when the player had worked the previous day (Figure 3).
During gym Phase 4 there were eight key rehabilitation pathways to follow. The manner in which six of these progressed is highlighted in Figure 4 In the capacity pathway the player completed multiple exercises in his regular sessions but was critically assessed in five key SL exercises (squat,11 calf raise gastrocnemius bias and soleus bias12 and hamstring bridge in 90° and 30°).13 These are progressed from 3 sets of 8 repetitions to 2 sets to fatigue which was completed in the gym exit profiling in gym Phase 5. Gradually increasing the repetitions and sets developed a local muscular endurance and robustness in the joint to withstand the loads in preparation for the grass phases ahead.
Strength was addressed in the maximum strength and IKD pathways. With all strength progressions the repetitions were reduced as the load was increased. Again, the player had a variety of exercises for the posterior and anterior chain but was critically assessed in the SL leg press, RFESS, trapbar deadlift, and the barbell floor thrust.9,10 Accompanying this the IKD pathway was initiated on the treatment table with manual resistance as the therapist resisted knee flexion and extension through range. This was then progressed to the IKD machine where initially quicker speeds (low joint forces) were employed.57 These contrac-
tion speeds were gradually decreased from 180°/s to 60°/s as the player ended by completing the traditional 3-speed profiling (60,180 300°/s)16–18 at the end of gym Phase 4 ready for the gym exit profiling in gym Phase 5.
The players power and RFD qualities were also introduced early in gym Phase 4. They were initially started through the introduction of the plyometric pathway which involved the player completing a drop series of squats and lunges in the pool on Mondays and Thursdays (Figure 3). This was progressed to the land with simple landings from a step and box (altitude landings).58 As the plyometric pathway progressed the introduction of the hop battery which consisted of the SL horizontal hop, triple hop, medial and lateral hop for distance tests as described by Ebert et al,19 and force plate jump profiling which consisted of DL and SL countermovement jump, along with DL and SL drop jumps23,25 leading into week four which included some of the types of simple hopping techniques the player was doing. The use of the force plates enabled the analysis of the relative force, RFD and interlimb asymmetries for example, to be compared to preinjury standards.10,22,23,36 Despite ongoing improvement and monitoring these qualities cannot be completely restored without the necessary grass speed exposures later in the process.
Movement patterns through the running preparation pathway were also completed specifically on Tuesday and Fridays (Figure 3.) as the number of ground contacts increased from 100 in the first session to 600 by the end of gym Phase 4. Every time the foot hit the ground it was counted and calculated as a sum for the total session. This progressed from simple wall drills and sled walks to A skip (a skipping pattern in a linear direction emphasizing the hip drive phase of running) variations. By week 4 the player had increased the number of ground contacts so he was able to start gym Phase 5 where he would be expected to complete 800-1000 ground contacts in a session. This along with two running introduction sessions (60-75% progressing to 95% body weight) on the anti-gravity treadmill (Alter-G, Fremont, CA, USA.) further highlighted his readiness for the grass phases.
Gym Phase 4 encompassed the rehabilitation pathways and progressions and in this case lasted from 10 days into week 4. These step-by-step increases in each of the pathways emphasized the design of graded exposure and also the variability created through the different pathways. The player improved in his local muscular endurance (capacity pathway) and strength (maximum strength and IKD pathways). He also started to develop his power and RFD qualities (plyometric pathway). By adding the movement qualities that were practiced in his running preparation pathway and indoor balls skills pathway he was starting to develop a level of confidence in the gym. This self-confidence came from being pain free not only in these but in the wide variety of exercises and movements that gym Phase 4 included. Having successfully completed the gym Phase 4 rehabilitation pathways described (Figure 2) he was ready to enter the gym Phase 5 (gym exit profiling).
The Development of a Return to Performance Pathway Involving A Professional Soccer Player Returning From A. International Journal of Sports Physical Therapy
GYM PHASE 5 - GYM EXIT PROFILING
The most common question a player asks at the start of the rehabilitation process is “when I can start running on the grass?” Gym Phase 5 has been specifically designed using objective tests to answer this question. The player had complete familiarity with the profiling modalities as they were gradually introduced throughout gym Phase 4. These standardized and repeatable profiling tests such as the hop test battery19–21 and force plate jumps22–25 were conducted regularly by all squad members as monitoring tests which added weight to their significance and relevance to performance. The common language they created was understood and well interpreted between the MDT, the player`s peers, and the coaches through ongoing education.
The structure of gym Phase 5 was conducted in complete alignment with the DUP of gym Phase 4. Gym Phase 5 was fundamentally an extension of gym Phase 4 with the exercises in the pathways being objectively profiled on the fourth and fifth day of week 4. On the fourth day the player completed the indoor ball skills profiling, plyometric profiling, the maximum strength and the IKD strength profiling. Despite a seemingly large volume of work, the indoor ball skills profiling (15 mins), the plyometric profiling (15 mins), the maximum strength profiling (30 mins) and the IKD profiling (15 mins) all took in total 75 minutes. Again, familiarity during gym Phase 4 to all these exercises reduced the players time to completion in one session.
The indoor balls skills pathway had seen the player progress through familiarization exercises with the ball which included exercises like the keep-up variations to lateral shuffles and volleys. The plyometric profiling (force plate jumps included the DL and SL countermovement and drop jumps with the hop battery including SL horizontal, triple, medial and lateral hop techniques) would not be equal to preinjury levels at this stage but it was important the player could perform all tests without pain or compensatory movement patterns. Compensations were judged in real time in the frontal plane by observing a vertical line through the trunk, one line through the exercising limb and one line horizontally through the pelvis. Despite being subjective, suboptimal mechanics seen through this method are easy to assess and can be used as simple steps to coach the player to better movement quality 15,59 In summary the movement quality, overall confidence, and ability to complete the plyometric variations at this stage was a prerequisite to exit gym Phase 5.
The maximum strength profiling (Figure 4B) saw the player achieve 230kg on a 3-repetition maximum9 SL leg press and 35kg each arm during a RFESS. Later that fourth morning the player completed the IKD profiling. At this stage the key criteria to achieve were >90% LSI and preinjury scores in the peak torque at 60°/s (strength)37,38 and the total workload for 15 repetitions at 300°/s (endurance)16,60 for the quadriceps and hamstring muscles (Figure 4C). For the strength and endurance IKD tests, the quadriceps were 96% and 94% respectively when utilizing the pre-injury ipsilateral maximum scores for comparison.
On the final workout day of the week the player started by completing the running preparation profiling. Through
a variety of drills such as A skips (a skipping pattern in a linear direction emphasizing the hip drive phase of running), B skips (a skipping pattern in a linear direction emphasizing the hip extension phase of running) and heel flicks for example, the player demonstrated the ability to complete 1000 ground contacts per limb in a movement session, a prerequisite for starting grass Phase 1. He also completed his final anti-gravity treadmill running session. The treadmill session followed on from the previous session that ended while running at 75% body weight. Two-minute running intervals at 12.6 km/hour (3.3ms-1 / 40% of maximum speed) with a stepwise increase from 80 to 95% body weight was successfully achieved.10 This was in exact alignment with the planned running intervals of the upcoming first session of grass Phase 1 in the following week. Later in the final day of the week the player completed low-level control and balance exercises as injury specific exercises. Movement quality while maintaining limb, pelvic and trunk alignment15,56,59 was the focus as SL rotational and balance type exercises were conducted.
To conclude gym Phase 5 the player completed the capacity profiling. This involved the player completing as many repetitions as possible on five key exercises. Throughout gym Phase 4 he had worked on numerous variations of these exercises like in all pathways but these five were specifically chosen to be profiled. From Figure 4A, the player exceeded >90% LSI and pre-injury ipsilateral maximum scores. Scores of 67 repetitions for the SL gastrocnemius heel raise, and 80 repetitions for the hamstring bridge in 90° and the SL squat exercise were achieved (Figure 4A). These tests along with hamstring bridges in 30° and SL soleus heel raise were used to measure the capacity of the lower limb musculature.11–13 Comparisons between limbs and exceeding >90% of his pre-injury ipsilateral maximum scores provided the player with the feeling of confidence to safely enter the grass Phase 1.
To exit gym Phase 5, it was important to utilize a holistic approach. Four key factors were interpreted together to make a safe and calculated decision that the player was ready to start grass Phase 1. Firstly, he had achieved >90% of his pre-injury ipsilateral maximum scores in his capacity, maximum strength and IKD profiling (Figure 5A). These key pathways were the cornerstone of his rehabilitation at this stage. Secondly it is widely acknowledged that the power (hop test battery - Figure 4D, and countermovement jump profiling - Figure 4E) and RFD (SL drop Jump,25 IKD quadriceps peak torque at 0.18ms28 and isometric hamstring RFD at 100ms)26 qualities will lag61 at this stage, but the player had started to go through the progressions and was comfortable with all exercises of the plyometric pathway (Figure 2). Thirdly, although not purely objective, the player had completed other pathways like the running preparation and indoor ball skills (Figure 2) which further highlighted his competency in a variety of movement patterns and also to tolerate load. Finally, and arguably the most critical factor was the psychological confidence the collective of all the pathways had provided the player At this stage expecting the player to feel ready to resume playing is unfeasible. However, verbalizing his confidence and readiness (>90%
The Development of a Return to Performance Pathway Involving A Professional Soccer Player Returning From A. International Journal of Sports Physical Therapy
confidence) to start on the grass was imperative for him to commence grass Phase 1 at the start of week 5. This simple confidence scale (>90% confidence) was used at the end of each phase to ensure communication between the player and therapist ensuring the player felt psychologically ready to start the next phase.
GRASS PHASE 1 – JOGGING AND REINTRODUCTIONS
The aim of grass Phase 1 in week five was twofold. Firstly, to reintroduce the player to ball activities and jogging on the grass whilst increasing his level of aerobic fitness27 and secondly to develop the necessary power qualities in the gym to start HSR and COD drills in grass Phase 2. In grass Phase 1 despite the player working on the grass, off-feet conditioning, and gym work continued in unison with very specific targets after the profiling completed in gym Phase 5. This player needed to accomplish the neces-
sary power qualities assessed through the hop battery
19–21 and SL countermovement jump profiling.22–24 Specifically achieving >90% LSI and pre-injury scores ipsilateral maximum scores in these key power tests was required to exit grass Phase 1 (Figure 5B).
On the grass the player completed sessions that involved pitch length runs (1 pitch length 100m x 5 = 500m),10 and dribble circuits (Hoff dribble circuit 290m x 1 = 290m)40 at a low speed (<65% maximum speed <5.1 ms-1) to increase his aerobic fitness level. As the player progressed through grass Phase 1 the total distance he covered in each session improved by 1km each day to 6km from a starting point of 2km. Incrementally increasing the number of pitch runs and dribble circuits was conducting in a step by step process as this type of aerobic conditioning has proven to achieve a heart rate <85% maximum.10,62,63 Accompanying this he was reintroduced to simple passing (0-10m), ball manipulations and low-level patterning drills that were incremen-
 Figure 4. The data collected in six of the key rehabilitation pathways
A) Capacity pathway B) Maximum strength pathway C) IKD pathway D) Plyometric pathway (Hop battery). E) Plyometric pathway (Force plate jumps). F) Injury specifics pathway (SL supine isometric hamstrings). (SL Single leg. R Right. IKD Isokinetic dynamometry Nm Newton metres. Ms milliseconds.)
Figure 4. The data collected in six of the key rehabilitation pathways
A) Capacity pathway B) Maximum strength pathway C) IKD pathway D) Plyometric pathway (Hop battery). E) Plyometric pathway (Force plate jumps). F) Injury specifics pathway (SL supine isometric hamstrings). (SL Single leg. R Right. IKD Isokinetic dynamometry Nm Newton metres. Ms milliseconds.)
The Development of a Return to Performance Pathway Involving A Professional Soccer Player Returning From A. International Journal of Sports Physical Therapy
A) GYM EXIT CRITERIA Achieved Pre-Grass Phase 1 - Jogging and Re-Introductions. B) POWER CRITERIA Achieved Pre-Grass Phase 2 - HSR and COD Drills. C) RFD CRITERIA Achieved Pre-Grass Phase 3 - Maximum Speed and Positional Drills. D) ALL CRITERIA Achieved Pre-Grass Phase 4 - Training Transition. (Yellow: Maximum distance achieved in one session in metres. Ligth Blue: Maximum number of accelerations and decelerations achieved in one session. Gray: Maximum number of changes of directions achieved in one session. Dark Blue: Maximum distance of high-speed running achieved in one session (>5.7 ms-1). Red: Maximum distance of sprint metres achieved in one session (>7.3 ms-1). Maximum speed achieved in one session (ms-1). R = Right. Reps = Repetitions. Nm = Newton metres. CMJ = Countermovement jump. RSI = Reactive strength index. Ms = milliseconds. HSR = High speed running. COD = Change of direction. RFD = Rate of force development.)
tal advancements to the exercises he had completed during the indoor ball skills pathway He had no exposure to HSR or high-level accelerations and decelerations (>2.5 ms-1) as
the high control and low variability ball drills were confined to distances no greater than 4 meters. However, with the sensitivity of the global positioning system (GPS sys-
 Figure 5. The prerequisite criteria to be achieved before the player progressed through each of the grass phases.
The Development of a Return to Performance Pathway Involving A Professional Soccer Player Returning From A. International Journal of Sports Physical Therapy
tem - augmented 10 Hz Apex, Catapult Leeds, UK) he did record some low-level (<2.5 ms-1) COD (total in one session 47, 27% of match total volume, Figure 6C) and accelerations and decelerations (total in one session 49, 31% of match total volume, Figure 6B). All these short distance intensity type actions were controlled and included within the small area (4m maximum) patterning drills the player completed. Grass Phase 1 was conducted in week five post-surgery and contained in total of five grass sessions. Critically during Phase 1 aerobic conditioning was implemented in the form of 500m runs (1 pitch length 100m x 5) and Hoff dribble circuits.40 During this and simple passing drills the player regained some confidence in his body, had a reintroduction to ball drills and accumulated 18,800 meters at a low speed, with 5523m being the highest achieved in one session (Figure 6A).
To complement the running and ball work the player also prioritized power work in the gym during grass Phase 1. Crucial to this whole RTP philosophy was the blending of the grass and gym exercises both being addressed simultaneously to prepare the player for the next phase he would progress onto. At this point in grass Phase 1 he needed to complete the necessary power profiling (hop battery19–21 and SL countermovement jump testing)22–24 to ensure the player was adequately prepared and safe to start grass Phase 2. During the morning sessions specific cueing was utilized to direct the players intent in producing explosive movements. The player completed three power sessions (day 1, day 4 and day 6 in the week) which consisted of the profiling criteria and supplementary power-based exercises (squat jumps, lunge jumps, step jumps, and hurdle hop variations etc). The power profiling (part of the plyo-
 Figure 6. The player’s GPS (global positioning system) data collected in six key metrics used to grade his exposure to soccer specific loads during grass Phases 1-4.
A) The maximum distance achieved in one session. B) The maximum number of accelerations and decelerations (combined) achieved in one Session. C) The maximum number of change of directions achieved in one session. D) The maximum number of high-speed running metres achieved in one session. E) The maximum number of sprint metres achieved in one session. F) The maximum running speed achieved in one session. (Accels accelerations. Decels Decelerations. M-s1 Metres per second.)
Figure 6. The player’s GPS (global positioning system) data collected in six key metrics used to grade his exposure to soccer specific loads during grass Phases 1-4.
A) The maximum distance achieved in one session. B) The maximum number of accelerations and decelerations (combined) achieved in one Session. C) The maximum number of change of directions achieved in one session. D) The maximum number of high-speed running metres achieved in one session. E) The maximum number of sprint metres achieved in one session. F) The maximum running speed achieved in one session. (Accels accelerations. Decels Decelerations. M-s1 Metres per second.)
The Development of a Return to Performance Pathway Involving A Professional Soccer Player Returning From A. International Journal of Sports Physical Therapy
metric pathway) specifically focused on the hop test battery19–21 and the SL countermovement jump.22–24 The results of the hop test battery significantly improved with the key hops for this injury being the SL triple hop (625cms) and the SL medial hop (152cms) both exceeding >90% LSI and pre-injury ipsilateral maximum scores (102 and 101% respectively, Figure 5B). Similarly, the SL countermovement jump height (24.2 cms) and the flight time:contraction time ratio (0.58 ms-1) for this player had achieved pre-injury levels of 94 and 95% respectively (Figure 5B). To exit grass Phase 1 the player had completed the GPS criteria (5-10m passing, low intensity COD, accels and decels, aerobic runs with a maximum of 6km in one session, all metrics <65% in speed, intensity, and volume) and also the necessary power criteria (Figure 5B) which were the prerequisites to start grass Phase 2.
GRASS PHASE 2 – HIGH-SPEED RUNNING AND CHANGE OF DIRECTION DRILLS
The aim of grass phase two was twofold. Firstly, it was on the grass to complete HSR (<85% of maximum speed), increase session volumes (<85% of match total volume in metres), complete reactive drills including CODs, accelerations and decelerations (<66% of match total volumes) and also to complete some longer kicking exercises (<40m) (Figure 1). All of these requirements were within the controlled chaos and multidirectional themes of the ´controlchoas continuum´.27 The second aim was in the gym where the final RFD qualities (SL drop jump,25 IKD quadriceps peak torque at 0.18ms28 and isometric hamstring RFD at 100ms)26 were achieved again with a prerequisite to exit grass Phase 2 being set at >90% LSI and pre-injury ipsilateral maximum scores (Figure 5C).
During grass Phase 2 (week 6) the player continued the theme of DUP On day 1 and day 4, the player completed more intensity-based drills including short distance (0-20m), accelerations, decelerations and CODs. Conversely on day 2 and day 5, he completed a more extensive HSR theme at the start of the session and an accumulation of low intensity meters towards the end of the session. Daily warmups of either rotational and more flexed positions or more upright HSR mechanics reflected these grass themes to prepare the player appropriately Towards the end of the grass Phase 2 in the day 4 session the player had completed in total 91 accelerations and decelerations (57% of match total volume - Figure 5B) and 109 COD (62% of match total volume - Figure 5C). On day 5 the player accumulated 350m of HSR (peak speed 7.2ms-1 = 85% of maximum speed –Figure 5F) in this extensive day and a total of 6523m in his largest volume session (Figure 5A). Concurrent to the physical work was the ball work where the player completed longer passing type exercises specifically on the intensive days (day 1 and day 4).
During grass Phase 2 in addition to the HSR and reactive drills the player also prioritized RFD work in the gym. RFD was deemed to be the last quality to be completed in the gym61 and a non-negotiable prerequisite to start the maximum speed work in grass Phase 3. The development of the player´s RFD had started beginning at 10 days post-surgery
as the player engaged in the plyometric pathway (Figure 2). Also, by undertaking all of the rehabilitation pathways and achieving qualities like capacity, strength (Figure 4A) and power (Figure 4B) this could finally be accomplished. By replicating the periodization of the power work in grass Phase 1 the player completed pre-grass sessions on day 1, day 4 and day 6 in the week programmed around the theme of RFD A variety of exercises such as hamstring isometrics, drop jumps and hurdle bounds were employed to increase limb stiffness and utilize the fast stretch shortening cycle (<250ms ground contact times).59,61 Minimal repetitions (2-4) and maximum intent was employed as the player´s RFD qualities were profiled in numerous ways. As Figure 5C highlights >90% LSI and pre-injury scores was specifically required in the SL drop jump (jump height and RSI),25 the RFD of the quadriceps peak torque on the IKD at 0.18ms (at 180°/s)28 and the isometric RFD in the hamstrings (3 x 3s isometric holds) on the force plates at 100ms (Figure 4F).26 By the end of week six the player had successfully completed grass Phase 2 as he had achieved the GPS criteria (Figure 1) and the necessary RFD criteria (Figure 5C) which were the prerequisites to start grass Phase 3.
GRASS PHASE 3 – MAXIMUM SPEED AND POSITIONAL DRILLS
At seven weeks post-surgery, the player started grass Phase 3. The aim of this phase was to achieve maximum GPS metrics (Figure 1) and work on any rehabilitation residuals that he had not accomplished. On the grass the phase involved maximum speed work (>95% of maximum speed), increased session volumes (>95% of match total volume in metres), positional drills including CODs, accelerations and decelerations (>95% of match total volumes) and also to complete positional kicking in this case namely shooting drills (Figure 1). The second aim of grass Phase 3 was in the gym. If there are no major asymmetry to work on like in this case, then continuing to monitor essential variables is the focus such as RFD and maximum strength qualities for example.
Grass Phase 3 was periodized in a similar theme (intensive days on day 1 and day 4 and extensive plus volume (low intensity) days on day 2 and day 5) to grass Phases 1 and 2. This was in alignment with the team’s training schedule except the hardest day of the week in RTP was on day 5 as opposed to day 6 (match days) for the team. On the extensive days (day 2 and day 5) the player achieved a speed of 8.4 ms-1 (Figure 6F), 153m sprint meters (Figure 6E) and 580m of HSR (Figure 6D) which equated to 99%, 101% and 106% of his match metrics respectively The second part of his day 5 session included conditioning (high volume at low intensity) as he accumulated a total session distance of 9515m (95% of match total metres). Conversely intensive metrics were similarly developed as he achieved in one session 139 accelerations and decelerations (Figure 6B) and 151 subsequent COD (Figure 6C) (87% and 85% respectively of match total volumes). Chaotic and highly variable movement patterns were individualized for the player through positional drills and shooting drills.27 Similarly controlled collision exercises with the physio and peers were designed
The Development of a Return to Performance Pathway Involving A Professional Soccer Player Returning From A. International Journal of Sports Physical Therapy
to build confidence by replicating his injury mechanism and prepare him for team training in grass Phase 4.
Despite the player achieving >90% LSI and pre-injury ipsilateral maximum scores in the maximum strength (Figure 5A) and RFD profiling (Figure 5C) the player subjectively wanted to maintain these training habits and qualities. He valued their link to performance and his preparation sessions on day 1 and day 4 continued to favor a RFD theme. Conversely after his grass sessions on the day 2 and day 6 he completed a concise maximum strength exposure (3-4 sets x 3-4 repetitions). Accompanying these positives themes the player subjectively felt 90-95% ready to train (Figure 5D) which is also another key psychological prerequisite to be achieved prior to starting with the team in grass Phase 4.
GRASS PHASE 4 – TRAINING TRANSITION
To enter grass Phase 4 at eight weeks post-surgery the player had completed the three grass phases exposing him to the necessary GPS demands (Figure 1) and also accompanying gym profiling (Figure 5D). Clinically he presented with no pain or swelling in his knee. He had experienced no major setbacks during the 8 weeks post-surgery and selfrated his readiness to train at >90%. During grass Phase 4 he rejoined full team training, exposing him to full contact and the inevitable neurocognitive overload that team training brings. The training speeds, spaces and interaction with players and coaches’ instructions undoubtedly overloaded the player, so unnecessary increases in the physical demands were not priortized.27 In the gym the player continued a bi-weekly prophylactic strength exposure in the key exercises he perceived to be benefiting his knee (RFESS, SL leg press, glut-hamstring bench raises, Nordic hamstring exercises, and the IKD, at 3 sets x 5 repetitions at 60°/s).38 His preparation sessions consisted of RFD exercises to ensure the RFD in the concentric and eccentric phases were continuing to improve. Both the strength and RFD sessions contained some of the key profiling tests (for example, strength exercises RFESS, SL leg press and IKD at 60°/s and RFD exercises such as SL drop jump and supine isometric hamstrings) now being employed as simple monitoring exercises to check for any subsequent trending patterns. The detection of any possible drop offs could be addressed early with the appropriately prescribed prophylactic strength or RFD sessions pre or post training. After two weeks of full
team training the player took part in a behind closed door friendly match where he successfully played 45 mins. This was followed, five days later, with another 45 minutes in a friendly match situation. These match minutes were further increased to 75 and 90 minutes before the player played in his first full league match. Similarly, he built up his competitive match minutes from 25 to 45 to 75 as he regained match fitness.
SUMMARY
The purpose of this case report was to outline a RTP for a professional soccer player who successfully restored specific injury criteria (strength, capacity and movement quality), their physical capabilities (plyometric and explosive qualities), and the retraining of their on-field sport specific criteria utilizing the ‘control-chaos continuum.’ The player went through the nine-phase RTP pathway linking the pathology, the development of physical qualities in the gym, and also sport specific qualities on the grass. The pathway utilizes clearly outlined exit criteria for each phase and demonstrates how each of the phases were progressed by graded exposure in the gym and on the grass utilizing the ‘control-chaos continuum’ Furthermore, the provided pathway presents how the players physical qualities were developed in a sequential fashion with capacity and strength developed first followed by plyometric and explosive qualities. The RTP pathway has clear phases, and exit criteria, a philosophy that is not limited by static timebased markers but instead uses objective and performancerelated criteria. By achieving a LSI of >90% and pre-injury scores it allowed the player to complete the process as quickly as possible while ensuring he was safe to return to competition.
CONFLICTS OF INTEREST
The authors report no conflicts of interest.
Submitted: September 11, 2022 CDT, Accepted: February 13, 2023 CDT
This is an open-access article distributed under the terms of the Creative Commons Attribution 4.0 International License (CCBY-NC-4.0). View this license’s legal deed at https://creativecommons.org/licenses/by-nc/4.0 and legal code at https://creativecommons.org/licenses/by-nc/4.0/legalcode for more information.
The Development of a Return to Performance Pathway Involving A Professional Soccer Player Returning From A. International Journal of Sports Physical Therapy
REFERENCES
1. Waldén M, Hägglund M, Magnusson H, Ekstrand J. ACL injuries in men’s professional football: a 15-year prospective study on time trends and return-to-play rates reveals only 65% of players still play at the top level 3 years after ACL rupture. Br J Sports Med 2016;50(12):744-750. doi:10.1136/bjsports-2015-095 952
2. Grassi A, Macchiarola L, Filippini M, Lucidi GA, Della Villa F, Zaffagnini S. Epidemiology of anterior cruciate ligament injury in Italian first division soccer players. Sports Health 2020;12(3):279-288. doi:10.11 77/1941738119885642
3. Della Villa F, Hägglund M, Della Villa S, Ekstrand J, Waldén M. Infographic. High rate of second ACL injury following ACL reconstruction in male professional footballers: an updated longitudinal analysis from 118 players in the UEFA elite club injury study. Br J Sports Med. 2021;55(23):1379-1380. doi:10.1136/bjsports-2021-104508
4. Ardern CL, Webster KE, Taylor NF, Feller JA. Return to sport following anterior cruciate ligament reconstruction surgery: a systematic review and meta-analysis of the state of play Br J Sports Med 2011;45(7):596-606. doi:10.1136/bjsm.2010.076364
5. Ardern CL, Glasgow P, Schneiders A, et al. Consensus statement on return to sport from the first world congress in sports physical therapy, Bern. Br J Sports Med 2016;50(14):853-864. doi:10.1136/bjsport s-2016-096278
6. Webster KE, Hewett TE. What is the evidence for and validity of return-to-sport testing after anterior cruciate ligament reconstruction surgery? A systematic review and meta-analysis. Sports Med. 2019;49(6):917-929. doi:10.1007/s40279-019-01093-x
7 van Melick N, van Cingel REH, Brooijmans F, et al. Evidence-based clinical practice update: practice guidelines for anterior cruciate ligament rehabilitation based on a systematic review and multidisciplinary consensus. Br J Sports Med. 2016;50(24):1506-1515. doi:10.1136/bjsports-2015-0 95898
8. Kyritsis P, Bahr R, Landreau P, Miladi R, Witvrouw E. Likelihood of ACL graft rupture: not meeting six clinical discharge criteria before return to sport is associated with a four times greater risk of rupture. Br J Sports Med 2016;50(15):946-951. doi:10.1136/bjs ports-2015-095908
9. McCurdy K, Langford GA, Cline AL, et al. The reliability of 1- and 3RM tests of unilateral strength in trained and untrained men and women. J Sports Sci Med 2004;1,3(3):190-6:190-196.
10. Taberner M, van Dyk N, Allen T, et al. Physical preparation and return to performance of an elite female football player following ACL reconstruction: a journey to the FIFA Women’s World Cup. BMJ Open Sport Exerc Med. 2020;6(1):e000843. doi:10.1136/bmjs em-2020-000843
11. Thorstensson CA, Petersson IF, Jacobsson LT, et al. Reduced functional performance in the lower extremity predicted radiographic knee osteoarthritis five years later Ann Rheum Dis 2004;63(4):402-407 d oi:10.1136/ard.2003.007583
12. Silbernagel KG, Nilsson-Helander K, Thomeé R, Eriksson BI, Karlsson J. A new measurement of heelrise endurance with the ability to detect functional deficits in patients with Achilles tendon rupture. Knee Surg Sports Traumatol Arthrosc 2010;18(2):258-264. d oi:10.1007/s00167-009-0889-7
13. Freckleton G, Cook J, Pizzari T The predictive validity of a single leg bridge test for hamstring injuries in Australian Rules Football Players. Br J Sports Med 2014;48(8):713-717 doi:10.1136/bjsport s-2013-092356
14. Buckthorpe M, Della Villa F. Optimising the “midstage” training and testing process after ACL reconstruction. Sports Med 2020;50(4):657-678. doi:1 0.1007/s40279-019-01222-6
15. Buckthorpe M, Tamisari A, Villa FD. The ten taskbased progressions in rehabilitation after ACL reconstruction: from post-surgery to return to play –a clinical commentary. Intl J Sports Phys Ther. 2020;15(4):611-623. doi:10.26603/ijspt20200611
16. Nagai T, Schilaty ND, Laskowski ER, Hewett TE. Hop tests can result in higher limb symmetry index values than isokinetic strength and leg press tests in patients following ACL reconstruction. Knee Surg Sports Traumatol Arthrosc. 2020;28(3):816-822. doi:1 0.1007/s00167-019-05513-3
17 Welling W, Benjaminse A, Seil R, Lemmink K, Zaffagnini S, Gokeler A. Low rates of patients meeting return to sport criteria 9 months after anterior cruciate ligament reconstruction: a prospective longitudinal study. Knee Surg Sports Traumatol Arthrosc 2018;26(12):3636-3644. doi:10.10 07/s00167-018-4916-4
The Development of a Return to Performance Pathway Involving A Professional Soccer Player Returning From A. International Journal of Sports Physical Therapy
18. Xergia SA, Pappas E, Georgoulis AD Association of the single limb hop test with isokinetic, kinematic, and kinetic asymmetries in patients after anterior cruciate ligament reconstruction. Sports Health. 2014;7(3):217-223. doi:10.1177/1941738114529532
19. Ebert JR, Du Preez L, Furzer B, Edwards P, Joss B. Which hop tests can best identify functional limb asymmetry in patients 9-12 months after anterior cruciate ligament reconstruction employing a hamstrings tendon autograft? Int J Sports Phys Ther. 2021;16(2):393-403. doi:10.26603/001c.21140
20. Kotsifaki A, Van Rossom S, Whiteley R, et al. Symmetry in Triple Hop Distance Hides Asymmetries in Knee Function After ACL Reconstruction in Athletes at Return to Sports. Am J Sports Med 2022;50(2):441-450. doi:10.1177/03635465211063192
21. Mitchell A, Greig M. Peak instantaneous playerload metrics highlight movement strategy deficits in professional male soccer players. Res Sports Med. 2022;20:1-11. doi:10.1080/15438627.2022.20799
22. Mitchell A, Holding C, Greig M. Factors influencing optimum countermovement jump performance and movement strategy in Championship professional football players: implications for player profiling. Res Sports Med. 2020;30(1):30-40. doi:10.1080/15438627.2020.186004
23. Mitchell A, Holding C, Greig M. The influence of injury history on countermovement jump performance and movement strategy in professional soccer players: Implications for profiling and rehabilitation Foci. J Sport Rehabil 2021;25(30):768-773.
24. O’Malley E, Richter C, King E, et al. Countermovement jump and isokinetic dynamometry as measures of rehabilitation status after anterior cruciate ligament reconstruction. J Athl Train. 2018;53(7):687-695. doi:10.4085/1062-6050-480-16
25. Kotsifaki A, van Rossom S, Whiteley R, et al. Single leg vertical jump performance identifies knee function deficits at return to sport after ACL reconstruction in male athletes. Br J Sports Med 2022;56(9):490-498. doi:10.1136/bjsports-2021-1046 92
26. Taberner M, Cohen DD Physical preparation of the football player with an intramuscular hamstring tendon tear: clinical perspective with video demonstrations. Br J Sports Med 2018;52(19):1275-1278. doi:10.1136/bjsports-2017-09 8817
27 Taberner M, Allen T, Cohen DD Progressing rehabilitation after injury: consider the ‘controlchaos continuum.’ Br J Sports Med 2019;53(18):1132-1136. doi:10.1136/bjsports-2018-1 00157
28. van der Horst N, Denderen R van. Isokinetic hamstring and quadriceps strength interpretation guideline for football (soccer) players with ACL reconstruction: a Delphi consensus study in the Netherlands. Sci Med Footb. 2022;6(4):434-445. doi:1 0.1080/24733938.2021.2024592
29. Herrington L, Myer G, Horsley I. Task based rehabilitation protocol for elite athletes following Anterior Cruciate ligament reconstruction: a clinical commentary Phys Ther Sport 2013;14(4):188-198. do i:10.1016/j.ptsp.2013.08.001
30. Sturgill LP, Snyder-Mackler L, Manal TJ, Axe MJ. Interrater reliability of a clinical scale to assess knee joint effusion. J Orthop Sports Phys Ther 2009;39(12):845-849. doi:10.2519/jospt.2009.3143
31. Lentz TA, Zeppieri GJ, Tillman SM, et al. Return to preinjury sports participation following anterior cruciate ligament reconstruction: contributions of demographic, knee impairment, and self-report measures. J Orthop Sports Phys Ther 2012;42(11):893-901. doi:10.2519/jospt.2012.4077
32. Peterson MD, Dodd DJ, Alvar BA, Rhea MR, Favre M. Undulation training for development of hierarchical fitness and improved firefighter job performance. J Strength Cond Res 2008;22(5):1683-1695. doi:10.1519/jsc.0b013e318182 15f4
33. Prestes J, Frollini AB, de Lima C, et al. Comparison between linear and daily undulating periodized resistance training to increase strength. J Strength and Cond Res 2009;23(9):2437-2442. doi:1 0.1519/jsc.0b013e3181c03548
34. Grgic J, Mikulic P, Podnar H, Pedisic Z. Effects of linear and daily undulating periodized resistance training programs on measures of muscle hypertrophy: a systematic review and meta-analysis. PeerJ 2017;5:e3695. doi:10.7717/peerj.3695
35. Kiely J. Periodization Theory: Confronting an inconvenient truth. Sports Med. 2018;48(4):753-764. doi:10.1007/s40279-017-0823-y
36. Jordan MJ, Aagaard P, Herzog W Lower limb asymmetry in mechanical muscle function: A comparison between ski racers with and without ACL reconstruction. Scand J Med Sci Sports 2015;25(3):e301-e309. doi:10.1111/sms.12314
85
9
The Development of a Return to Performance Pathway Involving A Professional Soccer Player Returning From A. International Journal of Sports Physical Therapy
37 Maly T, Zahalka F, Mala L. Muscular strength and strength asymmetries in elite and sub-elite professional soccer player Sport Science 2014;1:26-33.
38. Undheim MB, Cosgrave C, King E, et al. Isokinetic muscle strength and readiness to return to sport following anterior cruciate ligament reconstruction: is there an association? A systematic review and a protocol recommendation. Br J Sports Med 2015;49(20):1305-1310. doi:10.1136/bjsports-2014-0 93962
39. Higashihara A, Ono T, Kubota J, Okuwaki T, Fukubayashi T Functional differences in the activity of the hamstring muscles with increasing running speed. J Sports Sci 2010;28(10):1085-1092. doi:10.108 0/02640414.2010.494308
40. Hoff J, Wisløff U, Engen LC, et al. Soccer specific aerobic endurance training. Br J Sports Med 2002;36(3):218-221. doi:10.1136/bjsm.36.3.218
41. Hewett TE, Myer GD. The mechanistic connection between the trunk, hip, knee, and anterior cruciate ligament injury Exerc Sport Sci Rev 2011;39(4):161-166. doi:10.1097/jes.0b013e31822974 39
42. Ireland ML. Anterior cruciate ligament injury in female athletes: epidemiology. J Athl Train. 1999;34(2):150-154.
43. Sepúlveda F, Sánchez L, Eduardo A, Micheo W Anterior Cruciate Ligament Injury: Return to Play, Function and Long-Term Considerations. Current Sports Medicine Reports 2017;16(3):172-178. doi:10.1 249/jsr.0000000000000356
44. Logan M, Watts M, Owen J, Myers P. Meniscal repair in the elite athlete: results of 45 repairs with a minimum 5-year follow-up. Am J Sports Med. 2009;37(6):1131-1134. doi:10.1177/036354650833013
45. Majeed H, Karuppiah S, Sigamoney KV, Geutjens G, Straw RG. All-inside meniscal repair surgery: factors affecting the outcome. J Orthopaed Traumatol 2015;16(3):245-249. doi:10.1007/s10195-015-0342-2
46. Deore DrS, Patil DrB, Kale DrS, Samant DrP, Ali DrS. Influence of meniscal repair versus meniscectomy on ACL reconstruction in terms of knee stability and radiological imaging. Int J Orthop Sci 2017;3(4l):853-858. doi:10.22271/ortho.2017 v3.i 4l.117
47. Deledda D, Rosso F, Cottino U, Bonasia D, Rossi R. Results of meniscectomy and meniscal repair in anterior cruciate ligament reconstruction. Joints 2016;03(03):151-157. doi:10.11138/jts/2015.3.3.151
48. Arno S, Hadley S, Campbell KA, et al. The effect of arthroscopic partial medial meniscectomy on tibiofemoral stability Am J Sports Med 2013;41(1):73-79. doi:10.1177/0363546512464482
49. von Essen C, Hallgren A, Barenius B, Eriksson K. Utilizing a contralateral hamstring autograft facilitates earlier isokinetic and isometric strength recovery after anterior cruciate ligament reconstruction: a randomised controlled trial. Knee Surg Sports Traumatol Arthrosc. 2021;29(8):2684-2694. doi:10.1007/s00167-021-0649 1-1
50. Isberg J, Faxén E, Brandsson S, Eriksson BI, Kärrholm J, Karlsson J. Early active extension after anterior cruciate ligament reconstruction does not result in increased laxity of the knee. Knee Surg Sports Traumatol Arthrosc 2006;14(11):1108-1115. do i:10.1007/s00167-006-0138-2
51. Eriksson K, von Essen C, Jönhagen S, Barenius B. No risk of arthrofibrosis after acute anterior cruciate ligament reconstruction. Knee Surg Sports Traumatol Arthrosc. 2018;26(10):2875-2882. doi:10.1007/s0016 7-017-4814-1
52. Lynch AD, Logerstedt DS, Axe MJ, Snyder-Mackler L. Quadriceps activation failure after anterior cruciate ligament rupture is not mediated by knee joint effusion. J Orthop Sports Phys Ther 2012;42(6):502-510. doi:10.2519/jospt.2012.3793
53. Harput G, Ulusoy B, Yildiz TI, et al. Crosseducation improves quadriceps strength recovery after ACL reconstruction: a randomized controlled trial. Knee Surg Sports Traumatol Arthrosc. 2019;27(1):68-75. doi:10.1007/s00167-018-5040-1
54. Mitchell AJ. The Psychology Of The Athlete - The Physiotherapist’s Perspective. In: Porter S. Psychologically Informed Physiotherapy: Embedding Psychosocial Perspectives within Clinical Management 1st ed. Elsevier Saunders; 2017:162-187.
55. Taylor JB, Owen E, Ford KR. Incorporating workload measures into rehabilitation after anterior cruciate ligament reconstruction: a case report. Intl J Sports Phys Ther 2020;15(5):823-831. doi:10.26603/ij spt20200823
56. Joreitz R, Lynch A, Popchak A, Irrgang J. Criterion-based rehabilitation program with return to sport testing following acl reconstruction: a case series. Intl J Sports Phys Ther. 2020;15(6):1151-1173. doi:10.26603/ijspt20201151
8
The Development of a Return to Performance Pathway Involving A Professional Soccer Player Returning From A. International Journal of Sports Physical Therapy
57 Davies GJ, Riemann B, Ellenbecker T Role of isokinetic testing and training after ACL injury and reconstruction. In: Noyes F, Barber-Westin S, eds. ACL Injuries in the Female Athlete. Springer Berlin Heidelberg; 2018:567-588. doi:10.1007/978-3-662-56 558-2_24
58. Buckthorpe M, Pirotti E, Villa FD Benefits and use of aquatic therapy during rehabilitation after acl reconstruction -a clinical commentary Intl J Sports Phys Ther. 2019;14(6):978-993. doi:10.26603/ijspt201 90978
59. Buckthorpe M, Della Villa F. Recommendations for plyometric training after ACL reconstruction – A clinical commentary. Int J Sports Phys Ther. 2021;16(3):879-895. doi:10.26603/001c.23549
60. Hewett TE, Myer GD, Zazulak BT Hamstrings to quadriceps peak torque ratios diverge between sexes with increasing isokinetic angular velocity J Sci Med Sport 2008;11(5):452-459. doi:10.1016/j.jsams.2007.0
4.009
61. Buckthorpe M, Roi GS. The time has come to incorporate a greater focus on rate of force development training in the sports injury rehabilitation process. Muscles Ligaments Tendons J. 2018;10(3):435. doi:10.32098/mltj.03.2017.05
62. McMillan K, Helgerud J, Macdonald R, Hoff J. Physiological adaptations to soccer specific endurance training in professional youth soccer players. Br J Sports Med 2005;39(5):273-277 doi:10.1 136/bjsm.2004.012526
63. Zagatto A, Papoti M, da Silva A, et al. The Hoff circuit test is more specific than an incremental treadmill test to assess endurance with the ball in youth soccer players. Biol Sport. 2016;33(3):263-268. doi:10.5604/20831862.1201913
The Development of a Return to Performance Pathway Involving A Professional Soccer Player Returning From A. International Journal of Sports Physical Therapy
Case Reports
The Longitudinal Neurophysiological Adaptation of a Division
I
Female Lacrosse Player Following Anterior Cruciate Rupture and Repair: A Case Report
Robert Mangine1,2a , Jim Tersak3 , Thomas Palmer4 , Audrey Hill-Lindsay5 , Bolton Patton6 , Marsha Eifert-Mangine7,8 , Bradley Jacobs9,10 , Angelo J Colosimo11
1 Director of Residency Education, NovaCare Rehabilitation, 2 Associate Director Sports Medicine, University of Cincinnati, 3 Sports Medicine Director of Rehabilitation, NovaCare Rehabilitation, 4 Exercise Science and Integrative Health, Mount St. Joseph University, 5 CLR Neurosthenics Inc, 6 Physical Therapy, University of Alabama at Birmingham, 7 Physical Therapy, Mount St. Joseph University, 8 NovaCare Rehabilitation, 9 Neuro-Visual Performance Institute, 10 Clinical Research Associate, University of Cincinnati, 11 Orthopedics, University of Cincinnati
Keywords: Neurophysiological adaptation, ACL Rehabilitation, Hemispheric asymmetries, Brain Mapping https://doi.org/10.26603/001c.73179
International Journal of Sports Physical Therapy
Background
Neurophysiological adaptation following anterior cruciate ligament (ACL) rupture and repair (ACLR) is critical in establishing neural pathways during the rehabilitation process. However, there is limited objective measures available to assess neurological and physiological markers of rehabilitation.
Purpose
To investigate the innovative use of quantitative electroencephalography (qEEG) to monitor the longitudinal change in brain and central nervous systems activity while measuring musculoskeletal function during an anterior cruciate ligament repair rehabilitation.
Case Description
A 19 year-old, right-handed, Division I NCAA female lacrosse midfielder suffered an anterior cruciate ligament rupture, with a tear to the posterior horn of the lateral meniscus of the right knee. Arthroscopic reconstruction utilizing a hamstring autograft and a 5% lateral meniscectomy was performed. An evidence-based ACLR rehabilitation protocol was implemented while using qEEG.
Outcomes
Central nervous system, brain performance and musculoskeletal functional biomarkers were monitored longitudinally at three separate time points following anterior cruciate injury: twenty-four hours post ACL rupture, one month and 10 months following ACLR surgery Biological markers of stress, recovery, brain workload, attention and physiological arousal levels yielded elevated stress determinants in the acute stages of injury and were accompanied with noted brain alterations. Brain and musculoskeletal dysfunction longitudinally reveal a neurophysiological acute compensation and recovering accommodations from time point one to three. Biological responses to stress, brain workload, arousal, attention and brain connectivity all improved over time.
Discussion
The neurophysiological responses following acute ACL rupture demonstrates significant dysfunction and asymmetries neurocognitively and physiologically. Initial qEEG assessments revealed hypoconnectivity and brain state dysregulation. Progressive enhanced brain efficiency and functional task progressions associated with ACLR rehabilitation had notable simultaneous improvements. There may be a role for
Corresponding Author: manginre@ucmail.uc.edu
a
Mangine R, Tersak J, Palmer T, et al. The Longitudinal Neurophysiological Adaptation of a Division I Female Lacrosse Player Following Anterior Cruciate Rupture and Repair: A Case Report. IJSPT. Published online April 1, 2023. doi:10.26603/001c.73179
monitoring CNS/brain state throughout rehabilitation and return to play Future studies should investigate the use of qEEG and neurophysiological properties in tandem during the rehabilitation progression and return to play
BACKGROUND AND PURPOSE
Injury to the anterior cruciate ligament (ACL) causes an immediate functional disparity to knee joint proprioception and the central and peripheral nervous systems. The neurological and physical alteration in joint mechanics warrants targeted interventions to regain functional performance.1–3 Clinicians rely on progressive physical and neurological best practice intervention techniques to advance and guide rehabilitation and functional performance that leads to return to play sport parameters.3,4 After injury or surgery clinicians are presented with the challenge to improve or correct mechanical dysfunctions including bilateral and/or ipsilateral asymmetries in balance, strength, coordination, and reacquisition of skills. Recent data indicates the changes that occur in musculoskeletal or physical performance during the rehabilitation process may be illproportioned to the improvements noted by the central and peripheral neurological systems following ACL rupture and repair.1,3
Immediately post-injury there are drastic changes to the both afferent (sensory) and efferent (motor) components of the peripheral nervous system which results in disrupted proprioceptive and motor function.1,3 Activity at the brain and central nervous system (CNS) are therefore impacted by deficits in the neurophysiological somatosensory, motor excitability, and neural connective pathways throughout the body The ligament rupture results in an altered feedback loop and changes of CNS processing of somatosensory information and concomitant alterations in motor responses.1,3 Patients struggle to accurately maintain kinesthetic awareness, joint position awareness, the accuracy of the velocity of movements, and muscle forces necessary to function appropriately.3 As a result, recent literature supports the use of treatment protocols that target somatosensory processing in the CNS in tandem with the management of impairments of pain, swelling, joint instability, and motor dysfunction.1,5 The impaired feedback from ligament rupture results in advanced stages of disaffirmations and degradative neuroplastic modifications that result in insufficient efferent motor responses, and lead to functional limitations related to lack of body/limb coordination, postural control issues, and gait deviations.3,4,6 For these reasons, researchers and clinicians attempt to target neural adaptation of both the peripheral and central nervous systems.3 Neural adaptation following a significant alteration in afferent activity is well documented in the literature for joint replacement where numerous afferents are lost and other systems adapt to provide proprioception-like afferents.3,4 While acute neural changes have been monitored in the brain during functional activities, there is very little empirical real-time evidence of central/brain neural modifications sequentially throughout the progressions of a postACL repair/rehabilitation program. Thus, monitoring brain and central nervous system performance throughout a re-
habilitation program may provide objective metrics to improve the neuromuscular training and neurophysiological development needed during rehabilitation following an injury, such as a ruptured ACL.4,5
Quantitative electroencephalography (qEEG), commonly referred to as “Brain Mapping” is the utilization of a digitized signal to analyze changes in brain function and performance. Measuring feedback loops between sensorimotor stimuli and functional tasks allows clinicians to measure cortical electrical brain wave activity These measures can be used to evaluate a variety of conditions thought to be rooted to the brain, such as, post-traumatic stress disorder (PTSD), attention disorders, autism, epilepsy, seizure disorders, dementia, headaches, traumatic brain injuries, sleep disorders and learning disorders.4,7,8 qEEG applies sophisticated mathematical and statistical analysis to the brain wave patterns and compares these observations to an universal database compiled of numerous healthy controls representing a variety of ages and genders.7 The qEEG system used in this study has added technological advances that allow for dynamic activities to be performed during the qEEG data collection, resulting in a more profound assessment of qEEG and neurophysiological metrics as part of a rehabilitation program for an ACL rupture. Such measures display real-time brain electrical activity that occurs during physical activities. The Cognionics (CGX) Quick- 20r v2, 21 channel state of the art dry EEG headset (CGX EEG) from CLR Neurosthenics, Inc (Manhattan Beach, CA), with LED impedance indicators is used to collect continuous electrical signals from the brain that measure the magnitude and timing of cortical activity across 19 active channels (with 2 reference channels) relative to a stimulus or a motor task.9 Cortical activity can be evaluated in response to a stimulus or functional task associated with the specific action.8
A well-functioning and active brain is classified as being in a regulated ready state with efficient brain connectivity as indicated by the red/orange highlights on a qEEG brain image.7,9 Two brain maps are presented in Figures 1a and 1b Figure 1a represents a well-regulated state with little inhibitory drive which indicates efficient brain connections.7 Figure 1b represents an inhibited neurophysiological state indicating poor efficiency
of brain connectivity
The image in Figure 1b was obtained within 24 hours of knee post-injury The blue tints seen in Figure 1b are indicative of a dysregulated and poor electrical active brain state. The type and strength of the electrical impulses or brain waves can be analyzed to determine how different parts of the brain function and communicate during a given task. For example, different EEG signals: delta (0.5–4 Hz), theta (4–7 Hz), and alpha (8–12 Hz) waves have multifaceted cortical sensory integrations used to promote motor activity that can reflect a motor and/or sensory activity period.10 Memory tasks are associated strictly with theta and alpha waves typically involved with inhibition or deactivation of sensorimotor activities.8,10 Evaluating the
The Longitudinal Neurophysiological Adaptation of a Division I Female
International Journal of Sports Physical Therapy
Lacrosse Player Following Anterior Cruciate Rupture.
strength in electrical activity and band frequency of the brain waves throughout the cortex can quantitatively reflect the activity associated with a physical task.10

There are limited data identifying the cortical changes that occur throughout the linear progression of an ACLR rehabilitation program. Documenting the electrophysiological changes and accommodations at the brain and/or central nervous system level while progressing cognitive and physiological motor tasks used post-ACL injury or surgery may be valuable in developing more precise exercise progressions and return-to-play decisions. The purpose of this case report was to investigate the innovative use of qEEG and neurophysiological metrics to monitor the longitudinal and simultaneous change in brain and central nervous systems activity while measuring musculoskeletal function during an anterior cruciate ligament repair rehabilitation.

CASE DESCRIPTION
SUBJECT DEMOGRAPHICS
A 19-year-old, right-handed, Division I NCAA female lacrosse midfielder with 10 years of playing experience suffered a full thickness mid-substance anterior cruciate ligament rupture and a vertical posterior horn tear of the lateral meniscus near the intercondylar notch of the right knee. Clinical evaluation revealed moderate capsular swelling and a dysfunctional limb with pain during gait. Joint laxity following a Lachman’s anterior drawer, pivot shift, valgus, and varus stability tests revealed excessive anterior tibial translation and a grade 1 MCL and LCL sprain. The injury occurred on 01/24/2022, and findings were confirmed the same day via MRI. An arthroscopy with anterior cruciate ligament reconstruction using hamstring tendon autograft and a 5% lateral meniscectomy was performed on 01/28/2022. The subject volunteered to take part in the
case study and signed an informed consent regarding patient confidentiality and the protection offered by the U.S. Health Insurance Portability and Accountability Act (HIPAA). This project received no outside funding and the research was completed by the University of Cincinnati Sport Science Research Team.
During the course of the rehabilitation program, the patient’s central nervous system, brain performance and musculoskeletal function were monitored longitudinally at three separate time points: twenty-four hours post ACL rupture, one month following ACLR surgery and ten months following ACLR surgery Brain wave activity was observed using a CGX EEG head set at each time point. Congruently, the athlete participated in a contemporary evidence-based ACL rehabilitation protocol throughout all time points as outlined in Appendix A: Rehabilitation Summary Outline.11,12 The expected limitations in functional mobility early in the rehabilitation progression restricted some physical testing during the early testing dates; however, normal rehabilitative functional parameters were implemented to assure return to play status over time.
EXPLANATION OF OUTCOME MEASURES
Brain activity-dependent variables were measured using the CGX EEG head set. Cognitive workload metric, cognitive attention metric, sensorimotor rhythm (SMR) asymmetry, galvanic skin response (GSR), and three-dimensional cortex connectivity were derived to account for the central nervous system and brain precision and efficiency 13 Cognitive workload metric represents the depletion of mental resources of the brain due to higher levels of cognitive or sensory demands placed on the brain.14 GSR measures sympathetic conductance and electrical activity via a skin electrode which offers insight into the emotional state, or arousal, of a subject under specific experimental conditions. CNS arousal is typically directed by the thalamus with an emphasis on processing sensory inputs from the vision and hearing centers of the brain.13 Brain attention refers to a person’s ability to attain, remember, understand, and apply information.13 Heart rate (HR), heart rate variability (HRV), respiration rate (RR), peripheral body temperature, and superficial trapezius EMG activity were measured. Increases in HR, RR, and trapezius EMG activity are associated with elevated levels of central nervous system stress or increased GSR, whereas, HRV decreases with higher levels of stress.15
Neurocognitive and physical psychometric measures consisted of the Stroop test,16,17 visual reaction,17,18 a reaction time test,17 musculoskeletal range of motion, strength, a functional movement assessment consisting of balance-mobility-gait tasks,11,12 and force plate outputs for jump and landing mechanics on a ForceDecks (VALD Performance, Charlotte NC) force plates.19,20 The Stroop test is a neuropsychological test used to assess the speed or ability to process cognitive interference, inhibition, and selective attention capacity relative to simultaneous stimuli.16,17 The visual reaction was measured using the Dynavision D2, (Cincinnati, OH) A*-Proactive assessment which requires the individual to react and strike lights as they il-
Figure 1a. Regulated Brain State
Figure 1b. Dysregulated Brain State
The Longitudinal Neurophysiological Adaptation of a Division I Female
International Journal of Sports Physical Therapy
Lacrosse Player Following Anterior Cruciate Rupture.
luminate as quick as possible when presented in a random, computer-selected algorithm. In a similar fashion, the decision reaction time tests measured the response speed of the left and right hand and left-to-right brain activity precision prompted by visual stimuli.18 The functional movement and force plate assessments were used to measure bilateral functional asymmetries and relative ground reaction force upon walking gait, balance, landing, and jumping activities. Specifically, the force plate offers insight to force acceleration/decelerations, reactions, and bilateral imbalances. Overall, each measure provides an initial marker for longitudinal progressions that offer insight to assist in monitoring changes in functional performance and left-toright symmetries of the limbs and brain function. The data was analyzed using CLR Neurosthenics, Inc neuroanalytics provided by Intheon Labs (San Deigo, CA).
The initial qEEG assessment was performed twenty-four hours following injury while the athlete was being monitored and treated to manage the acute stage swelling and pain. Non-weight bearing/crutch ambulation, ice, compression, elevation, and linear mobility exercises were initiated to promote improvement in passive and active ROM with reductions in pain and swelling. The state of the acute injury limited the ability to perform extensive functional and physical assessments. Immediately following injury, the reduction in the motor neuron network demonstrates a potentially altered signal from the peripheral receptors.21 Therefore, the initial tests used to monitor neurophysiological status using qEEG were the physiological regulatory measures, the Stroop test, decision reaction time, attention, workload, and SMR metrics. There was no pre-injury baseline.
One month post-surgical reconstruction, the athlete was progressing through a best-practice rehabilitation program previously reported to have sustainable, valid, and reliable techniques ideal for athletic populations and return-toplay progressions.11 Throughout the rehabilitation protocol the athlete progressed with improvements noted in pain, swelling, ROM, function, and functional joint stability.
OUTCOMES
Heart rate, heart rate variability, respiration, and brain attention levels yielded high-stress
Determinants in the acute stages of injury were associated with brain dysregulation, hemispheric asymmetries (Tables 2 and 3) and musculoskeletal functional asymmetries. Traditional objective measures of knee joint laxity, range of motion, swelling, strength, and patient-reported outcomes were collected throughout the rehabilitation progression and are outlined in Tables 4, 5, and 6 Central nervous system, brain performance, and musculoskeletal functional biomarkers were monitored longitudinally at three separate time points following anterior cruciate injury: twenty-four hours post ACL rupture, one month, and nine months which was the time period for her return to competition following ACLR surgery. Brain and musculoskeletal dysfunction longitudinally reveal a neurophysiological acute compensation and recovering accommodation from time points
one to three. In addition, biological responses to stress, neuroanalytics of brain workload, arousal, and attention all advanced to more commonly regulated function during the progression of the rehabilitation. The neurophysiological development following acute ACL rupture demonstrates significant dysfunction in asymmetrical functions both neurocognitively and physiologically
DISCUSSION
The original intent of this case was to investigate the innovative use of qEEG and neurophysiological metrics to monitor the longitudinal and simultaneous change in brain and central nervous systems activity while measuring musculoskeletal function during an anterior cruciate ligament repair rehabilitation. The data captured initial brain dysregulation and signs of accommodation that were simultaneously associated with muscular dysfunction over the nine-month period. Other authors have monitored only qEEG activity during isolated positional (kinesthetic) activity or only active ROM to demonstrate changes in brain wave activity.3,4,9 This is the first report to examine the use of the CGX EEG headset to perform a qEEG to evaluate and demonstrate simultaneous changes in both the central nervous system and the peripheral musculoskeletal system throughout an ACLR rehabilitation sequence.
The initial data regarding hemispheric asymmetries (Table 3) indicates the athlete’s brain was in a dysregulated state at initial injury and one-month following injury, but not at nine months following injury A difference in brain activity, as little as 10-15% between each hemisphere, appears to create a dysregulated state.10 The initially slower right-handed reaction times indicate potential left hemisphere disruption as a result of having to accommodate for the injury to the right knee.21 In comparison, the lefthand reaction time was not clinically significant between time points one and two; however, it did demonstrate noted clinical improvements at nine months. The right hand was vastly different for all time points revealing a potential lag or inhibition in motor planning.21 The Dynavision D2 assessments from one month and nine months post-surgery revealed no significant change in performance which may indicate visual reaction time and accommodation following injury occur within the first month of rehabilitation and recovery. Recent literature has revealed both accuracy and reaction times to be impaired following ACLR.21 Conversely, this case data revealed slower reaction times following injury but no lag in accuracy The results of the Stroop test remained constant throughout the rehabilitation program while the speed of responses significantly improved between each time point (Table 2).
The dysregulation noted in this case is likely multifactorial and associated with a compromised motor planning sequence. Recent literature has identified a potential inhibition response due to an increased strain on brain connectivity commonly associated with ACLR patients.21 The qEEG along with the neurophysiological measurements provides a clearer understanding of how the neural mapping of the dysregulated brain state and neurocognitive
The Longitudinal Neurophysiological Adaptation of a Division I Female Lacrosse Player Following Anterior Cruciate Rupture. International Journal of Sports Physical Therapy
function are impacted during ACLR recovery. Bruns et al., reported hemispheric decoupling can be altered based on a task.10 Thought to be the result of lower corticospinal excitability in ACLR patients, lags in neurocognitive reaction time following injury appears to create a widespread corti-
cal inhibition contributing to poor neural connectivity and peripheral motor response time. Reaction time and motor response play a vital role in athletic participation; thus, understanding the contributing factors of the CNS during ACLR recovery is critical to return to play progressions.
Rate
Respiration
Dates/ Tasks Attention # Mean SEM Workload* Mean SEM SMR Asymmetry^ Mean SEM Heart Rate Mean SEM HRV Mean SEM Respiration Mean SEM 1/25/21/ FMS, RT 1.39 .007 .776 .003 .007 .000 77 .159 293 5.10 16 .049 2/23/21/ FMS, RT 1.17 .008 .752 .005 .001 .001 54 .379 787 15.6 14 .058 11/14/21 FMS, RT FD 1.02 .063 .731 .002 .012 .000 63 .464 564 25.3 17 0119 FMS- Functional Movement Screen: functional gait and lower extremity landing tasks RT- Reaction Time Task: used to assess speed and accuracy of decision making T1= Time point of initial qEEG assessment (1/25/21) T2= Time point of second qEEG assessment (2/23/21) T3= Time point of third qEEG assessment (11/14/21)
Table
1.
Attention, Workload, Sensory Motor Asymmetry, Heart Rate, Heart
Variability,
Means and Standard Error of Measure.
Assessment Time Points/Tools T 1 (1/25/2021) T 2 (2/23/2021) T3 (11/14/2021) Dynavision (touch/min) AVE NA 77 76 Stroop (ms)% Correct 97 95 97 Stroop Response time (ms) 772 654 552 Reaction Time- Left Hand (ms) 445 428 395 Reaction Time- Right Hand (ms) 498 411 337 Reaction Time- L/R Average (ms) 462 410 366 T1 to T2, T2 to T3, T1 to T3 indicates assessment times 1 = (1/25/2021), 2= (2/23/2021) and 3= (11/14/2021) L/R= Left-to-Right hand
time
Table
2.
Longitudinal Change for Dynavision, Stroop Test, Stroop Reaction Time and Decision Reaction Time.
reaction
average *Indicates no immediate deficit in reaction time following injury
Date Hemispheric Symmetry Left Right Left-to-Right Hemispheric Differences % Difference Left to Right hemisphere Impression 1/25/2021 847 718 129 15% Dysregulated 2/23/2021 622 683 61 10% Dysregulated 11/14/2021 566 539 27 2% Regulated
Table 3. Left to Right Hemisphere Symmetry, Percent Difference
Table 4. Knee arthrometry anterior tibial translation measures (mm) of involved and uninvolved knees by Newtons(N) of anterior force and time point from date of surgery.
Time 24 hours (initial) 1 month 6 months 9 Months Anterior Deficit 66(N) -0.95mm 0.17mm 0.14mm 0.24mm Anterior Deficit 88(N) -0.94mm 0.01mm 0.29mm 0.23mm Anterior Deficit 132 (N) -1.10mm -- 0.13mm 1.35mm
Knee Arthrometry (Knee Lax 3)
*Anterior tibial translation was measured with Knee Lax 3 device. *(N)- Newtons of Anterior Force.
The Longitudinal Neurophysiological Adaptation of a Division I Female Lacrosse Player Following Anterior Cruciate Rupture. International Journal of Sports Physical Therapy
In the current case, attention and workload metrics were elevated beyond normal levels immediately following injury and progressively decreased over time regardless of physical or visual tasks. The workload metric was notably different initially, likely due to the CNS accommodating following the injury 4,21,22 As a result, the initial workload values were elevated and trended higher with physical demands of jump landing, but not for the simple functional movements. The immediate elevation in the attention and workload metrics is consistent with previous reports of injury decreasing brain connectivity and efficiency following injury.22 The increased workload and attention are accommodation mechanics thought to stimulate alternative neuronal activity directed on returning peripheral limb function.21 In addition, when an individual is under high cognitive workload and the cognitive workload approaches the individual’s cognitive capacity, human errors often occur 14 Overall, hemisphere regulation was regained over an 8 month time frame, as indicated by a two-percent differential in brain hemisphere symmetries (see Table 3). It is important to note that the asymmetries that occurred in the central nervous system and brain regions of interest were associated with similar accommodations and asymmetries in musculoskeletal function (See Tables 2 and 3).
Re-establishing normal function to the pre-injury level is the primary goal of rehabilitation after ACLR. The rehabilitation program used in the current case consisted of functional progressions normally seen in a traditional ACLR protocol. Return-to-play criteria rely on physical and clinical assessments related to range of motion, kinesthetic awareness, balance, and strength. The functional move-
ment and force plate assessments used in the current study helped to guide the functional progressions necessary to advance movement patterns safely in preparation for return to sport. Throughout any rehabilitation process, left to right musculoskeletal asymmetries and functional capacities are used to evaluate exercise progressions. The current case reveals that monitoring the neurophysiological levels and brain electrophysiology activity in tandem with musculoskeletal function may be beneficial in maximizing returnto-play decisions post-injury or surgery.21,22
CONCLUSION
The objective of this paper was to demonstrate alterations in cortical brain activity after suffering an ACL injury and undergoing ACLR with the goal of returning to competition. The lack of cortical wave continuity, hemispheric asymmetries, and hemispheric decoupling throughout the phases of rehabilitation seem to support the need to monitor neurophysiological adaptations during rehabilitation to assure neural continuity between the peripheral and central nervous system.
The athlete advanced through the clinical pathway based on the traditional somatic metrics. While this case report demonstrates the novel use of qEEG to monitor brain neurophysiological somatic “readiness” for return to play/activity, more research is needed in order to support a causal relationship between these physical and neurological variables. Future studies with a larger cohort will be necessary to validate these conclusions. However, based on the data
Time 24 hours (initial) 1 month 6 months 9 months Knee Passive ROM Left: 5/0/145 Left: 5/0/145 Left: 4/0/145 Left: 5/0/145 Right: 0/3/75 Right: 0/1/110 Right: 4/0/140 Right: 5/0/140 L/R ROM % Difference 48 24 3 5 Knee Swelling Circumference Deficit (cm) Superior Patella: 0.5 Superior Patella: 0.3 Superior Patella: 0.0 Superior Patella: 0.0 Difference (cm) Mid/Inferior Patella: 3.6/1.5 Mid/Inferior Patella: 2.2/0.7 Mid/Inferior Patella: 0.2/0.1 Mid/Inferior Patella: 0.1/0.0 ACL-RSI -- 20% 85% 96.6%
ROM
Knee Joint Swelling -Circumference:
ACL-RSI: Anterior
to sport after ACL injury
Table 5. Knee Range of Motion, and bilateral Symmetry Assessments for Swelling
Circumference
Knee Passive Rom: Goniometry range of motion in degrees L/R
% Difference: Percentile difference in range of motion left to right limb compared
capsular swelling of the left to right limb compared
Cruciate Ligament Return to Sport After Injury scale – designed to measure an athlete’s psychological readiness to return
Time 3 months 9 Month Isometric 60o/s Knee Extension Knee Flexion 96% 29% -Isokinetic 180 o/s Knee Extension Knee Flexion -- 88% 95% *Biodex Isokinetic Tests Measured in Degrees Per Second Peak Torque LSI%
Table 6. Biodex Limb Symmetry Index for Isometric and Isokinetic Percentile Peak Torque of Uninvolved to Involved Limp
The Longitudinal Neurophysiological Adaptation of a Division I Female Lacrosse Player Following Anterior Cruciate Rupture. International Journal of Sports Physical Therapy
from this initial case study qEEG appears to have the potential to aid rehabilitation progressions by offering clinicians a collective insight into the neurological and physiological functional capacity of an ACLR patient.
Submitted: January 07, 2023 CDT, Accepted: March 09, 2023 CDT
This is an open-access article distributed under the terms of the Creative Commons Attribution 4.0 International License (CCBY-NC-4.0). View this license’s legal deed at https://creativecommons.org/licenses/by-nc/4.0 and legal code at https://creativecommons.org/licenses/by-nc/4.0/legalcode for more information.
The Longitudinal Neurophysiological Adaptation of a Division I Female Lacrosse Player Following Anterior Cruciate Rupture. International Journal of Sports Physical Therapy
REFERENCES
1. Machan T, Krupps K. The Neuroplastic Adaptation Trident Model: a suggested novel framework for ACL rehabilitation. Int J Sports Phys Ther. 2021;16(3):896-910. doi:10.26603/001c.23679
2. Hewett TE, Myer GD, Ford KR, et al. Biomechanical measures of neuromuscular control and valgus loading of the knee predict anterior cruciate ligament injury risk in female athletes: a prospective study Am J Sports Med. 2005;33(4):492-501. doi:10.1177/036354 6504269591
3. Grooms DR, Page SJ, Onate JA. Brain activation for knee movement measured days before second anterior cruciate ligament injury: neuroimaging in musculoskeletal medicine. J Ath Tr 2015;50(10):1005-1010. doi:10.4085/1062-6050-50.1
0.02
4. Simon JE, Millikan N, Yom J, Grooms DR. Neurocognitive challenged hops reduced functional performance relative to traditional hop testing. Phys Ther Sport 2020;41:97-102. doi:10.1016/j.ptsp.2019.1
2.002
5. Diekfuss JA, Grooms DR, Bonnette S, et al. Realtime biofeedback integrated into neuromuscular training reduces high-risk knee biomechanics and increases functional brain connectivity: a preliminary longitudinal investigation. Psychophysiology 2020;57(5):e13545. doi:10.1111/psyp.13545
6. Thiebaut de Schotten M, Forkel SJ. The emergent properties of the connected brain. Science 2022;378(6619):505-510. doi:10.1126/science.abq259
7 Kanda PAM, Anghinah R, Smidth MT, Silva JM. The clinical use of quantitative EEG in cognitive disorders. Dement Neuropsychol. 2009;3(3):195-203. d oi:10.1590/s1980-57642009dn30300004
8. Varghese JP, Merino DM, Beyer KB, McIlroy WE. Cortical control of anticipatory postural adjustments prior to stepping. Neuroscience 2016;313:99-109. do i:10.1016/j.neuroscience.2015.11.032
9. Needle AR, Lepley AS, Grooms DR. Central nervous system adaptation after ligamentous injury: a summary of theories, evidence, and clinical interpretation. Sports Med. 2017;47(7):1271-1288. do i:10.1007/s40279-016-0666-y
10. Bruns A, Eckhorn R. Task-related coupling from high- to low-frequency signals among visual cortical areas in human subdural recordings. Int J Psychophysiol 2004;51(2):97-116. doi:10.1016/j.ijpsyc ho.2003.07.001
11. Mangine RE, Noyes FR. Rehabilitation of the allograft reconstruction. J Orthop Sports Phys Ther 1992;15(6):294-302. doi:10.2519/jospt.1992.15.6.294
12. Myer GD, Paterno MV, Ford KR, Quatman CE, Hewett TE. Rehabilitation after anterior cruciate ligament reconstruction: criteria-based progression through the return-to-sport phase. J Orthop Sports Phys Ther 2006;36(6):385-402. doi:10.2519/jospt.200 6.2222
13. Mikicin M, Szczypinska M, Skwarek K. Neurofeedback needs support! effects of neurofeedback-EEG training in terms of the level of attention and arousal control in sports shooters. Balt J Health Phys Act 2018;10(3):72-79. doi:10.29359/bjh pa.10.3.08
14. Kamzanova AT, Kustubayeva AM, Matthews G. Use of EEG workload indices for diagnostic monitoring of vigilance decrement. Hum Factors 2014;56(6):1136-1149. doi:10.1177/001872081452661 7
15. Hoareau V, Godin C, Dutheil F, Trousselard M. The effect of stress management programs on physiological and psychological components of stress: the influence of baseline physiological state. Appl Psychophysiol Biofeedback. 2021;46(3):243-250. d oi:10.1007/s10484-021-09508-0
16. Lee C, Landre N, Sweet JJ. Performance validity on the Stroop Color and Word Test in a mixed forensic and patient sample. Clin Neuropsychol. 2019;33(8):1403-1419. doi:10.1080/13854046.2019.15 94385
17. Erdodi LA, Sagar S, Seke K, Zuccato BG, Schwartz ES, Roth RM. The Stroop test as a measure of performance validity in adults clinically referred for neuropsychological assessment. Psychol Assess. 2018;30(6):755-766. doi:10.1037/pas0000525
18. Clark JF, Ellis JK, Burns TM, Childress JM, Divine JG. Analysis of central and peripheral vision reaction times in patients with post-concussion visual dysfunction. Clin J Sport Med. 2017;27(5):457-461. do i:10.1097/jsm.0000000000000381
1
The Longitudinal Neurophysiological Adaptation of a Division I Female
Player Following Anterior
International Journal of Sports Physical Therapy
Lacrosse
Cruciate Rupture.
19. Bakal DR, Morgan JJ, Lyons SM, Chan SK, Kraus EA, Shea KG. Analysis of limb kinetic asymmetry during a drop vertical jump in adolescents post anterior cruciate ligament reconstruction. Clin Biomech (Bristol, Avon) 2022;100:105794. doi:10.101 6/j.clinbiomech.2022.105794
20. Mantashloo Z, Letafatkar A, Moradi M. Vertical ground reaction force and knee muscle activation asymmetries in patients with ACL reconstruction compared to healthy individuals. Knee Surg Sports Traumatol Arthrosc 2020;28(6):2009-2014. doi:10.100 7/s00167-019-05743-5
21. Sherman DA, Baumeister J, Stock MS, Murray AM, Bazett-Jones DM, Norte GE. Inhibition of motor planning and response selection following ACL reconstruction. Med Sci in Sports Exerc. 2022;55(3):440-449. doi:10.1249/mss.0000000000003 072
22. Giesche F, Engeroff T, Wilke J, Niederer D, Vogt L, Banzer W. Neurophysiological correlates of motor planning and movement initiation in ACLreconstructed individuals: a case–control study. BMJ Open 2018;8(9):e023048. doi:10.1136/bmjopen-201 8-023048
The Longitudinal Neurophysiological Adaptation of a Division I Female
International Journal of Sports Physical Therapy
Lacrosse Player Following Anterior Cruciate Rupture.
SUPPLEMENTARY MATERIALS
Appendix A
Download: https://ijspt.scholasticahq.com/article/73179-the-longitudinal-neurophysiological-adaptation-of-adivision-i-female-lacrosse-player-following-anterior-cruciate-rupture-and-repair-a-case-report/attachment/ 152346.docx?auth_token=YQlSx3RNrbb6pCtfZudp
The Longitudinal Neurophysiological Adaptation of a Division I Female Lacrosse Player Following Anterior Cruciate
International Journal of Sports Physical Therapy
Rupture.
Clinical Commentary/Current Concept Review
Criteria-Based Rehabilitation Following Revision Hip Arthroscopy: A Clinical Commentary
Haley Leo, PT, DPTa , Trevor Shelton, MD, MS, Helen Bradley, PT, MSc, SCS, CSCS
Keywords: criteria-based, rehabilitation, revision hip arthroscopy, physical therapy
https://doi.org/10.26603/001c.71355
International Journal of Sports Physical Therapy
Hip revision arthroscopy is becoming an increasingly popular surgery for those with unsatisfactory outcomes following primary hip arthroscopy With the relatively uncommon but potentially increased difficulty of rehabilitation from this surgery, a lack of established research regarding rehabilitative programs remains. Therefore, the purpose of this clinical commentary is to propose a criterion-based progression that considers the intricacies present following a hip revision arthroscopy from early rehabilitation through return to sport. Criteria are presented clearly to promote objective progression through rehabilitation as opposed to relying on time since surgery as revision surgeries do not always follow traditional tissue healing time-frames. This criterion based progression promotes range of motion (ROM), strength, gait, neuromuscular control, load introduction and gradual return to play
Level of Evidence
5
INTRODUCTION
The number of revision hip arthroscopic surgeries is increasing substantially, due in part to the increasing number of initial arthroscopic labral repairs.1 In the last five years, there has been a significant increase in the overall number of arthroscopic hip surgeries, and the number continues to rise.2 As such, revision surgeries are becoming more frequent, with research indicating between 4-10% of initial cases will need a revision surgery.
1–3 The mean time between primary labral and revision labral surgery is approximately two years.4,5 The most common indications for revision surgeries are residual bony impingement,4–9 labral tears,4–6,8,9 chondral lesions,5–7 micro-instability,5,9,10 and excessive scarring.
4,5,8,9 Preoperative imaging studies show that nearly 80% of those seeking revision hip arthroscopy (RHA) surgery have signs of remaining bony impingement.4–9 Micro-instability can occur as a result of femoroacetabular impingement (FAI), soft-tissue deficiencies, such as labral insufficiency following debridement, capsular resection, or over-resection of bony impingement.9–12 Micro-instability may be a pain generator due to excessive physiologic motion and can put the capsule and labrum at risk for further injury.10–12
Studies investigating the outcomes of physical therapy following hip arthroscopy for labral pathology are limited.13 Thorborg and colleagues reviewed outcomes at one year post-operatively and found clinically relevant and statistically significant changes in function following post-operative rehabilitation for FAI and labral pathology However, the patient related outcomes still fell behind those of healthy individuals.14 One review found that less than 30% of surgeons performing hip arthroscopy had an associated rehabilitation protocol given to patients.15 Of these protocols, use of bracing, weight bearing status, range of motion (ROM) precautions and limitations, and return to activity timelines varied significantly 15 When no residual bony impingement is present the variations found in both surgical and rehabilitative approach and treatment may be contributing to suboptimal outcomes following primary hip arthroscopy.
The utilization of criteria-based protocols to aid progression of rehabilitation is growing in popularity in other areas of orthopedics. In the anterior cruciate ligament (ACL) population, utilization of a criteria-based progression has been shown to reduce risk of reinjury fourfold.16,17 Following a shoulder stabilization procedure, significant numbers of participants did not pass criteria testing at the expected time of “recovery” 18,19 The use of
Corresponding Author: Haley Leo Howard Head Sports Medicine, 320 Beard Creek Rd, Edwards, CO 81632 haleyleo26@gmail.com 973-738-7993
a
Leo H, Shelton T, Bradley H. Criteria-Based Rehabilitation Following Revision Hip Arthroscopy: A Clinical Commentary. IJSPT. Published online April 1, 2023:477-492. doi:10.26603/001c.71355
criteria-based progression versus time-based progression throughout rehabilitation should help to minimize the discrepancy in readiness for return to activity due to regular assessment of patient progress. These progressions can ensure patients move through each phase of rehabilitation and meet specific goals related to motion, neuromuscular control, and strength. The unique difficulties following RHA surgeries can differ from the traditional rehabilitation process and challenge the rehabilitation professional.
Previous clinical commentaries have outlined rehabilitative guidelines for those following primary labral reconstruction or repair, and although these studies present an excellent and thorough framework, they do not consider the additional factors that impact revision labral surgeries.20 This clinical commentary attempts to highlight the differences and present guidelines that are both criterion-driven and time-based to ensure consideration for the individual as well as the complexity of the surgical procedure. Therefore, the purpose of this clinical commentary is to propose a criterion-based progression that considers the intricacies present following a hip revision arthroscopy from early rehabilitation through return to sport.
FEMOROACETABULAR IMPINGEMENT
The primary anatomical considerations that contribute to labral pathology are attributable to femoroacetabular impingement (FAI).21,22 FAI is caused by the abnormal morphological anatomy that changes joint contact between the head/neck of the femur and the margin of the acetabulum.22 As such, the presence of FAI may be correlated with chondral and labral damage in patients with hip pain.21 There are three main types of FAI: cam impingement, pincer lesions, or combined impingement.22 Cam lesions consist of a non-spherical femoral head which can lead to impingement during flexion. This impingement in flexion may cause labral tearing or avulsion from the acetabular rim and potentially damage to the acetabular cartilage.22 Pincer impingement is typically due to acetabular overcoverage, sometimes in conjunction with coxa profunda or acetabular retroversion. This type of lesion typically presents with degeneration of the acetabular labrum and potential ossification of labral tissue as well as chondral damage on the femoral head/neck.22 A combined impingement is consistent with both a cam and pincer pathology which can lead to damage of the acetabular labrum and chondral damage on the acetabulum and/or the femoral head/neck.22 These bony abnormalities can cause and often coincide with capsule, ligament, and muscular dysfunction which often results in abnormal stress and forces through the hip joint.23 Some examples of concomitant pathologies associated with FAI are anterior inferior iliac spine (AIIS) impingement, Iliopsoas impingement, athletic pubalgia, and tearing of the ligamentum teres.23,24 Primary hip arthroscopy is utilized to address these potential bony abnormalities, larbral and/ or chondral damage, and associated soft tissue pathology as needed.
REVISION SURGICAL TECHNIQUE
RHA surgeries of the labrum are focused on restoring the suction-seal mechanism and restoring the biomechanics of the hip joint.25,26 This added stability helps decrease the compression forces during hip motion and protects the articular cartilage.27,28 In most revision cases, there are adhesions between the labrum and the capsule that need to be addressed at the time of surgery.29 Whether to repair, augment, or reconstruct the labrum during a RHA depends on the quality of the labral tissue.
If there are minimal adhesions present and the labral quality is good, then any retear or new tear of the labrum can be addressed as in a primary setting. However, in cases of a deficient labrum where a repair is not possible (i.e., hypotrophic labrum, irreparable segmental defect, ossified labrum) then a labral augmentation or labral reconstruction is needed. If circumferential labral fibers are present, then a labral augmentation is preferred to reconstruction as this preserves the innervation of the labrum and the vascularization, which is important for graft healing.1 In cases where the circumferential labral fibers are not present, a labral reconstruction (either segmental or complete depending on the size of the defect) would be needed.26 These grafts can be made with either autograft or allograft tissue.26
Regardless of the labral surgery performed, any concomitant pathology must also be addressed during the RHA.26 Most commonly, this would include additional osteoplasty for under-resection in femoroacetabular impingement, a remplissage technique for over-resection for femoroacetabular impingement, addressing chondral defects, lysis of adhesions, or repair or reconstruction of a capsular defect.29 The remplissage technique utilizes surrounding soft tissue such as the Iliotibial Band (ITB) or Tensor Fascia Latae (TFL) musculature to fill in areas of overresection, particularly after resection of a cam deformity 30 The abundant blood supply of the capsulolabral recess predisposes that region to adhesions and in cases of patients with significant adhesions, a “ spacer graft” between the labrum and the capsule (similar to an augmentation) may be needed to prevent further adhesions.31
POST-OPERATIVE REHABILITATION
Following RHA surgery, the use of a criteria-based progression to advance through rehabilitation phases is proposed and described herein. The criteria-based progression focuses on specific goals to ensure readiness for more progressive loading and flexibility for the revision hip population. Similar to rehabilitation after primary hip arthroscopy, a five phase rehabilitation program is proposed to include: Protection, Endurance, Strength, Power, and Return to Participation/Sport.32
PHASE I: PROTECTION
The primary goals of Phase I are protection of healing tissues (bracing, ROM precautions, and load management),
Criteria-Based Rehabilitation Following Revision Hip Arthroscopy: A Clinical Commentary International Journal of Sports Physical Therapy
ROM restrictions
Revision Hip Arthroscopy (including but not limited to: Labral Repair, Labral Augmentation, Remplissage, Capsular Plication)
Hip flexion: No sitting in 90 degrees of flexion x 2 weeks; no active hip flexion
Hip Extension - not past neutral x 17 days
Hip ER - not past neutral x 21 days
Hip Abduction - 0-45* x 14 days
Hip Adduction- no restrictions
Hip IR- no restrictions
Brace 17 days
RHA +Microfracture
Hip flexion: No sitting in 90 degrees of flexion x 2 weeks; no active hip flexion
Hip Extension - not past neutral x 17 days
Hip ER - not past neutral x 21 days
Hip Abduction - 0-45* x 14 days
Hip Adduction- no restrictions
Hip IR- no restrictions
17 days
RHA + Gluteus Medius Repair
Hip flexion: No sitting in 90 degrees of flexion x 2 weeks; no active hip flexion
Hip Extension - not past neutral x 17 days
Hip ER - not past neutral x 21 days
Hip Abduction – 10-30* - 45* x 21 days
Hip Adduction- not pass 10-30* abduction x 21 days
Hip IR- no restrictions
17 days
Weightbearing 20lbs x 10-14 days, then wean as appropriate 20lbs x ~ 6 weeks, then wean as appropriate 20lbs x 10-14 days, then wean as appropriate
Positioning No prone lying x 4 weeks to avoid stressing anterior capsule
symptom management (inflammation and pain), maximize range of motion (ROM) within surgical precautions to reduce adhesion formation, initiate muscle activation, and return to general wellness baselines (sleep, energy, mood, and nutrition).
Surgical restrictions following RHA vary significantly between surgeons and procedures. It is important to ensure surgical precautions are followed as per individual protocol. The range of motion expectations at this point are similar to the typical restrictions seen following primary Extension and external rotation (ER) are limited to decrease tension on the healing anterior capsule, labral repair, and to protect the incisions. Active hip flexion is also limited to reduce stress of the hip flexor muscles.33 Weight-bearing during this phase is reduced to protect the repair, and the amount varies with surgeon’s discretion. Compared to a primary labral surgery, the time of restricted weight-bearing may be extended, especially if a micro-fracture is performed. Table 1 portrays some of the frequent surgical restrictions that are seen by the authors. These restrictions are utilized to guide and modify appropriate exercise selection in the early phases of rehabilitation. The restrictions of ROM, positioning, and weight bearing are all incorporated to protect the capsule, reduce stress on the repair, and reduce stress on the joint. Additionally, each of these restrictions and limitations is highly individualized to the patient and particularities of each case and as such, exist on a continuum. Due to the general variability in surgeon preference it is highly encouraged that the progression of range of motion, weight bearing restrictions, and exercise selection is based on post-operative restrictions individualized to each patient.
Symptom management should focus on controlling pain and reducing inflammation. With lengthy revision surg-
No prone lying x 4 weeks to avoid stressing anterior capsule
No prone lying x 4 weeks to avoid stressing anterior capsule
eries, post-operative joint effusion can be a significant issue. This can cause pain and impact muscle activation via arthrogenic and neurogenic inhibition.34 Manual therapy techniques including lymphatic drainage massage can be used to help manage post-operative swelling.35–37 The lymphatic system plays a big role in removing excess interstitial fluid and returning this fluid to the circulatory system. The use of continuous passive motion can help facilitate a pumping action, by creating a sinusoidal oscillation in intra-articular pressure, which will aid in moving blood and edema fluid away from the joint and periarticular tissues.38
Following suture removal, scar mobilization can be beneficial to manage pain and to prevent adhesion formation that may impact ROM and pain in later stages.39 Utilization of passive circumduction is standard for early post-operative care due to its propensity to reduce scar tissue formation. Research has shown there to be a 4.1x increase in scar tissue formation in hips that do not receive circumduction.40 The use of the medication Losartan has become more common following hip procedures to ameliorate cartilage deficits41 and reduce postoperative fibrosis via the blocking of transforming growth factor Beta-1.42 Figure 4 shows an early stage exercise to introduce ROM.
The gluteal muscles are essential in pelvic control during gait and single leg stance. Seventy percent of the abductor force required to maintain pelvic stability in the frontal plane is provided by muscles that insert into the greater trochanter.20 The maximal hip extension ROM achieved during gait is shown to increase the forces on the anterior hip joint.43 Consequently, general decreases in force output from the gluteal muscles during extension and the iliopsoas muscle during flexion causes an increase in anterior hip joint forces.44 A solid foundation of good gluteal maximus,
Table 1.
This table presents common RHA surgical components and frequent restrictions associated with these components.
Criteria-Based Rehabilitation Following Revision Hip Arthroscopy: A Clinical Commentary International Journal of Sports Physical Therapy
medius and minimus muscle activation and control during Phase I is important, before initiating endurance and progressing gait training. Figure 2 is an exercise utilized once weight bearing restrictions are lifted to promote gluteus maximus activation.
There is controversy regarding compensation patterns and movement dysfunction in rehabilitation.45 Do they cause pain and dysfunction or are they normal variations of human movement? Alternative neuromuscular strategies are commonly observed in individuals with mechanical hip pain and patients post hip arthroscopy.23 In particular, weakness of gluteus maximus with overactivation of hamstrings and lumbar extensors, weakness of gluteus medius with overactivation of tensor fascia latae are often observed in this population. Additionally, weakness of the deep hip rotators and anterior core is often seen.46–48 Individuals undergoing revision surgery have spent months if not years experiencing hip pain, which conform with compensatory movement patterns and hip muscle weakness.2 Being aware of these patterns is important both for the clinician and the patient. An easy way to incorporate the patient into discerning these compensatory patterns is by using subjective assessment of work or fatigue during a task. This can help to tie in the patient’s attention to movement while also incorporating awareness into their exercises by use of internal feedback.


Exercises commonly used during this phase are geared toward both protecting the repair and gradually reintroduc-
ing active hip-based movements, within the restrictions of the surgeon. Table 2 highlights exercises utilized throughout the rehabilitation process. The Phase I column in Table 2 presents suggested exercises with the main focus being correct muscle activation during the exercise, starting with active-assisted and moving to active range of motion as the patient is able to re-establish adequate neuromuscular control. Active hip flexion can commence after two weeks due to tissue healing guidelines. Although commonly perceived as overused in hip pathology, the psoas muscle is important in hip flexion and requires adequate strength to perform daily tasks.43 Figure 3 portrays the hip roll exercise which is integrated to promote psoas activation. In this figure, the patient is palpating their hip flexor muscles. Based on anatomical location and insertion, activation of the more laterally based muscles would be considered more rectus femoris bias while activation of flexors located more medial would be considered more psoas. Although isolation of the psoas is unlikely, this exercise is used to promote submaximal activation of both a commonly weak and potentially overused muscle in hip pathology 43
Located in Figure 4 is a flowchart highlighting criteria to progress between the five phases proposed in this commentary The criteria to progress to Phase II requires appropriate muscle activation, pelvic control in single limb stance and adequate ROM of the hip necessary to progress gait and perform functional movement tasks in the endurance phase. The ROM criteria are set to allow for ap-
Figure 1. Quadruped Rock Backs. An exercise used to move from a tabletop position to a child’s pose position and then toward a modified plank. Utilized for AROM of the hip within most surgical precautions
Figure 2. Hip Thrust. Patient is in tall kneeling position at end of table with ankles off of the table for comfort. Patient then sits buttock toward heels, pillow placed for comfort in ROM. Patient then initiates gluteal activation to move into hip extension. A medicine ball can be used for extra dynamic load and core activation.
Criteria-Based Rehabilitation Following Revision Hip Arthroscopy: A Clinical Commentary International Journal of Sports Physical Therapy
Table 2. Exercise Progressions
Exercises Phase I Phase II Phase III Phase IV Phase V
Compound Movements Cat Cow
Shuttle/TRX® Squat Lunges
Quadruped Rock Backs Weight shifting Single Leg Squat
Resisted Single Leg Squat Agility Ladder
Lateral/ Diagonal Agility drills Multiplanar Movements
Standing Terminal Knee Extension with Band Squats Balance squats Step Up with Knee Drive
Standing Abduction Internal Rotation Balance Deadlifts Box Jumps
Dual task balancing Lateral Step down Single Leg Deadlift
Neurocognitive tasks
Hip Extension Quadruped Hip Extension Bird Dogs Single Leg Bridges
Hip Thrusters Bridges
Hip Abduction
Standing Hip Abduction Internal Rotation
Sidelying Deep External Rotator (fig. 5) Hip Hikers
External Rotators Sidelying Glute Holds & Kick Lateral walking
Reverse Clams
Clam to Neutral
Hip Flexor/ Core Side Lying Hip Flexion Assist
Hip Rolls (fig. 3)
Transverse Abdominus Activation
Glider Extension/ Abduction
Side planks (with hip abduction)
Hip Hikers with Rotation
Sport Specific Non-Contact Drills
Standing Marches Full planks
Resisted Hip Rolls (fig. 3)
Heel Drag Plank (from Knees)

This table presents exercise suggestions for the 5 Phases of Rehabilitation suggested in this commentary
Criteria-Based Rehabilitation Following Revision Hip Arthroscopy: A Clinical Commentary International Journal of Sports Physical Therapy
Figure 3. Hip Roll. Patient lays in supine with legs supported on a large ball. Patient then focuses on pulling the ball inward by activating the iliopsoas muscle, anecdotally more medially located. Patient can use hands to palpate muscle activation.
propriate functional motion with walking and transitional movements such as sit to stand.20 The ROM expectations for ER and flexion are less due to typical surgical restrictions placed upon these motions in early rehabilitation.33 Prone hip extension, TA activation, and the gluteus medius side lying hold tests allow for assessment of muscle function that is less aggressive than dynamometer testing, which is inappropriate at this stage of healing.20 These particular tests are chosen to assess for gluteal activation and core stability in early rehabilitation, as they will set the stage for more dynamic strengthening later and their correct performance will determine compensatory patterns that may be present in hamstring, latissimus dorsi, or hip flexor muscle groups.20 Single leg stance testing is utilized to assess the ability of the lateral hip muscles in achieving a neutral pelvis on one limb, necessary for gait.20
PHASE II: ENDURANCE
Phase II, or the endurance phase, focuses on the introduction and improvement of muscular endurance for the ability to perform activities of daily living (ADLs) without pain or dysfunction. These dysfunctions could involve movement deviations and/or compensations. The main goals for this phase are normalizing active ROM (AROM) compared to the non-injured side, building endurance in hip musculature

to allow progression to full weight-bearing with a non-antalgic gait pattern, and reestablishing tolerance to joint and tissue loading in preparation for future strength exercise progressions in Phase III. Exercises should be provided in an endurance set-rep scheme with three sets of 15-20 repetitions, performed two to three times per week.49 Continuing to focus on neuromuscular re-education is paramount for the hip revision population in order to deconstruct presurgical compensation patterns and promote ideal muscle firing pattern for the hip complex that were established in Phase I. Initiating cardiovascular and work capacity training is also important in this phase.
Following RHA, the flexion, abduction, external rotation (FABER) position can be utilized to slowly integrate functional ER ROM and to reintroduce a previously irritating position. The FABER test is utilized to assess soft tissue restrictions in the anterior hip. Tissue tone or guarding of the psoas can be seen in ER or FABER positioning and may be symptomatic for some patients. Use of gentle contractrelax from proprioceptive neuromuscular facilitation (PNF) concepts can integrate reciprocal inhibition to reduce psoas or TFL guarding. Gentle joint mobilizations are another technique to help neuro-modulate the hip joint following revision surgery 50 Ensuring a restriction is capsular as opposed to bony should be established before utilizing higher grade mobilizations in this population.51 Assessing inter-
Figure 4. Criteria-Based Flow Chart
Criteria-Based Rehabilitation Following Revision Hip Arthroscopy: A Clinical Commentary International Journal of Sports Physical Therapy
nal and external rotation ROM both in positions of capsular tightness and muscle tension (hip extension versus hip flexion) should help to determine discrepancies in motion that would bias capsular restriction versus ROM restriction. Manual therapy techniques can be utilized in the neuromuscular re-education process to address muscle hypertonicity, pain, and dysfunction. Pain and tone in the adductors, psoas and TFL can be present and may affect progress in this phase of post-operative rehabilitation if overlooked.
Normalizing gait to ensure functional ambulation for the patient to return to typical ADLs is essential during this phase. When progressing weight-bearing, respecting surgical precautions and gradually reintroducing weight to the joint is paramount. The use of scales is common to incrementally introduce a percent of body weight while using crutches to desensitize the joint to external forces. Slow progression from two crutches to one crutch over multiple weeks may be necessary to avoid rebound inflammation, pain, and gait dysfunction. The use of pool walking, aquatic treadmills, Alter-G treadmills, and the TRXⓇ can be used to systematically increase load on the joint. This, in particular with hip revision cases, is important to allow the joint adequate and individualized time to adjust to body weight. Patience during this phase can be the difference between appropriately training the hip complex muscles to accept load during functional activities and perpetuating long-standing compensatory patterns. It is paramount that criteria-based progression be used in gait training versus time-based progression due to the variability in crutch weaning time.
During this stage, integration of neurocognitive challenges to single leg balance, lateral and posterior hip strengthening progression, and deep rotator strengthening is valuable. Refer to Table 2 for the exercises included in this phase. Resistance should be added to open kinetic chain exercises and once adequate lower extremity strength and proximal stability has been restored the addition of closed kinetic chain exercises should be introduced. This will prepare the hip joint to accept heavier loads in the later phases. Additionally, monitoring the degree and location of fatigue as well as undesirable signs and symptoms of overuse during a task can help to prevent delays in recovery and symptom exacerbation.
A key point of Phase II is returning to performing ADLs. Educating patients on how to best micro-dose their ADLs to promote function and minimize micro-inflammation during this phase is crucial for hip revision patients, who often cannot tolerate even minimal activity. This particular point can be guided by subjective symptoms or fatigue. Significant education regarding spacing activities over the course of a day or over multiple days rather than performing the entirety of a task is encouraged. The goal is to minimize micro-inflammation which can cause arthrogenic inhibition, while progressing capacity for load tolerance. Gaining independence with ADLs and gait can be a big accomplishment for RHA patients and achieving this milestone should be acknowledged. However, further advancement and new goals should be made. It is important they continue to progress with strengthening in order to create healthy habits and
increase their chances of preserving their hip function.49 An in vivo study by Bergmann et. al,52 showed that the average person loaded their hip joint at 238% body weight while walking at 4km/h, 251% with climbing stairs, and 260% with descending stairs. Giarmatzis et. al,53 and Luepongsak et. al,54 have shown that changes in gait speed and running can increase hip joint forces. Achieving superior strength is important in dissipating these forces and maximizing long term outcomes following RHA surgeries and will be addressed in the next phase.
Refer to Figure 4 for the criteria for progression from this phase. These tests aim to ensure adequate muscular strength in the gluteal complex and hip flexor muscles. All isometric testing is done utilizing hand held dynamometry (preferred) or by achieving a 4 strength grade using manual muscle testing in standard positions. The lateral trunk endurance test is a reliable and valid measure to assess core stability, pictured in Figure 5.55 The anterior reach of the Y-Balance test has been shown to have predictive validity for injury occurrence across adults and athletes alike, particularly if side-to-side discrepancy is >4cm. However, these studies are not specific to the hip population.56,57 In the authors’ opinion, at this stage of rehabilitation a < 8cm difference is utilized as an achievable measurement to begin assessing symmetry in dynamic balance, and this will be progressed upon in the next phase. All of these components set the stage for strengthening, by establishing an adequate muscular base of strength, endurance, and neuromuscular control.
PHASE III: STRENGTHENING
The strength phase, or Phase III, focuses on increasing load and building strength in the muscles of the lower extremity and core. At this stage of rehabilitation, exercise prescription should be changed according to strength parameters. Exercises should be performed in 3-6 sets of 3-5 repetitions at a higher load, 60-80% of one rep maximum for novice to experienced individuals respectively 49
Table 3 ranks exercises based on percentage of maximum voluntary isometric contraction (%MVIC) for gluteus maximus and gluteus medius strengthening, and it is recommended they are included in this phase of rehabilitation. Neuromuscular activation of 40-60% MVIC is recommended as a minimum for a strengthening effect59 while around 70% MVIC is thought to elicit an optimal strengthening effect and achieve desired adaptations in muscle morphology, such as hypertrophy 58 However, the use 1RM can be difficult and potentially unsafe to achieve and assess in the rehabilitative setting. In a recent meta-analysis by Lea et.al, rate of perceived exertion (RPE) has been shown to be a valid measure of exercise intensity and exertion.60 As such, utilizing RPE can be monitored to ensure sufficient load is being applied. Considering this information, a 60-80% intensity of 1RM can be estimated at about 6-8/10 or 14-17/20 using an RPE scale.60 Introduction of rate of force development (RFD) during these exercises in the later stages of Phase III can help build confidence with moving faster and without fear Utilizing speed in exercise tasks can promote this RFD bias. RFD correlates to maximum vol-
Criteria-Based Rehabilitation Following Revision Hip Arthroscopy: A Clinical Commentary International Journal of Sports Physical Therapy
promote bilateral hip abductor activation and increased challenge to core stability.
Exercises listed with their respective MVIC for both gluteus medius and maximus
Abbreviation: MVIC - maximum voluntary isometric contraction
* indicates MVIC >70% in both GMED and GMAX, according to Boren et al.58
untary contraction in the early phase of a contraction, requires increased discharge at the motor unit, and can be developed by heavy resistance training.49 By improving the RFD in this phase, it helps to set the stage for power training in phase IV.
The criteria for progression to Phase IV are referenced in Figure 4. Achieving adequate strength of the muscles of the
hip complex, compared to the non-injured limb (limb symmetry index), to assess muscular function is important to prepare for the power phase. Maximized strengthening of both internal and external rotator muscle groups is important in the homeostasis of the hip, with particular research supporting the deep external rotators, although a specific ratio has not been confirmed. Tateuchi et al.61 showed in-
 Figure 5. Lateral Trunk Endurance Test. The patient starts in a side-lying position and begins by pushing up onto the elbow and, ideally, the foot until the body is elevated off of the table. This is also the same positioning for the side plank with hip abduction (a therapeutic exercise). As this exercise becomes less difficult, the top leg can be elevated as well to
Exercise Gluteus Medius - MVIC% Boren Distefano Ekstrom Quadruped hip ext (moving limb) 22.03 42 + 17 Clamshell (45° hip flexion) 47.23 40 + 38 (30° hip flex) 38 + 29 (60° hip flex) Single leg deadlift 56.08 58 + 25 Side-lying hip abduction 62.91 81 + 42 39 + 17 Reverse clamshell (hip ext to 0° + hip abd to neutral) 76.88 *Single leg squat 82.26 64 + 24 *Side plank (ipsilateral) 103.11 74 + 30 Exercise Gluteus Maximus - MVIC% Boren Distefano Ekstrom Standing gluteal squeeze 80.72 Clamshell (45° hip flexion) 53.10 34 + 27 (30° hip flex) 39 + 34 (60° hip flex) Single leg bridge (stable limb) 54.24 40 + 20 Single leg deadlift 58.84 59 + 28 Side-lying hip abduction 51.13 39 + 18 21 + 16 *Front plank with hip ext 106.22 9 + 7 no hip ext *Single leg squat 70.74 59 + 27
Table 3. MVIC of Gluteus Medius and Gluteus Maximus During Common Therapeutic Exercises
Criteria-Based Rehabilitation Following Revision Hip Arthroscopy: A Clinical Commentary International Journal of Sports Physical Therapy
creased anterior hip joint forces in the deep squat when weakness in the deep external rotators was present. Meinders and colleagues showed that maximal activation of the deep external rotators resulted in decreased hip contact force angles and reduced acetabular loading.62 Examples of exercises for these muscle groups are seen in Figures 6 and 7.
The side plank with hip abduction (Figure 5) is shown to have the highest studied gluteus medius recruitment (103% MVIC).58 As such, utilization of the side plank with hip abduction test allows good understanding of the patient’s ability to recruit the gluteus medius which has direct im-


pact on ambulation and more advanced activities such as running and jumping. Upon completion, this phase should allow for significant functional improvements and a return to low intensity exercise and functional tasks without pain or dysfunction.63
PHASE IV: POWER
Phase IV, or the power phase, is the last required phase before fully allowing patients to return to light impactbased activity. Continuing into this phase is highly dependent on three factors: (1) number of hip surgeries &
Figure 6. Sidelying Deep External Rotator. The figure depicts a strengthening exercise utilized to target the deep external rotators of the hip. The starting positon has the target leg on the bottom with leg in line with trunk. Squeeze the deep buttock region to initiate the movement of the target foot off of the table in a rotary motion generated at the hip. Cue patient to keep the bottom knee in contact with the table for entire exercise to reduce adductor muscle bias.
Figure 7. Hip Hiker with Rotation. Subject stands near a wall with a large ball placed between hip and wall, maintaining constant pressure. Hinge trunk forward about 45 degrees and extend leg in line with trunk. Patient then rotates pelvis off of the stance leg (working leg) trying to keep trunk, pelvis, and opposite leg in line and moving as one unit.
Criteria-Based Rehabilitation Following Revision Hip Arthroscopy: A Clinical Commentary International Journal of Sports Physical Therapy
revisions, (2) patient expectations, and (3) surgeon expectations. These three factors will help to determine the necessity to progress to a power-based phase and to plan for appropriate expectations following RHA surgery. Should all three of these factors align and Phase III criteria have been met, it is anticipated the individual will have established good neuromuscular control, adequate strength, and the ability for the hip joint and surrounding tissue to accept load without exacerbation of hip pain.
In the author’s experience, in cases of multiple revision surgeries the history of muscular inhibition and compensatory patterns, aberrant joint loading, and the psychosocial factors increase the difficulty in returning to high level activities, and as such expectations should be modified. Presence of joint line space <2mm has been shown to have poor longevity after RHA and a higher probability of total hip arthroplasty/replacement in the future.64,65 Discussion with the medical team regarding joint space narrowing and history of microfracture may be a valuable tool in deciding whether return to higher intensity activities is advisable.64,65 Additionally, psychological readiness scales can be utilized to assess patient’s expectation and to help clinicians in making appropriate and informed decision regarding to sport and participation in later stages of rehabilitation.66 Similar to the earlier phases, the exercise prescription in this phase should also change in conjunction with normal power guidelines.49 Exercises are performed under light to moderate loads, with a prescription of 3 sets of 3-6 repetitions and an emphasis on rate of force development. Power exercises should be scheduled 2-3 times per week and within a session, performed before strength exercises.49
Power exercises apply the maximum amount of force as fast as possible on the basis that force times velocity equals power 49 This training can take many shapes, but during rehabilitation it is important to start slowly and gradually increase speed and load. Plyometric exercises are often a good starting point and can be easily modified to accommodate patient anxiety Plyometric progression should start with double leg exercises that minimize impact such as use of a shuttle press or TRXⓇ system which can promote a lengthened amortization phase initially and gradually challenge speed as patient comfort and mechanics improve. As tolerance improves, challenging overall load by increasing external resistance and then progressing to jump-down landings can be utilized for improving power. Sagittal plane jumping movements are progressed to frontal and multiplanar movements. Once adequate tolerance to double leg jumping is established without concern, progression to single leg loading such as single leg bounding or hopping can be incorporated. It is necessary to have established good control in jumping at or above full body weight prior to progressing to bounding or hopping. Continued strengthening is important in this phase, and increasing load as tolerated can be an efficient way to increase power.49
Figure 1 shows the progression criteria for the Power Phase. Unique to this progression are components of the Vail Hip Sports Test (VHST) which utilizes testing components that attempt to load the hip in typical impingement
angles to assess overall tissue load tolerance and movement patterns.67,68 The four test components include: single knee bend, lateral agility test, diagonal agility test and forward lunge onto box test.67 Additionally, performance on the VHST has been shown to be correlated with hip extension and external rotation strength.68 Triple hop and vertical hop tests have both been shown to be reliable tests following ACL reconstruction and can be adapted for other lower extremity conditions.69 Hop tests are convenient and reproducible in most clinical settings for discerning power differences between lower extremities.69
RETURN TO SPORT
Progression to this phase is individual and highly variable in this patient population. This decision is based on prior history, complexity of surgical procedure, recommendation of surgeon and team, and personal goals of the patient. If performed strategically, this phase can be very attainable despite revision status. In the case of clearance from the full medical team, the suggestion is to ensure greater than or equal to 90% limb symmetry index (LSI) in strength testing and power testing, as outlined in the previous Phases. The agility T-test is added due to its validity and reliable in assessing lower extremity speed, leg power, and agility 70 The agility T-test, strength LSI, power LSI, quality of motion during these tests along with clinical decision making by the health care team will help ensure safe return to sport following hip labral revision surgery Communication with the patient, coaching staff, medical staff, and strength coaches should be utilized to establish a smooth transition of both load and sport specific training. Ideally, slow integration of sport-specific exercises should be introduced into late stage rehabilitation and increasing difficulty implemented as mastery is achieved. A general guideline should start with sport-specific tasks in isolation, non-contact drills, contact drills, scrimmage or practice situations, and eventually a return to unrestricted competition. Full description of the return to sport phase is beyond the focus of this commentary.
PSYCHOLOGICAL CONSIDERATIONS
Dick, et al. and Chang et al. show a strong correlation between mental health and hip pathology 71,72 Evidence suggests that history or presence of mental health issues negatively impacts outcomes following FAI surgery 71,72 Presence or history of mental illness may have contributed to previous failed hip labral procedures, and although it cannot be assumed as a reason for failure, it may be a contributing factor in the rehabilitation process. Additionally, Dick et al., and Cheng et al. show that consideration for the presence of mental health issues following hip labral repair may prepare the clinician for the potential presence of persistent pain in both early and late rehabilitation postoperatively 71,73 Browning and colleagues showed that patients with pain catastrophizing and kinesiophobia following arthroscopic hip surgery had poor RTS outcomes at one year.74 The use of psychological readiness scales throughout rehab may help to assess areas of fear avoidance or anx-
Criteria-Based Rehabilitation Following Revision Hip Arthroscopy: A Clinical Commentary International Journal of Sports Physical Therapy
iety regarding RHA rehabilitation and return to prior levels of function. Recently, the Hip-RSI, a modified version of the ACL-RSI, has been proven to be both valid and reliable in assessing psychological readiness following hip arthroscopy 66 The Short Form-36 and Tampa Scale of Kinesiophobia66,75,76 are additional options to evaluate fear of motion, although not specific to post-operative hip surgery 77 In addition to the use of validated outcome measures, the incorporation of pain neuroscience education may be helpful in addressing and assuaging fears and habits that may negatively impact rehabilitation.
Another component of rehabilitation for the RHA patient is the importance of self-efficacy.73 Albert Bandura defined self-efficacy as the perception of one’s ability to succeed in a specific situation. Jochimsen et al.73 found that poor self-efficacy has been shown to correlate with higher pain levels. There is evidence that also suggests that high self-efficacy can improve adherence to a program, improve physical function, and decrease pain.73,78 Thus, as healthcare workers utilizing discussion of vicarious experiences, persuasion, and even positive reinforcement to maximize a patient’s perception of efficacy during their rehabilitation may be important. The referral to a psychologist can be an invaluable tool to address any psychological concerns present throughout rehabilitation.
CONCLUSION
When considering the typical difficulties that those who undergo RHA experience, the proposed criteria-based progression allows for patient individualization throughout
the course of therapy With a history of multiple hip labral surgeries, the timeline for recovery may lengthen and vary based on the complications that may be present. By removing the time-based criteria traditionally seen post-operatively, and utilizing a criteria-based progression, we can assist patients to be better equipped to achieve the motion, strength, stability, power, and function for returning to their maximum potential. The criteria proposed in this commentary is a working guideline to encourage the clinician to perform regular assessment of motion, endurance, strength, and power as tissue healing occurs and progress based upon suggested criterion.
ACKNOWLEDGEMENTS
The assistance of Kristyn Petracek, Jenna Hodge, Meghan Gallegos, Brett Mueller, and Devyn Kammert for their contribution to this project is gratefully acknowledged.
FUNDING
This research did not receive any specific grant from funding agencies in the public, commercial, or not-for-profit sectors. The authors report no conflicts of interest.
Submitted: August 29, 2022 CDT, Accepted: January 15, 2023
CDT
This is an open-access article distributed under the terms of the Creative Commons Attribution 4.0 International License (CCBY-NC-4.0). View this license’s legal deed at https://creativecommons.org/licenses/by-nc/4.0 and legal code at https://creativecommons.org/licenses/by-nc/4.0/legalcode for more information.
Criteria-Based Rehabilitation Following Revision Hip Arthroscopy: A Clinical Commentary International Journal of Sports Physical Therapy
REFERENCES
1. Locks R, Bolia I, Utsunomiya H, Briggs K, Philippon MJ. Current concepts in revision hip arthroscopy Hip Int J Clin Exp Res Hip Pathol Ther. 2018;28(4):343-351. doi:10.1177/1120700018771927
2. Bonazza NA, Homcha B, Liu G, Leslie DL, Dhawan A. Surgical Trends in Arthroscopic Hip Surgery Using a Large National Database. Arthrosc J Arthrosc Relat Surg 2018;34(6):1825-1830. doi:10.1016/j.arthro.201
8.01.022
3. West CR, Bedard NA, Duchman KR, Westermann RW, Callaghan JJ. Rates and Risk Factors for Revision Hip Arthroscopy. Iowa Orthop J. 2019;39(1):95-99.
4. Heyworth BE, Shindle MK, Voos JE, Rudzki JR, Kelly BT Radiologic and Intraoperative Findings in Revision Hip Arthroscopy. Arthrosc J Arthrosc Relat Surg 2007;23(12):1295-1302. doi:10.1016/j.arthro.20
07.09.015
5. Philippon MJ, Schenker ML, Briggs KK, Kuppersmith DA, Maxwell RB, Stubbs AJ. Revision Hip Arthroscopy Am J Sports Med 2007;35(11):1918-1921. doi:10.1177/03635465073050 97
6. Sardana V, Philippon MJ, de SA D, et al. Revision hip arthroscopy indications and outcomes: A systematic review. Arthrosc J Arthrosc Relat Surg. 2015;31(10):2047-2055. doi:10.1016/j.arthro.2015.0
3.039
7. Cvetanovich GL, Harris JD, Erickson BJ, Bach BR, Bush-Joseph CA, Nho SJ. Revision hip arthroscopy: A systematic review of diagnoses, operative findings, and outcomes. Arthrosc J Arthrosc Relat Surg. 2015;31(7):1382-1390. doi:10.1016/j.arthro.2014.12.0 27
8. Gwathmey FW, Jones KS, Thomas Byrd JW. Revision hip arthroscopy: findings and outcomes. J Hip Preserv Surg 2017;4(4):318-323. doi:10.1093/jhp s/hnx014
9. Arakgi ME, Degen RM. Approach to a failed hip arthroscopy Curr Rev Musculoskelet Med 2020;13(3):233-239. doi:10.1007/s12178-020-09629-9
10. Bolia I, Chahla J, Locks R, Briggs K, Philippon MJ. Microinstability of the hip: a previously unrecognized pathology. Muscle Ligaments Tendons J. 2019;06(03):354. doi:10.32098/mltj.03.2016.11
11. Canham CD, Yen YM, Giordano BD Does Femoroacetabular Impingement cause hip instability? A systematic review. Arthrosc J Arthrosc Relat Surg Off Publ Arthrosc Assoc N Am Int Arthrosc Assoc 2016;32(1):203-208. doi:10.1016/j.arthro.201 5.07.021
12. Parvaresh KC, Rasio J, Azua E, Nho SJ. Hip instability in the athlete: Anatomy, etiology, and management. Clin Sports Med. 2021;40(2):289-300. d oi:10.1016/j.csm.2020.11.005
13. Cheatham SW, Enseki KR, Kolber MJ. Postoperative rehabilitation after hip arthroscopy: A search for the evidence. J Sport Rehabil 2015;24(4):413-418. doi:10.1123/jsr.2014-0208a
14. Thorborg K, Kraemer O, Madsen AD, Hölmich P. Patient-reported outcomes within the first year after hip arthroscopy and rehabilitation for femoroacetabular impingement and/or labral injury: The difference between getting better and getting back to normal. Am J Sports Med 2018;46(11):2607-2614. doi:10.1177/03635465187869 71
15. Cvetanovich GL, Lizzio V, Meta F, et al. Variability and comprehensiveness of North American online available physical therapy protocols following hip arthroscopy for femoroacetabular impingement and labral repair. Arthrosc J Arthrosc Relat Surg. 2017;33(11):1998-2005. doi:10.1016/j.arthro.2017.0 6.045
16. Kyritsis P, Bahr R, Landreau P, Miladi R, Witvrouw E. Likelihood of ACL graft rupture: not meeting six clinical discharge criteria before return to sport is associated with a four times greater risk of rupture. Br J Sports Med 2016;50(15):946-951. doi:10.1136/bjs ports-2015-095908
17. Grindem H, Snyder-Mackler L, Moksnes H, Engebretsen L, Risberg MA. Simple decision rules can reduce reinjury risk by 84% after ACL reconstruction: the Delaware-Oslo ACL cohort study. Br J Sports Med. 2016;50(13):804-808. doi:10.1136/bjsports-2016-096 031
18. Drummond Junior M, Popchak A, Wilson K, Kane G, Lin A. Criteria-based return-to-sport testing is associated with lower recurrence rates following arthroscopic Bankart repair. J Shoulder Elbow Surg. 2021;30(7):S14-S20. doi:10.1016/j.jse.2021.03.141
Criteria-Based Rehabilitation Following Revision Hip Arthroscopy: A Clinical Commentary International Journal of Sports Physical Therapy
19. Wilson KW, Popchak A, Li RT, Kane G, Lin A. Return to sport testing at 6 months after arthroscopic shoulder stabilization reveals residual strength and functional deficits. J Shoulder Elbow Surg. 2020;29(7):S107-S114. doi:10.1016/j.jse.2020.04.035
20. Wahoff M, Dischiavi S, Hodge J, Pharez JD Rehabilitation after labral repair and femoroacetabular decompression: criteria-based progression through the return to sport phase. Int J Sports Phys Ther. 2014;9(6):813-826.
21. Kemp JL, Makdissi M, Schache AG, Pritchard MG, Pollard TCB, Crossley KM. Hip chondropathy at arthroscopy: prevalence and relationship to labral pathology, femoroacetabular impingement and patient-reported outcomes. Br J Sports Med 2014;48(14):1102-1107. doi:10.1136/bjsports-2013-09 3312
22. Parvizi J, Leunig M, Ganz R. Femoroacetabular Impingement. J Am Acad Orthop Surg 2007;15(9):561-570. doi:10.5435/00124635-20070900 0-00006
23. Hammoud S, Bedi A, Voos JE, Mauro CS, Kelly BT The recognition and evaluation of patterns of compensatory injury in patients with mechanical hip pain. Sports Health 2014;6(2):108-118. doi:10.1177/1 941738114522201
24. Kraeutler MJ, Garabekyan T, Pascual-Garrido C, Mei-Dan O Ligamentum teres tendinopathy and tears. Muscles Ligaments Tendons J. 2016;6(3):337-342. doi:10.11138/mltj/2016.6.3.337
25. Crawford MJ, Dy CJ, Alexander JW, et al. THE 2007 FRANK STINCHFIELD AWARD: The biomechanics of the hip labrum and the stability of the hip. Clin Orthop 2007;465:16-22. doi:10.1097/bl o.0b013e31815b181f
26. Philippon MJ, Nepple JJ, Campbell KJ, et al. The hip fluid seal—Part I: the effect of an acetabular labral tear, repair, resection, and reconstruction on hip fluid pressurization. Knee Surg Sports Traumatol Arthrosc 2014;22(4):722-729. doi:10.1007/s00167-01
4-2874-z
27 Ferguson SJ, Bryant JT, Ganz R, Ito K. An in vitro investigation of the acetabular labral seal in hip joint mechanics. J Biomech. 2003;36(2):171-178. doi:10.101 6/s0021-9290(02)00365-2
28. Soltz MA, Ateshian GA. Experimental verification and theoretical prediction of cartilage interstitial fluid pressurization at an impermeable contact interface in confined compression. J Biomech 1998;31(10):927-934. doi:10.1016/s0021-9290(98)001
05-5
29. Newman JT, Briggs KK, McNamara SC, Philippon MJ. Revision hip arthroscopy: A matched-cohort study comparing revision to primary arthroscopy patients. Am J Sports Med. 2016;44(10):2499-2504. do i:10.1177/0363546516650888
30. Frank JM, Chahla J, Mitchell JJ, Soares E, Philippon MJ. Remplissage of the femoral head-neck junction in revision hip arthroscopy: A technique to correct excessive cam resection. Arthrosc Tech 2016;5(6):e1209-e1213. doi:10.1016/j.eats.2016.07.01 2
31. Kelly BT, Shapiro GS, Digiovanni CW, Buly RL, Potter HG, Hannafin JoA. Vascularity of the hip labrum: A cadaveric investigation. Arthrosc J Arthrosc Relat Surg 2005;21(1):3-11. doi:10.1016/j.arthro.200 4.09.016
32. Spencer-Gardner L, Eischen JJ, Levy BA, Sierra RJ, Engasser WM, Krych AJ. A comprehensive five-phase rehabilitation programme after hip arthroscopy for femoroacetabular impingement. Knee Surg Sports Traumatol Arthrosc 2014;22(4):848-859. doi:10.1007/ s00167-013-2664-z
33. Grzybowski JS, Malloy P, Stegemann C, BushJoseph C, Harris JD, Nho SJ. Rehabilitation following hip arthroscopy: A systematic review Front Surg 2015;2. doi:10.3389/fsurg.2015.00021
34. Freeman S, Mascia A, McGill S. Arthrogenic neuromusculature inhibition: A foundational investigation of existence in the hip joint. Clin Biomech 2013;28(2):171-177 doi:10.1016/j.clinbiome ch.2012.11.014
35. Vairo GL, Miller SJ, Rier NMCI, Uckley WBI. Systematic review of efficacy for manual lymphatic drainage techniques in sports medicine and rehabilitation: An evidence-based practice approach. J Man Manip Ther 2009;17(3):80E-89E. doi:10.1179/j mt.2009.17.3.80e
36. Keser I, Esmer M. Does manual lymphatic drainage have any effect on pain threshold and tolerance of different body parts? Lymphat Res Biol 2019;17(6):651-654. doi:10.1089/lrb.2019.0005
37 Majewski-Schrage T, Snyder K. The effectiveness of manual lymphatic drainage in patients with orthopedic injuries. J Sport Rehabil. 2016;25(1):91-97. doi:10.1123/jsr.2014-0222
38. O’Driscoll SW, Giori NJ. Continuous passive motion (CPM): theory and principles of clinical application. J Rehabil Res Dev 2000;37(2):179-188.
Criteria-Based Rehabilitation Following Revision Hip Arthroscopy: A Clinical Commentary International Journal of Sports Physical Therapy
39. Donnelly CJ, Wilton J. The effect of massage to scars on active range of motion and skin mobility. Br J Hand Ther 2002;7(1):5-11. doi:10.1177/1758998302
00700101
40. Willimon SC, Briggs KK, Philippon MJ. Intraarticular adhesions following hip arthroscopy: a risk factor analysis. Knee Surg Sports Traumatol Arthrosc 2014;22(4):822-825. doi:10.1007/s00167-013-2728-0
41. Utsunomiya H, Gao X, Deng Z, et al. Improvement of cartilage repair with biologically regulated marrow stimulation by blocking TGF-β1 in a rabbit osteochondral defect model. Orthop J Sports Med 2019;7(7_suppl5):2325967119S0026. doi:10.1177/232 5967119s00263
42. Huard J, Bolia I, Briggs K, Utsunomiya H, Lowe WR, Philippon MJ. Potential usefulness of Losartan as an antifibrotic agent and adjunct to platelet-rich plasma therapy to Improve muscle healing and cartilage repair and prevent adhesion formation. Orthopedics. 2018;41(5). doi:10.3928/01477447-20180
806-05
43. Lewis CL, Sahrmann SA, Moran DW Anterior hip joint force increases with hip extension, decreased gluteal force, or decreased iliopsoas force. J Biomech 2007;40(16):3725-3731. doi:10.1016/j.jbiomech.200
7.06.024
44. Lewis CL, Sahrmann SA, Moran DW Effect of hip angle on anterior hip joint force during gait. Gait Posture. 2010;32(4):603-607. doi:10.1016/j.gaitpost.20
10.09.001
45. Falk J, Aasa U, Berglund L. How accurate are visual assessments by physical therapists of lumbopelvic movements during the squat and deadlift? Phys Ther Sport 2021;50:195-200. doi:10.1016/j.ptsp.202
1.05.011
46. Sahrmann S, Azevedo DC, Dillen LV Diagnosis and treatment of movement system impairment syndromes. Braz J Phys Ther. 2017;21(6):391-399. do i:10.1016/j.bjpt.2017.08.001
47 Harris-Hayes M, Czuppon S, Van Dillen LR, et al. Movement-pattern training to improve function in people with chronic hip joint pain: A feasibility randomized clinical trial. J Orthop Sports Phys Ther 2016;46(6):452-461. doi:10.2519/jospt.2016.6279
48. Murphy DR, Byfield D, McCarthy P, Humphreys K, Gregory AA, Rochon R. Interexaminer reliability of the hip extension test for suspected impaired motor control of the lumbar spine. J Manipulative Physiol Ther 2006;29(5):374-377 doi:10.1016/j.jmpt.2006.0 4.012
49. Ratamess N, Alvar B, Evetoch T, Housh T, Kibler W, Kraemer WJ. Progression models in resistance training for healthy adults. Med Sci Sports Exerc 2009;41(3):687-708. doi:10.1249/mss.0b013e3181915 670
50. Hanrahan S, Van Lunen BL, Tamburello M, Walker ML. The short-term effects of joint mobilizations on acute mechanical low back dysfunction in collegiate athletes. J Athl Train 2005;40(2):88-93.
51. Yang J lan, Chang C wei, Chen S yee, Wang SF, Lin J jenq. Mobilization techniques in subjects with frozen shoulder syndrome: randomized multipletreatment trial. Phys Ther 2007;87(10):1307-1315. do i:10.2522/ptj.20060295
52. Bergmann G, Deuretzbacher G, Heller M, et al. Hip contact forces and gait patterns from routine activities. J Biomech. 2001;34(7):859-871. doi:10.101 6/s0021-9290(01)00040-9
53. Giarmatzis G, Jonkers I, Wesseling M, Van Rossom S, Verschueren S. Loading of hip measured by hip contact forces at different speeds of walking and running: Hip loading measured by HCFS at different speeds of walking and running. J Bone Miner Res. 2015;30(8):1431-1440. doi:10.1002/jbmr.2483
54. Luepongsak N, Amin S, Krebs DE, McGibbon CA, Felson D. The contribution of type of daily activity to loading across the hip and knee joints in the elderly Osteoarthritis Cartilage 2002;10(5):353-359. doi:10.1 053/joca.2000.0511
55. Waldhelm A, Li L. Endurance tests are the most reliable core stability related measurements. J Sport Health Sci. 2012;1(2):121-128. doi:10.1016/j.jshs.201 2.07.007
56. Powden CJ, Dodds TK, Gabriel EH. The reliability of the star excursion balance test and lower quarter Y-balance test in healthy adults: A systematic review Int J Sports Phys Ther 2019;14(5):683-694. doi:10.266 03/ijspt20190683
57. Shaffer SW, Teyhen DS, Lorenson CL, et al. Ybalance test: A reliability study involving multiple raters. Mil Med. 2013;178(11):1264-1270. doi:10.720 5/milmed-d-13-00222
58. Boren K, Conrey C, Le Coguic J, Paprocki L, Voight M, Robinson TK. Electromyographic analysis of gluteus medius and gluteus maximus during rehabilitation exercises. Int J Sports Phys Ther 2011;6(3):206-223.
Criteria-Based Rehabilitation Following Revision Hip Arthroscopy: A Clinical Commentary International Journal of Sports Physical Therapy
59. Andersen LL, Magnusson SP, Nielsen M, Haleem J, Poulsen K, Aagaard P. Neuromuscular activation in conventional therapeutic exercises and heavy resistance exercises: implications for rehabilitation. Phys Ther 2006;86(5):683-697 doi:10.1093/ptj/86.5.6 83
60. Lea JWD, O’Driscoll JM, Hulbert S, Scales J, Wiles JD. Convergent validity of ratings of perceived exertion during resistance exercise in healthy participants: A systematic review and Meta-Analysis. Sports Med - Open 2022;8(1):2. doi:10.1186/s40798-0 21-00386-8
61. Tateuchi H, Yamagata M, Asayama A, Ichihashi N. Influence of simulated hip muscle weakness on hip joint forces during deep squatting. J Sports Sci 2021;39(20):2289-2297. doi:10.1080/02640414.2021.1 929009
62. Meinders E, Pizzolato C, Gonçalves B, Lloyd DG, Saxby DJ, Diamond LE. Activation of the deep hip muscles can change the direction of loading at the hip. J Biomech 2022;135:111019. doi:10.1016/j.jbiom ech.2022.111019
63. Retchford TH, Crossley KM, Grimaldi A, Kemp JL, Cowan SM. Can local muscles augment stability in the hip? A narrative literature review J Musculoskelet Neuronal Interact. 2013;13(1):1-12.
64. Philippon MJ, Briggs KK, Yen YM, Kuppersmith DA. Outcomes following hip arthroscopy for femoroacetabular impingement with associated chondrolabral dysfunction: minimum two-year follow-up. J Bone Joint Surg Br 2009;91-B(1):16-23. d oi:10.1302/0301-620x.91b1.21329
65. Philippon MJ, Schroder E Souza BG, Briggs KK. Hip arthroscopy for femoroacetabular impingement in patients aged 50 years or older. Arthrosc J Arthrosc Relat Surg 2012;28(1):59-65. doi:10.1016/j.arthro.201
1.07.004
66. Wörner T, Thorborg K, Webster KE, Stålman A, Eek F. Psychological readiness is related to return to sport following hip arthroscopy and can be assessed by the Hip-Return to Sport after Injury scale (HipRSI). Knee Surg Sports Traumatol Arthrosc 2021;29(5):1353-1361. doi:10.1007/s00167-020-0615 7-4
67 Wahoff M, Ryan M. Rehabilitation after hip femoroacetabular impingement arthroscopy Clin Sports Med. 2011;30(2):463-482. doi:10.1016/j.csm.20 11.01.001
68. Bolia I, Briggs KK, Locks R, Utsunomiya H, Philippon MJ. Association of hip strength with the hip sports test: A functional test to measure athlete’s ability to return to sport activity after hip arthroscopy Orthop J Sports Med 2017;5(7_suppl6):2325967117S0042. doi:10.1177/232 5967117s00426
69. Munro AG, Herrington LC. Between-session reliability of four hop tests and the agility T-test. J Strength Cond Res. 2011;25(5):1470-1477. doi:10.151 9/jsc.0b013e3181d83335
70. Pauole K, Madole K, Garhammer J, Lacourse M, Rozenek R. Reliability and validity of the T-test as a measure of agility, leg power, and leg speed in college-aged men and women. J Strength Cond Res 2000;14(4):443-450. doi:10.1519/00124278-20001100 0-00012
71. Dick AG, Smith C, Bankes MJK, George M. The impact of mental health disorders on outcomes following hip arthroscopy for femoroacetabular impingement syndrome: a systematic review J Hip Preserv Surg. 2020;7(2):195-204. doi:10.1093/jhps/hn
aa016
72. Cheng AL, Schwabe M, Doering MM, Colditz GA, Prather H. The effect of psychological impairment on outcomes in patients with prearthritic hip disorders: A systematic review and meta-analysis. Am J Sports Med. 2020;48(10):2563-2571. doi:10.1177/036354651
9883246
73. Jochimsen KN, Noehren B, Mattacola CG, Di Stasi S, Duncan ST, Jacobs C. Preoperative psychosocial factors and short-term pain and functional recovery after hip arthroscopy for femoroacetabular impingement syndrome. J Athl Train. 2021;56(10):1064-1071. doi:10.4085/1062-6050-13
9-20
74. Browning RB, Clapp IM, Alter TD, Nwachukwu BU, Nho SJ. Pain catastrophizing and kinesiophobia affect return to sport in patients undergoing hip arthroscopy for the treatment of femoroacetabular impingement. Arthrosc Sports Med Rehabil 2021;3(4):e1087-e1095. doi:10.1016/j.asmr.2021.03.0
14
75. Wörner T, Thorborg K, Webster KE, Stålman A, Eek F. Return to sport after hip arthroscopy: are you ready? Knee Surg Sports Traumatol Arthrosc. 2021;29(5):1349-1352. doi:10.1007/s00167-021-0653
3-8
76. Jones DM, Webster KE, Crossley KM, et al. Psychometric properties of the Hip–Return to Sport After Injury Scale (Short Form) for evaluating psychological readiness to return to sports after arthroscopic hip sufrgery Am J Sports Med 2020;48(2):376-384. doi:10.1177/0363546519888644
Criteria-Based Rehabilitation Following Revision Hip Arthroscopy: A Clinical Commentary International Journal of Sports Physical Therapy
77 Woby SR, Roach NK, Urmston M, Watson PJ. Psychometric properties of the TSK-11: A shortened version of the Tampa Scale for Kinesiophobia. Pain 2005;117(1):137-144. doi:10.1016/j.pain.2005.05.029
78. Waldrop D, Lightsey OR Jr, Ethington CA, Woemmel CA, Coke AL. Self-efficacy, optimism, health competence, and recovery from orthopedic surgery. J Couns Psychol. 2001;48(2):233-238. doi:10.1 037/0022-0167.48.2.233
Criteria-Based Rehabilitation Following Revision Hip Arthroscopy: A Clinical Commentary International Journal of Sports Physical Therapy
Graft-Specific Surgical and Rehabilitation Considerations for Anterior Cruciate Ligament Reconstruction with the Quadriceps Tendon Autograft
Braidy Solie, DPT1 a , Jill Monson, MPT2 , Christopher Larson, MD3
1 Physical Therapy, Training HAUS, 2 Physical Therapy, Twin Cities Orthopedics, 3 Orthopedics, Twin Cities Orthopedics
Keywords: anterior cruciate ligament reconstruction, autograft, physical therapy, quadriceps tendon autograft, rehabilitation https://doi.org/10.26603/001c.73797
International Journal of Sports Physical Therapy
Anterior cruciate ligament reconstruction (ACLR) with a bone-patellar tendon-bone (BPTB) or hamstring tendon (HT) autograft has traditionally been the preferred surgical treatment for patients returning to Level 1 sports. More recently, international utilization of the quadriceps tendon (QT) autograft for primary and revision ACLR has increased in popularity. Recent literature suggests that ACLR with the QT may yield less donor site morbidity than the BPTB and better patient-reported outcomes than the HT Additionally, anatomic and biomechanical studies have highlighted the robust properties of the QT itself, with superior levels of collagen density, length, size, and load-to-failure strength compared to the BPTB. Although previous literature has described rehabilitation considerations for the BPTB and HT autografts, there is less published with respect to the QT Given the known impact of the various ACLR surgical techniques on postoperative rehabilitation, the purpose of this clinical commentary is to present the procedure-specific surgical and rehabilitation considerations for ACLR with the QT, as well as further highlight the need for procedure-specific rehabilitation strategies after ACLR by comparing the QT to the BPTB and HT autografts.
Level of Evidence
Level 5
INTRODUCTION
Rupture of the anterior cruciate ligament is a well-known sports injury, with a higher injury incidence in females and those who participate in Level 1 sports.1–4 Traditionally, anterior cruciate ligament reconstruction (ACLR) with a bone-patellar tendon-bone (BPTB) or hamstring tendon (HT) autograft has been the preferred surgical procedure for managing complete tears of the anterior cruciate ligament, with a surgeon-preference towards the BPTB as the standard of care.5–9 Recently, international utilization of the quadriceps tendon (QT) autograft for primary and revision ACLR has increased in popularity10–13; ACLR with the QT may yield less graft harvest site morbidity than the BPTB and better patient-reported outcomes than the HT 14–16 However, revision ACLR outcomes from the Dan-
ish Knee Ligament Reconstruction Registry suggests higher graft laxity and failure rates when performing primary ACLR with the QT than both the BPTB and HT17; these findings have been debated,18,19 along with other literature reporting similar graft survivorship between the QT, BPTB and HT 14–16,20
Justifying the increased utilization of the QT for ACLR, anatomic and biomechanical studies have highlighted the robust properties of the QT itself, with superior levels of collagen density, length, size and load-to-failure strength than the BPTB.21–25 However, due to the multiple muscular origins of the quadriceps tendon, the QT has the potential for more variation in laminar structure and fiber orientation than the BPTB and HT.26–28 This non-uniformity of the quadriceps tendon, along with variation in surgeon skill and reconstruction technique, has been suggested as a rea-
Corresponding Author
Dr. Braidy Solie,
Training HAUS
DPT
2645 Viking Circle, Suite #200
Eagan, MN 55121
Cell Phone: (218) 289-3624
Email: BraidySolie@traininghaus.com
Research
Original
a
Solie B, Monson J, Larson C. Graft-Specific Surgical and Rehabilitation Considerations for Anterior Cruciate Ligament Reconstruction with the Quadriceps Tendon Autograft. IJSPT. Published online April 1, 2023:493-512. doi:10.26603/001c.73797
Rehabilitation
son for the higher QT failure rates within the Danish Knee Ligament Reconstruction Registry.17–19
In addition to intra-graft characteristics, graft-specific considerations for ACLR should also include fixation technique, management of the graft harvest site and the overall graft ligamentization process. For example, graft fixation with an interference screw may facilitate better graft incorporation than suspensory fixation and reduce the incidence of bone tunnel widening.29–31 Regarding the graft harvest site, ACLR with the QT and BPTB may produce more postoperative quadriceps weakness than the HT,14,32–34 whereas a higher incidence of kneeling-related knee pain has been reported with the BPTB than both the QT and HT autografts.14,15 Lastly, the bone-to-bone healing of the BPTB within the bone tunnels facilitates graft osteointegration, which is a more efficient incorporation process than the fibrovascular healing of an all soft-tissue graft35; these considerations influence surgical decision-making and the rehabilitation plan-of-care, to which the rehabilitation specialist must tailor their exercise prescription in an effort to optimize outcomes after ACLR.
Although previous literature has described rehabilitation considerations for the BPTB and HT autografts,28,36–39 there is less published with respect to the QT 39–41 Therefore, the purpose of this clinical commentary is to present the graft-specific surgical and rehabilitation considerations for ACLR with the QT, as well as further highlight the need for graft-specific rehabilitation strategies after ACLR by comparing the QT to the BPTB and HT autografts.
ANATOMIC AND BIOMECHANICAL CONSIDERATIONS
The quadriceps and hamstring tendons are different than the patellar tendon in their innate function to connect muscle-to-bone, whereas the patellar tendon connects bone-to-bone. Considering this, differences in stiffness and elastic properties are known to exist between autograft tissue used for ACLR,42–44 with the quadriceps tendon producing more absolute stiffness than both the patellar and semitendinosus tendons but a lower elastic modulus and relative strain tolerance than the patellar tendon24,28,44–46 (Table 1).
While these findings reflect total-graft biomechanical properties, previous work has highlighted the fact that regional variation in tendon elasticity and stiffness may also exist; the tendon region closest to the myotendinous junction is less stiff than the tendon region adjacent to the enthesis.48 This is an important consideration, as biomechanically-induced graft failure studies have reported a difference in failure location for the QT harvested with a patellar bone block (B-QT) than that of the BPTB and multiple-strand HT autografts; failure of the B-QT was most common at the bone-tendon interface,28,44 whereas universal stretch/mid-substance failures have been reported with the all soft-tissue QT (S-QT), BPTB and multiplestrand HT.28,43–45,47 These observations suggest the B-QT has more within-graft variation in regional elasticity and
structure, creating increased stress at the bone-tendon interface and the observed graft failure-location.26,44,49
Compared to the HT and BPTB, more variation in laminar structure is present with the QT. In contrast to the continuous structure of the hamstring and patellar tendons, the quadriceps tendon is typically described as a common tendon with a three-layered arrangement; a superficial layer derived from rectus femoris, an intermediate layer from vastus medialis and vastus lateralis, and a deep layer from vastus intermedius.26–28 Although the extent to which laminar structure contributes to graft fixation pullthrough is unknown, a biomechanical study by Arakagi et al50 reported significant suspensory fixation pull-through with a 150-newton load on the S-QT relative to a boneblock control.
GRAFT COMPOSITION AND HARVESTING TECHNIQUE CONSIDERATIONS
The harvesting technique of the QT can vary, and along with this, different rehabilitation considerations for graft composition are warranted. The B-QT facilitates partial graft osteointegration as early as 4-6 weeks after ACLR through the bone-to-bone healing of the single bone block within the bone tunnel,51,52 but likewise, carries a 1.4-8.8% risk of patellar fracture due to bone block harvest.53–55 Conversely, the S-QT is harvested without a patellar bone block and mitigates the risk of patellar fracture,54 but will take a minimum of 10 to 12-weeks for the fibrovascular interface to form between the S-QT and the bone tunnels.28,56–58 This between-graft difference in integration, in conjunction with the findings of Arakagi et al,50 suggests accelerated rehabilitation approaches may be less appropriate for the S-QT fixated with suspensory fixation, especially as graft tension is highly dependent on fixation until biological integration of the graft within the bone tunnels has occurred. While this is an extrapolated suggestion, shortterm increases in graft laxity have been reported with the early introduction of open-kinetic-chain (OKC) quadriceps resistance training after ACLR, to which slightly increased levels of graft laxity were reported with the HT relative to the BPTB when OKC quadriceps resistance training with distal tibial load was initiated between 0-45 degrees of knee flexion weeks 6-12 after ACLR.59
The theoretical advantage of graft osteointegration with the B-QT is not currently supported by the literature.28,56–58 Specifically, a higher incidence of postoperative rotatory instability (16% vs 0%) and atraumatic graft ruptures (24% vs 0%) have been observed after ACLR with the B-QT compared to the S-QT54; these findings suggest ACLR with the S-QT may yield better postoperative stability than the B-QT. However, evidence is still limited,54 and the full-thickness B-QT appears to be more biomechanically similar to the BPTB than the S-QT, as well as may betterreplicate the tissue properties of the native anterior cruciate ligament42,44 (Table 1). Lastly, ACLR with the S-QT may not provide adequate quadriceps tendon graft-length in some populations,60 especially women,61 and cosmetic
International Journal of Sports Physical Therapy
Graft-Specific Surgical and
Considerations for Anterior Cruciate Ligament Reconstruction with the.
ACL; anterior cruciate ligament, BPTB; bone-patellar tendon-bone, HT; hamstring tendon, B-QT; quadriceps tendon with a patellar bone block; S-QT, all soft-tissue quadriceps tendon; *includes data from Woo et al42; †includes data from Shani et al24; ‡ includes data from Hamner et al45; § includes data from Schilaty et al43; ǁ includes data from Strauss et al44; ≠ includes data from Magnussan et al47
retraction of the rectus femoris is a known complication related to proximal QT harvest.28,53,55
Outcomes comparing the full-thickness QT (F-QT) to the partial-thickness QT (P-QT) are limited with only one direct comparison published within the literature.62 QT thickness does not appear to influence donor site pain, failure rates or patient-reported outcomes.63 However, the biomechanical properties of the P-QT appear to be less robust than the F-QT44 (Table 1).
The F-QT produces a larger diameter graft and causes deeper disruption of the tissue at the graft harvest site. With this, violation of the suprapatellar pouch with F-QT harvest can produce a suprapatellar hematoma,53 which is a known complication after ACLR with the F-QT 40 More postoperative quadriceps inhibition may also be theorized with the F-QT relative to the P-QT, as full-thickness quadriceps tendon harvest will disrupt the laminar layers associated with the vastus medialis, vastus lateralis and vastus intermedius.26,27,64 Along with the inevitable increase in suprapatellar scarring, the high collagen density and graft-specific stiffness of the QT are suggested reasons for the observed incidence of arthrofibrosis after ACLR with the QT,20,40,65,66 to which the F-QT may exacerbate.67
EXTENSOR MECHANISM CONSIDERATIONS
Harvesting the P-QT may reduce the tensile strength of the quadriceps tendon by as much as 34%, which is greater than the 25% reduction in patellar tendon tensile strength after BPTB harvest.23 These findings have implications for rehabilitation, as greater impairments in quadriceps strength have been observed after ACLR with the QT and BPTB than with the HT 14,32–34,68 Following QT harvest, reduced quadriceps activation and strength may initially create a more protective healing environment at the graft harvest site. However, long-term reductions in quadriceps strength are detrimental to knee function and are one of the reasons why it may take longer to achieve performance testing milestones after ACLR with the QT and BPTB than with the HT 33,38,39,68
Considering P-QT harvest reduces the tensile strength of the quadriceps tendon by more than a third,23 a greater initial reduction in quadriceps strength may be expected after ACLR with the QT compared to the BPTB and HT.68 Quadriceps weakness from extensor mechanism graft harvest appears most extreme during the first three months after ACLR,68 suggesting any difference in quadriceps strength between ACLR with the QT and BPTB may only be distinguishable during the first three to four months after
Graft Type CrossSectional Area (mm2) Maximal Load To Failure (N) Ultimate Stiffness (N/mm) Ultimate Stress (N/mm2) Ultimate Strain (%) Common Failure Location Native ACL*§ 44 2160 242 49 20 BPTB Autograft†ǁ≠ 48 1580-1810 278-324 69.9 14 Deep Layer of Patellar Interface / Femoral Origin / Mid-substance HT Autograft‡§ǁ≠ 11 (1-strand) 23 (2-strand) 1060 (1-Stand) 2330 (2-stand) 1750 (4-stand) 213 (1-Stand) 469 (2-stand) 433 (4-stand) 99 (1-Stand) 100 (2-stand) 11.6 (4-stand) Mid-Substance / Universal Stretch B-QT†≠ (Full Thickness) 91 1450-2186 370-466 49 11.2 Bone-Tendon Interface S-QT≠ (Full Thickness) 1260 257 Proximal Graft / Universal Stretch S-QT≠ (Partial Thickness) 972 228 Distal Graft / Universal Stretch
Table 1. Biomechanical characteristics of the native anterior cruciate ligament and common autografts used for anterior cruciate ligament reconstruction
Graft-Specific Surgical and Rehabilitation Considerations
International Journal of Sports Physical Therapy
for Anterior Cruciate Ligament Reconstruction with the.
ACLR34,68; this suggestion is supported by the fact quadriceps strength is not statistically different between the QT and the BPTB at six to 24 month follow-up.34,68,69
REHABILITATION CONSIDERATIONS EARLY PHASE (POSTOPERATIVE WEEKS 0-8)
After ACLR with the QT, the graft’s composition and fixation method should be communicated to the rehabilitation specialist, as these factors dictate the overall graft ligamentization process35,70–72; the amount of tissue trauma at the graft harvest site44; and the durability of the graftbone tunnel construct.29–31,50,73 ACLR with the F-QT carries the risk of developing a suprapatellar hematoma55,63; pain and focal swelling at the graft harvest site is indicative of a hematoma and should be differentiated from a postoperative knee effusion.40 If a suprapatellar hematoma is identified, the surgical team should be notified as physician follow-up may be indicated.
The early restoration of passive knee extension is a crucial component of rehabilitation after ACLR, regardless of graft type.74 ACLR with the QT may carry an elevated risk of postoperative stiffness due to the larger graft size,67 presence of suprapatellar scarring and ongoing quadriceps inhibition.20,40,65,66 Interventions to improve patellar mobility, knee range-of-motion and soft tissue compliance should be implemented immediately after surgery Failure to restore passive knee extension by postoperative week eight may indicate the need for a subsequent lysis-of-adhesions procedure.20,65
Like the BPTB, ACLR with the QT requires an isolated quadriceps training load-progression to be a cornerstone of the rehabilitation program.33,34,75,76 Early phase quadriceps rehabilitation should include quadriceps setting and other activation exercises into terminal knee extension (TKE), with the goal of restoring active knee extension as soon as possible (Table 2). The early implementation of neuromuscular electrical stimulation and/or blood flow restriction during quadriceps exercise may improve neuromuscular recruitment and help mitigate thigh muscle atrophy,77–80 as well as facilitate improvements in muscle size and strength throughout rehabilitation.81–83 The quadriceps muscle load-progression should start with quadriceps setting and straight-leg raises in non-weightbearing, and progress onto closed-kinetic-chain (CKC) positions which emphasize the restoration of knee control in weightbearing (Table 2).84 The CKC quadriceps load-progression should begin with the double-leg squat exercise and incorporate body-weight isometric and isotonic contractions in low levels of knee flexion (Figure 1A) (Table 2).85
Graft osteointegration with the B-QT supports the implementation of an accelerated resistance training approach within the first 4-6 weeks after ACLR,59 such as OKC quadriceps resistance training with distal tibial load between 0-45 degrees of knee flexion86; the combined utilization of the B-QT with interference screw fixation may further justify this clinical decision29–31,44,50,70,71,87 (Table 3). The S-QT fixated with suspensory fixation may warrant a more traditional approach to resistance training the first
the surgical limb
Suboptimal progression of unilateral loading from a double leg regression (A) to a rearfoot elevated split-squat (B) with a subsequent increase in knee flexion angle and external resistance (C). Theoretically proper progression of unilateral loading from a double leg regression (A) to a split-squat (D) with the subsequent addition of external resistance (E). No change in knee flexion angle throughout progression (A-D-E). Red dash-arrow, approximate ground reaction force-vector; white lines, depiction of joint angles; red lines, depiction of increasing knee flexion; yellow lines in (A-D-E), depiction of knee/ quadriceps-dominant movement with a positive shin angle; yellow shading, depiction of external knee flexion moment related to knee/quadriceps-dominant movement; red circles, improper exercise selection; green circles, proper exercise selection.

10-12 weeks after ACLR59,72,73,87,88 (Table 2); healing time is needed to mitigate the risk of fixation slippage,50,73,85,89 graft laxity and bone tunnel widening with an all soft-tissue graft,17,29–31,50 as well as facilitate optimal fibrovascular integration of the graft within the bone tunnels72,87,89–93 (Table 3).
MIDDLE PHASE (POSTOPERATIVE WEEKS 8-16)
As goals related to joint homeostasis are achieved, the focus of rehabilitation transitions from resolving impairments in muscle activation and knee range-of-motion, to rebuilding the surgical limb’s functional capacity to manage load. Ongoing quadriceps weakness is expected after ACLR with the QT,14,15,33,34,75 and knee-specific load-progressions should be designed to best-manage the graft harvest site while stimulating improvements in quadriceps size and strength. Prior research has highlighted associations between knee position and extensor mechanism biomechanics,94–96 from which the quadriceps training load-progressions can be derived (Table 2).
As the knee moves into deeper knee flexion, preferential loading of the quadriceps tendon increases relative to the patellar tendon.94 This load-transition is the result of an improving patellar tendon mechanical advantage with a concurrent increase in passive tension within the quadriceps.94,95 Considering the laminar structure of the quadriceps tendon, variations in quadriceps length-tension can predispose the quadriceps tendon to greater levels of shear/ compressive load, as well as non-uniform intratendinous
Figure 1. Closed-kinetic-chain load-progression for
Graft-Specific
International Journal of Sports Physical Therapy
Surgical and Rehabilitation Considerations for Anterior Cruciate Ligament Reconstruction with the.
Graft-Specific Surgical and Rehabilitation Considerations for Anterior Cruciate Ligament Reconstruction with the.
Table 2. Example of a quadriceps muscle/tendon load-progression after anterior cruciate ligament reconstruction with an all soft-tissue quadriceps tendon autograft fixated with suspensory fixation
Postoperative Month Single-Leg Progression
Month 0-1 Banded TKE (Sitting at Edge of Surface)
Prescription Type: Neuromuscular Reeducation and Muscle Activation
F: 3-4 times/day
I: Elastic resistance band exercise (light to heavy)
T: Isotonic (concentric/eccentric phase)
T: 10-15 minutes each exposure
V: 2-4 sets of 10-20 repetition with a 1-3 second isometric contraction in TKE
P: Progression of elastic resistance band level; superimposition of NMES with exercise;
progression onto blood flow restriction exercise (1-2 times/day, 3-4 set to volitional fatigue at 80% LOP)
Month 1-2 Banded TKE (Standing)
Prescription Type: Neuromuscular Reeducation and Muscle Activation
F: 2-3 times/day
I: Elastic resistance band (light to heavy)
T: Isotonic (concentric/eccentric phase)
T: 10-15 minutes each exposure
V: 3-4 sets of 10-20 repetition with a 1-3 second isometric contraction in TKE
P: Progression of elastic resistance band level; progression onto blood flow restriction exercise (1-2 times/day, 3-4 set to volitional fatigue at 80% LOP)
Split-Squat Progression
Quadriceps Setting (Straight Leg Raise)
Prescription Type: Neuromuscular Reeducation and Muscle Activation
F: 3-6 times/day
I: Progressive increase in contraction intensity onto the straight leg raise exercise
T: Isometric quadriceps contraction training
T: 8-10 minutes each exposure
V: 2-4 sets of 10-20 repetition with a 1-3 second isometric contraction in TKE
P: Progression of body position and/or onto the straight leg raise exercise (with/without external resistance at the ankle); superimposition of NMES with exercise; progression onto blood flow restriction exercise (1-2 exposures/day, 3-4 set to volitional fatigue at 80% LOP)
Double-Leg Squat (0-60 Degrees of Knee Flexion)
Prescription Type: Neuromuscular Reeducation and Muscle Activation
F: 2-3 times/day
I: Body weight (0-60 degrees of knee flexion)
T: Isotonic (concentric/eccentric phase) or Isometric
T: 10-15 minutes each exposure
V: 3-4 sets of 10-15 repetition followed by a 45-90 second isometric contractions in 45-60 degrees of knee flexion | 30-90-second rest periods between sets
P: Progression of knee flexion angle, positive shin angle and duration of isometric contraction; redistribution of weight toward the surgical limb
Open-Kinetic-Chain Progression
Short/Long-Arc Quad (AROM)
Prescription Type: Neuromuscular Reeducation and Muscle Activation
F: 3-4 times/day
I: Weight of lower leg
T: Isotonic (concentric/eccentric phase)
T: 10-15 minutes each exposure
V: 2-4 sets of 10-20 repetition with a 1-3 second isometric contraction in TKE
P: Progression of contraction intensity and knee flexion angle during exercise; superimposition of NMES with exercise; progression onto blood flow restriction exercise (1-2 times/day, 3-4 set to volitional fatigue at 80% LOP)
Long-Arc Quad (AROM with Blood Flow Restriction)
Prescription Type: Cell Swelling/Atrophy Mitigation/ Hypertrophy
F: 1-2 times/day
I: Weight of lower leg, blood flow restriction at 80% LOP
T: Isotonic (concentric/eccentric phase) | 0-90+ degrees of knee flexion
T: 10-20 minutes each exposure
V: 3-4 sets to volitional fatigue | 30-90-second rest periods between sets
P: Addition of progressive isometric contractions at 45-90 degrees of knee flexion with/without the superimposition of NMES
International Journal of Sports Physical Therapy
Graft-Specific Surgical and Rehabilitation Considerations for Anterior Cruciate Ligament Reconstruction with the.
Postoperative Month Single-Leg Progression
Month 2-3 Double-Leg Wall Squat (60-90+ Degrees of Knee Flexion)
Prescription Type: Extensor Mechanism Load-Tolerance/ Hypertrophy
F: 3-5 times/week
I: Body weight (60-90+ degrees of knee flexion)
T: Isometric
T: 5-10 minutes each exposure
V: 3-4 sets of 45-90 second isometric contractions | 2-5-minute rest periods between sets
P: Progression of knee flexion angle, positive shin angle, or duration of isometric contraction; pressure redistribution of additional weight onto the surgical limb
Month 3-4 Leg Press Machine (Single-Leg with Blood Flow Restriction)
Prescription Type: Hypertrophy/ Strength
F: 2-4 times/week
I: 10-20 RM (40-75% 1-RM) on the involved limb, blood follow restriction at 80% limb occlusion pressure
T: Isotonic (concentric/eccentric phase)
T: 5-10 minutes each exposure
V: 3-4 sets to volitional fatigue | 2-5-minute rest periods between sets
P: Progression of knee flexion angle, positive shin angle or external resistance
Split-Squat Progression
Split-Squat (0-60 Degrees of Knee Flexion)
Prescription Type: Neuromuscular Reeducation and Muscle Activation
F: 2-3 times/day
I: Body weight (0-60 degrees of knee flexion) on involved limb
T: Isotonic (concentric/eccentric phase) or Isometric
T: 5-10 minutes each exposure
V: 3-4 sets of 10-15 repetition followed by a 45-60 second isometric contractions in shallow knee flexion | 30-90-second rest periods between sets
P: Progression of knee flexion angle, positive shin angle or duration of isometric contraction; redistribution of weight onto the surgical limb
Open-Kinetic-Chain Progression
Knee Extension Machine (Single-Leg with Blood Flow Restriction)
Prescription Type: Hypertrophy/Strength
F: 3-5 times/week
I: 15-30 RM (<40-65% 1-RM) of involved limb, blood follow restriction at 80% LOP
T: Isotonic (concentric/eccentric phase) | 45-90+ degrees of knee flexion
T: 5-10 minutes each exposure
V: 3-4 sets to volitional fatigue | 2-5-minute rest periods between sets
P: Progression of external resistance at the distal tibia
Split -Squat (60-90+ Degrees Knee Flexion)
Prescription Type: Hypertrophy/Strength
F: 2-4 times/week
I: Body weight (60-90+ degrees of knee flexion) on the involved limb
T: Isometric
T: 5-10 minutes each exposure
V: 3-4 sets of 45-90 second isometric contractions in progressively deeper knee flexion | 2-5-minute rest periods between sets
P: Progression of knee flexion angle, positive
Knee Extension Machine (Single-Leg with Blood Flow Restriction)
Prescription Type: Hypertrophy/Strength
F: 2-4 times/week
I: 15-20 RM (40-65% 1-RM) of involved limb, blood follow restriction at 80% limb occlusion pressure
T: Isotonic (concentric/eccentric phase) | 0-90+ degrees of knee flexion
T: 5-10 minutes each exposure
V: 3-4 sets to volitional fatigue | 2-5-minute rest periods between sets
P: Progression of external resistance at the distal tibial
International Journal of Sports Physical Therapy
Graft-Specific Surgical and Rehabilitation Considerations for Anterior Cruciate Ligament Reconstruction with the.
Postoperative Month Single-Leg Progression
Month 4-6 Leg Press (Single-Leg with Increasing Load)
Prescription Type: Hypertrophy/ Strength
F: 2-4 times/week
I: 6-15 RM (65-85% 1-RM) on the involved limb
T: Isotonic (concentric/eccentric phase)
T: 5-10 minutes each exposure
V: 3-4 sets to volitional fatigue | 2-5-minute rest periods between sets
P: Progression of knee flexion angle, positive shin angle or external resistance
Month 6+ Eccentric Leg Press (2-Legs Up Concentric / 1-Leg Down Eccentric)
Prescription Type: Hypertrophy/ Eccentric Strength
F: 2-3 times/week
I: 1-5 RM (85-100% 1-RM) on the involved limb
T: Eccentric resistance training
T: 5-10 minutes each exposure
V: 3-4 sets of 8-15 eccentric repetitions
| 2-5-minute rest periods between sets
P: Progression of knee flexion angle, positive shin angle or external resistance greater than a 1-RM (e.g., 120% 1-RM)
Split-Squat Progression Open-Kinetic-Chain Progression
Split-Squat (Rearfoot-Elevated Position)
Prescription Type: Hypertrophy/Strength
F: 2-4 times/week
I: 6-15 RM (65-85% 1-RM) on the involved limb
T: Isotonic (concentric/eccentric phase)
T: 5-10 minutes each exposure
V: 3-4 sets to volitional fatigue | 2-5-minute rest periods between sets
P: Progression of knee flexion angle, positive shin angle or external resistance
Knee Extension Machine (Single-Leg with Increasing Load)
Prescription Type: Hypertrophy/Strength
F: 2-4 times/week
I: 6-15 RM (65-85% 1-RM) on the involved limb
T: Isotonic (concentric/eccentric phase) | 0-90+ degrees of knee flexion
T: 5-10 minutes each exposure
V: 3-4 sets to volitional fatigue | 2-5-minute rest periods between sets
P: Progression of external resistance at the distal tibial
Split-Squat Jumps (Lunge or Rearfoot-Elevated Position)
Prescription Type: Power
F: 2-4 times/week
I: Body weight to 40-60% 1-RM on the involved limb
T: Isotonic (concentric/eccentric phase), emphasis on speed/effort during the concentric phase of the movement
T: 5-10 minutes each exposure
V: 4-5 sets of 3-5 reps | 2-5-minute rest period between sets
P: Progression of knee flexion angle, positive shin angle, contraction speed or external load
Eccentric Knee Extension Machine (2-Legs Up Concentric / 1-Leg Down Eccentric)
Prescription Type: Hypertrophy/ Eccentric Strength
F: 2-3 times/week
I: 1-5 RM (85-100% 1-RM) on the involved limb
T: Eccentric resistance training | 0-90+ degrees of knee flexion
T: 5-10 minutes each exposure
V: 3-4 sets of 8-15 eccentric repetitions | 2-5-minute rest periods between sets
P: Progression of external resistance greater than a 1-RM (e.g., 110% 1-RM)
F,
frequency; I, intensity; T, type; T, time; V, volume; P, progression; AROM, active range-of-motion; TKE, terminal knee extension; LOP, limb occlusion pressure, RM, repetition maximum, 1-RM, 1-repetition maximum
International Journal of Sports Physical Therapy
force-transmission. Specifically, performing the prone knee flexion stretch will preferentially tension the superficial layer of the quadriceps tendon by maximally lengthening rectus femoris, compressing/shearing the deeper layers of the tendon95,97,98; this unique type of tendon loading can be prescribed in addition to strength training to mobilize the graft harvest site and may help stimulate quadriceps tendon remodeling (Figure 2).
Months 2-4 after ACLR with the QT, the CKC quadriceps load-progression should include isometric or isotonic contractions with a light to moderate external resistance. Initially, body weight isometric exercise in low levels of knee flexion may best manage graft harvest site irritability94,99 (Figure 1A) (Table 2). As exercise tolerance improves, the quadriceps load-progression should be advanced by monitoring the graft harvest site for any increase in pain/irritability with exercise while gradually progressing external resistance or the level of knee flexion95 (Figure 1A-D-E). The rehabilitation specialist should not advance too many variables at once, as simultaneously increasing external resistance and the level of knee flexion can exponentially load the quadriceps tendon and may provoke graft harvest site pain94,95 (Figure 1C).
Graft-specific load-progressions for the P-QT may also exist, in which more specific targeting of the superficial layer of the quadriceps tendon/rectus femoris with OKC exercise may be indicated.98,100 The long-arc-quad exercise should be advanced from active range-of-motion during the early phase of rehabilitation,85 to OKC quadriceps resistance training on a knee extension machine (Table 2); the rehabilitation specialist may elect to perform OKC quadriceps resistance training with the hip positioned in lower levels of hip flexion to preferentially load rectus femoris (i.e., performing OKC quadriceps resistance training with the trunk positioned in supine).95,97,98 External resistance should be thoughtfully progressed, as performing OKC quadriceps resistance training between 0-45 degrees of knee flexion will increase patellofemoral compartment stress and preferentially strain the reconstructed ACL graft85,86,101 (Figure 3A), whereas performing OKC quadriceps resistance training in deeper levels of knee flexion will preferentially load the quadriceps tendon and may provoke irritability at the graft harvest site94,95 (Figure 3B).
LATE PHASE (POSTOPERATIVE WEEKS 16+)
As the surgical limb develops the capacity to perform higher-load activities at slow contraction velocities, higher demand exercise progressions should be introduced. Patients participating in physically demanding activities, such as Level 1 sports, will benefit from exposure to plyometric and ballistic-type exercise progressions. The rehabilitation specialist should consider the quadriceps tendon a ratelimiting tissue for the introduction of plyometric exercise,23 as the QT harvest site must store and transfer energy during these progressions. Plyometric exercise should be initiated with knee-specific regressions that temper the demand for elastic energy-storage within the quadriceps tendon, such as running drills in triple-extension or frontal plane plyometric exercise94,102,103 (Figure 4).
As mentioned previously, specific consideration should be given for ballistic activities that require the quadriceps tendon to transfer load while in the combined position of hip extension and knee flexion, such as the wind-up phase of kicking or high-velocity running104,105 (Figure 2B); these activities combine high angular velocities and tendinous compressive/shear force by the selective-tensioning of the superficial layer of the quadriceps tendon running continuous with rectus femoris.95,97 Sagittal plane deceleration training will also preferentially load the quadriceps tendon. During deceleration, the combination of large external knee flexion moments, increasing knee flexion angles, and highforce eccentric quadriceps contractions can produce exponentially higher load-transmission within the quadriceps tendon (Figure 4); sagittal plane deceleration training must be thoughtfully progressed per exercise-tolerance and symptom-response at the graft harvest site.
RETURN TO ACTIVITY CONSIDERATIONS
Regardless of the graft type used for ACLR, most individuals expect to restore knee joint stability and function to a level that supports the return to their pre-injury activity level.106 However, only 65% of individuals may return to their preinjury level of sports participation,107 with knee re-injury rates between 20-30% within higher-risk cohorts.108–110 Equally troubling is the unclear association between return-to-activity testing batteries and the subsequent risk of knee re-injury within various cohorts,111–117 and although the restoration of limb function on objective performance tests appears to improve return-to-sport rates,118–120 the use of performance testing cut-points as strict, medicallyrequired, return-to-activity criteria remains controversial.112,121–123 Recent literature has highlighted the importance of shared decision-making after ACLR,124,125 to which the use of a decision-making framework may improve the return-to-activity decision-making process.124,126–129
To best inform shared decision-making, serial physical examinations and performance testing batteries should be completed throughout rehabilitation.130,131 Physical examinations should include the assessment of knee homeostasis (effusion and irritability), stability and range-of-motion.132 After ACLR with the QT, quadriceps strength testing should be a fundamental component of the performance testing battery, as quadriceps strength appears most affected by QT harvest,33,34,68 and quadriceps strength deficits are common 9-12 months after ACLR.34 Other components of a performance testing battery may include jump/hop testing and the assessment of movement quality; these tests should include both qualitative and quantitative measurements.132 Collectively, this information can be utilized throughout rehabilitation to confirm the effectiveness of exercise interventions, adjust the exercise prescription(s), and inform return-to-activity decision-making.133
Of the various data synthesized for return-to-activity decision-making, some information may be more important than others. The timeframe between ACLR and returnto-activity has been observed to be a modifiable risk factor
Graft-Specific Surgical and Rehabilitation Considerations for Anterior Cruciate Ligament Reconstruction with the. International Journal of Sports Physical Therapy
Table 3. Rehabilitation Overview
• Partial graft osteointegration within first 4-6 weeks
• Graft fibrovascular integration takes a minimum of 10-12 weeks
• Accelerated rehabilitation approaches may be less appropriate when fixated with suspensory fixation (Table 2)
• Consider risk of a range-of-motion complications with large graft diameter and robust biomechanical properties
• AROM: as tolerated
• OKC quadriceps resistance exercise with distal tibial load:
◦ 45-90+ degrees weeks 3-4
◦ 0-45+ degrees weeks 4-6+
• AROM: as tolerated
• OKC quadriceps resistance exercise with distal tibial load:
◦ 45-90+ degrees weeks 3-10
◦ 0-45+ degrees weeks 10-12+
• Low risk of patellar fracture (1.4-8.8%)
• Possibility of more persistent and global quadriceps inhibition
• Differentiation of a postoperative knee effusion from a suprapatellar hematoma at graft harvest site
• Superficial tendon trauma will result in more isolated involvement of the rectus femoris muscle
• OKC exercise may be more provocative to graft harvest site than CKC
• Full-thickness tendon trauma may increase the potential for more global graft harvest site irritability with CKC/OKC quadriceps resistance training
• Prone knee flexion stretching will preferentially tension the superficial layer of quadriceps tendon
• Increasing the level of knee flexion during resistance training will preferentially increase the load within the quadriceps tendon relative to the patellar tendon
• Quadriceps strengthening program 2-3x/week (OKC + CKC)
• Progressive resistance training, eccentric training, and power training
Progression of Energy Storage Activities into Increasing Knee
• Combination of hip extension and knee flexion preferentially tensions the superficial layer of the quadriceps tendon (e.g., wind-up phase of kicking)
Weeks 16+)
• Avoid acute spikes in plyometric load into increasing levels of knee flexion
• Thoughtful progression of high velocity running speed/intensity, distance and volume
• Thoughtful progression of high-velocity kicking and sagittal plane deceleration training
B-QT, quadriceps tendon autograft with patellar bone-block; S-QT, all soft-tissue quadriceps tendon autograft; F-QT, full-thickness quadriceps tendon autograft; OKC, open-kineticchain; AROM, active range-of-motion; P-QT, partial-thickness quadriceps tendon autograft; CKC, closed-kinetic-chain
Consideration Location Description of Consideration(s) Early Phase Rehabilitation Considerations (Postoperative Weeks 0-8) Graft Composition IntraArticular B-QT S-QT F-QT OKC Quadriceps Resistance Training / Graft Fixation IntraArticular OKC Exercise with Interference Screw Fixation (B-QT) OKC Exercise with Suspensory Fixation (S-QT) Graft Harvest Site ExtraArticular B-QT F-QT Middle Phase Rehabilitation Considerations (Postoperative Weeks 8-16) Graft Composition ExtraArticular P-QT F-QT Graft Harvest Site ExtraArticular Gradual and Progressive Quadriceps Loading into Deep Knee Flexion
Considerations (Postoperative
Graft Harvest Site ExtraArticular Ongoing Quadriceps Strengthening Program
Late Phase Rehabilitation
Flexion
Graft-Specific Surgical and Rehabilitation Considerations for Anterior Cruciate Ligament Reconstruction with the. International Journal of Sports Physical Therapy
2. Selective tensioning of the superficial layer of the quadriceps tendon
Selective tensioning of the superficial layer of the quadriceps tendon is achieved by maximally lengthening rectus femoris into the combined motion of hip extension and knee flexion; low-velocity stretching may be therapeutically prescribed to shear/mobilize the graft harvest site (A), whereas high-velocity activities should be thoughtfully progressed with ongoing monitoring of the graft harvest site for any increase in tissue irritability Asterisk, quadriceps tendon autograft harvest site; white lines, depiction of joint angles; black dash-arrow, high-velocity eccentric lengthening of the quadriceps muscle during the wind-up phase of kicking
for knee re-injury,111,134 with the suggestion that most individuals should wait a minimum of nine months before returning to unrestricted sports participation.111,122,132 Risk calculator algorithms formulated to predict the risk of revision ACLR have been recently validated for clinical use135,136; these algorithms are based upon data that is specific to the individual of interest, including age, body mass index, preoperative knee laxity, activity level and graft type.135,136 The ACL-Return to Sport after Injury (ACL-RSI) is a validated psychometric scale, and should be used to as-
4. Sagittal deceleration task vs lateral plyometric task

The resultant ground reaction force during a sagittal plane deceleration task (top sequence from left to right) places a large amount of load on the knee and quadriceps tendon, whereas a lateral plyometric task places more relative load proximally on the lateral hip and trunk (bottom sequence from left to right). Red arrows, resultant ground reaction force-vector; white lines, depiction of joint angels; asterisks, area of high load-demand during task.
sess an individual’s psychological readiness for sports participation after ACLR.132
Comprehensive rehabilitation and return-to-sport programming can facilitate improved limb function on objective performance tests,133,137 achieve higher return-tosport rates and reduce the risk of knee re-injury 133,138–141
Comprehensive programming should include formal strength and conditioning sessions, as well as the integration of jumping/hopping, cutting and sport-specific load-
Figure 3. Considerations for open-kinetic-chain quadriceps resistance training with distal tibial load

Performing quadriceps resistance training between 0-45 degrees of knee flexion with distal tibial load will produce higher patellofemoral joint stress and increase strain on the reconstructed anterior cruciate ligament (A), whereas performing resisted knee extensions in deeper levels of knee flexion will preferentially load the quadriceps tendon relative to the patellar tendon. Red arc, 0-45 degrees of knee flexion; yellow arc, >45 degrees of knee flexion; Black asterisk,
 Figure
quadriceps tendon autograft harvest site
Figure
Figure
quadriceps tendon autograft harvest site
Figure
Graft-Specific Surgical and Rehabilitation Considerations for Anterior Cruciate Ligament Reconstruction with the. International Journal of Sports Physical Therapy
progressions. Late phase load-progressions should include a period of on-field rehabilitation with all relevant stakeholders (e.g., athlete, coach, guardian, and rehabilitation specialist) in agreement with the return-to-practice and competition progressions.131,133,142 On-field rehabilitation should follow the control-chaos continuum and facilitate graded exposure to sports participation.133,135,142,143
Prior to commencing unrestricted activity, a final physical examination and performance testing battery should be completed with all relevant information clearly synthesized for analysis within the shared decision-making framework.124–129,133 If the individual is returning to an activity with a high risk of knee re-injury, such as Level 1 sports, secondary injury reduction strategies should be implemented regardless of performance testing status.144 Preactivity neuromuscular warmups, such as the FIFA 11+, appear highly effective at mitigating known biomechanical risk factors for anterior cruciate ligament injury,145–148 and can significantly reduce the overall injury incidence rate.149
CONFLICTS OF INTEREST
The above authors have no financial disclosures or conflicts of interest related to the development and publication efforts of this manuscript
ACKNOWLEDGEMENTS
We extend a special thank you to Dr George Davies, DPT, and Dr Steven Stovitz, MD for their gift of time, mentoring, and teaching within their respective sports medicine communities.
Thank you to the physical therapists, sports scientists, and licensed athletic trainers at Training HAUS for their ongoing teamwork and support, as well as the research department at Twin Cities Orthopedics for their support with ongoing research projects.
Submitted: October 17, 2022 CDT, Accepted: January 27, 2023
CDT
FUNDING
No grant support was provided to aid in the development and publication efforts of this manuscript
This is an open-access article distributed under the terms of the Creative Commons Attribution 4.0 International License (CCBY-NC-4.0). View this license’s legal deed at https://creativecommons.org/licenses/by-nc/4.0 and legal code at https://creativecommons.org/licenses/by-nc/4.0/legalcode for more information.
Graft-Specific Surgical and Rehabilitation Considerations for Anterior Cruciate Ligament Reconstruction with the. International Journal of Sports Physical Therapy
Rehabilitation
REFERENCES
1. Arendt E, Dick R. Knee injury patterns among men and women in collegiate basketball and soccer Am J Sports Med. 1995;23(6):694-701. doi:10.1177/0363546 59502300611
2. Gwinn DE, Wilckens JH, McDevitt ER, Ross G, Kao TC. The relative incidence of anterior cruciate ligament injury in men and women at the United States Naval Academy Am J Sports Med 2000;28(1):98-102. doi:10.1177/036354650002800129 01
3. Hewett TE, Myer GD, Ford KR. Anterior cruciate ligament injuries in female athletes: Part 1, mechanisms and risk factors. Am J Sports Med 2006;34(2):299-311. doi:10.1177/0363546505284183
4. Montalvo AM, Schneider DK, Silva PL, et al. ‘What’s my risk of sustaining an ACL injury while playing football (soccer)?’ A systematic review with meta-analysis. Br J Sports Med. 2019;53(21):1333-1340. doi:10.1136/bjsports-2016-0 97261
5. Marx RG, Jones EC, Angel M, Wickiewicz TL, Warren RF. Beliefs and attitudes of members of the American Academy of orthopaedic surgeons regarding the treatment of anterior cruciate ligament injury Arthroscopy 2003;19(7):762-770. doi:10.1016/ s0749-8063(03)00398-0
6. Carmichael JR, Cross MJ. Why bone-patella tendon-bone grafts should still be considered the gold standard for anterior cruciate ligament reconstruction. Br J Sports Med. 2009;43(5):323-325. doi:10.1136/bjsm.2009.058024
7 Gifstad T, Foss OA, Engebretsen L, et al. Lower risk of revision with patellar tendon autografts compared with hamstring autografts: a registry study based on 45,998 primary ACL reconstructions in Scandinavia. Am J Sports Med. 2014;42(10):2319-2328. doi:10.117
7/0363546514548164
8. Sundemo D, Hamrin Senorski E, Karlsson L, et al. Generalised joint hypermobility increases ACL injury risk and is associated with inferior outcome after ACL reconstruction: a systematic review BMJ Open Sport Exerc Med. 2019;5(1):e000620. doi:10.1136/bmjsem-2 019-000620
9. Krebs NM, Barber-Westin S, Noyes FR. Generalized joint laxity Is associated with increased failure rates of primary anterior cruciate ligament reconstructions: a systematic review Arthroscopy 2021;37(7):2337-2347. doi:10.1016/j.arthro.2021.02.0 21
10. van Eck CF, Schreiber VM, Mejia HA, et al. “Anatomic” anterior cruciate ligament reconstruction: a systematic review of surgical techniques and reporting of surgical data. Arthroscopy 2010;26(9):S2-S12. doi:10.1016/j.arthr o.2010.03.005
11. Middleton KK, Hamilton T, Irrgang JJ, Karlsson J, Harner CD, Fu FH. Anatomic anterior cruciate ligament (ACL) reconstruction: a global perspective. Part 1. Knee Surg Sports Traumatol Arthrosc 2014;22(7):1467-1482. doi:10.1007/s00167-014-284 6-3
12. Lubowitz JH. Editorial Commentary: Quadriceps tendon autograft use for anterior cruciate ligament reconstruction predicted to increase. Arthroscopy. 2016;32(1):76-77 doi:10.1016/j.arthro.2015.11.004
13. Winkler PW, Vivacqua T, Thomassen S, et al. Quadriceps tendon autograft is becoming increasingly popular in revision ACL reconstruction. Knee Surg Sports Traumatol Arthrosc 2022;30(1):149-160. doi:10.1007/s00167-021-06478-y
14. Mouarbes D, Menetrey J, Marot V, Courtot L, Berard E, Cavaignac E. Anterior cruciate ligament reconstruction: a systematic review and metaanalysis of outcomes for quadriceps tendon autograft versus bone-patellar tendon-bone and hamstringtendon autografts. Am J Sports Med. 2019;47(14):3531-3540. doi:10.1177/03635465188253 40
15. Dai W, Leng X, Wang J, Cheng J, Hu X, Ao Y. Quadriceps tendon autograft versus bone-patellar tendon-bone and hamstring tendon autografts for anterior cruciate ligament reconstruction: A systematic review and meta-analysis. Am J Sports Med 2021;50(12):3425-3439. doi:10.1177/036354652
11030259
16. Cohen D, Slawaska-Eng D, Almasri M, Sheean A, de Sa D Quadricep ACL reconstruction techniques and outcomes: an updated ccoping review of the quadricep tendon. Curr Rev Musculoskelet Med 2021;14(6):462-474. doi:10.1007/s12178-021-09726-3
17. Lind M, Strauss MJ, Nielsen T, Engebretsen L. Quadriceps tendon autograft for anterior cruciate ligament reconstruction is associated with high revision rates: results from the Danish Knee Ligament Registry Knee Surg Sports Traumatol Arthrosc 2020;28(7):2163-2169. doi:10.1007/s0016
7-019-05751-5
International Journal of Sports Physical Therapy
Graft-Specific Surgical and
Considerations for Anterior Cruciate Ligament Reconstruction with the.
and Rehabilitation
18. Lind M, Strauss MJ, Nielsen T, Engebretsen L. Low surgical routine increases revision rates after quadriceps tendon autograft for anterior cruciate ligament reconstruction: results from the Danish Knee Ligament Reconstruction Registry Knee Surg Sports Traumatol Arthrosc 2021;29(6):1880-1886. do i:10.1007/s00167-020-06220-0
19. Ollivier M, Jacquet C, Pailhe R, Cognault J, Cavaignac E, Seil R. Higher re-rupture rate in quadriceps tendon ACL reconstruction surgeries performed in Denmark: let’s return to the mean. Knee Surg Sports Traumatol Arthrosc 2020;28(11):3655-3656. doi:10.1007/s00167-020-059 61-2
20. Schmücker M, Haraszuk J, Hölmich P, Barfod KW Graft failure, revision ACLR, and reoperation rates after ACLR with quadriceps tendon versus hamstring tendon autografts: a registry study with review of 475 patients. Am J Sports Med. 2021;49(8):2136-2143. do i:10.1177/03635465211015172
21. Harris NL, Smith DAB, Lamoreaux L, Purnell M. Central quadriceps tendon for anterior cruciate ligament reconstruction. Part I: morphometric and biomechanical evaluation. Am J Sports Med 1997;25(1):23-28. doi:10.1177/036354659702500105
22. Hadjicostas PT, Soucacos PN, Berger I, Koleganova N, Paessler HH. Comparative analysis of the morphologic structure of quadriceps and patellar tendon: a descriptive laboratory study Arthroscopy 2007;23(7):744-750. doi:10.1016/j.arthro.2007.01.032
23. Adams DJ, Mazzocca AD, Fulkerson JP Residual strength of the quadriceps versus patellar tendon after harvesting a central free tendon graft. Arthroscopy. 2006;22(1):76-79. doi:10.1016/j.arthro.2 005.10.015
24. Shani RH, Umpierez E, Nasert M, Hiza EA, Xerogeanes J. Biomechanical comparison of quadriceps and patellar tendon grafts in anterior cruciate ligament reconstruction. Arthroscopy 2016;32(1):71-75. doi:10.1016/j.arthro.2015.06.051
25. Musahl V, Engler ID, Nazzal EM, et al. Current trends in the anterior cruciate ligament part II: evaluation, surgical technique, prevention, and rehabilitation. Knee Surg Sports Traumatol Arthrosc. 2022;30(1):34-51. doi:10.1007/s00167-021-06825-z
26. Waligora AC, Johanson NA, Hirsch BE. Clinical anatomy of the quadriceps femoris and extensor apparatus of the knee. Clin Orthop Relat Res 2009;467(12):3297-3306. doi:10.1007/s11999-009-10
52-y
27 Grob K, Manestar M, Filgueira L, Ackland T, Gilbey H, Kuster MS. New insight in the architecture of the quadriceps tendon. J Exp Orthop 2016;3(1):32. doi:10.1186/s40634-016-0068-y
28. Mehran N, Damodar D, Shu Yang J. quadriceps tendon autograft in anterior cruciate ligament reconstruction. J Am Acad Orthop Surg 2020;28(2):45-52. doi:10.5435/jaaos-d-19-00032
29. Nebelung W, Becker R, Urbach D, Röpke M, Roessner A. Histological findings of tendon-bone healing following anterior cruciate ligament reconstruction with hamstring grafts. Arch Orthop Trauma Surg 2003;123(4):158-163. doi:10.1007/s004 02-002-0463-y
30. Otsuka H, Ishibashi Y, Tsuda E, Sasaki K, Toh S. Comparison of three techniques of anterior cruciate ligament reconstruction with bone-patellar tendonbone graft. Differences in anterior tibial translation and tunnel enlargement with each technique. Am J Sports Med. 2003;31(2):282-288. doi:10.1177/0363546 5030310022101
31. Rodeo SA, Kawamura S, Kim HJ, Dynybil C, Ying L. Tendon healing in a bone tunnel differs at the tunnel entrance versus the tunnel exit: an effect of graft-tunnel motion? Am J Sports Med 2006;34(11):1790-1800. doi:10.1177/03635465062900 59
32. Schuette HB, Kraeutler MJ, Houck DA, McCarty EC. Bone-patellar tendon-bone versus hamstring tendon autografts for primary anterior cruciate ligament reconstruction: a systematic review of overlapping meta-analyses. Orthop J Sports Med. 2017;5(11):2325967117736484. doi:10.1177/23259671 17736484
33. Johnston PT, Feller JA, McClelland JA, Webster KE. Knee strength deficits following anterior cruciate ligament reconstruction differ between quadriceps and hamstring tendon autografts. Knee Surg Sports Traumatol Arthrosc 2021;30(4):1300-1310. doi:10.100 7/s00167-021-06565-0
34. Johnston PT, McClelland JA, Feller JA, Webster KE. Knee muscle strength after quadriceps tendon autograft anterior cruciate ligament reconstruction: systematic review and meta-analysis. Knee Surg Sports Traumatol Arthrosc 2021;29(9):2918-2933. do i:10.1007/s00167-020-06311-y
35. Thaunat M, Fayard JM, Sonnery-Cottet B. Hamstring tendons or bone-patellar tendon-bone graft for anterior cruciate ligament reconstruction? Orthopaedics & Traumatology: Surgery & Research. 2019;105(1):S89-S94. doi:10.1016/j.otsr.2018.05.014
International Journal of Sports Physical Therapy
Graft-Specific Surgical
Considerations for Anterior Cruciate Ligament Reconstruction with the.
36. Herrington L, Wrapson C, Matthews M, Matthews H. Anterior cruciate ligament reconstruction, hamstring versus bone–patella tendon–bone grafts: a systematic literature review of outcome from surgery. Knee 2005;12(1):41-50. doi:10.1016/j.knee.2004.02.0 03
37 Bourke HE, Gordon DJ, Salmon LJ, Waller A, Linklater J, Pinczewski LA. The outcome at 15 years of endoscopic anterior cruciate ligament reconstruction using hamstring tendon autograft for ‘isolated’ anterior cruciate ligament rupture. J Bone Joint Surg Br 2012;94-B(5):630-637 doi:10.1302/030
1-620x.94b5.28675
38. Smith AH, Capin JJ, Zarzycki R, Snyder-Mackler L. Athletes with bone-patellar tendon-bone autograft for anterior cruciate ligament reconstruction were slower to meet rehabilitation milestones and returnto-sport criteria than athletes with hamstring tendon autograft or soft tissue allograft : secondary analysis from the ACL-SPORTS trial. J Orthop Sports Phys Ther 2020;50(5):259-266. doi:10.2519/jospt.2020.911
39. Brinlee AW, Dickenson SB, Hunter-Giordano A, Snyder-Mackler L. ACL reconstruction rehabilitation: clinical data, biologic healing, and criterion-based milestones to inform a return-to-sport guideline. Sports Health 2021;14(5):770-779. doi:10.1177/19417 381211056873
40. Hunnicutt JL, Slone HS, Xerogeanes JW Implications for early postoperative care after quadriceps tendon autograft for anterior cruciate ligament reconstruction: a technical note. J Athl Train 2020;55(6):623-627 doi:10.4085/1062-6050-17
2-19
41. Zhang K, Beshay T, Murphy B, Sheean A, de SA D Quadriceps tendon anterior cruciate ligament reconstruction: A systematic review of postoperative rehabilitation and complication profiles. Arthroscopy 2021;38(6):2062-2072. doi:10.1016/j.arthro.2021.12.0 20
42. Woo SLY, Debski RE, Withrow JD, Janaushek MA. Biomechanics of knee ligaments. Am J Sports Med 1999;27(4):533-543. doi:10.1177/03635465990270042 301
43. Schilaty ND, Martin RK, Ueno R, Rigamonti L, Bates NA. Mechanics of cadaveric anterior cruciate ligament reconstructions during simulated jump landing tasks: lessons learned from a pilot investigation. Clin Biomech. 2021;86:105372. doi:10.1 016/j.clinbiomech.2021.105372
44. Strauss MJ, Miles JW, Kennedy ML, et al. Full thickness quadriceps tendon grafts with bone had similar material properties to bone-patellar tendonbone and a four-strand semitendinosus grafts: a biomechanical study Knee Surg Sports Traumatol Arthrosc 2022;30(5):1786-1794. doi:10.1007/s0016 7-021-06738-x
45. Hamner DL, Brown CH, Steiner ME, Hecker AT, Hayes WC. Hamstring tendon grafts for reconstruction of the anterior cruciate ligament: biomechanical evaluation of the use of multiple strands and tensioning techniques. J Bone Joint Surg Am. 1999;81(4):549-557. doi:10.2106/00004623-1999 04000-00013
46. Stäubli HU, Schatzmann L, Brunner P, Rincón L, Nolte LP. Mechanical tensile properties of the quadriceps tendon and patellar ligament in young adults. Am J Sports Med 1999;27(1):27-34. doi:10.117 7/03635465990270011301
47. Magnussen RA, Taylor DC, Toth AP, Garrett WE. ACL graft failure location differs between allografts and autografts. Sports Med Arthrosc Rehabil Ther Tech 2012;4(1):22. doi:10.1186/1758-2555-4-22
48. Arruda EM, Calve S, Dennis RG, Mundy K, Baar K. Regional variation of tibialis anterior tendon mechanics is lost following denervation. J Appl Physiol 2006;101(4):1113-1117 doi:10.1152/japplphy siol.00612.2005
49. Thomopoulos S, Birman V, Genin GM, eds. Structural Interfaces and Attachments in Biology Springer New York; 2013. doi:10.1007/978-1-4614-33 17-0
50. Arakgi ME, Burkhart TA, Hoshino T, Degen R, Getgood A. Biomechanical comparison of three suspensory techniques for all soft tissue central quadriceps tendon graft fixation. Arthrosc Sports Med Rehabil 2022;4(3):e843-e851. doi:10.1016/j.asmr.202 1.12.008
51. Baxter FR, Bach JS, Detrez F, et al. Augmentation of bone tunnel healing in anterior cruciate ligament grafts: application of calcium phosphates and other materials. J Tissue Eng 2010;1(1):712370. doi:10.406 1/2010/712370
52. Ma Y, Murawski CD, Rahnemai-Azar AA, Maldjian C, Lynch AD, Fu FH. Graft maturity of the reconstructed anterior cruciate ligament 6 months postoperatively: a magnetic resonance imaging evaluation of quadriceps tendon with bone block and hamstring tendon autografts. Knee Surg Sports Traumatol Arthrosc. 2015;23(3):661-668. doi:10.1007/ s00167-014-3302-0
1
Graft-Specific Surgical and Rehabilitation Considerations for Anterior Cruciate Ligament Reconstruction with the. International Journal of Sports Physical Therapy
Graft-Specific Surgical and Rehabilitation Considerations for Anterior Cruciate Ligament Reconstruction with the.
53. Slone HS, Romine SE, Premkumar A, Xerogeanes JW. Quadriceps tendon autograft for anterior cruciate ligament reconstruction: a comprehensive review of current literature and systematic review of clinical results. Arthroscopy 2015;31(3):541-554. doi:10.101 6/j.arthro.2014.11.010
54. Crum RJ, Kay J, Lesniak BP, Getgood A, Musahl V, de SA D. Bone versus all soft tissue quadriceps tendon autografts for anterior cruciate ligament reconstruction: a systematic review. Arthroscopy. 2021;37(3):1040-1052. doi:10.1016/j.arthro.2020.10.0 18
55. Singh H, Glassman I, Sheean A, Hoshino Y, Nagai K, de SA D. Less than 1% risk of donor-site quadriceps tendon rupture post-ACL reconstruction with quadriceps tendon autograft: a systematic review Knee Surg Sports Traumatol Arthrosc 2022;31(2):572-585. doi:10.1007/s00167-022-07175-0
56. Theut PC, Fulkerson JP, Armour EF, Joseph M. Anterior cruciate ligament reconstruction utilizing central quadriceps free tendon. Orthop Clin North Am 2003;34(1):31-39. doi:10.1016/s0030-5898(02)0006 8-8
57 DeAngelis JP, Fulkerson JP Quadriceps Tendon—A reliable alternative for reconstruction of the anterior cruciate ligament. Clin Sports Med. 2007;26(4):587-596. doi:10.1016/j.csm.2007.06.005
58. Lu H, Chen C, Xie S, Tang Y, Qu J. Tendon healing in bone tunnel after human anterior cruciate ligament reconstruction: a systematic review of histological results. J Knee Surg 2019;32(05):454-462. doi:10.1055/s-0038-1653964
59. Heijne A, Werner S. Early versus late start of open kinetic chain quadriceps exercises after ACL reconstruction with patellar tendon or hamstring grafts: a prospective randomized outcome study Knee Surg Sports Traumatol Arthrosc 2007;15(4):472-473. d oi:10.1007/s00167-007-0313-0
60. Yamasaki S, Hashimoto Y, Han C, Nishino K, Hidaka N, Nakamura H. Patients with a quadriceps tendon shorter than 60 mm require a patellar bone plug autograft in anterior cruciate ligament reconstruction. Knee Surg Sports Traumatol Arthrosc 2021;29(6):1927-1935. doi:10.1007/s00167-020-0626
1-5
61. Yuksel Y, Kose O, Torun E, Ergun T, Yardibi F, Sarikcioglu L. Estimating the adequacy of the free quadriceps tendon autograft length using anthropometric measures in anterior cruciate ligament reconstruction. Arch Orthop Trauma Surg. 2021;142(8):2001-2010. doi:10.1007/s00402-021-041
97-0
62. Kim SJ, Jo SB, Kumar P, Oh KS. Comparison of single- and double-bundle anterior cruciate ligament reconstruction using quadriceps tendon–bone autografts. Arthroscopy. 2009;25(1):70-77. doi:10.101 6/j.arthro.2008.09.004
63. Kanakamedala AC, de Sa D, Obioha OA, et al. No difference between full thickness and partial thickness quadriceps tendon autografts in anterior cruciate ligament reconstruction: a systematic review. Knee Surg Sports Traumatol Arthrosc. 2019;27(1):105-116. doi:10.1007/s00167-018-5042-z
64. Farahmand F, Sejiavongse W, Amis AA. Quantitative study of the quadriceps muscles and trochlear groove geometry related to instability of the patellofemoral joint. J Orthop Res 1998;16(1):136-143. doi:10.1002/jor.1100160123
65. Huleatt J, Gottschalk M, Fraser K, et al. Risk Factors for manipulation under anesthesia and/or lysis of adhesions after anterior cruciate ligament reconstruction. Orthop J Sports Med. 2018;6(9):2325967118794490. doi:10.1177/232596711 8794490
66. Jasty N, Cook D, Liotta E, Hayworth B. Perioperative complications and early clinical outcomes following ACL reconstruction with soft tissue quadriceps tendon autograft in adolescent athletes. Orthop J Sports Med 2021;9(7). doi:10.1177/ 2325967121s00223
67. Haley RM, Lamplot JD, Myer GD, et al. Localized anterior arthrofibrosis after soft-tissue quadriceps tendon anterior cruciate ligament reconstruction is more common in patients who are female, undergo meniscal repair, and have grafts of larger diameter Arthroscopy. Published online December 2022. doi:1 0.1016/j.arthro.2022.11.027
68. Schwery NA, Kiely MT, Larson CM, et al. Quadriceps strength following anterior cruciate ligament reconstruction: normative values based on sex, graft type and meniscal status at 3, 6 & 9 months. Int J Sports Phys Ther. 2022;17(3). doi:10.266 03/001c.32378
69. Han HS, Seong SC, Lee S, Lee MC. Anterior cruciate ligament reconstruction: quadriceps versus patellar autograft. Clin Orthop Relat Res. 2008;466(1):198-204. doi:10.1007/s11999-007-0015-4
70. Fukuda H, Ogura T, Asai S, et al. Bone-patellar tendon–bone autograft maturation is superior to double-bundle hamstring tendon autograft maturation following anatomical anterior cruciate ligament reconstruction. Knee Surg Sports Traumatol Arthrosc 2022;30(5):1661-1671. doi:10.1007/s0016
7-021-06653-1
International Journal of Sports Physical Therapy
71. Ma Y, Murawski CD, Rahnemai-Azar AA, Maldjian C, Lynch AD, Fu FH. Graft maturity of the reconstructed anterior cruciate ligament 6 months postoperatively: a magnetic resonance imaging evaluation of quadriceps tendon with bone block and hamstring tendon autografts. Knee Surg Sports Traumatol Arthrosc. 2015;23(3):661-668. doi:10.1007/ s00167-014-3302-0
72. Scranton PE Jr, Lanzer WL, Ferguson MS, Kirkman TR, Pflaster DS. Mechanisms of anterior cruciate ligament neovascularization and ligamentization. Arthroscopy 1998;14(7):702-716. doi:10.1016/s074 9-8063(98)70097-0
73. Michel PA, Domnick C, Raschke MJ, et al. Soft tissue fixation strategies of human quadriceps tendon grafts: a biomechanical study. Arthroscopy. 2019;35(11):3069-3076. doi:10.1016/j.arthro.2019.0 5.025
74. Shelbourne KD, Gray T Minimum 10-year results after anterior cruciate ligament reconstruction: how the loss of normal knee motion compounds other factors related to the development of osteoarthritis after surgery Am J Sports Med 2009;37(3):471-480. d oi:10.1177/0363546508326709
75. Letter M, Beauperthuy A, Parrino RL, et al. Association between neuromuscular variables and graft harvest in soft tissue quadriceps tendon versus bone-patellar tendon-bone anterior cruciate ligament autografts. Orthop J Sports Med 2021;9(10). doi:10.1177/23259671211041591
76. Weaver A, Ness BM, Roman DP, et al. Short-term isokinetic and isometric strength outcomes after anterior cruciate ligament reconstruction in adolescents. Phys Ther Sport. 2022;53:75-83. doi:10.1 016/j.ptsp.2021.11.009
77 Hasegawa S, Kobayashi M, Arai R, Tamaki A, Nakamura T, Moritani T Effect of early implementation of electrical muscle stimulation to prevent muscle atrophy and weakness in patients after anterior cruciate ligament reconstruction. J Electromyogr Kines 2011;21(4):622-630. doi:10.1016/ j.jelekin.2011.01.005
78. Hamada T, Kimura T, Moritani T Selective fatigue of fast motor units after electrically elicited muscle contractions. J Electromyogr Kines 2004;14(5):531-538. doi:10.1016/j.jelekin.2004.03.008
79. Mendonça GO, Severino MLB, Oliveira KM de, et al. The effect of neuromuscular electrical stimulation in association with whey protein supplementation after anterior cruciate ligament reconstruction. Acta Ortop Bras 2021;29(6):316-322. doi:10.1590/1413-78
5220212906237983
80. Charles D, White R, Reyes C, Palmer D A systematic review of the effects of blood flow restriction training on quadriceps muscle atrophy and circumference post ACL reconstruction. Int J Sports Phys Ther 2020;15(6):882-891. doi:10.26603/ij spt20200882
81. Hauger AV, Reiman MP, Bjordal JM, Sheets C, Ledbetter L, Goode AP. Neuromuscular electrical stimulation is effective in strengthening the quadriceps muscle after anterior cruciate ligament surgery Knee Surg Sports Traumatol Arthrosc 2018;26(2):399-410. doi:10.1007/s00167-017-4669-5
82. Hughes L, Rosenblatt B, Paton B, Patterson SD Blood flow restriction training in rehabilitation following anterior cruciate ligament reconstructive surgery: a review. Techn Orthop. 2018;33(2):106-113. doi:10.1097/bto.0000000000000265
83. Kilgas MA, Lytle LLM, Drum SN, Elmer SJ. Exercise with blood flow restriction to improve quadriceps function long after ACL reconstruction. Int J Sports Med 2019;40(10):650-656. doi:10.1055/ a-0961-1434
84. Escamilla RF, Macleod TD, Wilk KE, Paulos L, Andrews JR. Anterior cruciate ligament strain and tensile forces for weight-bearing and non-weightbearing exercises: a guide to exercise selection. J Orthop Sports Phys Ther 2012;42(3):208-220. doi:10.2 519/jospt.2012.3768
85. Wang C, Qiu J, Wang Y, et al. Loaded openkinetic-chain exercises stretch the anterior cruciate ligament more than closed-kinetic-chain exercises: In-vivo assessment of anterior cruciate ligament length change. Musculoskelet Sci Pract 2023;63:102715. doi:10.1016/j.msksp.2022.102715
86. Beynnon BD, Fleming BC. Anterior cruciate ligament strain in-vivo: A review of previous work. J Biomech 1998;31(6):519-525. doi:10.1016/s0021-929 0(98)00044-x
87 Lu H, Chen C, Xie S, Tang Y, Qu J. Tendon healing in bone tunnel after human anterior cruciate ligament reconstruction: A systematic review of histological results. J Knee Surg 2019;32(05):454-462. doi:10.1055/s-0038-1653964
88. Perriman A, Leahy E, Semciw AI. The effect of open- versus closed-kinetic-chain exercises on anterior tibial laxity, strength, and function following anterior cruciate ligament reconstruction: a systematic review and meta-analysis. J Orthop Sports Phys Ther 2018;48(7):552-566. doi:10.2519/jospt.201
8.7656
Graft-Specific Surgical and Rehabilitation Considerations for Anterior Cruciate Ligament Reconstruction with the. International Journal of Sports Physical Therapy
Graft-Specific Surgical and Rehabilitation Considerations for Anterior Cruciate Ligament Reconstruction with the.
89. Khan R, Konyves A, Rama KRBS, Thomas R, Amis AA. RSA can measure ACL graft stretching and migration. Clin Orthop Relat Res 2006;448:139-145. d oi:10.1097/01.blo.0000224016.42669.17
90. Morgan CD, Kalmam VR, Grawl DM. Isometry testing for anterior cruciate ligament reconstruction revisited. Arthroscopy 1995;11(6):647-659. doi:10.101 6/0749-8063(95)90104-3
91. Ishibashi Y, Rudy TW, Livesay GA, Stone JD, Fu FH, Woo SLY The effect of anterior cruciate ligament graft fixation site at the tibia on knee stability: evaluation using a robotic testing system. Arthroscopy 1997;13(2):177-182. doi:10.1016/s0749-8 063(97)90152-3
92. Brand J, Weiler A, Caborn DNM, Brown CH, Johnson DL. Graft fixation in cruciate ligament reconstruction. Am J Sports Med. 2000;28(5):761-774. doi:10.1177/03635465000280052501
93. Kraeutler MJ, Wolsky RM, Vidal AF, Bravman JT Anatomy and biomechanics of the native and reconstructed anterior cruciate ligament: surgical implications. J Bone Joint Surg 2017;99(5):438-445. d oi:10.2106/jbjs.16.00754
94. Powers CM, Chen YJ, Scher IS, Lee TQ Multiplane loading of the extensor mechanism alters the patellar ligament force/quadriceps force ratio. J Biomech Eng. 2010;132(2). doi:10.1115/1.4000852
95. Sprague A, Epsley S, Silbernagel KG. Distinguishing quadriceps tendinopathy and patellar tendinopathy: semantics or significant? J Orthop Sports Phys Ther 2019;49(9):627-630. doi:10.2519/jos pt.2019.0611
96. Chiu LZF, Daehlin TE. Three-dimensional modelling of human quadriceps femoris forces. J Biomech. 2021;120:110347. doi:10.1016/j.jbiomech.20
21.110347
97 Xu J, Hug F, Fu SN. Stiffness of individual quadriceps muscle assessed using ultrasound shear wave elastography during passive stretching. J Sport Health Sci 2018;7(2):245-249. doi:10.1016/j.jshs.201
6.07.001
98. Maeo S, Saito A, Otsuka S, Shan X, Kanehisa H, Kawakami Y Localization of muscle damage within the quadriceps femoris induced by different types of eccentric exercises. Scand J Med Sci Sports. 2018;28(1):95-106. doi:10.1111/sms.12880
99. Rio E, van Ark M, Docking S, et al. Isometric contractions are more analgesic than isotonic contractions for patellar tendon pain. Clin J Sport Med 2017;27(3):253-259. doi:10.1097/jsm.000000000
0000364
100. Enocson AG, Berg HE, Vargas R, Jenner G, Tesch PA. Signal intensity of MR-images of thigh muscles following acute open- and closed chain kinetic knee extensor exercise – index of muscle use. Eur J Appl Physiol 2005;94(4):357-363. doi:10.1007/s00421-00
5-1339-y
101. McGinty G, Irrgang JJ, Pezzullo D Biomechanical considerations for rehabilitation of the knee. Clin Biomech 2000;15(3):160-166. doi:10.1016/s0268-003 3(99)00061-3
102. McCormick BT, Hannon JC, Newton M, Shultz B, Detling N, Young WB. The effects of frontal- and sagittal-plane plyometrics on change-of-direction speed and power in adolescent female basketball players. Int J Sports Physiol Perform 2016;11(1):102-107. doi:10.1123/ijspp.2015-0058
103. Schache AG, Lai AKM, Brown NAT, Crossley KM, Pandy MG. Lower-limb joint mechanics during maximum acceleration sprinting. J Exp Biol 2019;1. d oi:10.1242/jeb.209460
104. Schache AG, Blanch PD, Dorn TW, Brown NAT, Rosemond D, Pandy MG. Effect of running speed on lower limb joint kinetics. Med Sci Sports Exerc. 2011;43(7):1260-1271. doi:10.1249/mss.0b013e31820 84929
105. Mendiguchia J, Alentorn-Geli E, Idoate F, Myer GD Rectus femoris muscle injuries in football: a clinically relevant review of mechanisms of injury, risk factors and preventive strategies. Br J Sports Med. 2013;47(6):359-366. doi:10.1136/bjsports-2012-0912 50
106. Webster KE, Feller JA. Expectations for return to preinjury sport before and after anterior cruciate ligament reconstruction. Am J Sports Med 2019;47(3):578-583. doi:10.1177/0363546518819454
107 Ardern CL, Taylor NF, Feller JA, Webster KE. Fifty-five per cent return to competitive sport following anterior cruciate ligament reconstruction surgery: an updated systematic review and metaanalysis including aspects of physical functioning and contextual factors. Br J Sports Med. 2014;48(21):1543-1552. doi:10.1136/bjsports-2013-0
93398
108. Webster KE, Feller JA, Leigh WB, Richmond AK. Younger patients are at increased risk for graft rupture and contralateral injury after anterior cruciate ligament reconstruction. Am J Sports Med. 2014;42(3):641-647 doi:10.1177/0363546513517540
109. Webster KE, Feller JA. Exploring the high reinjury rate in younger patients undergoing anterior cruciate ligament reconstruction. Am J Sports Med 2016;44(11):2827-2832. doi:10.1177/03635465166518 45
International Journal of Sports Physical Therapy
110. Paterno MV, Rauh MJ, Schmitt LC, Ford KR, Hewett TE. Incidence of second ACL injuries 2 years after primary ACL reconstruction and return to sport. Am J Sports Med. 2014;42(7):1567-1573. doi:10.1177/ 0363546514530088
111. Grindem H, Snyder-Mackler L, Moksnes H, Engebretsen L, Risberg MA. Simple decision rules can reduce reinjury risk by 84% after ACL reconstruction: the Delaware-Oslo ACL cohort study Br J Sports Med 2016;50(13):804-808. doi:10.1136/bjsports-2016-096 031
112. Gokeler A, Dingenen B, Hewett TE. Rehabilitation and return to sport testing after anterior cruciate ligament reconstruction: where are we in 2022? Arthrosc Sports Med Rehabil 2022;4(1):e77-e82. doi:10.1016/j.asmr.2021.10.025
113. Blucher NC, Feller JA, Devitt BM, et al. Is there an association in young patients between quadriceps or hamstring strength after ACL reconstruction and graft rupture? Orthop J Sports Med. 2022;10(6):232596712211010. doi:10.1177/232596712 21101003
114. Bodkin SG, Hertel J, Diduch DR, et al. Predicting anterior cruciate ligament reinjury from return-toactivity assessments at 6 months postsurgery: a prospective cohort study. J Athl Train. 2022;57(4):325-333. doi:10.4085/1062-6050-0407.20
115. Marigi EM, Hale RF, Bernard CD, et al. Are 6-month functional and isokinetic testing measures risk factors for second anterior cruciate ligament injuries at long term follow-up? J Knee Surg 2022;10:2022. doi:10.1055/s-0042-1748824
116. King E, Richter C, Daniels KAJ, et al. Biomechanical but not strength or performance measures differentiate male athletes who experience ACL reinjury on return to Level 1 sports. Am J Sports Med 2021;49(4):918-927 doi:10.1177/036354652098
8018
117 Sousa PL, Krych AJ, Cates RA, Levy BA, Stuart MJ, Dahm DL. Return to sport: Does excellent 6-month strength and function following ACL reconstruction predict midterm outcomes? Knee Surg Sports Traumatol Arthrosc 2017;25(5):1356-1363. do i:10.1007/s00167-015-3697-2
118. Ithurburn MP, Altenburger AR, Thomas S, Hewett TE, Paterno MV, Schmitt LC. Young athletes after ACL reconstruction with quadriceps strength asymmetry at the time of return-to-sport demonstrate decreased knee function 1 year later Knee Surg Sports Traumatol Arthrosc. 2018;26(2):426-433. doi:10.1007/s00167-017-4678-4
119. Cristiani R, Mikkelsen C, Edman G, Forssblad M, Engström B, Stålman A. Age, gender, quadriceps strength and hop test performance are the most important factors affecting the achievement of a patient-acceptable symptom state after ACL reconstruction. Knee Surg Sports Traumatol Arthrosc 2020;28(2):369-380. doi:10.1007/s00167-019-05576-2
120. Hetsroni I, Wiener Y, Ben-Sira D, et al. Symmetries in muscle torque and landing kinematics are associated with maintenance of sports participation at 5 to 10 years after ACL reconstruction in young men. Orthop J Sports Med 2020;8(6). doi:10.1177/2325967120923267
121. Markström JL, Naili JE, Häger CK. A minority of athletes pass symmetry criteria in a series of hop and strength tests irrespective of having an ACL reconstructed knee or being noninjured. Sports Health 2022;15(1):45-51. doi:10.1177/194173812210 97949
122. Webster KE, Hewett TE. What is the evidence for and validity of return-to-sport testing after anterior cruciate ligament reconstruction surgery? a systematic review and meta-analysis. Sports Med 2019;49(6):917-929. doi:10.1007/s40279-019-01093-x
123. Kaplan Y, Witvrouw E. When is it safe to return to sport after ACL reconstruction? reviewing the criteria. Sports Health 2019;11(4):301-305. doi:10.11 77/1941738119846502
124. Yung KK, Ardern CL, Serpiello FR, Robertson S. Characteristics of complex systems in sports injury rehabilitation: examples and implications for practice. Sports Med Open. 2022;8(1):24. doi:10.1186/ s40798-021-00405-8
125. Dingenen B, Gokeler A. Optimization of the return-to-sport paradigm after anterior cruciate ligament reconstruction: A critical step back to move forward. Sports Med 2017;47(8):1487-1500. doi:10.10 07/s40279-017-0674-6
126. Shrier I. Strategic assessment of risk and risk tolerance (StARRT) framework for return-to-play decision-making. Br J Sports Med. 2015;49(20):1311-1315. doi:10.1136/bjsports-2014-0 94569
127. Shrier I. return to sport decision-based models. In: Return to Sport after ACL Reconstruction and Other Knee Operations Springer International Publishing; 2019:53-65. doi:10.1007/978-3-030-22361-8_4
128. Creighton DW, Shrier I, Shultz R, Meeuwisse WH, Matheson GO return-to-play in sport: a decision-based model. Clin J Sport Med. 2010;20(5):379-385. doi:10.1097/jsm.0b013e3181f3c0 fe
Graft-Specific Surgical and Rehabilitation Considerations for Anterior Cruciate Ligament Reconstruction with the. International Journal of Sports Physical Therapy
129. Yung KK, Ardern CL, Serpiello FR, Robertson S. A framework for clinicians to improve the decisionmaking process in return to sport. Sports Med Open 2022;8(1):52. doi:10.1186/s40798-022-00440-z
130. Bodkin SG, Rutherford MH, Diduch DR, Brockmeier SF, Hart JM. How much time is needed between serial “return to play” assessments to achieve clinically important strength gains in patients recovering from anterior cruciate ligament reconstruction? Am J Sports Med. 2020;48(1):70-77. d oi:10.1177/0363546519886291
131. Bodkin SG, Hertel J, Bruce AS, et al. Patient function in serial assessments throughout the postACL reconstruction progression. Phys Ther Sport. 2021;47:85-90. doi:10.1016/j.ptsp.2020.11.025
132. Meredith SJ, Rauer T, Chmielewski TL, et al. Return to sport after anterior cruciate ligament injury: panther symposium ACL injury return to sport consensus group. Orthop J Sports Med 2020;8(6):232596712093082. doi:10.1177/2325967120
930829
133. Solie B, Kiely M, Doney C, Schwery N, Jones J, Bjerke B. Return to elite-level basketball after surgical reconstruction of the anterior cruciate ligament and medial collateral ligament of the knee with meniscal repairs– it takes teamwork and time to restore performance: a case report. J Orthop Sports Phys Ther Cases. 2022;2(4):1-22.
134. Beischer S, Gustavsson L, Senorski EH, et al. Young athletes who return to sport before 9 months after anterior cruciate ligament reconstruction have a rate of new injury 7 times that of those who delay return. J Orthop Sports Phys Ther 2020;50(2):83-90. d oi:10.2519/jospt.2020.9071
135. Martin RK, Wastvedt S, Pareek A, et al. Machine learning algorithm to predict anterior cruciate ligament revision demonstrates external validity Knee Surg Sports Traumatol Arthrosc. 2022;30(2):368-375. doi:10.1007/s00167-021-0682 8-w
136. Marmura H, Getgood AMJ, Spindler KP, Kattan MW, Briskin I, Bryant DM. Validation of a risk calculator to personalize graft choice and reduce rupture rates for anterior cruciate ligament reconstruction. Am J Sports Med 2021;49(7):1777-1785. doi:10.1177/036354652110107 98
137 Czamara A, Krzemińska K, Widuchowski W, Dragan SL. The muscle strength of the knee joint after ACL reconstruction depends on the number and frequency of supervised physiotherapy visits. Int J Environ Res Public Health. 2021;18(20):10588. doi:1 0.3390/ijerph182010588
138. Franck F, Saithna A, Vieira TD, et al. Return to sport composite test after anterior cruciate ligament reconstruction (K-STARTS): factors affecting return to sport test score in a retrospective analysis of 676 patients. Sports Health 2021;13(4):364-372. doi:10.11 77/1941738120978240
139. Edwards PK, Ebert JR, Joss B, et al. Patient characteristics and predictors of return to sport at 12 months after anterior cruciate ligament reconstruction: the importance of patient age and postoperative rehabilitation. Orthop J Sports Med 2018;6(9):232596711879757 doi:10.1177/2325967118 797575
140. Johnson JL, Capin JJ, Arundale AJH, Zarzycki R, Smith AH, Snyder-Mackler L. A secondary injury prevention program may decrease contralateral anterior cruciate ligament injuries in female athletes: 2-year injury rates in the ACL-SPORTS randomized controlled trial. J Orthop Sports Phys Ther. 2020;50(9):523-530. doi:10.2519/jospt.2020.9407
141. Arundale AJH, Capin JJ, Zarzycki R, Smith AH, Snyder-Mackler L. Two year ACL reinjury rate of 2.5%: outcomes report of the men in a secondary ACL injury prevention program (ACL-SPORTS). Int J Sports Phys Ther. 2018;13(3):422-431. doi:10.26603/ijspt201 80422
142. Buckthorpe M. Optimising the late-stage rehabilitation and return-to-sport training and testing process after ACL reconstruction. Sports Med 2019;49(7):1043-1058. doi:10.1007/s40279-019-0110
2-z
143. Taberner M, Allen T, Cohen DD. Progressing rehabilitation after injury: consider the ‘controlchaos continuum.’ Br J Sports Med. 2019;53(18):1132-1136. doi:10.1136/bjsports-2018-1 00157
144. Bahr R. Why screening tests to predict injury do not work—and probably never will…: a critical review. Br J Sports Med 2016;50(13):776-780. doi:10.1136/bjs ports-2016-096256
145. Pappas E, Nightingale EJ, Simic M, Ford KR, Hewett TE, Myer GD Do exercises used in injury prevention programmes modify cutting task biomechanics? A systematic review with metaanalysis. Br J Sports Med 2015;49(10):673-680. doi:1 0.1136/bjsports-2014-093796
146. Lopes TJA, Simic M, Myer GD, Ford KR, Hewett TE, Pappas E. The effects of injury prevention programs on the biomechanics of landing tasks: a systematic review with meta-analysis. Am J Sports Med 2018;46(6):1492-1499. doi:10.1177/0363546517
716930
Graft-Specific Surgical and Rehabilitation Considerations for Anterior Cruciate Ligament Reconstruction with the. International Journal of Sports Physical Therapy
147 Thompson-Kolesar JA, Gatewood CT, Tran AA, et al. Age influences biomechanical changes after participation in an anterior cruciate ligament injury prevention program. Am J Sports Med. 2018;46(3):598-606. doi:10.1177/0363546517744313
148. Dix C, Arundale A, Silvers-Granelli H, Marmon A, Zarzycki R, Snyder-Mackler L. Biomechanical changes during a 90o cut in collegiate female soccer players with participation in the 11+. Int J Sports Phys Ther 2021;16(3). doi:10.26603/001c.22146
149. Huang YL, Jung J, Mulligan CMS, Oh J, Norcross MF. A majority of anterior cruciate ligament injuries can be prevented by injury prevention programs: a systematic review of randomized controlled trials and cluster–randomized controlled trials with metaanalysis. Am J Sports Med 2020;48(6):1505-1515. do i:10.1177/0363546519870175
Graft-Specific Surgical and Rehabilitation Considerations for Anterior
Ligament Reconstruction with the. International Journal of Sports Physical Therapy
Cruciate
Teare-Ketter A, Ebert J, Todd H. The Implementation of a Return-to-Play Protocol with Standardized Physical Therapy Referrals in a Collegiate Football Program: PT’s Role in Return-to-Play, A Clinical Commentary. IJSPT. Published online April 1, 2023:513-525. doi:10.26603/001c.73074
Commentary/Current Concept Review
The Implementation of a Return-to-Play Protocol with Standardized Physical Therapy Referrals in a Collegiate Football Program: PT’s Role in Return-to-Play, A Clinical Commentary
Andrew Teare-Ketter, PT, DPT, NCS1,2a , Jeffrey Ebert, PT, DPT, OCS3 , Hunter Todd, PT, DPT, OCS, SCS1
1
Physical Therapy
and
Rehabilitation, Atrium Health Floyd, 2 Mercer University, 3 Department of Physical Therapy, Mercer University
Keywords: concussion, return-to-play, football, dual-task, concussion rehabilitation https://doi.org/10.26603/001c.73074
International Journal of Sports Physical Therapy
Sport-related concussions (SRCs) are multi-faceted injuries requiring coordinated care for return-to-play (RTP). Although the number of concussions in collegiate football is increasing annually, there is poor standardization among RTP protocols. Recent evidence suggests there is an increased risk of lower extremity injury, neuropsychiatric consequences, and re-injury after SRC, and risk factors for a prolonged recovery from SRC have also been identified. Evidence demonstrates a faster RTP and improved outcomes with early physical therapy intervention; however, this is not yet common practice in the treatment of acute SRC.
There is little guidance available on the development and implementation of a multidisciplinary RTP rehabilitation protocol for SRC that incorporates standardized physical therapy By describing an evidence-based RTP protocol with standardized physical therapy management, and measures taken to implement this protocol, this clinical commentary aims to identify steps in treating SRC that can be used to improve recovery. The purpose of this commentary is to: a) survey the current state of standardization of RTP protocols in collegiate football; b) highlight the development and implementation of a RTP protocol with standardized physical therapy referral and management in an NCAA Division II collegiate football program; and c) describe results of a full-season pilot study, including time to evaluation, time to RTP, rate of re-injury or lower extremity injury, and the clinical significance of protocol implementation.
Level of Evidence
Level V
BACKGROUND AND INTRODUCTION
Sport-Related Concussion (SRC) has become a frequent topic of discussion in the sports medicine world. Collegiate football is often the focal point of this discussion due to the high relative risk of SRC. A recent epidemiologic study of SRCs in National Collegiate Athletic Association (NCAA) sports indicated that men’s football has the highest annual rate of SRCs and the highest annual increase in the number of SRCs compared to other collegiate sports,1 with 26.1% of players in a collegiate football program experiencing a con-
cussion at some point in their careers.2 Moreover, nearly 10% of SRCs in collegiate football are recurrent injuries.1 Concussions affect multiple body systems and can physically, cognitively, and psychologically impact a studentathlete. After a concussion, athletes also may face a higher risk of lower extremity injury3 and potential long-term cognitive and neuropsychological consequences.4
To improve concussion management in collegiate athletics, the NCAA implemented a policy in 2010 that addressed the need for a concussion management plan for member institutions. That plan includes removal from play for medical examination of any athlete exhibiting concus-
Corresponding Author:
Andrew L Teare-Ketter, PT, DPT, NCS
Concussion Rehabilitation Program, Division of Sports Medicine, Department of Physical Therapy and Rehabilitation, Atrium Health
Floyd, Rome, Georgia, USA
304 Shorter Ave #101, Rome, GA, 30165
Fax: (706) 292-7209
Phone: (404) 642-3943
Email: andrew.teareketter@atriumhealth.org
Clinical
a
sion-related symptoms, preclusion of return-to-play (RTP) for any athlete diagnosed with a concussion, and medical clearance to resume play following a concussion diagnosis.5 There was an increase in the number of diagnosed concussions in collegiate football following the implementation of this policy,2 highlighting the need for sensitive testing and quality rehabilitation protocols. The lack of sensitive measures for diagnosis and readiness to RTP can ultimately lead to premature RTP. Baugh et al. studied 730 collegiate football players and found that for every diagnosed concussion, there were 4.125 undiagnosed concussions in an athlete’s career, on average.6 Furthermore, a five-year, retrospective study by Carson et al. found that 43.5% of SRCs returned to play too soon.7
SRCs are challenging to manage due to the underlying pathophysiology A rapid change in intracranial velocity results in axonal shearing and cerebral edema creating metabolic changes and reduced cerebral blood flow.8 Force directed to the head and neck area can also create cervical spine soft tissue, articular, and ligamentous damage,9 resulting in varying symptoms, recovery times, and clinical trajectories. Presentations can differ greatly amongst athletes, but deficits can include vestibular and ocular impairments, musculoskeletal and cervical impairments, impairments in sensory integration, deficits in motor control, as well as autonomic dysfunction and exertional intolerance.10,11
SRCs are most commonly managed by team athletic trainers (ATCs) and team physicians (MDs).12,13 However, it has been demonstrated that physical therapy can effectively address impairments related to SRC.10 Authors have demonstrated that individuals post-concussion who received individualized physical therapy were 3.91 times more likely to be cleared to RTP after eight weeks,10 and athletes receiving individualized physical therapy within 10-days post-concussion are medically cleared for RTP significantly faster 14 Both cervical and vestibular rehabilitation are recommended by the 5th Consensus Statement of Concussion in Sport13 and pre-morbid risk factors and post-injury prognosticators identifying athletes that are at risk for a prolonged recovery have been established.15,16 Despite this, referral to physical therapy following SRC is frequently at the discretion of team ATCs and MDs as needed for complex vestibular and/or cervical issues or for athletes with persistent symptoms.13
When considering return-to-learn (RTL), improved clarity is also advantageous. The 5th Consensus Statement of Concussion in Sport presents a recommended four-step return-to-school strategy if needed13; however, outside of this recommendation, it provides no definitive criteria for academic accommodations or stepwise progression, the timing of stepwise progression, or multi-disciplinary involvement in addressing cognitive deficits. Although prolonged and complete cognitive rest has been shown to delay recovery,17 Carson et al. found that 44.7% of athletes with SRCs returned to full academic participation too soon, and findings from the Ivy League-Big Ten Epidemiology Study show that athletes who return to full academics too soon take longer to recover from SRC and that improved clarity
in the timing of RTL is warranted.7,18 Authors have suggested that impairments in working memory and attentional control can also lead to impairments in lower extremity motor control.19 However, these domains can be improved with targeted interventions, including physical therapy.19
Despite current efforts to better understand and manage SRCs, concussions remain one of the most complex injuries in sports-medicine, making it difficult to identify and implement best practices for a standardized RTP protocol. To develop a protocol that best serves the student-athlete, it is important to understand the landscape of RTP protocols as well as current, evidence-based concussion rehabilitation. Enhancing existing RTP protocols with recently available evidence can reduce premature RTP, improve rehabilitation effectiveness, and expedite recovery for athletes at risk for persistent symptoms.
With the changing landscape of RTP protocols and SRC management, the purpose of this clinical commentary is three-fold: to a) survey the current state of standardization of RTP protocols in collegiate football; b) highlight the development and implementation of a RTP protocol with standardized physical therapy referral and management in an NCAA Division II collegiate football program; and c) describe results of a full-season pilot study, including time to evaluation, time to RTP, rate of re-injury or lower extremity injury, and the clinical significance of protocol implementation. It is hoped that this commentary will aid in the strengthening of RTP protocols by demonstrating the benefit of increased and standardized physical therapy management in RTP. This study has been approved by the Mercer University Institutional Review Board.
CURRENT STANDARDIZATION OF RETURN-TOPLAY PROTOCOLS
Along with the NCAA’s updated policy regarding SRCs, position statements have been published by several professional organizations with recommendations for SRC management. The most recent Consensus Statement by the Concussion in Sport Group, 2017, presents an updated return-to-sport strategy consisting of a graduated six-step rehabilitation protocol.13 Recommendations for the recognition of a concussion, sideline evaluation and re-evaluation of a concussion, and removal from and reintroduction to play are also discussed.
The National Athletic Training Association (NATA) released a position statement in 2014 with notable recommendations including documentation of an athlete’s concussion evaluation and progression through a RTP protocol, baseline pre-season examinations that include neurocognitive and balance measures for high-risk sports, diagnosis reached by clinical examination and assessment tools, and treatment of athletes on an individual basis.12 The NCAA has also presented a Concussion Safety Protocol Checklist and Concussion Safety Protocol Template to serve as a guide in the development and standardization of RTP protocols.20 The checklist recommends pre-season education presented to athletes, pre-season assessment of concussion
International Journal of Sports Physical Therapy
The Implementation of a Return-to-Play Protocol with Standardized Physical Therapy Referrals in a Collegiate Football.
history, symptom evaluation, cognitive evaluation, and balance evaluation. A six-step return-to-sport plan is also required.
In 2015, Kerr et al.21 performed a cross-sectional investigation of concussion-related protocols and pre-season assessments that involved all 1,113 NCAA member institutions via surveys sent to all head ATCs. Despite the recommendations for standardized concussion management, results demonstrated that the adherence to recommendations vary by policy and division. Most, but not all, institutions provided concussion education to athletes (95.4%) and had RTP policies (96.6%), while fewer had RTL policies (63.3%).21 Only 83.2% of institutions utilized pre-season neurocognitive testing and only 56.6% incorporated balance assessments.21 The adherence to NATA recommendations also differed by division, with 55.2% of Division I programs complying with baseline measure recommendations compared to 38.2% and 36.1% of Division II and Division III institutions, respectively 21
In 2017, Buckley et al. evaluated the concussion management plans of all 65 Power Five NCAA institutions for compliance with the NCAA’s 2010 concussion policy.22 The overall compliance was 94.3% but varied greatly in detail and length, with one institution only complying with 59.6% of components. The lowest domain for institutional compliance was return-to-learn, with only 86.4% of components addressed. Although the overall compliance rate was high, there continues to be room for improvement.22
Both the consensus statement by the 5th CISG and the NCAA’s Concussion Safety Protocol Checklist recommend referral for multi-discipline management but not until symptoms become “persistent,”13,20 despite evidence that individualized and early onset of physical therapy intervention reduces recovery time and risk for persistent symptoms.10,14 Furthermore, to the authors’ knowledge, there is no literature describing the standardization of concussion rehabilitation or referral to physical therapy within collegiate football.
The variability in RTP policies between schools and divisions can be due to multiple factors, including but not limited to differing education levels, institutional support or financial limitations, or access to medical professionals, including physical therapists specializing in SRC management. However, universities and health care providers need to continue to adapt current policies with current evidence that better protect and serve student-athletes.
RETURN-TO-PLAY PROTOCOL
The implemented RTP protocol, described below, involving multi-disciplinary care from time of injury to full clearance, was developed utilizing recommendations from the 5th CISG consensus statement and NCAA Safety Protocol Checklist, and meets compliance with NCAA legislation. The protocol includes objective baseline neuromotor and neurocognitive testing, standardized sideline assessments, and a six-step RTP progression incorporating individualized physical therapy treatment. Evidence-based risk fac-
tors for prognostication were utilized at the time of injury to standardize referral to physical therapy.
It is important to note that the team athletic trainers, team physician, physical therapists, and speech-language pathologist were contracted from a local hospital system and were not university employees. Team ATCs were located within the university’s athletic facility; however, a sports-medicine fellowship-trained physician and physical therapist specialized in concussion management were based in satellite clinics off campus. Educational inservices were provided among disciplines to ensure the proper use of assessments and outcome measures for standardization of care.
BASELINE ASSESSMENTS
All athletes participated in pre-season physical examinations before being cleared to participate. Baseline neurocognitive performance and baseline symptoms were assessed via the Immediate Post-Concussion and Cognitive Testing (ImPACT) battery 23 It has been demonstrated that the ImPACT test battery has a low to moderate test-retest reliability with up to a 26% rate of purposeful underperformance by athletes23; therefore, a multimodal objective assessment is advantageous to assess readiness to RTP Evidence demonstrates that individuals who are post-concussion have impaired postural stability and sensory integration compared to non-concussed individuals. Therefore, objective baseline assessments of neuromotor function were performed.12,24
A four-condition Clinical Test of Integration in Balance (CTSIB) was performed utilizing a dynamic force plate to gather objective data on baseline postural stability and sensory integration. It has been shown that athletes with a history of concussion can demonstrate clinical deficits in balance long after the initial injury25; therefore, baseline norms were utilized as reference during RTP. Standard deviations for sway values on all four conditions in collegiate athletes were gathered in a study by Moran et al. and were utilized as a second comparison during recovery post-injury 26 The mBESS was not recorded due to concerns over ceiling effects.27 Education regarding symptoms and risks of SRC and the purpose of RTP protocol was also provided during pre-season physicals.
SIDELINE ASSESSMENT OF INJURY
To increase the sensitivity of clinical diagnosis, ATCs were educated on standardized sideline assessments of vestibular function, including the Vestibular Ocular Motor Screening (VOMS) and modified Concussion Balance Test (mCOBALT), to be performed in conjunction with the Sport Concussion Assessment Tool (SCAT-5). Sideline evaluations also incorporated the assessment of evidence-based negative prognosticators and/or risk factors for a prolonged recovery from SRC. These assessments served as a framework for referral to skilled PT, as athletes identified as at-risk for a prolonged recovery by the ATC and MD were referred to skilled PT.
The
a Return-to-Play
Standardized Physical
in a Collegiate Football. International Journal of Sports Physical Therapy
Implementation of
Protocol with
Therapy Referrals
of Injury
The VOMS briefly screens vestibulo-ocular and oculomotor function and sensitivity The VOMS can be used to aid in diagnosis of concussion with any item scored ≥ 2 in sensitivity increasing diagnostic accuracy of a concussion by 46%.10 The addition of the VOMS has been demonstrated to significantly increase the overall sensitivity and diagnostic capability of the SCAT-5.28 To further assess balance if needed, ATCs were educated on the use of the mCOBALT, which is a four-minute exam derived from the CTSIB and is more sensitive in identifying concussion-related neuromotor impairment than the mBESS due to increased vestibular demand.29 On average, only 55% of concussed athletes can complete the exam due to symptom provocation or loss of balance in comparison to 100% of non-concussed athletes.29
A decision tree was implemented for ATC use during sideline evaluation to identify athletes who are at risk of prolonged recovery from SRC according to evidence-based negative prognosticators post-concussion and/or risk factors (Figure 1). Pre-morbid risk factors include a history of previous concussion, migraines or familial history of migraines, history of anxiety and/or depression, Attention Deficient Disorder (ADD) or Attention Deficit/Hyperactivity Disorder (ADHD), female gender, and age less than18 years.30–32 Athletes with any risk factors have a 35-69% increased risk of recovery greater than 21 days.30

Post-injury negative prognosticators include on-field dizziness, acute vestibulo-ocular abnormalities, post-traumatic migraine, or high initial symptom burden.30,33,34 Those with reports of on-field dizziness have a six-fold increase in risk for a recovery >21 days.34 The Vestibular Ocular Motor Screen can also be utilized to identify the risk of prolonged recovery in collegiate athletes.33 An abnormal score of ≥2 on smooth pursuits, horizontal and vertical sac-
cades, or near-point convergence has been associated with a longer time to RTP 33
PHYSICIAN EVALUATION
To reduce the time from sideline assessment to clinical evaluation by the team physician and physical therapist, a communication portal was created between the ATC, MD, PT, and physical therapy office staff. Once a concussion was suspected, the ATC notified the MD to begin clinical management. It was also communicated by the ATC and MD if an athlete was considered a candidate for skilled PT to coordinate care with the physical therapist. If the MD was able to examine the athlete at the time of injury and deemed PT appropriate due to the risk of a protracted recovery, a referral to PT was placed to aid in the onset of early PT intervention.
The goal was to allow for MD and PT clinical evaluations to be performed within 48 and 96 hours of acute injury Education on the pathology of concussion, symptoms, recovery trajectory, and RTP protocol was provided during evaluation. Each athlete was educated on limiting cognitive strain, visual strain including phone and computer use, and exertion during the first 48 to 72 hours post-injury Education on RTL guidelines was also provided during MD evaluation, as described in detail below
PHYSICAL THERAPY EVALUATION AND MANAGEMENT
Physical therapy evaluation assessed constructs in agreement with the American Physical Therapy Association’s clinical practice guideline on concussion management and was directed by each athlete’s presentation.10 Subjective evaluation investigated current symptoms, level of sensi-
Figure 1. Decision Tree for Sideline Examination
The Implementation of a Return-to-Play Protocol with Standardized Physical Therapy Referrals in a Collegiate Football. International Journal of Sports Physical Therapy
tivity, individual functional goals, and the Post-Concussion Symptom Scale. Objective assessments for vestibular and vestibulo-ocular function, cervical spine integrity, exertional tolerance, and neuromotor function were performed, guided by an athlete’s symptom sensitivity
A Vestibular Ocular Motor Screen was performed to assess for vestibulo-ocular dysfunction. The VOMS incorporates five vestibulo-ocular and oculomotor domains: smooth pursuit, horizontal and vertical saccades, nearpoint convergence distance, horizontal vestibular ocular reflex (VOR), and visual motion sensitivity (VMS) and has an excellent internal consistency (α = .92)11 This was not compared to sideline performance of the VOMS, which was used to aid in diagnosis, but utilized to identify vestibulo-ocular impairments and sensitivities for guided treatment.
A Motion Sensitivity Quotient (MSQ) was also performed if motion sensitivity was subjectively reported or suspected. The MSQ is designed to identify and measure motion-provoked dizziness via 16 rapid body or head movements and was used clinically to develop an individualized exercise program for motion habituation.35 Both vestibulo-ocular and motion sensitivities were incorporated into later stages of rehabilitation via sport-related movements and drills. If room-spinning vertigo was reported, a screen for benign positional vertigo (BPV), including the Dix-Hallpike Test and Supine Roll Test, was performed for posterior/anterior and horizontal canal BPV, respectively.36
If motion sensitivity or gaze instability was reported, a vestibular head impulse test (HIT) was performed to screen for peripheral vestibular hypofunction. A HIT directly assesses the vestibular-ocular response from the peripheral vestibular system as the clinician rapidly and unpredictably turns the athlete’s head during visual fixation to assess instantaneous corrective eye movements.37 With vestibular hypofunction, the eyes move with the head during an unexpected head turn and must make a corrective movement to re-fix on the target, indicating impaired vestibulo-ocular response gain.
Cervical spine range of motion, accessory mobility, and soft tissue palpation were examined along with assessments for potential cervicogenic headache, cervicogenic dizziness, cervico-ocular dysfunction, and/or motor control impairments. The Cervical Flexion-Rotation test investigates cervicogenic headache and dizziness related to the first and second cervical facet joints by maximally flexing and rotating the upper cervical spine. Provocation of headache or dizziness with upper cervical approximation is considered positive (Sn: 0.91, Sp: 0.90).38 Cervico-ocular dysfunction was assessed via the Smooth-Pursuit Neck Torsion Test, which compares the oculomotor performance and sensitivity of smooth pursuits in neutral and in 45 degrees of rotation. Increased sensitivity and the presence of nystagmus with cervical rotation can indicate upper cervicalrelated oculomotor dysfunction (Sn: 0.90, So: 0.91). 39 Cervical joint position error was investigated if impairments in soft tissue mobility, cervical accessory mobility, or motor control were demonstrated. Cervical joint position error was assessed via the cervical joint relocation test, which
utilizes a cervical laser harness to identify the degree of position error and cervical sensorimotor disturbances.39
A post-injury objective CTSIB was performed for comparison to baseline data of balance and sensory integration, with symptom provocation also recorded. An mCOBALT test was not performed at the time of clinical evaluation as this was utilized as a part of the sideline examination to aid in diagnostic sensitivity An mCOBALT was performed, however, prior to discharge to ensure no neuromotor impairment or vestibular sensitivities arose with more sensitive vestibular demands on balance.
To assess for autonomic dysfunction and/or exertional intolerance, a Buffalo Concussion Exercise Treadmill Test (BCTT) was performed.40 The BCTT gradually increases the intensity of exercise via treadmill incline while vitals and symptoms are assessed every one to two minutes. The test is discontinued if the athlete reaches voluntary exhaustion or if post-concussion symptoms are exacerbated.40 Heart rate was recorded at the onset or exacerbation of symptoms, which is considered the athlete’s heart rate threshold (HRT). If motion sensitivity was identified during vestibular examination, a modified Buffalo Concussion Bike Test (BCBT) was performed on an upright exercise bike to increase test specificity by accounting for potential increases in dizziness from a vertical translation during ambulation.
An individualized home exercise program was prescribed including interventions for cervical spine soft tissue mobility, cervical motor control, and vestibular habituation and/ or adaptation. Graded aerobic exercise beginning less than 10 days post-injury has been associated with a faster RTP41; therefore, daily sub-symptom aerobic cardiovascular exercise was prescribed utilizing the established HRT Both the ATC and MD were informed of an athlete’s impairments, exercise program, and estimated prognosis for recovery.
Athletes continued individualized skilled physical therapy through stage three of the stepwise progression. Frequency was determined by impairments and severity Interventions could include exercises for cervical spine motor control and proprioception, vestibular adaptation and/or habituation, exertional tolerance, and cervical vestibular ocular integration. Interventions also incorporated dual motor and cognitive task practice throughout all stages. All exercises incorporating vestibular or vestibulo-ocular tasks were performed at an intensity that provoked light to moderate dizziness (4-6 out of 10), or below migraine symptom provocation. Once moderate dizziness was achieved, the athlete was instructed to rest until symptoms returned to baseline to promote vestibular habituation.42 Athletes continued to receive updated exercise programs reflecting their current RTP stage to be performed individually and supervised by ATCs.
STEPWISE RETURN-TO-PLAY
All athletes progressed through a six-step protocol as recommended from the 5th Concussion in Sport Group (CISG) meeting13 (Table 1), supervised by the ATC and PT under direction of the team MD. Stage zero began at the time of injury and included rest for the first 24-48 hours. Athletes then progressed to stage one which included vestibular and
The Implementation of a Return-to-Play Protocol with Standardized Physical Therapy Referrals in a Collegiate Football. International Journal of Sports Physical Therapy
Table 1. Stepwise Return-to-Play Protocol
Stage Description Activity
0 Rest Rest from non-ADL related physical exertion and cognitive strain for first 48 hours
1 Graded Exercise Symptom-dependent* graded aerobic and body weight exercise and vestibular and/or cervical interventions
Goal for advancement
• 48 hours post-injury
• Performance of 15 minutes of aerobic cardiovascular exercise at 70% heart rate max without symptom provocation
2 Sport Related Exercise Dynamic body weight exercise with increased vestibular†, vestibuloocular‡, and/or cervical proprioceptive§ demand
• Completion of sport-related, body weight exercise workout without symptom provocation
• No symptoms at rest or with completion of readiness assessment or sport-related drills#
3 Sport Related Drills
Introduction of weighted exercise focusing on sport-specific movements and explosion; performance of position-specific drills†† with increased vestibular, vestibulo-ocular, and cervical proprioceptive demand with cognitive and motor dual task practice**
4 Return to training Full practice participant
5 Return to play Full return to athletic competition
*Aerobic exercise should not exacerbate symptoms and is progressed daily as tolerated by symptoms
• Lower extremity kinematics within normal limits with sport-related movement and cognitive dual task**
• ImPACT, CTSIB, mCOBALT within normal limits
• Fully returned-to-learn without headache, cognitive impairments, or cognitive fatigue
• No symptoms at rest, with full practice participation, or within 24 hours of practice participation
† Increased vertical and horizontal body movement and/or head movements, performed at an intensity below onset of moderate dizziness (4/10 to 6/10) to promote habituation
‡ Performance of ocular smooth pursuits, saccades, vestibulo-ocular gaze stability, convergence activities, and vestibulo-ocular cancellation
§ Increased cervical rotation and/or flexion and extension to one or both sides depending on involved cervical segments
** Sport-related tasks performed with memory retrieval, multiple/alternating motor tasks, or tasks dependent upon cues with time constraints
†† Dependent upon position, i.e. three-point stance and rush, pass/run block, backpedal, route running, drop back and scramble, side shuffle – performed with increased body movement, vestibulo-ocular tasks, cervical range of motion dependent upon individual sensitivities
# Readiness assessment includes performance of 10 minutes moderate aerobic cardiovascular exercise, 10 minutes high intensity anaerobic cardiovascular exercise, 10-15 minutes sport-related body weight and weighted exercise, and 15 minutes sport/position-related drills with cognitive dual task
ImPACT: Immediate Post-Concussion Assessment and Cognitive Testing
CTSIB: Clinical Test of Sensory Integration in Balance
mCOBALT: Modified Concussion Balance Test
cervical exercises provided by a physical therapist and subsymptom aerobic conditioning guided by HRT identified via the BCTT or BCBT, if exertional intolerance and HRT were found.10 During each physical therapy session, athletes performed supervised aerobic cardiovascular exercise utilizing a treadmill or stationary bike and gradually increased their HR until either a new HRT was established or 70% HR max was achieved. Athletes could then progress to sport-related exercise (Stage 2 of RTP) with achievement of 70% HR max without symptom provocation and no symptoms at rest.
Stage 2 added sport-related body weight exercise, dynamic movement, and running drills supervised by the PT or ATC. Once athletes were able to perform sport-related exercise at moderate intensity (HR 70-80% HR max) with-
out symptom provocation, they progressed to Stage 3, which incorporated non-contact sport-related rills, resistance training, and increased anaerobic demands. Both sport-related exercise and non-contact sport-related drills emphasized position-specific movements and vestibular, vestibulo-ocular, and cervical sensitivities specific to the athlete. A focal point of physical therapy intervention was the incorporation of dual motor and/or cognitive tasks throughout RTP progression.
Dual task is considered the performance of simultaneous motor or cognitive tasks.43 During open sports, such as football, athletes must regulate both internal processes (e.g., joint position sense, vestibular/ocular function) and respond to external cues (e.g., the ball, opponents, teammates) in order to modify movement and perform the in-
The Implementation of a Return-to-Play Protocol with Standardized Physical Therapy Referrals in a Collegiate Football. International Journal of Sports Physical Therapy
tended motor task such as running, cutting, blocking, catching, or tackling.19 The execution of these dual tasks occurs in time-constrained environments necessitating increased processing speed, reaction time, and working memory, all of which may be impaired post-concussion and can remained impaired after clearance to RTP.44,45 Impairments in these cognitive domains post-concussion have been correlated to abnormal LE kinematics when given a dual motor/cognitive task.44–46
During physical therapy sessions, athletes were tasked to perform sport-related exercise or drills with simultaneous performance of vestibular or vestibulo-ocular tasks. These tasks also incorporated attentional control or working memory with time-constraints for processing speed. Examples are demonstrated in supplemental Videos 1 and 2.
Prior to progressing to stage four, athletes must have demonstrated CTSIB sway data within one standard deviation of baseline and no symptoms or errors with performance of the mCOBALT to ensure neuromotor function within normal limits. Athletes must also have completed a readiness assessment performed by a physical therapist including high intensity aerobic and anaerobic exertion, sport-related exercise, and sport-related drills with dual motor and cognitive tasks (Table 1). Athletic training staff then progressed athletes to full-contact practice and full RTP as appropriate. Prior to participating in contact practice or full play, athletes must have demonstrated ImPACT testing results within normal limits, have fully returned to learn, and have received MD clearance.
RETURN-TO-LEARN
Although the focus of this commentary is on the introduction of standardized PT in RTP, a brief discussion of RTL is also important due to the lack of congruency amongst RTL protocols. To aid in consistency with RTL in this protocol, all athletes who demonstrated risk for a prolonged recovery were placed on a four-step RTL progression by the team MD. The stepwise progression was based upon the graduated RTL strategy recommended by the CISG13 and included: 1) performance of sub-symptom daily activities, 2) performance of school and other cognitive activities as guided by symptoms and beginning 48-72 hours post injury, 3) return to school part-time as advised by the MD, and 4) return to school full-time as advised by the MD or when the athlete can tolerate a modified schedule without symptom exacerbation, whichever occurred first. RTL progression was then communicated to the ATC, school academic counselor, and PT
If appropriate, athletes returned to school part-time at 72 hours post-injury, as it has been suggested that strict rest longer than three days can protract recovery.17 Parttime participation could include partial attendance or shortened class periods, use of paper assignments to reduce visual strain, increased time for test taking, or increased breaks for symptom pacing, up to stage 4 of RTL. Athletes could not graduate from the stepwise progression until fully caught up on classwork and exams.
Table 2. Results
A referral for Speech-Language Pathology (SLP) was recommended if primary symptoms and/or impairments were consistent with the cognitive/fatigue clinical profile as described by Kontos et al.,47 if cognitive strain provoked posttraumatic migraine symptoms, or other cognitive impairments persisted past 10-14 days. Although SLPs are uncommon in traditional concussion management team, speech-language pathology is the second most common referral destination from a specialized concussion clinic, behind physical therapy.48
In the context of concussion management, an SLP examines cognitive processing skills, divided attention, and working memory and provides strategies and skills to aid in active cognitive recovery 48 A communication portal was created including athletic trainers, team physician, and the university academic coordinator in which the SLP would provide insight into cognitive strategies to better individualize the RTL plan. Furthermore, the SLP would communicate to the physical therapist the cognitive domains in which an athlete had deficits, e.g., working memory, divided attention, in order for the PT to incorporate these demands into dual-task interventions.
RESULTS
A pilot study cohort for this approach consisted of 13 athletes who entered the concussion protocol, were identified to be at risk for a prolonged recovery by the team ATCs and MD, and were referred to skilled physical therapy Results of time to MD evaluation, physical therapy evaluation, time to RTP after PT evaluation, and total time to RTP is demonstrated in Table 2 No athlete reported symptom exacerbation following clearance for RTP or full academic participation. Upon completion of the season, data was collected on the rate of re-injury following full RTP with no non-contact lower extremity injuries and one subsequent concussion occurring in the pilot cohort. It is worthwhile to note that there were also no subsequent concussions or LE injuries in any athlete in the cohort in the following football season.
DISCUSSION AND CLINICAL SIGNIFICANCE
The focus of this commentary is to describe the development and potential benefit of standardized physical therapy in a RTP protocol. It is hoped that the incorporation of sensitive sideline measures and evidence-based prognosti-
Timeframe Mean/Median (Days) Injury to MD Evaluation 1.69 Injury to PT Evaluation 4.07 Time to RTP from PT Evaluation 12.93 Total time to RTP 17/15.5 Number of PT Visits 4.54
The Implementation of a Return-to-Play Protocol with Standardized Physical Therapy Referrals in a Collegiate Football. International Journal of Sports Physical Therapy
cation into sideline assessment aided in initiating early-onset individualized PT and improved outcomes. It has been demonstrated that athletes who receive clinical evaluation prior to eight days post injury have a decreased RTP time, with all PT evaluations occurring before this cut-off 33 The introduction of more sensitive diagnostic tools may have also positively affected outcomes by mitigating misdiagnosis, as athletes who suffer a concussion but continue to play are 2.2 times more likely to have a prolonged recovery.49
More notably, all athletes in the pilot group initiated sub-symptom aerobic cardiovascular exercise prior to 10 days post-injury, began vestibular rehabilitation prior to 10 days post-injury, and received individualized vestibular and cervical rehabilitation and sport-related dual-task practice. Prior to discharge, neuromotor performance was assessed and compared to baseline CTSIB data, and athletes completed a PT-supervised readiness-to-return assessment to ensure adequate vestibular function, sensory integration and motor planning, and exertional tolerance. As mentioned above, no athlete had symptom exacerbation after full academic clearance or RTP
Prior to the implementation of the protocol described, no records were kept of athletes’ concussion histories or RTP data by the university’s athletic department or athletic training staff; therefore, it is difficult to assess the improvements in RTP time or re-injury rate compared to previous seasons. However, there are several studies previously reported on concussion recovery in collegiate athletes. A 2021 study by Putukian et al. that included 1,152 collegiate athletes found the average time to full RTP was 20.21 days.50 The United States Air Force Academy also analyzed the recovery of 104 male division 1 collegiate athletes, finding a mean time to full RTP of 20.47 days and an increase in time to RTP for those with the pre-existing risk factor of a previous concussion (1 = 35.9 days, ≥2 = 48.4 days).51
From 2013-2020, a large prospective cohort study was conducted analyzing concussion recovery data from 20 Ivy league and Big Ten Conference institutions.18 With data collected from 1,715 student-athletes, the median time to RTP was 14 days. The largest study conducted by the NCAA included data from 1,751 athletes across 22 academic institutions and reported that the median time to RTP was 12.8 days.52 All studies did report that a history of previous concussions was a risk for a longer recovery However, no study reported data regarding athletes specifically referred to physical therapy The variability of average time to RTP reported throughout the literature is noteworthy. However, despite all athletes in the cohort demonstrating risk for a prolonged recovery > 21 days and seven subjects having a history of one or more previous concussions, the average time of 17 days and median time of 15.5 days to RTP is comparable to larger studies.
Although the authors were unable to compare re-injury risk to previous seasons, it has been established that the risk of sustaining a subsequent concussion is significant, with an odds ratio of 3.73.53 Athletes may also be more likely to sustain a LE injury post-concussion, as Lynall et al. found that athletes are 1.97 times more likely to sustain an acute lower extremity injury within one-year post-con-
cussion.3 As stated previously, there were no non-contact lower extremity injuries in this cohort. One athlete did sustain an ankle injury via another player falling onto the planted lower extremity. Due to the nature of the injury, it is difficult to assess if impaired motor control or motor planning increased the risk of this particular injury. One athlete sustained a second concussion later in the season; however, no athlete in the cohort sustained a subsequent concussion or LE injury in the following season, which is notable considering the increased risk of injury
One athlete was referred to speech-language pathology as the primary symptoms/impairments were of the cognitive/fatigue clinical profile and the athlete demonstrated migraines with partial-school work that persisted longer than 14 days. However, no athlete reported symptom exacerbation with full academic participation.
There are several limitations to this pilot study Firstly, there was no data collected regarding return-to-play, return-to-learn, or rate of post-concussion lower extremity injury prior to the implementation of this protocol, so a direct comparison of pre-implementation and post-implementation statistics is not possible. It is also important to note that three athletes did not return to athletic participation due to their decisions to discontinue play or withdraw from play with the intention to transfer to another university These athletes did participate in skilled physical therapy and completed RTL guidelines, but their RTP data was not included in the study as they did not return to athletic participation. As mentioned above, there was one athlete who sustained a subsequent concussion. This injury occurred during the last week of the season; therefore, the data from the second injury was also not included in the data analysis, as the individual was playing in his final season and not attempting to return to play. These exclusions may have affected the results.
The authors also understand that the cohort involved in the study is very small and hesitate to make major interpretations from the data obtained. However, the authors believe that the results from the first year of protocol implementation and the discussion in this commentary have clinical relevance for collegiate athletic programs nationwide. This study continues to collect data on time to RTP and rate of re-injury with standardized referrals to skilled PT Additional, larger, and multi-center studies are still needed to further examine the outcomes of standardized physical therapy in RTP protocols at the collegiate level.
CONCLUSION
The rate of sport-related concussions in collegiate football continues to increase and emerging data demonstrate that there are neurocognitive and neuromotor impairments that can persist past RTP Professional organizations including the NATA, the NCAA, and the CISG have developed recent policies and recommendations to aid in SRC management; however, there continues to be a lack of continuity between policies amongst collegiate football programs and divisions of competition. Physical therapy management has been proven efficacious in reducing prolonged impairment post-
International Journal of Sports Physical Therapy
The Implementation of a Return-to-Play Protocol with Standardized Physical Therapy Referrals in a Collegiate Football.
concussion and increasing time to RTP, but the inclusion of physical therapy in RTP protocols is not yet common practice.
This commentary presents a RTP protocol that incorporates standardized physical therapy referral and management. Despite all athletes in the associated pilot study cohort having risk factors for prolonged recovery, the results of this protocol as measured in time to RTP are comparable to larger studies. It is also notable that there was only one subsequent concussion and zero non-contact LE injuries in the cohort after two seasons of play. The authors hesitate to make major interpretations from this study due to the
small sample size; however, this commentary demonstrates that the incorporation of standardized PT in RTP is feasible and may be efficacious for athletes at risk for a protracted recovery following SRC.
CONFLICT OF INTEREST
All authors disclose no conflict of interests.
Submitted: July 31, 2022 CDT, Accepted: January 27, 2023 CDT This is an open-access article distributed under the terms of the Creative Commons Attribution 4.0 International License (CCBY-NC-4.0). View this license’s legal deed at https://creativecommons.org/licenses/by-nc/4.0 and legal code at https://creativecommons.org/licenses/by-nc/4.0/legalcode for more information.
The Implementation of a Return-to-Play Protocol with Standardized Physical Therapy Referrals in a Collegiate Football. International Journal of Sports Physical Therapy
REFERENCES
1. Zuckerman SL, Kerr ZY, Yengo-Kahn A, Wasserman E, Covassin T, Solomon GS. Epidemiology of sportsrelated concussion in NCAA athletes from 2009-2010 to 2013-2014: Incidence, recurrence, and mechanisms. Am J Sports Med 2015;43(11):2654-2662. doi:10.1177/03635465155996 34
2. Houck Z, Asken B, Bauer R, Pothast J, Michaudet C, Clugston J. Epidemiology of sport-related concussion in an NCAA division I football bowl subdivision sample. Am J Sports Med 2016;44(9):2269-2275. doi:1 0.1177/0363546516645070
3. Lynall RC, Mauntel TC, Padua DA, Mihalik JP Acute lower extremity injury rates increase after concussion in college athletes. Med Sci Sports Exerc. 2015;47(12):2487-2492. doi:10.1249/mss.0000000000 000716
4. McAllister T, McCrea M. Long-Term Cognitive and neuropsychiatric consequences of repetitive concussion and head-impact exposure. J Athl Train 2017;52(3):309-317. doi:10.4085/1062-6050-52.1.14
5. Baugh CM, Kroshus E. Concussion management in US college football: progress and pitfalls. Concussion 2015;1(1):CNC6. doi:10.2217/cnc.15.6
6. Baugh CM, Kiernan PT, Kroshus E, et al. Frequency of head-impact-related outcomes by position in NCAA division I collegiate football players. J Neurotrauma. 2015;32(5):314-326. doi:10.1089/neu.2 014.3582
7 Carson JD, Lawrence DW, Kraft SA, et al. Premature return to play and return to learn after a sportrelated concussion: physician’s chart review Can Fam Physician. 2014;60(6):e310-e315.
8. Giza CC, Hovda DA. The neurometabolic cascade of concussion. J Athl Train 2001;36(3):228-235.
9. Morin M, Langevin P, Fait P Cervical spine involvement in mild traumatic brain injury: a review. J Sports Med 2016;1590161. doi:10.1155/2016/159016
10. Quatman-Yates CC, Hunter-Giordano A, Shimamura KK, et al. Physical therapy evaluation and treatment after concussion/mild traumatic brain injury. J Orthop Sports Phys Ther. 2020;50(4):CPG1-CPG73. doi:10.2519/jospt.2020.030
11. Mucha A, Collins MW, Elbin RJ, et al. A brief vestibular/ocular motor screening (VOMS) assessment to evaluate concussions: preliminary findings. Am J Sports Med 2014;42(10):2479-2486. do i:10.1177/0363546514543775
12. Broglio SP, Cantu RC, Gioia GA, et al. National Athletic Trainers’ Association position statement: management of sport concussion. J Athl Train 2014;49(2):245-265. doi:10.4085/1062-6050-49.1.07
13. McCrory P, Meeuwisse W, Dvorak J, et al. Consensus statement on concussion in sport—the 5thinternational conference on concussion in sport held in Berlin, October 2016. Br J Sports Med. 2017;51:838-847 doi:10.1136/bjsports-2017-097699
14. Reneker JC, Hassen A, Phillips RS, Moughiman MC, Donaldson M, Moughiman J. Feasibility of early physical therapy for dizziness after a sports-related concussion: A randomized clinical trial. Scand J Med Sci Sports. 2017;27(12):2009-2018. doi:10.1111/sms.1 2827
15. Kontos AP, Elbin RJ, Sufrinko A, Marchetti G, Holland CL, Collins MW. Recovery following sportrelated concussion: Integrating pre- and postinjury factors into multidisciplinary care. J Head Trauma Rehabil. 2019;34(6):394-401. doi:10.1097/htr.0000000 000000536
16. Lau BC, Kontos AP, Collins MW, Mucha A, Lovell MR. Which on-field signs/symptoms predict protracted recovery from sport-related concussion among high school football players? Am J Sports Med 2011;39(11):2311-2318. doi:10.1177/03635465114106 55
17 Buckley TA, Munkasy BA, Clouse BP Acute cognitive and physical rest may not improve concussion recovery time. J Head Trauma Rehabil 2016;31(4):233-241. doi:10.1097/htr.00000000000001 65
18. Wiebe DJ, Bretzin AC, D’Alonzo BA. Progression through return-to-sport and return-to-academics guidelines to concussion management and recovery in collegiate student athletes: findings from the Ivy League-Big Ten epidemiology of concussion study Br J Sports Med. 2022;56(14):801-811. doi:10.1136/bjspo rts-2021-104451
19. Moreira PED, Dieguez GT, Bredt S, Praça GM. The acute and chronic effects of dual-task on the motor and cognitive performances in athletes: a systematic review Int J Environ Res Pub Health 2021;18(4):1732. doi:10.3390/ijerph18041732
1
1
The Implementation of a Return-to-Play Protocol with Standardized Physical Therapy Referrals in a Collegiate Football. International Journal of Sports Physical Therapy
20. NCAA Sports Science Institute. Concussion safety protocol checklist. National Collegiate Athletic Association. Published March 29, 2022. Accessed January 1, 2023. https://ncaaorg.s3.amazonaws.com/s si/concussion/SSI_ConcussionSafetyProtocolChecklis t.pdf
21. Kerr ZY, Snook EM, Lynall RC, et al. Concussionrelated protocols and preparticipation assessments used for incoming student-athletes in National Collegiate Athletic Association member institutions. J Athl Train 2015;50(11):1174-1181. doi:10.4085/106 2-6050-50.11.11
22. Buckley TA, Baugh CM, Meehan WP III, DiFabio MS. Concussion management plan compliance: A study of NCAA power 5 conference schools. Orthop J Sports Med. 2017;5(4):2325967117702606. doi:10.117 7/2325967117702606
23. Gaudet CE, Weyandt LL. Immediate PostConcussion and Cognitive Testing (ImPACT): a systematic review of the prevalence and assessment of invalid performance. Clin Neuropsychol 2017;31(1):43-58. doi:10.1080/13854046.2016.122062
24. Lin LF, Liou TH, Hu CJ, et al. Balance function and sensory integration after mild traumatic brain injury. Brain Inj. 2015;29(1):41-46. doi:10.3109/02699 052.2014.955881
25. Schmidt JD, Terry DP, Ko J, Newell KM, Miller LS. Balance regularity among former high school football players with or without a history of concussion. J Athl Train 2018;53(2):109-114. doi:10.4085/1062-6050-32
6-16
26. Moran RN, Meek J, Allen J, Robinson J. Sex differences and normative data for the m-CTSIB and sensory integration on baseline concussion assessment in collegiate athletes. Brain Inj 2020;34(1):20-25. doi:10.1080/02699052.2019.166982
27 Starling AJ, Leong DF, Bogle JM, Vargas BB. Variability of the modified Balance Error Scoring System at baseline using objective and subjective balance measures. Concussion 2015;1(1):CNC5. doi:1 0.2217/cnc.15.5
28. Ferris LM, Kontos AP, Eagle SR, et al. Predictive accuracy of the Sport Concussion Assessment Tool 3 and Vestibular/Ocular-Motor Screening, individually and in combination: A National Collegiate Athletic Association-Department of Defense concussion assessment, research and education consortium analysis. Am J Sports Med. 2021;49(13):NP66-NP67. d oi:10.1177/0363546520988098
29. Massingale S, Alexander A, Erickson S, et al. Comparison of uninjured and concussed adolescent athletes on the Concussion Balance Test (COBALT). J Neurol Phys Ther. 2018;42(3):149-154. doi:10.1097/np t.0000000000000225
30. Kontos AP, Elbin RJ, Sufrinko A, Marchetti G, Holland CL, Collins MW Recovery following sportrelated concussion: Integrating pre- and postinjury factors into multidisciplinary care. J Head Trauma Rehabil. 2019;34(6):394-401. doi:10.1097/htr.0000000 000000536
31. Scopaz KA, Hatzenbuehler JR. Risk modifiers for concussion and prolonged recovery Sports Health 2013;5(6):537-541. doi:10.1177/1941738112473059
32. Aggarwal SS, Ott SD, Padhye NS, Schulz PE. Sex, race, ADHD, and prior concussions as predictors of concussion recovery in adolescents. Brain Inj. 2020;34(6):811-819. doi:10.1080/02699052.2020.1740 942
33. Whitney SL, Eagle SR, Marchetti G, et al. Association of acute vestibular/ocular motor screening scores to prolonged recovery in collegiate athletes following sport-related concussion. Brain Inj. 2020;34(6):842-847 doi:10.1080/02699052.2020.1755 055
34. Lau BC, Kontos AP, Collins MW, Mucha A, Lovell MR. Which on-field signs/symptoms predict protracted recovery from sport-related concussion among high school football players? Am J Sports Med. 2011;39(11):2311-2318. doi:10.1177/03635465114106 55
35. Akin FW, Davenport MJ. Validity and reliability of the motion sensitivity test. J Rehab Res Develop 2003;40(5):415-422. doi:10.1682/jrrd.2003.09.0415
36. Argaet EC, Bradshaw AP, Welgampola MS. Benign positional vertigo, its diagnosis, treatment and mimics. Clin Neurophys Pract 2019;4:97-111. doi:10.1 016/j.cnp.2019.03.001
37. Halmagyi GM, Chen L, MacDougall HG, Weber KP, McGarvie LA, Curthoys IS. The video head impulse test. Front Neurol. 2017;8:1664-2295. doi:10.3389/fne ur.2017.00258
38. Ogince M, Hall T, Robinson K, Blackmore AM. The diagnostic validity of the cervical flexion–rotation test in C1/2-related cervicogenic headache. Man Ther. 2007;12(3):256-262. doi:10.1016/j.math.2006.06.016
39. L’Heureux-Lebeau B, Godbout A, Berbiche D, Saliba I. Evaluation of paraclinical tests in the diagnosis of cervicogenic dizziness. Otol Neurotol 2014;35(10):1858-1865. doi:10.1097/mao.0000000000 000506
2
4
The Implementation of a Return-to-Play Protocol with Standardized Physical Therapy Referrals in a Collegiate Football. International Journal of Sports Physical Therapy
40. Leddy JJ, Baker JG, Kozlowski K, Bisson L, Willer B. Reliability of a graded exercise test for assessing recovery from concussion. Clin J Sport Med 2011;21(2):89-94. doi:10.1097/jsm.0b013e3181fdc721
41. Leddy JJ, Master CL, Mannix R, et al. Early targeted heart rate aerobic exercise versus placebo stretching for sport-related concussion in adolescents: a randomised controlled trial. Lancet Child Adolesc Health 2021;5(11):792-799. doi:10.101 6/s2352-4642(21)00267-4
42. Hall CD, Herdman SJ, Whitney SL, et al. Vestibular rehabilitation for peripheral vestibular hypofunction: an evidence-based clinical practice guideline. J Neurol Phys Ther. 2016;40(2):124-155. do i:10.1097/npt.0000000000000120
43. Hofheinz M, Mibs M, Elsner B. Dual task training for improving balance and gait in people with stroke. Cochrane Database Syst Rev 2016;2016(10):CD012403. doi:10.1002/14651858.cd01 2403
44. Avedesian JM, Covassin T, Baez S, Nash J, Nagelhout E, Dufek JS. Relationship between cognitive performance and lower extremity biomechanics: implications for sports-related concussion. Orthop J Sports Med 2021;9(8):23259671211032250. doi:10.1177/23259671 211032246
45. Dubose DF, Herman DC, Jones DL, et al. Lower extremity stiffness changes after concussion in collegiate football players. Med Sci Sport Exer 2017;49(1):167-172. doi:10.1249/mss.0000000000001 067
46. Lapointe AP, Nolasco LA, Sosnowski A, et al. Kinematic differences during a jump cut maneuver between individuals with and without a concussion history Int J Psychophysiol 2018;132(Pt A):93-98. do i:10.1016/j.ijpsycho.2017.08.003
47 Kontos AP, Sufrinko A, Sandel N, Emami K, Collins MW. Sport-related concussion clinical profiles: Clinical characteristics, targeted treatments, and preliminary evidence. Curr Sports Med Rep. 2019;18(3):82-92. doi:10.1249/jsr.0000000000000573
48. Ketcham CJ, Bowie M, Buckley TA, Baker M, Patel K, Hall EE. The value of speech-language pathologists in concussion management. Curr Res Concussion 2017;4(1):e8-e13. doi:10.1055/s-0037-160 3645
49. Asken BM, McCrea MA, Clugston JR, Snyder AR, Houck ZM, Bauer RM. “Playing through it”: Delayed reporting and removal from athletic activity after concussion predicts prolonged recovery. J Athl Train. 2016;51(4):329-335. doi:10.4085/1062-6050-51.5.02
50. Putukian M, Riegler K, Amalfe S, Bruce J, Echemendia R. Preinjury and postinjury factors that predict sports-related concussion and clinical recovery time. Clin J Sport Med 2021;31(1):15-22. do i:10.1097/jsm.0000000000000705
51. D’Lauro C, Johnson BR, McGinty G, Allred CD, Campbell DE, Jackson JC. Reconsidering return-toplay times: A broader perspective on recovery. Orthop J Sports Med 2018;6(3):232596711876085. doi:10.117 7/2325967118760854
52. Broglio SP, McAllister T, Katz BP, et al. The natural history of sports-related concussion in collegiate athletes: findings from the NCAA-DoD CARE Consortium. Sports Med. 2022;52(2):403-415. d oi:10.1007/s40279-021-01541-7
53. Reneker JC, Babl R, Flowers MM. History of concussion and risk of subsequent injury in athletes and service members: A systematic review and metaanalysis. Musculoskelet Sci Pract 2019;42:173-185. do i:10.1016/j.msksp.2019.04.004
The Implementation of a Return-to-Play Protocol with Standardized Physical Therapy Referrals in a Collegiate Football. International Journal of Sports Physical Therapy
SUPPLEMENTARY MATERIALS
Video 1
Download: https://ijspt.scholasticahq.com/article/73074-the-implementation-of-a-return-to-play-protocol-withstandardized-physical-therapy-referrals-in-a-collegiate-football-program-pt-s-role-in-return-to/attachment/ 152017.mov?auth_token=_ZtA07FBwFpHlhqCRxaa
Video 2
Download: https://ijspt.scholasticahq.com/article/73074-the-implementation-of-a-return-to-play-protocol-withstandardized-physical-therapy-referrals-in-a-collegiate-football-program-pt-s-role-in-return-to/attachment/ 152599.mov?auth_token=_ZtA07FBwFpHlhqCRxaa
The
Return-to-Play Protocol with Standardized Physical Therapy Referrals in a Collegiate Football. International Journal of Sports Physical Therapy
Implementation of a
Ecological and Specific Evidence-Based Safe Return To Play After Anterior Cruciate Ligament Reconstruction In Soccer Players: A New International Paradigm
Forelli
Coroller
Keywords: anterior cruciate ligament reconstruction, return to play, soccer specific, ecological approach, battery test https://doi.org/10.26603/001c.73031
International Journal of Sports Physical Therapy
Existing return to play (RTP) assessments have not demonstrated the ability to decrease risk of subsequent anterior cruciate ligament (ACL) injury after reconstruction (ACLR). RTP criteria are standardized and do not simulate the physical and cognitive activity required by the practice of sport. Most RTP criteria do not include an ecological approach. There are scientific algorithms as the “5 factor maximum model” that can identify risk profiles and help reduce the risk of a second anterior cruciate ligament injury. Nevertheless, these algorithms remain too standardized and do not include the situations experienced in games by soccer players. This is why it is important to integrate ecological situations specific to the environment of soccer players in order to evaluate players under conditions closest to their sporting activity, especially with high cognitive load. One should identify high risk players under two conditions: Clinical analyses commonly include assessments such as isokinetic testing, functional tests (hop tests, vertical force-velocity, profile), running, clinical assessments (range of motion and graft laxity), proprioception and balance (Star Excursion Balance Test modified, Y-Balance, stabilometry) and psychological parameters (kinesophobia, quality of life and fear of re-injury). Field testing usually includes game simulation, evaluation under dual-task conditions, fatigue and workload analysis, deceleration, timed-agility-test and horizontal force-velocity profiles. Although it seems important to evaluate strength, psychological variables and aerobic and anaerobic capacities, evaluation of neuromotor control in standard and ecological situations may be helpful for reducing the risk of injury after ACLR. This proposal for RTP testing after ACLR is supported by the scientific literature and attempts to approximate the physical and cognitive loads during a soccer match. Future scientific investigation will be required to demonstrate the validity of this approach.
Level of Evidence
5
INTRODUCTION
Anterior cruciate ligament (ACL) injury is one of the most controversial injuries in the world of sports. For example, ACL injury represents only 14% of injuries in soccer,1 but causes physiological and psychological modifications that can compromise the progress and career of soccer players. Forsythe et al. showed that only 71% of injured players return to their previous level within one year after the injury
and only 81% return within three years.2 If the return to the previous level is difficult after an ACL reconstruction (ACLR), it also appears that return to play (RTP), and at high level, can be hampered by a significant number of reinjury, as shown by Della Villa et al.3 The safest possible RTP is a major sporting and economic challenge after ACLR.4
Hence, implementation of functional assessments is important in the return to sport and RTP decisions for soccer players. If the isokinetic assessment, the hop tests and the psychological assessment seem to be gold standards it is
Original Research
Florian
1 a , Nicolas Le
2 , Maxime Gaspar3 , Geoffrey Memain3 , Georgios Kakavas4 , Nicholas Miraglia5 , Patrice Marine1 , Pascal Maille3 , Timothy E Hewett6 , Alexandre JM Rambaud7 1 Orthosport, 2 La Tour Hospital, 3 Clairefontaine Medical Center, 4 Fysiotek Spine & Sports Lab, 5 Miraglia Private Clinic, 6 Marshall University, 7 University Hospital of Saint Etienne
a
Corresponding Author: Florian FORELLI, Orthosport Rehab Center, 16 rue de Paris, 95330 Domont, France, fforelli@capio.fr, +33769495275
Forelli F, Le Coroller N, Gaspar M, et al. Ecological and Specific Evidence-Based Safe Return To Play After Anterior Cruciate Ligament Reconstruction In Soccer Players: A New International Paradigm. IJSPT. Published online April 2, 2023:526-540. doi:10.26603/001c.73031
Table 1. Clinical and Field assessments for RTP after ACLR in soccer players
Running
Graft Laxity Test
Isokinetic Test
Vertical Force – Velocity Profile
Game Simulation
Clinical Assessment
Hop Tests
Proprioception and Balance
Psychological
Field Assessment
Repeated Sprint Ability
Dual Task Work Load during game simulation
Deceleration
Fatigue after game simulation
important to note that these assessments are neither scientifically validated nor capable of predicting the risk of recurrence.5,6 Others authors have highlighted the lack of specificity and ecological situations in soccer player assessment as close as possible to their activity 7–10
It is important to develop ecological tests based on the specific skills of the soccer player and on solid scientific algorithms. Thus, the proposed test sequence is based on the “5 factors maximum model” developed by Hewett et al. aimed at prediction of ACL injury risk11 but also on ecological situations that result from the “11 to perf” assessment developed by Clairefontaine at the FIFA Medical Center The 5-factor maximum model is based on anthropometric, strength and coordination, biomechanics, proprioception and balance, and psychological characteristics.11,12 In addition, it is important to develop quantitative and qualitative tests with reliable and recommended evaluation tools (robotic laximetry, force platforms, etc.). The use of a scientific algorithm predictive of ACL injury that complements the existing tests, while approximating ecological situations, is a clinically relevant means of being able to make a safe decision in the RTP after ACLR in soccer player. Thus, it seems important to us to divide the suggested assessment into two stages (or 2 phases): Clinical using results from standardized tests, and field using results from an ecological situation specific to the soccer player’s environment (Table 1).
THE FIRST STEP: CLINICAL ASSESSMENTS
Before performing a sequence of tests allowing the return to the field, it is necessary to ensure the motor abilities of the patient such as walking without limping, or the return to running.
RUNNING
Running activity during rehabilitation of a patient after ACLR is unfortunately usually not sufficiently addressed.13 Often, running activity is a generic term that includes running in water, in-place running, running on a treadmill (with or without altered gravity), or educational running exercises, jogging, stadium running, trail running… Hence,
Agility Tests
Horizontal Force – Velocity Profile
rehabilitative management should focus on gradually increasing running demands through a continuum of exercises and activities in preparation for sprinting and changing directions (cutting/pivoting).
After ACLR, the return to running can be initiated very early (two months postoperatively) as previously proposed (see Rambaud et al. 2018) and but only with normal clinical criteria (no pain, full range of motion, operationalized knee flexion and extension strength).14
However, in current clinical practice, it is commonly during the fourth postoperative month that most patients are allowed to resume running (from three months postoperatively).13,15 This time frame is proposed to consider the biological processes of integration of the graft into the bone tunnels and the general healing of the knee joint.
Even if running induces little stress on the ACL (and by extension, the same for the graft), it remains a stressful activity for the femorotibial and patellofemoral joints, which can result in altered loading and pain, which is seen as a limp (running with low knee flexion, or with a dynamic valgus).16 A clinical assessment and a test battery seems to be essential to consider the start of running and a running program is initiated according to the patient’s abilities found during these evaluations (e.g. Delaware Interval Running Protocol).17 To ensure optimal loading program, the patient’s voice and her/his opinion will be essential. The use of soreness rules is important to avoid major errors in running training.18
Thus, a dialogue must be established, and the program adjusted according to the different elements with which the patient presents (pain, difficulties, fears). Running progression protocol will be continued until interval running protocol, running at high speed, or even sprinting to prepare for side cutting and pivoting activities and return to sport continuum.19
At the time of return to play, a running assessment on a treadmill is useful to evaluate if the running pattern is correct and symmetric. Indeed, even if lower limb dominance can play on asymmetry, it remains rather weak, particularly on lower limb stiffness (between 0 and 3%). The use of an optoelectrical barrier such as the OptoGait (Microgait, Tours, France) can provide an easy way to automate this assessment. Smartphone applications, such as Runmatic
Ecological and Specific Evidence-Based Safe Return To Play After Anterior Cruciate Ligament Reconstruction In Soccer International Journal of Sports Physical Therapy
(Runmatic App, Dr Carlos Balsalobre-Fernández), can also provide an overview of the symmetry of the gait parameters (lower limb stiffness) with a recording of eight steps.
After a warm-up on the treadmill, a recording of the flight time and the contact time for each step is made during a 30 seconds running sample, at a speed of 12 km.h-1 .
According to the work of Morin et al., the stiffness coefficient of the lower limb (its global compression during the acceptance of the body weight during the phase of singlelimb support) and be estimated.20,21
Therefore, strength asymmetry of less than 10% for RTP is proposed as healthy subjects present a strength asymmetry lower than 5%, and preliminary studies have shown an increase in the risk of injury if the strength asymmetry is higher than 10%.
GRAFT LAXITY TEST
After a normal clinical examination (no pain, full range of motion, no effusion), a test battery can be conducted. Gokeler et al. highlighted the use of a robotic laximeter as a tool to determine one assessment for RTP.22 Too much tibial anterior translation can increase ACL injury risk.22 In addition, graft healing is long time process (approximately 2 years)23 and it is important to be able to assess graft laxity using reliable tools. Lachmann, Pivot Shift, and direct anterior drawer tests are commonly utilized, but robotic laximeter use shows potential for objective data which can inform RTP decisions. A laximeter is a passive test and establishes dynamic elongation curves by comparison of the two knees (Figure 1). The device automatically calculates differential displacement and establishes curve slopes. The cut-off value is the difference of 3 millimeters between the knees24–27 at 134 N for a sensitivity of 70% and a specificity of 99%.27 During RTP assessment, three anterior translations at 250 N can be performed. After examination of the differential at 134 N, the slope differential is assessed. It corresponds to the functional instability risk, which should not exceed 10 μm.N-1 For a result with regard to RTP, we set the differential at 134 Newton to less than or equal to one mm and a slope differential less than five μm.N-1 28–30
ISOKINETIC TESTING
Although strength tests were reported in only 41% of the studies that describe RTP criteria,31 strength assessment, especially of the quadriceps, is of high importance. Quadriceps strength is correlated with i) functional test performance,32,33 ii) self-reported outcomes34,35 and iii) risk of reinjury.36,37
Strength assessments are performed in different modes (isometric, isokinetic: concentric or eccentric) and various angular speeds. If no standardized protocol is used following ACLR,38 most researchers use concentric peak torque of knee extension and flexion at 60°/s, normalized to body weight (PT60/BW).36,37,39–41 The Limb Symmetry Index (LSI) expresses the performance of the operated side as a percentage compared to the contralateral side. The goal is generally to achieve a PT60/BW-LSI greater than 90%36,37,39,42 but these values are rarely acheived.9 Addi-
tionally, the LSI may overestimate the capacities of the operated limb, if the healthy limb is detrained.43 Therefore, clinicians should assess both LSI and reference values.40
The ratio of hamstring and quadriceps peaks (Hamstring /Quadriceps ratio) is not a functional ratio, since it compares peaks appearing at different angles, but it is correlated with the risk of injury 37
The single PT60/BW value analysis could lead to a loss of information, which is why studies should focus on the torque profile specific to the angle of knee flexion,44 in order to improve understanding of the deficits identified, and therefore guide rehabilitation.
Since speed and absorption capacity are necessary for most physical activities, especially when changing direction and jumping,45 Edouard et al. suggest testing using faster speeds and the eccentric isokinetic mode.46 Concentric mode isokinetic assessments cannot assess the differences in rate of force development of the muscles.47
Authors criticize the use of isokinetics for strength assessment because of the gap between this mode of assessment and real life, such as analysis of a single motion in a single plane in contrast to the complexity of sports movements. That movements carried out in an isokinetic manner do not approximate the movements that occur in normal activities (isokinetic speeds described as" fast" do not exceed 300°/s, when certain movements, like sprinting, are performed at a much higher speed). Finally, open kinetic chain testing of muscles usually used in closed chain functional tasks has been discussed.46 Biomechanically, this assessment is the measure of the force couple, in a single plane, which we know to be different in vivo.46
This evaluation nevertheless remains the gold standard, but other methods of evaluating neuromuscular performance are being studied. These methods, like force platforms, are to be more functional.
HOP TESTS
Hop tests are designed to assess lower quarter function after ACLR and other surgeries and condtions. While some authors have shown good methodological quality for these tests, their validity has been challenged. According to Kotsifaki et al., knee performance is better assessed during landing and not during propulsion, particularly on Single Hop Test (SHT).48–51 Similar validity issues are observed on Triple Hop Test (THT), especially during the concentric propulsion phase as there can be hip, pelvis and trunk compensations.50 Thus, according to Kotsifaki et al. the LSI obtained during vertical jumps seems to demonstrate knee function deficits more accurately than horizontal jumps.49 The quantitative measure of the horizontal jumps to represent lower limb systemic performance which is essential for RTP.
For a qualitative assessment, use the qualitative analysis of single leg score (QASLS) to evaluate the landing and provide feedback on knee function.52 Indeed, dynamic valgus associated with an increase in the knee abductor moment constitutes a very important risk factor for ACL re-injury as shown Paterno et al.53 During landing test, Hewett et al. highlights a sensitivity of 77% and a specificity of
Ecological and Specific Evidence-Based Safe Return To Play After Anterior Cruciate Ligament Reconstruction In Soccer International Journal of Sports Physical Therapy
81% when dynamic valgus appears within the initial 10% of landing.11
Before a more ecological evaluation, the authors recommend assessing the knee on horizontal (SHT, THT), vertical (Single Leg Vertical Jump) and multidirectional (30 cm Side Hop Test, Cross Over) directions. According to the literature, the LSI must be at 90% and the QASLS < 1 in search of an increase in the knee abductor moment.37,52–54

Furthermore, it is important to be able to determine plyometric qualities and coordination in bipedal and unipedal modes (Table 2). Regarding coordination, assessment with the countermovement jump (CMJ) and Abalkov Test can offer information. A difference greater than 6 cm must be found in order to determine good coordination. Regarding plyometric qualities, it is important to perform both the squat jump (SJ) and drop vertical jump (DVJ). The difference should not be below 6 cm. A difference that exceeds 10 cm demonstrates good plyometric qualities. Plyometrics are an essential asset in ACL re-injury prevention.55–57 With the DVJ, we can also calculate the reactive strength index (RSI) which shows the ability of the knee to store and restore energy. According to Flanagan et al. it must be greater than 2.5 in order to show good plyometric quality 58
PROPRIOCEPTION AND BALANCE
Without vestibular disorders, proprioceptive alterations can be assessed via stabilometric analysis which can be performed in bipedal and unipedal modes, with vision or without.
Evaluation of static balance can be assessed by the study of mobility and variations in the center of pressure (CoP) which allows the quality of global proprioception and postural adaptation to be described. Using a stabilometry platform offers the possibility of calculating the Romberg quotient according to Ruhe et al.,59 which quantifies visual dependence in bipedal and unipedal conditions. Visual dependence occurs when a perceptual conflict between different sensory inputs occurs, giving precedence to visual input and creating difficulties in changing frames of reference using vestibular and proprioceptive afferents according Lubetzky-Vilnai et al.60 The Romberg quotient is calculated by the ratio of the surface of the ellipse containing 90% of the points of the center of pressure with eyes closed to that with eyes open; it quantifies the importance of visual input and therefore the importance of vision in postural control. The result is physiologically close to 93% (eyes closed CoP displacement / open eyes CoP displacement; multiplied by 100) with a difference with a standard devi-
Figure 1. Graft laxity assessment by GNRB® (Genourob, Laval, France)
Index Tests Cutt-off values Coordination Abalakov – CMJ > 6 cm Plyometric DVJ – SJ > 10 cm Reactive Strength DVJ > 2,5
Table 2. Assessment of coordination, plyometrics and reactive strength indexes
CMJ; Countermovement Jump , DVJ; Drop Vertical Jump, SJ; Squat Jump
Ecological and Specific Evidence-Based Safe Return To Play After Anterior Cruciate Ligament Reconstruction In Soccer International Journal of Sports Physical Therapy
ation of 20%.61 To overcome this visual dependence, stroboscopic glasses use associated with visual-motor training has demonstrated effectiveness in reducing reaction time in particular, as well as improving muscle coactivation and muscular anticipation, which then may reduce ACL injury risk.62–66
Dynamic balance should also be assessed, for example, by the Star Excursion Balance Test modified67 or Y-Balance Test. These two tests are also a reliable way to be able to predict lower limb and ACL injury risk. Lee et al. found a strong correlation with knee flexors strength and hip abductors strength.68 Furthermore, Pilsky et al.69 reported that an asymmetry of 4 cm in the anterior distance indicates a high risk of injury to the lower limb that there was a 3.5 times higher risk of injury in the event of a symmetry of less than 90%.
PSYCHOLOGICAL ASSESSMENT
If injury and surgery lead to significant physiological changes, there are psychological considerations, in particular apprehension and confidence, which impact RTP. Paterno et al. showed that athletes with a poor Tampa Scale Kinesiophobia 11 score (19 or more) have a risk factor multiplied by 13 for secondary ACL tears within two years after RTP.70 Straub et al. described a positive correlation in male athletes between symmetrical quadriceps strength and psychological aspect upon RTP.71 Similar results were reported by Webster et al. and Kim et al. who showed a correlation between symptoms, function, and psychological status at RTP.72,73
In the authors’ opinion, the Anterior Cruciate LigamentReturn to Sport after Injury (ACL-RSI) is the best way to assess psychological qualities of the player during RTP Langford et al. suggest that it is possible to identify athletes at risk of no RTP for psychological reasons after ACLR.74 Ardern et al. highlight that psychological variables measured with ACL-RSI are the only predictors of RTP before injury 75 Therefore, it is important to be able to detect the risk profiles of players who are overconfident in their RTP when compared to their physiological qualities. Conversely, specific psychological preparation for RTP can be initiated if the ACL-RSI score is not satisfactory Kitaguchi et al., during an evaluation at six months after ACLR, shows ACL RSI cut off values of 81.3% (sensitivity = 0.8 and specificity = 0.6) and a score of 55% (sensitivity = 0.69% and specificity = 0.82) as a predictor of RTS at one year 76
VERTICAL FORCE – VELOCITY PROFILE DURING A SQUAT JUMP

Samozino et al.77 relied on Newtonian dynamics laws to create a mathematical equation that allows the calculation of the values of force, speed and power using the following values: body mass, jump height and lower limb extension distance when pushing. It then becomes easy to obtain a reliable estimate of the force-velocity-power relationship of the lower limbs as well as the tracing of the individual force-velocity profile using data from a force plate. The athlete must perform a SJ with body weight alone and add 20%
of body weight to each vertical jump. The test stops when the player cannot jump more than 10 cm. (Figure 2).
The profile which is created is compared with a theoretical optimal profile. For a maximum power value, there must be a balance between the qualities of force produced during the jump and the speed at which the jump is made, thus allowing optimization of performance. If the slope of the measured force-velocity line is greater than the slope of the optimal profile, it is necessary to focus on force production. Conversely, if the slope measured is lower than that of its optimal profile, then training must be focused on the development of velocity
THE SECOND STEP: FIELD (FUNCTIONAL TESTING)
GAME SIMULATION
Welling et al.78,79 highlighted the fact that RTP tests are often not administered in a sport-specific environment. For example, it is uncertain whether performance during hop tests can be transposed to a sport-specific situation in which a patient must react to opponents, teammates, and the ball. Indeed, the actions of dual- task, taking information, processing and decision-making, the specific movements in dual-task, work/performance in a fatigued condition, or even the execution speed of specific gestures are parameters that must be observed during the RTP However, assessments have many limitations related to the validity and reproducibility of potential tests. To address these issues, the authors have empirically chosen to use a match simulation type session for 45 minutes where the soccer
Figure 2. Vertical Force-Velocity profile with 40% body weight during a SJ, on a force plate.
Ecological and Specific Evidence-Based Safe Return To Play After Anterior Cruciate Ligament Reconstruction In Soccer International Journal of Sports Physical Therapy
player reproduces the game demands according to position and level of practice80,81 or directly with group of players.
The use of such an observation for the position and the level of the player does not allow a high reproducibility of this session, hence this approach is not used as a “test”
During these 45 minutes, the values of acceleration, deceleration, change of direction, jump, tackle, contact, ball handling skills, high speed running (between 14,4 km/h and 19,8 km/h), very high speed running (between 19,8 km/h and 25,2 km/h), and sprint (with acceleration and deceleration)are assessed according to the athlete-specific references. During these 45 minutes, we evaluated only the most intense 5 minutes, period with the greatest density of activities during a session (bount of sprint, acceleration, braking…). A quantitative and qualitative analysis is carried out through GPS tracking and a biomechanical study of movement control (with videography) during dynamic movements (cutting, braking, sprinting, landing jumps). The authors acknowledge that this assessment has limits, however, it has the advantage of estimating the soccer player’s ability to perform the specific demands that await them when returning to the team.
REPEATED SPRINT ABILITY (RSA)
Metabolic energy reserves are essential during recovery.82 Indeed, the athlete’s physiological abilities will impact the quality of RTP. The RSA test represents a reliable assessment that can be adapted to the majority of team sports. This test assesses the athlete’s ability to repeat maximum efforts with quality by measurement of the difference between the ideal performance area and the actual area (distance and volume) of the RSA achieved. The maximum speed the player achieves can be quantified via GPS. In addition, there is a strong correlation between the result of the RSA Test and VO2max and the athlete’s oxidative power, a key performance factor in soccer.83,84 In the literature, the results of this test are between 6 to 12 efforts of 20 to 40m with 30 seconds of recovery
DUAL TASK
Optimal training of an athlete will assist the player to evolve from a situation with control to a situation where they will readily adapt to chaotic environments.85 Need another sentences here, about how one gradually increases the chaos? (before you get to the “last stage” )The last stage (maximum chaos) is divided into two parts with partial integration into the team and then full integration into the team environment.85 This is an essential moment in the rehabilitative process because cognitive demand is very high. The athlete will be required to manage their own body in space but also the ball, teammates, opponents, and instructions from the coach. This increasing cognitive load can disturb the neuromotor control of the athlete if the motor patterns are not automatic.86,87 This is especially important during movements that require deceleration, cutting or landing, commonly occurring during sequences of play with high uncertainty, such as a defensive or pressing situations.80 A loss of biomechanical quality of knee valgus
control or trunk lateral flexion can be directly related to an increased risk of ACL injury.88
It is important to put the athlete in a situation of dual tasks and to assess the quality of movement.85,86,88 If a major deterioration occurs during dual-task conditions, what will happen in a complex cognitive context as indicated above? This concept is therefore considered during match simulation (during cutting with uncertainty, 1 vs 1), as well as in via the single limb landing test with impaired visual input. This is a first level of assessment of the cognitive aspect related to the dual task, information processing and decision-making. However, it must be noted that the level of complexity of the proposed analysis tasks is lower than the multiple cognitive demands that occur during a game situation.
WORKLOAD
To optimize recovery, the athlete’s ability to support the daily and weekly training loads of their competition group and her/his position should be highlighted.89–93 Indeed, it is recommended that to optimize the RTP and athlete should be albe to support approximately 90% of the workload of the highest load of the highest session workload of the week of their training group.93 This is the athlete’s ability to progress group training while maintaining both the quality of neuromotor control during dynamic movements in the game, acceleration levels, speed, and the quantitative aspect related running distances and training intensity
There are many methods for workload assessment. The Foster method is the most common for evaluation of the internal load.94 Regarding the external load, GPS analysis is the most commonly used measure, assessing the number of acceleration, deceleration, cutting, and jumping tasks that occur, as well as distances covered at the various speed intervals.
DECELERATION
Current video analysis studies of ACL injuries have identified pressing and tackling as the most common patterns for ACL injury in soccer Pressing is a situation that leads to the demand for sudden deceleration. It seems important to assess the biomechanics during decelerations, in particular kinematics hip adduction and knee abduction.95,96
However, there is a difference between the literature and clinical practice, as most authors analyze the biomechanics of deceleration using a force platform integrated into the ground and several cameras.95,96 Such analysis is not possible on the field of play. It is possible to measure this deceleration via GPS revealing the intensity and distance of the athlete’s braking.97,98 Fortunately, latest generation smartphones can collect slow motion from 120 to 240 frames per second. The biomechanical analysis can then be performed with free software such as Kinovea®, whose reliability and validity have been demonstrated.
Ecological and Specific Evidence-Based Safe Return To Play After Anterior Cruciate Ligament Reconstruction In Soccer International Journal of Sports Physical Therapy
AGILITY TESTS
It is commonly advised to assess the movement qualities during specific movements. There are agility tests for this: the Modified Illinois Agility Test, the AFL Agility run test, the T-test, the Reactive shuttle agility run, the new curve sprint test, and the zigzag agility run, for example Each of these tests involves analysis of the athlete’s ability to express their neuromuscular capacities in a context of dynamic movement with greater specificity to their discipline and to the demands they will encounter during RTP 99 The T-test requires acceleration, in particular the rate of force development, which is the quality most impacted by ACL injury,100 deceleration, but also the ability to make 90° cuts and backpedal at maximum intensity while maintaining postural control.
The new curve sprint test (Figure 3) is similar to the sprints found in team sports and in particular in soccer, which requires asymmetrical movement of the athlete at maximum intensity, knee-trunk control, and contributions of the ankle-foot complex.101 Researchers have shown that during soccer game, players mainly repeat sprints of less than 10m but more than sixty times.102,103 Caldbeck showed that sprints were rarely in a straight line, but in 85% of cases curvilinear 104 Hence, to once more closely approximate the reality on the field, the authors recommend the use of a test recently developed by Filter et al.101 called the curve sprint which is characterized mainly by its reliability, specificity and simplicity, it can be performed easily and precisely in the arc of the penalty area, within a radius of 9.15m and over a distance of 17m. The athlete must perform two sprints in one direction then two sprints in the other direction.
FATIGUE
Van Melick et al. highlighted a reduction in quality of jumping tests which under fatigue conditions and is seen in ath-
letes who had ACLR compared to healthy subjects. Studies are contradictory concerning the role of fatigue in the risk factors of ACL injury106–110; however, it may be important to assess the player under fatigued and non-fatigued conditions. A significant deterioration in quality and/or performance with fatigue should at least inform the professional regarding the athlete’s current ability to RTP at the same intensity as before the injury Therefore, the authors recommend carrying out hop tests on the field in an ecological condition. The landing test should be performed with a force platform in a non-fatigued state and then in a fatigued situation53,99 after the training session including RTP and agility tests. These landing tests are each time carried out in single and dual task conditions.65,86 The impact of fatigue can also be analyzed during a game simulation, both from a qualitative (neuromotor control of movement) and quantitative (activity intensity) point of view
HORIZONTAL FORCE - VELOCITY PROFILE
Sprint force-velocity profiling is a subject of growing interest to inform the RTP, especially in soccer players. These profiles may contribute strongly to the production of the horizontal component of the reaction force on the ground111 and therefore influence the lower limb theoretical maximal force (F0) capabilities Mendiguchia et al. found a decrease in maximum horizontal power with an ability to produce force at the start of the acceleration phase, 20% deficit after injury while the value of F0 was almost unchanged.112 These authors have hypothesized that this deficit could be the cause of mechanical overload in the hamstring. Therefore, players who have ACLR with a hamstring graft should benefit from this assessment.
Soccer players must sometimes combine running at high speed with a non-linear trajectory, for example while driving the ball and cutting. Baena-Raya et al.113 were interested in the potential relationship between the variables of the individual force-velocity profile and the ability to
 Figure 3. The new curve test sprint105
Ecological and Specific Evidence-Based Safe Return To Play After Anterior Cruciate Ligament Reconstruction In Soccer International Journal of Sports Physical Therapy
cut. They report that the variables F0 and the lower limb maximal power (Pmax) capabilities were strongly associated with performance during changing direction in soccer.113 These authors showed that the ability to orient the ground reaction force vector horizontally (RFmax) was associated with enhanced performance on cutting tests.
IS NEUROMOTOR CONTROL THE KEY?
External and internal pressures may include a combination of spatiotemporal constraints, differing levels of cognitive complexity, and fatigue. These scenarios will impact the athlete’s ability to execute a movement task effectively and may also predispose them to positions associated with heightened injury risk. During the most intense and demanding moments on the field, athletes may only have milliseconds to scan the surrounding environment and decide upon and execute an appropriate movement.
Perceptual and cognitive load must be viewed with the same level of importance as the physical components of performance toward which the rehabilitation professional devotes much rehabilitation time.
Optimal movement technique and appropriate training load are important in both the gym and on the pitch, and the focus should not solely be on reaction and response time, but rather also include accuracy and error rate (inappropriate execution of movement in response to a specific stimulus) Monitoring an athletes’ agility success rate during progressively greater game-like training scenarios may provide practitioners with an enhanced appreciation of the player’s readiness to train; this is also an important avenue for future research. The effect of motor task difficulty on cognitive performance as an error rate can be masked with a delay in reaction time and can increase injury risk for the athlete. Therefore, simultaneous assessment of reaction time and error rate can provide a broader understanding with regard to cognitive effects on performance during
complex tasks that require dual tasking, which present in most, if not all sports.
A greater number of decision-making scenarios and shorter time periods to react to those decisions are some examples that might contribute to ACL injury and should be considered by clinicians after surgery, during rehab scenarios. Future research into injury mechanisms should also consider the contextual factors surrounding the injury to ensure the chaotic complexity of match play is at the forefront of discussion.114–116
CONCLUSION
Clearly, strength, neuromotor agility, psychological, and cardiovascular fitness are required for a safe RTP, and authors have suggested that ecological situations used to study these parameters are important to implement. Novel concepts are highlighted regarding assessments for both clinical and field measurement use, which together capture a more complete picture of neuromotor control in the athlete. Neuromotor control is crucial in terms of the quality of movement, whether during specific and analytical tasks, or tasks with cognitive load, and those that occur in a situation of fatigue. Assessing facets of neuromotor control in standardized or ecological situations with reproduction of the cognitive load required during participation is key to a safe RTP.
COI STATEMENT
The authors declare that they have no competing interests.
Submitted: October 10, 2022 CDT, Accepted: January 15, 2023 CDT
This is an open-access article distributed under the terms of the Creative Commons Attribution 4.0 International License (CCBY-NC-4.0). View this license’s legal deed at https://creativecommons.org/licenses/by-nc/4.0 and legal code at https://creativecommons.org/licenses/by-nc/4.0/legalcode for more information.
Ecological and Specific Evidence-Based Safe Return To Play After Anterior Cruciate Ligament Reconstruction In Soccer International Journal of Sports Physical Therapy
REFERENCES
1. Gilchrist J, Mandelbaum BR, Melancon H, et al. A randomized controlled trial to prevent noncontact anterior cruciate ligament injury in female collegiate soccer players. Am J Sports Med 2008;36(8):1476-1483. doi:10.1177/036354650831818 8
2. Forsythe B, Lavoie-Gagne OZ, Forlenza EM, Diaz CC, Mascarenhas R. return-to-play times and player performance after acl reconstruction in elite UEFA professional soccer players: a matched-cohort analysis from 1999 to 2019. Orthop J Sports Med 2021;9(5):232596712110088. doi:10.1177/2325967121 1008892
3. Della Villa F, Hägglund M, Della Villa S, Ekstrand J, Waldén M. High rate of second acl injury following acl reconstruction in male professional footballers: an updated longitudinal analysis from 118 players in the uefa elite club injury study. Br J Sports Med. 2021;55(23):1350-1357 doi:10.1136/bjsports-2020-10 3555
4. Eliakim E, Morgulev E, Lidor R, Meckel Y. Estimation of injury costs: financial damage of english premier league teams’ underachievement due to injuries. BMJ Open Sport Exerc Med. 2020;6(1):e000675. doi:10.1136/bmjsem-2019-00067
5
5. Webster KE, Hewett TE. What is the evidence for and validity of return-to-sport testing after anterior cruciate ligament reconstruction surgery? a systematic review and meta-analysis. Sports Med. 2019;49(6):917-929. doi:10.1007/s40279-019-01093-x
6. Welling W, Benjaminse A, Lemmink K, Gokeler A. Passing return to sports tests after acl reconstruction is associated with greater likelihood for return to sport but fail to identify second injury risk. Knee 2020;27(3):949-957. doi:10.1016/j.knee.2020.03.007
7 Gokeler A, Benjaminse A, Della Villa F, Tosarelli F, Verhagen E, Baumeister J. Anterior cruciate ligament injury mechanisms through a neurocognition lens: implications for injury screening. BMJ Open Sport Exerc Med 2021;7(2):e001091. doi:10.1136/bmjsem-2 021-001091
8. Gokeler A, Welling W, Zaffagnini S, Seil R, Padua D Development of a test battery to enhance safe return to sports after anterior cruciate ligament reconstruction. Knee Surg Sports Traumatol Arthrosc 2017;25(1):192-199. doi:10.1007/s00167-016-4246-3
9. Gokeler A, Dingenen B, Hewett TE. Rehabilitation and return to sport testing after anterior cruciate ligament reconstruction: where are we in 2022? Arthrosc Sports Med Rehabil 2022;4(1):e77-e82. doi:1 0.1016/j.asmr.2021.10.025
10. Benjaminse A, Verhagen E. Implementing acl injury prevention in daily sports practice—it’s not just the program: let’s build together, involve the context, and improve the content. Sports Med. 2021;51(12):2461-2467 doi:10.1007/s40279-021-0156 0-4
11. Hewett TE, Webster KE, Hurd WJ. Systematic selection of key logistic regression variables for risk prediction analyses: a five-factor maximum model. Clin J Sport Med. 2019;29(1):78-85. doi:10.1097/jsm.0 000000000000486
12. Hewett TE. prediction of future injury in sport: primary and secondary anterior cruciate ligament injury risk and return to sport as a model. J Orthop Sports Phys Ther 2017;47(4):228-231. doi:10.2519/jos pt.2017.0603
13. Rambaud AJM, Ardern CL, Thoreux P, Regnaux JP, Edouard P Criteria for return to running after anterior cruciate ligament reconstruction: a scoping review Br J Sports Med 2018;52(22):1437-1444. doi:1 0.1136/bjsports-2017-098602
14. Hackney JM, Wade MG, Larson C, Smith JP, Rakow J. Impairment in people with anterior cruciate ligament reconstruction in adjusting ground reaction force in running. Physiother Theory Pract. 2010;26(5):289-296. doi:10.3109/09593980903164066
15. Greenberg EM, Greenberg ET, Albaugh J, Storey E, Ganley TJ. Rehabilitation practice patterns following anterior cruciate ligament reconstruction: a survey of physical therapists. J Orthop Sports Phys Ther 2018;48(10):801-811. doi:10.2519/jospt.2018.8264
16. Knurr KA, Kliethermes SA, Stiffler-Joachim MR, Cobian DG, Baer GS, Heiderscheit BC. Running biomechanics before injury and 1 year after anterior cruciate ligament reconstruction in division i collegiate athletes. Am J Sports Med 2021;49(10):2607-2614. doi:10.1177/03635465211026 665
17 Manal TJ, Snyder-Mackler L. Practice guidelines for anterior cruciate ligament rehabilitation: a criterion-based rehabilitation progression. Oper Tech Orthop 1996;6(3):190-196. doi:10.1016/s1048-6666(9 6)80019-x
Ecological and Specific Evidence-Based Safe Return To Play After Anterior Cruciate Ligament Reconstruction In Soccer International Journal of Sports Physical Therapy
18. Adams D, Logerstedt D, Hunter-Giordano A, Axe MJ, Snyder-Mackler L. Current concepts for anterior cruciate ligament reconstruction: a criterion-based rehabilitation progression. J Orthop Sports Phys Ther. 2012;42(7):601-614. doi:10.2519/jospt.2012.3871
19. Rambaud AJ, Neri T, Edouard P Reconstruction, rehabilitation and return-to-sport continuum after anterior cruciate ligament injury (ACLR3-continuum): Call for optimized programs. Ann Phys Rehabil Med. 2021;65(4):101470. doi:10.101 6/j.rehab.2020.101470
20. Morin JB, Dalleau G, Kyröläinen H, Jeannin T, Belli A. A simple method for measuring stiffness during running. J Appl Biomech. 2005;21(2):167-180. doi:10.1123/jab.21.2.167
21. Pappas P, Paradisis G, Tsolakis C, Smirniotou A, Morin JB. Reliabilities of leg and vertical stiffness during treadmill running. Sports Biomech 2014;13(4):391-399. doi:10.1080/14763141.2014.9818 53
22. Gokeler A, Dingenen B, Mouton C, Seil R. Clinical course and recommendations for patients after anterior cruciate ligament injury and subsequent reconstruction: a narrative review EFORT Open Rev 2017;2(10):410-420. doi:10.1302/2058-5241.2.170011
23. Kiapour AM, Flannery SW, Murray MM, et al. Regional differences in anterior cruciate ligament signal intensity after surgical treatment. Am J Sports Med. 2021;49(14):3833-3841. doi:10.1177/036354652
11047554
24. Beynnon BD, Johnson RJ, Fleming BC, et al. Anterior cruciate ligament replacement: comparison of bone-patellar tendon-bone grafts with two-strand hamstring grafts: a prospective, randomized study J Bone Jt Surg Am Vol. 2002;84(9):1503-1513. doi:10.21 06/00004623-200209000-00001
25. Shaieb MD, Kan DM, Chang SK, Marumoto JM, Richardson AB. A prospective randomized comparison of patellar tendon versus semitendinosus and gracilis tendon autografts for anterior cruciate ligament reconstruction. Am J Sports Med. 2002;30(2):214-220. doi:10.1177/03635465020300021 201
26. Feller JA, Webster KE. A Randomized Comparison of patellar tendon and hamstring tendon anterior cruciate ligament reconstruction. Am J Sports Med 2003;31(4):564-573. doi:10.1177/03635465030310041 501
27 Robert H, Nouveau S, Gageot S, Gagnière B. A new knee arthrometer, the gnrb®: experience in acl complete and partial tears. Orthop Traumatol Surg Res 2009;95(3):171-176. doi:10.1016/j.otsr.2009.03.0 09
28. Saravia A, Cabrera S, Molina CR, Pacheco L, Muñoz G. Validity of the genourob arthrometer in the evaluation of total thickness tears of anterior cruciate ligament. J Orthop. 2020;22:203-206. doi:10.1016/j.jo r.2020.03.041
29. Klasan A, Putnis SE, Kandhari V, Oshima T, Fritsch BA, Parker DA. Healthy knee KT1000 measurements of anterior tibial translation have significant variation. Knee Surg Sports Traumatol Arthrosc. 2020;28(7):2177-2183. doi:10.1007/s0016 7-019-05768-w
30. Klasan A, Putnis SE, Kandhari V, Oshima T, Parker DA. Anterior knee translation measurements after acl reconstruction are influenced by the type of laximeter used. Knee Surg Sports Traumatol Arthrosc 2020;28(11):3639-3646. doi:10.1007/s00167-020-059 50-5
31. Burgi CR, Peters S, Ardern CL, et al. Which criteria are used to clear patients to return to sport after primary acl reconstruction? a scoping review. Br J Sports Med 2019;53(18):1154-1161. doi:10.1136/bjs ports-2018-099982
32. Palmieri-Smith RM, Lepley LK. Quadriceps strength asymmetry after anterior cruciate ligament reconstruction alters knee joint biomechanics and functional performance at time of return to activity. Am J Sports Med 2015;43(7):1662-1669. doi:10.1177/ 0363546515578252
33. Hewett TE, Myer GD, Ford KR, Paterno MV, Quatman CE. Mechanisms, prediction, and prevention of ACL injuries: cut risk with three sharpened and validated tools. J Orthop Res. 2016;34(11):1843-1855. doi:10.1002/jor.23414
34. Logerstedt D, Di Stasi S, Grindem H, et al. Selfreported knee function can identify athletes who fail return-to-activity criteria up to 1 year after anterior cruciate ligament reconstruction: a delaware-oslo acl cohort study. J Orthop Sports Phys Ther. 2014;44(12):914-923. doi:10.2519/jospt.2014.4852
35. Norte GE, Hertel J, Saliba SA, Diduch DR, Hart JM. Quadriceps function and patient-reported outcomes after anterior cruciate ligament reconstruction in patients with or without knee osteoarthritis. J Athl Train. 2018;53(10):965-975. doi:10.4085/1062-6050-1 70-17
36. Grindem H, Snyder-Mackler L, Moksnes H, Engebretsen L, Risberg MA. Simple decision rules can reduce reinjury risk by 84% after acl reconstruction: the delaware-oslo acl cohort study Br J Sports Med 2016;50(13):804-808. doi:10.1136/bjsports-2016-096 031
Ecological and Specific Evidence-Based Safe Return To Play After Anterior Cruciate Ligament Reconstruction In Soccer International Journal of Sports Physical Therapy
37 Kyritsis P, Bahr R, Landreau P, Miladi R, Witvrouw E. Likelihood of acl graft rupture: not meeting six clinical discharge criteria before return to sport is associated with a four times greater risk of rupture. Br J Sports Med 2016;50(15):946-951. doi:10.1136/bjs ports-2015-095908
38. Undheim MB, Cosgrave C, King E, et al. Isokinetic muscle strength and readiness to return to sport following anterior cruciate ligament reconstruction: is there an association? A systematic review and a protocol recommendation. Br J Sports Med 2015;49(20):1305-1310. doi:10.1136/bjsports-2014-0 93962
39. van Melick N, van Cingel REH, Brooijmans F, et al. Evidence-based clinical practice update: practice guidelines for anterior cruciate ligament rehabilitation based on a systematic review and multidisciplinary consensus. Br J Sports Med 2016;50(24):1506-1515. doi:10.1136/bjsports-2015-0 95898
40. van Melick N, van der Weegen W, van der Horst N. Quadriceps and hamstrings strength reference values for athletes with and without anterior cruciate ligament reconstruction who play popular pivoting sports, including soccer, basketball, and handball: a scoping review J Orthop Sports Phys Ther 2022;52(3):142-155. doi:10.2519/jospt.2022.10693
41. Andrade R, Pereira R, van Cingel R, Staal JB, Espregueira-Mendes J. How should clinicians rehabilitate patients after ACL reconstruction? A systematic review of clinical practice guidelines (CPGs) with a focus on quality appraisal (AGREE II). Br J Sports Med 2020;54(9):512-519. doi:10.1136/bjsp orts-2018-100310
42. van Melick N, van Rijn L, Nijhuis-van der Sanden MWG, Hoogeboom TJ, van Cingel REH. Fatigue affects quality of movement more in aclreconstructed soccer players than in healthy soccer players. Knee Surg Sports Traumatol Arthrosc 2019;27(2):549-555. doi:10.1007/s00167-018-5149-2
43. Wellsandt E, Failla MJ, Snyder-Mackler L. Limb symmetry indexes can overestimate knee function after anterior cruciate ligament injury. J Orthop Sports Phys Ther 2017;47(5):334-338. doi:10.2519/jos pt.2017.7285
44. Baumgart C, Welling W, Hoppe MW, Freiwald J, Gokeler A. Angle-specific analysis of isokinetic quadriceps and hamstring torques and ratios in patients after acl-reconstruction. BMC Sports Sci Med Rehabil 2018;10(1):23. doi:10.1186/s13102-018-011
2-6
45. Maestroni L, Read P, Turner A, Korakakis V, Papadopoulos K. Strength, rate of force development, power and reactive strength in adult male athletic populations post anterior cruciate ligament reconstruction - A systematic review and metaanalysis. Phys Ther Sport 2021;47:91-104. doi:10.101 6/j.ptsp.2020.11.024
46. Edouard P, Degache F, Depiesse F. Guide d’isocinétisme: l’évaluation isocinétique des concepts aux conditions sportives et pathologiques. Elsevier Masson; 2016.
47 Maffiuletti NA, Aagaard P, Blazevich AJ, Folland J, Tillin N, Duchateau J. Rate of force development: physiological and methodological considerations. Eur J Appl Physiol 2016;116(6):1091-1116. doi:10.1007/s0 0421-016-3346-6
48. Kotsifaki A, Korakakis V, Graham-Smith P, Sideris V, Whiteley R. Vertical and horizontal hop performance: contributions of the hip, knee, and ankle. Sports Health. 2021;13(2):128-135. doi:10.117 7/1941738120976363
49. Kotsifaki A, Van Rossom S, Whiteley R, et al. Single leg vertical jump performance identifies knee function deficits at return to sport after acl reconstruction in male athletes. Br J Sports Med 2022;56(9):490-498. doi:10.1136/bjsports-2021-1046 92
50. Kotsifaki A, Van Rossom S, Whiteley R, et al. Symmetry in triple hop distance hides asymmetries in knee function after acl reconstruction in athletes at return to sports. Am J Sports Med 2022;50(2):441-450. doi:10.1177/03635465211063192
51. Kotsifaki A, Whiteley R, Van Rossom S, et al. Single leg hop for distance symmetry masks lower limb biomechanics: time to discuss hop distance as decision criterion for return to sport after acl reconstruction? Br J Sports Med 2022;56(5):249-256. doi:10.1136/bjsports-2020-103677
52. Herrington L, Myer G, Horsley I. Task based rehabilitation protocol for elite athletes following Anterior Cruciate ligament reconstruction: a clinical commentary Phys Ther Sport 2013;14(4):188-198. do i:10.1016/j.ptsp.2013.08.001
53. Paterno MV, Schmitt LC, Ford KR, et al. Biomechanical measures during landing and postural stability predict second anterior cruciate ligament injury after anterior cruciate ligament reconstruction and return to sport. Am J Sports Med 2010;38(10):1968-1978. doi:10.1177/03635465103760
53 Ecological and Specific Evidence-Based Safe Return To Play After Anterior Cruciate Ligament Reconstruction In Soccer International Journal of Sports Physical Therapy
54. Blakeney WG, Ouanezar H, Rogowski I, et al. Validation of a composite test for assessment of readiness for return to sports after anterior cruciate ligament reconstruction: the k-starts test. Sports Health 2018;10(6):515-522. doi:10.1177/1941738118
786454
55. Myer GD, Ford KR, McLean SG, Hewett TE. The effects of plyometric versus dynamic stabilization and balance training on lower extremity biomechanics. Am J Sports Med. 2006;34(3):445-455. doi:10.1177/0363546505281241
56. Padua DA, DiStefano LJ, Hewett TE, et al. National athletic trainers’ association position statement: prevention of anterior cruciate ligament injury J Athl Train 2018;53(1):5-19. doi:10.4085/106 2-6050-99-16
57. Hewett T, Myer G. Reducing knee and anterior cruciate ligament injuries among female athletes – a systematic review of neuromuscular training interventions. J Knee Surg. 2010;18(01):82-88. doi:1 0.1055/s-0030-1248163
58. Flanagan EP, Ebben WP, Jensen RL. Reliability of the reactive strength index and time to stabilization during depth jumps. J Strength Cond Res 2008;22(5):1677-1682. doi:10.1519/jsc.0b013e318182 034b
59. Ruhe A, Fejer R, Walker B. The test–retest reliability of centre of pressure measures in bipedal static task conditions – a systematic review of the literature. Gait Posture 2010;32(4):436-445. doi:10.10 16/j.gaitpost.2010.09.012
60. Lubetzky-Vilnai A, McCoy SW, Price R, Ciol MA. Young adults largely depend on vision for postural control when standing on a bosu ball but not on foam. J Strength Cond Res. 2015;29(10):2907-2918. do i:10.1519/jsc.0000000000000935
61. Gagey PM, Weber B. Posturologie: régulation et dérèglements de la station debout. Masson; 2005.
62. Nagai T, Schilaty ND, Bates NA, Bies NJ, McPherson AL, Hewett TE. High school female basketball athletes exhibit decreased knee‐specific choice visual‐motor reaction time. Scand J Med Sci Sports 2021;31(8):1699-1707 doi:10.1111/sms.13978
63. Wilkerson GB, Simpson KA, Clark RA. Assessment and training of visuomotor reaction time for football injury prevention. J Sport Rehabil 2017;26(1):26-34. d oi:10.1123/jsr.2015-0068
64. Ellison P, Jones C, Sparks SA, et al. The effect of stroboscopic visual training on eye–hand coordination. Sport Sci Health 2020;16(3):401-410. d oi:10.1007/s11332-019-00615-4
65. Grooms D, Appelbaum G, Onate J. Neuroplasticity following anterior cruciate ligament injury: a framework for visual-motor training approaches in rehabilitation. J Orthop Sports Phys Ther. 2015;45(5):381-393. doi:10.2519/jospt.2015.5549
66. Grooms DR, Chaudhari A, Page SJ, Nichols-Larsen DS, Onate JA. Visual-motor control of drop landing after anterior cruciate ligament reconstruction. J Athl Train 2018;53(5):486-496. doi:10.4085/1062-6050-17 8-16
67. Picot B, Terrier R, Forestier N, Fourchet F, McKeon PO The star excursion balance test: an update review and practical guidelines. Int J Athl Ther Train. 2021;26(6):285-293. doi:10.1123/ijatt.2020-010
68. Lee DK, Kang MH, Lee TS, Oh JS. Relationships among the y balance test, berg balance scale, and lower limb strength in middle-aged and older females. Braz J Phys Ther 2015;19(3):227-234. doi:1 0.1590/bjpt-rbf.2014.0096
69. Plisky PJ, Gorman PP, Butler RJ, Kiesel KB, Underwood FB, Elkins B. The reliability of an instrumented device for measuring components of the star excursion balance test. North Am J Sports Phys Ther 2009;4(2):92-99.
70. Paterno MV, Flynn K, Thomas S, Schmitt LC. Selfreported fear predicts functional performance and second acl injury after acl reconstruction and return to sport: a pilot study. Sports Health. 2018;10(3):228-233. doi:10.1177/1941738117745806
71. Straub RK, Della Villa F, Mandelbaum B, Powers CM. Confidence to return to play after acl reconstruction: an evaluation of quadriceps strength symmetry and injury mechanism in male athletes. Sports Health. 2022;14(5):758-763. doi:10.1177/19417 381211043854
72. Webster KE, Feller JA, Lambros C. Development and preliminary validation of a scale to measure the psychological impact of returning to sport following anterior cruciate ligament reconstruction surgery Phys Ther Sport. 2008;9(1):9-15. doi:10.1016/j.ptsp.20 07.09.003
73. Kim Y, Kubota M, Sato T, Inui T, Ohno R, Ishijima M. Psychological patient-reported outcome measure after anterior cruciate ligament reconstruction: evaluation of subcategory in acl-return to sport after injury (acl-rsi) scale. Orthop Traumatol Surg Res. 2022;108(3):103141. doi:10.1016/j.otsr.2021.103141
74. Langford JL, Webster KE, Feller JA. A prospective longitudinal study to assess psychological changes following anterior cruciate ligament reconstruction surgery Br J Sports Med 2009;43(5):377-378. doi:10.1 136/bjsm.2007.044818
6
Ecological and Specific Evidence-Based Safe Return To Play After Anterior Cruciate Ligament Reconstruction In Soccer International Journal of Sports Physical Therapy
75. Ardern CL, Taylor NF, Feller JA, Whitehead TS, Webster KE. Psychological responses matter in returning to preinjury level of sport after anterior cruciate ligament reconstruction surgery. Am J Sports Med 2013;41(7):1549-1558. doi:10.1177/0363546513 489284
76. Kitaguchi T, Tanaka Y, Takeshita S, et al. Importance of functional performance and psychological readiness for return to preinjury level of sports 1 year after acl reconstruction in competitive athletes. Knee Surg Sports Traumatol Arthrosc 2020;28(7):2203-2212. doi:10.1007/s0016 7-019-05774-y
77. Samozino P, Rabita G, Dorel S, et al. A simple method for measuring power, force, velocity properties, and mechanical effectiveness in sprint running: simple method to compute sprint mechanics. Scand J Med Sci Sports 2016;26(6):648-658. doi:10.1111/sms.12490
78. Welling W, Frik L. On-field tests for patients after anterior cruciate ligament reconstruction: a scoping review. Orthop J Sports Med. 2022;10(1):232596712110554. doi:10.1177/232596712 11055481
79. Samozino P, Edouard P, Sangnier S, Brughelli M, Gimenez P, Morin JB. Force-velocity profile: imbalance determination and effect on lower limb ballistic performance. Int J Sports Med. 2013;35(06):505-510. doi:10.1055/s-0033-1354382
80. Waldén M, Krosshaug T, Bjørneboe J, Andersen TE, Faul O, Hägglund M. Three distinct mechanisms predominate in non-contact anterior cruciate ligament injuries in male professional football players: a systematic video analysis of 39 cases. Br J Sports Med 2015;49(22):1452-1460. doi:10.1136/bjsp orts-2014-094573
81. Martín-García A, Casamichana D, Díaz AG, Cos F, Gabbett TJ. Positional differences in the most demanding passages of play in football competition. J Sports Sci Med. 2018;17(4):563-570.
82. Almeida AM de, Santos Silva PR, Pedrinelli A, Hernandez AJ. Aerobic fitness in professional soccer players after anterior cruciate ligament reconstruction. Di Giminiani R, ed. PLoS ONE. 2018;13(3):e0194432. doi:10.1371/journal.pone.0194 432
83. Bishop D, Girard O, Mendez-Villanueva A. Repeated-sprint ability – part ii: recommendations for training. Sports Med 2011;41(9):741-756. doi:10.2 165/11590560-000000000-00000
84. Impellizzeri F, Rampinini E, Castagna C, et al. Validity of a repeated-sprint test for football. Int J Sports Med 2008;29(11):899-905. doi:10.1055/s-200 8-1038491
85. Taberner M, Allen T, Cohen DD. Progressing rehabilitation after injury: consider the ‘controlchaos continuum.’ Br J Sports Med 2019;53(18):1132-1136. doi:10.1136/bjsports-2018-1 00157
86. Neto T, Sayer T, Theisen D, Mierau A. Functional brain plasticity associated with acl injury: a scoping review of current evidence. Neural Plast 2019;2019:1-17 doi:10.1155/2019/3480512
87. Gokeler A, Benjaminse A, Hewett TE, et al. Feedback techniques to target functional deficits following anterior cruciate ligament reconstruction: implications for motor control and reduction of second injury risk. Sports Med 2013;43(11):1065-1074. doi:10.1007/s40279-013-009
5-0
88. De Blaiser C, Roosen P, Willems T, Danneels L, Bossche LV, De Ridder R. Is core stability a risk factor for lower extremity injuries in an athletic population? a systematic review Phys Ther Sport 2018;30:48-56. doi:10.1016/j.ptsp.2017.08.076
89. Dalen T, Lorås H, Hjelde GH, Kjøsnes TN, Wisløff U. Accelerations – a new approach to quantify physical performance decline in male elite soccer? Eur J Sport Sci. 2019;19(8):1015-1023. doi:10.1080/17 461391.2019.1566403
90. Buckthorpe M. Optimising the Late-Stage Rehabilitation and return-to-sport training and testing process after acl reconstruction. Sports Med 2019;49(7):1043-1058. doi:10.1007/s40279-019-0110
2-z
91. Abrams GD, Harris JD, Gupta AK, et al. Functional performance testing after anterior cruciate ligament reconstruction: a systematic review. Orthop J Sports Med 2014;2(1):232596711351830. doi:10.1177/23259 67113518305
92. Lozano D, Lampre M, Díez A, et al. Global positioning system analysis of physical demands in small and large-sided games with floaters and official matches in the process of return to play in high level soccer players. Sensors 2020;20(22):6605. doi:10.339 0/s20226605
93. Ritchie D, Hopkins WG, Buchheit M, Cordy J, Bartlett JD Quantification of training load during return to play after upper- and lower-body injury in australian rules football. Int J Sports Physiol Perform. 2017;12(5):634-641. doi:10.1123/ijspp.2016-0300
Ecological and Specific Evidence-Based Safe Return To Play After Anterior Cruciate Ligament Reconstruction In Soccer International Journal of Sports Physical Therapy
94. Foster C, Rodriguez-Marroyo JA, de Koning JJ. Monitoring training loads: the past, the present, and the future. Int J Sports Physiol Perform 2017;12(s2):S2-2-S2-8. doi:10.1123/ijspp.2016-0388
95. Di Paolo S, Zaffagnini S, Tosarelli F, et al. A 2D qualitative movement assessment of a deceleration task detects football players with high knee joint loading. Knee Surg Sports Traumatol Arthrosc. 2021;29(12):4032-4040. doi:10.1007/s00167-021-067 09-2
96. Dix C, Arundale A, Silvers-Granelli H, Marmon A, Zarzycki R, Snyder-Mackler L. Biomechanical measures during two sport-specific tasks differentiate between soccer players who go on to anterior cruciate ligament injury and those who do not: a prospective cohort analysis. Int J Sports Phys Ther. 2020;15(6):928-935. doi:10.26603/ijspt20200928
97 Dos’Santos T, McBurnie A, Donelon T, Thomas C, Comfort P, Jones PA. A qualitative screening tool to identify athletes with ‘high-risk’ movement mechanics during cutting: the cutting movement assessment score (CMAS). Phys Ther Sport. 2019;38:152-161. doi:10.1016/j.ptsp.2019.05.004
98. Dos’Santos T, Thomas C, Comfort P, Jones PA. The effect of training interventions on change of direction biomechanics associated with increased anterior cruciate ligament loading: a scoping review Sports Med. 2019;49(12):1837-1859. doi:10.1007/s402 79-019-01171-0
99. Taberner M, van Dyk N, Allen T, et al. Physical preparation and return to performance of an elite female football player following acl reconstruction: a journey to the fifa women’s world cup. BMJ Open Sport Exerc Med. 2020;6(1):e000843. doi:10.1136/bmjs em-2020-000843
100. Angelozzi M, Madama M, Corsica C, et al. Rate of force development as an adjunctive outcome measure for return-to-sport decisions after anterior cruciate ligament reconstruction. J Orthop Sports Phys Ther. 2012;42(9):772-780. doi:10.2519/jospt.201
2.3780
101. Filter A, Olivares-Jabalera J, Santalla A, et al. Curve Sprinting in soccer: kinematic and neuromuscular analysis. Int J Sports Med. 2020;41(11):744-750. doi:10.1055/a-1144-3175
102. Barnes C, Archer D, Hogg B, Bush M, Bradley P The evolution of physical and technical performance parameters in the english premier league. Int J Sports Med 2014;35(13):1095-1100. doi:10.1055/s-0034-137
5695
103. Bradley PS, Sheldon W, Wooster B, Olsen P, Boanas P, Krustrup P. high-intensity running in english fa premier league soccer matches. J Sports Sci 2009;27(2):159-168. doi:10.1080/02640410802512775
104. Caldbeck P. contextual sprinting in premier league football. Published online 2020. doi:10.24377/ LJMU.T.00013617
105. Loturco I, Pereira LA, Fílter A, et al. Curve sprinting in soccer: relationship with linear sprints and vertical jump performance. Biol Sport 2020;37(3):277-283. doi:10.5114/biolsport.2020.9643 2
106. Barber-Westin SD, Noyes FR. Effect of fatigue protocols on lower limb neuromuscular function and implications for anterior cruciate ligament injury prevention training: a systematic review Am J Sports Med. 2017;45(14):3388-3396. doi:10.1177/036354651 7693846
107 Benjaminse A, Webster KE, Kimp A, Meijer M, Gokeler A. Revised approach to the role of fatigue in anterior cruciate ligament injury prevention: a systematic review with meta-analyses. Sports Med 2019;49(4):565-586. doi:10.1007/s40279-019-01052-6
108. Bourne MN, Webster KE, Hewett TE. Is fatigue a risk factor for anterior cruciate ligament rupture? Sports Med. 2019;49(11):1629-1635. doi:10.1007/s402 79-019-01134-5
109. Chappell JD, Herman DC, Knight BS, Kirkendall DT, Garrett WE, Yu B. Effect of Fatigue on Knee Kinetics and Kinematics in Stop-Jump Tasks. Am J Sports Med 2005;33(7):1022-1029. doi:10.1177/03635 46504273047
110. Gokeler A, Eppinga P, Dijkstra PU, et al. Effect of fatigue on landing performance assessed with the landing error scoring system (less) in patients after acl reconstruction. a pilot study Int J Sports Phys Ther 2014;9(3):302-311.
111. Morin JB, Gimenez P, Edouard P, et al. Sprint acceleration mechanics: the major role of hamstrings in horizontal force production. Front Physiol 2015;6. doi:10.3389/fphys.2015.00404
112. Mendiguchia J, Edouard P, Samozino P, et al. Field monitoring of sprinting power–force–velocity profile before, during and after hamstring injury: two case reports. J Sports Sci. 2016;34(6):535-541. doi:1 0.1080/02640414.2015.1122207
Ecological and Specific Evidence-Based Safe Return To Play After Anterior Cruciate Ligament Reconstruction In Soccer International Journal of Sports Physical Therapy
113. Baena-Raya A, Rodríguez-Pérez MA, JiménezReyes P, Soriano-Maldonado A. maximizing acceleration and change of direction in sport: a case series to illustrate how the force-velocity profile provides additional information to that derived from linear sprint time. Int J Environ Res Public Health 2021;18(11):6140. doi:10.3390/ijerph18116140
114. Kakavas G, Malliaropoulos N, Blach W, Bikos G, Migliorini F, Maffulli N. Ball heading and subclinical concussion in soccer as a risk factor for anterior cruciate ligament injury J Orthop Surg Res 2021;16(1):566. doi:10.1186/s13018-021-02711-z
115. Kakavas G, Malliaropoulos N, Pruna R, Traster D, Bikos G, Maffulli N. Neuroplasticity and anterior cruciate ligament injury Indian J Orthop 2020;54(3):275-280. doi:10.1007/s43465-020-00045-2
116. Kakavas G, Malliaropoulos N, Bikos G, et al. Periodization in anterior cruciate ligament rehabilitation: a novel framework. Med Princ Pract 2021;30(2):101-108. doi:10.1159/000511228
Ecological and Specific Evidence-Based Safe Return To Play After Anterior Cruciate Ligament Reconstruction In Soccer International Journal of Sports Physical Therapy
Clinical Commentary/Current Concept Review
Periodization in Anterior Cruciate Ligament Rehabilitation: New Framework Versus Old Model? A Clinical Commentary
Georgios Kakavs1 , Florian Forelli2a , Nikolaos Malliaropoulos, Timothy E Hewett3 , Panagiotis Tsaklis
1 Fysiotek Spine & Sports Lab, 2 Orthosport Rehab Center, 3 Marshall University
Keywords: periodization, motor control, anterior cruciate ligament reconstruction, return to sport, cognitive phase/mesocycle https://doi.org/10.26603/001c.73035
International Journal of Sports Physical Therapy
The physiological and psychological changes after anterior cruciate ligament reconstruction (ACLR) do not always allow a return to sport in the best condition and at the same level as before. Moreover, the number of significant re-injuries, especially in young athletes should be considered and physical therapists must develop rehabilitation strategies and increasingly specific and ecological test batteries to optimize safe return to play The return to sport and return to play of athletes after ACLR must progress through the recovery of strength, neuromotor control, and include cardiovascular training while considering different psychological aspects. Because motor control seems to be the key to a safe return to sport, it should be associated with the progressive development of strength, and cognitive abilities should also be considered throughout rehabilitation. Periodization, the planned manipulation of training variables (load, sets, and repetitions) to maximize training adaptations while minimizing fatigue and injury, is relevant to the optimization of muscle strengthening, athletic qualities, and neurocognitive qualities of athletes during rehabilitation after ACLR. Periodized programming utilizes the principle of overload, whereby the neuromuscular system is required to adapt to unaccustomed loads. While progressive loading is a well-established and widely used concept for strengthening, the variance of volume and intensity makes periodization effective for improving athletic skills and attributes, such as muscular strength, endurance, and power, when compared with non-periodized training. The purpose of this clinical commentary is to broadly apply concepts of periodization to rehabilitation after ACLR.
INTRODUCTION
Non-contact injury of the anterior cruciate ligament (ACL) is a common sports-related injury typically warranting extensive rehabilitation time andreconstructive surgery followed by rehabilitation. After a sports injury, the first question asked by most athletes (and coaches) is: ‘When will I (the athlete) be able to compete again?’ The answer to this question is rarely straightforward and is influenced by many factors. However, in most cases the goals of the injured athlete and the treating clinician (plus other stakeholders in the decision-making team, such as coaches, parents, and managers) are the same—to facilitate a timely and safe return to sport.1
Athletes that return to play are at an elevated risk for reinjury or injury to the contralateral limb with an estimated 1 in 4 (25%) athletes suffering a second injury after returning to high-level sport.2 The high re-injury rate among in-
jured athletes has been a focus for researchers attempting to identify modifiable risk factors and different rehab protocols according the graft choice, type of surgery, type of injury (meniscus or medial collateral ligament, involvement, etc.) for rehabilitation strategies to improve returnto-sport (RTS) outcomes.3 Periodization is probably one of the most important and fundamental concepts in training and it is important to consider the use of this concept in rehabilitation of injuries to the ACL and after ACL reconstruction (ALCR).4 Periodization consists of a ‘training cycle’ divided into different training or rehab phases with distinct physical and physiological objectives – to enable the best performance from athletes in competition (i.e. peak performance, injury prevention). Theoretically, using the periodization concept, peak performance is achieved in a controlled way, as a result of the summation of the particular adaptations provided by each training-rehab phase (mesocycle; Figure 1).5
Corresponding author:
Florian FORELLI, 16 rue de Paris, 95330 Domont, France, +33769495275
fforelli@capio.fr
a
Kakavs G, Forelli F, Malliaropoulos N, Hewett TE, Tsaklis P. Periodization in Anterior Cruciate Ligament Rehabilitation: New Framework Versus Old Model? A Clinical Commentary. IJSPT. Published online April 1, 2023:541-546. doi:10.26603/001c.73035
Various models of periodization exist. The two most common are linear and non-linear. Linear periodization adjusts exercise volume and load across a series of predictable phases or mesocycles. This stepwise progression from one training stage to another based on intended goals is similar to advancing a rehabilitation protocol from one stage of recovery to the next. Non-linear periodization, on the other hand, involves a more frequent change of volume and load within a mesocycle.
However, when examining the role of the use of the periodization concept in achieving the maximum specific performance in selected sports events (e.g. a season’s best result), an important drawback emerges: very low rates of effectiveness.6 The high frequency of competition, together with the increasing physical demands of competition over the season,7 has served to accentuate the physical and mental load incurred by elite athletes from different sports. As a consequence of these demands, the importance of recovery and rehabilitation strategies designed to alleviate player fatigue, minimize injury risk, and enhance performance is of paramount importance to clubs and national federations responsible for managing the elite player health.8 The use of periodization in long standing rehabilitation programs after ACLR needs more research and data to become accepted by health professionals. Therefore, the purpose of this clinical commentary is to broadly apply concepts of periodization to rehabilitation after ACLR.

CAN PERIODIZATION BE APPLIED IN LONGTERM REHABILITATION, SUCH AS AFTER ACL INJURY?
Over the years, the pursuit of greater human performance through training has led to athletes, coaches, and physical therapists engaging in higher training volumes and often greater intensity When coupled with ever increasing competition demands and fixture congestion the interest in exercise recovery strategies is extremely important to consider within the training and competition calendar 8,9 Rehabilitation programs have traditionally used a basic progressive overload approach primarily focusing on the injured area. Periodized training is a safe method of training for healthy athletes, as well as those in pain or following an injury.10 The ideas and concepts presented in this commentary have not been tested in randomized controlled trials,
however they may stimulate further suitable studies investigating the application of periodization in rehab.
Periodization is the planned manipulation of training variables (load, sets, and repetitions) to maximize training adaptations while minimizing fatigue. Periodized programming utilizes the principle of overload, whereby the neuromuscular system adapts to unaccustomed loads. While progressive overload is a well-established and widely used concept for strengthening, the variance of volume and intensity makes periodization effective at improving athletic performance attributes, such as muscular strength, endurance, and power, compared with non-periodized training.10
The traditional periodization model assumes that a relatively prolonged period of basic training/rehab (general preparation / rehabilitation stages) is a prerequisite to a more specific phase (special preparation / cognitive phase). During general preparation, rehabilitation specialists aim to improve cardiorespiratory endurance and strength, even in athletes competing in power-speed sports disciplines.11
Another common belief related to strength-power development, is that the so-called ‘strength foundation phase’ will provide positive transfer of maximum strength to the ability to produce muscle power in the subsequent training phases or rehab stages. To date, there is no strong evidence supporting this belief, mostly held in traditional literature written on the basis of authors’ personal experiences and not supported by research. Conversely, there are studies showing that training using heavy-loads (i.e. maximum strength training) results in improvements only in the high-force/low-velocity portion of the force-velocity curve, without necessarily affecting the ability to produce higher amounts of force at high velocities (muscle power). It appears that the parametric relationship between force and velocity (i.e. the higher the load, the lower the velocity) plays a key role in modulating chronic neuromechanical adaptations and may be helpful in preventing re-injury 12
For instance, in endurance sports, athletes appear to benefit from performing high volumes of low-intensity training (i.e. below lactate thresholds) during their basic/ specific periods of preparation.11 Furthermore, coaches and physiotherapists use prolonged periods of basic training on muscle-tendon tissues adaptation and injury prevention cannot be ignored. However, it is likely that these positive adaptations in muscle, tendons and ligaments may also be obtained by typical strength power exercises, which can be directly implemented during the course of a rehab period.
PERIODIZATION CONCEPTS DURING ACL REHABILITATION: PRACTICAL APPLICATIONS
The initial post-operative phase of ACLR rehabilitation focuses on pain and swelling management, restoration of range of motion, quadriceps recruitment, and normalizing gait mechanics. Once an athlete meets these goals, they can begin a periodized resistance training program. To determine the appropriate load for an exercise prescription, clinicians must establish a one-repetition maximum (1RM) for each exercise. Injured or healing tissues pose a challenge
Figure 1. Periodization training cycles.
Periodization in Anterior Cruciate Ligament Rehabilitation: New Framework Versus Old Model? A Clinical Commentary International Journal of Sports Physical Therapy
to determining 1RMs when they require limited loading.13 Indeed, for most sports disciplines, make it extremely difficult for strength and conditioning coaches and physical therapists to adopt this classic and theoretical method used with healthy athletes to those recovering from injury or surgery.14,15
The injury-induced reduction in physical and mental function associated with sports training and competition infers that it is illogical that a single recovery strategy and/ or a generic one-size-fits-all approach would address a player’s recovery requirements. Alternatively, a framework where strategies are sequenced systematically at independent time points to match the source of physiological stress, alongside consideration to favorable adaptation might be a preferred approach in sports.16
From a practical standpoint, monitoring athletes using a battery of tests (Y-Balance test, hop tests, etc.) which best correlate to actual sports performance and RTS after injury is much more important than following theoretical concepts, which subjectively state that form might be predictable and controlled.17 With this simple and applied thought, strength and conditioning coaches and rehabilitation specialists may select better ways to control fluctuations in the competitiveness of individuals and teams, in addition to the already well-established variations in traditional training components (i.e. volume and intensity). Monitoring will help physical therapists and coaches to detect unexpected adaptations in the athletes’ fitness traits and adjust rehab and training loads according to these measured responses.18 In this regard, the use of validated methods for daily assessment (like GPS) of the internal training loads might be a useful strategy to quantify/modulate training intensity and its respective dose-response relationship with the specific changes in physical and mental qualities and quantities (cognitive load and fatigue assessment).19
THE NEUROCOGNITIVE MESOCYCLE: THE MISSING LINK IN ACL PERIODIZATION
ACL rehabilitation is a complex and multifaceted process involving physiological and psychological parameters which need to be constantly evolving to optimize individual athlete recovery needs and physiological adaptation.20 The relative importance of recovery versus adaptation will vary according to the needs of the athlete within the context of the procedure. This raises the idea of using rehab strategies in a manner that is periodized to mirror the demands of the sport, and to adequately recover from the stress, but also consider the need for an adaptive response. Sports injury rehabilitation must move beyond the traditional emphasis on mechanics and muscle strength and consider the need to address nuanced sensorimotor control deficits to ensure complete recovery and readiness for RTS demands.21 ACL injuries during sport are predominantly non-contact, suggesting injury may be a product of sensorimotor errors that result in a neuromuscular control fault unable to accommodate deleterious joint loading.22 Further, the vast majority of non-contact injury events occur while athletes are cog-
nitively distracted, attending to complex visual demands or environmental stimuli, suggesting that neural mechanisms may directly contribute to the athlete’s ability to safely interact with the dynamic sport environment.23 Neurocognitive tasks, such as those measuring reaction time, processing speed, visual memory, and verbal memory, are well established in the neuropsychology literature as indirect measures of cerebral performance.
Situational awareness, arousal, and attentional resources of the individual may influence several areas of neurocognitive function, affecting the complex integration of vestibular, visual, and somatosensory information needed for neuromuscular control.24 Neuroplasticity deficits following ACL injury and surgery may at least in part be caused by physiotherapy protocols that do not engage differential learning and dual-tasking during (engaging more demanding aspects of the cognitive arsenal) exercises.
Over the course of rehabilitation following ACLR, excitability of the motor cortex for quadriceps contractions decreases, at least partially from the lack of differential exercise approaches that do not force the motor cortex to reintegrate the memory trace for quadriceps motor control before each repetition and action.25,26 Neurophysiological data across the stages of rehabilitation are lacking. Neuroimaging has been used to quantify brain activation differences between subjects with ACL deficiency who did not return to previous levels of physical activity and a healthy control group.27 In this phase, patients will focus on sportspecific exercises that are intended to be extremely challenging both physically and cognitively while performed in a controlled environment. All of the previously mentioned multimodal tasks can be implemented with a major focus on motor learning, cognitive loading and sensory reweighting that are real-to sport and require quick decision making from unanticipated events.28,29
CONCLUSION
Sports rehabilitation specialists especially physical therapists and sports medicine physicians should have a basic understanding of periodization theory Such an understanding can help sport medicine teams to better interact with the competitive mindset of athletes, their coaches, and their goals. A basic understanding of periodization theories and models may help sports rehabilitation specialists to skillfully plan rehabilitation programs that then progress toward the realization of the patients’ treatment goals.
With recent evidence in support of neurological contributions to ACL injury and rate of recovery, rehabilitation protocols may benefit from incorporation of approaches that target the sensorimotor and cognitive system. Periodization can incorporate the integration of motor learning principles (external focus and differential learning, anticipation, and reaction) and/or new technologies may bolster current ACL rehabilitation protocols and improve patient recovery and timing. Research has traditionally focused on administering a single rehab intervention whereas, in the applied setting, athletes are more likely to administer mul-
Periodization in Anterior Cruciate Ligament Rehabilitation: New Framework Versus Old Model? A Clinical Commentary International Journal of Sports Physical Therapy
tiple interventions in varying sequences. Future research using robust rehabilitation technique protocols and largescale randomized control trials is needed to better understand the influence of various techniques and the application of periodization concepts on the stress-injury-adaptation continuum.
CONFLICTS OF INTEREST
The authors report no conflicts of interest.
Submitted: November 21, 2022 CDT, Accepted: January 27, 2023 CDT
This is an open-access article distributed under the terms of the Creative Commons Attribution 4.0 International License (CCBY-NC-4.0). View this license’s legal deed at https://creativecommons.org/licenses/by-nc/4.0 and legal code at https://creativecommons.org/licenses/by-nc/4.0/legalcode for more information.
International Journal of Sports Physical Therapy
Periodization in Anterior Cruciate Ligament Rehabilitation: New Framework Versus Old Model? A Clinical Commentary
REFERENCES
1. Rambaud AJ, Neri T, Edouard P Reconstruction, rehabilitation and return-to-sport continuum after anterior cruciate ligament injury (ACLR3-continuum): Call for optimized programs. Ann Phys Rehabil Med 2022;65(4):101470. doi:10.101 6/j.rehab.2020.101470
2. Ardern CL, Glasgow P, Schneiders A, et al. 2016 Consensus statement on return to sport from the First World Congress in Sports Physical Therapy, Bern. Br J Sports Med 2016;50(14):853-864. doi:10.11 36/bjsports-2016-096278
3. Rambaud AJ, Neri T, Dingenen B, et al. The modifying factors that help improve anterior cruciate ligament reconstruction rehabilitation: a narrative review. Ann Phys Rehabil Med. 2022;65(4):101601. do i:10.1016/j.rehab.2021.101601
4. Kakavas G, Malliaropoulos N, Bikos G, et al. Periodization in anterior cruciate ligament rehabilitation: a novel framework. Med Princ Pract 2021;30(2):101-108. doi:10.1159/000511228
5. Aquino R, Cruz Gonçalves LG, Palucci Vieira LH, et al. Periodization training focused on technicaltactical ability in young soccer players positively affects biochemical markers and game performance. J Strength Cond Res 2016;30(10):2723-2732. doi:10.151 9/jsc.0000000000001381
6. Barnes C, Archer D, Hogg B, Bush M, Bradley P. The evolution of physical and technical performance parameters in the english premier league. Int J Sports Med. 2014;35(13):1095-1100. doi:10.1055/s-0034-137 5695
7 Brown F, Gissane C, Howatson G, van Someren K, Pedlar C, Hill J. Compression garments and recovery from exercise: a meta-analysis. Sports Med. 2017;47(11):2245-2267 doi:10.1007/s40279-017-072
8-9
8. Altarriba-Bartes A, Peña J, Vicens-Bordas J, Casals M, Peirau X, Calleja-González J. The use of recovery strategies by Spanish first division soccer teams: a cross-sectional survey. Phys Sportsmed. 2021;49(3):297-307 doi:10.1080/00913847.2020.1819
150
9. Issurin V. Block periodization versus traditional training theory: a review J Sports Med Phys Fitness 2008;48(1):65-75.
10. Fleck S. Non-linear periodization for general fitness & athletes. J Hum Kinet 2011;29A(SpecialIssue):41-45. doi:10.2478/v10078-011-0057-2
11. Reiman MP, Lorenz DS. Integration of strength and conditioning principles into a rehabilitation program. Int J Sports Phys Ther. 2011;6(3):241-253.
12. Tillin NA, Pain MTG, Folland JP Short-term training for explosive strength causes neural and mechanical adaptations: Neuromuscular adaptations with explosive strength training. Exp Physiol 2012;97(5):630-641. doi:10.1113/expphysiol.2011.063 040
13. Grooms DR, Myer GD Upgraded hardware what about the software? Brain updates for return to play following ACL reconstruction. Br J Sports Med. 2017;51(5):418-419. doi:10.1136/bjsports-2016-0966 58
14. Mejane J, Faubert J, Romeas T, Labbe DR. The combined impact of a perceptual–cognitive task and neuromuscular fatigue on knee biomechanics during landing. Knee. 2019;26(1):52-60. doi:10.1016/j.knee.2 018.10.017
15. Montalvo AM, Schneider DK, Silva PL, et al. ‘What’s my risk of sustaining an ACL injury while playing football (soccer)?’ A systematic review with meta-analysis. Br J Sports Med 2019;53(21):1333-1340. doi:10.1136/bjsports-2016-0 97261
16. Naclerio Ayllón F, Moody J, Chapman M. Applied periodization: a methodological approach. jhse. 2013;8(2):350-366. doi:10.4100/jhse.2012.82.04
17 Kakavas G, Malliaropoulos N, Pruna R, Traster D, Bikos G, Maffulli N. Neuroplasticity and Anterior Cruciate Ligament Injury. Indian J Orthop. 2020;54(3):275-280. doi:10.1007/s43465-020-00045-2
18. Kakavas G, Malliaropoulos N, Blach W, Bikos G, Migliorini F, Maffulli N. Ball heading and subclinical concussion in soccer as a risk factor for anterior cruciate ligament injury J Orthop Surg Res 2021;16(1):566. doi:10.1186/s13018-021-02711-z
19. Baumeister J, Reinecke K, Weiss M. Changed cortical activity after anterior cruciate ligament reconstruction in a joint position paradigm: an EEG study: acl and cortical activity Scand J Med Sci Sports 2007;18(4):473-484. doi:10.1111/j.1600-0838.2007.00 702.x
20. Hutchison M, Comper P, Mainwaring L, Richards
D The influence of musculoskeletal injury on cognition: implications for concussion research. Am J Sports Med 2011;39(11):2331-2337 doi:10.1177/0363 546511413375
Periodization in Anterior Cruciate Ligament Rehabilitation: New Framework Versus Old Model? A Clinical Commentary International Journal of Sports Physical Therapy
21. Pietrosimone B, Golightly YM, Mihalik JP, Guskiewicz KM. Concussion frequency associates with musculoskeletal injury in retired nfl players. Med Sci Sports Exerc. 2015;47(11):2366-2372. doi:10.1 249/mss.0000000000000684
22. Zimny ML, Schutte M, Dabezies E. Mechanoreceptors in the human anterior cruciate ligament. Anat Rec. 1986;214(2):204-209. doi:10.100 2/ar.1092140216
23. Schultz RA, Miller DC, Kerr CS, Micheli L. Mechanoreceptors in human cruciate ligaments. A histological study J Bone Joint Surg Am 1984;66(7):1072-1076. doi:10.2106/00004623-198466 070-00014
24. Schutte MJ, Dabezies EJ, Zimny ML, Happel LT Neural anatomy of the human anterior cruciate ligament. J Bone Joint Surg Am. 1987;69(2):243-247. d oi:10.2106/00004623-198769020-00011
25. Kennedy JC, Alexander IJ, Hayes KC. Nerve supply of the human knee and its functional importance. Am J Sports Med 1982;10(6):329-335. doi:10.1177/036354 658201000601
26. Barrett D Proprioception and function after anterior cruciate reconstruction. J Bone Joint Surg Br. 1991;73-B(5):833-837 doi:10.1302/0301-620x.73b5.1 894677
27. Borsa PA, Lephart SM, Irrgang JJ, Safran MR, Fu FH. The effects of joint position and direction of joint motion on proprioceptive sensibility in anterior cruciate ligament-deficient athletes. Am J Sports Med. 1997;25(3):336-340. doi:10.1177/03635465970250031 1
28. Kapreli E, Athanasopoulos S. The anterior cruciate ligament deficiency as a model of brain plasticity Med Hypotheses 2006;67(3):645-650. doi:1 0.1016/j.mehy.2006.01.063
29. Konishi Y, Konishi H, Fukubayashi T Gamma loop dysfunction in quadriceps on the contralateral side in patients with ruptured acl. Med Sci Sports Exerc. 2003;35(6):897-900. doi:10.1249/01.mss.000006975 4.07541.d2
Periodization in Anterior Cruciate Ligament Rehabilitation: New Framework Versus Old Model? A Clinical Commentary International Journal of Sports Physical Therapy
THE USE OF MSK ULTRASOUND IN THE EVALUATION OF ELBOW ULNAR COLLATERAL LIGAMENT INJURIES
Robert C. Manske, PT, DPT, Med, SCS, ATC, CSCS
Michael Voight, PT, DHSC, SCS, OCS, ATC, CSCS, FAPTA
Chris Wolfe, PT, DPT, OCS, Cert MDT
Phil Page, PT, PhD, ATC, CSCS, FACSM
ABSTRACT
As physical therapists, understanding the anatomy and biomechanics of the musculoskeletal system is essential for accurate diagnosis and effective treatment outcomes. Musculoskeletal ultrasound (MSK-US is one tool that has revolutionized the way physical therapists evaluate musculoskeletal pathology. Specific to the elbow, assessing the ulnar collateral ligament (UCL) proves especially beneficial for providing both diagnosis and treatment planning. By directly visualizing static and dynamic loads to the ligament, physical therapists can gain valuable information about underlying pathology and guide the therapeutic decision-making process. In this sound byte, we will look at how incorporating MSK-US imaging into your patient assessments can provide you with more comprehensive data to make informed clinical decisions when treating UCL injuries in the elbow.
Overview of elbow anatomy and the role of the ulnar collateral ligament (UCL)
The ulnar collateral ligament (UCL) is a key component of the elbow joint and is the primary restraint to valgus instability. Anatomically, The UCL complex of the elbow is composed of three distinct bands: the anterior band, which assists in flexion and extension; the inferior band, which helps to secure lateral stability; and the posterior oblique band, which runs along a different plane than its counterparts and helps to direct ulnar forces during pronation and supination as well as resisting valgus stress. The anterior bundle is the strongest component of the ligamentous complex and from a functional standpoint; its primary purpose is to restrict valgus stress on the medial aspect of the elbow. The anterior bundle is also composed of two separate bands (anterior and posterior) that provide a
Figure 1a: Patient Position.
Supine with the involved arm abducted to 90 degrees, elbow flexed to 60-90 degrees and maintained in full external rotation. A bolster or towel under the arm applies a passive valgus stress to the elbow placing strain to the UCL ligament. The Green Box outlines the oblique longitudinal/LAX position of transducer.
1b. Transducer Placement.
The transducer is placed in an oblique longitudinal/LAX position.The probe needs to be anterior to the medial epicondyle to visualize the targeted UCL. This LAX position will be used to view either the anterior or posterior bands.
1c: Transducer Placement with Valgus Stress Applied.
With the probe in place, the arm can be rotated back into external rotation with a bolster or towel under the elbow where the valgus stress is reapplied. This exam becomes a dynamic assessment showing the UCL laxity in real time.


MSK ULTRASOUND BITES: TIPS AND TRICKS
Figure
Figure
PATIENT POSITION TRANSDUCER PLACEMENT
NORMAL ANTERIOR BAND IN LONG AXIS (LAX) Transducer Placement: Long Axis (LAX). The probe is placed in an oblique longitudinal/LAX position.
Figures
reciprocal function with the anterior band being tight in extension, while the posterior band is tight in flexion. Attenuation or rupture of the UCL can result in valgus instability.
Exploring the diagnostic criteria for various UCL injuries
There are three main types of UCL injury: partial tear, complete tear, and avulsion fracture. Partial tears are further classified into either grade 1 or grade 2, depending on the severity of the injury. Grade 1 tears are small tears or fraying of the ligament, while grade 2 tears are more significant tears with some loss of function. Complete tears are when the ligament is completely torn, and avulsion fractures occur when a small piece of bone is pulled away from the bony attachment along with the ligament. The diagnosis of UCL injury relies on an accurate history and physical examination. Clinicians must consider several factors when diagnosing UCL injuries, such as activity level, history of any prior injuries, and the individual’s presenting symptoms. Typically, patients with UCL injury will present with either acute or chronic onset of medial elbow pain. Symptoms of UCL injuries include pain and tenderness on the medial side of the elbow, swelling, loss of range of motion, and weakness in grip strength. Physical examination can often reveal crepitus (grating or grinding sensation) and joint line tenderness with palpation. Provocation testing can further localize the symptoms to the medial elbow. Particular attention should be given to ensuring that no other underlying condition is present when diagnosing a UCL injury. Imaging studies such as static radiographs, stress radiographs, and magnetic resonance imaging (MRI) can be helpful in making the diagnosis.
Incorporating musculoskeletal ultrasound in the diagnosis of UCL injuries
The diagnosis of UCL injuries can be complex; however, musculoskeletal ultrasound (MSK-US) is a useful and effective, noninvasive imaging modality for evaluating the UCL of the elbow due to its simplicity and convenience. Since MSK-US is not a radiation-based technology, its use is generally safe and painless for patients. Coupled with fast results and a smaller risk of complications, MSK-US is quickly becoming the go-to imaging method for diagnosing soft tissue issues such as ligament or tendon tears in the elbow region.

MSK-US offers several benefits compared to other imaging modalities in the diagnosis of elbow injuries making it increasingly easier to identify and diagnose UCL tears and other similar pathologies. MSK-US can provide instant realtime images during an examination, allowing examiners to accurately identify and grade any tear that may have occurred due to overuse, trauma or congenital anomalies. The common imaging findings associated with these conditions can be grouped into three distinct categories of MSK-US findings: tendinopathy, discontinuity of the ligament/tendon substance, and foreign bodies such as small particles of debris.
When evaluating a UCL tear with MSK-US, one may observe a widened UCL or redundant folds, irregular hyperechoic structures, clefts or gaps in the ligament coaptation line, discontinuity of continuous fibers within the UCL fibers, or pseudo fluid collections at some locations with laxity. Discontinuity appears as an apparent tear or
2a and 2b:
The normal anterior band of the ulnar collateral ligament is located by finding the hyperechoic bone contour of the medial epicondyle. The ligament is deep to the adjacent flexor tendon. The ulnar collateral ligament will appear hyperechoic and fibrillar. The humero-ulnar joint space must be visible for dynamic testing of the ulnar collateral ligament integrity.
gap between the proximal and distal ends of the tendon/ligament with intra-tendinous hyperechoic areas. A high-resolution MSK-US image can also reveal other pathologies such as tendinopathies, swelling, joint effusions, and cartilage lesions. Tendinopathy consists of irregular fibers within affected muscles or tendons and occasionally thickening around the tendon which may present with hypoechoic regions.Debris in a joint space indicates foreign bodies such as bacteria or nutrient crystals which can cause inflammation and damage to the surrounding tissue. MSK-US can help differentiate these pathologies from chronic disruptions such as UCL tears or instability events. By accurately isolating these imaging findings together with the history and physical examination, MSK-US can safely diagnose and monitor musculoskeletal disorders providing accurate guidance for treatment options.
Technical considerations for musculoskeletal ultrasound examination of the elbow
An MSK-US examination of the elbow requires several technical considerations to achieve an optimal diagnostic result. The transducer must be carefully prepared with a coupling gel and placed perpendicular to the skin surface for a clear picture of the anatomy. Higher frequency transducers do not penetrate tissue as well but provide
resolution of a more superficial structure. Scanning during dynamic movement should also be incorporated when imaging the elbow, as it can provide more detailed images essential for diagnosis in a clinical setting. Additionally, optimize the patient's position so they feel comfortable during imaging and the angle of view is maximized. Following these technical considerations will ensure an optimal MSK-US examination of the elbow.
MSK-US has become a popular modality for evaluating UCL injuries due to its advantages of being cost-effective and avoiding the need for x-rays. Not only does MSK-US offer advantages over traditional diagnostics methods like radiology, but its recent advancements have made it even more efficient and successful in evaluating UCL tears. An advantage of MSK-US is that it can be used in the outpatient setting without prior preparation, such as an injection of contrast materials. In this setting, MSK-US provides excellent imaging of the elbow anatomy which aids in the accurate diagnosis and treatment of UCL injuries. Because of its reliability, MSK-US should be considered when diagnosing possible UCL tears or other elbow pathologies.
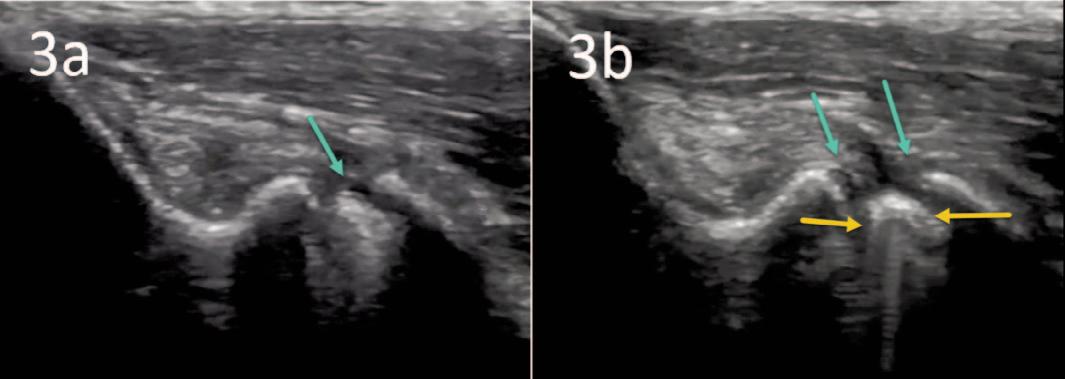
INSTABILITY
Figure 3a: Instability can be seen as a larger joint space (Green Arrows) between the ulna and medial epicondyle indicating a tear of the UCL ligament.
Figure 3b: Under valgus stress, the elbow joint shows widening some echogenic fat (yellow arrows) herniated into the joint with widening of the joint space.


