THE FIFTH WORLD CONGRESS OF SPORTS PHYSICAL THERAPY
JUNE 14-15 | OSLO, NORWAY

INTERNATIONAL JOURNAL OF SPORTS
THERAPY An Official Publication of A North American Sports Medicine Institute Publication
Partnering with
PHYSICAL
I J S PT

INTELECT® RPW 2
NEXT-GENERATION SHOCKWAVE THERAPY
TARGETED PAIN RELIEF
The Intelect® RPW 2 allows for the treatment of indications with pneumatically-generated acoustic waves, or ‘pressure pulses’. The applied pressure pulse propagates radially within the tissue generating a therapeutic effect.
THE INTELECT® RPW 2 IS INDICATED TO TEMPORARILY INCREASE BLOOD FLOW & HELP REDUCE PAIN ASSOCIATED WITH:
• Achilles Tendinopathy1
• Disorders of Tendon Insertions
• Myofascial Trigger Points 2
• Plantar Fasciitis 3
Scan the QR code to request a demo, or visit https://learn.chattanoogarehab.com/ijspt-journal-2024.
1. Gerdesmeyer L, Mittermayr R, Fuerst M, et al. Current evidence of extracorporeal shock wave therapy in chronic Achilles tendinopathy. Int J Surg. 2015;24(Pt B):154-159. doi:10.1016/j.ijsu.2015.07.718
2. Kartaloglu IF, Kus AA. Evaluation of Radial Extracorporeal Shock Wave Therapy on Treatment-Resistant Trigger Points Using Sonographic Shear Wave Elastography. J Coll Physicians Surg Pak. 2023;33(10):1159-1164. doi:10.29271/jcpsp.2023.10.1159
3. Aqil A, Siddiqui MR, Solan M, Redfern DJ, Gulati V, Cobb JP. Extracorporeal shock wave therapy is effective in treating chronic plantar fasciitis: a meta-analysis of RCTs. Clin Orthop Relat Res. 2013;471(11):3645-3652. doi:10.1007/s11999-013-3132-2
T 800.321.9549 F 800.936.6569 DJO, LLC 5919 Sea Otter Place, Suite 200 I Carlsbad, CA 92010 I U.S.A. enovis.com/chattanooga Copyright © 2024 DJO, LLC MKT00-12988 Rev B Individual results may vary. Neither DJO, LLC nor any of the Enovis companies dispense medical advice. The contents of this document do not constitute medical, legal, or any other type of professional advice. Rather, please consult your healthcare professional for information on the courses of treatment, if any, which may be appropriate for you.


PRESENTED BY SUPPORTED BY AND WCSPT MARKETING PARTNER IFSPT TITLE SPONSOR WCSPT GOLD SPONSORS JUNE 14-15 | OSLO Registration still available at WCSPT.org!

SAVE THE DATE! Focus on Neurocognitive Enriched Rehabilitation November 8, 2024 Bern, Switzerland
PHYSICAL THERAPY
IJSPT international JOURNAL OF SPORTS
Board of Directors / Business Advisory Board
Turner A Blackburn, APTA Life Member, AT-Ret, AOSSM-Ret President
Mary Wilkinson Executive Director
Michael Voight Executive Editor and Publisher
Joe Black, PT, DPT, SCS, ATC
Eric Fernandez
Jay Greenstein, DC
Skip Hunter, PT, ATC-Ret
Russ Paine, PT, DPT
Tim Tyler, PT, ATC
Sports Legacy Advisory Board
Turner A. Blackburn, PT, ATC
George Davies, PT, DPT, MEd, SCS, ATC, LAT, CSCS, PES, FAPTA
Terry Malone, PT, PhD
Bob Mangine, PT
Barb Sanders, PT, PhD
Tim Tyler, PT, ATC
Kevin Wilk, PT, DPT, FAPTA
Staff
Executive Editor/Publisher
Michael L. Voight, PT, DHSc, OCS, SCS, ATC, CSCS
Executive Director/Operations and Marketing
Mary Wilkinson
Editor in Chief
Barbara Hoogenboom, PT, EdD, SCS, ATC
Managing Editor
Ashley Campbell, PT, DPT, SCS, CSCS
Manuscript Coordinator
Casey Lewis, PTA, ATC
NORTH
AMERICAN SPORTS MEDICINE INSTITUTE
Publisher
Contact Information
International Journal of Sports Physical Therapy 6011 Hillsboro Pike Nashville, TN 37215, US, http://www.ijspt.org
IJSPT is a monthly publication, with release dates on the first of each month.
ISSN 2159-2896
Underwriting Sponsor Genie Health
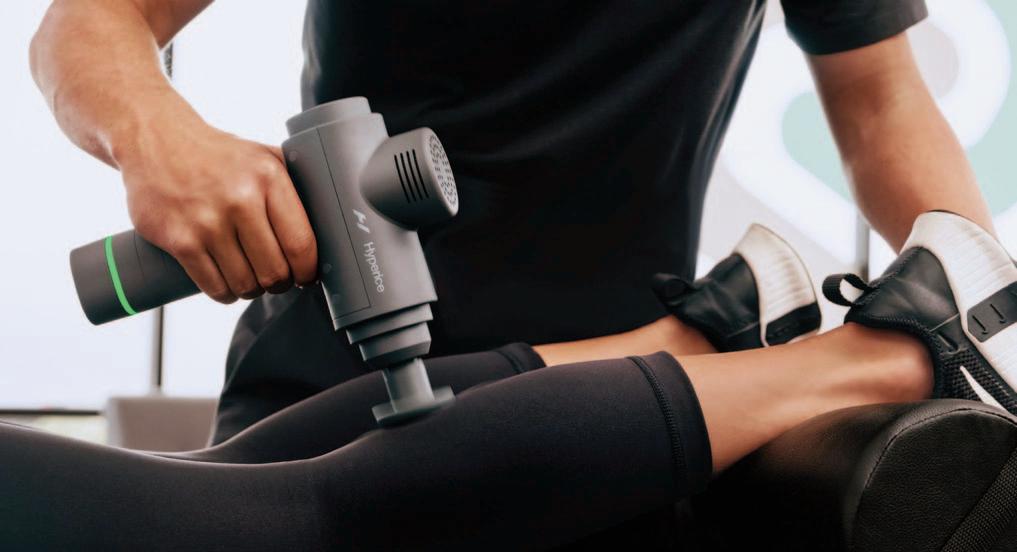
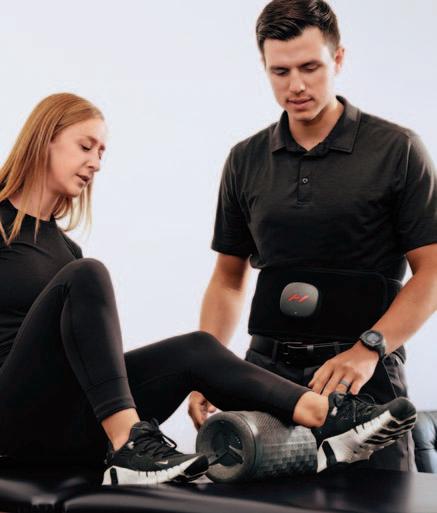
Founding Sponsors Enovis Exertools Hyperice Trazer Woodway
Platinum Sponsors ATI Elvation
Gold Sponsors Hawkgrips Kayezen Structure + Function Education Winback Partners
Northeast Seminars Academy of Human Movement
American Academy of Sports Physical Therapy
IJSPT is an official journal of the International Federation of Sports Physical Therapy (IFSPT). Countries with access to IJSPT as a member benefit. Reach us at www.ifspt.org.
IJSPT is an official journal of the ICCUS Society for Sports Rehabilitation. www.iccus.org

Stand out in your community with a diversified patient experience. Designed to improve outcomes, attract new patients, and increase revenue through insurance, cash-based services, and retail sales.
Gain access to a robust library of research, clinical education, and marketing tools including:
• On-demand clinical education courses
• Written treatment protocols
• Over 50 research studies specific to Hyperice technology
• Marketing tips and best practices including social media content, videos, and more
• Live trainings
Enhance your patient experience with Hyperice
Email rehab@hyperice.com for more information
Designed for clinicians, supported by the world’s best
IJSPT
Executive Editor/Publisher
INTERNATIONAL JOURNAL OF
SPORTS
PHYSICAL THERAPY
Michael L. Voight, PT, DHSc, OCS, SCS, ATC, CSCS
Belmont University
Nashville, Tennessee – USA
Editor in Chief
Barbara Hoogenboom, PT, EdD, SCS, ATC
Grand Valley State University
Grand Rapids, Michigan - USA
Managing Editor
Ashley Campbell, PT, DPT, SCS, CSCS
Nashville Sports Medicine and Orthopaedic Center
Nashville, Tennessee – USA
Manuscript Coordinator
Casey Lewis, PTA, ATC
Nashville Sports Medicine and Orthopaedic Center
Nashville, Tennessee – USA
Executive Director/Marketing
Mary Wilkinson
Indianapolis, Indiana – USA
Editors
Robert Manske PT, DPT, Med, SCS, ATC, CSCS
University of Wichita Wichita, KS, USA
Terry Grindstaff, PT, PhD, ATC, SCS, CSCS
Creighton University Omaha, NE, USA
Phil Page PT, PhD, ATC, CSCS
Franciscan University DPT Program
Baton Rouge, LA, USA
Kevin Wilk PT, DPT, FAPTA
Clinical Viewpoint Editor Champion Sports Medicine Birmingham, AL, USA
International Editors
Luciana De Michelis Mendonça, PT, PhD UFVJM
Diamantina, Brazil
Colin Paterson PT, MSc PGCert(Ed), MCSP, RISPT, SFHEA
University of Brighton Brighton, England, UK
Chris Napier, PT, PhD
Clinical Assistant Professor
University of British Coumbia, Vancouver, BC, Canada
Nicola Phillips, OBE, PT, PhD, FCSP Professor School of Healthcare Sciences Cardiff University, Cardiff, Wales, UK
Associate Editors
Eva Ageberg, PT, PhD Professor, Lund University Lund, Sweden
Lindsay Becker, PT, DPT, SCS, USAW Buckeye Performance Golf Dublin, Ohio, USA
Keelan Enseki, PT, MS, OCS, SCS, ATC University of Pittsburgh Pittsburgh, PA, USA
John Heick, PT, PhD, DPT, OCS, NCS, SCS
Northern Arizona University Flagstaff, AZ, USA
Julie Sandell Jacobsen, MHSc, PhD
VIA University Aarhus, Denmark
RobRoy L. Martin, PhD, PT, CSCS
Duquesne University Pittsburgh, PA, USA
Andrea Mosler, PhD, FACP, FASMF
La Trobe Sport and Exercise Medicine Research Centre, School of Allied Health, Human Services and Sport, La Trobe University Melbourne, Victoria, Australia
Brandon Schmitt, DPT, ATC
PRO Sports Physical Therapy Scarsdale, NY, USA
Barry Shafer, PT, DPT
Elite Motion Physical Therapy Arcadia, CA, USA
Laurie Stickler, PT, DHSc, OCS
Grand Valley State University
Grand Rapids, MI, USA
Editorial Board
James Andrews, MD
Andrews Institute & Sports Medicine Center
Gulf Breeze, AL, USA
Amelia (Amy) Arundale, PT, PhD, DPT, SCS
Red Bull/Ichan School of Medicine
Salzburg, Austria/New York, NY, USA
Gary Austin, PT PhD
Belmont University Nashville, TN, USA
Roald Bahr, MD
Oslo Sports Trauma Research Center
Oslo, Norway
Lane Bailey, PT, PhD
Memorial Hermann IRONMAN Sports Medicine Institute
Houston, Texas, USA
Gül Baltaci, PT,Ph.D. Professor, CKTI, FACSM
Private Guven Hospital Ankara, Turkey
Asheesh Bedi, MD
University of Michigan
Ann Arbor, MI, USA
David Behm, PhD Memorial University of Newfoundland St. John's, Newfoundland, Canada
Barton N. Bishop, PT, DPT, SCS, CSCS Kaizo Clinical Research Institute Rockville, Maryland, USA
Mario Bizzini, PhD, PT Schulthess Clinic Human Performance Lab Zürich, Switzerland
Joe Black, PT, DPT, SCS, ATC Total Rehabilitation Maryville, Tennesse, USA
Turner A. "Tab" Blackburn, APTA Life Member, ATC-Ret, AOSSM-Ret NASMI Lanett, AL, USA
Lori Bolgla, PT, PhD, MAcc, ATC Augusta University Augusta, Georgia, USA
Matthew Briggs The Ohio State University Columbus, OH, USA
Tony Brosky, PT, DHSc, SCS Bellarmine University Louisville, KY, USA
Brian Busconi, MD UMass Memorial Hospital Boston, MA, USA
Robert J. Butler, PT, PhD St. Louis Cardinals St. Louis, MO, USA
Duane Button, PhD Memorial University St. Johns, Newfoundland, Canada
J. W. Thomas Byrd, MD Nashville Sports Medicine and Orthopaedic Center Nashville, TN, USA
Lyle Cain, MD Andrews Institute & Sports Medicine Center Birmingham, AL, USA
Gary Calabrese, PT, DPT Cleveland Clinic Cleveland, Ohio, USA
Meredith Chaput, PT, DPT, SCS Ohio University Athens, OH, USA
Rita Chorba, PT, DPT, MAT, SCS, ATC, CSCS United States Army Special Operations Command Fort Campbell, KY, USA
John Christoferreti, MD Texas Health Dallas, TX, USA
Richard Clark, PT, PhD Tennessee State University Nashville, TN, USA
Juan Colado, PT, PhD University of Valencia Valencia, Spain
Brian Cole, MD Midwest Orthopaedics at Rush Chicago, IL, USA
Ann Cools, PT, PhD
Ghent University Ghent, Belgium
Andrew Contreras, DPT, SCS Washington, DC, USA
George Davies, PT, DPT, MEd, SCS, ATC, LAT, CSCS, PES, FAPTA
Georgia Southern University Savannah, Georgia, USA
Pete Draovich, PT
Jacksonville Jaguars Footbal Jacksonvile, FL, USA
Jeffrey Dugas, MD Andrews Institute & Sports Medicine Center Birmingham, AL, USA
Jiri Dvorak, MD Schulthess Clinic Zurich, Switzerland
Todd Ellenbecker Rehab Plus Phoenix, AZ, USA
Carolyn Emery, PT, PhD University of Calgary Calgary, Alberta, Canada
Ernest Esteve Caupena, PT, PhD University of Girona Girona, Spain
Sue Falsone, PT, MS, SCS, ATC, CSCS, COMT Structure and Function Education and A.T. Still University Phoenix, Arizona, USA
J. Craig Garrison, PhD, PT, ATC, SCS Texas Health Sports Medicine Fort Worth, Texas, USA
Maggie Gebhardt, PT, DPT, OCS, FAAOMPT Fit Core Physical Therapy/Myopain Seminars Atlanta, GA and Bethesda, MD, USA
Lance Gill, ATC
LG Performance-TPI Oceanside, CA, USA
Phil Glasgow, PhD, MTh, MRes, MCSP Sports Institute of Northern Ireland Belfast, Northern Ireland, UK
Robert S. Gray, MS, AT Cleveland Clinic Sports Health Cleveland, Ohio, USA
Jay Greenstein, DC Kaizo Health Baltimore, MD, USA
EDITORIAL BOARD
EDITORIAL BOARD
Martin Hagglund, PT PhD
Linkoping University Linkoping, Sweden
Allen Hardin, PT, SCS, ATC, CSCS
University of Texas Austin, TX, USA
Richard Hawkins, MD
Professor of surgery, University of South Carolina
Adjunct Professor, Clemson University
Principal, Steadman Hawkins, Greenville and Denver (CU)
John D.Heick, PT, PhD, DPT, OCS, NCS, SCS
Northern Arizona University Flagstaff, AZ, USA
Tim Hewett, PhD
Hewett Consulting Minneapolis, Minnesota, USA
Per Hølmich, MD
Copenhagen University Hospital Copenhagen, Denmark
Kara Mae Hughes, PT, DPT, CSCS
Wolfe PT Nashville, TN, USA
Lasse Ishøi, PT, MSc
Sports Orthopedic Research Center
Copenhagen University Hospital Hvidovre, Denmark
Jon Karlsson, MD Sahlgrenska University Goteborg, Sweden
Brian Kelly, MD Hospital for Special Surgery New York, NY, USA
Benjamin R. Kivlan, PhD, PT, OCS, SCS Duquesne University Pittsburgh, PA, USA
Dave Kohlrieser, PT, DPT, SCS, OCS, CSCS
Ortho One Columbus, OH, USA
Andre Labbe PT, MOPT
Tulane Institute of Sports Medicine New Orleans, LA USA
Henning Langberg, PT, PhD University of Copenhagen Copenhagen, Denmark
Robert LaPrade, MD Twin Cities Orthopedics Edina, MN, USA
Lace Luedke, PT, DPT University of Wisconsin Oshkosh Oshkosh, WI, USA
Phillip Malloy, PT, PhD
Arcadia University/Rush University Medical Center Glenside, PA and Chicago, IL, USA
Terry Malone, PT, EdD, ATC, FAPTA University of Kentucky Lexington, KY, USA
Robert Mangine, PT University of Cincinnati Cincinnati, OH, USA
Eric McCarty, MD University of Colorado Boulder, CO, USA
Ryan P. McGovern, PhD, LAT, ATC Texas Health Sports Medicine Specialists Dallas/Fort Worth, Texas, USA
Mal McHugh, PhD
NISMAT
New York, NY, USA
Joseph Miller, PT, DSc, OCS, SCS, CSCS
Pikes Peak Community College Colorado Springs, CO, USA
Havard Moksnes, PT PhD
Oslo Sports Trauma Research Center Oslo, Norway
Andrew Murray, MD, PhD
European PGA Tour Edinburgh, Scotland, UK
Andrew Naylor, PT, DPT, SCS
Bellin Health
Green Bay, WI, USA
Stephen Nicholas, MD NISMAT New York New York, NY, USA
John O'Donnel, MD
Royal Melbourne Hospital Melbourne, Australia
Russ Paine, PT McGovern Medical School Houston, TX, USA
Snehal Patel, PT, MSPT, SCD
HSS Sports Rehabilitation Institute New York, NY, USA
Marc Philippon, MD
Steadman-Hawkins Clinic Vail, CO, USA
Kevin Plancher, MD, MPH, FAAOS
Plancher Orthopedics and Sports Medicine
New York, NY USA
Marisa Pontillo, PT, PhD, DPT, SCS
University of Pennsylvania Health System Philadelphia, PA, USA
Matthew Provencher, MD
Steadman Hawkins Clinic Vail, CO, USA
Charles E. Rainey, PT, DSc, DPT, MS, OCS, SCS, CSCS, FAAOMPT
United States Public Health Service Springfield, MO, USA
EDITORIAL BOARD
Alexandre Rambaud, PT PhD Saint-Etienne, France
Carlo Ramponi, PT Physiotherapist, Kinè Rehabilitation and Orthopaedic Center Treviso, Italy
Michael Reiman, PT, PhD Duke University Durham, NC, USA
Mark F. Reinking, PT, PhD, SCS, ATC Regis University Denver, CO, USA
Mark Ryan, ATC Steadman-Hawkins Clinic Vail, CO, USA
David Sachse, PT, DPT, OCS, SCS USAF San Antonio, TX, USA
Marc Safran, MD Stanford University Palo Alto, CA, USA
Alanna Salituro, PT, DPT, SCS, CSCS New York Mets Port Saint Lucie, FL, USA
Mina Samukawa, PT, PhD, AT (JSPO) Hokkaido University Sapporo, Japan
Barbara Sanders, PT, PhD, FAPTA, Board Certified Sports Physical Therapy Emeritus Professor and Chair, Department of Physical Therapy Texas State University Round Rock, TX, USA
Felix “Buddy” Savoie, MD, FAAOS Tulane Institute of Sport Medicine New Orleans, LA, USA
Teresa Schuemann, PT, DPT, ATC, CSCS, Board Certified Specialist in Sports Physical Therapy Evidence in Motion Fort Collins, CO, USA
Timothy Sell, PhD, PT, FACSM Atrium Health Musculoskeletal Institute Charlotte, NC, USA
Andreas Serner, PT PhD
Aspetar Orthopedic and Sports Medicine Hospital Doha, Qatar
Ellen Shanley, PT, PhD ATI Spartanburg, SC, USA
Karin Silbernagel, PT, PhD University of Delaware Newark, DE, USA
Holly Silvers, PT, PhD Velocity Physical Therapy Los Angeles, CA, USA
Lynn Snyder-Mackler, PT, ScD, FAPTA STAR University of Delaware Newark, DE, USA
Alston Stubbs, MD Wake Forest University Winston-Salem, NC, USA
Amir Takla, B.Phys, Mast.Physio (Manip), A/Prof
Australian Sports Physiotherapy The University of Melbourne Melbourne, Australia
Charles Thigpen, PhD, PT, ATC ATI
Spartanburg, SC, USA
Steven Tippett, PT, PhD, ATC, SCS Bradley University Peoria, IL, USA
Tim Tyler, PT, ATC NISMAT New York, NY, USA
Timothy Uhl, PT, PhD, ATC University of Kentucky Lexington, KY, USA
Bakare Ummukulthoum, PT University of the Witswatersrand Johannesburg, Gauteng, South Africa
Yuling Leo Wang, PT, PhD Sun Yat-sen University Guangzhou, China
Mark D. Weber, PT, PhD, SCS, ATC Texas Women’s University Dallas, TX, USA
Richard B. Westrick, PT, DPT, DSc, OCS, SCS US Army Research Institute Boston, MA, USA
Chris Wolfe, PT, DPT Belmont University Nashville, TN, USA
Tobias Wörner, PT, MSc Lund University Stockholm, Sweden
TABLE
PAGE TITLE
ORIGINAL RESEARCH
657 Uninvolved Limb Strength is Not Reduced in Military Cadets Who Have Returned to Unrestricted Activity Following ACL Injury: Implications for Symmetry as a Marker of Sufficient Strength.
Hartshorne MT, Turner JA, Cameron KL, et al.
670 Functional Performance and Tendon Morphology After Operative or Nonoperative Treatment of Achilles Tendon Ruptures.
Zhu S, Garofalo J, Abuhantash A, et al.
681 Postural Control During Single-Leg Landing in Female Athletes After Anterior Cruciate Ligament Reconstruction.
Agura A, Miyazaki T, Ida H, et al.
692 Pre- and Post-Operative Pain Intensity and Physical Activity Levels in Individuals with Acetabular Dysplasia Undergoing Periacetabular Osteotomy: A Prospective Cohort Study.
Alrashdi NZ, Motl RW, Aguiar EJ, et al.
704 Reliability of Spatiotemporal Characteristics During Single-Legged Hop and Bilateral Drop Jump Tasks Using an Instrumented Pressure Walkway.
Post A, McManigal M, Allen M, et al.
714 Effect of Sex and Lateral Ankle Sprain History on Dorsiflexion Range of Motion Asymmetry During the Weight Bearing Lunge Test
Cady K, De Ste Croix M, Deighan M
724 Periscapular Strength Profile Changes in Collegiate Baseball Pitchers Over the Course of a Season Pabian PS, Roach V, Howard R, et al.
CASE SERIES
735 Effects of Low-Load Blood Flow Restriction Training on Rotator Cuff Strength and Hypertrophy: Case Series.
Safford DW, Shah KM, Breidenbach F, et al.
CASE REPORT
745 Rehabilitation Following ACL Repair with Internal Brace Ligament Augmentation in Female Gymnast: A Resident’s Case Report.
Haack C, Moser MW, Zeppieri G
INVITED COMMENTARY
758 Pain Neuroscience Education for Acute Pain.
Louw A, Schuemann T, Zimney K, et al.
MSK USB: TIPS AND TRICKS
768 Use of Diagnostic Musculoskeletal Ultrasound in the Evaluation of Piriformis Syndrome: A Review for Rehabilitation Providers.
Manske RC, Wolfe C, Page P, Voight M, Bardowski B.
Digital Health Corner by PT Genie
773 Data-Driven Prognosis and Improved Outcomes Part 3: Clinical Intelligence vs. Clinical Wisdom. Gray Cook, MSPT, OSC, CSCS
Abstracts from the Fifth World Congress of Sports Physical Therapy
776 OSLO, NORWAY, JUNE 14-15, 2024
OF CONTENTS VOLUME 19, NUMBER 6


sports genie PT genie woRx genie digital physical therapy solution combining remote monitoring
telehealth in-clinic
risk
revenue staffing challenges accessibility
and
and remote sports/functional assessment and management
assessment and remote management tools for occupational health
fee-for-service
genie health at a glance... deliver a virtual therapy solution tech platform & optional clinical staff turn-key solution to your organization genie.health | sales@genie.health | 321-558-6855 improve Drive revenue through remote monitoring
Founded by two prominent orthopedic surgeons and leveraged by two of the top 10 largest orthopedic groups in the country, Genie Health is managed by therapists and industry experts. Featuring a monitored HEP using computer vision, Genie Health offers both
and valuebased-care models on the same platform.
Cohorts run for a duration of 13 months, August through the following September. Application windows opens from October-December of the preceding year through RF-PTCAS.

TRANSFORM YOUR CAREER by interacting and training with leading clinicians, educators and researchers from the industry’s best! Orthopedic Residency Upper Extremity Athlete Fellowship Sports Residency Seattle, WA Ortho Phoenix, AZ Sports Chicago, IL Sports Birmingham, AL Sports Greenville, SC Ortho/Sports Charleston, SC Sports Baltimore, MD Sports Boston, MA Ortho Washington, D.C. Area Ortho
JOIN
TEAM
OUR
TODAY!


GOLD STANDARD OF IASTM NEW TOPICAL SOLUTIONS CERTIFICATION COURSES ® GET A GRIP ON SOFT TISSUE INJURIES See what’s new at HawkGrips Scan me www.HawkGrips.com • info@hawkgrips.com • 484-351-8050
Most Advanced Electrotherapy Device: Powerful, intuitive and user-friendly
Treat up to three body zones at once on all types of tissues
Effective in less than 10 minutes Enter A New Era of Therapy
TECAR
HIGH FREQUENCY
Metabolic Action at Cell Level
Hi-TENS
LOW FREQUENCY IN PULSED HIGH FREQUENCY
Ultimate Pain Management
Hi-EMS
MEDIUM FREQUENCY
Deep Muscle Contraction
Access BACK4 Case Studies Schedule a consultation with a Winback Expert hello@winback.com 133 Westchester Ave Ste N-220 White Plains NY 10604 www.winback.com www.winback-academy.org

https://sportspt.org/Members/Members/Ev ent_Display.aspx?EventKey=AMSC24


Hartshorne MT, Turner JA, Cameron KL, Padua DA. Strength of the Uninvolved Limb Following Return to Activity After ACL Injury: Implications for Symmetry as a Marker of Sufficient Strength. IJSPT. Published online June 1, 2024:657-669.
doi:10.26603/001c.117547
Strength of the Uninvolved Limb Following Return to Activity After ACL Injury: Implications
for Symmetry as a Marker of Sufficient Strength
Matthew T Hartshorne
1a ,
Jeffrey A Turner
1 ,
Kenneth L Cameron
2 ,
Darin A Padua
3
1 Human Movement Science Curriculum, University of North Carolina at Chapel Hill, 2 Keller Army Hospital, 3 Department of Exercise and Sport Science, University of North Carolina at Chapel Hill
Keywords: ACL, anterior cruciate ligament, hamstring strength, hip strength, limb symmetry index, muscle strength, quadriceps strength, return to sport
https://doi.org/10.26603/001c.117547
International Journal of Sports Physical Therapy
Background
Muscular strength deficits are common after ACL injury. While the Limb Symmetry Index (LSI), using the uninvolved limb as a reference, is widely used, negative strength adaptations may affect both limbs post-injury. It is uncertain how the strength of the uninvolved limb in those with an ACL injury compares to uninjured individuals, making it unclear whether it is appropriate as a benchmark for determining sufficient strength.
Purpose
To compare the strength of key lower extremity muscles of the uninvolved limb in those with history of ACL injury (ACL-I) to the dominant limb in individuals with no history of ACL injury (control).
Study Design
Cross-sectional study
Methods: A total of 5,727 military cadets were examined, with 82 females and 126 males in the ACL-I group and 2,146 females and 3,373 males in the control group. Maximum isometric strength was assessed for six muscle groups measured with a hand-held dynamometer Separate two-way ANOVAs with limb and sex were performed for each muscle group.
Results
Significant main effects for limb were observed with the uninvolved limb in the ACL-I group displaying greater strength compared to the dominant limb in the control group for the quadriceps, hamstrings, and gluteus medius, but effect sizes were small (Cohen’s d <0.25). Significant main effects for sex were observed with greater male muscular strength in all six muscle groups with small to large effect sizes (Cohen’s d 0.49-1.46). No limb-by-sex interactions were observed.
Conclusions
There was no evidence of reduced strength in the uninvolved limb in those with a history of ACL injury compared to the dominant limb in those with no prior ACL injury. This finding suggests that, after clearance to return to activities, the uninvolved limb can be used as a standard for comparison of sufficient strength, including when using the LSI. Level of Evidence: Level 3
a
Corresponding Author: Matthew T. Hartshorne PT, DPT
Human Movement Science Curriculum
University of North Carolina at Chapel Hill, CB #8700, 209 Fetzer Hall, Chapel Hill, NC 27599
Email: hartmatt@email.unc.edu
Original Research
INTRODUCTION
An estimated 200,000 people suffer an anterior cruciate ligament (ACL) injury each year1,2 with a higher injury rate in females than males.3 While many people will undergo an ACL reconstruction (ACLR) and/or perform physical rehabilitation, evidence suggests that only 70% will return to their previous level of function.4 For those that do return to sport, approximately 30% will be at risk of suffering a subsequent ACL injury to either the contralateral limb or ipsilateral limb.5
Previous authors have shown that deficits of muscular strength, particularly in the quadriceps,6‑8 hamstrings,8,9 hip abductors,4,10,11 hip extensors,12‑14 and hip rotators15 of the involved side exist and may persist for many years after injury16 and contribute to poor long-term outcomes by allowing for reduced knee joint stability, altered biomechanics, and a diminished ability to adequately dampen impact forces during different weightbearing and landing activities.4,6,17 Additionally, muscular strength deficits and asymmetries between the involved side and the uninvolved side are a risk factor for primary18 and secondary19 ACL injury. Therefore, identifying muscular strength deficits may be a critical component for secondary and tertiary injury risk reduction efforts.
Limb symmetry index (LSI) is one of the most common methods for identifying muscular strength deficits in those who have suffered a prior ACL injury 20 LSI is calculated by dividing the strength of the involved limb by the strength of the uninvolved limb and multiplying that by 100 to get a percentage, equation provided below in (1).21 While using the LSI has become standard practice, sports medicine professionals and researchers have raised concerns about using the uninvolved limb as a reference, as negative strength adaptations may occur in both limbs after ACL injury 20, 22‑26 Furthermore, after ACLR, people often demonstrate muscle strength deficits in both the involved and uninvolved limbs when compared to their uninjured peers.23,27 Since the uninvolved limb in those with an ACLR appears to be weaker than their uninjured peers, this calls into question the appropriateness of using the uninvolved limb as the standard for comparison after an ACL injury
Research on the strength of the uninvolved limb in individuals with ACL injury compared to healthy individuals is more extensively available for the quadriceps8,15,23,28 and hamstrings,3,8,23,28 and less so, for the gluteus medius,8,15 gluteus maximus,8,15,29 hip external rotators,15 and hip internal rotators.15 However, interpretation of this research is challenging due to variations in populations studied, including age,30 sport,19,30 and athletic level,19,30 small sample sizes,4,8,26,31 inconsistent testing times after injury,8,28, 32,33 limited muscle groups tested,32‑34 and differences in testing parameters such as muscle contraction type15,30,35 and speed.28,30,35
Thus, it is not clear if muscular strength in the uninvolved limb of those with ACL injury history is reduced compared to those with no prior ACL injury. Therefore, the
primary purpose of this study was to compare the strength of key lower extremity muscles of the uninvolved limb in those with history of ACL injury (ACL-I) to the dominant limb in individuals with no history of ACL injury (control). These key muscles include: the quadriceps, hamstrings, gluteus medius, gluteus maximus, hip external rotators, and hip internal rotators. The hypothesis was that the uninvolved (UNINV) limb in the ACL-I group would demonstrate muscle strength deficits in all muscle groups when compared to the dominant (DOM) limb of the control group. While the study design did not allow for control of every potential confounding factor in the interpretation mentioned previously, the methods employed are believed to enhance the clinical significance of the findings within the defined scope of this study
METHODS
This study uses data from the 2005-2009 years of enrollment in the JUMP-ACL (Joint Undertaking to Monitor and Prevent ACL Injury) study, a prospective cohort study of biomechanical risk factors for ACL injury. Participants were included if they recorded successful trials of the six muscle groups of interest. This paper represents a cross-sectional analysis of the baseline data collected at the time of enrollment to describe the strength difference of six muscle groups between the UNINV limb in the ACL-I group compared to the DOM limb of the control group.
PARTICIPANTS
A total of 5,908 cadets and midshipmen at the United States (U.S.) Air Force, Military and Naval Academies participated in the study and performed initial biomechanical testing during their initial summer of training (Figure 1). Informed consent was obtained from each participant in accordance with each institution’s review board. At the time of data collection, participants without a current musculoskeletal injury and were able to perform the study tasks were included. Participants were identified as having an ACL injury history (ACL-I group) or no prior ACL injury (control group) via self-report on the baseline questionnaire administered at the time of informed consent. Those in the ACL-I group had to receive a medical waiver through the Department of Defense Medical Evaluation Review Board and were deemed fit to participate in the physically demanding military training program at the U.S. Service Academies and had no physical activity restrictions at the time of consent. Additionally, from the original dataset, only participants who performed all strength tests were included in this study’s data analysis.
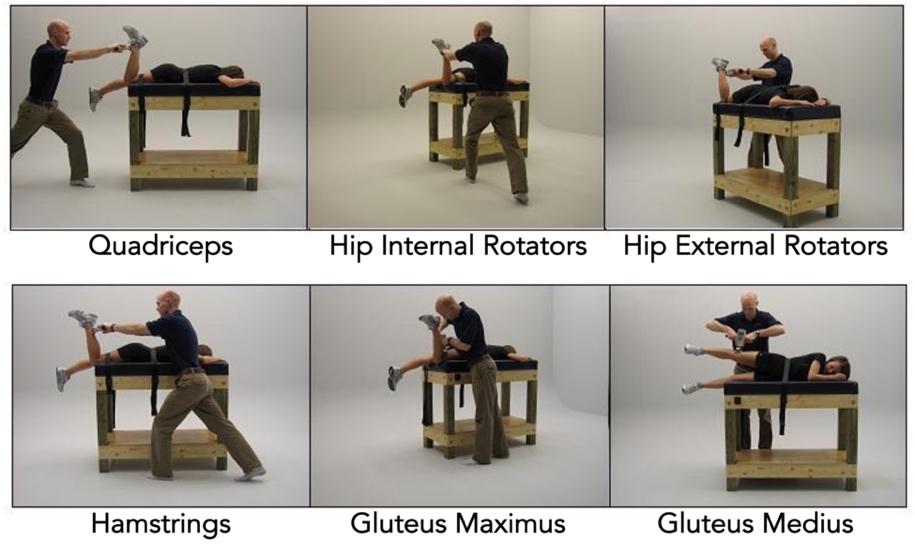
MUSCLE STRENGTH
Isometric strength of the quadriceps, hamstrings, gluteus medius, gluteus maximus, hip external rotators, and hip internal rotators were assessed using a hand-held dynamometer (NexGen Ergonomics, Quebec, Canada). At the time of data collection, the testing was carried out by a
Strength of the Uninvolved Limb Following Return to Activity After ACL Injury: Implications for Symmetry International Journal of Sports Physical Therapy
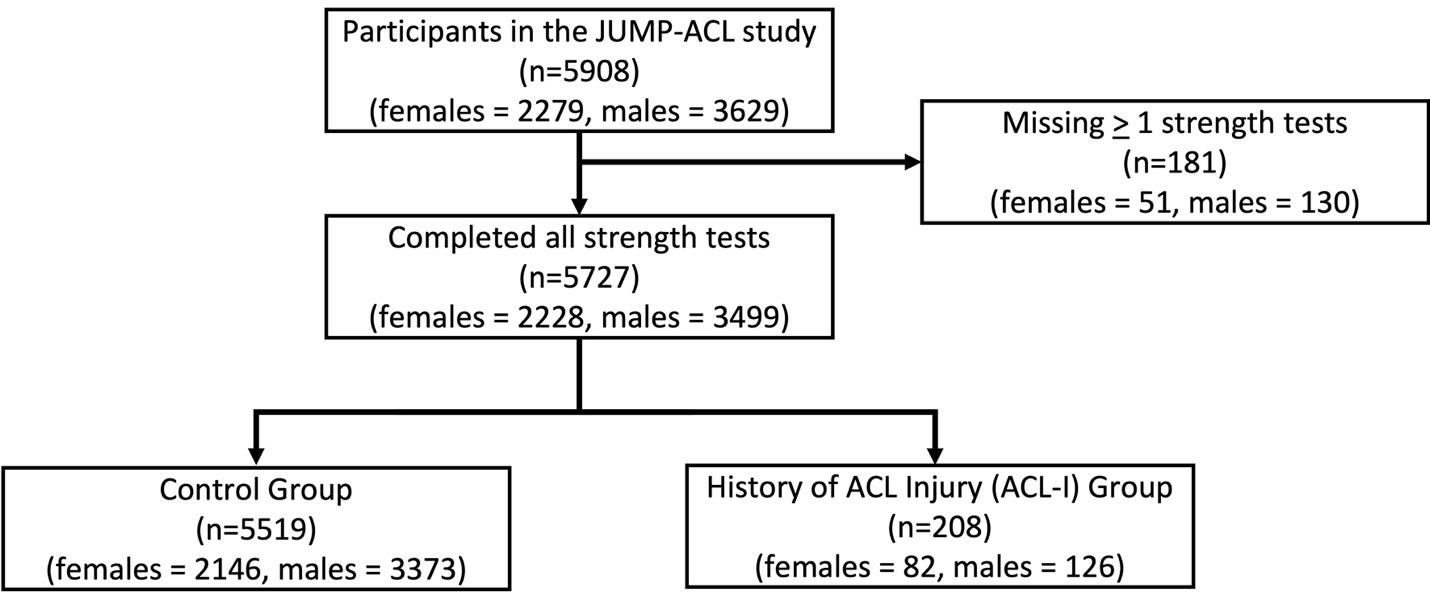
Figure 1. Flow diagram for enrollment of participants and group allocation
team of Certified Athletic Trainer Research Assistants, each of whom underwent a standardized training regimen and successfully passed a comprehensive validation assessment to ensure their competence. Previous studies have shown their intra-rater reliability (ICC2,k) for the testing positions (Figure 2) to range from 0.73 to 0.98.36 These specific testing positions were selected to minimize participant movement while ensuring efficient assessment of strength, given that strength testing was integrated into the procedures of a large-scale data collection. In the control group, the DOM limb, defined as the preferred leg to kick a ball, was used for testing while the UNINV limb was tested in the ACL-I group. In the control group, the DOM limb was selected to undergo testing as it has been demonstrated to be as strong or stronger than the non-dominant limb.37,38 This decision ensures that the ACL-I group’s UNINV limb would be compared to the highest standard. Participants were asked to push into the dynamometer as hard as they could for five seconds (Supplemental File 1). The mean force measurements across two 5-second trials were averaged together All strength values were converted to torque by multiplying the recorded force (N) by the participant’s lever arm length (m), which was measured as the distance from the lateral femoral epicondyle to the location of the dynamometer for the quadriceps and hamstrings and from the superior aspect of the greater trochanter to the location of the dynamometer for the gluteus medius and gluteus maximus. All torque values were then normalized to the participant’s body mass, as seen in (2).
DATA PROCESSING
The primary outcome variable of interest was the average mean isometric muscular strength of six different muscle groups between the uninvolved (UNINV) limb in those with a history of ACL injury who had returned to unrestricted activities (ACL-I group) to the dominant (DOM) limb in individuals with no history of ACL injury (control group). Each group’s strength variables were graphically analyzed for normality Additionally, the strength variables underwent several data cleaning steps, including 1) winsorizing outliers that were ± 3 SD above and below the mean (<1% of variables for each muscle group for the control group and 0% for the ACL-I group), and 2) removal of rows with miss-
ing data. Missingness accounted for <1.6% of the dataset, given the large sample size it is a reasonable strategy to opt for removal as a means for handling missing data.39
DATA ANALYSIS
All analyses were completed using RStudio Version 1.3.1073. Data were analyzed by conducting separate twoway analyses of variance (ANOVA) considering sex (female, male) and limb (UNINV in ACL-I group, DOM limb in the control group) for each of the six muscle groups tested using a priori alpha level of 0.05. To complement the p-values, effect sizes using Cohen’s d (d) were calculated for the main effects of sex and limb strength to provide a more comprehensive characterization of differences between groups. Effect size magnitude was interpreted as trivial (0-0.19), small (0.20-0.49), medium (0.50-0.79) and large (>0.8).40 Polarity of the effect sizes were adjusted so that positive effect sizes indicated increased strength in the UNINV limb compared to the DOM limb or increased male muscular strength compared to females. Negative effect sizes indicated reduced strength in the UNINV limb compared to the DOM limb or increased female muscular strength compared to males.
RESULTS
Baseline demographic information for each group at the time of enrollment is presented in Table 1 and the observed strength values for each limb (DOM, UNINV) by sex (females, males) are presented in Table 2. The results indicate significant main effects for limb, with the UNINV limb being stronger in the quadriceps (F1,5723 = 7.926, p = 0.005), hamstrings (F1,5723 = 4.256, p = 0.039), and gluteus medius (F1,5723 = 12.520, p <0.001), but not for the gluteus maximus (F1,5723 = 0.244, p = 0.621), hip external rotators (F1,5723 = 0.674, p = 0.412), or the hip internal rotators (F1,5723 = 0.075, p = 0.784) (Figure 3). Limb differences in strength showed trivial to small effect sizes (d) were present for the of the quadriceps (d = 0.16, 95% CI: 0.02-0.30), hamstrings (d = 0.13, 95% CI: -0.01-0.27), gluteus medius (d = 0.24, 95% CI: 0.10-0.38), gluteus maximus (d = -0.04,
Figure 2. Isometric strength testing positions for each muscle group.
Strength of the Uninvolved Limb Following Return to Activity After ACL Injury: Implications for Symmetry International Journal of Sports Physical Therapy
Table 1. Participant demographics by group and sex. Values are presented as mean ± SD.
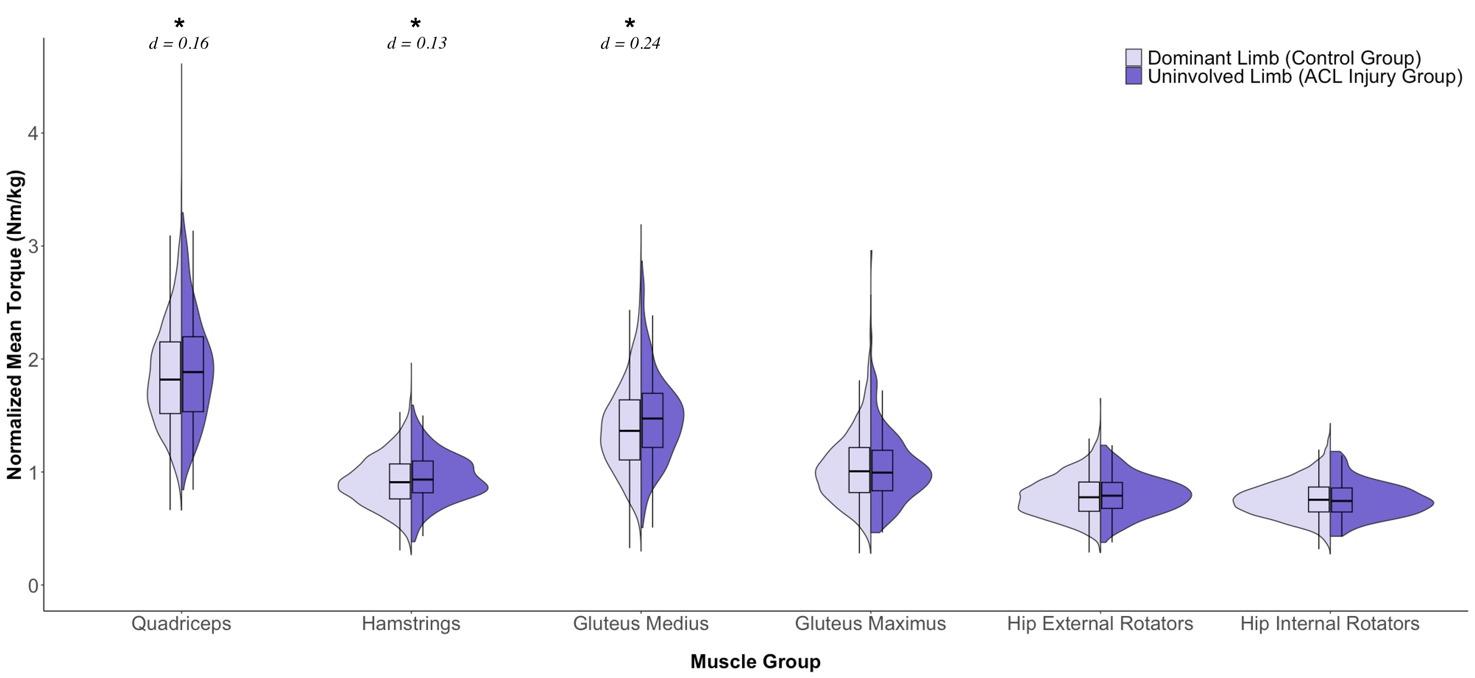
Figure 3. Difference in muscle strength of the six muscle groups between the DOM limb of the control (light purple) and the UNINV limb of the ACL-I (dark purple) groups during the hand-held dynamometer isometric muscle strength testing. This illustration is the combination of a violin plot and box plot to aid the best representation of the data. The shaded area reports the kernel distribution of the data. Overlaid is a box plot, with the box representing the 25th-to-75th percentile. The whiskers describe the upper and lower limits of the data. The median of the data is represented by the solid line. There was a significant main effect for limb in the quadriceps, hamstrings, and gluteus medius, but not for the gluteus maximus, hip external rotators, or hip internal rotators. While there were significant main effects for limb, effect sizes were trivial to small for all muscles (effect size (d) range -0.04 – 0.24), with greater strength in the UNINV limb compared to the DOM limb in all the muscles groups except for gluteus maximus, hip external rotators, and the hip internal rotators. ACL-I = participants with a history of a prior anterior cruciate ligament injury; DOM = dominant leg of the control group; UNINV = uninvolved limb of the ACL-I group; * = p < 0.05.
95% CI: -0.18-0.10), hip external rotators (d = 0.04, 95% CI: -0.10-0.18), and hip internal rotators (d = -0.02, 95% CI: -0.16-0.12).
Significant main effects for sex were observed, with males demonstrating greater strength in the quadriceps (F1,5723 = 2519.699, p <0.001), hamstrings (F1,5723 = 1251.848, p <0.001), gluteus medius (F1,5723 = 492.309, p <0.001), gluteus maximus (F1,5723 = 335.107, p <0.001), hip external rotators (F1,5723 = 2968.519, p <0.001), and hip internal rotators (F1,5723 = 545.594, p <0.001) (Figure 4). Effect sizes ranged from small to large for the sex differences in strength of the quadriceps (d = 1.36, 95% CI: 1.30 -1.42),
hamstrings (d = 0.96, 95% CI: 0.90-1.01), gluteus medius (d = 0.60, 95% CI: 0.55-0.66), gluteus maximus (d = 0.50, 95% CI: 0.44-0.55), hip external rotators (d = 1.48, 95% CI: 1.42 -1.54), and hip internal rotators (d = 0.63, 95% CI: 0.58-0.69).
There were no limb-by-sex interactions observed for the quadriceps (F1,5723 = 0.008, p = 0.927), hamstrings (F1,5723 = 0.416, p = 0.519), gluteus medius (F1,5723 = 1.034, p = 0.309), gluteus maximus (F1,5723 = 2.830, p = 0.093), hip external rotators (F1,5723 = 0.520, p = 0.471), or hip internal rotators (F1,5723 = 3.695, p = 0.055) (Table 2). The lack of a significant limb-by-sex interaction indicates that the observed
ACL-I Group (n=208) Control Group (n = 5,519) Sex 82 Females 126 Males 2,146 Females 3,373 Males Age (years) 18.71+0.77 19.06+1.01* 18.57+0.77 18.86+0.96 Height (cm) 165.64+6.50 178.70+7.23 165.63+6.54 178.08+7.15 Mass (kg) 64.00+8.41 81.68+13.81* 62.87+7.97 77.39+12.30 ACL-I Prior ACL injury group; Control No prior ACL injury group *indicates statistically higher value compared to males in the control group (p<0.05)
Strength of the Uninvolved Limb Following Return to Activity After ACL Injury: Implications for Symmetry International Journal of Sports Physical Therapy
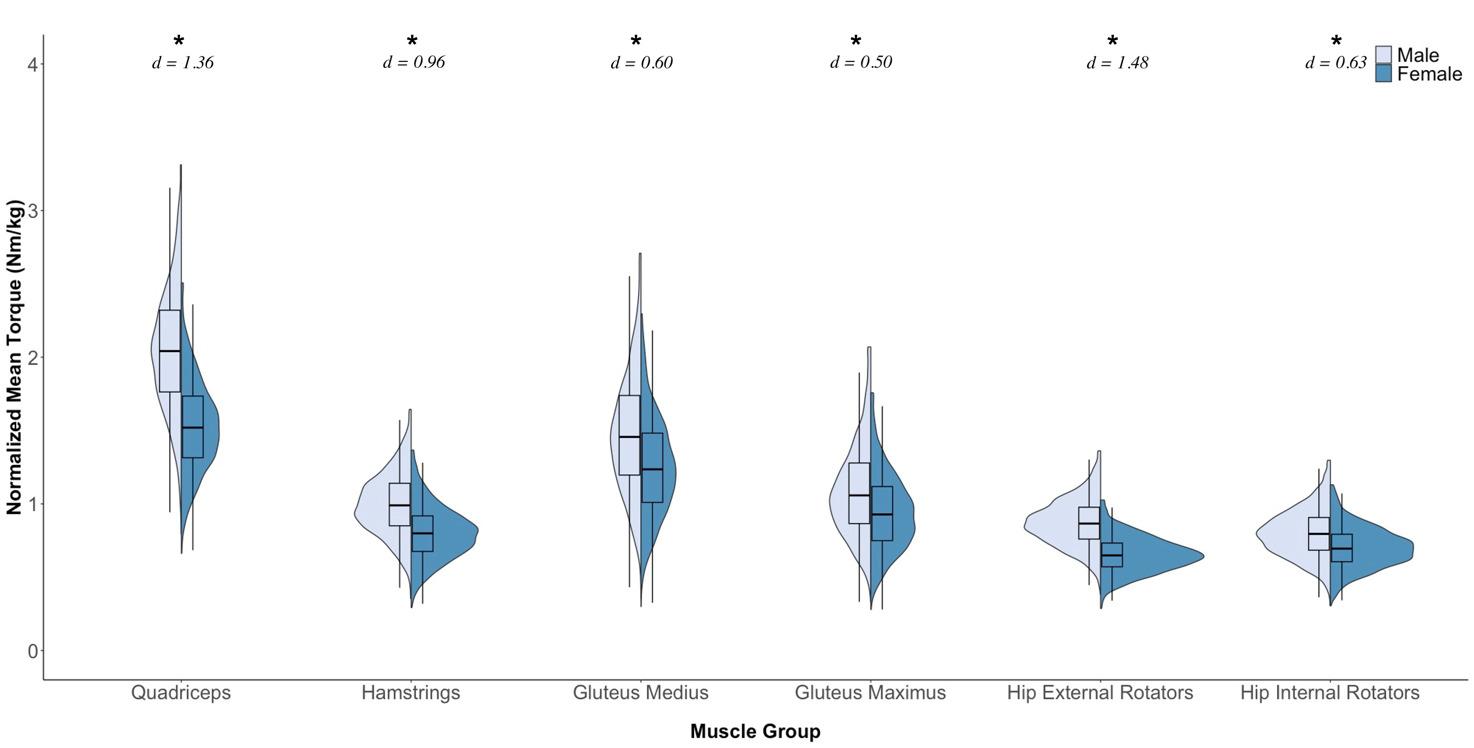
Figure 4. Difference in muscle strength of the six muscle groups between males (light blue) and females (dark blue) during the hand-held dynamometer isometric muscle strength testing. This illustration is the combination of a violin plot and box plot to aid the best representation of the data. The shaded area reports the kernel distribution of the data. Overlaid is a box plot, with the box representing the 25th-to-75th percentile. The whiskers describe the upper and lower limits of the data. The median of the data is represented by the solid line. There was a significant main effect for sex in all the muscle groups tested. There were small to large effect sizes for all muscles (effect size (d) range 0.50 – 1.48), with greater strength in males than females in all the muscle groups. * = p < 0.05.
differences in strength between limbs was similar for males and females.
DISCUSSION
The primary purpose of this study was to compare the muscular strength of the uninvolved (UNINV) limb in those with a history of ACL injury who had returned to unrestricted activities (ACL-I group) to the dominant (DOM) limb in individuals with no history of ACL injury (control group). The most important finding was that there was no clinically meaningful evidence (effect size, d < 0.25) of strength deficits in the UNINV limb for the quadriceps, hamstrings, gluteus medius, gluteus maximus, hip external rotators, or hip internal rotators muscle groups. While the UNINV limb in the ACL-I group displayed statistically higher strength values for the quadriceps, hamstrings, and gluteus medius muscle groups when compared to the DOM limb of the control group. This may be secondary to compensatory movement patterns and/or neuromuscular control changes developed after injury, resulting in more load on the uninvolved limb, which has been shown in other literature.41‑45 Given the small effect sizes, it is important to interpret the significance of the findings with caution as they might not be clinically meaningful. Take into consideration that larger sample sizes used in studies can increase the likelihood of detecting statistically significant differences (p-value < 0.05) even when the effect size is negligible, resulting in type I errors or false positives. Therefore, the results indicate that in those who have returned to unrestricted activities after ACLR, the UNINV limb’s strength can be used as a benchmark for determining if the individual has sufficient strength by comparing it to their involved limb.
The sample included in this study was substantial, with 5,519 participants in the control group and 208 participants in the ACL-I group, which represents the largest study examining lower extremity strength profiles to the best
Table 2. Sex-and Limb-Specific Differences in Lower Extremity Muscle Torque. Strength values are presented as mean + SD (95% CI)
Muscle Group
Quadriceps†‡
Hamstrings†‡
Gluteus Medius†‡
Gluteus Maximus‡
Hip External Rotators‡
Hip Internal Rotators‡
Injury Group
Female Muscle Torque (Nm/kg) Male Muscle Torque (Nm/kg)
(1.54-1.67)
(1.52-1.55)
(0.80-0.88)
(0.79-0.81)
(1.24-1.27)
(0.92-1.04)
(0.93-0.96)
(0.65-0.70)
(0.65-0.66)
(0.70-0.75)
Note: Uninvolved (UNINV) limb of the ACL-I group, and the dominant (DOM) limb of the control group were tested.
† indicates p <0.05 for the main effect for limb
‡ indicates p <0.05 for the main effect for sex
(2.04-2.21)
(0.98-1.06)
(0.99-1.01)
(1.52-1.67)
(1.47-1.49)
(1.00-1.11)
(1.09-1.11)
(0.85-0.90)
(0.87-0.88)
(0.75-0.81)
ACL-I 1.60+0.31
2.13+0.48
Control 1.53+0.32
2.05+0.42
(2.04-2.06)
ACL-I 0.84+0.19
Control 0.80+0.19
1.00+0.19
1.02+0.20
ACL-I
1.60+0.43
Control 1.25+0.35
1.48+0.41
1.31+0.29 (1.25-1.38)
ACL-I 0.98+0.28
Control 0.95+0.27
1.06+0.32
1.10+0.32
ACL-I 0.67+0.12
0.88+0.15
Control 0.65+0.12
0.87+0.16
ACL-I 0.73+0.13
0.78+0.17
Control 0.70+0.14
0.80+0.16
(0.70-0.71)
(0.80-0.81) ACL-I Prior ACL injury group; Control No prior ACL injury group
Strength of the Uninvolved Limb Following Return to Activity After ACL Injury: Implications for Symmetry International Journal of Sports Physical Therapy
knowledge of the authors. Although there were statistically significant main effects for limb with greater strength in the UNINV limb in those with ACL injury history for the quadriceps, hamstrings, and gluteus medius in this sample, their respective effects sizes were small (d < 0.25). Consequently, while the results may be statistically significant, they may not be clinically relevant. There were no limb-bysex interactions meaning the differences in muscle strength between the UNINV limb (ACL-I group) and the dominant limb (control group) were consistent across both sexes. Therefore, these results suggest that sports medicine professionals may use limb symmetry for muscle strength assessment in patients who have been cleared to participate in all activities after an ACL injury without concerns about strength deficits in the UNINV limb.
MAXIMAL ISOMETRIC MUSCLE STRENGTH
Although previously suggested mechanisms for muscle weakness in the UNINV limb after injury exist including prolonged arthrogenic inhibition,26,46 deconditioning,23 or lack of re-conditioning,23 the findings of the current study showed no difference in UNINV muscular strength compared to the DOM limb of healthy controls at the time of testing.
Although previously suggested mechanisms for muscle weakness in the uninvolved (UNINV) limb after injury, such as prolonged arthrogenic inhibition,26,46 deconditioning,23 or lack of re-conditioning,23 this study’s findings present a nuanced picture. While small statistically significant differences in three of the muscle groups were observed between the UNINV and dominant (DOM) limbs of healthy controls, the associated effect sizes were consistently small to trivial, suggesting that, from a clinical perspective, the observed differences may not be practically significant. In essence, although there were statistical differences in muscle strength, the limited impact on a practical level implies that the UNINV limb can be considered a reliable surrogate for comparison to the DOM limb. This reinforces the notion that, despite subtle statistical variations, the UNINV limb remains a valuable benchmark for assessing muscle strength in individuals with a history of ACL injury who have returned to unrestricted activities.
KNEE STRENGTH
Previous studies examining quadriceps and hamstrings strength in those with a history of an ACL injury and those with no prior ACL injury individuals have produced conflicting results. The present study supports previous research reporting no clinically significant differences in the UNINV limb strength of the quadriceps19,33‑35,47‑51 and hamstrings8,19,26,33,35,50,52,53 for individuals with ACLR compared to healthy controls after approximately six months. However, other studies have reported both increased8 and decreased23,26,54,55 quadriceps strength and decreased hamstrings23 strength in the UNINV limb after ACL injury when compared to those with no prior ACL injury The reason for the discrepancies in these findings is unclear, but factors such as time since injury/reconstruc-
tion,15,23,35,47,48 graft type,35,51 patient population characteristics (age,19,23,34 sex breakdown,19 and fitness level19, 34), and strength assessment methods19,23,52 may play roles. This study aimed to mitigate the potential impact of these factors through the inclusion/exclusion criteria focusing in on a relatively homogenous participant group in terms of age and fitness level and focused in on one aspect of strength isometric testing. The conflicting results highlight the need for future research to clarify the relationship between strength in individuals with a history of ACL injury and strength in individuals with no prior ACL injury across multiple time points, both acutely and chronically
HIP STRENGTH
The results of the current study, indicating a small effect but likely not clinically meaningful discernible difference in gluteus medius strength between the UNINV limb in the ACL-I group and the DOM limb in the healthy control group, align with findings in recreational athletes acutely,26 when cleared to return to play,8,11,34 and several years after ACLR.56 Of note, while weaker hip abduction muscle strength has been linked to potential knee injury positions10,57 and decreased gluteus medius strength in the involved limb after a knee injury,10,58 to the best of the authors’ knowledge, no studies have reported a decrease in gluteus medius of the UNINV limb after an ACL injury
The majority of previous research investigating gluteus maximus strength supports the current study’s findings that demonstrate no discernable differences in gluteus maximus strength between the UNINV limb in those with a history of ACL injury and the DOM limb in those with no prior ACL injury.8,26,29 Conversely, Tate et al. identified weakness in the UNINV limb’s gluteus maximus after ACLR compared to the DOM limb in healthy controls.4 The difference may be explained by their participants’ lower fitness level, as they were only recreationally active at least 2x/week for 30 minutes and engaged in jumping or cutting activities at least 1x/month. That activity level would be relatively low compared to the activity level of the military cadets in this study Interestingly, Bell et al. observed that individuals with weaker quadriceps strength in the UNINV limb after ACLR demonstrated an increase in gluteus maximus strength in the UNINV limb compared to healthy controls, possibly as a compensatory mechanism.15 However, they found no differences in the UNINV limb’s gluteus maximus strength in participants with high quadriceps strength in the UNINV limb compared to healthy controls. Notably, the average time from surgery for the ACLR group was approximately two to three years in their study, which represents a period of having returned to unrestricted activity. While the current study did not ask when the ACL injury occurred, all participants had been cleared for unrestricted activity
No differences were observed in hip external or internal rotator strength between the UNINV limb in individuals with ACL-I and the DOM limb in the healthy control group. Previous hip external rotator strength findings are mixed.15,34 Discrepancies between the two studies may be attributed to the age discrepancy between the two cohorts
Strength of the Uninvolved Limb Following Return to Activity After ACL Injury: Implications for Symmetry International Journal of Sports Physical Therapy
(~14 vs. ~18 years old) and the fact that research demonstrating reduced hip external rotator strength in the UNINV limb solely focused on female athletes.34 Only one study was identified examining hip internal rotation strength, which also reported no discernible differences in strength between the UNINV limb in individuals with a history of ACL injury and the DOM limb in those without prior ACL injury 15 In summary, the results of this study lend support to findings indicating that strength of the gluteus maximus, gluteus medius, hip internal rotators, and external rotators of the UNINV limb does not appear to be decreased in military cadets who have returned to unrestricted activity after ACL injury.
SEX DIFFERENCES
While there was no evidence of reduced strength in the UNINV limb for both sexes, males were statistically stronger than females in all muscle groups. The statistically significant differences were accompanied by small to large effect sizes indicating meaningful differences (Figure 4). These findings are consistent with previous research on young athletic populations, which also showed that males were stronger than females.59,60 Therefore, when designing rehabilitation programs, sports medicine professionals should consider sex differences in lower extremity muscular strength. Additionally, future research should establish normative values using sex-specific lower extremity muscular strength standards.
CLINICAL APPLICATION
Sports medicine professionals may use this study’s findings to assess and monitor strength deficits in patients with a history of ACL injury who have returned to unrestricted activities. By using the uninvolved limb’s strength in individuals with a history of ACL injury as a proxy for the dominant limb in those without prior ACL injury when utilizing the limb symmetry index, clinicians can develop individualized and effective rehabilitation protocols, including strength training programs, to restore muscle symmetry and optimize functional outcomes. This study also highlights the importance of accounting for sex differences in lower extremity muscular strength when establishing normative values for future research. Using the uninvolved limb as a benchmark for comparison, sports medicine professionals can make more informed clinical decisions, design effective rehabilitation programs, and improve musculoskeletal injury risk screenings for individuals with a history of ACL injury
It should be noted that while this study has a large sample size and provides valuable insights into using the uninvolved limb as an appropriate benchmark, it’s important to acknowledge that all participants had been medically cleared for physical activity at the time of the study. Therefore, they do not represent individuals in the early or subacute phases post-surgery, where the use of the non-injured limb as a reference for LSI might be less applicable. Additionally, practitioners should proceed with caution if attempting to compare the average strength values with
those reported in previous studies. The variations in testing positions and the equipment used pose a challenge for direct comparisons. For example, research indicates that maximal isometric strength values obtained from handheld dynamometers are often lower than those measured by isokinetic dynamometers.61 This discrepancy underscores the challenges in comparing strength measures across different methodologies. Furthermore, while isometric strength assessments provide a measure of muscle force generation, they might not comprehensively reflect the intricate dynamics of neuromuscular control that influence functional movement. This is an important consideration as persistent neuromuscular deficits, even in the presence of observed isometric strength symmetry, could impact movement quality and elevate the risk of secondary injuries.41‑45
Despite these considerations, this study’s findings support the practice among sports medicine professionals of using the uninvolved limb as an appropriate benchmark for assessing and monitoring strength deficits in individuals with a history of an ACL injury who have resumed unrestricted activities.
LIMITATIONS AND STRENGTHS
Several limitations to this study should be noted. First, only the uninvolved limb in those with a history of an ACL injury was tested as that was the protocol at the time of testing. Therefore, while there is no specific information about the involved limb, the findings of this study does support that the UNINV limb is not weaker than the dominant limb of healthy controls.
Second, while participants were all cleared to return to unrestricted activity at the time of enrollment, the time interval between injury and testing was not standardized. Previous research has shown that the muscle strength comparison between previously injured individuals and healthy controls may differ in terms of symmetry depending on the timing of testing, with most strength values being asymmetrical early and then normalizing around seven months.8,11,19 With most athletes being given clearance to return to activity between 6-12 months,62‑64 the majority of those in this study’s ACL-I group are most likely greater than seven months post-injury meaning that their strength may have normalized to that of healthy controls. The exact timing of when the muscular strength becomes symmetrical should be explored in future research.
Third, for those participants with an ACLR, the graft type was not specified, thus limiting the ability to determine if graft type may influence the appropriateness of using the UNINV limb after an ACL injury as the benchmark for comparison of muscular strength and symmetry However, previous research has suggested that muscle strength differences between graft types may only be clinically relevant during the early phases of rehabilitation after ACLR.65 Since this study’s patient population was in the later phases and cleared to return to unrestrictive activity, this limitation may not be significant.
Fourth, the participants examined in this study were first-year military cadets at different academies. As such,
Strength of the Uninvolved Limb Following Return to Activity After ACL Injury: Implications for Symmetry International Journal of Sports Physical Therapy
they may have greater physical fitness and/or motivation compared to a typical population.
Fifth, the strength symmetry between the UNINV limb in those with a history of ACL injury and the DOM limb in those with no prior ACL injury may only be specific to the type of muscle strength testing and the muscle testing positions used in this study It is unclear if similar findings would be observed in different testing positions or under different testing conditions, such as concentric or eccentric contractions during isokinetic testing or when assessing different strength parameters such as peak force or rate of force development.
Finally, while this study supports using the UNINV limb in those with a history of an ACL injury as a surrogate for the DOM limb of healthy controls, it does not provide information on all the lower extremity muscles such as the soleus or adductors, or the absolute magnitude of muscular strength or strength symmetry required for reducing secondary injury risk. Although potentially not clinically significant, the implications of the observed small differences in muscular strength, particularly during injury mechanisms in the context of reinjury or contralateral injury risk, deserve focused attention in future research endeavors. Future studies should address these identified gaps.
Despite these limitations, the current study contributes valuable insights into the muscular strength of individuals with a history of ACL injury, particularly after clearance to return to unrestricted activity By supporting the use of the UNINV limb as a surrogate for the DOM limb of healthy controls, these findings offer a practical benchmark for clinicians. The large sample size, including both males and females and ACL-injured and healthy individuals, enhances the robustness and applicability of the results. Moreover, the comprehensive examination of various lower extremity muscles provides a foundation for future research to build upon, addressing several research gaps identified in this study
CONCLUSION
In this investigation, there was no conclusive evidence of reduced muscular strength in the uninvolved (UNINV) limb in those with a history of ACL injury compared to the dominant (DOM) limb in those with no prior ACL injury, regardless of sex. Despite detecting a slight increase in muscular strength in three of the six muscle groups of the UNINV limb in individuals with a history of an ACL injury compared to the DOM limb of healthy controls, the small effect sizes (d < 0.25) caution against overemphasizing these differences as clinically significant. These findings suggest that after an individual with a history of ACL injury has been cleared for unrestrictive activities, using the uninvolved limb as a standard for comparison for sufficient strength, such as when using the LSI, appears appropriate. This study shows that isometric muscle strength values in the uninvolved limb of individuals with ACL injury are equivalent or stronger than those of the dominant limb in individuals with no prior ACL injury, supporting the use of the uninvolved limb as a reliable benchmark for assessing muscular strength in those with a history of ACL injury
CONFLICTS OF INTEREST
The authors report no conflicts of interest.
ACKNOWLEDGEMENTS
Thank you to all that made the JUMP-ACL testing possible.
Submitted: January 04, 2024 CDT, Accepted: April 24, 2024 CDT
© The Author(s)
This is an open-access article distributed under the terms of the Creative Commons Attribution 4.0 International License (CCBY-NC-4.0). View this license’s legal deed at https://creativecommons.org/licenses/by-nc/4.0 and legal code at https://creativecommons.org/licenses/by-nc/4.0/legalcode for more information.
Strength of the Uninvolved Limb Following Return to Activity After ACL Injury: Implications for Symmetry International Journal of Sports Physical Therapy
REFERENCES
1. Morris JL, McEwen P, Letson HL, Dobson GP Anterior cruciate ligament reconstruction surgery: creating a permissive healing phenotype in military personnel and civilians for faster recovery Mil Med 2022;187:1310-1317 doi:10.1093/milmed/usac093
2. de Queiroz JHM, Murakawa YAB, de Castro SS, Almeida GPL, de Oliveira RR. Biopsychosocial model domains in clinical practice guidelines for return to sport after ACL injury: systematic review using the AGREE II checklist. Sports Health 2023;15(2):165-175. doi:10.1177/19417381221094582
3. Stanley LE, Kerr ZY, Dompier TP, Padua DA. Sex differences in the incidence of anterior cruciate ligament, medial collateral ligament, and meniscal injuries in collegiate and high school sports: 2009-2010 through 2013-2014. Am J Sports Med 2016;44(6):1565-1572. doi:10.1177/ 0363546516630927
4. Tate J, Suckut T, Wages J, Lyles H, Perrin B. The associations between hip strength and hip kinematics during a single leg hop in recreational athletes post ACL reconstruction compared to healthy controls. Int J Sports Phys Ther 2017;12(3):341.
5. Paterno MV, Rauh MJ, Schmitt LC, Ford KR, Hewett TE. Incidence of contralateral and ipsilateral anterior cruciate ligament (ACL) injury after primary ACL reconstruction and return to sport. Clin J Sport Med. 2012;22(2):116-121. doi:10.1097/ JSM.0b013e318246ef9e
6. Eitzen I, Grindem H, Nilstad A, Moksnes H, Risberg MA. Quantifying quadriceps muscle strength in patients with ACL injury, focal cartilage lesions, and degenerative meniscus tears: differences and clinical implications. Orthop J Sports Med 2016;4(10):2325967116667717 doi:10.1177/ 2325967116667717
7 Pottkotter KA, Di Stasi SL, Schmitt LC, et al. Timeline of gains in quadriceps strength symmetry and patient-reported function early after ACL reconstruction. Int J Sports Phys Ther 2020;15(6):995. doi:10.26603/ijspt20200995
8. Thomas AC, Villwock M, Wojtys EM, PalmieriSmith RM. Lower extremity muscle strength after anterior cruciate ligament injury and reconstruction. J Athl Train. 2013;48(5):610-620. doi:10.4085/ 1062-6050-48.3.23
9. Kyritsis P, Bahr R, Landreau P, Miladi R, Witvrouw E. Likelihood of ACL graft rupture: not meeting six clinical discharge criteria before return to sport is associated with a four times greater risk of rupture. Br J Sports Med 2016;50(15):946-951. doi:10.1136/ bjsports-2015-095908
10. Khayambashi K, Ghoddosi N, Straub RK, Powers CM. Hip muscle strength predicts noncontact anterior cruciate ligament injury in male and female athletes: a prospective study Am J Sports Med 2016;44(2):355-361. doi:10.1177/0363546515616237
11. Noehren B, Abraham A, Curry M, Johnson D, Ireland ML. Evaluation of proximal joint kinematics and muscle strength following ACL reconstruction surgery in female athletes. J Orthop Res. 2014;32(10):1305-1310. doi:10.1002/jor.22678
12. Hollman JH, Ginos BE, Kozuchowski J, Vaughn AS, Krause DA, Youdas JW. Relationships between knee valgus, hip-muscle strength, and hip-muscle recruitment during a single-limb step-down. J Sport Rehabil. 2009;18(1):104-117. doi:10.1123/jsr.18.1.104
13. Hughes G. A review of recent perspectives on biomechanical risk factors associated with anterior cruciate ligament injury. Res Sports Med. 2014;22(2):193-212. doi:10.1080/ 15438627.2014.881821
14. Acevedo RJ, Rivera-Vega A, Miranda G, Micheo W. Anterior cruciate ligament injury: identification of risk factors and prevention strategies. Curr Sports Med Rep. 2014;13(3):186-191. doi:10.1249/ JSR.0000000000000053
15. Bell DR, Trigsted SM, Post EG, Walden CE. Hip strength in patients with quadriceps strength deficits after ACL reconstruction. Med Sci Sports Exerc. 2016;48(10):1886-1892. doi:10.1249/ MSS.0000000000000999
16. Petersen W, Taheri P, Forkel P, Zantop T. Return to play following ACL reconstruction: a systematic review about strength deficits. Arch Orthop Trauma Surg. 2014;134:1417-1428. doi:10.1007/ s00402-014-1992-x
17 Paterno MV, Schmitt LC, Ford KR, et al. Biomechanical measures during landing and postural stability predict second anterior cruciate ligament injury after anterior cruciate ligament reconstruction and return to sport. Am J Sports Med. 2010;38(10):1968-1978. doi:10.1177/ 0363546510376053
Strength of the Uninvolved Limb Following Return to Activity After ACL Injury: Implications for Symmetry International Journal of Sports Physical Therapy
18. Nagelli C, Wordeman S, Di Stasi S, Hoffman J, Marulli T, Hewett TE. Biomechanical deficits at the hip in athletes with ACL reconstruction are ameliorated with neuromuscular training. Am J Sports Med 2018;46(11):2772-2779. doi:10.1177/ 0363546518787505
19. van Melick N, van der Weegen W, van der Horst N. Quadriceps and hamstrings strength reference values for athletes with and without anterior cruciate ligament reconstruction who play popular pivoting sports, including soccer, basketball, and handball: a scoping review J Orthop Sports Phys Ther 2022;52(3):142-155. doi:10.2519/jospt.2022.10693
20. Wellsandt E, Failla MJ, Snyder-Mackler L. Limb symmetry indexes can overestimate knee function after anterior cruciate ligament injury. J Orthop Sports Phys Ther 2017;47(5):334-338. doi:10.2519/ jospt.2017.7285
21. Logerstedt D, Grindem H, Lynch A, et al. Singlelegged hop tests as predictors of self-reported knee function after anterior cruciate ligament reconstruction: the Delaware-Oslo ACL cohort study. Am J Sports Med 2012;40(10):2348-2356. doi:10.1177/0363546512457551
22. Urbach D, Nebelung W, Weiler HT, Awiszus F. Bilateral deficit of voluntary quadriceps muscle activation after unilateral ACL tear Med Sci Sports Exerc. 1999;31(12):1691-1696. doi:10.1097/ 00005768-199912000-00001
23. Hiemstra LA, Webber S, MacDonald PB, Kriellaars DJ. Contralateral limb strength deficits after anterior cruciate ligament reconstruction using a hamstring tendon graft. Clin Biomech 2007;22(5):543-550. doi:10.1016/j.clinbiomech.2007.01.009
24. Palmieri-Smith RM, Thomas AC, Wojtys EM. Maximizing quadriceps strength after ACL reconstruction. Clin Sports Med 2008;27(3):405-424. doi:10.1016/j.csm.2008.02.001
25. Urbach D, Nebelung W, Becker R, Awiszus F. Effects of reconstruction of the anterior cruciate ligament on voluntary activation of quadriceps femoris: a prospective twitch interpolation study J Bone Joint Surg Br 2001;83(8):1104-1110. doi:10.1302/0301-620X.83B8.0831104
26. Hannon J, Wang-Price S, Goto S, Garrison JC, Bothwell JM. Do muscle strength deficits of the uninvolved hip and knee exist in young athletes before anterior cruciate ligament reconstruction? Orthop J Sports Med 2017;5(1):2325967116683941. doi:10.1177/2325967116683941
27 Nakamura N, Horibe S, Sasaki S, et al. Evaluation of active knee flexion and hamstring strength after anterior cruciate ligament reconstruction using hamstring tendons. Arthrosc J Arthrosc Relat Surg. 2002;18(6):598-602. doi:10.1053/jars.2002.32868
28. Welling W, Benjaminse A, Lemmink K, Dingenen B, Gokeler A. Progressive strength training restores quadriceps and hamstring muscle strength within 7 months after ACL reconstruction in amateur male soccer players. Phys Ther Sport. 2019;40:10-18. doi:10.1016/j.ptsp.2019.08.004
29. Hiemstra LA, Gofton WT, Kriellaars DJ. Hip strength following hamstring tendon anterior cruciate ligament reconstruction. Clin J Sport Med. 2005;15(3):180-182. doi:10.1097/ 01.jsm.0000157795.93004.ea
30. Brown C, Marinko L, LaValley MP, Kumar D. Quadriceps strength after anterior cruciate ligament reconstruction compared with uninjured matched controls: a systematic review and meta-analysis. Orthop J Sports Med 2021;9(4):2325967121991534. doi:10.1177/2325967121991534
31. Harput G, Tunay VB, Ithurburn MP. Quadriceps and hamstring strength symmetry after anterior cruciate ligament reconstruction: a prospective study J Sport Rehabil. 2021;30(1):1-8. doi:10.1123/ jsr.2019-0271
32. Hiemstra LA, Webber S, MacDONALD PB, Kriellaars DJ. Knee strength deficits after hamstring tendon and patellar tendon anterior cruciate ligament reconstruction. Med Sci Sports Exerc 2000;32(8):1472-1479. doi:10.1097/ 00005768-200008000-00016
33. Chung KS, Ha JK, Yeom CH, et al. Are muscle strength and function of the uninjured lower limb weakened after anterior cruciate ligament injury? Two-year follow-up after reconstruction. Am J Sports Med. 2015;43(12):3013-3021. doi:10.1177/ 0363546515606126
34. Boo ME, Garrison JC, Hannon JP, et al. Energy absorption contribution and strength in female athletes at return to sport after anterior cruciate ligament reconstruction: comparison with healthy controls. Orthop J Sports Med. 2018;6(3):2325967118759522. doi:10.1177/ 2325967118759522
35. Keays SL, Bullock-Saxton JE, Keays AC, Newcombe PA, Bullock MI. A 6-year follow-up of the effect of graft site on strength, stability, range of motion, function, and joint degeneration after anterior cruciate ligament reconstruction. Am J Sports Med. 2007;35(5):729-739. doi:10.1177/ 0363546506298277
Strength of the Uninvolved Limb Following Return to Activity After ACL Injury: Implications for Symmetry International Journal of Sports Physical Therapy
36. Beutler AI, Sarah J, Marshall SW, Padua DA, Boden BP. Muscle strength and qualitative jumplanding differences in male and female military cadets: The Jump-ACL study. J Sports Sci Med. 2009;8(4):663.
37 Rosene JM, Fogarty TD, Mahaffey BL. Isokinetic hamstrings: quadriceps ratios in intercollegiate athletes. J Athl Train. 2001;36(4):378.
38. Holcomb WR, Rubley MD, Lee HJ, Guadagnoli MA. Effect of hamstring-emphasized resistance training on hamstring: quadriceps strength ratios. J Strength Cond Res 2007;21(1):41. doi:10.1519/ 00124278-200702000-00008
39. Parent MC. Handling item-level missing data: Simpler is just as good. Couns Psychol 2013;41(4):568-600. doi:10.1177/0011000012445176
40. Cohen J. Statistical Power Analysis for the Behavioral Sciences Lawrence Erlbaum Associates. Inc Publ; 1988.
41. Rohman E, Steubs JT, Tompkins M. Changes in Involved and Uninvolved Limb Function During Rehabilitation After Anterior Cruciate Ligament Reconstruction: Implications for Limb Symmetry Index Measures. Am J Sports Med 2015;43(6):1391-1398. doi:10.1177/ 0363546515576127
42. Paterno MV, Ford KR, Myer GD, Heyl R, Hewett TE. Limb asymmetries in landing and jumping 2 years following anterior cruciate ligament reconstruction. Clin J Sport Med 2007;17(4):258-262. doi:10.1097/ JSM.0b013e31804c77ea
43. Paterno MV, Schmitt LC, Ford KR, Rauh MJ, Myer GD, Hewett TE. Effects of sex on compensatory landing strategies upon return to sport after anterior cruciate ligament reconstruction. J Orthop Sports Phys Ther 2011;41(8):553-559. doi:10.2519/ jospt.2011.3591
44. Neitzel JA, Kernozek TW, Davies GJ. Loading response following anterior cruciate ligament reconstruction during the parallel squat exercise. Clin Biomech. 2002;17(7):551-554. doi:10.1016/ S0268-0033(02)00063-3
45. Ernst GP, Saliba E, Diduch DR, Hurwitz SR, Ball DW Lower-extremity compensations following anterior cruciate ligament reconstruction. Phys Ther. 2000;80(3):251-260. doi:10.1093/ptj/80.3.251
46. Konishi Y, Konishi H, Fukubayashi T Gamma loop dysfunction in quadriceps on the contralateral side in patients with ruptured ACL. Med Sci Sports Exerc 2003;35(6):897-900. doi:10.1249/ 01.MSS.0000069754.07541.D2
47 Garrison JC, Hannon J, Goto S, Giesler L, Bush C, Bothwell JM. Participants at three months postoperative anterior cruciate ligament reconstruction (ACL-R) demonstrate differences in lower extremity energy absorption contribution and quadriceps strength compared to healthy controls. The Knee 2018;25(5):782-789. doi:10.1016/j.knee.2018.06.014
48. Hsieh CJ, Indelicato PA, Moser MW, Vandenborne K, Chmielewski TL. Speed, not magnitude, of knee extensor torque production is associated with selfreported knee function early after anterior cruciate ligament reconstruction. Knee Surg Sports Traumatol Arthrosc Off J ESSKA. 2015;23(11):3214-3220. doi:10.1007/s00167-014-3168-1
49. Johnson AK, Palmieri-Smith RM, Lepley LK. Contribution of neuromuscular factors to quadriceps asymmetry after anterior cruciate ligament reconstruction. J Athl Train 2018;53(4):347-354. doi:10.4085/1062-6050-463-16
50. Mohammadi F, Salavati M, Akhbari B, Mazaheri M, Mir SM, Etemadi Y Comparison of functional outcome measures after ACL reconstruction in competitive soccer players: a randomized trial. JBJS 2013;95(14):1271-1277 doi:10.2106/JBJS.L.00724
51. Rudroff T Functional capability is enhanced with semitendinosus than patellar tendon ACL repair. Med Sci Sports Exerc 2003;35(9):1486-1492. doi:10.1249/ 01.MSS.0000084425.07852.7D
52. Mattacola CG, Perrin DH, Gansneder BM, Gieck JH, Saliba EN, McCue III FC. Strength, functional outcome, and postural stability after anterior cruciate ligament reconstruction. J Athl Train. 2002;37(3):262.
53. Rush JL, Norte GE, Lepley AS. Limb differences in hamstring muscle function and morphology after anterior cruciate ligament reconstruction. Phys Ther Sport 2020;45:168-175. doi:10.1016/ j.ptsp.2020.06.012
54. Lepley A, Gribble P, Thomas A, Tevald M, Sohn D, Pietrosimone B. Quadriceps neural alterations in anterior cruciate ligament reconstructed patients: A 6-month longitudinal investigation. Scand J Med Sci Sports 2015;25(6):828-839. doi:10.1111/sms.12435
55. Pamukoff DN, Montgomery MM, Choe KH, Moffit TJ, Garcia SA, Vakula MN. Bilateral alterations in running mechanics and quadriceps function following unilateral anterior cruciate ligament reconstruction. J Orthop Sports Phys Ther. 2018;48(12):960-967 doi:10.2519/jospt.2018.8170
56. Tate J, Suckut T, Wages J, Lyles H, Perrin B. The associations between hip strength and hip kinematics during a single leg hop in recreational athletes post ACL reconstruction compared to healthy controls. Int J Sports Phys Ther. 2017;12(3):341.
Strength of the Uninvolved Limb Following Return to Activity After ACL Injury: Implications for Symmetry International Journal of Sports Physical Therapy
57 Claiborne TL, Armstrong CW, Gandhi V, Pincivero DM. Relationship between hip and knee strength and knee valgus during a single leg squat. J Appl Biomech 2006;22(1):41-50. doi:10.1123/jab.22.1.41
58. Jaramillo J, Worrell TW, Ingersoll CD. Hip isometric strength following knee surgery J Orthop Sports Phys Ther 1994;20(3):160-165. doi:10.2519/ jospt.1994.20.3.160
59. Buchanan PA, Vardaxis VG. Lower-extremity strength profiles and gender-based classification of basketball players ages 9-22 years. J Strength Cond Res 2009;23(2):406-419. doi:10.1519/ JSC.0b013e3181942140
60. Myer GD, Ford KR, Foss KDB, Liu C, Nick TG, Hewett TE. The relationship of hamstrings and quadriceps strength to anterior cruciate ligament injury in female athletes. Clin J Sport Med Off J Can Acad Sport Med 2009;19(1):3-8. doi:10.1097/ JSM.0b013e318190bddb
61. Reinking MF, Bockrath-Pugliese K, Worrell T, Kegerreis RL, Miller-Sayers K, Farr J. Assessment of Quadriceps Muscle Performance by Hand-Held, Isometric, and Isokinetic Dynamometry in Patients With Knee Dysfunction. J Orthop Sports Phys Ther 1996;24(3):154-159. doi:10.2519/jospt.1996.24.3.154
62. Lai CC, Ardern CL, Feller JA, Webster KE. Eightythree per cent of elite athletes return to preinjury sport after anterior cruciate ligament reconstruction: a systematic review with meta-analysis of return to sport rates, graft rupture rates and performance outcomes. Br J Sports Med 2018;52(2):128-138. doi:10.1136/bjsports-2016-096836
63. Kvist J. Rehabilitation following anterior cruciate ligament injury: current recommendations for sports participation. Sports Med. 2004;34:269-280. doi:10.2165/00007256-200434040-00006
64. Ardern CL, Webster KE, Taylor NF, Feller JA. Return to the preinjury level of competitive sport after anterior cruciate ligament reconstruction surgery: two-thirds of patients have not returned by 12 months after surgery. Am J Sports Med. 2011;39(3):538-543. doi:10.1177/0363546510384798
65. Schwery NA, Kiely MT, Larson CM, et al. Quadriceps strength following anterior cruciate ligament reconstruction: normative values based on sex, graft type and meniscal status at 3, 6 & 9 months. Int J Sports Phys Ther. 2022;17(3):434. doi:10.26603/001c.32378
Strength of the Uninvolved Limb Following Return to Activity After ACL Injury: Implications for Symmetry International Journal of Sports Physical Therapy
SUPPLEMENTARY MATERIALS
Supplemental File 1
Download: https://ijspt.scholasticahq.com/article/117547-strength-of-the-uninvolved-limb-following-return-toactivity-after-acl-injury-implications-for-symmetry-as-a-marker-of-sufficient-strength/attachment/ 227056.docx?auth_token=RgGk222zQVGlTnIJACyj
Strength of the Uninvolved Limb Following Return to Activity After ACL Injury: Implications for Symmetry International Journal of Sports Physical Therapy
Functional Performance and Tendon Morphology After Operative or Nonoperative Treatment of Achilles Tendon Ruptures
Sophie Zhu, M.D.1 , Josh Garofalo2 , Monther Abuhantash, M.D.1 , Sheila McRae, Ph.D3 , Peter MacDonald, M.D.1,4 , Rob Longstaffe, M.D.1,4 , Dan Ogborn, MSc PhD1,5,6a
1 Department of Surgery, Orthopedic Section, University of Manitoba, 2 Max Rady College of Medicine, University of Manitoba, 3 University of Manitoba, 4 Pan Am Clinic, 5 Pan Am Clinic Foundation, 6 Faculty of Kinesiology and Recreation Management, University of Manitoba
Keywords: Achilles Tendon, Achilles Tendon Rupture, Achilles Tendon Length, Functional Testing, Isokinetic Plantar Flexion Strength, Hop testing https://doi.org/10.26603/001c.117549
International Journal of Sports Physical Therapy
Background
While controversy remains as to the relative benefit of operative (OM) versus non-operative management (NOM) of Achilles tendon (AT) ruptures (ATR), few studies have examined the effect on high impact maneuvers such as jumping and hopping.
Hypothesis/Purpose
The purpose of this study was to determine if functional performance including strength, jumping, and hopping outcomes differed between OM and NOM of acute ATR. The secondary objective was to assess the degree of association between AT morphology and performance outcomes.
Study Design
Retrospective cohort with a single prospective evaluation.
Methods
All patients were treated at an institutional secondary care center. Eligible participants (n=12 OM; 12 NOM) who were treated with OM or NOM of ATR within three weeks of injury were evaluated a minimum 20 months following ATR. AT length, thickness and gastrocnemius muscle thickness were assessed with B-mode ultrasound. Isokinetic plantar flexor strength, hop tests and countermovement and drop jumps were completed. Two-way ANOVAS were completed on all tests with unilateral values, independent t-tests were used for bilateral outcomes, and linear regressions were completed to assess the relationship between normalized AT length and performance.
Results
Affected limb AT was elongated and thickened (p<0.01), gastrocnemius was atrophied (p< 0.01) and angle-specific plantar flexor torque was reduced at 120°/s when measured at 20° plantar flexion (p = 0.028). Single leg drop vertical jump was higher in OM (p = 0.015) with no difference for hop and jump tests. AT length was related to plantar flexor torque but had no relationship with hopping performance.
Conclusions
Hop test performance was maintained despite plantarflexion weakness, gastrocnemius atrophy, and AT elongation. This may be the result of compensatory movement patterns. AT length holds limited explanatory power in plantar flexor strength, although this relationship should be evaluated further.
Corresponding Author:
Dan Ogborn
75 Poseidon Bay, Winnipeg, MB, Canada, R3M 3E4
Office: 204-927-2829
Fax: 204.927.2775
dogborn@panamclinic.com
Original Research
After
of Achilles Tendon Ruptures.
Published
a Zhu S, Garofalo J, Abuhantash M, et al. Functional Performance and Tendon Morphology
Operative or Nonoperative Treatment
IJSPT.
online June 1, 2024:670-680. doi:10.26603/001c.117549
INTRODUCTION
Treatment of acute Achilles tendon (AT) ruptures (ATR) has long remained controversial. Historically, operative management (OM) was thought to provide a reduced risk of rerupture albeit with the possibility of postoperative complications.1,2 More recently, studies using non-operative management (NOM) with accelerated rehabilitation by early mobilization have demonstrated comparable results to OM.3‑8 Despite these advancements, strength and functional deficits are common following ATR.9‑17
AT elongation and calf muscle atrophy have been proposed as causative factors for strength deficits following an ATR, yet the literature is ambiguous. AT elongation has been associated with calf muscle atrophy,9 decreased plantar flexion strength,9 heel-rise test deficits (height, repetitions, work)18 and altered ankle kinetics and kinematics during walking, jogging and running.19 This was further examined with a randomized trial comparing OM to NOM with identical rehabilitation.10 At 18 months, AT length was increased in NOM, and OM patients had 10% to 18% greater plantar flexor strength. Carmont et al11 concluded that tightness of the tendon repair during surgery was the most important modifiable risk factor for tendon elongation and heel-rise deficits. However, others have found that AT elongation does not influence plantar flexion strength, patient’s subjective interpretation of recovery,12 nor does it relate to muscle volume and calf muscle circumference.13 Methodological variation across studies may partially explain the varied findings, as strength deficits may be larger in greater degrees of plantar flexion relative to analysis of peak torque.
Evaluations of functional performance have focused on muscular strength,9‑13 with minimal research investigating the relationship between AT length and dynamic performance (i.e. jumping and hopping).14,15 Brorsson et al19 found that individuals with heel rise deficits greater than 30% had increased AT length and the limb symmetry index (LSI) of heel-rise test work correlated with kinetic variables during hopping. Nicholson et al14 found that although there were no differences in peak isokinetic plantar flexion strength between limbs, there was significant reductions in single-leg countermovement jump (CMJ) height. They also showed longer bilateral drop vertical jump contact time for the injured side without differences in landing forces.14 This suggests that dynamic performance cannot be assumed to be recovered by strength measures alone.
Further research is required to understand the relationship between tendon morphological changes following ATR, isolated muscular strength, and dynamic performance measures. The purpose of this study was to determine if functional performance including strength, jumping, and hopping outcomes differed between OM and NOM of acute ATR. The secondary objective was to assess the degree of association between AT morphology and performance outcomes. It was hypothesized that in patients following NOM
of ATR, AT length would be greater, and performance would be reduced (including muscular strength, hopping, and jumping) relative to OM.
MATERIALS AND METHODS PARTICIPANTS
This was a retrospective cohort study with a single prospective evaluation. Eligible participants were between 18 - 65 years old, that had undergone treatment for an acute complete ATR between October 2014 and October 2019 at a regional orthopedic clinic, and were treated within three weeks of the injury Informed consent was obtained prior to participating in the study. Patients were excluded if they had a re-rupture of their AT, ATR on their contralateral leg, surgical site infection, or any significant ankle, knee, or medical comorbidities that prevented functional testing. Ethics approval was obtained by the University of Manitoba Research Ethics Board prior to commencing the study.
SURGICAL TECHNIQUE AND NON-OPERATIVE MANAGEMENT
All surgeries were performed in an open manner during which each end of the tendon was debrided of abnormal tissue and repaired in a side to side fashion with No. 2 Fiberwire sutures (Arthrex, Naples Fl). A backslab (below knee half cast) was placed on the ankle in plantarflexion and converted to a boot with elevated heel wedges at the twoweek mark. The management of those who were treated non-operatively differed based on clinician. However, these patients were all managed by some variation of initial nonweight bearing in plantar flexion alongside progressively reduced heel lifts and gradual restoration of weight-bearing, with referral for physical therapy
GASTROCNEMIUS AND ACHILLES TENDON MORPHOLOGY
Calf circumference was recorded with participants in a seated position with the knees flexed to 90° over the edge of the examination table. Measurements were recorded at 15 cm distal to the medial knee joint line (identified via palpation),16 and at the point of maximal circumference. Tendon and muscle morphology was determined via B-Mode ultrasound (GE Healthcare LOGIQ, Chicago, IL, USA, 12mHz, linear transducer). Thickness of the lateral and medial gastrocnemius was recorded at 30% of the distance from the respective articular cleft to the malleolus.17 Patients were positioned prone with knees flexed 10° with the feet resting off the examination table for morphological assessment.20 Tendon thickness was recorded at the height of the medial malleolus.20 Tendon length was determined by identifying and marking the proximal (musculotendinous union of the medial gastrocnemius) and distal landmarks (calcaneal insertion) with B-mode ultrasound.20 Landmarks were pro-
Level of Evidence Level
III
Functional Performance and Tendon Morphology After Operative or Nonoperative Treatment of Achilles Te… International Journal of Sports Physical Therapy
jected onto the skin by placing a modified (blunted) 18-gauge needle between the ultrasound probe and the skin, which allowed for translation of the anatomical landmark on the ultrasound image to a superficial location on the skin at the position of the needle. The location of the non-inserted needle was then marked on the skin with ink to allow for distance measurement. AT length was normalized relative to estimated tibial length (tibial length = AT length / 0.6 + 53).21
RANGE OF MOTION AND ACHILLES TENDON RESTING ANGLE
Ankle range of motion (ROM; active plantar- and dorsiflexion) was recorded via goniometer with participants positioned supine in 30° of knee flexion. AT resting angle was measured in prone with the knee passively flexed to 90° with a goniometer 16,22‑25
PATIENT-REPORTED OUTCOME MEASURES
Patients completed a demographic form and patient-reported outcome measures (PROMS) including the Achilles Tendon Total Rupture Score (ATRS), a Physical Activity Scale (PAS) and the Foot and Ankle Outcome Score (FAOS) Sports and Recreation subscale. The ATRS had patients rank their level of limitation due to symptoms and during certain activities, with each question scored ranging from 0-10 on a Likert scale, with established validity and reliability in patients following ATR and an MCID of 8 points.26,27 The PAS had patients rank their current level of physical activity from “0”, representing “hardly any physical activity”, to “6”, including hard or very hard exercise regularly several times a week (i.e. jogging, skiing). The FAOS assessed patients’ difficulty doing a series of movements over the past week due to their foot or ankle, ranking patients’ difficulty on a 5-point scale ranging from “None”, to “Extreme”
PERFORMANCE ASSESSMENT
All patients completed a standardized warm up of five minutes on a stationary bicycle, at a self-selected pace, followed by two sets of 10 bilateral heel raises.
JUMPING TESTS
Participants then completed the jumping tests, which were recorded using dual force plates (1000 hz; AMTI, Watertown, MA, USA). Jump heights were estimated from flight time (height = ½g(t/2)2; g = 9.81 m*sec−2 , t = time in air). Participants completed two or three familiarization attempts, before three trials of each jump. For the bilateral countermovement jump (CMJ), participants stood upright with hands placed on their hips, and on cue bent their knees to a depth of their preference and performed a maximal effort jump. For the bilateral squat jump, the method was the same as the bilateral CMJ, however participants would pause for three seconds in the squat position (maximum 90o knee flexion) before completing a maximal effort vertical jump. Unilateral CMJs used the same methodology
as the bilateral CMJs, except participants would take off on a single limb, and land on the same limb. Drop vertical jumps (DVJ) were completed with participants starting on a 30 cm elevated platform with the force plates positioned at a distance of half of the participants height from the platform. Participants jumped down from the platform to the force plates, followed by a maximal effort jump for height in a fluid motion. For the single leg DVJ (SL-DVJ) the force plates were positioned at a distance of 25% of the participant’s height from the 30 cm box. Participants would jump down from the box to the plates on a single limb, then complete a maximal single leg jump in one fluid motion, landing on the same single leg to complete the test.
HOP TESTING
Four different hop tests were completed on each leg. Each test began with a practice attempt followed by two trials on each limb, alternating between unaffected and affected limbs. The single hop had participants perform a single hop forward for maximal distance. The triple hop consisted of three consecutive hops to achieve maximal distance. The crossover hop had participants complete three consecutive hops for distance, crossing over a 15 cm wide longitudinal marker with each hop. Distances were recorded from the front of patient’s foot on takeoff to the heel on landing. The 6-meter timed hop test had participants hop on one foot for six meters as quickly as possible (Brower Timing Systems TCi System, Draper, UT, USA).
STRENGTH TESTING
Isokinetic plantar- and dorsiflexion torque were measured at 60 o/s and 120 o/s (Biodex System 4, Mirion Technologies, Atlanta, GA, USA). Participants were seated with the knee flexed to 10°, the waist and knee immobilized via belts, and foot strapped to the plate attached to dynamometer. Participants were able to practice at each speed before completing five repetitions of maximal effort plantarflexion and dorsiflexion, followed by a 60 second break between trials. Peak torque, and angle-specific torque at 20o of plantarflexion were extracted for analysis.
STATISTICAL ANALYSIS
Two-way analysis of variance (ANOVA; Group: Operative, Non-operative; Side: Affected, Unaffected) were completed for all tests with unilateral values. Independent t-tests were used for between-group comparisons for bilateral outcomes (countermovement jump). Linear regressions were completed for normalized AT length against performance outcomes of the affected limb in absolute measures (i.e. distance, torque) and as a limb symmetry index (LSI) for peak and angle-specific torque and the single leg hop test. Statistical significance was considered at p < 0.05, and all values are presented as means ± standard deviation unless stated otherwise.
Functional Performance and Tendon Morphology After Operative or Nonoperative Treatment of Achilles Te… International Journal of Sports Physical Therapy
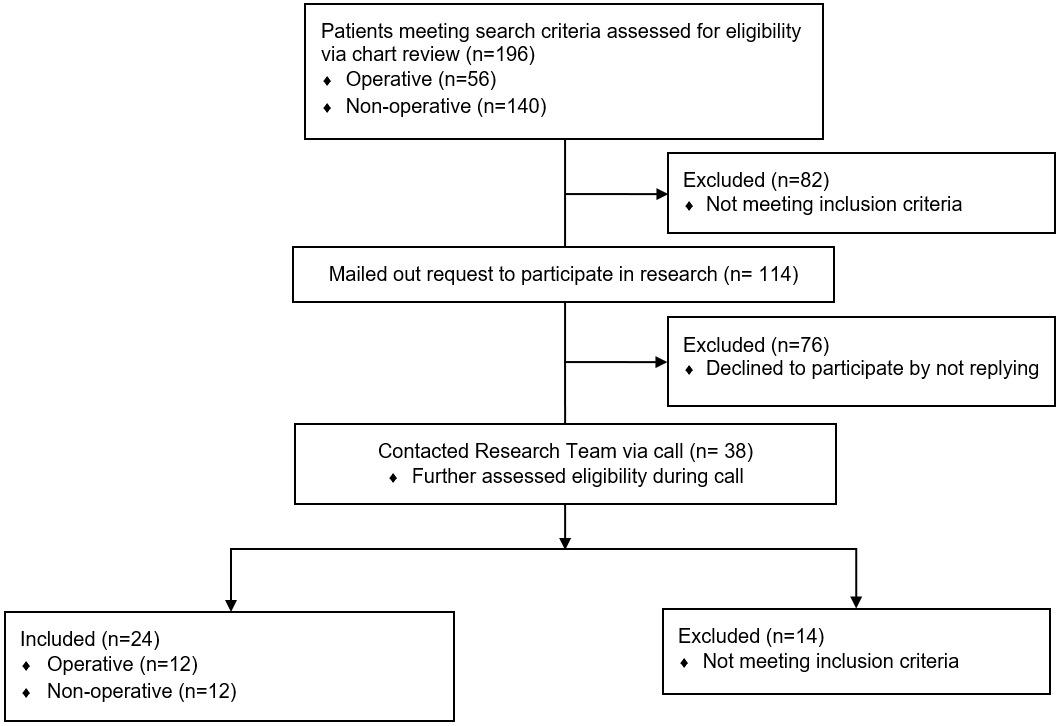
Figure 1. CONSORT 2010 Flow Diagram
Table 1. Patient Demographics
RESULTS PARTICIPANTS
Records (n = 196) were screened against eligibility criteria and a resultant 114 patients were contacted by mail to indicate their potential eligibility to participate in the study. Thirty-eight patients contacted the research center, with 24 ultimately eligible to participate in the study and completing testing, a total of 12 per group (Figure 1). There were no significant differences in demographic data between groups (Table 1). Amongst PROMs only PAS differed for which the NOM group was more active.
RANGE OF MOTION AND ACHILLES TENDON RESTING ANGLE
Active ROM for dorsiflexion and plantar flexion was not statistically different between limbs or groups (Table 2). AT resting angle was lower on the affected limb (p <0.001) with
no effect of group or interaction or group and side (Table 2).
MUSCLE AND TENDON MORPHOLOGY
There was no effect of side, group, or interaction of group and side on calf girth. Both medial (p = 0.002) and lateral (p = 0.008) gastrocnemius thickness were reduced on the affected side regardless of group. AT thickness was greater on the affected side (F(1,44) = 176.18, p <0.001), with no effect of group or interaction. AT length was greater on the affected limb (p = 0.009) with no effect of group or interaction (Table 2).
MUSCULAR STRENGTH
Isokinetic peak plantar flexor torque at 60o/s and 120o/s was similar between groups and sides, with no interaction of group and side (Table 3). Torque at 20o plantar flexion was reduced on the affected limb when measured at 120o/s
Non-operative Operative P-Value Age (yrs) 46.2
14.8 39.0 ± 9.3 P = 0.17 Height (cm) 174.1
7.8 175.7
8.4 P = 0.64 Weight (kg) 94.4
22.5 89.7
14.6 P = 0.55 Follow-up (yrs) 3.3 ± 1.2 4.1 ± 1.4 P = 0.124 Sex 8M/4F 9M/3F ATRS 27.08 ± 27.89 26.83 ± 26.13 P = 0.982 PAS 5 (2-6) 3.5 (2-5) P = 0.04 FAOS Subscale 79.17
22.34 85.42 ± 13.22 P = 0.413
±
±
±
±
±
±
Functional Performance and Tendon Morphology After Operative or Nonoperative Treatment of Achilles Te… International Journal of Sports Physical Therapy
Table 2. Calf and tendon morphology and ankle range of motion
Non-operative Operative Statistical Comparisons Unaffected Affected Unaffected Affected Interaction Group Side Calf circumference (cm) (at 15cm) 41.1 ± 5.8 39.5 ± 7.3 40.4 ± 3.4 38.8 ± 3.6 F = 0.002 p = 0.993 F = 0.209 p = 0.650 F = 1.075 p = 0.306 Calf circumference (cm) (at max girth) 42.4 ± 6.2 41.1 ± 3.3 40.9 ± 7.4 39.8 ± 3.5 F = 0.001 p = 0.972 F = 0.591 p = 0.446 F = 0.835 p = 0.366 Gastrocnemius Thickness (cm) Lateral 1.61 ± 0.4 1.29 ± 0.5 1.8 ± 0.3 1.5 ± 0.4 F = 0.01 p = 0.886 F = 3.763 p = 0.059 F = 7.668 p = 0.008 Gastrocnemius Thickness (cm) Medial 2.15 ± 0.5 1.7 ± 0.5 2.2 ± 0.4 1.9 ± 0.3 F = 0.294 p = 0.590 F = 0.695 p = 0.409 F = 10.98 p = 0.002 AT Thickness (cm) 0.54 ± 0.08 1.13 ± 0.23 0.48 ± 0.16 1.24 ± 0.20 F = 2.438 p = 0.126 F = 0.257 p = 0.614 F = 176.18 p < 0.001 AT Length (cm) 19.03 ± 3.70 21.38 ± 2.89 19.91 ± 2.16 21.79 ± 1.59 F = 0.089 p = 0.766 F = 0.694 p = 0.409 F = 7.360 p = 0.009 AT Resting Angle 49 ± 7 42 ± 7 49 ± 6 41 ± 5 F = 0.005 p = 0.943 F = 0.131 p = 0.720 F = 16.185 p < 0.001 Plantar Flexion Active Range of motion (o) 58 ± 5 58 ± 6 57 ± 9 54 ± 7 F = 0.519 P = 0.475 F = 1.407 P = 0.242 F = 0.459 P = 0.501 Dorsiflexion Active Range of motion (o) 14 ± 5 14 ± 6 14 ± 3 14 ± 4 F = 0.045 P = 0.833 F = 0.045 P = 0.833 F = 0.008 P = 0.928 Functional Performance and Tendon Morphology After Operative or Nonoperative Treatment of Achilles Tendon Ruptures International Journal of Sports Physical Therapy
(F(1,42) = 5.201, p = 0.028), and while reduced at 60o/s this was not statistically significant (F(1,40) = 3.732, p = 0.06; Table 3). There was no effect of group, or interaction of group and side for angle-specific torque at 20o plantar flexion.
HOP AND JUMP PERFORMANCE
Performance was not statistically significantly different between limbs for all single leg hop and single leg jump tests (Table 4). The only significant difference was greater single leg drop vertical jump height in the operative relative to non-operative group (F(1,36) = 6.541, p = 0 .015; Table 4), with no effect of side or interaction. Bilateral jump tests were also not significantly different between groups (Table 5).
RELATIONSHIP BETWEEN ACHILLES TENDON LENGTH AND PERFORMANCE
Regression analyses identified minimal to no association between AT length and single leg hop distance across both the affected and unaffected limbs (Table 6). Only torque at 20o plantar flexion when measured at 120o/s was found to have a significant association with AT length, with AT length explaining 11% of the variance (p = 0.03, Table 6), and peak torque at 120o/s approached significance (8.4%, p = 0.05, Table 6). No significant associations were identified between affected limb AT length and LSI values for the single leg hop or strength outcomes, while the LSI of Peak Torque at 120o/s approached statistical significance (15.6%, p = 0.06; Table 6).
DISCUSSION
This study found persistent gastrocnemius atrophy alongside tendon elongation and thickening regardless of operative or non-operative management of ATR. Impairment in plantar flexor strength was found when measured at 20o plantar flexion at 120o/s, but not when considering peak torque or at slower testing velocities. Despite this reduction, performance on dynamic jumping and hopping tests were comparable between limbs and treatment groups, apart from higher SL-DVJ heights in the operatively managed group. AT length had no association with single leg hop distance or LSI, whereas a minor association was found with overall AT length and plantar flexor torque at 20o plantar flexion at 120o/s.
The relationship between AT length and plantar flexion strength is inconsistent in the literature.9,10,12,13 Similar to some studies, this study found impaired isokinetic plantar flexor strength when measured at greater degrees (20o) of plantar flexion.9,28,29 Both Pajala et al30 and Heikkinen et al9 demonstrated positive correlations between work or peak torque deficits and tendon elongation following ATR, suggesting impaired force production with tendon elongation. Conversely, others have found no relationship between isokinetic work or peak torque and AT length following ATR.28,29,31 The overall lack of agreement regarding
strength measurement techniques, including the mode of contraction (isokinetic versus isometric), the metric used to quantify (peak torque versus work), the angle of determination (peak torque versus angle-specific torque), may partially explain the discrepant findings. The development of standardized testing protocols, with test velocities of 120-180o/s with angle-specific measurement of plantar flexor torque at 20-30o plantar flexion, may provide further clarification on the relationship of AT length to plantar flexor strength.
Altered movement patterns and kinetics in walking, jogging and CMJs have been observed following ATR12; however, altered kinematics and kinetics do not necessarily translate into reduced performance outcomes. These results indicate that performance in unilateral hopping and bilateral jumping was comparable between both limbs and groups, apart from the single-leg DVJ which was greater in operative patients, despite significant AT elongation in both groups. Deficits in functional tasks are variable in the literature, of which the evaluation of differing post-operative time points and functional tests are confounding factors. Deficits in SL-DVJ performance have been previously described, upwards of six years post-operative,32,33 while others have found no difference in SL-CMJ and vertical hopping height.15,34 Kinetic compensations during jumping or hopping indicate reduced use on the ankle, with reduced concentric and eccentric plantar flexor power,19, 33 and increased eccentric33 or concentric knee power 34 Comparable SL-DVJ between operative and non-operative management has been found, whereas the present study found increased jump height in the operative group, that did not extend across other hop or jump tests. Brorsson et al35 found impaired single leg hop for distance, in contrast to the present results; however, the average LSI values approached 95%, indicating minimal difference between limbs despite statistically significant differences as well as no difference between operative and non-operative groups. Unique to the present study is the observation that AT length did not have an association with single leg hop performance. Few studies have evaluated the direct relationship between AT length and dynamic performance. Brorsson et al19 identified that patients with >30% heel-rise deficit had reduced ankle concentric and eccentric plantar flexor power during drop jumps and vertical hopping, alongside reduced peak Achilles tendon force and impulse. However, AT length did not correlate with any kinetic differences between the groups. It is possible that there is a threshold whereby AT length impacts dynamic performance, as while others have demonstrated altered walking kinematics,12 Kastoft et al36 recently found near symmetrical between-limb walking kinematics up to 4.5 years after non-operative management, except for a slight delay in heel lift-off, despite upwards of 1.7 cm AT elongation. Conversely, the previously discussed knee-dominant kinetic strategies may be sufficient to maintain hopping and jumping performance, such that no relationship with AT length would be expected on performance outcomes alone. Functional task selection may be important when considering altered kinetic strategies, as ankle, hip and knee contribu-
Functional Performance and Tendon Morphology After Operative or Nonoperative Treatment of Achilles Te… International Journal of Sports Physical Therapy
Table 3. Ankle Plantar Flexor Strength
Non-operative Operative Statistical Values Unaffected Affected LSI Unaffected Affected LSI Interaction Group Side Peak Torque 60o/s 71.00 ± 32.19 64.61 ± 20.54 98.5 ± 27.6% 69.01 ± 24.70 60.75 ± 23.19 92.4 ± 31.8% F (1,42) = 0.016 p = 0.901 F(1,42) = 0.151 p = 0.699 F(1,42) = 0.950 p = 0.335 Peak Torque 120o/s 53.4 ± 16.26 45.07 ± 12.20 86.3 ± 20.2 % 48.68 ± 20.09 43.97 ± 19.01 91.5 ± 17.8 % F(1,42) = 0.125 p = 0.0725 F(1,42) = 0.326 p = 0.571 F(1,42) = 1.634 p = 0.208 Torque 20o, 60o/s 59.45 ± 27.51 44.67 ± 20.98 83.7 ± 41.8% 59.46 ± 15.86 49.78 ± 17.68 88.7 ± 40.0 % F(1,40) = 0.162 p = 0.689 F(1,40) = 0.164 p = 0.688 F(1,40) = 3.732 p = 0.06 Torque 20o, 120o/s 48.60 ± 16.85 35.85 ± 10.74 76.4 ± 20.8% 44.58 ± 17.94 36.56 ± 14.99 84.5 ± 20.2 % F(1,42) = 0.269 p = 0.606 F(1,42) = 0.131 p = 0.719 F(1,42) = 5.201 p = 0.028
Non-operative Operative Statistical Comparisons Unaffected Affected LSI Unaffected Affected LSI Interaction Group Side Single Leg Hop (cm) 110.3 ± 26.7 105.1 ± 28.6 94.7 ± 8.0 (n = 11) 115.4 ± 47.8 107.6 ± 46.5 93.2 ± 13.0 (n = 12) F(1,42) = 0.012 p = 0.912 F(1,42) = 0.108 p = 0.744 F(1,42) = 0.312 p = 0.580 Triple Hop (cm) 374.5 ± 73.0 364.4 ± 97.2 97.2 ± 5.9 (n = 11) 385.8 ± 142.7 376.1 ± 133.5 98.2 ± 6.8 (n = 12) F(1,42) = 0.00 p = 0.996 F(1,42) = 0.120 p = 0.731 F(1,42) = 0.089 p = 0.767 Crossover hop (cm) 326.5 ± 81.2 304.5 ± 86.7 93.2 ± 10.8 (n = 11) 344.1 ± 143.2 340.4 ± 134.2 100.5 ± 7.7 (n = 11) F(1,42) = 0.071 p = 0.792 F(1,42)= 0.600 p = 0.443 F(1,42) = 0.138 p = 0.712 6M Timed Hop (s) 2.5 ± 0.4 2.7 ± 0.7 93.3 ± 8.3 (n = 11) 2.7 ± 01.0 2.9 ± 1.1 95.1 ± 6.8 (n = 12) F(1,42) = 0.013 p = 0.910 F(1,42) = 0.470 p = 0.497 F(1,42) = 0.629 p = 0.432 SL-CMJ (cm) 7.9 ± 3.4 6.1 ± 3.5 85.1 ± 15.3 (n = 11) 9.8 ± 4.84 8.6 ± 4.3 88.0 ± 25.9 (n = 10) F(1,42) = 0.002 p = 0.140 F(1,42) = 2.265 p = 0.140 F(1,42) = 0.923 p = 0.342 SL-DVJ (cm) 9.7 ± 2.9 8.6 ± 2.7 91.8 ± 21.2 (n = 10) 12.5 ± 5.2 12.0 ± 4.2 100.1 ± 18.2 (n = 11) F(1,36) = 0.063 p = 0.803 F(1,36) = 6.541 p = 0.015 F(1,36) = 0.422 p = 0.520 Functional
Operative
Achilles
Ruptures International Journal of Sports Physical Therapy
Table 4. Single Leg Hop and Jump Performance
Performance and Tendon Morphology After
or Nonoperative Treatment of
Tendon
Table 5. Bilateral Jump Tests
Table 6. Regression analyses between normalized AT length and performance outcomes considering both the affected and unaffected limbs or limb symmetry index (LSI).
tions vary between vertical or horizontal hops.37 In this case, contribution of the ankle is greatest in the concentric (take-off) phase of horizontal hopping, which suggests future kinetic and kinematic investigations should focus on horizontal hopping, whereas current studies have evaluated primarily vertical hopping and jumping.19,33,34
There were some limitations within this study that should be considered when examining these results. One limitation was the small sample size amongst the potentially eligible screened population. Secondly, due to recruitment being voluntary, bias may exist as the individuals who responded and underwent an assessment may not be entirely representative of the population of individuals with ATRs. Achilles rehabilitation is not standardized across surgeons and sports medicine physicians at this center which introduces variability in participants’ recovery processes and limits the ability to isolate differences between management groups.
CONCLUSION
Participants’ musculotendinous morphology, strength, and functional performance did not differ between operative and non-operative management of acute ATR. Despite persistent gastrocnemius atrophy, plantarflexion weakness and tendon elongation, lower extremity dynamic performance measures were maintained. While no relationship was found between AT length and single leg hop performance, AT length did partially explain isokinetic plantar flexor strength when measured at 20o plantar flexion at higher speeds (120o/s).
CONFLICTS OF INTEREST
The authors report no conflicts of interest.
Submitted: January 16, 2024 CDT, Accepted: April 03, 2024 CDT
© The Author(s)
This is an open-access article distributed under the terms of the Creative Commons Attribution 4.0 International License (CCBY-NC-4.0). View this license’s legal deed at https://creativecommons.org/licenses/by-nc/4.0 and legal code at https://creativecommons.org/licenses/by-nc/4.0/legalcode for more information.
Non-operative Operative Test Statistic P-Value Counter Movement Jump (cm) 19.1 ± 7.7 (n = 12) 22.1 ± 8.6 (n = 12) t(22) = -0.904 p = 0.376 Squat Jump (cm) 19.1 ± 7.3 (n = 12) 21.7 ± 8.3 (n = 12) t(22) = -0.819 p = 0.421 Drop Counter Movement Jump (cm) 24.9 ± 6.4 (n = 11) 25.9 ± 10.6 (n = 12) t(21) = -0.398 p = 0.695
Achilles
R2 B (95%CI) P Value Single Leg Hop (/height) 0.008 -0.47 (-2.00 – 1.06) 0.54 Peak Torque (60o/s) 0.052 -1.36 (-3.13 – 0.40) 0.13 Peak Torque (120o/s) 0.084 -1.18 (-2.38 – 0.01) 0.05 Torque 20o (60o/s) 0.072 -1.41 (-2.95 – 0.13) 0.07 Torque 20o (120o/s) 0.109 -1.25 (-2.34 – 0.16) 0.03 Single Leg Hop LSI 0.002 -0.11 (-1.34 – 1.13) 0.86 Peak Torque 60o/s LSI 0.003 -0.37 (-3.68 – 2.94) 0.82 Peak Torque 120o/s LSI 0.156 -1.83 (-3.77 – 0.10) 0.06 Torque 20o (60o/s) LSI 0.005 0.25 ( -4.89 – 5.38) 0.92 Torque 20o (120o/s) LSI 0.035 -0.96 (-3.23 – 1.32) 0.39
Tendon Length
Functional Performance and Tendon Morphology After Operative or Nonoperative Treatment of Achilles Te… International Journal of Sports Physical Therapy
REFERENCES
1. Bhandari M, Guyatt GH, Siddiqui F, et al. Treatment of acute Achilles tendon ruptures: a systematic overview and metaanalysis. Clin Orthop Relat Res 2002;(400):190-200. doi:10.1097/ 00003086-200207000-00024
2. Khan RJK, Fick D, Keogh A, Crawford J, Brammar T, Parker M. Treatment of acute Achilles tendon ruptures. A meta-analysis of randomized, controlled trials. J Bone Joint Surg Am. 2005;87(10):2202-2210. doi:10.2106/JBJS.D.03049
3. Costa ML, MacMillan K, Halliday D, et al. Randomised controlled trials of immediate weightbearing mobilisation for rupture of the tendo Achillis. J Bone Joint Surg Br 2006;88(1):69-77 doi:10.1302/ 0301-620X.88B1.16549
4. Nilsson-Helander K, Grävare Silbernagel K, Thomeé R, et al. Acute Achilles tendon rupture: A randomized, controlled study comparing surgical and nonsurgical treatments using validated outcome measures. Am J Sports Med 2010;38(11):2186-2193. doi:10.1177/0363546510376052
5. Olsson N, Silbernagel KG, Eriksson BI, et al. Stable surgical repair with accelerated rehabilitation versus nonsurgical treatment for acute Achilles tendon ruptures: A randomized controlled study Am J Sports Med 2013;41(12):2867-2876. doi:10.1177/ 0363546513503282
6. Renninger CH, Kuhn K, Fellars T, Youngblood S, Bellamy J. Operative and nonoperative management of Achilles tendon ruptures in active duty military population. Foot Ankle Int 2016;37(3):269-273. doi:10.1177/1071100715615322
7. Twaddle BC, Poon P. Early motion for Achilles tendon ruptures: is surgery important? A randomized, prospective study Am J Sports Med 2007;35(12):2033-2038. doi:10.1177/ 0363546507307503
8. Willits K, Amendola A, Bryant D, et al. Operative versus nonoperative treatment of acute Achilles tendon ruptures: A multicenter randomized trial using accelerated functional rehabilitation. J Bone Joint Surg Am. 2010;92(17):2767-2775. doi:10.2106/ JBJS.I.01401
9. Heikkinen J, Lantto I, Piilonen J, et al. Tendon Length, Calf muscle atrophy, and strength deficit after acute Achilles tendon rupture: Long-term follow-up of patients in a previous study J Bone Joint Surg Am. 2017;99A(18):1509-1515. doi:10.2106/ JBJS.16.01491
10. Heikkinen J, Lantto I, Flinkkila T, et al. Soleus Atrophy is common after the nonsurgical treatment of acute Achilles tendon ruptures: A randomized clinical trial comparing surgical and nonsurgical functional treatments. Am J Sports Med 2017;45(6):1395-1404. doi:10.1177/ 0363546517694610
11. Carmont MR, Zellers JA, Brorsson A, NilssonHelander K, Karlsson J, Grävare Silbernagel K. Age and tightness of repair are predictors of heel-rise height after Achilles tendon rupture. Orthop J Sports Med. Published online 2020. doi:10.1177/ 2325967120909556
12. Diniz P, Pacheco J, Guerra-Pinto F, Pereira H, Ferreira FC, Kerkhoffs G. Achilles tendon elongation after acute rupture: is it a problem? A systematic review Knee Surg Sports Traumatol Arthrosc 2020;28(12):4011-4030. doi:10.1007/ s00167-020-06010-8
13. Rosso C, Vavken P, Polzer C, et al. Long-term outcomes of muscle volume and Achilles tendon length after Achilles tendon ruptures. Knee Surg Sports Traumatol Arthrosc 2013;21(6):1369-1377 doi:10.1007/s00167-013-2407-1
14. Nicholson G, Walker J, Dawson Z, Bissas A, Harris N. Morphological and functional outcomes of operatively treated Achilles tendon ruptures. Phys Sportsmed 2020;48(3):290-297 doi:10.1080/ 00913847.2019.1685364
15. Nordenholm A, Nilsson N, Senorski EH, Helander KN, Westin O, Olsson N. Patients with chronic Achilles tendon rupture have persistent limitations in patient-reported function and calf muscle function one year after surgical treatment – a case series. J Exp Orthop 2022;9:15. doi:10.1186/s40634-022-00451-5
16. Carmont MR, Silbernagel KG, Mathy A, Mulji Y, Karlsson J, Maffulli N. Reliability of Achilles tendon resting angle and calf circumference measurement techniques. Foot Ankle Surg. 2013;19(4):245-249. doi:10.1016/j.fas.2013.06.007
17 Perkisas S, Bastijns S, Baudry S, et al. Application of ultrasound for muscle assessment in sarcopenia: 2020 SARCUS update. Eur Geriatr Med 12(2021):45-59. doi:10.1007/s41999-020-00433-9
18. Silbernagel KG, Steele R, Manal K. Deficits in heel-rise height and Achilles tendon elongation occur in patients recovering from an Achilles tendon rupture. Am J Sports Med. 2012;40(7):1564-1571. doi:10.1177/0363546512447926
Functional
After Operative
Treatment of Achilles Te… International Journal of Sports Physical Therapy
Performance and Tendon Morphology
or Nonoperative
19. Brorsson A, Willy RW, Tranberg R, Grävare Silbernagel K. Heel-rise height deficit 1 year after Achilles tendon rupture relates to changes in ankle biomechanics 6 years after injury. Am J Sports Med. 2017;45(13):3060-3068. doi:10.1177/ 0363546517717698
20. Barfod KW, Riecke AF, Boesen A, et al. Validation of a novel ultrasound measurement of achilles tendon length. Knee Surg Sports Traumatol Arthrosc 2015;23(11):3398-3406. doi:10.1007/ s00167-014-3175-2
21. Rosso C, Schuetz P, Polzer C, Weisskopf L, Studler U, Valderrabano V Physiological Achilles tendon length and its relation to tibia length. Clin J Sport Med 2012;22(6):483-487 doi:10.1097/ JSM.0b013e3182639a3e
22. Cramer A, Rahdi E, Hansen MS, Sandholdt H, Hölmich P, Barfod KW No clinically relevant difference between operative and non-operative treatment in tendon elongation measured with the Achilles tendon resting angle (ATRA) 1 year after acute Achilles tendon rupture. Knee Surg Sports Traumatol Arthrosc 2021;29(5):1617-1626. doi:10.1007/s00167-020-06391-w
23. Cramer A, Hansen MS, Hölmich P, Barfod KW Neither heel-rise Height (HRH) nor Achilles tendon resting angle (ATRA) show strong correlations to patient limitations and return to previous activities one year after acute Achilles tendon rupture. Foot Ankle Surg 2021;28(6):795-799. doi:10.1016/ j.fas.2021.11.003
24. Hansen MS, Barfod KW, Kristensen MT. Development and reliability of the Achilles tendon length measure and comparison with the Achilles tendon resting angle on patients with an Achilles tendon rupture. Foot Ankle Surg 2017;23(4):275-280. doi:10.1016/j.fas.2016.08.002
25. Hansen MS, Kristensen MT, Hölmich P, Barfod KW The Achilles tendon length measure and the Achilles tendon resting angle show acceptable construct validity using the Copenhagen Achilles Length Measure as gold standard. Foot Ankle Surg 2021;27(6):655-659. doi:10.1016/j.fas.2020.08.004
26. Spennacchio P, Vascellari A, Cucchi D, Canata G, Randelli P Outcome evaluation after Achilles tendon ruptures. A review of the literature. Joints. 2016;04(01):052-061. doi:10.11138/jts/2016.4.1.052
27 Costa ML, Achten J, Marian IR, et al. Plaster cast versus functional brace for non-surgical treatment of Achilles tendon rupture (UKSTAR): a multicentre randomised controlled trial and economic evaluation. The Lancet. 2020;395(10222):441-448. doi:10.1016/ S0140-6736(19)32942-3
28. Heikkinen J, Lantto I, Flinkkilä T, et al. Augmented compared with nonaugmented surgical repair after total Achilles rupture: Results of a prospective randomized trial with thirteen or more years of follow-up. J Bone Joint Surg Am 2016;98(2):85-92. doi:10.2106/JBJS.O.00496
29. Mortensen NHM, Skov O, Jensen PE. Early motion of the ankle after operative treatment of a rupture of the Achilles tendon. A prospective, randomized clinical and radiographic study. J Bone Joint Surg Am. 1999;81(7):983-990. doi:10.2106/ 00004623-199907000-00011
30. Pajala A, Kangas J, Siira P, Ohtonen P, Leppilahti J. Augmented compared with nonaugmented surgical repair of a fresh total Achilles tendon rupture: A prospective randomized study. J Bone Joint Surg Am. 2009;91(5):1092-1100. doi:10.2106/JBJS.G.01089
31. Kangas J, Pajala A, Ohtonen P, Leppilahti J. Achilles tendon elongation after rupture repair: A randomized comparison of 2 postoperative regimens. Am J Sports Med 2007;35(1):59-64. doi:10.1177/ 0363546506293255
32. Olsson N, Nilsson-Helander K, Karlsson J, et al. Major functional deficits persist 2 years after acute Achilles tendon rupture. Knee Surg Sports Traumatol Arthrosc. 2011;19(8):1385-1393. doi:10.1007/ s00167-011-1511-3
33. Powell HC, Silbernagel KG, Brorsson A, Tranberg R, Willy RW. Individuals post Achilles tendon rupture exhibit asymmetrical knee and ankle kinetics and loading rates during a drop countermovement jump. J Orthop Sports Phys Ther. 2018;48(1):34-43. doi:10.2519/jospt.2018.7684
34. Willy RW, Brorsson A, Powell HC, Willson JD, Tranberg R, Grävare Silbernagel K. Elevated knee joint kinetics and reduced ankle kinetics are present during jogging and hopping after Achilles tendon ruptures. Am J Sports Med. 2017;45(5):1124-1133. doi:10.1177/0363546516685055
35. Brorsson A, Grävare Silbernagel K, Olsson N, Nilsson Helander K. Calf muscle performance deficits remain 7 years after an Achilles tendon rupture. Am J Sports Med 2018;46(2):470-477 doi:10.1177/ 0363546517737055
36. Kastoft R, Barfod K, Bencke J, Speedtsberg MB, Hansen SB, Penny JØ 1.7 cm elongated Achilles tendon did not alter walking gait kinematics 4.5 years after non-surgical treatment. Knee Surg Sports Traumatol Arthrosc 2022;30(10):3579-3587 doi:10.1007/s00167-022-06874-y
Functional Performance and Tendon Morphology After Operative or Nonoperative Treatment of Achilles Te… International Journal of Sports Physical Therapy
37 Kotsifaki A, Korakakis V, Graham-Smith P, Sideris V, Whiteley R. Vertical and horizontal hop performance: Contributions of the hip, knee, and ankle. Sports Health. 2021;13(2):128-135. doi:10.1177/1941738120976363
Functional
Achilles Te… International Journal of Sports Physical Therapy
Performance and Tendon Morphology After Operative or Nonoperative Treatment of
Postural Control During Single-Leg Landing in Female Athletes After Anterior Cruciate Ligament Reconstruction
Ayane Ogura1 , Terumitsu Miyazaki2 , Hirofumi Ida3 , Satoshi Shibata4 , Masahiro Takemura5a
1 Graduate School of Comprehensive Human Sciences, University of Tsukuba, 2 National Institute of Fitness and Sports in Kanoya, 3 Human Science Center, Ibaraki Prefectural University of Health Sciences, 4 Physical Therapy, Ibaraki Prefectural University of Health Sciences, 5 Faculty of Health and Sport Sciences, University of Tsukuba
Keywords: anterior cruciate knee ligament reconstruction, female athletes
https://doi.org/10.26603/001c.117400
International Journal of Sports Physical Therapy
Background
Secondary anterior cruciate ligament (ACL) injury is a complication of ACL reconstruction (ACLR), which may result from altered neuromuscular control affecting anticipatory postural adjustments (APAs) and compensatory postural adjustments (CPAs) required for maintaining balance during movement. However, it remains unclear how APAs and CPAs differ in single-leg landings post-ACLR compared to healthy subjects.
Purpose
The purpose of this study was to clarify the differences in muscle activities of APAs and CPAs, lower limb kinematics, and kinetics between athletes with a history of ACLR and healthy athletes during single-leg landing.
Study design
Cross-sectional study
Methods
Eighteen female athletes were recruited and divided into ACLR (n = 9) and control groups (n = 9). The experimental task involved a single-leg landing from a 30 cm box. Joint angles and moments were determined using a 3-dimensional motion analysis system, while muscle activity was assessed using surface electromyography Analysis intervals were divided into two phases: the APA phase (-150 ms to 50 ms) and the CPA phase (50 ms to 250 ms), with initial contact (0 ms) as the reference point. Muscle activity onset time was defined as the time when the baseline exceeded by the sum of mean values and 2 standard deviations.
Results
No significant differences were observed in muscle activity or onset time between the ACLR and control groups. However, an increased hip external rotation moment was observed during the CPA phase in the ACLR group.
Conclusion
These findings suggest that APAs and CPAs of athletes who returned to sports more than 1 year post-ACLR may be similar The increased hip external rotation moment in the ACLR group during the CPA phase could represent a specific compensatory strategy to decrease the hip internal rotation angle post-ACLR.
Level of Evidence
III
Corresponding author: Masahiro Takemura
Faculty of Health and Sport Sciences, University of Tsukuba 1-1-1 Tennodai, Tsukuba, Ibaraki 305-8577, Japan
Original Research
a
During Single-Leg Landing
After
Published
2024:681-691. doi:10.26603/001c.117400
Ogura A, Miyazaki T, Ida H, Shibata S, Takemura M. Postural
Control
in Female Athletes
Anterior Cruciate Ligament Reconstruction. IJSPT
online June 1,
INTRODUCTION
Anterior cruciate ligament (ACL) injuries frequently occur in female athletes,1 and many undergo ACL reconstruction (ACLR) to return to sport (RTS).2 It has been reported that the incidence of a second ACL injury in the ACLR group was 0.47 per 1000 athlete exposures (AEs), which is about twice as high as the incidence of the initial ACL injury at 0.24 per 1000 AEs.3 Since secondary ACL injury is more common in females than in males,3 there is a relatively high need to investigate female athletes.
Seventy percent of ACL injuries occur via non-contact mechanisms4 and are caused by large ground reaction forces acting on the landing leg during rapid deceleration movements such as single-leg landing.5 These may not only result from the initial ACL injury, but also the risk of injury may be greater after ACLR. This is due to alterations in movement patterns, such as joint angles, joint moments, and coordination movements during single-leg landing and hopping post-ACLR, resulting from deficits in neuromuscular control.6,7 Afferent mechanosensory feedback control from the knee joint after initial contact (IC), which occurs to stabilize the joint during landing movements, takes more than 100 ms.8,9 However, ACL injury occurs 40 ms after IC,10 which renders feedback control too late to prevent ACL injury Therefore, the timing of ACL injury may occur before feedback occurs. Consequently, assessing neuromuscular control before and after the onset of sensory input during single-leg landing movements can elucidate the ongoing neuromuscular activity strategies when an ACL injury is expected to occur
In a previous study of biomechanics during drop-landing after ACLR, asymmetry of sagittal plane knee extension moment, knee valgus angle, and hip internal rotation moment were identified as risk factors for secondary ACL injury.11 Additionally, knee valgus angle enhances hip rotation moment and knee extension moment asymmetry, and deficits in single-leg balance are associated with the risk of reinjury. Knee abduction moment, internal tibial rotation moment, and anterior tibial shear force12 under axial impact produced clinically relevant ACL injuries.13 In summary, it has been pointed out that biomechanics during landing are an important factor in secondary ACL injury prevention after ACLR, but the changes in neuromuscular activity associated with movement patterns during landing are not clear Therefore, it is necessary to examine these factors together to identify strategies for preventing secondary ACL injuries after ACLR.
The ability to minimize postural disturbances plays a crucial role in preventing injuries during sports activities.14 These efforts are achieved through compensatory and anticipatory strategies aimed at minimizing both unpredictable and predictable perturbations.8,15 Anticipatory postural adjustments (APAs) and compensatory postural adjustments (CPAs) come into play to maintain postural stability APAs involve the activation or inhibition of lower limb muscles before internal or external balance perturbation occurs.16 Their primary role is to mitigate the impact of postural perturbation for maintaining balance.17 Con-
versely, CPAs are typically triggered by sensory feedback signals evoked by perturbation.9,18 Consequently, there is continuous muscle activity from the anticipatory to the compensatory phase during the movement.19 Therefore, it remains unclear during which phase of the landing ACL injury occurs in ACLR. By measuring APAs and CPAs before and after IC, it may be possible to clarify the mechanism of sensorimotor coordination during a risky landing motion. Also, it is possible that post-ACLR athletes’ neuromuscular control is affected by training during rehabilitation to return to sport.20 Hence, APAs and CPAs post-ACLR may exhibit distinct features compared to those observed in healthy subjects. However, the discrepancies between APAs and CPAs in female athletes with and without a history of ACLR have not yet been verified.
The purpose of this study was to clarify the differences in muscle activities of APAs and CPAs, lower limb kinematics, and kinetics between athletes with a history of ACLR and healthy athletes during single-leg landing. The hypotheses of this study were as follows: 1) muscle activity onset is delayed in the ACLR group compared to the control group; 2) muscle onset time was the same, but quadriceps activity during the compensatory phase was higher; and 3) hip adduction, internal rotation, and knee abduction angle at landing, along with hip adduction moment and knee abduction moment are reported to be higher in the ACLR group.21
METHODS
PARTICIPANTS
This cross-sectional study included nine female college athletes with a history of ACLR (ACLR group) and nine healthy subjects without a history of ACLR (CON group), selected from female athletes affiliated with university athletic clubs. The inclusion criteria for the ACLR group were as follows: 1) being 12 months post-surgery and having returned to full sports participation, 2) graft types being autograft (e.g., bone-patellar tendon-bone or hamstring tendon), 3) participation in sports activities such as cutting, pivoting, and jump-landing sports (handball, basketball, soccer, tennis, or lacrosse) prior to the injury, 4) no history of meniscal injury or surgery on either the ipsilateral or contralateral knee before ACL injury, and 5) absence of any disorders in the peripheral sensory system or history of surgery on the lumbar spine or lower limbs. The inclusion criteria for the CON group were: 1) no lower limb injuries and/or concussions within the prior three months and 2) no disorders in the peripheral sensory system or history of surgery on the lumbar spine or lower limbs.
The authors obtained written informed consent from all volunteers before their participation, following approval by the Ethics Committee of the Faculty of Health and Sports Sciences at the University (approval number 020-166).
EXPERIMENTAL TASK
The experimental task involved a single-leg landing from a 30 cm box, with participants instructed to land on the cen-
Postural Control During Single-Leg Landing in Female Athletes After Anterior Cruciate Ligament Reconstr… International Journal of Sports Physical Therapy
ter of the force platform placed in front of the box. Additionally, participants were instructed to place their hands on their waists to minimize the effect of balance retention by their upper limbs. For the single-leg landing motion, the injured leg was used in the ACLR group, while the dominant leg was used in the CON group. The dominant leg was defined as the leg preferred for kicking the ball by the participants. Throughout the experiment, participants were barefoot to eliminate the influence of footwear Each participant was allowed to participate in several practice trials, and measurements continued until three successful trials were completed. Failed trials were characterized by foot slip after landing, loss of balance (where the sole of the opposite foot touched the floor or force plate), or inability to maintain the correct arm position.
DATA COLLECTION
Surface electromyography (EMG) data were recorded at 1,000 Hz using a Data-LITE wireless EMG sensor (Biometrics Ltd.) and collected synchronously with the motion and force platform data. The skin at each electrode site was shaved and cleaned using an alcohol swab. Ultrasonography (Venue 50; GE Healthcare Japan) was used to define the anatomical properties of the superficial region of individual muscles for electrode placement, following the SENIAM recommendations.22 Electromyographic (EMG) activities of the tibialis anterior (TA), medial head of the gastrocnemius (MG), rectus femoris (RF), biceps femoris (BF), semitendinosus (ST), gluteus medius (GM), and adductor longus (AL) were measured. Electrodes were placed as follows: TA, 1/3 on the line between the tip of the fibula and the tip of the medial malleolus; MG, at the most prominent bulge of the muscle; RF, at 50% on the line from the anterior superior iliac spine to the superior part of the patella; BF, approximately halfway between the tibial lateral epicondyle and the ischial tuberosity over the muscle belly; ST, at 50% on the line between the ischial tuberosity and the medial epicondyle of the tibia; GM, 50% on the line from the iliac crest to the trochanter; and AL, between the sartorius and gracilis muscles.
A three-dimensional motion analysis system (VICON MX, Oxford, UK) captured task motions at a 250 Hz sampling rate using 13 infrared cameras. Thirty-five retroreflective markers were placed on the anatomical landmarks across each participant’s body according to the standard Plug-in Gait model (Genetic Hays marker set).23,24
Ground reaction force (GRF) data were measured using a force platform (Kistler Instruments, Inc., model 9281C, Winterthur, Switzerland). EMG and kinematic data were time-synchronized and acquired at 1,000 Hz. The GRF of the eight components (Fx, Fy, Fz, Mx, My, Mz, Cx, and Cy) were calculated for one force plate.
DATA ANALYSIS
The following parameters were analyzed: (1) integrated electromyographic (IEMG) data, (2) muscle activity onset at the IC, (3) hip and knee joint angles, and (4) hip and
knee joint moments. The analysis interval ranged from 150 ms before landing to 250 ms after landing, divided into the APA and CPA phases. Given previous studies suggesting that ACL injury may occur up to 100ms after IC, the analysis range was assumed to be no more than 100 ms after IC. IEMG was calculated for 4 different epochs, each lasting 100 ms in relation to T0 (defined as the instant when vertical ground reaction force exceeded 10N).25 APAs accounted for the electromechanical delay between muscle activity onset and torque generation, including the interval from T0 to 50 ms.26 The time windows for the four epochs were as follows: 1) from -150 to -50 ms (anticipatory activity, APA1); 2) -50 to +50 ms (anticipatory activity, APA2); 3) +50 to +150 ms (compensatory reactions, CPA1); and 4) + 150 to +250 ms (compensatory reactions, CPA2).
Anticipatory EMG activity was calculated as follows: EMG (APA1) represents the integral of EMG activity of the muscles from -150 to -50 ms with respect to t0, and similarly, EMG (APA2) is the integral of EMG activity, defined as the integral of the EMG signal from -50 to +50 ms with respect to t0. Compensatory EMG activity was calculated as follows: EMG (CPA1) represents the integral of the EMG activity of the muscles from +50 to +150 ms with respect to t0, while EMG (CPA2) was the integral of the EMG activity of the muscles from +150 to +250 ms with respect to t0.16
Data were analyzed offline using MATLAB (MathWorks Inc., USA). All EMG signals were rectified and filtered using a low-pass second-order Butterworth filter with a cutoff frequency of 20 Hz. For maximum voluntary contraction, IEMG data were calculated, and a 3 s IEMG was used to normalize the dynamic contraction recorded during landing (%MVC). Muscle activity onset was detected from the stance phase before landing for the baseline signal and 100 ms before approximately 300 ms from IC. Onset time was defined as the time when the EMG amplitude of the baseline signal exceeded the mean + 2SD for 12 ms.
Raw kinematic and kinetic data were filtered on the basis of frequency-content analysis of digitized coordinate data. GRF and marker trajectories were filtered at 15 Hz using a fourth-order Butterworth filter with VICON Nexus 2.0 software (Oxford Metrics Ltd., UK), consistent with previous studies.27 For all kinematic and kinetic data, the mean value of each 100 ms epoch was calculated. Joint angles and moments were averaged for each epoch, with time windows for the four epochs calculated at the same intervals as those for integral EMG.
Joint moments were computed on the reference leg side via a complete inverse-dynamic model implemented using the VICON Plug-in Gait. These moments were reported as external torques. Calculated GRF and joint moments were standardized according to the subject’s body mass (Nm/kg).
STATISTICAL ANALYSIS
To assess the normal distribution of the data, the ShapiroWilk tests were conducted prior to analysis. Independent-
Postural Control During Single-Leg Landing in Female Athletes After Anterior Cruciate Ligament Reconstr… International Journal of Sports Physical Therapy
Table 1. Participant characteristics
ACLR, anterior cruciate ligament reconstruction. CON, control
sample t-tests were used to ascertain significant differences in the onset time of muscle activity between participants in the ACLR and CON groups. For assessing significant interactions of each phase and participants in IEMG, hip, and knee joint angle, and moment, a two-way repeated measures analysis of variance (ANOVA) was utilized, followed by post hoc tests. Post-hoc Bonferroni multiple comparison procedures were used. Statistical analyses were performed using SPSS version 27 (IBM Corp., Armonk, NY, USA), with statistical significance set at p < 0.05. Additionally, a post-hoc power analysis was performed using G*Power software31(Version 3.1.9.6, University of Dusseldorf, Dusseldorf, DEU).28 The post-hoc power analysis, considering the significant result and the hip external rotation moment (effect size: 0.68), showed a power of 0.49 for both, calculated at an alpha level of 0.05.
RESULTS
Descriptive characteristics of participants are summarized in Table 1.
The onset times of muscle activity are depicted in Figure 1 for all participants, as well as specifically for the ACLR and CON groups. No significant differences were observed in the onset time of muscle activity (p > .05).
The IEMG results for each muscle in the ACLR and CON groups are presented in Table 2. Comparisons of the IEMG in each phase between ACLR and control groups revealed no interaction between groups (p>0.05) but significant main effects for the IEMG in each phase.
Multiple comparisons showed significantly higher values for CPA1 and 2 compared to APA1, and for CPA1 compared to APA2 in the TA (p < 0.05). In the MG, APA1 and 2 were significantly higher than CPA1 and 2 (p <0.05); in RF, CPA1 was significantly higher than APA1, and APA2 was significantly higher than CPA2 (p <.05); in the BF, APA1 and 2 and CPA1 were significantly higher than CPA2 (p <0.05); in ST, APA2 and CPA1 were significantly higher than APA1 (p <.05). In the GM, APA2 was significantly higher than APA1, CPA1and 2, (p <0.05). Also, in AL, APA2 and CPA1 were significantly higher than APA1 (p <0.05).
Comparison of hip and knee joint angles in each phase between ACLR and control groups showed no interaction
but significant main effects for the joint angles in each phase (Table 3). Multiple comparisons revealed that the hip flexion angle was significantly higher in the following order: CPA2, CPA1, APA1, and APA2, (p <0.05). The angles of adduction and abduction were significantly greater in the CPA1 and 2 compared to APA1 and 2 (p <0.05). Similarly, the angles of internal and external rotation were significantly higher in CPA2 than in APA1, and in CPA1 and 2 compared to APA2 (p <0.05). The flexion angle of the knee joint increased significantly in the following order: CPA2 > CPA1 > APA1 > APA2 (p <0.05). Additionally, the angles of adduction and abduction were significantly higher in CPA1 than in APA1 and significantly higher in CPA2, CPA1, and APA2 (p <0.05). The internal and external rotation angles were significantly greater in CPA1 and 2 than in APA1 and 2 (p <0.05).
The hip external rotation moment exhibited a significant interaction between the ACLR and CON groups (p<0.018) (Table 4). Using the post hoc test, the hip external rotation moment of the ACLR group (CPA1=0.46 ± 0.16 Nm/km, CPA2 = 0.44 ± 0.1 Nm/km) at CPA1 and 2 was significantly larger than that of the CON group (CPA1 = 0.27 ± 0.06 Nm/ km, CPA2 = 0.32 ± 0.09 Nm/km). For other parameters, a main effect was observed only for the phase, and multiple comparisons showed that the hip flexion moments were significantly higher for CPA1 and 2 compared to APA1 and 2 (p <0.05). The moments of adduction and abduction were significantly higher in the following order: CPA1, CPA2, APA2, and APA1 (p <0.05). APA1 and 2 exhibited significantly higher internal and external rotation moments than CPA1 and 2 (p <0.05). There was no interaction between the phase and joint moments of each group, and a main effect of the phase was observed only for the knee joint moments. Multiple comparisons revealed that the flexion moments were significantly higher in CPA1 and 2 compared to APA1 and 2 (p <0.05). The moments of adduction and abduction were significantly higher in the CPA1, CPA2, APA2, and APA1 groups (p <0.05). The moments of internal and external rotation were significantly higher in the following order: CPA1, CPA2, APA2, and APA1 (p <0.05).
ACLR group (n = 9) CON group (n = 9) p-value Mean ± SD Mean ± SD Age (years) 20.8±1.4 20.4±1.2 0.599 Body height (mm) 1624.7±52.5 1646.2±76.7 0.497 Body weight (kg) 57.5±5.9 57.8±6.3 0.922 Q-angle (°) 2.78±0.972 2.11±3.1 0.547 Thigh-foot angle (°) 9.56±3.504 8.67±5.6 0.691 Navicular drop test (cm) 4.11±3.06 4.22±2.8 0.937 General joint laxity 1.6±0.9 1.1±1.1 0.303 Leg heel angle (°) 3.0±1.4 4.1±1.2 0.088
Postural Control During Single-Leg Landing in Female Athletes After Anterior Cruciate Ligament Reconstr… International Journal of Sports Physical Therapy
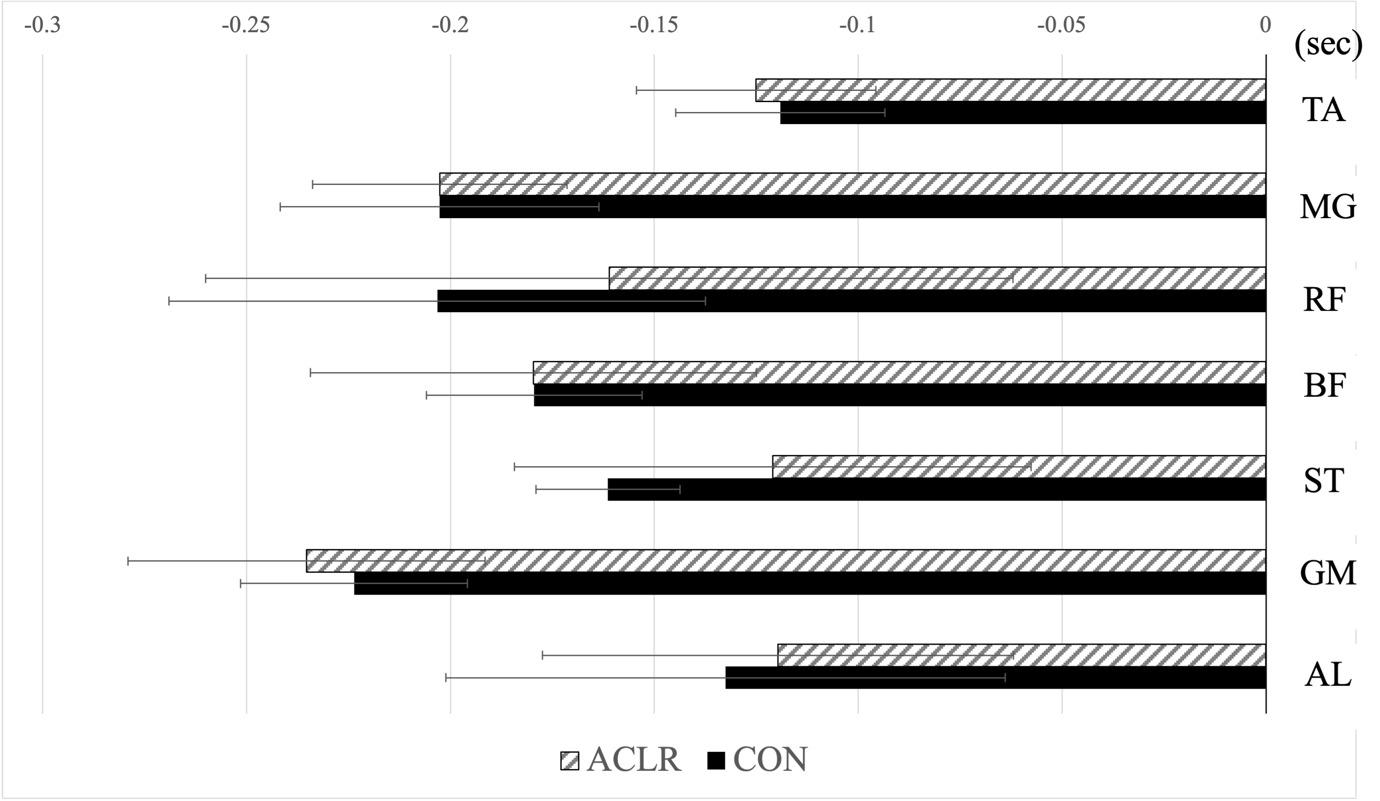
Figure 1. Muscle activity onset
ACLR, anterior cruciate ligament reconstruction. CON, control. TA, tibialis anterior MG, medial head of the gastrocnemius. RF, rectus femoris. BF, biceps femoris. ST, semitendinosus. GM, gluteus medius. AL, adductor longus
Table2. IEMG
anterior cruciate ligament reconstruction. CON, control. TA, tibialis anterior MG, medial head of the gastrocnemius. RF, rectus femoris. BF, biceps femoris. ST, semitendinosus. GM, gluteus medius. AL, adductor longus. APA, Anticipatory postural adjustments. CPA, compensatory postural adjustments.
DISCUSSION
This study aimed to elucidate differences in muscle activities during APAs and CPAs, as well as lower limb kinematics and kinetics between athletes with a history of ACLR and healthy athletes during single-leg landing. The hypotheses were: 1) muscle activity onset is delayed in the ACLR group
compared to the control group; 2) muscle onset time is the same, but quadriceps activity in the compensatory phase is higher; and 3) hip adduction moment and knee abduction moment are higher in the ACLR group during landing. Contrary to these hypotheses, the results of this study revealed that female athletes who underwent RTS post-ACLR exhibited muscle activation patterns similar to those of healthy
Phase; Time (ms) APA1; -150 ~ -50 APA2; -50 ~ 50 CPA1; 50 ~ 150 CPA2; 150 ~ 250 (CI) (95%CI) (95%CI) (95%CI) TA ACLR 39.3 (26.9 – 51.7) 62.7 (52.1 – 73.2) 86.6 (71.3 – 102) 83.8 (67 – 100.6) (%MVC) CON 39.3 (26.9 – 51.7) 62.7 (52.1 – 73.2) 86.6 (71.3 – 102) 83.8 (67 – 100.6) MG ACLR 84.6 (59.1 – 110.1) 72.3 (55.1 – 89.5) 41.2 (25.2 – 57.1) 26.7 (17.2 – 36.3) CON 95.5 (75.7 – 115.4) 85.3 (71.6 – 99) 46.6 (38 – 55.1) 33.1 (22.9 – 43.2) RF ACLR 61.2 (26.6 – 95.7) 118.3 (62.3 – 174.2) 96.6 (51.9 – 141.4) 63.7 (36 – 91.3) CON 74.5 (35.3 – 113.8) 139.8 (54.9 – 224.7) 111 (73.7 – 148.4) 73.6 (45.6 – 101.6) BF ACLR 56.7 (33.9 – 79.6) 51.1 (37.3 – 64.9) 45.3 (33.2 – 57.3) 36.2 (26.1 – 46.4) CON 60 (31.4 – 88.6) 57 (36.4 – 77.6) 48.1 (31.8 – 64.3) 32 (20 – 44) ST ACLR 30.9 (17.3 – 44.5) 43 (25.1 – 60.9) 41.7 (27 – 56.5) 27.7 (18.4 – 37.1) CON 28.7 (17.4 – 40) 36.9 (23.2 – 50.6) 48.2 (33.7 – 62.6) 36.4 (22.7 – 50) GM ACLR 56.2 (35.2 – 77.3) 74.7 (55.9 – 93.5) 51.9 (41.4 – 62.5) 36.4 (27.4 – 45.5) CON 43.4 (28.9 – 57.8) 60.6 (47.1 – 74) 55 (44.5 – 65.5) 39.1 (29.5 – 48.7) AL ACLR 24.9 (14.4 – 35.4) 46.1 (29.4 – 62.9) 54.3 (30.7 – 78) 44.8 (24.2 – 65.5) CON 22.4 (14.2 – 30.6) 38 (27.8 – 48.1) 48 (31.1 – 65) 34.5 (19.5 – 49.5) Mean ± SD ACLR,
Control During Single-Leg Landing in Female Athletes After Anterior Cruciate Ligament Reconstr… International Journal of Sports Physical Therapy
Postural
Table 3. Hip and knee joint angles
Mean ± SD ACLR, anterior cruciate ligament reconstruction. CON, control. APA, Anticipatory postural adjustments. CPA, compensatory postural adjustments.
subjects in both anticipatory and compensatory phases of single-leg landings.
ONSET TIMES OF MUSCLE ACTIVITY / IEMG
No significant differences were found in muscle activities during APAs and CPAs in any muscle between the ACLR and CON groups, which contradicts the study’s hypotheses. It has been suggested that factors such as muscle training29 and sensorimotor training included in rehabilitation may have contributed to early recovery of reflex excitability and motor neurons,30 enhancing neuromuscular control after ACLR.20 These may be adaptations due to learning by the central nervous system to plan anticipatory responses in advance.31 This finding aligns with previous research indicating that muscle activity in men after 14 months postACLR did not differ from that in healthy subjects.32 Furthermore, it suggests that female athletes who underwent RTS more than one year after ACLR may have recovered to a similar extent as healthy subjects in terms of muscle activation. Reduced muscle activity after RTS has been associated with poor performance and reduced dynamic stability of the knee during landing,33 underscoring the clinical significance of understanding changes in muscle activity at RTS.20,34 On the other hand, previous studies have reported earlier onset times or longer durations of muscle activities in the quadriceps and hamstring muscles before landing,35 indicating increased pre-muscle activity as a pro-
tective mechanism to stiffen the joint in preparation for impact after landing.36 However, these findings were mainly observed during the initial rehabilitation period (4 to 6 months post-surgery), whereas this study and others included subjects approximately 15 months32 and 60 months33 post-surgery Thus, early EMG onset may only be evident during the initial rehabilitation period. These results emphasize the clinical importance of understanding changes in muscle activity during RTS.20,37 While the present study showed that factors leading to the risk of ACL injury by muscle activity onset were eliminated more than one year after ACLR, a reported secondary ACL injury rate of 9% in the involved leg within two years after ACLR3 suggests that other factors may still pose a risk for secondary ACL injury ACLR has been associated with abnormal gamma loop activity, affecting the neuromuscular system through the spinal cord38 and sensory-motor deficits at the motor cortex level.39 Therefore, future research should explore changes in corticomotor excitability using functional MRI, transcranial magnetic stimulation, and H-reflexes to further understand these mechanisms.
KINEMATICS/KINETICS
The present study revealed a significant interaction in hip external rotation moments during the CPA phase, with higher values observed in the ACLR group compared to the CON group. However, no significant differences were found
Phase; Time
APA1; -150 ~ -50 APA2; -50 ~ 50 CPA1; 50 ~ 150 CPA2; 150 ~ 250 (95%CI) (95%CI) (95%CI) (95%CI) Hip Angle (°) Flexion+/ ACLR 34.3 (29 –39.6) 30.7 (26 –35.5) 48 (43.2 –52.9) 56.2 (50.4 –61.9) Extension- CON 31.3 (27.1 –35.6) 25.7 (21.2 –30.3) 41.2 (35.7 –46.7) 48.4 (41.7 –55.1) Adduction+/ ACLR -2.5 (-5.3 –0.2) -5.9 (-9.1 –-2.7) 3.3 (-0.7 – 7.2) 7.9 (4 – 11.9) Abduction- CON -1.5 (-3.8 –0.7) -5.5 (-7.4 –-3.6) 4.6 (0.8 – 8.3) 9.4 (6.3 – 12.4) Internal rotation+/ ACLR -2.6 (-12.9 –7.7) -3.5 (-14.1 – 7) -0.7 (-12.9 –11.5) -0.1 (-13.8 –13.7) External rotation- CON 4.6 (1.9 – 7.3) 4.2 (2.2 – 6.3) 8.9 (5.7 – 12.1) 10.7 (6.9 –14.4) Knee Angle (°) Flexion+/ ACLR 29.2 (24 –34.4) 21.9 (19.5 –24.3) 58 (56 – 59.9) 66.2 (63.9 –68.5) Extension- CON 33.8 (29.1 –38.4) 23 (20.3 –25.7) 57.5 (54.1 –60.9) 65.7 (59.6 –71.7) Adduction+/ ACLR 5.1 (1.9 – 8.2) 3.6 (1.1 – 6.1) 7.9 (1.6 – 14.3) 8.5 (0.9 – 16) Abduction- CON 4.6 (1.8 – 7.4) 3.2 (0.8 – 5.5) 9.3 (3.9 – 14.6) 10.4 (4.2 –16.5) Internal rotation+/ ACLR 4.5 (1.1 – 7.9) 6.7 (3 – 10.3) 17.7 (15.1 –20.3) 17.7 (15.5 –20) External rotation- CON 5.3 (2.1 – 8.5) 5.2 (2.7 – 7.6) 17.5 (14.1 –21) 17 (12.5 –21.6)
(ms)
Postural Control During Single-Leg Landing in Female Athletes After Anterior Cruciate Ligament Reconstr… International Journal of Sports Physical Therapy
Table 4. Hip and knee joint moments
Mean ± SD ACLR, anterior cruciate ligament reconstruction. CON, control. APA, Anticipatory postural adjustments. CPA, compensatory postural adjustments.
* Significant difference between the ACLR and CON
in lower limb joint angles between the two groups. Previous studies have shown that in kinematics, increased knee valgus and hip adduction angle during landing and cutting movements are risks for ACL injury,40,41 and decreased hip and knee flexion angles, along with increased GRF during such movements, can exert significant stress on the ACL.42 In kinetics, participants with smaller hip external rotator moments at the initial stage of landing were over eight times more likely to sustain a second ACL injury compared to those with greater hip external rotation moments.11 The similarity in lower limb joint angles between both groups in this study, alongside the increased hip external rotation moments in the ACLR group during CPAs, may be attributed to ACL injury prevention strategies implemented after ACLR, potentially affecting movement and postural control through kinetic changes. These strategies are considered ACLR-specific compensatory mechanisms aimed at reducing the angle of hip internal rotation occurring 50 ms postIC, which corresponds to the feedback phase following sensory nerve input. Consequently, the high value of hip external rotation moment observed in this study may signify a postural strategy during single-leg landing movement after ACLR.
LIMITATIONS
This study had some limitations. First, lower limb muscle strength was not measured, which could have affected muscle activity during single-leg landing, especially considering reports indicating a relationship between muscle fiber conduction velocity and force in isometric contractions of the quadriceps during knee extension43 might cause a difference in muscle activity during single-leg landing. Second, the experiment was conducted in a laboratory setting and involved only single-leg landings, which may yield different responses compared to performance during actual sports activities. This context should be considered when interpreting the data. Third, the ACLR group comprised only female athletes who had returned to competition approximately one year or more after surgery, and it remained unclear when and to what extent muscle function had recovered. Therefore, longitudinal studies investigating ACLR muscle function and assessing training effects are warranted. Fourth, the study had a limited number of subjects, and only a post hoc power analysis was conducted. Despite the small sample size, meaningful results were obtained. Finally, this study only included the involved leg, although
Phase; Time
APA1; -150 ~ -50 APA2; -50 ~ 50 CPA1; 50 ~ 150 CPA2; 150 ~ 250 (95%CI) (95%CI) (95%CI) (95%CI) Hip moment Flexion+/ ACLR 0.41 (0.3 − 0.52) 0.34 (0.17 − 0.5) 2.02 (1.59 − 2.45) 1.84 (1.52 − 2.16) (Nm/kg) Extension- CON 0.49 (0.38 − 0.6) 0.45 (0.34 − 0.56) 2.05 (1.75 − 2.34) 1.86 (1.62 − 2.1) Adduction+/ ACLR -0.03 (-0.1 − 0.05) 0.23 (0.04 − 0.43) 1.24 (0.47 − 2.01) 0.78 (0.18 − 1.37) Abduction- CON -0.08 (-0.13 − -0.02) 0.02 (-0.09 − 0.12) 0.56 (0.35 − 0.78) 0.39 (0.21 − 0.56) Internal rotation+/ ACLR -0.02 (-0.04 − 0.00) -0.05 (-0.07 − -0.03) -0.46 (-0.56 − -0.35) -0.44 (-0.51 − -0.38) External rotation- CON -0.02 (-0.03 − -0.01) -0.04 (-0.06 − -0.03) -0.27 (-0.3 − -0.23) -0.32 (-0.38 − -0.26) Knee moment Flexion+/ ACLR -0.21 (-0.26 − -0.15) -0.01 (-0.14 − 0.11) 1.84 (1.54 − 2.14) 1.04 (0.77 − 1.31) (Nm/kg) Extension- CON -0.21 (-0.28 − -0.15) -0.11 (-0.2 − -0.03) 1.61 (1.36 − 1.86) 0.91 (0.63 − 1.19) Varus+/ ACLR 0.03 (-0.01 − 0.07) 0.25 (0.22 − 0.29) 0.94 (0.62 − 1.27) 0.64 (0.44 − 0.83) Valgus- CON 0.02 (-0.01 − 0.05) 0.21 (0.16 − 0.26) 0.89 (0.61 − 1.16) 0.59 (0.36 − 0.81) Internal rotation+/ ACLR 0.01 (0.00 − 0.01) 0.08 (0.07 − 0.09) 0.25 (0.19 − 0.31) 0.14 (0.11 − 0.17) External rotation- CON 0.01 (0.00 − 0.01) 0.08 (0.06 − 0.09) 0.25 (0.19 − 0.32) 0.14 (0.07 − 0.2)
(ms)
Postural Control During Single-Leg Landing in Female Athletes After Anterior Cruciate Ligament Reconstr… International Journal of Sports Physical Therapy
it is well-established that neuromuscular changes after ACL injury can also affect the contralateral leg.44 Including the contralateral leg in future studies will provide a better understanding of contralateral injury mechanisms and postural control after ACLR. In the future, it will be essential to examine the effects of post- ACLR status on muscle strength and surgical techniques.
CONCLUSION
The findings of the current study indicate that in female athletes who underwent RTS after ACLR, the onset of muscle activity during single-leg landing was similar to that of the control group. Both the amount and pattern of muscle activity during APAs and CPAs were similar to those observed in the control group. Additionally, no significant differences were observed in hip and knee joint angles between the two groups. However, during the CPA phase, the ACLR group exhibited higher values of hip external rotation moments compared to the control group. Clinically, this finding underscores the importance of assessing and addressing hip biomechanics and muscle function during
rehabilitation to optimize movement quality and reduce the risk of secondary injuries. Future studies should investigate how variations in muscle strength affect neuromuscular control and landing mechanics, which could inform rehabilitation strategies aimed at optimizing strength and function.
CONFLICTS OF INTEREST
The authors report no conflicts of interest.
ACKNOWLEDGMENTS
The authors thank all the participants for their time and support. We would like to thank Editage (www.editage.jp) for English language editing.
Submitted: October 30, 2023 CDT, Accepted: April 08, 2024 CDT
© The Author(s)
This is an open-access article distributed under the terms of the Creative Commons Attribution 4.0 International License (CCBY-NC-4.0). View this license’s legal deed at https://creativecommons.org/licenses/by-nc/4.0 and legal code at https://creativecommons.org/licenses/by-nc/4.0/legalcode for more information.
Postural Control During Single-Leg Landing in Female Athletes After Anterior Cruciate Ligament Reconstr… International Journal of Sports Physical Therapy
REFERENCES
1. Bram JT, Magee LC, Mehta NN, Patel NM, Ganley TJ. Anterior cruciate ligament injury incidence in adolescent athletes: A systematic review and metaanalysis. Am J Sports Med 2021;49:1962-1972. doi:10.1177/0363546520959619
2. Schmitt LC, Paterno MV, Ford KR, Myer GD, Hewett TE. Strength asymmetry and landing mechanics at return to sport after anterior cruciate ligament reconstruction. Med Sci Sports Exerc. 2015;47:1426-1434. doi:10.1249/ MSS.0000000000000560
3. Paterno MV, Rauh MJ, Schmitt LC, Ford KR, Hewett TE. Incidence of second ACL injuries 2 years after primary ACL reconstruction and return to sport. Am J Sports Med. 2014;42:1567-1573. doi:10.1177/ 0363546514530088
4. Chia L, De Oliveira Silva D, Whalan M, et al. Noncontact anterior cruciate ligament injury epidemiology in team-ball sports: A systematic review with meta-analysis by sex, age, sport, participation level, and exposure type. Sports Med. 2022;52:2447-2467 doi:10.1007/s40279-022-01697-w
5. Leppänen M, Pasanen K, Kujala UM, et al. Stiff landings are associated with increased ACL injury risk in young female basketball and floorball players. Am J Sports Med 2017;45:386-393. doi:10.1177/ 0363546516665810
6. Di Stasi S, Myer GD, Hewett TE. Neuromuscular training to target deficits associated with second anterior cruciate ligament injury. J Orthop Sports Phys Ther 2013;43:777-792. doi:10.2519/ jospt.2013.4693.Neuromuscular
7. Johnston PT, McClelland JA, Webster KE. Lower limb biomechanics during single-leg landings following anterior cruciate ligament reconstruction: A systematic review and meta-analysis. Sport Med. 2018;48:2103-2126. doi:10.1007/s40279-018-0942-0
8. Kanekar N, Aruin AS. Improvement of anticipatory postural adjustments for balance control: effect of a single training session. J Electromyogr Kinesiol. 2015;25:400-405. doi:10.1016/j.jelekin.2014.11.002
9. Alexandrov YI, Sams ME. Emotion and consciousness: ends of a continuum. Brain Res. 2005;25:387-405. doi:10.1016/ j.cogbrainres.2005.08.006
10. Koga H, Nakamae A, Shima Y, Bahr R, Krosshaug T Hip and ankle kinematics in noncontact anterior cruciate ligament injury situations: Video analysis using model-based image matching. Am J Sports Med 2018;46:333-340. doi:10.1177/0363546517732750
11. Paterno MV, Schmitt LC, Ford KR, et al. Biomechanical measures during landing and postural stability predict second anterior cruciate ligament injury after anterior cruciate ligament reconstruction and return to sport. Am J Sports Med 2010;38:1968-1978. doi:10.1177/0363546510376053
12. Levine JW, Kiapour AM, Quatman CE, et al. Clinically relevant injury patterns after an anterior cruciate ligament injury provide insight into injury mechanisms. Am J Sports Med. 2013;41:385-395. doi:10.1177/0363546512465167
13. Ueno R, Navacchia A, Schilaty ND, Myer GD, Hewett TE, Bates NA. Anterior cruciate ligament loading increases with pivot-shift mechanism during asymmetrical drop vertical jump in female athletes. Orthop J Sports Med. 2021;9:1-11. doi:10.1177/ 2325967121989095
14. Labanca L, Laudani L, Casabona A, Menotti F, Mariani PP, Macaluso A. Early compensatory and anticipatory postural adjustments following anterior cruciate ligament reconstruction. Eur J Appl Physiol 2015;115:1441-1451. doi:10.1007/s00421-015-3126-8
15. Bennis N, Roby-Brami A, Dufossé M, Bussel B. Anticipatory responses to a self-applied load in normal subjects and hemiparetic patients. J Physiol Paris 1996;90:27-42. doi:10.1016/ 0928-4257(96)87166-x
16. Aruin AS, Latash ML. The role of motor action in anticipatory postural adjustments studied with selfinduced and externally triggered perturbations. Exp Brain Res. 1995;106:291-300. doi:10.1007/ BF00241125
17 Massion J. Movement, posture and equilibrium: Interaction and coordination. Prog Neurobiol. 1992;38:35-56. doi:10.1016/0301-0082(92)90034-c
18. Park S, Horak FB, Kuo AD Postural feedback responses scale with biomechanical constraints in human standing. Exp Brain Res. 2004;154:417-427. doi:10.1007/s00221-003-1674-3
19. Hughey LK, Fung J. Postural responses triggered by multidirectional leg lifts and surface tilts. Exp Brain Res 2005;165:152-166. doi:10.1007/ s00221-005-2295-9
Postural Control During Single-Leg Landing in Female Athletes After Anterior Cruciate Ligament Reconstr… International Journal of Sports Physical Therapy
20. Needle AR, Lepley AS, Grooms DR. Central nervous system adaptation after ligamentous injury: A summary of theories, evidence, and clinical interpretation. Sports Med. 2017;47(20):1271-1288. doi:10.1007/s40279-016-0666-y
21. Delahunt E, Sweeney L, Chawke M, et al. Lower limb kinematic alterations during drop vertical jumps in female athletes who have undergone anterior cruciate ligament reconstruction. J Orthop Res 2012;30:72-78. doi:10.1002/jor.21504
22. Hermens HJ, Freriks B, Disselhorst-Klug C, Rau GG. Development of recommendations for SEMG sensors and sensor placement procedures. J Electromyogr Kinesiol. 2000;10:361-374. doi:10.1016/ s1050-6411(00)00027-4
23. Kadaba MP, Ramakrishnan HK, Wootten ME. Measurement of lower extremity kinematics during level walking. J Orthop Res 1990;8:383-392. doi:10.1002/jor.1100080310
24. Davis RB, Õunpuu S, Tyburski D, Gage JR. A gait analysis data collection and reduction technique. Hum Mov Sci 1991;10:575-588. doi:10.1016/ 0167-9457(91)90046-z
25. Brown TN, Palmieri-Smith RM, McLean SG. Comparative adaptations of lower limb biomechanics during unilateral and bilateral landings after different neuromuscular-based ACL injury prevention protocols. J Strength Cond Res 2014;28:2859-2871. doi:10.1519/JSC.0000000000000472
26. Howatson G, Glaister M, Brouner J, van Someren KA. The reliability of electromechanical delay and torque during isometric and concentric isokinetic contractions. J Electromyogr Kinesiol 2009;19:975-979. doi:10.1016/j.jelekin.2008.02.002
27. Kristianslund E, Krosshaug T, Van den Bogert AJ. Effect of low pass filtering on joint moments from inverse dynamics: Implications for injury prevention. J Biomech. 2012;45:666-671. doi:10.1016/ j.jbiomech.2011.12.011
28. Faul F, Erdfelder E, Lang AG, Buchner A. G*Power 3: a flexible statistical power analysis program for the social, behavioral, and biomedical sciences. Behav Res Methods 2007;39:175-191. doi:10.3758/bf03193146
29. Crow J, Pizzari T, Buttifant D Muscle onset can be improved by therapeutic exercise: a systematic review Phys Ther Sport 2011;12(29):199-209. doi:10.1016/j.ptsp.2010.12.002
30. Gruber M, Bruhn S, Gollhofer A. Specific adaptations of neuromuscular control and knee joint stiffness following sensorimotor training. Int J Sports Med. 2006;27(30):636-641. doi:10.1055/ s-2005-872904
31. Labanca L, Laudani L, Mariani PP, Macaluso A. Postural adjustments following ACL rupture and reconstruction: A longitudinal study. Int J Sports Med. 2018;39:549-554. doi:10.1055/a-0599-6401
32. Bryant AL, Newton RU, Steele J. Successful feedforward strategies following ACL injury and reconstruction. J Electromyogr Kinesiol 2009;19(32):988-997 doi:10.1016/ j.jelekin.2008.06.001
33. He X, Leong HT, Lau OY, Ong MTY, Yung PSH. Altered neuromuscular activity of the lower extremities during landing tasks in patients with anterior cruciate ligament reconstruction: A systematic review of electromyographic studies. J Sport Rehabil. 2020;29:1194-1203. doi:10.1123/ jsr.2019-0393
34. Rocchi JE, Labanca L, Laudani L, Minganti C, Mariani PP, Macaluso A. Timing of muscle activation is altered during single-leg landing tasks after anterior cruciate ligament reconstruction at the time of return to sport. Clin J Sport Med. 2020;30:e186-e193. doi:10.1097/ jsm.0000000000000659
35. Georgoulis JD, Melissaridou D, Patras K, et al. Neuromuscular activity of the lower - extremities during running, landing and changing - of - direction movements in individuals with anterior cruciate ligament reconstruction : a review of electromyographic studies. J Exp Orthop. 2023;10:43. doi:10.1186/s40634-023-00603-1
36. Dyhre-Poulsen P, Krogsgaard MR. Muscular reflexes elicited by electrical stimulation of the anterior cruciate ligament in humans. J Appl Physiol. 2000;89(6):2191-2195. doi:10.1152/ jappl.2000.89.6.2191
37. Hewett TE, Di Stasi SL, Myer GD. Current concepts for injury prevention in athletes after anterior cruciate ligament reconstruction. Am J Sports Med. 2013;41:216-224. doi:10.1177/ 0363546512459638
38. Cossich V, Mallrich F, Titonelli V, de Sousa EB, Velasques B, Salles JI. Proprioceptive deficit in individuals with unilateral tearing of the anterior cruciate ligament after active evaluation of the sense of joint position. Rev Bras Ortop. 2014;49:607-612. doi:10.1016/j.rboe.2013.07.003
Postural Control During Single-Leg Landing in Female Athletes After Anterior Cruciate Ligament Reconstr… International Journal of Sports Physical Therapy
39. Nyland J, Gamble C, Franklin T, Caborn DNM. Permanent knee sensorimotor system changes following ACL injury and surgery Knee Surg Sports Traumatol Arthrosc. 2017;25:1461-1474. doi:10.1007/ s00167-017-4432-y
40. Hewett TE, Myer GD, Ford KR. Anterior cruciate ligament injuries in female athletes: Part 1, mechanisms and risk factors. Am J Sports Med. 2006;34:299-311. doi:10.1177/0363546505284183
41. Brown TN, Palmieri-Smith RM, McLean SG. Sex and limb differences in hip and knee kinematics and kinetics during anticipated and unanticipated jump landings: Implications for anterior cruciate ligament injury. Br J Sports Med. 2009;43:1049-1056. doi:10.1136/bjsm.2008.055954
42. Shimokochi Y, Ambegaonkar JP, Meyer EG, Lee SY, Shultz SJ. Changing sagittal plane body position during single-leg landings influences the risk of noncontact anterior cruciate ligament injury. Knee Surg Sports Traumatol Arthrosc 2013;21:888-897 doi:10.1007/s00167-012-2011-9
43. Arendt-Nielsen L, Mills KR. Muscle fibre conduction velocity, mean power frequency, mean EMG voltage and force during submaximal fatiguing contractions of human quadriceps. Eur J Appl Physiol Occup Physiol 1988;58:20-25. doi:10.1007/ BF00636598
44. Benjaminse A, Holden S, Myer GD ACL rupture is a single leg injury but a double leg problem: too much focus on ‘symmetry’ alone and that’s not enough! 2019;52:1029-1030. doi:10.1136/ bjsports-2017-098502
Postural Control During Single-Leg Landing in Female Athletes After Anterior Cruciate Ligament Reconstr… International Journal of Sports Physical Therapy
Alrashdi N, Motl R, Aguiar E, et al. Pre- and Post-Operative Pain Intensity and Physical Activity Levels in Individuals with Acetabular Dysplasia Undergoing Periacetabular Osteotomy: A Prospective Cohort Study. IJSPT. Published online June 1, 2024:692-703. doi:10.26603/001c.117403
Pre- and Post-Operative Pain Intensity and Physical Activity Levels in Individuals with Acetabular Dysplasia Undergoing Periacetabular Osteotomy: A Prospective Cohort Study
Naif Alrashdi1a , Robert Motl2 , Elroy Aguiar3 , Donald Lein Jr4 , Suzanne Perumean-Chaney5 , Michael Ryan6 , Matthew Ithurburn7
1 1. Department of Physical Therapy and Health Rehabilitation, College of Applied Medical Sciences, Majmaah University, Majmaah, 11952, Kingdom of Saudi Arabia, Majmaah University, 2 Kinesiology , University of Illinois at Chicago, 3 Kinesiology, University of Alabama, 4 Physical Therapy , University of Alabama at Birmingham, 5 Biostatistics , University of Alabama at Birmingham, 6 Hip Center , Andrews Institute for Orthopaedics & Sports Medicine, 7 American Sports Medicine Institute, American Sports Medicine Institute
Keywords: Hip, pelvis, accelerometers, orthopaedics https://doi.org/10.26603/001c.117403
International Journal of Sports Physical Therapy
Background
Acetabular dysplasia (AD) causes pain, limited function, and development of early hip osteoarthritis. Periacetabular osteotomy (PAO) is a surgical treatment for AD that aims to reposition the acetabulum to reduce pain and improve function.
Purpose
To examine pain recovery and physical activity (PA) before and during the six months after PAO
Study Design
Case series, prospective
Methods
Individuals with AD scheduled for PAO were enrolled. Pain intensity was evaluated before PAO and at one week and one, three, and six months following PAO PA levels was evaluated before and six months following PAO using accelerometers (time spent in sedentary behavior, light PA, moderate-to-vigorous PA [MVPA], and daily steps) and the International Physical Activity Questionnaire (IPAQ; time spent in walking and in MVPA). Pain improvements was examined over time following PAO using a repeated-measures one-way ANOVA as well as improvements in PA levels before and six months after PAO using paired-sample t tests. In addition, time spent in MVPA was qualitatively summarized at each time point (before and six months after PAO) measured by both the accelerometers and IPAQ
Results
Out of 49 screened participants, 28 were enrolled, and 23 individuals (22 females; age=23.1±7.9 years) completed both study visits. Compared to pre-PAO pain, participants reported significant improvements in pain at one month and onward following PAO (p<0.011). However, PA levels at six months following PAO did not differ from pre-PAO PA levels (p>0.05). Qualitatively, participants reported spending more time in MVPA recorded by the IPAQ (pre-PAO=73.3±150.2 mins/day; six-months after PAO=121.2±192.2 mins/day), compared with MVPA recorded by accelerometers (pre-PAO=22.6±25.2 mins/ day; six-months after PAO=25.0±21.4 mins/day).
Corresponding author: Naif Alrashdi, PT, MSRS, PhD; Department of Physical Therapy and Health Rehabilitation Majmaah University, Majmaah, Saudi Arabia, 11952; n.alrashedy@mu.edu.sa; Phone number: 00966559035192
Original Research
a
Conclusions
Individuals with AD reported significant pain reduction at one month and up to six months after PAO, but PA levels did not change six months after PAO compared to baseline testing. Future studies should consider examining longitudinal pain recovery and PA improvements over longer periods of time with larger samples of individuals with AD undergoing PAO and identifying modifiable factors to minimize pain and increase PA participation.
Level of Evidence III
INTRODUCTION
Acetabular dysplasia (AD) is a hip joint condition that is characterized by incomplete development of the acetabulum leading to inadequate bony coverage of the femoral head,1 joint instability, and altered hip joint loading.2 AD leads to pain and decreased quality-of-life,2,3 decreased functional performance,4,5 and is a known risk factor for early-onset hip osteoarthritis (OA).6,7 Periacetabular osteotomy (PAO) is a hip preservation surgery for individuals with AD that aims to reposition the acetabulum to increase bony coverage of the femoral head with an overall goal of minimizing pain and improving function.8,9
The author team recently published a review that examined changes in pain intensity and physical activity (PA) levels in individuals with AD following PAO 10 This review reported that pain intensity decreased at six-months compared with pre-PAO levels across several studies,2,10‑15 however, to authors’ knowledge, little evidence exists regarding pain recovery during the first six months following PAO Our team further noted that self-reported PA levels in individuals with AD are negatively-impacted before PAO but improve one year following PAO 2,13‑23 However, no previous studies have evaluated changes in PA prior to one year after PAO (i.e., during the first six months after PAO), and these previous studies primarily used self-reported PA measures (which have known risk of recall bias24),13‑15, 17‑23 as opposed to a device-measured approach. Collectively, a comprehensive, longitudinal assessment of changes in pain intensity and PA levels in individuals with AD over the first six months after PAO could help guide decision-making regarding rehabilitation progression and return to sport or work following surgery.
The purpose of this study was to examine pain recovery and PA before and during the six months after PAO, in individuals with AD (i.e., lateral center edge angle “LCEA” of 20° or less25). The hypothesis was that individuals with AD would demonstrate significant improvements in pain intensity and PA levels over the first six months following PAO Additionally, this study qualitatively examined differences in self-reported and device-measured PA levels.
MATERIALS AND METHODS
The study followed a longitudinal cohort design. Potential participants were recruited (aged 14 to 49 years) with a confirmed diagnosis of AD who were scheduled for PAO with a
single, fellowship-trained orthopaedic surgeon with a specialty in hip preservation (MKR). Diagnostic criteria of AD included a combination of the patient’s reported symptoms (e.g., intra-articular hip pain), radiological findings of AD (i.e., LCEA of 20° or less25), and no signs of significant hip joint degeneration (i.e., Tonnis grade of 1 or 026,27). Prior to PAO, all participants received hip arthroscopy to address intra-articular pathology, including labral tears, ligamentum teres tears, and cam deformities, as well as to confirm that articular cartilage quality was sufficient to proceed with a PAO PAO surgical technique details are similar to previously-described techniques.9 Briefly, after standard supine positioning and preparation, an anterior-based incision provided access to the ischium, superior pubic ramus, and ilium. Cuts were made with fluoroscopic guidance around the acetabulum, while maintaining the continuity and integrity of the posterior column of the ilium. Once free, the acetabular fragment was rotated and positioned to optimally cover the femoral head. The fragment was stabilized with metal screws to allow bony healing.
After PAO, all participants followed a standardized rehabilitation program, including approximately six weeks of protected weightbearing (20%-foot flat partial weightbearing) with assistive devices. Active motion was limited until six weeks, and excessive hip flexion, extension, and external rotation were avoided. Weightbearing and strength progression began at week six, provided sufficient healing was noted on radiographs. Advanced strength training and running progressions began at approximately three months post-PAO, provided patients had sufficient motion, strength, no limp with walking, and continued progression of healing on radiographs. Full return-to-sport typically occurred between six to nine months post-PAO. Institutional review board approval (R-2024-1049) was granted, and all participants provided signed informed consent and/or assent and parental permission before participation.
PAIN INTENSITY EVALUATION BEFORE AND AFTER PAO
A comprehensive hip-related pain evaluation was performed in individuals with AD before (mean=27 days; range=2-94 days) and at one week and one, three, and six months following PAO using: the Hip disability and Osteoarthritis Outcome Score pain subscale (HOOS-Pain)28 and the Numeric Pain Rating Scale (NPRS).29 The HOOSpain is a 10-item valid and reliable hip pain measure that asks about hip-related pain in the last week.28,30,31 Each item is scored on a Likert scale from 0 to 4, and scores are
Pre- and Post-Operative Pain Intensity and Physical Activity Levels in Individuals with Acetabular Dysplasi… International Journal of Sports Physical Therapy
transformed to a score of 0-100 (0=no pain and 100=worst pain).28 The NPRS is a numeric version of the visual analog scale, in which individuals select and mark a whole number ranging from 0 to 10 (0=no pain and 10= worst pain).29 The NPRS has been shown to demonstrate good validity and reliability in individuals with musculoskeletal pain.32, 33 The NPRS was used to evaluate average pain over the prior week. Prior to and six months following PAO, pain evaluations were completed as a part of onsite study visits, whereas pain evaluations at one week, one month, and three months following PAO were completed remotely by participants.
DEVICE-MEASURED PHYSICAL ACTIVITY LEVELS BEFORE AND AFTER PAO
An accelerometer (ActiGraph; GT3X+; Pensacola, FL) was used to measure PA levels over a seven-day period, both before and again at six months after PAO. The accelerometer quantifies PA by capturing acceleration signals during movement, and motion outside normal human movement is band-pass filtered.34 The signal is then converted into activity counts using ActiGraph’s proprietary algorithm in sampling intervals (one-minute epochs in this study). This accelerometry approach is valid and reliable to quantify activity35 and has been used in several previous studies in individuals with AD before and/or after PAO 16,17 Participants were provided the accelerometer and were instructed to wear it during all waking hours, only removing it during water-based activities and prior to going to sleep. Participants wore the accelerometer around their waist and above the non-painful hip (pre-PAO) or the non-surgical hip (postPAO), using an elastic belt and pouch. For the entire week, accelerometer-wear adherence was considered valid if wear-time was ≥8 hours per day and minimum of four valid days.34,36,37
Accelerometer data were downloaded and processed using ActiLife software (version 6.13.3). We computed minute-by-minute activity counts of data from valid days.34,38 PA variables of interest included average time (minutes) per day spent in sedentary behavior (SB; <100 activity counts/min),35 light PA (100–1,951 activity counts/ min),35 and moderate-to-vigorous physical activity (MVPA; ≥1,952 activity counts/min),35 as well as average daily steps both before and six months after PAO, using uniaxial activity count cut-points developed in healthy adults.35,39
SELF-REPORTED PHYSICAL ACTIVITY LEVELS BEFORE AND AFTER PAO
The International Physical Activity Questionnaire short form (IPAQ-SF) was used to evaluate self-reported PA levels both before and 6 months after PAO 40 The IPAQ-SF is a valid and reliable PA measure,41,42 and is among the most widely-used self-reported measures of PA.43 It contains nine items that evaluate PA levels in various domains over the seven days prior to completion. The average time spent (minutes) in walking and in MVPA over the week prior to study visits before and six months after PAO were calculated.
STATISTICAL ANALYSES
Percentages/frequencies were computed for categorical data and means/standard deviations for continuous data. A repeated-measures one-way analysis of variance (ANOVA) was used to examine changes in pain intensity across all time points (pre-PAO; one week after PAO; one, three, and six months after PAO). Paired t-tests were used to evaluate differences in device-measured PA levels (i.e., SB, light PA, MVPA, and daily steps) before and six months after PAO, as well as average accelerometer wear time before and after PAO As secondary analyses, differences in self-reported PA variables were examined before and six months after PAO (average minutes of walking and MVPA) using paired t-tests as well as qualitatively summarized time spent in MVPA measured by accelerometers versus IPAQ-SF measures at each time point (before and six months after PAO). Effect sizes (Cohen’s d) were calculated where appropriate and interpreted these as: 0.2 small, 0.5 medium, 0.8 large.44 We set the statistical significance level a priori (α=0.05) for all statistical comparisons.
RESULTS
Twenty-three out of 28 individuals (82.1%) completed all study measures at both testing visits (Figure 1). Demographic and clinical data for the cohort are presented in Table 1
HOOS-PAIN INTENSITY BEFORE AND AFTER PAO
The average HOOS-Pain score was 48.3±12.5 before PAO, and 41.0±20.6, 63.0±15.0, 73.1±11.1, 82.5±10.9 at one week, one month, three months, and six months following PAO, respectively For one-way repeated measures ANOVA testing, the assumption of sphericity was met (p=0.262). There were significant differences in pain intensity across time points following PAO (df=4, F=52.268, p<0.001). With posthoc tests, significant improvements were observed in pain intensity at one month and onward following PAO compared with pain intensity before PAO (Figure 2A) and pain improvements at one month, three, and six months after PAO compared with pain intensity 1 week after PAO, as well as pain improvements at four and six months after PAO compared with pain intensity six months after PAO (Figure 2B).
NPRS-PAIN INTENSITY BEFORE AND AFTER PAO
The average NPRS score was 8.0±1.4 before PAO, and 8.3±1.9, 5.9±2.1, 4.5±1.8, 3.7±1.8 at one week, one month, three months, and six months following PAO, respectively The sphericity assumption for one-way repeated measures ANOVA testing was met (p=0.346). There were significant differences in pain intensity across time points following PAO (df=4, F=35.764, p<0.001). With post-hoc tests, significant improvements were observed in pain intensity at one month and onward following PAO compared with pain intensity prior to PAO (Figure 3A) and pain improvements at one month, three, and six months after PAO compared with
Pre- and Post-Operative Pain Intensity and Physical Activity Levels in Individuals with Acetabular Dysplasi… International Journal of Sports Physical Therapy
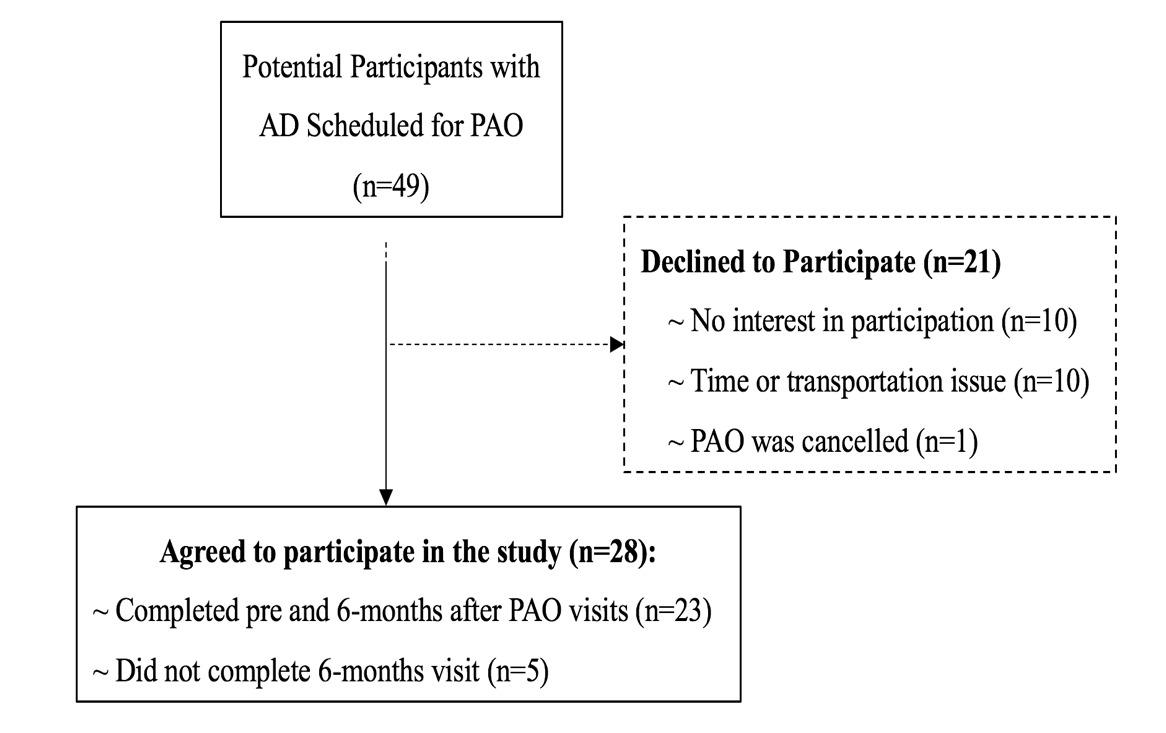
Figure 1. Flowchart of the Study Recruitment Processes
Table 1. Demographic and Clinical Data for the Cohort at Time of Enrollment (n=23). Data are presented as mean ± standard deviation, mean (range), or count (%).
± 7.9
± 3.4
Involved side n (%) Left: 14 (60%) Right: 9 (40%) Symptom Duration (years)*
Initial weight-bearing following PAO (mean; range) 6 weeks; 2-12
Concomitant Injuries (n)
pain intensity one week after PAO, as well as pain improvements three and six months after PAO compared to pain intensity one month after PAO (Figure 3B).
DEVICE-MEASURED PHYSICAL ACTIVITY LEVELS BEFORE AND AFTER PAO
There were no significant differences in mean time spent in SB, light PA, MVPA, or daily step counts between prior to and six months after PAO (Table 2). Additionally, mean wear time did not differ between prior to and six months after PAO. (Table 2).
Labral tear=14
None=9
SELF-REPORTED PHYSICAL ACTIVITY LEVELS BEFORE AND AFTER PAO
On average, individuals with AD reported that they spent 147.7±174.1 minutes per day before PAO and 204.0±210.0 minutes per day six-months following PAO in walking. On average, individuals with AD reported that they spent 71.9±156.6 minutes per day before PAO and 121.2±192.2 minutes per day six months following PAO in MVPA. There were no significant differences in time spent in both walking (p=0.262; d=0.3) and MVPA (p=0.169; d=0.3) between prior to and six months following PAO A qualitative comparison between time average spent in device-measured and self-reported MVPA at each time point is shown in Table 3
Value
Male Female
22
BMI
23.4
Variable
Age (years) 23.1
Sex, n (%)
1 (4%)
(96%)
(kg/m²)
2.7
± 2.3
Pre- and Post-Operative Pain Intensity and Physical Activity Levels in Individuals with Acetabular Dysplasi… International Journal of Sports Physical Therapy
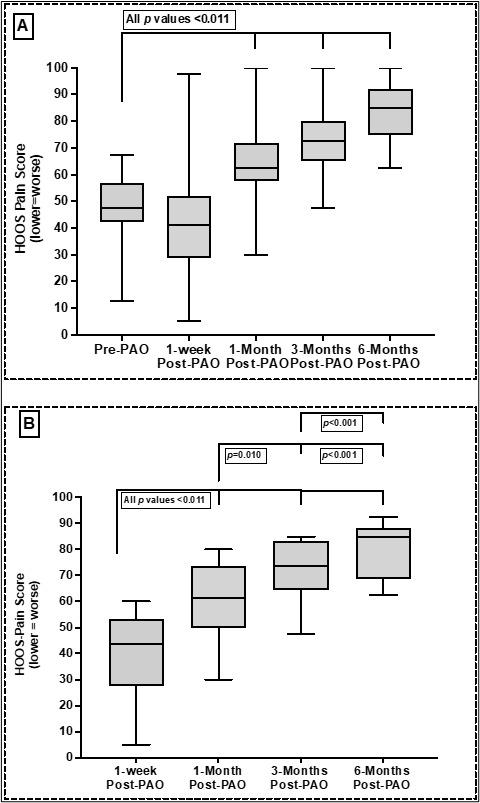
Among Multiple Time Points Following PAO
DISCUSSION
In this longitudinal cohort study, pain recovery was examined in individuals with AD before and at multiple time points following PAO, and PA levels before and six months after PAO using both a device-measured approach and a self-reported PA measure. Additionally, time spent in de-
vice-measured and self-reported MVPA before and six months after PAO were qualitatively summarized and compared. The study’s hypothesis was partially supported in that individuals with AD reported significant, gradual decreases in pain at one month and onward following PAO, compared with pre-PAO pain intensity However, devicemeasured and self-reported PA levels did not statistically
Figure 2. A) HOOS Pain Comparisons Following PAO Compared with Pre-PAO and B) HOOS Pain Comparisons
Pre- and Post-Operative Pain Intensity and Physical Activity Levels in Individuals with Acetabular Dysplasi… International Journal of Sports Physical Therapy
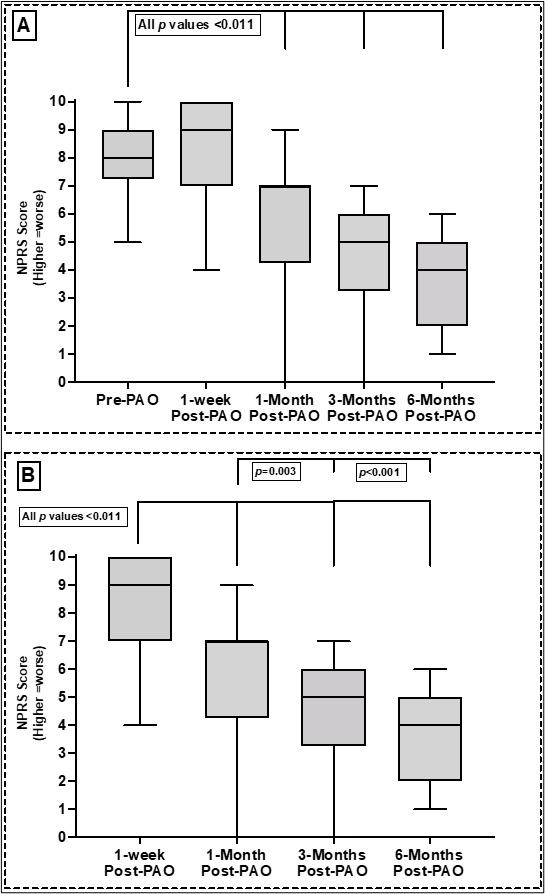
Among Multiple Time Points Following PAO
change/improve in the six months following PAO, compared with pre-PAO PA levels. Interestingly, individuals with AD reported more time spent in MVPA measured by the IPAQSF compared with time spent measured by accelerometers, both before and six months after PAO. To authors’ knowledge, this is the first prospective cohort study to evaluate early and longitudinal pain recovery following PAO in indi-
viduals with AD as well as to evaluate PA levels during the first 6 months following PAO
Significant reductions in pain intensity (HOOS-pain and NPRS) at one month, three, and six months following PAO, compared with pre-PAO pain intensity were observed (Figures 2 and 3). Additionally, significant reductions in pain intensity at multiple time points following PAO were ob-
Figure 3. A) NPRS Pain Comparisons Following PAO Compared with Prior to PAO and B) NPRS Pain Comparisons
Pre- and Post-Operative Pain Intensity and Physical Activity Levels in Individuals with Acetabular Dysplasi… International Journal of Sports Physical Therapy
Table 2. Device-Measured Physical Activity Levels Before and Six Months After PAO. Values are presented as mean ± DS.
Abbreviations – SD: standard deviation; MVPA: moderate-to- vigorous physical activity; PAO: periacetabular osteotomy; PA: physical activity
Table 3. Qualitative Comparison between Device-Measured and Self-Reported Time Spent in Moderate-toVigorous Physical Activity Values are presented as Mean ± SD
Abbreviations: IPAQ: International physical activity questionnaire; MVPA: moderate- to- vigorous physical activity; min: minutes.
served including: i) One month, three, and six months following PAO compared with one week following PAO, ii) three and six months following PAO compared with one month following PAO, and lastly, iii) six months following PAO compared with three months following PAO (HOOSPain only). The majority of prior studies that have examined pain improvements following PAO have evaluated pain recovery only as early as six months and later following PAO 2,10‑14,18,19,45 Generally, these studies reported that pain significantly decreased/improved at six months following PAO compared to before PAO.2,11‑14,18,19,45 However, to authors’ knowledge, only one previous study has examined pain intensity earlier than six months following PAO, and reported no significant improvements in pain at four months following PAO compared with pre-PAO pain intensity 15 In this study, significant reduction in pain (across both the HOOS and NPRS) at one month and onward following PAO was found when compared to pre-PAO pain intensity
In clinical practice, a 10-point change in the HOOS-Pain following PAO46 and ≥35% change in the NPRS following orthopaedic surgeries47 are considered as minimal clinically important difference (MCID) values. In this study, participants reported more than a 10-point improvement in HOOS-Pain scores at one month and onward (Figure 2) as we well as greater than a 35% reduction in NPRS at three months (Figure 3) following PAO, compared with pre-PAO pain intensity Altogether, the comprehensive, longitudinal pain evaluation (HOOS and NPRS) showed that pain gradually decreased as early as one month following PAO, with the greatest degree of pain reductions occurring between one-week and one month and between one month and three months after surgery Additionally, these improvements were clinically significant (exceeding MCID) at latest follow-up (six months following PAO).
To authors’ knowledge, there are no previous studies reporting PA estimates at six months following PAO. When examining differences in device-measured and self-reported PA levels before and six months after PAO, we found no significant differences in the PA variables. Two previous prospective studies examined changes in device-measured PA levels in individuals with AD following PAO 15,17 The first study (n=77) evaluated PA levels over seven days, both before and one year after PAO using a thigh-worn accelerometer 17 Similar to the current results, that study reported no significant improvements in time spent in very low-, low-, moderate-, and high-intensity activity one year after PAO compared to pre-PAO.17 The second study (n=23) measured PA levels over five days, both four months and one year after PAO (no baseline/pre-surgical PA data reported) using a thigh-worn accelerometer 15 That study reported no significant improvements in time spent in standing, walking, running, or sit-to-stand tasks one year after PAO compared with time spent in the same activities 4 months after PAO.15 Notably, in the self-reported PA-related findings, individuals with AD reported spending ~56.3 more minutes in walking and ~49.3 more minutes in MVPA six months after PAO compared with pre-PAO levels (both small-to-medium effect size; no statistically-significant differences were observed). Five prospective2,13‑15,17 and three retrospective18‑20 previously-published studies have examined changes in self-reported PA levels before PAO and at four months and up to five years following PAO Whereas these studies used different self-reported measures than used in our study (the HAGOS and UCLA), across all previously published studies, self-reported PA levels significantly improved at one year after PAO Importantly, our relatively small sample size may have limited our power and ability to detect differences in PA levels between presurgery and six months following PAO
Outcome Prior to PAO 6-Months after PAO p- value Effect Size Wear time (minutes/day; mean ± SD) 749.2 ± 81.6 782.1 ± 137.6 0.271 0.3 Sedentary PA (minutes/day; mean ± SD) 451.1 ± 82.0 480.2 ± 130.6 0.377 0.3 Light PA (minutes/day; mean ± SD) 273.9 ± 81.7 276.9 ± 65.5 0.874 0.04 MVPA (minutes/day; mean ± SD) 24.2 ± 26.6 25.0 ± 21.4 0.910 0.03 Daily steps (steps/day; mean ± SD) 5,730 ± 2,991 5,918 ± 2,219 0.789 0.07
Measure MVPA (min/day) Before PAO 6-Months after PAO Self-Reported (IPAQ-SF): 73.3 ± 150.2 121.2 ± 192.2 Device-Measured (accelerometer) 22.6 ± 25.2 25.0 ± 21.4
Pre- and Post-Operative Pain Intensity and Physical Activity Levels in Individuals with Acetabular Dysplasi… International Journal of Sports Physical Therapy
As described above, a significant decrease in pain intensity six months following PAO compared with pre-PAO pain intensity was observed in the current cohort (Figures 2 and 3). Previous work has shown that pre-PAO pain correlates with functional limitations following PAO 48 Thus, decreases in pain intensity at six months following PAO could be an important factor associated with a person’s ability to engage in increased PA following PAO However, there were no statistically significant improvements in any PA variable in this cohort. In this study, the participants did not start weightbearing on their surgical limb and walking without assistive devices until six weeks, on average (range 2-12 weeks) after PAO. Thus, given the relatively short timeframe between post-operative weight-bearing onset and their follow-up PA data collection at six months, there may have been insufficient time to appreciate statistically significant improvements in PA levels. As mentioned previously, this study likely was underpowered to detect differences in PA levels between pre-surgery and six months following PAO. Despite not finding a statistically significant improvements, evaluating and improving PA engagement following PAO is likely critical for long-term joint health and overall health. Clinicians working with patients with AD undergoing PAO may consider monitoring PA levels at multiple time points following PAO using commercially available devices (e.g., Fitbit) as it may provide unique device-measured data related to recovery and return to prior level of function following surgery Alternatively, PAO and subsequent rehabilitation might not be sufficient to change/improve PA engagement in individuals following PAO, and other unique interventions (such as targeted behavioral change PA programs) may be needed to improve activity participation in this patient population.
When qualitatively summarizing time spent in MVPA measured by accelerometers versus the IPAQ-SF, a large difference between the two measures was observed, both before and six months after PAO Before PAO, individuals with AD reported more than triple the time spent in MVPA on the IPAQ-SF (73.3 mins/day), compared with the time spent in MVPA that was measured by the accelerometers (22.6 mins/day). At six months following PAO, individuals with AD similarly reported more than triple the time spent in MVPA via the IPAQ-SF (121.2 mins/day) compared with the time spent in MVPA measured by accelerometers (25.0 mins/day). Although both the IPAQ-SF and accelerometers report MVPA in minutes/day, it is important to note that these approaches differ in the specific activity-related constructs they measure. The IPAQ is a self-reported PA measure that recalls salient activities, whereas accelerometers capture accelerations related to all ambulatory movement.34 Taken together, these findings indicate that the IPAQ-SF may overestimate time spent in MVPA in individuals with AD, both before and six months after PAO Potentially, these differences and the tendency for self-reported PA measures to overestimate PA levels may be accounted for by recall bias.41 On the other hand, and because patients with AD often report hip instability and pain2,3 that could influence gait performance, energy expenditure, and/or exercise capacity, there may be a need for AD/PAO-specific
accelerometer processing cut-points to better evaluate activity volume in this patient population.
LIMITATIONS
The current study has several limitations to recognize. Firstly, the sample size was relatively small (n=23). However, due to the epidemiological nature of AD, the prevalence of AD is considered low (1-3% of the general population) when compared with similar intra-articular hip pain conditions (femoroacetabular impingement syndrome or hip OA).2,49‑51 Secondly, the sample was predominantly females (22 females). This was to be expected, as epidemiological data show that 80% or more of AD diagnoses are in females.2,49‑51 Thirdly, because PAO is a major orthopaedic procedure requiring subspecialty training, our coauthor (MKR), is one of only a few hip surgeons in the region in which the study was conducted that performs this procedure, and thus subjects were only recruited from a single institution. In light of this, the current findings may not be generalizable to other PAO patients of a different demographic makeup, those with varied surgical technique, those treated elsewhere, or those undergoing varying rehabilitation approaches. Lastly, it is important to not neglect limitations related to PA evaluation in this study. Specifically, participants may have had difficulty describing their PA behavior when completing the IPAQ-SF. Prior research reported that individuals completing the IPAQ-SF often had challenges understanding terms used in the questionnaire, potentially leading to errors in the collection of self-reported PA data.52 Additionally, patients with AD in the current study may have altered their activity behavior in ways not measured by the accelerometers. For example, whereas lower limb/walking-related activity might have been reduced, upper body activity might have been performed relatively more frequently but may not have been captured by accelerometers worn on the hip/waist. Future studies should include a larger sample of individuals with AD undergoing PAO and examine PA levels changes over time following PAO and examine the potential impact of baseline factors associated with increased PA participation in this patient population. Secondly, future studies could further examine individuals changes in pain and PA over time, as well as examining potential trajectories of pain and PA recovery in those with AD following PAO. Thirdly, evaluating changes in the participation in specific type of PA (as opposed to just volume and intensity of activity measures by the accelerometer) might have provided additional insight into activity-related recovery following PAO Lastly, despite the lack of improvement in PA from prior to six months after PAO, future research could examine whether the patient’s experience during activity (e.g., pain or self-efficacy) might have improved over time.
CONCLUSION
Compared to pre-PAO, individuals with AD reported pain reduction as early as one month following PAO and the reduction in pain continued over the entire six month period.
Pre- and Post-Operative Pain Intensity and Physical Activity Levels in Individuals with Acetabular Dysplasi… International Journal of Sports Physical Therapy
By comparison, PA levels remained the same six months after PAO. There was a large difference in time spent in MVPA between accelerometry-based and self-reported PA measures, both before and six months after PAO.
CONFLICT OF INTEREST
The authors declare no conflicts of interest related to this work.
ACKNOWLEDGMENT
The author extends the appreciation to the Deanship of Postgraduate Studies and Scientific Research at Majmaah University for funding this research work through the project number (R-2024-1049). We would also like to thank our clinical collaborators at the Hip Center at Andrews Sports Medicine and Orthopaedic Center, Kirby Kelley and Hannah
Harrity, for their assistance in recruiting participants for this study. Additionally, we would like to thank Hadeel Alghanim for her assistance in data collection for some of the included participants in this study.
FUNDING
This work was funded by the NIH National Rehabilitation Research Resource to Enhance Clinical Trials REACT Scholar Award. The author extends the appreciation to the Deanship of Postgraduate Studies and Scientific Research at Majmaah University for funding this research work through the project number (R-2024-1049).
Submitted: December 08, 2023 CDT, Accepted: April 12, 2024 CDT
© The Author(s)
This is an open-access article distributed under the terms of the Creative Commons Attribution 4.0 International License (CCBY-NC-4.0). View this license’s legal deed at https://creativecommons.org/licenses/by-nc/4.0 and legal code at https://creativecommons.org/licenses/by-nc/4.0/legalcode for more information.
Pre- and Post-Operative Pain Intensity and Physical Activity Levels in Individuals with Acetabular Dysplasi… International Journal of Sports Physical Therapy
REFERENCES
1. Clohisy JC, Beaule PE, O’Malley A, Safran MR, Schoenecker P AOA symposium. Hip disease in the young adult: current concepts of etiology and surgical treatment. J Bone Joint Surg Am 2008;90(10):2267-2281. doi:10.2106/JBJS.G.01267
2. Sankar WN, Duncan ST, Baca GR, et al. Descriptive epidemiology of acetabular dysplasia: The Academic Network of Conservational Hip Outcomes Research (ANCHOR) Periacetabular Osteotomy. J Am Acad Orthop Surg 2017;25(2):150-159. doi:10.5435/JAAOSD-16-00075
3. Clohisy JC, Knaus ER, Hunt DM, Lesher JM, HarrisHayes M, Prather H. Clinical presentation of patients with symptomatic anterior hip impingement. Clin Orthop Relat Res. 2009;467(3):638-644. doi:10.1007/ s11999-008-0680-y
4. Sucato DJ, Tulchin K, Shrader MW, DeLaRocha A, Gist T, Sheu G. Gait, hip strength and functional outcomes after a Ganz periacetabular osteotomy for adolescent hip dysplasia. J Ped Orthop 2010;30(4):344-350. doi:10.1097/ BPO.0b013e3181d9bfa2
5. Skalshoi O, Iversen CH, Nielsen DB, et al. Walking patterns and hip contact forces in patients with hip dysplasia. Gait Posture 2015;42(4):529-533. doi:10.1016/j.gaitpost.2015.08.008
6. Wyles CC, Heidenreich MJ, Jeng J, Larson DR, Trousdale RT, Sierra RJ. The John Charnley Award: Redefining the natural history of osteoarthritis in patients with hip dysplasia and impingement. Clin Orthop Relat Res 2017;475(2):336-350. doi:10.1007/ s11999-016-4815-2
7. McWilliams DF, Doherty SA, Jenkins WD, et al. Mild acetabular dysplasia and risk of osteoarthritis of the hip: a case-control study Ann Rheum Dis 2010;69(10):1774-1778. doi:10.1136/ard.2009.127076
8. Troelsen A, Elmengaard B, Soballe K. Mediumterm outcome of periacetabular osteotomy and predictors of conversion to total hip replacement. J Bone Joint Surg Am. 2009;91(9):2169-2179. doi:10.2106/JBJS.H.00994
9. Ganz R, Klaue K, Vinh TS, Mast JW A new periacetabular osteotomy for the treatment of hip dysplasias. Technique and preliminary results. Clin Orthop Relat Res. 1988;(232):26-36. doi:10.1097/ 00003086-198807000-00006
10. Alrashdi NZ, Motl RW, Aguiar EJ, Ryan MK, Perumean-Chaney SE, Ithurburn MP Mobility-related outcomes for periacetabular osteotomy in persons with acetabular dysplasia: setting the stage for measurement of real-world outcomes. Journal of hip preservation surgery. Published online 2021. doi:10.1093/jhps/hnab086
11. Scott EJ, Willey MC, Davison JC, Westermann RW, Paulson AC, Wilken JM. Physical performance tests correlate with patient-reported outcomes after periacetabular osteotomy: A Prospective Study J Am Acad Orthop Surg Glob Res Rev. 2021;5(6). doi:10.5435/JAAOSGlobal-D-21-00100
12. Karam MD, Gao Y, McKinley T Assessment of walking pattern pre and post peri-acetabular osteotomy Iowa Orthop J 2011;31:83-89.
13. Jacobsen JS, Soballe K, Thorborg K, et al. Patientreported outcome and muscle-tendon pain after periacetabular osteotomy are related: 1-year followup in 82 patients with hip dysplasia. Acta Orthop 2019;90(1):40-45. doi:10.1080/ 17453674.2018.1555637
14. Petrie JR, Novais EN, An TW, Group AS, Clohisy J. What is the impact of periacetabular osteotomy surgery on patient function and activity levels? J Arthroplasty Published online 2020. doi:10.1016/ j.arth.2020.03.002
15. Mechlenburg I, Jorgensen PB, Stentz-Olesen K, Tjur M, Grimm B, Soballe K. Leg power, pelvic movement and physical activity after periacetabular osteotomy A prospective cohort study Acta Orthop Belg 2018;84(2):163-171.
16. Reimer LCU, Kierkegaard S, Mechlenburg I, Jacobsen JS. Does Daily Physical activity differ between patients with femoroacetabular impingement syndrome and Patients with hip dysplasia? A Cross-Sectional Study in 157 Patients and 60 Healthy Volunteers. Int J Sports Phys Ther 2021;16(4):1084-1092. doi:10.26603/001c.25523
17. Sandell Jacobsen J, Thorborg K, Holmich P, et al. Does the physical activity profile change in patients with hip dysplasia from before to 1 year after periacetabular osteotomy? Acta Orthop 2018;89(6):622-627 doi:10.1080/ 17453674.2018.1531492
18. Bogunovic L, Hunt D, Prather H, Schoenecker PL, Clohisy JC. Activity tolerance after periacetabular osteotomy. Am J Sports Med. 2014;42(8):1791-1795. doi:10.1177/0363546514535906
Pre- and Post-Operative Pain Intensity and Physical Activity Levels in Individuals with Acetabular Dysplasi… International Journal of Sports Physical Therapy
19. Okoroafor UC, Pascual-Garrido C, Schwabe MT, Nepple JJ, Schoenecker PL, Clohisy JC. Activity level maintenance at midterm follow-up among active patients undergoing periacetabular osteotomy. Am J Sports Med 2019:363546519881421. doi:10.1177/ 0363546519881421
20. Novais EN, Heyworth B, Murray K, Johnson VM, Kim YJ, Millis MB. Physical activity level improves after periacetabular osteotomy for the treatment of symptomatic hip dysplasia. Clin Orthop Relat Res. 2013;471(3):981-988. doi:10.1007/s11999-012-2578-y
21. McClincy MP, Wylie JD, Kim YJ, Millis MB, Novais EN. Periacetabular osteotomy improves pain and function in patients with lateral center-edge angle between 18° and 25°, but are these hips really borderline dysplastic? Clin Orthop Relat Res. 2019;477(5):1145-1153. doi:10.1097/
CORR.0000000000000516
22. Heyworth BE, Novais EN, Murray K, et al. Return to play after periacetabular osteotomy for treatment of acetabular dysplasia in adolescent and young adult athletes. Am J Sports Med. 2016;44(6):1573-1581. doi:10.1177/0363546516632743
23. Edelstein AI, Nepple JJ, Abu-Amer W, PascualGarrido C, Goss CW, Clohisy JC. What mid-term patient-reported outcome measure scores, reoperations, and complications are associated with concurrent hip arthroscopy and periacetabular osteotomy to treat dysplasia with associated intraarticular abnormalities? Clin Orthop Relat Res 2021;479(5):1068-1077. doi:10.1097/
CORR.0000000000001599
24. McPhail S, Haines T Response shift, recall bias and their effect on measuring change in healthrelated quality of life amongst older hospital patients. Health Qual Life Outcomes 2010;8:65. doi:10.1186/1477-7525-8-65
25. Vaudreuil NJ, McClincy MP. Evaluation and treatment of borderline dysplasia: moving beyond the lateral center edge angle. Curr Rev Musculoskelet Med. Published online 2020. doi:10.1007/ s12178-020-09599-y
26. Clohisy JC, Barrett SE, Gordon JE, Delgado ED, Schoenecker PL. Periacetabular osteotomy for the treatment of severe acetabular dysplasia. J Bone Joint Surg Am. 2005;87(2):254-259. doi:10.2106/ JBJS.D.02093
27 Kralj M, Mavcic B, Antolic V, Iglic A, Kralj-Iglic V The Bernese periacetabular osteotomy: clinical, radiographic and mechanical 7-15-year follow-up of 26 hips. Acta Orthop 2005;76(6):833-840. doi:10.1080/17453670510045453
28. Nilsdotter A, Bremander A. Measures of hip function and symptoms: Harris Hip Score (HHS), Hip Disability and Osteoarthritis Outcome Score (HOOS), Oxford Hip Score (OHS), Lequesne Index of Severity for Osteoarthritis of the Hip (LISOH), and American Academy of Orthopedic Surgeons (AAOS) Hip and Knee Questionnaire. Arthritis Care Res (Hoboken). 2011;63 Suppl 11:S200-207 doi:10.1002/acr.20549
29. Williamson A, Hoggart B. Pain: a review of three commonly used pain rating scales. J Clin Nurs. 2005;14(7):798-804. doi:10.1111/ j.1365-2702.2005.01121.x
30. Kemp JL, Collins NJ, Roos EM, Crossley KM. Psychometric properties of patient-reported outcome measures for hip arthroscopic surgery Am J Sports Med. 2013;41(9):2065-2073. doi:10.1177/ 0363546513494173
31. Thorborg K, Holmich P Measurement qualities of hip and groin outcome scores: letter to the editor Am J Sports Med. 2014;42(1):NP7-10. doi:10.1177/ 0363546513514718
32. Farrar JT, Young JP Jr, LaMoreaux L, Werth JL, Poole RM. Clinical importance of changes in chronic pain intensity measured on an 11-point numerical pain rating scale. Pain 2001;94(2):149-158. doi:10.1016/S0304-3959(01)00349-9
33. Salaffi F, Stancati A, Silvestri CA, Ciapetti A, Grassi W Minimal clinically important changes in chronic musculoskeletal pain intensity measured on a numerical rating scale. Eur J Pain 2004;8(4):283-291. doi:10.1016/j.ejpain.2003.09.004
34. Ezeugwu V, Klaren RE, E AH, Manns PT, Motl RW. Mobility disability and the pattern of accelerometerderived sedentary and physical activity behaviors in people with multiple sclerosis. Prev Med Rep. 2015;2:241-246. doi:10.1016/j.pmedr.2015.03.007
35. Freedson PS, Melanson E, Sirard J. Calibration of the computer science and applications, Inc. accelerometer Medicine and science in sports and exercise 1998;30(5):777-781. doi:10.1097/ 00005768-199805000-00021
36. Masse LC, Fuemmeler BF, Anderson CB, et al. Accelerometer data reduction: a comparison of four reduction algorithms on select outcome variables. Medicine and science in sports and exercise 2005;37(11 Suppl):S544-554. doi:10.1249/ 01.mss.0000185674.09066.8a
37 Aadland E, Ylvisaker E. Reliability of the Actigraph GT3X+ Accelerometer in adults under freeliving conditions. PLoS One. 2015;10(8):e0134606. doi:10.1371/journal.pone.0134606
Pre- and Post-Operative Pain Intensity and Physical Activity Levels in Individuals with Acetabular Dysplasi… International Journal of Sports Physical Therapy
38. Sandroff BM, Dlugonski D, Weikert M, Suh Y, Balantrapu S, Motl RW. Physical activity and multiple sclerosis: new insights regarding inactivity Acta Neurol Scand. 2012;126(4):256-262. doi:10.1111/ j.1600-0404.2011.01634.x
39. Matthew CE. Calibration of accelerometer output for adults. Medicine and science in sports and exercise 2005;37(11 Suppl):S512-522. doi:10.1249/ 01.mss.0000185659.11982.3d
40. Craig CL, Marshall AL, Sjostrom M, et al. International physical activity questionnaire: 12-country reliability and validity Medicine and science in sports and exercise 2003;35(8):1381-1395. doi:10.1249/01.MSS.0000078924.61453.FB
41. Lee PH, Macfarlane DJ, Lam TH, Stewart SM. Validity of the International Physical Activity Questionnaire Short Form (IPAQ-SF): a systematic review Int J Behav Nutr Phys Act 2011;8:115. doi:10.1186/1479-5868-8-115
42. Friedenreich CM, Courneya KS, Neilson HK, et al. Reliability and validity of the Past Year Total Physical Activity Questionnaire. Am J Epidemiol 2006;163(10):959-970. doi:10.1093/aje/kwj112
43. van Poppel MN, Chinapaw MJ, Mokkink LB, van Mechelen W, Terwee CB. Physical activity questionnaires for adults: a systematic review of measurement properties. Sports Med 2010;40(7):565-600. doi:10.2165/ 11531930-000000000-00000
44. Cohen J. Statistical Power Analysis for the Behavioral Sciences 2nd ed. L. Erlbaum Associates; 1988.
45. Boje J, Caspersen CK, Jakobsen SS, Soballe K, Mechlenburg I. Are changes in pain associated with changes in quality of life and hip function 2 years after periacetabular osteotomy? A follow-up study of 321 patients. J Hip Preserv Surg 2019;6(1):69-76. doi:10.1093/jhps/hnz009
46. Wasko MK, Yanik EL, Pascual-Garrido C, Clohisy JC. Psychometric properties of patient-reported outcome measures for periacetabular osteotomy J Bone Joint Surg Am. 2019;101(6):e21. doi:10.2106/ JBJS.18.00185
47 Sloman R, Wruble AW, Rosen G, Rom M. Determination of clinically meaningful levels of pain reduction in patients experiencing acute postoperative pain. Pain Manag Nurs 2006;7(4):153-158. doi:10.1016/j.pmn.2006.09.001
48. Everett BP, Nakonezny PA, Mulligan EP, Chhabra A, Wells J. The relationship between pre-operative pain characteristics and periacetabular osteotomy outcomes in patients with acetabular dysplasia. J Hip Preserv Surg 2022;9(1):44-50. doi:10.1093/jhps/ hnac004
49. Jacobsen S, Sonne-Holm S, Soballe K, Gebuhr P, Lund B. Hip dysplasia and osteoarthrosis: a survey of 4151 subjects from the Osteoarthrosis Substudy of the Copenhagen City Heart Study. Acta Orthop. 2005;76(2):149-158. doi:10.1080/00016470510030517
50. Nunley RM, Prather H, Hunt D, Schoenecker PL, Clohisy JC. Clinical presentation of symptomatic acetabular dysplasia in skeletally mature patients. J Bone Joint Surg Am 2011;93 Suppl 2:17-21. doi:10.2106/JBJS.J.01735
51. Jacobsen JS, Holmich P, Thorborg K, et al. Muscletendon-related pain in 100 patients with hip dysplasia: prevalence and associations with selfreported hip disability and muscle strength. J Hip Preserv Surg 2018;5(1):39-46. doi:10.1093/jhps/ hnx041
52. Heesch KC, van Uffelen JG, Hill RL, Brown WJ. What do IPAQ questions mean to older adults? Lessons from cognitive interviews. Int J Behav Nutr Phys Act 2010;7:35. doi:10.1186/1479-5868-7-35
Pre- and Post-Operative Pain Intensity and Physical Activity Levels in Individuals with Acetabular Dysplasi… International Journal of Sports Physical Therapy
Reliability of Spatiotemporal
McManigal M, Post A, Allen M, et al. Reliability of Spatiotemporal Characteristics During Single-Legged Hop and Bilateral Drop Jump Tasks Using an Instrumented Pressure Walkway. IJSPT. Published online June 1, 2024:704-713. doi:10.26603/001c.117401
Characteristics During Single-Legged Hop and Bilateral Drop Jump Tasks Using an Instrumented Pressure Walkway
Matthew McManigal1a , Austin Post2 , Michael Allen3 , Alyx Jorgensen4 , MIke Rosenthal4 , Michael Wellsandt4 , Matthew Tao2 , Elizabeth Wellsandt4
1 Physical Therapy Education, University of Nebraska Medical Center, 2 Department of Orthopaedic Surgery and Rehabilitation, University of Nebraska Medical Center, 3 College of Education, Health, and Human Sciences, University of Nebraska at Omaha, 4 Department of Health and Rehabilitation Sciences, University of Nebraska Medical Center
Keywords: Zeno, biomechanics, hop test, drop jump, reliability https://doi.org/10.26603/001c.117401
International Journal of Sports Physical Therapy
Background
Single-legged hop tests have been widely used to assess performance-based outcomes after anterior cruciate ligament (ACL) reconstruction. Traditional single, triple, or 6-meter (6m) timed hop tests only measure distance or time as the principal variables, neglecting other variables, such as individual hop distances within a series of hops, flight time, and stance time. The development of portable instrumented pressure walkways has made it possible to collect parameters such as hop velocity, flight time, stance time, distance, and pressure outside of a laboratory setting. However, the reliability of instrumented pressure walkways in measuring spatial and temporal variables during single-legged hop tests is unknown. This study aimed to determine if the Zeno walkway can reliably measure spatiotemporal (ST) characteristics of hop tests.
Study Design
Cross-Sectional Study
Methods
Individuals (n=38) in this cross-sectional study performed single, triple, and 6m hop tests on a pressure-sensitive Zeno walkway Twenty-one participants completed follow-up testing between one and 14 days later. Intraclass correlation coefficients (ICC(3,k)) were used to assess test-retest reliability of ST variables. The accuracy of vertical jump height and 6m hop timing were also measured.
Results
All ST variables demonstrated excellent test-retest reliability (ICC > 0.86) with small minimal detectable change (MDC) values during single-legged hop tests. Six-meter hop time and jump height during a bilateral drop jump were also accurately measured by the walkway
Conclusion
An instrumented pressure walkway is a novel tool to reliably assess non-traditional parameters of clinically relevant hop and jump tests such as flight time, stance time, and jump height after lower extremity injury, surgery, and rehabilitation.
Corresponding Author: Matthew McManigal 984420 Nebraska Medical Center Omaha, NE 68198-4420 matthew.mcmanigal@unmc.edu
Original Research
a
INTRODUCTION
Hopping and jumping movements are frequently completed in cutting and pivoting sports and are commonly used to measure performance in clinical and field settings.1 Measuring multi-joint lower limb movements common in sports is considered an essential marker of rehabilitation and recovery following lower extremity injuries. For example, hop and jump tests are a common component of return-to-sport test batteries following anterior cruciate ligament (ACL) reconstruction. Such tests have been used as a screening assessment to determine those who may be at risk for reinjury 2‑4 However, single-legged hop tests are not strongly associated with self-reported knee function and the ability to return to sport after ACL reconstruction.5 Thus, measuring the most basic characteristics of hop tests, such as hop distance, may be inadequate to detect underlying deficits in lower extremity function and performance. For example, patients that can hop at least 90% as far after ACL reconstruction, compared to the uninjured limb, still demonstrate significant kinematic and kinetic differences between limbs.6
Previous studies investigating more detailed characteristics of single-legged and vertical jumping have used force plates.6 Force plates, however, are expensive and typically housed within laboratory settings that require trained personnel to operate. Clinical measurements of single-legged hop tests for distance are typically measured using a tape measure,7,8 while hop testing for time, such as the 6m timed hop test, typically relies on the use of a stopwatch.8,9 Although common practice in many clinical settings, these hop test measurement tools do not allow for analysis of individual hop characteristics, such as time spent in flight compared to on the ground. In recent years, instrumented pressure mats have emerged as cost-effective and portable devices that can be used in a field or clinical setting to measure human movement. However, their use has been predominantly focused on measuring walking.10‑12 The measurement of ST variables using an instrumented pressure walkway during performance-based measurements such as jumping and hopping have not been reported.
The first aim of this study was to determine the testretest reliability of ST variables during hopping and jumping measured using an instrumented pressure walkway Single-legged hop tests included the single and triple hop for distance and the 6m timed hop. The jump test measured was the bilateral drop vertical jump. The authors hypothesized that there would be excellent test-retest reliability of ST variables measured during these hop and jump tests. The second aim of this study was to determine the level of agreement between a) the time measured by the pressure walkway compared to infrared timing gates during the 6m timed hop and b) the jump height during the bilateral drop vertical jump measured by the pressure walkway compared to a three-dimensional motion capture system. The authors hypothesized that there would be a high level of agreement
for a) 6m hop time between the pressure walkway and timing gates and b) jump height between the pressure walkway and motion capture system.
METHODS
Thirty-eight participants were recruited for this study and completed baseline testing (T1). Twenty-one of the 38 participants returned to repeat testing for the test-retest reliability portion of this study Participants were included for participation if they were between 19-35 years old and participated in at least 50 hours per year of cutting or pivoting activities.13 Participants were excluded if they had hip, knee, or ankle pain or surgery within the prior six months, a history of balance or neurological disorders, or were currently pregnant. This study was approved by the University of Nebraska Medical Center’s Institutional Review Board, and all participants provided written informed consent prior to participation in the study
INSTRUMENTATION
All hop and jump testing was performed on a portable, instrumented pressure walkway (Protokinetics Zeno Walkway System, Havertown, Pennsylvania, USA). The Zeno Walkway used in this study had a sensor resolution of 0.5 in2 , a sensor area of 2 feet by 20 feet, and a sampling rate of 120 Hz. At 120 Hz, the fastest discernable hop time the walkway is capable of capturing is 0.017 seconds, which is much faster than expected hop times.14
HOP AND JUMP MEASUREMENTS
Participants completed the single hop for distance, triple hop for distance, and 6m timed hop on the instrumented pressure walkway, in this respective order (Figure 1). Participants completed up to two practice trials for each of the three hop tests and were allowed 30 seconds of rest in between all trials to reduce fatigue. All single-legged hop tests started with two valid trials on the right leg, followed by two valid trials on the left leg using the same procedure.
SINGLE AND TRIPLE HOP FOR DISTANCE
The single hop for distance began with the participant’s foot on the walkway and their toes behind a taped line at the beginning of the walkway The participant finished the hop on the same foot, without placing the contralateral foot on the walkway The participant was instructed to begin each trial by lifting the contralateral foot off the walkway and maintain their balance, followed by a forward hop to the furthest possible distance to which the participant was able to complete a stable landing for two seconds, before placing the contralateral foot on the walkway Variables of interest for the single hop for distance included flight time and distance. Distance was measured in Pro-
Level of Evidence 3b
Reliability of Spatiotemporal Characteristics During Single-Legged Hop and Bilateral Drop Jump Tasks Usin… International Journal of Sports Physical Therapy
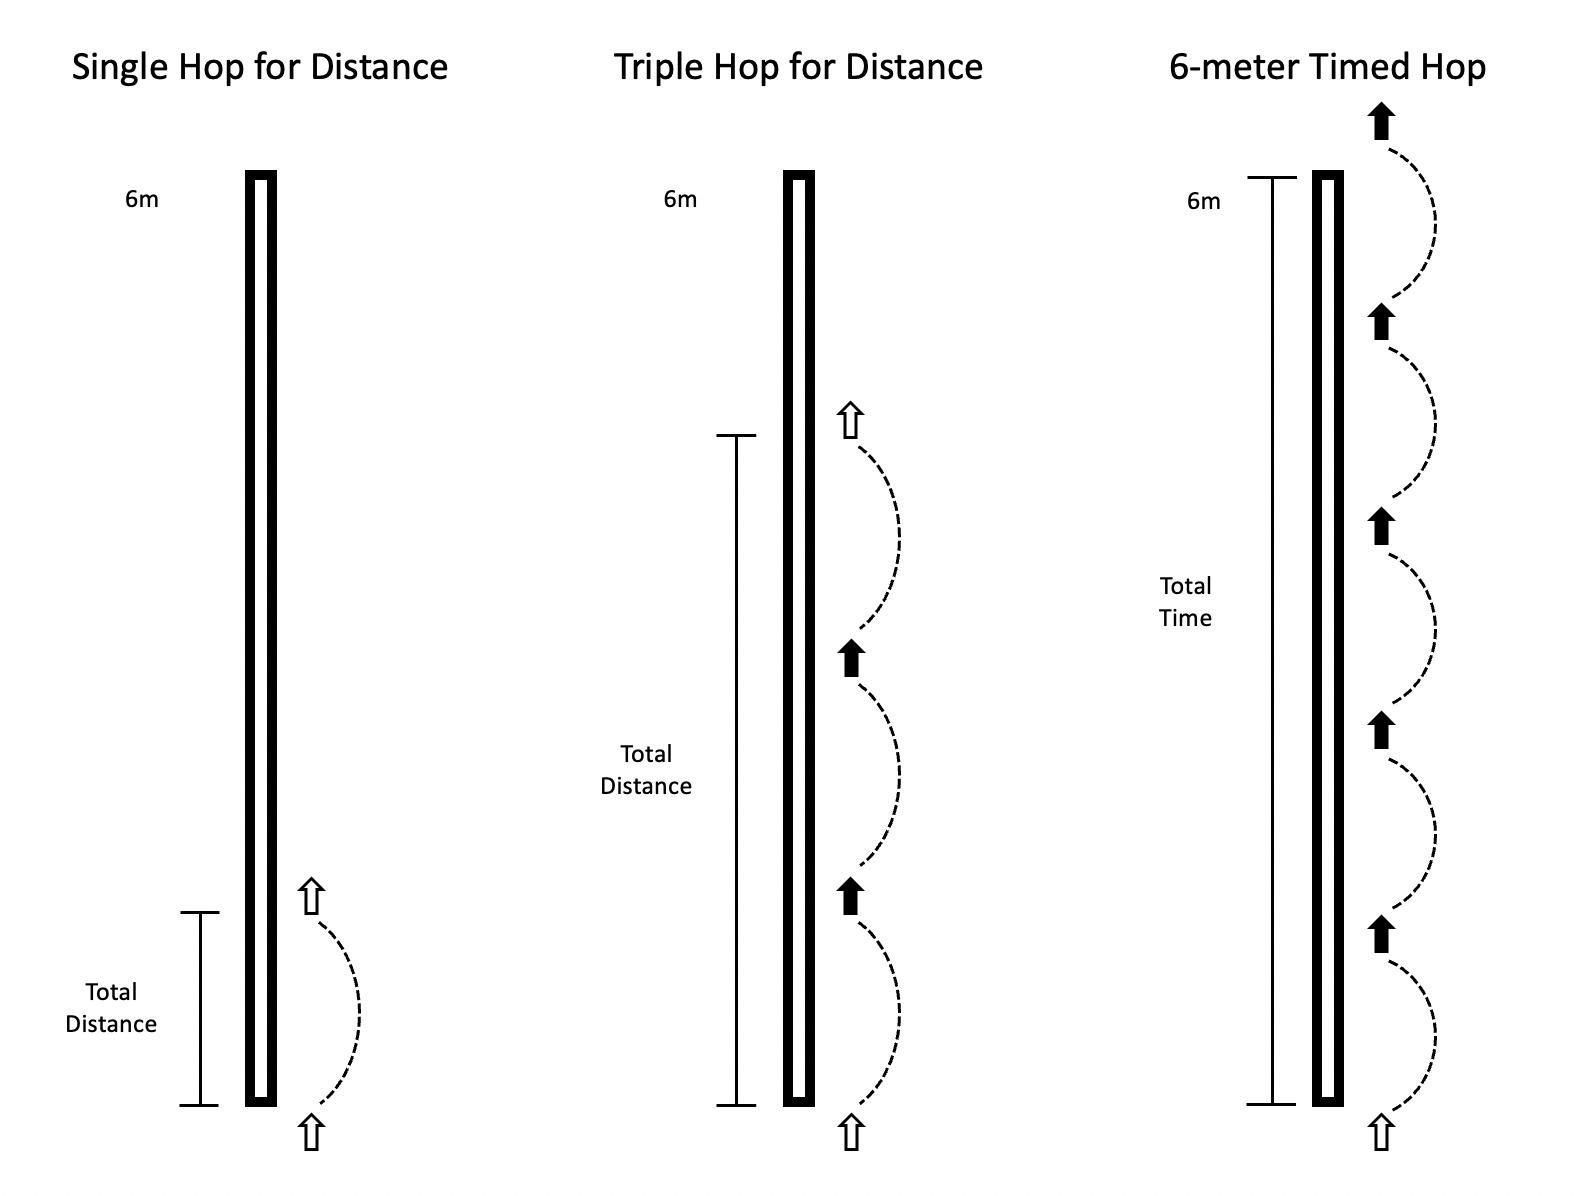
Figure 1. Diagrammatic representation of the series of 3 hop tests: single hop for distance, triple hop for distance, and 6m timed hop. Arrows indicate footfalls. Empty arrows indicate either the first or last footfall.
toKinetics Movement Analysis Software (PKMAS) from the starting toe position of the foot to the ending heel position of the foot.
The triple hop for distance consisted of the participant beginning with their toes behind a taped line at the beginning of the walkway. The participant then performed three consecutive forward hops on the same limb. If at any time the contralateral foot touched the walkway, that trial became invalid. For the triple hop for distance, variables of interest included average flight time, average stance time, and total distance. Like single hop, distance was measured in PKMAS from the starting toe position of the foot to the ending heel position of the foot at the final landing.
6-METER TIMED HOP
The 6m timed hop consisted of the participant beginning with their toes behind a taped line at the beginning of the walkway. The participant then hopped forward as fast as possible for 6 meters, without placing the contralateral foot on the walkway. The pressure walkway and a 40-inch tall timing gate system (Brower Timing, TCi Timing System, Draper, Utah, USA) were used to collect 6m timed hop data. Total hop time was measured using the timing gate system integrated with a switch placed under the heel and a pair of timing gates placed 6 meters from the beginning taped line. Time started when the participant’s heel lifted off the switch and ended once the participant’s torso crossed the timing gates at the 6m line.
Walkway variables of interest included average flight time, average stance time, average hop distance, and total time required to complete each 6m hop trial. Total time to complete the 6m timed hop using the pressure walkway was
calculated by extrapolating the average hop speed from the first to last footfall (Equation 1). Average hop speed was calculated using PKMAS-calculated 1) measured distance (MD) from the beginning toe position to the toe position of the final footfall before the 6m mark and 2) time from when the foot first departed the walkway until the time of the final footfall before the 6m mark. Because the distance to the last footfall was less than 6 meters, this equation allowed estimation of time over a full 6m length.
Equation 1. Total time (s) = MT / (MD/6 meters)
MT = Measured time from the beginning of the trial to final footfall (s)
MD = Measured distance from the start of the trial to final footfall (m)
BILATERAL DROP VERTICAL JUMPS
Prior to drop vertical jump trials, a single, 14 mm retroreflective marker was placed at the most anterior portion of each shoe (toe) and posteriorly on each shoe at the heel. Target marker data was measured using an 8-camera motion capture system (Qualisys AB, Gothenburg, Sweden) sampled at 240 Hz, during bilateral drop vertical jump testing.
Participants performed bilateral drop vertical jumps from a box with a height of 31 cm. The box was positioned such that the participant could drop straight down onto the walkway. Participants were instructed to step off the box with whichever foot they preferred, eyes open, and hands on their hips. They were further instructed to land with both feet simultaneously, followed immediately by a maximum vertical jump, ending with both feet landing back onto the walkway in accordance with previously recorded
Reliability of Spatiotemporal Characteristics During Single-Legged Hop and Bilateral Drop Jump Tasks Usin… International Journal of Sports Physical Therapy
Table 1. Descriptive data (n= 38)
Age (years) 24.2 (3.5) BMI (kg/m2)
(3.6)
Time Between Testing Sessions (days)* 5.8 (3.0)
Abbreviations: F, female; M, male; BMI, body mass index; kg, kilograms; m, meters; R, right; L, left. *Time between testing sessions calculated for the 20 participants who returned for the second testing session of the test-retest portion of this study
methods.15 Participants were allowed two practice trials to familiarize themselves with the movement, followed by five valid trials that were recorded. A valid trial required the participant to complete both landings without loss of balance.
Variable of interest for drop vertical jump included the flight time of the vertical jump as measured by the pressure walkway, which was used to calculate vertical jump height using Equation 2. Flight time (FT) was defined as the duration of time the pressure walkway detected no pressure –corresponding to the time the participant spent in the air between the first and second landing. The pressure walkway-derived vertical jump height was then compared to the height measured by the motion capture system. Target marker data were post-processed in Visual3D software (CMotion, Inc., Bethesda, Maryland, USA). Target data were low-pass filtered using a second-order Butterworth filter with a cut-off frequency of 15 Hz. Maximum jump height was defined by the vertical distance between a heel marker at toe-off of the first landing and the maximum vertical height of the heel marker while the participant was in the air before the second landing. The heel marker on the foot that achieved the lowest maximum height was used for analysis.
Equation 2. Height (m) = 1/8 * g * (FT)2
g = Acceleration due to gravity (9.81 m/s2)
FT = Flight time (s)
SECOND TESTING SESSION
For the 21 participants completing the second testing session (T2), all movements were completed in the same order using the same protocol and procedures as the first testing session. Participants completed the second testing session between 24 hours to 14 days after the first session.
STATISTICAL ANALYSIS
A random number generator was used to determine whether pressure walkway data from the right leg or left leg was used in the statistical analysis for each participant. Analyses were performed using SPSS 26 (IBM, Armonk, New York, USA). Intraclass correlation coefficients (ICC(3,k); two-way mixed, reliability) were used to determine test-retest reliability of ST variables during singlelegged hop tests across the two separate testing sessions. Standard error (SE) was estimated as: SE = SD x
, where SD is the pooled standard deviation of the measurements for all the participants. Minimal detectable change (MDC) values were calculated at a 95% confidence level for each ST variable (MDC95 = SE x 1.96 x ). For each hop type, MDC95 was also normalized by the mean hop distance.16 This provides a more clinically useful MDC as a percentage of a patient’s hop distance. An ICC value greater than 0.90 is defined as excellent, 0.75-0.90 is defined as good, 0.50-0.75 is defined as moderate, and less than 0.50 is defined as poor reliability 17 The level of agreement for the ST variables of the hop tests were assessed using Bland-Altman plots (GraphPad Prism 8.2.0 San Diego, California, USA). Limits of agreement (LoA) were set at ±2 MDC values.18 Pearson correlations were used to assess the correlation between the 6m hop time (using the pressure walkway compared to the timing gates) and maximum vertical jump height during the bilateral drop vertical jump (using the pressure walkway compared to motion capture) from the first testing session. A p-value of <0.05 was set for all analyses a priori.
RESULTS
Descriptive data for participants is presented in Table 1 A greater proportion of females participated in the study (55.3%), and a greater proportion of right legs were randomly selected for statistical analysis (52.6%). On average, participants had a normal BMI, 24.3 kg/m2
SINGLE AND TRIPLE HOP FOR DISTANCE
Descriptive statistics, reliability coefficients, and MDCs are reported in Table 2 for ST variables during single and triple hops for distance. The instrumented pressure walkway showed good to excellent test-retest reliability during single hops (ICCs 0.929-0.952) and triple hops (ICCs 0.860-0.958) for all ST variables. One participant was not included in triple hop analyses due to measurement error. Bland-Altman plots for ST variables of single and triple hop for distance tests are presented in Figure 2.
SIX-METER TIMED HOP
Descriptive statistics, reliability coefficients, and MDCs are reported in Table 3 for ST variables during 6m timed hop. The instrumented pressure walkway showed excellent testretest reliability during 6m hops (ICCs 0.939-0.972) for all
Mean (SD) Frequency Sex Frequency
21:17
20:18
(F:M)
Leg Analyzed (R:L)
24.3
Reliability of Spatiotemporal Characteristics During Single-Legged Hop and Bilateral Drop Jump Tasks Usin… International Journal of Sports Physical Therapy
Table 2. Mean values, pooled standard deviations (SD), reliability coefficients, standard errors of the mean, and minimal detectable changes for ST variables during the single and triple hop for distance.
ST variables. The 6m hop time measured by the instrumented walkway during the first testing session ( =2.092, SD=0.380) was strongly correlated with the infrared timing gates ( =2.226, SD=0.369) (p<0.001, r=0.953) and differences between the measurement methods are demonstrated in a Bland-Altman plot in Figure 3 Bland-Altman plots for ST variables of 6m timed hop tests are also presented in Figure 2
BILATERAL DROP JUMPS
Maximum vertical jump height, as calculated from flight time, during bilateral drop jumps on the instrumented pressure walkway during the first testing session ( =0.248, SD=0.081) was strongly correlated with the maximum vertical jump height as measured by the Qualisys motion capture system ( =0.256, SD=0.086) (p<0.001, r=0.907). A Bland-Altman plot depicting the differences between the measurement methods is presented in Figure 3
DISCUSSION
The purpose of this study was to determine the test-retest reliability and MDC values of ST variables during singlelegged hop tests using a Zeno instrumented pressure walkway The authors also aimed to validate the time measured by the walkway during the 6m timed hop and jump height during a bilateral drop vertical jump. The findings supported the primary hypothesis, showing that test-retest reliability for all spatial and temporal variables for hop tests were good or excellent using the instrumented pressure walkway (ICCs≥0.86). Furthermore, the secondary hypothesis was supported, as the data showed a strong correlation (r=0.953) between the total time during the 6m timed hop measured by the walkway compared to the timing gates. Additionally, the tertiary hypothesis was supported, as the data indicated a strong correlation (r=0.907) between the maximum vertical jump height measured by the pressure walkway compared to the three-dimensional motion capture system. To the authors’ knowledge, this is the first study that has analyzed various ST variables during singlelegged hop tests and bilateral drop vertical jumps in young, active individuals using an instrumented pressure walkway.
Recent research has highlighted the value of measuring other ST variables beyond that of total distance and time during single-legged hop tests. For example, Lloyd and colleagues measured reactive strength ratios, which is the ratio of stance time to flight time in a population of male professional soccer players at 36 weeks after ACL reconstruction.19 Even while 80% of athletes tested passed the 90% leg symmetry index (LSI) for total hop distance during triple hop, only 35% and 45% passed the LSI threshold for reactive strength ratios during their first and second hop, respectively Such conclusions highlight the value of collecting alternative ST variables beyond traditional total hop distance and time.
Past research by Reid et al. published MDC values for LSIs of the single, triple, and 6m hops at the 90% confidence level for a population of similar age but after ACLR. Their results noted MDC values of 8.1%, 10.0%, and 13.0%, respectively.7 When converting the current data to a 90% confidence level, our MDC results were slightly higher compared to Reid et al. for single and triple hop at 14.9% and 13.0%, respectively, but lower for the 6m hop at 9.4%. Additionally, Dingenen et al. reported MDC values normalized to total hop distance of 10.4% and 7.2% for single and triple hop, respectively 16 The corresponding single and triple hop normalized MDC values from the current study were higher at 17.8% and 15.5%, respectively The differences in normalized MDC values are likely due to differences in participant demographics.
Similarly, recent research by Ahmadian et al. analyzed the accuracy and precision of ST variables during the triple hop test using wearable inertial measurement units in a population of 11 to 19-year-old individuals who sustained a knee injury within the prior 15 months.19 Results found accurate and precise total hop distances when compared to the clinical standard tape measure. One limitation noted in this study was the validation of temporal variables, which did not use the gold standard force plates. The current study testing procedures overcomes this limitation with the use of the instrumented pressure walkway. Both inertial measurement units and instrumented pressure walkways provide an emerging alternative for a more in-depth analysis of ST variables during single-legged hop tests.
This study was limited by the width of the pressure walkway, which did not allow for the safe collection of the
Hop Variable Mean Pooled SD ICC SEM MDC95 MDC95/hop distance (%) Single Flight Time (s) 0.29 0.05 0.929 0.01 0.04Distance (cm) 111.69 32.66 0.952 7.16 19.83 17.8 Triple Average Flight Time (s) 0.27 0.05 0.958 0.01 0.03Average Stance Time (s) 0.35 0.04 0.860 0.02 0.04Total Distance (cm) 412.14 86.47 0.929 23.04 63.87 15.5
ICC, intraclass correlation coefficient; MDC95, minimal detectable change at the 95% confidence interval; s, seconds; cm, centimeters.
Reliability of Spatiotemporal Characteristics During Single-Legged Hop and Bilateral Drop Jump Tasks Usin… International Journal of Sports Physical Therapy
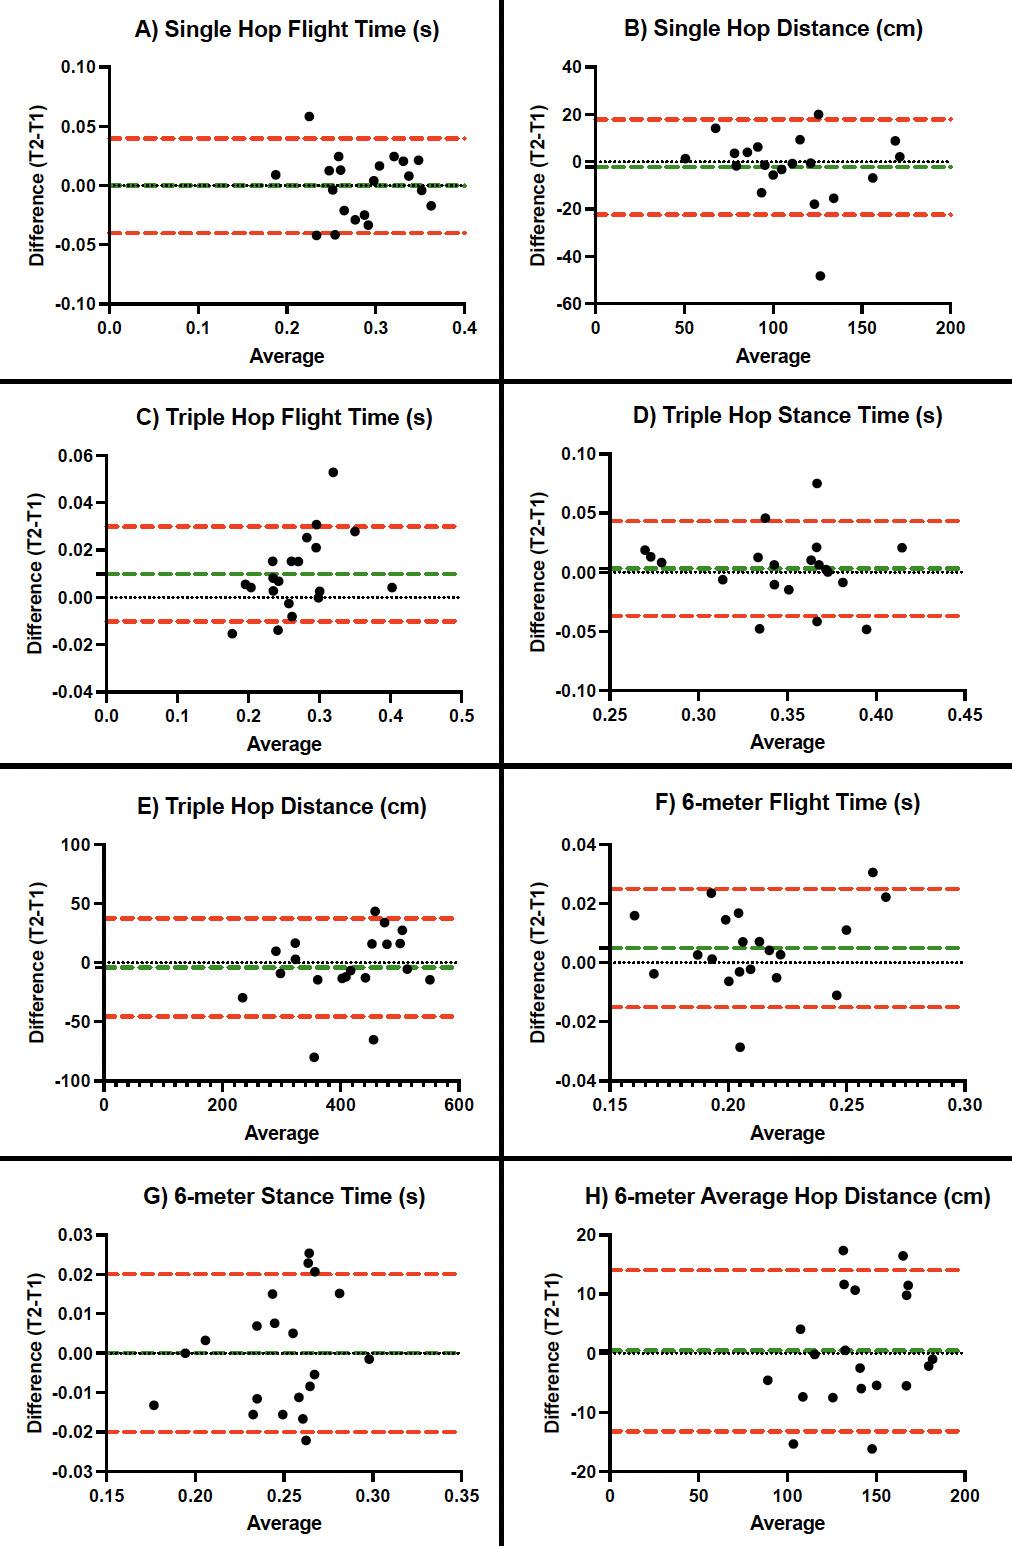
International Journal of Sports Physical Therapy
Reliability of Spatiotemporal Characteristics During Single-Legged Hop and Bilateral Drop Jump Tasks Usin…
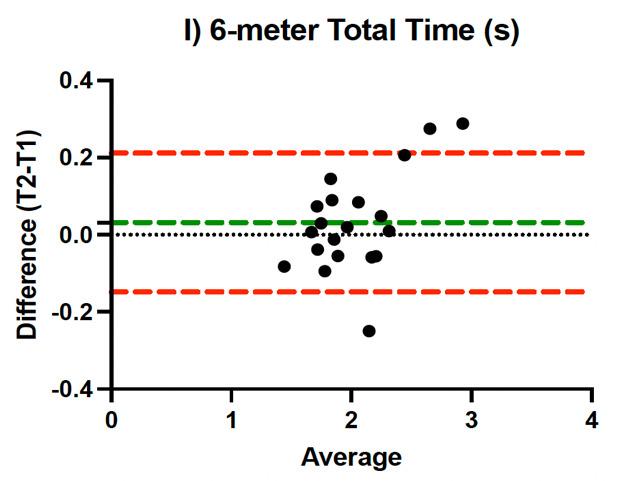
Figure 2. Bland-Altman plots for single, triple, and 6m hop test ST variables. Each participant’s average measurement of T1 and T2 is plotted along the x-axis. The difference between the measurements at T1 and T2 is plotted along the y-axis. The dashed red lines represent limits of agreement (±2 MDC). The dashed, green line represents the mean of the differences for all participants between T1 and T2. The dotted, black line is included as a reference that indicates no difference between testing sessions.
Table 3. Mean values, pooled standard deviations (SD), reliability coefficients, standard errors of the mean, and minimal detectable changes for ST variables during the 6m timed hop.
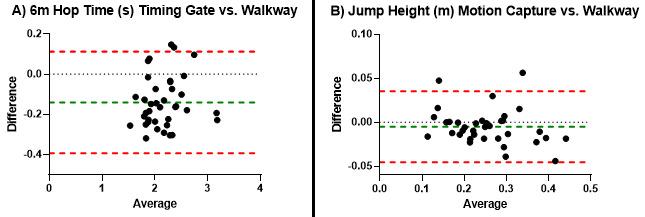
Figure 3. Bland-Altman plots for total 6m hop time as measured by timing gates versus instrumented pressure walkway and jump height during bilateral drop jump as measured by the Qualisys motion capture system versus height as calculated by the instrumented pressure walkway Each participant’s average measurement at T1 is plotted along the x-axis. The difference between the measurement methods is plotted along the y-axis. The dashed red lines represent limits of agreement (±2 SD). The dashed, green line represents the mean of the differences for all participants between measurement methods. The dotted, black line is included as a reference that indicates no difference between testing sessions.
crossover hop test for distance. In addition, the walkway would occasionally slide forward ≤ 1 cm upon the partici-
pant landing, specifically during triple hop tests when forward momentum was greater.
Hop Variable Mean Pooled SD ICC SEM MDC95 MDC95/hop distance (%) 6m Average Flight Time (s) 0.22 0.03 0.955 0.01 0.02Average Stance Time (s) 0.24 0.05 0.939 0.01 0.03Average Hop Distance (cm) 142.28 28.54 0.972 4.46 12.35 8.7 Total Time (s) 1.97 0.47 0.969 0.08 0.236m,
detectable change at the 95% confidence interval; s, seconds; cm, centimeters.
6-meter; ICC, intraclass correlation coefficient; MDC95, minimal
Reliability of Spatiotemporal Characteristics During Single-Legged Hop and Bilateral Drop Jump Tasks Usin… International Journal of Sports Physical Therapy
CONCLUSION
The test-retest reliability was good to excellent (all ICCs>0.86), with small MDC values for all ST variables measured by an instrumented pressure walkway during singlelegged hop tests. The walkway also accurately measured six-meter hop time and vertical jump height during a bilateral drop vertical jump. An instrumented pressure walkway is a novel tool able to reliably assess non-traditional, clinically relevant hop and jump test parameters such as flight time, stance time, and jump height in a young, uninjured population, and may be useful after lower extremity injury, surgery, and rehabilitation.
CONFLICTS OF INTEREST
The authors report no conflicts of interest.
FUNDING
This work was supported by the Nebraska Bankers Association and the University of Nebraska Medical Center The funding sources were not involved in study design, data collection, analysis, interpretation, manuscript writing, or decision to submit the article for publication.
Submitted: December 14, 2023 CDT, Accepted: April 12, 2024 CDT
© The Author(s)
This is an open-access article distributed under the terms of the Creative Commons Attribution 4.0 International License (CCBY-NC-4.0). View this license’s legal deed at https://creativecommons.org/licenses/by-nc/4.0 and legal code at https://creativecommons.org/licenses/by-nc/4.0/legalcode for more information.
Reliability of Spatiotemporal Characteristics During Single-Legged Hop and Bilateral Drop Jump Tasks Usin… International Journal of Sports Physical Therapy
REFERENCES
1. Casartelli N, Müller R, Maffiuletti NA. Validity and reliability of the Myotest Accelerometric System for the assessment of vertical jump height. J Strength Cond Res 2010;24(11). https://journals.lww.com/ nsca-jscr/Fulltext/2010/11000/ Validity_and_Reliability_of_the_Myotest.40.aspx
2. Castagna C, Ganzetti M, Ditroilo M, Giovannelli M, Rocchetti A, Manzi V Concurrent validity of vertical jump performance assessment systems. J Strength Cond Res 2013;27(3). doi:10.1519/ JSC.0b013e31825dbcc5
3. Noyes FR, Barber SD, Mangine RE. Abnormal lower limb symmetry determined by function hop tests after anterior cruciate ligament rupture. Am J Sports Med. 1991;19(5):513-518. doi:10.1177/ 036354659101900518
4. Grindem H, Snyder-Mackler L, Moksnes H, Engebretsen L, Risberg MA. Simple decision rules can reduce reinjury risk by 84% after ACL reconstruction: the Delaware-Oslo ACL cohort study Br J Sports Med 2016;50(13):804-808. doi:10.1136/ bjsports-2016-096031
5. Losciale JM, Bullock G, Cromwell C, Ledbetter L, Pietrosimone L, Sell TC. Hop testing lacks strong association with key outcome variables after primary anterior cruciate ligament reconstruction: A systematic review. Am J Sports Med. 2020;48(2):511-522. doi:10.1177/0363546519838794
6. Kotsifaki A, Korakakis V, Whiteley R, Van Rossom S, Jonkers I. Measuring only hop distance during single leg hop testing is insufficient to detect deficits in knee function after ACL reconstruction: a systematic review and meta-analysis. Br J Sports Med. 2020;54(3):139-153. doi:10.1136/ bjsports-2018-099918
7. Reid A, Birmingham TB, Stratford PW, Alcock GK, Giffin JR. Hop testing provides a reliable and valid outcome measure during rehabilitation after anterior cruciate ligament reconstruction. Phys Ther. 2007;87(3):337-349. doi:10.2522/ptj.20060143
8. Myers BA, Jenkins WL, Killian C, Rundquist P
Normative data for hop tests in high school and collegiate basketball and soccer players. Int J Sports Phys Ther 2014;9(5):596-603.
9. Ebert JR, Du Preez L, Furzer B, Edwards P, Joss B. Which hop tests can best identify functional limb asymmetry in patients 9-12 months after anterior cruciate ligament reconstruction employing a hamstrings tendon autograft? Int J Sports Phys Ther 2021;16(2):393-403. doi:10.26603/001c.21140
10. Vallabhajosula S, Humphrey SK, Cook AJ, Freund JE. Concurrent validity of the Zeno walkway for measuring spatiotemporal gait parameters in older adults. J Geriatr Phys Ther 2019;42(3):E42-E50. doi:10.1519/JPT.0000000000000168
11. Cleland BT, Arshad H, Madhavan S. Concurrent validity of the GAITRite electronic walkway and the 10-m walk test for measurement of walking speed after stroke. Gait Posture. 2019;68:458-460. doi:10.1016/j.gaitpost.2018.12.035
12. McKay MJ, Baldwin JN, Ferreira P, et al. Spatiotemporal and plantar pressure patterns of 1000 healthy individuals aged 3-101 years. Gait Posture 2017;58:78-87 doi:10.1016/j.gaitpost.2017.07.004
13. Grindem H, Logerstedt D, Eitzen I, et al. Singlelegged hop tests as predictors of self-reported knee function in nonoperatively treated individuals with anterior cruciate ligament injury. Am J Sports Med. 2011;39(11):2347-2354. doi:10.1177/ 0363546511417085
14. Ahmadian N, Nazarahari M, Whittaker JL, Rouhani H. Quantification of triple single-leg hop test temporospatial parameters: A validated method using body-worn sensors for functional evaluation after knee injury Sensors 2020;20(12):3464. doi:10.3390/s20123464
15. Hewett TE, Myer GD, Ford KR, et al. Biomechanical measures of neuromuscular control and valgus loading of the knee predict anterior cruciate ligament injury risk in female athletes: A prospective study Am J Sports Med 2005;33(4):492-501. doi:10.1177/0363546504269591
16. Dingenen B, Truijen J, Bellemans J, Gokeler A. Test–retest reliability and discriminative ability of forward, medial and rotational single-leg hop tests. The Knee. 2019;26(5):978-987. doi:10.1016/ j.knee.2019.06.010
17 Koo TK, Li MY A Guideline of selecting and reporting intraclass correlation coefficients for reliability research. J Chiropr Med. 2016;15(2):155-163. doi:10.1016/j.jcm.2016.02.012
Reliability of Spatiotemporal Characteristics During Single-Legged Hop and Bilateral Drop Jump Tasks Usin… International Journal of Sports Physical Therapy
18. Bland JM, Altman DG. Statistical methods for assessing agreement between two methods of clinical measurement. Lancet 1986;1(8476):307-310.
19. Lloyd RS, Oliver JL, Kember LS, Myer GD, Read PJ. Individual hop analysis and reactive strength ratios provide better discrimination of ACL reconstructed limb deficits than triple hop for distance scores in athletes returning to sport. Knee 2020;27(5):1357-1364. doi:10.1016/ j.knee.2020.07.003
International Journal of Sports Physical Therapy
Reliability of Spatiotemporal Characteristics During Single-Legged Hop and Bilateral Drop Jump Tasks Usin…
Effect of Sex and Lateral Ankle Sprain History on Dorsiflexion
Range Of Motion Asymmetry During the Weight Bearing Lunge Test
kathrine P Cady
1,2a ,
Mark De Ste Croix
2
, Martine Deighan
2
1 Sports Therapy , University of Hertfordshire, 2 Education and Applied Science , University of Gloucestershire
Keywords: Dorsiflexion, lateral ankle sprain, weight bearing lunge test, asymmetry, sex differences https://doi.org/10.26603/001c.117775
International Journal of Sports Physical Therapy
Background
Reduced dorsiflexion range of motion (DFROM) which is commonly seen following lateral ankle sprain (LAS) has the potential to influence lower extremity biomechanics which have been linked to increased injury risk in the female athlete. Current research on the effect of sex and LAS history on DFROM is limited.
Hypothesis/Purpose
This study had three aims 1) to determine the effect of sex, leg dominance and LAS history on DFROM, 2) to determine the effect of sex and LAS history on magnitude of DFROM symmetry and 3) to examine the association of sex on direction (whether dominant or non-dominant limb had the higher DFROM) of symmetry
Study Design
Cross-Sectional Study
Methods
DFROM was measured bilaterally in 105 recreational athletes all participating in multidirectional sports using the tape measurement method during the weight bearing lunge test (WBLT). A mean of three measurements was used for analysis. A 3-way mixed ANOVA was carried out to determine the interaction between sex, LAS history and leg dominance on DFROM and a 2-way ANOVA for the effect of sex and LAS history on asymmetry A chi-square test was used to determine the association of sex and direction of asymmetry
Results
The results indicate no significant effect of sex, LAS history, and leg dominance on DFROM (p=0.65). Main effects were significant for sex and LAS on DFROM. The mean asymmetry for all participants was reported as 12.25±14.76cm. No significant effect of sex and LAS history on magnitude of asymmetry was reported. There was a significant association of sex and direction of asymmetry (χ2(1) = 11.26, p = 0.00). Sixty-five-point two percent of males were shown to have higher DFROM of their non-dominant limb compared to 75% of females who were higher in their dominant limb.
Conclusion
Findings from this study suggest that DFROM is affected by sex and LAS history While females have increased DFROM compared to males, those with LAS history are more likely to have a decreased DFROM on the involved side. The results also indicate that
Corresponding author:
Kathrine Cady
School of Life and Medical Sciences, University of Hertfordshire Institute of Sport, De Havilland Campus, Hatfield, Hertfordshire, AL10 9EU k.cady2@herts.ac.uk 07810440728 a
Original Research
Bearing
online June 1, 2024:714-723. doi:10.26603/001c.117775
Cady kathrine P, De Ste Croix M, Deighan M. Effect of Sex and Lateral Ankle Sprain History on Dorsiflexion Range Of Motion Asymmetry During
the Weight
Lunge Test. IJSPT. Published
interlimb asymmetries in DFROM are present in athletes, therefore practitioners should exercise caution when using bilateral comparisons in injury and return to play assessments.
Level of Evidence
2b.
INTRODUCTION
It has been well documented that the female athlete is at an increased risk of sustaining knee injuries such as patellofemoral pain (PFP)1 and anterior cruciate ligament (ACL) ruptures.2,3 Currently, two biomechanical patterns have been linked to knee injury risk: dynamic knee valgus (DKV) (adduction and internal rotation of the hip, knee abduction and rotation of the tibia) and reduced knee flexion.2,4 Females have been shown to demonstrate more knee valgus, less knee flexion and more femoral adduction when performing ‘at risk’ activities such as landing or cutting which could predispose them to a higher risk of injury 5‑8
A plethora of research has focused on the influence of the kinetic chain on lower extremity biomechanics, with much of the research focusing on the hip,9‑12 but there is a growing body of evidence linking decreased ankle dorsiflexion range of motion (DFROM) to these ‘at risk’ movement patterns.13‑19 These kinetic chain patterns can be identified as the top-down approach (hip and trunk) and the bottom-up approach (ankle).20
Decreased DFROM is a common problem among athletes, especially after LAS, that has been shown to affect sagittal plane movement which may result in compensatory frontal and transverse plane motion and loading, especially at the knee. Individuals with DFROM limitations have been shown to have greater knee flexion displacement, increase knee valgus and greater ground reaction forces during bilateral and unilateral squatting,21,22 landing tasks,16,23,24 and change of direction tasks25 which have been linked to an increase in injury risk, especially in the female athlete. Furthermore, females have been shown to be more oneleg dominant in comparison to males and are more likely to injure their non-dominant limb.26‑28 Therefore, understanding the effect of sex and leg dominance on DFROM may be useful to help inform future sex-specific prevention and rehabilitation strategies. Currently, the plethora of research which has investigated the effect of sex, limb dominance and LAS history on DFROM has found no effect of sex on DFROM29‑32 in a variety of different sports and levels. Miller at al.29 and Senanayake et al.32 report a significant effect of previous ankle injury on DFROM but did not provide analysis on sex differences and so there exists a gap in the current evidence which will be explored further in this study
Unilateral restrictions in DFROM may lead to asymmetrical loading and result in interlimb asymmetries which may influence lower extremity biomechanics. Current evidence is conflicting regarding the extent of asymmetries in DFROM. It has been previously suggested that a threshold of 10-15% asymmetry may increase risk of injury but the literature to support this focusses on return to sport af-
ter ACL reconstruction.33 This has since been challenged and no clear evidence which supports asymmetry and increased risk of injury,34,35 Furthermore the use of an arbitrary asymmetry threshold has limitations and it has been argued that asymmetry should be based on the metric, task, population, and muscle group studied in order to be useful.36 It has also been suggested that practitioners should monitor magnitude (% difference between dominant and non-dominant limbs) alongside direction of asymmetry (whether dominant or non-dominant limb had the larger DFROM) over several testing sessions as these have been to vary considerably over several test sessions using the same test. However, where data has only been collected during one single testing session, an inter-participant threshold can be established to determine what can be considered as a true asymmetry 37 To date there is no known study which investigates sex differences and LAS history on DFROM asymmetry Normative data from Hoch and McKeon38 report interlimb asymmetries of 1-2cm in 35 healthy participants and Rabin et al.39 found asymmetries of 10° in 23% of male military recruits. Arede et al.40 and Işın et al.41 report frequent asymmetries of over 10% in male soccer players but argue that differences occur due to the functional demands of the sport. However, in comparison, other authors have found no asymmetry in DFROM,42,43 but this could be due to methodological differences between the studies and how asymmetry has been calculated. There is a dearth of literature on DFROM asymmetry in the female athlete. As DFROM has been postulated as a predisposing factor to influence lower extremity biomechanics, an understanding of between limb differences in DFROM is required to determine population and task specific asymmetry thresholds for asymmetry. Therefore, the aims of this study were to 1) to determine the effect of sex, leg dominance and LAS history on DFROM, 2) to determine the effect of sex and LAS history on magnitude of DFROM symmetry and 3) to examine the association of sex on direction (whether dominant or non-dominant limb had the higher DFROM) of symmetry
MATERIALS AND METHODS PARTICIPANTS
One hundred and five participants (68 females, 37 females) from recreational multidirectional sports volunteered for the study. All participants self-reported to be physically active and were participating in at least one training session and one match per week. All participants provided written, informed consent in the spirit of the Helsinki Declaration. Prior to testing, all participants completed an injury history questionnaire to assess previous lateral ankle injury on each leg, and leg dominance. Dominant leg was defined as the preferred leg for kicking a ball44 and LAS history was
of Sex and Lateral Ankle Sprain History on Dorsiflexion Range Of Motion Asymmetry During the Wei… International Journal of Sports Physical Therapy
Effect
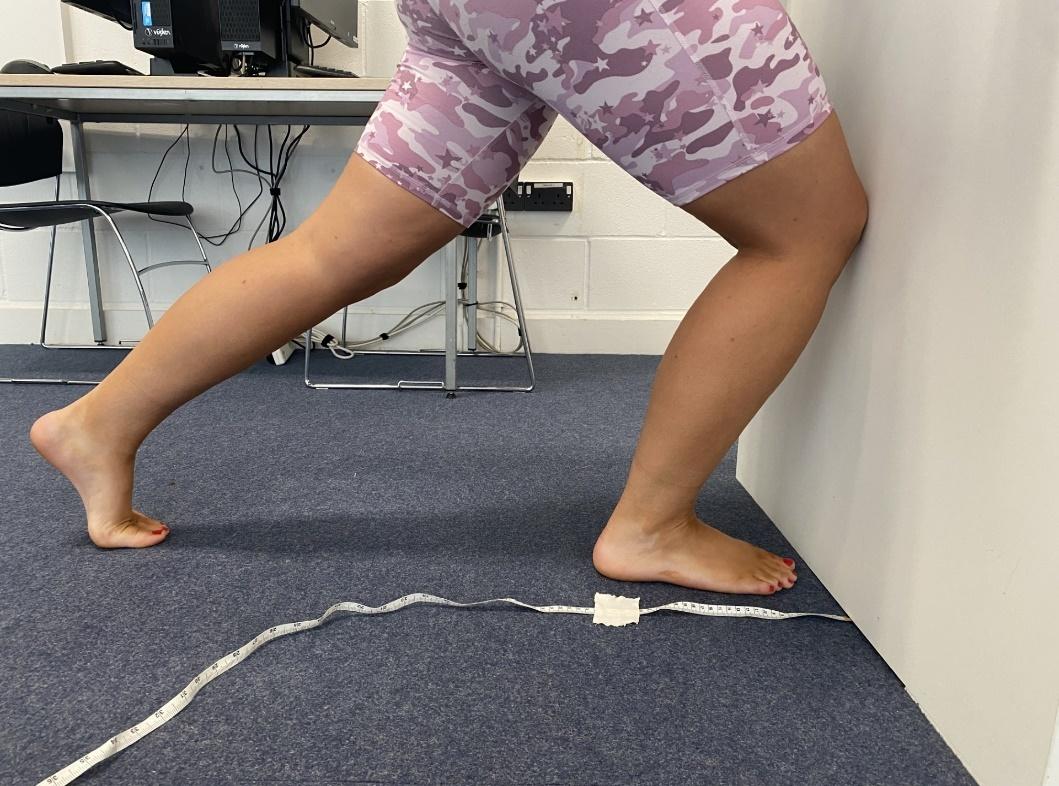
1.
defined as at least one episode of an ankle sprain.45 Participants were excluded if they had a history of lower extremity surgery, any health conditions that may have influenced foot and ankle function, or a previous history of lower extremity injury in the prior six months. The participants were instructed to maintain their regular training regimens but were told not to exercise 48 hours prior to the day of testing. Ethical clearance was obtained by the institutional ethics review panel.
PROCEDURE
DFROM measurements were obtained using the weight bearing lunge test (WBLT) where the back foot (BF) heel was raised off the floor.46 This method has been shown to have excellent intra-rater reliability 46 Participants were instructed to position themselves in a tandem stance position in front of a wall. The big toe and midline of the heel of both feet were maintained perpendicular to the wall and each participant was instructed to keep the BF knee straight during each test position. Their BF heel was raised off the floor so that the participant was on their toes. Participants were asked to place their hands against the wall in front so that their hands were flat, and no gripping was allowed. Measurements were taken using a tape measure (to the nearest 0.1cm) from the big toe to the wall (Figure 1). Once participants were able to maintain the position with the knee touching the wall, the test foot was then progressed away from the wall in 1cm increments until their reach their maximum range of dorsiflexion.38 The examiner ensured that front heel contact was made throughout the testing using manual contact alongside verbal instructions but did not control either pronation or supination of the foot during testing. The BF was maintained in the same position throughout the test. No warmup was performed prior to testing and all testing took place in the same place using the same instruments by the same examiner to standardize testing conditions. The WBLT was completed three times for each leg and the mean of the three measurements was used for analysis. Leg order was randomly selected prior to the testing session.
DATA ANALYSIS
The mean of the three attempts were used for statistical analysis.47 For the first study aim, a three-way mixed ANOVA (IBM SPSS, version 29) was conducted to compare the effects of two between subject variables; lateral ankle sprain history (yes, no) sex (male or female) and a within subject’s variable: leg dominance (dominant or non-dominant) on DFROM. The assumption of normality for the data was checked using the Kolmogorov-Smirnov test with normative data obtained for all DFROM measurements (p>0.05). There was homogeneity of variances for dominant limb (p=0.90) and non-dominant limb (p=0.43) as assessed by the Levene’s test for equality of variances.
To determine interlimb asymmetry the calculation 100/(max value) x (min value) x -1 + 100 was used.48 To determine the direction of asymmetry (which ankle has higher DFROM) an ‘IF function’ was added to the end of the above formula: *IF(dominant <non-dominant,1,-1).49
An asymmetry threshold (AT%) was calculated for DFROM all participants and this was used to determine whether a participant can be considered as having a true asymmetry This threshold was based on the population mean + smallest worthwhile change (SWC) using the calculation AT% = magnitude of asymmetry mean% + (0.2 x SD).50 The SD is the standard deviation of the mean magnitude of asymmetry. A high asymmetry threshold (HAT%) was calculated using population mean + (1.0 x between subject SD) for all participants.50 The assumption of normality for the data was checked for asymmetry data using the Kolmogorov Smirnov test and it was not normally distributed (p<0.05). There was homogeneity of variances as assessed by Levene’s test for equality of variances p=0.19). A two-way ANOVA was conducted to compare sex (male or female) and LAS history (yes or no) on magnitude of asymmetry (%). A Chi Square test of independence was conducted to determine whether there was an association between sex and direction of asymmetry
RESULTS
One hundred and five participants (68 males, 37 females, age:27.8 ± 7.7 y, stature:175.5±9.4 cm, body mass:84.2± 17.4 kg, R dominant: n=92, L dominant: n=13) participated in the study The descriptive statistics for all measurements for both dominant and non-dominant limb are presented in Table 1 Ninety-two (87.6%) participants (57 males, 35 females) reported their right leg to be their dominant leg while 13 (12.4%) participants (11 males, 2 females) reported their left leg to be the dominant leg. Seventy (66.6%) of participants reported a history of LAS in comparison to 35 (33.3%) of participants who reported no history of LAS.
There was no interaction between sex, LAS history, and leg dominance on DFROM (F(1,101) = 0.21, p = 0.65, η2 = 0.00) and no 2-way interactions between sex and leg dominance (p=0.82, η2=0.00), leg dominance and LAS history (p=0.94, η2= 0.00), or sex and LAS history (p=0.33, η2= 0.01). Significant main effects were found for sex (p=0.04, η2=0.43) and LAS history (p=<0.00, η2=0.10). No significant
Figure
WBLT with back foot raised off the floor
Range Of Motion Asymmetry During the Wei… International Journal of Sports Physical Therapy
Effect of Sex and Lateral Ankle Sprain History on Dorsiflexion
Table 1. Mean DFROM measurements by sex, LAS history and leg dominance. Data are reported as mean (+/- SD)
Table 2. Mean interlimb asymmetry values (%) and SD for sex and LAS history.
main effects were found for leg dominance (p=0.66, η2=0.00).
Magnitude of asymmetry values (%) are shown in Table 2 There was no interaction between sex and LAS history on magnitude of asymmetry F(1, 101)= .03, p=0.88, η2=0.00) and no main effects were found for sex (p=0.25, η2=0.00) or LAS history (p=0.82, η2=0.00).
The asymmetry threshold was calculated as 11.8%. Twenty-six (24.7%) males (11 males LAS history, 15 no LAS history) 10 (9.5%) females (7 LAS history, 3 no LAS history) exhibited DFROM asymmetry magnitudes above the AT%. The HAT% was calculated as 25.6%. Twelve (11.4%) of males (6 LAS history, 6 no LAS history) and 3 (2.8%) females (2 LAS history, 1 no LAS history) exhibited asymmetry above the HAT%.
A chi-square test for independence was conducted between sex and direction of asymmetry (positive or negative). There were statistically significant association between sex and whether asymmetry favoured the dominant or non-dominant limb (χ2(1) = 11.26, p = .00). Sixty-fivepoint two percent of males were shown to have higher DFROM in their non-dominant limb compared to 75% of females who were shown to have higher DFROM in their dominant limb.
DISCUSSION
No statistically significant interactions existed between sex, leg dominance and LAS history and DFROM (F(1,101) = 0.21, p = 0.65, η2 = 0.00). Furthermore, there were no significant interactions found for sex and LAS history and DFROM, however, significant main effects were reported
individually for sex (p=0.04, η2=0.43) and LAS history (p=0.00, η2=0.10) on DFROM. As this is the first known study to investigate the effect of sex, LAS history, and leg dominance on DFROM using the WBLT, these results cannot be compared to any previous published findings. The significant main effect of sex suggests that males demonstrated less DFROM (9.82cm) than females (10.91cm). It has been argued that females are shown to exhibit greater range of motion (ROM) due to lower muscle stiffness that allows a higher tolerance of muscle stretch,51 however, the findings from this study contradict Miller et al.29 and Llurda-Almuzara30 who found no significant effect of sex on DFROM in a group of elite level gymnasts and soccer players respectively Differences between the studies could be attributed to the population tested as the athletes in this study were all recreational athletes from a range of multidirectional sports compared to elite athletes from a specific sport. Decreased DFROM has been linked to changes in lower extremity biomechanics which may increase risk of injury of non-contact ACL injuries especially in the female athlete. This study reported a significant difference in DFROM between males and females which may suggest that males may be more at risk of developing lower extremity biomechanics that may predispose them to injury, however, the difference was reported as 1.09cm (males 9.82cm, females 10.91cm) and it is unclear whether this is clinically relevant. More research is required to understand whether sex specific thresholds exist for DFROM, and how they influence lower extremity biomechanics or predispose an athlete to an increased risk of injury
The results of this study indicate a significant main effect of LAS history on DFROM with those athletes with a history of LAS demonstrating less DFROM (LAS history
Sex Participants (n) LAS History (yes, no) DFROM (cm) (Mean ± SD) Male Dominant Non-Dominant 41 27 41 27 Yes No Yes No 8.94 (3.25) 10.38 (3.45) 9.44 (3.23) 10.52 (3.46) Female Dominant Non-Dominant 25 12 25 12 Yes No Yes No 9.86 (3.31) 11.85 (3.09) 9.70 (3.15) 12.21 (2.39)
Sex Participants (n) LAS History Asymmetry (% ±SD) Male 41 27 Yes No 13.5 (18.2) 13.3 (13.7) Female 25 12 Yes No 10.4 (11.8) 9.2 (8.5) Asymmetry Threshold (AT%) 11.8% High Asymmetry Threshold (HAT%) 25.6%
Effect of Sex and Lateral Ankle Sprain History on Dorsiflexion Range Of Motion Asymmetry During the Wei… International Journal of Sports Physical Therapy
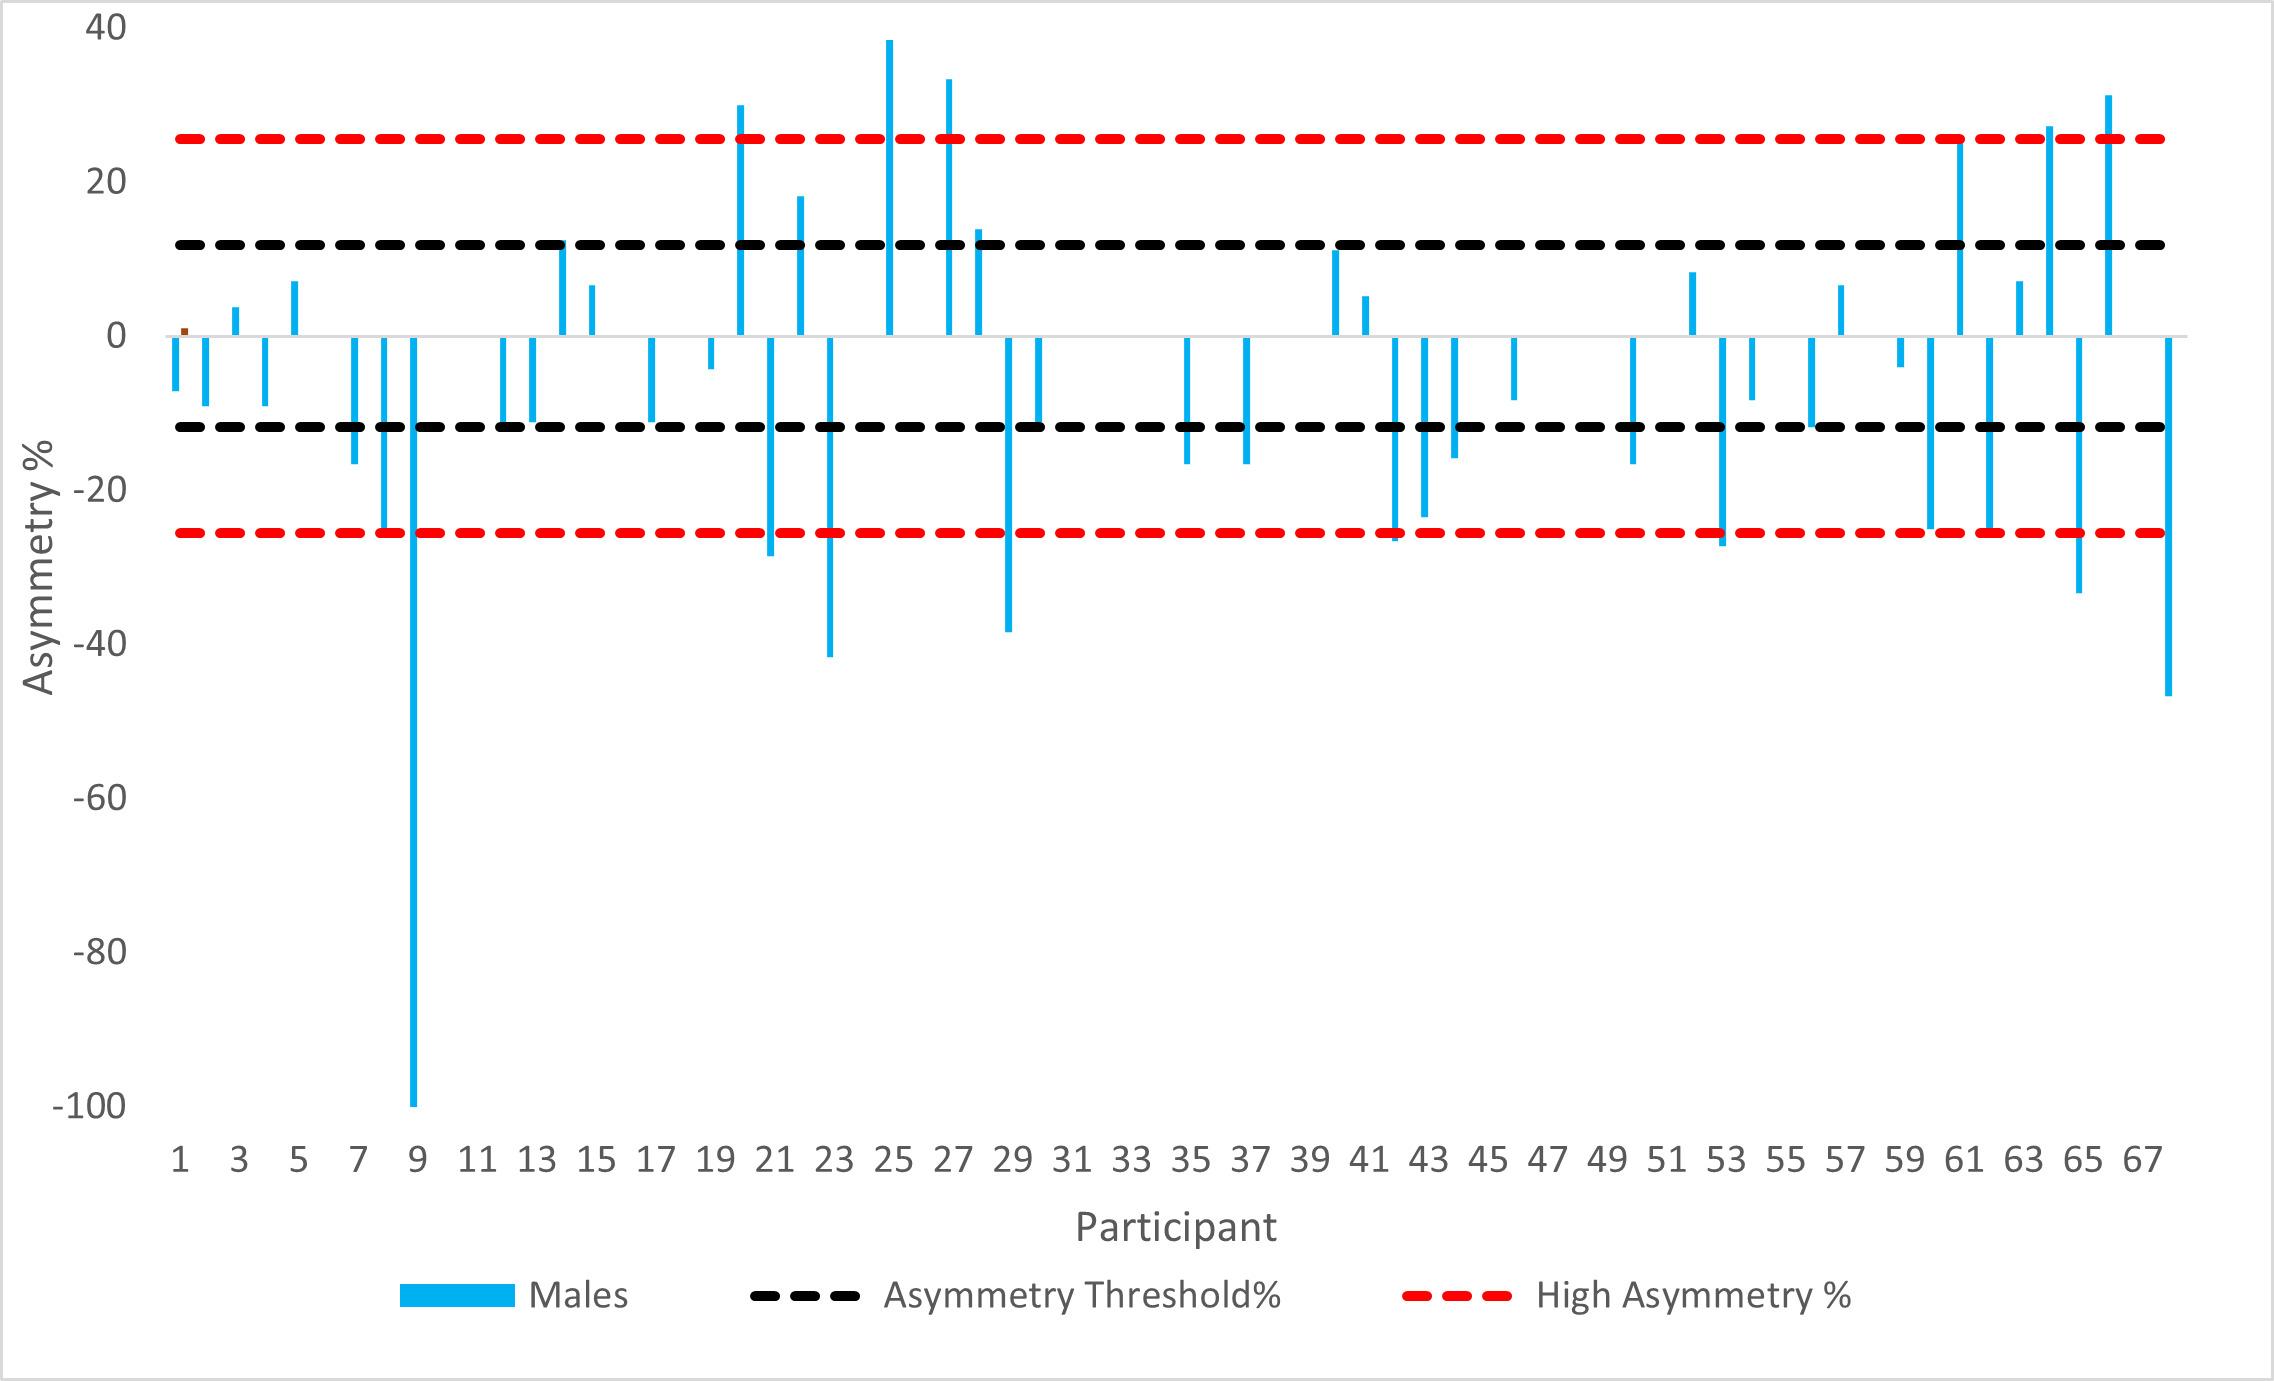
Figure 2. Individual DFROM asymmetry scores for males.
Above 0 indicates asymmetry favours the dominant limb and below 0 indicates that asymmetry favours the non-dominant limb.
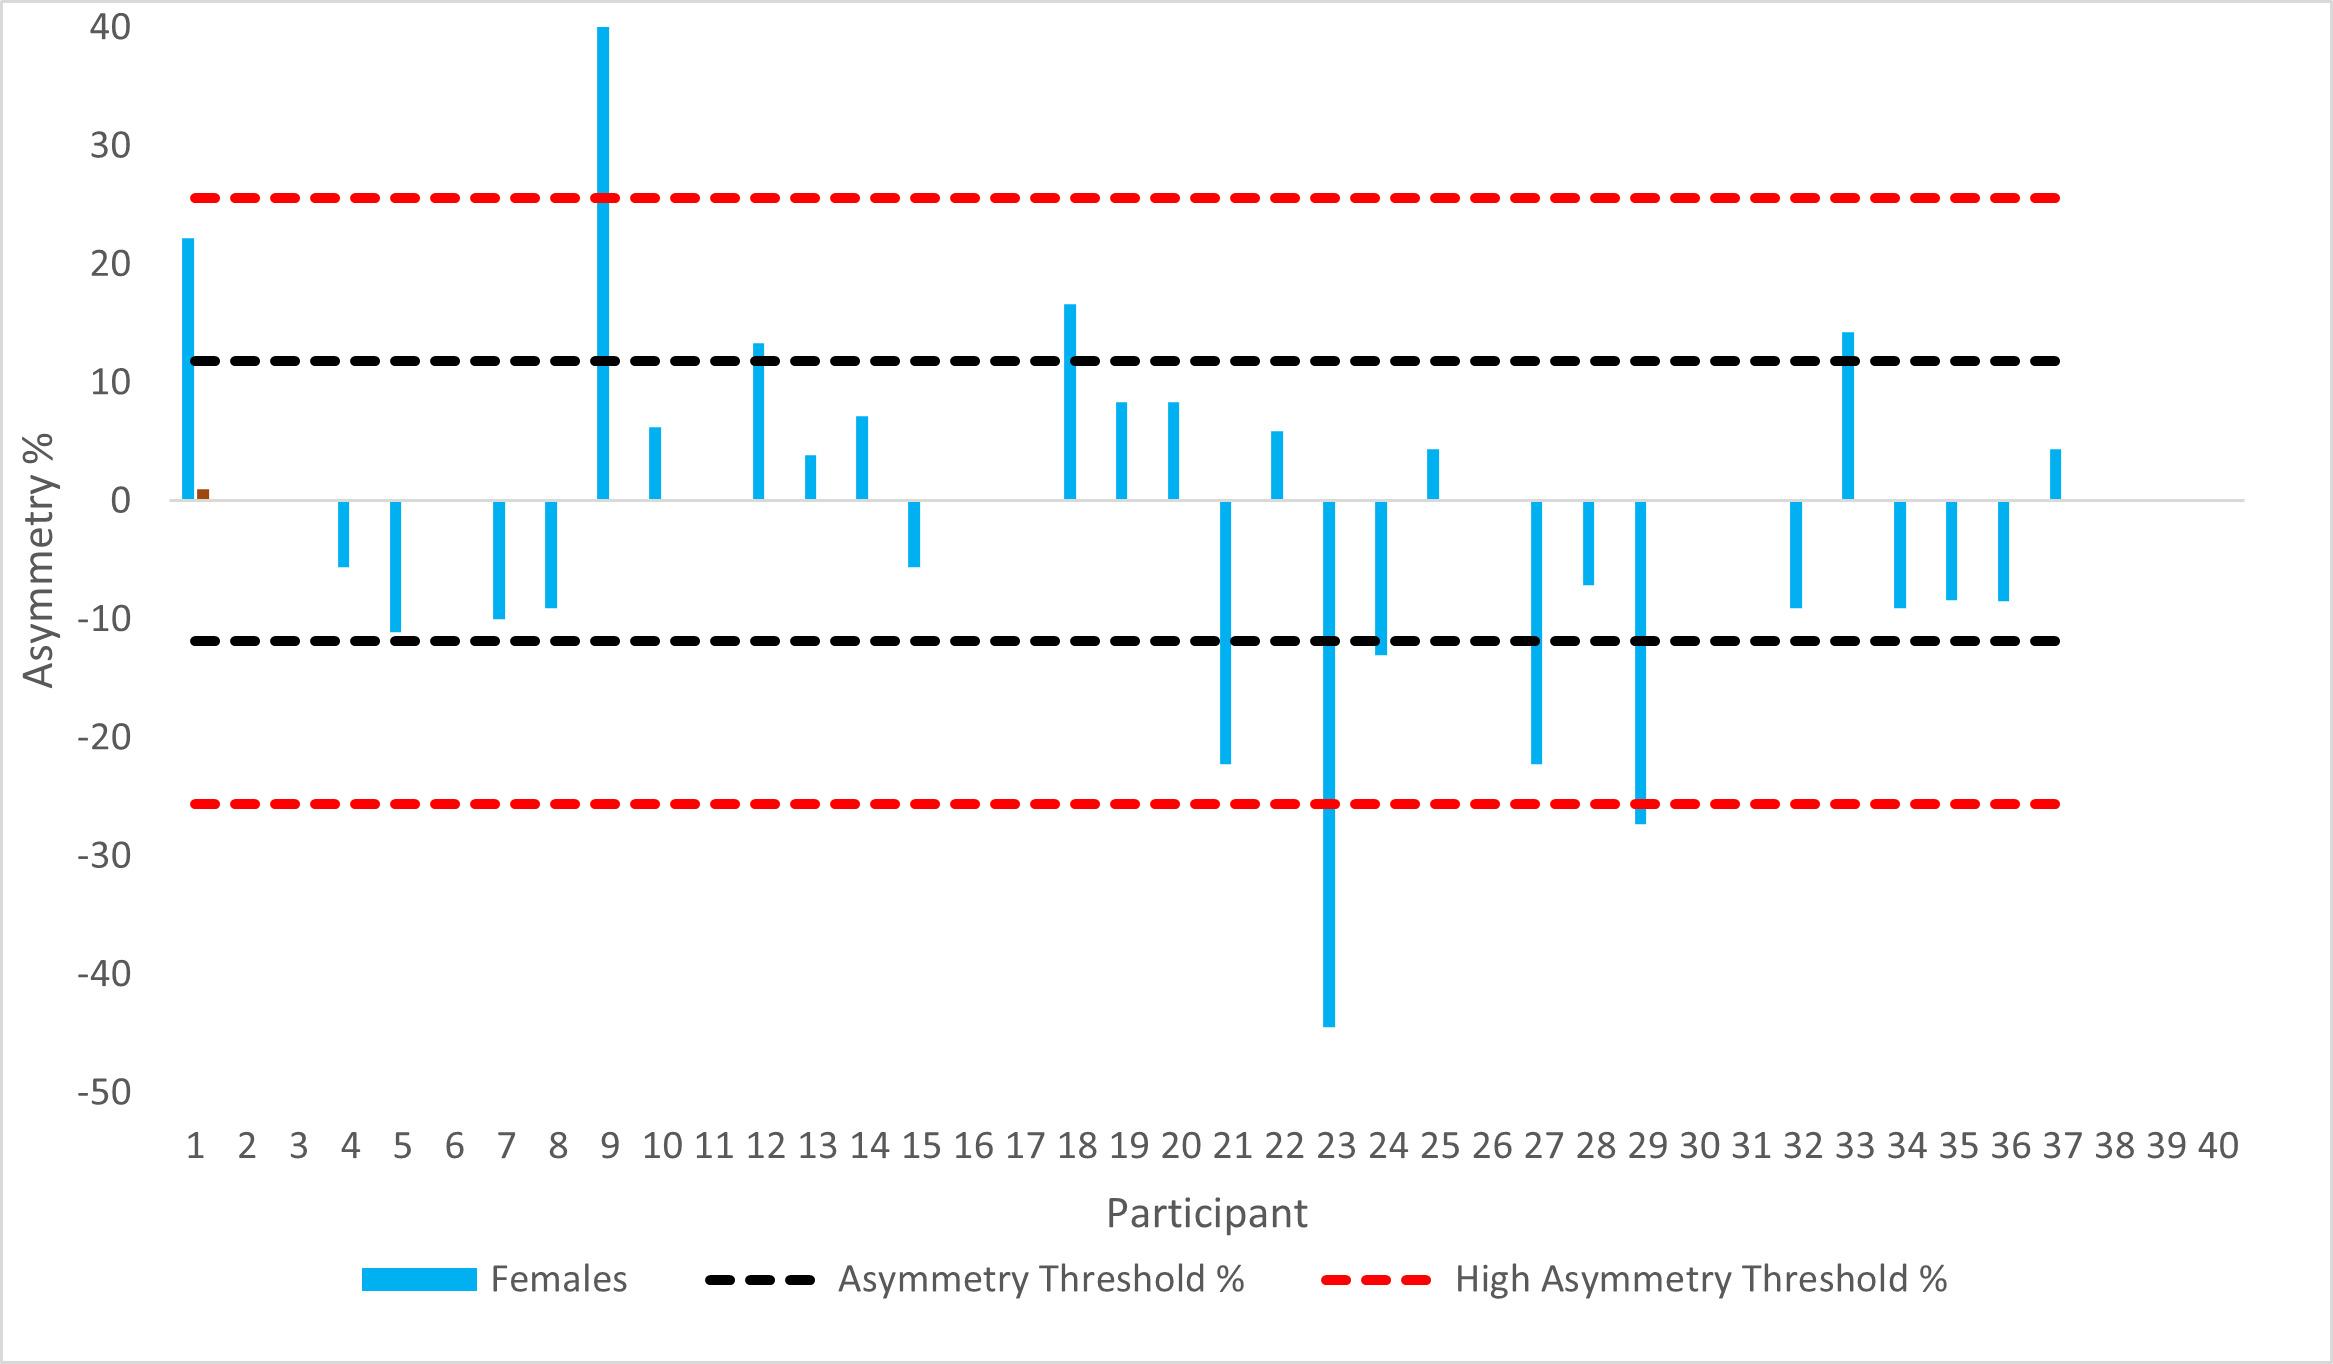
Figure 3. Individual DFROM asymmetry scores for females.
Above 0 indicates asymmetry favours the dominant limb and below 0 indicates that asymmetry favours the non-dominant limb.
9.48cm, no LAS history 11.25cm, p=0.00). This supports findings from Miller et al.29 who reported similar findings in elite level gymnasts. However, Denegar et al.52 found no differences in DFROM in those with LAS history, but DFROM was measured passively in the prone position using an inclinometer which has been shown to be less reliable.
These findings suggest that those with previous LAS history have less DFROM which may predispose them injury. However, there is a need to understand what constitutes decreased DFROM and whether there is a specific DFROM or threshold of loss that may predispose an individual to adverse lower extremity biomechanics.
Effect of Sex and Lateral Ankle Sprain History on Dorsiflexion Range Of Motion Asymmetry During the Wei… International Journal of Sports Physical Therapy
The results of this study indicated that sex or LAS did not affect magnitude of asymmetry for DFROM. The mean magnitude of asymmetry ranged from 13.3%-13.5% in males and 9.2% -10.4% in females (males: LAS history: 13.6%±18.2%, No LAS history: 13.3%±13.7%; Females: LAS history: 10.4%±11.9%; No LAS history: 9.2%±8.6%). Magnitude of asymmetry values reported in this study are much higher compared to Madruga–Parera et al.53 who reported asymmetry of 5.88% ± 3.42 and Gonzalo Skok et al25 who reported asymmetry 9.6% in fifteen youth elite male basketball players, however they are consistent with findings from Arede et al.40 and Işın et al.41 who reported magnitude of asymmetries over 10% in semi-professional male soccer players. Large SDs have been reported in this study which indicates a large inter-individual variation however, this is a common finding in most asymmetry related research and may explain why relationships between asymmetry and performance are often insignificant.54 The AT% for this study population of recreational athletes was calculated as 11.8%. Of the 105 athletes tested 28 (41.17%) of the males (16.17% LAS history and 22.05% no LAS history) and 13 (35.13%) of the females (27.02% LAS history and 8.10% no LAS history) exhibited DFROM asymmetries which exceeded the AT%. Furthermore, 12 (17.6%) males and only 3 (8.1%) females exhibited asymmetry values above HAT%. This suggests that symmetries are present in males and females and supports findings from Hoch and McKeon,38 Rabin et al.,39 Howe et al.,42 and Arede et al.40 who all reported differences in DFROM between dominant and non-dominant limbs in healthy populations. Therefore, clinicians should exercise caution when using bilateral comparisons during injury assessment. However, in the current study true asymmetries (above the AT% for that population) were only seen in 41.17% of males and 35.13% of females and high asymmetry in 17.6% of males and 8.1% of females. It is important to recognise that these values are only specific to this population for this specific testing period and should not be used as a threshold for other studies as asymmetry has been shown to be metric, population, and test specific.52 Furthermore, it is not known how DFROM asymmetry influences lower extremity biomechanics and more research is needed in this area.
An interesting finding of the current study is that there was a significant association between sex and direction of asymmetry (χ2(1) = 11.26, p = 0.00). Sixty-five-point two percent of males were shown to have higher DFROM in their non-dominant limb compared to 75% of females who were more likely to have higher ROM in their dominant limb. It has been argued that athletes should have greater DFROM in their non-dominant (stance) limb as this limb needs to provide stability and balance when cutting and landing which is needed in sports requiring frequent change of direction,40 but this needs to be explored further It is not known how direction and magnitude of asymmetry affects lower extremity biomechanics during specific activities as previous research has only investigated performance measures.53 Females have been shown to favour one limb
more than another (leg dominance) in sports compared to males who have been shown to have less reliance on one limb which may predispose them to injury risk,2 and several studies have found that females are a higher risk of injury of injuring their non-dominant limb which suggests that leg dominance is a factor.26‑28
This study is not without its limitations, although a large sample size was used for this study (n=105), the athletes used were from a variety of different university and recreational level multidirectional sports which required changes of direction and athletes were participating at different levels. Previous research54‑57 shows that asymmetry differs depending on both sport, level, task, and population studied and therefore it is not known whether these sex differences would be seen if the tested on one sport and from athletes participating at the same level. Furthermore, the data from this study was collected during one single data collection point and caution must be taken when interpreting this data as both magnitude and direction has been shown to vary considerably across several testing sessions. This study also did not measure the effect of DFROM asymmetry on a specific performance variable and so it is not known how asymmetries may influence a variety of difference sports specific activities.
CONCLUSION
The results of this study indicate no significant interaction between sex, leg dominance and LAS history on DFROM in university and recreational level athletes from a range of multidirectional sports. However, females were had significantly higher DFROM values compared to males. Furthermore, those with LAS history had less DFROM compared to those without. This study reported interlimb asymmetry, however this was not affected by sex or LAS history There was a difference in association of sex on direction of asymmetry as females were shown to have direction in favor of their dominant limb compared to males which favored the non-dominant limb. Caution should be exercised in interpreting these results as thresholds for asymmetry are metric, population, and test specific. Future research would be useful to determine the sex differences in magnitude and direction of asymmetry in DFROM while performing specific sports specific maneuvers. Further investigations of sex differences in the magnitude and direction of asymmetry on lower extremity biomechanics may help inform sex specific rehabilitation and prevention strategies.
CONFLICT OF INTEREST
The authors report no conflict of interest.
Submitted: November 09, 2023 CDT, Accepted: April 24, 2024 CDT
© The Author(s)
of Sex and Lateral Ankle Sprain History on Dorsiflexion Range Of Motion Asymmetry During the Wei… International Journal of Sports Physical Therapy
Effect
This is an open-access article distributed under the terms of the Creative Commons Attribution 4.0 International License (CCBY-NC-4.0). View this license’s legal deed at https://creativecommons.org/licenses/by-nc/4.0 and legal code at https://creativecommons.org/licenses/by-nc/4.0/legalcode for more information.
of Sex and Lateral Ankle Sprain History on Dorsiflexion Range Of Motion Asymmetry During the Wei… International Journal of Sports Physical Therapy
Effect
REFERENCES
1. Boling M, Padua D, Marshall S, Guskiewicz K, Pyne S, Beutler A. Gender differences in the incidence and prevalence of patellofemoral pain syndrome. Scand J Med Sci Sports 2010;20(5):725-730. doi:10.1111/ j.1600-0838.2009.00996.x
2. Hewett TE, Myer GD, Ford KR. Anterior cruciate ligament injuries in female athletes: Part 1, mechanisms and risk factors. Am J Sports Med 2006;34(2):299-311. doi:10.1177/0363546505284183
3. Hewett TE, Ford KR, Hoogenboom BJ, Myer GD Understanding and preventing ACL injuries current biomechanical and epidemiologic considerationsupdate 2010. N Am J Sports Phys Ther 2010;5(4):234-251.
4. Hewett TE, Myer GD, Ford KR, et al. Biomechanical measures of neuromuscular control and valgus loading of the knee predict anterior cruciate ligament injury risk in female athletes: a prospective study. Am J Sports Med 2005;33(4):492-501. doi:10.1177/ 0363546504269591
5. Quatman CE, Hewett TE. The anterior cruciate ligament injury controversy: is “valgus collapse” a sex-specific mechanism? Br J Sports Med 2009;43(5):328-335. doi:10.1136/bjsm.2009.059139
6. Weinhandl JT, Irmischer BS, Sievert ZA. Sex differences in unilateral landing mechanics from absolute and relative heights. Knee. 2015;22(4):298-303. doi:10.1016/j.knee.2015.03.012
7 Wang IL, Wang SY, Wang LI. Sex differences in lower extremity stiffness and kinematics alterations during double-legged drop landings with changes in drop height. Sports Biomech 2015;14(4):404-412. doi:10.1080/14763141.2015.1062129
8. Pollard CD, Sigward SM, Powers CM. Gender differences in hip joint kinematics and kinetics during side-step sutting maneuver Clin J Sport Med 2007;17:38-42. doi:10.1097/JSM.0b013e3180305de8
9. Montalvo AM, Schneider DK, Yut L, et al. What’s my risk of sustaining an ACL injury while playing sports? A systematic review with meta-analysis. Br J Sports Med 2019;53(16):1003-1012. doi:10.1136/ bjsports-2016-096274
10. Cashman GE. The effect of weak hip abductors or external rotators on knee valgus kinematics in healthy subjects: A Systematic Review J Sport Rehab 2012;21:273-284. doi:10.1123/jsr.21.3.273
11. Alzahrani AM, Alzhrani M, Alshahrani SN, Alghamdi W, Alqahtani M, Alzahrani H. Is hip muscle strength associated with dynamic knee valgus in a healthy adult population? A systematic review Int J Environ Res Public Health 2021;18(14). doi:10.3390/ ijerph18147669
12. Rinaldi VG, Prill R, Jahnke S, Zaffagnini S, Becker R. The influence of gluteal muscle strength deficits on dynamic knee valgus: a scoping review. J Exp Orthop 2022;9(1):81. doi:10.1186/ s40634-022-00513-8
13. Wyndow N, De Jong A, Rial K, et al. The relationship of foot and ankle mobility to the frontal plane projection angle in asymptomatic adults. J Foot Ankle Res. 2016;9:3. doi:10.1186/s13047-016-0134-9
14. Wilczynski B, Zorena K, Slezak D Dynamic knee valgus in single-leg movement tasks. Potentially modifiable factors and exercise training options. A literature review Int J Environ Res Public Health 2020;17(21). doi:10.3390/ijerph17218208
15. Wahlstedt C, Rasmussen-Barr E. Anterior cruciate ligament injury and ankle dorsiflexion. Knee Surg Sports Traumatol Arthrosc 2015;23(11):3202-3207 doi:10.1007/s00167-014-3123-1
16. Taylor JB, Wright ES, Waxman JP, Schmitz RJ, Groves JD, Shultz SJ. Ankle dorsiflexion affects hip and knee biomechanics during landing. Sports Health. 2021:19417381211019683. doi:10.1177/ 19417381211019683
17 Stanley LE, Harkey M, Luc-Harkey B, et al. Ankle Dorsiflexion displacement is associated with hip and knee kinematics in females following anterior cruciate ligament reconstruction. Res Sports Med. 2019;27(1):21-33. doi:10.1080/ 15438627.2018.1502180
18. Rabin A, Einstein O, Kozol Z. The association of visually-assessed quality of movement during jumplanding with ankle dorsiflexion range-of-motion and hip abductor muscle strength among healthy female athletes. Phys Ther Sport. 2018;31:35-41. doi:10.1016/ j.ptsp.2018.01.004
19. Lima YL, Ferreira V, de Paula Lima PO, Bezerra MA, de Oliveira RR, Almeida GPL. The association of ankle dorsiflexion and dynamic knee valgus: A systematic review and meta-analysis. Phys Ther Sport. 2018;29:61-69. doi:10.1016/j.ptsp.2017.07.003
of Sex and Lateral Ankle Sprain History on Dorsiflexion Range Of Motion Asymmetry During the Wei… International Journal of Sports Physical Therapy
Effect
20. Jamaludin NI, Sahabuddin FNA, Raja Ahmad Najib RKM, Shamshul Bahari MLH, Shaharudin S. Bottom-Up Kinetic Chain in Drop Landing among University Athletes with Normal Dynamic Knee Valgus. Int J Environ Res Public Health 2020;17(12). doi:10.3390/ijerph17124418
21. Dill KE, Begalle RL, Frank BS, Zinder SM, Padua DA. Altered knee and ankle kinematics during squatting in those with limited weight-bearing-lunge ankle-dorsiflexion range of motion. J Athl Train. 2014;49(6):723-732. doi:10.4085/1062-6050-49.3.29
22. Crowe MA, Bampouras TM, Walker-small K, Howe LP Restricted unilateral ankle dorsiflexion movement increases interlimb vertical force asymmetries in bilateral bodyweight squatting. J Strength Cond Res 2020;34(2):332-336. doi:10.1519/ JSC.0000000000003345
23. Fong C, Blackburn JT, Norcross MF, McGrath M, Padua D Ankle-dorsiflexion range of motion and landing biomechanics. J Athl Train. 2011;46(1):5-10. doi:10.4085/1062-6050-46.1.5
24. Hoch MC, Farwell KE, Gaven SL, Weinhandl JT Weight-bearing dorsiflexion range of motion and landing biomechanics in individuals with chronic ankle instability J Athl Train 2015;50(8):833-839. doi:10.4085/1062-6050-50.5.07
25. Gonzalo-skok O, Serna J, Rhea MR, Marin PJ. Relationships between functional movement tests and performance tests in young elite male basketball players. Int J Sports Phys Ther 2015;10(5):628-638.
26. Negrete RJ, Schick EA, Cooper JP Lower limb dominance as a possible etiologic factor in noncontact anterior cruciate ligament tears. J Strength Cond Res 2007;21(1):270-273. doi:10.1519/ 00124278-200702000-00048
27 Brophy RH, Silvers HJ, Gonzales T, Mandelbaum BR. Gender influences: the role of leg dominance in ACL injury among soccer players. Br J Sports Med. 2010;44(10):694-697 doi:10.1136/bjsm.2008.051243
28. Ruedl G, Webhofer M, Helle K, et al. Leg dominance is a risk factor for noncontact anterior cruciate ligament injuries in female recreational skiers. Am J Sports Med 2012;40(6):1269-1273. doi:10.1177/0363546512439027
29. Miller H, Fawcett L, Rushton A. Does gender and ankle injury history affect weightbearing dorsiflexion in elite artistic gymnasts? Phys Ther Sport. 2020;42:46-52. doi:10.1016/j.ptsp.2019.12.003
30. Llurda-Almuzara L, Perez-Bellmunt A, LabataLezaun N, Lopez-de-Celis C, Moran J, Clark NC. Sex differences in pre-season anthropometric, balance and range-of-motion characteristics in elite youth soccer players. Healthcare 2022;10(5). doi:10.3390/ healthcare10050819
31. Onate JA, Starkel C, Clifton DR, et al. Normative Functional Performance Values in High School Athletes: The functional pre-participation evaluation project. J Athl Train. 2018;53(1):35-42. doi:10.4085/ 1062-6050-458.16
32. Senanayake S, Premakumara T, Kodagoda P, Jayasekara H. Influence of weight bearing dorsiflexion (WBDF) on ankle injury history among semiprofessional recreational basketball players. Adv J Grad Res. 2021;11(1):45-51. doi:10.21467/ ajgr.11.1.45-51
33. Grindem H, Snyder-Mackler L, Moksnes H, Engebretsen L, Risberg MA. Simple decision rules can reduce reinjury risk by 84% after ACL reconstruction: the Delaware-Oslo ACL cohort study Br J Sports Med 2016;50(13):804-808. doi:10.1136/ bjsports-2016-096031
34. Kyritsis P, Bahr R, Landreau P, Miladi R, Witvrouw E. Likelihood of ACL graft rupture: not meeting six clinical discharge criteria before return to sport is associated with a four times greater risk of rupture. Br J Sports Med. 2016;50(15):952. doi:10.1136/ bjsports-2016-096410
35. Helme M, Tee J, Emmonds S, Low C. Does lowerlimb asymmetry increase injury risk in sport? A systematic review. Phys Ther Sport. 2021;49:204-213. doi:10.1016/j.ptsp.2021.03.001
36. Bishop C. Interlimb Asymmetries: Are thresholds a usable concept? Strength Cond J. 2020;0(0):1-5. doi:10.1519/SSC.0000000000000554
37 Helme M, Bishop C, Emmonds S, Low C. Validity and reliability of the rear foot elevated split squat 5 repetition maximum to determine unilateral leg strength symmetry J Strength Cond Res 2019;33(12):3269-3275. doi:10.1519/ JSC.0000000000003378
38. Hoch MC, McKeon PO Normative range of weight-bearing lunge test performance asymmetry in healthy adults. Man Ther 2011;16(5):516-519. doi:10.1016/j.math.2011.02.012
39. Rabin A, Kozol Z, Spitzer E, Finestone AS. Weight-bearing ankle dorsiflexion range of motioncan side-to-side symmetry be assumed? J Athl Train 2015;50(1):30-35. doi:10.4085/1062-6050-49.3.40
of Sex and Lateral Ankle Sprain History on Dorsiflexion Range Of Motion Asymmetry During the Wei… International Journal of Sports Physical Therapy
Effect
40. Arede J, Fernandes JFT, Singh H, Bishop C, Romero-Rodriguez D, Madruga Parera M. Assessing asymmetries and predicting performance in semiprofessional soccer players. Int J Sports Sci Coach Published online 2023. doi:10.1177/ 17479541221146220
41. Işın A, Akdağ E, Özdoğan EÇ, Bishop C. Associations between differing magnitudes of interlimb asymmetry and linear and change of direction speed performance in male youth soccer players. Biomed Hum Kinet 2022;14(1):67-74. doi:10.2478/ bhk-2022-0009
42. Howe LP, Bampouras TM, North JS, Waldron M. Within-session reliability for inter-limb asymmetries in ankle dorsiflexion range of motion measured during the weight-bearing lunge test. Int J Sports Phys Ther 2020;15(1):64-73. doi:10.26603/ijspt20200064
43. Konor MM, Morton S, Eckerson JM, Grindstaff TL. Reliability of three different measurements of ankle dorsiflexion. Int J Sports Phys Ther. 2012;7(3):279-287
44. Thorborg K, Couppe C, Petersen J, Magnusson SP, Holmich P. Eccentric hip adduction and abduction strength in elite soccer players and matched controls: a cross-sectional study Br J Sports Med 2011;45(1):10-13. doi:10.1136/bjsm.2009.061762
45. Meyer JE, Rivera MJ, Powden CJ. The evaluation of joint mobilization dosage on ankle range of motion in individuals with decreased dorsiflexion and a history of ankle sprain. J Sport Rehab 2020;30(3):347-352. doi:10.1123/jsr.2020-0114
46. Cady K, De Ste Croix M, Deighan M. Back foot influence on dorsiflexion using three different positions of the weight bearing lunge test. Phys Ther Sport. 2020;47:1-6. doi:10.1016/j.ptsp.2020.10.005
47 Bennell K, Talbot R, Wajswelner H, Techovanich W, Kelly D, Hall AJ. Intra-rater and inter-rater reliability of a weight-bearing lunge measure of ankle dorsiflexion. Aust J Physiother 1998;44(3):175-180. doi:10.1016/s0004-9514(14)60377-9
48. Bishop C, Read P, Lake J, Chavda S, Turner A. Interlimb asymmetries:Understanding how to calculate differences rrom bilateral and unilateral tests. Strength Cond J. 2018;40(4):1-6. doi:10.1519/ JSC.0000000000002729
49. Bishop C, Read P, Chavda S, Jarvis P, Turner A. Using unilateral strength, power and reactive strength tests to detect the magnitude and direction of asymmetry: A test-retest design. Sports. 2019;7(3). doi:10.3390/sports7030058
50. Dos’Santos T, Thomas C, Jonea PA. Assessing interlimb asymmetries: Are we heading in the right direction? Strength Cond J. 2021;43(3):91-100. doi:10.1519/SSC.0000000000000590
51. Braz M, Souto Maior A. Functional performance of ankles between male and female practitioners of resistance exercise. Muscl Ligament Tendon J 2021;11(04). doi:10.32098/mltj.04.2021.13
52. Bishop C, Lake J, Loturco I, Papadopoulos K, Turner A, Read P Interlimb asymmetries: The need for an individual approach to data analysis. J Strength Cond Res. 2018:1-7. doi:10.1519/ JSC.0000000000002729
53. Hewit JK, Cronin JB, Hume PA. Multidirectional leg asymmetry assessment in sport. Strength Cond J. 2012;34(1):82-86. doi:10.1519/ SSC.0b013e31823e83db
54. Bishop C, Weldon A, Hughes G, et al. Seasonal variation of physical performance and inter-limb asymmetry in professional cricket Athletes. J Strength Cond Res. 2021;35(4):941-948. doi:10.1519/ JSC.0000000000003927
55. Bishop C, Read P, shyam C, et al. Magnitude or direction? Seasonal variation of interlimb asymmetry in elite academy soccer players. J Strength Cond Res 2022;36(4):1031-1037 doi:10.1519/ JSC.0000000000003565
56. Bishop C, Turner A, Gonzalo-skok O, Read P. Inter-limb asymmetry during rehabilitation. Understanding formulas and monitoring the magnitude and direction. Aspetar Sports Med J 2021;9:19-22.
57 Madruga-Parera M, Romero-Rodriguez D, Bishop C, et al. Effects of maturation on lower limb neuromuscular asymmetries in elite youth tennis players. Sports. 2019;7(5). doi:10.3390/sports7050106
Effect of Sex and Lateral Ankle Sprain History on Dorsiflexion Range Of Motion Asymmetry During the Wei… International Journal of Sports Physical Therapy
Periscapular Strength Profile Changes in Collegiate Baseball Pitchers Over the Course of a Season
Patrick S Pabian1a , Victoria Roach2 , Roselin Howard2 , Lauren Johnston2 , Ryan McGuire1
1 Department of Physical Therapy, University of Kentucky, 2 Division of Physical Therapy, University of Central Florida
Keywords: scapular strength, rotator cuff strength, baseball https://doi.org/10.26603/001c.117398
International Journal of Sports Physical Therapy
Background
Repetitive application of high forces to the shoulder and scapular musculature during the pitching motion over the course of a collegiate baseball season may lead to changes in strength and increased fatigue, potentially predisposing pitching athletes to injury. The purpose of this study was to investigate periscapular strength profiles of Division I collegiate baseball players over the course of a season.
Methods
This study was a retrospective data analysis of 18 Division I baseball pitchers. Isometric scapular plane abduction (scaption), external rotator, internal rotator, middle trapezius, and lower trapezius isometric strength was measured on throwing arm of each subject using a MicroFET 2 handheld dynamometer Data were collected in a single session at the preseason, midseason, and postseason of the college baseball season, which spanned a five-month period. A repeated measures ANOVA was utilized to determine if there was a significant change in periscapular strength across the baseball season.
Results
Over the three time-points, all strength values decreased for each muscle group, with decreases ranging from 3-14%. Changes in scaption strength values were statistically significant (p=0.018, partial eta squared =0.284) with an 8% reduction over the entire season, specifically with a 5% decline from mid-season to post-season. While external rotator, internal rotator, middle trapezius, and lower trapezius strength values all decreased over the course of the season (range 0.02kg to 1.8kg), these differences were not statistically significant. However, the middle trapezius strength value change (1.3kg loss) exceeded the minimal detectible change.
Conclusion
Periscapular muscles in baseball pitchers diminish in strength over the course of a collegiate baseball season. Understanding strength changes over the course of a season may influence training and therapeutic interventions.
Level of Evidence
3b
Corresponding author:
Patrick.pabian@uky.edu a
Patrick S. Pabian PT, DPT, PhD, SCS, OCS University of Kentucky
Department of Physical Therapy 900 S Limestone St. Lexington, KY 40515
Original Research
Strength Profile Changes in Collegiate Baseball Pitchers Over the Course of a Season. IJSPT. Published online June 1, 2024:724-734. doi:10.26603/001c.117398
Pabian PS, Roach V, Howard R, Johnston L, McGuire R. Periscapular
INTRODUCTION
The baseball pitching motion is a complex and repetitive movement that requires a combination of precision and high velocity, where shoulder peak angular velocities can reach up to 7000°/sec.1‑6 This velocity leads to several substantial forces acting on the shoulder including distraction forces of up to 950 N at ball release and compression forces of up to 1090 N.4 Additionally, shear forces of 310 N and 250 N can occur at the anterior and superior glenohumeral joint surfaces respectively.4 The rotator cuff is highly involved in the generation, control, and dissipation of these forces. In addition, scapular muscles are highly active during the arm cocking, acceleration and deceleration phases due to their role in scapular and glenoid positioning during the dynamic and rapid arm motion of throwing.7 Given the repetitive application of these forces to the shoulder and scapular musculature over the course of a collegiate baseball season, there is potential for changes in shoulder and scapular strength during the season.
Weakness in the shoulder musculature, specifically the rotator cuff, has been proposed as a risk factor for developing a shoulder injury in baseball pitchers.8‑12 Several authors have reported that more than 57% of baseball pitchers suffer a shoulder injury during a playing season, including but not limited to rotator cuff tears and/or tendinitis, glenohumeral labral degenerations and tears, secondary subacromial impingement syndrome (SIS), as well as microtrauma to both the static and dynamic stabilizers of the shoulder and elbow 9,13,14 Of further concern is that currently there is no consensus on an optimal in season program for mitigation of strength loss. Therefore, understanding the temporal shoulder and scapular strength characteristics of pitchers can assist in the guidance of targeted treatment strategies and rehabilitation protocols.
To this end, muscle strength profiles of the rotator cuff and scapular musculature in asymptomatic high school, collegiate, and professional pitchers at singular points in time have been established.9‑11,15‑21 This information has helped guide general interventions aimed at addressing shoulder and scapular muscle weakness, improving performance, and mitigating injury risk. Further research has detailed the changes in shoulder muscle strength profiles after acute bouts of single session throwing in collegiate level pitchers. Gagnon et al.22 found no changes in external and internal rotation strength while Mirabito et al.23 found a reduction in external rotation strength. Mullaney et al.19 found minimal changes in scapular stabilizer strength and a gross reduction in shoulder strength with the exception of external rotation and strength in the empty can testing position. Strength profiles of high school and professional pitchers have also been established at preseason to preseason time points which illustrate that pitchers often enter a season with supraspinatus and external rotation weakness that is associated with an increased risk of injury to the shoulder 8,24 Further, Trakis et al.11 found that asymptomatic adolescent pitchers with a history of shoulder pain in the prior season had decreased middle trapezius strength compared to pitchers without a history of pain.
However, limited evidence exists on changes of both shoulder and scapular strength profiles during the course of a season in asymptomatic Division I collegiate baseball pitchers. Studies by McHugh et al.25 and Whitley et al.26 examined shoulder muscle strength changes from preseason to post-season in asymptomatic high school pitchers, with McHugh et al. including interscapular muscle strength assessment. Wilkin et al.27 examined isokinetic concentric shoulder rotator muscle changes, but not scapular muscle changes, in asymptomatic Division II collegiate pitchers at preseason, mid-season, and post-season. And finally, Sumimoto et al.28 examined preseason, mid-season and postseason scapular and shoulder strength changes in asymptomatic professional pitchers. Understanding strength profile changes at different levels of competition is important given the variation in pitching demands at each level. Fleisig et al.29 found that joint forces, torques and velocity specific measures increased at each progressive level of competition without position or temporal changes, suggesting kinetic differences were most likely due to greater muscle strength at each higher level.
Therefore, the purpose of this study was to investigate periscapular strength profiles of Division I collegiate baseball players over the course of a season. This study may assist in understanding normal strength profiles and muscular attrition over the course of a season in D1 collegiate pitchers and help guide rehabilitation professionals with targeted interventions to address anticipated loss of strength in specific muscles during specific in season timeframes. The authors hypothesized that shoulder scaption, internal rotation, external rotation, middle trapezius, and lower trapezius isometric strength values would decrease over the course of a season.
METHODS
STUDY DESIGN
This study was a retrospective analysis of existing data that was used in a sports science initiative for injury monitoring and establishing baseline for injuries. Institutional review board approval for this study was obtained by the University of Central Florida.
PARTICIPANTS
The data from eighteen Division I male baseball pitchers was used in this study. Each subject was assessed for scaption, external rotator, internal rotator, middle trapezius and lower trapezius isometric strength on their throwing arm.
ASSESSMENT OF PERISCAPULAR STRENGTH
Muscular strength measurements were taken using the MicroFET 2 Wireless Handheld Dynamometer. The system is compact, portable and can measure up to 300 pounds (approximately 136 kilograms) of force. The intraclass correlation coefficient for the MicroFET 2 was measured in a previous study that examined the reliability of using the MicroFET 2 to measure the strength of the internal and ex-
Periscapular Strength Profile Changes in Collegiate Baseball Pitchers Over the Course of a Season International Journal of Sports Physical Therapy
ternal rotators of the shoulder in adolescent swimmers.30 The authors reported an ICC of more than 0.90 and a low percentage of method error variation, concluding that the MicroFET 2 was a reliable measure of internal and external rotation strength in swimmers.30 Furthermore, MicroFET 2 ICCs of .94 for external rotation and .93 for internal rotation have been reported in the measurement of shoulder rotator strength in competitive high school and collegiate baseball athletes.31,32
DATA COLLECTION PROCEDURES
The data for each subject was recorded at three time points throughout the baseball season. Data collection sessions transpired on a single day during the pre-season, mid-season and immediately post-season, with a total duration of collection being a five-month period. Three trials of each strength measure were taken at each session by the same rater who is a board-certified clinical specialist in sports, with experience in use of the hand-held dynamometer An average strength measurement for each position was calculated. Strength measures in kilograms were recorded for five different muscle groups: shoulder scaption, shoulder external rotators, shoulder internal rotators, middle trapezius, and the lower trapezius. Each test consisted of the subject contracting against a maximal force applied by the tester The maximal force was applied until the participant broke from the test position.33 The force required to break the test position was recorded as the relative strength of the muscle group being measured. Prior studies assessing shoulder and scapular muscle strength in collegiate and professional baseball players have utilized a break test,19,31, 34 which has also been shown to be correlated to the forces produced during make tests.35
Shoulder internal and external rotator strength was measured with the participant prone with their shoulder abducted to 90 degrees and their elbow flexed to 90 degrees. Positioning the patients in prone with the arm abducted to 90 degrees replicates the functional throwing position of the glenohumeral joint and has been utilized in several studies involving high school, collegiate, and professional baseball pitchers and players.8,36,37
For internal rotator strength assessment, the digital dynamometer was placed on the volar aspect of the distal forearm and the test was performed. (Figure 1)
For external rotator strength assessment, the digital dynamometer was placed on the dorsal aspect of the distal forearm and the test was performed. (Figure 2)
Scaption strength was measured with the participant in standing, with their arm flexed to 90 degrees and horizontally abducted to be in line with the scapular plane. The digital dynamometer was placed over the distal radius with the thumb pointed towards the sky and the test was performed. (Figure 3)
Middle trapezius strength was measured with the participant prone with their shoulder abducted to 90 degrees, the elbow fully extended, and the forearm supinated so the thumb was pointed to the sky. This position biases the middle trapezius muscle fibers.33 The dynamometer was again
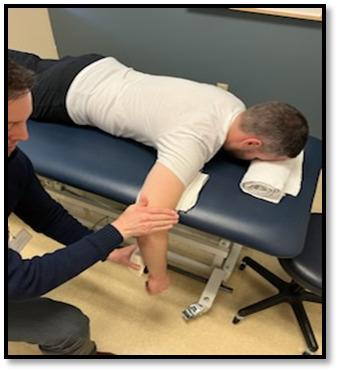
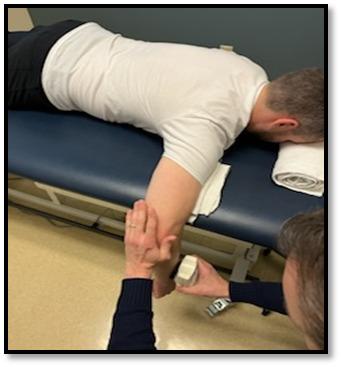
placed at the distal radius and the test was performed. (Figure 4)
Lower trapezius strength was measured with the participant prone with their shoulder abducted to 120 degrees, the elbow fully extended, and the forearm supinated so the thumb was pointed to the sky This position biases the lower trapezius muscle fibers.33 The dynamometer was again placed at the distal radius and the test was performed. (Figure 5)
Figure 1. Internal rotation strength testing procedure
Figure 2. External rotation strength testing procedure
Periscapular Strength Profile Changes in Collegiate Baseball Pitchers Over the Course of a Season International Journal of Sports Physical Therapy
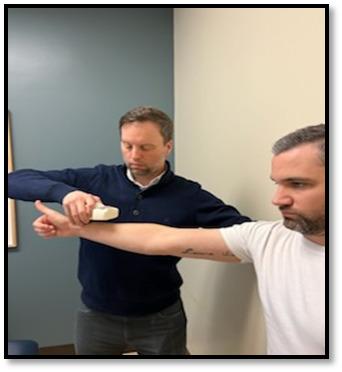
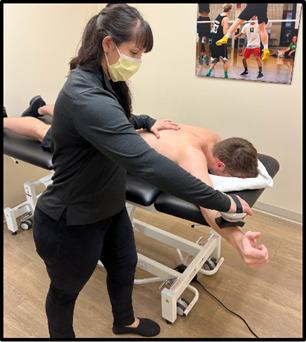
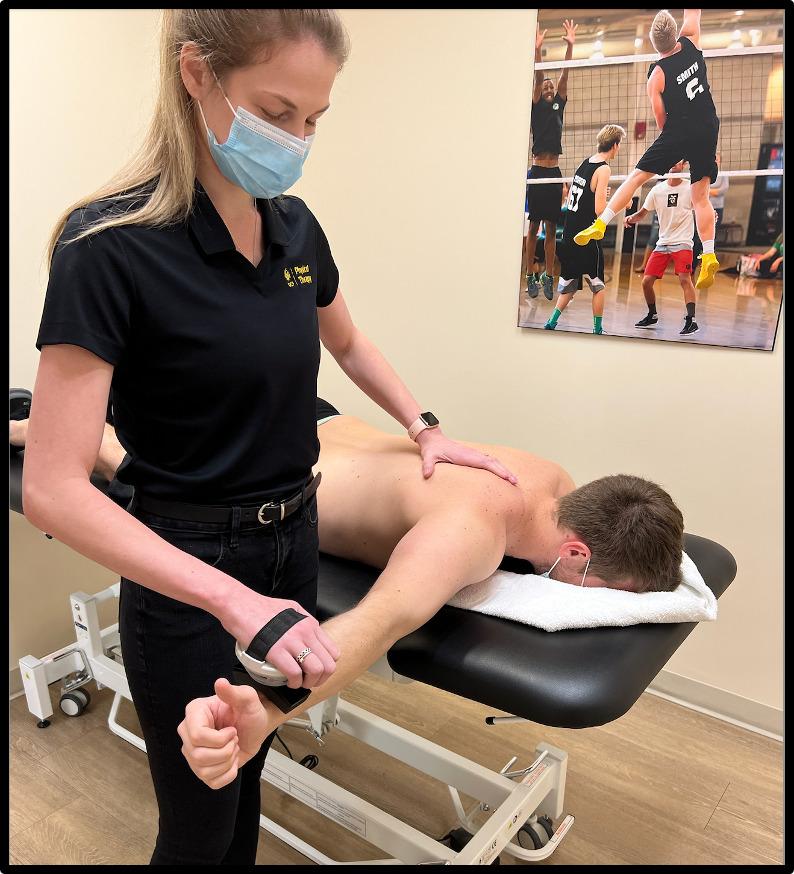
STATISTICAL ANALYSES
Descriptive statistics were calculated for each muscle group to determine a strength profile in this population during each time period. Mean scores in kilograms (kg) were calculated across three trials for each time period. Percent changes in strength were also calculated to identify changes in first and second halves of the season. This was done by kg loss or gain divided by pre-season mean score
for first half percent change and kg loss or gain divided by mid-season mean score for second half of the season. Intraclass correlation coefficients (ICCs) were calculated for each muscle group to determine the intra-rater reliability of the MicroFET 2 in the collegiate baseball pitcher population for each of the muscle groups across the prescribed testing positions. A repeated measure analysis of variance (ANOVA) (IBM SPSS Statistics 28.0) was used to determine if a change in muscle strength occurred over the course of the baseball season, from pre-season to mid-season, and immediately post-season. Post hoc Bonferroni assessments were conducted to examine pairwise differences between each data collection period. An alpha level of 0.05 was used to reject the null hypothesis. Effect sizes were reported as partial eta squared, which is the ratio of variance associated with an effect, plus that effect and its associated error variance. The formula is partial eta2 = sum of squares for the effect / sum of squares for the effect + sum of squares for the error Values of 0.01, 0.06, and 0.14 were utilized to determine a small, medium, and large effect.
RESULTS
Descriptive statistics were calculated for each time period, with means and standard deviations for the strength measures identified in Table 1 Intraclass correlation coefficients (ICCs) were calculated for the three trials by the rater at each of the time points and were found to be strong. ICCs ranged from a low of 0.844 to a high of 0.971 (Table 2). Standard error of the mean (SEM) scores and Minimum Detectible Change (MDC) values were also calculated and included in Table 1. Sphericity was found for all measures, ranging from 0.2-0.702, which suggests equal variances in strength measures among time points.
Figure 3. Scaption strength testing procedure
Figure 4. Middle trapezius strength testing procedure
Figure 5. Lower trapezius strength testing procedure
Periscapular Strength Profile Changes in Collegiate Baseball Pitchers Over the Course of a Season International Journal of Sports Physical Therapy
Table 1. Descriptive statistics: Means, standard deviations, standard error of measurement (SEM), and minimum detectible change (MDC), all reported in kilograms.
Table 2. Calculated ICCs for all time points using the MicroFET 2 Handheld Dynamometer
Over the three time-points, all strength values decreased for each muscle group, but scaption was the only measure found to have a statistically significant decrease across the season (p = 0.018, F = 4.758; partial eta squared=0.284). Scaption decreased by 1.2 kg from pre-season to post-season, which exceeded the MDC value of 0.87kg for the measure. External rotator, internal rotator, middle trapezius, and lower trapezius strength values all decreased over the course of the season (range 0.02kg to 1.8kg). Although the strength differences were not statistically significant (p > 0.05), the middle trapezius strength value change (1.3kg loss) exceeded the MDC (Table 1).
Data points were further evaluated to examine strength changes not only from the pre-to post-season, but also in consideration of changes between pre- to mid-season and mid- to post-season. Strength values were standardized to consider overall percent strength changes during these time periods (Table 3). On average, the periscapular musculature strength loss was 4.22% in the first half of the season
(range +0.4% to 10.75%) while the average loss was 2.97% in the second half of the season (range 1.32% to 7.73%). The middle trapezius lost the greatest amount of strength during the first half of the season (10.75%), followed by external rotation (5.85%), while the greatest strength losses in the second half of the season occurred in internal rotation (7.73%), followed by scaption (5.30%), and the middle trapezius (3.61%). Figures 6-10 graphically represent the individual muscle group changes from pre-season to midseason to post-season.
Scaption strength decreased 8.3% overall through the season, with a 3.2% decline from pre-to mid-season, and another 5.3% decline occurring from mid-to post-season. External rotator strength decreased by 5.85% from pre-season to midseason and then increased by 3.1% from midseason to post-season resulting in a 2.93% reduction in strength over the course of the entire season. Internal rotator strength decreased by 0.4% from pre-season to mid-season and then decreased by 7.73% from mid-season to post-
Pre-Season Mean (SD) Mid-Season Mean (SD) Post-Season Mean (SD) SEM MDC p-value Scaption 15.6 (1.6) 15.1(1.5) 14.3 (1.6) 0.32 0.87 **0.018 External Rotation 20.5 (3.4) 19.3 (3.6) 19.9 (2.9) 0.81 2.24 0.239 Internal Rotation 23.2 (4.0) 23.3 (4.4) 21.5 (4.5) 0.96 2.66 0.464 Middle Trapezius 9.3 (1.2) 8.3 (1.5) 8.0 (1.2) 0.28 0.78 0.512 Lower Trapezius 7.7 (1.3) 7.6 (1.5) 7.5 (1.2) 0.30 0.83 0.133 SEM= Standard error of the mean, MDC= Minimal detectable change. ** represents significant values for RMANOVA.
ICC Upper Bound Lower Bound Pre-Season Shoulder Scaption 0.922 0.828 0.968 Pre-Season Shoulder External Rotation 0.969 0.931 0.987 Pre-Season Shoulder Internal Rotation 0.951 0.892 0.98 Pre-Season Middle Trapezius 0.897 0.768 0.96 Pre-Season Lower Trapezius 0.917 0.817 0.966 Mid-Season Shoulder Scaption 0.954 0.89 0.983 Mid-Season Shoulder External Rotation 0.971 0.93 0.989 Mid-Season Shoulder Internal Rotation 0.969 0.926 0.989 Mid-Season Middle Trapezius 0.884 0.726 0.958 Mid-Season Lower Trapezius 0.964 0.913 0.987 Post-Season Shoulder Scaption 0.929 0.836 0.973 Post-Season Shoulder External Rotation 0.967 0.924 0.987 Post-Season Shoulder Internal Rotation 0.959 0.902 0.985 Post-Season Middle Trapezius 0.946 0.877 0.98 Post-Season Lower Trapezius 0.933 0.846 0.975
Periscapular Strength Profile Changes in Collegiate Baseball Pitchers Over the Course of a Season International Journal of Sports Physical Therapy
Table 3. Mean periscapular strength changes over the course of the playing season
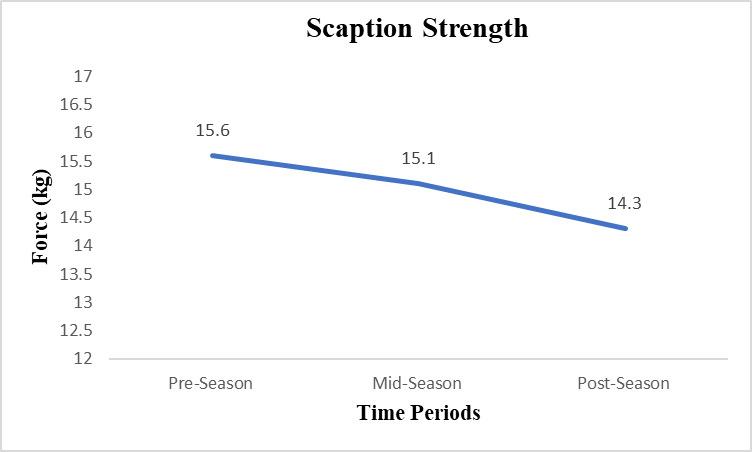
6. Scaption strength over the course of the playing season
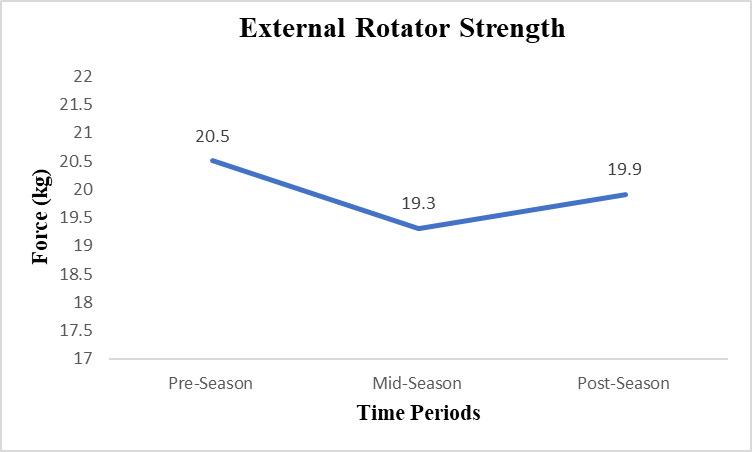
7 External rotation strength over the course of the playing season.
season resulting in a 7.33% reduction in strength over the course of the entire season. Middle trapezius strength decreased by 10.75% from pre-season to mid-season and by 3.61% from mid-season to post-season with a 13.98% reduction in strength over the course of the entire season. Lower trapezius strength decreased by 1.30% from pre-season to mid-season and by 1.32% from mid-season to postseason with a 2.60% reduction in strength over the course of the entire playing season.
A post-hoc power analysis conducted utilizing the statistically significant finding of diminished scaption strength
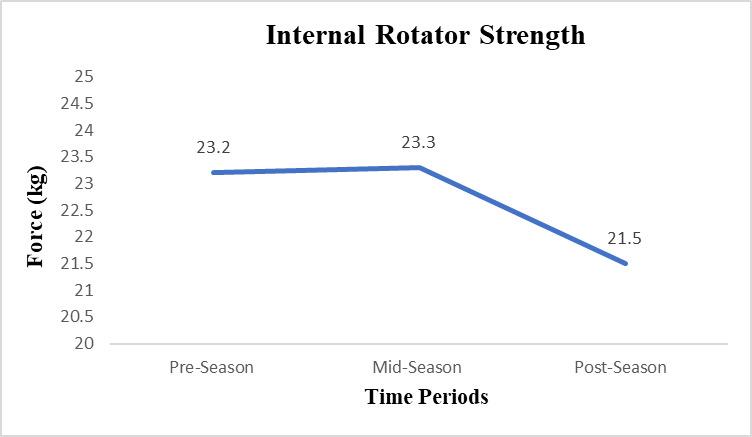
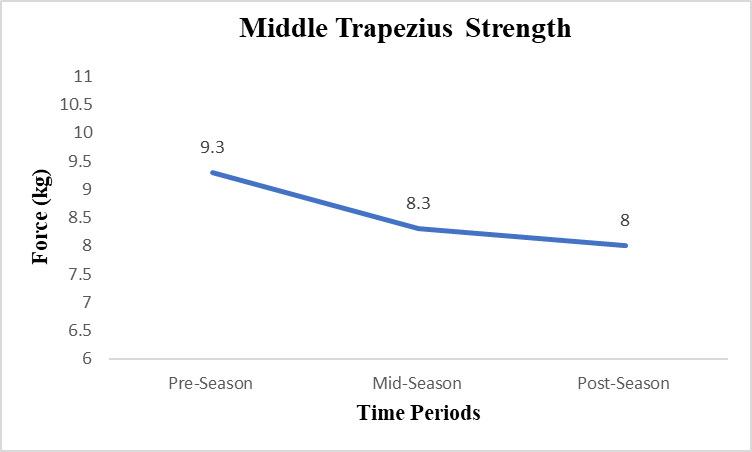
via the repeated measures ANOVA was conducted. Using the calculated partial eta squared (0.284), which equates to an effect size (f) of 0.623, and post-hoc power of 0.99. With this effect, follow-up studies would need a minimum of six subjects to obtain >.80 power, if utilizing this outcome variable (scaption strength). In observance of the lowest effect size, which was found in the middle trapezius assessment (partial eta squared 0.054), a total sample size of 30 subjects would be needed to achieve >.80 power in future studies using repeated measures.
% Strength Loss Muscle First Half Season Second Half Season Total Season % Change Pre-to-Mid % Change Mid-to-Post Scaption 3.20 5.30 8.30 External Rotation 5.85 (+) 3.11 2.93 Internal Rotation (+) 0.40 7.73 7.33 Middle Trapezius 10.75 3.61 13.98 Lower Trapezius 1.30 1.32 2.60 Average strength loss 4.22 2.97 8.4
Figure
Figure
Figure 8. Internal rotation strength over the course of the playing season
Figure 9. Middle trapezius strength over the course of the playing season.
Periscapular Strength Profile Changes in Collegiate Baseball Pitchers Over the Course of a Season International Journal of Sports Physical Therapy
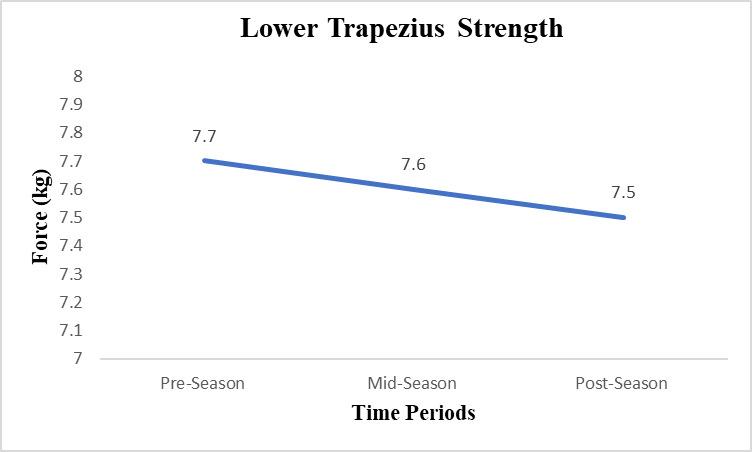
Figure 10. Lower trapezius strength over the course of the playing season
DISCUSSION
The results of this study primarily supported the hypothesis that strength values of specific periscapular muscles would decrease over the course of the season. All strength measures demonstrated an overall reduction over the course of the season, although only scaption met the threshold for a statistically significant decrease. The effect size for this change in value (partial eta squared=0.284) identifies this as a large effect. Further, the mean score change of 1.2kg far exceeds the MDC value for the scaption strength measure (0.87kg), which further substantiates this finding. The only other mean strength value that exceeded its MDC value was for the middle trapezius (1.3kg mean score difference; MDC 0.78). Although this change was not statistically significant, such trend may warrant future investigation.
When considering overall strength loss, average percent loss across all muscle groups measured was similar when considering the first half of the season (4.22% loss) versus the second half of the season (2.97% loss). These findings are outlined in Table 3 Although average strength loss across muscle groups was fairly consistent, it should be noted that the middle trapezius lost the most strength during the course of the season (13.98% loss), with a majority of this loss transpiring over the first half of the season (10.75%). Similar to the middle trapezius, external rotation also had its greatest loss in the first half of the season (5.85% loss). While scaption had the second greatest loss in total strength (8.30% loss), most of this took place in the second half of the season (5.30% loss). In similar fashion, internal rotation strength had a more substantial loss during the second half of the season (7.73%). External rotation was the only measure in which strength increased during any point in the study time period (Table 3). This transpired when pitchers increased their strength by 3.1% during the second half of the season.
The authors believe that in-season training via the team’s structured strength and conditioning program could have created this change in external rotation strength as well as reduced the loss in middle trapezius strength, if these muscle groups were indeed a strong focus or perhaps extensive focus. The authors postulate that this effect could
be contributing to this increase, or perhaps it could be related to a training effect from the strong eccentric demand placed on the external rotators during the pitching motion, coupled with the ability for eccentric activity to produce greater gains in strength compared to concentric training.38,39 Last, error in measurement as indicated by the larger standard deviation scores of internal and external rotation strength could be a factor related to this finding. Future studies examining the structure, prescription, and dosing of such strength and conditioning practices during the baseball season may be warranted.
The pre-season to post-season reduction in scaption strength in this study was supported by McHugh et al.,25 who examined strength adaptations in high school baseball pitchers over the course of a season. McHugh et al. reported significant supraspinatus strength reduction of 7% over the course of a season, with strength reductions of 13% in high volume pitchers, and nonsignificant strength reductions of 6% and 2% in moderate to low volume pitchers, respectively. While the present study did not dichotomize pitchers based on throwing volume, this concept may be warranted in future investigations with collegiate pitchers.
The current study results indicate that scaption strength was reduced over the course of the season by 8.3%. McHugh et al. also reported significant reductions over the course of the season in internal rotator strength (6%), external rotator strength (7%), and scapular retractor strength (4%). While the present study did not show statistically significant differences in all strength measure assessed, nonsignificant reductions of 2.93% external rotator strength, 7.33% reduction of internal rotator strength, 13.98% reduction of middle trapezius strength, and 2.60% reduction of lower trapezius strength did occur over the course of the season.
The pre-season to post-season changes in external rotator and internal rotator strength were not supported by those found by Wilkin et al.,27 which examined isokinetic external and internal rotator strength of Division II collegiate baseball pitchers during a season. Wilkin et al. reported no differences over time in isokinetic external or internal rotator mean peak torque values. Differences in results may be in part due to the method of testing, as isokinetic testing was utilized by Wilkin et al. and isometric testing was utilized in the current study
Over the course of the competitive collegiate baseball season, periscapular strength values decreased. The authors hypothesize that this may be due to the shift in training that occurs as part of a typical periodized training program, as pitchers transition from intense strength training in the pre-season to a maintenance program during the inseason to avoid fatigue and reduce the risk of injury 39,40 As a result, internal rotation and scaption strength were higher in the preseason and followed an anticipated decrease over the course of the season.
The significant loss of early season middle trapezius strength and full-season scaption strength in this study is concerning, especially as studies have also reported that pre-season supraspinatus weakness has been shown to be 12% lower in the dominant vs. nondominant arm in col-
Periscapular Strength Profile Changes in Collegiate Baseball Pitchers Over the Course of a Season International Journal of Sports Physical Therapy
legiate pitchers.19 Failure to gain supraspinatus strength from post-season to the following preseason may predispose the pitcher to injury, given the rates of shoulder injury to pitchers during the season and the risk factors involved with pitching with fatigue. Further, the role of the lower and middle trapezius in scapular positioning and control during the pitching motion is well established relative to shoulder injury 41‑43 These weaknesses suggest that careful attention should be placed on the development of the periodized periscapular strength training program to account for in-season periscapular strength changes and the need to increase supraspinatus strength from post-season to the following pre-season.
This study has several limitations. The weight of each athlete was not recorded. As a result, all strength values are reported as absolute values and not recorded relative to body weight. The sample size was small and all pitchers were from the same university and participating in the same strength training protocols. As this was a retrospective data analysis, data that was analyzed did not include information regarding specifics in the periodized strength training regimen and therefore it is uncertain what effect, if any, the periodized strength training regimen had on the seasonal strength changes. Further, pitchers’ level of participation and throwing volume throughout the season were not recorded. Each of these limitations offers opportunities for future investigation. Last, the empty can test position was not utilized as it had been used in previous studies for assessment of supraspinatus strength in baseball pitchers.11,18,19,24 Therefore, results of scaption strength may not fully represent supraspinatus strength measures as measured in other studies.
CONCLUSION
Strength of the rotator cuff and other periscapular musculature experienced normal attrition of strength by approximately 3-14% over the course of a season in Division I collegiate baseball pitchers, however only scaption strength decreased significantly. Although periscapular musculature lost nearly the same amount of strength in the first and second halves of the season, individual muscle groups lost strength at different time periods, with middle trapezius diminishing most during in the first half of the season, while internal rotators and scaption lost the most strength at the second half of the season. While differences in fatigue patterns may occur due to specific muscular actions during pitching, throwing volume, or mitigation effects of inseason training, future investigations are warranted. Understanding normal strength values as well as the strength changes of the shoulder girdle musculature in throwing athletes may assist various rehabilitation professionals, strength and conditioning professionals, and sports physical therapists in the appropriate targeting of metrics for training and therapeutic interventions for the baseball pitchers.
CONFLICT OF INTEREST
The authors have no conflict of interest to report.
Submitted: November 22, 2023 CDT, Accepted: April 08, 2024 CDT
© The Author(s)
This is an open-access article distributed under the terms of the Creative Commons Attribution 4.0 International License (CCBY-NC-4.0). View this license’s legal deed at https://creativecommons.org/licenses/by-nc/4.0 and legal code at https://creativecommons.org/licenses/by-nc/4.0/legalcode for more information.
Periscapular Strength Profile Changes in Collegiate Baseball Pitchers Over the Course of a Season International Journal of Sports Physical Therapy
REFERENCES
1. Dillman CJ, Fleisig GS, Andrews JR. Biomechanics of pitching with emphasis upon shoulder kinematics. J Orthop Sports Phys Ther. 1993;18(2):402-408. doi:10.2519/jospt.1993.18.2.402
2. Fleisig GS, Dillman CJ, Andrews JR. Biomechanics of the shoulder during throwing. In: Andrews JR, Wilk KE, eds. The Athlete’s Shoulder Churchill Livingstone; 1994:355-368.
3. Fleisig GS, Barrentine SW, Escamilla RF, Andrews JR. Biomechanics of overhand throwing with implications for injuries. Sports Med 1996;21(6):421-437. doi:10.2165/ 00007256-199621060-00004
4. Fleisig GS, Andrews JR, Dillman CJ, Escamilla RF. Kinetics of baseball pitching with implications about injury mechanisms. Am J Sports Med 1995;23(2):233-239. doi:10.1177/ 036354659502300218
5. Pappas AM, Zawacki RM, Sullivan TM. Biomechanics of baseball pitching; a preliminary report. Am J Sports Med. 1985;13(4):216-222. doi:10.1177/036354658501300402
6. Feltner M, Dapena J. Dynamics of the shoulder and elbow joints of the throwing arm during a baseball pitch. J Appl Biomech. 1986;2(4):235-259. doi:10.1123/ijsb.2.4.235
7 DiGiovine N, Jobe F, Pink M, Perry J. An electromyographic analysis of the upper extremity in pitching. J Shoulder Elbow Surg 1992;1(1):15-25. doi:10.1016/S1058-2746(09)80011-6
8. Byram IR, Bushnell BD, Dugger K, Charron K, Harrell FE Jr, Noonan TJ. Preseason shoulder strength measurements in professional baseball pitchers: identifying players at risk for injury. Am J Sports Med. 2010;38(7):1375-1382. doi:10.1177/ 0363546509360404
9. Donatelli R, Ellenbecker TS, Ekedahl SR, Wilkes JS, Kocher K, Adam J. Assessment of shoulder strength in professional baseball pitchers. J Orthop Sports Phys Ther. 2000;30(9):544-551. doi:10.2519/ jospt.2000.30.9.544
10. Ellenbecker TS, Mattalino AJ. Concentric isokinetic shoulder internal and external rotation strength in professional baseball pitchers. J Orthop Sports Phys Ther 1997;25(5):323-328. doi:10.2519/ jospt.1997.25.5.323
11. Trakis JE, McHugh MP, Caracciolo PA, Busciacco L, Mullaney M, Nicholas SJ. Muscle strength and range of motion in adolescent pitchers with throwing-related pain: implications for injury prevention. Am J Sports Med 2008;36(11):2173-2178. doi:10.1177/0363546508319049
12. Wilk KE, Obma P, Simpson CD, Cain EL, Dugas JR, Andrews JR. Shoulder injuries in the overhead athlete. J Orthop Sports Phys Ther. 2009;39(2):38-54. doi:10.2519/jospt.2009.2929
13. Ouellette H, Labis J, Bredella M, Palmer WE, Sheah K, Torriani M. Spectrum of shoulder injuries in the baseball pitcher Skeletal Radiol 2008;37(6):491-498. doi:10.1007/s00256-007-0389-0
14. Bullock GS, Faherty MS, Ledbetter L, Thigpen CA, Sell TC. Shoulder range of motion and baseball arm injuries: a systematic review and meta-analysis. J Athl Train. 2018;53(12):1190-1199. doi:10.4085/ 1062-6050-439-17
15. Alderink GJ, Kuck DJ. lsokinetic shoulder strength of high school and college-aged pitchers. J Orthop Sports Phys Ther 1986;7(4):163-172. doi:10.2519/ jospt.1986.7.4.163
16. Brown LP, Niehues SL, Harrah A, Yavorsky P, Hirshman HP. Upper extremity range of motion and isokinetic strength of the internal and external shoulder rotators in major league baseball players. Am J Sports Med. 1988;16(6):577-585. doi:10.1177/ 036354658801600604
17 Hinton RY Isokinetic evaluation of shoulder rotational strength in high school baseball pitchers. Am J Sports Med 1988;16:274-279. doi:10.1177/ 036354658801600314
18. Magnusson SP, Gleim GW, Nicholas JA. Shoulder weakness in professional baseball pitchers. Med Sci Sports Exerc 1994;26(1):5-9. doi:10.1249/ 00005768-199401000-00003
19. Mullaney MJ, McHugh MP, Donofrio TM, Nicholas SJ. Upper and lower extremity muscle fatigue after a baseball pitching performance. Am J Sports Med. 2005;33(1):108-113. doi:10.1177/0363546504266071
20. Mulligan IJ, Biddington WB, Barnhart BD, Ellenbecker TS. Isokinetic profile of shoulder internal and external rotators of high school aged baseball pitchers. J Strength Cond Res 2004;18(4):861-866. doi:10.1519/14633.1
Periscapular Strength Profile Changes in Collegiate Baseball Pitchers Over the Course of a Season International Journal of Sports Physical Therapy
21. Wilk KE, Andrews JR, Arrigo CA, Keirns MA, Erber DJ. The strength characteristics of internal and external rotator muscles in professional baseball pitchers. Am J Sports Med. 1993;21(1):61-66. doi:10.1177/036354659302100111
22. Gagnon A, Payette J, Park M, Juras K, Slater L. Relationship between pitch counts and shoulder strength in collegiate baseball players. J Strength Cond Res 2023;37(9):1860-1864. doi:10.1519/ JSC.0000000000004477
23. Mirabito NS, Topley M, Thomas SJ. Acute effect of pitching on range of motion, strength, and muscle architecture. Am J Sports Med 2022;50(5):1382-1388. doi:10.1177/03635465221083325
24. Tyler TF, Mullaney MJ, Mirabella MR, Nicholas SJ, McHugh MP Risk factors for shoulder and elbow injuries in high school baseball pitchers: the role of preseason strength and range of motion. Am J Sports Med 2014;42(8):1993-1999. doi:10.1177/ 0363546514535070
25. McHugh MP, Tyler TF, Mullaney MJ, Mirabella MR, Nicholas SJ. The effect of a high pitch volume on musculoskeletal adaptations in high school baseball pitchers. Am J Sports Med 2016;44(9):2246-2254. doi:10.1177/0363546516650183
26. Whitley JD, Terrio T. Changes in peak torque armshoulder strength of high school baseball pitchers during the season. Percept Mot Skills 1998;86(3):1361-1362. doi:10.2466/ pms.1998.86.3c.1361
27 Wilkin LD, Haddock BL. Isokinetic strength of collegiate baseball pitchers during a season. J Strength Cond Res 2006;20(4):829-832. doi:10.1519/ R-18045.1
28. Sumimoto Y, Yokoya S, Kitasaka A, Harada Y, Deie M, Adachi N. Range of motion and muscle strength changes in Japanese professional pitchers during the baseball season. Cureus. 2023;15(12):e49844. doi:10.7759/cureus.49844
29. Fleisig GS, Barrentine SW, Zheng N, Escamilla RF, Andrews JR. Kinematic and kinetic comparison of baseball pitching among various levels of development. J Biomech 1999;32(12):1371-1375. doi:10.1016/s0021-9290(99)00127-x
30. Conceição A, Parraca J, Marinho D, et al. Assessment of isometric strength of the shoulder rotators in swimmers using a handheld dynamometer: a reliability study Acta Bioeng Biomech 2018;20(4):113-119.
31. Garrison JC, Johnston C, Conway JE. Baseball players with ulnar collateral ligament tears demonstrate decreased rotator cuff strength compared to healthy controls. Int J Sports Phys Ther. 2015;10(4):476-481.
32. Kennedy SM, Sheedy P, Klein B, et al. Differences in shoulder internal rotation strength between baseball players with ulnar collateral ligament reconstruction and healthy controls. Orthop J Sports Med. 2022;10(1):23259671211065025. doi:10.1177/ 23259671211065025
33. Kendall FPM, EK, Provance PG, Rodgers MM, Romani WA. Muscles: Testing and Function With Posture and Pain. 5th ed. Lippincott Williams & Wilkins; 2005.
34. Laudner KG, Moline M, Meister K. Lack of a relationship between glenohumeral external-rotation strength and posterior shoulder tightness in baseball players. J Sport Rehabil 2012;21(1):12-17 doi:10.1123/jsr.21.1.12
35. Bohannon RW Make tests and break tests of elbow flexor muscle strength. Phys Ther 1988;68(2):193-194. doi:10.1093/ptj/68.2.193
36. Schilling DT, Elazzazi AM. Shoulder strength and closed kinetic chain upper extremity stability test performance in division III collegiate baseball and softball players. Int J Sports Phys Ther 2021;16(3):844-853. doi:10.26603/001c.24244
37. Shitara H, Kobayashi T, Yamamoto A, et al. Prospective multifactorial analysis of preseason risk factors for shoulder and elbow injuries in high school baseball pitchers. Knee Surg Sports Traumatol Arthrosc 2017;25(10):3303-3310. doi:10.1007/ s00167-015-3731-4
38. Nakaji RM, Ellenbecker TS, McClenahan KM, Roberts LM, Perez C, Dickenson SB. Descriptive Strength and Range of Motion in Youth Baseball Players. Int J Sports Phys Ther. 2021;16(1):195. doi:10.26603/001c.18815
39. Hody S, Croisier JL, Bury T, Rogister B, Leprince P Eccentric muscle contractions: risks and benefits. Front Physiol 2019;10:442082. doi:10.3389/ fphys.2019.00536
40. Haff GG, Triplett NT Essentials of Strength Training and Conditioning 4th Edition. Human Kinetics; 2015.
41. Escamilla RF, Andrews JR. Shoulder muscle recruitment patterns and related biomechanics during upper extremity sports. Sports Med 2009;39:569-590. doi:10.2165/ 00007256-200939070-00004
Periscapular Strength Profile Changes in Collegiate Baseball Pitchers Over the Course of a Season International Journal of Sports Physical Therapy
42. Trakis JE, McHugh MP, Caracciolo PA, Busciacco L, Mullaney M, Nicholas SJ. Muscle strength and range of motion in adolescent pitchers with throwing-related pain: implications for injury prevention. The Am J Sports Med 2008;36(11):2173-2178. doi:10.1177/ 0363546508319049
43. Myers JB, Oyama S, Hibberd EE. Scapular dysfunction in high school baseball players sustaining throwing-related upper extremity injury: a prospective study. J Shoulder Elbow Surg. 2013;22(9):1154-1159. doi:10.1016/j.jse.2012.12.029
Periscapular
Profile Changes in Collegiate Baseball Pitchers Over the
a Season International Journal of Sports Physical Therapy
Strength
Course of
Effects
of Low-Load Blood Flow Restriction Training on Rotator Cuff Strength and Hypertrophy: Case Series
Daniel W Safford1a , Kshamata M Shah1 , Frederic Breidenbach1 , Philip W McClure1
1 Physical Therapy, Arcadia University
Keywords: blood flow restriction training, BFRT, cross-sectional area, rotator cuff, shoulder https://doi.org/10.26603/001c.118143
International Journal of Sports Physical Therapy
Background
The rotator cuff (RC) plays a pivotal role in the performance and health of the shoulder and upper extremity Blood flow restriction training (BFRT) is a modality to improve strength and muscle hypertrophy with even low-load training in healthy and injured individuals. There is minimal evidence examining its effect proximal to the occluded area, and particularly on the RC.
Hypothesis & Purpose
The purpose of this case series is to explore the effects of low-load BFRT on RC strength, hypertrophy, and tendon thickness in asymptomatic individuals.
Study Design
Case series.
Methods
Fourteen participants with asymptomatic, untrained shoulders were recruited to participate. They performed an eight-week low-load shoulder exercise regimen where BFR was applied to the dominant arm only during exercise. The dependent variables were maximal isometric strength of the shoulder external rotators(ER) and elevators (in the scapular plane in full can position) (FC) measured via handheld dynamometry, cross sectional area (CSA) of the supraspinatus and infraspinatus muscles, and supraspinatus tendon thickness measured via ultrasound imaging (US). Mean changes within and between arms were compared after training using paired t-tests. Cohen’s d was used to determine effect sizes.
Results
All participants were able to complete the BFRT regimen without adverse effects. Mean strength and CSA increased for all variables in both arms, however this increase was only significant (p<0.01) for FC strength bilaterally and CSA for the supraspinatus and infraspinatus on the BFRT side. The effect sizes for increased supraspinatus and infraspinatus CSA on the BFRT side were 0.40 (9.8% increase) and 0.46 (11.7% increase) respectively. There were no significant differences when comparing the mean changes of the BFRT side to the non-BFRT side for strength or muscle CSA. There were no significant changes to supraspinatus tendon thickness.
Conclusion
These results suggest variability in response of the RC musculature to low-load BFRT in asymptomatic individuals. The potential for a confounding systemic response in the
Corresponding Author:
Daniel W. Safford
450 S Easton Rd Glenside, PA 19038 affordd@arcadia.edu
Case Series
a
Shah
Breidenbach
McClure PW. Effects of Low-Load Blood Flow Restriction Training on Rotator Cuff Strength and Hypertrophy: Case Series. IJSPT Published
2024:735-744. doi:10.26603/001c.118143
Safford DW,
KM,
F,
online June 1,
study design makes determining whether low-load BFRT is more beneficial than low-load non-BFRT difficult. The hypertrophy seen on the BFRT side warrants further study.
Level of Evidence
4
INTRODUCTION
Shoulder pain impacts about 12% of the population, with a variable range of 26% - 81% in high risk populations where rotator cuff (RC) tendinopathy accounts for roughly half of cases.1‑3 The rotator cuff plays a pivotal role in the performance of the glenohumeral joint particularly in athletes where it acts to stabilize the humerus during high-load activity.4 Improved rotator cuff performance has been associated with improved outcomes in patients with rotator cuff pathology and following shoulder surgery.5‑7
Blood flow restriction training (BFRT) has been performed in the healthy population for over 40 years with recent literature demonstrating relatively strong evidence for its efficacy in developing muscle hypertrophy and force production in healthy individuals with low-load training.8, 9 Amplification of the training effects of low-loads may be particularly valuable in a clinical population who are unable to generate higher loads secondary to weakness or inhibition, or in whom high loads would be unsafe in consideration of healing tissues. There is a growing body of evidence indicating the safety and efficacy of generating hypertrophic and strength increases in patient populations, predominantly with lower extremity injury or after lower extremity surgical procedures.10‑12 Use of BFRT in sports clinical practice and training communities for the lower and upper extremity has become increasingly popular.
The primary mechanism for muscular adaptation is increased activation of type IIx muscle fibers at lower mechanical loads than normally required via hypoxia locally induced by an inflated specialized pressure cuff at the proximal portion of the limb.13 Secondary mechanisms include mechanotransduction effects from venous pooling and a cascade of local and systemic hormonal responses.14
Some evidence has indicated advantageous muscular adaptations proximal to the placement of the pressure cuff 15‑19 Recent authors have indicated shoulder strength gains following BFRT regimens in healthy individuals, but results have been mixed with relatively small effects observed.15,18‑21 Additionally, there is early evidence to suggest hypertrophy of shoulder musculature occurs with lowload training in combination with shoulder BFRT,19‑21 however the methods used included girth measurement and whole shoulder DEXA scan which are not gold standard measures for muscle hypertrophy and are not specific to the rotator cuff Existing studies in this area have not examined the effect of BFRT on RC muscle cross-sectional area (CSA).
There is even less evidence exploring the use of BFRT for conditions of the shoulder in patients. To the authors’ knowledge there are only three peer-reviewed articles on the use of BFRT in patients with shoulder problems – one case series in patients following shoulder stabilization surgery,22 one case report on a patient with adhesive cap-
sulitis and rotator cuff involvement,23 and one case report on two patients with subacromial pain.24 Overall, there is limited evidence regarding the effects of upper extremity BFRT on the shoulder, and a further paucity of evidence on its effects specific to the rotator cuff The lack of clear evidence in this domain combined with reported benefit in patients with lower extremity involvement warrants further investigation. The purpose of this case series is to explore the effects of low-load blood flow restriction training on RC strength, hypertrophy, and tendon thickness.
MATERIALS & METHODS
STUDY DESIGN
This case series examines the effects of blood flow restriction training of the shoulder on RC musculature hypertrophy and isometric strength in adults with asymptomatic, untrained shoulders. Participants underwent an exam to exclude those for whom upper extremity exercise or BFRT might be unsafe. They performed RC isometric strength testing via fixed dynamometry, and RC muscle CSA measurement via US imaging, before and after an 8-week progressive exercise regimen (Figure 1). Participants performed the exercise regimen with both arms, while BFR was applied proximally, to the dominant arm only. All participants provided informed consent to participate in this study, which was approved by an institutional review board.
STRENGTH & HYPERTROPHY MEASUREMENT
ISOMETRIC DYNAMOMETRY
Participants’ maximal volitional isometric contraction (MVIC) strength for external rotators (ER) and elevators (in the full can position) (FC) was assessed with fixed dynamometry using a handheld dynamometer stabilized by a wall or inelastic strap (Figure 2) on both arms. For ER measurement participants were seated upright with their arm at their side, elbow bent to 90 degrees, and the forearm in neutral rotation. The dynamometer was aligned to the ulnar styloid process. For FC measurement, participants were seated with the arm elevated to 90 degrees in the plane of the scapula (40 degrees anterior to the frontal plane) with the dynamometer aligned to the radial styloid process. Participants performed two submaximal trials at 50% effort and then rested for 1 minute. Participants then performed two maximal effort trials with three minutes of rest between each.25 If there was greater than a 10% difference between the two maximal efforts a third maximal effort was performed. Results of maximal efforts were averaged for data and exercise regimen purposes detailed below Shoulder dynamometry has been shown to have good reliability 26‑28
Effects of Low-Load Blood Flow Restriction Training on Rotator Cuff Strength and Hypertrophy: Case Series International Journal of Sports Physical Therapy
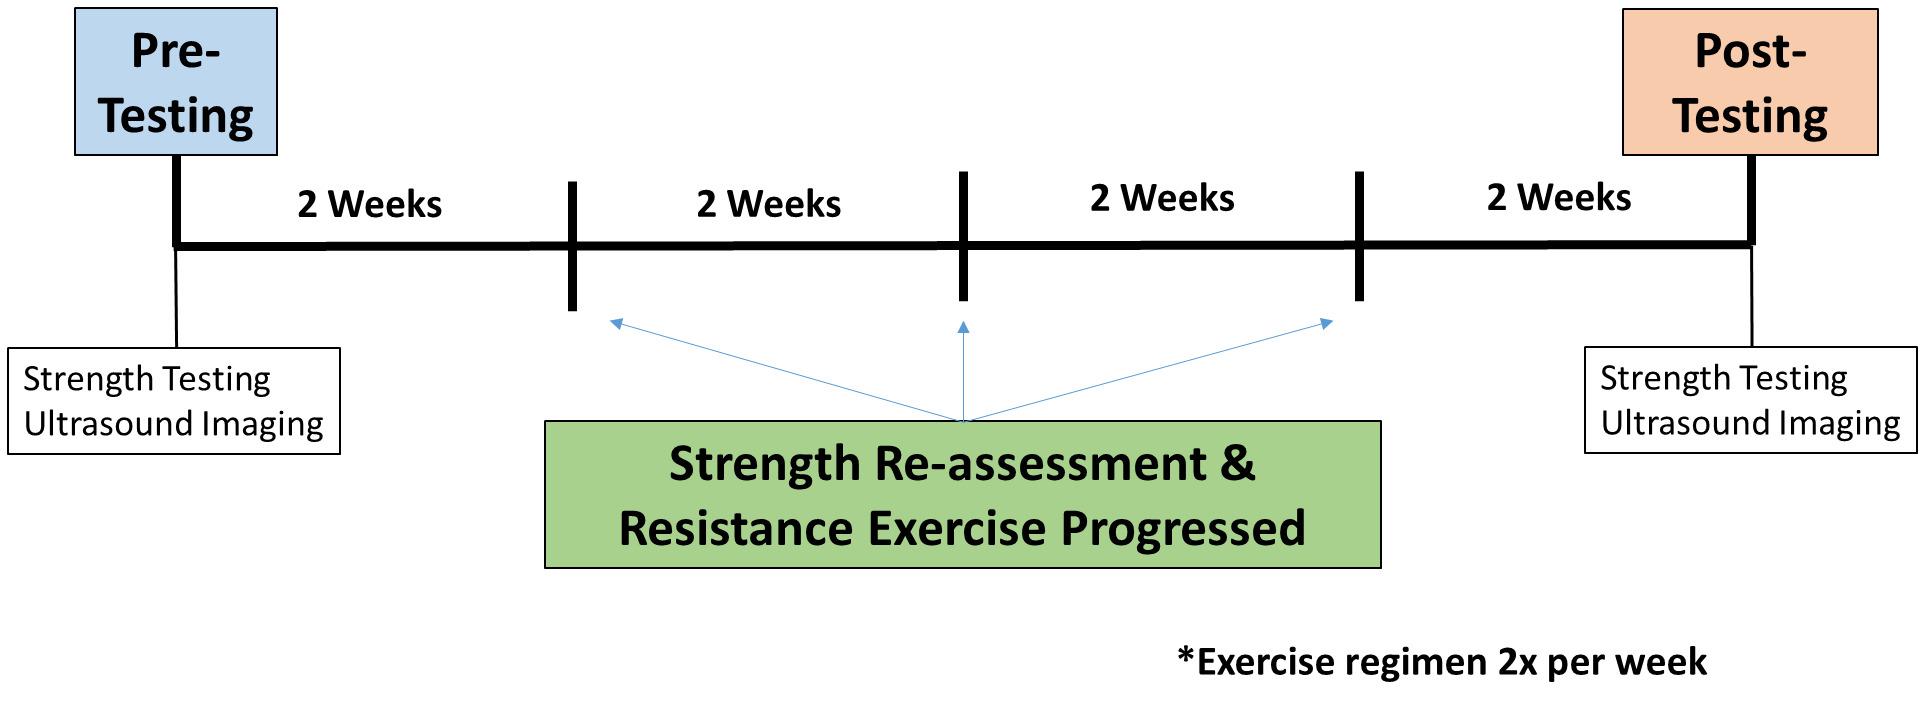
FIGURE 1. Study design timeline.
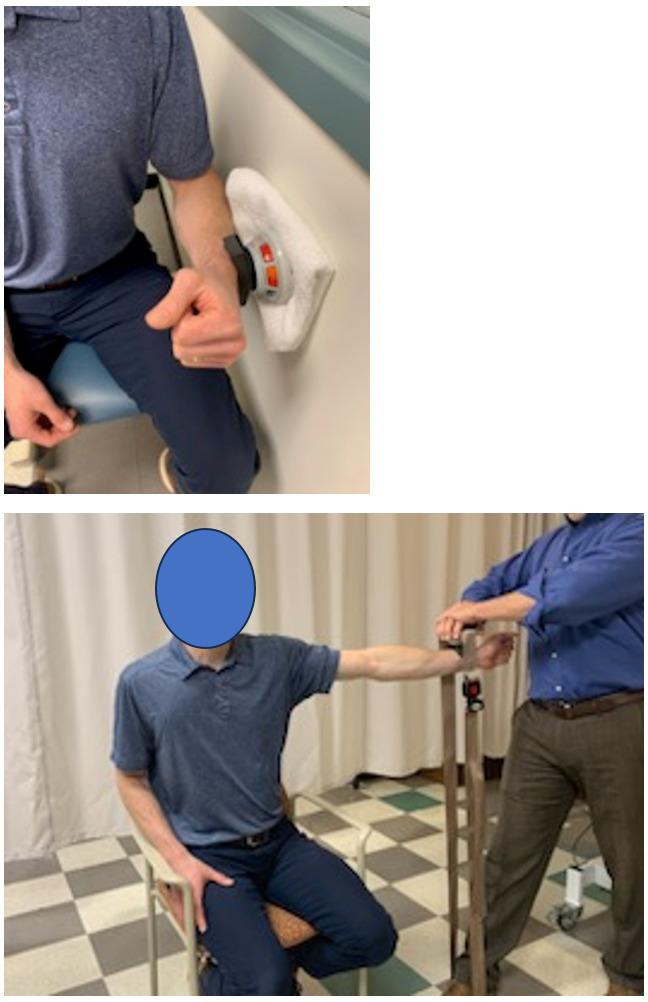
FIGURE 2. Isometric dynamometry for shoulder external rotation (ER) against a wall (top) and elevation in the scapular plane (FC) against an inelastic belt (bottom).
ULTRASOUND IMAGING
Supraspinatus and infraspinatus CSA and supraspinatus tendon thickness of both shoulders was obtained using GE
Logiq-e B-mode ultrasound (GE Healthcare, Wisconsin, USA) with a high resolution, multi-frequency (8-13MHz) linear transducer The participant was seated comfortably on a stool with the arm held in different positions for the supraspinatus muscle thickness, and tendon thickness measurements.29 The participant was prone for the infraspinatus muscle thickness measurement (Figure 3). At least three scans were performed by an individual trained in the study methods for each structure and an average of three measurements for each structure was used for data analyses. ImageJ [version 1.45s (NIH, Bethesda, MD)] computerized image analysis program was used for size measurements, performed by a different single trained individual. These methods of US data collection have demonstrated good reliability 30
EXERCISE REGIMEN
Participants performed two common clinical shoulder exercises – sidelying external rotation and standing scaption (elevation in the scapular plane) – on both arms (Figure 4). The sidelying external rotation was performed with a small towel roll under the arm and scaption was performed to 90 degrees of elevation. Participants performed the exercises two times per week with at least one day of rest between sessions for eight weeks. Participants were allowed to miss three sessions from the protocol, and if they missed two sessions consecutively, they completed an additional week of exercise. Participants performed four sets of each exercise – the first set was 30 repetitions, and the remaining sets were 15 repetitions – all with 30 seconds of rest between sets. If a participant failed to complete all repetitions in a set due to fatigue they took the rest allotted and continued to the next set. The exercises were performed with dumbbells at 20% of the average MVIC performed by the participants which was re-assessed every two weeks and loads were adjusted accordingly The ER MVIC determined the weight for sidelying ER exercise, and the FC MVIC determined the weight for the scaption exercise. The dumbbell selection was rounded to the nearest pound.
Effects of Low-Load Blood Flow Restriction Training on Rotator Cuff Strength and Hypertrophy: Case Series International Journal of Sports Physical Therapy
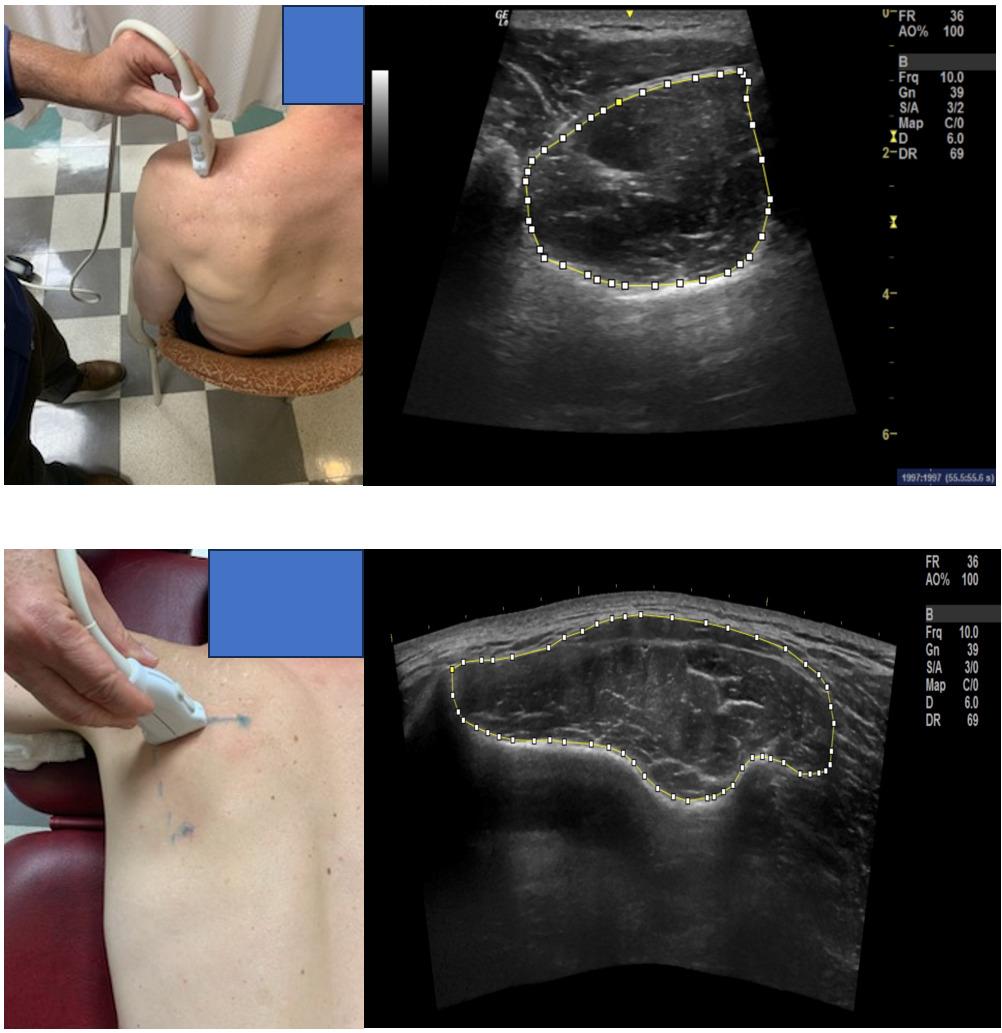
FIGURE 3. Ultrasound Imaging and cross-sectional area (CSA) measurement examples – supraspinatus (top) and infraspinatus (bottom)
BLOOD FLOW RESTRICTION PROTOCOL
Participants performed the exercise regimen with a Delfi PTS Personalized Tourniquet System II BFR cuff applied to the dominant upper arm at 50% arterial occlusion pressure (AOP). Participants were monitored for excessive pain (>7/ 10 on a numeric pain rating scale (NPRS)), excessive rate of perceived exertion (RPE) (>8/10), lack of capillary refill, loss of sensation, or any negative systemic response. If these occurred, the pressure was reduced by 10% and exercise was continued. If the symptoms persisted, the session would be ended for the day, however this did not occur during the
study. The exercise and blood flow restriction parameters were based on previous studies.8,10,31
DATA ANALYSIS
Data was analyzed using Microsoft Excel 2016 MSO (16.0.4266.1001). Descriptive data were represented using means (SD). Paired, two-tailed t-tests were used to assess changes within the same arm pre versus post training, and between arms after training. Cohen’s d (mean difference divided by pooled SD) was used to determine effect size of within group (same arm) changes.
Effects of Low-Load Blood Flow Restriction Training on Rotator Cuff Strength and Hypertrophy: Case Series International Journal of Sports Physical Therapy
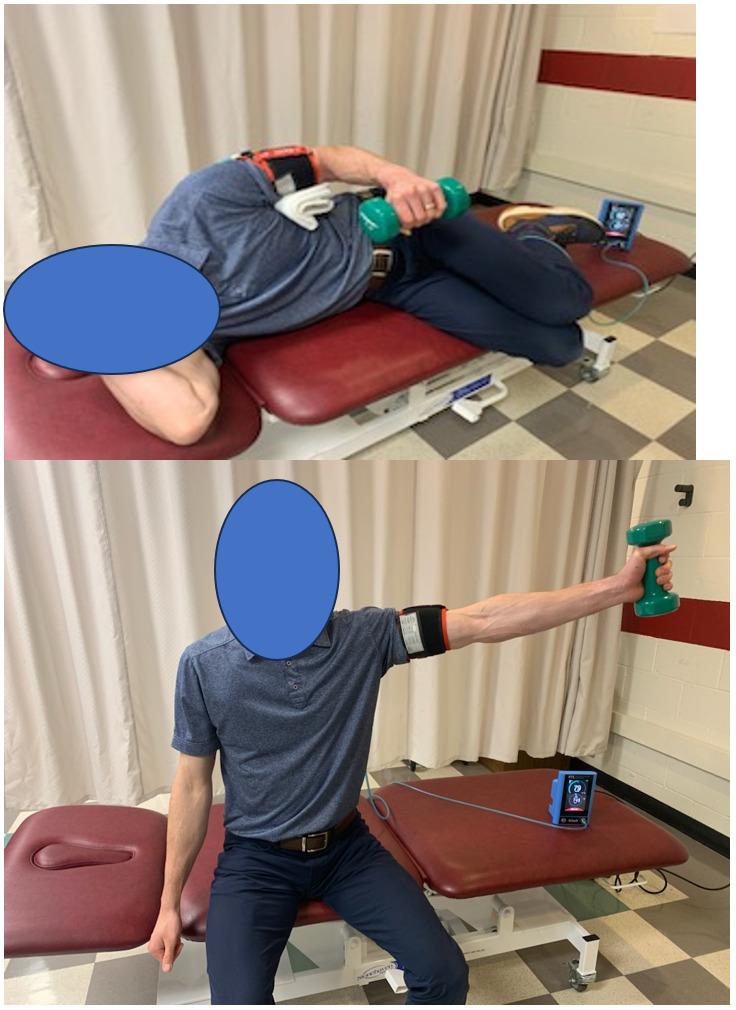
FIGURE 4. Sidelying shoulder external rotation (top) and scaption (bottom) exercises. The same exercises were performed without the BFR cuff on the nondominant arm.
RESULTS
PARTICIPANTS
Fourteen participants were enrolled in the study All participants completed the study and there were no adverse events. The cuff pressure was reduced by 10% for four participants due to excessive RPE (>8/10) during sessions early in the protocol or when increasing resistance. They were all able to continue with the exercise regimen and returned to ideal cuff pressure in subsequent sessions. The mean age (SD) of the participants was 30.7 (14.8), two were left hand dominant, and three were male.
STRENGTH, HYPERTROPHY, AND TENDON THICKNESS
The data for strength, hypertrophy, and tendon thickness are shown in Table 1 and Table 2 The mean increase in strength was statistically significant for FC (p<0.01) in both arms. The mean change in strength for ER increased in both arms, but the differences were not statistically significant. There were no statistically significant strength gain differences between the non-BFRT and BFRT sides.
Mean cross-sectional area increased for both the supraspinatus and infraspinatus muscles in both arms, however the increase was only statistically significant (p<0.01) in the BFRT side. The effect sizes (cohen’s d) for increased supraspinatus and infraspinatus CSA on the BFRT side were 0.40 (9.8% increase) and 0.46 (11.7% increase) respectively The increased mean CSA on the BFRT side was
88mm2 for the supraspinatus and 207mm2 for the infraspinatus. These values are in the range of existing MDC95 for the supraspinatus (70-130mm2) but not the infraspinatus (290-370mm2).30 There were no significant differences in mean change between arms for either muscle. There were no significant changes to supraspinatus tendon thickness on either side. Due to imaging error, data from only 10 participants was included in the tendon analysis.
DISCUSSION
Strength increased relatively symmetrically in the BFRT and non-BFRT arms, and only FC strength gains were statistically significantly different. This could represent a relatively expected response of untrained musculature to training, neural adaptation, motor learning from the biweekly testing, or a systemic response to the BFRT Other studies examining RC strengthening with BFRT have produced mixed results.18‑21 Interestingly, most of these studies showed a similar pattern where strength improved in multijoint movements such as FC, flexion, or bench press that involve the deltoid and pectoralis musculature where isolated rotation such as ER did not.17,19‑21
Increases in muscle hypertrophy were only statistically significant on the BFRT side for both the supraspinatus and infraspinatus. The effect size and percentage increases were 0.40 (9.8% increase) and 0.46 (11.7% increase) respectively, which are moderate and similar to expected increases for traditional high-load or low-load progressive resistance training, and low-load blood flow restriction training in musculature distal to the cuff 8,17,32,33 The difference between sides was not significant.
There was no statistically significant change in tendon thickness on either side. Since the participants had asymptomatic shoulders and likely minimal to no pathology there may not have been much opportunity for change. It seems that use of shoulder BFRT is not deleterious to healthy rotator cuff tendon and further study is warranted in various patient populations.
The results of this study present a confounding comparison. There was significantly increased muscle CSA only in the BFRT side, while there were no between side differences for strength change. There is an apparent decoupling of hypertrophy and strength gain. A primary confounder and limitation of this study is that the BFRT performed on one side may have had a systemic cross over effect boosting the response to the loading stimulus in the non-BFRT side. There is conflicting evidence on the systemic effect of lowload BFRT34 wherein there is an endocrine response similar to high-load training particularly with a large increase in human growth hormone and insulin growth factors.35,36 This is also a mechanism proposed to contribute to advantageous tissue response to BFRT proximal to the cuff 19 The study design cannot tease out the potential impact of this effect. So, while the study design controls for a number of between-individual comparison factors it may be possible that a systemic hormonal response boosted strength and hypertrophy in the non-BFRT side that might not have occurred if it were performed in a different individual.
Effects of Low-Load Blood Flow Restriction Training on Rotator Cuff Strength and Hypertrophy: Case Series International Journal of Sports Physical Therapy
Table 1. Pre- and Post-training data for strength, cross-sectional area and tendon thickness for BFRT and non BFRT arms
Within Arm
Cross-Sectional Area (mm2) Supraspinatus
Table 2. Mean differences between arms due to training
There are several other theories that have been presented to explain hypertrophy and strength gains proximal to the BFR cuff Common ones include increased EMG activation of proximal musculature, remote ischemic preconditioning, and a backflow effect where vascular pressure builds proximal to the cuff 13‑15,37,38 Both shoulders were untrained and there were no significant differences between sides at baseline despite the mean strength being 5% and 1.5% lower on the nondominant side for ER and FC respectively Even so, the slightly higher mean strength gain on the non-BFRT side may be somewhat due to an inherently less trained state since it was the non-dominant side with greater potential for neural adaptation with training which is also a limitation of this research. These mechanisms and factors may contribute to the apparent decoupling of hypertrophy and strength gain between sides.
There are additional limitations to this research. While the parameters used for the BFRT regimen are commonly
recommended, the 20%1RM is the lower end of what is reported as effective in the literature. That said, the potential for gains with low-load training is part of what makes BFRT potentially advantageous for clinical practice. Similarly, to achieve clinical feasibility, training was performed by rounding dynamometry measurements to the nearest pound for dumbbell use. This may have blunted training intensity increases that should have been associated with small strength gains found at the biweekly strength re-assessments. Furthermore, increased exercise volume might have produced more pronounced effects.
Another limitation is that the use of an isometric strength measure to approximate the resistance for isotonic exercise may carry inherent error However, the effect of this is likely small and the repeated assessment and matched progression of resistance in the exercise regimen would likely minimize this.
While reliability of this study’s measurement tools is strong,26,27,29,30,39‑42 a higher number of participants may have demonstrated a clearer between side difference for CSA. Furthermore, most participants were female and there is conflicting evidence to suggest that the menstrual cycle has an impact on response to strength training.43‑45 This was not controlled and so may be a confounding factor. However, it is unlikely that this would be controlled in a current clinical environment.
This study was performed in individuals with asymptomatic untrained shoulders. Those with trained shoulders or patients with symptomatic shoulders and/or local pathology may respond differently There may be other neurosensory and psychological mechanisms and benefits related to application of BFRT that were not directly examined in this study.
The exercise regimen of this study was designed to be simple and clinically feasible. The frequency, exercise selection, and equipment used aside from the BFR device are all very common in clinical practice for the shoulder. Vari-
Mean(SD) Before Mean(SD) After Mean Difference % Change Effect Size p-value Strength (lb) ER BFRT side 21.1(4.8) 22.9(6.8) 1.8 8.5% 0.31 0.135 ER non-BFRT side 20.0(5.4) 22.0(6.7) 2.0 10.0% 0.33 0.118 FC BFRT side 19.2(7.6) 20.5(8.0) 1.2 6.3% 0.16 0.011 FC non-BFRT side 18.9(7.6) 20.7(7.1) 1.8 9.6% 0.25 0.001
BFRT side 892(176) 979(203) 88 9.8% 0.46 0.004 Supraspinatus non-BFRT side 888(179) 943(175) 55 6.2% 0.31 0.093 Infraspinatus BFRT side 1778(509) 1987(534) 207 11.7% 0.40 0.009 Infraspinatus non-BFRT side 1808(653) 1862(482) 55 3.0% 0.10 0.088 Tendon Thickness
Supraspinatus BFRT side 6.7(1.3) 6.6(0.8) -0.1 -1.9% -0.12 0.472 Supraspinatus non-BFRT side 6.8(0.6) 6.7(1.0) -0.1 -1.6% -0.13 0.572 SD standard deviation, ER external rotation, FC full can / elevation in the scapular plane, BFRT blood flow restricted training, lb pounds, mm2 millimeters squared
(mm2)
Between
Mean Difference p-value Strength (lb) External Rotation -0.2 0.890 Full Can -0.6 0.184 Cross-Sectional Area (mm2) Supraspinatus 33 0.470 Infraspinatus 152 0.156 Tendon Thickness
2
Supraspinatus -0.02 0.460
non-BFRT
subtracted
BFRT side. lb pounds, mm
mil-
Arms
(mm
)
Mean difference is
side
from
2
limeters squared
Effects of Low-Load Blood Flow Restriction Training on Rotator Cuff Strength and Hypertrophy: Case Series International Journal of Sports Physical Therapy
ous BFR devices are also becoming more common and accessible in clinical environments. When applied appropriately, BFRT has been reportedly relatively safe,22,23,31,46,47 and in this study all participants were able to complete the study without adverse events. Given these factors, it seems likely that a similar regimen could be applied in clinical practice.
CONCLUSION
This study and others examining the response of RC tissue to BFRT have produced mixed results.17‑21,37 This study is the first to examine the hypertrophic response specifically of the supraspinatus and infraspinatus to low-load BFRT as measured by US. The potential for a confounding systemic response makes determining if low-load BFRT is more ben-
eficial than low-load non-BFRT in asymptomatic untrained shoulders difficult. However, the hypertrophy gains on the BFRT side along with strength gains in a similar pattern to other studies are encouraging and warrant further study.
CONFLICT OF INTEREST
All authors, their immediate family, and any research foundation with which they are affiliated did not receive any financial payments or other benefits from any commercial entity related to the subject of this article.
Submitted: December 12, 2023 CDT, Accepted: April 30, 2024 CDT
© The Author(s)
This is an open-access article distributed under the terms of the Creative Commons Attribution 4.0 International License (CCBY-NC-4.0). View this license’s legal deed at https://creativecommons.org/licenses/by-nc/4.0 and legal code at https://creativecommons.org/licenses/by-nc/4.0/legalcode for more information.
Effects of Low-Load Blood Flow Restriction Training on Rotator Cuff Strength and Hypertrophy: Case Series International Journal of Sports Physical Therapy
REFERENCES
1. Leclerc A, Chastang JF, Niedhammer I, Landre MF, Roquelaure Y Incidence of shoulder pain in repetitive work. Occup Environ Med. 2004;61(1):39-44.
2. Lee PN, Lee M, Haq AM, Longton EB, Wright V Periarthritis of the shoulder Trial of treatments investigated by multivariate analysis. Ann Rheum Dis. 1974;33(2):116-119. doi:10.1136/ard.33.2.116
3. Weiss KJ, Allen SV, McGuigan MR, Whatman CS. The relationship between training load and injury in men’s professional basketball. Int J Sports Phys Perf 2017;12(9):1238-1242. doi:10.1123/ijspp.2016-0726
4. Seitz AL, McClure PW, Finucane S, Boardman ND 3rd, Michener LA. Mechanisms of rotator cuff tendinopathy: intrinsic, extrinsic, or both? Clinical Biomech. 2011;26(1):1-12. doi:10.1016/ j.clinbiomech.2010.08.001
5. Oh JH, Yoon JP, Kim DH, et al. Does strength deficit correlate with shoulder function in patients with rotator cuff tears? Characteristics of massive tears. J Shoulder Elbow Surg 2019;28(10):1861-1868. doi:10.1016/j.jse.2019.03.015
6. Nakamura Y, Gotoh M, Mitsui Y, et al. Prognostic factors affecting clinical outcomes after arthroscopic rotator cuff repair: importance of functional recovery by 3 months after surgery. J Orthop Surg Res. 2018;13(1):310. doi:10.1186/s13018-018-1014-8
7 Ellenbecker TS, Cools A. Rehabilitation of shoulder impingement syndrome and rotator cuff injuries: an evidence-based review Br J Sports Med 2010;44(5):319-327 doi:10.1136/bjsm.2009.058875
8. Slysz J, Stultz J, Burr JF. The efficacy of blood flow restricted exercise: A systematic review & metaanalysis. J Sci Med Sport 2016;19(8):669-675. doi:10.1016/j.jsams.2015.09.005
9. Loenneke JP, Wilson JM, Marin PJ, Zourdos MC, Bemben MG. Low intensity blood flow restriction training: a meta-analysis. Eur J Appl Physiol. 2012;112(5):1849-1859. doi:10.1007/ s00421-011-2167-x
10. Hughes L, Paton B, Rosenblatt B, Gissane C, Patterson SD. Blood flow restriction training in clinical musculoskeletal rehabilitation: a systematic review and meta-analysis. Brit J Sports Med. 2017;51(13):1003-1011. doi:10.1136/ bjsports-2016-097071
11. Tennent DJ, Hylden CM, Johnson AE, Burns TC, Wilken JM, Owens JG. Blood flow restriction training after knee arthroscopy: A randomized controlled pilot study Clinical J Sport Med 2017;27(3):245-252. doi:10.1097/jsm.0000000000000377
12. Nakajima T, KM, Iida H, Takano H, et al. Use and safety of KAATSU training: Results of a national survey Inter J Kaatsu Train Res 2006;2:5-13. doi:10.3806/ijktr.2.5
13. Loenneke JP, Fahs CA, Wilson JM, Bemben MG. Blood flow restriction: the metabolite/volume threshold theory. Med Hypoth. 2011;77(5):748-752. doi:10.1016/j.mehy.2011.07.029
14. Pearson SJ, Hussain SR. A review on the mechanisms of blood-flow restriction resistance training-induced muscle hypertrophy Sports Med 2015;45(2):187-200. doi:10.1007/s40279-014-0264-9
15. Dankel SJ, Jessee MB, Abe T, Loenneke JP The effects of blood flow restriction on upper-body musculature located distal and proximal to applied pressure. Sports Med. 2016;46(1):23-33. doi:10.1007/ s40279-015-0407-7
16. Abe T, YT, Midorikawa T, Sato Y, et al. Skeletal muscle size and circulating IGF-1 are increased after two weeks of twice daily “KAATSU” resistance training. Inter J Kaatsu Train Res 2005;200(1):6-12. doi:10.3806/ijktr.1.6
17. Pavlou K, Korakakis V, Whiteley R, Karagiannis C, Ploutarchou G, Savva C. The effects of upper body blood flow restriction training on muscles located proximal to the applied occlusive pressure: A systematic review with meta-analysis. PLoS One 2023;18(3):e0283309. doi:10.1371/ journal.pone.0283309
18. Brumitt J, Hutchison MK, Kang D, et al. Blood flow restriction training for the rotator cuff: a randomized controlled trial. Inter J Sports Phys Perf. 2020;15(8):1175-1180. doi:10.1123/ijspp.2019-0815
19. Lambert B, Hedt C, Daum J, et al. Blood flow restriction training for the shoulder: A case for proximal benefit. Am J Sports Med 2021;49(10):2716-2728. doi:10.1177/ 03635465211017524
20. Bowman EN, Elshaar R, Milligan H, et al. Upperextremity blood flow restriction: the proximal, distal, and contralateral effects-a randomized controlled trial. J Shoulder Elbow Surg 2020;29(6):1267-1274. doi:10.1016/j.jse.2020.02.003
Effects of Low-Load Blood Flow Restriction Training on Rotator Cuff Strength and Hypertrophy: Case Series International Journal of Sports Physical Therapy
21. Lambert BS, Hedt C, Ankersen JP, et al. Rotator cuff training with upper extremity blood flow restriction produces favorable adaptations in division IA collegiate pitchers: a randomized trial. J Shoulder Elbow Surg 2023;32(6):e279-e292. doi:10.1016/ j.jse.2023.02.116
22. McGinniss JH, Mason JS, Morris JB, Pitt W, Miller EM, Crowell MS. The effect of blood flow restriction therapy on shoulder function following shoulder stabilization surgery: A case series. Int J Sports Phys Ther 2022;17(6):1144-1155. doi:10.26603/001c.37865
23. Safford DW, Shah KM, McClure P Blood flow restriction training as an adjunct to conventional care in a patient with adhesive capsulitis and rotator cuff tendinopathy: A case report. J Orthop Sports Phys Ther Cases. 2021;1(4):4.
24. Ceballos A, Zeppieri G Jr, Bialosky J. Resident case series: Blood flow restriction as an adjunct to strengthening exercises in two patients with subacromial impingement and high irritability. Int J Sports Phys Ther 2022;17(5):931-940.
25. de Salles BF, Simão R, Miranda F, da Silva Novaes J, Lemos A, Willardson J. Rest interval between sets in strength training. Sports Med 2009;39(9):765-777 doi:10.2165/11315230-000000000-00000
26. Chen B, Liu L, Bin Chen L, et al. Concurrent validity and reliability of a handheld dynamometer in measuring isometric shoulder rotational strength. J Sport Rehabil. 2021;30(6):965-968. doi:10.1123/ jsr.2020-0021
27 Chamorro C, Arancibia M, Trigo B, Arias-Poblete L, Jerez-Mayorga D. Absolute reliability and concurrent validity of hand-held dynamometry in shoulder rotator strength assessment: Systematic review and meta-analysis. Int J Environ Res Pub Health 2021;18(17). doi:10.3390/ijerph18179293
28. Beshay N, Lam PH, Murrell GAC. Assessing the reliability of shoulder strength seasurement: handheld versus fixed dynamometry Shoulder Elbow 2011;3(4):244-251. doi:10.1111/ j.1758-5740.2011.00137.x
29. Shah KM, Clark BR, McGill JB, Lang CE, Maynard J, Mueller MJ. Relationship between skin intrinsic fluorescence--an indicator of advanced glycation end products-and upper extremity impairments in individuals with diabetes mellitus. Phys Ther 2015;95(8):1111-1119. doi:10.2522/ptj.20140340
30. Shah KM, Brennan M, Bucantis J, Kust E, Washatka J, McClure PW [Poster Abstract] Reliability of ultrasound measurements of rotator cuff muscle cross sectional area in healthy adults. J Orthop Sports Phys Ther 2017;47(1):A58-A161. doi:10.2519/ jospt.2017.47.1.A58
31. Watson R, Sullivan B, Stone A, et al. Blood flow restriction therapy: An evidence-based approach to postoperative rehabilitation. JBJS Rev 2022;10(10). doi:10.2106/jbjs.rvw.22.00062
32. Mitchell CJ, Churchward-Venne TA, West DW, et al. Resistance exercise load does not determine training-mediated hypertrophic gains in young men. J Appl Physiol (1985). 2012;113(1):71-77. doi:10.1152/ japplphysiol.00307.2012
33. Lopez P, Radaelli R, Taaffe DR, et al. Resistance training load effects on muscle hypertrophy and strength gain: Systematic review and network metaanalysis. Med Sci Sports Exerc 2021;53(6):1206-1216. doi:10.1249/mss.0000000000002585
34. Ampomah K, Amano S, Wages NP, et al. Blood flow-restricted exercise does not induce a crosstransfer of effect: A randomized controlled trial. Med Sci Sports Exerc 2019;51(9):1817-1827 doi:10.1249/ mss.0000000000001984
35. Madarame H, Neya M, Ochi E, Nakazato K, Sato Y, Ishii N. Cross-transfer effects of resistance training with blood flow restriction. Med Sci Sports Exerc 2008;40(2):258-263. doi:10.1249/ mss.0b013e31815c6d7e
36. Reeves GV, Kraemer RR, Hollander DB, et al. Comparison of hormone responses following light resistance exercise with partial vascular occlusion and moderately difficult resistance exercise without occlusion. J Appl Physiol (1985). 2006;101(6):1616-1622. doi:10.1152/ japplphysiol.00440.2006
37. Roehl T, Lambert BS, Ankersen J, Hernandez K, McCulloch PC, Hedt C. Optimal blood flow restriction occlusion pressure for shoulder muscle recruitment with upper extremity exercise. Am J Sports Med. 2023;51(7):1859-1871. doi:10.1177/ 03635465231166959
38. Hedt C, McCulloch PC, Harris JD, Lambert BS. Blood flow restriction enhances rehabilitation and return to sport: The paradox of proximal performance. Arthrosc Sports Med Rehabil. 2022;4(1):e51-e63. doi:10.1016/j.asmr.2021.09.024
39. Chamorro C, Armijo-Olivo S, De la Fuente C, Fuentes J, Chirosa LJ. Absolute reliability and concurrent validity of hand held dynamometry and isokinetic dynamometry in the hip, knee and ankle joint: Systematic review and meta-analysis. Open Med 2017;12:359-375. doi:10.1515/med-2017-0052
Effects of Low-Load Blood Flow Restriction Training on Rotator Cuff Strength and Hypertrophy: Case Series International Journal of Sports Physical Therapy
40. Safford DW, SK, Garant LG, et al. OP0180 Reliability and comparison of fixed versus handheld shoulder dynamometry in student physical therapists. J Orthop Sports Phys Ther. 2023;53(2):CSM55-CSM146. doi:10.2519/ jospt.2023.53.2.CSM55
41. Wu Y, Barrere V, Ashir A, et al. High-frequency quantitative ultrasound imaging of human rotator cuff muscles: Assessment of repeatability and reproducibility. Ultrason Imaging. Published online 2023:1617346231207404. doi:10.1177/ 01617346231207404
42. Schneebeli A, Egloff M, Giampietro A, Clijsen R, Barbero M. Rehabilitative ultrasound imaging of the supraspinatus muscle: Intra- and interrater reliability of thickness and cross-sectional area. J Bodyw Mov Ther 2014;18(2):266-272. doi:10.1016/ j.jbmt.2013.09.009
43. Colenso-Semple LM, D’Souza AC, Elliott-Sale KJ, Phillips SM. Current evidence shows no influence of women’s menstrual cycle phase on acute strength performance or adaptations to resistance exercise training. Front Sports Act Living 2023;5:1054542. doi:10.3389/fspor.2023.1054542
44. Sung ES, Kim JH. The resistance training effects of different weight level during menstrual cycle in female. J Exerc Rehabil 2019;15(2):249-253. doi:10.12965/jer.193808.024
45. McNulty KL, Elliott-Sale KJ, Dolan E, et al. The effects of menstrual cycle phase on exercise performance in eumenorrheic women: A systematic review and meta-analysis. Sports Med. 2020;50(10):1813-1827 doi:10.1007/ s40279-020-01319-3
46. Minniti MC, Statkevich AP, Kelly RL, et al. The safety of blood flow restriction training as a therapeutic intervention for patients with musculoskeletal disorders: A systematic review. Am J Sports Med 2020;48(7):1773-1785. doi:10.1177/ 0363546519882652
47. Patterson SD, Hughes L, Warmington S, et al. Blood flow restriction exercise: considerations of methodology, application, and safety Front Physiol 2019;10:533. doi:10.3389/fphys.2019.00533
Effects of Low-Load Blood Flow Restriction Training on Rotator Cuff Strength and Hypertrophy: Case Series International Journal of Sports Physical Therapy
Rehabilitation Following ACL Repair with Internal Brace Ligament Augmentation in Female Gymnast:
A Resident’s
Colten Haack, DPT1a , Giorgio Zeppieri, PT2 , Micheal W Moser, MD3
Case Report
1 Department of Sports Medicine, University of Wisconsin Health, 2 Department of Rehabilitation, University of Florida Health, 3 Sports Medicine, Florida Orthopedic Institute
Keywords: Gymnastics, ACL repair, Internal Brace Ligament Augmentation, rehabilitation, Sherman Type 1 https://doi.org/10.26603/001c.117773
International Journal of Sports Physical Therapy
Introduction
Anterior Cruciate Ligament (ACL) injuries continue to be a major source of morbidity in gymnastics. The gold standard is to perform an ACL Reconstruction (ACLR). However, injuries to the proximal femoral attachment of the ACL have demonstrated an ability to regenerate. An alternative surgical intervention to the ACLR in this ACL tear subgroup is an ACL repair The purpose of this case report is to provide a rehabilitation progression for a female gymnast after an ACL repair with Internal Brace Ligament Augmentation (IBLA).
Case Description
The subject was a 16-year-old female who presented with a Sherman Type 1 proximal avulsion of her ACL. She underwent an ACL repair with IBLA. Physical therapy interventions followed a sequential and multi-phased approach based on time for tissue physiologic healing and individual progression. Patient reported outcomes including the International Knee Documentation Committee (IKDC), the Anterior Cruciate Ligament Return to Sport After Injury (ACL-RSI) and the Optimal Screening for Prediction of Referral and Outcome Yellow Flag (OSPRO-YF) were assessed in conjunction with isokinetic strength and hop performance testing to determine return to sport readiness.
Outcomes
The subject completed 42 sessions over the course of 26 weeks in addition to a home exercise program. At return to sport, clinically meaningful improvement was observed in patient reported outcomes including the IKDC, ACL-RSI, and OSPRO-YF. Additionally, strength and hop performance surpassed established thresholds of clinical significance. The subject returned to sport at six months post-operatively.
Conclusion
The subject in this case report returned to full participation in gymnastics six months after an ACL repair with internal bracing following a sequential and multi-phased rehabilitation. The primary ACL repair with IBLA appeared beneficial to this patient and could benefit from additional study in other athletes and athletic populations.
Level of Evidence
Level 5
Corresponding Author: Colten Haack
Department of Sports Medicine, University of Wisconsin Health, 4602 Eastpark Blvd, Madison, WI 53718 (USA) E-mail: chaack@uwhealth.org
Case Reports
a
Published online June 1, 2024:745-757. doi:10.26603/001c.117773
Haack C, Zeppieri G, Moser MW. Rehabilitation Following ACL Repair with Internal Brace Ligament Augmentation in
Female Gymnast: A Resident’s Case Report. IJSPT
INTRODUCTION
The Anterior Cruciate Ligament (ACL) is one of the most commonly injured ligaments in the body with as many as 200,000 ACL injuries occurring each year in the United States.1 The injury rate for females is nearly double that of males, 2.10 compared 1.12 respectively per 10,000 athletic exposures. The injury rate increases to 4.80 per 10,000 athletic exposures for athletes in fixed-object high impact rotational landing sports such as gymnastics.2 The gold standard for treatment over decades has been an ACL reconstruction using either autografts or allografts.1,3
Some researchers suggest the ACL has potential to heal without reconstruction for acute tears that occur in the proximal ACL.4‑6 Specifically, Sherman type 1 ACL tears (proximal avulsions of the ACL at the femoral attachment) may benefit from an ACL repair with internal bracing.7 The advantages include decreased donor site morbidity pain and weakness, maintaining proprioception of the native ACL , earlier recovery, minimizing osteoarthritis, and fortification of the repair with biological healing of the proximal ACL.8‑11 There are a number of different surgical techniques utilized to repair the ACL including: Suture Anchor Repair (SAR), Internal Brace Ligament Augmentation (IBLA), Dynamic Intraligamentary Stabilization (DIS), or Bridge Enhanced Anterior Cruciate Ligament Repair (BEAR).1 Attempts at repairing the ACL have been used since the 1970's, but were previously associated with less than favorable outcomes including a high failure rate in athletes and long periods of immobilization.12 Since then, improved surgical techniques and appropriate patient selection have demonstrated favorable results in terms of subjective and objective outcomes while restoring function in patients who receive a primary repair compared to those with an ACLR.13‑16
The surgical technique described in this case report involves an ACL repair using IBLA. It is suggested the use of IBLA in conjunction to repairing the ACL preserves the native proprioceptive fibers of the ACL while acting as a secondary stabilizer 14,17 IBLA consists of an ultra-high strength 2mm wide synthetic polyethylene tape as an internal brace to provide additional external support to bridge the healing ACL from tibia to femur.14,18,19 In addition to the anatomical repair, the IBLA is reinforced with femoral fixation via a button anchor, while the tibial fixation is held with a knotless bone anchor 18 The internal brace acts as secondary stabilizer, reducing elongation and peak loads on the ACL repair, restricting gap formation to less than 3mm at loads up to 350 N.20 This is crucial in stabilizing the ACL from loads that occur through daily activity while allowing for an earlier progression through the rehabilitation protocol compared to an ACLR.14,17,20
Variability exists in the literature regarding an appropriate rehabilitation progression in terms of bracing, range of motion (ROM) restrictions, exercise progression, and return to sport for patients who undergo an ACL repair, specifically those with internal bracing. The ACL repair is gaining popularity as a potential treatment alternative for acute ACL ruptures.14 Therefore, there is a need for surgeons and
physical therapists to collaborate and provide technique specific rehabilitation guidelines for these procedures. The purpose of this case report is to provide an example of a rehabilitation progression used for a high-level female gymnast after an ACL repair with IBLA.
CASE DESCRIPTION
The subject was a 16-year-old female who was actively competing in high level gymnastics and was committed to a Division 1 gymnastics program. The subject originally hurt her right knee roughly four weeks prior, while competing in a gymnastics event. She was performing a twisting double Salto dismount on the bars, when the side of her tibia collided with the upper bar, resulting in knee pain as she landed on her injured leg. She attempted to continue competing the same day and over the next week, but consistently experienced pain, clicking and persistent swelling in her knee. She reported developing a mild extension deficit which inhibited her ability to compete. Three weeks after her injury, the subject sought out care. An MRI was obtained which revealed a disruption of the anterior cruciate ligament, avulsed from the femoral attachment. After all treatment options were provided to the subject and her mother, they elected to proceed with a right knee ACL repair with internal bracing for an expedited return to sport.
OUTCOME MEASURES
The subject was examined at baseline prior to treatment, and then re-examined every four weeks until discharged from physical therapy Performance measurements were obtained every eight weeks, starting at week eight post-operatively and continuing until discharged from therapy
PATIENT REPORTED OUTCOMES
To measure symptoms, function, and sports activity the International Knee Documentation Committee (IKDC) Subjective Knee Form was used. It is a reliable and valid kneespecific questionnaire that is appropriate for patients with a wide variety of knee problems.21‑23 The IKDC consists of 18 questions (7 items for symptoms, 1 item for sport participation, 9 items for daily activities, and 1 item for current knee function). The score ranges from 0 to 100, where 100 indicates no limitation with daily or sporting activities and the absence of symptoms.23 Irrgang et al. determined that the normal rating of knee function for those who have undergone an ACLR was an IKDC score of 95.2, nearly normal was 91.2, abnormal was 84.9, and severely abnormal was 75.4. In addition, based on test-retest reliability, the MCID is 11.5 points.21‑23
The Anterior Cruciate Ligament Return to Sport After Injury (ACL-RSI) scale is a reliable and valid tool for evaluation of psychological readiness to return to sport after ACL injury 24 The ACL-RSI consists of three domains: emotions, confidence, and risk appraisal. Scores for each domain are summed and averaged for a total score between 0 and 100. Higher scores indicate greater psychological readi-
Rehabilitation Following ACL Repair with Internal Brace Ligament Augmentation in Female Gymnast: A Re… International Journal of Sports Physical Therapy
ness.24 The shortened version of the scale, which contains six of the original items, was the version used in this study. Webster et al. found a cutoff score of 60 on the short version, when assessed at six months post-operatively, having a high specificity and moderate sensitivity that the athlete will return to their preinjury level of sport by 12 months.25 In another study Webster et al. also determined the minimally important change (MIC) on the short form was 15.1 points.24
The Optimal Screening for Prediction of Referral and Outcome Yellow Flag (OSPRO-YF) tool which assesses negative mood, fear-avoidance, and positive coping was used.26 This tool is a reliable and valid multidimensional psychological assessment tool for individuals with musculoskeletal pain.26 The OSPRO-YF assesses 11 psychological constructs within three broad psychological domains including: self-efficacy and acceptance (pain self-efficacy, rehabilitation self-efficacy, and chronic pain acceptance), negative pain coping (fear avoidance beliefs surrounding work and physical activity, pain catastrophizing, kinesiophobia, and pain anxiety), and negative mood (depression, anxiety, and anger).27 Based on patient responses, the OSPRO-YF generates a score estimate for each of the 11 constructs. Scores above the 75th percentile in negative pain coping or negative mood constructs or below the 25th percentile in self-efficacy/acceptance constructs are marked with a “yellow flag” for their respective domains.27 A summary OSPRO-YF score for a patient is a simple count of the number of constructs with yellow flags.27 The higher the number of yellow flags indicates higher pain associated distress and can help understand the patient's treatment response and overall pain experience.
PERFORMANCE MEASURES
To objectively test muscular strength and performance, a battery of tests was used to help assess physical preparedness for return to sport. Performance testing included both strength and hop testing, but only strength testing was assessed during the original eight-week measurement. Isokinetic strength testing was measured at 60 deg/sec, using the Biodex System 3 dyanamometer. In addition, hop testing included single leg hop, single leg triple hop, and single leg cross-over hop. Historically, a Limb Symmetry Index (LSI) of 90% or greater between limbs following ACL reconstruction has been regarded as satisfactory for both strength and hop performance.28 Buchanan et al. studied females aged 15-17 years old and suggested that they have a strength to bodyweight ratio of 70%, which was the goal for return to sport for this athlete.29
SURGICAL PROCEDURE
During the procedure, the initial arthroscopic findings revealed that the subject ' s ACL was partially torn with posterolateral bundle laxity and the anteromedial bundle avulsed from femoral footprint. (Figures 1 and 2) Her PCL was intact, and there was no other significant pathology in the patellofemoral joint or the medial and lateral compartments.
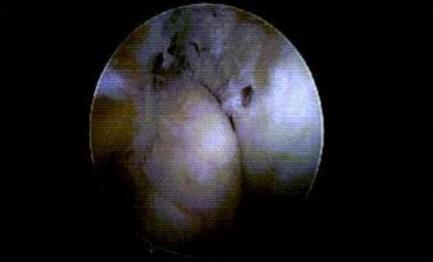
The surgical description was as follows: The standard lateral portal site was created, and the knee joint was surveyed in the usual fashion with the arthroscopic findings mentioned above. Under direct visualization, the medial parapatellar portal was created. The physician then turned their attention to the ACL repair
The central aspect of the ACL footprint on the femur was identified to place several evenly spaced holes in the notch, including, a large imprint at the center of the ACL footprint to prepare for drilling. Then, a passing pin was drilled into the center of the ACL footprint in the notch and out the lat-
Figure 1. Surgical photo of the patient’s torn ACL
Figure 2. Surgical photo showing the ACL torn from femur
Figure 3. ACL stump with Fiber Ring suture
ACL
with Internal
in Female Gymnast: A Re… International Journal of Sports Physical Therapy
Rehabilitation Following
Repair
Brace Ligament Augmentation
eral aspect of the femur Following the placement and removal of a tibial guide and cannulated pin, a wire lasso was then loaded through the cannulated pin and pulled out of the anterolateral portal. A passport cannula was placed in the anteromedial portal. The FiberRing (Arthrex) was then loaded and pierced through the mid-substance of the ACL. (Figure 3) The free end was loaded through the loop and the suture was cinched on itself This process was repeated twice for a total of two sutures through the stump of the ACL. The sutures were then loaded on the tightrope. (Figure 4) The tightrope sutures were shuttled out through the lateral femur and the button flipped on the lateral femoral cortex. The shortening strands were then pulled to hoist the ACL stump towards the femoral footprint. (Figure 5)
EXAMINATION
The subject was referred to physical therapy the day following her ACL repair. The subject ambulated with standard axillary crutches and a knee immobilizer, weight bearing as tolerated (WBAT) with a step-to gait. She reported decreased daily function, increased knee pain, and altered quality of life during the subjective portion of her evaluation evidenced by patient reported outcomes (PROs). During the initial evaluation, post-op dressings were removed, and new dressings were applied. The subject presented with moderate 2+ swelling and the incisions were stabilized by sutures and were clean and dry. There were no signs of infection and the subject reported tenderness to palpation
around the surgical incisions. Her post-operative pain was rated a 4/10 on the numeric pain rating scale (NPRS) during evaluation, but at its worst the subject would rate her pain as 8/10. She described the pain as sharp and throbbing, along with feelings of perceived weakness and instability Objective measures were taken and are listed in Table 1. Her primary goal for therapy was to compete nine months later in her upcoming gymnastics season.
CLINICAL IMPRESSION
This subject presented with typical post-surgical limitations including functional limitations in terms of strength deficits, ROM limitations, pain, joint inflammation, and gait abnormalities. She did not demonstrate signs of any other red flags that would warrant further medical attention or referral. The subject in this study completed physical therapy two times per week. She was given a home exercise program of similar exercises to be completed on days not in clinic.
INTERVENTIONS
While evidence is limited, it has been accepted that the ACL is inherently stable following repair with IBLA.30 Therefore, only a short period of bracing is recommended until quadriceps control is restored. In addition, obtaining full knee extension is a top priority along with progressively increasing knee flexion.30 Early weight bearing is recommended as it allows the joint to begin tolerating loads in a safe manner with the use of crutches.19 As the subject progresses through rehabilitation, there is consistency across the literature that the use of IBLA allows return to running as early as three months post-operatively However, the subject must demonstrate appropriate strength and psychological readiness through objective testing and PROs, similar to those used for ACLR.18,19,31 Lastly, based on current literature, sport specific training can begin between 17 and 20 weeks postoperatively and should continue until the subject demonstrates the appropriate functional capacity to progress to full return to sport (RTS), passing similar criteria used for an ACLR.19,31
Prior to beginning physical therapy, the therapists (CH, GZ) and physician (MM) discussed the proposed protocol below including any precautions, time-line restrictions, and criteria for advancement through the phases.
PHASE I – PROTECTIVE PHASE (DAYS 1 –7)
The focus of this phase is to restore normal ROM, particularly full knee extension, which is critical to attain early in the rehabilitation process to achieve long term success and to return to sport.32,33 In addition, there is a large emphasis on maintaining quadriceps and gluteal activation during this phase, while also working to restore ambulation without compensations or the use of an assistive device.34ACL deficient patients can develop a habit of walking with a flexed knee gait, potentially complicating the restoration of the tibiofemoral and patellofemoral biomechanics.33,35
Figure 4. TightRope button with internal brace
Figure 5. Repaired ACL with internal brace
Rehabilitation Following ACL Repair with Internal Brace Ligament Augmentation in Female Gymnast: A Re… International Journal of Sports Physical Therapy
Table 1. Evaluation Objective Measures
Sensation
Strength (Manual Muscle Testing)
Quadriceps Not tested, Trace quad activation 5/5
Range of Motion (ROM)
Knee hyperextension/extension/flexion (in degrees)
*Right knee was assessed Active Assistive ROM, L knee was assessed Active ROM
Table 3. Performance Outcome Measures
Isokinetic @ 60 deg/sec
Quad Strength LSI 59.9 %
Hamstrings LSI 82.4 %.
Peak Torque: Bodyweight 44%
Quad Strength LSI 79 %
Hamstrings LSI 96.6%
Peak Torque: Bodyweight 72%
Quad Strength LSI 94 %
Hamstrings LSI 97 %.
Peak Torque: Bodyweight 72% YES Y-Balance Composite Score LSI 97%
Hop Testing
The first day of treatment consisted of restoring knee extension via a heel prop exercise. Other exercises to restore ROM included ankle pumps, patellar mobilizations and heel slides. Isometric quadriceps sets were initiated to begin restoring quad activation. Education consisted of pain and swelling management techniques including icing, compression via an ace wrap, and elevation. Furthermore, post-surgical precautions were emphasized including keeping the incision drying during bathing, sleeping in the knee immobilizer, and using the crutches and knee immobilizer during all ambulation. In the days following, straight leg raises (SLR) into flexion and abduction with the knee locked in extension via the knee immobilizer were initiated to continue restoring strength in the quadriceps and gluteal muscles. Neuromuscular Electrical Stimulation (NMES) is a modality that causes the muscles to contract mimicking the action potential coming from the central nervous system.36 NMES is used to build muscle activation and prevent atrophy, especially with immobilized patients.35,36 NMES was incorporated in conjunction with the isometric quad sets and SLR into flexion exercises to assist in restoring quadriceps strength. The Excel Multi IV (Excel Tech LTD, Oakville, Ontario, Canada). electrical stimulation machine was used with an amplitude that produced a tetanic muscle contraction, using a ramp of three seconds along with an on: off ratio of 10 seconds: 30 seconds, and a total treatment time of 15 minutes. The subject was educated on the proper gait
Single Leg Hop LSI 99%
Triple Hop LSI 96%
Cross-over Hop LSI 96%
sequencing, emphasizing a heel to toe gait using bilateral crutches while in the knee immobilizer. The criteria required to progress to the next phase of rehab consisted of achieving a knee extension within 5° of opposite leg, obtaining > 90 degrees of knee flexion, and demonstrating the ability to perform a strong quadriceps set and a SLR without quadriceps lag. (Appendix 1)
PHASE II – EARLY MOBILITY (WEEK 2 - 3)
This next phase of rehabilitation continued to build upon the previous. The knee immobilizer and crutches were removed once the subject could demonstrate quadriceps control via repetitive SLRs without lag, full knee extension, and the ability to ambulate without gait compensations. ROM remained a primary focus with the goal of maintaining full knee extension compared to the contralateral side while progressing knee flexion to >110° flexion. The subject began using the recumbent bike for cardiovascular exercise and to facilitate knee flexion once she demonstrated >105 degrees of active assisted knee flexion. SLRs were progressed via load using ankle weights. Closed kinetic chain (CKC) exercises were used to continue building strength and proprioceptive capacity in the quadriceps and gluteal muscles of the involved lower extremity Exercises included: leg press, mini-squats, terminal knee extension with resistance bands, calf raises, as well as forward and
Right Left
Intact Intact
Light touch
0/4/60 5/0/130
test
1+ Not Tested
Effusion Sweep
(0-3+)
Return to Running Return to Gymnastics Clinical Threshold Met
Outcome Initial Assessment at 8 weeks
Was not reassessed YES
YES
LSI= Limb symmetry index
Following ACL Repair with Internal Brace Ligament Augmentation in Female Gymnast: A Re… International Journal of Sports Physical Therapy
Rehabilitation
lateral step-ups and heel taps. Blood flow restriction (BFR) was used due to the ability to improve strength and hypertrophy with low loads.37 The subject performed the recommended repetition scheme of 30/15/15/15 with 45 seconds rest between sets and the cuff remaining inflated at 80% of occlusion.38,39 The total tourniquet time never exceeded 10 minutes in duration per session. BFR was used for several exercises including SLRs, leg press, and mini squats. To progress to the next phase, the subject had to demonstrate knee extension ROM equal to the opposite side and >110° of knee flexion, perform a SLR without a quad lag, and independently ambulate without an assistive device or compensations. (Appendix 1)
PHASE III – STRENGTHENING (WEEK 4 – 12)
The focus of Phase III is a continued progression from Phase II. The subject continued to focus on normalizing ROM to the uninvolved side. Loading in CKC was progressed in terms of load and depth to continue working on eccentric control.40 Step-ups and heel tap exercises progressed from 4 inch boxes to 12 inch by week 12. Open Kinetic Chain (OKC) exercises were initiated starting with knee extension, limiting knee flexion ROM from 90° to 40°, with low load and the weight at the proximal tibia at week six.41 Early knee extension exercises were performed with BFR with the parameters mentioned above. OKC knee extension progressed to full ROM by week eight. Proprioceptive drills evolved from Phase I with weight shifting, to single limb stance in Phase II, to performing balance exercises in single leg stance on a solid surface with the addition of external/ internal perturbations. This was further progressed by replacing the stable surface with an unstable surface without perturbations, and finally, perturbations were reintroduced while on an unstable surface. The next phase looked to progress the subject to straight line jogging and early plyometric activity The criteria to progress the subject to Phase IV included: achieving ROM within 5 degrees of flexion and full extension equal to contralateral side, without complaints of patellofemoral symptoms, as well as isokinetic strength limb symmetry index (LSI) for quadriceps and hamstring strength >75% of the uninvolved side.31,42‑44 By week 12 the subject demonstrated full knee flexion and hyperextension ROM compared to the contralateral side. The first round of performance testing was completed via isokinetic dynamometry via the Biodex at a speed of 60 deg/sec at week eight. The subject’s isokinetic strength measurements at 60 deg/sec demonstrated quadriceps strength LSI deficit of 40.1% and a hamstrings LSI deficit of 17.6%. In terms of normalizing her strength to bodyweight, she kicked at a ratio of 44% of her bodyweight. She remained in this phase until she demonstrated sufficient strength to tolerate light plyometric activity in Phase IV (Appendix 1)
PHASE IV - LIGHT PLYOMETRIC/RETURN RUNNING (3 –4 MONTHS)
The focus of Phase IV is to continue building strength within the lower extremity while also introducing the sub-
ject to light impact. Many of the same OKC and CKC exercises were performed without restrictions with the intent of increasing load per session. Jogging was initiated at week 13 which consisted of a walk: jog ratio starting at 1 min: 1 min for 10 minutes. This was repeated on three separate occasions with at least one day of rest between sessions prior to progressing to the next phase in the return to jogging program. Early plyometric activity consisted of double leg bounding on the leg press with an emphasis on equal pushoff and equal soft landing while minimizing dynamic knee valgus. This progressed to a double limb push-off with a single limb landing to eventually single leg jumps on the leg press machine. Once the subject tolerated all plyometric activity on the leg press, land based plyometrics were introduced, starting in the sagittal plane, using both limbs. Over the course of Phase IV, plyometric activity progressed to include multiple planes of movement and from double to single limb exercises. (Figures 6,7,9 ( BlazePods (BlazePod LTD, Tel Aviv, Israel) were incorporated in later phases of plyometrics to improve reaction time and provide unpredictability to the environment. (Figure 8) The next phase consisted of agility and sport specific drills. The criteria to progress to Phase V included the ability to demonstrate a strength LSI of quadriceps strength >80%, hop testing >85%, and a Y-Balance test composite score >85% (Appendix 1).45 At her 16-week assessment, the subject’s Y-Balance test composite score was >95%, and her isokinetic strength testing demonstrated a quadriceps strength LSI deficit of 21%, a hamstrings strength LSI deficit of 2%, and a strength to body weight ratio of 72%.
Figure 6. Example of patient performing a drop jump onto foam padding followed by a counter movement jump
Rehabilitation Following ACL Repair with Internal Brace Ligament Augmentation in Female Gymnast: A Re… International Journal of Sports Physical Therapy
PHASE V – AGILITY/ SPORT SPECIFIC DRILLS (4 – 6 MONTHS)
Phase V consisted of initiating sport specific agility drills while also continuing to normalize strength compared the contralateral limb. Running and plyometric activity had a larger emphasis on gymnastic-related activity to mimic
routines performed on the vault, floor, and beam events. The subject also began performing agility drills starting in a singular plane progressing to multiple planes of movement. Early exercises consisted of Figure 8 cutting drills, lateral side shuffle, sprints forward and backpedaling, and ladder drills. Eventually as her confidence and the quality of movement improved, drills progressed to include multiple planes of movement including agility work such as the T drill or box drills. Plyometrics involved the subject landing on unstable surfaces such as an Airex foam pad or BOSU ball and from varying heights and depths including multiple planes of movement, progressing from bilateral to unilateral dismounts, to mimic gymnastic related activity. The subject continued to progress through the strength, agility, and plyometric exercises until she achieved the criteria to completely return to sport. As she neared return to sport she began training with her gymnastics coach to work on appropriate progressions to return to the vault, beam, bars, and floor This was led by her coach, but communication continued between the coaching staff and the therapy team to determine what would be appropriate for the athlete. Criteria for physician release and complete return to sport consisted of a: strength LSI of > 90% compared to the contralateral limb, a normalized strength to body weight ratio of > 70%, as well as > 90% LSI on single leg hop, triple hop and crossover hop.31 In addition to performance testing, the subject had to score > 90 on the IKDC subjective questionnaire, > 60 on the ACL-RSI, and report zero yellow flags on OSPRO-YF.
Figure 7. Example of a patient performing forward hopping using hurdles
Figure 8. Example of a patient performing reactive agility drills using BlazePods
Figure 9. Example of a patient performing lateral hopping using hurdles
Rehabilitation Following ACL Repair with Internal Brace Ligament Augmentation in Female Gymnast: A Re… International Journal of Sports Physical Therapy
Table 2. Patient Reported Outcome Measures
IKDC= International Knee Documentation Committee, ACL-RSI= Anterior Cruciate Return to Sport after Injury, OSPRO-YF= Optimal Screening for Prediction of Referral and Outcome Yellow Flag
OUTCOMES
Three different patient reported outcomes were utilized for this case study including the IKDC, ACL-RSI, and the OSPRO-YF (Table 2). The subject’s IKDC score improved from 60.92 (severely abnormal) to 96.6 (normal) by the time of discharge. This is much larger than the MCID of 11.5 points as well as places the subject in the highest classification of knee function. In terms of ACL-RSI, the subject had an improved score of 71 to 95. This achieves both the MCID of 15.1 and demonstrates psychological readiness to return to sport as a perfect score for the ACL-RSI is 100. Lastly the OSPRO-YF was used, however, the subject never reported yellow flags through the course of treatment demonstrating an overall positive treatment response and pain experience. Performance testing was completed every eight weeks. The subject continued to demonstrate improvement in terms of performance testing throughout the course of treatment and achieved all RTS criteria at six months postoperatively This includes isokinetic strength and hop testing LSIs of > 90% as well as a normalized strength to bodyweight ratio of > 70%.
DISCUSSION
The purpose of this case report was to provide a template of a rehabilitation and return to sport progression based on the available research for the treatment of an elite gymnast who had an ACL repair with IBLA. Female athletes, specifically those in fixed object high impact rotational landing sports, such as gymnastics are at an increased risk for an ACL injury 2 While many athletes choose to pursue the standard ACL reconstruction, an ACL repair with IBLA provides an alternative to an ACLR with associated advantages of maintaining proprioception, preserving the biology, minimizing surgical morbidity and allowing for faster recovery with adequate rehabilitation.8 In a study by Ortmaier et al., 91% of patients who underwent ACL repair with IBLA returned to sport.46 Furthermore, ACL repair with IBLA appears to show signs of increased stability and superior patient reported outcomes at levels greater than those accepted following ACLR.47,48 However, ACL repair is not suitable for all patients and careful selection is imperative to its success. Consideration for an ACL repair is typically reserved for Sherman type I ACL tears that occur in the proximal ACL as it requires sufficient tissue length and quality, typically within the first three weeks from injury 7, 48 van der List et al. suggest that Type 1 ACL tears only
account for 16% of all tears for those aged between 19-55 years old, with type III being the most common.49
ACL repair has gained momentum as an alternative to ACL reconstructions as of recent.7 Currently, ACL primary repair techniques have shown promising results in treatment of an ACL rupture; however, there is no common consensus on an appropriate rehabilitation protocol. The therapists who participated in this case report followed a short period of bracing until quadriceps control and full knee extension were restored. Early weight bearing was recommended to build tolerance to loads through the knee with the use of crutches. She began running around 13 weeks post-operatively and began sport specific training around 4.5 months postoperatively. She remained in the agility/ sport specific drills phase working with both the rehab team and coaching staff until she passed all the RTS criteria, similar to what occurs after an ACLR. Once she passed the RTS criteria, she was allowed to participate fully in gymnastics related activity and returned to competition at six months post-operatively
There are several limitations for this case report, including the inclusion of only one subject, as is typical of a casereports. In addition, due to time constraints, the follow up following rehabilitation was a short duration of only a few months and therefore long-term outcomes are unknown at this time. Furthermore, due to clinical constraints in space and technology, vertical jump LSI and gymnastics sports specific drills were not assessed prior to return to sport. The athlete was assessed via horizontal hop testing, however, there is an opportunity for the athlete to test well on these types of hops by utilizing compensation strategies, therefore limiting the reliability of the performance testing to determine true RTS readiness. Lastly, the findings from this report may not translate to other patient populations presenting with type 1 ACL tears as the case report design does not allow determination of cause and effect. Nonetheless, this case report is helpful in describing the clinical decision-making process and application of a rehabilitation progression in a female gymnast who underwent a primary ACL repair with internal brace ligament augmentation.
CONCLUSION
The results of this case report provide an example of an ACL repair protocol that was used in an elite female gymnast who achieved full return to sport at six months postoperatively The intent this report was to provide evidence to help direct orthopedic surgeons and physical therapists regarding an appropriate rehabilitation guideline for their
Outcome Initial Evaluation Return to Running Return to Gymnastics Was MCID Met IKDC 60.92 79.3 96.6 YES ACL-RSI 0 90 95 YES OSPRO-YF 0 0 0 YES
Rehabilitation Following ACL Repair with Internal Brace Ligament Augmentation in Female Gymnast: A Re… International Journal of Sports Physical Therapy
ACL repair patients. There is much variability related to surgical technique regarding bracing, ROM and weight bearing restrictions, and return to sport timeline which may affect implementation of these guidelines. Future research should focus on larger scale studies to explore the use of these suggested guidelines.
SUBJECT CONSENT
Subjects were informed prior to treatment that data concerning the case would be submitted for publication.
RESIDENT’S CASE REPORT
Case report was completed during University of Florida Health Sports Residency approved by the American Board of Physical Therapy Specialties (ABPTS) The authors report no conflicts of interest.
Submitted: November 28, 2023 CDT, Accepted: April 08, 2024 CDT
© The Author(s)
This is an open-access article distributed under the terms of the Creative Commons Attribution 4.0 International License (CCBY-NC-4.0). View this license’s legal deed at https://creativecommons.org/licenses/by-nc/4.0 and legal code at https://creativecommons.org/licenses/by-nc/4.0/legalcode for more information.
ACL
in Female Gymnast: A Re… International Journal of Sports Physical Therapy
Rehabilitation Following
Repair with Internal Brace Ligament Augmentation
REFERENCES
1. Wu J, Kator JL, Zarro M, Leong NL. Rehabilitation principles to consider for anterior cruciate ligament repair. Sports Health. 2022;14(3):424-432. doi:10.1177/19417381211032949
2. Montalvo AM, Schneider DK, Webster KE, et al. Anterior cruciate ligament injury risk in sport: A systematic review and meta-analysis of injury incidence by sex and sport classification. J Athl Train 2019;54(5):472-482. doi:10.4085/1062-6050-407-16
3. Anderson MJ, Browning WM, Urband CE, Kluczynski MA, Bisson LJ. A systematic summary of systematic reviews on the topic of the anterior cruciate ligament. Orthop J Sports Med 2016;4(3). doi:10.1177/2325967116634074
4. Sherman MF, Lieber L, Bonamo JR, Podesta L, Reiter I. The long-term follow up of primary anterior cruciate ligament repair Defining a rationale for augmentation. Am J Sports Med. 1991;19(3):243-255. doi:10.1177/036354659101900307
5. Nguyen DT, Ramwadhdoebe TH, van der Hart CP, Blankevoort L, Tak PP, van Dijk CN. Intrinsic healing response of the human anterior cruciate ligament: A histological study of reattached ACL remnants. J Orthop Res. 2014;32(2):296-301. doi:10.1002/ jor.22511
6. DiFelice GS, van der List JP Arthroscopic primary repair of proximal anterior cruciate ligament tears. Arthrosc Tech. 2016;5(5):e1057-e10617. doi:10.1016/ j.eats.2016.05.009
7 Jonkergouw A, van der List JP, DiFelice GS. Arthroscopic primary repair of proximal anterior cruciate ligament tears: outcomes of the first 56 consecutive patients and the role of additional internal bracing. Knee Surg Sports Traumatol, Arthrosc 2019;27(1):21-28. doi:10.1007/ s00167-018-5338-z
8. Adachi N, Ochi M, Uchio Y, Iwasa J, Ryoke K, Kuriwaka M. Mechanoreceptors in the anterior cruciate ligament contribute to the joint position sense. Acta Orthop Scand. 2002;73(3):330-334. doi:10.1080/000164702320155356
9. DiFelice GS, Villegas C, Taylor S. Anterior Cruciate Ligament Preservation: Early results of a novel arthroscopic technique for suture anchor primary anterior cruciate ligament repair. J Arthrosc Rel Surg. 2015;31(11):2162-2171. doi:10.1016/ j.arthro.2015.08.010
10. Murray MM, Fleming BC. Use of a bioactive scaffold to stimulate anterior cruciate ligament healing also minimizes posttraumatic osteoarthritis after surgery Am J Sports Med 2013;41(8):1762-1770. doi:10.1177/0363546513483446
11. van der List JP, DiFelice GS. Range of motion and complications following primary repair versus reconstruction of the anterior cruciate ligament. Knee. 2017;24(4):798-807. doi:10.1016/ j.knee.2017.04.007
12. Strand T, Mølster A, Hordvik M, Krukhaug Y Long-term follow-up after primary repair of the anterior cruciate ligament: Clinical and radiological evaluation 15-23 years postoperatively Arch Orthop Trauma Surg. 2005;125(4):217-221. doi:10.1007/ s00402-004-0766-2
13. Malahias MA, Chytas D, Nakamura K, Raoulis V, Yokota M, Nikolaou VS. A Narrative Review of four different new techniques in primary anterior cruciate ligament repair: “Back to the Future” or another trend? Sports Med Open. 2018;4(1). doi:10.1186/ s40798-018-0145-0
14. Rodriguez-Merchan EC. Primary repair of the anterior cruciate ligament: A review of recent literature (2016-2017). Arch Bone Jt Surg 2019;7(3):297-300.
15. Taylor SA, Khair MM, Roberts TR, Difelice GS. Primary repair of the anterior cruciate ligament: A systematic review J Arthrosc Rel Surg 2015;31(11):2233-2247. doi:10.1016/ j.arthro.2015.05.007
16. van Eck CF, Limpisvasti O, ElAttrache NS. Is There a role for internal bracing and repair of the anterior cruciate ligament? A systematic literature review Am J Sports Med 2018;46(9):2291-2298. doi:10.1177/0363546517717956
17. Wilson WT, Hopper GP, Byrne PA, MacKay GM. Anterior cruciate ligament repair with internal brace ligament augmentation. Surg Technol Int. 2016;29:273-278.
18. Iain C, Anthony GM. Anterior cruciate ligament repair revisited. Preliminary results of primary repair with internal brace ligament augmentation: A Case Series. Orthop Musc System 2015;04(02). doi:10.4172/ 2161-0533.1000188
Rehabilitation Following ACL Repair with Internal Brace Ligament Augmentation in Female Gymnast: A Re… International Journal of Sports Physical Therapy
19. Gagliardi AG, Carry PM, Parikh HB, Traver JL, Howell DR, Albright JC. ACL Repair with suture ligament augmentation is associated with a high failure rate among adolescent patients. Am J Sports Med 2019;47(3):560-566. doi:10.1177/ 0363546518825255
20. Bachmaier S, DiFelice GS, Sonnery-Cottet B, et al. Treatment of acute proximal anterior cruciate ligament tears—Part 2: The role of internal bracing on gap formation and stabilization of repair techniques. Orthop J Sports Med 2020;8(1). doi:10.1177/2325967119897423
21. Irrgang JJ, Ho H, Harner CD, Fu FH. Use of the International Knee Documentation Committee guidelines to assess outcome following anterior cruciate ligament reconstruction. Knee Surg Sports Traumatol Arthrosc 1998;6(2):107-114. doi:10.1007/ s001670050082
22. Irrgang JJ, Anderson AF, Boland AL, et al. Responsiveness of the International Knee Documentation Committee Subjective Knee Form. Am J Sports Med. 2006;34(10):1567-1573. doi:10.1177/0363546506288855
23. Irrgang JJ, Anderson AF, Boland AL, et al. Development and validation of the International Knee Documentation Committee Subjective Knee Form. Am J Sports Med 2001;29(5):600-613. doi:10.1177/03635465010290051301
24. Webster KE, Feller JA. Evaluation of the responsiveness of the Anterior Cruciate Ligament Return to Sport After Injury (ACL-RSI) Scale. Orthop J Sports Med. 2021;9(8). doi:10.1177/ 23259671211031240
25. Webster KE, Feller JA. Development and Validation of a Short Version of the Anterior Cruciate Ligament Return to Sport After Injury (ACL-RSI) Scale. Orthop J Sports Med 2018;6(4). doi:10.1177/ 2325967118763763
26. Lentz TA, Beneciuk JM, Bialosky JE, et al. Development of a yellow flag assessment tool for orthopaedic physical therapists: Results from the optimal screening for prediction of referral and outcome (OSPRO) Cohort. J Orthop Sports Phys Ther 2016;46(5):327-343. doi:10.2519/jospt.2016.6487
27 Morriss NJ, Kim BI, Poehlein E, et al. Association between preoperative multidimensional psychological distress and physical function after surgery for sports-related injury Orthop J Sports Med 2023;11(4). doi:10.1177/23259671231163854
28. Thomeé R, Kaplan Y, Kvist J, et al. Muscle strength and hop performance criteria prior to return to sports after ACL reconstruction. Knee Surgery, Sports Traumatol Arthrosc. 2011;19(11):1798-1805. doi:10.1007/s00167-011-1669-8
29. Buchanan PA, Vardaxis VG. Sex-Related and AgeRelated Differences in Knee Strength of Basketball Players Ages 11–17 Years. J Athl Train. 2003;38(3):231-237
30. Ateschrang A, Ahmad SS, Stöckle U, Schroeter S, Schenk W, Ahrend MD. Recovery of ACL function after dynamic intraligamentary stabilization is resultant to restoration of ACL integrity and scar tissue formation. Knee Surgery, Sports Traumatol Arthrosc 2018;26(2):589-595. doi:10.1007/ s00167-017-4656-x
31. Flagg KY, Karavatas SG, Thompson Jr S, Bennett C. Current criteria for return to play after anterior cruciate ligament reconstruction: an evidence-based literature review. Ann Transl Med. 2019;7(S7):S252-S252. doi:10.21037/atm.2019.08.23
32. Rubinstein RA Jr, Shelbourne KD, VanMeter CD, McCarroll JR, Rettig AC, Gloyeske RL. Effect on knee stability if full hyperextension is restored immediately after autogenous bone-patellar tendonbone anterior cruciate ligament reconstruction. Am J Sports Med 1995;23(3):365-368. doi:10.1177/ 036354659502300321
33. Irfan A, Kerr S, Hopper G, Wilson W, Wilson L, Mackay G. A criterion based rehabilitation protocol for acl repair with internal brace augmentation. Int J Sports Phys Ther. 2021;16(3):870-878. doi:10.26603/ 001c.22217
34. Williams GN, Buchanan TS, Barrance PJ, Axe MJ, Snyder-Mackler L. Quadriceps weakness, atrophy, and activation failure in predicted noncopers after anterior cruciate ligament injury Am J Sports Med 2005;30(3):402-407. doi:10.1177/0363546504268042
35. Snyder-Mackler L, Delitto A, Bailey SL, Stralka SW Strength of the quadriceps femoris muscle and functional recovery after reconstruction of the anterior cruciate ligament. A prospective, randomized clinical trial of electrical stimulation. J Bone Joint Surg. 1995;77(8):1166-1173. doi:10.2106/ 00004623-199508000-00004
36. Hainaut K, Duchateau J. Neuromuscular electrical stimulation and voluntary exercise. Sports Med. 1992;14:100-113. doi:10.2165/ 00007256-199214020-00003
ACL Repair with Internal Brace Ligament Augmentation in Female Gymnast: A Re… International Journal of Sports Physical Therapy
Rehabilitation Following
37 Hughes L, Rosenblatt B, Haddad F, et al. Comparing the effectiveness of blood flow restriction and traditional heavy load resistance training in the post-surgery rehabilitation of anterior cruciate ligament reconstruction patients: A UK National Health Service randomised controlled trial. Sports Med. 2019;49(11):1787-1805. doi:10.1007/ s40279-019-01137-2
38. Owens JG, Hughes L, Patterson S. Blow flow restricted exercise: physical therapy patient management using current evidence. Am Phys Ther Assoc Published online 2020:1-52.
39. Mason JS, Owens JG, Brown WJ. Blood flow restriction training: current and future applications for the rehabilitation of musculoskeletal injuries. Tech Orthop. 2018;33(2):1-66. doi:10.1097/ BTO.0000000000000301
40. Glass R, Waddell J, Hoogenboom B. The effects of open versus closed kinetic chain exercises on patients with ACL deficient or reconstructed knees: A systematic review N Am J Sports Phys Ther 2010;5(2):74-84.
41. Escamilla RF, MacLeod TD, Wilk KE, Paulos L, Andrews JR. Anterior cruciate ligament strain and tensile forces for weight-bearing and non-weightbearing exercises: A guide to exercise selectiona. J Orthop Sports Phys Ther 2012;42(3):208-220. doi:10.2519/jospt.2012.3768
42. Shelbourne KD, Nitz P. Accelerated rehabilitation after anterior cruciate ligament reconstruction. Am J Sports Med 1990;18(3):292-299. doi:10.1177/ 036354659001800313
43. Rambaud AJM, Ardern CL, Thoreux P, Regnaux JP, Edouard P Criteria for return to running after anterior cruciate ligament reconstruction: A scoping review Br J Sports Med 2018;52(22):1437-1444. doi:10.1136/bjsports-2017-098602
44. Karasel S, Akpinar B, Gülbahar S, et al. Clinical and functional outcomes and proprioception after a modified accelerated rehabilitation program following anterior cruciate ligament reconstruction with patellar tendon autograft. Acta Orthop Traumatol Turc 2010;44(3):220-228. doi:10.3944/ AOTT.2010.2293
45. Alnahdi AH, Alderaa AA, Aldali AZ, Alsobayel H. Reference values for the Y Balance Test and the lower extremity functional scale in young healthy adults. J Phys Ther Sci 2015;27(12):3917-3921. doi:10.1589/ jpts.27.3917
46. Ortmaier R, Fink C, Schobersberger W, et al. Return to sports after anterior cruciate ligament injury: A matched-pair Analysis of Repair with internal brace and reconstruction using hamstring or quadriceps tendons. Sportverletz Sportschaden 2021;35(1):36-44. doi:10.1055/a-1019-0949
47 Muller B, Yabroudi MA, Lynch A, et al. defining thresholds for the Patient Acceptable Symptom State for the IKDC Subjective Knee Form and KOOS for patients who underwent ACL reconstruction. Am J Sports Med 2016;44(11):2820-2826. doi:10.1177/ 0363546516652888
48. Wilson WT, Hopper GP, Banger MS, Blyth MJG, Riches PE, MacKay GM. Anterior cruciate ligament repair with internal brace augmentation: A systematic review. Knee. 2022;35:192-200. doi:10.1016/j.knee.2022.03.009
49. van der List JP, Mintz DN, DiFelice GS. The location of anterior cruciate ligament tears: A prevalence study using magnetic resonance imaging. Orthop J Sports Med 2017;5(6). doi:10.1177/ 2325967117709966
Rehabilitation
ACL
with Internal Brace
in Female Gymnast: A Re… International Journal of Sports Physical Therapy
Following
Repair
Ligament Augmentation
SUPPLEMENTARY MATERIALS
Appendix 1
Download: https://ijspt.scholasticahq.com/article/117773-rehabilitation-following-acl-repair-with-internal-braceligament-augmentation-in-female-gymnast-a-resident-s-case-report/attachment/ 227860.docx?auth_token=4KXyrDq9wKdDY9dI-mwy
International Journal of Sports Physical Therapy
Rehabilitation
Following ACL Repair with Internal Brace Ligament Augmentation in Female Gymnast: A Re…
Pain Neuroscience Education for Acute Pain
a
Adriaan Louw1 , Teresa Schuemann1
, Kory Zimney1,2 , Emilio J Puentedura1,3
1 Evidence In Motion, 2 University of South Dakota, 3 Baylor University
Keywords: acute pain, athletes, fear avoidance, pain catastrophizing, pain neuroscience education https://doi.org/10.26603/001c.118179
International Journal of Sports Physical Therapy
In musculoskeletal and sports medicine, pain has traditionally been linked to tissue injury, often assuming a linear correlation between tissue damage and pain intensity However, modern pain science has illuminated the complexity of the human pain experience, incorporating psychosocial elements, nervous system sensitization, immune responses, and structural changes in the brain as factors. This contemporary understanding of pain has proven highly beneficial for both clinicians treating individuals in pain and those experiencing pain.
Pain neuroscience education (PNE) provides individuals in pain with an understanding of the underlying neurobiology and neurophysiology of their pain experience, which has been shown to result in decreased self-reported pain, reduced disability, the alleviation of fear and fear-avoidance behaviors, diminished pain catastrophizing, and improved movement. Currently, research on PNE predominantly focuses on interventions with individuals with persistent or chronic pain conditions. However, those who experience acute, sub-acute, and perioperative pain also have the potential for elevated levels of fear, fear-avoidance, and pain catastrophizing, indicating potential benefits from PNE. This invited commentary seeks to inform readers about the latest advancements in pain science and propose a conceptual model for delivering PNE in acute pain experiences.
Level of Evidence
5
INTRODUCTION
Pain is an everyday human experience designed to warn an individual in the case of danger and ultimately have them take action to reduce or eliminate the threat.1 For example, suppose a football player hurts their knee in a tackle. In that case, pain is a critical warning sign to reduce the threat by stopping what they’re doing (running on the leg) and take action by getting it further evaluated by the medical team. Throughout the history of pain science, human pain experiences, especially in musculoskeletal medicine have been tied to the health of the person’s tissues, including the stages and duration of healing.2 Traditionally, society has been taught and expects pain to be present in the event of an injury, and as tissues heal, pain eases, and a person returns to their prior level of activity.3 Persistent pain does not follow this trajectory, and often, despite tissue heal-
ing, the pain experience continues.1 This not only significantly impacts the person dealing with pain but also increases challenges faced by medical providers when seeking ways to address persistent pain.4
Biomedical models for understanding pain, tying tissue health to pain, have been scrutinized in the last two to three decades based on significant advances in pain neuroscience. Apart from the relationship to tissue health, it is now well understood that a human’s pain experience is complex, unique to each person, consisting of a delicate interplay between tissue-related issues, peripheral neuropathic processes, immune function, brain processing, psychosocial variables, sensitization of the peripheral and central nervous system, neuroplasticity, endogenous mechanisms, and more.1,5 The progress made in pain science, particularly concerning persistent pain, has propelled research forward and this progress in pain science has undergone rigorous testing and validation in clinical settings.
teresa@eimpt.com a
Corresponding author:
Teresa L. Schuemann
Evidence in Motion
16414 San Pedro Avenue, Suite 805
San Antonio TX 78232
(210)624-8226
Invited Clinical
Commentary
Louw A, Schuemann T, Zimney K, Puentedura EJ. Pain Neuroscience Education for Acute Pain. IJSPT. Published online June 2, 2024:758-767. doi:10.26603/001c.118179
Additionally, pain science been integrated into entry-level programs for medical professionals, and has shown positive changes towards patients with persistent pain.
One treatment at the forefront of non-pharmacological treatment of persistent pain is pain neuroscience education (PNE).6 Currently, almost twenty systematic reviews and meta-analyses examining PNE for various persistent pain conditions have consistently demonstrated significant benefits in reducing self-reported pain, disability, fear-avoidance, pain catastrophizing, and positively impacting physical movement and healthcare expenses.7‑9 In contrast to the increasing evidence of PNE effectiveness for persistent pain, only a limited number of studies have explored its potential benefits for acute pain experiences.10,11 Given that pain, including acute and sub-acute forms, is a universal human experience, this invited commentary seeks to delve into the application of PNE for athletes experiencing acute pain episodes.
PAIN SCIENCE UPDATE
PNE seeks to provide individuals in pain with an understanding of the underlying neurobiology and neurophysiology of their pain experience, as well as the psychosocial dimensions of their pain experience, collectively known as the neuroscience of pain.12 A critical element of this approach is the provider’s knowledge and understanding of modern pain science.13 Given the recent advances in pain science, a starting point for all clinicians is an updated review of pain science, which will then allow for an enhanced ability to educate people they encounter who experience pain. The model chosen for this education is the Mature Organism Model, described by Gifford,14 which represents the critical biological and psychosocial processes underpinning a human pain experience (Figure 1).
TISSUE-RELATED ISSUES
Tissue injury is well described and understood by medical providers and often follows the predicted stages and timelines of healing.3 Nociceptors are stimulated (mechanically, chemically, or thermally), initiating an electrochemical impulse into the central nervous system (CNS), passed onto the brain for processing, and typically a pain experience ensues, which garners the attention of the individual.1 Most pain experiences in life, including those that occur during sport participation, fit within this category and are referred to as a nociceptive driven pain experience. In fact, epidemiological research data from outpatient physical therapy (PT) indicates that approximately 55% of patients attending PT fit into this category.15,16 In a nociceptive driven pain experience, the pain experienced is typically proportionate to the input stimulus, presents with very definite aggravating and easing factors, is often described as a dull ache or a throb at rest, and does not include neurological symptoms associated with sensory changes (numbness, tingling, loss of sensation, etc.).17 Although the aforementioned process is the most common, some key exceptions should be mentioned. First, injury and pain are not synony-
mous – people can experience an injury and no pain, and conversely, many people experience pain with no tissue injury 1,2 A poignant example is the growing body of evidence from imaging studies on pain-free individuals demonstrating various tissue anomalies, including bulging discs, arthritic age-related changes, rotator cuff tears, hip labral issues, and more.18,19 Second, and perhaps more critical, is to acknowledge that when nociceptors are stimulated from the tissues, they will only send nociceptive information (or danger messages) into the CNS for the brain to process. They do not send pain messages to the brain.20 It is the brain that processes this information, adds context to it from various other sources, and ultimately produces pain (or not). Examples include noticing a bruise on one’s body or blood (tissue injury), but not knowing where it came from.
ENVIRONMENTAL ISSUES
All pain experiences occur in the context of varied environments. Environmental factors powerfully influence pain – by either increasing or decreasing the pain experience. For example, an athlete who sprains their ankle while their team is winning will represent a different experience (including pain experience), compared to when they are losing. Support for this notion arises from research demonstrating that children engaged in contact sports exhibit decreased sensitivity later in life to painful stimuli, i.e., injections.21 Additionally, despite experiencing repetitive and forceful whiplash injuries, demolition derby drivers often report minimal to no lasting pain.22 Furthermore, recent findings linking pain to psychosocial factors such as stress and anxiety reveal that children involved in individual sports face a significantly higher risk of mental health issues compared to those participating in team sports or none at all.23 This is important to consider in athletes because stress and anxiety are known to increase pain experiences. These examples underscore how psychosocial factors, beyond mere tissue health, significantly influence the pain experience.
PERIPHERAL NERVOUS SYSTEM
The human body is thought to contain over 400 individual nerves, with sensory nerves designed to electrochemically transmit information to the CNS and, ultimately, the brain for processing.24 Complex biological processes during a pain experience such as demyelination, ion channel upregulation, blood flow changes, and glial cell activation can result in an upregulation of the peripheral nervous system.24 This is normal and part of the architecture of the “pain system” to warn the individual of danger This “waking” or senstizing of the nervous system is designed to protect. As pain eases and tissues heal, typically, the sensitivity of the nervous system decreases allowing a person to return to their prior activities “pain-free.” For example, when an athlete sprains their ankle, the nervous system in and around the ankle increases its sensitivity (hyperalgesia) to protect the ankle. As the ankle recovers, it remains “sensitive” as the nervous system also adapts its response
Pain Neuroscience Education for Acute Pain International Journal of Sports Physical Therapy
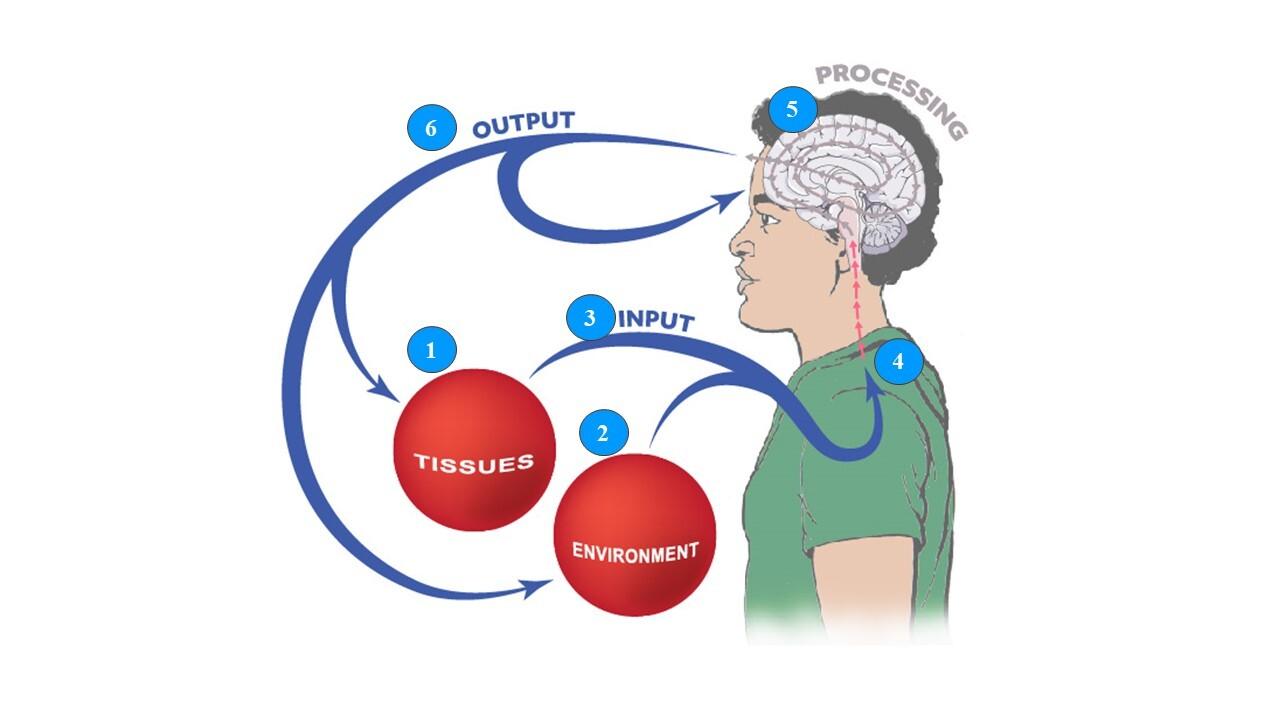
Figure 1. Mature Organism Model of pain – adapted from Gifford.14 Used with permission.
to the injury and healing process. In approximately 25% of patients attending outpatient PT, the peripheral nervous system does not calm down and becomes the main driver of the pain experience, even when tissues have healed.15, 16,25 This is referred to as peripheral neuropathic pain and includes conditions such as radiculopathy, and nerve compression syndromes such as carpal tunnel and cubital syndrome. Clinically, these patients display symptoms in a dermatomal or cutaneous nerve distribution, positive neurodynamic tests, sensitivity to nerve palpation, and neurological symptoms (numbness, pins and needles, etc.).26
CENTRAL NERVOUS SYSTEM
The next process, which highlights the interaction between the peripheral nervous system and the central nervous system, has garnered considerable attention in the field of pain science. In the dorsal horn of the spinal cord, information from the periphery is received with the intent to pass that information on to the brain for processing.1 Inhibitory and excitatory neurotransmitters interact with receptors, allowing the information to be blocked (gating) or continue on to second-order neurons to pass the information on to the brain. In acute, sub-acute, and postoperative pain experiences, the dorsal horn becomes bombarded with nociceptive information from the target tissue; the dorsal horn plays an essential role in the acute pain experience and then reverts back to a normal state as tissues heal. In persistent pain, however, continued bombardment from the periphery results in permanent changes at the dorsal horn, including loss of inhibitory interneurons, expansion of receptor fields, upregulation of second-order neurons, decreased endogenous analgesia, and more, resulting in a heightened sensitization of the CNS to peripheral input –
hyperalgesia and allodynia.1,2,5,20 This process is labeled as a nociplastic pain, with a clinical presentation of disproportionate pain, diffuse tenderness to palpation, disproportionate aggravating and easing factors, and psychosocial issues – typically high levels of fear, fear-avoidance, depression, and pain catastrophizing.27
BRAIN PROCESSING
Since the emergence of brain scan technology in the early 1990s, scientists have significantly enhanced their understanding of the role of the brain in human pain experiences.28,29 It is now well established that a human pain experience consists of widespread brain activation of various functional parts of the brain, including key areas such as the amygdala (fear-conditioning), anterior cingulate cortex (focus and concentration), hippocampus (memory), motor and pre-motor corteces (planning and execution of movement), and more.30,31 The distributed brain activity observed during a painful experience signifies a functional change within the brain, known as the pain neuromatrix.30, 31 Each involved brain area is part of the pain experience, potentially resulting in the sub-optimal function of the tasks normally associated with each area, which can lead to altered motor control (motor and pre-motor cortex), decreased memory (hippocampus), reduced focus and concentration (anterior cingulate cortex) as examples.30 What renders the human pain experience unique is the activation of various regions of the brain, which not only process the perceived threat but also interact with other existing cognitive maps linked to memory, beliefs, and past experiences. This extensive activation across multiple brain regions renders the pain experience distinctive for each individual, influencing the optimal functioning of the brain.30,31
Pain Neuroscience Education for Acute Pain International Journal of Sports Physical Therapy
OUTPUT MECHANISMS
The concluding stage of the mature organism model is output, encompassing diverse biological and physiological reactions to the input and processing of information, including motor, immune, linguistic, sympathetic, and other responses.1 For example, for a soccer player who sustains an ankle sprain, information is sent to the CNS and brain for processing, and if the brain perceives a threat, pain will be produced by the brain to protect the ankle, and ultimately the athlete. Pain is an output of the brain to get a person to stop, pay attention to the situation, and seek help. Likewise, an individual might experience anger (sympathetic response), utter a choice word or two (linguistic expression), or clutch their leg (motor action). The athlete, in this case a soccer player who sprains their ankle, experiences pain, vocalizes expletives, and instinctively grasps their leg as they collapse to the ground. Finally, since this is a feedback model, these physiological processes also impact tissue, the peripheral nervous system, and senses, which feed into the CNS.14
The mature organism model (Figure 1) provides a quick, updated view of pain science and is a great place for medical providers to develop an understanding of modern pain science, with two key takeaways. First, research indicates that healthcare providers who deepen their understanding of pain tend to exhibit increased empathy and compassion toward individuals experiencing pain. They also tend to employ less provocative biomedical language and approaches when addressing pain, adjust their clinical practices to better treat individuals in pain, and ultimately achieve better patient outcomes.13,32,33 Second, and perhaps of greater significance, studies have demonstrated that enhancements in pain knowledge among patients have a beneficial impact on various aspects including self-reported pain ratings, disability, fear and fear-avoidance, pain catastrophizing, willingness and ability to move, as well as healthcare expenditures.7‑9 For athletes this is very important, since pain, fear and catastrophizing all have the potential to impact movement, performance, motor control, concentration, which are essential for optimial performance.
PAIN NEUROSCIENCE EDUCATION
PAIN NEUROSCIENCE EDUCATION
The process of teaching a patient about the underlying biology and physiology of pain is referred to as PNE.12,34 PNE emerged due to the inadequacies of the traditional biomedical educational model in addressing pain in light of current scientific knowledge, the complexities of treating persistent pain, and rising rates of pain prevalence.35 PNE has gained considerable scrutiny from various systematic reviews and meta-analyses, with increasing evidence for its efficacy, especially for those with persistent pain. However, more recently, it has been shown that the combination of PNE and a physical treatment, i.e., exercise, manual therapy, etc., is superior to PNE alone.36,37 This concept of PNE plus (PNE+) aligns with behavioral medicine research
showing that education-only approaches are not successful in a achieving change in patient behaviors.38 In musculoskeletal medicine, this would imply that providers who use movement-based therapy, with the addition of PNE, deliver PNE+, which aligns with current best-evidence care for people with pain, especially those with persistent pain.38
PNE is best delivered using metaphors, examples, and images (Figure 2).6,9 This can be done verbally in one-onone, group sessions, or via digital therapeutics, i.e., telehealth or virtual reality As with exercise, education should also be paced, and it is recommended that PNE be delivered in short, digestible sessions, complimented with physical treatments (i.e., stretches, exercises, neurodynamics, manual therapy, etc.), resulting in the PNE+ approach.6 During subsequent clinical interactions, different or additional metaphors are used to teach the patient about various aspects of their pain experience, carefully matching their clinical presentation with a metaphor designed to systematically increase the patient’s understanding of their pain and steadily reduce fear and catastrophizing, which allows them to move more and more over time, thereby allowing for pacing and graded exposure to movement and return to function.
PNE that has gained considerable attention for the clinical application of identifying patients that would respond favorably to PNE. Various studies have shown that patients presenting with some or all the clinical presentations in Table 1 are ideally suited for a PNE or PNE+ approach.6,39, 40
An examination of Table 1 unmistakably suggests that individuals exhibiting persistent, widespread pain characterized by elevated levels of fear and fear-avoidance, as well as pain catastrophizing, would likely benefit from PNE. An intriguing inquiry arises: Do any of the items listed in Table 1 serve as stronger indicators of the success of PNE? Remarkably, and crucially for this commentary, it has been demonstrated that both high initial levels of fearavoidance and pain catastrophizing can potentially predict a favorable outcome to PNE.6,39,40 This holds significance as elevated levels of fear and pain catastrophizing have been linked to unfavorable outcomes in orthopedic surgery, acute and sub-acute pain episodes, and return to sport.46‑49 This prompts the question: Can PNE offer benefits for those experiencing acute and sub-acute pain experiences, such as an athlete with an acute ankle sprain?11
To date, only a small number of studies have investigated the use of PNE for acute, sub-acute, and perioperative pain. Research on preoperative PNE interventions for lumbar surgery, total knee arthroplasty, and shoulder surgery has demonstrated positive effects on surgical outcomes, patient experiences, nervous system sensitization, and healthcare costs post-surgery.50‑53 Zimney and Louw have suggested that individuals with higher fear-avoidance levels during the acute phase of low back pain can derive benefits from PNE interventions.10,11 Although the evidence for PNE in treatment of those with acute and subacute pain is not as extensive as for those with persistent pain, emerging research supports its clinical application in cases where individuals exhibit high levels of fear-avoid-
Pain Neuroscience Education for Acute Pain International Journal of Sports Physical Therapy
Table 1. Clinical presentations that respond favorably to a PNE/PNE+ approach with clinical characteristics and proposed screening tools.
Central sensitization27
Widespread pain; diffuse palpation tenderness; disproportionate aggravating and easing factors and psychosocial issues (i.e., fear avoidance, depression, etc.)
Persistent pain20
Ongoing, persistent pain beyond normal expected healing phases
High fear-avoidance41
Expressing fear related to pain, including movement, activities, work, etc.
Displaying fear and fear-avoidance in the presence of pain.
High pain catastrophizing43
Inability to foresee anything other than a negative outcome. Heavily tied to poor beliefs and expression regarding pain, including hyper focus on pain, biomedical views of pain, etc.
Readiness for change44
Patients beyond pre-contemplation phase – contemplative, planning and action phase. Interest in changing their clinical situation and being an active participant.
ance and/or pain catastrophizing. A notable distinction, however, is that while PNE typically de-emphasizes anatomical education in persistent pain cases, some degree of anatomical education may be necessary in acute pain scenarios due to patient expectations.54
CLINICAL APPLICATION
Considering that the majority of research on PNE focuses on persistent pain, there is a clear need for invited commentary on this topic. This commentary seeks to demonstrate how PNE can and should be utilized for individuals experiencing acute pain, such as athletes with ankle sprains, who exhibit high levels of fear-avoidance and pain catastrophizing. Such individuals are at risk of experiencing prolonged recovery periods, which can delay their return to regular activities and sport participation.
CASE STUDY: SOCCER PLAYER WITH AN ACUTE ANKLE SPRAIN
CLINICAL PRESENTATION
Hailey is an 18-year-old high school senior soccer player who was referred to physical therapy (PT). She plays as a striker and sustained a right ankle sprain two days ago during a tackle in a soccer game. Immediately after the incident, she experienced acute pain and swelling. The athletic trainer attended to her on the field, and she had to leave the game due to the severity of the ankle sprain. The Ottawa Ankle Rules screen was inconclusive regarding potential foot and ankle fractures, so she underwent x-ray
Central sensitization inventory (CSI) ≥ 40
Persistent pain > 3-6 months
Fear-avoidance beliefs questionnaire (FABQ)42
• Physical activity: FABQ-PA > 15
• Work subscale: FABQ-WS > 34
Tampa Scale of Kinesiophobia (TSK)
• TSK > 37
• PCS > 30
Stages of Change Readiness and Treatment Eagerness Scale45
Subjective clues regarding their interest in changing situation, including active participation in treatment.
imaging. She was provided with crutches to maintain nonweight bearing status until she saw the team’s physician the following day The x-rays showed no fractures, and she was diagnosed with a grade II inversion ankle sprain. She was advised to continue using crutches, gradually transitioning to weight-bearing as tolerated, given an ace wrap for edema control, and referred for outpatient PT.
During her examination, Hailey reported a pain rating of 5 out of 10 on the Numeric Pain Rating Scale. She exhibited limited range-of-motion in her right ankle, ankle swelling, and significant fear of moving her ankle. The athletic trainer informed the attending PT that Hailey was deeply upset about the injury because she is a senior and is concerned about playing during her final year of high school. Additionally, she is worried that the injury could impact her chances of receiving a collegiate scholarship. As part of the examination, the attending PT conducted a Pain Catastrophizing Scale (PCS) and Fear-Avoidance Beliefs Questionnaire (FABQ) screening survey, resulting in a PCS score of 32, FABQ-Physical Activity (PA) score of 17, and FABQ-Work Subscale (WS) score of 12.
INTERPRETATION
Traditional biomedical education for a case like this typically involves a detailed explanation of ankle anatomy, ligaments, biomechanics, and injury mechanisms. This explanation often utilizes anatomical models or posters mounted in the clinic.55 Commonly used terms such as “tear” or “ripped” may be employed, along with in-depth anatomical terminology like “anterior talofibular ligament” 56 However, research suggests that this approach
Pain catastrophizing scale (PCS)43
Pain Neuroscience Education for Acute Pain International Journal of Sports Physical Therapy
What is wrong with me?
Ankles are designed to move. When we suddenly move in a direction, we may sprain a ligament, resulting in a sprained ankle, just like what you experienced. With an ankle sprain there is some swelling and bleeding, which is normal and expected, but over time this will get better, along with the pain.
What can I do for it?
In therapy we will work on getting you better but there’s a lot you can do to help at home. Ice as needed to help with swelling and pain; do the exercises we provide; keep moving; do not stress about the ankle and focus on getting yourself in the best position to get back to sport.
How long will it take?
Over time the pain will ease, swelling come down and the ankle will get better. With an ankle sprain like yours, we expect this to be much better in 1-2 weeks. You’re young, healthy, and eager to get back to soccer, all of which will help recovery. We will see you three times a week for two weeks and expect you to be much better in two weeks.
What will you do for it?
We will see you three times a week; a session will last 40-45 minutes and will focus on getting swelling down; restoring movement; putting weight on the ankle; getting rid of the crutches and walking normally. Later we will focus on sport-specific exercises to get you ready for return to play You will see the doctor in three weeks for a follow-up.
may not be beneficial in reducing fear or promoting recovery; in fact, it could increase fear and catastrophizing, both of which are linked to heightened pain experiences.41,56 The results of the screening tools indicate that the athlete is experiencing high levels of acute pain, fear of movement, and catastrophizing, likely exacerbated by concerns about missing the remainder of the season.42,43
Focusing solely on a biomedical approach to education could potentially prolong recovery in this scenario.2,57 Therefore, it is suggested that clinicians adopt a dualmodel approach. This approach would involve addressing the biomedical aspects to aid in tissue healing and recovery, while also integrating PNE and a PNE+ approach to facilitate holistic healing and recovery individualized to the patient.
BIOMEDICAL EDUCATION
Although biomedical education has faced criticism, clinicians must still recognize the value of providing a thorough explanation of the patient’s injury and diagnosis. Several qualitative studies have highlighted that patients desire more information about their diagnosis. When this need is not met, patients often resort to seeking additional information, including from the internet and websites.54,58
Biomedical education needs to evolve by providing patients with essential information while avoiding language that triggers catastrophizing and fear (“words that harm”). It should use explanations that fulfill patient needs without inducing fear and catastrophizing by using “words that heal”, and should incorporate reassurance (refer to Table 2).56 In the case of this soccer player, it’s recommended to use the term “sprain,” which is less alarming than “tear” and accurately describes the current situation.56 Additionally, it is crucial to acknowledge tissue injury and validate the patient’s current condition. Education should encompass information on diagnosis (what is wrong with me?), prognosis (how long with it take?), self-help strategies to empower the patient and boost self-efficacy (what can I do for it?), and the overall treatment plan from the medical team (what will you do for it?). (Refer to Table 2 for details).54
The updated biomedical education may vary in terminology, explanations, and timelines among clinicians and clinical settings due to their individual experiences. How-
ever, the primary goal of this education should be to alleviate fear and anxiety, offer reassurance, and provide clear guidance for the patient’s path forward. However, it is crucially important to note that this is just one aspect of the educational model. In light of the latest advancements in pain neuroscience, the authors propose implementing a secondary, complementary PNE approach. This approach aims to further educate the patient about her pain, as well as to diminish fear and anxiety, thereby facilitating an optimal recovery process.
PAIN NEUROSCIENCE EDUCATION
From a clinical standpoint, heightened sensitization of the nervous system around the ankle is likely to result in increased pain, particularly during movement.1,24 During her assessment, her elevated score on the Fear-Avoidance Beliefs Questionnaire for Physical Activity (FABQ-PA) suggests a high probability of it hindering her recovery and return to sports.42 Furthermore, her elevated score on the Pain Catastrophizing Scale (PCS) score indicates a diminished sense of hope, particularly concerning her status as a senior and her concerns about participating in her final high school season.43 These factors alone justify considering the incorporation of PNE, given its capacity to mitigate fear-avoidance and pain catastrophizing, while also facilitating movement, which will be integral to her upcoming rehabilitation process. Table 3 and Figure 2 provide an illustration of a PNE session tailored for this athlete, utilizing a metaphorical depiction of a sensitized alarm system.6
CONCLUSIONS AND TAKE-AWAYS FOR THE CLINICIAN
By integrating PNE into the revised biomedical educational model, a foundation is established for clinicians to refer to during rehabilitation. This is important even for athletes with apparently minor injuries. While pain during movement is anticipated during the recovery process, understanding this pain diminishes fear As the clinician reminds the patient during rehabilitation that the overly sensitive alarm system is gradually settling down, fear and pain catastrophizing decrease further. This is crucial for achieving optimal recovery from pain, encompassing acute, subacute, and perioperative pain experiences.
biomedical patient
Table 2. Example
education
Pain Neuroscience Education for Acute Pain International Journal of Sports Physical Therapy
Table 3. Pain neuroscience education example using a metaphorical sensitive alarm system analogy.
The extra sensitive alarm system6
• Therapist: I just taught you a little more about ankle sprains, including that it’s quite common and what you experience is quite normal, expected and it will get better over time. We talked about things we will do and things you can do to help get better and back to soccer
• There is, however, another important part we need to cover. Around your ankle there are a bunch of nerves. Nerves work like an alarm system – they always have a little bit of electricity in them, “buzzing along”, enjoying a beautiful day. When you sprain your ankle, the nerves around your ankle ramp up like an alarm system and fire the message to the spinal cord, which is then passed onto the brain – warning the brain you just hurt your ankle. The brain produces pain to get your attention, the athletic trainer assesses, helps, and appropriately refers you to see the doctor, and now here you are in the clinic. The alarm did its job!. Once everything is clear, the alarm is designed to calm down to its resting level, ready to warn you in case of…another ankle sprain.
• In most cases, the alarm system calms down at the same time as your ankle heals and all is well. In some people, however, the alarm either does not calm down all the way or calms down a little slower than expected. This now means, you have an extra sensitive alarm system and it would not take much movement, walking or touching the ankle for the alarm to “go off” In this case, you need to remember you’re sore but safe, and hurt does not equal harm. A sensitive ankle during rehabilitation is just that…a sensitive alarm, even though your ankle is getting better day-by-day. As we engage in exercises and movement, you will “feel” your ankle. We expect that and it’s normal.
• Why does the alarm system not calm all the way down or slower than expected? We now know when people worry about their ankle, it keeps the alarm sensitive, so yes – we need to work on the ankle – which we will, but we also add other strategies to get the alarm down as soon as possible. This may include some relaxation techniques; mindfulness techniques; breathing techniques; monitoring your sleep and more – just like what the professional athletes do.
• So – when you come to therapy or get sent home with homework, we will focus on two different, but connected, approaches:
◦ Work on your ankle to get it better, improve movement, ease pain, and get you back to sport as quickly as we can.
◦ Work on calming down the sensitive nerves around the ankle, ease some anxiety and allow for the best possible recovery
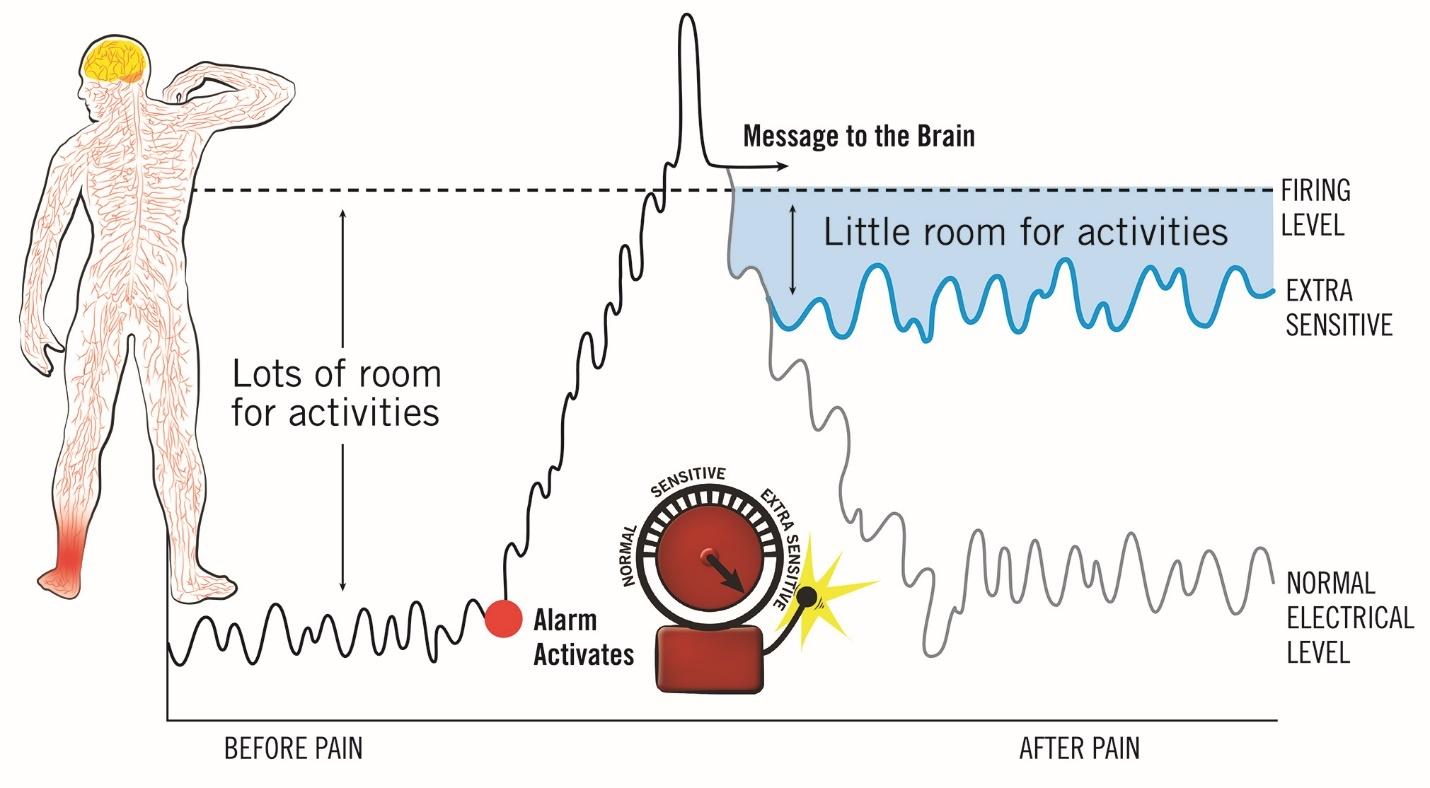
Figure 2. Pain neuroscience education example using a metaphorical sensitive alarm system analogy – used with permission.6
Submitted: March 08, 2024 CDT, Accepted: May 16, 2024 CDT
© The Author(s)
This is an open-access article distributed under the terms of the Creative Commons Attribution 4.0 International License (CCBY-NC-4.0). View this license’s legal deed at https://creativecommons.org/licenses/by-nc/4.0 and legal code at https://creativecommons.org/licenses/by-nc/4.0/legalcode for more information.
Pain Neuroscience Education for Acute Pain International Journal of Sports Physical Therapy
REFERENCES
1. Zimney K, Van Bogaert W, Louw A. The biology of chronic pain and its implications for Pain Neuroscience Education: State of the art. J Clin Med. 2023;12(13):4199. doi:10.3390/jcm12134199
2. Nijs J, Roussel N, Paul van Wilgen C, Koke A, Smeets R. Thinking beyond muscles and joints: therapists’ and patients’ attitudes and beliefs regarding chronic musculoskeletal pain are key to applying effective treatment. Man Ther. 2013;18(2):96-102. doi:10.1016/j.math.2012.11.001
3. Haldeman S. Presidential address, North American Spine Society: Failure of the pathology model to predict back pain. Spine 1990;15(7):718-724. doi:10.1097/00007632-199007000-00019
4. Carnago L, O’Regan A, Hughes JM. Diagnosing and treating chronic pain: Are we doing this right? J Prim Care Community Health 2021;12:21501327211008055.
5. Nijs J, George SZ, Clauw DJ, et al. Central sensitisation in chronic pain conditions: latest discoveries and their potential for precision medicine. Lancet Rheumatol 2021;3(5):e383-e392.
6. Louw A, Zimney K, O’Hotto C, Hilton S. The clinical application of teaching people about pain. Physiother Theory Pract. 2016;32(5):385-395. doi:10.1080/09593985.2016.1194652
7 Siddall B, Ram A, Jones MD, Booth J, Perriman D, Summers SJ. Short-term impact of combining pain neuroscience education with exercise for chronic musculoskeletal pain: a systematic review and metaanalysis. Pain. Published online 2021.
8. Watson JA, Ryan CG, Cooper L, et al. Pain neuroscience education for adults with chronic musculoskeletal pain: a mixed-methods systematic review and meta-analysis. J Pain Published online 2019.
9. Louw A, Zimney K, Puentedura EJ, Diener I. The efficacy of therapeutic neuroscience education on musculoskeletal pain – a systematic review of the literature. Physiother Theory Pract. 2016;32(5):332-355. doi:10.1080/ 09593985.2016.1194646
10. Zimney K, Louw A, Puentedura EJ. Use of Therapeutic Neuroscience education to address psychosocial factors associated with acute low back pain: a case report. Physiother Theory Pract. 2014;30(3):202-209. doi:10.3109/ 09593985.2013.856508
11. Louw A, Farrell K, Choffin B, et al. Immediate effect of pain neuroscience education for recent onset low back pain: an exploratory single arm trial. J Man Manip Ther Published online 2019:1-10.
12. Moseley GL, Hodges PW, Nicholas MK. A randomized controlled trial of intensive neurophysiology education in chronic low back pain. Clin J Pain 2004;20:324-330. doi:10.1097/ 00002508-200409000-00007
13. Louw A, Vogsland R, Marth L, Marshall P, Cox T, Landers M. Interdisciplinary pain neuroscience continuing education in the veterans affairs. Clin J Pain 2019;35(11).
14. Gifford L. Pain, the tissues and the nervous system: a conceptual model. Physiother. 1998;84(1):27-36. doi:10.1016/ S0031-9406(05)65900-7
15. Bardin LD, King P, Maher CG. Diagnostic triage for low back pain: a practical approach for primary care. Med J Aust 2017;206(6):268-273. doi:10.5694/ mja16.00828
16. Louw AHD, Weber B, Shuda D, Obert C, Louw H, Farrell K. Central sensitization in patients attending physical therapy for musculoskeletal disorders. Phys Med Rehabil Int. 2021;8(5).
17 Smart KM, Blake C, Staines A, Thacker M, Doody C. Mechanisms-based classifications of musculoskeletal pain: Part 3 of 3: Symptoms and signs of nociceptive pain in patients with low back (+/-leg) pain. Man Ther 2012;17(4):352-357 doi:10.1016/j.math.2012.03.002
18. Brinjikji W, Luetmer PH, Comstock B, et al. Systematic literature review of imaging features of spinal degeneration in asymptomatic populations. AJNR Am J Neuroradiol 2015;36(4):811-816. doi:10.3174/ajnr.A4173
19. Guermazi A, Niu J, Hayashi D, et al. Prevalence of abnormalities in knees detected by MRI in adults without knee osteoarthritis: population based observational study (Framingham Osteoarthritis Study). BMJ Med 2012;345:e5339.
20. Moseley GL. Unravelling the barriers to reconceptualisation of the problem in chronic pain: the actual and perceived ability of patients and health professionals to understand the neurophysiology. J Pain. 2003;4(4):184-189. doi:10.1016/S1526-5900(03)00488-7
Pain Neuroscience Education for Acute Pain International Journal of Sports Physical Therapy
21. Raudenbush B, Canter RJ, Corley N, et al. Pain threshold and tolerance differences among intercollegiate athletes: implication of past sports injuries and willingness to compete among sports teams. N Am J Psychol 2012;14(1).
22. Simotas AC, Shen T Neck pain in demolition derby drivers. Arch Phys Med Rehabil 2005;86(4):693-696. doi:10.1016/j.apmr.2004.11.003
23. Hoffmann MD, Barnes JD, Tremblay MS, Guerrero MD Associations between organized sport participation and mental health difficulties: Data from over 11,000 US children and adolescents. PLoS One 2022;17(6):e0268583.
24. Schmid AB, Nee RJ, Coppieters MW. Reappraising entrapment neuropathies--mechanisms, diagnosis and management. Man Ther 2013;18(6):449-457 doi:10.1016/j.math.2013.07.006
25. Orita S, Yamashita T, Ohtori S, et al. Prevalence and location of neuropathic pain in lumbar spinal disorders: Analysis of 1804 consecutive patients with primary lower back pain. Spine 2016;41(15):1224-1231. doi:10.1097/ BRS.0000000000001553
26. Smart KM, Blake C, Staines A, Thacker M, Doody C. Mechanisms-based classifications of musculoskeletal pain: Part 2 of 3: Symptoms and signs of peripheral neuropathic pain in patients with low back (+/-leg) pain. Man Ther 2012;17(4):345-351. doi:10.1016/j.math.2012.03.003
27 Smart KM, Blake C, Staines A, Thacker M, Doody C. Mechanisms-based classifications of musculoskeletal pain: Part 1 of 3: Symptoms and signs of central sensitisation in patients with low back (+/-leg) pain. Man Ther 2012;17(4):336-344. doi:10.1016/j.math.2012.03.013
28. Louw A, Puentedura EJ, Diener I, Peoples RR. Preoperative therapeutic neuroscience education for lumbar radiculopathy: a single-case fMRI report. Physiother Theory Pract 2015;31(7):496-508. doi:10.3109/09593985.2015.1038374
29. Moseley GL. Widespread brain activity during an abdominal task markedly reduced after pain physiology education: fMRI evaluation of a single patient with chronic low back pain. Aust J Physiother. 2005;51(1):49-52. doi:10.1016/ S0004-9514(05)70053-2
30. Puentedura EJ, Louw A. A neuroscience approach to managing athletes with low back pain. Phys Ther Sport 2012;13(3):123-133. doi:10.1016/ j.ptsp.2011.12.001
31. Melzack R. Pain and the neuromatrix in the brain. J Dent Educ. 2001;65:1378-1382.
32. Louw A, Neilson B, Freund B, Cox T Pain neuroscience education for physiotherapy receptionists. Pain and Rehab. 2019;46(Winter 2019):24-31.
33. Louw A, Puentedura EJ, Denninger TR, et al. The clinical impact of pain neuroscience continuing education on physical therapy outcomes for patients with low back and neck pain. PLoS One 2022;17(4):e0267157.
34. Louw A, Puentedura EL, Zimney K. Teaching patients about pain: It works, but what should we call it? Physiother Theory Pract. 2016;32(5):328-331. doi:10.1080/09593985.2016.1194669
35. Moseley L. Combined physiotherapy and education is efficacious for chronic low back pain. Aust J Physiother 2002;48(4):297-302. doi:10.1016/ S0004-9514(14)60169-0
36. Wood L, Hendrick PA. A systematic review and meta-analysis of pain neuroscience education for chronic low back pain: Short-and long-term outcomes of pain and disability. Eur J Pain. 2019;23(2):234-249. doi:10.1002/ejp.1314
37 Marris D, Theophanous K, Cabezon P, Dunlap Z, Donaldson M. The impact of combining pain education strategies with physical therapy interventions for patients with chronic pain: A systematic review and meta-analysis of randomized controlled trials. Physiother Theory Pract 2021;37(4):461-472. doi:10.1080/ 09593985.2019.1633714
38. Louw A, Sluka KA, Nijs J, Courtney CA, Zimney K. Revisiting the provision of pain neuroscience education: An adjunct intervention for patients but a primary focus of clinician education. J Orthop Sports Phys Ther 2021;51(2):57-59. doi:10.2519/ jospt.2021.9804
39. Moseley GL, Butler DS. Fifteen years of explaining pain: the past, present, and future. J Pain Published online 2015.
40. Louw A, Puentedura EJ, Zimney K, Cox T, Rico D. The clinical implementation of pain neuroscience education: A survey study Physiother Theory Pract 2017;33(11):869-879. doi:10.1080/ 09593985.2017.1359870
41. Vlaeyen JWS, Linton SJ. Fear-avoidance and its consequences in chronic musculoskeletal pain: a state of the art. Pain 2000;85:317-322. doi:10.1016/ S0304-3959(99)00242-0
Pain Neuroscience Education for Acute Pain International Journal of Sports Physical Therapy
42. Fritz JM, George SZ. Identifying psychosocial variables in patients with acute work-related low back pain: the importance of fear-avoidance beliefs. Phys Ther. 2002;82(10):973-983. doi:10.1093/ptj/ 82.10.973
43. Sullivan MJL, Bishop SR, Pivak J. The pain catastrophizing scale: Development and validation. Psychol Assess. 1995;7:524-532. doi:10.1037/ 1040-3590.7.4.524
44. Prochaska JO, Norcross JC. Stages of change. Psychother. 2001;38(4):443-448. doi:10.1037/ 0033-3204.38.4.443
45. Mitchell D, Francis JP, Tafrate RC. The psychometric properties of the Stages of Change Readiness and Treatment Eagerness Scale (SOCRATES) in a clinical sample of active duty military service members. Mil Med. 2005;170(11):960-963. doi:10.7205/ MILMED.170.11.960
46. Mansfield CB, Selhorst M. The effects of fearavoidance beliefs on anterior knee pain and physical therapy visit count for young individuals: A retrospective study. Phys Ther Sport. 2018;34:187-191. doi:10.1016/j.ptsp.2018.10.008
47 Archer KR, Seebach CL, Mathis SL, Riley LH 3rd, Wegener ST. Early postoperative fear of movement predicts pain, disability, and physical health six months after spinal surgery for degenerative conditions. Spine J. 2014;14(5):759-767. doi:10.1016/ j.spinee.2013.06.087
48. Subedi A, Pokharel K, Sah BP, Chaudhary P Association of preoperative pain catastrophizing with postoperative pain after lower limb trauma surgery J Psychosom Res 2021;149:110575. doi:10.1016/ j.jpsychores.2021.110575
49. Alodaibi FA, Fritz JM, Thackeray A, Koppenhaver SL, Hebert JJ. The fear avoidance model predicts short-term pain and disability following lumbar disc surgery PLoS One 2018;13(3):e0193566.
50. Louw A, Diener I, Landers MR, Puentedura EJ. Preoperative pain neuroscience education for lumbar radiculopathy: a multicenter randomized controlled trial with 1-year follow-up. Spine 2014;39(18):1449-1457. doi:10.1097/ BRS.0000000000000444
51. Louw A, Diener I, Landers MR, Zimney K, Puentedura EJ. Three-year follow-up of a randomized controlled trial comparing preoperative neuroscience education for patients undergoing surgery for lumbar radiculopathy J Spine Surg 2016;2(4):289-298. doi:10.21037/jss.2016.12.04
52. Louw A, Puentedura EJ, Reed J, Zimney K, Grimm D, Landers MR. A controlled clinical trial of preoperative pain neuroscience education for patients about to undergo total knee arthroplasty. Clin Rehabil Published online 2019:269215519857782.
53. Louw A, Rico D, Langerwerf L, Maiers N, Diener I, Cox T. Preoperative pain neuroscience education for shoulder surgery: A case series. S Afr J Physiother 2020;76(1):1417. doi:10.4102/sajp.v76i1.1417
54. Subialka JA, Smith K, Signorino JA, Young JL, Rhon DI, Rentmeester C. What do patients referred to physical therapy for a musculoskeletal condition expect? A qualitative assessment. Musculoskelet Sci Pract 2022;59:102543. doi:10.1016/ j.msksp.2022.102543
55. Lederman E. The fall of the postural-structuralbiomechanical model in manual and physical therapies: Exemplified in lower back pain. CPDO Online Journal. Published online 2010:1-14.
56. Stewart M, Loftus S. Sticks and stones: the impact of language in musculoskeletal rehabilitation. J Orthop Sports Phys Ther. 2018;48(7):519-522. doi:10.2519/jospt.2018.0610
57 Jull G. Biopsychosocial model of disease: 40 years on. Which way is the pendulum swinging? Br J Sports Med 2017;51(16):1187-1188.
58. Verbeek J, Sengers MJ, Riemens L, Haafkens J. Patient expectations of treatment for back pain: a systematic review of qualitative and quantitative studies. Spine 2004;29(20):2309-2318. doi:10.1097/ 01.brs.0000142007.38256.7f
Pain Neuroscience Education for Acute Pain International Journal of Sports Physical Therapy
USE OF DIAGNOSTIC MUSCULOSKELETAL
ULTRASOUND IN THE EVALUATION OF PIRIFORMIS SYNDROME: A REVIEW FOR REHABILITATION PROVIDERS.
Robert C. Manske, PT, DPT, MEd, SCS, ATC, CSCS, FAPTA
Chris Wolfe, PT, DPT, OCS, Cert MDT
Phil Page, PT, PhD, ATC, CSCS, FACSM
Michael Voight, PT, DHSC, SCS, OCS, ATC, CSCS, FAPTA
Beth Bardowski, MSN, APN, ACNP-BC
Abstract
Piriformis syndrome (PS) is a neuromuscular condition caused by the entrapment of the sciatic nerve at the level of the piriformis muscle (PM) and can cause significant discomfort and disability.PS is often misdiagnosed due to its overlapping symptoms with other lumbar and sciatic issues, and, as such, diagnosing PS remains challenging despite recent invasive and non-invasive diagnostic methods. Diagnostic musculoskeletal ultrasound (MSK US) offers a non-invasive, cost-effective alternative for the identification and evaluation of PS, providing dynamic, realtime imaging of the PM and adjacent structures. This article reviews the applications, advantages, and procedural insights of MSK US in the diagnosis of PS, emphasizing its relevance in rehabilitation settings. We discuss the technical aspects of ultrasound use, interpretation of findings, and integration into clinical practice, aiming to enhance the diagnostic accuracy and therapeutic outcomes for patients with suspected PS.
Keywords: Piriformis, MSK-US, sciatic nerve entrapment, rehabilitation
Introduction
PS is recognized as an entrapment neuropathy where the sciatic nerve is compressed by the PM, often resulting in significant lumbar, gluteal, and thigh pain.1-3 This condition is characterized by symptoms such as lower back and buttock pain, muscular weakness, unilateral numbness, and hip and spine mobility challenges.2 The pain frequently radiates down the leg, sometimes extending into the medial foot, and is commonly accompanied by numbness in the posteriomedial lower limbs.1 Despite its resemblance to L5 or S1 radiculopathy in symptomatology, PS is typically attributed to either an anomalous PM or direct compression and irritation of the sciatic nerve. Its clinical presentation can be similar to those of lumbar disc herniation, stenosis, radiculopathy, and neurogenic pain, complicating the diagnostic process.4
Historically, the diagnosis of PS has relied primarily on physical examination and has been considered a diagnosis of exclusion due to the absence of direct, compelling imag-
ing evidence.5 Traditional diagnostic approaches include clinical assessments, magnetic resonance imaging (MRI), and computed tomography (CT) scans.1,6-8 However, these methods are often hampered by high costs, limited availability, and occasionally inadequate resolution for distinguishing soft tissue abnormalities.8 Electrodiagnostic evaluations are frequently utilized to differentiate between PS and radiculopathy, though electromyography (EMG) has limitations, such as low specificity and poor repeatability which challenge the precise localization and understanding of the lesion’s etiology.7
In recent developments, musculoskeletal ultrasound (MSK US) has emerged as a valuable diagnostic tool for PS, offering high-resolution imaging of muscles, tendons, joints, and nerves.10 The use of high-resolution ultrasonography has particularly enhanced the visualization of anatomical details, thereby expanding the utility of ultrasound in peripheral nerve imaging.10 Ultrasound provides a realtime, dynamic assessment and serves as a more accessible and cost-effective alternative to MRI, maintaining reliable accuracy.11 Early and accurate diagnosis through advanced imaging techniques is crucial for the effective management of PS and preventing diagnostic delays.
Epidemiology
The incidence and prevalence of PS remain uncertain, though estimates suggest that it accounts for 6% to 36% of cases involving low back pain and "sciatica."12 Accurately determining the true prevalence is challenging due to the predominantly clinical basis of its diagnosis, which is typically one of exclusion.9 PS is most commonly observed during the fourth and fifth decades of life and affects individuals across various occupations and levels of physical activity. Research conducted by Jawish et al14 indicated that among 3,550 individuals reporting sciatica symptoms, only 26 were diagnosed with PS. Furthermore, up to 50% of patients with PS report a history of trauma, often related to direct buttock contusion or torsional injuries affecting the hip or lower back.
MSK ULTRASOUND BITES: TIPS AND TRICKS
Anatomy
The PM, characterized by its flat, pyramid-like shape, generally functions as an external rotator, and provides weak abduction and flexion of the hip. The PM plays a critical role in maintaining postural stability during both standing (statically) and walking (dynamically) activities. Anatomically, it originates from the ventral surface of the sacrum, specifically lateral to the sacral foramina, extending from the margin of the greater sciatic foramen to the pelvic surface of the sacrotuberous ligament near the sacroiliac joint, spanning vertebral levels S2 to S4. The muscle attaches to the superior medial aspect of the greater trochanter and receives innervation from spinal nerves S1 and S2. In most individuals, the sciatic nerve exits the pelvis through the greater sciatic foramen, passing beneath the PM. However, variations occur wherein the sciatic nerve may either pierce or divide the PM. Such anatomical variations significantly increase the susceptibility to PS in affected individuals.
Technical Considerations
MSK US involves the use of a high-frequency linear transducer to obtain detailed images of the targeted area. When examining the PM using ultrasound, the patient should first assume the prone or lateral decubitus position to best visualize the PM and sciatic nerve.1 Placing a pillow or towels between the bed and the patient’s inguinal area can help increase the pelvic tilt. This allows better visualization of the PM via ultrasound. A curvilinear transducer is placed in a transverse orientation to first identify the sacral cornua and is then moved toward the greater trochanter until the lateral edge of the sacrum is observed. The transducer is moved further laterally until the greater trochanter and ilium are both observed (Figure 1). The PM will appear as a hyperechoic band lying between the lateral edge of the sacrum and the greater trochanter and deep in the gluteus maximus muscle. The sciatic nerve appears as an oval shaped hypoechoic structure lying deep in the PM (Figure 2)
Interpretation of Ultrasound Findings
Key ultrasound findings in PS include
• Hypertrophy of the PM
• Echotexture abnormalities indicating muscle strain or tears
• Increased vascularity suggesting inflammation
• Compression or displacement of the sciatic nerve
These findings must be correlated with clinical symptoms and other diagnostic tests to confirm the diagnosis of PS.
Integration into Clinical Practice
For rehabilitation providers, integrating MSK US into clinical practice requires training in sonographic techniques and interpretation of images specific to musculoskeletal disorders. MSK US can guide interventions such as targeted physiotherapy, injections, and minimally invasive procedures by providing precise anatomical details.
Advantages of MSK Ultrasound
MSK US offers several advantages over other imaging modalities.
Non-invasive: Does not require ionizing radiation, making it safer for repeated use.
Cost-effective: Generally, less expensive than MRI and computed tomography scans.
Dynamic imaging: Allows real-time visualization of the PM during motion, aiding in dynamic assessments.
Point-of-care: Can be used in various settings, including clinics and bedside evaluations, providing immediate feedback to guide treatment decisions.
Conclusion Diagnostic MSK US is an effective and efficient tool in the evaluation of PS, offering detailed visualization of soft tissue structures. It enhances diagnostic accuracy and assists in the formulation of targeted treatment plans in rehabilitation settings. As technology advances and accessibility increases, MSK US is poised to become an integral part of the diagnostic process for musculoskeletal disorders such as PS.
References
1. Michel F, Decavel P, Toussirot E, et al. The piriformis muscle syndrome: an exploration of anatomical context, pathophysiological hypotheses and diagnostic criteria. Ann Phys Rehabil Med. 2013;56:300-311.
2. Jankovic D, Peng P, van Zundert A. Brief review: Piriformis syndrome: etiology, diagnosis, and management. Can J Anesth/J Can Anesth.2013; 60:1003-1012.
3. Burke C, Walter WR, Adler RS. Targeted ultrasoundguided perineural hydrodissection of the sciatic nerve for the treatment of piriformis syndrome. Ultrasound Q. 2019;35(2):125-129.
4. Miller TA, White KP, Ross DC. The diagnosis and management of piriformis syndrome: myths and facts. Can J Neurol Sci. 2012;39:577-583.
5. Hopayian K, Danielyan A. Four symptoms define the piriformis syndrome: an updated systematic review of its clinical features. Eur J Orthop Surg Traumatol. 2018;28:155-164.
6. Zhang W, Luo F, Sun H, et al. Ultrasound appears to be a reliable technique for the diagnosis of piriformis syndrome. Muscle Nerve. 2019;59:411-416.
7. Fishman LM, Wilkins AN, Rosner B. Electrophysiologically identified piriformis syndrome is successfully treated with incobotulinum toxin A and physical therapy. Muscle Nerve. 2017;56:258-263.
8. Fishman LM, Hosseini M. Piriformis syndrome – a diagnosis comes into its own. Muscle Nerve. 2019;59: 395-396.
9. Kirschner JS, Foye PM, Cole JL. Piriformis syndrome, diagnosis and treatment. Muscle Nerve. 2009;40(1): 10-18.
10. Chen J, Liu J, Zeng J, et al. Ultrasonographic reference values for assessing normal sciatic nerve ultrasonography in the normal population. J Med Ultrasound. 2018;26:85-89.
11. Wu YY, Guo XY, Chen K, et al. Feasibility and reliability of an ultrasound examination to diagnose piriformis syndrome. World Neurosurg. 2019;134:e1085-92.
12. Boyajian-O’Neill LA, McClain RL, Coleman MK, et al. Diagnosis and management of piriformis syndrome: An osteopathic approach. J Am Osteopath Assoc. 2008;108(11):657-664.
13. Jawish RM, Assoum HA, Khamis CF. Anatomical, clinical and electrical observations in piriformis syndrome. J Orthop Surg Res. 2010;Jan 21:5:3.
14. Childers MK, Wilson DJ, Gnatz SM, et al. Botulinum toxin type A use in piriformis muscle syndrome: a pilot study. Am J Phys Med Rehabil. 2002;81(10): 751-759.
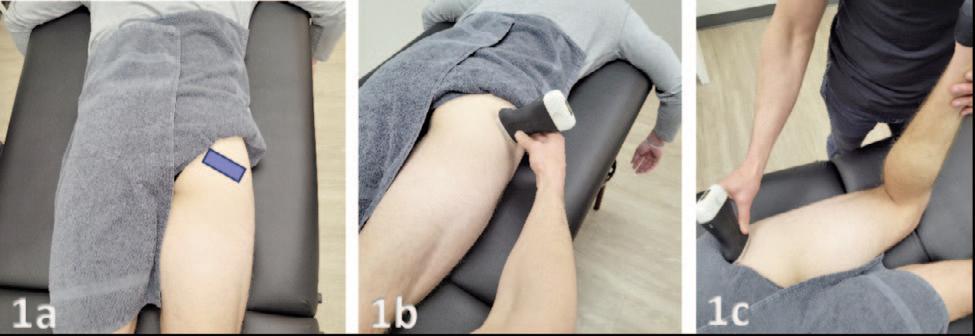
Figures 1a: Patient Position. Patient is lying prone with the hips and knees extended straight.
Figures 1b and 1c: Oblique/Long Axis View (LAX) Transducer Placement. For this oblique/LAX view, the transducer is placed initially in a short axis view that is perpendicular to the shaft of the femur (Figure 1b). The reference end of the probe is placed downward on the bony greater trochanter for better image orientation initially. The transducer is then moved into the gluteal region by sliding medially and rotating into an oblique axis/long axis view to be parallel with the muscle fibers of the piriformis (Figure 1c). Flexing the patient’s knee to 90 degrees can allow the clinician to passively internally and externally rotate the hip allowing for a dynamic assessment of the gluteus maximus muscle and piriformis muscle.
PIRIFORMIS
NORMAL VIEW IN AN OBLIQUE – LAX VIEW:
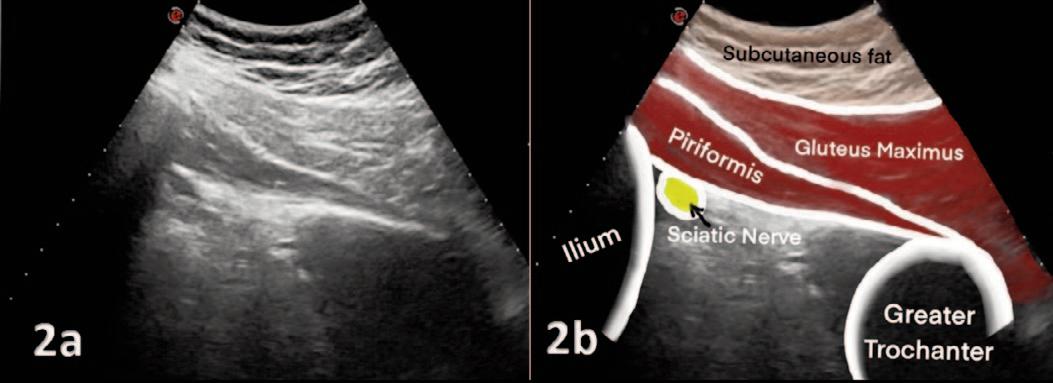
Figures 2A and 2B: An oblique/LAX ultrasound image depicts the relation between the subcutaneous tissue, sacrum, gluteus maximus, piriformis, and sciatic nerve. The muscle belly of the piriformis exhibits a pear-shaped morphology with a compact, uniformly smooth echotexture. Positioned superficially to the piriformis, the gluteus maximus displays a comparatively coarser echotexture, characterized by its fibrous composition. Utilizing dynamic, real-time imaging, the interface delineation between the superficial gluteus maximus and the deeper piriformis muscle is accomplished. This involves flexing the patient’s knee to a 90-degree angle and gradually internally and externally rotating the hip. Through this controlled motion, the deeper piriformis muscle can be distinctly isolated, facilitating precise identification.
SCIATIC NERVE BIFURCATION:
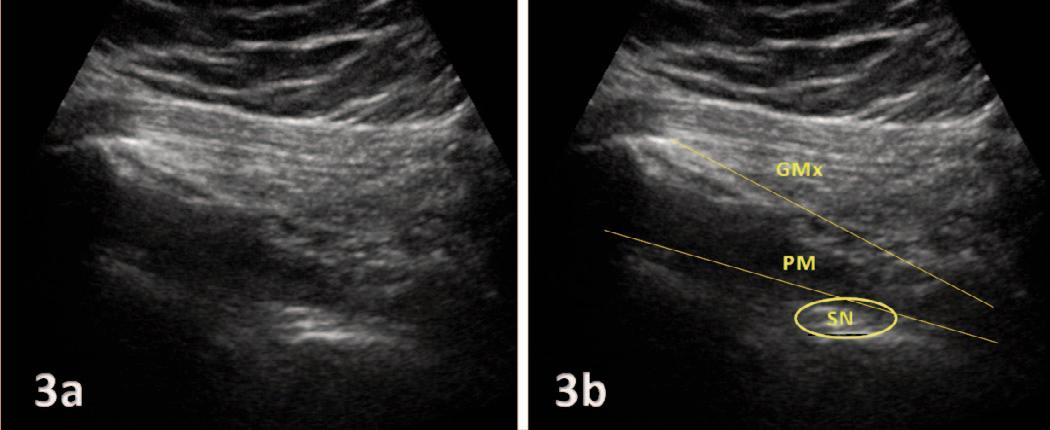 Figures 3a and 3b: Sciatic Nerve Passing Under Piriformis Muscle
SCIATIC NERVE BIFURCATION:
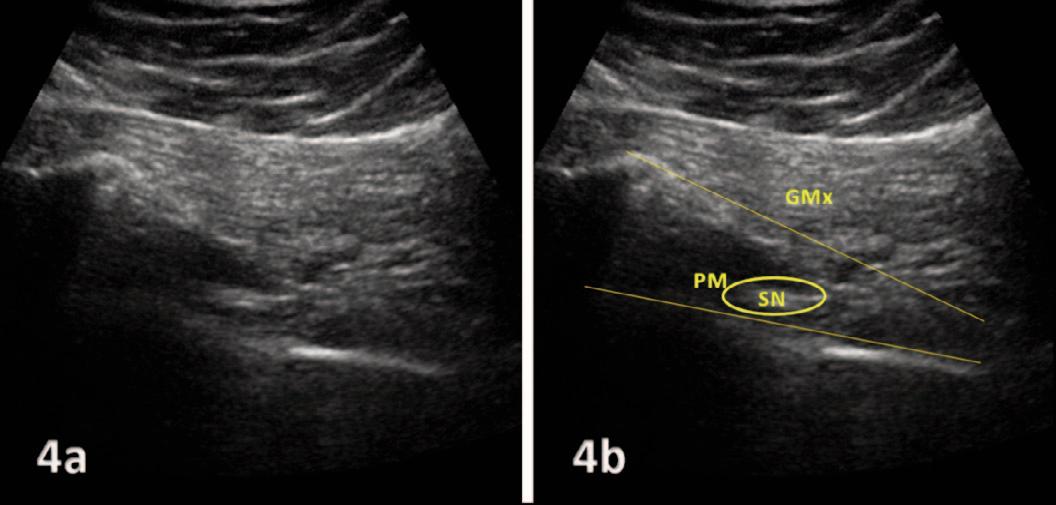
Figures 4a and 4b: Sciatic Nerve Passing Through Piriformis Muscle: The above ultrasound images are of the same patient and reveal the sciatic nerve bifurcation, passing through the piriformis muscle and underneath in the posterior hip region. Figures 3a and 3b (previous page) show the sciatic nerve passing under the piriformis muscle as highlighted. Figures 4a and 4b show the same muscle with a better view of the sciatic nerve passing through the piriformis muscle. From top to bottom, it displays subcutaneous fat tissue, the gluteus maximus muscle, and the piriformis muscle situated between the greater trochanter and sacroiliac bone. Labels indicate GMx for gluteus maximus muscle, PM for piriformis muscle, and SN for sciatic nerve.
Data-Driven Prognosis and Improved Outcomes Part 3: Clinical Intelligence vs. Clinical Wisdom
Gray Cook, MSPT, OSC, CSCS
https://doi.org/10.26603/001c.117949
International Journal of Sports Physical Therapy
If known risk factors for musculoskeletal injury are currently considerable burdens on our outcomes (Part 1), and we have efficient and low-cost (time and money) methods to screen and tally these risk factors (Part 2), then why do we continue to treat symptomatically? Why aren’t we using information that we can easily know to manage regional interdependence during rehabilitation, to measure risk at the completion of rehabilitation, and to bring awareness to overall asymptomatic movement burdens (or opportunities) rather than the current complaint?
The first step within intelligent management is the differentiation of the types of risk factors that can interrupt our rehabilitation efforts and outcomes. Risk factors for musculoskeletal injury can be categorized as movement-based or self-care/lifestyle-based.
My initial editorial described risk factors in this manner:
Clinical outcomes can improve if we employ a functional wellness screening mentality, considering risk associated with (1)undiagnosed MSK complicating factors affecting outcome, (2)diagnosed complicating factors, outside of specialty, affecting outcome, and (3)undiagnosed complicating factors, outside of specialty, affecting outcome.
Movement-based risk factors (undiagnosed MSK complicating factors affecting outcome) can be further divided to benefit our work. What are we looking for?
1. Inappropriate movement pain within normal patterns,
2. Inappropriate activity levels/movement quantity within normal patterns (both too much/not enough), or
3. Inappropriate movement quality within normal patterns. (Asymptomatic movement dysfunction)
Most of our training and the daily work we perform focuses on the first two categories, but 20 years’ worth of compelling data should shift our focus towards movement quality - the wisdom play
The Matsel et al.1 study discussed in my previous editorials demonstrates that untrained individuals can reliably screen movement for all three categories of risk. The burden to collect this information is no longer on healthcare. It’s my opinion that our outcomes would be better if we used an improved awareness of risk to clear complicating factors as we care for the current complaint.
What can be done regarding the lifestyle-based risk factors, or as I referenced them earlier, the diagnosed complicating factors, outside of specialty, affecting outcome, and un-
diagnosed complicating factors, outside of specialty, affecting outcome?
I think of the lifestyle risk-factors as having a binary split. We’re trying to uncover significant imbalances in the movement stress and movement recovery cycles.
Imbalances in the stress and recovery cycles of life are known risk factors for MSK injury While this editorial is not a literature review, I have accepted the following contributing lifestyle risk factors based on research, my personal experience, and successful outcomes. My job has always been to find the “good enough” functional limits agreed upon by the experts in each domain pertaining to stress and recovery.
In my management of risk factors for MSK injury, I consider the screening, monitoring, and correcting of the following lifestyle domains to be indispensable:
Behavioral Health - Anxiety and Depression are known risk factors for MSK injury Also, is there something going on today that’s more important than movement?
Injury History - Are they fully cleared of pain and dysfunction from previous injuries.
Breathing Quality - It should be clear that breathing dysfunctions can alter many movements or exertive activities. How efficiently and effectively a person breathes affects overall health and directly impacts sleep, movement and behavioral health.
Physical Activity - Too much or not enough, both impact movement health and lifestyle.
Body Composition - Overnourished or undernourishedboth are malnutrition and both impact movement health and lifestyle.
Sleep Quality - Poor sleep quality and sleep deprivation are risk factors for physical injury and are known to negatively impact overall cognitive and physical performance.
Nutritional Awareness - The qualities and quantities of what we consume strongly impact not only our MSK health, but our physical development and health of our entire being.
Along with the Symmio movement screen, there are reliable screens and surveys that efficiently look at the seven lifestyle domains for dysfunction. If they can contribute to making people well, why aren’t we using them?
Living with risk should not simply be accepted as inevitable, with long-term management as the only option. Wisdom says: Why correct what you can protect, why protect what you can prevent, why prevent what you can avoid? We should be using awareness of risk to improve our outcomes, but we must use that awareness correctly.
Here’s how I integrate risk factor management parallel to my rehabilitation efforts:
Digital Health Corner by Genie Health
Cook G. Data-Driven Prognosis and Improved Outcomes Part 3: Clinical Intelligence vs. Clinical Wisdom. IJSPT. Published online June 2, 2024:773-775. doi:10.26603/001c.117949
1. Screen and survey movement and lifestyle. (Know risk factors)
2. Don’t add risk factors during rehabilitation. (Do no harm)
3. Resolve the current episode and, if possible, reduce existing risk factors.
4. Re-screen and Re-survey movement and lifestyle.
5. Disclose remaining risk(s).
Numbers 3 and 5 are two sides of the same coin: whether you use an awareness of risk to improve outcomes or to explain outcomes, it is of benefit.
This system is vital for athlete return-to-play Today’s athlete does not simply need injury triage, physical modalities, and corrective exercise.
Today’s athlete is part of a broken physical culture still trying to play the games that an earlier physical culture played with far less risk. If you are going to say that an athlete is ready to play, that statement is not only a reflection of your diagnostic intervention, it is a statement of prognosis and must factor the risks inherent to the individual (vulnerability) and to the specific environment (threat).
If you don’t have the tools to manage risk, why do you think you have the authority to return them to play?
Clinical intelligence provides the right information at the right time without regard to awareness. Clinical wisdom brings awareness by exposing blind spots in objective and measurable ways. Clinical wisdom upgrades the value of the same information in a precise and personal way © The Author(s)
This is an open-access article distributed under the terms of the Creative Commons Attribution 4.0 International License (CCBY-NC-4.0). View this license’s legal deed at https://creativecommons.org/licenses/by-nc/4.0 and legal code at https://creativecommons.org/licenses/by-nc/4.0/legalcode for more information.
Data-Driven Prognosis and Improved Outcomes Part 3: Clinical Intelligence vs. Clinical Wisdom International Journal of Sports Physical Therapy
THE FIFTH WORLD CONGRESS OF SPORTS PHYSICAL THERAPY
JUNE 14-15 | OSLO, NORWAY
INTERNATIONAL JOURNAL OF SPORTS
THERAPY An Official Publication of A North American Sports Medicine Institute Publication
Partnering with
PHYSICAL
I J S PT
ABSTRACTS
ABSTRACTS FOR THE FIFTH WORLD CONGRESS OF SPORTS PHYSICAL THERAPY: OSLO,
Authors:
NORWAY, JUNE 1415, 2024
International Federation of Sports Physical Therapy
NFFs Faggruppe for Idrettsfysioterapi og Aktivitetsmedisin
International Journal of Sports Physical Therapy
TABLE OF CONTENTS
Prep to be PRO—developing and implementing an educational program for youth elite athletes in sports academy high schools in Norway. Heiestad H, Myklebust G, Moseid CH.
A One-Year Prospective Study of Injury Occurrence and Burden in 102 Brazilian Para Athletes. Resende R, Madaleno M, Ocarino J, Pinheiro L, Lourenço T, Wezenbeek E, Witvrouw E, Verhagen E, Mello MT, Silva A.
A Qualitative Study Examining Young Athletes’ Perceptions and Experiences With Pain and Injury Following Acute or Overuse Injury.
Summersby R, Sheehan N, Bleakley C, Caulfield B, Matthews M, Klempel M, Holden S.
Acute effects of stretching for mood symptoms and autonomic modulation in middle-aged women.
Komatsuzaki M, Koshino Y, Ishida T, Kasa-hara S, Ebina Y, Tohyama H, Samukawa M.
Adolescents’ Experience with Sports-Related Pain and Injury and their Journey to Returning to Sport: A Systematic Review of Qualitative Research. Sheehan N, Summersby R, Bleakley C, Caufield B, Matthews M, Klempel N, Holden S.
Bio-banding in Soccer: A Scoping Review Homstøl SM.
Body Composition, Core Stability, Flexibility, Balance and Psychological State in Female Athletes with Primary Dysmenorrhea: A Case-control Study. Celenay ST, Karaaslan Y, Karakus A, Korkut Z, Dusgun ES, Kaya DO.
Breast Pain and Trauma in Professional Women’s Basketball – Next Steps for Awareness and Action.
Eichelberger T, Smith L, Edward Kane E.
Career Prevalence of Concussion among Adolescent Female and Male Handball Players: A Cross-Sectional Study.
Bohlin S, Hägglund M, Waldén M, Whiteley R, .Asker M.
Changes in foot and ankle muscle pennation angles from non-weight-bearing to weight-bearing positions.
Jaffri A, Schwarting A.
Cognitive behavioral physical therapy in chronic musculoskeletal conditions: A systematic review.
Jaffri A, Greenfield R, Kelley S.
Comparison of the distance between the talus and the lateral malleolus during single-leg drop landing in individuals with and without chronic ankle instability.
Ishida A, Maeda N, Onoue S, Komiya M, Tashiro T, Arima S, Mizuta R, Ishihara H, Kawai M, Urabe Y.
Construct validity of the Sideways Shoulder Sway Test for Assessment of Sensorimotor Control of the Glenohumeral Joint.
Salling MA, Andreasen KR, Møller M, Bencke J.
Curl-up exercises improve abdominal muscle strength without worsening inter-recti distance in women with diastasis recti abdominis postpartum: a randomised controlled trial.
Gluppe SB, Engh ME, Bø K.
Development and intra-tester reliability of a new strength assessment protocol on female pole dancers.
Ignatoglou D, Paliouras A, Bilika P, Kapreli E.
Development and Validation of the Intervention Usability Scale for Exercise (IUSE).
Mørtvedt AI, Petushek EJ.
Does the characteristics of head impact during blind football differ between Paralympic Games? Videobased observational study
Maeda N, Sasadai J, Tamura Y, Nagao T, Mizuta R, Ishihara H, Tashiro T, Arima S, Abekura T, Ishida A, Urabe.Y.
Effect of limited dorsiflexion range of motion on the outcome of the clinical balance test in individuals with chronic ankle instability.
Nozu S, Matsuda T, Takazawa Y.
Effect of maturation on overuse knee injury prevalence: A cross-sectional study of youth football players in Japan.
Okuno H, Namiki T, Koshino Y, Ishida T, Tohyama H, Samukawa M.
SPECIAL PARTNER EDITION
Effect of one month ankle flossing on single-leg drop landings in recreational athletes: a pilot randomizedcontrolled trial.
Watanabe Y, Kawabata M, Watanabe H, Tsuihiji Y, Mogi K, Hiraoka R, Uchida Y, Inada T, Takahira N.
Effect of shoulder external rotation exercise with real-time visual feedback using ultrasonography in college baseball players: a randomized controlled trial.
Suzuki T, Kawabata M, Matsuda A, Saito Y, Nagano Y, Sano Y, Tsuihiji Y, Watanabe H, Takahira N.
Effectiveness of high-load compared with low-load strengthening exercise on self-reported function in patients with hypermobile shoulders: One-year follow-up from a randomised controlled trial.
Liaghat B, Juul-Kristensen B, Faber DA, Christensen EO, Søgaard K, Skou ST, Søndergaard J, Juhl C.
Effects of Modified Get Set Injury Prevention Program for South Korean National Archery Team: A Prospective Intervention Study Over Two Seasons
Kim J, Suhn-yeop K.
Effects of talocrural joint mobilization on joint position sense and center of gravity in patients with chronic ankle instability.
Murayama H, Yoshida R, Shida N.
Effects On Plantar Support After Deep Dry Needling In Posterior Tibial Muscle: A Baropodometric Double-Blind Randomized Controlled Trial.
Medina SDR, Navarro SM, Payá FJM, Ruiz CO, Andreu CS, Rico JMB, Balaguer JM, Mas JMS, Ortiz MIR, González MDCM.
Efficacy of Radial Pressure Wave Therapy in athletes with Achilles Tendinopathy: A randomized trial.
Togashi I, Nagao M, Nishio H, Takayuki K, Shiota Y, Takazawa Y.
Electromyography Analysis of Scapular Muscles during Scapular Stabilizer Strengthening Exercises: Impact of Voluntary Abdominal Contraction.
Gürses KC, Uysal O, Düzgün.
Evaluating the Effectiveness of the Modified Arm Care Screen in Overhead Athletes: A Glimpse into Injury Prevention.
Paraskevopoulos E, Kottaridis FM, Moutzouri M, Koumantakis G, Antonakis-Karamintzas D, Tsolakis C, Ignatoglou D.
Evidence for recommending delayed anterior cruciate ligament reconstruction – a scoping review.
Arp K, Nedermark J, Ingwersen KG, Ageberg E, Varnum C, Viberg B.
Exploring Exercise Intolerance in Mild TBI patients with Persistent Post-Concussion Symptoms: A CrossSectional Study.
Valaas L-J, Soberg HL, Rasmussen MS, Steenstrup SE, Kleffelgård I.
Exploring the relationship between training load and injury risk in Leinster Schoolboy Rugby: analysis of the SCRUm cohort study phase 2.
Murphy SJ, French H, Doyle B, Boland F, Keating L.
Gender differences in the relationship between intrinsic foot muscle morphology, toe grip strength and postural control ability after jump landing in adolescent athletes.
Arima S, Maeda N, Tsutsumi S, Ishihara H, Tashiro T, Urabe Y.
Gender-specific Sociocultural Factors and Their Association with Lower Limb Kinematics During High and Low-impact Tasks.
Chiddarwar V, Wilford K, Hooper T, James R, Seeber GH, Brooks T, Sizer P.
Hamstring muscle volume contribution to hamstring eccentric strength in collegiate football athletes.
Neto JS, Joachim M, Opar D, Blemker S, Mortensen B, Johnson W, Remington E, Alves V, Heiderscheit B.
Hip Crepitus is Highly Prevalent and Associated with Psychological Features and Pain in Football Players with Hip/Groin Pain.
Serighelli F, Crossley K, Kemp J, Heerey J, Scholes M, King M, Silva DdO.
Immediate effects of lower leg tissue flossing on ankle muscle strength and dorsiflexion range of motion in healthy individuals: A randomized crossover controlled trial.
Sano Y, Kawabata M, Uchida Y, Watanabe Y, Tsuihiji Y, Watanabe H, Takahira N.
Improvements in Forward Bending are Related to Improvements in Pain and Activity Limitation during Cognitive Functional Therapy for People with Chronic Low Back Pain.
Chang R, Campbell A, Kent P, O’Sullivan P, Hancock M, Hoffman L, Smith A.
Injury incidence in Leinster Schoolboy Rugby players in 2022-23 season; the SCRUm cohort study phase 2. Murphy SJ, French H, Doyle B, Boland F, Keating L.
Injury Occurrence and Profiles Across Four Para Sport Modalities: A One-Year Prospective Study.
Resende R, Madaleno F, Silva A, Pinheiro L, Lourenço T, Wezenbeek E, Witvrouw E, Verhagen E, Mello MT, Ocarino J. Interaction between gender and injured limb on H/Q isokinetic ratio of both sides in patients with ACL rupture.
Fouladi R, Kiyadehi MB.
Intra-Rater Reliability and Error of Measurement of Knee Isokinetic Eccentric Muscle Performance
Assess- ment Procedures in Anterior Cruciate Ligament Injury Prevention Screening for Adult Agility-Sport Athletes.
Llurda-Almuzara L, Lewis C, Clark NC.
Intrinsic Graft Laxity Variation With Open Kinetic Chain Exercise After Anterior Cruciate Ligament Reconstruction.
Forelli F, Mazeas J, Zeghhoudi Y, Bouzekaroui M, Kakavas G, Hewett TE, Rambaud AJM.
Is Deceleration the Key Element in Vertical Jump Performance to Return to Sport After Anterior Cruciate Ligament Reconstruction?
Forelli F, Nekhouf B, Bouzekaroui M, Kakavas G, Hewett TE, Rambaud AJM.
Is Quadriceps Strength the Key Factor for RTR after ACLR?
Hariri B, Hardy A, Forelli F.
Isokinetic Eccentric Quadriceps Muscle Performance
Assessment in Patellofemoral Joint Primary and Sec- ondary Injury Prevention: An Intra-Rater Reliability and Standard Error of Measurement Pilot Study
Llurda-Almuzara L, Lewis C, Taylor MJD, Neal BS, Rambaud AJM.
Muscle activation alterations on single legged jumps after anterior cruciate ligament surgery.
Mazeas J, Forelli F, Vandebrouck A, Ratte L, Bouzekaroui M, Rambaud AJM.
Patient characteristics associated with successful response to patient advice and combined treatments for patients with plantar fasciopathy.
Larsen AL, Olesen JL, Jensen MB, Rathleff MS, Vicenzino B, Riel H.
Pelvic Floor Muscle Training in Female Functional Fitness Exercisers – An Assessor-blinded Randomized Controlled Trial
Skaug KL, Engh EM.
Periodic Health Evaluation in Para Athletes: a Position Statement Based on Expert Consensus.
Pinheiro L, Verhagen E, Ocarino J, Fagher K, Ahmed O, Dalton K, Mann D, Weiler R, Okoth C, Blauwet C, Lexell J, Kneepkens H, Derman W, Webborn N, Silva A, Resende R. Physiotherapist-led Treatment for Femoroacetabular Impingement Syndrome (The PhysioFIRST study): A Participant and Assessor-blinded Randomised Controlled Trial.
Kemp J, Smith A, Scholes M, Johnston R, Coburn S, Jones D, Girdwood M, Schache A, Mentiplay B, King M, Silva DdO, Crossley K.
Recovery after a Sports-related Concussion: a Longitudinal Study of Adolescent Rugby Union Players in Northern Ireland.
McKee C, Matthews M, Rankin A, Bleakley C.
Recovery of sensorimotor outcomes after acute ankle sprain: preliminary results of a prospective cohort study.
Wagemans J, Taeymans J, Kuppens K, Baur H, Vissers D, Bleakley C.
Relationship between muscle swelling and muscle hypertrophy of peroneus muscles by resistance training
Oda S, Maeda N, Arima S, Tamura Y, Tashiro T, Urabe Y.
Return to sport among 1928 patients with hip dysplasia after undergoing periacetabular osteotomy
Tønning L, Jakobsen S, Kemp J, O’Brien M, Dalgas U, Mechlenburg I.
Review of the physiotherapy service for athletes in Olympic winter games.
Chang JY.
Scapular Position In Non-Professional Racquet
Players: A Cross-Secondary Study.
Ruiz CO, Fuentes JM, Sousa SLDO, Navarro SM, Andreu CS, Payá FJM, Medina SDR, Rico JMB, Balaguer JM, Mas JMS.
Secondary prevention for athletes after an anterior cruciate ligament reconstruction – an evidence summary.
Sommer S, Wüthrich S, Blasimann A.
Segmental spinal curvature, inclination, and mobility changes of male soccer players within 4-year follow-up.
Keskin M, Bayram K, Ucurum SG, Kaya DO.
Shoulder laxity and rotator cuff muscle strength in healthy overhead athletes: an ultrasound study.
Abekura T, Maeda N, Kaizuka R, Komiya M, Tashiro T, Arima S, Urabe Y.
Stabilometric and Baropodometric Evaluation After Osteopathic Scaphoid Tug Manipulation.
Payá FJM, Navarro SM, Medina SDR, Ruiz CO, Balaguer JM, Andreu CS, Mas JMS, Rico JMB.
Static Stretching Improves Flexibility. But How Often, How Hard, and How Long Do We Need to Stretch For? A Systematic Review, Meta-Analysis, and Multivariate Meta-Regression.
Ingram L, Tomkinson G, D’Unienville N, Gower B, Dr. Sam Gleadhill S, Boyle T, Bennett H.
The Application of the ROAST - Guideline in Ankle Sprain Rehabilitation – A Case Study.
Liechti M, Schurz AP, Ahmadi E, Busch A, Bangerter C, Wagemans J.
The Effect of Blood Flow Restriction Training on Quadriceps Strength and Physiological Cross-Sectional Area After Anterior Cruciate Ligament
Reconstruction: A Double-Blind, Randomized, Placebo-Controlled Clinical Trial.
Erickson L, Lucas KH, Brightwell B, Graham M, Spencer K, Casadonte K, Janatova T, Hardy P, Owen M, Thompson K, Johnson D, Jacobs C, Conley C, Fry C, Noehren B.
The effects of icing on muscle temperature and contractile properties.
Fukuoka S, Samukawa M, Koshino Y, Ishida T, Kasahara S, Tohyama H.
The Effects of Motor Imagery on Balance and on the Fear of Re-Injury in Professional Football Players with Ankle Sprain.
Plakoutsis G, Paraskevopoulos E, Fousekis K, Tsepis E, Papandreou M, Ignatoglou D.
The effects of repetitive pitching on elbow valgus stability in baseball pitchers.
Nomura M, Koshino Y, Apolo F, Takahashi Y, Ishida T, Kasahara S, Tohyama H, Samukawa Mina.
The effects of rhythm jump training on agility and jumping ability in preadolescent Japanese soccer players: A non-randomized controlled trial.
Tsunekawa N, Watanabe H, Kato Y, Muroi R, Horiuchi H, Kawabata M, Takahira N.
The Health And Performance Promotion in Youth Sport (HAPPY) study: A qualitative evaluation of the implementation of injury prevention exercise programs in community handball.
Jespersen J, Storm LK, Larsen AC, Andersen LN, Zacher-Gross S, Juhl C, Roos EM, Møller M.
The influence of growth and maturation on injury and illness in Norwegian youth athletes – a prospective observation study.
Mollatt J, Rustaden AM.
The Multicentre ACL Screening COhorT STUDY –Validation of a screening tool – The MASCOT study protocol.
Arp K, Ingwersen KG, Ageberg E, Viberg B, Varnum C.
The relationship between trunk flexor endurance test at different angles and trunk performance tests in physical education students.
Koyama T, Kawai R, Matsuda T.
The Significant Effect on Clinical Condition, Strength Endurance and Stiffness of the Achilles Tendon for Both Alfredson and Silbernagel Protocols in Competitive Athletes with Achilles Tendinopathy.
Voleský K, Katolický J, Novák J, Janek M, Tufano J, CourelIbáñez J, Vitrovský T.
Thermal And Textural Analysis In Athletes With Patellar Tendinopathy: A Cross-Sectional Study.
Payá FJM, Navarro SM, Medina SDR, Ruiz CO, Sánchez JM, Andreu CS, Balaguer JM, Rico JMB.
Throwing Injury Prevention Strategies with a Fundamental Motor Skills-Focused Approach in the Early Stages of Long-Term Athletic Development.
Sakata J, Tsutsui T, Nakamura E, Sakai T.
Tissue flossing improves range of motion at hip in active person.
Silva F, Schneider C, Bona R.
Perception towards injury risk and injury prevention of rugby players in Germany – is there a difference between male and female players?
Lohkamp M, Saile M.
Translation, cross-cultural adaptation and validation of the Danish version of the Knee Outcome SurveyActivities of Daily Living Scale.
Arp K, Varnum C, Dalgas U, Knudsen BM, Timm S, Viberg B, Ingwersen KG.
Unveiling Vascular Masquerades: A Case of Iliac Internal Stenosis Mimicking GTPS.
Hamsø M.
Using In-game Scenarios to Measure Dual Task Capacity in Football Players.
Uysal O, Tunay VB, Güzel NA, Fırat T.
Validity and reliability of the groin injury screening questionnaire in Japanese.
Tamura Y, Maeda N, Tsutsumi S, Ishida A, Komiya M, Tashiro T, Arima S, Urabe Y.
Validity, agreement and reliability of the ForceFrame dynamometer in patients with anterior cruciate ligament injuries.
Arp K, Frydeldal T, Kjeldsen T, Dalgas U, Viberg B, Ingwersen KG, Varnum C.
Who Counted as an Expert and Whose Expertise Counted in Consensus Statements on Patellofemoral Pain or Patellofemoral Osteoarthritis?
Blazey P, Ardern C, Scott A, Whittaker J, Davis J, Losciale J, Khan K.
Efficacy of a rhythmic gymnastics-specific injury prevention program: a cluster-randomized controlled trial among competitive Norwegian rhythmic gymnasts.
Gram MD, Fagerland MW, Bø K.
Quality First: Development of a Tool to Assess Movement Quality in Hop Tests.
Baur H, Caminada S, Häberli M, Mathieu-Kälin M, Müller M, Weber M.
Reliability of two recently developed procedures assessing biological maturity by ultrasound imaging- a Pilot Study.
Hutmacher N, Busch J, Rueger E, Romann M, Eichelberger P.
“Prep to be PRO”—developing and implementing an educational program for youth elite athletes in sports academy high schools in Norway
Mrs. Hege Heiestad (Norwegian school of sport sciences, Oslo Sports Trauma Research Center), Prof. Grethe Myklebust (Norwegian school of sport sciences, Oslo Sports Trauma Research Center), Dr. Christine Holm Moseid (Norwegian school of sport sciences, Oslo Sports Trauma Research Center)
Oral Presentation
Abstract
Introduction: Due to the substantial burden of health problems among youth elite athletes we have developed a holistic, health-promoting, and injury-preventing educational program, across all sports.1
Objectives: The aim is to contribute to athletes’ overall health and to empower young athletes to make thoughtful, balanced choices that prioritize their long-term goals while navigating the challenges of sport and adolescence.
Study design: “Prep to be PRO” is a ten-module teacher-/coach-driven program, anchored in relevant competency and learning objectives mandated by the Norwegian Directorate of Education.
Setting: The program is athlete-centered and includes practical and theoretical sessions on relevant sport-specific physiological and psychological demands in high-level sports. The modules focus on growth and maturation, how to manage load progression and transition periods, overload, burnout, recovery, sports nutrition, and mental health. Participants/study population: A questionnaire-based pilot study was performed among 158 coaches and 1101 students at 9 different schools.
Interventions: In the development phase, we conducted meetings and practical workshops for school administra- tors and coaches to encourage the adoption and sustainability of the program. We also designed an evaluation form for the pilot.
Main Outcome Measurements: A pilot questionnaire consisting of 21 questions.
Results: A large majority of the coaches (83.8%-96.5%) answered “to a large or very large extent” in questions about the relevance of the program for the students. The students reported increased independence; 91.1% stated that “Prep to be PRO”instructions improved self-confidence and 95.2% planned to integrate the knowledge acquired in their daily training.
Conclusions: The pilot indicated that “Prep to be PRO” empowers elite youth athletes to assume responsibility for, and to be more aware of the complexity related to, -their overall health. The program will be implemented at sports academy high schools in Norway throughout 2023-24, and each school and sport will be monitored for research purposes.
Keywords: Injury prevention, Sports academy high schools, Youth elite athletes.
References
1. Moseid CH. (2020). Injury and illness in youth elite athletes.
A One-Year Prospective Study of Injury Occurrence and Burden in 102 Brazilian Para Athletes
Dr. Renan Resende (Universidade Federal de Minas Gerais), Ms. Fernanda Madaleno (Universidade Federal de Minas Gerais), Dr. Juliana Ocarino (Universidade Federal de Minas Gerais), Dr. Larissa Pinheiro (Universidade Federal de Minas Gerais), Dr. Thiago Lourenço (Comitê Paralímpico Brasileiro), Dr. Evi Wezenbeek (Ghent University), Prof. Erik Witvrouw (Ghent University), Dr. Evert Verhagen (Vrije Universiteit Amsterdam), Prof. Marco Tulio Mello (Universidade Federal de Minas Gerais), Dr. Andressa Silva (Universidade Federal de Minas Gerais)
Oral Presentation
Abstract
Introduction: Injuries may limit para athletes’ training and daily activities, affecting their sports performance and social participation.
Objectives: To assess injury occurrence and associated burdens in Brazilian para athletes throughout a season.
Study design: Prospective longitudinal study.
Methods: Data were collected between January and December 2022 at two Brazilian Paralympic Reference Centers. Para athletes from athletics, swimming, powerlifting, and taekwondo were included. A total of 102 athletes (25 females, 77 males) were studied using the Oslo Sports Trauma Research Center Questionnaire to record injuries, on a weekly basis, for 50 weeks. Incidence was calculated as the number of new cases divided by the time at risk in hours. The result was multiplied by 1000 to obtain the rate per 1000 hours of sport participation. Weekly prevalence was calculated by dividing the number of para athletes reporting an injury by the number of questionnaire respondents each week. A risk matrix graph was used to estimate burden.
Results: The majority of injuries were located in the shoulder (306;24.0%), ankle (217;17.1%), knee (187; 14.7%), and thigh (117;9.2%). The injury incidence rate was 24.2 per 1000 athlete hours (95%CI 23.4-25), and the mean weekly injury prevalence was 44.5% (95%CI 42.1–46.9). Injuries with a gradual onset were most common, with an incidence of 9.2 injuries per 1000 athlete hours (95%CI 8.9-9.5), while sudden onset injuries had an incidence of 8.2 injuries per 1000 athlete hours (95%CI 7.7-8.7). Twenty-three percent of all injuries caused at least one day of time-loss, with gradual onset injuries in the shoulder, knee, ankle, and thigh presenting the highest burdens.
1 2
Conclusions: Brazilian para athletes experienced a high incidence, prevalence and burden of injuries through- out the season. Practitioners working with para athletes should carefully monitor the occurrence and burden of shoulder injuries in non-ambulant athletes and ankle/knee/thigh injuries in ambulant athletes.
Keywords: Injury, Incidence, Prevalence, Burden, Para athletes
References
1. Pinheiro LSP, Ocarino JM, Madaleno FO, et al. Prevalence and incidence of injuries in para athletes: A systematic review with meta-analysis and GRADE recommendations. Br J Sports Med. 2021;55(23):1357-1365. Doi: 10.1136/bjsports2020-102823.
2. Pinheiro LSP, Silva A, Madaleno FO, et al. Prevalence and incidence of health problems and their characteristics in Brazilian para athletes: A one-season single-center prospective pilot study. Disability and Health Journal. 2024;17:101511.
A
Qualitative Study Examining Young Athletes’ Perceptions and Experiences With Pain and Injury Following Acute or Overuse Injury.
Mr. Ryan Summersby (School of Public Health, Physiotherapy and Sport Science, University College Dublin), Ms. Niamh Sheehan (School of Public Health, Physiotherapy and Sport Science), Dr. Chris Bleakley (School of Health Sciences, Ulster University, Belfast), Prof. Brian Caulfield (School of Public Health, Physiotherapy and Sport Science, University College Dublin), Dr. Mark Matthews (School of Sport, Ulster University, Belfast), Dr. Natalie Klempel (School of Health Sciences, Ulster University, Belfast), Dr. Sinead Holden (School of Public Health, Physiotherapy and Sport Science, University College Dublin)
Oral Presentation
Abstract
Introduction: Adolescence is a crucial period of musculoskeletal development. Despite the benefits of sport in this period, there is an inherent risk of injury that poses a threat to physical activity as well as future musculoskeletal health.
Objectives: The objective of this study is to gain insight into adolescents’ experiences with sport-related pain and injury, and their return to sport.
Study Design: Qualitative study design using single person semi-structured interviews.
Methods: We included athletes aged 15-18 years old who had suffered a sports related injury that impacted their sports participation/performance. Included participants were interviewed in their school using a semi-structured interview guide which had previously been piloted on adolescents with injury. Interviews were recorded and tran- scribed. Reflexive thematic analysis was used to inductively identify themes without any preconceptions of the data. Recruitment continued until data saturation.
Results: Seventeen interviews were included for data analysis (9 male, 8 female; mean age: 16years). Athletes had various injuries including bone fractures, muscle/ligament injury, back pain, shoulder dislocation and Osgood- Schlatter Disease. The thematic analysis revealed four major themes that influence adolescents’ path from pre- injury to return to sport. This included mental challenges, overtraining, social influences, and player confidence on return to sport. Players often felt pressure to overtrain and play through pain to retain their place on the team as they felt they were one of the stars of the team and they also expressed the importance of sport in their lives which could be a positive motivation but can also cause feelings of isolation during injury.
Conclusion: There are a range of social, emotional and cognitive factors that can positively and negatively affect adolescents’ journeys while injured. This may be important information to mitigate future injury risk and to guide adolescents successfully through injury rehabilitation.
Keywords: Adolescence, Injury, Interviews, Qualitative, Sport
3
Acute effects of stretching for mood symptoms and autonomic modulation in middle-aged women.
Ms. Miho Komatsuzaki (Graduate School of Health Sciences, Hokkaido University), Dr. Yuta Koshino (Faculty of Health Sciences, Hokkaido University), Dr. Tomoya Ishida (Faculty of Health Sciences, Hokkaido University), Dr. Satoshi Kasahara (Faculty of Health Sciences, Hokkaido University), Prof. Yasuhiko Ebina (Faculty of Health Sciences, Hokkaido University), Prof. Harukazu Tohyama (Faculty of Health Sciences, Hokkaido University), Dr. Mina Samukawa (Faculty of Health Sciences, Hokkaido University)
Oral Presentation
Abstract
Introduction: Middle-aged women are influenced by mood symptoms such as anxiety which may be associated with autonomic modulation.1 Stretching improves mood symptoms and increases parasympathetic activity. However, there are no reports that examine these indicators simultaneously.2,3
Objective: To investigate the acute effects of stretching on mood symptoms and autonomic modulation in middle-aged women.
Methods: Twenty-five middle-aged women (age: 51.8 ± 4.4 years) enrolled in this study. Each participant completed two conditions (static stretching and control) for 25 minutes each on separate days in a random order. Static stretch- ing was conducted with a whole-body program. The mood symptoms were measured using the State Trait Anxiety Inventory (STAI) questionnaire. Total score, subscales of anxiety-present and anxiety-absent were calculated pre- and post- intervention. Autonomic modulation was measured by heart rate variability (HRV). The HRV indices which assess parasympathetic activity were calculated with the root mean square of successive differences (RMSSD) and high-frequency power (HF) pre- and post- intervention and again 30 minutes later (PRE, POST-0, POST-30). The RMSSD and HF were transformed using the natural logarithm. Two-way repeated-measures analysis of variance was performed, and the Bonferroni test was used for posthoc comparisons.
Results: In the stretching condition, mood symptoms, especially state anxiety indicated with STAI-total (PRE: 34.2 ± 7.7; POST-0: 29.6 ± 6.7, p = < 0.001) and positive mood state determined with STAI-anxiety absent (PRE: 22.5 ± 6.9; POST0: 19.1 ± 6.3, p = < 0.001) were significantly improved after stretching. However, there were no significant changes with RMSSD and HF with either POST-0 or POST-30 in both stretching and control condition (p = 0.068– 0.808).
Conclusion: Stretching immediately improved mood symptoms in middle-aged women. However, autonomic mod- ulations were unchanged after stretching. Therefore, stretching is an effective intervention for mood symptoms in middle-aged women.
Keywords: Autonomic nerve activity, menopause, mental health, static stretching
References
1. Zhao D et al. The structure of menopausal syndrome: Using network analysis to understand unique symptomatic relationships: Int J Gynecol Obstet. 2022.
2. Kai Y et al. Effects of stretching on menopausal and depressive symptoms in middle-aged women: a randomized controlled trial. Menopause. 2016;23(8):827-832.
3. Wong A et al. The Effects of Stretching Training on Cardiac Autonomic Function in Obese Postmenopausal Women. Altern Ther Health Med. 2017.
Adolescents’ Experience with Sports-Related Pain and Injury and their Journey to Returning to Sport: A Systematic Review of Qualitative Research
Ms. Niamh Sheehan (School of Public Health, Physiotherapy and Sport Science, University College Dublin), Mr. Ryan Summersby (School of Public Health, Physiotherapy and Sport Science, University College Dublin), Dr. Chris Bleakley (School of Health Sciences, Ulster University, Belfast), Dr. Brian Caufield (School of Public Health, Physiotherapy and Sport Science, University College Dublin), Dr. Mark Matthews (School of Sport, Ulster University, Belfast), Dr. Natalie Klempel (School of Health Sciences, Ulster University, Belfast), Dr. Sinead Holden (School of Public Health, Physiotherapy and Sport Science, University College Dublin)
Oral Presentation
Abstract
Introduction: Sports related pain and injuries are common in adolescent athletes who may experience unique challenges. Injury and burn out throughout adolescence remains one of the primary drivers of premature drop out from sport and therefore it is fundamental to explore the experience of adolescents with injuries and their difficulties and successes in returning to sport.
Objectives: The aim of this review is to synthesise qualitative studies examining adolescents’ experience with pain and injury arising from sports participation.
Study Design: A Systematic review of Qualitative research.
4 5
Methods: This review was prospectively registered on Open Science Framework. A systematic search of PubMed, Embase, and Sports Discus was carried out up to January 2023. Studies were included based on a pre-set inclu- sion/exclusion criteria. There were no restrictions based on injury type once the injury or pain was sports related. Studies were appraised using the CASP (critical appraisal skills programme) checklist. Data was synthesised using meta aggregation.
Results: 16 qualitative studies were included (n=216 participants). Participants presented with either severe knee injuries (n=8 studies), concussion (n= 5 studies), or various musculoskeletal injuries (n=3). Study quality was re- ported as high overall. The synthesised findings revealed that regardless of injury diagnosis, adolescents experi- ence a mix of positive (motivation to rehab and return to sport, optimism) and negative emotions (fear of re-injury, isolation, depressive responses) throughout recovery. Common coping strategies were to ignore symptoms, modify activity levels, or seek support. Conclusion; In conclusion, this systematic review sheds light on the multifaceted experiences of adolescent athletes dealing with sports-related pain and injuries. Motivation and support play crucial roles in adolescents’ desire to return to sports, but that this can be accompanied by a pervasive fear of re-injury and social isolation. This provides insights to address the unique needs of adolescents as they navigate the path to recovery.
Keywords: Adolescent experiences, concussion experience, meta aggregation, sports injury, qualitative synthesis
Bio-banding in Soccer: A Scoping Review.
Mr. Sander Mellingen Homstøl (Norwegian school of sport sciences)
Oral presentation.
Abstract
Introduction: Bio-banding (BB) is a strategy used in sports to level out the differences in growth, maturation and development in children and youth during training and non-official competition. Instead of grouping athletes based on chronological age, they are grouped based on their biological maturity status.
Objectives: Bio-banding in soccer has been proposed to assist in the process of identifying, selecting and developing talents and reduce the risk of injury. The aim of this study was therefore to identify primary research on bio-banding in soccer relating to the; technical/tactical-; physical-; psychological-, social-; and medical-dimension of performance.
Study design: A scoping review following the PRISMA-ScR guidelines was used to identify research from the databases of Sport- Discus, Medline and ORIA NORD from its origin to October 2022 using bio-banding as the primary search term. Primary research on BB in soccer, written in English or a Scandinavian language with full text, was included. An additional search was performed in referencelists, Google Scholar and grey literature.
Results: The study identified 20 studies from 2018 to 2022 on the use of BB among 9- to 18-year-old soccer players (N=1951), coaches/stakeholders (N=8) and parents (N=80). In terms of outcome measures there were 10 studies related to the technical- and/or tactical dimension; 15 to the physical-, 9 to the psychological-; 5 to the social-; and 4 to the medicaldimension.
Conclusion: Players, coaches/stakeholders and parents identified both advantages and disadvantages with the use of BB. The outcome measures support the potential use of BB in soccer through identification, selection, player development and risk of injury. However, the evidence is limited, so further studies are warranted, especially among female soccer players. To facilitate a more holistic and integrated approach to banding in soccer, the study proposes a biopsychosocial model for further development.
Keywords: Scoping review; Bio-banding; Soccer; Football; Maturation
Body Composition, Core Stability, Flexibility, Balance and Psychological State in Female Athletes with Primary Dysmenorrhea: A Case-control Study.
Poster presentation
Mrs. Seyda Toprak Celenay (Ankara Yildirim Beyazit University), Mrs. Yasemin Karaaslan (Hatay Mustafa Kemal University), Ms. Aysenur Karakus (Cankiri Karatekin University), Mrs. Zehra Korkut (Selcuk University), Mrs. Elif Sena Dusgun (Fenerbahce University), Prof. Derya Ozer Kaya (Izmir Katip Celebi University)
Abstract
Introduction: Primary dysmenorrhea (PD), painful menstruation in the absence of pelvic pathology, is a common gynecological condition that affects between 45 and 95% of menstruating women.1 Among the parameters as- sociated with PD, body composition, core stability, flexibility, balance and psychological problems are prominent.2,3 The high incidence of PD in female athletes4 has led to the need for more comprehensive investigation of these parameters that may affect PD in these athletes.
Objectives: To compare body composition, core stability, flexibility, balance and psychological state in female ath- letes with and without PD.
6 7
Study design: A case-control study.
Methods: Nineteen athletes with PD (PD group, age=20 (19-23) years) and 17 athletes without PD (control group, age=21 (18-24) years) were included. Body composition with Tanita BC601 device, core stability with McGill-trunk endurance tests and Sahrmann test, flexibility with sit-and-reach test, balance with Y-balance test and psychological state with Athletic Psychological Skills Inventory were evaluated on days off menstruation.
Results: The branches of athletes in the PD group were volleyball (n=17), rugby (n=1) and swimming (n=1). The branches of athletes in the control group were volleyball (n=11), basketball (n=4) and swimming (n=2). Daily training time of PD and control groups were 60 (30-120) min and 60 (30-120) min, respectively. The pain intensity of PD group was 7.3(4.410) cm. Waist-hip ratio (p=0.06) in PD group were higher than control group. Trunk flexor (p=0.029), extensor (p=0.015), right (p=0.001) and left lateral flexor endurance (p=0.018), Sahrmann (p<0.001) and sit-and-reach scores (p=0.004) were lower in PD group than control group. There were no differences in other parameters between groups (p>0.05).
Conclusions: While waist-hip ratio was higher in athletes with PD than athletes without PD; core stability and flexibility were lower. These parameters related to sports performance should be considered in management of female athletes with PD.
Keywords: Female athlete, primary dysmenorrhea, body composition, balance, dynamic stabilization
References:
1. De Sanctis V, Soliman A, Bernasconi S, et al. Primary Dysmenorrhea in Adolescents: Prevalence, Impact and Recent Knowledge. Pediatric Endocrinology Reviews, 2015;13(2):512–520.
2. Karakus A, Balaban M, Kaya DO et al. Lumbopelvic muscle endurance, morphology, alignment, and mobility in women with primary dysmenorrhea: A case-control study. Clinical Biomechanics (Bristol, Avon). 2022;92:105582.
3. Wu L, Zhang J, Tang, J et al. (2022) The relation between body mass index and primary dysmenorrhea: A systematic review and meta-analysis. Acta Obstetricia et Gynecologica Scandinavica. 2022;101(12), 1364- 1373.
4. Vannuccini, Fondelli F, Clemenza S, et al. Dysmenorrhea and Heavy Menstrual Bleeding in Elite Female Athletes: Quality of Life and Perceived Stress. Reproductive Sciences. 2020;27(3):888–894.
Breast Pain and Trauma in Professional Women’s Basketball – Next Steps for Awareness and Action.
Oral presentation
Dr. Tamara Eichelberger (Azusu Pacific University, Azusa, CA), Dr. Laura Smith (University of Michigan - Flint, Flint, MI), Dr. Edward Kane (University of St. Augustine for Health Sciences, San Marcos, CA)
Abstract
Introduction: Participation in professional women’s sports has increased dramatically in the last few decades. Research on the prevalence and potential consequences of breast trauma sustained during participation in profes- sional sports is scarce despite the documented consequences of trauma to the breast sustained outside of sports participation, including motor vehicle collisions,1 seatbelt,2 and blunt force trauma.3
Objectives: Investigate the prevalence, description, and effects of breast pain and trauma among athletes in the French Feminine Professional Basketball League.
Study design: Cross-sectional study from a sample of convenience.
Methods: Female athletes from six French professional basketball teams were invited to participate. A thirteen- question survey was administered electronically to sixty-six athletes that included questions regarding demograph- ics and breast trauma during participation in basketball.
Results: Fifty-eight athletes participated. Nearly one-third (27.6%, n=16) of the athletes reported breast trauma. Fourteen of the sixteen athletes provided additional information regarding their trauma. Fourteen (100%) athletes reported pain, with an average pain rating of 5.6 (0-10 scale). Three (21.4%) athletes reported bruising/discoloration, three (21.4%) reported lumpy/hard mass development, and two (14.3%) reported swelling/inflammation. Four (28.6%) athletes missed practice and/or competition. Six (42.9%) athletes reported their trauma to medical staff, and three (21.4%) of those received treatment.
Conclusions: All athletes who reported breast trauma reported experiencing moderate pain. Pain and other in- juries had adverse effects on practice and/or competition. As part of the medical team, the sports physical therapist is in prime position to assist with educating on the importance of awareness of sports-related breast trauma. Strate- gies need to be implemented to reduce the occurrence and encourage follow up of breast trauma for women par- ticipating in sports, including education on the importance of reporting breast trauma as well as exploring proper breast protection and determining potential sequela for this sensitive topic important to women’s health.
Keywords: basketball, breast, pain, trauma, injury
8
References
1. Pressney I, Stedman B, King L. Significant breast injury after road traffic collision. Trauma. 2013;16:45-47.
2. Song CT, Teo I, Song C. Systematic review of seat-belt trauma to the female breast: A new diagnosis and management classification. J Plast Reconstr Aesthet Surg. 2015;68:382-389. (PMID: 25586018)
3. Sanders C, Cipolla J, Stehly C, et al. Blunt breast trauma: Is there a standard of care? Am J Surg. 2011;77:1066-1069. (PMID: 21944525)
Career Prevalence of Concussion among Adolescent Female and Male Handball Players: A Cross-Sectional Study.
Oral Presentation
Mr. Stefan Bohlin (1: Handball Research Group, Department of Health Promotion Science, Sophiahemmet University. 2: Naprapathögskolan - Scandinavian College of Naprapathic Manual Medicine, Stockholm, Sweden.), Prof. Martin Hägglund (3: Sport Without Injury Programme (SWIPE), Linköping University, Unit of Physiotherapy, Linköping, Sweden. ), Dr. Markus Waldén (4: Capio Ortho Center Skåne, Malmö, Sweden. 5: Department of Health, Medical and Caring Sciences, Linköping University, Sweden.), Dr. Rodney Whiteley (6: Aspetar Orthopaedic and Sports Medicine Hospital, Rehabilitation Department.), Dr. Martin Asker (1: Handball Research Group, Department of Health Promotion Science, Sophiahemmet University.)
Abstract
Introduction: While sports-related concussions (SRC) are recognized as a serious concern for young athletes, re- search remains limited regarding the prevalence of and risk factors for SRC in handball.
Objectives: To investigate the career prevalence of SRC in adolescent handball players and investigate any potential differences based on sex, age, playing position and playing level.
Study design: Cross-sectional study.
Methods: Players from Swedish handball-profiled high schools were during 2020–2023 invited to participate in the ongoing Swedish Handball Cohort study. At baseline, the participants completed a questionnaire assessing their ex- periences with current and past SRC sustained during their handball careers. Prevalence ratios (PR) were calculated with corresponding 95% confidence intervals (CI) using multivariable generalized linear models.
Results: A total of 1,545 players from 22 schools were included. The self-reported career prevalence of SRC in the total population was 423 (27 %). Goalkeepers had a twofold higher prevalence compared to wing players (PR 2.28, 95 % CI 1.73–3.01) and the prevalence was also higher for backcourt players compared to wing players (PR 1.40, 95% CI 1.08–1.82).
Furthermore, the prevalence was higher in 2nd grade students (PR 1.22, 95 % CI 1.01–1.47) and 3rd grade students (PR 1.34, 95 % CI 1.09–1.64) compared to 1st grade students. The PR between line players and wing players was 1.37 (95 % CI 0.98–1.90) and the PR between female players and male players was 1.12 (95 % CI 0.96–1.32). There was no difference between national level players compared to regional level players (PR 0.99, 95% CI 0.83–1.19).
Conclusion: Goalkeepers and backcourt players showed a higher prevalence of SRC compared to wing players. The prevalence was also higher in 2nd and 3rd grade students compared to 1st grade students. No difference was seen between national level players and regional level players.
Keywords: adolescent, concussion, handball, traumatic brain injury, youth sport
Changes in foot and ankle muscle pennation angles from non-weight-bearing to weightbearing positions
Poster presentation
Dr. Abbis Jaffri (Creighton University), Dr. Amber Schwarting (Creighton University)
Abstract
Introduction: The architectural features of muscles (muscle thickness (MT), cross-sectional area (CSA), pennation angles) respond to different stimuli (strength training, immobilization, weight-bearing, etc.). It is imperative to understand the changes in architectural features of the muscles to understand their functional changes. While changes in MT and CSA in foot and ankle muscles have been studied, changes in pennation angles have not yet been studied.
Objective: This study is aimed to investigate the changes in pennation angles in foot and ankle muscles from non-weightbearing (NWB) to weight-bearing (WB) positions.
Study design: This is a retrospective case-control study. Sixty (23.06 ± 3.16 yrs., 74.67 ± 19.72 kgs, 169.50 ± 8.69 cm,) individuals participated in the study.
Methods: Pennation angles were measured in vivo using ultrasound imaging in NWB (sitting) and WB (standing) positions. Three images were taken, and the average was calculated, for the following muscles: Tibialis Anterior (TA), Tibialis
9 10
Posterior (TP), Peroneals, and Abductor Hallucis (AH). The probe was placed at 20%, 30%, and 50% of the shank length for TA, TP, and peroneal muscles, respectively. For AH, the probe was placed 2 cm distal to the medial malleolus. The probe was oriented along the muscle fibers. An independent sample t-test was used to analyze the differences between pennation angles measures in NWB and WB positions.
Results: There was no statistically significant difference found between NWB and WB positions for TA, TP and AH muscles. However, pennation angles increased significantly (p=0.04) for peroneal muscles in the WB position compared to NWB.
Conclusions: Changes in muscle architecture are associated with changes in muscle function. Changes in pennation angles in peroneal muscles show greater force production in the functional position compared to NWB positions. Pennation angles may be considered when assessing muscle force for peroneal muscles.
Keywords: Ultrasound imaging, assessment, force production, lower leg
References
1. Fraser JJ, Koldenhoven RM, Jaffri AH, et al. Foot impairments contribute to functional limitation in individuals with ankle sprain and chronic ankle instability. Knee Surgery, Sports Traumatology, Arthroscopy. 2020;28:1600-1610.
2. Baellow A, Jaffri AH, Hertel J, et al. Intrinsic foot muscle size and quality in a single leg weight bearing position across foot posture types in individuals with Patellofemoral Pain compared to healthy. Physical Therapy in Sport. 2022;54:58-64.
3. Jaffri A, Koldenhoven R, Saliba S, et al. Evidence of intrinsic foot muscle training in improving foot function: a systematic review and meta-analysis. Journal of Athletic Training.
Cognitive behavioral physical therapy in chronic musculoskeletal conditions: A systematic review.
Oral presentation
Dr. Abbis Jaffri (Creighton University), Dr. Ryan Greenfield (Creighton University), Dr. Sean Kelley (Creighton University)
Abstract
Introduction: Despite the enhancement of physical therapy treatment interventions, the prevalence of chronic musculoskeletal conditions is increasing. Therefore, new holistic treatment interventions are implemented by physical therapists to improve clinical and patient-reported outcomes.
Objective: To critically assess the literature focused on the effect of psychologically informed physical therapy interventions in improving outcomes associated with chronic musculoskeletal conditions.
Study design: Systematic review. 1,511 total subjects from 19 different studies were included in this systematic review: one study on Knee osteoarthritis (O.A), eight studies with chronic low back pain (CLBP) patients, four studies with chronic neck pain (CNP), and two studies with patellofemoral pain (PFP).
Materials and methods: A search of electronic databases including PubMed, CINHAL, psychological and behavioral sciences, SPORTdiscus, and Scopus was completed between January 2000 to January 2023. Randomized control trials (RCTs) with an out- come of interest including the VAS (visual analog scale), FABQ (fear avoidance belief questionnaire), ODI (modified Oswestry Disability index), Tampa Scale for Kinesiophobia, and functional outcomes.
Results: No superiority of CBPT was observed for improving pain and function of knee OA. For the CLBT patients, disability improved in 7/8 studies, pain improved in 5/8 studies, and fear in 4/8 studies. For PFP, one study showed immediate improvements in pain and disability compared to controls but no difference at 6 months. All four CNP studies showed improvements in pain in the groups receiving CBPT, no improvement in disability was observed with CBPT in CNP, two of the four studies looked at kinesiophobia or pain related to fear and both studies found improvements with CBPT compared to the control group.
Conclusion: While initial results are promising, high-quality RCTs following CONSORT guidelines are required to further evaluate the efficacy of CBPT and determine optimal clinical pathways for addressing pain, disability, and fear developed because of chronic musculoskeletal conditions.
Keywords: holistic therapy, treatment, intervention, psychological impairments
References
1. El-Tallawy SN, Nalamasu R, Salem GI, et al. Management of musculoskeletal pain: an update with emphasis on chronic musculoskeletal pain. Pain and Therapy. 2021;10:181-209.
2. Balagué F, Mannion AF, Pellisé F, et al. Non-specific low back pain. The Lancet. 2012;379(9814):482-491.
3. Ludvigsson ML, Peterson G, O’Leary S, et al. The effect of neck-specific exercise with, or without a behavioral approach, on pain, disability, and self-efficacy in chronic whiplash-associated disorders: a randomized clinical trial. The Clinical Journal of Pain. 2015;31(4):294.
11
Comparison of the distance between the talus and the lateral malleolus during single-leg drop landing in individuals with and without chronic ankle instability
Poster presentation
Ms. Ayano Ishida (1) Department of Sports Rehabilitation, Graduate School of Biomedical and Health Sciences, Hiroshima University), Dr. Noriaki Maeda (1) Department of Sports Rehabilitation, Graduate School of Biomedical and Health Sciences, Hiroshima University), Mr. Satoshi Onoue (1) Department of Sports Rehabilitation, Graduate School of Biomedical and Health Sciences, Hiroshima University), Dr. Makoto Komiya (1) Department of Sports Rehabilitation, Graduate School of Biomedical and Health Sciences, Hiroshima University), Dr. Tsubasa Tashiro (1) Department of Sports Rehabilitation, Graduate School of Biomedical and Health Sciences, Hiroshima University), Mr. Satoshi Arima (1) Department of Sports Rehabilitation, Graduate School of Biomedical and Health Sciences, Hiroshima University), Ms. Rami Mizuta (1) Department of Sports Rehabilitation, Graduate School of Biomedical and Health Sciences, Hiroshima University), Ms. Honoka Ishihara (1) Department of Sports Rehabilitation, Graduate School of Biomedical and Health Sciences, Hiroshima University), Ms. Miki Kawai (1) Department of Sports Rehabilitation, Graduate School of Biomedical and Health Sciences, Hiroshima University), Prof. Yukio Urabe (1) Department of Sports Rehabilitation, Graduate School of Biomedical and Health Sciences, Hiroshima University)
Abstract
Introduction: Lateral ankle sprain (LAS) has high recurrence rate, which has considered to be associated with chronic ankle instability (CAI). Ankle instability in individuals with CAI has seemed as a risk of LAS re-injury, and LAS often occur during landing. A previous study used ultrasound imaging to measure the distance between the talus and lateral malleolus as an assessment of ankle instability. In previous study, this distance was greater in individuals with CAI than without.1 However, the distance has been only evaluated statically, and dynamics of the distance during landing is unknown.
Objectives: To evaluate dynamics of the distance between the talus and lateral malleolus during single-leg drop landing and compare between with and without CAI.
Study design: Cross-sectional study
Methods: In total 12 adults (22 feet) were participated in this study, and they were divided into the healthy group (12 feet) and the CAI group (10 feet). The task movement was single-leg drop landing from a 30 cm high box. The distances between the talus and lateral malleolus during landing were measured using the ultrasound synchronized with a motion capture system.2 The analysis was conducted from 400 ms before to 400 ms after initial contact (IC). To compare the distances between healthy group and CAI group, unpaired t-test was conducted.
Results: The distance was significantly greater in the CAI group than the healthy group from 400 ms before to 400 ms after IC (p<0.01).
Conclusions: The distance between the talus and the lateral malleolus was greater in the CAI group compared to the healthy group during drop landing, and this may reflect the ankle instability and be a risk for LAS re-injury. The result of this study suggests the necessity of compasating the ankle instabiltity of individuals with CAI during landing by taping, orthosis, muscle training and so on.
Keywords: ankle instability, lateral ankle sprain, motion capture system, ultrasound imaging
References
1. Adbeen R, Comfort P, Starbuck C, et al. Ultrasound characteristics of foot and ankle structures in healthy, coper, and chronically unstable ankles. J Ultrasound Med. 2019;38(4):917-926.
2. Maeda N, Yasunari I, Tsubasa T, et al. Quantitative evaluation of the vertical mobility of the first tarsometatarsal joint during stance phase of gait. Sci Rep. 2022;12(1):9246.
Construct validity of the Sideways Shoulder Sway Test for Assessment of Sensorimotor Control of the Glenohumeral Joint
Poster presentation
Mr. Mads Arensdorff Salling (The Faculty of Health Sciences, University of Southern Denmark, Odense, Denmark & Human Movement Analysis Laboratory, Dept. of Orthopaedic Surgery, Copenhagen University Hospital – Amager-Hvidovre, Denmark.), Ms. Kristine Rask Andreasen (Sports Orthopaedic Research Center Copenhagen - (SORC-C), Department of Orthopaedic Surgery, Amager-Hvidovre Hospital, Institute of Clinical Medicine, Copenhagen University, Denmark.), Dr. Merete Møller (Department of Sports Science and Clinical Biomechanics, The Faculty of Health Sciences, University of Southern Denmark, Odense, Denmark. Oslo Sports Trauma Research Center, Norwegian School of Sports Sciences, Oslo, Norway), Dr. Jesper Bencke (Human Movement Analysis Laboratory, Dept. of Orthopaedic Surgery, Copenhagen University Hospital – Amager-Hvidovre, Denmark & IOC Research Center Copenhagen, Copenhagen University Hospital – Amager-Hvidovre, Denmark).
12 13
Abstract
Introduction: Reduced sensorimotor control of the shoulder joint has been proposed as a risk factor for overuse injuries in overhead athletes. Sway length in a one-armed prone plank has been suggested as a method for mea- suring sensorimotor control. The Shoulder Sway Test (SST) has been developed to measure sensorimotor control outside the laboratory.
Objective: To assess “known-group validity” of the SST by evaluating the “between-arm difference” in sway in senior volleyball athletes compared to soccer athletes. We hypothesized that volleyball athletes have greater “between- arm difference” in sensorimotor control of the shoulder joint compared to soccer athletes.
Study design: Known-group validity study.
Methods: 61 adult male and female volleyball and soccer athletes were divided into groups: Volleyball athletes (VA), Volleyball athletes with dominant shoulder pain (VASP) and Soccer athletes (SA). Athletes were tested in an upper limb weight bearing sideways plank with the lower extremities resting on step platforms to the iliac crest measuring sway of the proximal humerus using an iPhone 6 and the application “Physics Toolbox Sensor Suite” with 100 Hz sampling frequency. Sway was defined as a summation of the horizontal acceleration vectors. The tests were done prior to team practice at the athletes’ clubs.
Results: There was no statistically significant “between-arm difference” in sway for VA (mean = 165.1 [95% CI, - 242.7 ; 572.9]), SA (mean = 406.7 [95% CI, -136.6 ; 950.0]) or VASP (mean = 148.7 [95% CI, -221.9 ; 519.3]). Additionally, there was no statistically significant difference between groups, including VA and SA (mean = -241.6 [95% CI, -888.5; 405.6]) or VA and VASP (mean = 16.4 [95% CI, -621.0 ; 653.7]).
Conclusion: The SST lack “known-group validity” in measuring sensorimotor control of the shoulder in adult active volleyball and soccer athletes. Further research is needed to investigate potential validity in other groups.
Keywords: Overhead athletes, Sensorimotor control, Shoulder joint, Validity
Curl-up exercises improve abdominal muscle strength without worsening inter-recti distance in women with diastasis recti abdominis postpartum: a randomised controlled trial.
Oral presentation
Dr. Sandra Bjordal Gluppe (Norwegian school of sport sciences), Prof. Marie Ellström Engh (Akershus University Hospital), Prof. Kari Bø (Norwegian school of sport sciences)
Abstract
Introduction: Diastasis recti abdominis (DRA) is defined as midline separation of the two rectus abdominis muscles along the linea alba and is highly prevalent postpartum. Systematic reviews have concluded with insufficient evidence to recommend any specific exercise protocol in the treatment and curl-ups have traditionally been discouraged for women with DRA.
Objectives: What is the effect of a 12-week, home-based, abdominal exercise program containing head lifts and abdominal curl-ups on inter-recti distance (IRD) in women with DRA 6 to 12 months postpartum?
Study design: A two-arm, parallel-group, randomised controlled trial with concealed allocation, assessor blinding and intention-to-treat analysis
Methods: Seventy primiparous or multiparous women 6 to 12 months postpartum, having a single or multiple preg- nancy following any mode of delivery, with a diagnosis of DRA. The experimental group (n=35) was prescribed a 12-week standardised exercise program including head lifts, abdominal curl-ups and twisted abdominal curl-ups 5 days a week. The control group (n=35) received no intervention. The primary outcome measure was change in IRD measured with ultrasonography. Secondary outcomes were: observed abdominal movement during a curl- up; global perceived change; rectus abdominis thickness; abdominal muscle strength and endurance; pelvic floor disorders; and low back, pelvic girdle and abdominal pain.
Results: The exercise program did not improve or worsen IRD (eg, MD 1 mm at rest 2 cm above the umbilicus, 95% CI -1 to 4). The program improved rectus abdominis thickness (MD 0.7 mm, 95% CI 0.1 to 1.3) and strength (MD 9 Nm, 95% CI 3 to 16) at 10 deg; its effects on other secondary outcomes were trivial or unclear.
Conclusions: An exercise program containing curl-ups for women with DRA did not worsen IRD or change the sever- ity of pelvic floor disorders or low back, pelvic girdle or abdominal pain, but it did increase abdominal muscle strength and thickness.
Keywords: Curl-up; Diastasis recti abdominis; Exercise; Postpartum; Randomised controlled trial.
14 15
References
1. Venes D, Taber C. Taber’s Cyclopedic Medical Dictionary 22nd edition. Philadelphia, PA: FA Davis Co; 2013.
2. Gluppe S, Engh ME, Bø K. What is the evidence for abdominal and pelvic floor muscle training to treat diastasis recti abdominis postpartum? A systematic review with meta-analysis. Braz J Phys Ther. 2021;25(6):664-675. doi: 10.1016/j.bjpt.2021.06.006. Epub 2021 Jul 21. PMID: 34391661; PMCID: PMC8721086.
3. Sandra B Gluppe, Marie Ellström Engh, Kari Bø, Immediate Effect of Abdominal and Pelvic Floor Muscle Exercises on Interrecti Distance in Women With Diastasis Recti Abdominis Who Were Parous, Physical Therapy, 2020;100-B:1372-1383 https://doi.org/10.1093/ptj/pzaa070
Development and intra-tester reliability of a new strength assessment protocol on female pole dancers
Poster presentation
Mrs. Despoina Ignatoglou (Clinical Exercise Physiology and Rehabilitation Labatory, Physiotherapy Department, School of Health Sciences,University of Thessaly, 3o km Lamias- Athens, 35100), Mr. Achileas Paliouras (Clinical Exercise Physiology and Rehabilitation Labatory, Physiotherapy Department, School of Health Sciences,University of Thessaly, 3o km Lamias- Athens, 35100), Mrs. Paraskevi Bilika (Clinical Exercise Physiology and Rehabilitation Labatory, Physiotherapy Department, School of Health Sciences,University of Thessaly, 3o km Lamias- Athens, 35100), Prof. Eleni Kapreli (Clinical Exercise Physiology and Rehabilitation Labatory, Physiotherapy Department, School of Health Sciences,University of Thessaly, 3o km Lamias- Athens, 35100)
Abstract
Introduction: Pole dancing (PD) is a very demanding sport that combines dancing and acrobatic figures around a vertical pole.1 There is little research that has done and it is limited in epidemiological data and grip strength.1-3
Objectives: The aim of this study is to create a strength assessment protocol in 3 different sport specific positions for female athletes of PD and its intra- tester reliability.
Study design: This was an observational study for intra- tester reliability.
Method: For this study a total of 32 female athletes were recruited as volunteers. The participants had different level of experience and they were assessed at 3 different basics for PD positions. The assessment happened at two different days with a 5-7 days gap between them. The positions were the shoulder abduction and adduction and the hip adduction. Participants did not resent any pain, injury or surgery at the assessment areas and also there were not in the menstruation phase of cycle. The procedure included three trials for each side and each position. Every trial had five seconds duration and repeated after two minutes break. A hand held dynamometer (Activ5, ActivBody) was used and stabilized with straps on the pole.
Results: The reliability was established comparing the 3 trials of each measurement day and the last 2 trials of each day between them and the means of the trials of each day were compared between two days. The results revealed high reliability rates (ICC= 0,833-0,974). The 3-trial means method presented the higher rates between the comparisons done (ICC= 0,939- 0,974), while the position with the more consistently repeated results was the abduction of left shoulder. Conclusion: The strength assessment protocol developed through this study could be used as a reliable and easily applicable way for assessing pole dancers’ strength in clinical practice.
Keywords: pole dancing, activ5, strength, reliability, sport specific
References
1. Catherine, N. J. The Psychological, Physiological And Injury- Releated Characteristics Of Recreational Pole Dancing. 2019. PhD, University Of Western Australia.
2. Lee JY, Lin L, Tan A. 24 Prevelance Of Pole Dance Injuries From A Global Online Survey. The Journal Of Sports Medicine And Physical Fitness. 2019;60:270-275.
3. Naczk M, Kowalewska A, Naczk A. The Risk Of Injuries And Physiological Benefits Of Pole Dancing. The Journal Of Sports Medicine And Physical Fitness. 2020;60:883-888
Development and Validation of the Intervention Usability Scale for Exercise (IUSE)
Poster presentation
Ms. Anne Inger Mørtvedt (Michigan Technological University), Dr. Erich J. Petushek (Michigan Technological University)
Abstract
Introduction: Exercise interventions are effective in treating and preventing injuries and diseases, but adherence rates are typically low. Usability testing of products has been successful in other domains (e.g. technology) by its end-user involvement and ability to detect barriers to use. No scales exist aiming to assess usability of exercise interventions.
16 16
Objectives: Develop and assess the psychometric properties of the Intervention Usability Scale for Exercise (IUSE).
Study design: Instrument development / Psychometric research
Methods: Item generation and content validation involved cognitive interviews with eight exercise intervention stakeholders and ten target users from the general public. Subsequently, 526 target users from University, Qualtrics and Prolific participant panels assessed exercise programs through an online survey. Test-retest analysis, di- mensionality assessment using PCA, EFA/CFA, and bifactor models, IRT for discriminability, item information lev- els/patterns and differential item functioning, and comparison of short vs. original scale versions were conducted. Evidence of criterion, convergent, and discriminant validity was assessed.
Results: Thirty-six items were initially included, with 16 removed due to low reliability and factor loadings (r < .05). A 3factor structure emerged from EFA, PCA, and bifactor models: Usefulness, Ease of Use/Learnability, and Social. Iterative evaluation led to 12 item removals, resulting in 8 final items across three subscales. Validity analyses indicated good convergent (e.g., r = 0.79 with Intervention Appropriateness Measure), criterion (e.g., r = 0.71 with Net Promoter Score), and discriminant validity (r = 0.42 with External Motivation), along with satisfactory internal consistency (Cronbach’s alpha: 0.79-0.84).
Conclusions: The IUSE scale demonstrated promising psychometric properties. Application of the scale with collec- tion of actual uptake/adherence data is needed to assess predictive validity.
Keywords: usability, implementation, exercise, adherence, scale development, psychometrics
Do the characteristics of head impact during blind football differ between Paralympic Games? Video-based observational study
Poster presentation.
Dr. Noriaki Maeda (1) Department of Sports Rehabilitation, Graduate School of Biomedical and Health Sciences, Hiroshima University), Dr. Junpei Sasadai (2) Sports Medical Center, Japan Institute of Sports Sciences (JISS)), Mr. Yuki Tamura (1) Department of Sports Rehabilitation, Graduate School of Biomedical and Health Sciences, Hiroshima University), Mr. takumi Nagao (1) Department of Sports Rehabilitation, Graduate School of Biomedical and Health Sciences, Hiroshima University), Ms. Rami Mizuta (1) Department of Sports Rehabilitation, Graduate School of Biomedical and Health Sciences, Hiroshima University), Ms. Honoka Ishihara (1) Department of Sports Rehabilitation, Graduate School of Biomedical and Health Sciences, Hiroshima University), Dr. Tsubasa Tashiro (1) Department of Sports Rehabilitation, Graduate School of Biomedical and Health Sciences, Hiroshima University), Mr. Satoshi Arima (1) Department of Sports Rehabilitation, Graduate School of Biomedical and Health Sciences, Hiroshima University), Mr. Takeru Abekura (1) Department of Sports Rehabilitation, Graduate School of Biomedical and Health Sciences, Hiroshima University), Ms. ayano ishida (1) Department of Sports Rehabilitation, Graduate School of Biomedical and Health Sciences, Hiroshima University), Prof. Yukio Urabe (1) Department of Sports Rehabilitation, Graduate School of Biomedical and Health Sciences, Hiroshima University)
Abstract
Introduction: Blind football is a para-sport played by athletes with severe visual impairments, and ranked second highest of the five levels for concussion risk rate in para-sports competition.1 In Tokyo 2020 Paralympic Games, there were game time and goal size changes at the blind football competition. It is possible that this may have also changed the head impact characteristics in Tokyo 2020, but this has not been examined.
Objectives:
To compare the head impact characteristics during blind football competition between Rio 2016 and Tokyo 2020 Paralympic Games using the official videos.
Study design: Cross-sectional study
Methods:
All 36 official game videos from the national blind football teams participating in the Rio 2016 and Tokyo 2020 summer Paralympic Games were obtained from the International Paralympic Committee’s official website channel YouTube (https://www.youtube.com/c/paralympics). The duration of the match was 50 minutes for Rio 2016 and 40 minutes for Tokyo 2020. Eight teams participated in each Paralympic Game, which consisted of 12 preliminary games and six ranking and final games. The videos were analyzed to assess the number of scores, number of head impacts, and their details (round, playing phase, scoring situation, impact situation, occurrence area, impact object, site of head impact, fall, and foul).
Results:
The total number of goals scored at the Rio 2016 and Tokyo 2020 were 23 and 45, respectively. The number of head impacts was 1,105 and 931 for Rio 2016 and Tokyo 2020, respectively. Significant differences were observed in head impact characteristics between the Rio 2016 and Tokyo 2020 among seven outcomes (round, scoring situation, impact situation, occurrence area, impact object, site of head impact, and fall).
17
Conclusions: Compared with the Rio 2016 Paralympic Games, the Tokyo 2020 Paralympic Games showed an increase in the number of points scored and different head impact characteristics.
Keywords: blind football, head impact, Paralympics, video analysis
References
1. Kissick J, Webborn N. Concussion in Para Sport. Phys Med Rehabil Clin N Am. 2018;29(2):299-311.
Effect of limited dorsiflexion range of motion on the outcome of the clinical balance test in individuals with chronic ankle instability
Poster presentation
Dr. Shojiro Nozu (Juntendo University), Dr. Tadamitsu Matsuda (Juntendo University), Dr. Yuji Takazawa (Juntendo University)
Abstract
People with chronic ankle instability (CAI) demonstrate limited dorsiflexion range of motion (DFROM), leading to altered postural control. Moreover, CAI exhibits diminished posteromedial (PM) reach distance of the Star Excursion Balance Test (PM-SEBT), compared to healthy people. However, whether DFROM limitation affects PM-SEBT is unknown.
Purpose: This study aimed to examine whether DFROM was a covariance between PM-SEBT outcomes in individuals with and without CAI. We hypothesized that DFROM affects PM reach distance.
Study design: A cross-sectional study including 20 uninjured people and 15 patients with CAI was conducted. Participants performed the weight-bearing lunge test (WBLT) and PM-SEBT. We measured the DFROM during WBLT, maximum reach distance (MRD), and lower-limb sagittal joint angles with electromyographic signals from the tibialis anterior (TA) and soleus during the PM-SEBT. All biomechanical parameters at the maximum reach point were included in the statistical analysis. We used an independent t-test to compare all variables between the control and CAI groups. Analysis of covariance (ANCOVA) was used to compare MRD between the groups while adjusting for DFROM. Significance was set at p<0.05.
Results: The CAI group exhibited shorter MRD (p=0.005), limited DFROM (p=0.01), less knee flexion (p=0.04), and lower TA muscle activity (p=0.008), compared to the control group. ANCOVA demonstrated that DFROM, knee flexion, and TA muscle activity were not covariates for the comparison of MRD between the control and CAI groups (p=0.24, 0.09, 0.98, respectively).
Conclusion: This study suggested that limited DFROM did not affect PM reach distance. Clinicians should consider altered postu- ral control in people with CAI, compared to healthy people, while conducting the PM-SEBT to assess their dynamic balance ability. Future studies should employ multivariate analysis to clarify how people with CAI control their movements during the PM-SEBT.
Keywords: Chronic ankle instability Dorsiflexion range of motion Dynamic balance test
References:
1. Thompson, C., Schabrun, S., Romero, R., et al. Factors Contributing to Chronic Ankle Instability: A Systematic Review and Meta-Analysis of Systematic Reviews. Sports Med, 2018;48(1):189-205.
2. Hertel J, Corbett RO. (2019). An Updated Model of Chronic Ankle Instability. J Athl Train. 2018;54(6):572-588.
3. Nozu S, Johnson KA, Takemura M, et al. Disrupted somatosensory input alters postural control strategies during the Star Excursion Balance Test (SEBT) in healthy people. Gait Posture. 2021;90:141-147.
Effect of maturation on overuse knee injury prevalence: A cross-sectional study of youth football players in Japan
Oral presentation
Mr. Hinata Okuno (Graduate School of Health Sciences, Hokkaido University), Mr. Takahiro Namiki (Rehabilitation Center, NTT Medical Center Sapporo), Dr. Yuta Koshino (Faculty of Health Sciences, Hokkaido University), Dr. Tomoya Ishida (Faculty of Health Sciences, Hokkaido University), Prof. Harukazu Tohyama (Faculty of Health Sciences, Hokkaido University), Dr. Mina Samukawa (Faculty of Health Sciences, Hokkaido University)
Abstract
Introduction: Youth football players are at higher risk of knee problems due to growth. The Oslo Sports Trauma Research Center Overuse Injury Questionnaire (OSTRC-O2) has been utilized to record overuse injuries. However, there are no reports investigating overuse knee problems in Japanese youth football players with the questionnaire and/or the influence of maturation status implied with peak height velocity (PHV) on the prevalence of overuse knee injuries.
18 19
Objective: To investigate the prevalence of overuse knee problems in Japanese youth football players, and to ascertain the effects of maturation status on the prevalence of overuse knee problems.
Methods: One hundred youth male football players (age: 13.1 ± 0.6 years; height: 160.3 ± 8.1 cm; weight: 49.6 ± 8.1 kg) were enrolled. The players were divided into pre-PHV (34 players), circa-PHV (29 players), and post-PHV (7 players) groups based on their maturity offset. The prevalence of overuse knee injuries was recorded using the Oslo Sports Trauma Research Center Overuse Injury Questionnaire (OSTRC-O2) from December 2023 to February 2024 (for 9 weeks). The main outcomes were the prevalence of overuse and substantial overuse injuries. The Fisher exact test was performed to examine the effect of maturation on injury prevalence.
Results: The response rate to the OSTRC-O2 was 88.0%. The weekly prevalence of overuse knee injuries was 11.8 ± 1.8%. The weekly prevalence of substantial overuse knee problems was 4.2 ± 1.6%. A total of 25 overuse injuries were reported. The Fisher’s exact test did not find a significant association between the maturation and the incidence of overuse injuries (p = 0.858).
Conclusion: The prevalence of overuse knee problems found no differences by maturation status in this study. Overuse knee problems should be monitored for longer periods to clarify the effects of maturity status on the overuse knee injuries.
Keywords: adolescent, football, overuse injuries, sports injuries
References
1. Clarsen B, Bahr R, Myklebust G, et al. Improved reporting of overuse injuries and health problems in sport: an update of the Oslo Sport Trauma Research Center questionnaires. Br J Sports Med. 2020;54:390-396.
2. Mirwald RL, Baxter-Jones AD, Bailey DA, et al. An assessment of maturity from anthropometric measure- ments. Med. Sci. Sports. Exerc. 2002;34:689-694.
Effect of one month ankle flossing on single-leg drop landings in recreational athletes: a pilot randomized controlled trial
Poster presentation
Mr. Yuto Watanabe (Physical Therapy for Sports and Musculoskeletal System, Kitasato University Graduate School of Medical Sciences), Mr. Masashi Kawabata (Physical Therapy for Sports and Musculoskeletal System, Kitasato University Graduate School of Medical Sciences), Mr. Hiroyuki Watanabe (Physical Therapy for Sports and Musculoskeletal System, Kitasato University Graduate School of Medical Sciences), Mr. Yusuke Tsuihiji (Physical Therapy for Sports and Musculoskeletal System, Kitasato University Graduate School of Medical Sciences), Ms. Koharu Mogi (Physical Therapy for Sports and Musculoskeletal System, Kitasato University Graduate School of Medical Sciences), Mr. Ryuta Hiraoka (Physical Therapy for Sports and Musculoskeletal System, Kitasato University Graduate School of Medical Sciences), Mr. Yuto Uchida (Physical Therapy for Sports and Musculoskeletal System, Kitasato University Graduate School of Medical Sciences), Mr. Tomoaki Inada (Department of Rehabilitation, School of Allied Health Sciences, Kitasato University), Dr. Naonobu Takahira (Physical Therapy for Sports and Musculoskeletal System, Kitasato University Graduate School of Medical Sciences)
Abstract
Introduction: Lateral ankle sprains (LAS) are the most common type of sports injury, and the single-leg drop land- ing (SDL) is used to assess the risk of injury. Individuals at higher risk for LAS display elevated maximum vertical ground reaction force (GRF), reduced mediolateral GRF displacement upon landing, and elevated horizontal GRF displacement in late landing phase. Improving these factors may improve injury prevention.1,2 Ankle flossing improves ankle function and sports performance; however, evidence regarding its effect on SDL or LAS prevention is currently insufficient.
Objectives: We examined the effects of one-month ankle flossing on SDL in recreational athletes.
Study design: Pilot randomized controlled trial.
Methods: Twenty-one healthy recreational athletes who met baseline eligibility criteria were randomly allocated into a flossing group (FLOSS), which performed active exercises (ankle plantar dorsiflexion exercises and plyomet- ric jumps) with a floss band wrapped around the ankle, and a control group (CON), which performed the same exercises without the floss band. Both groups performed the assigned interventions before every sports activity for approximately one month. Assessment measures were GRF index (maximum force, root mean square, horizontal force, and time to stabilization) during SDL, which was measured before and after the intervention. Mixed-model two-way analysis of variance was conducted for each item, using group and time as factors.
Results: An interaction between groups and times was observed for maximum vertical force during landing (p=0.02), with a 5.2%BW decrease (p=0.48) and a 21.3%BW increase (p<0.01) in FLOSS and CON groups, respectively. The horizontal force from 0.4 to 2.4 s after landing decreased by 0.29%BW in the FLOSS group (p=0.02) and increased by 0.02% BW in the CON group (p=0.84).
20
Conclusions: One month of ankle flossing prevented a vertical GRF increase and improved horizontal stability during SDL
Keywords: injury prevention, lateral ankle sprain, single-leg drop landing, tissue flossing
References:
1. Fransz DP, Huurnink A, Kingma I, et al. Performance on a single-legged drop-jump landing test is related to increased risk of lateral ankle sprains among male elite soccer players: a 3-year prospective cohort study. Am J Sports Med. 2018;46(14):3454-3462.
2. McKeon PO, Hertel J. Systematic review of postural control and lateral ankle instability, part I: can deficits be detected with instrumented testing. J Athl Train. 2008;43(3):293-304.
Effect of shoulder external rotation exercise with real-time visual feedback using ultrasonography in college baseball players: a randomized controlled trial.
Oral presentation
Mr. Takamasa Suzuki (Department of Rehabilitation, Kitasato University School of Allied Health Sciences), Mr. Masashi Kawabata (Department of Rehabilitation, Kitasato University School of Allied Health Sciences), Ms. Ayaha Matsuda (Department of Rehabilitation, Kitasato University School of Allied Health Sciences), Mr. Youta Saito (Department of Rehabilitation, Kitasato University School of Allied Health Sciences), Mr. Yudai Nagano (Department of Rehabilitation, Kitasato University School of Allied Health Sciences), Mr. Yuto Sano (Physical Therapy for Sports and Musculoskeletal System, Kitasato University Graduate School of Medical Sciences), Mr. Yusuke Tsuihiji (Physical Therapy for Sports and Musculoskeletal System, Kitasato University Graduate School of Medical Sciences), Mr. Hiroyuki Watanabe (Department of Rehabilitation, Kitasato University School of Allied Health Sciences), Dr. Naonobu Takahira (Department of Rehabilitation, Kitasato University School of Allied Health Sciences)
Abstract Introduction: The effectiveness of shoulder external rotation exercises (ER-Ex) in preventing shoulder and elbow disorders in baseball players is widely recognized.1 However, it is unclear whether educational exercises with real-time visual feedback (FB) using ultrasonography have an additive effect on facilitating rotator cuff contraction.
Objectives: This study aimed to examine the additive effect of shoulder ER-Ex with real-time visual feedback using ultrasonography.
Study Design: Randomized controlled trial.
Methods: Twenty-six players (mean age 20.5 years) were block-randomized into the ER-Ex with FB using ultrasonog- raphy group (FB-G) and ER-Ex only as the control group (C-G). The FB-G performed ER-Ex with ultrasonography FB during exercise, while the C-G performed ER-Ex without FB. Both groups performed three sets of 10 repetitions of ER-Ex in a prone position with the shoulder abducted to 90 degrees and the elbow flexed to 90 degrees. Both groups independently performed the ER-Ex for one month before their regular baseball practices.The primary outcome measure was the Kerlan-Jobe Orthopaedic Clinic (KJOC) Shoulder & Elbow Score, including total and subitem scores. Secondary outcomes included pitching performance (ball speed and elbow valgus torque) and physical function (shoulder rotation muscle strength and range of motion). These were evaluated for one month before and after the intervention.
Results:No significant changes were found in the KJOC total score, pitching performance, or physical function. However, a significant improvement was observed in KJOC subitem 1, related to warm-up time (p=0.02), with the score increasing from 78.8 to 87.2 points for the FB-G (p=0.01).
Conclusions: One month of self-exercise following the educational intervention combining ER-Ex with real-time visual FB showed no additional effects on the KJOC total score or pitching performance. However, ER-Ex with real- time visual FB could potentially contribute to reducing warm-up time.
Keywords: Baseball, Injury prevention, real-time visual feedback, Shoulder external rotation exercise, Ultrasonography
References:
1. Shitara H, et al. Shoulder stretching versus shoulder muscle strength training for the prevention of baseball-related arm injuries: a randomized, active-controlled, open-label, non-inferiority study. Sci Rep. 2022. 21;12(1):22118. doi: 10.1038/s41598-022-26682-1.
21
Effectiveness of high-load compared with low-load strengthening exercise on self-reported function in patients with hypermobile shoulders: One-year follow-up from a randomised controlled trial.
Oral presentation
Dr. BEHNAM LIAGHAT (Department of Sports Science and Clinical Biomechanics, University of Southern Denmark, Odense), Dr. Birgit Juul-Kristensen (Department of Sports Science and Clinical Biomechanics, University of Southern Denmark, Odense), Mr. Daniel A Faber (Department of Sports Science and Clinical Biomechanics, University of Southern Denmark, Odense), Mr. Emil O Christensen (Department of Sports Science and Clinical Biomechanics, University of Southern Denmark, Odense), Prof. Karen Søgaard (Department of Sports Science and Clinical Biomechanics, University of Southern Denmark, Odense. Department of Clinical Research, University of Southern Denmark, Odense,), Prof. Søren T Skou (Department of Sports Science and Clinical Biomechanics, University of Southern Denmark, Odense. Department of Physiotherapy and Occupational Therapy, NæstvedSlagelse-Ringsted Hospitals, Slagelse), Prof. Jens Søndergaard (Research Unit for General Practice, Department of Public Health, University of Southern Denmark, Odense), Prof. Carsten Juhl (Department of Sports Science and Clinical Biomechanics, University of Southern Denmark, Odense. Department of Physiotherapy and Occupational Therapy, Copenhagen University Hospital, Herlev and Gentofte)
Abstract
Introduction: Shoulder symptoms are common in patients with hypermobility spectrum disorders (HSD), but evidence for treatment is sparse.
Objectives: To investigate the long-term effectiveness of high-load versus low-load strengthening exercise on self-reported function in patients with HSD and shoulder symptoms.
Study design: A secondary analysis of a superiority, parallel-group, randomised trial (balanced block randomisation 1:1, electronic concealment).
Methods: A secondary analysis of a superiority, parallel-group, randomised trial (balanced block randomisation 1:1, electronic concealment) including adult patients (n=100) from primary care with HSD and shoulder pain and/or instability ≥3 months. Patients received 16 weeks of shoulder exercises (three sessions/week): HEAVY (n=50, full-range, high-load, supervised twice/week) or LIGHT (n=50, neutral/mid-range, low-load, supervised three times in total). The 1-year between-group difference in change in self-reported function was measured using the Western Ontario Shoulder Instability Index (WOSI, scale 0–2100, 0=best). Secondary outcomes were self-reported measures including changes in shoulder-related symptoms, function, emotions and lifestyle, quality of life, patient-perceived effect, treatment utility and adverse events. A blinded analyst conducted the analyses using linear mixed model repeated measurements analysis.
Results: One-year data were available in 86 out of 100 participants (79% women, mean age 37.8 years) (LIGHT 84%, HEAVY 88%). The mean WOSI score between-group difference favoured HEAVY (−92.9, 95% CI −257.4 to 71.5, p=0.268) but was not statistically significant. The secondary outcomes were mostly inconclusive, but patients in HEAVY had larger improvement in the WOSI-emotions subdomain (−36.3; 95% CI −65.4 to −7.3, p=0.014). Patient-perceived effect favoured HEAVY anchored in WOSI-emotions (55% vs 31%, p=0.027) and WOSI-lifestyle (50% vs 29%, p=0.042).
Conclusions: High-load shoulder strengthening exercise was not superior to low-load strengthening exercise in improving self- reported function at 1 year. High-load strengthening exercise may be more effective in improving patient emotions about shoulder pain and function, but more robust data are needed to support these findings.
Keywords: Joint hypermobility, shoulder, high-load strength training, randomised controlled trial
Effects of Modified Get Set Injury Prevention Program for South Korean National Archery Team: A Prospective Intervention Study Over Two Seasons
Oral presentation
Prof. Jintaek Kim (Daejeon university), Prof. Kim Suhn-yeop (Daejeon university)
Abstract
Background: Olympic archery has a high injury rate among non-contact sports in Olympic Summer Games and tends to be chronic due to overuse. IOC with collaboration with OSTRC developed Get Set, an injury prevention program for Olympic athletes, and anyone engaged in physical activity. The purpose of this study is to find out whether the modified Get Set injury prevention program has a positive effect on the injury rate for Korean national archery team.
Design: Prospective intervention study.
Participants: Archers from Korean national team: control season (2018-2019), 16 archers; intervention season (2019–2020), 16 archers. Final 12 archers, excluded elimination of the national selectionS
Interventions: Modified Get Set injury prevention program, archery part. Program added 5 exercises on the Get Set shoulder part. 15 minutes before training, 5 days a week, twice a day, for a total of 20 weeks.
22 23
Main Outcome Measurements: The number of injuries, injured area, diagnosis and cause of injury during the two seasons.
Results: There were total of 77 injuries during the control season, 62 injuries during the intervention season. The injury rate decreased by 19.48%. The injury rate at the injured area decreased in the order of cervical (69.23%), thoracic (42.11%) and shoulder (32.00%). The diagnosis of muscle and tendon decreased by 27.66% and 33.33% respectively. However, injuries related to the lumbar intervertebral disc increased by 50.00%. The cause of injury from overuse decreased by 18.46%.
Conclusions:This study shows that it is possible to prevent cervical, thoracic and shoulder injuries with modified Get Set injury prevention program for archers. There is an additional need to supplement the prevention program related to lumbar.
Keywords: Get Set, injury prevention program, injury rate, archery
References
1. Myklebust G, Engebretsen L, Braekken IH, et al. Prevention of anterior cruciate ligament injuries in female team handball players: a prospective intervention study over three seasons. Clin J Sport Med. 2003;13(2):71-8.
2. Andersson SH, Bahr R, Clarsen B, et al. Preventing overuse shoulder injuries among throwing athletes: a clusterrandomised controlled trial in 660 elite handball players. Br J Sports Med. 2017;51(14):1073-1080.
Effects of talocrural joint mobilization on joint position sense and center of gravity in patients with chronic ankle instability
Poster presentation
Mr. Hirokazu Murayama (Tokyo Metropolitan University), Mr. Ryota Yoshida (Tokyo Metropolitan University), Prof. Nami Shida (Tokyo Metropolitan University)
Abstract
Introduction: Chronic ankle instability (CAI), which develops in approximately 40% of patients with internal ankle sprains, results in recurrent sprains due to a loss of joint position and proprioceptive sensations. However, few studies have examined the effects of talocrural joint mobilization on joint position sense.
Objectives: This study aimed to clarify the effects of talocrural mobilization on joint position sense and center of gravity sway in patients with CAI.
Study Design: This study was an intervention study. Measurements and interventions were performed by different examiners.
Methods: The CAI cases (20–30 years old) included 60 adult male and female patients. The criteria for inclusion included: (1) Cumberland Ankle Instability Tool Japanese version: 25 points or less1;(2) at least one ankle sprain; and (3) a history of the ankle joint giving-way. Participants were divided into the following groups: (1) Maitland Grade II talocrural joint mobilization group; (2) Maitland Grade III talocrural joint mobilization group2; and (3) sham group. Random assignment was performed. All interventions were carried out by a single Orthopaedic Manual Physical Therapists.
Measurement items:(1) Positional sensory testing during ankle joint supination; (2) center of gravity sway testing in an open-eyed, one-leg standing position; and (3) ankle joint dorsiflexion angle using the distance of the great toe wall as an index.3
Results: The absolute error at 15° ankle joint supination improved from 4.9±2.8° to 3.5+2.2° in the Grade II group and from 4.5±1.6° to 3.4±1.8° in the Grade III group (Grade II, III: p<0.05). The ankle dorsiflexion angle improved from 12.4±2.5cm to 12.9±2.4cm in the Grade II group and from 13.2±2.6cm to 13.6±2.7cm in the Grade III group (Grade II: p<0.001, Grade III: p<0.01).
Conclusions: Talocrural joint mobilization effectively improved joint position sense at 15° ankle joint supination and ankle dorsiflexion angle but did not significantly impact center of gravity sway.
Keywords: CAI, Joint mobilization, Joint position sense, Postural sway
References
1. Kunugi, Shun, Akihiko Masunari, Byungjoo Noh, et al. Cross-Cultural Adaptation, Reliability, and Validity of the Japanese Version of the Cumberland Ankle Instability Tool. Disability and Rehabilitation, 2016;39(1):50–58.
2.. Hoch MC., McKeon PO. Joint Mobilization Improves Spatiotemporal Postural Control and Range of Motion in Those with Chronic Ankle Instability. Journal of Orthopaedic Research. 2010;9(3):326–332.
3. Konor, Megan, Sam Morton, Joan Eckerson, et al.: RELIABILITY of THREE MEASURES of ANKLE DORSIFLEXION. The International Journal of Sports Physical Therapy. 2012;7(3).
24
Effects On Plantar Support After Deep Dry Needling In Posterior Tibial Muscle: A Baropodometric Doble-Blind Randomized Controlled Trial.
Oral presentation.
Dr. SONIA DEL RIO MEDINA (Nursing and Physical Therapy Department, Health Sciences Faculty, CEU-Cardenal Herrera University, CEU Universities, Elche, Spain), Dr. SERGIO MONTERO NAVARRO (Nursing and Physical Therapy Department, Health Sciences Faculty, CEU-Cardenal Herrera University, CEU Universities, Elche, Spain), Dr. FRANCISCO JAVIER MOLINA PAYÁ (Nursing and Physical Therapy Department, Health Sciences Faculty, CEU-Cardenal Herrera University, CEU Universities, Elche, Spain), Dr. CRISTINA ORTS RUIZ (Nursing and Physical Therapy Department, Health Sciences Faculty, CEU-Cardenal Herrera University, CEU Universities, Elche, Spain), Dr. CRISTINA SALAR ANDREU (Nursing and Physical Therapy Department, Health Sciences Faculty, CEU-Cardenal Herrera University, CEU Universities, Elche, Spain), Dr. JOSÉ MARTÍN BOTELLA RICO (Nursing and Physical Therapy Department, Health Sciences Faculty, CEU-Cardenal Herrera University, CEU Universities, Elche, Spain), Dr. JAUME MORERA BALAGUER (Nursing and Physical Therapy Department, Health Sciences Faculty, CEU-Cardenal Herrera University, CEU Universities, Elche, Spain), Dr. JESÚS MANUEL SÁNCHEZ MAS (Biomedical Sciences Department, Health Sciences Faculty, CEU-Cardenal Herrera University, CEU Universities, Elche, Spain), Dr. MARÍA ISABEL ROCHA ORTIZ (Nursing and Physical Therapy Department, Health Sciences Faculty, CEU-Cardenal Herrera University, CEU Universities, Elche, Spain), Ms. MARÍA DEL CARMEN MARTÍNEZ GONZÁLEZ (Nursing and Physical Therapy Department, Health Sciences Faculty, CEU-Cardenal Herrera University, CEU Universities, Elche, Spain)
Abstract
Introduction. The tibialis posterior muscle (TPM) is a major element in dynamic and passive stabilization on the medial side of the ankle and hindfoot. The presence of myofascial trigger points (MTrPs) in TPM compromises its stabilizing function in the gait.
Objectives. To analyze the immediate and short-term effect of the application of the deep dry needling (DDN) technique in the MTrP of TPM on plantar support and gait.
Methods. A double-blind randomized controlled clinical trial was performed following CONSORT guidelines. Eighty- two participants with latent MTrP in TPM were randomly assigned to receive a single session of DDN on the MTrP of TPM (n=48, intervention group) or sham DDN (n=34, control group). The plantar pressure distribution was assessed by dynamic baropodometry before intervention, and immediately, 24 and 72 hours after the intervention. The vari- ables analyzed were the maximum and mean pressure in different areas of the plantar footprint, and the support surface and average pressure of the footprint, forefoot and hindfoot. The statistical analysis was performed using SPSS Statistics version 29.0.
Results. In the intervention group, immediately after the puncture in TPM, a significant increase in the pressure of the hindfoot (p=0.021) was observed, as well as in the mean pressure in the back, medial and anterior part of the foot (p<0.01), and a decrease in the maximum pressure in these areas (p<0.05), compared to the data obtained before the intervention. This change was observed at 24 hours post-intervention, but not at 72 hours. These pressure differences were not observed for the control group that received sham DDN.
Conclusions. For the first time, the current study demonstrated that posterior tibial trigger point treatment using DDN is capable of inducing changes in plantar pressures. Further studies evaluating DDN as a therapeutic strategy for tibialis posterior dysfunction are needed.
Keywords: tibialis posterior muscle, myofascial trigger point, deep dry needling, baropodometry
References
1. Ribbans WJ, Garde A. Tibialis posterior tendon and deltoid and spring ligament injuries in the elite athlete. Foot Ankle Clin. 2013;18(2):255-291. doi: 10.1016/j.fcl.2013.02.006.PMID: 23707177
2. Thummar RC, Rajaseker S, Anumasa R.J. Association between trigger points in hamstring, posterior leg, foot muscles and plantar fasciopathy: A cross- sectional study. Bodyw Mov Ther. 2020;24(4):373-378. doi: 10.1016/j.jbmt.2020.07.018.
25
Efficacy of Radial Pressure Wave Therapy in athletes with Achilles Tendinopathy: A
randomized trial
Poster presentation
Mr. Ishin Togashi (Juntendo University), Dr. Masashi Nagao (Juntendo University), Dr. Hirohumi Nishio (Juntendo University), Dr Komatsu Takayuki (Juntendo University), Dr. Yuki Shiota (Juntendo University), Dr. Yuji Takazawa (Juntendo University)
Abstract
Introduction: Radial pressure wave (RPW) is widely used in clinical practice for tendinopathy and is investigated to have a synergistic effect with exercise therapy.1 However, there are no studies that have examined and compared the additive effect of RPW and exercise therapy although they are not used alone in clinical practice.
Objectives: To compare the effects of RPW with exercise therapy versus exercise therapy alone in athletes with Achilles tendinopathy.
Study design: Open-label randomized controlled trial.
Methods: 18 athletes with Achilles tendinopathy were randomly assigned to the intervention group (n = 9) or the control group (n = 9). The intervention group received a total of four sessions of RPW once a week for 4 weeks. Both groups received instruction from the physiotherapist and performed the exercise therapy daily. Score on the Japanese version of the Victorian Institute of Sports Assessment Scale-Achilles questionnaire (VISA-A-J) were collected at baseline, 4, 16 and 24 weeks after the start of the intervention. Repeated measures analysis was used to assess the difference in an improvement in VISA-A-J variables between the groups over time.
Results: VISA-A-J scores improved significantly in both groups over the study period, but there were no differences in treatment efficacy between groups over time (p = 0.675). The mean baseline VISA-A-J scores (95% confidence interval, CI) were 63.4 (54.0 - 72.9) for the intervention group and 59.2 (49.8 - 68.7) for the control group. The VISA-A-J scores of the intervention and control groups improved over time to 76.0 (61.3 - 90.7) and 61.2 (46.5 - 75.9), respectively after four RPW sessions and to 86.8 (75.5 - 98.1) and 79.6 (68.3 - 90.9), respectively, at 24 weeks.
Conclusions: The addition of RPW was as effective as exercise therapy alone for athletes with Achilles tendinopathy.
Keywords: Radial pressure wave (RPW), Achilles tendinopathy, Exercise therapy
References
1. Liao CD, Tsauo JY, Chen HC, et al. Efficacy of Extracorporeal Shock Wave Therapy for Lower-Limb Tendinopathy: A Meta-analysis of Randomized Controlled Trials. Am J Phys Med Rehabil. 2018;97(9):605-619. doi:10.1097/phm.0000000000000925
ELECTROMYOGRAPHY ANALYSIS OF SCAPULAR MUSCLES DURING SCAPULAR STABILIZER STRENGTHENING EXERCISES: IMPACT OF VOLUNTARY ABDOMINAL CONTRACTION
Poster presentation
Mrs. Kübra Çaylan Gürses (Hacettepe University), Mr. Özgün Uysal (Hacettepe University, Physical Therapy and Rehabilitation Faculty), Prof.Orem DÜZGÜN (Hacettepe University)
Abstract
Introduction: Anterior pelvic tilt increases during scapular retraction exercises performed in the prone position. Changes in scapular muscle activation are unknown when the lumbar spine is stabilized by abdominal contraction. Objectives: The aim of the study was to investigate scapulothoracic muscle activations during scapular stabilizer retraction exercise (SRE) while maintaining lumbopelvic stability through voluntary abdominal contraction (VAC) in the prone position
Study design: Single-group repeated-measures.
Methods: Twenty healthy, physically active individuals (mean age [SD] = 23.3 [2.27], body mass index = 22.17 [1.6]) were included. Participants performed a standard scapular SRE in the prone position with four variations (arm beside the trunk, 45°, 90°, and 120° abduction) in random order. Exercises were performed both with and without VAC. A pressure biofeedback unit was utilized to measure VAC. Surface electromyographic (EMG) activity of the upper trapezius (UT), lower trapezius (LT), and serratus anterior (SA) muscles was collected during the concentric, eccentric, and isometric phases. A one-way repeated measures ANOVA was employed to compare the activity levels (%MVIC) of the UT, LT, and SA muscles.
Results: Scapular muscle activation levels were low to moderate (< 44% MVIC with VAC UT isometric phase dur- ing arm in 120°abduction). There was no significant difference between with and without VAC conditions in the three contraction phases. (all ps>0.05). UT (concentric phase) activity was higher during arm in 120°abduction SRE with/without VAC when compared to arm beside the trunk SRE with/without VAC (p< 0.001), in 45° abduction SRE with/without VAC (p=0.001)/(p=0.002) and in 90° abduction SRE with VAC (p=0.006). (Accordingly; 32.12 [14.2]/32.14 [11.31];13.72 [11.31]/11.14 [11.34]; 15.12 [8.98]/16.69 [12.09]; 21.47 [11.43])
26 27
Conclusions: No changes were observed in UT, AT, and SA muscle activation when VAC was performed in conjunction with SRE. UT concentric activation increased as the degree of arm abduction increased in both conditions.
Keywords: Abdominal contraction, Electromyography, Lumbar stabilization, Shoulder joint.
Evaluating the Effectiveness of the Modified Arm Care Screen in Overhead Athletes: A Glimpse into Injury Prevention
Poster presentation
Dr. Eleftherios Paraskevopoulos (University of West Attica), Mr. Fottis Marios Kottaridis (University of Peloponnese), Dr. Maria Moutzouri (University of West Attica), Dr. George Koumantakis (University of West Attica), Mr. Dimitrios Antonakis-Karamintzas (National and Kapodistrian University of Athens), Dr. Charilaos Tsolakis (National and Kapodistrian University of Athens), Dr. Panagiotis Koulouvaris (National and Kapodistrian University of Athens), Dr. Anna Christakou (University of Peloponnese), Dr. Maria Papandreou (University of West Attica), Mrs. Despoina Ignatoglou (University of Thessaly, 3o km Lamias- Athens, 35100)
Abstract
Introduction: To reduce the risk of injuries and boost performance in overhead athletes, coaches introduce arm care programs that emphasize on strength, stability, and range of motion (Frisch et al 2017; Paraskevopoulos et al. 2023). However, these programs lack precision, making it difficult to pinpoint specific factors that increase the risk of injury in these athletes. To tackle this problem, a screening tool called the Arm Care Screen (ACS) was created, using principles from the Functional Movement Screen (FMS) (Matsel et al. 2022). Its purpose is to identify musculoskeletal risk factors for shoulder injuries in baseball players and other overhead athletes.
Objectives: This study aimed to evaluate how effective the modified ACS is at identifying prevalent risk factors in overhead athletes participating in various sports.
Study design: Original study; Cross sectional
Methods: The study involved 62 overhead athletes with an average age of 24.5 years. These athletes underwent a comprehensive ACS evaluation, which included assessments of reciprocal shoulder mobility, total body rotation, lower body diagonal reach, and rotary stability. Two physical therapists independently measured ten musculoskele- tal risk factors.
Results: The modified ACS showed moderate to strong associations (Phi values ranging from 0.273 to 0.905) with these risk factors. Sensitivity was between 0.81 and 0.88, indicating a high true positive rate, while specificity ranged from 0.43 to 0.94, indicating a moderate to strong positive rate. Positive and negative likelihood ratios varied from 1.48 to 15.92 and 0.12 to 0.38, respectively. The positive predictive value ranged from 0.58 to 0.92, and the negative predictive value ranged from 0.73 to 0.93. The accuracy of the modified ACS ranged from 0.62 to 0.91.
Conclusions: The modified ACS displayed promising diagnostic accuracy. Its inclusion of core stability assessment further enhances its potential as a valuable tool for injury prevention and athletic performance enhancement.
Keywords: Overhead; Prevention; Shoulder; ACS
References
1. Frisch KE, Clark J, Hanson C, et al. High prevalence of nontraumatic shoulder pain in a regional sample of female high school volleyball athletes. Orthopaedic Journal of Sports Medicine. 2017;5(6). 2325967117712236.
2. Paraskevopoulos E, Pamboris GM,Papandreou, M. The Changing Landscape in Upper Limb Sports Rehabilitation and Injury Prevention. Sports. 2023;11(4):80.
3. Matsel KA, Hoch MC, Butler RJ, et al. A Field-expedient Arm Care Screening Tool Can Identify Musculoskeletal Risk Factors in Baseball Players. Sports Health. 2022. 19417381221125465.
Evidence for recommending delayed anterior cruciate ligament reconstruction: a scoping review.
Oral presentation
Mrs. Kamilla Arp (Department of Orthopedic Surgery, Lillebaelt Hospital - University Hospital of Southern Denmark, Denmark), Mr. Jacob Nedermark (Department of Orthopedic Surgery, Lillebaelt Hospital - University Hospital of Southern Denmark, Denmark), Mr.Kim Gordon Ingwersen (Department of Physio- and Occupational therapy, Lillebaelt Hospital - University Hospital of Southern Denmark, Denmark), Prof. Eva Ageberg (Department of Health Sciences, Faculty of Medicine, Lund University, Lund, Sweden), Dr. Claus Varnum (Department of Orthopedic Surgery, Lillebaelt Hospital - University Hospital of Southern Denmark, Denmark), Prof.Bjarke Viberg (Orthopaedic Surgery and Traumatology, Odense University Hospital, Denmark)
28 29
Abstract
Introduction: Treatment after anterior cruciate ligament (ACL) injury can initially be rehabilitation. Some patients need delayed ACL reconstruction (ACLR), but it is unclear what characterizes these patients.
Objective: The objective of this review is to describe predictors for ACLR in patients initially treated with rehabilitation. Study design: Scoping review
Methods: A comprehensive systematic literature search was performed in the Cochrane, Embase, Medline, SportsDiscus and Web of Science databases from inception to February 21, 2023. We included articles describing characteristics in adult ACLinjured patients undergoing ACLR after minimum 5 weeks rehabilitation.
Characteristics described in at least three articles were defined as a predictor for delayed ACLR and characteristics described in less than three articles were considered less certain and defined as potential predictors. Articles were screened using Covidence by two independent reviewers. The study followed PRISMA guidelines and was originally planned as a systematic review with meta-analysis but due to limited data, a scoping review was performed.
Results: 18,706 studies were identified and 168 full texts were screened of which 10 papers were included. Lower age and higher preinjury activity level were the only 2 predictors identified. Another 13 potential predictors were identi- fied in single studies. All potential predictors were through an iterative process categorized into 4 groups; patient demographics, knee function, patient-reported outcome measures and anatomical structures.
Conclusion: This review found few predictors for delayed ACLR, while there were several potential predictors. The evidence for recommending patients delayed ACL reconstruction seems scarce and more studies are needed to evaluate and identify predictors for patients regarding delayed ACLR.
Keywords: ACL, ACL reconstruction, rehabilitation, surgical predictors
Exploring Exercise Intolerance in mild TBI patients with Persistent Post-Concussion Symptoms: A Cross-Sectional Study.
Oral presentation
Mr. Lars-Johan Valaas (Center for Habilitation and Rehabilitation Models and Services (CHARM), Faculty of Medicine, Institute of Health and Society, University of Oslo, Oslo, Norway), Prof. Helene L. Soberg (Department of Rehabilitation Science and Health Technology, Faculty of Health Sciences, Oslo Metropolitan University, Oslo, Norway), Dr. Mari S. Rasmussen (Department of Physical Medicine and Rehabilitation, Oslo University Hospital, Oslo, Norway), Dr. Sophie E. Steenstrup (Department of Rehabilitation Science and Health Technology, Faculty of Health Sciences, Oslo Metropolitan University, Oslo, Norway), Dr. Ingerid Kleffelgård (Department of Physical Medicine and Rehabilitation, Oslo University Hospital, Oslo, Norway)
Abstract
Introduction: Persistent post-concussion symptoms (PPCS) are common after mild traumatic brain injury (mTBI). There is a need to explore contributing factors to exacerbation of symptoms during physical activity, exercise intol- erance, in adult population with PPCS to provide effective rehabilitation
Objective: Explore differences in demographic, injury-related, psychological, and physical functioning factors in patients with and without exercise intolerance tested on the Buffalo Concussion Treadmill Test (BCTT). Explore if these factors are associated with PPCS-burden in patients with exercise intolerance.
Study design: Cross-sectional study of the baseline population in a randomized controlled trial: ClinicalTrials.gov:NCT05086419
Methods: Study population: 103 patients (57% female, mean age 37 years, SD:11) with mTBI and self-reported exercise intolerance recruited from the TBI outpatient clinic, Oslo University Hospital.
Type of assessments: Exercise intolerance measured by BCTT (% of HRmax). Dependent variable: Rivermead Post- concussion Symptoms Questionnaire (RPQ). Independent variables: age, sex, days since injury, exercise intolerance, depression (PHQ-9), anxiety (GAD-7), fatigue (FSS), physical activity level (IPAQ).
Results: Among the 103 patients, 81 (79%) tested exercise intolerant on the BCTT. The exercise intolerant group was younger (35.8 years, sd:10.6 vs. 41.4, sd:10.2, p=.029), had more co-morbidities (proportion: 69% vs 50%, p=0.09) and had shorter time since injury (days: 212 sd:113 vs. 288 sd:123, p=.013). All test parameters for the BCTT were significantly poorer for the exercise intolerant group. Headache (59%) and dizziness (36%) were the most frequently reported symptoms during BCTT. A multiple regression analysis with backward selection showed that female sex (b=3.49), days-since-injury (b=0.015), GAD-7 (b=0.58) and PHQ-9 (b=1.04) were significantly associated (p<.05) with higher PPCS-burden on the RPQ (adjR2= .46, p<.001), whereas exercise intolerance was not.
Conclusions: Exercise intolerance was confirmed with BCTT for the majority of mTBI patients with self-reported exercise intolerance. Anxiety and depression was the strongest factors explaining PPCS-burden in patients with exercise intolerance after mTBI.
Keywords: #concussion #mTBI #exercise intolerance #post-concussion symptoms #treadmill #incremental_testing
30
References
1. Valaas LJV, Soberg HL, Rasmussen MS, et al. Sub-symptom threshold aerobic exercise for patients with persisting post-concussion symptoms and exercise intolerance after mild traumatic brain injury – a study protocol with a nested feasibility study for a randomized controlled trial. BMC Neurol. 2023;23:179. https://doi.org/10.1186/s12883- 023-03221-7
Exploring the relationship between training load and injury risk in Leinster Schoolboy Rugby: analysis of the SCRUm cohort study phase 2
Oral presentation
Dr. Sarah J. Murphy (School of Physiotherapy, Royal College of Surgeons in Ireland (RCSI) University of Medicine and Health Sciences), Prof. Helen French (School of Physiotherapy, Royal College of Surgeons in Ireland (RCSI) University of Medicine and Health Sciences), Mr. Brian Doyle (School of Physiotherapy, Royal College of Surgeons in Ireland (RCSI) University of Medicine and Health Sciences), Dr. Fiona Boland (School of Population Health, Royal College of Surgeons in Ireland, (RCSI) University of Medicine and Health Sciences), Ms. Louise Keating (School of Physiotherapy, Royal College of Surgeons in Ireland (RCSI) University of Medicine and Health Sciences)
Abstract
Introduction: Management of training load (TL) including contact load, are receiving increased attention in relation to injury risk, but few studies have explored TL in adolescent rugby players and its link to injury.1
Objectives:
• Monitor TL in senior schoolboy rugby players in Leinster, Ireland.
• Explore relationship between TL and injury risk.
Study design: Prospective cohort study
Methods: Leinster senior schoolboy rugby players competing in the 2022-23 season were recruited. Injury recording followed rugby injury surveillance consensus statements.2 Training load was calculated using duration (minutes) multi- plied by intensity (rate of perceived exertion) and reported as an arbitrary unit (AU) of load.1 Data were collected in Kitman Lab’s Athlete application.
Mean weekly TL categories included <500, 500 to <750, 750 to <1000, 1000 to <1250 and >1250 AUs. Adjusted logistic regression models, accounting for the correlation between players within schools, were used to explore potential relationships between player characteristics, training type, and TL and odds of an injury. Missing RPE data was imputed where possible, from team mean & median RPE or the previous session RPE.
Results: 273 participants (mean age 17±2 years, height 181±6 cm, weight 82±13 kg) from eight schools provided data over 24 weeks. 61 players reported an injury during the season. 5614 training sessions were recorded.
Adjusted logistic regression analysis revealed higher odds ratios (OR) for sustaining an injury, with mean weekly TL<500 AUs (OR:1.2, 95%CI:0.14-10.6) or higher than 750 to <1000 (OR:9.1, 95%CI:1.33-61.6), 1000 to <1250 (OR:18.2, 95%CI:1.1-294.3) and >1250 AUs (OR:63.4, 95%CI: 3.1-1288.1); in comparison to 500 to <750 AUs (reference value).
Conclusions: A quadratic relationship between TL and injury was evident, with lower risk of injury associated with mean weekly 500 to <750 AUs, compared to higher or lower TL.
This research was funded by the Irish Rugby Football Union Charitable Trust.
Keywords: injury risk, training load, rugby, youth athlete
References
1. Bourdon PC, Cardinale M, Murray A, et al. Monitoring athlete training loads: Consensus statement. International journal of sports physiology and performance. 2017;12(s2):161-170.
2. Fuller CW, Molloy MG, Bagate C, et al. Consensus statement on injury definitions and data collection procedures for studies of injuries in rugby union. Br J Sports Med [Internet]. 2007;41(5):328-331. Available from: https://www.ncbi.nlm.nih.gov/pubmed/17452684
31
Gender differences in the relationship between intrinsic foot muscle morphology, toe grip strength and postural control ability after jump landing in adolescent athletes.
Poster presentation
Mr. Satoshi Arima (1) Department of Sports Rehabilitation, Graduate School of Biomedical and Health Sciences, Hiroshima University), Dr. Noriaki Maeda (1) Department of Sports Rehabilitation, Graduate School of Biomedical and Health Sciences, Hiroshima University), Mr. Shogo Tsutsumi (1) Department of Sports Rehabilitation, Graduate School of Biomedical and Health Sciences, Hiroshima University), Ms. Honoka Ishihara (1) Department of Sports Rehabilitation, Graduate School of Biomedical and Health Sciences, Hiroshima University), Dr. Tsubasa Tashiro (1) Department of Sports Rehabilitation, Graduate School of Biomedical and Health Sciences, Hiroshima University), Prof. Yukio Urabe (1) Department of Sports Rehabilitation, Graduate School of Biomedical and Health Sciences, Hiroshima University)
Abstract
Introduction: Previous research has investigated the relationship between the morphology of intrinsic foot muscles and post-jump landing posture control ability in adolescent athletes (Arima et al., 2022). However, gender differences in this relationship are still not clearly understood.
Objectives: This study aimed to investigate the relationship between the intrinsic foot muscles morphology, toe grip strength, and post-jump landing posture control ability in adolescent athletes, considering gender differences.
Study design: This study is cross-sectional design.
Methods: A total of 171 adolescent athletes (104 males and 67 females) were included. The cross-sectional area (CSA) and thickness of the abductor hallucis, flexor hallucis brevis (FHB), and flexor digitorum brevis (FDB) were measured by an ultrasound system. Toe grip strength was assessed with a digital grip strength meter. The single-leg forward jump landing stability was evaluated using the Dynamic Postural Stability Index (DPSI), calculated from the com- bined medial-lateral, vertical, anterior-posterior stability index (APSI). Correlations between each variable were calculated for gender, and the relationships were examined using multiple regression analysis.
Results: In males, there was a significant correlation between the CSA and thickness of FHB, toe grip strength, and DPSI (p < 0.05). For females, significant correlations were observed between the CSA of FHB and DPSI, as well as the CSA of FDB and thickness with APSI (p < 0.05). Multiple regression analysis indicated that in males, the CSA of FHB and toe grip strength, while in females, the CSA of FHB and FDB were significantly associated with DPSI (p < 0.05).
Conclusions: The findings suggest that overall toe grip strength contributes to post-jump landing stability in males, while in females, the FDB, which is widely attached to the sole and contributes to foot stiffness, generates stability. Support for adolescent athletes needs to consider the gender differences between toe grasp and FDB function.
Keywords: adolescent athlete, intrinsic foot muscle, ultrasound system, dynamic postural stability index
Gender-specific Sociocultural Factors and Their Association with Lower Limb Kinematics During High and Low-impact Tasks.
Poster presentation
Ms. Vaishnavi Chiddarwar (Department of Rehabilitation Sciences, Texas Tech University Health Sciences Center), Dr. Katherine Wilford (Associate Professor Physical Therapy Program Murphy Deming College of Health Sciences Mary Baldwin University), Dr. Troy Hooper (Associate Dean for Research and Innovation School of Health Professions Texas Tech University Health Sciences Center), Dr. Roger James (Director, Center of Rehabilitation Research, Texas Tech University Health Sciences Center), Dr. Gesine H. Seeber (Carl von Ossietzky University Oldenburg University, Oldenburg, Germany), Dr. Toby Brooks (Assistant Dean for Faculty Success, Professor, and MAT Program Director, Texas Tech University Health Sciences Center), Dr. Phil Sizer (Associate Vice President for Research Innovation, Texas Tech Research Park, Professor, Texas Tech University Health Sciences Center)
Abstract
Introduction: Sex and gender are often used interchangeably in sports medicine research, despite their distinct meanings
1. Women experience a disproportionately higher risk of non-contact ACL injuries compared to men
2. Gender-specific sociocultural factors (GSSFs) may influence movement patterns and injury risk.
Objectives:
1. To examine the association between GSSFs and 3D hip and knee kinematics during high- and low-impact tasks (HITs and LITs).
2. To explore the correlation between 3D hip and knee kinematics during LITs and HITs.
32 33
Study Design: Cross-sectional correlational design
Methods:
Participants: 18 cis-gender, healthy, active women aged 18-30 years Assessments:
•. Three trials of HITs (drop vertical jump, single-leg drop vertical jump on dominant and non-dominant sides)
•. Three trials of LITs (stand-to-sit, single-leg stand-to-sit on dominant and non-dominant sides) Outcome measures:
•. 3D hip and knee kinematics measured using motion capture
•. GSSFs assessed using Trait Self-Objectification Scale (TSOS) and Gender Role Socialization Scale (GRSS)
Statistical analysis: Spearman and Pearson correlations
Results:
TSOS correlations:
Moderate positive correlation with non-dominant frontal plane hip kinematics during single-leg stand-to-sit on the non-dominant side (ρ = 0.48, p = .043)
Moderate negative correlations with:
•. Dominant hip frontal plane kinematics during drop vertical jump (ρ = -0.52, p = .027*)
•. Non-dominant knee transverse plane kinematics during stand-to-sit transition (ρ = -0.52, p = .024*)
No significant correlations found with GRSS.
Strong positive correlations (r = 0.77-0.86, p < .05) between dominant-side hip/knee kinematics in frontal/transverse planes during bilateral and single-leg HITs and LITs.
Conclusions
•. LITs may be valuable tools for early ACL injury identification in female athletes.
• Higher self-objectification may be associated with altered hip and knee movement patterns, potentially influencing injury risk.
•. Further research is needed to explore the implications of these findings and the broader role of GSSFs in shaping movement patterns.
Keywords: ACL injury, Gender, Sociocultural factors.
References
1. Bruder AM, Culvenor AG, King MG, et al. Let’s talk about sex (and gender) after ACL injury: a systematic review and meta-analysis of self-reported activity and knee-related outcomes. Br J Sports Med. 2023;57(10):602-610.
2. Montalvo AM, Schneider DK, Yut L, et al. ”What’s my risk of sustaining an ACL injury while playing sports?” A systematic review with meta-analysis. Br J Sports Med. 2019;53:1003–12.
Hamstring muscle volume contribution to hamstring eccentric strength in collegiate football athletes.
Oral presentation
Prof. Joao Silva Neto (Faculdade de Ciências Médicas da Santa Casa de São Paulo), Dr. Mikel Joachim (Badger Athletic Performance Lab - University of Wisconsin), Dr. David Opar (SPRINT Research Center - Australian Catholic University), Dr. Silvia Blemker (Biomedical Engineering - University of Virginia), Mr. Brett Mortensen (Brigham Young University), Mr. Wayne Johnson (Brigham Young University), Ms. Emma Remington (Brigham Young University), Dr. Vera Alves (Faculdade de Ciências Médicas da Santa Casa de São Paulo), Dr. Bryan Heiderscheit (Badger Athletic Performance Lab - University of Wisconsin)
Abstract
Introduction: The Nordic hamstring exercise is known to increase hamstring muscle volume (MV),1,2 and greater MV is known to be associated with greater strength across a variety of muscles. However, the relative influence of individual hamstring MV on Nordic hamstring eccentric strength (NHES) in high-level athletes has not been described.
Objective: Investigate the association between individual hamstring MV and peak NHES in collegiate American football athletes.
Study design: Cross-sectional.
Methods: 125 uninjured high-level collegiate football athletes completed preseason NHES testing and magnetic resonance imaging to quantify MV, bilaterally. Each athlete completed 3 NHES trials, and maximum force values (N) were analyzed. MV (mL) was calculated for each hamstring muscle by automatic muscle segmentation.3 A linear mixed effect model assessed the relationship between each individual HMV and peak NHES, controlling for hamstring strain injuries within 12 months before testing and repeated observations across limbs.
Results: Biceps femoris long head (BFLH, p<0.001), semitendinosus (ST, p=0.001) and semimembranosus (SM, p=0.03) MV were significantly associated with peak NHES, while biceps femoris short head (BFSH) volume was not (p=0.24). A 10 ml increase in BFLH, ST, and SM MV was associated with 3.4N (95%CI: 1.6 – 5.2N), 3.1N (95%CI: 1.2 – 5.0N), and 1.9N (95%CI: 0.2 – 3.6N) increase in peak NHES, respectively. Average (± standard deviation) values for each metric were: peak NHE force: 445.4 ± 82.6N; BFLH: 319.6 ± 68.6mL; BFSH: 164.8 ± 34.9mL; ST: 370.2 ± 61.4mL and SM: 396.7 ± 70.4mL.
34
Conclusion: A change in BFLH volume was associated with the greatest change in peak NHES, followed by ST and SM. Therefore, targeting the BFLH, ST, and SM in hypertrophy training may potentially enhance NHES. These findings provide insights into optimizing training strategies to improve hamstring eccentric strength in athletes.
Keywords: Athletes; Hamstring muscles; Muscle mass; Nordic hamstring eccentric exercise; Muscle strength.
References
1. Seymore KD, Domire ZJ, DeVita P, et al. The effect of Nordic hamstring strength training on muscle architecture, stiffness, and strength. Eur J Appl Physiol. 2017;117(5):943-953.
2. Cuthbert M, Ripley N, McMahon JJ, et al. The Effect of Nordic Hamstring Exercise Interven- tion Volume on Eccentric Strength and Muscle Architecture Adaptations: A Systematic Review and Meta-analyses. Sports Medicine. 2020;19:83-99.
3. Ni R, Meyer CH, Blemker SS, et al. Automatic segmentation of all lower limb muscles from high- resolution magnetic resonance imaging using a cascaded three-dimensional deep convolutional neural network. Journal of Medical Imaging. 2019;28:1.
Hip Crepitus is Highly Prevalent and Associated with Psychological Features and Pain in Football Players with Hip/Groin Pain.
Oral presentation
Ms. Fernanda Serighelli (La Trobe University), Prof. Kay Crossley (La Trobe University), Dr. Joanne Kemp (La Trobe University), Dr. Joshua Heerey (La Trobe University), Dr. Mark Scholes (La Trobe University), Dr. Matthew King (La Trobe University), Dr. Danilo de Oliveira Silva (La Trobe University)
Abstract Introduction: Mechanical hip symptoms (crepitus) are poorly understood in athletes with hip/groin pain.1 In the knee joint, crepitus relates to negative emotions and beliefs.2 However, the psychological implications of hip crepi- tus are unknown.
Objectives: To explore (i) the prevalence and severity of hip crepitus in football players with and without hip/groin pain; and (ii) association between hip crepitus severity and psychological features and pain in football players with hip/groin pain.
Study design: Cross-sectional.
Methods: We recruited football players with and without hip/groin pain (≥2 weekly football sessions)3. The preva- lence and severity of crepitus were assessed using a single item of the HAGOS, and the iHOT-33, respectively. Psy- chological features were assessed using Tampa Scale of Kinesiophobia, Arthritis Self-Efficacy Scale and Pain Catas- trophizing Scale. Pain severity was assessed by a Numeric Pain Rating Scale (0-10) describing average pain playing football and average pain in the last week. Log-binomial and linear regressions were used to explore the prevalence and the association of hip crepitus severity with pain/psychological features.
Results: 184 hip/groin pain participants and 60 controls were included. Football players with hip/groin pain had a higher crepitus prevalence (prevalence ratio=5.0 [2.5 to 10.2]) and severity (mean difference [95%CI]=7.5 [0.89 to 15.9]) than controls. Hip crepitus severity was associated with kinesiophobia (r2=0.07), pain catastrophising (r2=0.16), self-efficacy (pain subscale: r2=0.07; other subscale: r2=0.09), average pain playing football (r2=0.10) and average pain in the last week (r2=0.10). Significant interaction effects between hip crepitus and sex were observed for pain catastrophising (p=0.022) and average pain playing football (p=0.030). Women had a higher association between hip crepitus and pain catastrophising, and average pain than men.
Conclusions: Football players with hip/groin pain had greater prevalence and severity of hip crepitus than controls. In footballers with hip/groin pain, hip crepitus is associated with psychological features and pain.
Keywords: Hip; Hip-related pain; Patient-reported outcome measure; Rehabilitation.
References
1. Reiman MP, Agricola R, Kemp JL, et al. Consensus recommendations on the classification, definition and diagnostic criteria of hip-related pain in young and middle-aged active adults from the International Hip-related Pain Research Network, Zurich 2018. Br J Sports Med. 2020;54(11):631-641.
2. de Oliveira Silva D, Pazzinatto MF, Priore LBD, et al. Knee crepitus is prevalent in women with patellofemoral pain, but is not related with function, physical activity and pain. Phys Ther Sport. 2018;33:7-11.
3. Crossley KM, Pandy MG, Majumdar S, et al. Femoroacetabular impingement and hip OsteoaRthritis Cohort (FORCe): protocol for a prospective study. J Physiother. 2018;64(1):55.
35
Immediate effects of lower leg tissue flossing on ankle muscle strength and dorsiflexion range of motion in healthy individuals: A randomized cross-over controlled trial
Poster presentation
Mr. Yuto Sano (Physical Therapy for Sports and Musculoskeletal System, Kitasato University Graduate School of Medical Sciences), Mr. Masashi Kawabata (Physical Therapy for Sports and Musculoskeletal System, Kitasato University Graduate School of Medical Sciences), Mr. Yuto Uchida (Physical Therapy for Sports and Musculoskeletal System, Kitasato University Graduate School of Medical Sciences), Mr. Yuto Watanabe (Physical Therapy for Sports and Musculoskeletal System, Kitasato University Graduate School of Medical Sciences), Mr. Yusuke Tsuihiji (Physical Therapy for Sports and Musculoskeletal System, Kitasato University Graduate School of Medical Sciences), Mr. Hiroyuki Watanabe (Physical Therapy for Sports and Musculoskeletal System, Kitasato University Graduate School of Medical Sciences), Dr. Naonobu Takahira (Physical Therapy for Sports and Musculoskeletal System, Kitasato University Graduate School of Medical Sciences)
Abstract
Introduction: The lower leg tissue flossing technique involves wrapping a rubber band around a muscle group for a few minutes while performing joint motion, enhancing ankle muscle strength output and dorsiflexion (DF) joint range of motion (ROM).1,2 However, there is currently no consensus regarding the effectiveness of this technique due to insufficient evidence-based research and inconsistencies in band pressure.3
Objectives: To clarify the immediate effects of lower leg tissue flossing using several compression bands focused on enhancing ankle muscle strength and DF-ROM.
Study Design: Randomized cross-over controlled trial.
Methods: Nineteen healthy adult males underwent the intervention: two bands (low and high pressure) and under- wrap (control) were wrapped for 2 min on the non-dominant lower leg, with 5–10 day intervals. A pressure monitor sensor inserted into the center of the posterior lower leg monitored wrapping compression force. The intervention exercise comprised six ankle joint plantar flexion (PF) and DF voluntary isometric contractions at three angles (PF 20°, neutral 0°, and DF 10°) for 3 seconds using a dynamometer. The maximum isometric muscle strength in DF and PF and ankle DF-ROM were evaluated pre- and post-intervention.
Results: The ankle PF muscle strength showed a significant interaction at 10° DF (p<0.01) but none at 0° and 20° PF. The low- and high-pressure bands significantly enhanced the ankle PF muscle strength by 4.3 (p=0.02) and 4.9 Nm (p<0.05), respectively, compared to the control. The ankle DF-ROM showed significant interaction (p<0.01), and the low- and highpressure bands significantly enhanced the ankle DF-ROM by 1.7° (p<0.01) and 1.3° (p=0.02), respectively, compared to the control. The low- and high-pressure band groups had comparable muscle strength and DF-ROM.
Conclusions: The two-minute lower-leg tissue flossing intervention significantly enhanced ankle PF strength and DF-ROM. Keywords: Ankle dorsiflexion range of motion, Ankle muscle strength, Injury prevention, Tissue flossing
References:
1.. Kaneda H, Takahira N, Tsuda K, et al. The effects of tissue tissue flossing and static stretching on gastrocnemius exertion and flexibility. Isokinet Exerc Sci. 2020;28:205-213.
2. Konrad A, Močnik R, Nakamura M. Effects of Tissue Flossing on the Healthy and Impaired Musculoskeletal System: A Scoping Review. Front Physiol. 2021;12:666129.
3. Galis J, Cooper DJ. Application of a Floss Band at Differing Pressure Levels: Effects at the Ankle Joint. J Strength Cond Res. 2022;36(9):2454-2460.
Improvements in Forward Bending are Related to Improvements in Pain and Activity
Limitation during Cognitive Functional Therapy for people with Chronic Low Back Pain.
Oral presentation
Ms. Ruth Chang (Curtin University), Dr. Amity Campbell (Curtin University), Dr. Peter Kent (Curtin University), Prof. Peter O’Sullivan (Curtin University), Prof. Mark Hancock (Macquarie University), Prof. Lesa Hoffman (University of Iowa), Prof. Anne Smith (Curtin University).
Abstract
Introduction: Treatments for low back pain (LBP) often focus on restoring movement to reduce pain and disability. Longitudinal studies examining the relationships between changes in the way a person with LBP moves and changes in their pain/disability are required to clarify associations.
Objectives:
To investigate whether improvements in spinal movement during forward bending are related to improvements in pain/disability in people with LBP undergoing Cognitive Functional Therapy (CFT).
36 37
Study design: Longitudinal Observational Study.
Methods: Participants with chronic, disabling non-specific LBP allocated to CFT or CFT with biofeedback in the RESTORE trial1(n=261) performed forward bending at each treatment session over a 13-week treatment period (average of 4.3 timepoints/participant (range 1-8)). Spinal kinematics were recorded using inertial measurement units. Par- ticipants reported i) average pain intensity (0-10 scale) (Pain), and ii) pain-related activity limitation (Disability), (Roland Morris Disability Questionnaire (RMDQ)) via online questionnaires at 0,3,6 and 13 weeks. Multivariate mul- tilevel models were used to evaluate associations between individual rates of change over time between three spinal movement measures (trunk velocity, trunk range of movement (ROM) or intersensor ROM) and Pain/Disability.
Results: Strong correlations were observed between increased trunk velocity and reduced Pain (-0.81, 95%CI -0.98, -0.05), and reduced Disability (-0.77, 95%CI -0.95, -0.22). Moderate correlations were observed between increased trunk ROM and reduced Pain (-0.37, 95%CI -0.67, 0.04), and reduced Disability (-0.32, 95%CI -0.6, 0.03). It was not possible to establish temporal precedence as changes occurred concomitantly.
Conclusions: Targeting forward bending may lead to reductions in chronic low back pain and disability. Alternatively, reduc- ing pain or disability via other treatment targets may improve forward bending. It is likely that Pain/Disability and movement outcomes may improve together due to reciprocity of effects which reinforces the importance of a person-centred focus for clinicians.
Keywords: Bending, Disability, Low Back Pain
References
Kent P, Haines T, O’Sullivan P, et al. Cognitive functional therapy with or without movement sensor biofeedback versus usual care for chronic, disabling low back pain (RESTORE): a randomised, controlled, three-arm, parallel group, phase 3, clinical trial. Lancet. 2023; doi:10.1016/S0140-6736(23)00441-5
Injury incidence in Leinster Schoolboy Rugby players in 2022-23 season; the SCRUm cohort study phase 2.
Oral presentation
Dr. Sarah J. Murphy (School of Physiotherapy, Royal College of Surgeons in Ireland (RCSI) University of Medicine and Health Sciences), Prof. Helen French (School of Physiotherapy, Royal College of Surgeons in Ireland (RCSI) University of Medicine and Health Sciences), Mr. Brian Doyle (School of Physiotherapy, Royal College of Surgeons in Ireland (RCSI) University of Medicine and Health Sciences), Dr. Fiona Boland (School of Population Health, Royal College of Surgeons in Ireland, (RCSI) University of Medicine and Health Sciences), Ms. Louise Keating (School of Physiotherapy, Royal College of Surgeons in Ireland (RCSI) University of Medicine and Health Sciences)
Abstract
Introduction: Injury surveillance studies in adolescent rugby show varied injury incidence and injury risk factors, supporting further exploration in this cohort.1 Focus on the tackle as the mechanism of injury has grown, with an introduction of lower tackle height in community games.2
Objectives: Describe injury incidence, site, mechanism, and severity in senior schoolboy rugby players in Leinster, Ireland.
Study design: Prospective cohort study
Methods: Leinster senior schoolboy rugby players competing in the 2022-23 season were recruited. Injury recording included site, mechanism and severity following rugby injury surveillance consensus statements (3). Match frequency and training duration were recorded to calculate exposure.3 Data were collected in Kitman Lab’s Athlete application. Results: 297 participants (median age 17 years (IQR:16-17), mean height 181±6 cm, median weight 80.2kg (IQR:73.1-90.1)) in nine schools provided data over 24 weeks.
73 injuries (51 match, 22 training) were reported. Match injury incidence (per 1000 player hours) was 25.8 (95% confidence interval (CI):19.2-33.9), and training injury incidence was 1.2 (95% CI:0.5-1.1). Match injury severity was a median time-loss of 27 days (95% CI:22.4-33), and a median of 18 days (95% CI:12-33) for training injuries. Most common reported match injury sites included head (n=15, 29%) and shoulder (n=11, 22%), and training injury sites were shoulder (n=6, 27%) and ankle (n=5, 23%). The tackle was the most common mechanism of injury (tackling n=19, 26%; tackled n=17, 23%).
Conclusions: Match injury incidence was lower in Leinster schoolboys than a recent meta-analysis (39.76; 95% CI:10.1869.33), but similar to a previous season (2019-2020) in Leinster (SCRUm phase 1). Most common regions injured were similar across both phases and to other youth rugby studies (1). Similar to other studies, the tackle is the most common mechanism of injury (1).
This research was funded by the Irish Rugby Football Union Charitable Trust.
38
Keywords: rugby, youth athletes, injury, epidemiology,
References
1. West SW, Shill IJ, Bailey S, et al. Injury Rates, Mechanisms, Risk Factors and Prevention Strategies in Youth Rugby Union: What’s All the Ruck-Us About? A Systematic Review and Meta-analysis. Sports Med. 2023;53(7):1375-1393.
2. World Rugby. World Rugby confirms lower tackle height law trials for community rugby | World Rugby [Internet]. 2023. [cited 2023 Aug 1]. Available from: https://www.world.rugby/news/808734/world-rugby-confirms-lower- tackle-heightlaw-trials-for-community-rugby
3. Fuller CW, Molloy MG, Bagate C, et al. Consensus statement on injury definitions and data collection procedures for studies of injuries in rugby union. Br J Sports Med [Internet]. 2007;41(5):328-331. Available from: https://www.ncbi.nlm.nih.gov/pubmed/17452684
Injury Occurrence and Profiles Across Four Para Sport Modalities: A One-Year Prospective Study
Oral presentation
Dr. Renan Resende (Universidade Federal de Minas Gerais), Ms. Fernanda Madaleno (Universidade Federal de Minas Gerais), Dr. Andressa Silva (Universidade Federal de Minas Gerais), Dr. Larissa Pinheiro (Universidade Federal de Minas Gerais), Dr. Thiago Lourenço (Comitê Paralímpico Brasileiro), Dr. Evi Wezenbeek (Ghent University), Prof. Erik Witvrouw (Ghent University), Dr. Evert Verhagen (Vrije Universiteit Amsterdam), Prof. Marco Tulio Mello (Universidade Federal de Minas Gerais), Dr. Juliana Ocarino (Universidade Federal de Minas Gerais)
Abstract
Introduction: Better understanding of unique injury profiles and occurrence across para sport modalities can aid the development of tailored monitoring and prevention strategies.1
Objectives: To compare the prevalence of injuries between para athletes from athletics, swimming, powerlifting, and taekwondo throughout a season.
Study design: Prospective longitudinal comparison study.
Methods: Data collection occurred from January to December of 2022 at two Paralympic Reference Centers in Brazil, including para athletes from athletics (N=41), swimming (N=37), powerlifting (N=14), and taekwondo (N=10). Injuries were recorded for 50 weeks, on a weekly basis, via the Oslo Sports Trauma Research Center Questionnaire. Weekly injury prevalence was determined by the ratio of injured athletes to respondents per week.2 One-way ANOVAs compared gradual onset and sudden onset injuries prevalence among the four modalities with a = 0.05.
Results: The mean weekly prevalence of injuries was 51.2% (95%CI 47.8-54.5) for athletics, 31.0% (95%CI 26.3- 835.7) for swimming, 49.0% (95%CI 38.4-59.6) for powerlifting, and 65.6% (95%CI 53.6-77.5) for taekwondo. The following body regions were the most affected by injuries in each modality: athletics - ankle (25.4%) and knee (21.1%); swimming – shoulder (47.2%); powerlifting – wrist (42.7%) and shoulder (29.9%); and taekwondo – ankle (40.7%), knee (28.0%) and foot/toes (20.0%). Swimming had the lowest prevalence of gradual onset injuries while taekwondo had the highest prevalence between the four modalities (F=14.94; η²=0.186;p<0.001). There were no differences between modalities regarding the prevalence of sudden onset injuries (F=1.27; η²=0.019;p=0.286).
Conclusions: The lower prevalence of gradual onset injuries in swimming may be explained by its low impact nature, whereas taekwondo’s higher prevalence may be attributed to its combat sport nature. Practitioners working with para athletes should be aware of the body regions most affected by injuries in each modality reported in this study, especially in taekwondo.
Keywords: Injury, Para athletics, Para swimming, Para powerlifting, Para taekwondo
References
1. Pinheiro LSP, Ocarino JM, Madaleno FO, et al. Prevalence and incidence of injuries in para athletes: A systematic review with meta-analysis and GRADE recommendations. Br J Sports Med. 2021;55(23):1357-1365.
2. Pinheiro LSP, Silva A, Madaleno FO, et al. Prevalence and incidence of health problems and their characteristics in Brazilian para athletes: A one-season single-center prospective pilot study. Disability and Health Journal. 2024;17:101511.
39
Interaction between gender and injured limb on H/Q isokinetic ratio of both sides in patients with ACL rupture
Poster presentation
Dr. Rose Fouladi (University of Mazandaran, Babolsar, Iran), Ms. Marziyeh Bakhshi Kiyadehi (Shafagh institute, Tonekabon, Iran)
Abstract
Introduction: Anterior cruciate ligament (ACL) rupture is one of the most common sport injuries, particularly in women. Objectives: The aim of this study was investigating the interaction between gender and injured limb on the isokinetic ratio of H/Q on both healthy and affected sides in patients with ACL rupture.
Study design: This original study was semi-experimental, retrospective, and single blind.
Methods: In this study, eighteen athletes (7 women and 11 men) in the ages of 20 to 35 years participated voluntarily. All the participants had the experience of ACL partial tearing more than 6 months, which were symptom-free at the time of our study and they return to full activity by the help of conservative treatment. After warming up, they performed an isokinetic test for knee flexion and extension at a constant speed of 60o per second. Each movement was performed 10 times with three repetitions and the average ratio of hamstrings to quadriceps (H/Q) calculated by the device software was transferred to spss23 software and it was investigated through the statistical test of two-way analysis of variance (α=0.05).
Results: In the results of the present study, the H/Q ratio was significantly higher in the affected leg of women and there was a significant difference between the healthy and affected sides in women (P=0.044). However, comparing the healthy and affected legs in men and also the comparison of the healthy leg of men and women and the affected leg of men and women were not significantly different (P>0.05).
Conclusion: Perhaps this can be attributed to the feeling of greater instability in the affected knee of women after ACL injury and their greater dependence on ACL. So, women show greater hamstring/quadriceps activity in their affected side to support their injured knee, and also compensate dynamic instability due to ACL deficiency.
Keywords; gender, knee isokinetic, ACL rupture, H/Q ratio
References
1. Hunnicutt JL, Xerogeanes JW, Tsai LC, et al. Terminal knee extension deficit and female sex predict poorer quadriceps strength following ACL reconstruction using all-soft tissue quadriceps tendon autografts. Knee Surg Sports Traumatol Arthrosc. 2021;29(9):3085-3095.
2. Maguire K, Sugimoto D, Micheli LJ, et al. Recovery After ACL Reconstruction in Male Ver- sus Female Adolescents: A Matched, Sex-Based Cohort Analysis of 543 Patients. Orthop J Sports Med. 2021;9(11):23259671211054804.
3. Högberg J, Piussi R, Wernbom M, et al. No Association Between Hamstrings-to-Quadriceps Strength Ratio and Second ACL Injuries After Accounting for Prognostic Factors: A Cohort Study of 574 Patients After ACL-Reconstruction. Sports Medicine. 2024;10(1):7.
Intra-Rater Reliability and Error of Measurement of Knee Isokinetic Eccentric Muscle Performance Assessment Procedures in Anterior Cruciate Ligament Injury Prevention
Screening for Adult Agility-Sport Athletes
Poster presentation
Dr. Luis Llurda-Almuzara (Physiotherapy Department, Faculty of Health Sciences, Universidad Euneiz, Vitoria-Gasteiz, Álava, Spain.), Ms. Courtney Lewis (School of Sport, Rehabilitation, and Exercise Sciences, University of Essex, Wivenhoe Park, Colchester CO4 3SQ, Essex, UK.), Dr. Nicholas C. Clark (School of Sport, Rehabilitation, and Exercise Sciences, University of Essex, Wivenhoe Park, Colchester CO4 3SQ, Essex, UK.)
Abstract
Introduction: Noncontact anterior cruciate ligament (ACL) injuries occur frequently during change-of-direction/landing tasks when eccentric muscle performance is required to decelerate momentum and shock-absorb forces away from noncontractile tissues. Therefore, assessment of knee eccentric muscle performance is prudent in noncontact ACL injury prevention screening, but reliable measurement procedures are scarce in the literature.
Objective: To assess critical psychometric properties of a new knee isokinetic eccentric muscle performance as- sessment procedure linked closely to noncontact ACL injury mechanisms and using a specific knee range-of-motion and velocity-ofmotion (specificity of testing.1,2 It was hypothesised that procedures would demonstrate good intra-rater reliability (intraclass correlation coefficient [ICC] ≥0.75).
Study design: Between-day (D1/D2) repeated measures.
40 41
Setting: biomechanics laboratory.
Study population: 12 agility-sport athletes volunteered (male n=7, female n=5, age 23.5±4.6yr; height 170.0±10.1cm; mass 75.7±12.3kg).
Assessment: athletes were seated on an isokinetic dynamometer set to eccentric mode. For specificity of test- ing, dynamometer configuration was knee flexion/extension range-of-motion 0-60° and velocity-of-motion 240°/sec- ond. Five maximal-effort knee flexion (eccentric quadriceps) and extension (eccentric hamstrings) trials were per- formed. Peak torque (PT; Newton-metres [Nm]) and time-to-peak torque (TTPT; milliseconds [ms]) were measured. Limb order was randomised for D1, the order repeated for D2.
Main outcome measurements: relative reliability (ICC 2,1), absolute reliability (standard error of measurement [SEM]).
Results: For eccentric quadriceps PT ICC/SEM: right 0.76/22.8Nm, left 0.78/19.0Nm. For eccentric quadriceps TTPT ICC/SEM: right 0.07/213.0ms, left 0.13/316.3ms. For eccentric hamstrings PT ICC/SEM: right 0.92/13.7Nm, left 0.96/8.0Nm. For eccentric hamstrings TTPT ICC/SEM: right 0.74/12.5ms, left 0.41/16.6ms.
Conclusion: For both eccentric quadriceps and hamstrings, PT consistently demonstrated good relative reliability (ICC>0.75) but TTPT did not (ICC<0.75). Interestingly, right and left eccentric hamstring TTPT absolute reliability (SEM) were <17.0ms. These new knee isokinetic eccentric PT assessment procedures possess critical psychometric properties that qualify them for use in ACL injury prevention screening systems with adult agility-sport athletes.
Keywords: Anterior cruciate ligament; eccentric muscle performance; isokinetic testing
References
1. Clark NC, Heebner NR, Lephart SM, et al. Specificity of isokinetic assessment in noncontact knee injury prevention screening: A novel assessment procedure with relationships between variables in amateur adult agility-sport athletes. Physical Therapy in Sport. 2022;Jan;53:105-114.
2. Clark NC. Noncontact Knee Ligament Injury Prevention Screening in Netball: A Clinical Commentary with Clinical Practice Suggestions for Community-Level Players. Int J Sports Phys Ther. 2021;1:16(3).
Intrinsic Graft Laxity Variation With Open Kinetic
Chain Exercise After Anterior Cruciate Ligament Reconstruction
Poster presentation
Mr. Florian FORELLI (Orthosport Rehab Center, Domont, France), Mr. Jean Mazeas (Orthosport Rehab Center, Domont, France), Mr. Yannis ZEGHHOUDI (Clinic of Domont), Mr. Ismail BOUZEKAROUI (Ministy of Education, Preschool and Sports, Rabat, Morocco), Mr. Georgios KAKAVAS (Department of Physical Education and Sport Science, University of Thessaly, ErgoMechLab, Greece), Dr. Timothy E Hewett (Department of Orthopaedic Surgery, Marshall University), Dr. Alexandre JM RAMBAUD (Department of Clinical and Exercise Physiology, Sports Medicine Unity, University Hospital of Saint Etienne, Faculty of medicine)
Abstract
Introduction: After anterior cruciate ligament reconstruction (ACLR), studies have demonstrated early use of OKC did not seem to affect the graft healing process and laxity.
Objective: The main objective was to determine whether quadriceps and hamstring strengthening in a rehabilita- tion program involving early open kinetic chain (OKC) and/or closed kinetic chain (CKC) knee joint exercises had an influence on graft laxity at 1, 3 and 6 after ACLR. The secondary objective was to assess whether the early use of OKC exercise affects intrinsic graft laxity between 1 and 6 months postoperatively.
Design: Non randomized, single blinded, prospective case control study
Methods: This study included 53 patients following a ACLR with hamstring graft. Participants were retrieved from 2 rehabilitation centers that followed different ACLR rehabilitation programs with regards the use of OKC exercises; the intervention group (n= 25) that performed OKC and CKC exercises in combination and the control group (n=28) that performed only CKC exercises. (1;2) Anterior knee laxity was measured using the GNRB device on the operated limb, and compared to the contralateral control limb. Three evaluations were performed at 1, 3 and 6 months after the ACLR. The difference between both limbs was calculated and used to determine the variation in anterior laxity throughout the first 6 months after surgery. (1;3)
Results: No differences were observed in knee laxity at 1 (p = 0.263), 3 (p = 0.263) and 6 months (p = 0.256) follow up between intervention group and control group. No differences were observed in within-group graft laxity between 1 and 6 months after ACLR in intervention group (p = 0.155) and control group (p = 0.690).
Conclusion: The initiation of OKC exercises doesn’t seem to increase the ACLR graft laxity as compared to the rehabilitation program with only CKC exercises.
Keywords: intrinsic graft laxity, open kinetic chain, anterior cruciate ligament, rehabilitation program
42
References
1. Forelli, F., Barbar, W., Kersante, G., et al. Evaluation of Muscle Strength and Graft Laxity With Early Open Kinetic Chain Exercise Af- ter ACL Reconstruction: A Cohort Study. Orthopaedic Journal of Sports Medicine. 2023;11(6): 23259671231177594. https://doi.org/10.1177/23259671231177594
2. Brinlee AW, Dickenson SB, Hunter-Giordano A, et al. ACL Reconstruction Rehabili- tation: Clinical Data, Biologic Healing, and Criterion-Based Milestones to Inform a Return-to-Sport Guideline. Sports Health: A Multidisciplinary Approach. 2021194173812110568. https://doi.org/10.1177/19417381211056873
3. Heinje A, Werner S. \Early versus late start of open kinetic chain quadriceps exercises after ACL reconstruction with patellar tendon or hamstring grafts: A prospective randomized outcome study. Knee Surgery, Sports Traumatology, Arthroscopy. 2007;15(4):402–414. https://doi.org/10.1007/s00167-006-0246-z
IS DECELERATION THE KEY ELEMENT IN VERTICAL JUMP PERFORMANCE TO RETURN TO
SPORT AFTER ANTERIOR CRUCIATE LIGAMENT RECONSTRUCTION?
Oral presentation
Mr. Florian FORELLI (Orthosport Rehab Center, Domont, France), Mr. Branis NEKHOUF (Clinic of Domont), Mr. Ismail BOUZEKAROUI (Ministy of Education, Preschool and Sports, Rabat, Morocco), Mr. Georgios KAKAVAS (Department of Physical Education and Sport Science, University of Thessaly, ErgoMechLab, Greece), Dr. Timothy E Hewett (Department of Orthopaedic Surgery, Marshall University), Dr. Alexandre JM RAMBAUD (Department of Clinical and Exercise Physiology, Sports Medicine Unity, University Hospital of Saint Etienne, Faculty of medicine)
Abstract
Introduction: After anterior cruciate ligament reconstruction (ACLR), jump tests allow to help return to sport decision making.
Objective: The main objective was to examine countermovement jump (CMJ) measures to identify which parame- ters can best distinguish between ACLR and control participants. The secondary objective was to determine whether performance alterations between operated and non-operated limb exist during vertical two-legged activities after ACLR
Design: Non randomized, single blinded, prospective case control study
Methods: This study included 67 patients with hamstring graft and no contact injury at 6 postoperative months (203.5 days ± 32.2) and 47 healthy athletes (25,2 ± 6,6 years old) with no knee injury history. Two groups were formed, an ACLR group (n=67) and a control group (n=47). The evaluation of CMJ by force plate was performed to calculate vertical ground reaction force (vGRF), maximal power (MP) and eccentric rate force development (RFDe) during landing and limb symmetry index (LSI). (1-3) First analysis compared LSI vGRF, LSI MP and LSI RFDe between both groups during CMJ. Secondary analysis compared vGRF, MP and RFDe between operated/non-operated limb in the ACLR group and dominant/non-dominant limb in the control group.
Results: At 6 months after ACLR, CMJ measures in the ACLR group were significantly reduced compared to the control group for LSI vGRF (- 8.7% ; p < 0,001), LSI MP (- 10.8% ; p < 0,001) and LSI RFDe (- 8.7% ; p < 0,001). Secondary analysis showed no significant result in control group between dominant/non-dominant limb. ACLR group showed significant results between operated / non-operated limb for vGRF ( +1.4 N.kg-1 ; p < 0,001), MP (+2.6 W.kg-1 ; p < 0,001) and RFDe (+ 375.3 N.s-1 ; p < 0,01).
Conclusion: Landing performance and deceleration should be better considered at time to return to sport after ACLR.
Keywords: Deceleration, Anterior Cruciate Ligament Reconstruction, Vertical Jump, performance, return to sport
References:
1. Nyland J, Klein S, Caborn DNM. Lower Extremity Compensatory Neuromuscular and Biomechanical Adaptations 2 to 11 Years After Anterior Cruciate Ligament Reconstruction. Arthroscopy. 2010;26(9):121-225.
2. O’Malley E, Richter C, King E, et al. Countermovement Jump and Isokinetic Dynamometry as Measures of Rehabilitation Status After Anterior Cruciate Ligament Reconstruction. Journal of Athletic Training 2018;53(7):68795.
3. Souissi S, Wong DP, Dellal A, et al. Improving Functional Performance and Muscle Power 4-to-6 Months After Anterior Cruciate Ligament Reconstruction. J Sports Sci Med. 2011;10(4):65564.
43
IS QUADRICEPS STRENGTH THE KEY FACTOR FOR RTR AFTER ACLR?
Poster presentation
Mr. Badr HARIRI (L’Ekipe Center Paris), Dr. Alexandre HARDY (Clinic of Sport Surgery, Ramsay Healthcare), Mr. Florian FORELLI (Orthosport Rehab Center, Domont, France)
Abstract
Background: Return to run (RTR) after anterior cruciate ligament reconstruction (ACLR) is an important step in the return to previous performance. Generally, postoperative time (12-weeks) help clinicians in RTR decision making but it seems important to recover strength, mobility, functional and psychological qualities to optimize the RTR.
Objectives: The aim of this study was to analyze the RTR self-perceived quality with physical, functional and psy- chological parameters at 6 months after ACLR.
Design: Cross-sectional study
Methods: This study included 130 patients at 6 months after ACLR. The patients performed the international knee documentation committee (IKDC) subjective knee form, the anterior cruciate ligament - return to sport after injury (ACL-RSI) scale, strength and functional assessment. Limb symmetry index (LSI) and peak torque to body weight ratio (PT/BW) were assessed with isokinetic dynamometer for quadriceps (Q) and hamstring (H) in concentric mode at 60°. s-1, 240°. s-1, and eccentric mode at 30°. s-1. Functional assessment was performed with MyJump app and included knee range of motion (ROM), hop tests (single, triple and triple cross over for distance) and single leg vertical drop jump. All participants were assigned in 2 groups : RTR with pain (G1, 33.6%) and pain-free RTR (G2).
Results: G2 showed significantly higher quadriceps PT/BW than G1 (1.8 ± 0.4 N.kg -1 vs. 2.3 ± 0.5, p = 0.05), but similar LSI Q (81.1% ± 14.8; 80.2% ± 15.1 ; p = 0.008). ACL-RSI (p = 0.22) and IKDC (p = 0.43) scores were lower in G1 compared to G2. No significant results were found for ROM and hop tests in both groups.
Conclusion: These findings indicate that quadriceps strength seems to be a key performance discriminator to allow for safe RTR. Besides, IKDC and ACL-RSI may help athletes and clinicians in RTR decision making.
Keywords: ACL reconstruction, Return to run, criteria
References:
1. Kotsifaki R, et al. Aspetar clinical practice guideline on rehabilitation after anterior cruciate ligament recon- struction. Br J Sports Med. 2023;57(9):500-514. Doi: 10.1136/bjsports-2022-106158
2. Pairot de Fontenay B, et al. Reintroduction of Running Afer Anterior Cruciate Ligament Reconstruction with a Hamstrings Graft: Can We Predict Short- Term Success? J Athl Train. 2022;57(6):540-546
Isokinetic Eccentric Quadriceps Muscle Performance Assessment in Patellofemoral Joint
Primary and Secondary Injury Prevention: An Intra-Rater Reliability and Standard Error of Measurement Pilot Study
Poster presentation
Dr. Luis Llurda-Almuzara (Physiotherapy Department, Faculty of Health Sciences, Universidad Euneiz, Vitoria-Gasteiz, Álava, Spain.), Ms. Courtney Lewis (School of Sport, Rehabilitation, and Exercise Sciences, University of Essex, Wivenhoe Park, Colchester CO4 3SQ, Essex, UK.), Dr. Matthew J. D. Taylor (School of Sport, Rehabilitation, and Exercise Sciences, University of Essex, Wivenhoe Park, Colchester, CO4 3SQ, Essex, UK.), Dr. Bradley S. Neal (School of Sport, Rehabilitation, and Exercise Sciences, University of Essex, Wivenhoe Park, Colchester, CO4 3SQ, Essex, UK.), Dr. Nicholas C. Clark (School of Sport, Rehabilitation, and Exercise Sciences, University of Essex, Wivenhoe Park, Colchester CO4 3SQ, Essex, UK.)
Abstract
Introduction: Quadriceps muscle weakness is implicated in the onset and persistence of patellofemoral joint (PFJ) pain, which commonly manifests during the early stance-phase of gait when eccentric quadriceps muscle performance (eccQMP) is required to decelerate momentum and shock-absorb forces away from articular tissues. Therefore, assessment of eccQMP is prudent in PFJ primary and secondary injury prevention, but reliable measurement procedures are scarce in the literature.
Objective: To assess critical psychometric properties of a new isokinetic eccQMP assessment procedure linked closely to the biomechanics of gait during stair and hill descent, using a specific knee range-of-motion and velocity-of-motion (specificity of testing1). It was hypothesised that procedures would demonstrate good intra-rater reliability (intraclass correlation coefficient [ICC] ≥0.75).
Study design: Between-day (D1/D2) repeated measures.
Setting: biomechanics laboratory.
44 45
Study population: eight athletes volunteered (male n=6, female n=2, age 23.0±3.6yr; height 157.0±35.8cm; mass 86.0±36.4kg).
Assessment: athletes were seated on an isokinetic dynamometer set to eccentric mode. For specificity of testing, dynamometer configuration was knee flexion/extension range-of-motion 10-80° and velocity-of-motion 60°/s then 120°/s. Three maximal-effort knee flexion (eccQMP) trials were performed for both velocities. Peak torque (PT; Newton-metres [Nm]) and time-to-peak torque (TTPT; milliseconds [ms]) were measured. Limb order was ran- domised for D1 then repeated D2.
Main outcome measurements: relative reliability (ICC 2,1) and absolute reliability (standard error of measurement (SEM)).
Results: For 60°/s: PT ICC/SEM, right 0.95/13.5Nm, left 0.98/10.2Nm; TTPT ICC/SEM, right 0.12/1121.0ms, left 0.12/666.3ms. For 120°/s: PT ICC/SEM, right 0.85/23.8Nm, left 0.96/15.1Nm; TTPT ICC/SEM, right 0.76/174.4ms, left 0.05/694.7ms.
Conclusion: For both 60°/s and 120°/s, eccentric PT consistently demonstrated good relative reliability (ICC>0.75) but TTPT did not (ICC<0.75). The SEM was consistently lowest when the highest ICCs were evident. The new isokinetic eccentric quadriceps PT assessment procedures demonstrate psychometric properties that qualify them for potential use in PFJ primary and secondary injury prevention.
Keywords: Patellofemoral joint; eccentric muscle performance; isokinetic testing
References
1. Clark NC, Heebner NR, Lephart SM, et al. Specificity of isokinetic assessment in noncontact knee injury prevention screening: A novel assessment procedure with relationships between variables in amateur adult agility-sport athletes. Physical Therapy in Sport. 2022;53:105-114.
Muscle activation alterations on single legged jumps after anterior cruciate ligament surgery
Oral presentation
Mr. Jean Mazeas (Orthosport Rehab Center, Domont, France), Mr. Florian FORELLI (Orthosport Rehab Center, Domont, France), Dr. Amaury Vandebrouck (Clinic of Domont), Dr. Pascal Duffet (Clinic of Domont), Dr. Louis Ratte (Clinic of Domont), Dr. Alexandre JM RAMBAUD (Department of Clinical and Exercise Physiology, Sports Medicine Unity, University Hospital of Saint Etienne, Faculty of medicine)
Abstract
Introduction: Motor control deficits persist after anterior cruciate ligament reconstruction (ACLR), and are more than often responsible for bad return to play ability and reinjuries.Current information still lacks on the potential deficits in specific lower limb muscle activation during sport’s specific tasks, or even basic tasks such as jumping Objective: The aim of this study was to measure muscular activity of the lower limb in patients performing single leg tasks during their rehabilitation process after ACLR.
Design: Non randomized, Prospective, Case control study
Methods: This study included 59 participants divided into two groups, a test group (n=31) which included patients after ACLR (5.6 ± 2.1 months) with a hamstring graft and a control group (n=28) including healthy subjects. Partici- pants were asked to perform four tries of both a Single Leg Counter Movement Jump (SLCMJ) and a Single Leg Drop Landing (SLDL), on each leg in a randomized order.1,2 The muscular activity of Vastus Medialis, Gluteus Medius, Soleus and of the Lateral et Medial Gastrocnemii was recorded. Raw EMG data was treated via Root Mean Square and maximum normalized value were used for the analysis and compared between groups.
Results: Significant results showed a lower Soleus activity (-26.1%, p-value = 0.01), as well as a higher Vastus Medialis (+17.2, p-value = 0.03) and lower Gluteus Medius (-7.50%, p-value = 0.01) in the test group for the SLCMJ. Similar results were found in the SLDL, adding a lower Medial Gastrocnemius activity (-41.0%, p < 0.01). Other muscle showed non-significant differences between both groups.
Conclusion: Neuromotor deficits are present after ACLR and can be linked to specific neuromuscular patterns, which may also help our current strength and function-based return to sport decision making, allowing athletes to return to their practice in better condition and decreased risks of injury.
Keywords: Electromyography, Anterior Cruciate Ligament Reconstruction, Motor pattern,Return to sport, Neuromuscular assessment.
References:
1. Gokeler A, Hof AL, Arnold MP, et al. Abnormal landing strategies after ACL reconstruction. Scand J Med Sci Sports. 2010;20(1):e12-9. doi: 10.1111/j.1600-0838.2008.00873.x. Epub 2009 Feb 2. PMID: 19210671
2. Kotsifaki A, Van Rossom S, Whiteley R, et al. Single leg vertical jump performance identifies knee function deficits at return to sport after ACL reconstruction in male athletes. Br J Sports Med. 2022;56(9):490-498.
doi: 10.1136/bjsports-2021-104692. Epub 2022 Feb 8. PMID: 35135826; PMCID: PMC9016240.
46
Patient characteristics associated with successful response to patient advice and combined treatments for patients with plantar fasciopathy
Oral presentation
Ms. Anna Lagergaard Larsen (Department of Health Science and Technology, Aalborg University, Aalborg, Denmark), Prof. Jens Lykkegaard Olesen (Center for General Practice at Aalborg University, Aalborg University, Aalborg, Denmark), Prof. Martin Bach Jensen (Center for General Practice at Aalborg University, Aalborg University, Aalborg, Denmark), Prof. Michael Skovdal Rathleff (Department of Health Science and Technology and Center for General Practice at Aalborg University, Aalborg University, Aalborg, Denmark), Prof. Bill Vicenzino (The University of Queensland School of Health and Rehabilitation Sciences: Physiotherapy: Sports Injury Rehabilitation and Prevention for Health, St. Lucia QLD 4072, Australia), Dr. Henrik Riel (Center for General Practice at Aalborg University, Aalborg University, Aalborg, Denmark)
Abstract
Introduction: A recent randomised controlled trial compared three combined treatments for plantar fasciopathy (PF) and found no clinically relevant between-group differences. Understanding which patient characteristics can predict response to treatment may help clinicians choose the most suitable treatment for their patients.
Objectives: This study aims to explore patient characteristics associated with a successful outcome of different combined treatments for patients with PF.
Study design: An ancillary analysis of a three-armed randomized controlled trial (the FIX-Heel Trial) comparing three combined treatment approaches to PF.
Methods: The association between patient characteristics collected at baseline and the outcome of one of the three treatment approaches: 1) advice plus insoles (PA), 2) PA and exercises (PAX), and 3) PAX and corticosteroid injection (PAXI) were explored. 180 patients with PF were included in the trial. The primary analysis is a logistic regression to analyse a possible association of sex, age, BMI, symptom duration, pain during the past week on a 0-100 mm VAS, number of PF episodes, and sedentary behaviour with a successful outcome of treatment after 12 weeks. A successful outcome is defined as a minimal clinically important change (14.1 points) in the Foot Health Status Questionnaire pain domain.
Results: Preliminary results from univariate complete-case analyses indicate that pain during the past week is negatively associated with a successful outcome with odds ratios of 0.95 (95%CI: 0.91;0.99], P=0.014) and 0.91 (95%CI: 0.86;0.97, P= 0.005) in PA and PAX, respectively. Symptom duration seems negatively associated with a successful outcome with an odds ratio of 0.9 (95%CI: 0.83;0.97 P= 0.006) in PAXI. Final results, including secondary analyses, will be presented at the conference.
Conclusion: Less pain during the past week in PA and PAX and shorter symptom duration in PAXI may be associated with a successful outcome of treatment after 12 weeks.
Keywords: combined treatment, logistic regression, plantar fasciopathy, predictors.
Pelvic Floor Muscle Training in Female Functional Fitness Exercisers –An Assessor-blinded Randomized Controlled Trial
Competition abstract
Dr. Kristina Lindquist Skaug (Norwegian school of sport sciences), Prof. Kari Bø (Norwegian school of sport sciences), Prof. Marie Ellström Engh (Akershus University Hospital)
Abstract
Introduction: Stress urinary incontinence (SUI) is common among females during functional fitness training, such as CrossFit©.1 Pelvic floor muscle training (PFMT) has been proven effective in treating SUI in the general female population, but there is limited knowledge of the effect of PFMT among female strenuous exercisers and athletes.2,3
Objective: The aim of the study was to assess the effect of PFMT on SUI in female functional fitness exercisers. Methods: This was an assessor-blinded randomized controlled trial with two arms: a PFMT group (n=22) and a control group (n=25). The PFMT group followed a 16-week home-training program including 3 sets of 8-12 maximum pelvic floor muscle (PFM) contractions daily and with weekly follow-up by phone. Primary outcome was change in the total score of the International Consultation on Incontinence Questionnaire Urinary Incontinence – Short Form (ICIQ-UI- SF). Secondary outcomes were perceived change of symptoms of SUI, change of PFM strength (measured by vaginal manometry), and symptoms of anal incontinence (AI) and pelvic organ prolapse (POP).
Results: Forty-seven women, mean age 33.5 (SD: 8.1), participated in the study. At 16 weeks, there was a mean difference between groups of -1.4 (95% CI: -2.6 to -0.2) in change of the ICIQ-UI-SF score in favor of the PFMT group. The PFMT group completed in mean 70% (SD: 23) of the prescribed protocol. Sixty-four percent in the PFMT group vs. 8% in the control group reported improved symptoms of SUI (p < 0.001, Relative Risk: 7.96, 95% CI 2.03 to 31.19). There were no group differences in change of PFM strength or AI/POP symptoms.
47 48
Conclusion: A 16-week home-training program of the PFM led to improvements of SUI among female functional fitness exercisers. However, PFM strength, AI and POP symptoms did not improve significantly in the PFMT group compared to the control group.
Keywords: Women’s health Female athlete Pelvic floor Incontinence Rehabilitation
References:
1. Dominguez-Antuna E, Diz JC, Suarez-Iglesias D, et al. Prevalence of urinary incontinence in female CrossFit athletes: a systematic review with meta-analysis. Int Urogynecol J. 2023;34(3):621-634.
2. Dumoulin C, Cacciari LP, Hay-Smith EJC. Pelvic floor muscle training versus no treatment, or inactive control treatments, for urinary incontinence in women. Cochrane Database Syst Rev. 2018;10:CD005654.
3. Fukuda FS, Arbieto ERM, Da Roza T, et al. Pelvic Floor Muscle Training In Women Practicing High-impact Sports: A Systematic Review. Int J Sports Med. 2023;44(6):397-405.
PERIODIC HEALTH EVALUATION IN PARA ATHLETES: A POSITION STATEMENT BASED ON EXPERT CONSENSUS
Oral presentation
Dr. Larissa Pinheiro (Universidade Federal de Minas Gerais), Dr. Evert Verhagen (Vrije Universiteit Amsterdam), Dr. Juliana Ocarino (Universidade Federal de Minas Gerais), Dr. Kristina Fagher (Lund University), Dr. Osman Ahmed (The Football Association, Burton-upon-Trent, United Kingdom), Dr. Kristine Dalton (University of Waterloo), Dr. David Mann (Vrije Universiteit Amsterdam), Dr. Richard Weiler (University College London), Dr. Carole Okoth (National Spinal Injury Referral Hospital, Ministry of Health Kenya), Dr. Cheri Blauwet (Harvard Medical School), Dr. Jan Lexell (Lund University), Dr. Hiske Kneepkens (Vrije Universiteit Amsterdam), Dr. Wayne Derman (Stellenbosch University), Dr. Nick Webborn (British Paralympic Association), Dr. Andressa Silva (Universidade Federal de Minas Gerais), Dr. Renan Resende (Universidade Federal de Minas Gerais)
Abstract
Introduction: Para athletes diverse impairments and their specialized equipment used in competitions require individualized approaches to comprehend their overall health1. They frequently encountering barriers when ac- cessing healthcare services.2 The Periodic Health Evaluation (PHE) is a valuable tool for continuously monitoring athletes’ health, screening for health conditions, and identifying barriers to athlete’s performance.3 Additionally, the PHE assists in the surveillance of health problems by establishing baseline information for each athlete and providing crucial information in case of emergencies.
Objective: To guide sports healthcare providers in the PHE for para athletes across key impairment categories: intellectual, musculoskeletal, neurological and vision.
Study design: position statement.
Methods: A panel of sixteen international experts, including epidemiologists, physiother- apists, optometrists, and physicians with expertise in para athlete health, convened via videoconferences to discuss the position statement’s purpose, methods, and themes. They formed working groups to address underlying med- ical condition, cardiorespiratory, neuromusculoskeletal, nutritional status, mental and sleep health, concussion, and female para athlete health assessment considerations.
Results: Health history review can provide insights into factors impacting para athlete health, inform physical assessments, and help healthcare providers understand each athlete’s needs. During the PHE, considerations should encompass the specific requirements of the sport modality and the impairment itself. These evaluations can help mitigate the common tendency of para athletes to underreport health issues. They also enable early interventions tailored to the athlete’s health history. Moreover, the PHE serves as an opportunity to educate para athletes on preventive strategies that can be integrated into their training routines, enhancing their performance and overall health.
Conclusion: This position statement can potentially enhance clinical practice and improve the healthcare quality for para athletes, ultimately contributing to their overall health and well-being.
Keywords: Health; Assessment; Paralympic; Sport
References
1. Van de Vliet P. Let’s Talk Facts - What Healthcare Providers Really Need to Know about Paralympic Athletes. ASPETAR Sport Med J. 2016;5:74-79. https://www.aspetar.com/Journal/upload/PDF/2016310103620.pdf
2. Fagher K, Forsberg A, Jacobsson J, et al.Paralympic athletes’ perceptions of their experiences of sports-related injuries, risk factors and preventive possibilities. Eur J Sport Sci. 2016;16:1240-1249. doi:10.1080/17461391.2016.1192689
3. Ljungqvist A, Jenoure P, Engebretsen L, et al. The International Olympic Committee (IOC) Consensus Statement on periodic health evaluation of elite athletes March 2009. Br J Sports Med. 2009;43:631-643. doi:10.1136/BJSM.2009.064394
49
Physiotherapist-led treatment for Femoroacetabular Impingement Syndrome (The PhysioFIRST study): A participant and assessor-blinded randomised controlled trial.
Competition abstract
Dr. Joanne Kemp (La Trobe University), Prof. Anne Smith (Curtin University), Dr. Mark Scholes (La Trobe University), Dr. Richard Johnston (La Trobe University), Ms. Sally Coburn (La Trobe University), Dr. Denise Jones (La Trobe University), Mr. Michael Girdwood (La Trobe University), Dr. Anthony Schache (La Trobe University), Dr. Benjamin Mentiplay (La Trobe University), Dr. Matthew King (La Trobe University), Dr. Danilo de Oliveira Silva (La Trobe University), Prof. Kay Crossley (La Trobe University)
Abstract
Introduction: There have been no full-scale randomised controlled trials (RCTs) comparing physiotherapist-led in- terventions for FAI syndrome.1
Objectives: Evaluate the effect of physiotherapist-led targeted-strengthening (STRENGTH) compared to physiotherapist-led standardised-stretching (STRETCH) on hip-related quality of life (QOL) and perceived improve- ment at six months in people with femoroacetabular impingement (FAI) syndrome.
Study design: Double-blind, parallel, superiority RCT(2).
Methods: Participants aged 18-50 years, pain ≥3/10 for ≥6 weeks, cam morphology (alpha angle ≥60°), positive flexion–adduction–internal rotation test were included. People were excluded for physiotherapy treatment or hip joint injection in the past three months, previous or planned hip, back lower limb surgery, radiographic hip os- teoarthritis.
Both groups received 6-months of one-on-one treatment with a physiotherapist. STRENGTH undertook a super- vised, targeted, individualised exercise therapy and education programme. STRETCH undertook a supervised stan- dardised stretching and education program. Primary outcomes were change in hip-related QOL (International Hip Outcome Tool-33 (iHOT-33, 0-100 points)); and patient-perceived global improvement (7-point Likert scale) at six months. Secondary outcomes were hip muscle strength, functional task performance, and kinesiophobia. Statistical analyses compared betweengroup differences by intention-to-treat.
Results: We recruited 154 participants (STRENGTH n=79 (53% women, 35(9) years); STRETCH n=75 (45% women, 36(9) years)). There was no difference between groups for change in hip-related QOL (mean difference (95% con- fidence interval) 1.6 (-4.9 to 8.1) p=0.63) or patient-perceived global improvement (0.3 (-0.1 to 0.7) p=0.11) at six- months. Both groups improved in iHOT-33 over six-months of 21.9 points. STRENGTH had greater improvements in hip abduction (21.6(7.6 to 35.5) Newtons; p=0.002) and adduction (16.9(3.9 to 29.9) Newtons; p=0.011) strength than STRETCH.
Conclusions: We found no difference between a targeted, individualised strengthening program and a standardised stretching program on hip-related QOL or perceived improvement at six-months in people with FAI syndrome. Both groups showed improvements much larger than the minimal clinically important change in hip-related QOL at six- months.
Keywords: Exercise-therapy, Femoroacetabular Impingement Syndrome, Hip pain, Physiotherapist-led treatment, Randomised controlled trial
References
1. Kemp JL, Mosler AB, Hart H, et al. Improving function in people with hip-related pain: a systematic review and meta-analysis of physiotherapist-led interventions for hip-related pain. Br J Sports Med. 2020;54(23):1382-1394.
2. Kemp JL, Johnston RTR, Coburn SL, et al. Physiotherapist-led treatment for femoroacetabular impingement syndrome (the PhysioFIRST study): a protocol for a participant and assessor- blinded randomised controlled trial. BMJ Open. 2021;11(4):e041742.
RECOVERY AFTER A SPORTS-RELATED CONCUSSION: A LONGITUDINAL STUDY OF ADOLESCENT RUGBY UNION PLAYERS IN NORTHERN IRELAND
Oral presentation
Mr. Connor McKee (School of Health Sciences, Ulster University, Belfast), Dr. Mark Matthews (School of Sport, Ulster University, Belfast), Dr. Alan Rankin (Sport Medicine NI LTD, Belfast, Northern Ireland), Dr. Chris Bleakley (School of Health Sciences, Ulster University, Belfast)
Abstract
Introduction: Adolescent athletes who sustain a sports-related concussion may experience a prolonged recovery period.1 Evidence suggests female athletes and those with a history of previous concussion may have an extended recovery period, spanning multiple weeks to months.2
Objectives: To track recovery from a concussion across patient-reported measures and determine the time taken to return to pre-injury levels in adolescent rugby union players.
50 51
Study design: A longitudinal study was utilised across a single rugby union playing season (2022-23). Ethical ap- proval was granted from Ulster University Research Ethics Committee
Methods: Male and female rugby union players were recruited from nine school and club rugby teams across Northern Ireland. To be eligible, participants had 16-18years of age, injury free and currently playing at First XV level. Participants completed demographic and established questionnaires including Post-Concussion Symptom Scale (PCSS), Concussion Clinical Profiling (CP), Paediatric Fear Avoidance Behaviour after Traumatic Brain Injury (PFAB-TBI), General Anxiety Disorder (GAD) and Patient Health Questionnaire (PHQ). Those who sustained a con- cussion were re-assessed at 3, 7, 14, 23, 90 and 180days post-event. Recovery was defined as questionnaire score at pre-injury level. Primary outcome measure with Post-Concussion Symptom Scale.
Results: Of the 149 participants (113M (76%); 36F (24%)), 11 (7%) sustained a concussion during the season (9M: 2F), of which four had a previous history of concussion (2M: 2F). PCSS and PFAB-TBI took the longest time to return to baseline scores. Statistically significant differences in survival distribution (Chi-square 9.27 (df=4) p<0.05) across self-reported outcomes; pairwise comparisons show the largest differences in survival distribution were seen be- tween PCSS and GAD (p=0.02) and PCSS and PHQ (p<0.04).
Conclusions: Adolescent male and female rugby union players experienced prolonged post-concussive symptoms based on self-reported measures. Further research on male and female adolescent athletes is needed to track re- covery across various clinical measures.
Keywords: Female, Male, Prolonged
References
1. Field M, Collins MW, Lovell MR., et al. Does age play a role in recovery from sports-related concussion? A comparison of high school and collegiate athletes. The Journal of pediatrics. 2003;142(5), 546-553.
2. Brown DA, Elsass JA, Miller AJ, et al. Differences in symptom reporting between males and females at baseline and after a sports-related concussion: a systematic review and meta- analysis. 2015;45:1027-1040.
Recovery of sensorimotor outcomes after acute ankle sprain: preliminary results of a prospective cohort study
Oral presentation
Mr. Jente Wagemans (University of Antwerp, Antwerp, Belgium), Prof. Jan Taeymans (Bern University of Applied Sciences, Bern, Switzerland), Dr. Kevin Kuppens (University of Antwerp, Antwerp, Belgium), Dr. Heiner Baur (Bern University of Applied Sciences, School of Health Professions, Physiotherapy, 3008 Bern, Switzerland), Prof. Dirk Vissers (University of Antwerp, Antwerp, Belgium), Dr. Chris Bleakley (School of Health Sciences, Ulster University, Belfast)
Abstract
Introduction: Chronic ankle instability (CAI) develops after 30-40% of ankle sprains.1 Etiological models suggest CAI is underpinned by pathomechanical and sensorimotor deficits, but this is largely informed by cross sectional data.2
Objectives: To prospectively record key clinical outcomes and evaluate their individual recovery at 6 and 12 weeks post ankle sprain
Study design: Prospective cohort study
Methods: Athletes (>18y) presenting with an acute lateral ankle sprain (LAS) (<14 days) were recruited from hospital ED’s, social media and physiotherapy clinics. The following outcomes were recorded at 6 and 12 weeks post injury: perceived instability (CAIT), self-reported ankle function (Q-FAAM), range of motion (ROM), strength, joint positional sense (JPS) , balance and jump performance. For each outcome, recovery was considered as the point at which scores for the affected ankle were ≥ to the contralateral side (± minimal detectable change - MDC). We also recorded re-injury (%), and time to return to sport.
Results: We have recruited N=33 patients (61% male; mean age 29y (range 18-60)), with 28 completing 6 and 12 week follow ups. At weeks 6 and 12, many participants had comparable side to side scores for ROM (61%; 89%) and balance (82%; 86%). Fewer participants reported normal scores for CAIT (23%) and Q-FAAM (13%) at week 6, with some increases at week 12 (50% and 46%). Muscle strength, JPS and jump performance were inconclusive. At 6 weeks, 50% had return to sport, increasing to 95% at 12 weeks. By week 12, 12 participants (36%) had incurred a re-sprain.
Conclusions: Recurrence rates are high and align with previous reports. Our initial results suggest that sensorimotor outcomes seem to recover up to 12 weeks post LAS, but time to recovery varies considerably across these outcomes. Recruitment is ongoing; future analysis will examine key predictors of CAI.3
Keywords: Ankle Sprain, Chronic Ankle Instability, rehabilitation
52
References
1. Doherty C, Bleakley C, Hertel J, et al. Recovery From a First-Time Lateral Ankle Sprain and the Predictors of Chronic Ankle Instability: A Prospective Cohort Analysis. Am J Sports Med. 2016;44(4):995-1003. doi: 10.1177/0363546516628870. Epub 2016 Feb 24. PMID: 26912285.
2. Bleakley C, Wagemans J, Netterström-Wedin F. Understanding chronic ankle instability: model rich, data poor. Br J Sports Med. 2021;55(9):463-464. doi: 10.1136 bjsports-2020-103311. Epub 2020 Oct 26. PMID: 33106250.
3. Wagemans J, Taeymans J, Kuppens K, et al. Determining key clinical predictors for chronic ankle instability and return to sports with cost of illness analysis: protocol of a prospective cohort study. BMJ Open. 2023;10:13(5):e069867. doi: 10.1136/bmjopen-2022-069867. PMID: 37164478; PMCID: PMC10174038.
Relationship between muscle swelling and muscle hypertrophy of peroneus muscles by resistance training
Poster presentation
Ms. Sakura Oda (1) Department of Sports Rehabilitation, Graduate School of Biomedical and Health Sciences, Hiroshima University), Dr. Noriaki Maeda (1) Department of Sports Rehabilitation, Graduate School of Biomedical and Health Sciences, Hiroshima University), Mr. Satoshi Arima (1) Department of Sports Rehabilitation, Graduate School of Biomedical and Health Sciences, Hiroshima University), Mr. Yuki Tamura (1) Department of Sports Rehabilitation, Graduate School of Biomedical and Health Sciences, Hiroshima University), Dr. Tsubasa Tashiro (1) Department of Sports Rehabilitation, Graduate School of Biomedical and Health Sciences, Hiroshima University), Prof. Yukio Urabe (1) Department of Sports Rehabilitation, Graduate School of Biomedical and Health Sciences, Hiroshima University)
Abstract Introduction: The peroneus longus (PL) and peroneus brevis (PB) have different functions for ankle stability. Although resistance training (RT) is effective in improving the muscle function, since it takes a long time to obtain muscle hypertrophy, a simple measure to confirm the effects of RT would be useful. A previous study has shown a positive correlation between muscle swelling and muscle hypertrophy.1 However, it is unclear about PL and PB.
Objectives: To examine whether the muscle swelling of PL and PB was associated with muscle hypertrophy.
Study design: Intervention study
Methods: Participants were divided into PL (n=10, push the TheraBand out form the ball of the foot by ankle ever- sion) and PB (n=9, pull the TheraBand through the base of the fifth metatarsal by ankle external rotation) groups2). RT of 2 sets of 100 times was performed 3 times a week for 8-weeks. Cross-sectional area (CSA) of muscles was measured using ultrasound before and after 8-weeks. To examine the acute morphological changes after RT, each CSA was measured before RT, immediately after (post), 10, and 20 minutes after the RT. Paired t-test was used to compare CSA before and after 8-weeks. A one-way repeated ANOVA with post-hoc test was performed to confirm acute changes. The correlation between the changes in CSA at each time point after RT and the changes by 8-weeks intervention was calculated with Pearson’s correlation analysis.
Results: Each CSA increased after 8-weeks (p<0.05). Post-hoc test revealed that each CSA at post was greater com- pared with others (p<0.05). We found a correlation between the amount of muscle swelling at post and the amount of muscle hypertrophy in each CSA (PL: r=0.682, p<0.05; PB: r=0.680, p<0.05).
Conclusions: We reaffirmed selective RT for peroneus muscles is possible. Furthermore, this report is useful in efficiently performing RT to obtain muscle hypertrophy.
Keywords: muscle swelling, muscle hypertrophy, peroneus muscles, resistance training, ultrasound
References:
1. Hirono T, Ikezoe T, Taniguchi M, et al. Relationship between muscle swelling and hypertrophy induced by resistance training. J Strength and Cond Res. 2022;36(2):1-6.
2. Arima S, Maeda N, Tsutsumi S, et al. Is it possible to selective muscle strength train the peroneus longus and peroneus brevis? Japanese Journal of Athletic Training. 2022;8 (1):1-7. (in Japanese)
53
Return to sport among 1928 patients with hip dysplasia after undergoing periacetabular osteotomy
Competition abstract
Mrs. Lisa Tønning (Department of Orthopedic Surgery, Aarhus University Hospital, Aarhus, Denmark), Dr. Stig Jakobsen (Department of Orthopedic Surgery, Aarhus University Hospital, Aarhus, Denmark), Dr. Joanne Kemp (La Trobe University), Mr. Michael O’Brien (La Trobe University), Prof. Ulrik Dalgas (Exercise Biology, Department of Public Health, Aarhus University, Denmark), Prof. Inger Mechlenburg (Department of Orthopedic Surgery, Aarhus University Hospital, Aarhus, Denmark)
Abstract
Introduction: Symptomatic hip dysplasia is often treated with the periacetabular osteotomy (PAO). Studies inves- tigating the effect of PAO have primarily focused on radiographic measurements, pain-related outcomes, and hip survival while evidence related to sport participation is limited.
Objective: The primary aim of this study was to report the rate of participation in sports among patients with hip dysplasia before undergoing PAO compared to up to 20 years after surgery.
Study Design: Cohort study with both retrospective and prospectively collected data.
Methods: All patients who had undergone PAO and had answered at least one question related to sport registered in our institutional database were deemed eligible. Patients were asked if they were playing sport preoperatively, 6 months after PAO as well as 2, 5, 10, 15 and 20 years after. In addition, patients were asked if they were able to play their preferred sport, at what level they were playing sport, what type of sport and if surgery had improved their sport performance.
Results: Among 2404 patients surveyed, 1928 (80%) were included and 56% were playing sport 6months after PAO. This number was 61% two years after PAO, and remained around that for the following years, before dropping 15 years after PAO. Between 56% and 71% of patients felt that their sporting performance improved following PAO at the different time points. Between 39% (6 months after PAO) and 63% (15 years after PAO) were able to participate in their preferred sport.
Conclusion: Patients undergoing PAO due to hip dysplasia have a good chance of returning to, and maintaining, sport after PAO. And more than half of patients undergoing PAO believe that the surgery improved their sports performance, and long after the surgery more than half of patients undergoing PAO can participate in their preferred sport.
Keywords: Hip Dysplasia, Periacetabular Osteotomy, Return to Sport
Review of the physiotherapy service for athletes in Olympic winter games
Poster presentation
Mr. Joon Young Chang (Yonsei Institute of Sports Science and Exercise Medicine)
Abstract
Introduction: Given that the Olympic Summer and Winter Games take place in differing environments, they com- prise different sporting categories as well. These differences bring about various injuries and illnesses (Interna- tional Olympic Committee, 2009). Soligard et al. reported 14.0% and 9.8% injury rates in the Sochi Olympic Winter Games and the Rio Olympic Summer Games, respectively (Soligard et al., 2015, 2017). We believe not only injury and illness have differences, but also in physiotherapy service for athletes are receiving during the Olympic Games are also an important factor to protect athletes’ health (International Olympic Committee, 2009).
Objective This study will provide to better understand the needs for physiotherapy services during the 2018 PyeongChang Olympic Winter Games (POG) from two polyclinics. It is necessary to understand the needs and what physiotherapists do during the Olympic Winter games for first time.
Design: An observational study.
Setting: 2018 PyeongChang Olympic Winter Games.
Participants: Athletes who visited the physiotherapy department of polyclinics.
Results: During 25 the days of the POG, a total of 125 athletes (n = 125, 83 males, 42 females) visited the two polyclin- ics. Of all visits, 69.6% were from the mountain polyclinic and 30.4% from the city. There were three reasons for visit, most of the reason for visit was injury and injury with recovery or injury prevention. Overall, the injury rate (per 1000 athletes) was 42.8 across 13 sports visited the physiotherapy department during the POG. Total numbers of treatments sessions were 823 provided and electrophysical modalities (36.2%) was the most utilized service in POG. And also there were significant differences in the physiotherapy services provided at the two polyclinics.
Conclusion: As each polyclinic differed in location, they addressed different populations of athletes; hence, the study provides insights into the injury trends and different physiotherapy treatments.
Keywords: Injury, Winter sports, Olympics, Physiotherapy service
54 55
Scapular Position In Non-Professional Racquet Players: A Cross-Secondary Study.
Oral presentation
Dr. CRISTINA ORTS RUIZ (Nursing and Physical Therapy Department, Health Sciences Faculty, CEU-Cardenal Herrera University, CEU Universities, Elche, Spain), Dr. JUAN MARTÍNEZ FUENTES (Health Sciences Department, Universidad Catolica de Murcia UCAM, Murcia, Spain), Dr. SILVANA LOANA DE OLIVEIRA SOUSA (University of Murcia - Espinardo Campus: Universidad de Murcia - Campus de Espinardo, Murcia, Spain.), Dr. SERGIO MONTERO NAVARRO (Nursing and Physical Therapy Department, Health Sciences Faculty, CEU-Cardenal Herrera University, CEU Universities, Elche, Spain), Dr. CRISTINA SALAR ANDREU (Nursing and Physical Therapy Department, Health Sciences Faculty, CEU-Cardenal Herrera University, CEU Universities, Elche, Spain), Dr. FRANCISCO JAVIER MOLINA PAYÁ (Nursing and Physical Therapy Department, Health Sciences Faculty, CEU-Cardenal Herrera University, CEU Universities, Elche, Spain), Dr. SONIA DEL RIO MEDINA (Nursing and Physical Therapy Department, Health Sciences Faculty, CEU-Cardenal Herrera University, CEU Universities, Elche, Spain), Dr. JOSÉ MARTÍN BOTELLA RICO (Nursing and Physical Therapy Department, Health Sciences Faculty, CEU-Cardenal Herrera University, CEU Universities, Elche, Spain), Dr.JAUME MORERA BALAGUER (Nursing and Physical Therapy Department, Health Sciences Faculty, CEU-Cardenal Herrera University, CEU Universities, Elche, Spain), Dr. JESÚS MANUEL SÁNCHEZ MAS (Biomedical Sciences Department, Health Sciences Faculty, CEU-Cardenal Herrera University, CEU Universities, Elche, Spain)
Abstract
Introduction. Racquet sports are characterized by repeated movements above the level of the head, implying that the dominant shoulder must develop strategies that allow it to acquire suffcient laxity to ensure the necessary articular ranges and stability to avoid possible articular dislocations, predisposing the area to possible shoulder postural alterations.
Objective. To examine if there is asymmetry in the scapular position between the dominant and non-dominant shoulders in non-professional racquet players.
Methods. Cross-sectional, descriptive, and analytical study in 83 tennis and/or paddle tennis players. Scapulothoracic angle, normalized lateral scapular displacement, scapular height index and distance from the acromion to a reference vertical were evaluated through photographs, later processed and analyzed with SAPo software. Descriptive statistics and repeated measures linear regression models were used for data analysis, adjusting the models for sex, age, BMI, and profession. The effect size was calculated using the partial eta-squared (h2), with values p>0.14 being considered large. Values of p<0.05 were established as statistical significance.
Results. On the dominant side, the players presented smaller scapulothoracic angle [MD: -2.0; P=0.011]; smaller normalized lateral scapular displacement [MD: -0.08; P=0.007]; greater scapular height index [MD:0.48; P=0.000]; and greater distance from the acromion to a reference vertical [MD:1.29; P=0.007]. However, only the scapular height index and the distance of the acromion to a reference vertical were considered high (h2>0.30). When subjects were analyzed by sport subgroup, tennis players presented fewer asymmetries as compared to the paddle or mixed group.
Conclusions. Non-professional racquetball players presented asymmetries in scapular position between the domi- nant and non-dominant shoulders, differing in frequency and magnitude according to the type of sport practiced.
Keywords: Racquet Players, Scapular Position, Shoulder postural Alterations
References:
1. Kleinpaul JF, Mann L, Dos Santos SG. Influência do treinammento de nataçaô de lesôes e desvios posturais. EFDeportes.com. Revista Digital. 2013;17(176).
2. Bhatt JB, Glaser R, Chavez A, et al. Middle and lower trapezius strengthening for the management of lateral epicondilalgia: a case report. J Orthop Sports Phys Ther. 2013;43(11):841-847.
3. Cools AM, Johansson FR, Borms D, et al. Prevention of shoulder injuries in overhead athletes: a science-based approach. Braz J Phys Ther. 2015;1:1-9.
Secondary prevention for athletes after an anterior cruciate ligament reconstruction – an evidence summary.
Poster
Ms. Sarina Sommer (Bern University of Applied Sciences, School of Health Professions, Physiotherapy, 3008 Bern, Switzerland), Ms. Sara Wüthrich (Bern University of Applied Sciences, School of Health Professions, Physiotherapy, 3008 Bern, Switzerland), Dr. Angela Blasimann (Bern University of Applied Sciences, School of Health Professions, Physiotherapy, 3008 Bern, Switzerland)
57 56
Abstract
Introduction: A rupture of the anterior cruciate ligament (ACL) is a common knee injury in athletes, often followed by surgical reconstruction. A high percentage returns to high-impact sports, however, up to 25% of those athletes sustain an ACL reinjury.1
Objectives: To summarize evidence-based training modalities as secondary prevention measures after ACL recon- struction Study design: Evidence summary based on a systematic literature review.
Methods: Systematic literature search in the databases PubMED and Web of Science with the keywords «ACL, an- terior cruciate ligament, reconstruction, reinjury, second injury, rerupture, secondary, prevention, sports» from 2013 to May 2023. Two authors screened the hits independently for title and abstract, followed by full-text reading. Predefined inclusion (adults, professional and amateur athletes after ACL reconstruction), and exclusion criteria (conservative treatment, ACL suture, concomitant or secondary injuries, cadaver or animal study) were used. In- jury of the contralateral side, rerupture of the reconstructed ACL and modification of risk factors for ACL reinjury were chosen as outcomes. The final study selection was made by consensus. Included studies were assessed for risk of bias by using the Critical Appraisal Skills Programme checklist.2
Results: From 923 hits, seven studies with a total of 560 athletes, one systematic literature review, three randomized controlled trials and three cohort studies were included for qualitative analysis. The included literature showed moderate to high quality. Secondary prevention programs with neuromuscular training, eccentric training and plyometric exercises and core strenghtening showed a positive impact on spine, knee and hip joint biomechanics, functional and clinical outcomes in patients after ACL reconstruction.
Conclusions: The interventions in the included literature were shown to reduce various risk factors for ACL reinjury. However, the included studies were heterogeneous regarding interventions and outcomes. As ACL reinjury is multifactorial, it is recommended not to focus on one specific risk factor or outcome.
Keywords: ACL, anterior cruciate ligament, reconstruction, reinjury, secondary prevention
References:
1. Wiggins AJ, Grandhi RK, Schneider DK, et al. Risk of Secondary Injury in Younger Athletes After Anterior Cruciate Ligament Reconstruction: A Systematic Review and Meta-analysis. Am J Sports Med, 2016;44(7):1861-1876. https://doi.org/10.1177/0363546515621554
2. Critical Appraisal Skills Programme Checklists, available via https://casp-uk.net/casp-tools-checklists/
Segmental spinal curvature, inclination, and mobility changes of male soccer players within 4-year follow-up
Poster presentation
Ms. Merve Keskin, Mr. Kazım Bayram, Dr. Sevtap Gunay Ucurum, Prof. Derya Ozer Kaya (Izmir Katip Celebi University)
Abstract
Introduction: It has been observed that the segmental curvature changes, inclination, and mobility of the spine may change depending on age, sport, and the duration of training load (sports age).1,2 Objectives: This study aimed to compare the spinal curvature, inclination, and mobility changes of soccer players within a 4-year duration.
Study design: The study was a longitudinal study comparing data from the same participants within a 4-year duration. Methods: Sixteen male soccer players from Team A were included in the study at the age of 16.38±1.10 years, with a sport age of 6.43±1.63 years. Four years later, at the age of 19.94±1.00 years, their sports age was 10.00±1.79 years. Spine evaluation was conducted using the Valedo®Shape device (Idiag, Fehraltorf, Switzerland). Thoracic kypho- sis, lumbar lordosis, and sacral kyphosis curvatures, mobility, and inclination angles (angle of body displacement relative to the gravity line) were recorded in the sagittal and frontal planes. After marking the spinous processes as reference points, the Valedo®Shape device was moved downward from C7 to approximately S3.3 A paired samples t-test was used to compare the before and after data of the two different intervals in 4 years.
Results: There was a difference between angular inclination values in the sagittal plane in favor of the second measurements (first: 4.63±2.39°, second: 0.81±2.40°, p<0.001). In the frontal plane, thoracic (first: 6.13±5.06°, second: 10.81±7.46°, p=0.014 ) and lumbar curvatures (first: 5.75±4.30°; second: 12.69±7.59°, p<0.001), and thoracic mobility (first: 52.31±9.09°, second: 71.75±13.56°, p<0.001) were increased in favour of current measurements.
Conclusions: The second measurement revealed a decrease in the angle of inclination, indicating a decrease in spinal curvature. Increased curvatures in the anterior plane can potentially bring risks related to asymmetry. There was an observable increase in thoracic mobility.
Keywords: Soccer players, spine, angle, mobility, inclination.
58
References
1. Suchomel TJ, Nimphius S, Stone MH. The importance of muscular strength in athletic performance. Sports Medicine. 2016;46(10):1419-1449.
2. Johnston R, Cahalan R, O’Keeffe M, et al. The associations between training load and baseline characteristics on musculoskeletal injury and pain in endurance sport populations: A systematic review. J Sci Med Sport. 2018;21(9): 910-918. doi: 10.1016/j.jsams.2018.03.001. Epub 2018 Mar 14. PMID: 29559317.
3. Mannion AF, Knecht K, Balaban G, et al. A new skin-surface device for measuring the curvature and global and segmental ranges of motion of the spine: Reliability of measurements and comparison with data reviewed from the literature. Eur Spine J. 2004;13(2):122-136.
Shoulder laxity and rotator cuff muscle strength in healthy overhead athletes: an ultrasound study
Poster presentation
Mr. Takeru Abekura (Department of Sports Rehabilitation, Graduate School of Biomedical and Health Sciences, Hiroshima University), Dr. Noriaki Maeda (Department of Sports Rehabilitation, Graduate School of Biomedical and Health Sciences, Hiroshima University), Mr. Ryosuke Kaizuka (Department of Sports Rehabilitation, Graduate School of Biomedical and Health Sciences, Hiroshima University), Dr. Makoto Komiya (Department of Sports Rehabilitation, Graduate School of Biomedical and Health Sciences, Hiroshima University), Dr. Tsubasa Tashiro (Department of Sports Rehabilitation, Graduate School of Biomedical and Health Sciences, Hiroshima University), Mr. Satoshi Arima (Department of Sports Rehabilitation, Graduate School of Biomedical and Health Sciences, Hiroshima University), Prof. Yukio Urabe (Department of Sports Rehabilitation, Graduate School of Biomedical and Health Sciences, Hiroshima University)
Abstract
Introduction: Shoulder instability may exist in healty overhead (OH) athletes, as high ligament and bursa flexibility contributes to performance exertion in OH athletes. Previous study reported that methods for measuring shoulder laxity using ultrasonography was reliable.2 However, no studies have examined differences in shoulder laxity between non-OH and OH athletes using ultrasound imaging devices.
Objectives: To compare shoulder laxity and rotator cuff muscle strength between OH and non-OH athletes and to examine the characteristics of shoulder joint stability in OH athletes.
Study design: Cross-sectional study
Methods: The dominant shoulder of 7 healthy men who play OH sports (OH group) and 7 healthy men who did not play OH sports (non-OH group) were included. Shoulder laxity were measured according to the method of Sangeeta et al2). The shoulder joint was fixed in 90-degree abduction and external rotation in the sitting position, the posterior labrum and posterior humeral border were delineated by an ultrasonography (KONICA MINOLTA, Japan). The humeral head was pulled back and forth up to 30 N with a tensiometer (TAKEI, Japan), and the anterior and posterior laxity were measured. Internal and external rotation muscle torque were measured by a dynamometer (ANIMA, Japan). For statistical analysis, group comparisons were performed by unpaired t-test (p<0.05).
Results: The OH group had significantly higher anterior laxity (0.9 ± 0.6 mm; 1.9 ± 0.8 mm), internal rotation muscle torque (31.1 ± 7.1 Nm; 42.4 ± 8.9 Nm), and external rotation muscle torque (29.2 ± 6.5 Nm; 35.9 ± 4.3 Nm) than the nonOH group (p<0.05, respectively).
Conclusions: The OH group had higher anterior laxity than the non-OH group, suggesting the presence of structural instability of the shoulder joint in healthy OH athletes. Internal and external rotation muscle torques was higher in the OH group and may be antagonistic to increased structural instability.
Keywords: overhead sport, shoulder laxity, ultrasonography
References:
1. Harada Y, Iwahori Y, Kajita Y, et al. Return to sports after arthroscopic bankart repair on the dominant shoulder in overhead athletes. J Orthop Sci. 2022;27(6):1240- 1245.
2. Rathi S, Taylor NF, Gee J, et al. Measurement of glenohumeral joint translation using real-time ultra- sound imaging: A physiotherapist and sonographer intra-rater and inter-rater reliability study. Man Ther. 2016;26(1):110-116.
59
Stabilometric and Baropodometric Evaluation After Osteopathic Scaphoid Tug Manipulation
Poster presentation
Dr. FRANCISCO JAVIER MOLINA PAYÁ (Nursing and Physical Therapy Department, Health Sciences Faculty, CEU-Cardenal Herrera University, CEU Universities, Elche, Spain), Dr. SERGIO MONTERO NAVARRO (Nursing and Physical Therapy Department, Health Sciences Faculty, CEU-Cardenal Herrera University, CEU Universities, Elche, Spain), Dr. SONIA DEL RIO MEDINA (Nursing and Physical Therapy Department, Health Sciences Faculty, CEU-Cardenal Herrera University, CEU Universities, Elche, Spain), Dr. CRISTINA ORTS RUIZ (Nursing and Physical Therapy Department, Health Sciences Faculty, CEU-Cardenal Herrera University, CEU Universities, Elche, Spain), Dr. JAUME MORERA BALAGUER (Nursing and Physical Therapy Department, Health Sciences Faculty, CEU-Cardenal Herrera University, CEU Universities, Elche, Spain), Dr. CRISTINA SALAR ANDREU (Nursing and Physical Therapy Department, Health Sciences Faculty, CEU-Cardenal Herrera University, CEU Universities, Elche, Spain), Dr. JESÚS MANUEL SÁNCHEZ MAS (Biomedical Sciences Department, Health Sciences Faculty, CEU-Cardenal Herrera University, CEU Universities, Elche, Spain), Dr. JOSÉ MARTÍN BOTELLA RICO (Nursing and Physical Therapy Department, Health Sciences Faculty, CEU-Cardenal Herrera University, CEU Universities, Elche, Spain)
Abstract
Introduction. Stabilometry and baropodometry are currently the object of study in different health fields both at a preventive, diagnostic level, and as a method of treatment of different pathologies or imbalances. Osteopathic manipulative techniques applied to the foot sensor could modify the postural registers.
Objectives. To analyze the modification of the stabilometric and baropodometric registers in the bipedal standing posture in healthy subjects after the application of the osteopathic manipulative technique of TUG of the scaphoid. Method. A randomized experimental study was performed with a sample of 36 subjects (intervention group n=17; control group n=19). The intervention group underwent an osteopathic scaphoid TUG intervention, while the con- trol group was given a placebo. Before and after the intervention, both groups underwent a stabilometric and baropodometric analysis by means of a pressure platform using the standards of the Association Français de Pos- turologie. Statistical analysis was carried out with IBM SPSS Statistics, version 19.0 (Shapiro-Wilks test, analysis of Q-Q and Q-Q normality graphs without trend, Levene’s test, ANOVA, Bonferroni correction and Cohen’s d).
Results. The inter- and intra-group post-intervention comparative analysis showed that there were no significant differences in the stabilometric and baropodometric variables studied, except for the support surface variable which showed significant intra-group results both in the control group (differences in the right foot p=0.02) and in the intervention group (left foot p=0.032), which suggests an anomaly or influence of some parameter not con- trolled in the study or in the measurement process.
Conclusions. Osteopathic TUG manipulation of the scaphoid does not modify the stabilometric or baropodometric recordings in the bipedal standing posture in healthy subjects.
Keywords: osteopathic manipulation, stabilometry, baropodometry
References
1. Latash M et Al. Postural synergies and their development. Neural plasticity. 2005;12(2-3):119-130.
2. Wang L et Al. Propioception of ankle and knee joints in obese boys and nonobese boys. Med Sci Monit. 2008;14(3): 129-135.
3. Lephart SM et Al. The role of propioception in the management and rehabilitation of athetic injuries. Am J Sports Med. 1997; 25(1): 130-137.
Static Stretching Improves Flexibility. But How Often, How Hard, and How Long Do We Need to Stretch For? A Systematic Review, Meta-Analysis, and Multivariate Meta-Regression
Oral presentation
Dr. Lewis Ingram (Alliance for Research in Exercise, Nutrition and Activity (ARENA), Allied Health and Human Performance, University of South Australia, Adelaide, SA), Prof. Grant Tomkinson (Alliance for Research in Exercise, Nutrition and Activity (ARENA), Allied Health and Human Performance, University of South Australia, Adelaide, SA), Dr. Noah D’Unienville (Alliance for Research in Exercise, Nutrition and Activity (ARENA), Allied Health and Human Performance, University of South Australia, Adelaide, SA), Ms. Bethany Gower (Alliance for Research in Exercise, Nutrition and Activity (ARENA), Allied Health and Human Performance, University of South Australia, Adelaide, SA), Dr. Sam Gleadhill (University of South Australia, Adelaide, SA), Dr. Terry Boyle (Australian Centre for Precision Health, Allied Health and Human Performance, University of South Australia, Adelaide, SA), Dr. Hunter Bennett (Alliance for Research in Exercise, Nutrition and Activity (ARENA), Allied Health and Human Performance, University of South Australia, Adelaide, SA)
60 61
Abstract
Introduction: Static stretching is widely used to increase flexibility. However, there is no consensus regarding the optimal dosage parameters for increasing flexibility.
Objectives: To identify the optimal frequency, intensity, and volume to maximise flexibility through static stretching, and to investigate whether this is moderated by muscle group, health status, or baseline flexibility.
Study design: Systematic review and meta-analysis.
Methods: Seven databases (CINAHL Complete, Cochrane CENTRAL, Embase, Emcare, MEDLINE, Scopus, and SPORTDiscus) were systematically searched up to March 2023. Randomised and non-randomised controlled trials investigating the effects of a single session (acute) or multiple sessions (chronic) of static stretching on flexibility- specific outcomes (compared to non-stretching passive controls) among adults (≥18 years) were included. Multi- level meta-analysis examined the effect of acute and chronic static stretching on flexibility outcomes, while multi- variate meta-regression determined the volume at which increases in flexibility were maximised.
Results: Data from 188 studies representing 8095 adults (63% female; mean [SD] age: 29±13 years) were included. We found a moderate positive effect of acute static stretching on flexibility (g = 0.60, 95%CI: 0.49-0.72, p<0.001) and a large positive effect of chronic static stretching on flexibility (g = 0.94, 95%CI: 0.80-1.10, p<0.001). While neither effect was moderated by stretching frequency, intensity, muscle group stretched, or health status, those who were less flexible had greater improvements following acute static stretching (g = -0.46, 95%CI: -0.70, -0.23, p<0.001). Improvements in flexibility were maximised by a cumulative stretching volume of three minutes per session (acute) and eight minutes per week (chronic).
Conclusion: Static stretching improves flexibility in adults, with no additional benefit observed beyond three min- utes per session or eight minutes per week. Intensity, frequency, muscle group, and health status do not influence improvements in flexibility. These guidelines for static stretching can be used by coaches and therapists to improve flexibility.
Keywords: Joint Flexibility; Joint Range of Motion; Muscle stretching exercises; Static Stretching
The Application of the ROAST - Guideline in Ankle Sprain Rehabilitation – A Case Study
Poster presentation
Ms. Melanie Liechti (Bern University of Applied Sciences, School of Health Professions, Physiotherapy, 3008 Bern, Switzerland), Mr. Alexander Philipp Schurz (Bern University of Applied Sciences, School of Health Professions, Physiotherapy, 3008 Bern, Switzerland), Ms. Elaheh Ahmadi (N/A), Ms. Aglaja Busch (Bern University of Applied Sciences, School of Health Professions, Physiotherapy, 3008 Bern, Switzerland), Mr. Christian Bangerter (Bern University of Applied Sciences, School of Health Professions, Physiotherapy, 3008 Bern, Switzerland), Mr. Jente Wagemans (University of Antwerp, Antwerp, Belgium)
Abstract
Introduction: Ankle sprains are associated with increased re-injury rates and frequent development of chronic ankle instability.1 The Rehabilitation Oriented Assessment (ROAST) tool should help to identify mechanical and sensorimotor impairments and guide the rehabilitation decision making.2 Recently, a systematic review evaluated the measurement properties of tests recommended in the ROAST guideline which is used to underpin the decision making for our case.3
Objectives: Monitoring the rehabilitation process using impairment-based testing.
Study design: Case study
Methods: We assessed overall ankle function, pain, swelling, range of motion (ROM), sensorimotor function, and muscle strength according to ROAST. In addition, we evaluated brain activity using electroencephalography and time to stabilization (TTS) after jump landing. The measurements were performed at baseline (T0), 6 weeks (T1), three (T2) and six months (T3) after injury.
Results: A middle-distance triathlete (31 years) twisted his right ankle during running. Medical examination revealed no fracture but positive anterior drawer test. Self-reported ankle function increased significantly at T1 or T2 according to the minimal clinical important difference (MCID) for the Foot and Ankle Ability Measure (mean difference (MD): 10.4 - MCID: 9) and Cumberland Ankle Instability Tool (right MD: 9 - MCID: 3). ROM improved over timepoints without fulfilling the cut-off of ≥ 10cm for dorsiflexion (9.9cm at T3). Ankle pain, swelling and calf muscle strength were inconspicuous. Composite Y-balance scores failed to meet the criteria of 94% (left: 82.16%, right: 85.66%) at T3. The injured limb demonstrated higher cognitive activity during balance exercises on T1. No clear patterns were observed for balance exercises (T2, T3) and TTS after jump landings.
Conclusions: Self-reported ankle function normalized over time but measured ankle function did not reach standardized thresh- old values. Brain activity might indicate increased cognitive resources to maintain balance on the injured limb six weeks post injury.
Keywords: Ankle injury, chronic ankle instability, impairment-based assessment, case study
62
References:
1. Gribble PA, Delahunt E, Bleakley C, et al. Selection criteria for patients with chronic ankle instability in controlled research: a position statement of the International Ankle Consortium. Br J Sports Med. 2014;48:1014-1018.
2. Delahunt E, Bleakley CM, Bossard DS, et al. Clinical assessment of acute lateral ankle sprain injuries (ROAST): 2019 consensus statement and recommendations of the International Ankle Consortium. Br J Sports Med. 2018;52:1304-1310.
3. Schurz AP, Wagemans J, Bleakley C, et al. Impairment-based assessments for patients with lateral ankle sprain: A systematic review of measurement properties. PLoS One. 2023;18:e0280388.
The Effect of Blood Flow Restriction Training on Quadriceps Strength and Physiological Cross-Sectional Area After Anterior Cruciate Ligament Reconstruction: A Double-Blind, Randomized, Placebo-Controlled Clinical Trial
Competition abstract
Dr. Lauren Erickson (University of Kentucky), Dr. Kathryn Hickey Lucas (Creighton University), Dr. Benjamin Brightwell (University of Texas Medical Branch), Dr. Megan Graham (University of Kentucky), Mrs. Kylie Spencer (University of Kentucky), Mrs. Kelsey Casadonte (University of North Carolina), Ms. Tereza Janatova (University of Kentucky), Dr. Peter Hardy (University of Kentucky), Dr. Meredith Owen (University of Kentucky), Dr. Katherine Thompson (University of Kentucky), Dr. Darren Johnson (University of Kentucky), Dr. Cale Jacobs (Harvard University), Dr. Caitlin Conley (University of Kentucky), Dr. Christopher Fry (University of Kentucky), Dr. Brian Noehren (University of Kentucky)
Abstract
Introduction: Blood flow restriction training (BFRT) is a popular form of training for athletes after anterior cruciate ligament reconstruction (ACLR); however, there is a lack of research establishing the efficacy of using BFRT during rehabilitation.
Objective: To test the efficacy of BFRT to improve quadriceps strength (QS), rate of torque development (RTD), and physiological cross-sectional area (PCSA) after ACLR.
Study Design: Double-blind, randomized, placebo-controlled clinical trial
Methods: 48 athletes were randomly assigned to either low-load strength training with BFRT (BFRT group) or high- load strength training with sham BFRT (control group). Treatment occurred for one month pre-surgery and four months postsurgery. Both groups followed the same standard rehabilitation program and performed the same exercises (leg press, knee extension, squat, step up/down) 3x per week. Outcome variables were measured at baseline and 4 months post-surgery. Isometric QS and RTD were measured on an isokinetic dynamometer and normalized to body mass. PCSA of the vastus lateralis was determined using diffusion tensor magnetic resonance imaging. A two-sample t-test was used to assess between group differences (change from baseline to 4-months post-surgery) for each outcome.
Results: Both groups were equally balanced by sex (BFRT: 11F, 15M, Control: 11F, 15M) and age (BFRT: 20.8 ± 6.0 yrs, Control: 21.23 ± 5.3 yrs). There were no significant differences between groups for QS (p=0.49, BFRT: -0.22 ± 0.6 Nm/kg, Control: -0.11 ± 0.5 Nm/kg), RTD (p=0.92, BFRT: -1.59 ± 3.4 Nm/kg/s, Control: -1.67 ± 2.4 Nm/kg/s) or PCSA of the vastus lateralis (p=0.46, BFRT: 387.25 ± 1351.8 mm2, Control: 95.67 ± 958.4 mm2).
Conclusion: The use of BFRT as part of a rehabilitation program for athletes pre- and post-ACLR was no more effective than standard rehabilitation for improving QS, RTD, and PCSA. Clinicians should consider the value of BFRT relative to the cost, time, and discomfort for patients.
Keywords: ACL, BFRT, quadriceps, strength training
References
1. Caetano D, Oliveira C, Correia C, et al. Rehabilitation Outcomes and Parameters of Blood Flow Restriction Training in ACL Injury: A Scoping Review. Phys Ther Sport. 2021;49:129-137.
2. Erickson LN, Lucas KCH, Davis KA, et al. The Effect of Blood Flow Restriction Training on Quadriceps Muscle Strength, Morphology, Physiology, and Knee Biomechanics Before and After Anterior Cruciate Ligament Reconstruction: Protocol for a Randomized Clinical Trial. Phys Ther. 2019;99(8):1010-1019.
63
The effects of icing on muscle temperature and contractile properties.
Oral presentation.
Mr. Shuya Fukuoka (Graduate School of Health Sciences, Hokkaido University, Sapporo, Japan), Dr. Mina Samukawa (Faculty of Health Sciences, Hokkaido University, Sapporo, Japan), Dr. Yuta Koshino (Faculty of Health Sciences, Hokkaido University), Dr. Tomoya Ishida (Faculty of Health Sciences, Hokkaido University), Dr. Satoshi Kasahara (Faculty of Health Sciences, Hokkaido University), Prof. Harukazu Tohyama (Faculty of Health Sciences, Hokkaido University)
Abstract
Introduction: Cold exposures impair neuromuscular function.1 Tensiomyography (TMG) non-invasively assesses muscle contractile properties with electrical stimulation.2 Until present, there are no reports to clarify icing effects on muscle contractile properties with TMG.
Objective: To investigate the effects of icing on muscle temperature and contractile properties.
Methods: Eight healthy males (age: 22.9 ± 2.2 years) participated in this study. Each participant completed two conditions (icing and control) each for 15 minutes on separate days in a random order. Icing was applied on the right gastrocnemius muscles. Muscle temperature was measured at gastrocnemius lateralis. Muscle contractile proper- ties of the gastrocnemius medialis were measured using Tensiomyography (TMG–100). The stimulation intensity was increased gradually to 20 mA, reaching a plateau in the twitch response curve. TMG parameters, including maximal radial displacement (Dm), delay time (Td), contraction time (Tc), and velocity of contraction (Vc), were then measured from the maximal twitch response. Two-way repeated-measures ANOVA was performed, and the Bonferroni test was used for post-hoc comparisons.
Results: In the icing condition, muscle temperature were significantly decreased (Pre: 34.2 ± 0.9 °C; Post: 28.6 ± 2.7 °C, p < 0.001). Neuromuscular properties were shown with Td (Pre: 20.2 ± 1.1 ms; Post: 23.9 ± 1.4 ms, p < 0.001), Tc (Pre: 20.9 ± 2.1 ms; Post: 23.2 ± 2.6 ms, p = 0.021) and Vc (Pre: 0.087 ± 0.024 mm/ms; Post: 0.076 ± 0.021 mm /ms, p < 0.001) were significantly impaired after icing. However, no significant changes with Dm in icing condition (p = 0.206) and muscle temperature and TMG parameters in control condition (p = 0.092–0.994).
Conclusion: Icing temporally impairs muscle contractile properties, but the maximal radial displacement remains unchanged. The present results suggest that icing may negatively affect neuromuscular properties without altering mechanical properties with the muscle contraction.
Keywords: icing, muscle contractile properties, tensiomyography
References:
1. Racinais S, Oksa J. Temperature and neuromuscular function. Scand J Med Sci Sports. 2010.
2. Langen G et al. Methodical approaches to determine the rate of radial muscle displacement using tensiomyography: A scoping review and new reporting guideline: J Electromyogr Kinesiol. 2022.
The Effects of Motor Imagery on Balance and on the Fear of Re-Injury in Professional Football Players with Ankle Sprain
Oral presentation
Mr. George Plakoutsis (University of West Attica), Dr. Eleftherios Paraskevopoulos (University of West Attica), Dr. Konstantinos Fousekis (University of Patras), Dr. Elias Tsepis (University of Patras), Dr. Maria Papandreou (University of West Attica), Mrs. Despoina Ignatoglou (University of Thessaly, 3o km Lamias- Athens, 35100)
Abstract
Acute lateral ankle sprain is one of the most common musculoskeletal injury in football causing deficits in balance. Motor Imagery (MI) has been progressively included in sports rehabilitation as an adjunct therapeutic modality either for injury management or sports performance (e.g. fear of re-injury). The aim of the present study was to investigate the effects of MI on balance and on the fear of re-injury in professional football players with ankle sprain Grade II. Fifty-eight professional football players participated in the study. Athletes were in the return to play period, and they were randomly divided into 2 groups: 1st MI group (n = 29) and 2nd – Placebo group (n = 29). Both groups received the same balance training program. Athletes in the 1st – MI group received a standardized recorded content of MI instructions in addition to the balance training program, while athletes in the 2nd – Placebo group received only relaxation instructions. Static balance was evaluated with the Single Leg Stance Test (SLST) by the portable KForce Plates, dynamic balance was evaluated with the Y Balance Test (YBT), the fear of re-injury was assessed using the Causes of Re-injury Worry Questionnaire (CR-IWQ), the ability of MI with the use of the Greek version of the Vividness of Movement Imagery Qusetionnaire-2 (VMIQ-2-GR) and the responses of the Autonomic Nervous System through the Oxygen saturation (SPO2) and the heart rate. Results indicated a statistically significant improvement for the YBT (p < 0.001) between the 2 groups while there were no statistically
64 65
significant differences on the other variables. Despite the MI group did not show statistically significant results, there was an improvement in all main outcome measures post intervention. Further research is recommended in order to explore the MI interventions in combination with psychophysiological factors associated with sports rehabilitation and performance.
Keywords: motor imagery; football; ankle sprain; balance; fear of re-injury
References:
1. Jensen SN, et al. Depression in Danish and Swedish elite football players and its relation to perfectionism and anxiety. Psychology of Sport and Exercise. 2018;36:147-155. doi: 10.1016/j.psychsport.2018.02.008.
2. Mulcahey MK, et al.The Epidemiology of Ankle Injuries Identified at the National Football League Combine, 2009-2019. Orthopaedic Journal of Sports Medicine. 2018;6(7):2009–2015. doi: 10.1177/2325967118786227.
3. Plakoutsis G, et al. The Effects of Motor Imagery on Pain in Lower Limb Sports Injuries: A Systematic Review and Meta-Analysis. Healthcare. 2022;10(12):1–11. doi: 10.3390/healthcare10122545.
The effects of repetitive pitching on elbow valgus stability in baseball pitchers
Poster presentation
Ms. Maki Nomura (Graduate School of Health Sciences, Hokkaido University), Dr. Yuta Koshino (Faculty of Health Sciences, Hokkaido University), Ms. Fiorella Apolo (Graduate School of Health Sciences, Hokkaido University), Mr. Yoshiya Takahashi (Hokushin Hospital), Dr. Tomoya Ishida (Faculty of Health Sciences, Hokkaido University), Dr. Satoshi Kasahara (Faculty of Health Sciences, Hokkaido University), Prof. Harukazu Tohyama (Faculty of Health Sciences, Hokkaido University), Dr. Mina Samukawa (Faculty of Health Sciences, Hokkaido University)
Abstract
Introduction: Repetitive baseball pitching causes valgus stress on elbow joints and consequently increases ulnar collateral ligament (UCL) injury risk.1 The medial elbow joint space was found to increase after 60 pitches in a previous study.2,3 However, the pitching task in the previous study was performed on “straight” pitches only in a controlled setting.
Objectives: To investigate the repetitive pitching effects in a baseball game on the medial joint space at elbow joint.
Design: A cross-sectional study
Methods: Twenty-six young male collegiate baseball pitchers were enrolled. The medial elbow joint space was measured using ultrasonography in the following conditions: resting with forearm on bed (unloaded), valgus load with forearm weight (loaded), and valgus load with forearm weight and maximal grip (loaded-contracted). The medial elbow joint space was measured before and after pitching in a game. Subgroup analysis was conducted considering the throwing frequency (≥ 60 pitches and < 60 pitches). The minimum detectable change (MDC) was also calculated. Two-way repeated-measures analysis of variance was used to assess the effects of the game and condition on the medial elbow joint space.
Results: In the analysis of all participants, the medial elbow joint space significantly increased (0.14 mm) after pitching in the loaded condition (p = 0.01). In the subgroup analysis, the medial elbow joint space in the ≥ 60 pitches significantly increased (0.13 mm) after pitching in the loaded contraction (p = 0.02). However, none of these results exceeded the MDC (0.28 mm). There were no significant changes in the < 60 pitches.
Conclusions: Repetitive pitching with various types of throwing in an actual game was indicated to decrease elbow valgus stabil- ity. However, the effect may be considered small due to less than the MDC.
Keywords: baseball, elbow, ulnar collateral ligament, ultrasonography
References:
1. Fleisig GS, Andrews JR, Dillman CJ, et al: Kinetics of baseball pitching with implications about injury mechanisms. Am J Sports Med. 1995;23:233-239.
2. Hattori H, Akasaka K, Otsudo T, et al. Ulnar collateral ligament laxity after repet- itive pitching: associated factors in high school baseball pitchers. Am J Sports Med. 2021;49:1626-1633.
3. Namiki Y, Saito A, Okada K: The relationship between changes in elbow valgus laxity and forearm flexor strength during repetitive pitching. Sports Biomech. In press. doi: 10.1080/14763141.2022.2125822.
66
The effects of rhythm jump training on agility and jumping ability in preadolescent Japanese soccer players: A non-randomized controlled trial
Poster presentation
Ms. Naoko Tsunekawa (Department of Rehabilitation, Kitasato University School of Allied Health Sciences), Mr. Hiroyuki Watanabe (Department of Rehabilitation, Kitasato University School of Allied Health Sciences), Mr. Yudai Kato (Physical Therapy for Sports and Musculoskeletal System, Kitasato University Graduate School of Medical Sciences), Mr. Ryota Muroi (Department of Sports Medicine, St. Marianna University School of Medicine), Mr. Haruki Horiuchi (Department of Rehabilitation, Kitasato University School of Allied Health Sciences), Mr. Masashi Kawabata (Department of Rehabilitation, Kitasato University School of Allied Health Sciences), Dr. Naonobu Takahira (Department of Rehabilitation, Kitasato University School of Allied Health Sciences)
Abstract
Introduction: Although the World Health Organization recommends 60 minutes of physical activity per day for children, approximately 80% do not meet this recommendation.1,2 Rhythm jump training (RJT), involving rhythmic jumping exercises, is aimed at increasing physical activity and improving motor skills; however, its effectiveness remains unclear. Objectives: This study was aimed to elucidating the effects of RJT on motor skills.
Study design: We conducted a non-randomized comparative trial.
Methods: Overall, 101 preadolescent soccer players attending soccer school once a week were included, with 79 individuals (age: 8.5 ± 1.6 years) ultimately participating after exclusions. The participants were divided into two groups, RJT group (n = 44, age: 8.3 ± 1.8 years) and CON group (n = 35, age: 8.7 ± 1.4 years). The RJT group performed six different RJT exercises synchronized to music at a tempo of 115-120 BPM for the initial 10 minutes of each 60-minute practice session once a week, totalling eight sessions. The CON group performed regular warm-up exercises. Motor skill performance measurements included the reactive strength index (RSI), which measures jump height per ground contact time, and the pro-agility test (PAT), a 20-meter sprint including two changes of direction.
Results: Following the intervention, PAT scores significantly improved in RJT group compared with CON group (p < 0.01).
Conclusions: This study showed that RJT positively affected the agility of preadolescent soccer players. RJT is an effective training method that is easy to sustain and can increase physical activity. Because the difficulty of the exercises can be adjusted by altering the types of jumps and the music, RJT is considered feasible for a wide range of age groups. Future research endeavours will require elucidating the improvement in various motor skills through RJT and determining the impact of long-term RJT interventions on injury incidence.
Keywords: Motor skill, physical activity, rhythm jump training
References:
1. World Health Organization. Global recommendations on physical activity for health. Geneva;World Health Organization: 2010.
2. Guthold R, Stevens GA, Riley LM, et al. Global trends in insufficient physical activity among adolescents: a pooled analysis of 298 population-based surveys with 1·6 million participants. Lancet Child Adolesc Health. 2019. https://doi.org/10.1016/S2352 -4642(19)30323-2.
The Health And Performance Promotion in Youth Sport (HAPPY) study: A qualitative evaluation of the implementation of injury prevention exercise programs in community handball.
Competition abstract
Ms. Julie Jespersen (Department of Sports Science and Clinical Biomechanics, The Faculty of Health Sciences, University of Southern Denmark, Odense, Denmark), Dr. Louise Kamuk Storm (Department of Sports Science and Clinical Biomechanics, The Faculty of Health Sciences, University of Southern Denmark, Odense, Denmark), Mr. Anders Christer Larsen (Department of Sports Science and Clinical Biomechanics, The Faculty of Health Sciences, University of Southern Denmark, Odense, Denmark), Dr. Lotte Nygaard Andersen (Department of Sports Science and Clinical Biomechanics, The Faculty of Health Sciences, University of Southern Denmark, Odense, Denmark), Mrs. Sarah Zacher-Gross (Department of Sports Science and Clinical Biomechanics, The Faculty of Health Sciences, University of Southern Denmark, Odense, Denmark), Prof. Carsten Juhl (Department of Sports Science and Clinical Biomechanics, University of Southern Denmark, Odense. Department of Physiotherapy and Occupational Therapy, Copenhagen University Hospital, Herlev and Gentofte), Prof. Ewa Maria Roos (Department of Sports Science and Clinical Biomechanics, The Faculty of Health Sciences, University of Southern Denmark, Odense, Denmark), Dr. Merete Møller (Department of Sports Science and Clinical Biomechanics, The Faculty of Health Sciences, University of Southern Denmark, Odense, Denmark. Oslo Sports Trauma Research Center, Norwegian School of Sports Sciences, Oslo, Norway)
67 68
Abstract
Introduction: Although evidence-based injury prevention programs are available in youth handball, their imple- mentation in practice remains insufficient. This gap emphasizes the need for a better understanding of the behav- ioral determinants, facilitators, and barriers among youth handball coaches.
Objectives: To gain a profound understanding of youth handball coaches´ behavioural determinants and adher- ence to an injury prevention exercise programme in youth community handball.
Methods: We used a qualitative study-design. Data were collected from 18 semi-structured interviews with hand- ball coaches who participated in a randomized controlled trial, comparing the effectiveness of an online and on- site implementation strategy (11 coaches) versus an online-only strategy (7 coaches) in enhancing adherence to an injury prevention exercise program. The interview guide was based on The Health Action Process Approach (HAPA) behaviour change model, addressing barriers, facilitators, and behavioural determinants influencing the implementation process. Interviews were transcribed verbatim and data were analyzed using reflexive thematic analysis.
Results: All participants recognized the importance of injury prevention; however, they had different levels of adherence implementing the HAPPY-program. 6 overall themes were identified influencing the implementation process positively or negatively; 1) coaches’ knowledge, skills and preferences, 2) player skills and motivation 3) practical setting, 4) injury prevention club culture, 5) onsite expert support from health professionals and 6) social support among coaches. We found no major differences in coach responses between the two randomized implemen- tation strategy groups. Instead, adherence to the implementation was strongly influenced by personal autonomy, as well as environmental factors such as the availability of resources/facilities, social support and culture.
Conclusion: Adherence to an injury prevention program was largely dependent on pre-existing factors, such as the coaches’ personal beliefs, skills, resources, and the environmental factors surrounding them.
Keywords: Health and Performance, Implementation, Injury prevention, youth handball
The influence of growth and maturation on injury and illness in Norwegian youth athletes –a prospective observation study
Oral presentation
Mr. Jacob Mollatt (Inland Norway University of Applied Sciences), Dr. Anne Mette Rustaden (Inland Norway University of Applied Sciences)
Abstract
Introduction: Youth athletes rely on full participation in their sport to be able to achieve their athletic potential. However, health problems related to growth and maturation can negatively impact their athletic development through a significant loss in training and competition. Moreover, injuries in adolescence can proceed a reason for drop-out.
Objectives: The main objective was to investigate the relationships between growth, maturation, and health prob- lems among Norwegian youth athletes.
Study design: This is a prospective observation study.
Methods: In total, 299 youth athletes between 12 and 16 years were prospectively monitored for growth, matura- tion, and self-reported health problems for a period of 13 weeks. Health problem variables were collected through weekly distribution of the Oslo Sports Trauma Research Questionnaire on Health Problems, and generalised Poisson regression models were used to model growth rate and maturation with health problem variables.
Results: Both the relationship between maturity status and severity score, and the relationships with severity score of substantial health problems was non-linear in both genders (p<0.001). Peak estimated severity scores, duration of health problems and full time-loss were observed between 86.8 and 92.1% predicted adult height in boys, and above 97.8% in girls. The relationships with maturity status and duration of health problems were non-linear in boys (p=0.003) and in girls (p<0.001). The relationships with growth rate and severity score in boys was linear and positive (p<0.001), and non-linear in girls (p<0.001).
Conclusion: Severity and burden of health problems follow a non-linear association with maturity status in male youth athletes, with peak values approximating peak height velocity. In females, the association was more linear, although the sample was more mature compared to the boys and largely post-PHV. Growth rate had a positive linear association with severity of health problems in male youth athletes, while the association was non-linear among the females.
Keywords: Growth, maturation, injury
69
References
1. Bergeron MF, Mountjoy M, Armstrong N, et al. International Olympic Committee consensus statement on youth athletic development. Br J Sports Med. 2015;Jul;49(13):843–851.
2. Swain M, Kamper SJ, Maher CG, et al. Relationship between growth, maturation and musculoskeletal conditions in adolescents: a systematic review. Br J Sports Med. 2018;52(19):1246-1252.
3. Clarsen B, Bahr R, Myklebust G, et al. Improved reporting of overuse injuries and health problems in sport: An update of the Oslo Sport Trauma Research Center questionnaires. British Journal of Sports Medicine. 2020;54:bjsports-2019.
The Multicentre ACL Screening COhorT STUDY – Validation of a screening tool – The MASCOT study protocol
Poster presentation
Mrs. Kamilla Arp (Department of Orthopedic Surgery, Lillebaelt Hospital - University Hospital of Southern Denmark, Denmark), Mr. Kim Gordon Ingwersen (Department of Physio- and Occupational therapy, Lillebaelt Hospital - University Hospital of Southern Denmark, Denmark), Prof. Eva Ageberg (Department of Health Sciences, Faculty of Medicine, Lund University, Lund, Sweden), Prof. Bjarke Viberg (Orthopaedic Surgery and Traumatology, Odense University Hospital, Denmark), Dr. Claus Varnum (Department of Orthopedic Surgery, Lillebaelt Hospital - University Hospital of Southern Denmark, Denmark)
Abstract
Background: Anterior cruciate ligament (ACL) rupture can be treated surgically or non-surgically. An existing screening tool has been used to identify patients who require ACL reconstruction (ACLR) and who do not. However, previous research assessed the tool’s utility shortly ACL injury.
Objective: The primary objective of the MASCOT study is to evaluate the sensitivity and specificity of an existing screening tool to identify patients who needs ACLR following 3 months rehabilitation.
Study design: Protocol for a prospective cohort study
Methods: In the MASCOT study, three Danish hospitals will enroll 356 patients (aged 18-49) within six months of a primary unilateral ACL injury. Patients will be evaluated at baseline (when initial acute impairments are resolved), at followup after 3 months rehabilitation and after 12 months from follow-up. Evaluation at baseline and follow-up include the existing screening tool (number of episodes of giving way, Global Rating Scale [GRS] of knee function, a func- tional performance test [6-meter timed hop] and a patient reported outcome measure [PROM], [Knee Outcome Sur- vey]) and additionally assessment of muscle strength of knee extensors and knee flexors, a battery of single-legged hop-tests, patient reported outcomes and treatment preference. At 12 months after follow-up assessment includes patient reported outcomes and questionnaire regarding satisfactory of completed treatment. The primary outcome is patients scheduled for ACLR after the follow up assessment. The sensitivity, specificity, positive and negative predictive values of the screening tool will be calculated and additionally a receiver operating characteristics (ROC) analysis will be performed.
Discussion: This study may have important clinical implications in the identification of patients who will receive ACLR after 3 months rehabilitation and who do not.
Keywords: ACL, rehabilitation, ACL reconstruction, screening, copers and noncopers
The relationship between trunk flexor endurance test at different angles and trunk performance tests in physical education students
Poster presentation
Dr. Takayuki Koyama (Nihon University), Mr. Ryosuke Kawai (Nihon University), Dr. Tadamitsu Matsuda (Juntendo University)
Abstract
Introduction: The trunk flexor endurance test (TFET) has been used with variations in the inclination angle from 45 to 60 degrees. Specifically, an inclination angle of 60 degrees is deemed suitable for older adults, yet may be overly simplistic for athletes. The clinical relevance of TFET could differ based on the inclination angle and populations.
Objectives: This study aims to investigate the association between different TFET angles and trunk performance.
Study Design: A correlational analysis approach.
Methods: The participants consisted of 350 physical education students (236 men, 114 women), divided into three groups based on angles (45, 50, and 55 degrees). The TFET commenced by moving the backrest 10 cm backwards at the designated angle while participants maintained the initial posture. The test concluded when participant’s back contacted the backrest again. Trunk performance was evaluated through 30-second speed sit-ups, trunk extensor endurance test (TEET), closed kinetic chain upper extremity stability test (CKCUEST), and upper quarter Y balance test (UQYBT).
70 71
Results: Among men, a significant difference was noted between 45 and 55 degrees, whereas no significant difference was observed among women across angles. For men, correlation analysis revealed significant associations between TFET and sit-ups (r=.32 with 45 degrees, r=.37 with 50 degrees, r=.27 with 55 degrees), TEET (r=.54 with 50 degrees), and UQYBT (r=.30 with 55 degrees). For women, significant correlations were observed between TFET and sit-ups (r=.49 with 45 degrees, r=.61 with 55 degrees), TEET (r=.38 with 45 degrees), CKCUEST (r=.35 with 45 degrees, r=.31 with 50 degrees), and UQYBT (r=-.37 with 55 degrees).
Conclusions: Our findings showed that the angle of TFET influences both the endurance capacity and the outcomes on trunk performance tests. The variation in TFET duration across different angles underscores the importance of selecting appropriate angles to accurately assess the physical fitness levels of diverse populations.
Keywords: endurance test, physical fitness, trunk performance
References:
1. McGill SM, et al. Endurance times for low back stabilization exercises: clinical targets for testing and training from a normal database. Arch Phys Med Rehabil. 1999;80:941-944.
2. McGill S et al. Previous history of LBP with work loss is related to lingering deficits in biomechanical, physiological, personal, psychosocial and motor control characteristics. Ergonomics. 2003;46(7):731-746.
The Significant Effect on Clinical Condition, Strength, Endurance and Stiffness of the Achilles Tendon for Both Alfredson and Silbernagel Protocols in Competitive Athletes with Achilles Tendinopathy
Oral presentation
Mr. Kryštof Voleský (Charles University), Mr. Jakub Katolický (Charles University), Mr. Jan Novák (Charles University), Mr. Michael Janek (Charles University), Mr. James Tufano (Charles University), Mr. Javier Courel-Ibáñez (University of Granada), Dr Tomáš Vetrovský (Charles University)
Abstract
Introduction: Treatment protocols for Achilles tendinopathy, such as the Alfredson and Silbernagel, have shown beneficial effects on the clinical condition of patients. However, they have never been directly compared in competitive athletes. Objectives: To compare the effectiveness of both the Alfredson and Silbernagel protocols in competitive athletes. A secondary objective was to explore biomechanical or structural changes in the Achilles tendon (AT) and impact on strength endurance of the plantar flexors.
Study design: Randomized controlled trial.
Methods: A total of 20 competitive athletes with Achilles tendinopathy diagnosed through a combination of ques- tionnaire, ultrasound and clinical assessment were randomly assigned to the Alfredson isolated eccentric loading (AG) or Silbernagel concentric-eccentric loading (SG) group using permuted block randomization stratified by age. Both groups followed the respective protocol for six weeks. The primary outcome was the difference in the clinical condition assessed by the Victorian Institute of Sports Assessment-Achilles (VISA-A) instrument after 6 weeks. Sec- ondary outcomes were plantar flexors strength endurance assessed by heel-rise test (HRT), stiffness of AT assessed by MyotonPRO device (STIF) and cross-section area of AT assessed by ultrasound (CSA). Between-group comparison was performed using an unpaired t-test, and the impact of training was evaluated using a paired t-test.
Results: No significant between-group differences were found for the primary and secondary outcomes. When analyzing both groups combined, there was a significant improvement in: VISA-A score (from 60.3±17.5 to 77±13.2, p<0.001), HRT (from 26±3.72 to 31.8±4.65 reps, p<0.001), STIF (from 869 ± 149 to 942±155 N/m, p=0.006), of the tendinopathy leg and there was no significant improvement in CSA of the tendinopathy leg.
Conclusions: No differences were found between AG and SG. Both protocols significantly improved clinical condi- tion (VISA-A), plantar flexor strength endurance (HRT), and stiffness (STIF) of the AT with diagnosed tendinopathy.
Registration: NCT05659134 (ClinicalTrials.gov)
72
Keywords: Achilles tendinopathy, treatments, VISA-A, HRT, stiffness
References
1. Scott A, Squier K, Alfredson H, et al. ICON 2019: International Scientific Tendinopathy Symposium Consensus: Clinical Terminology. Br J Sports Med. 2020;54(5):260-262
2. Habets B, van Cingel REH, Backx FJG, et al. No Difference in Clinical Effects When Comparing Alfredson Eccentric and Silbernagel Combined Concentric-Eccentric Loading in Achilles Tendinopathy: A Randomized Controlled Trial. Orthop J Sport Med. 2021;9(10):1–10
3. Grävare Silbernagel K, Malliaras P, de Vos RJ, et al. ICON 2020— International Scientific Tendinopathy Symposium Consensus: A Systematic Review of Outcome Measures Reported in Clinical Trials of Achilles Tendinopathy. Sport Med. 2022;52(3):613-641.
Thermal And Textural Analysis In Athletes With Patellar Tendinopathy: A Cross-Sectional Study
Poster presentation
Dr. FRANCISCO JAVIER MOLINA PAYÁ (Nursing and Physical Therapy Department, Health Sciences Faculty, CEU-Cardenal Herrera University, CEU Universities, Elche, Spain), Dr. SERGIO MONTERO NAVARRO (Nursing and Physical Therapy Department, Health Sciences Faculty, CEU-Cardenal Herrera University, CEU Universities, Elche, Spain), Dr. SONIA DEL RIO MEDINA (Nursing and Physical Therapy Department, Health Sciences Faculty, CEU-Cardenal Herrera University, CEU Universities, Elche, Spain), Dr.CRISTINA ORTS RUIZ (Nursing and Physical Therapy Department, Health Sciences Faculty, CEUCardenal Herrera University, CEU Universities, Elche, Spain), Dr. JESÚS MANUEL SÁNCHEZ MAS (Biomedical Sciences Department, Health Sciences Faculty,CEU-Cardenal Herrera University, CEU Universities, Elche, Spain), Dr. CRISTINA SALAR ANDREU (Nursing and Physical Therapy Department, Health Sciences Faculty, CEU-Cardenal Herrera University, CEU Universities, Elche, Spain), Dr. JAUME MORERA BALAGUER (Nursing and Physical Therapy Department, Health Sciences Faculty, CEU-Cardenal Herrera University, CEU Universities, Elche, Spain), Dr. JOSÉ MARTÍN BOTELLA RICO (Nursing and Physical Therapy Department, Health Sciences Faculty, CEU-Cardenal Herrera University, CEU Universities, Elche, Spain)
Abstract
Introduction. Patellar tendinopathy (PT), common in athletes, poses a challenging diagnosis. Thermal assessment by infrared thermography (IRT) and grey-level co-occurrence matrix (GLCM) analysis of infrared images could help in the identification and characterisation of this pathology.
Objectives. To evaluate thermal and textural changes in athletes with unilateral PT versus asymptomatic athletes, and to analyse their correlation with symptomatology and functionality.
Methods. In this cross-sectional study we worked with a group of athletes with unilateral PT (n=27) and a group of asymptomatic athletes (n=27). Infrared images of the patellar tendons of both groups were recorded and the symptomatology and functionality of the knees were quantified using the VISA-P questionnaire. Thermal symmetry between patellar tendons and GLCM of the infrared images was analysed and finally correlated with the results of the VISA-P questionnaire. Results. As expected, the thermal difference between knees in the PT group was larger than in the control group, with an effect size of 0.79. No correlation was observed between temperature and the VISA-P scale (rxy= -0.162, p= 0.242, R2= 0.03). In relation to GLCM, the PT group showed a higher textural correlation (effect size 0.85) and a lower homogeneity (effect size of 0.47) than the control group. A significant correlation was only observed for the textural correlation in inverse and weak correlation (rho= -0.276, p= 0.013, R2= 0.18).
Conclusions. The analysis of thermal symmetry and GLCM on thermal images of patellar tendons could be used as an aid in the diagnosis and clinical follow-up of patients with TR, despite not having found a correlation with knee pain and functionality measured with VISA-P scale.
Keywords: Patellar tendinopathy, thermography, textural analysis, athletes
References
1. Malliaras P, Cook J, Purdam C, et al. Patellar Tendinopathy: Clinical Diagnosis, Load Management, and Advice for Challenging Case Presentations. Journal of Orthopaedic & Sports Physical Therapy. 2015;45(11):887-898. https://doi.org/10.2519/jospt.2015.5987
2. Mangine RE, Siqueland KA, Noyes FR. The use of thermography for the diagnosis and man- agement of patellar tendinitis. The Journal of Orthopaedic and Sports Physical Therapy. 1987;9(4):132-140.
3. Pérez-Buitrago S, Tobón-Pareja S, Gómez-Gaviria Y, et al. Methodology to evaluate temperature changes in multiple sclerosis patients by calculating texture features from infrared thermography images. Quantitative InfraRed Thermography Journal. 2020;1-11. https://doi.org/10.1080/17686733.2020.1793283
73
Throwing Injury Prevention Strategies with a Fundamental
Motor Skills-Focused Approach in the Early Stages of Long-Term Athletic Development
Oral presentation
Mr. Jun Sakata (TOYOTA Athlete Support Center, TOYOTA Motor Corporation), Mr. Toshiharu Tsutsui (Faculty of Sport Sciences, Waseda University), Ms. Emi Nakamura (Department of Physical Therapy, Faculty of Health Science, Juntendo University), Dr.Tadahiro Sakai (TOYOTA Athlete Support Center, TOYOTA Motor Corporation)
Abstract
Introduction: Shoulder and elbow throwing injuries are common in young baseball players.1 In the early stage of long-term athletic development, it’s crucial to focus on the development of fundamental motor skills first, and specific athletic skills second.2
Objectives: This study aimed to investigate the effectiveness of a prevention program for the incidence of throwing injuries of the shoulder and elbow using a fundamental motor skills-focused approach.
Study design: Randomized controlled trials.
Methods: Six youth baseball teams consisting of 268 players aged 8–11 years were randomized into an intervention group (three teams, 122 players) and a control group (three teams, 146 players). The intervention program consisted of all-four balance exercise, multiple squat exercises, and skip exercises performed during the warm-up. The pri- mary study outcome measures were shoulder and elbow injuries incidences for 10 months. In addition, ball speed and ball spin ratio during pitching and swing speed during batting were measured as performance-related fac- tors during the pre- and post-intervention periods. Physical function variables (single-leg balance, chest expansion length, and thoracic kyphosis angle) were assessed during the pre- and post-intervention periods.
Results: The incidence of shoulder and elbow injuries in the intervention group (23/122, 18.9%) was significantly lower than that in the control group (55/146, 37.7%) (hazard ratio, 45.6%; P = .02). The factors related to performance, as assessed by swing speed, tended to increase in the intervention group compared to the control group (P = .001). The program also improved single-leg balance (P = .047), chest expansion length (P = .001), and thoracic kyphosis angle (P = .047).
Conclusions: A prevention program with a fundamental motor skills-focused approach decreased throwing injuries and enhanced baseball performance in young baseball players.
Keywords: throwing injury, long-term athletic development prevention, randomized controlled trials
References:
1. Sakata J, Nakamura E, Suzuki T, et al. Throwing Injuries in Youth Baseball Players: Can a Prevention Program Help? A Randomized Controlled Trial. Am J Sports Med. 2019;47(11):2709-2716. doi: 10.1177/0363546519861378.
2. Till K, Lloyd RS, McCormack S, et al. Optimising long-term athletic develop- ment: An investigation of practitioners’ knowledge, adherence, practices and challenges. PLoS One. 2022;17(1):e0262995. doi: 10.1371/journal.pone.0262995.
Tissue flossing improves range of motion at hip in active person.
Poster presentation.
Mrs. Fabiana Silva (UFCSPA), Mr. Christian Schneider (UDELAR), Mrs. Renata Bona (UDELAR)
Abstract
Introduction: Tissue flossing is the use of elastic bands called floss bands, which are wrapped around joints and/or tissues. Studies have found that flossing in tissues (FT) has beneficial effects such as increased range of motion (ROM), power, prevention and post-exercise recovery.1
Objectives: To compare the acute effects of FT application with physical activity on the variables of local thigh temperature and hip ROM. We hypothesize that FT will generate an increase in local temperature, hip ROM, when compared to the group that will perform only physical activity.
Study design: This study has a cross-sectional design.
Methods: The study included 16 men aged (22.8 ± 1.58 years), (1.80 m ± 0.06 m), (79.5 kg ± 8.43 kg). All of them with a weekly physical activity time of (354.12 ± 71.90 minutes). The SWATT2 method was used for FT. For the acute physical activity, exercises were performed for about 10 min.
Results: For thigh temperature, the group that performed the FT protocol found a difference (p<0.05) both pre and post training and in the application of FT. There was a difference post FT and post training (increased in the group that performed FT). Regarding hip ROM, we found difference between pre FT and post FT (p<0.05), also there was difference between pre FT and post training in the FT group.
74 75
Conclusions: We conclude that FT compresses the tissue1, producing heat that leads to an improvement in the viscoelasticity of the fascia because it enhances the shear between its layers.2 The fascia, therefore, presents more stretching capacity, which benefits joint ROM.
Keywords: Voodoo Flossing, Temperature, Viscosity, Performance, Fascia
References
1. Konrad A, Mocnik R, Nakamura M. Effects of tissue flossing on the healthy and impaired musculoskeletal system: A Scoping Review. Frontiers in Physiology, 2021;12:666129.
2. Suslik D, Seifert, S. Training und Therapie mit dem Flossband: Leistungssteigerung, Verletzungspräven- tion und Schmerzreduktion durch Vitality Flossing. Meyer & Meyer Verlag.
3- Carvalhais V, Ocarino M, Araújo V, et al. Myofascial force transmission between the latissimus dorsi and gluteus maximus muscles: an in vivo experiment. Journal Biomechanics. 2013;46(5):1003
Perception towards injury risk and injury prevention of rugby players in Germany – is there a difference between male and female players?
Poster presentation.
Prof. Monika Lohkamp (SRH Hochschule Heidelberg), Ms. Maria Saile (SRH Hochschule Heidelberg)
Abstract
Introduction: There is a high injury incidence in Rugby in Germany but only few clubs implement injury prevention programs. One barrier could be that players do not perceive injuries as serious and hence do not see the need for it.
Objectives: To gather information on the perceptions of injury and injury prevention of German rugby players.
Study design: cross-sectional survey.
Methods: Male and female players who were older than 16 years were included. They completed a questionnaire as described by Barden et al. (2021) which included demographic information followed by rating the agreement/disagreement to several statements on a 6-point Likert scale. The answers were described using a median. Differences between male and female players were calculated using a Mann-Whitney Test.
Results: 50 questionnaires were completed (25 female, 25 male). The mean age was 23.7 ± 5.0 years and they had on average 10.5 ± 3.9 years experience playing rugby. Seriousness of contusions was rated the lowest (median:2) and concussion the highest (median:6). Female players rated concussions statistically significantly more serious (median:6 vs median:5, p< .05; Cohen’s d: .47). The agreement with the statements that “injury can shorten the career” or “cause physical problems later in life” was very high (median: 6). The risk of injury while playing rugby was rated high (median: 4). The agreement with the statements about injury prevention (e.g. preventive exercises should be integrated in training) were very high (median 5 to 6). Six players know the program “Activate.” Most players (N=47) think, they are responsible for injury prevention, followed by the coach (N=41).
Conclusion: Players see a high risk of injuries and would like prevention exercises integrated in the training. They should also be advised what to do themselves. There is only little difference in perception towards injury and injury prevention between male and female players.
Keywords: activate, athletes, attitude, rugby union
References:
1. Barden C, Stokes KA, McKay CD. Implementation of the Activate injury prevention exercise programme in English schoolboy rugby union. BMJ Open Sport & Exercise Medicine. 2021;7: e e001018. doi:10.1136/bmjsem-2020- 001018
Translation, cross-cultural adaptation and validation of the Danish version of the Knee Outcome Survey - Activities of Daily Living Scale.
Poster presentation
Mrs. Kamilla Arp (Department of Orthopedic Surgery, Lillebaelt Hospital - University Hospital of Southern Denmark, Denmark), Dr. Claus Varnum (Department of Orthopedic Surgery, Lillebaelt Hospital - University Hospital of Southern Denmark, Denmark), Prof. Ulrik Dalgas (Exercise Biology, Department of Public Health, Aarhus University, Denmark), Mrs. Bettina Mølri Knudsen (Center for Shared Decision Making, Lillebaelt Hospital, University Hospital of Southern Denmark, Vejle, Denmark), Mrs. Signe Timm (Department of Orthopedic Surgery, Lillebaelt Hospital - University Hospital of Southern Denmark, Denmark), Prof. Bjarke Viberg (Orthopaedic Surgery and Traumatology, Odense University Hospital, Denmark), Mr. Kim Gordon Ingwersen (Department of Physio- and Occupational therapy, Lillebaelt Hospital - University Hospital of Southern Denmark, Denmark)
76 77
Abstract
Introduction: The Knee Outcome Survey –Activities of Daily Living Scale (KOS-ADLS) is a patient reported outcome measure (PROM) developed to assess functional abilities in patients with various knee disorders. The original version of KOS-ADLS is widely used in research and clinical practice and is reliable, valid and responsive to changes in pa- tients with various knee disorders.
Objectives: The purpose of this study was to translate and culturally adapt the KOS-ADLS into Danish and to evaluate the psy- chometric properties of the Danish version (KOS-ADLS-DK) in patients with anterior cruciate ligament (ACL) injury. Study design: Cross-sectional study
Methods: The KOS-ADLS was translated into Danish and culturally adapted in accordance with guidelines from Beaton and colleagues.1 To evaluate the psychometric properties, 117 patients with ACL injury completed KOS-ADLS-DK and other knee-specific PROMs. All patients completed the PROMs at baseline and 14 days later and a sub-population (79 patients) completed the PROMs before and after 3 months of rehabilitation (to evaluate responsiveness). Validity (internal consistency and construct validity), reproducibility (test-retest reliability and agreement), responsiveness and floor/ceiling effects were assessed.
Results: The translation and cross-cultural adaptation process did not reveal major problems. The KOS-ADLS-DK showed a high internal consistency (Cronbach’s alpha = 0.90), factor analysis confirmed the unidimensionality of the KOS-ADLS-DK, but the construct validity was not satisfactory as only five of seven hypotheses were confirmed. Bland&Altman plots showed equal distribution in test-retest agreement, good reliability (Intraclass Correlation Co- efficient = 0.88) with a SEM of 4.9% and SDC of 13.6%. Hypotheses testing on change scores revealed the KOS-ADLS- DK to be responsive and without floor/ceiling effects.
Conclusion: The Danish version of KOS-ADLS is a valid, reliable and responsive PROM for assessing symptoms and functional limitations in patients with ACL injury, but have some minor limitations in its construct validity.
Keywords: Knee Outcome Survey, translation, validation, psychometric assessment, ACL
References:
1. Beaton DE, Bombardier C, Guillemin F, et al. Guidelines for the process of cross-cultural adaptation of self- report measures. Spine. 2000;25(24):3186-3191.
Unveiling Vascular Masquerades: A Case of Iliac Internal Stenosis Mimicking GTPS.
Poster presentation
Mr. Magnus Håmsø (Movon AS)
Abstract
This case study sheds light on a situation where peripheral arterial disease was mistaken for Greater Trochanteric Pain Syndrome (GTPS). The patient, a woman aged between 55 and 60, had a complex medical history, including a battle with breast cancer, cardiovascular problems, and gastrointestinal complications stemming from previous treatments. Her presenting complaint was 14 months of persistent right hip pain. Despite conservative treatments aimed at GTPS, her symptoms failed to improve. Upon closer examination, it became evident that her symptoms were not typical of GTPS. She displayed signs such as pain that worsened rapidly with any activity (including cycling) and was completely alleviated by short rest periods (<120 seconds). The symptoms did not typically originate in the calves but in the lateral hip, and did not radiate distally. The rapid alleviation of symptoms with rest prompted further investigation. This led to the discovery of vascular issues, specifically iliac internal stenosis, which had been previously masked by the predominant musculoskeletal symptoms. The patient underwent surgery to address the underlying vascular pathology, receiving bilateral iliac stents. Postoperatively, her symptoms dramatically improved, and she experienced significant relief from her hip pain. Notably, clinical tests that were initially positive for musculoskeletal dysfunction, such as single-leg standing and specific isometric tests, no longer reproduced her previous pain. This case underscores the importance of considering vascular etiologies in patients presenting with atypical musculoskeletal symptoms, especially those with underlying cardiovascular risk factors. It highlights the potential pitfalls of relying solely on clinical presentations and the importance of a comprehensive assessment approach. Early recognition of vascular involvement and prompt intervention could have potentially prevented prolonged suffering and unnecessary treatments. In summary, this case emphasizes the critical role of thorough assessment and clinical reasoning in guiding appropriate management strategies, ultimately leading to improved patient outcomes and quality of life.
Keywords: Greater Trochanteric Pain Syndrome, peripheral arterial disease, iliac stenosis, misdiagnosis, vascular screening
78
Using In-game Scenarios to Measure Dual Task Capacity in Football Players
Poster presentation
Mr. Özgün Uysal (Physical Therapy and Rehabilitation Faculty, Hacettepe University), Prof. Volga Bayrakcı Tunay (Physical Therapy and Rehabilitation Faculty, Hacettepe University), Prof. Nevin Atalay Güzel (Faculty of Health Sciences, Gazi University), Prof.Tüzün Fırat (Physical Therapy and Rehabilitation Faculty, Hacettepe University)
Abstract
Introduction: Current dual-task methods are not enough to challenge football players’ dual-task capacity and are not specific to football as they are mostly based on functions like counting backward from a hundred while walking over obstacles.1
Objectives: We aimed to create a dual-task test based on in-game situations and measure football players’ capacity, which would not be correlated to physical performance.
Study design: Our study was designed as a prospective cohort study.
Methods: Thirteen football players (from professional youth teams) were included in our study with a mean age of 17.67±0.41. We excluded players with health-related problem that could affect attending regular training. Besides our DualTask test, players performed a juggling (foot), speed dribbling, and long passing tests for performance measurement2. For the dual-task test, we used a shorter version of the agility t-test. One meter away from the test area, we placed a projector and a curtain. At first, players performed the agility test while dribbling. In the dual- task version, while the players dribble, we projected in-game scenarios to the curtain and asked players to say the number of the player who is available to receive the ball. The total time and number of errors were recorded.
Results: Our players scored a mean of 23.46±5.55 times in right-foot, 16.85±8.93 times in left-foot, and 40.31±9.13 times in total juggling; 17.92±1.55 seconds in speed dribbling; 8.38±2.36 points in long passing; 9.28±0.92 seconds in modified ttest; 11.77±1.08 seconds in new dual-task test; 27.69±13.6 in dual-task cost. There was no correlation between dual-task cost and performance parameters (all ps’>0.05 and r=0.231, 0.214, 0.339 for juggling right, left, and total; r=-0.311 for speed dribbling; r=-0.147 for long pass test.)
Conclusions: Our test could be used as a new method to measure players’ dual-task capacity. The performance parameters did not alter the dual task measurement.
Keywords: Dual-Task, Performance Testing, Soccer.
References:
1. Giessler-Gonzalez K, et al., Revised Dual Task Screen is a Valid Measure of Dual Task Performance: Developing a Motor and Cognitive Dual Task Measure with Healthy Female Athletes. Occup Ther Health Care. 2023:1-15.
2. Rösch D, et al. Assessment and evaluation of football performance. Am J Sports Med. 2000;28(5 Suppl):S29-639.
Validity and reliability of the groin injury screening questionnaire in Japanese
Poster presentation
Mr. Yuki Tamura (Hiroshima university), Dr. Noriaki Maeda (1) Department of Sports Rehabilitation, Graduate School of Biomedical and Health Sciences, Hiroshima University), Mr. Shogo Tsutsumi (1) Department of Sports Rehabilitation, Graduate School of Biomedical and Health Sciences, Hiroshima University), Ms. ayano ishida (1) Department of Sports Rehabilitation, Graduate School of Biomedical and Health Sciences, Hiroshima University), Dr. Makoto Komiya (1) Department of Sports Rehabilitation, Graduate School of Biomedical and Health Sciences, Hiroshima University), Dr. Tsubasa Tashiro (1) Department of Sports Rehabilitation, Graduate School of Biomedical and Health Sciences, Hiroshima University), Mr. Satoshi Arima (1) Department of Sports Rehabilitation, Graduate School of Biomedical and Health Sciences, Hiroshima University), Prof. Yukio Urabe (Department of Sports Rehabilitation, Graduate School of Biomedical and Health Sciences, Hiroshima University)
Abstract Introduction: Groin pain is one of the prevalent injuries in soccer players.1 Since groin pain takes time to heal and affects the performance of the players, it is necessary to monitor the groin condition regularly to prevent its onset and reccurence. The Groin Injury Screening Questionnaire (GISQ) was developed in Norway to evaluate the groin condition for soc- cer players.2 GISQ has already been translated in several language, but not into Japanese.
Objectives:
To develop the Japanese version of the GISQ (GISQ-J), and to examine its validity and reliability. Moreover, to in- vestigate the relationship between a history of groin pain and GISQ-J scores.
Study design: Cross-sectional study
Methods: The GISQ-J, translated with permission from the original author, was distributed twice to 114 Japanese high school and university soccer players by Google Forms. The second response was given within 72 hours of the first
79 80
response, recalling the condition of the groin at the time of the first response. The GISQ-J is a 100-point scale, with a higher score indicating better groin conditions. Cronbach’s α was calculated to assess the validity of each GISQ-J scale, and the intraclass correlation coefficient (ICC) was calculated to evaluate the reliability. In addition, an unpaired t-test was used to compare GISQ-J scores by the presence or absence of a history of groin pain.
Results: A total of 60 soccer players (52.6%) responded. Cronbach’s α for each scale ranged from 0.71 to 0.97, and the ICC from 0.72 to 0.86. Those with a history of groin pain (n=14) had significantly lower GISQ-J scores than those without (n=46)(p<0.05).
Conclusions: The GISQ-J showed good validity and reliability on each scale. The GISQ-J scores were poor with a history of groin pain, suggesting that the GISQ-J may be useful in the evaluation of groin conditions in Japanese soccer players.
Keywords: Groin pain, Questionnaire, Screening tool, soccer player
Referenc
1. Candela V, De Carli A, Longo UG, et al. Hip and groin pain in soccer players. Joints. 2021;7(4):182-187.
2. Engebretsen AH, Myklebust G, Holme I, et al. Prevention of injuries among male soccer players: a prospective, randomized intervention study targeting players with previous injuries or reduced function. Am J Sports Med. 2008; 36(6):1052-1060.
Validity, agreement and reliability of the ForceFrame dynamometer in patients with anterior cruciate ligament injuries
Poster presentation
Mrs. Kamilla Arp (Department of Orthopedic Surgery, Lillebaelt Hospital - University Hospital of Southern Denmark, Denmark), Mr.Thomas Frydeldal (Department of Orthopedic Surgery, Aarhus University Hospital, Aarhus, Denmark), Mr. Troels Kjeldsen (Department of Orthopedic Surgery, Aarhus University Hospital, Aarhus, Denmark), Prof. Ulrik Dalgas (Exercise Biology, Department of Public Health, Aarhus University, Denmark), Prof. Bjarke Viberg (Orthopaedic Surgery and Traumatology, Odense University Hospital, Denmark), Mr. Kim Gordon Ingwersen (Department of Physio- and Occupational therapy, Lillebaelt HospitalUniversity Hospital of Southern Denmark, Denmark), Dr. Claus Varnum (Department of Orthopedic Surgery, Lillebaelt HospitalUniversity Hospital of Southern Denmark, Denmark)
Abstract
Introduction: Restoring maximal muscle strength of knee extension and knee flexion following anterior cruciate ligament (ACL) injury and reconstruction is of great importance. It is therefore essential for clinicians and healthcare providers to have dynamometers that are easy-to-use, valid and reliable. The ForceFrame is a novel dynamometer that may be a reliable option compared to the gold-standard isokinetic dynamometer.
Objective: To assess the reproducibility of the ForceFrame dynamometer and concurrent validity against an isokinetic dynamometer in maximum voluntary isometric contraction (MVIC) during knee extension and flexion.
Study Design: Reproducibility study
Methods: Twenty-seven participants with ACL injury or reconstruction participated in this study. ForceFrame MVIC were tested on two separate days; Day one including gold-standard isokinetic dynamometer and day two inter-tester assessment by a new assessor. Main outcome measures were concurrent validity and agreement (ForceFrame vs. isokinetic dynamometer), day-to-day test-retest reliability and agreement and inter-tester reliability of ForceFrame.
Results: ForceFrame showed a fair concurrent validity compared to the isokinetic dynamometer for extension (r=0.56), poor concurrent validity for flexion (r=0.24), Bland & Altman plots between ForceFrame and the isokinetic dynamometer showed a mean difference of -0.51 Nm/kg for extension and -0.32Nm/kg for flexion. There was a good day-to-day testretest reliability for MVIC of extension (ICC=0.77, CI95:0.48-0.90) and flexion (ICC=0.83, CI95:0.61-0.92), while there were excellent inter-tester reliability for MVIC of extension (ICC=0.97, CI95:0.94-0.98) and flexion (ICC=0.93, 95CI:0.85-0.97).
Standard error of measurement (SEM) was 8% and 9% while the smallest detectable change (SDC) was 22% and 27% for extension and flexion, respectively.
Conclusions: ForceFrame can be used to obtain valid and reliable results to assess MVIC of knee extension and flexion, but abso- lute results may be considered an underestimation of actual MVIC. The chosen test position to assess knee flexion in ForceFrame does not appear to be optimal, and different test-positions may be considered.
Keywords: ACL, knee, maximal muscle testing, validation
81
Who Counted as an Expert and Whose Expertise Counted in Consensus Statements on Patellofemoral Pain or Patellofemoral Osteoarthritis?
Oral presentation
Mr. Paul Blazey (Department of Family Practice, Faculty of Medicine, The University of British Columbia, Canada; Department of Physical Therapy, The University of British Columbia, Vancouver, Canada), Prof. Clare Ardern (Department of Physical Therapy, The University of British Columbia, Vancouver, Canada: Sport and Exercise Medicine Research Centre, La Trobe University, Melbourne, Australia), Prof. Alex Scott (Department of Physical Therapy, The University of British Columbia, Vancouver, Canada), Prof. Jackie Whittaker (Department of Physical Therapy, The University of British Columbia, Vancouver, Canada: Arthritis Research Canada, Vancouver, Canada), Prof. Jennifer Davis (Applied Health Economics Laboratory, Faculty of Management, University of British Columbia – Okanagan, Kelowna, Canada; Social & Economic Change Laboratory, Faculty of Management, University of British Columbia - Okanagan), Mr. Justin Losciale (Department of Physical Therapy, The University of British Columbia, Vancouver, Canada: Arthritis Research Canada, Vancouver, Canada), Prof. Karim Khan (Department of Family Practice, Faculty of Medicine, University of British Columbia: School of Kinesiology, University of British Columbia, Vancouver, Canada)
Abstract Introduction: Consensus recommendations bridge knowledge gaps in patellofemoral pain (PFP) research and/or clinical practice. The prevalence of PFP is 29% in elite, and 23% in amateur, female athletes.1 Consensus recommendations depend on the expertise of panelists who take part in the consensus process. To represent their target population, panels should include persons impacted by their work.2
Objectives: To assess who has been invited and whose opinions have counted towards consensus recommendations on PFP or Patellofemoral osteoarthritis (PF-OA).
Study Design: A secondary analysis of data from a scoping review.
Methods: The Joanna Briggs Institute Manual for Evidence Synthesis was used to map consensus statements in PFP and PF-OA. Two reviewers extracted data on the panelists including: number of panelists; definition of expertise; sex; country; country income level; and the reason they were invited to participate.
Population: PFP ‘experts’. Inclusion criteria – had to be a panelist in a consensus statement making recommenda- tions on PFP.
Results: Twenty-two consensus statements were included. Thirteen (59%) focused on treatment recommenda- tions. Nine (39%) provided a justification for why panelists were invited. Sixteen (73%) reported panelist numbers (N=365). Eleven (50%) reported panelist sex; 66% of panelists were male (111 of 169). Twelve (55%) reported pan- elist country; 44% (117 of 263) of panelists represented the USA or Canada. All panels included either a medical doctor or physical therapist. One consensus panel included a patient.
Conclusions: PFP and PF-OA consensus statements have often failed to define who counts as an expert and the panels have lacked diversity. Experience—the metric most often used to identify experts—is not a perfect proxy for expertise.3 The patient/athlete voice has been missing from consensus panels, meaning that recommendations may not serve the athletic population who are affected by PFP.
Keywords: Patellofemoral Pain; Consensus; Expertise; Diversity.
References:
1. Smith BE, Selfe J, Thacker D, et al. Incidence and prevalence of patellofemoral pain: A systematic review and meta-analysis. PLoS One. 2018:13(1):e0190892.
2. Blazey P, Crossley KM, Ardern CL, et al. It is time for consensus on ‘consensus statements’. Br J of Sports Med. 2022;56:306-307
3. Petty, NJ. Becoming an expert: A Masterclass in developing clinical expertise. Int J Osteopath Med. 18;3:207- 218
82
Efficacy of a rhythmic gymnastics-specific injury prevention program: a cluster-randomized controlled trial among competitive Norwegian rhythmic gymnasts
Competition abstract
Ms. Marte Dobbertin Gram (Norwegian school of sport sciences), Dr. Morten Wang Fagerland (Norwegian school of sport sciences), Prof. Kari Bø (Norwegian school of sport sciences)
Abstract
Introduction: Overuse injuries are common among competitive Norwegian rhythmic gymnasts with a mean weekly prevalence of 37% and with the knees, lower back and hip/groin as the most common injury locations (Gram, M., Clarsen, B., & Bø, K., 2021). It has been postulated that reduced physical capacity (e.g. strength, flexibility) in these areas contributes to the high prevalence of overuse injuries.
Objectives: To assess if exercises targeting reduced physical capacity in the lower back, knees and hip/groin lower the prevalence of overuse injuries in these areas compared with no targeting exercises among Norwegian rhythmic gymnasts.
Study design: Assessor-blinded cluster-randomized controlled trial.
Methods: Twenty-three Norwegian rhythmic gymnastics clubs were randomized to an intervention group (12 clubs, 119 gymnasts) and a control group (11 clubs, 86 gymnasts). Included gymnasts had to be ≥12 years of age and training ≥3 days per week. The intervention group performed a targeted injury prevention exercise program for lower back, knees and hip/groin during training/warm-up for 8 months (November 2023-June 2024). The control group continued RG training as normal. The prevalence of overuse injuries in the targeted areas were measured monthly in both groups using the Oslo Sports Trauma Research Centre Questionnaire on Health Problems (OSTRC- H2).
Results: The prevalence of overuse injuries in the targeted areas were similar in the two groups: Odds ratio = 0.93 (95% CI 0.40 to 2.15); P=0.87 for intervention vs control.
Conclusions: The results suggest that a targeted injury prevention program alone is not enough to prevent overuse injuries in the knees, lower back and hip/groin among competitive Norwegian rhythmic gymnasts. Other measures to prevent overuse injuries (e.g load management, proper training planning and performing sport specific elements with correct technique) might be just as important as targeted exercises.
Trial registration number: NCT05506579; ClinicalTrials.gov
Keywords: Female athletes; Injury prevention; Overuse injuries; Rhythmic gymnastics
“Quality First”:
Poster presentation
Development of a Tool to Assess Movement Quality in Hop Tests
Dr. Heiner Baur (Bern University of Applied Sciences, School of Health Professions, Physiotherapy, 3008 Bern, Switzerland), Mr. Sandro Caminada (ALTIUS Swiss Sportmed Center AG, 4310 Rheinfelden, Switzerland), Ms. Marina Häberli (ALTIUS Swiss Sportmed Center AG, 4310 Rheinfelden, Switzerland), Mr. Moritz Mathieu-Kälin (Bern University of Applied Sciences, School of Health Professions, Physiotherapy, 3008 Bern, Switzerland), Ms. Mirjam Müller (Bern University of Applied Sciences, School of Health Professions, Physiotherapy, 3008 Bern, Switzerland), Ms. Melanie Weber (Bern University of Applied Sciences, School of Health Professions, Physiotherapy, 3008 Bern, Switzerland)
Abstract
Introduction: Hop tests are used to assess knee function but outcomes often reflect rather performance than movement quality, which is crucial for proper knee function.1
Objectives: The movement quality scoring tool “Quality First”, focusing on movement related risk factors for knee injury, was developed and quality criteria were assessed. Moreover, movement quality was correlated with performance and a comparison of real-time versus slow-motion analysis was executed.
Study Design: Cross-sectional study in a clinical setting.
Methods: 34 participants performed various hop tests and 2D-videos were evaluated using “Quality First”. Content validity was assessed from the perspective of professionals, for interpretability, classical test theory was employed. Cron-bach’s α was calculated to evaluate internal consistency. Intraclass correlation coefficients (ICC2,3), standard error of measurements (SEM) and minimal detectable changes (MDC) were analyzed to assess reliability. Hop performance (LimbSymmetry-Index, LSI) was correlated with the “Quality First” total score (Spearman) and Bland- Altman analysis was performed for method comparison (slow-motion, real-time).
Results: Content validity resulted in the final inclusion of single-leg hop for distance, vertical hop, and side hop test covering sagittal, vertical, and transversal plane. “Quality First” consists finally of 15 items on a 4-point scale and obtained a sufficient Cronbach’s α The interrater reliability showed ICC2s from 0.45–0.60, with SEMs ranging from 1.46-1.73 and MDCs from 4.06-4.80. Intrarater reliability revealed ICC3s from 0.73–0.85 with SEMs ranging from 0.89-1.09 and MDCs
84 83
from 2.47-3.01. No correlations between LSIs and “Quality First” were found (r=−0.1–0.02, p=0.65–0.93). Bland-Altman analysis revealed no systematic mean differences between real-time and slow-motion except for the vertical hop (0.8 points).
Conclusion: “Quality First” can be a promising and time-efficient tool to assess movement quality showing fair to good interrater- and good to excellent intrarater-reliability. Patient progress of movement quality in hop tests should be monitored in addition to performance.
Keywords: hop test, knee injury, movement quality, quality criteria
References
1. Kotsifaki A, Korakakis V, Whiteley R, et al. Measuring only hop distance during single leg hop testing is insufficient to detect deficits in knee function after ACL reconstruction: a systematic review and meta-analysis. Br J Sports Med. 2020;54(3):139-153. doi: 10.1136/bjsports-2018-099918
Reliability of two recently developed procedures assessing biological maturity by ultrasound imaging- A Pilot-Study.
Poster presentation
Ms. N. Hutmacher (Bern University of Applied Sciences, School of Health Professions, Physiotherapy, 3008 Bern, Switzerland), Dr J. Busch (Department of Diagnostic, Interventional and Pediatric Radiology, Inselspital, Bern University Hospital, University of Bern, 3010 Bern, Switzerland), Ms. E. Rueger (Department of Elite Sport, Swiss Federal Institute of Sport Magglingen, 2532 Magglingen, Switzerland), Dr. M. Romann (Department of Elite Sport, Swiss Federal Institute of Sport Magglingen, 2532 Magglingen, Switzerland), Dr. P. Eichelberger (Bern University of Applied Sciences, School of Health Professions, Physiotherapy, 3008 Bern, Switzerland)
Abstract
Substantial differences in the biological maturity of children of the same chronological age during puberty lead to inequalities in talent selection in youth sports, emphasizing the importance of considering the athlete’s biological maturity.1,2 Biological maturity is most commonly assessed on the basis of a radiography of the left hand and wrist, but ultrasound (US) could be advantageous, especially by avoiding ionizing radiation. The aims of this study were to assess the intra- and interrater reliability of two examiners with different expertise levels in an US-based assessment of five anatomical landmarks at the knee joint and the interrater reliability of an US-based calculation of the ossification ratio (OssR) of the distal medial femur. For the purpose of this pilot study, a cross-sectional design with two measurement time points was chosen. Twenty healthy female handball players between 10 and 17 years of age were recruited. Adolescents were excluded if they had any form of growth, musculoskeletal or neurological disorder. Epiphyseal closure at the landmarks was staged (stages 1-3). The reliability of the stages was analyzed using Cohen’s kappa (k). The OssR was calculated by dividing the diameter of the ossification center by the epiphy- seal diameter. The interrater reliability of the OssR was analyzed using the Bland-Altman method and intraclass correlation coefficients (ICC). Interrater and intrarater reliability for the stages ranged from k=0.69 to k=0.90 and from k=0.70 to k=1.0, respectively. For the OssR, an ICC of 0.930 and a minimal detectable change (MDC) of 0.030 were determined. In conclusion, the overall high inter- and intrarater reliability shows that US-based imaging has a high potential for use in youth sports. Due to several limitations, further research with a larger number and higher heterogeneity of subjects is needed for possible implementation of US in the field of sports.
Keywords: biological maturity; bone age; reliability; ultrasound; youth sport
References
1. Malina RM, Peña Reyes ME, Figueiredo AJ, et al. Skeletal age in youth soccer players: implication for age verification. Clin J Sport Med. 2010;20(6):469-474. https://doi.org/10.1097/JSM.0b013e3181f827ea
2. Vaeyens RM, Lenoir AM, Williams AM, et al. Talent Identification and Development Programmes in Sport. Sports Med. 2008;38(9):703-714. https://doi.org/10.2165/00007256-200838090-00001
85