I J S PT


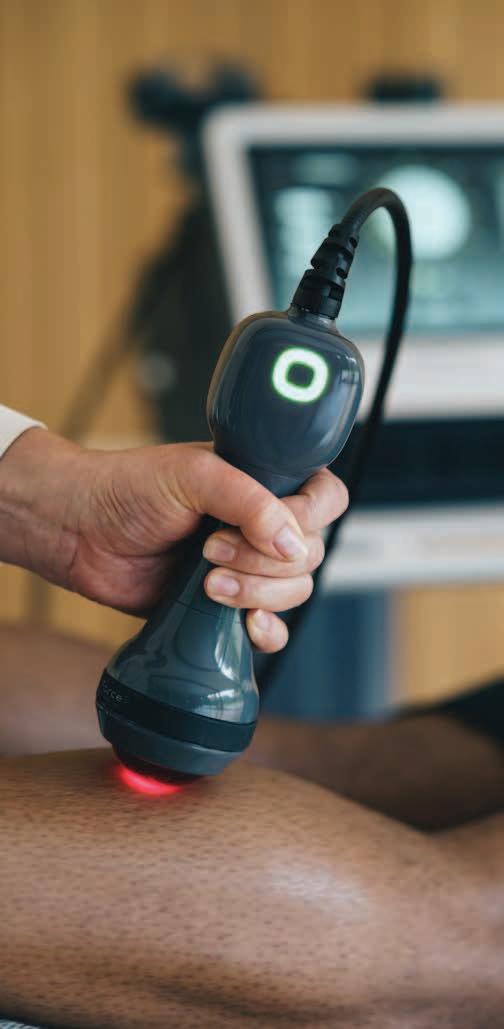
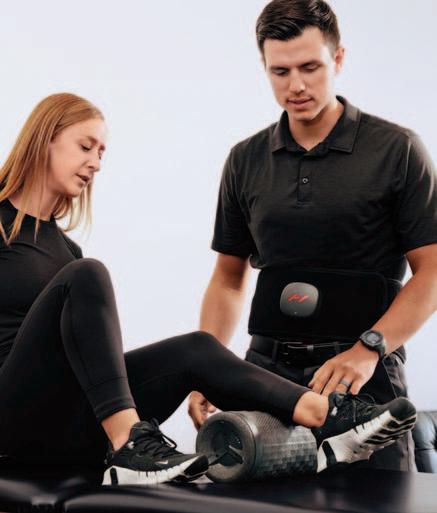
LightForce® Therapy Lasers empower you to treat soft tissue with confidence. Harnessing photobiomodulation (PBM)—a powerful form of light therapy—our lasers stimulate cellular metabolism to help treat muscle and joint pain from acute and chronic conditions.
Equipped with smart features like dosing recommendations, real-time visual and haptic feedback, and convenient portability, our range of therapy lasers combines a fusion of power with intelligence to enhance the patient and user experience. With the ability to reach deep tissues, LightForce lasers can cut the time needed by clinicians to treat patients—making light work of pain.
TRUSTED GLOBALLY
More than 250 professional and collegiate sports teams around the world trust LightForce Therapy Lasers to provide rehabilitation and pain management.
Scan the QR code to request a demo, or visit https://learn.chattanoogarehab.com/ijspt-journal-2024.
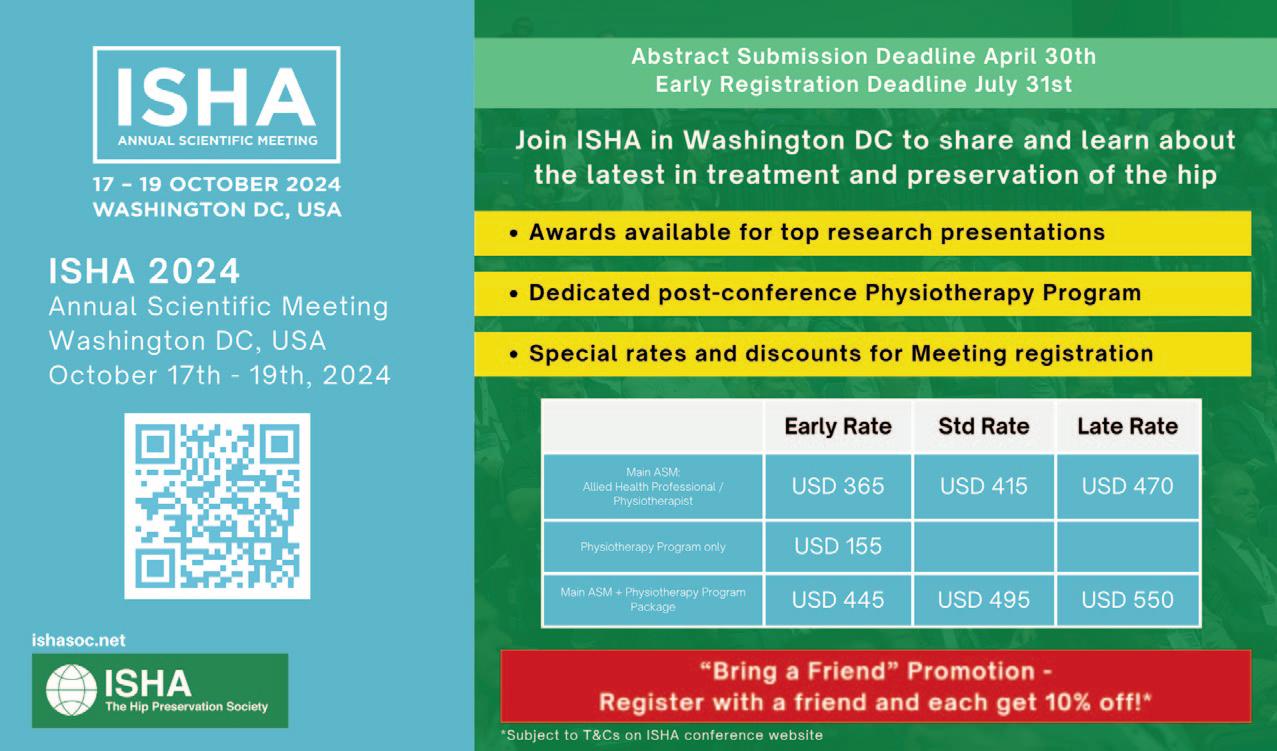

November 8, 2024 Bern, Switzerland
https://sportfisio.ch/sympo-2024/
Turner A Blackburn, APTA Life Member, AT-Ret, AOSSM-Ret President
Mary Wilkinson Executive Director
Michael Voight Executive Editor and Publisher
Joe Black, PT, DPT, SCS, ATC
Eric Fernandez
Jay Greenstein, DC
Skip Hunter, PT, ATC-Ret
Russ Paine, PT, DPT
Tim Tyler, PT, ATC
Sports Legacy Advisory Board
Turner A. Blackburn, PT, ATC
George Davies, PT, DPT, MEd, SCS, ATC, LAT, CSCS, PES, FAPTA
Terry Malone, PT, PhD
Bob Mangine, PT
Barb Sanders, PT, PhD
Tim Tyler, PT, ATC
Kevin Wilk, PT, DPT, FAPTA
Executive Editor/Publisher
Michael L. Voight, PT, DHSc, OCS, SCS, ATC, CSCS
Executive Director/Operations and Marketing
Mary Wilkinson
Editor in Chief
Barbara Hoogenboom, PT, EdD, SCS, ATC
Managing Editor
Ashley Campbell, PT, DPT, SCS, CSCS
Manuscript Coordinator
Casey Lewis, PTA, ATC
AMERICAN SPORTS MEDICINE INSTITUTE
Publisher
Contact Information
International Journal of Sports Physical Therapy 6011 Hillsboro Pike Nashville, TN 37215, US, http://www.ijspt.org
IJSPT is a monthly publication, with release dates on the first of each month.
ISSN 2159-2896
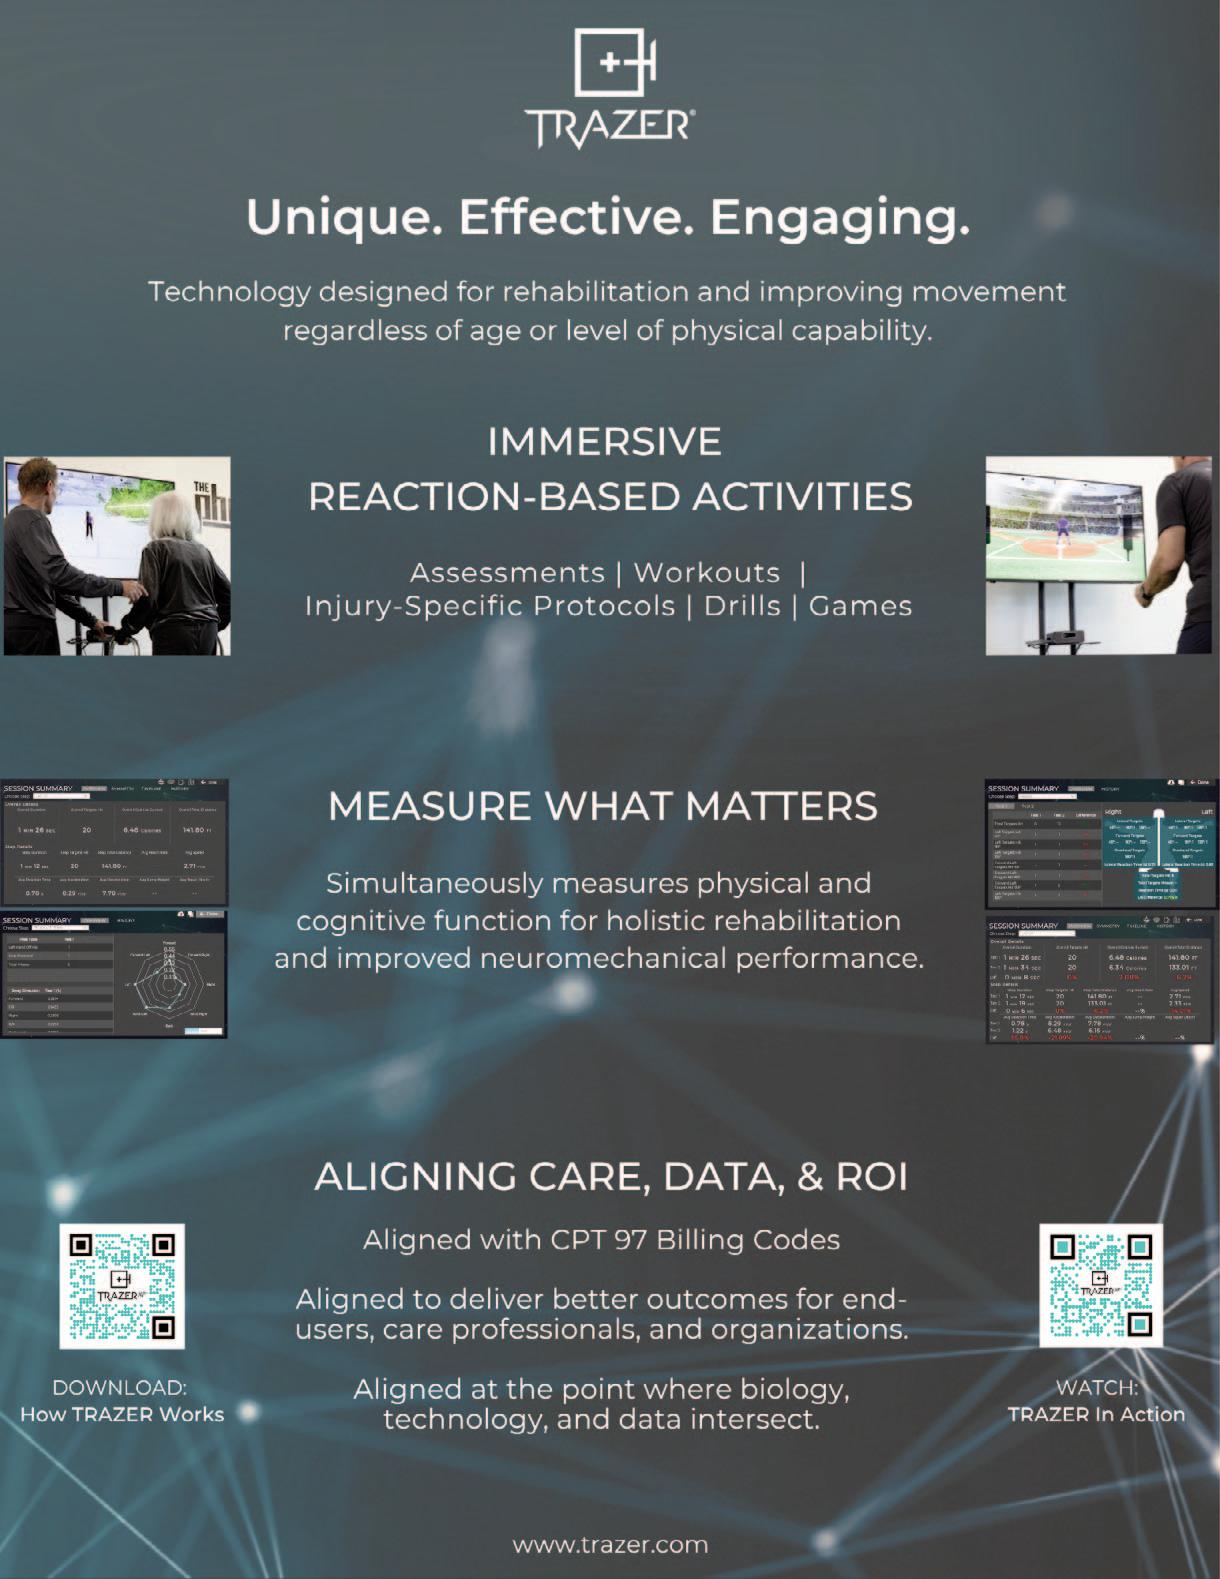
Underwriting Sponsor Genie Health
Founding Sponsors Enovis Exertools Hyperice Trazer Woodway
Platinum Sponsors ATI Elvation
Gold Sponsors Hawkgrips Kayezen Structure + Function Education Winback Partners
Northeast Seminars Academy of Human Movement
American Academy of Sports Physical Therapy
IJSPT is an official journal of the International Federation of Sports Physical Therapy (IFSPT). Countries with access to IJSPT as a member benefit. Reach us at www.ifspt.org.

IJSPT is an official journal of the ICCUS Society for Sports Rehabilitation. www.iccus.org


Stand out in your community with a diversified patient experience. Designed to improve outcomes, attract new patients, and increase revenue through insurance, cash-based services, and retail sales.
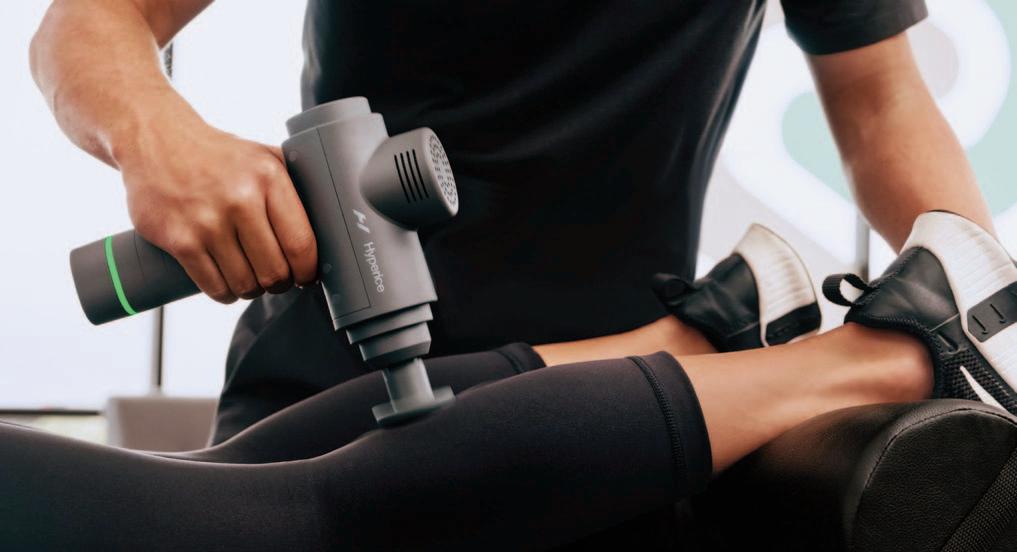
Gain access to a robust library of research, clinical education, and marketing tools including:
• On-demand clinical education courses
• Written treatment protocols
• Over 50 research studies specific to Hyperice technology
• Marketing tips and best practices including social media content, videos, and more
• Live trainings
Executive Editor/Publisher
Michael L. Voight, PT, DHSc, OCS, SCS, ATC, CSCS
Belmont University
Nashville, Tennessee – USA
Editor in Chief
Barbara Hoogenboom, PT, EdD, SCS, ATC
Grand Valley State University
Grand Rapids, Michigan - USA
Managing Editor
Ashley Campbell, PT, DPT, SCS, CSCS
Nashville Sports Medicine and Orthopaedic Center
Nashville, Tennessee – USA
Manuscript Coordinator
Casey Lewis, PTA, ATC
Nashville Sports Medicine and Orthopaedic Center
Nashville, Tennessee – USA
Executive Director/Marketing
Mary Wilkinson
Indianapolis, Indiana – USA
Editors
Robert Manske PT, DPT, Med, SCS, ATC, CSCS
University of Wichita Wichita, KS, USA
Terry Grindstaff, PT, PhD, ATC, SCS, CSCS
Creighton University Omaha, NE, USA
Phil Page PT, PhD, ATC, CSCS
Franciscan University DPT Program
Baton Rouge, LA, USA
Kevin Wilk PT, DPT, FAPTA
Clinical Viewpoint Editor Champion Sports Medicine Birmingham, AL, USA
International Editors
Luciana De Michelis Mendonça, PT, PhD UFVJM
Diamantina, Brazil
Colin Paterson PT, MSc PGCert(Ed), MCSP, RISPT, SFHEA
University of Brighton Brighton, England, UK
Chris Napier, PT, PhD
Clinical Assistant Professor
University of British Coumbia, Vancouver, BC, Canada
Nicola Phillips, OBE, PT, PhD, FCSP Professor School of Healthcare Sciences Cardiff University, Cardiff, Wales, UK
Associate Editors
Eva Ageberg, PT, PhD Professor, Lund University Lund, Sweden
Lindsay Becker, PT, DPT, SCS, USAW Buckeye Performance Golf Dublin, Ohio, USA
Keelan Enseki, PT, MS, OCS, SCS, ATC University of Pittsburgh Pittsburgh, PA, USA
John Heick, PT, PhD, DPT, OCS, NCS, SCS
Northern Arizona University Flagstaff, AZ, USA
Julie Sandell Jacobsen, MHSc, PhD
VIA University Aarhus, Denmark
RobRoy L. Martin, PhD, PT, CSCS
Duquesne University Pittsburgh, PA, USA
Andrea Mosler, PhD, FACP, FASMF
La Trobe Sport and Exercise Medicine Research Centre, School of Allied Health, Human Services and Sport, La Trobe University Melbourne, Victoria, Australia
Brandon Schmitt, DPT, ATC
PRO Sports Physical Therapy Scarsdale, NY, USA
Barry Shafer, PT, DPT
Elite Motion Physical Therapy Arcadia, CA, USA
Laurie Stickler, PT, DHSc, OCS
Grand Valley State University
Grand Rapids, MI, USA
Editorial Board
James Andrews, MD
Andrews Institute & Sports Medicine Center
Gulf Breeze, AL, USA
Amelia (Amy) Arundale, PT, PhD, DPT, SCS
Red Bull/Ichan School of Medicine
Salzburg, Austria/New York, NY, USA
Gary Austin, PT PhD
Belmont University Nashville, TN, USA
Roald Bahr, MD
Oslo Sports Trauma Research Center
Oslo, Norway
Lane Bailey, PT, PhD
Memorial Hermann IRONMAN Sports Medicine Institute
Houston, Texas, USA
Gül Baltaci, PT,Ph.D. Professor, CKTI, FACSM
Private Guven Hospital Ankara, Turkey
Asheesh Bedi, MD
University of Michigan
Ann Arbor, MI, USA
David Behm, PhD Memorial University of Newfoundland St. John's, Newfoundland, Canada
Barton N. Bishop, PT, DPT, SCS, CSCS Kaizo Clinical Research Institute Rockville, Maryland, USA
Mario Bizzini, PhD, PT Schulthess Clinic Human Performance Lab Zürich, Switzerland
Joe Black, PT, DPT, SCS, ATC Total Rehabilitation Maryville, Tennesse, USA
Turner A. "Tab" Blackburn, APTA Life Member, ATC-Ret, AOSSM-Ret NASMI Lanett, AL, USA
Lori Bolgla, PT, PhD, MAcc, ATC Augusta University Augusta, Georgia, USA
Matthew Briggs The Ohio State University Columbus, OH, USA
Tony Brosky, PT, DHSc, SCS Bellarmine University Louisville, KY, USA
Brian Busconi, MD UMass Memorial Hospital Boston, MA, USA
Robert J. Butler, PT, PhD St. Louis Cardinals St. Louis, MO, USA
Duane Button, PhD Memorial University St. Johns, Newfoundland, Canada
J. W. Thomas Byrd, MD Nashville Sports Medicine and Orthopaedic Center Nashville, TN, USA
Lyle Cain, MD Andrews Institute & Sports Medicine Center Birmingham, AL, USA
Gary Calabrese, PT, DPT Cleveland Clinic Cleveland, Ohio, USA
Meredith Chaput, PT, DPT, SCS Ohio University Athens, OH, USA
Rita Chorba, PT, DPT, MAT, SCS, ATC, CSCS United States Army Special Operations Command Fort Campbell, KY, USA
John Christoferreti, MD Texas Health Dallas, TX, USA
Richard Clark, PT, PhD Tennessee State University Nashville, TN, USA
Juan Colado, PT, PhD University of Valencia Valencia, Spain
Brian Cole, MD Midwest Orthopaedics at Rush Chicago, IL, USA
Ann Cools, PT, PhD
Ghent University Ghent, Belgium
Andrew Contreras, DPT, SCS Washington, DC, USA
George Davies, PT, DPT, MEd, SCS, ATC, LAT, CSCS, PES, FAPTA
Georgia Southern University Savannah, Georgia, USA
Pete Draovich, PT
Jacksonville Jaguars Footbal Jacksonvile, FL, USA
Jeffrey Dugas, MD Andrews Institute & Sports Medicine Center Birmingham, AL, USA
Jiri Dvorak, MD Schulthess Clinic Zurich, Switzerland
Todd Ellenbecker Rehab Plus Phoenix, AZ, USA
Carolyn Emery, PT, PhD University of Calgary Calgary, Alberta, Canada
Ernest Esteve Caupena, PT, PhD University of Girona Girona, Spain
Sue Falsone, PT, MS, SCS, ATC, CSCS, COMT Structure and Function Education and A.T. Still University Phoenix, Arizona, USA
J. Craig Garrison, PhD, PT, ATC, SCS Texas Health Sports Medicine Fort Worth, Texas, USA
Maggie Gebhardt, PT, DPT, OCS, FAAOMPT Fit Core Physical Therapy/Myopain Seminars Atlanta, GA and Bethesda, MD, USA
Lance Gill, ATC
LG Performance-TPI Oceanside, CA, USA
Phil Glasgow, PhD, MTh, MRes, MCSP Sports Institute of Northern Ireland Belfast, Northern Ireland, UK
Robert S. Gray, MS, AT Cleveland Clinic Sports Health Cleveland, Ohio, USA
Jay Greenstein, DC Kaizo Health Baltimore, MD, USA
Martin Hagglund, PT PhD
Linkoping University Linkoping, Sweden
Allen Hardin, PT, SCS, ATC, CSCS
University of Texas Austin, TX, USA
Richard Hawkins, MD
Professor of surgery, University of South Carolina
Adjunct Professor, Clemson University
Principal, Steadman Hawkins, Greenville and Denver (CU)
John D.Heick, PT, PhD, DPT, OCS, NCS, SCS
Northern Arizona University Flagstaff, AZ, USA
Tim Hewett, PhD
Hewett Consulting Minneapolis, Minnesota, USA
Per Hølmich, MD
Copenhagen University Hospital Copenhagen, Denmark
Kara Mae Hughes, PT, DPT, CSCS
Wolfe PT Nashville, TN, USA
Lasse Ishøi, PT, MSc
Sports Orthopedic Research Center
Copenhagen University Hospital Hvidovre, Denmark
Jon Karlsson, MD Sahlgrenska University Goteborg, Sweden
Brian Kelly, MD Hospital for Special Surgery New York, NY, USA
Benjamin R. Kivlan, PhD, PT, OCS, SCS Duquesne University Pittsburgh, PA, USA
Dave Kohlrieser, PT, DPT, SCS, OCS, CSCS
Ortho One Columbus, OH, USA
Andre Labbe PT, MOPT
Tulane Institute of Sports Medicine New Orleans, LA USA
Henning Langberg, PT, PhD University of Copenhagen Copenhagen, Denmark
Robert LaPrade, MD Twin Cities Orthopedics Edina, MN, USA
Lace Luedke, PT, DPT University of Wisconsin Oshkosh Oshkosh, WI, USA
Phillip Malloy, PT, PhD
Arcadia University/Rush University Medical Center Glenside, PA and Chicago, IL, USA
Terry Malone, PT, EdD, ATC, FAPTA University of Kentucky Lexington, KY, USA
Robert Mangine, PT University of Cincinnati Cincinnati, OH, USA
Eric McCarty, MD University of Colorado Boulder, CO, USA
Ryan P. McGovern, PhD, LAT, ATC Texas Health Sports Medicine Specialists Dallas/Fort Worth, Texas, USA
Mal McHugh, PhD
NISMAT
New York, NY, USA
Joseph Miller, PT, DSc, OCS, SCS, CSCS
Pikes Peak Community College Colorado Springs, CO, USA
Havard Moksnes, PT PhD
Oslo Sports Trauma Research Center Oslo, Norway
Andrew Murray, MD, PhD
European PGA Tour Edinburgh, Scotland, UK
Andrew Naylor, PT, DPT, SCS
Bellin Health
Green Bay, WI, USA
Stephen Nicholas, MD NISMAT New York New York, NY, USA
John O'Donnel, MD
Royal Melbourne Hospital Melbourne, Australia
Russ Paine, PT McGovern Medical School Houston, TX, USA
Snehal Patel, PT, MSPT, SCD
HSS Sports Rehabilitation Institute New York, NY, USA
Marc Philippon, MD
Steadman-Hawkins Clinic Vail, CO, USA
Kevin Plancher, MD, MPH, FAAOS
Plancher Orthopedics and Sports Medicine
New York, NY USA
Marisa Pontillo, PT, PhD, DPT, SCS
University of Pennsylvania Health System Philadelphia, PA, USA
Matthew Provencher, MD
Steadman Hawkins Clinic Vail, CO, USA
Charles E. Rainey, PT, DSc, DPT, MS, OCS, SCS, CSCS, FAAOMPT
United States Public Health Service Springfield, MO, USA
Alexandre Rambaud, PT PhD Saint-Etienne, France
Carlo Ramponi, PT Physiotherapist, Kinè Rehabilitation and Orthopaedic Center Treviso, Italy
Michael Reiman, PT, PhD Duke University Durham, NC, USA
Mark F. Reinking, PT, PhD, SCS, ATC Regis University Denver, CO, USA
Mark Ryan, ATC Steadman-Hawkins Clinic Vail, CO, USA
David Sachse, PT, DPT, OCS, SCS USAF San Antonio, TX, USA
Marc Safran, MD Stanford University Palo Alto, CA, USA
Alanna Salituro, PT, DPT, SCS, CSCS New York Mets Port Saint Lucie, FL, USA
Mina Samukawa, PT, PhD, AT (JSPO) Hokkaido University Sapporo, Japan
Barbara Sanders, PT, PhD, FAPTA, Board Certified Sports Physical Therapy Emeritus Professor and Chair, Department of Physical Therapy Texas State University Round Rock, TX, USA
Felix “Buddy” Savoie, MD, FAAOS Tulane Institute of Sport Medicine New Orleans, LA, USA
Teresa Schuemann, PT, DPT, ATC, CSCS, Board Certified Specialist in Sports Physical Therapy Evidence in Motion Fort Collins, CO, USA
Timothy Sell, PhD, PT, FACSM Atrium Health Musculoskeletal Institute Charlotte, NC, USA
Andreas Serner, PT PhD
Aspetar Orthopedic and Sports Medicine Hospital Doha, Qatar
Ellen Shanley, PT, PhD ATI Spartanburg, SC, USA
Karin Silbernagel, PT, PhD University of Delaware Newark, DE, USA
Holly Silvers, PT, PhD Velocity Physical Therapy Los Angeles, CA, USA
Lynn Snyder-Mackler, PT, ScD, FAPTA STAR University of Delaware Newark, DE, USA
Alston Stubbs, MD Wake Forest University Winston-Salem, NC, USA
Amir Takla, B.Phys, Mast.Physio (Manip), A/Prof
Australian Sports Physiotherapy The University of Melbourne Melbourne, Australia
Charles Thigpen, PhD, PT, ATC ATI
Spartanburg, SC, USA
Steven Tippett, PT, PhD, ATC, SCS Bradley University Peoria, IL, USA
Tim Tyler, PT, ATC NISMAT New York, NY, USA
Timothy Uhl, PT, PhD, ATC University of Kentucky Lexington, KY, USA
Bakare Ummukulthoum, PT University of the Witswatersrand Johannesburg, Gauteng, South Africa
Yuling Leo Wang, PT, PhD Sun Yat-sen University Guangzhou, China
Mark D. Weber, PT, PhD, SCS, ATC Texas Women’s University Dallas, TX, USA
Richard B. Westrick, PT, DPT, DSc, OCS, SCS US Army Research Institute Boston, MA, USA
Chris Wolfe, PT, DPT Belmont University Nashville, TN, USA
Tobias Wörner, PT, MSc Lund University Stockholm, Sweden
VOLUME 19, NUMBER 8
PAGE TITLE
ORIGINAL RESEARCH
942 Assessing the Relationship of Psychological Sport Readiness, Single-leg Vertical Jump, and NonSagittal Single-Leg Hops to Quadriceps Strength After Anterior Cruciate Ligament Reconstruction. Kuwik PA, Mason JS, Benedict TM, et al.
956 Hop Distance Symmetry Moderately Reflects Knee Biomechanics Symmetry During Landing But Not For Controlled Propulsions.
Di Paolo S, Ito N, Seymore KD, et al.
965 Shoulder Pain in Competitive Swimmers: A Multi-Site Survey Study.
Stirling BD, Sum JC, Baek L, et al.
976 Return to Play Assessment After Lateral Ankle Sprains – German Male Elite Youth Football (Soccer) Academy Baseline Data. Flore Z, Welch G, Bloch H.
985 Lower-Quarter Y-Balance Test Differs by Age: Younger Athletes May Not Be Generalized to High School-Aged Counterparts.
McGinley JJ, Randoing B, Saleem L, et al.
997 Reliability of Goniometric Techniques for Measuring Hip Flexor Length Using the Modified Thomas Test.
Eimiller K, Janes B, Smith M, et al.
1003 Acute Effects of Handheld Vibration Massage on Posterior Shoulder Soft Tissues.
Imai T, Nagamatsu T, Yoshizato Y, et al.
CASE SERIES
1012 A Pre and Postnatal Physical Therapy Protocol for Recreational Athletes: A Case Series. Selman R, Early KS
1020 Point of Care Ultrasound Guided Management of Lateral Ankle Sprains: A Case Series. Bush ML, Umlauf JA, Pickens BB, et al.
CASE REPORT
1034 Rehabilitation of an Upper Extremity Weight Bearing Athlete with an Ulnar Collateral Ligament Injury: A Case Report.
Corbitt AB, Bandy WD.
CLINICAL VIEWPOINT
1044 Quadriceps Activation After Anterior Cruciate Ligament Reconstruction: The Early Bird Gets the Worm!
Moiroux-Sahraqui A, Forelli F, Mazeas J, Rambaud AJM, Bjerregaard A, Riera J.

Kuwik P, Florkiewicz E, Benedict T, Mason J, Morris J, Crowell M. Assessing the Relationship of Psychological Sport Readiness, Single-leg Vertical Jump, and NonSagittal Single-Leg Hops to Quadriceps Strength After Anterior Cruciate Ligament Reconstruction. IJSPT. Published online August 2, 2024:942-955. doi:10.26603/001c.121597
Paul Kuwik1a , Erin Florkiewicz1,2 , Timothy Benedict1 , John Mason1 , Jamie Morris1 , Michael Crowell1
1 Baylor University – Keller Army Community Hospital Division 1 Sports Physical Therapy Fellowship, 2 Doctor of Philosophy in Health Sciences Program, Rocky Mountain University of Health Professions, Provo, Utah
Keywords: Anterior Cruciate Ligament Reconstruction, Hop Tests, Psychological Readiness, Quadriceps Strength https://doi.org/10.26603/001c.121597
International Journal of Sports Physical Therapy
Background
Limitations exist with current ACLR functional testing assessments that may be mitigated by including single-leg multi-directional testing.
Hypothesis/Purpose
To compare Anterior Cruciate Ligament-Return to Sport after Injury Scale (ACL-RSI) scores, limb symmetry index (LSI) of the single-leg vertical jump (SLVJ), single-leg medial rotation hop (SLMRH), single-leg lateral hop (SLLH), and isokinetic quadriceps strength between participants with an ACLR and healthy controls and assess predictors of quadriceps strength asymmetry It was hypothesized that ACL-RSI scores and LSIs for all tests would differ between ACLR and healthy control groups and within the ACLR group a strong correlation would exist between all outcome measures and quadriceps strength.
Study Design
Cross-Sectional Study
Methods
Twenty-six participants with an ACLR (median 13 months after surgery) and twenty-six matched healthy controls were recruited to participate in this study Performance was assessed via SLVJ, SLMRH, SLLH, and isokinetic quadriceps strength. Between-group comparisons were made with independent t-tests and Mann-Whitney U test. Within the ACLR group, bivariate correlation and multivariate regression analysis were performed to assess the relationship between the outcome measures and quadriceps strength asymmetry.
Results
Significant between-limb differences were only identified in the ACLR group (p< 0.05): SLVJ LSI: 88.5%, SLMRH LSI: 93.6%, SLLH LSI: 92.7%, quadriceps strength LSI 80.9%83.9%, which were significantly lower (p <0.05) than the healthy control group. Within the ACLR group, a moderate-strong significant (p < 0.05) correlations existed with quadriceps strength and SLVJ (r=0.44-0.65), SLMRH (r =0.43-0.83), and SLLH (r=0.54-0.63); while ACL-RSI had a weak non-significant (p > 0.05) correlation with quadriceps strength (r= 0.12-0.30).
CORRESPONDING AUTHOR:
a
Paul A Kuwik, PT, DSc Baylor University – Keller Army Community Hospital Division 1 Sports Physical Therapy Fellowship 900 Washington Road, West Point, NY, 10966, USA Paul.kuwik@gmail.com; (724) 544-8475
Single-leg multidirectional test LSIs were less in ACLR participants than matched healthy controls and all were directly related to quadriceps strength. Psychological readiness to return to sport was not related to quadriceps strength.
Anterior cruciate ligament (ACL) tears are devastating injuries to both civilian athletes and military service members.1 Due to the physical occupation demands military service members have a ten times greater incidence of ACL injuries than the general population.2 Most athletes and military service members with ACL tears elect to undergo anterior cruciate ligament reconstruction (ACLR).3 Despite evolving surgical procedures and post-operative rehabilitation, 2 -38% of athletes rupture their ACLR graft,4‑6 up to 19% have a contralateral ACL rupture,7 and only 55% return to competitive sport.8 Military personnel have similar challenges as only 47% of service members return to full duty status after an ACLR.9
A crucial decision point during ACLR rehabilitation is determining when to return the athlete to sport or the service member to full military duty Numerous factors are incorporated into this decision including type of sport/military occupation, prior medical history, and time from surgery, as well as psychological readiness, strength, and functional objective assessments.10 These assessments are essential as post-ACLR patients may have neuromuscular deficits for years11,12 and up to 24% of athletes do not return to sports due to fear of re-injury 13
Quadriceps strength is a standard post-ACLR assessment with isokinetic dynamometer being the gold standard for assessing quadriceps strength.14 Athletes with symmetric quadriceps strength after ACLR have a decreased injury risk.15 As isokinetic dynamometers are expensive, clinicians frequently utilize field expedient single-leg sagittal hops (SLSH) solely or in addition to quadriceps strength assessments to quantify lower extremity strength and functional asymmetry 16,17 Test results are typically displayed as a ratio of the operated limb to the non-operated limb, referred to as a limb symmetry index (LSI). A commonly employed LSI cutoff is ≥ 90% before an athlete may be cleared to return to sports,15,18 Nine months after ACLR surgery quadriceps strength LSI can range from 37% to 93%.19‑22 and SLSH LSI can range from 52% to 98%.19,22,23
Clinicians commonly utilize patient-reported outcomes such as the Anterior Cruciate Ligament-Return to Sport After Injury (ACL-RSI) to assess psychological return to sport readiness after ACLR.24 The ACL-RSI has been explicitly designed for and validated within an ACLR population24 with scores ≥65 indicating a favorable prognosis to return to the same level of sports two years after ACLR.25
Several limitations exist with the current ACLR functional assessments. Only 23-43% of athletes pass the test batteries post-ACLR and passing may not be associated with lower re-injury rates.17 Furthermore, Webster et al. reported an increased risk of a contralateral ACL injury for those who passed return to sport testing.16 The commonly utilized SLSH may overestimate quadriceps strength
and lower extremity symmetry 19‑21,26,27 Due to high re-injury rates, ambiguous validity of return to sport test batteries, and individual test limitations, additional research is needed to optimize ACLR functional assessments.
Recent research has suggested that multidirectional single-leg testing such as the single-leg vertical jump (SLVJ), single-leg medial rotation hop (SLMRH), and single-leg lateral hop (SLLH) warrant inclusion in ACLR return to sport assessments. The SLVJ has a greater association with quadriceps strength than the SLSH,19,23 identifies functional impairments in ACLR patients one year from surgery,28 and correlates with the ACL-RSI.29 The SLMRH can identify asymmetry in ACLR patients six months after surgery.30 The SLLH can identify asymmetry in ACLR patients twelve months from surgery,31 and is associated with quadriceps strength.32 It remains unknown whether all of these single-leg multidirectional tests are associated with validated confidence or quadriceps strength measures.
The purpose of this study was to compare ACL-RSI scores and LSIs of the SLVJ, SLMRH, SLLH, and quadriceps strength between two groups of United States Military Academy (USMA) Cadets: those with an ACLR within 10 to 38 months and a healthy control group. The time from ACLR was chosen to be consistent with previous research conducted at our institute. The second aim was to examine if relationships exist among quadriceps strength LSI and ACL-RSI, and LSIs of the SLVJ, SLMRH, and SLLH in USMA cadets with a recent ACLR. It was hypothesized that ACLRSI scores and LSIs for all tests would differ between the ACLR and healthy control groups. It was also hypothesized that within the ACLR group, a strong correlation would exist between quadriceps strength LSI and SLVJ LSI, SLMRH LSI, SLLH LSI, and ACL-RSI.
STUDY DESIGN
This was a case-control study among United States Military Academy (USMA) Cadets. A-priori power analysis using G power software (Heinrich-Heine Universität, Düsseldorf, Germany) indicated a necessary sample size of twenty-six participants in both groups for the first aim (effect size = 0.7 from prior research conducted by the researchers’ institute,33 α = 0.05, power= 0.8, two-tailed). For the second aim, twenty-six ACLR participants were required (effect size = 0.39 from prior research conducted by the researchers’ institute,33 α = 0.05, four predictors, power = 0.8, two-tailed). The Naval Medical Center Portsmouth Institutional Review Board approved this study All participants provided written informed consent before data collection.
USMA Cadets with an ACLR prior to or after matriculation to USMA were invited to participate. All participants in the ACLR group had completed or were finishing their rehabilitation and were cleared for testing. ACLR group inclusion criteria consisted of ages 18-27 years (17 years if an emancipated Cadet), fluent in English, a history of a unilateral ACLR within 10 to 38 months to be consistent with prior research conducted at the researachers’ institute,33 and cleared by a medical provider to perform jump, hop, and strength testing. Potential participants were excluded if they had: a history of bilateral ACLR, any lower extremity surgery other than concomitant ACLR procedures (i.e. meniscal repair), a lower extremity injury within the prior six months, were currently pregnant, or had a medical condition that would preclude them from participating. Healthy control group members were matched based on biological sex, height, weight, and collegiate athletic skill level to the ACLR participants. Healthy control group inclusion criteria consisted of ages 18-27 years (17 if an emancipated Cadet) and fluent in English. Participants were excluded if they had: a history of a lower extremity injury within six months, any lower extremity surgery, were currently pregnant, or had a medical condition that would preclude them from participating.
Participants wore their own athletic clothes and athletic shoes. All data were collected on a single visit. After consenting, all participants completed intake documentation: demographic information, collegiate athletic skill level, surgical information, and the ACL-RSI. Before testing, all participants performed a warm-up on a stationary bicycle for five minutes at a low, self-determined intensity.34 They were also offered an optional non-standardized stretching or foam rolling period of five minutes.34 Participants completed testing in a standardized order ([1] SLVJ, [2] SLMRH, [3] SLLH, and [4] isokinetic quadriceps strength testing). Before performing the SLVJ, SLMRH, and SLLH, the examiner provided verbal instructions on how to perform the task. Alternating between limbs, each participant performed three practice repetitions per limb, and then three successful trials per limb. Each test commenced with the non-operated or non-dominant limb. The participant’s dominant limb was defined by their preferred limb to kick a ball.35 For the SLVJ, SLLH, and SLMRH a thirty-second rest period was provided between test repetitions.36
ANTERIOR CRUCIATE LIGAMENT-RETURN TO SPORT AFTER INJURY (ACL-RSI)
The ACL-RSI is a twelve-question questionnaire scored from 0 to 100.37 Greater scores indicate a positive psychological response for sport resumption following ACLR.24 Nine months after surgery, ACLR patients typically have an ACL-RSI score of 50-7229,38 and scores <47 indicate a decreased likelihood of returning to sports.24,38
The SLVJ was performed on the commercially available Just Jump System (JPS, Probotics Inc, Huntsville, AL, USA). The Just Jump system is a portable, inexpensive, valid, and reliable tool (intrasession intraclass correlation coefficient [ICC]reliability of 0.90-0.92 compared to a three-camera motion analysis system)39 that calculates jump height from flight time between foot contacts.40 Participants were instructed to stand on a single-leg, perform a maximum countermovement single-leg vertical jump, use their arms when jumping, and land on the jumping leg. Tests were excluded and reperformed if the participant excessively flexed their hips, any part of their foot landed off the mat, lost their balance, or their hands or the contralateral limb touched the floor.
The SLMRH is a reliable assessment (ICC reliability of 0.930.95) of functional performance following ACLR.30 Participants were instructed to stand on a single-leg with the medial aspect of their foot perpendicular to the direction of travel, perform a maximum hop while rotating 90 ° in the medial direction, allowing use of their arms when performing the hop, and land on the jumping leg. The distance was measured from the medial aspect of the foot on the starting line to the participant’s toes at landing. The test was excluded and reperformed if the participant lost their balance, their hands or the contralateral limb touched the floor, or > 10 ° difference in the direction the participant’s foot should be pointing.
The SLLH is also a reliable assessment (ICC reliability of 0.91-0.95)41 of functional performance after ACLR.31 Participants were instructed to stand on a single-leg with the lateral aspect of their foot perpendicular to the hop direction, perform a maximum single-leg lateral hop, use their arms when performing the hop, and land on the jumping leg. The distance was measured from the lateral aspect of the foot on the starting line to the lateral aspect of the participant’s foot at landing. The test was excluded and reperformed if the participants lost their balance, either of their hands or the contralateral limb touched the floor, or > 10 ° difference in the direction the participant’s foot should be pointing.
Maximum isokinetic strength testing was performed with the Cybex HUMAC dynamometer Model 502140 (CSMi, Stoughton, MA, USA) or Biodex dynamometer (Biodex Medical Systems, Shirley, NY, USA). Both provide reliable assessments of quadriceps strength and present similar values (ICC reliability 0.88-0.92).42 Participants were seated and secured with straps over their torso and thigh, hips flexed to approximately 90 ° , knees flexed to approximately 90 ° , femoral condyles of the tested limb aligned with the ro-
tation axis of the torque meter, and straps over their legs. For familiarization, the participants performed three submaximal knee extension/flexion repetitions. Participants rested for one minute after familiarization and between each strength test which consisted of five maximum consecutive concentric contractions of knee extension and flexion. Isokinetic strength was tested at angular velocities of 60° , 180 ° , and 300 ° per second. Participants were provided with standardized vigorous verbal encouragement.
The final analysis utilized the average score (height or distance) for each hop/jump test and the maximum peak quadriceps torque for each isokinetic angular velocity. Quadriceps torque was normalized to the participant’s body mass. For ACLR participants, an LSI was calculated for each test with the following formula43:
LSI was calculated for healthy participants with the following formula for each test44:
Normality was assessed using the Shapiro-Wilk test. The group differences in demographic data, single-leg multidirectional tests, ACL-RSI, and quadriceps strength were analyzed using chi-square, Fischer’s exact test, independent t-test, or Mann-Whitney U test with two tails. Pearson’s product correlation coefficients were calculated to investigate association between time from surgery and all LSIs for SLVJ, SLMRH, SLLH, and quadriceps strength. Spearman correlation was calculated to investigate association between the ACL-RSI and the strength and functional assessments. The strength of associations was determined as weak: < 0.3, moderate: ≥ 0.3 to < 0.5: and strong ≥ 0.5.45
A priori, it was determined to enter each independent variable (ACL-RSI, SLVJ LSI, SLMRH LSI, and SLLH LSI) with the dependent variable being quadriceps strength (for each angular velocity) into multivariable backward stepwise linear regression models. Multicollinearity and model diagnostics were assessed for each final model. α = 0.05 was used for all statistical tests. All statistical analyses were performed with SPSS software (version 28.0.1.1 for Windows; SPSS, Chicago, IL, USA).
Participant characteristics are presented in Table 1 No significant differences were found in biological sex, collegiate athletic skill, age, height, weight, and body mass index between the ACLR and healthy control groups. The median time from surgery for the ACLR group was 13.0 months.
Functional and isokinetic quadriceps testing outcomes for participants in both groups are presented in Table 2 For the ACLR group, the surgical limb scored significantly (p< 0.001) less than the non-surgical limb for all singleleg multidirectional and strength tests. No significant between-limb differences were identified within the healthy
control group. The healthy control group had significantly greater ACL-RSI scores (p <0.001) and greater limb symmetry on the SLVJ (p < 0.001), SLMRH (p= 0.016), SLLH (p< 0.001), and quadricep strength (p<0.05) than the ACLR group. The non-surgical limb for the ACLR group was stronger compared to the non-dominant limb of the healthy control group but was not statistically significantly different (p> 0.05). Sub-group analysis within the ACLR group for time from surgery, athletic group, gender, graft type, and meniscal procedure did not identify a significant difference between sub-groups.
Correlation coefficients between the ACL-RSI, single-leg multidirectional test LSI, and quadriceps strength LSI for the ACLR group are shown in Table 3 The SLVJ LSI (r: 0.44-0.67) (Figure 1), SLMRH LSI (r values range from 0.43-0.83) (Figure 2), and SLLH LSI (r: 0.54-0.63) (Figure 3) all had a significant positive moderate-strong correlation with quadriceps strength LSI (p< 0.05). ACL-RSI did not have a significant correlation with quadriceps strength LSI. Time from surgery had a moderate-strong significant correlation with quadriceps strength LSI (r: 0.41-0.60) (p<0.05).
Table 4 displays the results of the multiple regression analysis. A priori (Model 1) only the ACL-RSI, SLVJ LSI, SLMRH LSI, and SLLH LSI were entered into the backwards regression analysis for each quadriceps isokinetic angular velocity LSI. As a significant correlation exists between time from surgery and quadriceps strength LSI, the analysis was repeated with time from surgery as an additional factor (Model 2). For Model 1, only one variable was retained (SLMRH LSI or SLLH LSI) for each isokinetic velocity LSI, accounting for 31.6% to 68.2% of the model variance. For Model 2 there was no change for extension 60º/sec LSI; however, for extension 180º/sec LSI and 300 º/sec LSI time since from surgery increased the explained variance from 46.7% to 57.7% and 31.6% to 62.9%.
Only four ACLR participants achieved ≥ 90% LSI on all tests. The proportion of ACLR participants who achieved the ≥ 90% LSI cutoff was greater for the single-leg multidirectional tests than for the quadriceps strength tests. Table 5 displays the results of the SLVJ LSI and SLMRH LSI compared to the reference standard of quadriceps extension 60º/sec with ≥ 90% LSI. Both tests over-estimated quadriceps strength symmetry; however, the SLVJ only had four false-negatives for quadriceps strength symmetry compared to nine for the SLRMH. This contributes to the greater sensitivity in detecting quadriceps strength asymmetry with the SLVJ (73.3%) compared to the SLMRH (40.0%) (Table 6).
This study assessed the ability of the SLVJ, SLMRH, SLLH, and quadriceps strength to detect single-leg asymmetries between ACLR participants and healthy controls. The second aim examined the relationship between ACL-RSI, SLVJ LSI, SLMRH LSI, and SLLH LSI to quadriceps strength LSIs. The results partially confirmed the hypotheses. The ACLRSI, SLVJ, SLMRH, SLLH, and quadriceps strength testing differentiated between ACLR participants and healthy con-
Table 1. Participant characteristics
from Surgery, months (median, interquartile range)
Repair (Yes)
Abbreviations: ACLR, Anterior Cruciate Ligament Reconstruction; SD, standard deviation; BMI, body mass index; BTB, bone-patellar tendon-bone autograft; HS, hamstring autograft; NCAA, National Collegiate Athletic Association; QT quadriceps tendon autograft trols; however, only the SLVJ LSI, SLMRH LSI, and SLLH LSI were associated with quadriceps strength asymmetry Functional assessments consistently overestimate the strength present in the ACLR participants. In the regression analysis, time from surgery and the SLMRH LSI or SLLH LSI were the only retained factors to predict quadriceps strength asymmetry when accounting for the other variables. This is the first study to assess the association between the SLMRH and quadriceps strength asymmetry and identify single-leg multidirectional asymmetries in a military population after an ACLR. Additionally, these results contribute to the overall knowledge of single-leg multidirectional tests. Single-leg hop and jump asymmetries were identified in the ACLR participants (median 13 months from surgery): SLVJ LSI of 88.5%, SLMRH LSI of 93.6%, and SLLH LSI of 92.7%. These results are consistent with prior ACLR research that identified an SLVJ LSI of 83.4%-90.4%,19,23,29,31 SLMRH LSI of 86.6%,30 and SLLH LSI of 82.2%-87.5%.31,46 Those results are similar to the current results despite several study design differences: most studies had ACLR participants only with HS autografts while only two (8%) of the ACLR participants in the current study had an HS autograft and most prior research had subjects six to nine months compared to the current study that had a median time of 13 months from surgery 19,29‑31,46,47 The ability of the SLVJ, SLMRH, and SLLH to identify single-leg asymmetries in ACLR patients up to 38 months from surgery and with different graft types indicates that these tests warrant consideration as part of ACLR functional testing batteries. Only four of the twenty-six ACLR participants (15%) achieved an LSI threshold of at least 90% for all strength and functional tests. A greater proportion of ACLR participants achieved a 90% LSI for the strength than the functional tests; however, the SLVJ had a greater diagnostic ability to rule out quadriceps asymmetry than the SLMRH (sensitivity of 73.3% vs 40.0%). The results of the current study are consistent with a meta-systematic review that
identified that only 23% of individuals could pass the test batteries with similar LSI thresholds.16 The finding that ACLR participants have greater single-leg functional than quadriceps strength symmetry is consistent with prior research.46,48,49 This study is the first to investigate this for a greater range of isokinetic velocities and with three singleleg multi-directional movements.
Following ACLR, quadriceps muscle atrophy is common,50 therefore a goal of ACLR rehabilitation is to improve quadriceps strength which may reduce the risk of re-injury 15 As most clinicians do not possess expensive dynamometers51 they must rely upon other assessments such as single-leg hops to identify and quantify quadriceps strength asymmetry 16 Moderate -strong correlations (p > 0.05) were identified between quadriceps strength asymmetry and the single-leg multidirectional tests, which explain up to 68% of quadriceps strength asymmetry variance. When time from surgery was included in the regression analysis, the explained variance increased by another 10.0-31.3% for the faster quadriceps isokinetic velocities. The results are consistent with prior research identifying a moderate-strong correlation between SLVJ height and quadriceps strength19,29,48,52 and a significant correlation between SLLH and quadriceps strength.46 Within our study, ACLR participants with QT autographs tended to have weaker quadriceps strength compared to ACLR participants with BTB grafts (86.9% compared to 74.7% for quadriceps isokinetic velocity of 60 º/sec, p =0.351). This is consistent with observations from the authors’ clinic that patients with QT often have persistent quadriceps activation deficits. After ACLR, patients with QT autografts may have quadriceps neuromuscular inhibition compared to those with HS and BTB autografts,53 which may result in longterm muscle fiber type changes.50 A recent meta-analysis identified that patients with QT grafts may have similar strength outcomes to those with BTB grafts, but strength deficits persist for 24 months.54 Future research may better
Table 2. Anterior cruciate ligament return to sport injury scale, single-leg multidirectional tests, and quadriceps strength results
Abbreviations: ACL-RSI, Anterior Cruciate Ligament-Return to Sport after Injury; ACLR, anterior cruciate ligament reconstruction; LSI, limb symmetry index; SLLH, single-leg lateral hop; SLMRH, single-leg medial rotation hop; SLVJ, single-leg vertical jump
examine this relationship to better inform research strategies.
The results of this study indicated that despite the SLVJ, SLMRH, and SLLH possessing a moderate-strong correlation with quadriceps strength those assessments may overestimate quadriceps strength symmetry in ACLR patients. Despite the SLMRH possessing the largest correlation magnitude with quadriceps strength, the SLMRH has lower sensitivity than the SLVJ in detecting quadriceps strength asymmetry. Therefore, the SLVJ may be a more useful screening tool than the SLMRH to rule out quadriceps strength asymmetry. Similarly, researchers have identified the SLSH has a moderate-strong correlation with quadriceps strength but may overestimate quadriceps strength19, 43 as SLSH improves faster than quadriceps strength.43,55 These findings have stimulated researchers to investigate the merit of including multidirectional single-leg tests in post-ACLR functional assessments.19 The SLVJ may be a better assessment of knee function which contributes to approximately a third of SLVJ height and only an eighth of SLSH distance.56 Limited biomechanical research specif-
ically for the hip exists for the SLMRH and SLLH.41 As the current study illustrates the value of single-leg multidirectional tests in ACLR functional assessments, future biomechanical research should examine lower extremity muscle and joint kinetics for both the SLLH and SLMRH.
Interestingly, as the speed of quadriceps isokinetic contraction increased, the magnitude of the correlation between SLVJ LSI and quadriceps strength LSI decreased. This is counterintuitive as theoretically lower isokinetic quadriceps angular velocities are associated with maximal muscle strength, while higher velocities are associated with power movements such as a vertical jump.57 Previous research on ACLR participants has identified that as quadriceps isokinetic velocity increased the strength of the correlation between SLVJ jump height and peak quadriceps torque increased.19 Research studies with healthy individuals have revealed conflicting results. Faster isokinetic velocities increased the magnitude of correlation between jump height and quadriceps peak torque,58 as isokinetic speed increased to 300 º/sec the correlation magnitude between jump height and quadriceps peak torque decreases59 and a sig-
Table 3. Correlation coefficients (ACLR group)
Pearson correlation coefficients, except for ACL-RSI, which are Spearman correlations
Abbreviations: ACL-RSI, Anterior Cruciate-Ligament Return to Sport after Injury; LSI, limb symmetry index; SLLH, single-leg lateral hop; SLMRH, single-leg medial rotation hop; SLVJ, single-leg vertical jump
*Correlation is significant at the 0.05 level (2-tailed)
**Correlation is significant at the 0.01 level (2-tailed)
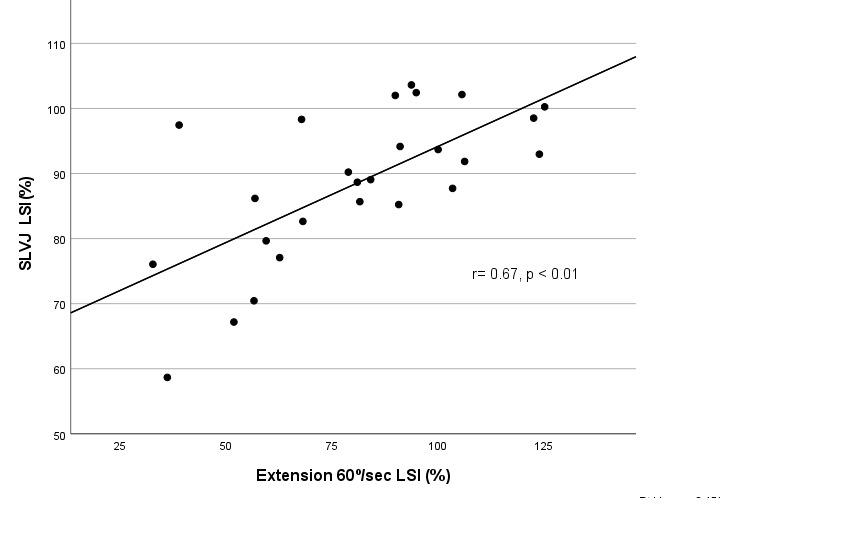
Figure 1. Scatterplot between single-leg vertical jump (SLVJ) limb symmetry index (LSI) and quadriceps extension 60º/sec LSI (ACLR group)
nification relationship did not exist between jump height and quadriceps peak torque.60 There are methodological differences between those studies; however, it appears a relationship between SLVJ jump height and quadriceps peak torque exists; however, how this relationship is related to isokinetic angular velocity (during testing) after ACLR is not clearly understood.
Clinicians typically include patient self-reported measures such as the ACL-RSI to determine an ACLR athlete’s psychological readiness to return to sport.61 Within the ACLR group, the mean ACL-RSI score was 67, which is con-
sistent with previous studies25,60 and greater than the proposed ≥65 threshold to return an ACLR athlete to sport.25 Contrary to the stated hypothesis, results of this study identified a weak non-significant relationship between the ACL-RSI and the single-leg multidirectional tests and quadriceps strength assessments. Several researchers have identified a moderate-strong association between the ACLRSI and functional hops29,33,46 while two large cohorts did not identify a significant relationship.37,47 These results indicate that patient-reported function is multifactorial and
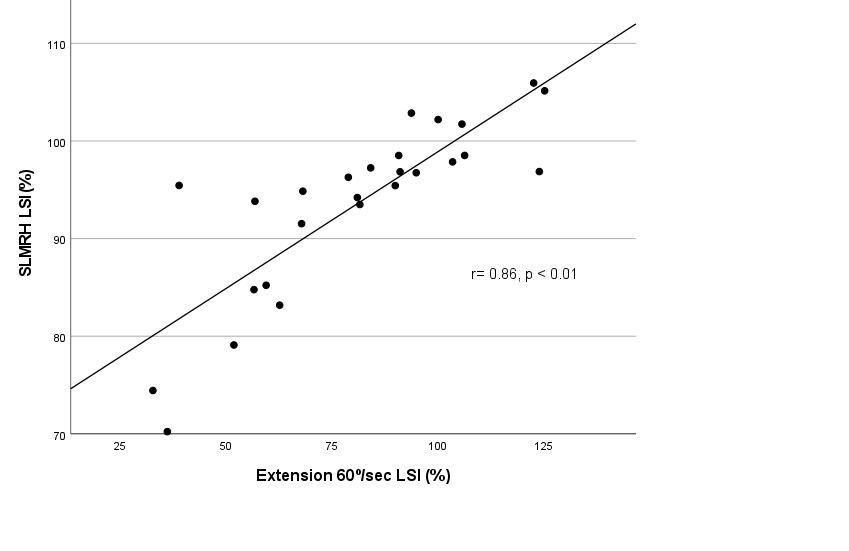
Figure 2. Scatterplot between single-leg medial rotation (SLMRH) limb symmetry index (LSI) and quadriceps extension 60º/sec LSI (ACLR group)
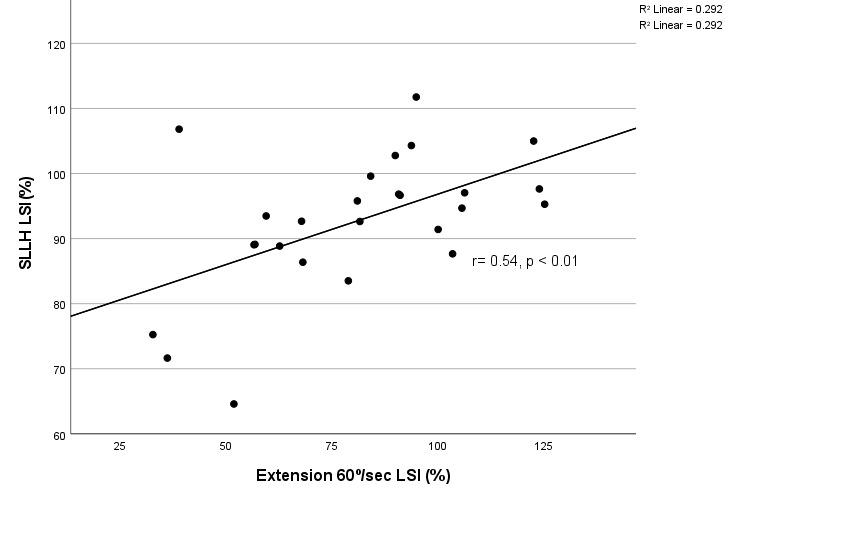
Figure 3. Scatterplot between single-leg lateral hop (SLLH) limb symmetry index (LSI) and quadriceps extension 60º/sec LSI (ACLR group)
dependent upon factors other than just physical performance.
This study does have limitations. A larger sample size would have allowed additional sub-analysis according to athletic ability, time from surgery, and graft types. Second, these study data were collected cross-sectionally. A longitudinal study design could assess performance measure-
ments at multiple time points and therefore ascertain the temporal relationship between single-leg multidirectional and quadriceps strength tests. Finally, the generalizability of these results may be limited as the participants were all current or recent graduates of the USMA and sixteen of the twenty-six participants in the ACLR group had a QT autograft.
Table 4. Backwards linear regression analysis to predict quadriceps strength limb symmetry index
Model 1 variables: ACL-RSI, SLVJ, SLMRH, SLLH
Model 2 variables: Time from Surgery, ACL-RSI, SLVJ, SLMRH, SLLH
Abbreviations: ACL-RSI, Anterior Cruciate Ligament-Return to Sport after Injury; LSI, limb symmetry index; SLLH, single-leg lateral hop; SLMRH, single-leg medial rotation hop; SLVJ, single-leg vertical jump
Table 5. Relationship between quadriceps extension 60º/sec limb symmetry index (LSI), single-leg vertical jump, and single-leg medial rotation hop LSI with cutoff of 90% LSI.
Extension 60º/sec LSI
Extension 180º/sec LSI < 90% ≥ 90% Sum < 90% ≥ 90% Sum
Abbreviations: LSI, limb symmetry index; SLMRH, single-leg medial rotation hop; SLVJ, single-leg vertical jump
Table 6. Diagnostic accuracy of single-leg vertical jump and single-leg medial rotation hop to predict quadriceps strength at 60 deg/sec limb symmetry > 90%.
Abbreviations: LSI, limb symmetry index; SLMRH, single-leg medial rotation hop; SLVJ, single-leg vertical jump
Clinicians, especially those who do not own isokinetic dynamometers, may utilize the SLVJ, SLMRH, and SLLH to identify asymmetrical single-leg function in ACLR patients. Those tests have a strong-moderate direct correlation to quadriceps strength but may under-represent strength deficits. The ACL-RSI has a weak relationship with functional and strength testing and thus be interpreted with caution.
The authors declare that they have no known competing financial interests or personal relationships that could have appeared to influence the work reported in this paper
The views expressed in this publication are those of the author(s) and do not reflect the official policy or position of William Beaumont Army Medical Center, Department of the Army, Defense Health Agency, or the US Government.
Submitted: January 27, 2024 CDT, Accepted: June 21, 2024 CDT
© The Author(s)
This is an open-access article distributed under the terms of the Creative Commons Attribution 4.0 International License (CCBY-NC-4.0). View this license’s legal deed at https://creativecommons.org/licenses/by-nc/4.0 and legal code at https://creativecommons.org/licenses/by-nc/4.0/legalcode for more information.
1. Sanders TL, Maradit Kremers H, Bryan AJ, et al. Incidence of anterior cruciate ligament tears and reconstruction: A 21-year population-based study. Am J Sports Med 2016;44(6):1502-1507 doi:10.1177/ 0363546516629944
2. Tennent DJ, Posner MA. The military ACL. J Knee Surg 2019;32(2):118-122. doi:10.1055/ s-0038-1676565
3. Losciale JM, Ithurburn MP, Paterno MV, Schmitt LC. Passing return-to-sport criteria and landing biomechanics in young athletes following anterior cruciate ligament reconstruction. J Orthop Res. Published online June 3, 2021. doi:10.1002/jor.25110
4. Ashigbi EYK, Banzer W, Niederer D Return to sport tests’ prognostic value for reinjury risk after anterior cruciate ligament reconstruction: A systematic review Med Sci Sports Exerc 2020;52(6):1263-1271. doi:10.1249/ MSS.0000000000002246
5. Hui C, Salmon LJ, Kok A, Maeno S, Linklater J, Pinczewski LA. Fifteen-year outcome of endoscopic anterior cruciate ligament reconstruction with patellar tendon autograft for “isolated” anterior cruciate ligament tear. Am J Sports Med. 2011;39(1):89-98. doi:10.1177/0363546510379975
6. Wiggins AJ, Grandhi RK, Schneider DK, Stanfield D, Webster KE, Myer GD. Risk of secondary injury in younger athletes after anterior cruciate ligament reconstruction: A systematic review and metaanalysis. Am J Sports Med. 2016;44(7):1861-1876. doi:10.1177/0363546515621554
7 Morgan MD, Salmon LJ, Waller A, Roe JP, Pinczewski LA. Fifteen-year survival of endoscopic anterior cruciate ligament reconstruction in patients aged 18 years and younger Am J Sports Med 2016;44(2):384-392. doi:10.1177/0363546515623032
8. Ardern CL, Taylor NF, Feller JA, Webster KE. Fiftyfive per cent return to competitive sport following anterior cruciate ligament reconstruction surgery: an updated systematic review and meta-analysis including aspects of physical functioning and contextual factors. Br J Sports Med. 2014;48(21):1543-1552. doi:10.1136/ bjsports-2013-093398
9. Antosh IJ, Patzkowski JC, Racusin AW, Aden JK, Waterman SM. Return to military duty after anterior cruciate ligament reconstruction. Mil Med 2018;183(1-2):e83-e89. doi:10.1093/milmed/usx007
10. Shrier I. Strategic Assessment of Risk and Risk Tolerance (StARRT) framework for return-to-play decision-making. Br J Sports Med. 2015;49(20):1311-1315. doi:10.1136/ bjsports-2014-094569
11. Pairot-de-Fontenay B, Willy RW, Elias ARC, Mizner RL, Dubé MO, Roy JS. Running biomechanics in individuals with anterior cruciate ligament reconstruction: A systematic review. Sports Med. 2019;49(9):1411-1424. doi:10.1007/ s40279-019-01120-x
12. Ithurburn MP, Paterno MV, Thomas S, et al. Clinical measures associated with knee function over two years in young athletes after ACL reconstruction. The Knee. 2019;26(2):355-363. doi:10.1016/ j.knee.2019.01.011
13. Kvist J, Ek A, Sporrstedt K, Good L. Fear of reinjury: a hindrance for returning to sports after anterior cruciate ligament reconstruction. Knee Surg Sports Traumatol Arthrosc 2005;13(5):393-397 doi:10.1007/s00167-004-0591-8
14. Undheim MB, Cosgrave C, King E, et al. Isokinetic muscle strength and readiness to return to sport following anterior cruciate ligament reconstruction: is there an association? A systematic review and a protocol recommendation. Br J Sports Med 2015;49(20):1305-1310. doi:10.1136/ bjsports-2014-093962
15. Grindem H, Snyder-Mackler L, Moksnes H, Engebretsen L, Risberg MA. Simple decision rules can reduce reinjury risk by 84% after ACL reconstruction: the Delaware-Oslo ACL cohort study Br J Sports Med 2016;50(13):804-808. doi:10.1136/ bjsports-2016-096031
16. Webster KE, Hewett TE. What is the evidence for and validity of return-to-sport testing after anterior cruciate ligament reconstruction surgery? A systematic review and meta-analysis. Sports Med 2019;49(6):917-929. doi:10.1007/s40279-019-01093-x
17. Losciale JM, Zdeb RM, Ledbetter L, Reiman MP, Sell TC. The association between passing return-tosport criteria and second anterior cruciate ligament injury risk: A systematic review with meta-analysis. J Orthop Sports Phys Ther 2019;49(2):43-54. doi:10.2519/jospt.2019.8190
18. Kyritsis P, Bahr R, Landreau P, Miladi R, Witvrouw E. Likelihood of ACL graft rupture: not meeting six clinical discharge criteria before return to sport is associated with a four times greater risk of rupture. Br J Sports Med 2016;50(15):946-951. doi:10.1136/ bjsports-2015-095908
19. Ohji S, Aizawa J, Hirohata K, et al. Single-leg hop can result in higher limb symmetry index than isokinetic strength and single-leg vertical jump following anterior cruciate ligament reconstruction. The Knee 2021;29:160-166. doi:10.1016/ j.knee.2021.01.030
20. Ebert JR, Edwards P, Yi L, et al. Strength and functional symmetry is associated with postoperative rehabilitation in patients following anterior cruciate ligament reconstruction. Knee Surg Sports Traumatol Arthrosc 2018;26(8):2353-2361. doi:10.1007/s00167-017-4712-6
21. Toole AR, Ithurburn MP, Rauh MJ, Hewett TE, Paterno MV, Schmitt LC. Young athletes cleared for sports participation after anterior cruciate ligament reconstruction: How many actually meet recommended return-to-sport criterion cutoffs? J Orthop Sports Phys Ther 2017;47(11):825-833. doi:10.2519/jospt.2017.7227
22. Webster KE, Feller JA. Who passes return-to-sport tests, and which tests are most strongly associated with return to play after anterior cruciate ligament reconstruction? Orthop J Sports Med 2020;8(12):2325967120969425. doi:10.1177/ 2325967120969425
23. Zarro MJ, Stitzlein MG, Lee JS, et al. Single-leg vertical hop test detects greater limb asymmetries than horizontal hop tests after anterior cruciate ligament reconstruction in NCAA Division 1 collegiate athletes. Int J Sports Phys Ther 2021;16(6):1405-1414. doi:10.26603/001c.29595
24. Webster KE, Feller JA, Lambros C. Development and preliminary validation of a scale to measure the psychological impact of returning to sport following anterior cruciate ligament reconstruction surgery Phys Ther Sport 2008;9(1):9-15. doi:10.1016/ j.ptsp.2007.09.003
25. Sadeqi M, Klouche S, Bohu Y, Herman S, Lefevre N, Gerometta A. Progression of the psychological ACL-RSI score and return to sport after anterior cruciate ligament reconstruction: A prospective 2-year follow-up study from the French prospective anterior cruciate ligament reconstruction cohort study (FAST). Orthop J Sports Med 2018;6(12):2325967118812819. doi:10.1177/ 2325967118812819
26. Herrington L, Alarifi S, Jones R. Patellofemoral joint loads during running at the time of return to sport in elite athletes with ACL reconstruction. Am J Sports Med. 2017;45(12):2812-2816. doi:10.1177/ 0363546517716632
27 Wellsandt E, Failla MJ, Snyder-Mackler L. Limb symmetry indexes can overestimate knee function after anterior cruciate ligament injury. J Orthop Sports Phys Ther 2017;47(5):334-338. doi:10.2519/ jospt.2017.7285
28. Petschnig R, Baron R, Albrecht M. The relationship between isokinetic quadriceps strength test and hop tests for distance and one-legged vertical jump test following anterior cruciate ligament reconstruction. J Orthop Sports Phys Ther 1998;28(1):23-31. doi:10.2519/jospt.1998.28.1.23
29. Lee DW, Yang SJ, Cho SI, Lee JH, Kim JG. Singleleg vertical jump test as a functional test after anterior cruciate ligament reconstruction. The Knee 2018;25(6):1016-1026. doi:10.1016/ j.knee.2018.07.014
30. Dingenen B, Truijen J, Bellemans J, Gokeler A. Test-retest reliability and discriminative ability of forward, medial and rotational single-leg hop tests. The Knee 2019;26(5):978-987 doi:10.1016/ j.knee.2019.06.010
31. Ebert JR, Du Preez L, Furzer B, Edwards P, Joss B. Which hop tests can best identify functional limb asymmetry in patients 9-12 months after anterior cruciate ligament reconstruction employing a hamstrings tendon autograft? Int J Sports Phys Ther 2021;16(2):393-403. doi:10.26603/001c.21140
32. Aizawa J, Hirohata K, Ohji S, et al. Correlations between isokinetic knee torques and single-leg hop distances in three directions in patients after ACL reconstruction. BMC Sports Sci Med Rehabil 2021;13(1):38. doi:10.1186/s13102-021-00265-5
33. Borawski J. Do psychological factors contribute to neuromuscular asymmetries following anterior cruciate ligament reconstruction? Presented at: APTA Combined Sections Meeting; March 2, 2022. https:// apta.confex.com/apta/csm2022/meetingapp.cgi/ Paper/33300
34. Ebert JR, Edwards P, Preez LD, Furzer B, Joss B. Knee extensor strength, hop performance, patientreported outcome and inter-test correlation in patients 9-12 months after anterior cruciate ligament reconstruction. The Knee 2021;30:176-184. doi:10.1016/j.knee.2021.04.012
35. Pamukoff DN, Montgomery MM, Choe KH, Moffit TJ, Garcia SA, Vakula MN. Bilateral alterations in running mechanics and quadriceps function following unilateral anterior cruciate ligament reconstruction. J Orthop Sports Phys Ther 48(12):960-967 doi:10.2519/jospt.2018.8170
36. Read P, Mc Auliffe S, Wilson MG, Myer GD Better reporting standards are needed to enhance the quality of hop testing in the setting of ACL return to sport decisions: a narrative review. Br J Sports Med. 2021;55(1):23-29. doi:10.1136/bjsports-2019-101245
37 O’Connor RF, King E, Richter C, Webster KE, Falvey ÉC. No relationship between strength and power scores and anterior cruciate ligament return to sport after injury scale 9 months after anterior cruciate ligament reconstruction. Am J Sports Med. 2020;48(1):78-84. doi:10.1177/0363546519887952
38. Faleide AGH, Magnussen LH, Strand T, et al. The role of psychological readiness in return to sport assessment after anterior cruciate ligament reconstruction. Am J Sports Med 2021;49(5):1236-1243. doi:10.1177/ 0363546521991924
39. Nuzzo JL, Anning JH, Scharfenberg JM. The reliability of three devices used for measuring vertical jump height. J Strength Cond Res. 2011;25(9):2580-2590. doi:10.1519/ JSC.0b013e3181fee650
40. Leard JS, Cirillo MA, Katsnelson E, et al. Validity of two alternative systems for measuring vertical jump height. J Strength Cond Res 2007;21(4):1296-1299. doi:10.1519/R-21536.1
41. Kea J, Kramer J, Forwell L, Birmingham T Hip abduction-adduction strength and one-leg hop tests: test-retest reliability and relationship to function in elite ice hockey players. J Orthop Sports Phys Ther 2001;31(8):446-455. doi:10.2519/jospt.2001.31.8.446
42. de Araujo Ribeiro Alvares JB, Rodrigues R, de Azevedo Franke R, et al. Inter-machine reliability of the Biodex and Cybex isokinetic dynamometers for knee flexor/extensor isometric, concentric and eccentric tests. Phys Ther Sport 2015;16(1):59-65. doi:10.1016/j.ptsp.2014.04.004
43. Barfod KW, Feller JA, Hartwig T, Devitt BM, Webster KE. Knee extensor strength and hop test performance following anterior cruciate ligament reconstruction. The Knee. 2019;26(1):149-154. doi:10.1016/j.knee.2018.11.004
44. Souissi S, Chaouachi A, Burnett A, et al. Leg asymmetry and muscle function recovery after anterior cruciate ligament reconstruction in elite athletes: a pilot study on slower recovery of the dominant leg. Biol Sport 2020;37(2):175-184. doi:10.5114/biolsport.2020.94238
45. Cohen J. Statistical Power Analysis for the Behavioral Sciences. 2nd ed. Lawrence Erlbaum; 1988.
46. Aizawa J, Hirohata K, Ohji S, et al. Correlations between isokinetic knee torques and single-leg hop distances in three directions in patients after ACL reconstruction. BMC Sports Sci Med Rehabil 2021;13(1):38. doi:10.1186/s13102-021-00265-5
47. Gauthier M, Lê TN, Wehn A, Joseph S, Tscholl PM. Subjective knee apprehension is not associated to physical parameters 6-12 months after anterior cruciate ligament reconstruction. J Exp Orthop. 2022;9(1):110. doi:10.1186/s40634-022-00545-0
48. Fischer F, Blank C, Dünnwald T, et al. Isokinetic extension strength is associated with single-leg vertical jump height. Orthop J Sports Med 2017;5(11):2325967117736766. doi:10.1177/ 2325967117736766
49. Laudner K, Evans D, Wong R, et al. Relationship between isokinetic knee strength and jump characteristics following anterior cruciate ligament reconstruction. Int J Sports Phys Ther 2015;10(3):272-280.
50. Lepley LK, Davi SM, Burland JP, Lepley AS. Muscle atrophy after ACL injury: Implications for clinical practice. Sports Health 2020;12(6):579-586. doi:10.1177/1941738120944256
51. Hegedus EJ, McDonough S, Bleakley C, Cook CE, Baxter GD Clinician-friendly lower extremity physical performance measures in athletes: a systematic review of measurement properties and correlation with injury, Part 1. The tests for knee function including the hop tests. Br J Sports Med. 2015;49(10):642-648. doi:10.1136/ bjsports-2014-094094
52. Read PJ, Davies WT, Bishop C, Mc Auliffe S, Wilson MG, Turner AN. Residual deficits in reactive strength indicate incomplete restoration of athletic qualities following anterior cruciate ligament reconstruction in professional soccer players. J Athl Train Published online November 5, 2020. doi:10.4085/169-20
53. Mouarbes D, Menetrey J, Marot V, Courtot L, Berard E, Cavaignac E. Anterior cruciate ligament reconstruction: A systematic review and metaanalysis of outcomes for quadriceps tendon autograft versus bone-patellar tendon-bone and hamstringtendon autografts. Am J Sports Med 2019;47(14):3531-3540. doi:10.1177/ 0363546518825340
54. Johnston PT, McClelland JA, Feller JA, Webster KE. Knee muscle strength after quadriceps tendon autograft anterior cruciate ligament reconstruction: systematic review and meta-analysis. Knee Surg Sports Traumatol Arthrosc. 2021;29(9):2918-2933. doi:10.1007/s00167-020-06311-y
55. Thomeé R, Neeter C, Gustavsson A, et al. Variability in leg muscle power and hop performance after anterior cruciate ligament reconstruction. Knee Surg Sports Traumatol Arthrosc 2012;20(6):1143-1151. doi:10.1007/ s00167-012-1912-y
56. Kotsifaki A, Korakakis V, Graham-Smith P, Sideris V, Whiteley R. Vertical and horizontal hop performance: Contributions of the hip, knee, and ankle. Sports Health 2021;13(2):128-135. doi:10.1177/1941738120976363
57 Sugi H, Ohno T Physiological significance of the force-velocity relation in skeletal muscle and muscle fibers. Int J Mol Sci 2019;20(12):3075. doi:10.3390/ ijms20123075
58. Cerrah AO, Bayram İ. Relationship between isokinetic strength, vertical jump, spring speed, agility, and Yo-Yo intermittent recovery test in soccer players. Eur J Phys Educ Sport Sci. 2022;9(2). doi:10.46827/ejpe.v9i2.4514
59. Rouis M, Coudrat L, Jaafar H, et al. Assessment of isokinetic knee strength in elite young female basketball players: correlation with vertical jump. J Sports Med Phys Fitness 2015;55(12):1502-1508.
60. Kozinc Ž, Marković G, Hadžić V, Šarabon N. Relationship between force-velocity-power profiles and inter-limb asymmetries obtained during unilateral vertical jumping and singe-joint isokinetic tasks. J Sports Sci 2021;39(3):248-258. doi:10.1080/ 02640414.2020.1816271
61. Lepley AS, Pietrosimone B, Cormier ML. Quadriceps function, knee pain, and self-reported outcomes in patients with anterior cruciate ligament reconstruction. J Athl Train. 2018;53(4):337-346. doi:10.4085/1062-6050-245-16
Stefano Di Paolo1 , Naoaki Ito2 , Kayla D. Seymore2 , Haraldur B. Sigurðsson3 , Laura Bragonzoni4 , Stefano Zaffagnini1 , Lynn Snyder-Mackler2 , Karin Gravare Silbernagel2a
1 Clinica Ortopedica e Traumatologica II, IRCCS Istituto Ortopedico Rizzoli, 2 Department of Physical Therapy, University of Delaware, 3 School of Health Sciences, University of Iceland, 4 Life Quality Studies, University of Bologna
Keywords: ACL, hop test, markerless motion capture https://doi.org/10.26603/001c.121599
International Journal of Sports Physical Therapy
Background
540 S College Ave Suite 160, Newark, DE 19713, USA kgs@udel.edu a Di Paolo S, Ito N, Seymore KD, et al. Hop
Landing with poor knee sagittal plane biomechanics has been identified as a risk factor for Anterior Cruciate Ligament (ACL) injury. However, it is unclear if the horizontal hop test battery reflects knee function and biomechanics.
Hypothesis/Purpose
To investigate the correlation between clinical limb symmetry index (LSI) and landing and propulsion knee biomechanics during the hop test battery using markerless motion capture.
Study Design
Cross-sectional biomechanics laboratory study
Methods
Forty-two participants with and without knee surgery (age 28.0 ± 8.0 years) performed the hop test battery which consisted of a single hop for distance, crossover hop, triple hop, and 6-m timed hop in the order listed. Eight high speed cameras were used to collect simultaneous 3D motion data and Theia 3D (Theia Markerless Inc.) was used to generate 3D body model files. Lower limb joint kinematics were calculated in Visual3D Correlation (Spearman’s ρ) was computed between clinical LSI and symmetry in peak and initial contact (IC) knee flexion angle during propulsion and landing phases of each movement.
Results
In the single hop, clinical LSI showed positive correlation with kinematic LSI at peak landing (ρ= 0.39, p=0.011), but no correlation at peak propulsion (ρ= -0.03, p=0.851). In the crossover hop, non-significant correlations were found in both propulsion and landing. In the triple hop, positive correlation was found at peak propulsion (ρ= 0.38, p=0.027), peak landing (ρ= 0.48 – 0.66, p<0.001), and last landing IC (ρ= 0.45, p=0.009). In the timed hop, peak propulsion showed positive correlation (ρ= 0.51, p=0.003).
Single hop and triple hop distance symmetry reflected landing biomechanical symmetry better than propulsion symmetry. Poor scores on the hop test battery reflect asymmetrical knee landing biomechanics, emphasizing the importance of continuing to use the hop test battery as part of clinical decision making.
Corresponding author
Karin Grävare Silbernagel, PT, PhD
Biomechanics and Movement Science Program, University of Delaware; Department of Physical Therapy University of Delaware
Limb symmetry index (LSI) from the horizontal hop test battery1 is widely used by clinicians for return to sport (RTS) decision making after knee, and particularly anterior cruciate ligament (ACL), injury 2,3 The battery involves four single-leg hop tests: single hop for distance (SLH), crossover hop for distance (COH), triple hop for distance (TRH), and timed 6-meter hop (TIH). The hops for distance must be completed with a controlled landing for the distance score to count. With the advancement of technology (e.g., motion capture, inertial measurement units, force plates), biomechanical data during athletic maneuvers, such as the hops, are becoming more available in clinical practice and may ultimately guide better care.4,5 Landing with poor knee sagittal plane biomechanics has been identified as a part of the ACL injury mechanism in several sports.6‑8 It is unclear, however, if the more easily and commonly implemented hop test battery reflects knee function and biomechanics.
Researchers have suggested that horizontal hop distance poorly reflects propulsion (e.g., take-off) knee biomechanics, but rather captures a greater degree of involvement from the ankle and hip joint.9 Some researchers also advocate using the vertical hop test as a better indicator of biomechanical deficits, as there is a higher knee contribution during a vertical hop compared to a horizontal hop.9, 10 These studies, however, mostly investigate vertical hop propulsive phase, while non-contact ACL injuries almost always occur during landing.6 While performance in vertical hop may capture an athlete’s ability to move faster and further, it does not capture the athlete’s ability to land safely after the maneuver is complete. Moreover, there has been no evidence to date quantifying the influence of vertical hop performance on secondary injury Moderate evidence does exist for including the horizontal hop tests as part of a test battery for secondary injury reduction.11,12
Clinically, while the use of these tests assumes that scores in the horizontal hop test battery captures the ability for an athlete to land, no work has quantified the LSI scores obtained during the hop test battery and compared it to propulsion and landing biomechanics symmetry Thus, whether the current performance metrics are related to propulsion and/or landing biomechanical asymmetries are unknown.
The present study aimed to investigate the potential correlation between horizontal hop test battery LSI and sagittal plane knee kinematics during propulsion and landing using markerless motion capture technology It was hypothesized that hop battery LSI and kinematics would correlate better during the hop landing phase compared to propulsion phase. Ultimately, this is an investigation of the validity of the horizontal hop test battery symmetry outcome as described by Noyes and colleagues1 against a 3D biomechanics symmetry outcome measure. In addition, this is the first study, to the authors’ knowledge, that has
investigated biomechanics during the hop test battery without impeding with participant attire/movement by attaching retroreflective markers or IMUs.
Written informed consent was received from all participants before inclusion and all study procedures were approved by the University of Delaware Institutional Review Board (n. 1770974-3).
Forty-two participants (n=12) with and (n=30) without previous lower extremity surgery were recruited for the study (Table 1). Patients without injury were included to ensure a range of values for the correlational analysis. Participants with previous knee surgery had been cleared to return to sport and/or activity by a qualified healthcare provider (average time from surgery: 81.9 ± 43.2 months, minimum 42 months).
Participants provided basic demographic information and surgery/injury history, in addition to completing questionnaires that assessed physical activity levels (Physical Activity Scale [PAS], Marx Activity Rating Scale [MARS]), and Patient-Reported Outcomes Measurement Information System [PROMIS]).
Participants performed a five-minute warm-up on a treadmill at a comfortable pace prior to testing. Each participant performed the hop test battery which consisted of a SLH, COH, TRH, and TIH in the order listed.1 Participants were asked to hop as far as possible (or as fast as possible for the TIH), starting with their toes behind a marked point on the ground. Two practice trials preceded two successful hop trials. As is the practice in the authors’ clinics and laboratory since 1991, hops for distance were only considered valid if participants were able to maintain their landing posture (at last landing) without shifting the foot from the initial landing position, excessive leaning of the trunk or arms, and were able to be determined to have complete control over their body as determined by the physical therapist in charge.1 If a hop was deemed invalid, participants repeated the hop until a successful trial was achieved. Participants were provided as much rest as desired between hop trials. Hops were performed first on the uninvolved limb then involved limb. The involved limb was defined as the non-dominant limb for participants without previous injury. The dominant limb was defined as the preferred leg to kick a ball.13 Starting position of the toe and landing position of the heel over the tape measure on the ground was used to measure the distance hopped. A stopwatch was used to measure time from heel lift to when the participants center of mass crossed the six-meter line.
Table 1. Participants demographics.
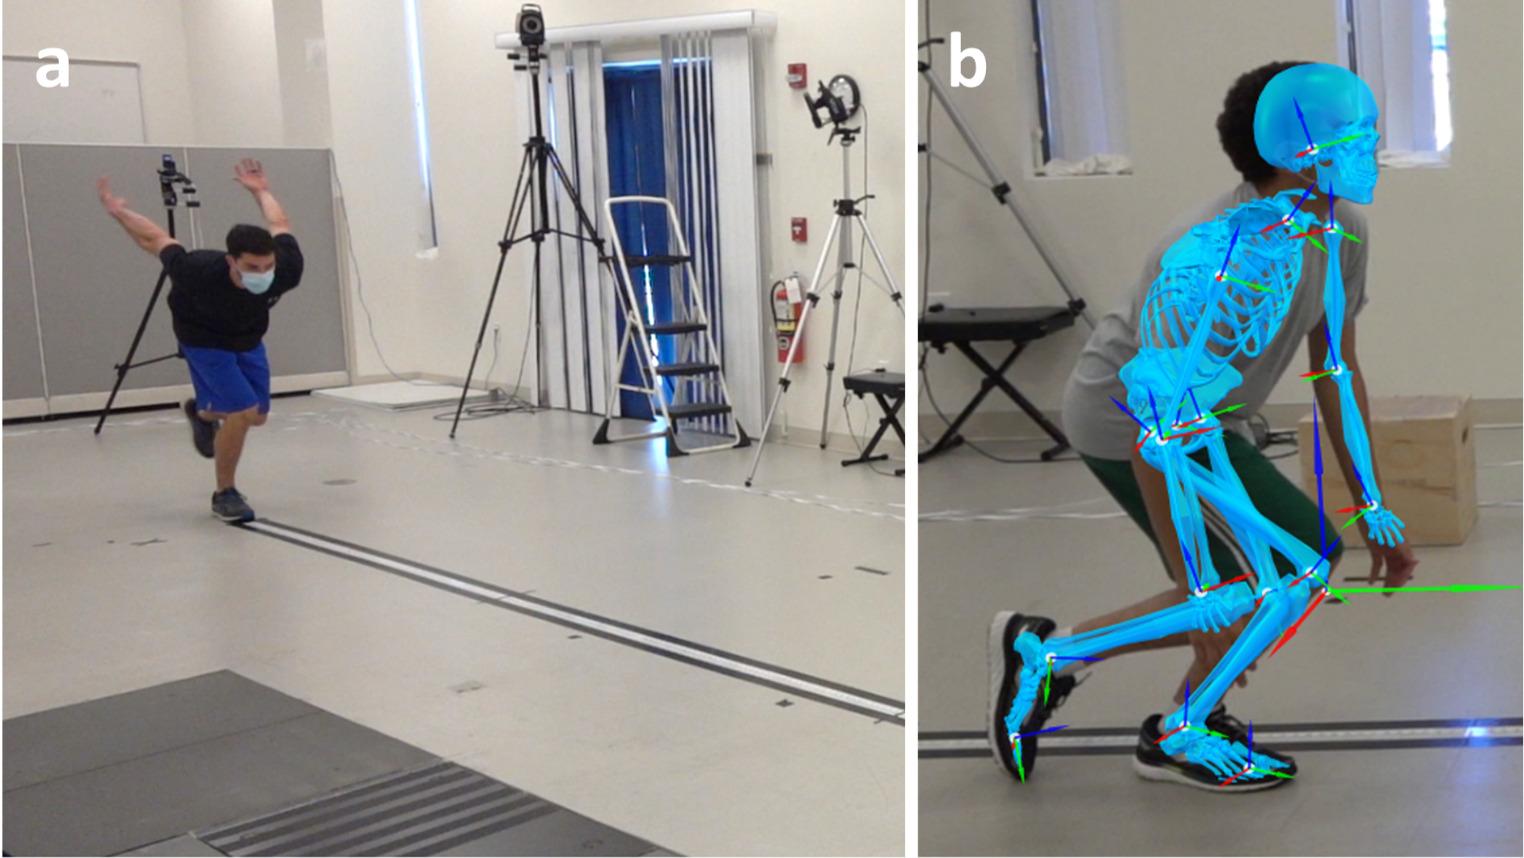
The two successful hop trials were used for data processing and analysis. Eight high speed cameras (Sony RX0-II, Sony Corp., Minato, Japan, 120Hz) were used to collect simultaneous three-dimensional (3D) motion data. All hop tests were administered by a licensed PT
Theia 3D (Theia Markerless Inc., Kingston, Canada) was used to generate 3D body model files for each trial. The model files were processed in Visual3D (v6, C-Motion Inc., Germantown, USA) (Figure 1). Lower limb (hip, knee, ankle) joint kinematics were calculated using the Visual3D models with a Cardan XYZ rotation sequence.14
Hop event detection was performed in Visual3D. A “propulsion phase” and one (SLH) or more (COH, TRH, TIH) “landing phases” were identified. Toe-off and landing events were identified for each hop through the peak foot segment velocity Peak knee flexion angle was extracted from each propulsion and landing phase and averaged between the two successful trials for each participant. Knee flexion angle at initial contact (IC) of each landing phase was also extracted and averaged.15 In tests with multiple hops (all but SLH), the landing peak and IC knee flexion angles were also averaged and reported. For the TIH, participants took three to six hops to reach the 6-meter line. The TIH landing biomechanics are presented only as the average of the hops.
The average performance (distance for SLH, COH, and TRH; time for TIH) of two trials was computed for each participant and each limb. Clinical LSI was computed as the percentage of the involved limb divided by the uninvolved limb. Kinematic LSI was computed as the percentage of the supplementary knee flexion angle of the uninvolved limb divided by the supplementary knee flexion angle of the involved limb. The choice to use the supplementary angle (180° - actual angle) was made to address the small knee flexion angle values occurring at IC: dividing by a number close to 0° would have, indeed, generated non-physiologically high LSI. Additionally, knee flexion angle interlimb difference (ILD = involved limb – uninvolved limb) was computed. ILD values were also calculated for ease of interpretation, as it is more common for clinicians to reference a certain degree of knee joint angle asymmetry than a percentage of asymmetry
The categorical variables were presented as a percentage of the total, while the continuous variables were presented as the mean ± standard deviation. Normal distribution of the data was tested through a Shapiro-Wilk test. Since distribution was found to be non-normal (p<0.05), Spearman’s rank correlation coefficient ρ (with 95% confidence interval) was used to assess the correlation between clinical LSI and kinematic LSI. Correlation was considered weak, moderate, and excellent for ρ < 0.40, 0.40-0.75, and > 0.75, respectively 16 Significance level was set at α=0.05. Statistical analyses were performed in Matlab (v9.13, R2022a, The MathWorks Inc., USA).
For the SLH, clinical LSI showed a weak positive correlation with kinematic LSI at peak landing (ρ= 0.39), but no correlation at peak propulsion or knee angle at IC was seen (Figure 2). For the COH, no correlations were found in propulsion or landing (Figure 3). For the TRH, a weak positive correlation was found at peak propulsion (ρ= 0.38) and a moderate positive correlation at first, last, and average peak landing (ρ= 0.48 – 0.66), as well as a moderate positive correlation at last landing IC (ρ= 0.45) (Figure 4). For the TIH, peak propulsion showed a moderate positive correlation with clinical LSI (ρ= 0.51, Figure 5). In those without correlation, while the range of hop LSI was broad, the range of values for kinematic LSI had a truncated range centered around 100%.
Descriptive and correlation data for all clinical vs kinematic LSI are presented in Appendices 1-4. Descriptive kinematic ILD are presented in Appendix 5. Descriptive knee flexion angle curves are presented in Appendix 6.
The present study investigated the correlation between clinical LSI and both knee propulsion and landing kinematic symmetry during the hop test battery This is the first
study presenting biomechanical data for the hop test battery evaluated clinically and simultaneously measured with markerless motion capture.
Symmetry in hop distance during the SLH and TRH was more representative of landing (ρ= 0.39 – 0.66) compared to propulsion (ρ= -0.03 – 0.38) knee biomechanical symmetry (i.e., knee flexion angle LSI and ILD). The effects were most clear in the SLH, where participants had one attempt to successfully land their hop, compared to the TRH, where participants were able to accumulate distance over the first two hops without controlling their landings. This is also reflected in the current data, as the TRH’s last landing had the strongest clinical-to-biomechanical symmetry correlation amongst the three hops. This confirms the authors’ hypothesis that while propulsion biomechanics matter in acquiring horizontal hop distance, symmetry in hop distance may be limited by the ability to control the landing. Hence, the asymmetry in landing ability is reflected in the horizontal hop test battery score.
Null findings for the COH compared to the SLH and TRH (which are more strictly sagittal plane movements), was not surprising, as sagittal plane biomechanics were only considered in this study due to the questionable reliability and validity of markerless motion capture in other planes of movement.17,18 During the COH test, participants must adjust the direction of progression at each landing and propulsion; stronger knee frontal/transverse plane control is therefore required. Future studies should aim to see if the addition of frontal plane biomechanics may better explain the relationship between hop distance LSI and COH biomechanical LSI.
The TIH showed contrasting results compared to the other three hops; clinical LSI was positively correlated with propulsion but not landing peak knee biomechanics and negatively correlated with landing IC biomechanics. The latter was the only statistically significant negative correlation found in the study Such differences compared to other hops are likely related to the biomechanical strategy adopted in TIH; since participants have a time goal and no limit to the number of hops, they might choose to do shorter – but quicker – or longer hops. Thus, greater intraand inter-subject variability in knee flexion angle can be expected (Appendix 4).
Recent literature questioned the use of hop for distance tests, suggesting that clinical LSI could overestimate knee function and mask residual deficits during the propulsion phases of hopping.9 In the present study, hop distance symmetry was correlated to landing movement symmetry better than propulsion movement symmetry Landing with proper knee flexion angle is crucial to distribute the impact forces on lower limb muscles and avoid excessive stress on knee ligaments.19 Thus, proper landing mechanics and joint loading are crucial to address during rehabilitation after knee injury and surgery, where knee underloading and muscle weakness are common.20 When hopping in the horizontal direction, symmetrical distance reflected symmetrical knee sagittal plane kinematics in landing. Therefore, poorer clinical LSI during the hop test battery can inform asymmetries in knee function and allow clinicians to focus
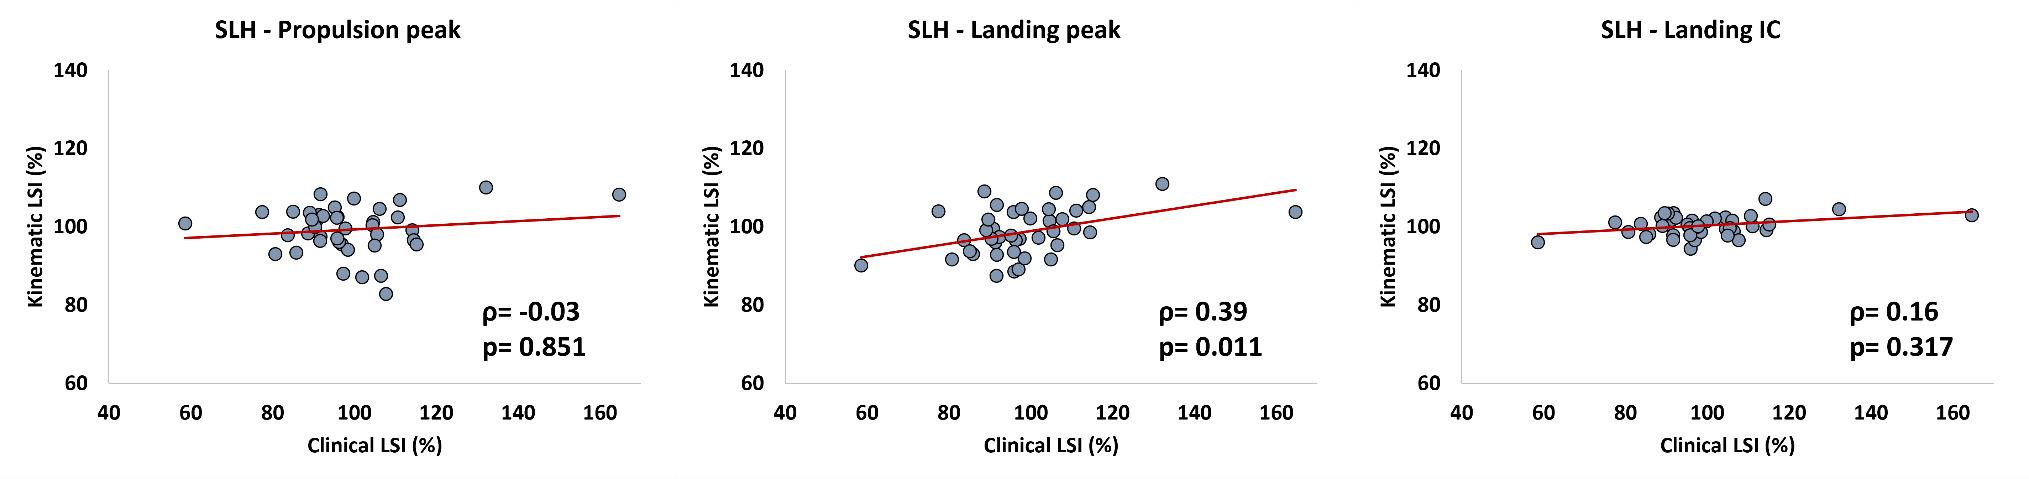
2. Correlation plot for clinical (x-axis) vs kinematic LSI (y-axis) in single leg hop for distance.
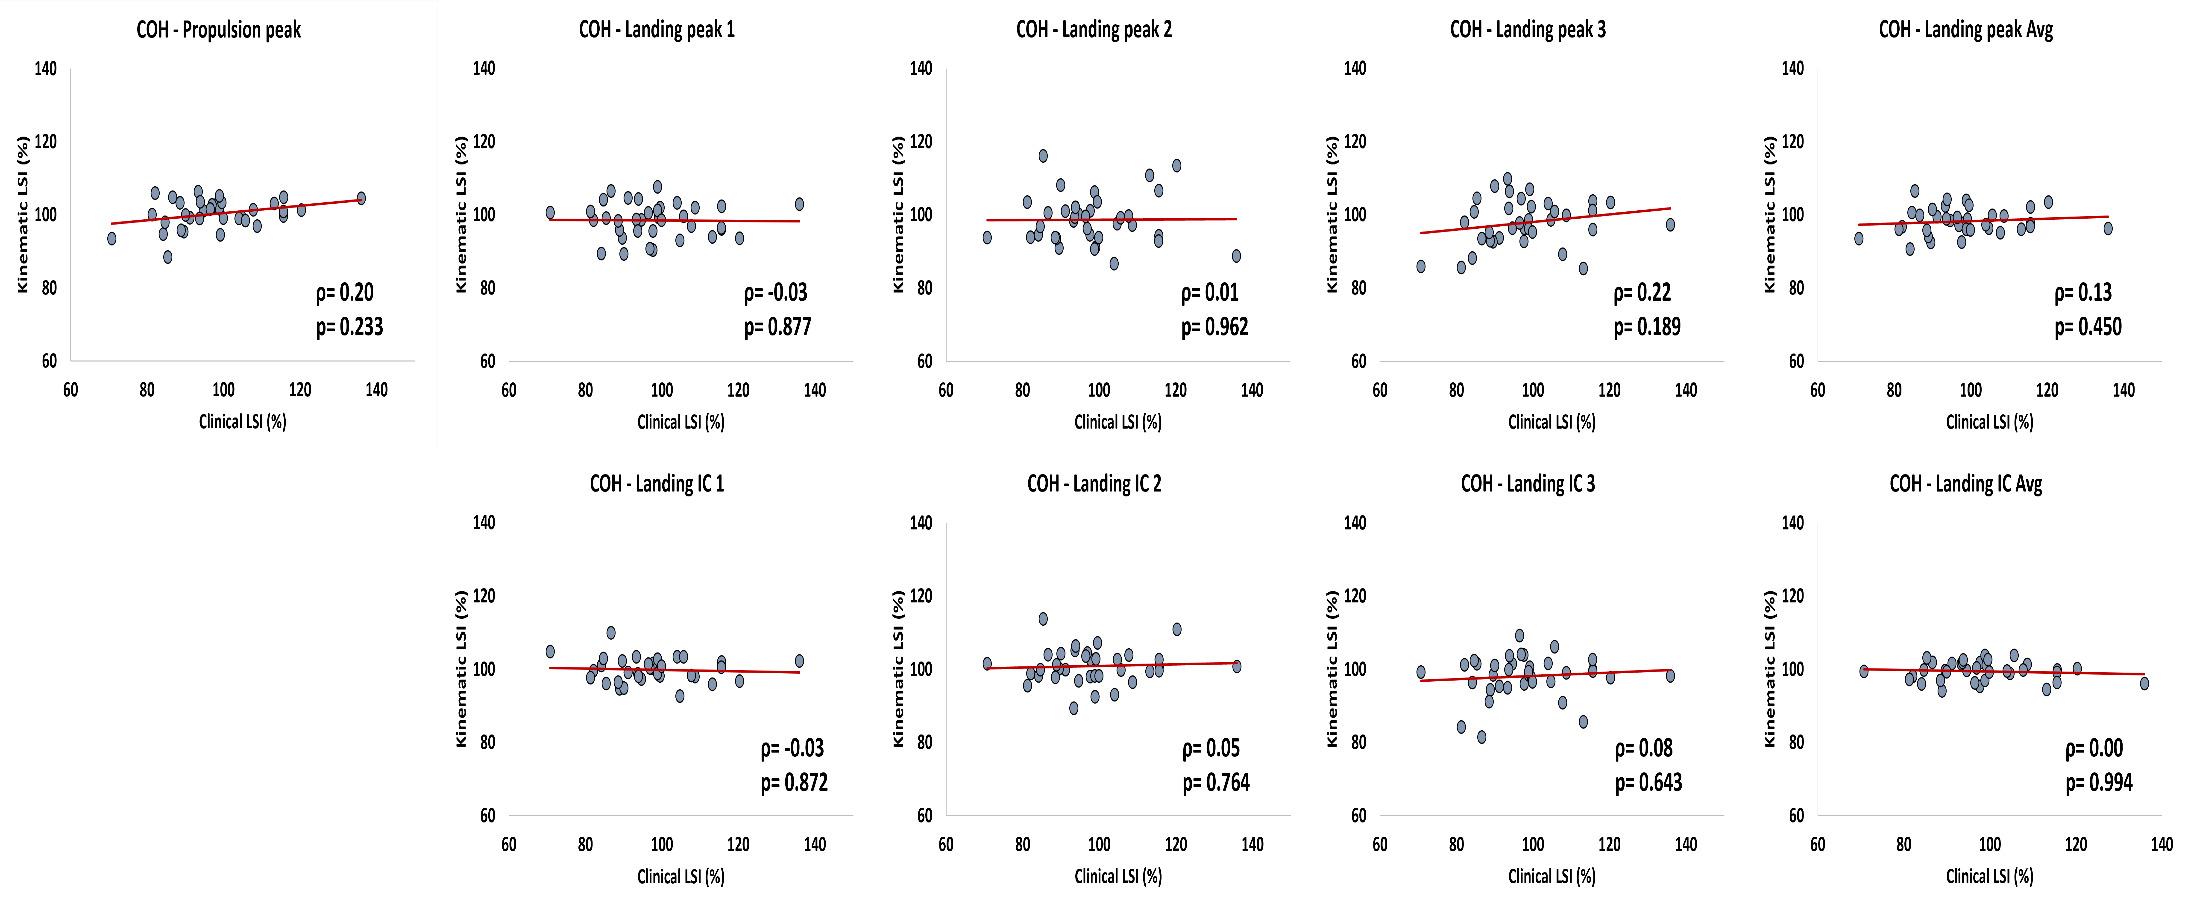
3. Correlation plot for clinical (x-axis) vs kinematic LSI (y-axis) in crossover hop.
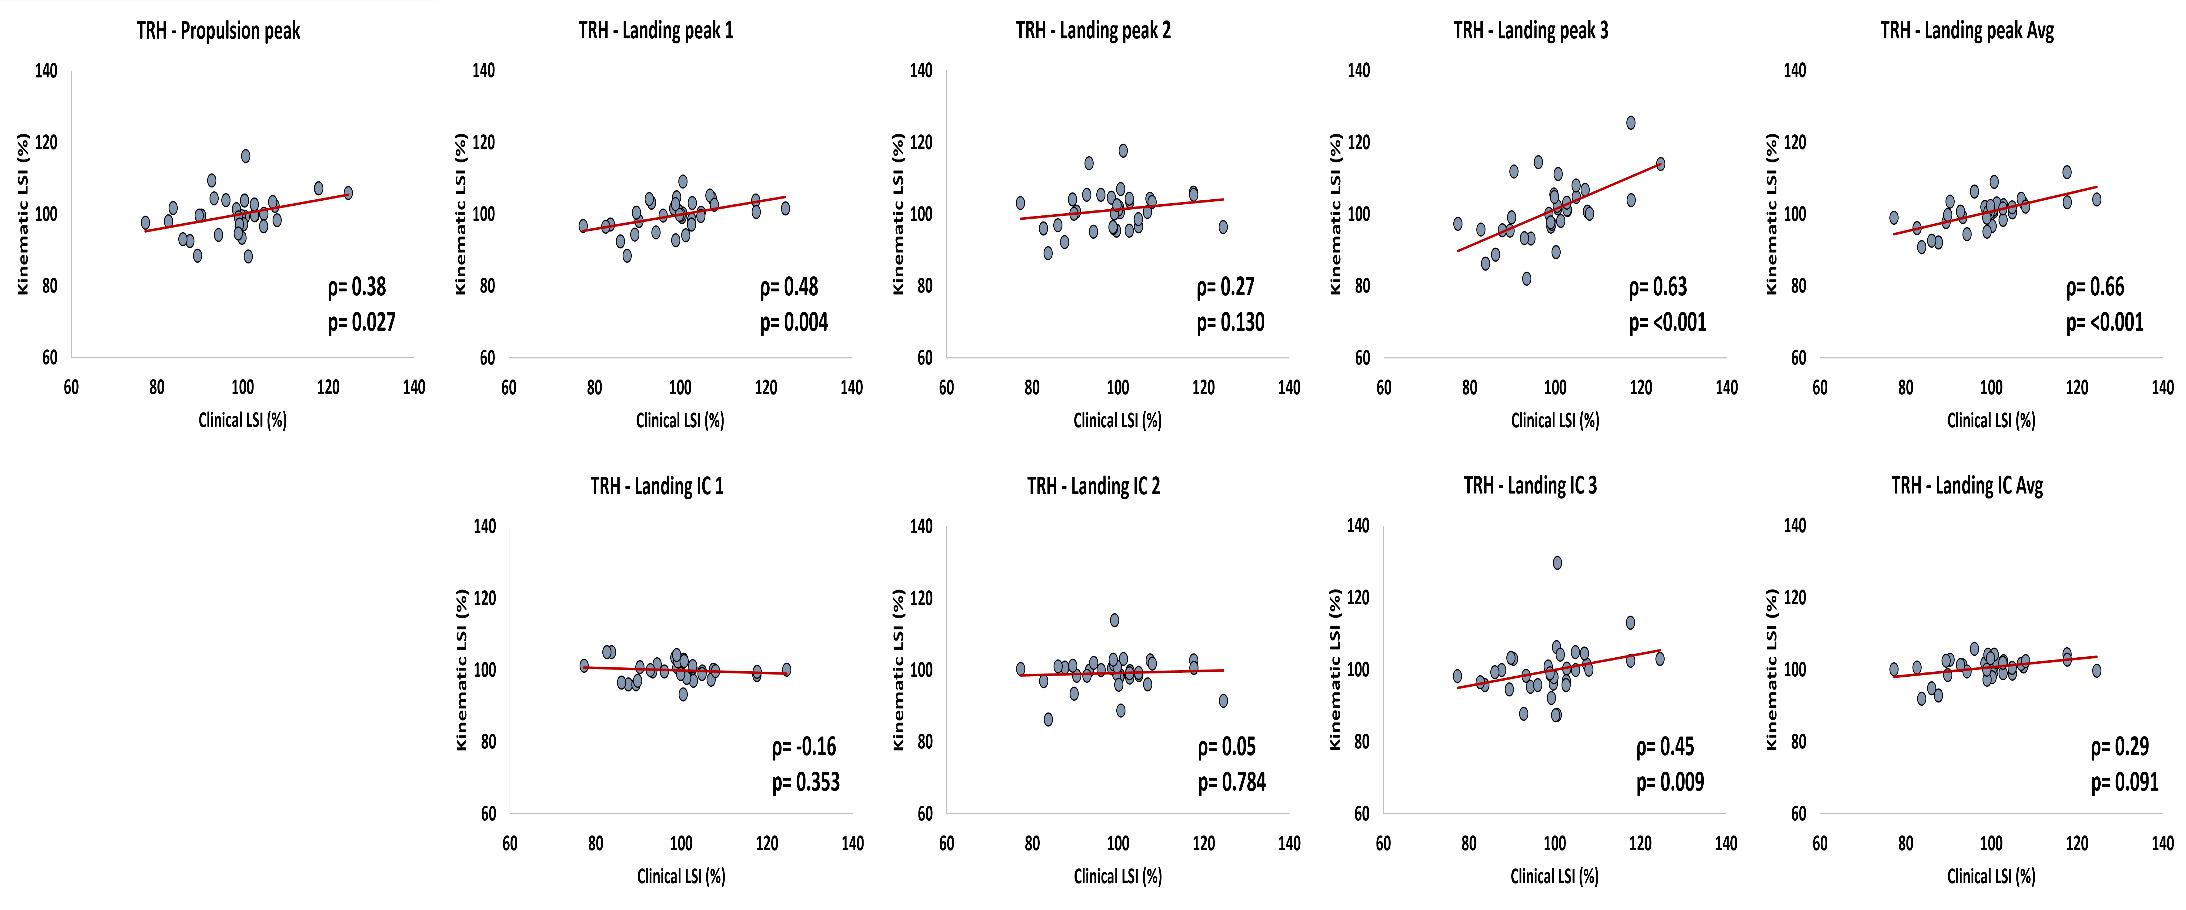
4. Correlation plot for clinical (x-axis) vs kinematic LSI (y-axis) in triple hop.
on further landing movement quality training. In addition, the range of kinematic LSI was truncated in many cases, while the hop LSIs were not, suggesting that the clinical LSIs uncovered more asymmetry.
In the present study, knee biomechanics from markerless motion capture was used to improve the understanding of the hop test battery Metrics such as peak knee flexion angle could be integrated in clinical practice to offer precious insights on hopping quality and knee function while
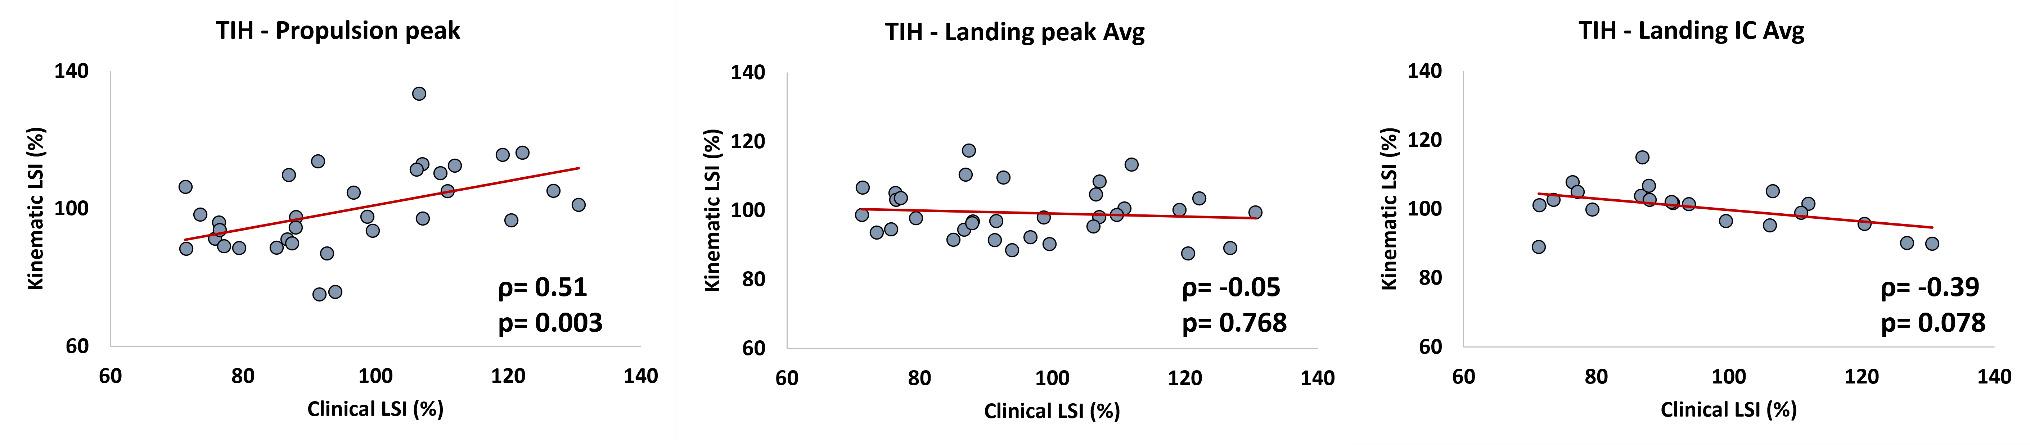
Figure 5. Correlation plot for clinical (x-axis) vs kinematic LSI (y-axis) in 6-m timed hop.
maintaining ease of interpretation for clinicians and patients. Currently, the need for dedicated training and time required for data collection, analysis and processing are the most prominent barriers to the use of biomechanics metrics in daily clinical practice.21,22 Markerless motion capture technology may soon be integrated into clinics due to the reduced testing time required of patients and the simplified equipment.18
The present cross-sectional study has one of the largest and heterogeneous (both healthy and surgery participants) cohorts investigating a clinical test battery designed for RTS clearance decision making through markerless motion capture technology 17 Knee biomechanics quantified from markerless motion capture may provide information beyond current clinical symmetry metrics. Further research is required to assess if markerless motion capture could provide additional insight into knee function in patient populations to improve clinical RTS decision making.23
This study has some limitations. First, knee sagittal plane was the only kinematic variable investigated given the current limitation of markerless motion capture. Knee frontal and transverse plane kinematics might have been of interest to assess the overall knee motion and identify risk factors for biomechanically-driven knee injuries, e.g., non-contact ACL injury This choice was made due to the more straightforward interpretation and greater applicability in the clinical setting of knee sagittal plane kinematics compared to frontal and transverse plane data.17 Since the study’s primary outcome was to assess the correlation between clinical and kinematic LSI, the cohort studied included both healthy and knee surgery participants to enhance the inter-subject variability. Future investigations should focus on possible residual biomechanical deficits in the homogeneous cohorts (e.g., ACL reconstructed athletes) and consider their implications in the use of clinical and kinematic LSI.
Clinical hop LSI distances correlated with landing biomechanics, while hop times correlated with propulsion knee biomechanics. Moderate positive correlation was found in
purely horizontal hop tests, such as the single and triple hop. No correlation was found when more frontal plane movement was introduced, as seen in the crossover hop. Indeed, poorer clinical LSI scores during hop for distance tests implies greater knee landing biomechanics asymmetry
CORRESPONDING AUTHOR
Karin Grävare Silbernagel, PT, PhD
Biomechanics and Movement Science Program, University of Delaware; Department of Physical Therapy University of Delaware 540 S College Ave Suite 160, Newark, DE 19713, USA kgs@udel.edu
CONFLICTS OF INTEREST
The authors report no conflicts of interest.
ACKNOWLEDGMENTS
Theia Markerless Inc. provided the cameras and software used in this research study
FUNDING
The National Institute of Arthritis and Musculoskeletal and Skin Diseases (grant n. R01AR072034-04S1, recipient: Kayla D Seymore) and the Eunice Kennedy Shriver National Institute of Child Health and Human Development (grant n. R37HD037985, recipient: Karin Grävare Silbernagel) supported this work.
Submitted: February 12, 2024 CDT, Accepted: June 21, 2024 CDT
© The Author(s)
This is an open-access article distributed under the terms of the Creative Commons Attribution 4.0 International License (CCBY-NC-4.0). View this license’s legal deed at https://creativecommons.org/licenses/by-nc/4.0 and legal code at https://creativecommons.org/licenses/by-nc/4.0/legalcode for more information.
1. Noyes FR, Barber SD, Mangine RE. Abnormal lower limb symmetry determined by function hop tests after anterior cruciate ligament rupture. Am J Sports Med 1991;19(5):513-518. doi:10.1177/ 036354659101900518
2. Adams D, Logerstedt DS, Hunter-Giordano A, Axe MJ, Snyder-Mackler L. Current concepts for anterior cruciate ligament reconstruction: a criterion-based rehabilitation progression. J Orthop Sports Phys Ther. 2012;42(7):601-614. doi:10.2519/jospt.2012.3871
3. Brinlee AW, Dickenson SB, Hunter-Giordano A, Snyder-Mackler L. ACL reconstruction rehabilitation: clinical data, biologic healing, and criterion-based milestones to inform a return-to-sport guideline. Sports Health. 2022;14(5):770-779. doi:10.1177/ 19417381211056873
4. Di Paolo S, Zaffagnini S, Tosarelli F, Grassi A, Della Villa F. Beyond distance: a simple qualitative assessment of the single-leg hop test in return-toplay testing. Sports Health Published online January 26, 2022:194173812110634. doi:10.1177/ 19417381211063450
5. Kotsifaki A, Korakakis V, Whiteley R, Van Rossom S, Jonkers I. Measuring only hop distance during single leg hop testing is insufficient to detect deficits in knee function after ACL reconstruction: a systematic review and meta-analysis. Br J Sports Med. 2020;54(3):139-153. doi:10.1136/ bjsports-2018-099918
6. Della Villa F, Buckthorpe M, Grassi A, et al. Systematic video analysis of ACL injuries in professional male football (soccer): injury mechanisms, situational patterns and biomechanics study on 134 consecutive cases. Br J Sports Med 2020;54(23):1423-1432. doi:10.1136/ bjsports-2019-101247
7 Della Villa F, Tosarelli F, Ferrari R, et al. Systematic Video analysis of anterior cruciate ligament injuries in professional male rugby players: pattern, injury mechanism, and biomechanics in 57 consecutive cases. Orthop J Sports Med 2021;9(11):23259671211048182. doi:10.1177/ 23259671211048182
8. Koga H, Nakamae A, Shima Y, et al. Mechanisms for noncontact anterior cruciate ligament injuries: knee joint kinematics in 10 injury situations from female team handball and basketball. Am J Sports Med. 2010;38(11):2218-2225. doi:10.1177/ 0363546510373570
9. Kotsifaki A, Whiteley R, Van Rossom S, et al. Single leg hop for distance symmetry masks lower limb biomechanics: time to discuss hop distance as decision criterion for return to sport after ACL reconstruction? Br J Sports Med 2022;56(5):249-256. doi:10.1136/bjsports-2020-103677
10. Kotsifaki A, Van Rossom S, Whiteley R, et al. Single leg vertical jump performance identifies knee function deficits at return to sport after ACL reconstruction in male athletes. Br J Sports Med 2022;56(9):490-498. doi:10.1136/ bjsports-2021-104692
11. Grindem H, Snyder-Mackler L, Moksnes H, Engebretsen L, Risberg MA. Simple decision rules can reduce reinjury risk by 84% after ACL reconstruction: the Delaware-Oslo ACL cohort study Br J Sports Med 2016;50(13):804-808. doi:10.1136/ bjsports-2016-096031
12. Kyritsis P, Bahr R, Landreau P, Miladi R, Witvrouw E. Likelihood of ACL graft rupture: not meeting six clinical discharge criteria before return to sport is associated with a four times greater risk of rupture. Br J Sports Med 2016;50(15):946-951. doi:10.1136/ bjsports-2015-095908
13. van Melick N, Meddeler BM, Hoogeboom TJ, Nijhuis-van der Sanden MWG, van Cingel REH. How to determine leg dominance: the agreement between self-reported and observed performance in healthy adults. PLoS One 2017;12(12):e0189876. doi:10.1371/ journal.pone.0189876
14. Cole GK, Nigg BM, Ronsky JL, Yeadon MR. Application of the joint coordinate system to threedimensional joint attitude and movement representation: a standardization proposal. J Biomech Eng 1993;115(4A):344-349. doi:10.1115/1.2895496
15. Sigurðsson HB, Karlsson J, Snyder-Mackler L, Briem K. Kinematics observed during ACL injury are associated with large early peak knee abduction moments during a change of direction task in healthy adolescents. J Orthop Res 2021;39(10):2281-2290. doi:10.1002/jor.24942
16. Kadaba MP, Ramakrishnan HK, Wootten ME, Gainey J, Gorton G, Cochran GV Repeatability of kinematic, kinetic, and electromyographic data in normal adult gait. J Orthop Res. 1989;7(6):849-860. doi:10.1002/jor.1100070611
17 Ito N, Sigurðsson HB, Seymore KD, et al. Markerless motion capture: what clinician-scientists need to know right now JSAMS Plus 1(2022):100001. doi:10.1016/j.jsampl.2022.100001
18. Kanko RM, Laende EK, Davis EM, Selbie WS, Deluzio KJ. Concurrent assessment of gait kinematics using marker-based and markerless motion capture. J Biomech. 2021;127:110665. doi:10.1016/ j.jbiomech.2021.110665
19. Leppänen M, Pasanen K, Kujala UM, et al. Stiff Landings are associated with increased ACL injury risk in young female basketball and floorball players. Am J Sports Med 2017;45(2):386-393. doi:10.1177/ 0363546516665810
20. Chan MS, Sigward SM. Individuals following anterior cruciate ligament reconstruction practice underloading strategies during daily activity. J Orthop Res 2022;40(3):565-572. doi:10.1002/jor.25070
21. Della Croce U, Leardini A, Chiari L, Cappozzo A. Human movement analysis using stereophotogrammetry Part 4: assessment of anatomical landmark misplacement and its effects on joint kinematics. Gait Posture 2005;21(2):226-237 doi:10.1016/j.gaitpost.2004.05.003
22. Sinclair J, Hebron J, Taylor PJ. The influence of tester experience on the reliability of 3D kinematic information during running. Gait Posture 2014;40(4):707-711. doi:10.1016/ j.gaitpost.2014.06.004
23. Gokeler A, Dingenen B, Hewett TE. Rehabilitation and return to sport testing after anterior cruciate ligament reconstruction: where are we in 2022? Arthrosc Sports Med Rehabil 2022;4(1):e77-e82. doi:10.1016/j.asmr.2021.10.025
Download: https://ijspt.scholasticahq.com/article/121599-hop-distance-symmetry-moderately-reflects-kneebiomechanics-symmetry-during-landing-but-not-for-controlled-propulsions/attachment/ 237545.docx?auth_token=LQALoZ3R-IMkZcrzrpva
4
Brian D. Stirling1a , Jonathan C. Sum2 , Lisa Baek3 , Lori A. Michener2 , Adam J. Barrack2 , Angela R. Tate
1 Rehab Ortho & Sports, Stanford Health Care, 2 Division of Biokinesiology and Physical Therapy, University of Southern California, 3 Physical Therapy, California Rehab Institute, 4 Physical Therapy in the College of Health Sciences, Arcadia University
Keywords: disability, pain, satisfaction, shoulder, swimming, youth https://doi.org/10.26603/001c.121114
Background
There are 2.8 million youth competitive swimmers in the United States (US), and shoulder pain is the most common complaint among swimmers.
Purpose
To determine prevalence of shoulder pain, disability, and dissatisfaction in youth competitive swimmers. A secondary purpose was to determine influence of age, competitive swimming experience, and previous history of shoulder pain or injury on shoulder pain, disability, and dissatisfaction, and finally to determine if sex, geographic area, and participation in a second sport relate to shoulder pain, disability, and dissatisfaction.
Study Design
Multi-site cross-sectional design
Methods
Six-hundred and seventy-one swimmers aged 9–17 years from six states in the US completed surveys which included demographics, the Penn Shoulder Score (PSS), and the Disability of Arm Shoulder Hand (DASH) Sports. Independent t-tests were used to compare pain, disability, dissatisfaction, the influence of age, sex, participation in second sport, geographic region, and history of shoulder pain. Linear regression analyses were performed to determine the interaction of these variables with reported pain and disability.
Results
Forty-nine percent of swimmers had shoulder symptoms. Greater shoulder pain and disability were reported in 15 to 17-year-olds compared to 9 to 10-year-olds (pain and disability: p<0.001), in swimmers with greater versus less years of experience (pain and disability: p<0.001), and in swimmers from eastern versus western states (pain: p=0.001, disability: p=0.0014). Swimmers not participating in a second sport had higher shoulder dissatisfaction (p=0.002). History of prior shoulder pain/traumatic injury was the best indicator of increased pain, disability, and dissatisfaction (p<0.001).
Conclusion
Almost half of swimmers surveyed had shoulder pain, with a higher prevalence found in older age groups, those with greater experience, and in those with prior shoulder pain or traumatic injury. Further research should investigate shoulder pain prevention programs, and surveillance methods are recommended to identify symptomatic swimmers who may benefit from referral to prevent further pain and disability.
Corresponding author:
Brian D. Stirling, Stanford Health Care, Redwood City, CA 94063 United States
Telephone number: +1 (609) 273-2257
Email address: stirlingdpt@gmail.com
Swimming is a popular form of exercise both recreationally and competitively A 2021 survey revealed that there were 2.8 million people aged six years and older competing on a swim team in the United States (US).1 The non-weight bearing nature of the sport may lead people to believe that it is safe for joints. While this may be true for the recreational swimmer, elite swimmers may swim up to 14,000 meters and undergo 2,500 shoulder revolutions per day,2 with competitive swimmers practicing five to seven days per week, sometimes twice daily.3 It is therefore not surprising that shoulder pain is the most common orthopedic complaint in swimmers. A majority of high school competitive swimmers in one study believed that shoulder pain is normal, with 47% of this group reporting that they take pain medication regularly to manage their shoulder symptoms.4
The most recent wide-scale study reporting the prevalence of shoulder pain in youth swimmers in the US was published by McMaster and Troup in 1993,5 who collected over 1,000 survey responses from swimmers aged 13–16 years who were selected for participation in USA Swimming-sponsored national training camps. The authors defined shoulder pain as pain that interfered with training or progress in training and reported that 9-26% of the swimmers were currently experiencing pain and 38-67% reported a history of shoulder pain.5 Furthermore, the more years of competitive experience the swimmers had, the more likely they were to experience shoulder pain.5 To date, there has not been another study from a diverse sample reporting on the prevalence of pain and disability in youth swimmers in the US, thereby accounting for possible changes in training over the past three decades.
Recent studies reporting prevalence of shoulder pain in youth competitive swimmers have been smaller in scale and limited to a single geographical region. An Australian study published in 2010 with 90 swimmers aged 13–25 years reported a pain prevalence of 91%.6 An Italian study revealed that in a cohort of 197 swimmers aged 12–20 years, 51% reported shoulder pain within the prior 12 months.7 A US study of female swimmers aged 8–77 years found that 18.6-22.6% reported significant pain and disability.3 Although definitions of pain and disability vary among these studies, it appears that there are differences in rates of shoulder pain across geographical regions and age-groups.
Several risk factors for shoulder pain have been identified in the literature. Tate et al. found that youth swimmers with shoulder pain, disability, and dissatisfaction reported a greater history of shoulder trauma, had greater years of competitive swimming experience, and had less participation in another sport compared to their less symptomatic counterparts.3 However, this study included only female swimmers from a single geographical region of the US.3 Since female youth competitive swimmers have reported a higher prevalence of shoulder pain than males7 and train-
ing practices can differ across geographical regions, a widescale study including males and females across different geographical regions of the US would provide more generalizable data to identify swimmers at risk for shoulder pain and disability who may ultimately benefit from a prevention or intervention program.
Due to the paucity of large-scale studies identifying symptoms in competitive swimmers, the primary purpose of this study was to determine the prevalence of shoulder pain, disability, and dissatisfaction with current level of function of the shoulders in youth competitive swimmers aged 9–17 years over a diverse geographical area of the US. Additional aims of this study were: (1) to determine the influence of age, competitive swimming experience, and previous history of shoulder pain that interfered with practice/ competition or traumatic injury on shoulder pain, disability, and dissatisfaction, and (2) to determine if differences in sex, geographic area, and participation in a second sport relate to reported shoulder pain, disability, and dissatisfaction.
A multi-site cross-sectional survey design was used.
YMCA or USA club swimming association teams and their swimmers in the following age groups were recruited for the study: 9 to 10 years-old, 11 to 12 years-old, 13 to 14 years-old, and 15 to 17 years-old. Parents/guardians and swimmers were invited to participate through an information sheet explaining the study and provided informed consent/assent. This study was approved by both the University of Southern California Institutional Review Board and the Arcadia University Institutional Review Board.
Parents/guardians and swimmers completed a swimmer survey and coaches completed a coach survey developed by the authors as part of a larger study The results of the swimmer surveys collected between 2015 and 2018 are presented in this manuscript. The swimmer survey requested anthropomorphic data including age, sex, height, weight, and swimming and training data including competitive agegroup, primary stroke, years of competitive swimming participation, months per year of swimming, and participation in other sports. In addition, components of the Penn Shoulder Score (PSS) and the Disability of Arm Shoulder Hand (DASH) Sports were used for self-reported outcome measures. The satisfaction and pain sections of the PSS were used to rate swimmers’ satisfaction from 0-10, with 0 being not satisfied and 10 being fully satisfied with current shoul-
der function, as well as for pain at rest, with normal activity, and with strenuous activity on a numeric pain rating scale from 0-10, with 0 being no pain.8 The term “dissatisfaction” is used in this manuscript instead of “satisfaction” to enhance readability and is defined as a lower Penn satisfaction score. The DASH Sports was used to assess swimming-related disability with a score range of 4-20 points, 4 equating to having no difficulty with physical ability related to swimming and 20 equating to being unable to perform swimming tasks.9
Swimmers were also asked to describe any current symptoms they may have had using one of five options as described by Neer and Welsh: Phase 0, no pain or shoulder symptoms; Phase I, pain/ache only after heavy workouts; Phase II, pain/ache (not disabling) during and after workouts; Phase III, disabling pain during and after workouts that interferes with athletic performance; and Phase IV, shoulder pain preventing competitive sport participation.10 These surveys were administered during high training volumes of each team’s season, as confirmed by the team’s head coach. Surveys were given either in-person using paper format or electronically using online format. The online format was administered via the RedCap database management system and was identical in content to the paper format. The head coach of the team distributed the paper form or a link to the online survey via email to the parents of the team members who provided consent. Participants had one week to complete the survey after receiving it.
Participants were divided into four age-groups based on their competitive level: Group 1 = 9 to 10 years, Group 2 = 11 to 12 years, Group 3 = 13 to 14 years, and Group 4 = 15 to 17 years. Years of competitive swimming experience were divided into three groups based on the sample interquartile range: 0-25% labeled as least experienced, 26-74% labeled as moderately experienced, and 75-100% labeled as most experienced. An athlete was identified as having a history of shoulder pain if they indicated previous pain that interfered with competition or practice or if they had ever sustained a traumatic shoulder injury. Geographic region of the swimming team was divided into two groups: West included swimmers in Arizona and California, and East included swimmers in Florida, New Jersey, Pennsylvania, and Vermont.
Shoulder pain, disability, and dissatisfaction were reported for each age-group. ANOVAs with multiple posthoc comparisons were performed to determine the effect of age-groups and percentiles of years of competitive swimming experience on shoulder pain, disability, and dissatisfaction in swimmers.
Independent t-tests were used to report mean differences in pain (PSS Pain Subscale individual items, PSS Pain total), disability (DASH Sports total), and dissatisfaction comparing sex (male vs female), participation in a second sport (yes vs no), geographic region (West vs East) and presence of a history of pain or injury (yes vs no).
Two separate linear regression analyses were performed to determine how age, sex, geographic area, participation
in a second sport and prior pain or injury explained variability in pain (PSS Pain total) and disability (DASH Sports total). Independent variables were entered into the model using forward progression, with an entry criterion of 0.05 and exclusion criterion of 0.10.
Significance was set to 0.05 for all tests except those indicating a Bonferroni correction when multiple comparisons were warranted. These values are included in their respective tables. Bonferroni corrections were used first during multiple comparisons for data considering age-group and then for data considering the competitive experience of the athlete in an interquartile range. All statistical analyses were performed using SPSS (IBM, Armonk, NY).
Surveys were collected from 671 swimmers between the ages of 9 and 17 years old from YMCA and USA club swimming association teams from Arizona, California, Florida, New Jersey, Pennsylvania, and Vermont. Some swimmers did not fully complete their surveys; therefore the N of each measure differed slightly. As such, the authors were able to identify sex in 631 surveys (254 males [40.3%], 377 females [59.70%]), geographic region in 594 surveys (477 West [70.2%], 117 East [29.80%])) and participation in a second sport in 666 surveys (234 answered yes [35.1%]). Table 1 contains descriptive statistics of participants, Penn pain and satisfaction ratings, and DASH Sports ratings.
The figures represent descriptives of the prevalence of shoulder pain (Figure 1), swimmers per age group report a history of shoulder pain (Figure 2) and if they have shoulder pain today (Figure 3). Tables 2, 3 and 4 report the effects of age and swimming experience, sex, geographic area and other sports participation on reports of shoulder pain, disability and dissatisfaction with the use of their shoulder Table 5 reports the effects prior pain or injury on shoulder pain, disability and dissatisfaction with shoulder use.
The purposes of this study were to (1) determine the prevalence of shoulder pain, disability, and dissatisfaction in youth competitive swimmers, (2) determine the influence of age, competitive swimming experience, and previous history of shoulder pain or injury on shoulder pain, disability, and dissatisfaction, and (3) determine if sex, geographic area, and participation in a second sport relate to shoulder pain, disability, and dissatisfaction. To the authors’ knowledge, this is the first large scale survey study involving youth competitive swimmers in the US since the McMaster and Troup study in 1993, in which the authors reported a current shoulder pain prevalence of 10% in 13 to 14-yearold swimmers and 13% in 15 to 16-year-old swimmers.5 By comparison in the current study, the percentage of swimmers who reported having current symptoms was 21.3% of 13 to 14-year-old swimmers and 28.1% of 15 to 17-year-old swimmers. McMaster and Troup did not collect data on 9 to 10-year-olds and 11 to 12-year-olds, so direct comparisons cannot be made for these age groups.5 Possible rea-
Table 1. Swimmers’ descriptive statistics for demographics, pain, and disability
Penn Shoulder Score - Pain and Dissatisfaction Sections (0 – 10, 0 = No Pain)
DASH Sports - Swimming-Related Disability (1-5, 1 = No Difficulty)
# Includes Arizona and California and ^ includes Florida, New Jersey, Pennsylvania, and Vermont.
Figure 1. Swimmers’ self-report of shoulder symptoms according to Neer and Welsh survey format showing n number of swimmers who selected the response followed by percentage of total who chose selected response rounded to nearest whole number
sons for the higher percentage of swimmers with symptoms in the current study may include differences in swimming yardage, years of training, dryland training, and the exclu-
sion of 17-year-olds from the 1993 study; however, data is not available for comparison thereby firm conclusions cannot be made.
Figure 2. History of pain interfering with competition or practice given as percentage and number of swimmers in each age-group.
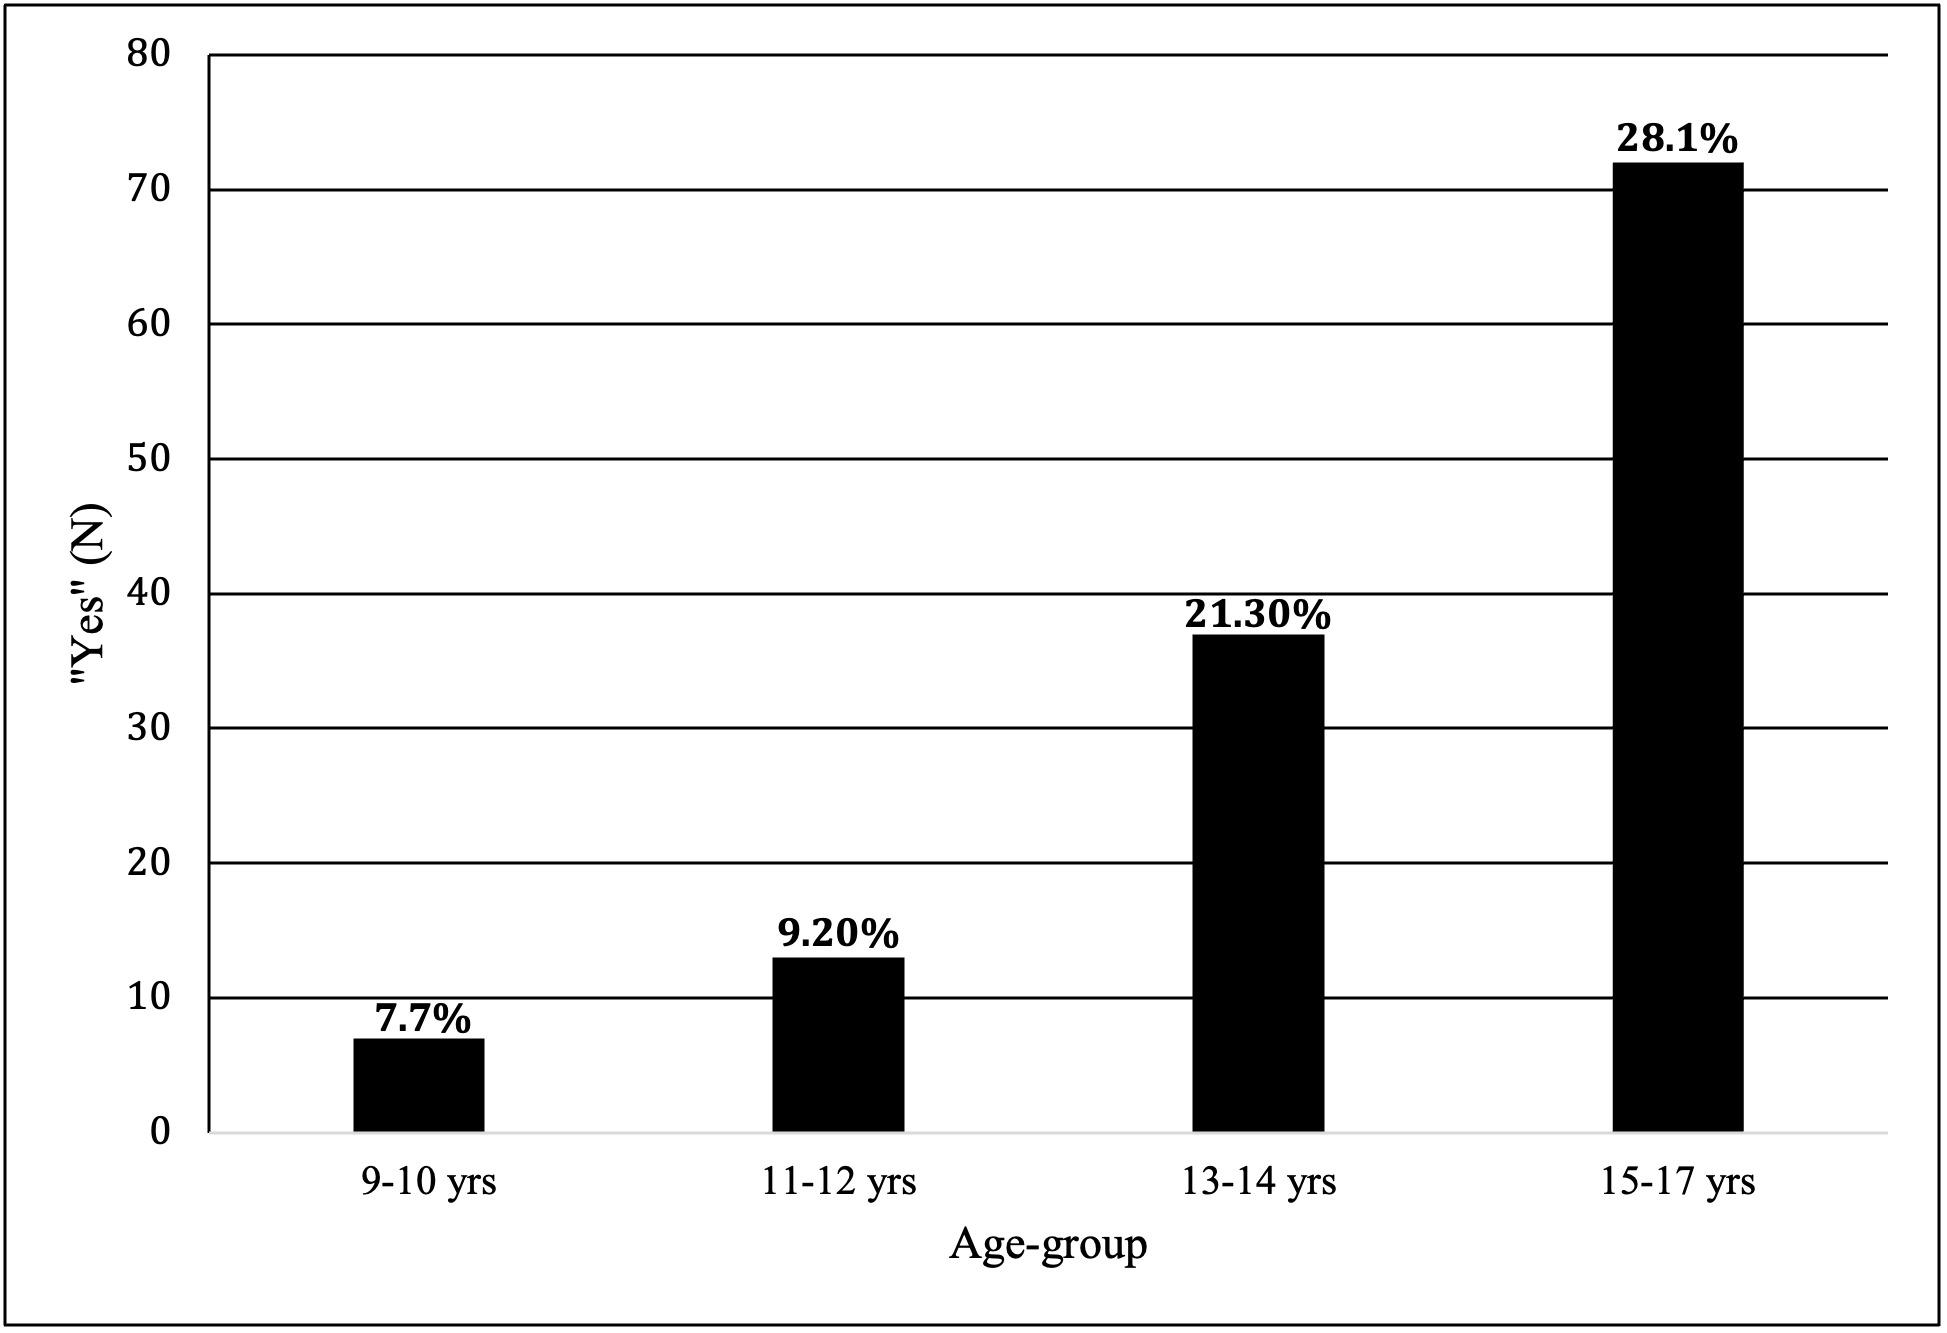
Figure 3. The number of swimmers who responded “Yes” to the question “Do you have pain today?” with the percentage of swimmers per age group above each bar.
When swimmers were asked if they had ever experienced shoulder pain interfering with practice or competition,
47.4% of the 13 to 14-year-old swimmers and 55.5% of the 15 to 17-year-old swimmers answered “yes”. This finding is similar to McMaster and Troup’s report of 46.5% of 13 to 14-year-old swimmers reporting a history of interfering shoulder pain.5 However, McMaster and Troup reported
65.5% of their 15 to 16-year-old group having a history of interfering shoulder pain, which is higher than the current study’s report of 55.5%.5 This may be due to the higher level of competition in the 1993 study participants as a subgroup of the swimmers in that prior study were invited to participate in US national training camps.5 The current
study invited swimmers of all levels within their age-groups to participate, regardless of competitive level.
As Table 1 depicts, the overall mean ratings of pain, disability, and dissatisfaction are relatively low, but about onefifth of swimmers reported some amount of swimming shoulder-related disability When swimmers were asked if shoulder pain impacted their swimming, 49% of swimmers surveyed reported having shoulder symptoms that impacted their swimming. While most swimmers reported pain/ache Phase I, only after heavy workouts (27.6%) and Phase II, during/after workouts (not disabling) (18.5%), a smaller percentage of swimmers reported Phase III, disabling pain during/after workouts (2.5%) and Phase IV, that prevents competitive participation (0.6%), as can be seen in Figure 1 For comparison, Bak and Faunø found values of 20% for Phase I, 59% for Phase II, 18% for Phase III, and 2% for Phase IV in a group of 36 swimmers from Denmark with histories of shoulder pain with a mean age of 17 11 Females made up 61% of their study participants and 36% were Na-
tional team members.11 Since subjects in that prior study were recruited based on reporting a history of shoulder pain, had older mean ages, and greater than one third competed at the national level, it may be reasonable to expect that swimmers in the Bak and Faunø study reported higher percentages of disabling and non-disabling pain during/after workouts, as well as pain that prevented participation.11 Nonetheless, the findings of the current study support the concern that reported pain after and during workouts is being experienced by swimmers in the US. Bak and Faunø recommended that swimmers be classified into these phases of disability so proper interventions can be made to prevent progression into the subsequent phase.11 Furthermore, the current authors suggest that interventions such as stroke correction, yardage moderation and guidelines, and rehabilitation/training programs, addressing swimmer-specific impairments should be studied to determine their efficacy in reducing symptom and disability progression.
Age-Group Comparison
Descriptive Statistics
4 = No Difficulty)
Penn Dissatisfaction with Shoulder Use (0-10, 0 = Not Satisfied/Dissatisfied)
Group Comparisons
DASH-Sports Total (4-20, 4 = No Difficulty)
Difference
(-1.1, 0.6), 1.000 -1.0 (-1.8, -0.2), 0.004* -1.4 (-2.2, -0.6), < 0.001*
Penn Pain Total (0-30, 30 = No Pain) 0.3 (-1.0, 1.7), 1.000 1.6 (0.3, 2.8), 0.008* 2.3 (1.1, 3.5), < 0.001*
Penn Dissatisfaction with Shoulder Use (0-10, 0 = Not Satisfied/Dissatisfied) 0.1 (-0.8, 1.0), 1.000 1.0 (0.1, 1.8), 0.020 0.9 (0.1, 1.7), 0.022
11-12 yrs vs. 11-12 yrs vs. 13-14 yrs vs. 13-14 yrs 15-17 yrs 15-17 yrs
DASH-Sports Total (4-20, 4 = No Difficulty)
-0.8 (-1.5, -0.1), 0.019 -1.1 (-1.8, -0.5), < 0.001* -0.4 (-1.0, 0.2), 0.590
Penn Pain Total (0-30, 30 = No Pain) 1.2 (0.1, 2.3), 0.024 2.0 (1.0, 3.0), < 0.001* 0.8 (-0.2, 1.7), 0.209
Penn Dissatisfaction with Shoulder Use (0-10, 0 = Not Satisfied/Dissatisfied)
*Bonferonni-Adjusted α 0.017
0.8 (0.1, 1.6), 0.023 0.8 (0.1, 1.5), 0.023 -0.1 (-0.7, 0.6), 1.000
Table 3. Competitive swim experience effect on shoulder pain, disability, and dissatisfaction
Descriptive Statistics
4 = No Difficulty)
Pain Total (0-30, 30 = No Pain)
Penn Dissatisfaction with Shoulder Use (0-10, 0 = Not Satisfied/Dissatisfied)
Group Comparisons
Total (4-20, 4 = No Difficulty)
Penn Pain Total (0-30, 30 = No
Penn Dissatisfaction with Shoulder Use (0-10, 0 = Not Satisfied/Dissatisfied)
*Bonferonni-Adjusted α = 0.017
INFLUENCE OF AGE, EXPERIENCE AND HISTORY OF PRIOR SHOULDER PAIN OR INJURY
In the current study, the percentage of “pain interfering with competition or practice” increased with each swimming age-group from 11.1% for the 9 to 10-year-olds to 55.5% for the 15 to 17-year-olds, as can be seen in Figure 2 The largest percentage difference between chronological age-groups was 22.8% between the 11 to 12-year-olds and 13 to 14-year-olds. Figure 3, which displays the number and percentage of swimmers who had shoulder pain at the time of the survey, demonstrates the largest percentage difference, 12.1%, between these age groups as well. This coincides with mean peak height velocity, defined as the period when a child experiences the fastest upward growth in stature,12 in females at 11 years and males at 13 years,13 which could explain the large percentage difference in pain found in this sample of swimmers. Increased training volume occurring near the time of peak height velocity can increase likelihood of injury,14 a phenomenon which has also been demonstrated in youth soccer players.15 With changes in body size, muscle mass, and maturation of the neuromuscular system, an athlete’s performance may improve naturally without specific intervention.16 In youth competitive swimmers, significant improvement in performance over the course of one year was shown to be strongly correlated with anthropomorphic changes while biomechanical variables remained relatively unchanged.17 However, shortly after a growth spurt, there is rapid longitudinal growth in bone with a delay of muscle length growth that leads to relatively rapid muscle lengthening and increases in resting tension of muscles, which limits overall amount
of force production and reduces neuromuscular control.16 Therefore, it may be important for swimming coaches to consider sudden or recent developmental skeletal growth when implementing and executing swim training programs to mitigate potential risk for injury
While the chronological age of the swimmer in the current study was related to shoulder pain, the years of competitive swimming experience is another factor that might affect a swimmer’s shoulder pain, disability, and dissatisfaction. The results demonstrate that pain and disability increase with age and years of competitive swimming experience. Specifically, 15 to 17-year-olds had significantly more pain and disability than 11 to 12-year-olds. Moreover, 13 to 14-year-olds and 15 to 17-year-olds had significantly more pain and disability than 9 to 10-year-olds. Likewise, moderately to most experienced swimmers had significantly more pain and disability than less experienced swimmers, which show that pain and disability may evolve over time and with a cumulative volume of training. Consistent with Tate et al., despite only collecting data on females, swimmers also reported increased pain, disability, and dissatisfaction with more competitive experience.3 Using ultrasound imaging, Dischler et al. demonstrated that years of swimming participation were directly associated with supraspinatus tendon thickening and declining function using the Western Ontario Rotator Cuff score.18 Another study of swimmers utilized MRI to demonstrate a direct positive correlation between supraspinatus tendon thickening and tendinopathy with years of experience and volume of training.6 With these previous swimming studies detailing progressive pain, disability, and morphological tendon changes as volume and experience increase, care must be taken when de-
Table 4. Sex, geographic area, and other sport participation effects on shoulder pain, disability, and dissatisfaction
Total
4 = No Difficulty)
Dissatisfaction with Shoulder Use (0-10, 0 = Not Satisfied/Dissatisfied)
Total (4-20, 4 = No Difficulty)
Dissatisfaction with Shoulder Use (0-10,
* Significance at α 0.05. Descriptive statistics and comparisons across 3 categorical groups. # Includes Arizona and California and ^ includes Florida, New
Table 5. Regression models for pain, disability, and dissatisfaction
DASH-Sports Total
Pain Total (0-30, 30 = No Pain)
Equation Y = 22.364 + 3.367B - 0.118B2
Dissatisfaction (0-10, 0 = Not Satisfied)
signing training programs for more experienced swimmers to minimize and prevent further shoulder pain and disability
Additionally, the authors suggest that surveillance and prevention measures should be considered at younger ages and experience levels to attempt to prevent shoulder dysfunction leading to tissue pathology, which may negatively impact swimming performance. Longitudinal studies are needed to determine if there is a long-term consequence of shoulder pathology in youth on shoulder disability as adults.
It is important to note that while the findings show statistically significant differences among groups, the threshold for Minimum Detectable Change (MDC) and Standard Error of Measurement (SEM) for the PSS and the DASH were not reached, indicating that the differences are not clinically significant. MDC and SEM values for the Penn Pain subscale were reported as 5.2 and 3.8, respectively, and the Penn Satisfaction subscale results were reported as 1.3 and 1.8, respectively.8 For the complete DASH measure, MDC was reported as 12.8 and SEM as 7.619; however, clinically meaningful thresholds for the DASH subscales, such as the DASH Sports, have not been previously reported. Therefore, the authors cannot conclude whether the statistically significant differences are clinically significant or meaningful.
Reported history of previous shoulder pain that interfered with competition/practice or traumatic injury significantly predicted higher levels of current pain, sports-related disability, and dissatisfaction with the use of the swimmers’ shoulder(s). Additionally, more competitive years of experience significantly predicted higher levels of pain. This is consistent with the findings of McMaster & Troup, who reported that the prevalence of shoulder pain increased with more participation time in swimming.5 Given the consistency of results, it is advantageous and beneficial for coaches and clinicians to be aware of any prior history of shoulder pain or traumatic shoulder injury in their swimmers, understanding the association of this with further pain, disability, and dissatisfaction. Effective interventions should be developed for these at-risk individuals.
When comparing the swimmers geographically, significant differences were identified in reported pain and disability between Eastern and Western teams, with Eastern teams reporting greater pain and disability Further studies should investigate training methods, including yardage and dry land training to determine if these vary between the Eastern and Western regions of the US, which may explain differences found in the reported pain and disability findings in the current study Interestingly, swimmers who participated in a second sport reported significantly less dissatisfaction than swimmers who participated in swimming only Evidence of dissatisfaction in sport specialized athletes is limited, but athletes who participate in a single sport and a predominantly individual sport like swimming may be at risk for social isolation, overdependence, burnout, ma-
nipulation, injury, and compromised growth and maturation.20 Thirdly, no significant differences were found in shoulder pain, disability, or dissatisfaction between male and female swimmers. This contradicts previous research findings that female competitive swimmers had a higher prevalence of pain than males.7 More research is needed to assess whether sex differences in shoulder pain, disability, and dissatisfaction exist to raise athletes’ and coaches’ awareness as well as optimize pain prevention strategies.
This study has several limitations. While data were captured from a broad geographical area in six states, data from regions in the middle of the country were not represented, and a majority of the participants were from the Western region of the US. In addition, surveys were administered in two different formats: paper and online. The online format allowed for survey distribution to more regions, but research personnel were unable to speak in-person to coaches and teams to explain the study, instead relying on coaches to relay information to their teams and parents. As this research focused on youth across different ages with various levels of comprehension and understanding, survey response accuracy may be a limitation. Another limitation was that a direct comparison to McMaster and Troup5 cannot be made since they also studied swimmers at higher level of competition than the current study with slightly different age groups. Lastly, while some findings were statistically significant, the differences did not reach the thresholds for MDC and SEM, so clinicians should use caution when integrating these results in their clinical decision-making.
This survey study of 671 swimmers from six states identified the prevalence of shoulder pain, disability, and dissatisfaction within the four competitive US swimming youth age-groups. Forty-nine percent of swimmers surveyed reported having shoulder symptoms that impacted their swimming. Consistent with prior studies, older swimmers and those with more years of swimming experience had a higher prevalence of shoulder pain and disability, and prior history of shoulder pain or injury was associated with higher rates of current pain and disability Participation in a second sport other than swimming was associated with increased satisfaction regarding shoulder function. Overall, the current study adds to the body of evidence related to factors and risk profiles of youth swimmers across two regions of the US who report increased shoulder pain and disability It may guide clinicians and coaches in designing safe and effective performance and rehabilitation programs for swimmers.
CORRESPONDING AUTHOR
Brian D Stirling, Stanford Health Care, Redwood City, CA 94063 United States
Telephone number: +1 (609) 273-2257
Email address: stirlingdpt@gmail.com
Lori A. Michener serves on the advisory board for Operative versus non-operative treatments for atraumatic rotator cuff tears: a multicenter randomized controlled trial (PI: Nitin Jain, MD, MPH) for NIAMS and PCORI, and she also served as Vice President for the APTA Academy of Orthopedic Physical Therapy from 2017 – 2023. Jonathan C. Sum received USC Division of Biokinesiology and Physical Therapy support for registration and travel for the ASSET Annual
Meeting in 2022 and 2023, and serves on the executive board for ASSET as a volunteer.
The authors thank Kathryn Ayoob, Anthony Blubello, David Blum, Maggie Bryant, Jocelyn Chang, Jessica Curran, Alyssa Peterson, Jenna (Hankard) Somasundaram, Rini Varghese, Chelsea Weedman, Garin Wyberg, Christine Yim and Bonnie Zeigler for assistance with data collection and organization.
Submitted: November 18, 2023 CDT, Accepted: June 17, 2024 CDT
© The Author(s)
This is an open-access article distributed under the terms of the Creative Commons Attribution 4.0 International License (CCBY-NC-4.0). View this license’s legal deed at https://creativecommons.org/licenses/by-nc/4.0 and legal code at https://creativecommons.org/licenses/by-nc/4.0/legalcode for more information.
1. Swimming participation in the U.S. 2011-2021. Statista Research Department. Published June 9, 2023. https://www.statista.com/statistics/763709/ swimming-on-a-team-participants-us/
2. Pink MM, Tibone JE. The painful shoulder in the swimming athlete. Orthop Clin North Am. 2000;31(2):247-261. doi:10.1016/ S0030-5898(05)70145-0
3. Tate A, Turner GN, Knab SE, Jorgensen C, Strittmatter A, Michener LA. Risk factors associated with shoulder pain and disability across the lifespan of competitive swimmers. J Athl Train. 2012;47(2):149-158. doi:10.4085/1062-6050-47.2.149
4. Hibberd EE, Myers JB. Practice habits and attitudes and behaviors concerning shoulder pain in high school competitive club swimmers. Clin J Sport Med 2013;23(6):450-455. doi:10.1097/ JSM.0b013e31829aa8ff
5. McMaster WC, Troup J. A survey of interfering shoulder pain in United States competitive swimmers. Am J Sports Med. 1993;21(1):67-70. doi:10.1177/036354659302100112
6. Sein ML, Walton J, Linklater J, et al. Shoulder pain in elite swimmers: Primarily due to swim-volumeinduced supraspinatus tendinopathy. Br J Sports Med. 2010;44(2):105-113. doi:10.1136/bjsm.2008.047282
7 Tessaro M, Granzotto G, Poser A, Plebani G, Rossi A. Shoulder pain in competitive teenage swimmers and its prevention: A retrospective epidemiological cross sectional study of prevalence. Int J Sports Phys Ther. 2017;12(5):798-811. doi:10.26603/ ijspt20170798
8. Leggin BG, Michener LA, Shaffer MA, Brenneman SK, Iannotti JP, Williams GR. The Penn Shoulder Score: Reliability and validity J Orthop Sports Phys Ther 2006;36(3):138-151. doi:10.2519/ jospt.2006.36.3.138
9. Beaton DE, Wright JG, Katz JN, et al. Development of the QuickDASH: Comparison of three itemreduction approaches. J Bone Jt Surg - Ser A. 2005;87(5). doi:10.2106/JBJS.D.02060
10. Neer CS, Welsh RP The shoulder in sports. Orthop Clin North Am. 1977;8(3):583-591. doi:10.1142/ 9789812388919_0009
11. Bak K, Faunø P Clinical findings in competitive swimmers with shoulder pain. Am J Sports Med 1997;25(2):254-260. doi:10.1177/ 036354659702500221
12. Lloyd RS, Oliver JL. The youth physical development model: A new approach to long-term athletic development. Strength Cond J 2012;34(3):61-72. doi:10.1519/ SSC.0b013e31825760ea
13. Rogol AD, Clark PA, Roemmich JN. Growth and pubertal development in children and adolescents: Effects of diet and physical activity. Am J Clin Nutrit. 2000;72(2 Suppl):521S-8S. doi:10.1093/ajcn/72.2.521s
14. DiFiori JP Overuse injuries in young athletes: An overview. Athl Ther Today. 2002;7(6):25-29. doi:10.1123/att.7.6.25
15. Bult HJ, Barendrecht M, Tak IJR. Injury risk and injury burden are related to age group and peak height velocity among talented male youth soccer players. Orthop J Sport Med Published online 2018. doi:10.1177/2325967118811042
16. Corso M. Developmental changes in the youth athlete: Implications for movement, skills acquisition, performance and injuries. J Can Chiropr Assoc. 2018;62(3):150-160.
17 Moreira MF, Morais JE, Marinho DA, Silva AJ, Barbosa TM, Costa MJ. Growth influences biomechanical profile of talented swimmers during the summer break. Sport Biomech 2014;13(1):62-74. doi:10.1080/14763141.2013.865139
18. Dischler JD, Baumer TG, Finkelstein E, Siegal DS, Bey MJ. Association between years of competition and shoulder function in collegiate swimmers. Sports Health. 2018;10(2):113-118. doi:10.1177/ 1941738117726771
19. McConnell S, Beaton D, Bombardier C. The DASH Outcome Measure User’s Manual. Institute for Work & Health; 1999.
20. Malina RM. Early sport specialization: Roots, effectiveness, risks. Curr Sports Med Rep. 2010;9(6):364-371. doi:10.1249/ JSR.0b013e3181fe3166
Flore Z, Welsch G, Bloch H. Return to Play Assessment After Lateral Ankle Sprains –German Male Elite Youth Football (Soccer) Academy Baseline Data. IJSPT. Published online July 1, 2024:976-988. doi:10.26603/001c.120201
Zacharias Flore1,2a , Götz Welsch3,4 , Hendrik Bloch5
1 School of Sport and Exercise Sciences, University of Kent, 2 Medical Department, 1. FC Magdeburg, 3 UKE-Athleticum, University Medical Center Hamburg-Eppendorf, 4 Department of Trauma and Orthopaedic Surgery, University Medical Center Hamburg-Eppendorf, 5 Bezirksverwaltung Bielefeld, Verwaltungs-Berufsgenossenschaft (VBG)
Keywords: ankle sprains, elite football, rehabilitation, return to play https://doi.org/10.26603/001c.120201
Background
Lateral ankle sprain (LAS) is one of the most common types of injury in football (soccer). Normative baseline data of performance tests for Return to Play (RTP) decision are still lacking.
Purpose
The primary aim of this study was to generate baseline values for uninjured elite youth football players for a multifactorial RTP assessment and compare with previously published data. A secondary aim was to investigate the use of the Limb Symmetry Index (LSI) as a method to determine whether an athlete passes a performance test or not.
Study Design
Observational Cohort study
Methods
Baseline data of performance tests (Y-Balance [YBT-LQ], Heel Rise [HRT]; Singe Leg Squat [SLST]; Single Leg Drop Jump [SLDJ]; Side Hop [SHT]; Figure of 8 Hop [F-8]; Modified Agility T-Test [MAT]) were assessed in 20 elite youth football players, aged 16-21 years. Additionally, the traditional LSI (dividing the result of the non-dominant leg by the result of the dominant leg and multiplying by 100) and directionally corrected LSI (the worst value is divided by the better value and multiplied by 100) were calculated. The test values were compared to previously reported study results. LSI and side-to-side comparisons between dominant and non-dominant leg sides were analyzed using the Wilcoxon test.
Results
Male elite youth football players achieved better results in the dynamic performance tests (SHT, F-8, and MAT) compared to reference values of the cohorts previously described in the literature: YBT-LQ total score (cm) dominant (dom) 99.3±8.3, non-dominant (ND) 99.5±10.4; HRT (average number) dom. 27.1±5.4, ND 25.2±5.1); SLDJ height (cm) dom 15±5, ND 15±5 and contact time (sec) dom 0.29±0.08, ND 0.29±0.07, Reactive Strength Index (RSI) dom 0.52±0.12, ND 0.50±0.13); SHT (sec) dom 7.12±0.73, ND 7.39±0.93; F-8 (sec) dom 10.52±1.02, ND 10.37±1.04; and MAT (sec) 5.82±0.22. Directionally corrected LSI differed significantly from the traditional calculated LSI (p<0.05).
Corresponding author:
Zacharias Flore
University of Kent, School of Sport and Exercise Sciences Kapellenstraße 8a 39104 Magdeburg, Germany zf43@kent.ac.uk +4915203090096 a
The findings of this study highlight the need to determine specific baseline data for RTP testing in male elite youth football players after LAS. The traditional LSI should not be used as a “stand alone method” for determining RTP. LSI calculations should consider the direction of asymmetry to determine passing a performance test or not.
Level of evidence 3b
Ligamentous ankle injury is one of the most common types of injury in sports, especially in sports characterized by multi-directional movement patterns such as cutting, startstop loading, or frequent jumping and landing.1 The injury rate of ligamentous ankle injuries is particularly high in soccer (football): 10-21% of all injuries occurring in football involve the ankle.2,3 In professional youth football, the prevalence is 9-19%.4‑9 A large proportion (75%) of these injuries involve the lateral ligaments.3 Thus, the later al ligament injury of the ankle joint is, in total, one of the most common types of injury in football, and the ankle joint is the third most frequently injured region (12.9%), along with injuries to the knee (15.2%) and the thigh (25.0%).10 In addition, up to 20% of affected athletes who sustain ankle injuries develop functional or mechanical ankle instability 11
For the most part, rehabilitation is still managed in a time-based manner based on clinical impressions and experience of the physician and/or therapist. Nevertheless, an international consensus has defined return to sports as a continuum emphasising a graded, criterion-based progression.12 Furthermore, a more recent and complex model underlines the importance of objective criteria for return to play decision making.13 While there is widespread consensus on the measures and criteria for a return to competition (RTC),14,15 there are few criteria-based rehabilitation programs and test batteries after lateral ligament injury of the ankle joint in sport.16,17
For this reason, the German statutory accidental insurance for professional athletes (VBG) organized a consensus conference “Return to Competition after Ankle Injuries” in cooperation with the German Federal Institute of Sport Science. Participants included experts from different fields and disciplines, such as rehabilitation medicine, sports medicine, orthopaedics and surgery, physiotherapy, and sports science. After the consensus conference, a manual for a multifactorial return to play test battery was published.18 The results of the multifactorial test battery were proposed to be used for an interdisciplinary exchange (“shared decision-making”) of the stakeholders involved in the rehabilitation process for the assessment of the athlete’s unrestricted participation in team training.19 In addition to addressing the clinical release for testing and the recording of the subjective perception of the athletes, the test battery focuses on the testing postural control, ankle muscle strength, hopping, jumping and landing quality, as well as agility. The order, setup and execution of the corresponding tests is described in the test manual.18 Overall,
the final test battery considers the domains of: Pain, Ankle impairments, Athlete perception, Sensorimotor control, and Sport/functional performance of the PAASS-Framework.20
Due to the frequent lack of sport-specific orientation or individual reference values, the comparison between injured and uninjured leg side (Lower Limb Symmetry Index, LSI) was established in the interpretation of test results. With the help of the LSI, a possible deficit on the affected side of the leg can be objectified during strength or jump tests. However, ligament injuries to the knee and ankle lead to changes in the somatosensory cortex and motor cortex. Therefore, bilateral strength or control deficits and altered movement patterns can be the consequence.21 Examinations of subjects with anterior cruciate ligament injuries have revealed deficits on the uninjured side when compared to healthy controls. The mere use of the LSI in the context of a return-to-play test must therefore at least be questioned.22 The primary aim of this study was to generate baseline values for uninjured elite youth football players for a multifactorial RTP assessment and compare with previously published data. A secondary aim was to investigate the use of the Limb Symmetry Index (LSI) as a method to determine whether an athlete passes a performance test or not. Both of these aims will allow professionals to able to take these values into account as an additional factor in the decision to return to sport.
Players from three German youth football teams (U17, U19, U21) of one elite youth football academy were recruited after the study project had been presented verbally and written to the head coaches and players. Players had to be older than 16 years at the time of testing to be included in this study All participants or their legal guardians gave their written consent to participate in the study Withdrawal was possible at any time without giving reasons or expected disadvantages. The study was approved by the Ethics Committee of the Hamburg Medical Association (PV6090).
20 uninjured male youth players were recruited. All included players trained and played without external ankle stabilization. Of all players, leg dominance was recorded as the leg with which the player preferred to kick the ball.
The Lower Limb Symmetry Index (LSI) was used for the side-by-side comparison of the jump tests. The LSI was formed in the cohort of uninjured players by dividing the result of the non-dominant leg by the result of the dominant leg and multiplying by 100.23,24 Typically, an LSI cutoff of ≥90% is used to classify a side difference as normal. This carries the risk that asymmetries are overlooked to the detriment of the supposedly better leg side, when using the magnitude of between-limb deficits alone.25,26 Therefore, the LSI in this study was also calculated directionally corrected (LSIdc), in which the worst value (regardless of dominant or non-dominant limb) is divided by the better value and multiplied by 100.26,27
Prior to the test, the subjects performed a fifteen-minute standardized warm-up program consisting of a five-minute run on the treadmill at a standard speed of 11 km/h followed by ten minutes of movements of the hip, knee and ankle joints, balance, core stabilization and bodyweight exercises, as well as jumping and landing exercises and change-of-direction runs (Supplemental Material 1).
Initially, all tests were performed with the dominant leg. To avoid bias due to the influence of footwear, both the YBalance Test (YBT-LQ), Heel Rise Test (HRT), and Single Leg Squat Test (SLST) were performed without shoes. All other dynamic assessments were performed with footwear, the T-Test on artificial turf with appropriate football cleats. One trial was permitted prior to the testing followed by the judged assessments. Detailed test descriptions are presented in supplementary material (Supplemental Material 2).
Postural control was tested using the YBT-LQ and a corresponding test kit (Perform Better, Munich, Germany). Prior to testing, leg length was measured bilaterally in the supine position with a tape measure from the anterior superior iliac spine (ASIS) to the medial malleolus and this measurement was utilized for normalization.28
The HRT measures the eccentric and concentric muscle strength of the plantar flexors during a single-leg heel raise.29 The rhythm during completion of heel raises every two seconds, was controlled by a metronome app (Metronome Beats, version 4.3.1). The maximum number of completed repetitions per leg side was counted.
The SLST was used to assess the function of the hip abductors. The test was performed in single-leg stance on a 24 inch plyo jump box with arms crossed in front of the chest.30 An experienced physiotherapist assessed the quality of movement using five objective criteria (Table 1).31
The Single Leg Drop Jump is a common method to evaluate jump performance (e.g. jump height, reactive strength index) and dynamic postural stability.32‑34 The player was instructed to drop from a 20-centimeter-high box with their hands resting on their hips at their sides by stepping forward without jumping off Movement quality was assessed using the objective criteria of the Single-Leg Landing Error Scoring System (SL-LESS) in the sagittal and frontal (Table 2).35 The reactive jumps were recorded with an optical measuring instrument (Optojump, Microgate USA, Mahopac (NY), version 1.10.19) and also recorded using a 50 Hz HD camera (Sony HDR-CX405, Tokyo, Japan) for the purpose of retrospective evaluation (SL-LESS).
The SHT can be used to identify players with chronic ankle instability.36 The individual hops with their standing leg over two tape strips, placed at a distance of 30 centimetres apart on a start command.37 The player was instructed to complete 10 hops as quickly as possible. A hop was considered invalid if the test person fell down, touched the tape on landing, or if the contralateral foot was set down. Once per leg, the hop was performed as a trial (80 per cent of maximum power) and twice as a measured attempt, with a one-minute break between the trials. The time in how many seconds the subject performed 10 complete hops per leg was measured by using a commercially available stopwatch and was rounded to the second decimal place. The LSI and LSIdc were also calculated for side-by-side comparisons.
The Figure-of-8-Hop exhibits excellent reliability and is helpful in identifying athletes with ankle instability.36 The individual was instructed to hop a figure of eight around slalom poles (distance of five meters) on one leg as quickly as possible, twice in succession. The time needed to complete the parcous twice was measured in seconds. A light barrier system (Brower, TCI timing, Draper, USA) recorded the duration of the trial. The time was rounded to the second decimal place. The LSI and LSIdc were also calculated for side-by-side comparisons.
Reacting quickly to a stimulus, starting and stopping repeatedly, and fast direction changes are permanent and performance determining elements of sports. Change of di-
Table 1. Objective rating criteria for single leg squat. Adapted from Perrot et al. (2012)31
Single Leg Squat
Good
Overall impression
• Smooth, good quality movement
• General control
• Controlled change-over between repetitions
• Ease of movement
Weight transfer
• Minimal translation of centre of mass
• Upright trunk
Lumbar spine & pelvic alignment
• Minimal movement in all three phases
• Frontal plane: ASIS level
• Sagittal plane: A-P tilt, rotation
• Lateral view: stable lordosis, minimal trunk flexion
Leg alignment
• Minimal movement out of the starting plane of movement. This takes into account the alignment of the limb, influenced by pelvic width, and Q angle at the knee
Foot alignment
• Neutral foot position – remains stable during movement
A-P, anterior-posterior; ASIS, anterior superior iliac spine
rection (COD) speed and COD situations should be evaluated during a RTP assessment.20 Following the distance specifications of Sassi, Dardouri & Yahmed et al. 2009, the MAT was completed outdoors on a certified artificial turf training pitch (Heiler Master 40/200) in firm ground football cleats (FG).38
STATISTICAL ANALYSIS
All statistical analyses were carried out using IBM SPSS Statistics V.25 (IBM, Amonk, New York, USA). Continuous data are expressed as the mean, standard deviation (SD), median, and range, and categorical data are expressed as frequency counts (percentages). The significance level was set to p<0.05. LSI and side-by-side comparisons between dominant and non-dominant leg sides were analyzed using the Wilcoxon test.
20 uninjured male youth players (age 18.4 ± 1.5 years, height 177.4 ± 5.8 cm, body weight 74.6 ± 5.3 kg) participated. For three quarters the players, the right leg was the dominant leg and for one quarter, the left leg.
Table 3 presents the results of the YBT-LQ for the dominant leg and the opposite side as a raw score and as a score normalized to leg length. In addition to the individual ranges, side differences and the total score are also presented.
• Staggered movement
Poor
• Increased speed to attempt to control movement
• Effort to control movement
• Trunk "wobble“
• Discernible translation of center of mass
• Trunk leaning forward or side
• Extended time to transfer
• Discernible movement with pelvis tilting up or down, rotating toward or away from weightbearing leg, tilting in anterior or posterior direction
• Lumbar lordosis increasing or trunk flexion occuring
• Discernible movement out of the starting plane of movement
• Excessive pronation of foot during squat descent
• Externally rotated starting position of lower leg / foot
The results of the HRT show a wide inter-individual range of the number of repetitions. Of note, the best players achieved twice as many repetitions as the worst players (Table 3).
For all players, the movement execution of the SLST was rated as good in all categories (overall impression, weight transfer, lumbar spine, and pelvic alignment, leg axis, and foot position).
The qualitative assessment of the SLDJ with the help of the SL-LESS was scored, on average, a 2.6 for both leg sides, which corresponds to mediocre movement quality The direction-corrected LSI of the jump height (p=0.006) and the ground contact time (p=0.002) is significantly lower than the conventionally calculated LSI. The results of the SLDJ are summarized in table 4 With the traditional LSI, three players (15.0%) were below the recommended cut-off of 90% asymmetry for the ground contact time and five players (25.0%) for jump height. When using the LSIdc, nine players (45%) were identified for the ground contact time and 13 players (65%) for the jump height.
Table 2. Objective rating criteria for SL-LESS. Adapted from O´Connor (2015)35
1 Forward Trunk Flexion at IC
2 Knee Flexion at IC
3 Ankle Plantarflexion at IC
Sagittal plane
Frontal plane
4 Forward Trunk Flexion Displacement
5 Knee Flexion Displacement
6 Ankle Dorsiflexion Displacement
7 Knee Valgus at IC
8 Lateral Trunk Flexion at IC
9 Knee Valgus Displacement
At IC the trunk is vertical or extended on the hips The trunk is flexed on the hips
At IC the knee is flexed more than 30°
The foot lands heel to toe or with a flat foot
The knee is not flexed more than 30°
The foot of the test leg lands toe to heel
Between IC and MKF there is no additional trunk flexion There is additional trunk flexion
Between IC to MKF the knee does not flex additional 30° The knee flexes an additional 30°
Between IC and MKF the heel does not touch the ground or the ankle does not move into a dorsiflexed position during landing
At IC, a line drawn straight down from the center of the patella is medial to the midfoot
At IC, the midline of the trunk is flexed to the left or the right side of the body
At MKV a line drawn straight down from the center of the patellar runs through the great toe or is medial to the great toe
10 Pelvic Drop During landing the contralateral pelvis positioned lower than the ipsilateral pelvis
11 Tibial Rotation (toe point in / out)
Between IC and MKF the foot is internally / externally rotated more than 30°
For the Side Hop, there was a non-significant trend (p=0.067) for slower times achieved with the non-dominant leg compared to the dominant leg side. The direction-corrected LSI was significantly less than the conventional LSI (p=0.001, Table 4). With the traditional LSI, two players (10.0%) were below the recommended cut-off of 90% asymmetry, while five players (25%) were identified when using the LSIdc.
FIGURE-OF-8-HOP
There was a tendency for faster times on the non-dominant leg side in all age groups, although these were not statistically significantly different. The direction-corrected LSI was significantly less than the conventional LSI (p=0.043, Table 4), but no player had a side difference >10% neither for the tradional LSI nor the LSIdc.
AGILITY T-TEST (MAT)
The mean time for the best of the two trials of the MAT was 5.81 (± 0.22) seconds (range 5.37 – 6.18) (Table 4). In 35% (7/20) of the cases, the first attempt was faster than the second trial, but there was no statistically significant difference (p=0.349) between trials. Within subjects, the dif-
The heel touches the ground and the ankle becomes dorsiflexed during landing
The line goes through the midfoot
The trunk is not flexed to the left or the right side of the body
The line is lateral to the great toe
Both sides of the pelvis remain level
If the foot is not internally / externally rotated more than 30°
ference between the two trials ranged from 0.01 sec to 0.15 sec.
There is a wide range of test results due to heterogenous study cohorts (age, sports, elite vs. non-elite level) reported in the literature. The heterogeneous data of previous reports hampers a direct comparison. The results of this investigation demonstrate that male elite youth football players achieved better results in the dynamic performance tests (SHT, F-8, and MAT) compared to reference values of the cohorts previously described in the literature. Previously reported study results and results of this investigation are summarized in Supplemental Material 3.
This study presents baseline data from uninjured elite youth football players for the components of a multifactorial ankle sprain RTP assessment. Male elite youth football players achieved better results in the high dynamic performance tests (SHT, F-8, and MAT) compared to results of the cohorts previously described in the literature. The current results can be used as baseline or standard values during the rehabilitation process of elite youth footballers. The results also highlight the need to interpret LSI calculations with caution and should encourage professionals to consider the direction of the asymmetry
Table 3. Results of the Y-balance Test and the Heel Rise Test (n=20)
Test Dominant leg
Y-Balance Test
Reach direction difference between limbs
Heel Rise Test
Heel Rise Test
ANT, anterior; PM, posteromedial; PL, posterolateral
Table 4. Results of the Single Leg Drop Jump, the Side Hop and Figure-of-8-Hop and T-Test (n=20)
Side Hop
Figure-of-8-Hop
Mod. Agility T-Test
When interpreting the results of the YBT-LQ, age, performance, and sport-specific differences are described in the literature, which underlines the need for target group-specific standard values.39 Butler, Lehr & Fink et al. found out that American football players with a total score below 89.6% are 3.5 times more likely to be injured during the season.40 There are also indications that in male football players, injury risk increases with poorer or more asymmetrical YBT-LQ scores.41 Gonell et al. 2015 showed that male elite and amateur soccer players with a total score of less than or equal to 99.9% are two times more likely to be injured.42
In the current study, total YBT scores on the dominant leg side of two players (10.0%) were below 89.6%, seven players (35.0%) were below 94.0% and ten players (50%) were below 99.9%. On the non-dominant leg side, three players (15%) were below 89.6%, seven players (35.0%) were below 94.0% and ten players (50%) were below 99.9%. Two players (10%) were below 89.6% on both sides, three players (15.0%) were below the 94.0% on both sides and seven players (35.0%) were below the 99.9% on both sides. When considering lateral differences, different cut-off values are described for assessing asymmetries that are associated with an increased risk of injury 39 In male professional football, it has been shown that a posteromedial range difference of four centimeters or more is associated with an almost fourfold higher probability of a non-contact injury during the season.42 In this study, 45.0% (9/20) of the players had a posteromedial range difference of four centimeters or more.
The results of the HRT show comparable results for the dominant leg (27.1±5.4) to previously published values of healthy, non-athletic male subjects (mean age 34.7 ± 8.5 years) who achieved an average of 27.8 repetitions (± 11.5).29 For the ND leg, less repetitions were achieved (25.2±5.1). The norm values published by Hébert-Losier et al. 2017 cannot be used for comparison because in their study heel rises were performed on a 10° incline.43
In the current study, all players were able to achieve good results in the SLST This differs considerably from the results from Norwegian female competitive football and handball.44 Even though the SLST was modified in the study of the female athletes, it should be noted that only around 34% of the female players examined had good hip control and around 17% had good knee control. One explanation for this could be gender-specific differences in motor strategies when performing the SLST 45 However, a study of male and female high school athletes also showed that only 49% performed satisfactorily.46 In a study of physically active adults, only around 6% performed poorly 47 In contrast to the U14 players in the study of Räisänen et al. 2016 the current study showed that the players were well able to master the test requirement.48 One explanation for this
could be that the players in the current study regularly undergo neuromuscular control training. However, it is also possible that the dichotomous assessment of the test requirement that was used is not sufficiently differentiated to capture differences in movement performance via visual observation.
Only six players managed to complete the SLDJ on the dominant leg side within a time frame reflecting a stretch shortening cycle (< 250ms), with only three players on the non-dominant leg side. Thus, it may be important to either change the test instruction and focus on the lowest possible ground contact time or to keep the instruction and reduce the jump height. A recent study of Level 1 and 2 athletes after anterior cruciate ligament rupture used a box height of 15 cm.32 However, the included players achieved slight higher jump heights (0.15 ± 0.05) than the healthy controls (13.7 ± 2.1) in the study mentioned above.
To the authors’ knowledge, there are no reference data for the side hop test in elite youth players without ankle injury The results show slightly better results than reported in previous studies of adult amateur football players and healthy subjects in an ACL study, although differences in test set-up complicate comparability 37,49 In the literature, the cut-off value for subjects with chronic ankle instability is defined to be 12.88 seconds, and all tested players were faster than 12.88 seconds as would be expected (due to no chronic instability).36 In a study of 62 (n=31 healthy; n=31 Functional Ankle Instability [FAI]) adult athletes, an average time of 8.79 and 8.98 sec was determined for the SHT.50 Comparable results were obtained in a study with 60 athletically active subjects.51 Elite youth football players in this study, however, showed shorter times (7.12 and 7.39 sec.) when compared to the forementioned cohorts, which can be attributed to the elite youth players being more trained.
All players were below the cut-off value of 17.36 seconds indicated for individuals with chronic ankle instability on both the dominant and non-dominant leg sides.36 Itoh et al. 2009 found a time of 11.36 ±1.30 for the dominant leg and 11.39 ±1.38 for the non-dominant leg in his study of 23 male subjects (average age 21.6 years), and Caffrey et al. 2009 recorded an average time of 11.0±0.4 sec (matched uninvolved limb) and 11.15±0.4 sec. (matched uninjured limb) in a cohort of an athletically active, healthy study controls (n=30; mean age 20 years).37,50 Thus, the results of the current study indicate that elite youth football players perform the Figure-of-8 test faster than other cohorts in previous studies (10.52 sec dominant and 10.37 sec non-dominant respectively). One possible explanation might be that the non-dominant leg is usually the jumping leg and is characterized by better jumping abilities.
Agility and speed were tested using the MAT according to the methods of Sassi et al. 2009.38 In contrast to trained male sports students (n=52; 22.4±1.5 years), who completed the test in 6.25±0.36 sec, elite youth football players completed the task in 5.81±0.22 seconds. Even though the distance, direction, and procedure were identical to those of Sassi et al. 2009, the MAT was performed outdoors on artificial turf in football shoes.38 If, or to what extent the results may be influenced by these external circumstances and different footwear is uncertain. For example, the external influences (weather, artificial turf pitch, footwear) could affect the speed values of the elite youth football players compared to measurements when performed indoors on an alternative surface. Even if the testing conditions indoor are therefore easier to standardize, the testing chosen in this study mimics a football-specific scenario and generates results that provide the rehabilitation practitioner with orientation values for outdoor testing.
Around 20 years ago, the principle of LSI was introduced to detect bilateral differences. Classically, the LSI is set at 85-90% and deviations of 10-15% are treated as normal.26 Increasingly, experts critically discuss LSI, especially when no directional correction is made and only the dominant side is compared with the non-dominant side.24,51 Due to these reasons LSI results can be (over-)interpreted in a false-positive way which may lead to true deficits going unnoticed (small LSI if the injured side is the non-dominant side and is compared with the dominant side; false negative by detraining the reference side). Therefore, considering the LSI exclusively offers considerable potential for distortion in both directions, which can lead to premature RTS decisions and increase the risk of recurrent injuries.51 Dos Santos et a. 2021 provides potential options for quantifying, monitoring, and the interrelation of interlimb asymmetries and suggests using “asymmetry thresholds” (low-moderate; high-extreme).52 In addition, cohortspecific absolute values should be defined, as an LSI >90% can also be achieved if both sides (injured/non-injured; dominant/non-dominant) are at a low level and if absolute values required for the sport are generally not achieved. In this case, a “positive” or acceptable LSI masks true deficits and does not reveal fundamental deficits.22 The results of the current study emphasize the need for criticism of the traditional calculation of the LSI. In this cohort of healthy footballers, the usage of the LSIdc identified more players with leg symmetry differences >10% in SLDJ and side hop. This is because a single cut-off specification of ≥90% leads to asymmetries being overlooked to the detriment of the supposedly better side (e.g. LSI values >110). Therefore, the direction of the asymmetry should be considered when calculating LSI. In addition, ranges of “asymmetry thresholds” (e.g. ≥90 % to ≤110%) and the orientation towards absolute normative values should be advocated for a broad injury risk stratification, instead of using traditional LSI alone.
Although the setting (e.g. test selection, necessary equipment) of the test battery applies to a professional football training center, it was not possible to test a complete squad of the respective youth teams. Therefore, the small sample size of only male athletes is considered as a limitation of this study even though its value is the specific cohort in an elite environment. The results cannot be generalized to other levels of athletes or to female athletes. The time required (about 60 minutes per athlete) corresponds to the duration of an individual training session in rehabilitation training. Nevertheless, it might be too time consuming for players and coaches in the daily practice in a football academy environment, which comes at the expense of compliance and prevented a larger sample.
For the YBT-LQ, six trial runs are recommended due to possible learning effects.53 For reasons of practicality and the limited time window in professional football, only three trial runs were conducted in this study
A multifactorial RTP assessment is recommended for those with LAS to evaluate various sport motor (sport-specific) requirements (e.g. proprioception, jumping ability, etc.). The current results in male elite youth football players highlight the need to collect baseline data for this specific cohort, as male elite youth football players achieve better results in the dynamic performance tests compared to reference values of the cohorts previously described in the literature. Furthermore, the conventional representation of the LSI should be used with caution, as it may overlook asymmetries to the detriment of the supposedly better side. While the direction corrected LSI can show the extent of the asymmetry, without looking at the raw scores LSI values do not indicate which side the asymmetry is due to. Therefore, the authors recommend specifying the LSI cut off in interval limits, e.g. ≥90 % to ≤110% or to consider different approaches. The extent to which this RTP assessment leads to a reduction in the high rate of recurrent injuries after LAS in elite youth football players should be explored in further prospective studies.
CORRESPONDING AUTHOR
Zacharias Flore University of Kent, School of Sport and Exercise Sciences Kapellenstraße 8a 39104 Magdeburg, Germany zf43@kent.ac.uk +4915203090096
FUNDING
The data were collected as part of a pilot study funded by VBG on return to play after lateral ligament injury to the ankle.
HB is employed by the Verwaltungs-Berufsgenossenschaft (VBG). ZF and GW were employed by Hamburger SV All authors declare that there are no conflicts of interest.
The authors would like to thank Hamburger SV for the opportunity to conduct this study
Submitted: November 28, 2023 CDT, Accepted: May 10, 2024 CDT
© The Author(s)
This is an open-access article distributed under the terms of the Creative Commons Attribution 4.0 International License (CCBY-NC-4.0). View this license’s legal deed at https://creativecommons.org/licenses/by-nc/4.0 and legal code at https://creativecommons.org/licenses/by-nc/4.0/legalcode for more information.
1. Noronha M de, Lay EK, Mcphee MR, Mnatzaganian G, Nunes GS. Ankle sprain has higher occurrence during the latter parts of matches: Systematic review with meta-analysis. J Sport Rehabil 2019;28(4):373-380. doi:10.1123/jsr.2017-0279
2. Fong DTP, Hong Y, Chan LK, Yung PSH, Chan KM. A systematic review on ankle injury and ankle sprain in sports. Sports Med 2007;37(1):73-94. doi:10.2165/ 00007256-200737010-00006
3. Waldén M, Hägglund M, Ekstrand J. Time-trends and circumstances surrounding ankle injuries in men’s professional football: An 11-year follow-up of the UEFA Champions League injury study Br J Sports Med 2013;47(12):748-753. doi:10.1136/ bjsports-2013-092223
4. Read PJ, Oliver JL, Ste Croix MBA de, Myer GD, Lloyd RS. An audit of injuries in six english professional soccer academies. J Sports Sci. 2018;36(13):1542-1548. doi:10.1080/ 02640414.2017.1402535
5. Price RJ, Hawkins RD, Hulse MA, Hodson A. The Football Association medical research programme: An audit of injuries in academy youth football. Br J Sports Med. 2004;38(4):466-471. doi:10.1136/ bjsm.2003.005165
6. Nilsson T, Östenberg AH, Alricsson M. Injury profile among elite male youth soccer players in a Swedish first league. J Exerc Rehabil. 2016;12(2):83-89. doi:10.12965/jer.1632548.274
7 Materne O, Chamari K, Farooq A, et al. Association of skeletal maturity and injury risk in elite youth soccer players: A 4-season prospective study with survival analysis. Orthop J Sports Med. 2021;9(3):2325967121999113. doi:10.1177/ 2325967121999113
8. Ergün M, Denerel HN, Binnet MS, Ertat KA. Injuries in elite youth football players: A prospective three-year study Acta Orthop Traumatol Turc 2013;47(5):339-346. doi:10.3944/AOTT.2013.3177
9. Cloke DJ, Spencer S, Hodson A, Deehan D. The epidemiology of ankle injuries occurring in English Football Association academies. Br J Sports Med 2009;43(14):1119-1125. doi:10.1136/ bjsm.2008.052050
10. Klein C, Bloch H, Burkhardt K, et al. VBGSportreport 2021 - Analyse des Verletzungsgeschehens in den zwei höchsten Ligen der Männer: Basketball, Eishockey, Fußball, Handball. Published online 2022.
11. Chan KW, Ding BC, Mroczek KJ. Acute and chronic lateral ankle instability in the athlete. Bull NYU Hosp Jt Dis 2011;69(1):17-26.
12. Ardern CL, Glasgow P, Schneiders A, et al. 2016 Consensus statement on return to sport from the First World Congress in Sports Physical Therapy, Bern. Br J Sports Med. 2016;50(14):853-864. doi:10.1136/bjsports-2016-096278
13. Buckthorpe M, Frizziero A, Roi GS. Update on functional recovery process for the injured athlete: Return to sport continuum redefined. Br J Sports Med 2019;53(5):265-267 doi:10.1136/ bjsports-2018-099341
14. Wikstrom EA, Mueller C, Cain MS. Lack of consensus on return-to-sport criteria following lateral ankle sprain: A systematic review of expert opinions. J Sport Rehabil 2020;29(2):231-237 doi:10.1123/jsr.2019-0038
15. Tassignon B, Verschueren J, Delahunt E, et al. Criteria-based return to sport decision-making following lateral ankle sprain injury: A systematic review and narrative synthesis. Sports Med. 2019;49(4):601-619. doi:10.1007/s40279-019-01071-3
16. Flore Z, Welsch G, Capel S. Zurück in den Leistungsfußball. sportärztezeitung 2018;(3).
17. Flore Z, Keller M, Welsch G, Kurz E. Erfolgreich zurück in den Leistungssport nach Verletzung des oberen Sprunggelenks – Ein Fallbeispiel. Sportphysio 2018;06(03):133-138. doi:10.1055/a-0583-8035
18. Bloch H, Klein C, Kühn N, Luig P. Return to Competition - Test Manual for Assessment of the Ability to Play after an Acute Lateral Ankle Sprain Injury.; 2019.
19. Bloch H, Klein C, Luig P, Riepenhof H. Development and implementation of a modular return-to-play test battery after ACL reconstruction. In: Musahl V, Karlsson J, Krutsch W, Mandelbaum BR, Espregueira-Mendes J, d’Hooghe P, eds. Return to Play in Football: An Evidence-Based Approach Springer Berlin Heidelberg; 2018:217-235. doi:10.1007/ 978-3-662-55713-6
20. Smith MD, Vicenzino B, Bahr R, et al. Return to sport decisions after an acute lateral ankle sprain injury: Introducing the PAASS framework-an international multidisciplinary consensus. Br J Sports Med 2021;55(22):1270-1276. doi:10.1136/ bjsports-2021-104087
21. Needle AR, Lepley AS, Grooms DR. Central nervous system adaptation after ligamentous injury: A summary of theories, evidence, and clinical interpretation. Sports Med. 2017;47(7):1271-1288. doi:10.1007/s40279-016-0666-y
22. Gokeler A, Welling W, Benjaminse A, Lemmink K, Seil R, Zaffagnini S. A critical analysis of limb symmetry indices of hop tests in athletes after anterior cruciate ligament reconstruction: A case control study. Orthop Traumatol Surg Res. 2017;103(6):947-951. doi:10.1016/j.otsr.2017.02.015
23. Scinicarelli G, Trofenik M, Froböse I, Wilke C. The reliability of common functional performance tests within an experimental test battery for the lower extremities. Sports 2021;9(7):23. doi:10.3390/ sports9070100
24. Bishop C, Pereira LA, Reis VP, Read P, Turner AN, Loturco I. Comparing the magnitude and direction of asymmetry during the squat, countermovement and drop jump tests in elite youth female soccer players. J Sports Sci 2020;38(11-12):1296-1303. doi:10.1080/ 02640414.2019.1649525
25. Bishop C, Read P, Chavda S, Turner A. Asymmetries of the lower limb: The calculation conundrum in strength training and conditioning. Strength Condit J. 2016;38(6):27-32. doi:10.1519/ SSC.0000000000000264
26. Parkinson AO, Apps CL, Morris JG, Barnett CT, Lewis MGC. The calculation, thresholds and reporting of inter-limb strength asymmetry: A systematic review J Sports Sci Med 2021;20(4):594-617. doi:10.52082/jssm.2021.594
27 Kurz E, Schwesig R, Pröger S, Delank KS, Bartels T Foot tapping and unilateral vertical jump performance in athletes after knee surgery: An explorative cross-sectional study BMC Sports Sci Med Rehabil 2022;14(1):34. doi:10.1186/ s13102-022-00422-4
28. Picot B, Terrier R, Forestier N, Fourchet F, McKeon PO The Star Excursion Balance Test: An update review and practical guidelines. Int J Athl Ther Train 2021;26(6):285-293. doi:10.1123/ ijatt.2020-0106
29. Lunsford BR, Perry J. The standing heel-rise test for ankle plantar flexion: Criterion for normal. Phys Ther 1995;75(8):694-698. doi:10.1093/ptj/75.8.694
30. Crossley KM, Zhang WJ, Schache AG, Bryant A, Cowan SM. Performance on the single-leg squat task indicates hip abductor muscle function. Am J Sports Med. 2011;39(4):866-873. doi:10.1177/ 0363546510395456
31. Perrott MA, Pizzari T, Opar M, Cook J. Development of clinical rating criteria for tests of lumbopelvic stability. Rehabil Res Pract. 2012(2012):803637 doi:10.1155/2012/803637
32. Kotsifaki A, van Rossom S, Whiteley R, et al. Single leg vertical jump performance identifies knee function deficits at return to sport after ACL reconstruction in male athletes. Br J Sports Med 2022;56(9):490-498. doi:10.1136/ bjsports-2021-104692
33. Kawaguchi K, Taketomi S, Mizutani Y, et al. Dynamic postural stability is decreased during the single-leg drop landing task in male collegiate soccer players with chronic ankle instability Orthop J Sports Med. 2022;10(7):23259671221107343. doi:10.1177/ 23259671221107343
34. Fransz DP, Huurnink A, Kingma I, de Boode VA, Heyligers IC, van Dieën JH. Performance on a singlelegged drop-jump landing test is related to increased risk of lateral ankle sprains among male elite soccer players: A 3-year prospective cohort study. Am J Sports Med 2018;46(14):3454-3462. doi:10.1177/ 0363546518808027
35. O’Connor ML. The Development of the Single-Leg Landing Error Scoring System (SL-LESS) for Lower Extremity Movement Screening Thesis. University of Wisconsin Milwaukee; 2015. Accessed September 6, 2022. https://dc.uwm.edu/cgi/ viewcontent.cgi?article=2074&context=etd
36. Linens SW, Ross SE, Arnold BL, Gayle R, Pidcoe P. Postural-stability tests that identify individuals with chronic ankle instability J Athl Train 2014;49(1):15-23. doi:10.4085/1062-6050-48.6.09
37 Itoh H, Kurosaka M, Yoshiya S, Ichihashi N, Mizuno K. Evaluation of functional deficits determined by four different hop tests in patients with anterior cruciate ligament deficiency Knee Surg Sports Traumatol Arthrosc 1998;6(4):241-245. doi:10.1007/s001670050106
38. Sassi RH, Dardouri W, Yahmed MH, Gmada N, Mahfoudhi ME, Gharbi Z. Relative and absolute reliability of a modified agility T-test and its relationship with vertical jump and straight sprint. J Strength Cond Res 2009;23(6):1644-1651. doi:10.1519/JSC.0b013e3181b425d2
39. Plisky P, Schwartkopf-Phifer K, Huebner B, Garner MB, Bullock G. Systematic review and meta-analysis of the Y-Balance test lower quarter: Reliability, discriminant validity, and predictive validity. Int J Sports Phys Ther 2021;16(5):1190-1209. doi:10.26603/001c.27634
40. Butler RJ, Lehr ME, Fink ML, Kiesel KB, Plisky PJ. Dynamic balance performance and noncontact lower extremity injury in college football players: An initial study. Sports Health. 2013;5(5):417-422. doi:10.1177/ 1941738113498703
41. Mohammadi H, Ghaffari R, Kazemi A, Bennett H, Hosseinzadeh M. Evaluation of the value of the Ybalance test to predict lower limb injuries in professional male footballers. J Sport Rehabil 2024;33(1):33-39. doi:10.1123/jsr.2023-0139
42. Gonell AC, Romero JAP, Soler LM. Relationship between the Y Balance test scores and soft tissue injury incidence in a soccer team. Int J Sports Phys Ther. 2015;10(7):955-966.
43. Hébert-Losier K, Wessman C, Alricsson M, Svantesson U. Updated reliability and normative values for the standing heel-rise test in healthy adults. Physiotherapy 2017;103(4):446-452. doi:10.1016/j.physio.2017.03.002
44. Petushek E, Nilstad A, Bahr R, Krosshaug T. Drop jump? Single-leg squat? Not if you aim to predict anterior cruciate ligament injury from real-time clinical assessment: A prospective cohort study involving 880 elite fmale athletes. J Orthop Sports Phys Ther 2021;51(7):372-378. doi:10.2519/ jospt.2021.10170
45. Zawadka M, Smolka J, Skublewska-Paszkowska M, et al. Sex-dependent differences in single-leg squat kinematics and their relationship to squat depth in physically active individuals. Sci Rep 2020;10(1):19601. doi:10.1038/s41598-020-76674-2
46. Ugalde V, Brockman C, Bailowitz Z, Pollard CD Single leg squat test and its relationship to dynamic knee valgus and injury risk screening. PM R 2015;7(3):229-235. doi:10.1016/j.pmrj.2014.08.361
47. Gianola S, Castellini G, Stucovitz E, Nardo A, Banfi G. Single leg squat performance in physically and non-physically active individuals: A crosssectional study. BMC Musculoskelet Disord. 2017;18(1):299. doi:10.1186/s12891-017-1660-8
48. Räisänen AM, Arkkila H, Vasankari T, et al. Investigation of knee control as a lower extremity injury risk factor: A prospective study in youth football. Scand J Med Sci Sports 2018;28(9):2084-2092. doi:10.1111/sms.13197
49. Silva DCF, Santos R, Vilas-Boas JP, Macedo R, Montes AM, Sousa ASP Different cleat models do not influence side hop test performance of soccer players with and without chronic ankle instability J Hum Kinet 2019;70:156-164. doi:10.2478/ hukin-2019-0029
50. Caffrey E, Docherty CL, Schrader J, Klossnner J. The ability of 4 single-limb hopping tests to detect functional performance deficits in individuals with functional ankle instability J Orthop Sports Phys Ther 2009;39(11):799-806. doi:10.2519/jospt.2009.3042
51. Vereijken A, van Trijffel E, Aerts I, Tassignon B, Verschueren J, Meeusen R. The non-injured leg can be used as a reference for the injured leg in singlelegged hop tests. Int J Sports Phys Ther. 2021;16(4):1052-1066. doi:10.26603/001c.25758
52. Dos’Santos T, Thomas C, Jones PA. Assessing interlimb asymmetries: Are we heading in the right direction? Strength Condit J 2021;43(3):91-100. doi:10.1519/SSC.0000000000000590
53. Hertel J, Miller SJ, Denegar CR. Intratester and intertester reliability during the Star Excursion Balance Tests. J Sport Rehabil 2000;9(2):104-116. doi:10.1123/jsr.9.2.104
Download: https://ijspt.scholasticahq.com/article/120201-return-to-play-assessment-after-lateral-ankle-sprainsgerman-male-elite-youth-football-soccer-academy-baseline-data/attachment/ 232790.docx?auth_token=ZSDvMOr_RkxVwbvJz-AM
Download: https://ijspt.scholasticahq.com/article/120201-return-to-play-assessment-after-lateral-ankle-sprainsgerman-male-elite-youth-football-soccer-academy-baseline-data/attachment/ 232791.docx?auth_token=ZSDvMOr_RkxVwbvJz-AM
Download: https://ijspt.scholasticahq.com/article/120201-return-to-play-assessment-after-lateral-ankle-sprainsgerman-male-elite-youth-football-soccer-academy-baseline-data/attachment/ 232789.docx?auth_token=ZSDvMOr_RkxVwbvJz-AM
James J McGinley, BS1 a , Ben Randoing, BS1,2 , Laura Saleem, PT1 , Caroline Podvin, BA1 , Henry B Ellis, MD1,3 , Philip L Wilson, MD1,3 , Sophia Ulman, PhD1,3
1 Center for Excellence in Sports Medicine, Scottish Rite for Children, 2 Department of Biomedical Engineering, Duke University, 3 Department of Orthopaedic Surgery, University of Texas Southwestern Medical Center
Keywords: dynamic balance, lower extremity, reference values, return to sport, youth sports https://doi.org/10.26603/001c.120898
International Journal of Sports Physical Therapy
Background
Given rising youth sport participation, 8 to 10-year-olds increasingly display comparable lower-extremity injury incidence to 11 to 17-year-olds and require effective return to sport criteria. One such criterion which quantifies dynamic stability is the Y-Balance Test (YBT), though it has not been validated in children under age 11.
Hypothesis/Purpose
The purpose of this study was to examine the performance of 8 to 10-year-old patients on the YBT after lower-extremity injury and determine how these results compare to larger samples of age-grouped athletes within the validated 11 to 17-year-old range. It was hypothesized that 8 to 10-year-olds would display different normalized YBT distances compared to 11 to 17-year-olds.
Study Design
Cross-sectional Study.
Methods
Patients (N=1093) aged 8 to 17 who presented to a pediatric sports medicine practice with a lower-extremity injury and completed the YBT between December 2015-May 2021 were included. Anterior, posteromedial, and posterolateral YBT scores were collected at return-to-sport for affected and unaffected limbs. Scores were normalized to limb length, and composite scores were created. Between-limb differences were calculated in groups of ages 8-10, 11-12, 13-14, and 15-17 Groups were also evaluated for differences by sex.
Results
A rise in performance was observed in unaffected limb anterior reach from ages 8 to 10 years to 11 to 12 years followed by a subsequent significant decrease at older ages (p<0.001). Affected limb anterior reach differed between the youngest group and two oldest groups (p=0.004). Anterior and composite difference were significantly different between the oldest three groups (p=0.014 anterior; p=0.024 composite). No differences were observed between sexes in 8 to 10-year-olds, though 11 to 12-year-old females reached further during all eight distances. In the older three groups, males generally displayed greater between-limb differences.
Corresponding Author: James McGinley
Scottish Rite for Children
5700 Dallas Parkway Frisco, TX 75034
Phone: 469-515-728
Fax: (469) 515-7133
jamesmcginley@att.net @SRChildren_
YBT scores, specifically anterior reach, demonstrated inconsistency by age and sex across a large adolescent cohort. Existing return-to-sport standards should not be used with younger athletes, and individual validation is required.
Level III
An estimated 30 million children are involved annually in organized sport.1 However, given frequent year-round participation of youth athletes, injuries have steadily increased.2 Specifically, youth anterior cruciate ligament (ACL) injuries have grown by 2.3% per year over the last 20 years.3 Youth athletes are often more susceptible to sportrelated injury due to skeletal immaturity and/or underdeveloped coordination.4 In fact, 8 to 10-year-olds may undergo similar injury levels to older youth,5 due in part to rising sport specialization as early as six years of age.6 This increased prevalence is especially true in youth athletes with prior injury,7 with one study demonstrating that one in four youth athletes will suffer a repeat lower-extremity injury 8 Moreover, increased injury prevalence is perpetuated by reduced recovery time and insufficient emphasis on rest,1 yet prediction is multifactorial and not fully understood.3 Therefore, it is essential that evidence-based screening measures are available and appropriate for determining return to play readiness for athletes of all ages.
Dynamic movement screens, such as the Y-Balance Test (YBT), have been implemented in return-to-play protocols to quantify a patient’s readiness for activity Specifically, the YBT is a screening measure that evaluates the dynamic limits of stability, strength, and asymmetrical balance in the anterior, posterolateral, and posteromedial directions. Normative values of the YBT have been shown to increase with age, falling in the range of 85-115 percent of leg length for 10-18-year-old patients.9‑11 The YBT may also relate to injury risk,12,13 although some studies have shown otherwise.14 Specifically, anterior reach has been associated with both injury risk and limb asymmetry at return-to-play 15‑17 Injury risk may also be anticipated by anterior reach asymmetry greater than four centimeters, though these studies have focused on adults.17 As re-injury risk may relate to measures of the YBT, specifically in the anterior direction, it is important to establish normative values of all at-risk populations.
While researchers have validated the YBT in patients aged 11 to 17 years,10,11,18 clear physical and physiological differences exist between athletes across different stages of maturation.6 For example, postural stability may improve with age in youth.19 As athletes continue to grow, they display different stability, flexibility, and control as their center of mass shifts and muscles develop. Similarly, athletes who have recently undergone growth spurts may be disposed to muscular imbalances, which can be monitored by dynamic movement screens such as the YBT 20 Dynamic stability may also differ by sex as females have been reported to attain further anterior reach21 and males
have been observed to have larger anterior asymmetry,22 posteromedial reach, and posterolateral reach.23 Given the variation among age and sex in characteristics of dynamic stability, it is necessary that sports care providers have a sufficient understanding of how each developmental age performs. Therefore, despite reliable dynamic movement screening being essential for maximizing adolescent health, extrapolating physical therapy screening across age cohorts without rigorous examination is potentially problematic.24
Provided the YBT has only limited investigation in a cohort of youth athletes aged less than 11 years25,26 and no comparisons with older athletes to the authors’ knowledge, therefore, the purpose of this study was to examine the performance of 8 to 10-year-old patients on the YBT after lower-extremity injury and determine how these results compare to larger samples of age-grouped athletes within the validated 11 to 17-year-old range. It was hypothesized that 8 to 10-year-olds would display different normalized YBT distances compared to 11 to 17-year-olds.
The local Institutional Review Board (IRB) approved this retrospective review of patients who presented with a lower-extremity injury at a pediatric sports medicine practice, and informed consent was waived. Patients were included if they completed functional performance testing for return-to-play decision-making between December 2015 to May 2021 from a single pediatric sports medicine physical therapy department and had an available diagnosis of lower-extremity injury Lower-quarter YBT scores completed at the time of return-to-play evaluation were collected from a functional performance test database called Move2Perform (Evansville, IN). Demographics and sports type were collected from patients’ electronic medical records. As only the final YBT score was analyzed for each return-to-sport decision, patient scores prior to activity release were excluded from data analysis. The Strengthening the Reporting of Observational studies in Epidemiology (STROBE) statement checklist is provided as Supplementary Material.27
The lower-quarter YBT is a screening measure that evaluates dynamic stability in the anterior, posterolateral, and posteromedial directions, demonstrating interrater reliability with an acceptable level of measurement error 23 Each patient performed a lower-quarter YBT using the test kit (Functional Movement Systems; Chatham, VA) as part of a return-to-play evaluation conducted by a trained physical therapist. Prior to testing, limb length of the right leg was measured from the right anterior superior iliac spine to the
distal tip of the right medial malleolus to the nearest half centimeter. Next, verbal instructions were provided alongside a live demonstration performed by the physical therapist certified by Functional Movement Systems. Patients completed three practice trials in each direction prior to testing so that the patient was familiar with the test. Each patient was tested bilaterally in the anterior (ANT), posteromedial (PM), and posterolateral (PL) directions for a total of three trials. During the testing phase, trials were excluded if any of the testing faults occurred: kicking the push box, not returning to the starting position under control, touching down during testing, or placing the foot on top of the push box. Reach distance was estimated to the nearest half centimeter
Normalized component scores for each test condition were then calculated by dividing each component by limb length and multiplying by 100. In addition, a composite score (COMP) was computed by averaging the three normalized component scores. Between-limb differences (Δ) were calculated for each score (components and composite) as the absolute value of the difference between the scores of the affected and unaffected limb.
Patients were separated into age groups of 8 to 10, 11 to 12, 13 to 14, and 15 to 17 years. Group separations were based on the average adolescent growth spurt and peak growth (near ages 11 and 13, respectively).28 Patients were not initially separated by sex or severity of their lower-extremity injury to allow for a large-scale survey only dependent on age grouping. Given that patients were evaluated for return-to-play, affected and unaffected limbs were separated in analysis. Each limb of bilaterally affected patients was included individually in the affected limb analysis, but all bilaterally affected patients were excluded from between-limb differences. After age group comparisons, patients were separated for a within-group comparison by sex.
For each YBT metric, a Kruskal-Wallis ANOVA was performed to determine significant differences between age groups, and Mann-Whitney post-hoc testing specified significance between age group pairings. A conventional 95% confidence interval was set for all statistical tests.
A total of 1093 bilateral patients were included and analyzed for YBT reach distances. All age groups were majority female and were significantly different from other groups in age (p<0.001), weight (p<0.001), and limb length (p<0.001) (Table 1). Among all patients, 70.3% participated in contact sports. Patients were treated for a variety of lower-extremity conditions which merited return-to-play evaluations including injury of the ACL (41.7%), ankle (17.8%), patella (16.1%), hip (13.3%), Achilles tendon (1.8%), meniscus (1.6%), and other (7.7%). Seventeen patients were missing weight measurements (2%, 1%, 1%, and 2%, from youngest to oldest age group, respectively).
Computed mean and sample standard deviation of the eight YBT reach metrics and four YBT between-limb differences described groups of 8 to 10, 11 to 12, 13 to 14, and
15 to 17-year-old athletes. Significant differences were observed between age groups in affected limb ANT (p=0.004), unaffected limb ANT (p<0.001), Δ ANT (p=0.014), and Δ COMP (p=0.024). Post-hoc analyses revealed that YBT scores were not significantly different in the 8 to 10-yearold group than 11 to 12 years. However, 8 to 10-year-olds were significantly greater in both affected and unaffected ANT than 13 to 14-year-olds (p=0.021 affected; p=0.004 unaffected) and 15 to 17-year-olds (p=0.001 affected; p<0.001 unaffected). Between 11 to 12-year-olds and 13 to 14-yearolds, unaffected ANT (p=0.031), Δ ANT (p=0.029) and Δ COMP (p=0.015) were greater in the younger group. Additionally, 11 to 12-year-olds had significantly greater unaffected ANT (p=0.002), affected PM (p=0.035), and Δ COMP (p=0.008) than 15 to 17-year-olds. Finally, the 15 to 17-year-olds recorded a greater Δ ANT than 13-14-yearolds (p=0.011) (Table 2).
Though, reach distances demonstrated lower scores at 8 to 10 years, a peak in performance from 11 to 12 years, a decline at 13 to 14 years, and a further decline at 15 to 17 years, these differences were not statistically significantly different. Between-limb comparisons in the anterior direction, posterolateral direction, and composite score showed similar non-significant trends, though the oldest group did not continue to decline in YBT scores after falling from 13 to 14 years. A decline starting at ages 8 to 10 was observed in between-limb comparisons of the posteromedial direction, with a rise at 15 to 17 years (Table 2).
When categorized by sex, the 8 to 10-year group displayed no within-group differences in YBT score. However, females in the 11 to 12-year group achieved greater reach distances in all categories (p<0.001 affected ANT; p=0.014 unaffected ANT; p=0.001 affected PM; p=0.007 unaffected PM; p=0.001 affected PL; p=0.002 unaffected PL; p<0.001 affected COMP; p=0.002 unaffected COMP), with males showing greater Δ PL (p=0.016). Similarly, the 13-14-year group differed by greater Δ ANT (p=0.039) in males, while the 15 to 17-year group only saw males report a significantly greater Δ PL (p=0.017). Complete sex comparison data are included in the Supplementary Material.
As youth injuries continue to rise due to increasing yearround sport participation and earlier specialization of sport,2,6 it is becoming increasingly important to develop accurate and efficient screening measures for return-toplay assessments at all ages. As such, understanding how YBT scores may be influenced by age is an essential aspect of ensuring children have accurate screening. In this study, reach distances underwent a noticeable peak in patients aged 11 to 12 years, with a decline in younger and older age groups. As YBT scores were normalized by leg length, the decrease suggests that, as maturity progresses, leg length increases more than dynamic stability improves over time despite an increase in raw scores with age. Furthermore, dynamic stability is highly dependent on flexibility, which
Table 1. Patient Demographics
Table 2. Mean ± Standard Deviation of YBT Metrics by Age Group
a Significant ANOVA results noted in bold with an asterisk (*). Superscripts denote statistical significance between age groups. Differences with the 8-10-year, 11-12-year, and 13-14-year groups are noted by the superscripts X, Y, and Z, respectively Bilateral patients grouped with Affected Limb on both sides and excluded from Between-Limb Difference. Total patients (N) listed for each group. Reach distances normalized by limb length. Y-Balance Test (YBT).
decreases with age.29 While studies in youth athletes that compare the YBT across age have previously demonstrated increased scores with age rather than the observed decrease, these studies have compared youth to collegiate athletes17 or studied an extremely homogenous cohort.9
The large, heterogenous cohort of various lower-extremity conditions and sports observed in the current study may provide a more accurate view of the total youth athlete population than prior research. Thus, the inconsistency in YBT scores across the cohort highlights that premature athletes may not follow the same progression as maturing athletes and emphasizes the need for future studies to provide additional normative data on YBT scores at return-to-play for the 8 to 10-year-old group.
The importance of establishing YBT normative data for younger ages is underscored by the general agreement that the YBT can be predictive of injury given the positive relationship between adolescent growth and injury risk,12,13,30 though agreement is not unanimous.14 The anterior direction has been identified as especially useful for injury risk, both in reach distance15,16 and in the difference between limbs.17 One possible explanation is suggested by Earl and
Hertel, who put forth that the greater knee flexion observed in anterior reach results in greater vastus medialis obliquus and vastus lateralis activity for a more demanding overall task than the posterior direction.31 As anterior reach was the only direction consistently significant in this study, the results exhibit additional evidence that anterior reach may not only be predictive of return-to-play outcomes, but abnormal values for each age are also more readily identifiable given more stark age differences. Therefore, future studies should aim to corroborate these age-specific anterior reach distances, specifically in ages 8 to 10, as their predictive ability may be clinically useful.
The differences observed by sex serve to bolster the interpretation that the average onset of pubertal growth around 11 and peak growth at 13 years is a significant determinant of YBT metrics.28 Prior to the female growth spurt at 8 to 10 years, no differences were identified between sexes. However, there was a significant difference in nearly every category in 11 to 12-year-olds where growth stage is most
sex-dependent, with less difference in the older groups as growth leveled off. As such, future validation of 8 to 10-year-old YBT scores may not necessarily require stratification by sex; however, these results do emphasize that the YBT at 8 to 10 years cannot be considered equivalent to scores at 11 to 12 years for practitioners examining returnto-sport readiness.
Limitations to the current study include data collection involving a single pediatric sports medicine practice and risk of data specific to the region. Smaller sample size in the youngest age group and variability in sample size across all age groups presents complications when trying to make between-group comparisons. Furthermore, patients included in the current study were presumably cleared for sport after this YBT and were expected to show YBT scores similar to a healthy population, limiting the utility of the current study’s data for injury risk prediction. Finally, the YBT is not yet validated in the 8 to 10-year-old population. However, this only serves to emphasize that future work should compare YBT performance to functional outcome measures to successfully validate the YBT for younger ages.
This study presents YBT scores in a large cohort of lowerextremity patients aged 8 to 17 with age group comparisons. Anterior reach scores were observed to rise from 8 to 10 years to 11 to 12 years then significantly decrease with age. Both posterior directions and composite YBT scores also displayed a nominal peak at 11 to 12 years with a decrease at younger and older ages. Differences by sex were observed in the three older groups, with all eight reach distances significant at 11 to 12-years-old, but differences were not seen at 8 to 10 years. Therefore, patients aged 8 to 10 years were not consistent within the trends observed in the validated 11 to 17 year-old population. Given the importance of YBT scores in predicting injury risk, specifically anterior reach, it is necessary that the YBT is studied for validation in this age group and normative values are established in future studies to avoid inaccurately generalizing trends observed in older populations to pre-mature children.
The Authors declare that there are no conflicts of interest.
Submitted: March 19, 2024 CDT, Accepted: June 26, 2024 CDT
© The Author(s)
This is an open-access article distributed under the terms of the Creative Commons Attribution 4.0 International License (CCBY-NC-4.0). View this license’s legal deed at https://creativecommons.org/licenses/by-nc/4.0 and legal code at https://creativecommons.org/licenses/by-nc/4.0/legalcode for more information.
1. DiFiori JP, Benjamin HJ, Brenner JS, et al. Overuse injuries and burnout in youth sports: a position statement from the American Medical Society for Sports Medicine. Br J Sports Med 2014;48(4):287-288. doi:10.1136/bjsports-2013-093299
2. Bram JT, Magee LC, Mehta NN, Patel NM, Ganley TJ. Anterior cruciate ligament injury incidence in adolescent athletes: A systematic review and metaanalysis. Am J Sports Med. 2021;49(7):1962-1972. doi:10.1177/0363546520959619
3. Lang PJ, Sugimoto D, Micheli LJ. Prevention, treatment, and rehabilitation of anterior cruciate ligament injuries in children. Open Access J Sports Med 2017;8:133-141. doi:10.2147/OAJSM.S133940
4. Caine D, Purcell L, Maffulli N. The child and adolescent athlete: a review of three potentially serious injuries. BMC Sports Sci Med Rehabil 2014;6:22. doi:10.1186/2052-1847-6-22
5. Radelet MA, Lephart SM, Rubinstein EN, Myers JB. Survey of the injury rate for children in community sports. Pediatrics. 2002;110(3):e28. doi:10.1542/ peds.110.3.e28
6. Côté J, Lidor R, Hackfort D ISSP position stand: To sample or to specialize? Seven postulates about youth sport activities that lead to continued participation and elite performance. Int J Sport Exerc Psych. 2009;7(1):7-17. doi:10.1080/ 1612197X.2009.9671889
7 Paterno MV, Rauh MJ, Schmitt LC, Ford KR, Hewett TE. Incidence of second ACL injuries 2 years after primary ACL reconstruction and return to sport. Am J Sports Med 2014;42(7):1567-1573. doi:10.1177/ 0363546514530088
8. Wiggins AJ, Grandhi RK, Schneider DK, et al. Risk of secondary injury in younger athletes after anterior cruciate ligament reconstruction: A systematic review and meta-analysis. Am J Sports Med. 2016;44(7):1861-1876. doi:10.1177/ 0363546515621554
9. O’Connor S, McCaffrey N, Whyte EF, et al. Can the Y balance test identify those at risk of contact or non-contact lower extremity injury in adolescent and collegiate Gaelic games? J Sci Med Sport. 2020;23(10):943-948. doi:10.1016/ j.jsams.2020.04.017
10. Schwiertz G, Beurskens R, Muehlbauer T Discriminative validity of the lower and upper quarter Y balance test performance: a comparison between healthy trained and untrained youth. BMC Sports Sci Med Rehabil 2020;12(1):73. doi:10.1186/ s13102-020-00220-w
11. Schwiertz G, Brueckner D, Beurskens R, Muehlbauer T Lower quarter Y Balance test performance: Reference values for healthy youth aged 10 to 17 years. Gait Posture 2020;80:148-154. doi:10.1016/j.gaitpost.2020.05.041
12. Linek P, Booysen N, Sikora D, Stokes M. Functional movement screen and Y balance tests in adolescent footballers with hip/groin symptoms. Phys Ther Sport. 2019;39(12):99-106. doi:10.1016/ j.ptsp.2019.07.002
13. Oleksy L, Mika A, Sulowska-Daszyk I, et al. Standard RTS criteria effectiveness verification using FMS, Y-balance and TJA in footballers following ACL reconstruction and mild lower limb injuries. Sci Rep 2021;11(1):1558. doi:10.1038/s41598-021-81152-4
14. Lisman P, Hildebrand E, Nadelen M, Leppert K. Association of Functional Movement Screen and YBalance Test Scores with injury in high school athletes. J Strength Cond Res 2021;35(7):1930-1938. doi:10.1519/JSC.0000000000003082
15. Garrison JC, Bothwell JM, Wolf G, Aryal S, Thigpen CA. Y Balance ttest anterior reach symmetry at three months is related to single leg functional performance at time of return to sports following anterior ruciate ligament reconstruction. Int J Sports Phys Ther 2015;10(5):602-611.
16. Read PJ, Oliver JL, Myer GD, et al. Utility of the anterior reach Y-Balance test as an injury risk screening tool in elite male youth soccer players. Phys Ther Sport. 2020;45:103-110. doi:10.1016/ j.ptsp.2020.06.002
17 Smith CA, Chimera NJ, Warren M. Association of Y Balance test reach asymmetry and injury in division I athletes. Med Sci Sports Exerc. 2015;47(1):136-141. doi:10.1249/ MSS.0000000000000380
18. Schwiertz G, Brueckner D, Schedler S, Kiss R, Muehlbauer T Performance and reliability of the Lower Quarter Y Balance Test in healthy adolescents from grade 6 to 11. Gait Posture. 2019;67:142-146. doi:10.1016/j.gaitpost.2018.10.011
19. Paniccia M, Wilson KE, Hunt A, et al. Postural stability in healthy child and youth athletes: The effect of age, sex, and concussion-related factors on performance. Sports Health. 2018;10(2):175-182. doi:10.1177/1941738117741651
20. Arnold A, Thigpen CA, Beattie PF, Kissenberth MJ, Shanley E. Overuse physeal injuries in youth athletes. Sports Health. 2017;9(2):139-147. doi:10.1177/1941738117690847
21. Alfuth M, Franke PJ, Klemp J, Knicker AJ. Comparison of dynamic balance and unilateral hop performance between women and men handball players after anterior cruciate ligament reconstruction: A pilot study. J Sport Rehabil. 2023;32(3):282-288. doi:10.1123/jsr.2022-0052
22. Miller MM, Trapp JL, Post EG, et al. The effects of specialization and sex on anterior Y-Balance performance in high school athletes. Sports Health 2017;9(4):375-382. doi:10.1177/1941738117703400
23. Plisky P, Schwartkopf-Phifer K, Huebner B, Garner MB, Bullock G. Systematic review and meta-analysis of the Y-Balance test lower quarter: Reliability, discriminant validity, and predictive validity. Int J Sports Phys Ther 2021;16(5):1190-1209. doi:10.26603/001c.27634
24. van Melick N, van Cingel RE, Brooijmans F, et al. Evidence-based clinical practice update: practice guidelines for anterior cruciate ligament rehabilitation based on a systematic review and multidisciplinary consensus. Br J Sports Med 2016;50(24):1506-1515. doi:10.1136/ bjsports-2015-095898
25. Avery M, Wattie N, Holmes M, Dogra S. Seasonal changes in functional fitness and neurocognitive assessments in youth ice-hockey players. J Strength Cond Res. 2018;32(11):3143-3152. doi:10.1519/ JSC.0000000000002399
26. Rossler R, Donath L, Bizzini M, Faude O A new injury prevention programme for children’s football-FIFA 11+ Kids--can improve motor performance: a cluster-randomised controlled trial. J Sports Sci 2016;34(6):549-556. doi:10.1080/ 02640414.2015.1099715
27 von Elm E, Altman DG, Egger M, et al. The Strengthening the Reporting of Observational Studies in Epidemiology (STROBE) statement: guidelines for reporting observational studies. J Clin Epidemiol 2008;61(4):344-349. doi:10.1016/ j.jclinepi.2007.11.008
28. Beunen G, Malina R. Growth and biologic maturation: Relevance to athletic performance. In: Hebestreit H, Bar-Or O, eds. The Young Athlete. ; 2008:3-17 doi:10.1002/9780470696255.ch1
29. Martínez-Silván D, Johnson A. Lower limb flexibility characteristics in youth athletics. Differences among events and age groups in highly trained adolescent athletes. Apunts Sports Medicine 2020;55(207):89-95. doi:10.1016/ j.apunsm.2020.05.003
30. Caine D, Maffulli N, Caine C. Epidemiology of injury in child and adolescent sports: injury rates, risk factors, and prevention. Clin Sports Med 2008;27(1). doi:10.1016/j.csm.2007.10.008
31. Earl-Boehm J, Hertel J. Lower-extremity muscle activation during the Star Excursion Balance Tests. J Sport Rehabil 2001;10(2):93-104. doi:10.1123/ jsr.10.2.93
Download: https://ijspt.scholasticahq.com/article/120898-lower-quarter-y-balance-test-differs-by-age-youngerathletes-may-not-be-generalized-to-high-school-aged-counterparts/attachment/235399.pdf?auth_token=gjfkeGKYGFvLC7F1mi5
Eimiller K, Stoddard E, Janes B, Smith M, Vincek A. Reliability of Goniometric Techniques for Measuring Hip Flexor Length Using the Modified Thomas Test. IJSPT. Published online August 1, 2024:997-1002. doi:10.26603/001c.120899
Kira
Eimiller1a ,
Emma Stoddard
1 , Briana
Janes
1 ,
Mason Smith
1 ,
Andrew Vincek
1 1 Physical Therapy, Daemen University
Keywords: Hip extension, hip flexor length, intra-rater reliability, inter-rater reliability, modified Thomas test, iliopsoas https://doi.org/10.26603/001c.120899
Background
The modified Thomas test (MTT) is commonly used to assess the flexibility of hip musculature, including the iliopsoas, rectus femoris, and tensor fascia latae. This measurement is important to include in a comprehensive musculoskeletal examination. However, existing research shows conflicting results regarding its reliability, particularly due to variations in controlling pelvic tilt during testing, which may lead to inaccurate measurements of hip extension when quantifying the test outcomes.
Purpose/Hypothesis
This study aimed to evaluate the intra- and inter-rater reliability of the Modified Thomas Test (MTT) in assessing hip flexor length using a goniometer It was hypothesized that controlling for pelvic tilt would enhance the reliability of these measurements.
Intra- and inter-rater reliability study
Methods
Sixty-four healthy individuals were recruited to participate in this study The MTT was performed twice on each leg by both an experienced and a student physical therapist. Blinded goniometric measurements for hip extension range of motion (ROM) in the MTT position were taken with neutral pelvic tilt being enforced via palpation. A double-blind protocol was used where both examiners were unaware of each other’s measurements and the goniometer was covered to blind the measuring therapist to the values as well. ROM values were entered into a Microsoft Excel spreadsheet and quantified using SPSS software. Statistical analysis included calculating Intraclass Correlation Coefficients (ICCs) and Standard Errors of Measurement (SEMs) using SPSS software.
Results
The study included 64 participants (mean age = 23.7 ± 4.34 years). The MTT demonstrated high intra-rater reliability (ICC = 0.911) and inter-rater reliability (ICC = 0.851). The SEMs indicated minimal variability around the mean scores. The average hip extension ROM measured was 5.43± 9.73 degrees.
Conclusion
These results suggest that the MTT is a reliable tool for assessing hip flexor length in clinical practice, particularly when pelvic tilt is controlled. These results have important
Corresponding author:
Email: keimille@daemen.edu a
Kira Eimiller, PT, DPT, Cert. MDT
Board Certified in Orthopedics
Physical Therapy Department, Daemen University, Amherst, NY 14226, USA
Telephone: (716) 930-5989
Fax: (716) 839-8537
implications for accurately testing orthopedic limitations that can contribute to low back, hip, and knee pain.
3
The Modified Thomas Test (MTT) is an orthopedic assessment employed by clinicians to examine hip flexor length, specifically targeting the iliopsoas and rectus femoris muscles.1,2 Goniometers, commonly utilized in clinical settings, provide quantitative measurements in angular (degrees) units of motion for various joints in the upper and lower extremities.3 They can also be used to quantify outcomes of muscle length tests. In this study, “hip flexor length” refers to the overall assessment of the MTT, quantified by “hip extension ROM” measured using a goniometer during the MTT Despite the generally recognized good-toexcellent reliability of goniometric measurements for muscle length in the lower extremity, a limitation reported is the need for two hands on the tool, posing challenges in stabilizing other body segments, particularly when measuring isolated hip range of motion that may be affected by lumbopelvic contributions.4,5
Intra-rater reliability measures the consistency of one individual’s measurements, while inter-rater reliability assesses consistency between different individuals measuring the same phenomenon. The MTT can be used to determine hip flexor length using goniometric measurements of hip extension. The MTT can also be scored using a pass/fail method, where a “pass” indicates that the subject’s ROM meets or exceeds 0 degrees of hip extension in the testing position, and a “fail” signifies that the subject does not achieve this position and remains in varying degrees of hip flexion while in the testing position.
The MTT is used in clinical practice to assess hip flexor length in patients with conditions such as lower back pain, knee dysfunction, and hip pain.6‑10 However, the limited evidence regarding the MTT has shown conflicting reliability due to confounding variables including the lack of pelvic stabilization and varying positions of the contralateral hip.1 Researchers have found that uncontrolled pelvic tilt during the MTT measurement contributes to the overestimation of hip extension, leading to poor reliability 11,12 The purpose of this study was to evaluate the intra- and inter-rater reliability of the MTT to assess hip flexor length using a goniometer It was hypothesized that controlling for pelvic tilt would result in high inter- and intra-rater reliability of these measurements.
Subjects consisted of 64 volunteers (128 limbs). A power analysis estimation revealed that a sample size of approximately 93 limbs would provide a 95% confidence level when analyzing data at a p<0.05 level of significance. Inclusion criteria was willingness to participate and being at least 20 years old. Exclusion criteria included recent surgery (within
the prior six months) of the lumbar, hip, or knee region, recent physical trauma to the lumbar region or lower extremity (within the prior six months), or if the participant was under the care of a clinician for low back pain. Participants, primarily university students and staff, completed a detailed pre-participation questionnaire covering weekly activity level, height, weight, average sleep duration, dominant leg, prior injuries or surgeries, and back pain intensity (0-10 scale). This study adhered to ethical standards for human research and was approved by the Institutional Review Board (IRB). Informed consent was obtained from all individual participants included in the study
The primary researcher was a physical therapist, board certified in Orthopedic physical therapy with 12 years of experience in an outpatient setting. The additional four researchers were Doctor of Physical Therapy (DPT) students in the final year of their program. Following completion of all required paperwork, participants proceeded to the first station for MTT measurements of hip flexor length.
Participants were instructed to sit at the edge of the mat table, pull one knee towards the chest and gradually roll back to the table. Subjects were instructed to allow the opposite leg to hang off the table. Once the participant was in supine on the mat table, the examiner assisted the participant in further flexing the hip not being measured with one hand while palpating under the lumbar spine for a neutral lumbopelvic tilt with the other Neutral lumbopelvic tilt was operationally defined as the natural lordosis of the lumbar spine without excessive arching or flattening. Once neutral was found, the participant maintained their neutral position (confirmed by examiner palpation) for completion of the measurement. This allowed for maintaining a neutral lumbopelvic tilt and avoiding compensatory excessive lumbar lordosis during testing. Upon achieving the testing position, examiners utilized a standard plastic goniometer, positioning the fulcrum at the greater trochanter, the distal arm at the lateral midline of the femur, and the proximal arm at the lateral midline of the trunk. Stickers were placed on bony landmarks via palpation to encourage accuracy during measurements. Degrees of goniometric measurements were blinded by a piece of construction paper placed over the goniometer face to prevent the measurer from seeing the results.
Each participant underwent a total of eight measurements: two trials on each leg by each of the two examiners at two separate stations. While one examiner aligned the goniometer, blinded to the measurement by a piece of construction paper, the other examiner removed the paper, read and recorded the goniometric measurement. The stations were separated by a curtain to ensure independent measurements without vocal communication. Intra-rater
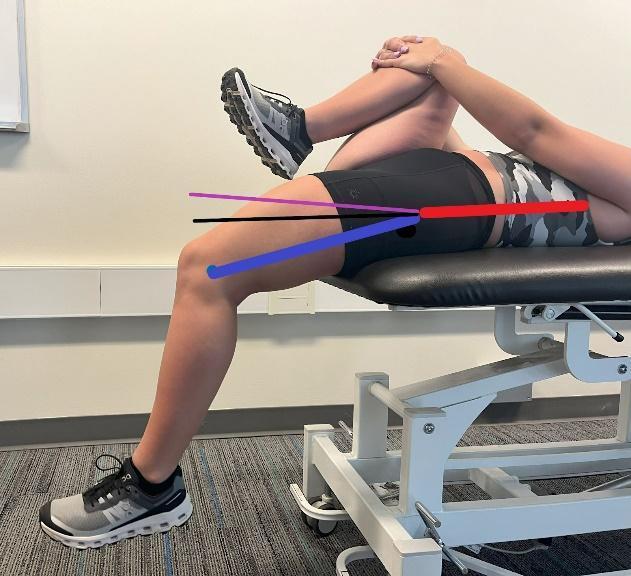
Figure 1. Modified Thomas Test with Pelvic Neutral
Red Line: Represents the stationary goniometer line at the lateral midline of the trunk, indicating pelvic neutral position. Purple Line: Demonstrates a tight hip flexor, with the thigh above 0 degrees of hip extension, indicating a failed MTT Black Line: Indicates the pass line where the thigh is parallel to the table, showing 0 degrees of hip extension. Blue Line: Shows the placement of the moving arm of the goniometer, aligned with the lateral midline of the femur and fulcrum at the greater trochanter, also representing a passing test.
reliability was assessed by comparing the two measurements on the same leg taken by the same examiner at each station, while inter-rater reliability was determined by comparing measurements on the same legs taken by different examiners across the two stations.
In this study, hip flexor length was measured in the MTT position with hip extension ROM being recorded in degrees. Data were entered into a Microsoft Excel spreadsheet for initial organization and verification before being analyzed in SPSS.
Statistical analysis was performed using SPSS software. ICCs were calculated to assess both intra-rater and interrater reliability SEMs were also computed to quantify the variability around the mean scores across trials, providing a comprehensive understanding of measurement consistency and reliability. Descriptive statistics, including means and standard deviations, were calculated to summarize the central tendency and dispersion of the hip ROM data.
The convenience sample of 64 volunteers, primarily physical therapy students, was between 20 and 43 years of age, and comprised 42 females and 22 males. On average, participants were moderately active, engaging in physical activities for about 5.61 hours weekly (SD ± 3.63). The average sleep duration was approximately 6.77 +/- 0.88 hours per night, indicating consistent sleep patterns. Additionally, the average Body Mass Index (BMI) was 25.55 ± 3.66 kg/
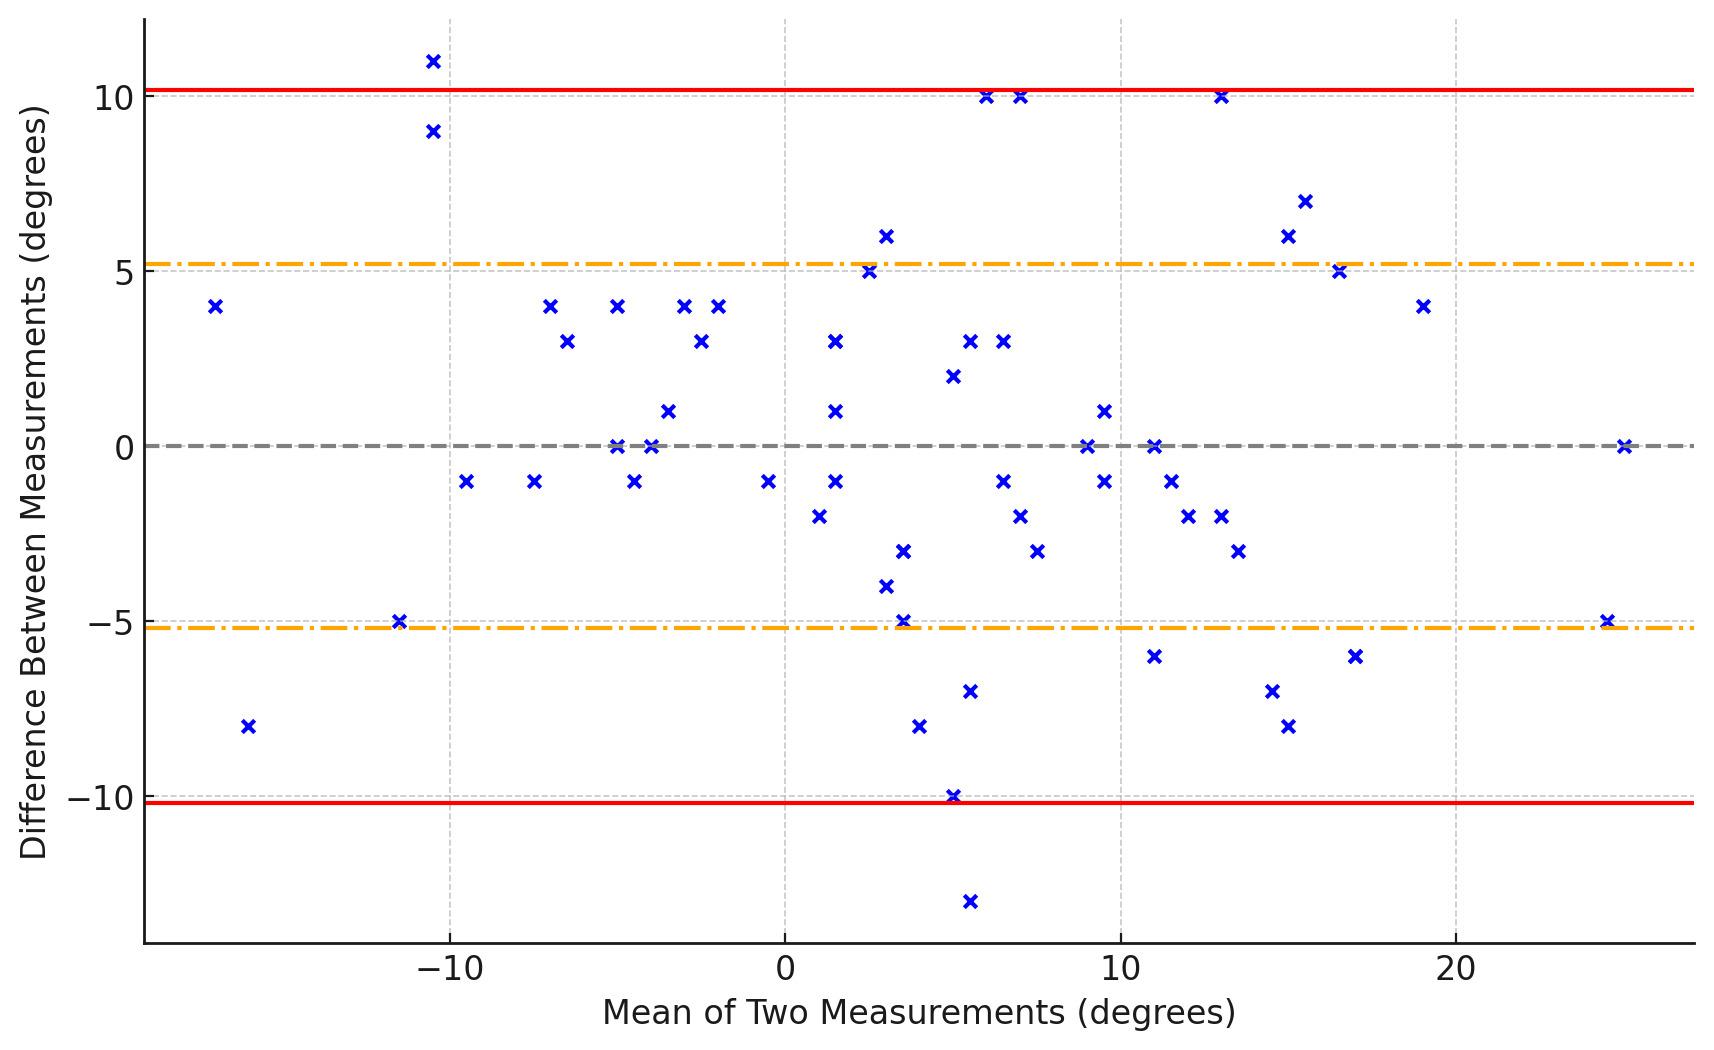
This plot shows the agreement between two goniometric measurements on the left side taken by Examiner 1. The blue dots represent the differences between measurements plotted against their mean. The gray dashed line indicates the mean difference between measurements. The red solid lines show the 95% limits of agreement (mean difference ± 1.96 times the standard deviation), and the orange dash-dotted lines represent one standard deviation from the mean difference.
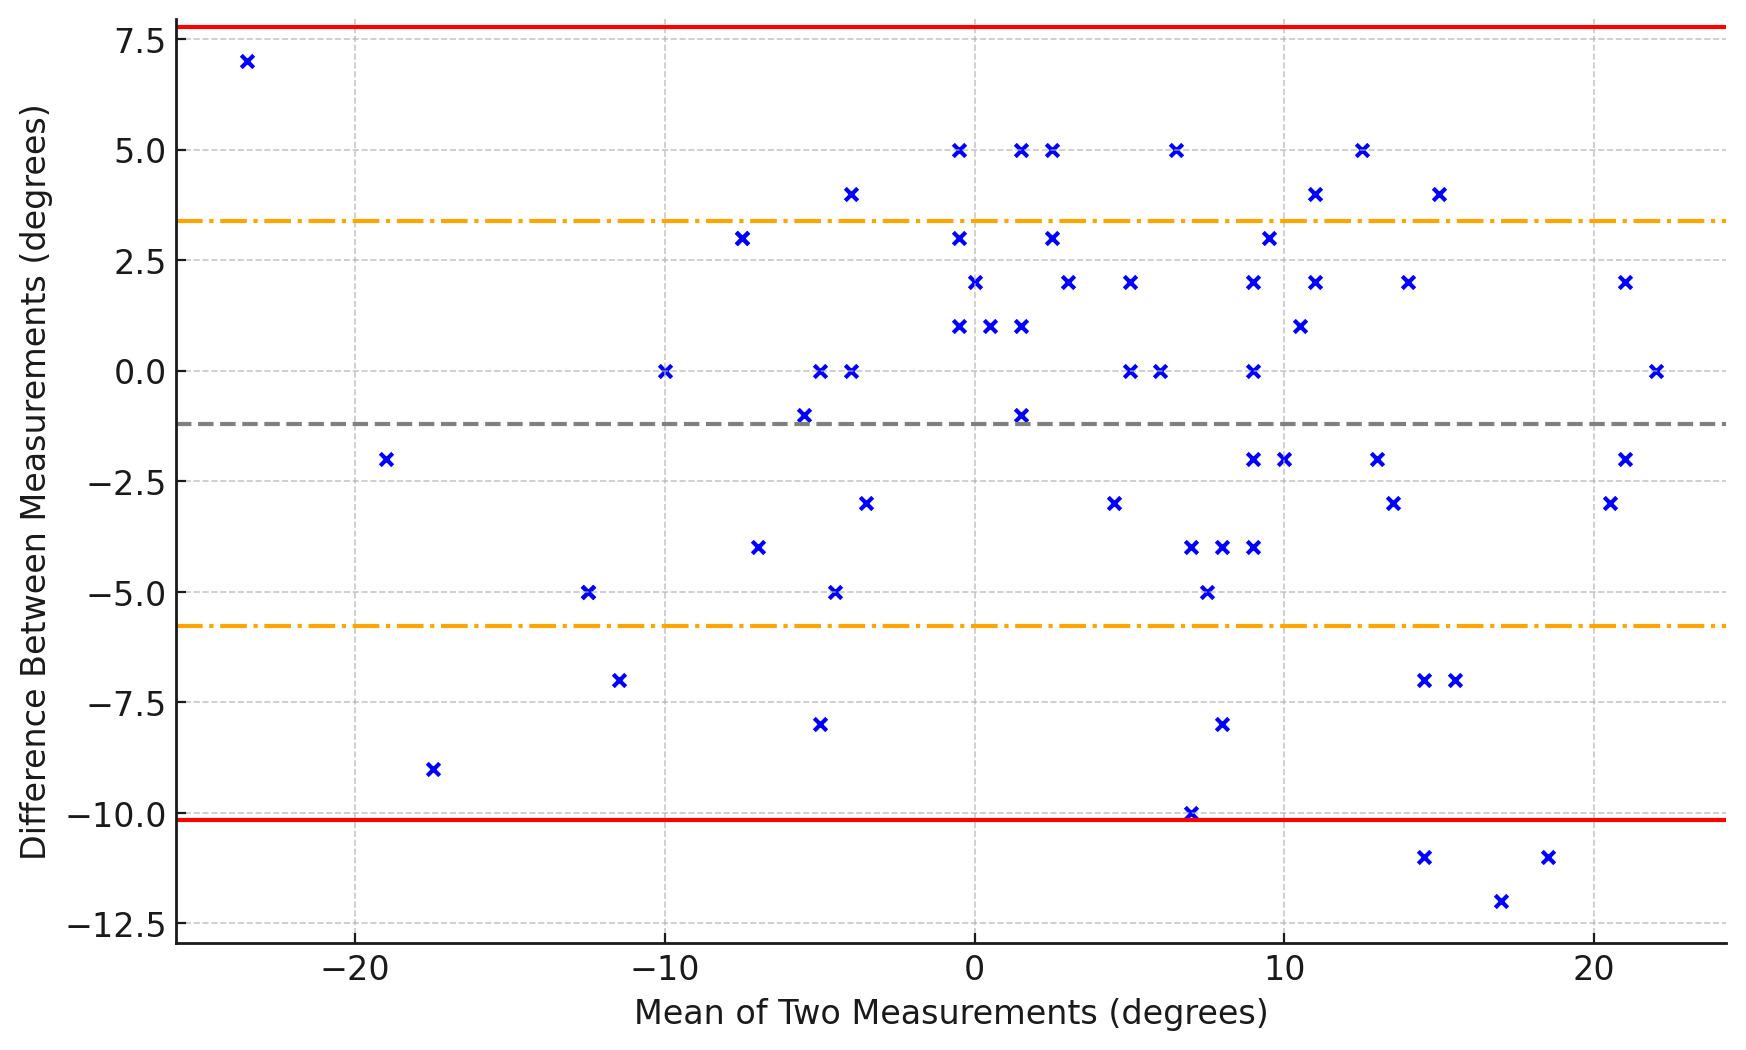
The blue dots represent the differences between measurements plotted against their mean. The gray dashed line indicates the mean difference between measurements. The red solid lines show the 95% limits of agreement (mean difference ± 1.96 times the standard deviation), and the orange dash-dotted lines represent one standard deviation from the mean difference.
m². The average hip flexor length measured using the MTT among the participants was 5.43± 9.73 degrees, suggesting a moderate level of variability across this sample population.
INTRA-RATER RELIABILITY
The intra-rater reliability was high, indicated by mean ICC’s of 0.899 and 0.923, suggesting repeatable measurement outcomes and good levels of agreement across multiple trials by the same rater (Figures 2-5, Table 1)
High inter-rater reliability was also demonstrated, with mean ICC’s ranging between 0.831-0.871. (Table 2)
Additionally, the SEMs for the hip flexor length using ROM data from the MTT further validated the precision of
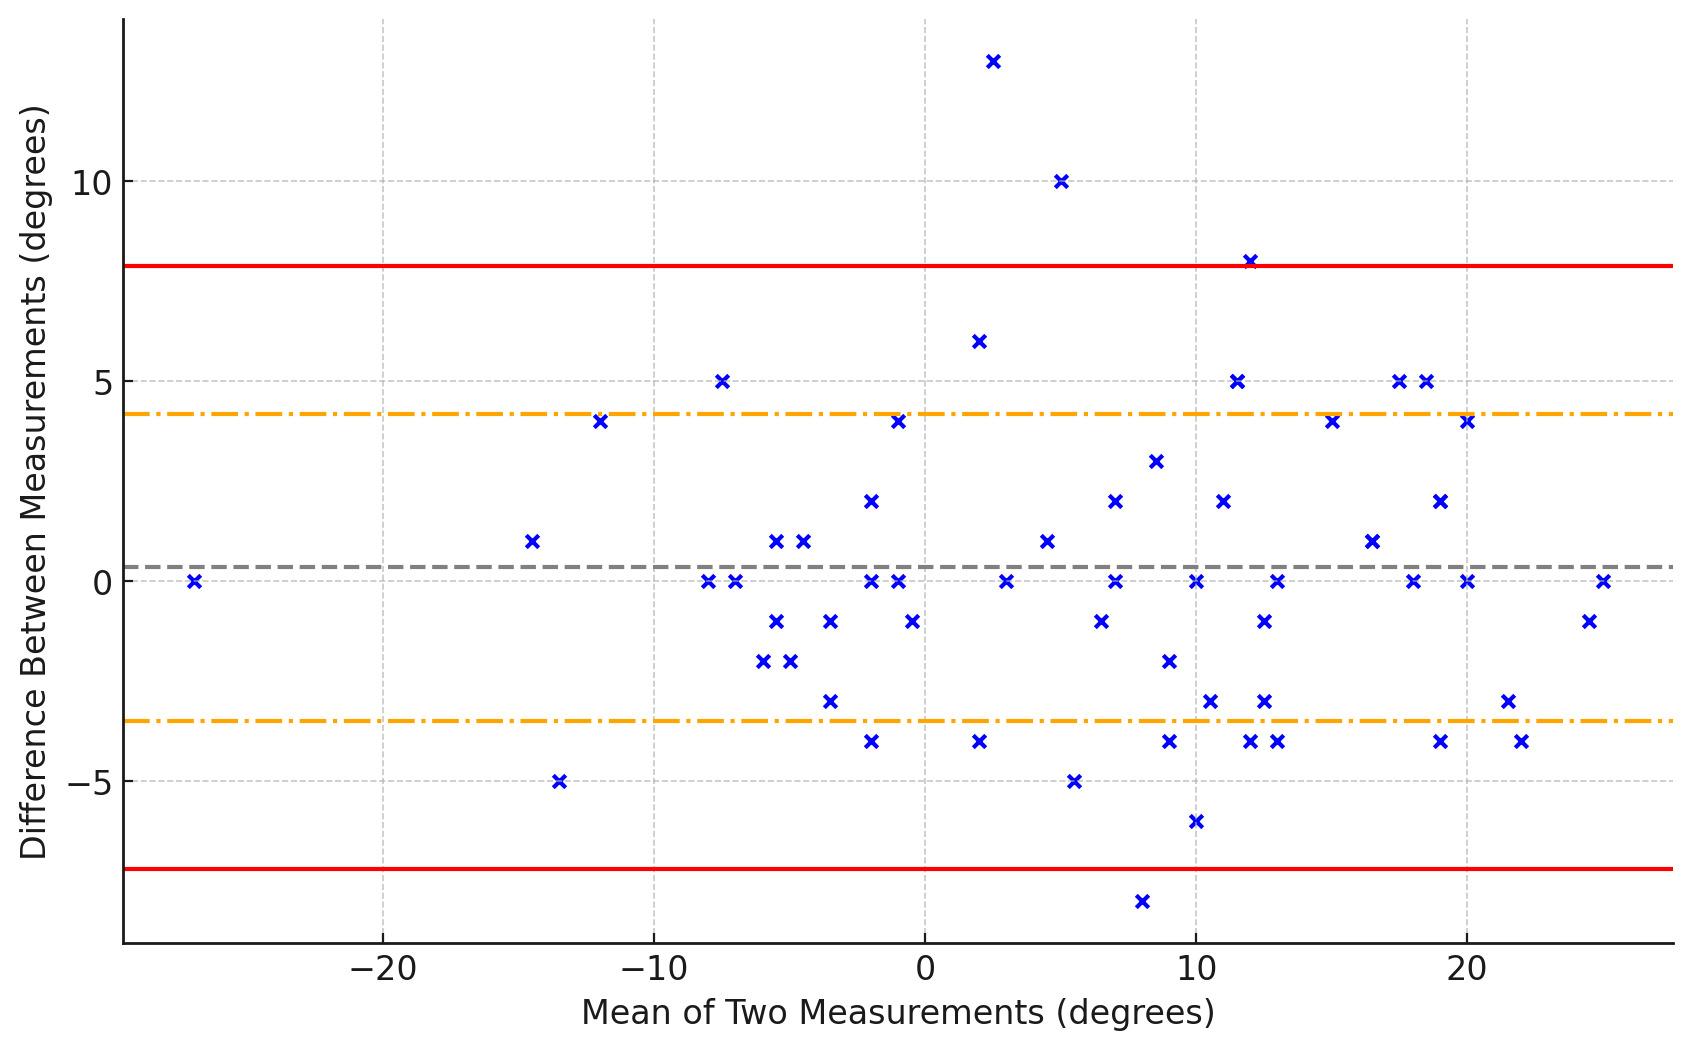
Figure 4. Bland-Altman Plot for Examiner 2 - Left Side
The blue dots represent the differences between measurements plotted against their mean. The gray dashed line indicates the mean difference between measurements. The red solid lines show the 95% limits of agreement (mean difference ± 1.96 times the standard deviation), and the orange dash-dotted lines represent one standard deviation from the mean difference.
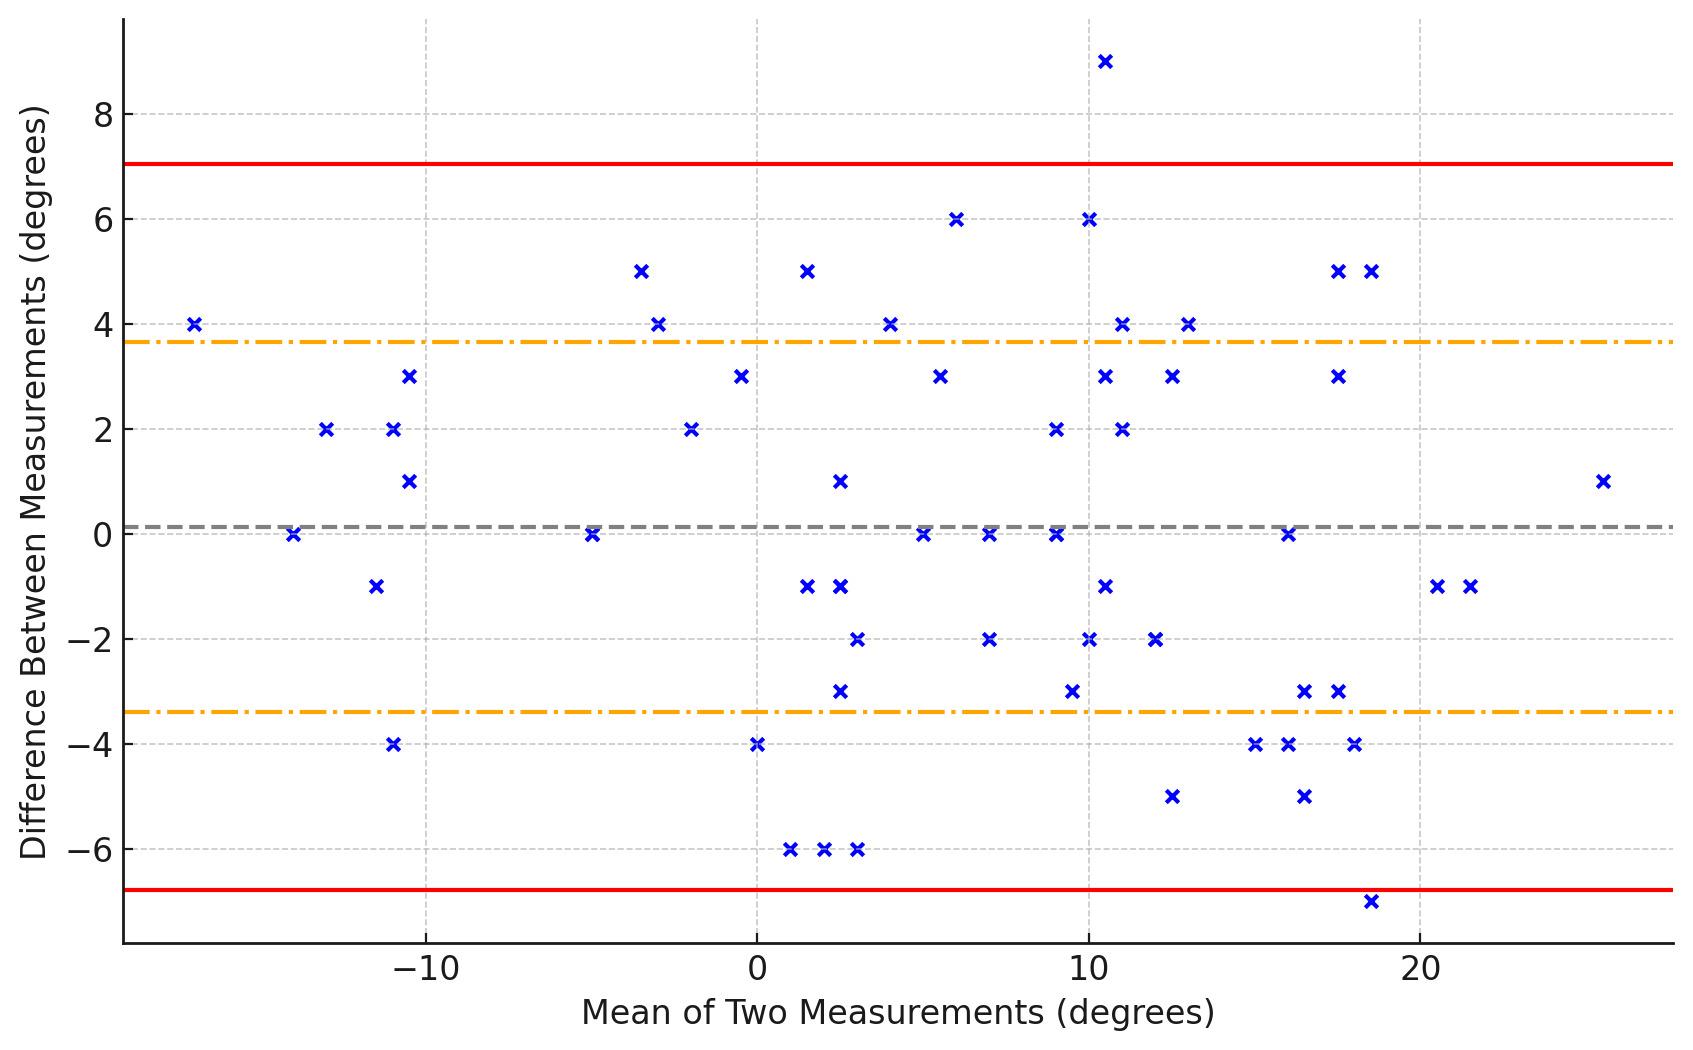
Figure 5. Bland-Altman Plot for Examiner 2 - Right Side
The blue dots represent the differences between measurements plotted against their mean. The gray dashed line indicates the mean difference between measurements. The red solid lines show the 95% limits of agreement (mean difference ± 1.96 times the standard deviation), and the orange dash-dotted lines represent one standard deviation from the mean difference.
the measurements. The overall average SEM across both examiners and both sides (left and right) is 2.85 degrees. Overall, these results underscore the high reliability and
measurement precision of the MTT, affirming its utility in both clinical and research settings for evaluating hip flexor length.
Although the MTT is widely used in orthopedic and physical therapy practice, its reference validity and measurement reliability amongst practitioners has been questioned. This study aimed to assess the reliability of the MTT, addressing inconsistencies in previous studies, particularly those with variations in controlling pelvic tilt during testing.2,12
The results of the current study indicate strong intraand inter rater reliability for the MTT when utilizing goniometric measurements. These findings align with those reported by Vigotsky et al.12 and Kim and Ha,13 underscoring the increased reliability, specificity, and sensitivity of the MTT when accounting for lumbopelvic movement and controlling for pelvic tilt. Prior studies have consistently shown that pelvic tilt significantly affects the differences between MTT measurements of hip flexor length and standard hip extension goniometric measurements taken in the prone position. This emphasizes the important role pelvic tilt plays in the relationship between hip muscle length and pelvic position, compared to measuring hip joint ROM. Due to the lack of pelvic control in prior studies, results of the current study contradicted the findings of both Peeler and Anderson14 and Gabbe et al.15 who reported poor reliability for this test. However, Neves et al.8 suggested that positive results for shortening may also be influenced by an increase in the joint capsule and ligament stiffness, a factor not considered in this study The improved reliability observed in the current study can likely be attributed to the control of pelvic tilt during the MTT measurements. By attempting to reach and maintain a neutral pelvic position, the potential for measurement error and variability was lessened, leading to more consistent results.
Maintaining a neutral pelvic tilt helps isolate the hip flexor muscles and provides a more accurate assessment of hip extension ROM.12 Without controlling for pelvic tilt, compensatory movements in the lumbar spine and pelvis can occur, leading to overestimation or underestimation of actual hip extension.13 This discrepancy highlights the importance of standardized testing protocols that account
Table 1. Intra-rater Reliability Scores for Modified Thomas Test Assessments
Table 2. Comparison of Inter-rater Reliability Across Two Trials for Hip Flexor Length Measurement
for pelvic positioning to achieve reliable and valid measurements. Additionally, the use of anatomical landmark stickers may have improved accuracy of alignment during goniometer evaluation across data collection by different examiners for each participant. Outcomes of the current study offer valuable information to clinicians, emphasizing the importance of controlling pelvic tilt when performing the MTT, as pelvic tilt appears to contribute to variability in measures.
The current findings contrast with those of Watkins et al.,16 challenging the assertion that goniometric measurements display high reliability within the same therapist but lacked consistency between different therapists. The current results are consistent with the work of Clapis et al.17 demonstrating that goniometric measurement of hip flexor length using the MTT displayed both intra and interrater reliability, surpassing that of an inclinometer based measurements. The superior intra-rater reliability observed may be attributed to several factors. Individual examiners tend to develop consistent personal techniques and methods when performing repeated measurements, which reduces variability and leads to higher intra-rater reliability. In contrast, inter-rater reliability involves comparing measurements between different examiners, each of whom may have slight variations in their technique or interpretation, despite standardized training and protocols. The small differences can lead to slightly lower inter-rater reliability compared to intra-rater reliability
Moreover, the blinding technique used in the study, where the goniometric measurement was obscured by construction paper, helped minimize bias but did not entirely eliminate individual differences in measurement technique. Therefore, while the standardized protocols and training resulted in overall high reliability, intra-rater reliability was higher as each examiner was more consistent with their own methods compared to aligning perfectly with another examiner’s methods. Clapis et al.17 emphasized the importance of consistency in measurement techniques, which inherently supports higher both inter- and intra-rater reliability The current study’s findings align with this, showing that when a single examiner performs repeated measurements, the consistency of their technique leads to more reliable results. However, despite these dif-
ferences, the study still demonstrated high inter-rater reliability, indicating that standardized training and protocols were effective in achieving reliable measurements across different examiners.
This study’s strengths include the inclusion of both sexes, minimizing potential bias through blinding, and involving examiners with varying levels of experience, which demonstrates the reliability of the MTT across different expertise levels.
Although the MTT demonstrated high reliability among examiners, it is crucial to acknowledge certain limitations inherent to the study The assessment was conducted on a young, healthy population limiting the generalizability of the findings to broader age groups and diverse populations. There is a possibility of hip flexor stretching occurring after repeated measurements, as each participant underwent four goniometric measurements per leg, which could have influenced the hip flexor length and therefore measured ROM. Furthermore, the order in which subjects were tested was not randomized, which could have introduced an order effect, potentially influencing the reliability outcomes. Future studies should consider randomizing the order of testing to eliminate this potential bias.
The findings of this study demonstrate that the MTT shows strong inter- and intra-rater reliability when pelvic position is considered, aligning with the results of studies that have implemented similar controls. Previously reported poor reliability of the MTT in some studies may be due to the lack of control of pelvic position. These results support the use of the MMT as a reliable measure of hip flexor length in clinical practice when a neutral lumbar spine is maintained. It is important that physical therapists and medical professionals use reliable tests when assessing hip flexor length.
The authors declare no conflicts of interest.
Submitted: January 26, 2024 CDT, Accepted: June 17, 2024 CDT
© The Author(s)
This is an open-access article distributed under the terms of the Creative Commons Attribution 4.0 International License (CCBY-NC-4.0). View this license’s legal deed at https://creativecommons.org/licenses/by-nc/4.0 and legal code at https://creativecommons.org/licenses/by-nc/4.0/legalcode for more information.
1. Cady K, Powis M, Hopgood K. Intrarater and interrater reliability of the modified Thomas Test. J Bodyw Mov Ther. 2022;29:86-91. doi:10.1016/ j.jbmt.2021.09.014
2. Peeler JD, Anderson JE. Reliability limits of the modified Thomas Test for assessing rectus femoris muscle flexibility about the knee joint. J Athl Train 2008;43(5):470-476. doi:10.4085/1062-6050-43.5.470
3. Lea RD, Gerhardt JJ. Range-of-motion measurements. J Bone Joint Surg Am 1995;77(5):784-798. doi:10.2106/ 00004623-199505000-00017
4. Peeler J, Leiter J. Using digital photography to document rectus femoris flexibility: A reliability study of the modified Thomas Test. Physiother Theory Pract 2012;29(4):319-327 doi:10.3109/ 09593985.2012.731140
5. Roach SM, San Juan JG, Suprak DN, Lyda M. Concurrent validity of digital inclinometer and universal goniometer in assessing passive hip mobility in healthy subjects. Int J Sports Phys Ther. 2013;8(5):680-688.
6. Borges NF, Borges BS, Sanchez EG, Sanchez HM. Correlation between anterior knee pain with flexibility muscles hip. Man Ther Posturol Rehabil J. 2020:1-5. doi:10.17784/mtprehabjournal.2016.14.408
7 Roach SM, San Juan JG, Suprak DN, Lyda M, Boydston C. Patellofemoral pain in subjects exhibit decreased passive hip range of motion compared to controls. Int J Sports Phys Ther 2014;9(4):468-475.
8. Neves RP, Oliveira D, Fanasca MA, Vechin FC. Shortening of hip flexor muscles and chronic lowback pain among resistance training practitioners: Applications of the modified Thomas Test. Sport Sci Health Published online 2022. doi:10.1007/ s11332-022-00969-2
9. Kim WD, Shin D. Correlations between hip extension range of motion, hip extension asymmetry, and compensatory lumbar movement in patients with nonspecific chronic low back pain. NMed Sci Monit. 2020;26:e925080. doi:10.12659/MSM.925080
10. Wu A, March L, Zheng X, et al. Global low back pain prevalence and years lived with disability from 1990 to 2017: estimates from the Global Burden of Disease Study 2017 Ann Transl Med 2020;8(6):299. doi:10.21037/atm.2020.02.175
11. Nussbaumer S, Leunig M, Glatthorn JF, et al. Validity and test-retest reliability of manual goniometers for measuring passive hip range of motion in femoroacetabular impingement patients. BMC Musculoskelet Disord 2010;11:194. doi:10.1186/ 1471-2474-11-194
12. Vigotsky AD, Lehman GJ, Beardsley C, Contreras B, Chung B, Feser EH. The modified Thomas test is not a valid measure of hip extension unless pelvic tilt is controlled. PeerJ. 4(2016):e2325. doi:10.7717/ peerj.2325
13. Kim GM, Ha SM. Reliability of the modified Thomas test using a lumbo-pelvic stabilization. J Phys Ther Sci 2015;27:447-449. doi:10.1589/ jpts.27.447
14. Peeler J, Anderson JE. Reliability of the Thomas test for assessing range of motion about the hip. Phys Ther Sport 2007;8(1):14-21. doi:10.1016/ j.ptsp.2006.09.023
15. Gabbe B. Reliability of common lower extremity musculoskeletal screening tests. Phys Ther Sport 2004;5(2):90-97. doi:10.1016/s1466-853x(04)00022-7
16. Watkins MA, Riddle DL, Lamb RL, Personius WJ. Reliability of goniometric measurements and visual estimates of knee range of motion obtained in a clinical setting. Phys Ther. 1991;71(2):90-96. doi:10.1093/ptj/71.2.90
17 Clapis PA, Davis SM, Davis RO Reliability of inclinometer and goniometric measurements of hip extension flexibility using the modified Thomas test. Physiother Theory Pract 2008;24(2):135-141. doi:10.1080/09593980701378256
Imai T, Nagamatsu T, Yoshizato Y, Miyara K, Sumizono M, Nakamura M. Acute Effects of Handheld Vibration Massage on Posterior Shoulder Soft Tissues. IJSPT. Published online August 2, 2024:1003-1011. doi:10.26603/001c.121299
Takaki Imai1a , Takashi Nagamatsu1 , Yushin Yoshizato1 , Kodai Miyara1 , Megumi Sumizono1 , Masatoshi Nakamura2
1 Department of Rehabilitation, Kyushu University of Nursing and Social Welfare, 2 Faculty of Rehabilitation Sciences, Nishi Kyushu University
Keywords: crossover design, muscle strength, range of motion, shoulder joint, vibration massage https://doi.org/10.26603/001c.121299
Background
Interventions using vibration stimulation have been recognized for their potential for increasing range of motion (ROM) without compromising muscle strength. Handheld vibration massagers can efficiently deliver vibration therapy to the shoulder joint and may be a potential treatment.
Purpose
To evaluate the effects of vibration massage using a handheld device on the soft tissues of the posterior shoulder joint, particularly on internal rotation (IR) passive ROM and external rotation (ER) muscle strength.
Study Design
Crossover study design.
Methods
A crossover study with a 5-min vibration massage and passive control condition was conducted in healthy male volunteers (mean age 20.5 ± 1.7 years). Vibration massage was applied to the posterior shoulder soft tissues of the dominant arm, with no intervention under control conditions. IR-ROM (vertebral level and in abduction) and strength of the external rotators (isometric and isokinetic) were measured before and immediately after the intervention. Vertebral levels were calculated as a ratio of lengths (ratio decreases with increased mobility). IR-ROM in abduction, the angle was measured. Statistical analysis was performed with two-way repeated measures ANOVA and paired t-test (Bonferroni correction).
Results
Vibration application decreased (improved) vertebral level IR ROM by −4.1% (p < 0.01, d = 0.445) and increased abduction position IR ROM by 11.4° (p < 0.01, d = 0.694). These changes exceeded the 95% confidence interval for the minimum detectable change. By contrast, the control condition produced no changes. IR-ROM (vertebral level and abduction) immediately after the intervention showed significant differences between the control and vibration conditions (p = 0.036, d = 0.273; p = 0.048, d = 0.483, respectively). Muscle strength did not show any interaction, time, or between-condition effects.
Corresponding Author:
Takaki Imai, PT, PhD
Department of Rehabilitation, Kyushu University of Nursing and Social Welfare 888, Tomino, Tamana, Kumamoto, 865-0062, Japan
Tel: +81-968-75-1800 Fax: +81-968-75-1811
Email address: t-imai@kyushu-ns.ac.jp
A massage using a handheld vibration massager applied to the posterior shoulder soft tissues increased IR-ROM without negatively affecting muscle strength, suggesting its potential use as a means of warming up.
Level 3
Posterior shoulder tightness (PST) is defined as soft tissue tightness in the posterior region of the glenohumeral joint, including the infraspinatus, teres minor, and posterior glenohumeral joint capsule.1 This condition has been observed in so-called shoulder range of motion (ROM) disorders, such as frozen shoulder and stiff shoulder, impingement syndrome, rotator cuff tears, anterior instability, and glenohumeral internal rotation deficit (GIRD), among overhead athletes.2,3
PST induces abnormal humeral head motion during shoulder flexion and abduction and is involved in subacromial pain syndrome, thereby affecting shoulder ROM.4‑6 It also can cause scapular malposition, which has been identified as a factor in shoulder disorders.7 Aside from pain, this condition also is present in numerous pathological processes in the shoulder, highlighting the importance of treatment, including preventive measures. However, aggressive treatment, such as manipulation or capsular release, is rarely necessary, with most cases showing improvement following with conservative treatment such as physical therapy, massage, and stretching.8,9
Massage and static stretching are typical approaches for improving soft tissue flexibility. However, self-massage may be challenging to perform in certain areas, such as the shoulder region, inhibiting continuous and preventive intervention. Furthermore, several previous studies have reported that 45–60 s of static stretching interventions can potentially decrease muscle force generating capacity, a phenomenon referred to as stretch-induced force deficit.10, 11 Therefore, as alternatives to stretching and massage, approaches using vibration have attracted considerable attention in recent years. In fact, recent systematic reviews and meta-analyses showed that vibration therapy for lower extremity muscles reduces stiffness and increases ROM.12,13 Similarly, other authors have suggested that vibration therapy improves flexibility, muscle activation, and maximal voluntary contractility 14,15
Despite the increase in attention directed toward vibration therapy, most studies showing the effects of vibration therapy on stiffness and ROM have been conducted using whole-body vibration or vibrating foam rollers. Moreover, unlike handheld devices, which can easily target specific areas, whole-body vibration or vibration foam rollers make targeting specific areas, such as the soft tissues of the posterior shoulder, quite difficult. A handheld massager is a portable tool that can be used in any environment, including sports stadiums and homes. However, only a few previous studies have investigated the effectiveness of a handheld vibration massager Konrad et al.,16 who inves-
tigated the acute effects of a handheld vibration massager on calf muscles, reported that patients increased their ankle dorsiflexion ROM while maintaining ankle plantar flexion torque. These results are similar to those observed with other vibration therapies, such as whole-body vibration and vibrating foam rollers, and indicate that handheld devices can improve ROM without decreasing muscle activity and maximum voluntary contractile force. The current study extends previous findings and may facilitate the establishment of a new treatment for PST The authors hypothesized that massage using a handheld vibration tool would increase ROM without decreasing muscle strength.
Thus, the purpose of the current study was to evaluate the effects of vibration massage using a handheld device on the soft tissues of the posterior shoulder joint, particularly on internal rotation (IR) passive ROM and external rotation (ER) muscle strength.
This crossover study examined the effects of vibration massage over the soft tissues of the posterior shoulder on ROM and muscle strength. The dependent variables included IRROM and ER muscle strength, whereas the independent variables included the presence or absence of intervention (vibration vs. control) and the time effects before (PRE) and immediately after the intervention (POST).
This study enrolled 15 healthy men (aged 20.5 ± 1.7 years; height, 169.9 ± 6.3 cm; weight, 62.9 ± 7.4 kg). Participants who had no experience with regular resistance training over the prior six months and had no history of neuromuscular disease or orthopedic neck and upper extremity pain/injury were included. Based on previous studies,16 the sample size required for a two-way repeated-measures analysis of variance (ANOVA) [effect size = 0.40 (large), α error = 0.05, power = 0.80] was calculated using G∗ power 3.1 software (Heinrich Heine University, Düsseldorf, Germany). After calculating the sample size, >14 participants were ultimately needed for analysis.
This study was approved by the Institutional Ethical Review Board and was conducted in accordance with the ethical principles of the Declaration of Helsinki and the Ethical Guidelines for Life Sciences and Medical Research Involving Human Subjects. All participants provided written informed consent after being fully informed of the study procedures and objectives.
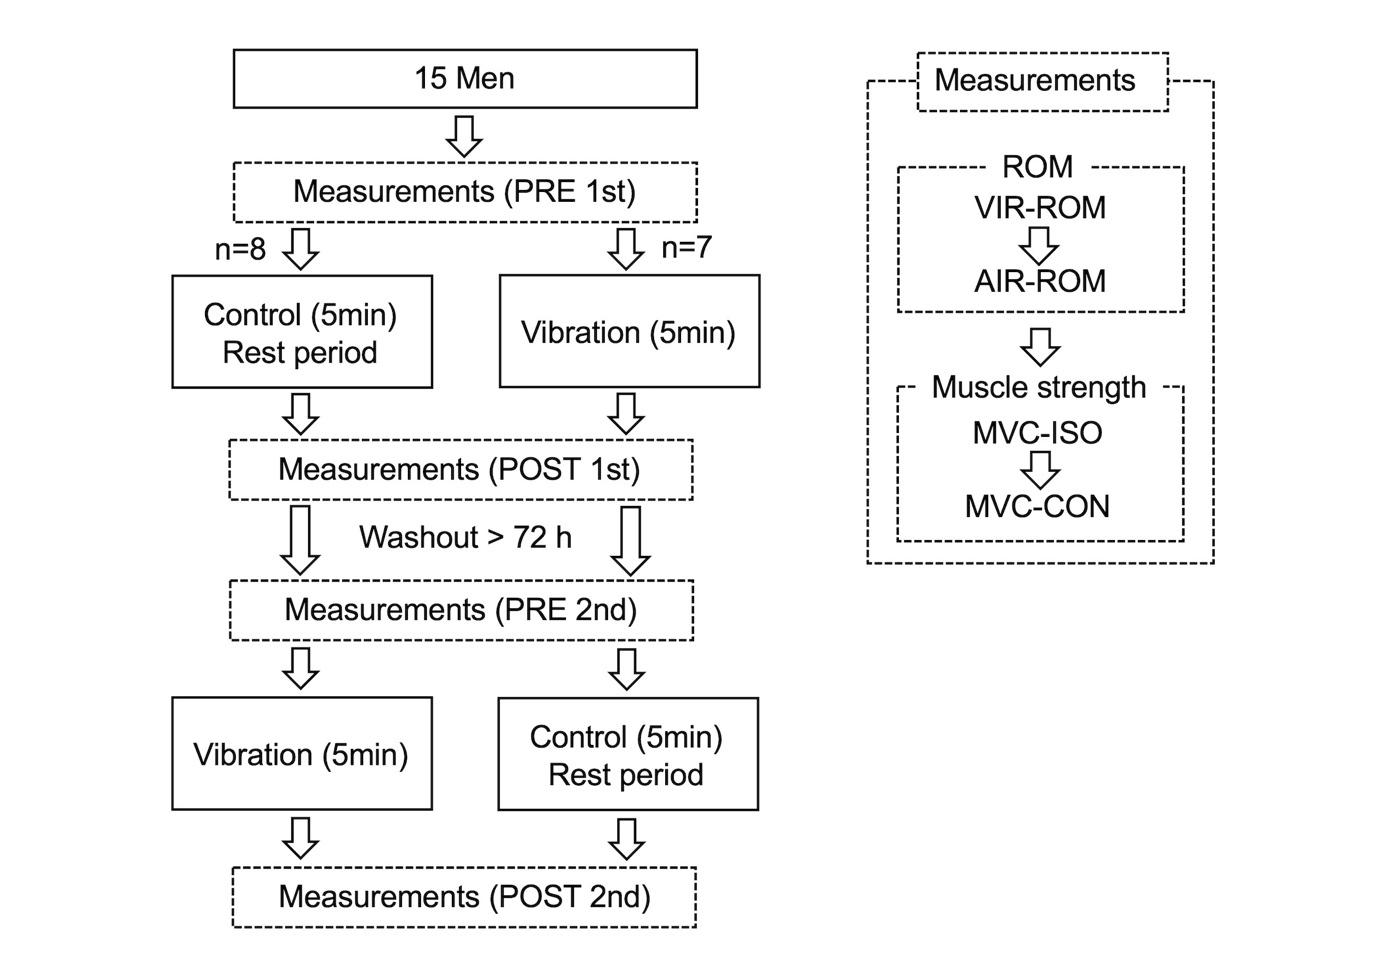
Figure 1. Study Procedures.
ROM, range of motion; VIR, internal rotation at vertebral level; AIR, internal rotation in abduction position; MVC, maximum voluntary contraction; ISO, isometric; CON, concentric. PRE, before intervention; POST, immediately after intervention
The procedures are illustrated in Figure 1. Participants were instructed to visit the laboratory twice, at least 72 h apart. Participants were randomly assigned to receive either handheld vibration massage (vibration) or the control condition (no vibration) using the permuted block method. Participants who received the vibration intervention at their first visit were provided the control condition on their second visit. Conversely, participants who received the control condition at the first visit were subsequently provided the vibration intervention at their second visit. Shoulder exercises, including elevation and internal and external rotations, were performed for five minutes prior to measurement. Moreover, isometric and concentric contractions were practiced once each at approximately 30% effort. All outcome variables were measured before (PRE) and after (POST) the intervention. The intervention (vibration or control) was administered immediately after the PRE measurement, and the POST measurement was taken immediately after the intervention. The time taken for participants to complete the PRE measurement, intervention (vibration or control), and POST measurement in one visit was <20 min. The two examiners performing the measurements were blinded to grouping of the participants. In both PRE and POST measurements, (1) passive IRROM at the vertebral level reached by the extended thumb (VIR-ROM); (2) passive IR-ROM of the shoulder joint at 90° abduction (AIR-ROM); (3) maximum voluntary contraction in isometric (MVC-ISO); and (4) concentric isokinetic contraction torque (MVC-CON), was measured following this order.
Two shoulder IR-ROM tests, namely VIR-ROM and AIRROM, were performed. VIR-ROM is recommended by the American Academy of Orthopedic Surgeons as a measure of shoulder IR-ROM, with reports showing moderate to high
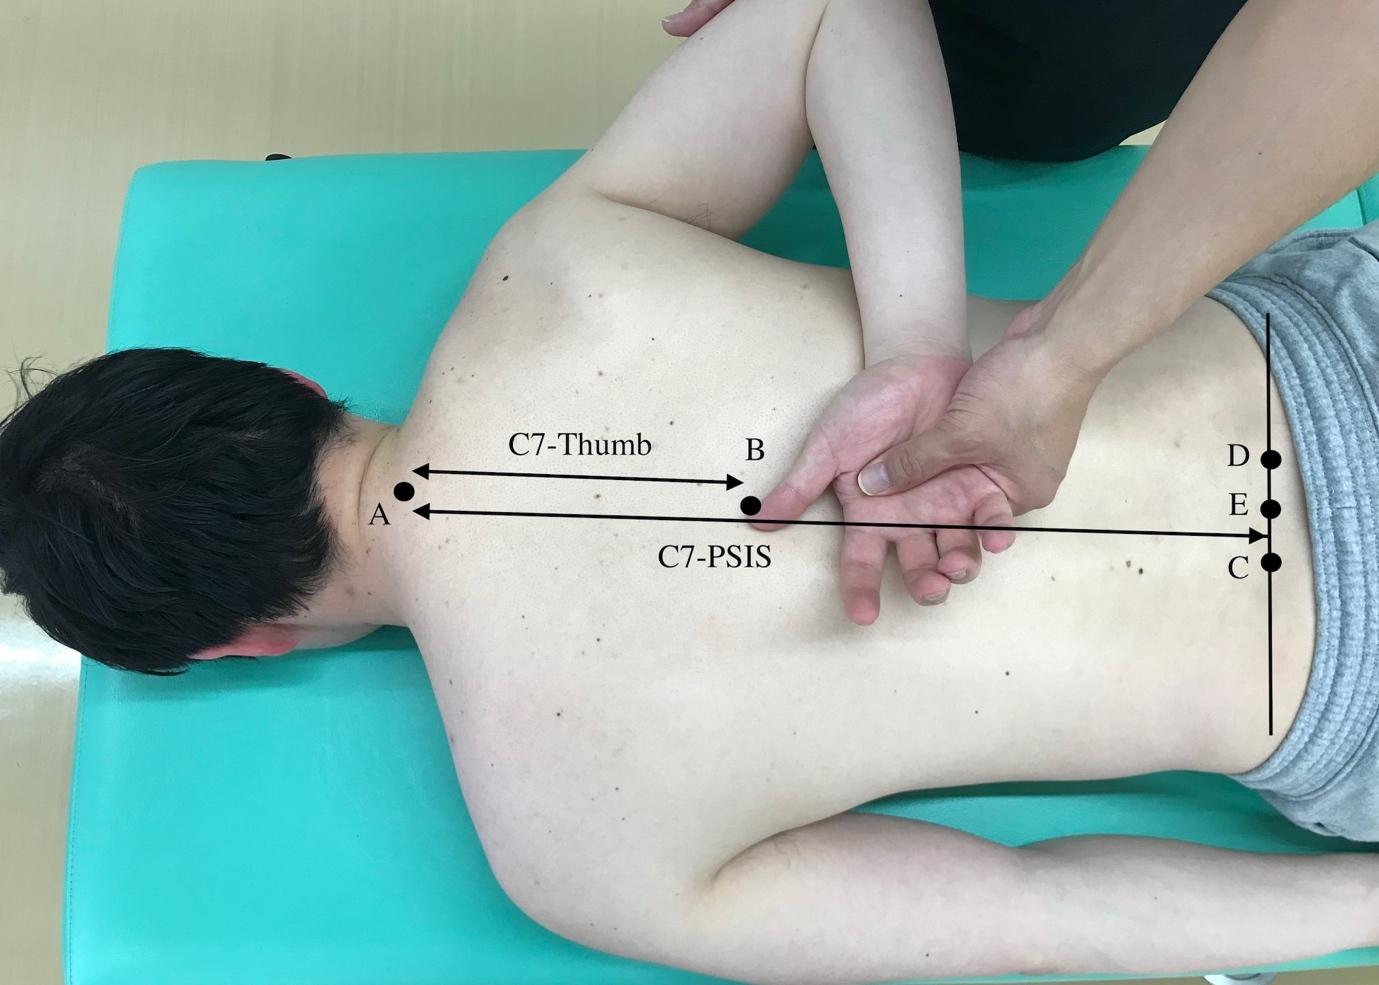
Reference line and distance measurements. (A) Palpation of the C7 spinous process. (B) Thumb position. (C, D): Palpation of the superior posterior iliac spine. (E) Midpoint of the C–D line. C7–thumb, distance between A and B. C7-PSIS, distance between A and E, and VIR-ROM was calculated as the ratio of C7–thumb to C7–PSIS. VIR-ROM, vertebral level range of motion
intraexaminer reliability 17,18 To obtain normality, VIRROM measurements were obtained based on the method described by Mitsukane et al.19 The ratio of “the length between the thumb and the seventh cervical spinous process” to “the length between the middle position of both superior posterior iliac spines and the seventh cervical spinous process” was calculated (Figure 2), with lower ratios indicating greater the ROM. VIR-ROM involves the extension and IR of the glenohumeral joint and is influenced by the extensibility and flexibility of the infraspinatus muscle. It is a static stretching method for the infraspinatus muscle.20 Given that VIR-ROM is also affected by factors other than the glenohumeral joint, such as the elbow, wrist, and thumb, AIR-ROM was also evaluated. AIR-ROM was measured using a digital inclinometer (BEVEL BOX; Niigataseiki, Niigata, Japan) with the patient in the prone position and their shoulder joint in 90° abduction, after which the angle of IR was recorded in 1° increments (Figure 3). The digital inclinometer has a minimum reading of 0.1°, a reading accuracy of ±0.2°, and a repeatability of 0.1°. AIR-ROM was believed to involve stretching only the inferior fiber of the middle and inferior fibers of the infraspinatus.20 AIRROM showed high reproducibility as a method of measuring glenohumeral joint IR-ROM given that it controls scapulothoracic joint motion through scapular fixation.21 In this study, the examiner stabilized the coracoid process (scapular movement) using their forearm while also supporting the subject’s distal upper arm with their other hand to measure AIR-ROM with a measurement assistant (Figure 3). These considerations ensured that scapular movement was minimized as much as possible avoid tension in the subject’s periscapular muscles and avoid a shift in the horizontal abduction angle of the glenohumeral joint. In all participants, ROM measurements and measurement assistance were performed by two physical therapists with >10 years of experience in orthopedics.
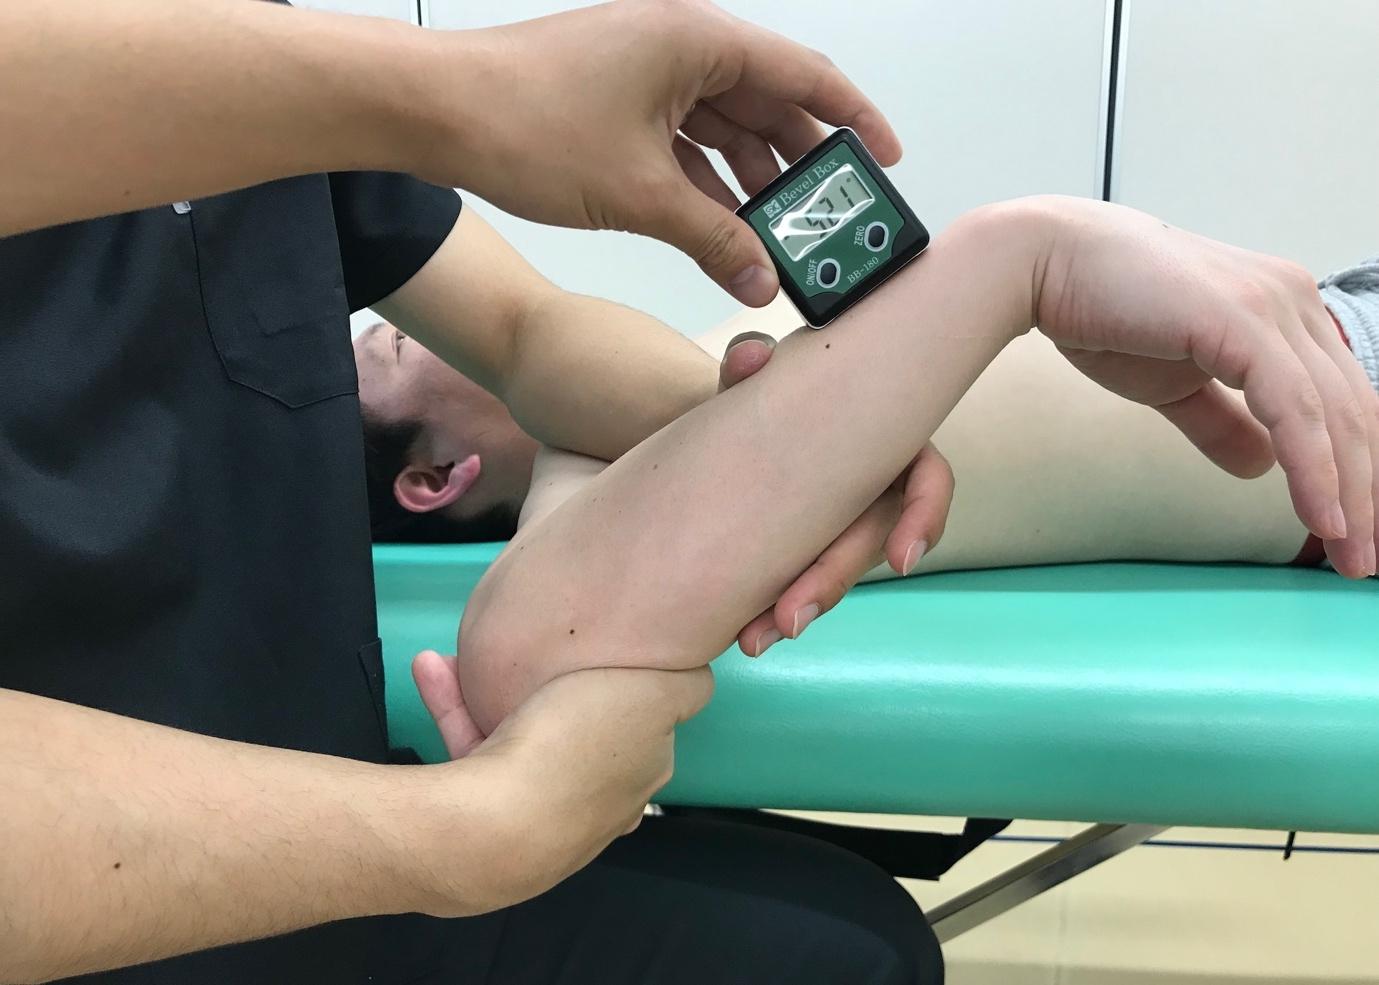
Figure 3. Passive Abduction IR-ROM measurement method.
IR-ROM was measured with a digital inclinometer in the 90° abduction position of the shoulder joint using the scapular fixation technique. AIR, abduction position range of motion; IR-ROM, internal rotation range of motion
Shoulder ER muscle strength measurements for MVC-ISO and MVC-CON were performed using a dynamometer (Primus RS; BTE Technologies, Hanover, MD, USA) and depicted in Figure 4. According to the Primus RS manual, measurements were obtained in the standing position with their feet shoulder width apart. To ensure that postural changes did not influence PRE and POST measurements, a tape was placed on the floor to standardize the standing position. Participants were also instructed to avoid compensatory movements during measurements. MVC-ISO measurements were performed with the shoulder joint in 45° of abduction, in a neutral position of IR and ER, and with the elbow joint flexed at 90°. MVC-ISO was performed twice, for 6 seconds, with a 60-s rest between efforts, and the maximum value was analyzed. MVC-CON measurements were performed at an angular velocity of 60°/s from 55° IR to 55° ER with the shoulder joint in 45° abduction and the elbow joint in 90° flexion. The examiner encouraged the participants to maximize their effort during muscle contraction. The peak (maximum) torque in three concentric contractions was used as the MVC-CON torque.
Using the spherical attachment of a handheld vibration massager (Recovery Gun RG-01; Dream Factory, Inc., Osaka, Japan), a vibration frequency of 58 Hz and amplitude of 5 mm, vibration massage was applied over the infraspinatus fossa for five minutes. The frequency and amplitude settings were based on reports showing increases in ROM and muscle strength.14,16,22 The five minute intervention time was based on a previous study in which a handheld vibration massager was used to improve the flexibility of the lower limb muscles.16 Vibration massage was performed in a relaxed prone position (neutral IR and ER positions with 90° shoulder joint abduction) (Figure 5) and initiated just
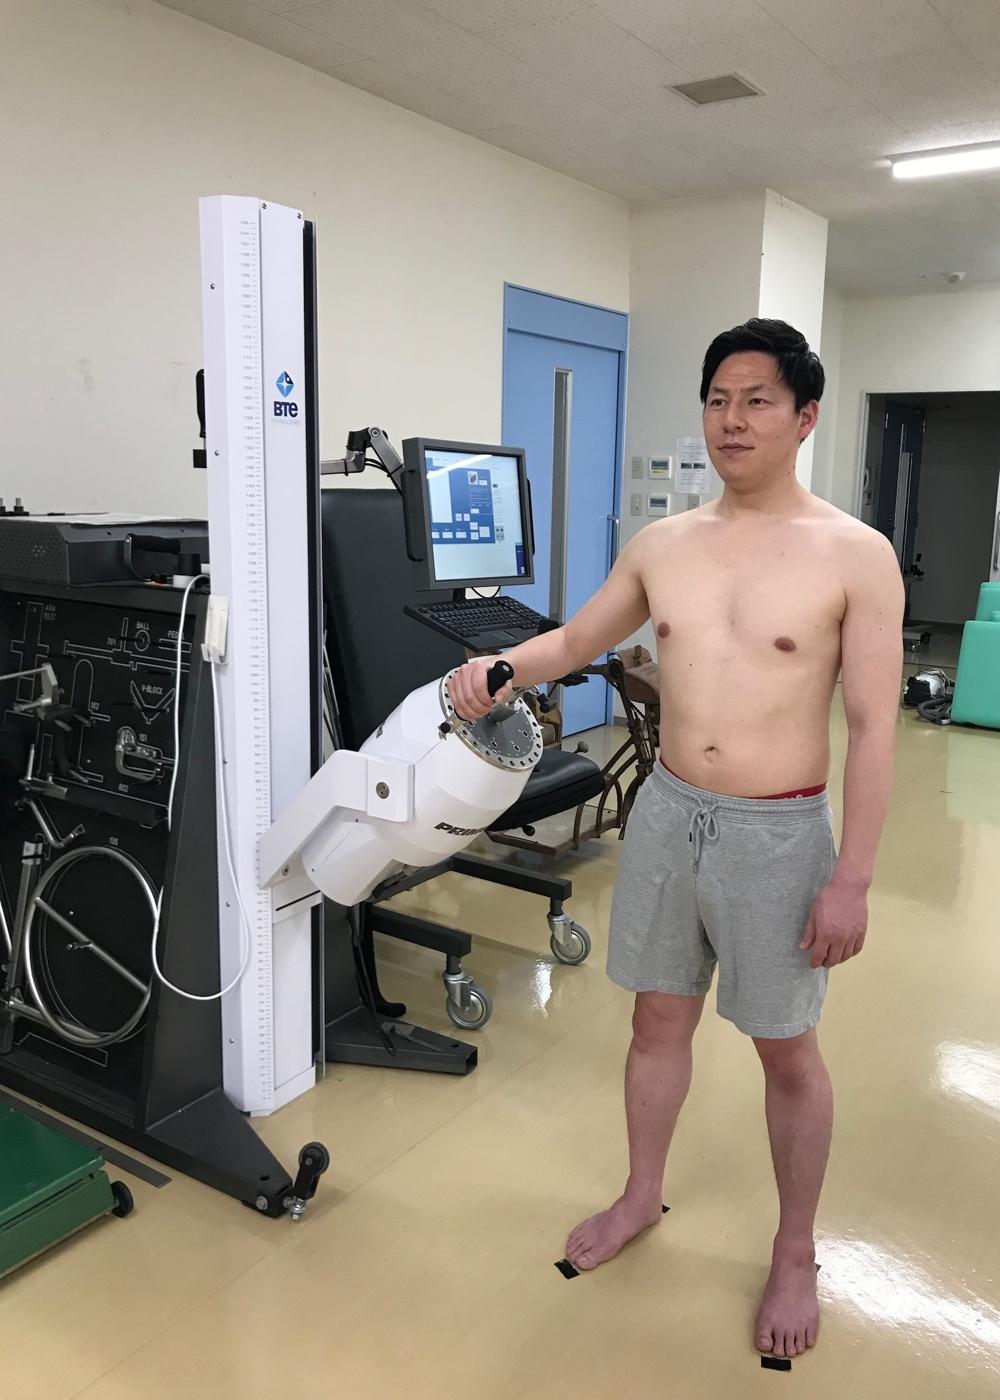
of IR and ER, and with the elbow joint flexed at 90°. MVC-CON measurements were performed at an angular velocity of 60°/s from 55° IR to 55° ER with the shoulder joint in 45° abduction and the elbow joint in 90° flexion. ER, external rotation; MVC, maximum voluntary contraction; ISO, isometric; CON, concentric.
below the scapular spine (head side of the infraspinatus muscle). The vibration massager was moved linearly from distal to proximal and then from proximal to distal within 20 s. The vibration massage started from the head side and ended at the caudal side. The pressure of the vibrating massager was evaluated using a numerical rating scale (NRS). The degree of pressure was numerically quantified by the following descriptors: 0, no pressure; 1, slight pressure; 5, moderate pressure; and 10, very strong pressure. During the massage, the participants were asked to confirm the pressure level through verbal responses while maintaining a consistent pressure level of NRS 5 (moderate pressure). Vibration massage was administered to all participants by one physical therapist (YY) who did not perform ROM and muscle strength measurements. Participants receiving the control condition maintained the same relaxed prone position for five minutes, similar to that in the intervention condition, except that no vibration massage was performed during that time. The instructions for the control condition were provided by the same single physical therapist who performed the vibration massage.
The test–retest reliability values of VIR-ROM, AIR-ROM, MVC-ISO, and MVC-CON were determined by the coefficient of variation (CV) and intraclass correlation coefficient (ICC) based on the interconnection PRE measurement data of all participants. The CVs were 4.9% ± 3.8%, 3.2% ± 2.8%,
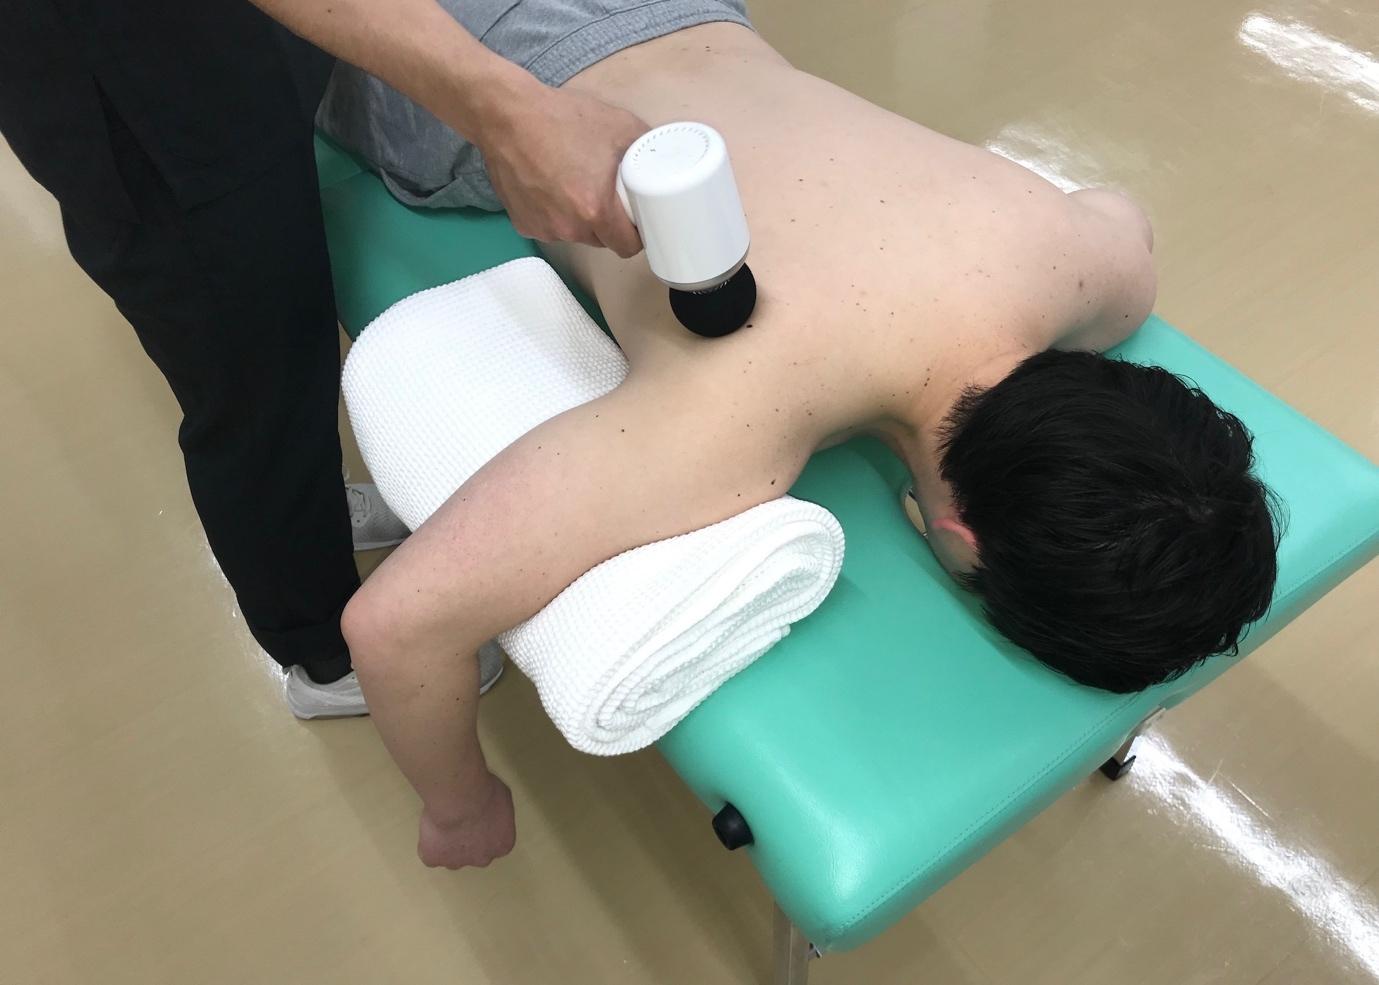
Figure 5. Handheld vibration massage.
The vibration massage was performed in a relaxed prone position (shoulder joint in 90° abduction with neutral internal and external rotation).
4.1% ± 3.5%, and 6.5% ± 4.4%, whereas the ICCs (1, 1) of the measurements were 0.97, 0.99, 0.93, and 0.82, respectively Based on the reliability coefficient, the standard error of the measurement (SEM) (Eq. 1) and the 95% confidence interval of the minimum detectable change (MDC), MDC95 (Eq. 2), were calculated.
VIR-ROM had an SEM of 1.2% and MDC95 of 3.2%. AIRROM had an SEM of 2.6° and MDC95 of 7.1°.
All statistical analyses were conducted using IBM SPSS Statistics version 25.0 (IBM Corp., Armonk, NY, USA). The Shapiro–Wilk test was used to confirm the normality of all variables. To analyze interactions and main effects, twoway repeated-measures ANOVA [condition (vibration vs. control) vs. time (PRE vs. POST)] were performed on all variables. After confirming the interaction or main effect, a paired t-test (Bonferroni-corrected) was performed to compare the changes in PRE and POST values in both conditions, PRE and POST values between conditions, and POST and POST values between conditions. The effect size [partialη2 (ηp2), Cohen’s d] was calculated as the difference in means divided by the pooled standard deviation (SD), with effect sizes of 0.00–0.19, 0.20–0.49, 0.50–0.79, and ≥0.80 being considered trivial, small, moderate, and large, respectively.23 A p value of <0.05 indicated statistically significant differences. Descriptive data were reported as mean ± SD.
The results are presented in Table 1. Shapiro–Wilk test confirmed normality of all variables. Repeated-measures ANOVA showed a significant interaction [F = 17.6, p = 0.001, ηp 2 = 0.556] and time (F = 42.9, p < 0.001, ηp 2 = 0.754) effect for VIR-ROM; however, no between-condition effect (F =
2.64, p = 0.127, ηp 2 = 0.159) was observed. The posthoc test showed a significant change in VIR-ROM (−4.1%, p < 0.001, d = 0.445) in the vibration condition but not in the control condition (−1.7%, p = 0.052, d = 0.169). Preintervention comparison of the two conditions showed no significant difference (p = 1.000), whereas postintervention comparison showed significantly greater ROM in the vibration condition than in the control condition (p = 0.036, d = 0.273).
AIR-ROM ANOVA revealed significant interaction (F = 15.3, p = 0.002, ηp 2 = 0.523) and time (F = 48.9, p < 0.001, ηp 2 = 0.777) effects; however, a between-condition effect (F = 2.68, p = 0.124, ηp 2 = 0.161) was not observed. The posthoc test showed a significant change in AIR-ROM (+11.4°, p < 0.001, d = 0.694) in the vibration condition but not in the control condition (+2.8°, p = 0.096, d = 0.232).
Preintervention comparison of the two conditions showed no significant difference (p = 1.000), whereas postintervention comparison showed significantly greater ROM in the vibration condition than in the control condition (p = 0.048, d = 0.483).
MVC-ISO ANOVA showed no significant interaction (F = 0.004, p = 0.951, ηp 2 < 0.001), time (F = 2.79, p = 0.117, ηp 2 = 0.166), or between-condition (F = 0.019, p = 0.892, ηp 2 = 0.001) effects. MVC-CON ANOVA showed no significant interaction (F = 0.101, p = 0.755, ηp 2 = 0.007), time (F = 1.061, p = 0.321, ηp 2 = 0.07), or between-condition (F = 0.651, p = 0.433, ηp 2 = 0.044) effects.
The current study examined the effects of a handheld vibration massage to the posterior shoulder soft tissues on IR-ROM and ER MVC torque. Notably, the results indicate that a handheld vibration massage increased the IR-ROM without negatively effecting the MVC torque. The current study demonstrates of the usefulness of a handheld vibration massage device as an intervention for shoulder joint stiffness and extends previous research focused on wholebody vibration stimulation and lower extremity muscles.
Conventional mechanisms proposed to explain the increase in ROM after massage include biomechanical (decreased muscle contraction), physiological (increased blood flow), neurological (decreased pain perception), and psychophysiological (increased relaxation) changes.24 Vibration massage also creates pressure and friction in the treated skin, fascia, and muscles, which may affect tissue viscosity and decrease resistance to joint motion. Moreover, studies have shown that vibration therapy had an effect on decreasing pain perception.25,26 Despite the unknown details regarding the mechanism underlying increased ROM, ROM changes after a handheld vibration massage may be associated with decreased muscle stiffness and pain perception changes.
Cross-body stretching and sleeper stretching are common interventional strategies that have been shown to improve IR-ROM by 3.1°–11.0° immediately after the intervention.27,28 Furthermore, one report showed that combining soft tissue mobilization and stretching promoted a 12.1° improvement of IR-ROM after the interven-
Table 1. Changes in internal rotation ROM and external rotation muscle strength before (PRE) and immediately after the intervention (POST).
Data are presented as mean ± SD. *p < 0.05, significant difference between PRE and POST. †p < 0.05, significantly different between Vibration POST and Control POST Δ, Changes in PRE and POST. range of motion; ROM, internal rotation by the vertebral level reached by the extended thumb; VIR, internal rotation of the shoulder joint in 90° abduction position; AIR, maximal voluntary contraction; MVC, isometric; ISO, concentric; CON
tion.29 The current study demonstrated that a 5 minute application of a vibration massage to the soft tissues of the posterior shoulder promoted an ROM expansion of 4.1% in VIR-ROM and 11.4° in AIR-ROM, with the changes in both variables exceeding the MDC95 range. These results demonstrate improvements comparable to those reported in previous studies, further indicating the potential for expanding interventions targeting the soft tissues of the posterior shoulder Vibration interventions for shoulder joint ROM have been reported to be as effective in improving ROM as stretching and proprioceptive neuromuscular facilitation.30 However, these reports differ from the present study in that they applied vibration to the shoulder joint from a vibration table via the hand or forearm, (i.e., indirectly to the shoulder joint). In the present study, vibration massage was applied directly to the posterior shoulder soft tissues, after which ROM increase was confirmed. Based on these findings, vibration has the potential to increase ROM through both direct and indirect stimulation methods to the intervention site.
The present study found no MVC changes after the handheld vibration massage, which supports the results of a previous study using a similar device on the calf 16 However, the mechanical vibration theory states that handheld vibration massage can induce tonic vibration reflex contraction of the muscle.15 This mechanism is stimulated by a sequence of rapid muscle stretches that occur during vibration, triggering muscle spindles, which subsequently induce involuntary muscle force production.15 However, no significant changes in muscle strength were found after the vibration intervention. Although this study provided the intervention at a frequency of 58 Hz, amplitude of 5 mm, and stimulation duration of 5 minutes, changes in these parameters may have influenced the effects on muscle strength.14 Therefore, future studies are needed to investigate the effects of various vibration parameters on muscle strength.
Previous authors have shown that the throwing side of overhead athletes presents with reduced IR-ROM compared to their non-throwing side and that of normal individu-
als.31 Furthermore, restrictions in shoulder joint ROM and reduced ER strength have been identified as risk factors for overhead athletes,32 and PST has been shown to influence kinematic changes in the glenohumeral joint.5,33,34 Thus, massage and static stretching are commonly employed to address ROM and stiffness. However, self-massage may be difficult in certain areas, such as the shoulders, hindering ongoing and preventive interventions. Moreover, although static stretching has been commonly implemented to improve ROM and muscle stiffness, the decrease in muscle strength for a certain duration during warm-up has remained a primary concern.10,11 The infraspinatus and teres minor muscles (the target soft tissues of the posterior shoulder) exhibit high muscle activity reaching 74% and 71% of the maximum voluntary muscle contraction during the cocking phase of the overhead throwing motion, respectively, when pain and injury are likely to occur in the throwing motion.35 Therefore, the soft tissues of the posterior shoulder should be the focus of injury prevention given that they are required for both flexibility and stability. Considering these factors, improving flexibility without causing muscle weakness is imperative during warm-up. The results of the current study indicate that a handheld vibration massage is effective in improving ROM without negatively affecting muscle strength. In other words, it can be used for warming up.
The handheld device is easy to carry, can be used in any setting, including sports stadiums and homes, and is easily used in sports and rehabilitation settings. In the current study, the intervention was conducted by only one examiner to achieve reproducibility of the intervention. In practice, however, the described intervention is intended for individuals to employ for self-care. In essence, self-management is important and should be further investigated using self-administration of a vibrational device.
The current study has several limitations worth noting. First, the study population included only healthy men. As such, further investigations are required on athletes, those who perform overhead activity, or those with PST and GIRD, who may demonstrate different results. In the cur-
rent study, vibration massage was applied to the entire infraspinatus fossa. Therefore, the possibility that the applied vibration may have affected not only the infraspinatus muscle but also the posterior articular capsule via the teres minor and scapula cannot be overlooked. Regarding stimulation pressure, moderate pressure (NRS 5) was used as the standard and this standardization relied on the subjective reports of the participants. Therefore, slight differences in the sensation of pressure reported between participants could have been present. Finally, this study only examined the acute effects of vibration massage on ROM and muscle strength. Previous studies on interventions aiming to improve flexibility, such as stretching and massage, have examined duration of improvement, long-term intervention effects, pain relief, and muscle stiffness. These effects
of handheld vibration massage remain unclear and require further investigations.
A single five minute session with a handheld vibration massage device applied to the soft tissues of the posterior shoulder increased IR ROM without negatively affecting muscle strength. The results presented herein indicate that a handheld vibration massage can be used for warming up.
Submitted: February 01, 2024 CDT, Accepted: June 17, 2024 CDT
©
The Author(s)
This is an open-access article distributed under the terms of the Creative Commons Attribution 4.0 International License (CCBY-NC-4.0). View this license’s legal deed at https://creativecommons.org/licenses/by-nc/4.0 and legal code at https://creativecommons.org/licenses/by-nc/4.0/legalcode for more information.
1. Tyler TF, Roy T, Nicholas SJ, Gleim GW Reliability and validity of a new method of measuring posterior shoulder tightness. J Orthop Sports Phys Ther. 1999;29(5):262-274. doi:10.2519/jospt.1999.29.5.262
2. Duzgun I, Turgut E, Çinar-Medeni Ö, et al. The presence and influence of posterior capsule tightness on different shoulder problems. J Back Musculoskelet Rehabil 2017;30(2):187-193. doi:10.3233/ BMR-160731
3. Takenaga T, Sugimoto K, Goto H, et al. Posterior shoulder capsules are thicker and stiffer in the throwing shoulders of healthy college baseball players: a quantitative assessment using shear-wave ultrasound elastography Am J Sports Med 2015;43(12):2935-2942. doi:10.1177/ 0363546515608476
4. Huffman GR, Tibone JE, McGarry MH, et al. Path of glenohumeral articulation throughout the rotational range of motion in a thrower’s shoulder model. Am J Sports Med 2006;34(10):1662-1669. doi:10.1177/ 0363546506287740
5. Lin JJ, Lim HK, Yang JL. Effect of shoulder tightness on glenohumeral translation, scapular kinematics, and scapulohumeral rhythm in subjects with stiff shoulders. J Orthop Res 2006;24(5):1044-1051. doi:10.1002/jor.20126
6. Muraki T, Yamamoto N, Zhao KD, et al. Effects of posterior capsule tightness on subacromial contact behavior during shoulder motions. J Shoulder Elbow Surg. 2012;21(9):1160-1167. doi:10.1016/ j.jse.2011.08.042
7 Mihata T, McGarry MH, Akeda M, et al. Posterior shoulder tightness can be a risk factor of scapular malposition: a cadaveric biomechanical study. J Shoulder Elbow Surg 2020;29(1):175-184. doi:10.1016/j.jse.2019.05.040
8. Lintner D, Mayol M, Uzodinma O, Jones R, Labossiere D Glenohumeral internal rotation deficits in professional pitchers enrolled in an internal rotation stretching program. Am J Sports Med. 2007;35(4):617-621. doi:10.1177/0363546506296736
9. van den Dolder PA, Ferreira PH, Refshauge KM. Effectiveness of soft tissue massage and exercise for the treatment of non-specific shoulder pain: a systematic review with meta-analysis. Br J Sports Med. 2014;48(16):1216-1226. doi:10.1136/ bjsports-2011-090553
10. Behm DG, Blazevich AJ, Kay AD, McHugh M. Acute effects of muscle stretching on physical performance, range of motion, and injury incidence in healthy active individuals: a systematic review Appl Physiol Nutr Metab 2016;41(1):1-11.
11. Kay AD, Blazevich AJ. Effect of acute static stretch on maximal muscle performance: a systematic review Med Sci Sports Exerc 2012;44(1):154-164. doi:10.1249/MSS.0b013e318225cb27
12. Konrad A, Tilp M, Nakamura M. A comparison of the effects of foam rolling and stretching on physical performance. a systematic review and meta-analysis. Front Physiol 2021;12:720531. doi:10.3389/ fphys.2021.720531
13. Park SJ, Lee SI, Jeong HJ, Kim BG. Effect of vibration foam rolling on the range of motion in healthy adults: a systematic review and metaanalysis. J Exerc Rehabil. 2021;17(4):226-233. doi:10.12965/jer.2142322.161
14. Alghadir AH, Anwer S, Zafar H, Iqbal ZA. Effect of localised vibration on muscle strength in healthy adults: a systematic review Physiotherapy 2018;104(1):18-24. doi:10.1016/j.physio.2017.06.006
15. Germann D, El Bouse A, Shnier J, Abdelkader N, Kazemi M. Effects of local vibration therapy on various performance parameters: a narrative literature review. J Can Chiropr Assoc. 2018;62(3):170-181.
16. Konrad A, Glashüttner C, Reiner MM, Bernsteiner D, Tilp M. The acute effects of a percussive massage treatment with a hypervolt device on plantar flexor muscles’ range of motion and performance. J Sports Sci Med. 2020;19(4):690-694.
17. Edwards TB, Bostick RD, Greene CC, Baratta RV, Drez D Interobserver and intraobserver reliability of the measurement of shoulder internal rotation by vertebral level. J Shoulder Elbow Surg. 2002;11(1):40-42. doi:10.1067/mse.2002.119853
18. Hoving JL, Buchbinder R, Green S, et al. How reliably do rheumatologists measure shoulder movement? Ann Rheum Dis 2002;61(7):612-616. doi:10.1136/ard.61.7.612
19. Mitsukane M, Suzuki K, Tabe R, Hasumi F, Fukushima D Normalized hand-behind-back for the measurement of shoulder internal rotation. JSES Int 2022;6(2):287-291. doi:10.1016/j.jseint.2021.12.001
20. Muraki T, Aoki M, Uchiyama E, Murakami G, Miyamoto S. The effect of arm position on stretching of the supraspinatus, infraspinatus, and posterior portion of deltoid muscles: a cadaveric study. Clin Biomech (Bristol, Avon) 2006;21(5):474-480. doi:10.1016/j.clinbiomech.2005.12.014
21. Wilk KE, Reinold MM, Macrina LC, et al. Glenohumeral internal rotation measurements differ depending on stabilization techniques. Sports Health 2009;1(2):131-136. doi:10.1177/1941738108331201
22. Marín PJ, Herrero AJ, Sáinz N, Rhea MR, GarcíaLópez D Effects of different magnitudes of wholebody vibration on arm muscular performance. J Strength Cond Res. 2010;24(9):2506-2511. doi:10.1519/JSC.0b013e3181e38188
23. Cohen J. Statistical Power Analysis for the Behavioral Sciences. 2nd ed. Routledge; 1988.
24. Weerapong P, Hume PA, Kolt GS. The mechanisms of massage and effects on performance, muscle recovery and injury prevention. Sports Med. 2005;35(3):235-256. doi:10.2165/ 00007256-200535030-00004
25. Cheatham SW, Stull KR, Kolber MJ. Comparison of a vibration roller and a nonvibration roller intervention on knee range of motion and pressure pain threshold: a randomized controlled trial. J Sport Rehabil 2019;28(1):39-45. doi:10.1123/jsr.2017-0164
26. Veqar Z, Imtiyaz S. Vibration therapy in management of delayed onset muscle soreness (DOMS). J Clin Diagn Res 2014;8(6):Le01-4. doi:10.7860/JCDR/2014/7323.4434
27 Laudner KG, Sipes RC, Wilson JT The acute effects of sleeper stretches on shoulder range of motion. J Athl Train 2008;43(4):359-363. doi:10.4085/1062-6050-43.4.359
28. Salamh PA, Kolber MJ, Hanney WJ. Effect of scapular stabilization during horizontal adduction stretching on passive internal rotation and posterior shoulder tightness in young women volleyball athletes: a randomized controlled trial. Arch Phys Med Rehabil. 2015;96(2):349-356. doi:10.1016/ j.apmr.2014.09.038
29. Bailey LB, Thigpen CA, Hawkins RJ, Beattie PF, Shanley E. Effectiveness of manual therapy and stretching for baseball players with shoulder range of motion deficits. Sports Health. 2017;9(3):230-237. doi:10.1177/1941738117702835
30. Tucker WS, Slone SW The acute effects of holdrelax proprioceptive neuromuscular facilitation with vibration therapy on glenohumeral internal-rotation deficit. J Sport Rehabil 2016;25(3):248-254. doi:10.1123/jsr.2014-0329
31. Shanley E, Thigpen CA, Clark JC, et al. Changes in passive range of motion and development of glenohumeral internal rotation deficit (GIRD) in the professional pitching shoulder between spring training in two consecutive years. J Shoulder Elbow Surg. 2012;21(11):1605-1612. doi:10.1016/ j.jse.2011.11.035
32. Tooth C, Gofflot A, Schwartz C, et al. Risk factors of overuse shoulder injuries in overhead athletes: a systematic review. Sports Health. 2020;12(5):478-487. doi:10.1177/1941738120931764
33. DeAngelis JP, Hertz B, Wexler MT, et al. Posterior capsular plication constrains the glenohumeral joint by drawing the humeral head closer to the glenoid and resisting abduction. Orthop J Sports Med 2015;3(8):2325967115599347. doi:10.1177/ 2325967115599347
34. Laudner K, Wong R, Latal J, Meister K. Posterior shoulder tightness and subacromial impingement characteristics in baseball pitchers: a blinded, matched control study Int J Sports Phys Ther 2020;15(2):188-195. doi:10.26603/ijspt20200188
35. Escamilla RF, Andrews JR. Shoulder muscle recruitment patterns and related biomechanics during upper extremity sports. Sports Med. 2009;39(7):569-590. doi:10.2165/ 00007256-200939070-00004
Rachel Selman1a , Kate S. Early2
1 Synthesis Physical Therapy LLC, 2 Kinesiology and Health Sciences, Columbus State University
Keywords: female athlete, physical therapy, postpartum, pregnancy, strength and conditioning https://doi.org/10.26603/001c.121421
Background and Purpose
Recent changes to medical recommendations for exercise in pregnancy and postpartum have expanded to include recreational athletes. While women are transitioning into motherhood at the height of their athletic careers, there is limited guidance on musculoskeletal training from pregnancy through safe return to activity The lack of education and support in this population may lead to increased prevalence of symptoms and delay of treatment, ultimately hindering athletic performance. The purpose of this case series is to assess pelvic floor symptoms through implementing a new pre- and postnatal exercise training paradigm in a group of women aiming to return to recreational athletics.
Study Design
Case series
Methods
Six recreationally athletic women between 25-35 years of age were referred to physical therapy during pregnancy to participate in this protocol. The women completed a standardized pregnancy and postpartum rehabilitation plan focused on core and pelvic floor control in addition to specific strength and mobility training.
Results
Pain, urinary dysfunction, and pelvic floor muscle strength were assessed at six weeks postpartum and at discharge. Meaningful improvement was noted in pain, urinary dysfunction, and muscle strength by the time of discharge.
Conclusion
The decrease in symptoms and improvements in measures of musculoskeletal health suggests that a physical therapist guided rehabilitation protocol may be useful as part of the standard of care to reduce prevalence of pain and dysfunction, particularly in the recreational athlete population. Improving understanding of exercise training in this population may minimize musculoskeletal symptoms and encourage additional research to improve the standard of care for this group of patients.
Level of Evidence
Level 4
Corresponding Author: Rachel Selman
Synthesis Physical Therapy LLC 10820 Independence Pointe Pkwy, Ste A Matthews, NC 28105 Phone: 706-331-9696. Email: rachel@synthesisphysicaltherapy.com
Despite increasing participation across the lifespan of females in sport and recreational activity, evidence regarding guided musculoskeletal rehabilitation for the athlete mother is limited.1 The benefits of exercise during pregnancy are well known, yet lack of awareness regarding appropriate training protocols may continue to contribute to the low percentage of women achieving the current recommended physical activity guidelines.2,3 The American College of Obstetricians and Gynecologists (ACOG) has recently updated guidance for exercise with suggestions for pregnant athletes.4 These exercise recommendations are based solely on medical health, and while appropriate to protect the medical status of baby and mother, lack a clear focus on musculoskeletal health or appropriate timeline for returning to activity 4 Current ACOG recommendations do not discuss the increased demands placed on the musculoskeletal system and the stress pregnancy places on the pelvic floor in relationship to exercise. As more evidencebased suggestions for safe and holistic movement during the perinatal period continues to develop, special attention to musculoskeletal health and progression of exercise is warranted in the relatively vulnerable period of pregnancy and postpartum.5‑7
Commonly experienced postpartum symptoms such as pelvic floor dysfunction, urinary incontinence, and pain can interfere with athletic performance.1 Physical therapy in the treatment of pelvic floor dysfunction has been well established, but is not currently considered standard of care for recreational or elite athletes during pregnancy and postpartum.8 Presently, there are no musculoskeletal-specific guidelines to address symptoms from the onset of pregnancy through the completion of the first three months postpartum (often referred to as the fourth trimester). Conflicting recommendations that do not delineate the postnatal medical vs. musculoskeletal clearance may result in either overly conservative or zealousness approaches to recovery, leaving mothers to navigate this fourth trimester independently despite the incredible amount of anatomical and physiological healing taking place.9 Understanding of appropriate and safe exercise, neuromuscular control, and pelvic floor-specific considerations in during pregnancy and postpartum may allow athletes to better maintain strength and conditioning throughout pregnancy as well as promote a timely return to sport and minimize postpartum symptoms.
Athlete mothers may require more specific guidance on returning to impact tasks then the general population during performance of independent training regimens and the maintenance of resistance training.4 A clear timeline related to the progression of exercise may assist clinicians and coaches with appropriate guidance to maximize sport and activity performance. The range of women, clinicians, and coaches who are unaware of the proposed rehabilitation timeline is significant, and continuous longitudinal assessments and modifications of protocols such as this may prompt larger and more specific studies to help eliminate the either/or distinction of athlete vs. mother. There-
fore, the purpose of this case series is to assess pelvic floor symptoms through implementing a new pre- and postnatal exercise training paradigm in a group of women aiming to return to recreational athletics.
Participants of this study were electively undergoing physical therapy treatment as a preventative musculoskeletal measure beginning in pregnancy Participants were included as a sample of convenience if they were pregnant women between the ages of 25 and 35 and considered a low-risk pregnancy Participants completed at least one inperson visit per trimester. All participants performed regular independent exercise programs prior to pregnancy including impact work such as running, ranging between 5-20 miles/week for at least three months prior to pregnancy All participants regularly met ACSM guidelines for activity for at least three months prior to pregnancy and were meant to represent a field of recreational athlete mothers not specific to any individual sport. Exercise participation prior to this study included a variety of recreational tasks including running, CrossFit, HIIT training, and strength training as desired by each individual.
It should be noted that all participants described varying levels of occasional stress incontinence, heaviness and pressure (prolapse-related symptoms), and varying levels of pain in their current pregnancies prior to the start of this protocol. Exclusion criteria from the present study included Grade 4 perineal tearing during delivery and highrisk pregnancies. The U.S. Health Insurance Portability and Accountability Act (HIPPA) was discussed, and informed consent obtained from all participants to allow for the use of medical information. All participants in this case series were informed that the data collected would be submitted for publication, and the study was approved by the local institutional review board.
Women participated both during and after pregnancy in the previously published protocol.10 Participants all worked with the same physical therapist for the entirety of their care, who had training specific to pre- and postnatal interventions through specialization from Herman and Wallace Pelvic Rehabilitation Institute. Participants attended an average of one physical therapy visit per trimester prior to delivery Based on the anatomical and physiologic healing time frames, participants avoided high impact tasks (described clinically as “anything leaving the ground” such as jumping, running) until cleared by the pelvic floor physical therapist. Participants attended an average of eight physical therapy visits after delivery beginning as early as two weeks postpartum and continuing until at latest 16 weeks postpartum. In addition to the postpartum physical therapy visits, each participant was provided with a home exercise program with video guidance from an author-de-
Table 1. Home Exercise Program for 0-6 Weeks Postpartum.
Supine diaphragmatic breathing x20
Inhale and exhale x205s / 5s
Supine lumbar rotation x20 holding 5s
0-2
2-4
4-6
Side-lying open book x10 holding 10s
Cat and cow stretch x15 holding 5s
Supine posterior pelvic tilt x20 holding 5s
Side-lying transverse abdominis bracing x20 holding 5s
Quadruped transverse abdominis bracing x20 holding 5s
Supine transverse abdominis bracing with double leg fallout x30
Supine pelvic floor contract and release x10, 5s contract / 10s relax*
Walking program <10 minutes (up to 3x/day as tolerated)
Sit to stand x30
Bridges x30 holding 10s
Clamshells x30 each side
Reverse clamshells x30 each side
Walking program <20 minutes (up to 3x/day as tolerated) s=
veloped program on Medbridge (Table 1) during the 0-6 week postpartum period with internal muscle exam performed by the physical therapist after the six-weeks postpartum physician clearance. During weeks 6-12 postpartum, patients attended in-clinic physical therapy between one to two times per week with discharge ranging between weeks 12-16 postpartum. Time until discharge varied between participants depending on their progression through the rehabilitation program and ability to meet the markers for readiness to progress. Outcomes of the study were measured at six weeks postpartum and discharge (12-16 weeks). Criteria for discharge included asymptomatic independence in desired exercise program (varying from CrossFit to HIIT training) as well as asymptomatic running performance for individually desired distances.
Symptoms of pelvic floor dysfunction were monitored and adjusted for in the postpartum group to assist with readiness for progression into the next phase of rehabilitation. These symptoms were based on patient subjective reports and patients were instructed to either continue forward with the protocol or instructed to repeat movements from a previous session until asymptomatic depending on the discretion and expertise of the clinician. These symptoms included urinary and/or fecal incontinence, urinary and/ or fecal urgency, symptoms of prolapse, pain with intercourse, and musculoskeletal lumbopelvic pain.5 This is not an all-inclusive list of signs of pelvic floor dysfunction,
but they are main markers for dysfunction that may limit progression in exercise. As with any protocol, presence of any of these symptoms in isolation may not necessarily be grounds to halt progression but should be monitored and accounted for by the licensed professional supervising the protocol. Any ongoing or onset of vaginal bleeding not related to the menstrual cycle during or after an attempted low impact or high impact exercise was to be utilized as an immediate referral back to the participant’s obstetrician/ gynecologist.5 However, no participants experienced vaginal bleeding during the course of the rehabilitation.
The lower extremity functional scale (LEFS) is a functional questionnaire focused on the ability of the participant with consideration to lower body dysfunction.11 Questions include tasks such as housework, sport participation, walking, stairs, running, and hopping. The LEFS is scored out of 80 points, with a higher score suggesting greater function and less disability LEFS was used to determine a percentage of disability. Minimal clinically important difference requires a change in score by 9 points or greater to indicate significant change in function.11
The urinary distress inventory short form (UDI-6) is a six question form meant to assess the life quality and symptom related distress of women suffering from urinary incontinence.12 The UDI-6 is scored out of 100, with a higher score suggesting greater urinary distress. Minimal clinically important difference requires a change in score by 11 points or greater to indicate statistically significant change in function.12
Lastly, the modified Oxford grading system (MOMMT) was used to evaluate the strength of the pelvic floor by vaginal palpation. The grading score is described as the following: 0 = no contraction, 1 = flicker, 2 = weak, 3 = moderate, 4 = good (with lift) and 5 = strong (with lift). Inter-rater reliability for this measure is high (95% confidence interval) and this is a widely used and recognized method for strength grading for this musculature.13
Initial evaluation of patients in the postpartum period focused solely on external musculoskeletal approaches prior to the six-week postpartum mark as listed in the recommended protocol. After medical follow up at six-weeks postpartum, each patient consented to an internal (vaginal) muscle exam to determine baseline strength, endurance, and to assess any notable tenderness to palpation that may indicate myofascial trigger points and associated dysfunction at the pelvic floor musculature. Based on this exam, deficits were addressed throughout the 6-12 week protocol recommendations with individualized treatment dependent on baseline muscle performance. While some participants were noted to have underactive pelvic floor musculature post-delivery, others were noted to have overactive pelvic floor musculature and this clinical information was used as an adjunct to supplement completion of the suggested protocol. For example, for participants who were noted to have increased pelvic floor musculature tone at six-week postpartum assessment, increased focus was placed on relaxation of the pelvic floor musculature throughout their plan of care. Vice versa, those who were noted to have underactive decreased pelvic floor musculature tone at this check-in were guided to include supplemental contract/overflow tasks of the pelvic floor This variation in presentation emphasizes the importance of a qualified pelvic health physical therapist to better individualize the suggested protocol for each athlete.
Of the six participants, two mothers were primipara and four mothers considered multipara. All mothers had a vaginal delivery. Participants were discharged between the 12-16 week postpartum mark at which point all were participating in their desired exercise programs without pain, urinary dysfunction, or prolapse during performance. These exercise programs included group fitness such as CrossFit and local HIIT training in addition to individual running programs for varying distances. At the time of discharge, all six participants improved their LEFS, UDI and MOMMT scores (Table 2). The LEFS assessment improved by 28 points on average, suggesting a meaningful clinical difference from pre- to post-rehabilitation. The UDI improved on average 53 points, also suggesting a clinically significant change from pre- to post-rehabilitation. All individuals improved MOMMT scores at the time of discharge, with good to strong lift of the pelvic floor muscles (Figure 1).
Evidence for pelvic floor physical therapy itself has been well established for the management of urinary incontinence, pelvic organ prolapse, sexual dysfunction, and the prevention of pelvic organ prolapse.14‑17 Despite this evidence, no specific pre- and postnatal musculoskeletal rehabilitation guidelines currently exist to assist clinicians in determining rehabilitation frequency or exercise progressions. The lack of information in this realm may be limiting a potential change in standard of care encouraging referral to physical therapy upon determination of viable pregnancy These results of this case series suggest that pregnant and postpartum athletes benefit from a guided rehabilitation program for the management and improvement of common postpartum symptoms, which may also limit the continuation of symptoms into their goal of returning to sport.
Postpartum urinary incontinence creates a barrier to exercise, limiting women from participating in an exercise program and may encourage avoidance in regards to strength training tasks.18 While few athletes experience stress incontinence prior to pregnancy and childbirth, a significant amount of women experience incontinence during pregnancy.19 Previous authors have found the presence of incontinence during pregnancy to be indicative of the presence of incontinence in the postpartum period, with athletes experiencing a greater likelihood of incontinence persisting up to five years postpartum.20 The completion of the exercise program and timeline to return to activity utilized in this study resulted in each of the participants fully returning to their desired activity levels without notable symptoms of incontinence or pain by the four-month postpartum mark. At time of discharge from this rehabilitation protocol, no participants were experiencing incontinence symptoms. The exercise program during pregnancy may have allowed for easier and faster establishment of strength, endurance and neuromotor control of the pelvic floor muscles, however this cannot be determined by this case series design. Functionally, participants had improved LEFS scores after the exercise program at the time of discharge. As pregnant and postpartum women have higher incidence of leg pain than non-pregnant women, this outcome emphasizes the importance of an establishing a rehabilitation timeline before postpartum.21
Utilizing a pelvic health physical therapist for the pregnancy and postpartum period appears to be beneficial to the six women included in this case series, via the assessed outcomes. A guided rehabilitation model as the standard of care can help to ensure that the pelvic floor muscles are both contracting and relaxing correctly In addition, a specialized physical therapist can help to assess the need for appropriate focus on up-training or down-training the musculature of the pelvic floor, which would limit incorrect performance of strength and mobility work leading to undesired symptoms. The importance of this case series not only lies in the description of a preventative approach to maternal care, but also highlights the importance of continuous reassessment of the changing body throughout the
Table 2. Outcomes for all outcome assessments (n=6).
LEFS, lower extremity functional scale; UDI, urinary distress inventory; MOMMT, modified Oxford grading system; MCID, minimal clinically important differences.11,12 Data displayed as mean (range).
Figure 1. Individual responses to the rehabilitation protocol (n=6).
Pre- measurements assessed at 6 weeks postpartum and post measurements assessed at discharge (week 12-16). Bars represent the average while the lines represent individuals. LEFS, lower extremity functional scale; UDI, urinary distress inventory; MOMMT, modified oxford grading system.
pregnant and early postpartum periods as athletes work to continue and return to sport participation.
The scope of this rehabilitation protocol is to provide a starting point for exercise prescription in postpartum women and should be personalized for each individual by an appropriate provider or pelvic health physical therapist. Each phase should ideally be monitored by a pelvic health physical therapist who can best make determinations on
readiness to progress through exercise. Due to the limitations of a case series, there is not a way to determine if other exercise rehabilitation approaches would have elicited similar changes in postpartum symptoms. While these guidelines establish a musculoskeletal progression, it does not consider the individual’s needs related to varying degrees of vaginal tearing and/or cesarean-section delivery. Participants entered at different points in their pregnancy with different, but common, incoming symptoms. Thus, a more controlled approach to evaluating their prenatal symptoms is warranted. This small sample of women considered low-risk pregnancies (vaginal deliveries and no cesarean sections), which limits the conclusions that can be drawn from the results, and cause and effect cannot be assumed. These methods should continue to be studied on larger and varying populations. Additional research should also be performed to improve more specific care considerations for women after cesarean-section deliveries and various degrees of vaginal tearing during vaginal births.
The potential benefits of pelvic floor rehabilitation and exercise training during the pregnant and postpartum period cannot be neglected. The results of this case series suggest that a graded rehabilitation program during postpartum period improved symptoms of incontinence, prolapse, and pain in the athlete mother In addition, a structured approach to modifications and interventions in the prenatal period may have positively affected outcomes postpartum although more work must be done here to determine the effects of such an approach. An exercise prescription protocol specialized to pregnant and postpartum athletes may help women to maintain fitness, minimize postpartum symptoms that interfere with exercise, and ultimately return them to sport in a safe manner
The Authors report no conflicts of interest.
Submitted: January 09, 2024 CDT, Accepted: June 21, 2024 CDT
© The Author(s)
This is an open-access article distributed under the terms of the Creative Commons Attribution 4.0 International License (CCBY-NC-4.0). View this license’s legal deed at https://creativecommons.org/licenses/by-nc/4.0 and legal code at https://creativecommons.org/licenses/by-nc/4.0/legalcode for more information.
1. Christopher SM, Cook CE, Snodgrass SJ. What are the biopsychosocial risk factors associated with pain in postpartum runners? Development of a clinical decision tool. PLoS One 2021;16(8):e0255383. doi:10.1371/journal.pone.0255383
2. Evenson KR, Wen F. Measuring physical activity among pregnant women using a structured one-week recall questionnaire: evidence for validity and reliability. Int J Behav Nutr Phys Act. 2010;7:21. doi:10.1186/1479-5868-7-21
3. James ML, Moore IS, Donnelly GM, Brockwell E, Perkins J, Coltman CE. Running during pregnancy and postpartum, Part A: Why do women stop running during pregnancy and not return to running in the postpartum period? J Womens Health Phys Ther. 2022;46(3):111-123. doi:10.1097/ JWH.0000000000000228
4. ACOG. Physical Activity and Exercise During Pregnancy and the Postpartum Period: ACOG Committee Opinion, Number 804. Obstet Gynecol 2020;135(4):e178-e188. doi:10.1097/ AOG.0000000000003772
5. Goom T, Donnelly G, Brockwell E. Returning to running postnatal – guidelines for medical, health and fitness professionals managing this population. Sports Medicine Published online 2019. doi:10.1016/ j.physio.2020.03.276
6. Donnelly GM, Moore IS, Brockwell E, Rankin A, Cooke R. Reframing return-to-sport postpartum: the 6 Rs framework. Br J Sports Med. 2022;56(5):244-245. doi:10.1136/bjsports-2021-104877
7 Lee R, Thain S, Tan LK, Teo T, Tan KH, Committee IEiP. Asia-Pacific consensus on physical activity and exercise in pregnancy and the postpartum period. BMJ Open Sport Exerc Med 2021;7(2):e000967 doi:10.1136/bmjsem-2020-000967
8. Wallace SL, Miller LD, Mishra K. Pelvic floor physical therapy in the treatment of pelvic floor dysfunction in women. Curr Opin Obstet Gynecol. 2019;31(6):485-493. doi:10.1097/ GCO.0000000000000584
9. Critchley CJC. Physical therapy is an important component of postpartum care in the fourth trimester Phys Ther Published online 2022. doi:10.1093/ptj/pzac021
10. Selman R, Early K, Battles B, Seidenburg M, Wendel E, Westerlund S. Maximizing recovery in the postpartum period: A timeline for rehabilitation from pregnancy through return to sport. Int J Sports Phys Ther 2022;17(6):1170-1183. doi:10.26603/001c.37863
11. Binkley JM, Stratford PW, Lott SA, Riddle DL. The Lower Extremity Functional Scale (LEFS): scale development, measurement properties, and clinical application. Phys Ther. 1999;79(4):371-383.
12. Uebersax JS, Wyman JF, Shumaker SA, McClish DK, Fantl JA. Short forms to assess life quality and symptom distress for urinary incontinence in women: the Incontinence Impact Questionnaire and the Urogenital Distress Inventory Continence Program for Women Research Group. Neurourol Urodyn. 1995;14(2):131-139. doi:10.1002/nau.1930140206
13. Chevalier F, Fernandez-Lao C, Cuesta-Vargas AI. Normal reference values of strength in pelvic floor muscle of women: a descriptive and inferential study BMC Womens Health 2014;14:143. doi:10.1186/ s12905-014-0143-4
14. Braekken IH, Majida M, Ellstrom Engh M, Bo K. Can pelvic floor muscle training improve sexual function in women with pelvic organ prolapse? A randomized controlled trial. J Sex Med 2015;12(2):470-480. doi:10.1111/jsm.12746
15. Hagen S, Stark D, Glazener C, Sinclair L, Ramsay I. A randomized controlled trial of pelvic floor muscle training for stages I and II pelvic organ prolapse. Int Urogynecol J Pelvic Floor Dysfunct. 2009;20(1):45-51. doi:10.1007/s00192-008-0726-4
16. Bø K. Is there still a place for physiotherapy in the treatment of female incontinence? EAU Update Series. 2003;1(3):145-153. doi:10.1016/ S1570-9124(03)00037-0
17 Sanchez-Martinez Y, Camargo-Lemos DM, RuizRodriguez M, Triana CA, Sarmiento OL. Prevalence of the practice of physical activity and its associated factors in adult Colombian pregnant women. Biomedica. 2022;42(2):379-390.
18. Nygaard I, Girts T, Fultz NH, Kinchen K, Pohl G, Sternfeld B. Is urinary incontinence a barrier to exercise in women? Obstet Gynecol. 2005;106(2):307-314. doi:10.1097/ 01.AOG.0000168455.39156.0f
19. Romano M, Cacciatore A, Giordano R, La Rosa B. Postpartum period: three distinct but continuous phases. J Prenat Med 2010;4(2):22-25.
20. Viktrup L, Lose G. The risk of stress incontinence 5 years after first delivery. Am J Obstet Gynecol. 2001;185(1):82-87 doi:10.1067/mob.2001.114501
21. Vullo VJ, Richardson JK, Hurvitz EA. Hip, knee, and foot pain during pregnancy and the postpartum period. J Fam Pract 1996;43(1):63-68.
Matthew Bush1a , Jon Umlauf2 , Bryan Pickens2
1 Navy Medicine Readiness and Training Command Yokosuka, Japan, 2 Army-Baylor University Doctoral Program in Physical Therapy
Keywords: Ankle sprain, Point of Care Ultrasound https://doi.org/10.26603/001c.121601
Background
Lateral ankle sprain (LAS) is a common injury with incidence rates reported at 7.2 per 1000 person-years. Physical examination strategies provide limited information to guide rehabilitation that can maximize clinical outcomes. Early and accurate diagnostic information using ultrasound imaging enables individualized care and the ability to monitor healing along with its response to activity and rehabilitation.
Purpose
The purpose of this study was to describe and observe the outcomes associated with Point of Care Ultrasound (POCUS) guided early management of acute and sub-acute lateral ankle sprains.
Study Design
Case series
Methods
Individuals with a LAS within the prior 28 days underwent a clinical evaluation to include a POCUS exam to assess ligamentous integrity Objective and POCUS findings were integrated to classify each LAS into one of four categories. Each grade of ankle sprain corresponded to levels of bracing for the protection of injured structures with each patient receiving physical therapy care based on rehabilitation guidelines. Participants completed the Foot and Ankle Ability Measure (FAAM) activities of daily living and Sports subscale, the Foot and Ankle Outcome Score (FAOS), Patient Reported Outcomes Measurement Information Systems Global Health, Tampa Scale of Kinesiophobia (TSK-11), Cumberland Ankle Instability Tool (CAIT), and the Numeric Pain Rating Scale as well as the Ankle Lunge Test and Figure 8 measurements at baseline, 4 weeks, 8 weeks and 12 weeks post enrollment. The FAAM Sport subscale, all FAOS subscales, and the TSK-11 were also collected at 24 weeks while the CAIT was collected at baseline and 24 weeks.
Results
Fourteen participants were enrolled with 11 participants completing all data collection. FAAM Sport scores significantly improved at 4, 8, 12 and 24 weeks. All components of the FAOS significantly increased except for Sport scores at four weeks and Quality of Life scores at four and eight weeks.
PSC 475 Box A FPO AP 96350-9998 a
Corresponding Author:
Matthew L. Bush PT, DPT, DSc
Associate Director of Clinical Support Services
U.S. Navy Medicine Readiness and Training Command, Yokosuka, Japan
POCUS guided early management and ligamentous protection of LASs resulted in significant short and long-term improvement in function and return to sporting activity This case series highlights the feasibility of using ultrasound imaging to assess the severity of ligamentous injury and align bracing strategies for ligamentous protection. The observations from this case series suggest that functional bracing strategies focused on ligamentous protection to promote healing and reduce re-injury rates does not delay improvement in functional outcomes.
Level IV, Case Series
Lateral ankle sprain (LAS) is a common musculoskeletal injury among active individuals, with incidence rates reported at 7.2 per 1000 person-years, making this one of the most common reasons for accessing healthcare.1‑7 Despite the high occurrence, a majority of individuals report not seeking medical care following an ankle sprain, with acute foot and ankle injuries resulting in more work limitations than any other body region.8,9 The strongest risk factor for a future ankle or foot injury (AFI) is a history of an AFI in the previous two years, with 47-70% of those injured sustaining a second LAS within one year 4,10 The high incidence and re-injury rate of LASs result in long term healthcare cost, delayed return to normal recreational and work related activities as well as the development of chronic ankle instability (CAI) in at least 40% of individuals who sustain a LAS.7,11‑14
The long-term effects of acute ankle sprains and CAI can be substantial. Approximately 78% of people with CAI develop post-traumatic osteoarthritis (PTOA).15 Patients with ankle PTOA are an average of 14 years younger at time of diagnosis compared to those of other joints, resulting in increased duration of pain, loss of function, and associated economic burdens to society.16 Because the journey to this chronic condition begins at initial injury, the identification and application of appropriate management techniques aimed at the prevention of reinjury and disease progression is essential.
Standard methods of assessing ankle sprains, such as palpation and orthopaedic tests and measures provide only dichotomous information to describe an ankle sprain into either injured or uninjured.17‑20 For ankle sprains, a clinical examination alone is unable to provide the comprehensive knowledge of individual injury characteristics to guide treatment decisions and predict long term prognosis.17,18, 21,22 Current clinical practice heavily relies on the ability of the clinical exam to accurately evaluate ligamentous damage and to characterize the associated functional impairments. This practice approach is unable to describe the extent and degree of injury in a manner to guide management and predict long-term disability from an acute injury 23,24 Ankle sprains are diagnostically challenging due to variability in presentation with respect to the amount of pain, edema, range of motion loss and functional limitation.
Ultrasound (US) imaging can identify the severity of ligamentous injury in acute ankle sprains to grade and provide
prognostic factors for long term outcomes.21 Previous studies have found that US has high sensitivity, specificity and accuracy of 95% or greater when used for the diagnosis of ligamentous injuries and fractures of the foot when compared to magnetic resonance imaging.25‑27 Additionally, excellent inter-observer agreement has been observed between expert and novice trained sonographers performing POCUS for ankle sprains.27 Utilization of point of care ultrasound (POCUS) allows for real time, dynamic evaluation of neuromusculoskeletal structures to include joints, ligaments, tendons, muscles and nerves.25 POCUS provides an opportunity to determine the severity of ligamentous injury in LASs to facilitate early and accurate diagnosis and guide management descisions.21,25‑29 The purpose of this study was to describe and observe the outcomes associated with POCUS guided early management of acute and sub-acute lateral ankle sprains.
A prospective case series of individuals presenting with a recent lateral ankle sprain was conducted. This study was approved by the Institutional Review Board at Brooke Army Medical Center, Fort Sam Houston, TX. All participants provided informed consent prior to enrollment in this study
A convenience sample of 14 individuals with an inversion ankle sprain within 28 days of injury were recruited from the local emergency department, primary care clinics or direct access physical therapy clinics at Brooke Army Medical Center. Inclusion criteria required participants to be between 18 and 45 years of age, negative Ottawa Ankle rules30 or negative radiographs of the foot and ankle, and sufficient English language skills to complete self-reported outcome measures. Participants were excluded if their clinical examination was consistent with a tibiofibular syndesmosis sprain, a fracture of the foot or ankle was identified, the existence of any condition that prevented the wearing of an ankle brace, or they were unable to commit to the course of care.
A standardized clinical evaluation, including ultrasound examination was performed to classify participants with a lateral ankle sprain into one of four graded categories. The clinical exam included palpation of injured and potentially injured structures, assessment of swelling, physiologic active and passive range of motion, passive accessory motion, soft tissue mobility, gait, balance, and strength. Range of motion assessment consisted of ankle dorsiflexion and plantarflexion using a goniometer as well as the Ankle Lunge Test (ALT) as a measure of weight bearing dorsiflexion.31 Ankle girth was used to quantitate soft tissue edema, using a standard figure-of-eight measurement as previously described by Devoogdt et al.32‑34
A standard and focused POCUS examination of the ankle was then performed using a LogiQ e (GE Healthcare, Milwaukee, WI) with a 4-12 MHz or 8-18 MHz linear transducer by a physical therapists trained to perform musculoskeletal (MSK) ultrasound examinations of the foot and ankle region. All scans were reviewed by a physical therapist Registered in Musculoskeletal sonography with over ten years of experience performing MSK ultrasound examinations. Guidelines of the Ultrasound Subcommittee of the European Society of Musculoskeletal Radiology (ESSR) were utilized to establish the scanning protocol and included examination of the joints, tendons, ligaments, bone surfaces and visible articular surfaces of the ankle.35 The examiner classified each structure as either stretched with minimal tearing, partially torn or completely torn to establish a grade of ligamentous injury 36 During the ultrasound exam all areas of pain were assessed but the extent of ligamentous injury along with range of motion loss and joint edema were used to assign a grade of injury. Clinical and ultrasound findings were integrated to determine the extent of ligamentous protection strategies such as movement and weight bearing restrictions along with bracing techniques to maximize early protection of injured structures. Injury grading and bracing strategies are detailed in Table 1. During a twoweek follow-up, participants received a second ultrasound examination to confirm the injury severity and describe any progression of pathology, such as joint effusion or inflammatory changes.
Initial treatment focused on protecting injured ligamentous structures, reducing edema and pain free active dorsiflexion and plantarflexion range of motion. Assistive devices were utilized as needed to normalize gait. Treatment also included adherence to bracing strategies listed in Table 1, and the avoidance of active ankle inversion for six weeks to avoid stressing injured tissues.37 After week six, participants were instructed to add gentle pain free inversion motion in varying degrees of plantar and dorsiflexion to facilitate a return to full pain free range of motion and to provide moderate tensile force to the healing ligament. Identified impairments of range of motion, strength, balance and gait were addressed as part of an evidence-based intervention
plan consistent with current clinical practice guidelines.38 Treatment was tailored to the severity of the injury with current impairments determining the focus of each treatment session. Interventional strategies aimed to decrease pain and swelling, increase range of motion, strength, weight-bearing and exercise tolerance were used Integration of clinical and sonographic examination of the injury provided the treating clinician information to guide early treatment decisions such as bracing recommendations and weight bearing status. Medication and imaging referral decisions were permitted and determined by the treating physical therapist.
All participants provided demographic information and completed patient reported outcomes to include the Foot and Ankle Ability Measure (FAAM) activities of daily living (ADL) and Sports subscale,39 the Foot and Ankle Outcome Score (FAOS),40 Patient Reported Outcomes Measurement Information Systems Global Health (PROMIS-GH),41 Tampa Scale of Kinesiophobia (TSK-11),42 Cumberland Ankle Instability Tool (CAIT),43 and the Numeric Pain Rating Scale (NPRS).44 Participants completed the FAAM, FAOS, PROMIS-GH, TSK-11 and NPRS as well as the Ankle Lunge Test (ALT) and Figure 8 measurements at baseline, 4 weeks, 8 weeks and 12 weeks post enrollment. The FAAM Sport subscale, all FAOS subscales, and the TSK-11 were also collected at 24 weeks while the CAIT was collected at baseline and 24 weeks. The anterior, posteromedial, and posterolateral directions of the Star Excursion Balance Test (SEBT) were assessed at 4, 8 and 12 weeks after enrollment to assess dynamic balance.45‑47 Balance was not assessed at baseline to protect injured ligamentous structures.37
The FAAM consists of a 21 item ADL and eight-item Sports subscale. The FAAM demonstrates excellent reliability, responsiveness for ADL participation, and is a valid measure of physical function for individuals with a wide range of musculoskeletal disorders of the lower leg, foot, and ankle.39,48 Each question is scored on a 5-point Likert scale from 4 (no difficulty) to 0 (unable to do). Scores range from 0 to 84 for the ADL subscale and 0 to 32 for the sports subscale.49 To calculate scores the total number of points are added, divided by the total number of possible points and then multiplied by 100. The FAAM has been validated in patients from 9-86 years of age and is a recommended outcome measure for lateral ankle sprains.38,39
Forty-two items that represent five subscales of pain (9 items), activities of daily living (17 items), sport and recreational function (5 items), foot and ankle related quality of life (4 items), and other symptoms (7 items) comprise the FAOS. Each question is scored on a 5-point Likert scale from 0-4 (Never, Rarely, Sometimes, Often, Always). The FAOS has been validated among patients with lateral ankle instability up to 60 years of age and is recommended as an outcome measure for a variety of ankle diagnoses.40
Table 1. Operational definition of grades and protection strategies
Clinical and Ultrasound Findings Protection Strategy
Grade I Clinical Exam
- Loss of ankle motion <5 degrees
- Edema of 0.5cm or less
Ultrasound Exam
- Stretching but no ligamentous tear
Grade II Clinical Exam
- Loss of ankle motion 5-10 degrees
- Edema of 0.5cm to 2cm
Ultrasound Exam
-Partial tear of one or more ankle ligament (ATFL, CFL)
Grade III Clinical Exam
- Loss of ankle motion: >10 degrees
- Edema > 2cm
Ultrasound Exam
-Complete tear of one ankle ligament (ATFL, CFL)
Grade IV Clinical Exam
- Loss of ankle motion: >10 degrees
- Edema > 2cm
Ultrasound Exam
- Complete Tear of two ankle ligaments (ATFL and CFL)
- Weightbearing: No restrictions
- ROM: No restrictions
- Bracing: 0-6 weeks: Ankle Stabilizing Orthosis (ASO)
- Weightbearing: No restrictions
- ROM:
0-6 weeks: Pain free dorsiflexion and plantarflexion, no inversion
- Bracing: 0-2 weeks: Semi rigid brace 2-6 weeks: ASO
- Weightbearing: no restrictions
- ROM:
0-6 weeks: Pain free dorsiflexion and plantarflexion, no inversion
- Bracing: 0-2 weeks: CAM Boot 2-4 weeks: Semi rigid brace 4-8 weeks: ASO
- Weightbearing:
0-2 weeks: < 25% weightbearing
- ROM:
0-6 weeks: Pain free dorsiflexion and plantarflexion, no inversion
- Bracing:
0-6 weeks: CAM Boot 6-12 weeks: ASO
The FAOS demonstrates excellent reliability40 and has established MCIDs for each subscale.50 Additionally, previous literature has established an excellent outcome as >450/500 total score.51
The CAIT is designed to measure the degree of functional ankle instability 52 This self-reported nine item questionnaire has demonstrated excellent reliability and construct validity, while a discriminant score for functional ankle instability has been determined to be ≤ 25 out of a possible 30 points.43,53 The NPRS is a 0-10 numeric pain rating scale (0 indicating no pain, and 10 indicating the worst imaginable pain) used to assess pain intensity Numeric pain scales are known to have excellent test-retest reliability.44
Designed to measure pain-related fear of movement/ reinjury, the TSK-11 is an 11 item instrument, with all items scored on a 4-point Likert scale (1–4) from “Strongly disagree” to “Strongly agree.”54 The TSK score ranges from 11 to 44, with higher scores indicating greater fear of pain, movement and injury 55 The TSK-11 has been found to be valid, with construct validity determined by the significant correlations between the TSK and Roland Disability Questionnaire, and the Pain Visual Analog Scale.56
The PROMIS-GH is a 10-item short form that efficiently gathers general perceptions of health. Questions assessing global physical health and global mental health are utilized to efficiently summaries physical and mental health in pa-
tient reported outcomes with higher scores indicating better global physical and mental health.41
The ALT was used as a weight bearing measurement of ankle dorsiflexion and is considered more functionally relevant than a non-weight bearing measurement.31 It is a common way of measuring ankle dorsiflexion among various ankle injuries and has demonstrated excellent intra and inter-rater reliability 31,57 Minimal detectable change (MCD) and minimal clinically important differences (MCID) for each outcome measure is detailed in Table 2
The SEBT is a quick and inexpensive method of measuring balance with good reliability 59 The SEBT consist of eight reach directions with previously published studies establishing acceptable intra-tester and inter-tester reliability in health young adults.46 Based on findings of shared variance across the eight reach directions the recommendation has been made that assessment of only three reach directions (anterior, posteromedial, posterolateral) be performed.60 Four practice trials were performed on each limb and in each of the three reach directions.46 The average of three measured trails was calculated and normalized to leg length. A composite score was also calculated.59
A priori significance was set at p ≤ 0.05 for all analyses with a sample size estimate of 18 participants being needed to
FAAM Foot and Ankle Ability Measure, ADL activities of daily living, FAOS Foot and Ankle Outcome Score, CAIT Cumberland Ankle Instability Tool, NPRS Numeric Pain Rating Scale, TSK-11 Tampa Scale for Kinesiophobia, PROMIS Patient Reported Outcome Measures Information System, ALT Ankle Lunge Test, SEBT Star Excursion Balance Test, ARD anterior reach direction, PMD posteromedial direction, PLD posterolateral direction
detect a 22.5 point change in the FAOS sport subscale, α =0.05, β =0.20.51 Descriptive statistics were calculated for participant demographics and all patient reported outcome measures. Prior to statistical comparison analysis, Levene’s test of homogeneity of variance, Shapiro-Wilk test for normality and Mauchly’s test of sphericity were performed. Primary and secondary outcomes with three or more levels of measure were analyzed using a repeated measures analysis of variance, with time as the within-subjects factor. For significant findings a post hoc analysis was performed with a Bonferroni correction applied. Secondary outcomes with two data points were assessed via paired t-test. Data were analyzed using Statistical Package for Social Sciences (SPSS) Version 27.0 (IBM, Inc., Armonk, New York).
Twenty-five consecutive individuals were screened for eligibility with ten choosing not to participate due to the time commitment of the study and one individual not participating due to an identified foot fracture. Fourteen individuals met the inclusion criteria and consented to participate in the study (Table 3). All participants completed all in-clinic treatment and data collection at 12 weeks but only eleven participants completed patient reported outcome measures at 24 weeks.
FAAM ADL scores of the involved side significantly increased at 4, 8 and 12 weeks compared to baseline with score improvement at 4 and 8 weeks exceeding the MCID of 8 points, compared to the previous time point. FAAM sport scores of the involved side significantly increased at all time points and exceeded the MCID of 9 points when compared to the previous time point at 4, 8, and 24 weeks. An 8.2-point improvement was observed between weeks 8 and 12. Lastly, all component scores of the FAOS and total scores were significantly increased compared to baseline measurements except for Sport scores at four weeks and Quality of life scores at four and eight weeks. Pain, Other symptoms and ADL subscale MCIDs of the FAOS were initially exceeded at four weeks, while Sport and Quality of life scores exceeded MCIDs at eight weeks. FAAM Sport and ADL scores are also shown graphically in Figure 1 and Figure 2 Individual FAOS score are detailed in Figure 3 and total FAOS scores are shown in Figure 4.
Statistically significant differences were observed in 15 of 17 secondary outcome measures across multiple time points. All primary and secondary outcome measures are detailed in Table 4.
This case series of ultrasound guided early management and ligamentous protection of lateral ankle sprains observed significant improvement in primary functional outcomes across all data points from baseline to 24 weeks. While conducting this case series, the authors observed that detailed evaluation of lateral ankle ligaments and grading with ultrasound can provide valuable information to guide clinical decisions such as bracing strategies and functional rehabilitation while improving management.29
The continued improvement in primary outcomes from baseline to 24 weeks suggest that a ligamentous injury to the lateral ankle is not one in which full anatomical and functional recovery is rapidly obtained. The application of a tailored management plan with an emphasis on ligamentous protection, guided by POCUS findings shows promise in the management of this injury Sport and ADL subscales of the FAAM and FAOS both showed large improvements from baseline to eight weeks with a ceiling effect being observed with FAAM and FAOS ADL scores from 8 to 24 weeks. FAAM Sport subscale scores continued to exceed the MCID through 24 weeks when compared to the previous data points, possibly due to higher level function associated with sporting activity being slower to return than tolerance to daily activities.
Secondary measures assessing global physical health, pain, range of motion, ankle edema and dynamic balance revealed significant improvement when compared to baseline data. ALT scores of the involved limb showed improvement from baseline to eight weeks, with a slight decrease in scores from eight to 12 weeks. Improvements on the involved side from baseline to four weeks and four weeks to
Table 3. Group demographics, injury history, and grade of ankle sprain
Age (years) 27.5 ± 6.9 Body mass index (kg/m2)
Sex, n
Time (days) from injury to initial evaluation
ankle sprain of reference ankle
of Sprain
± 4.5
± 6.7
(50)
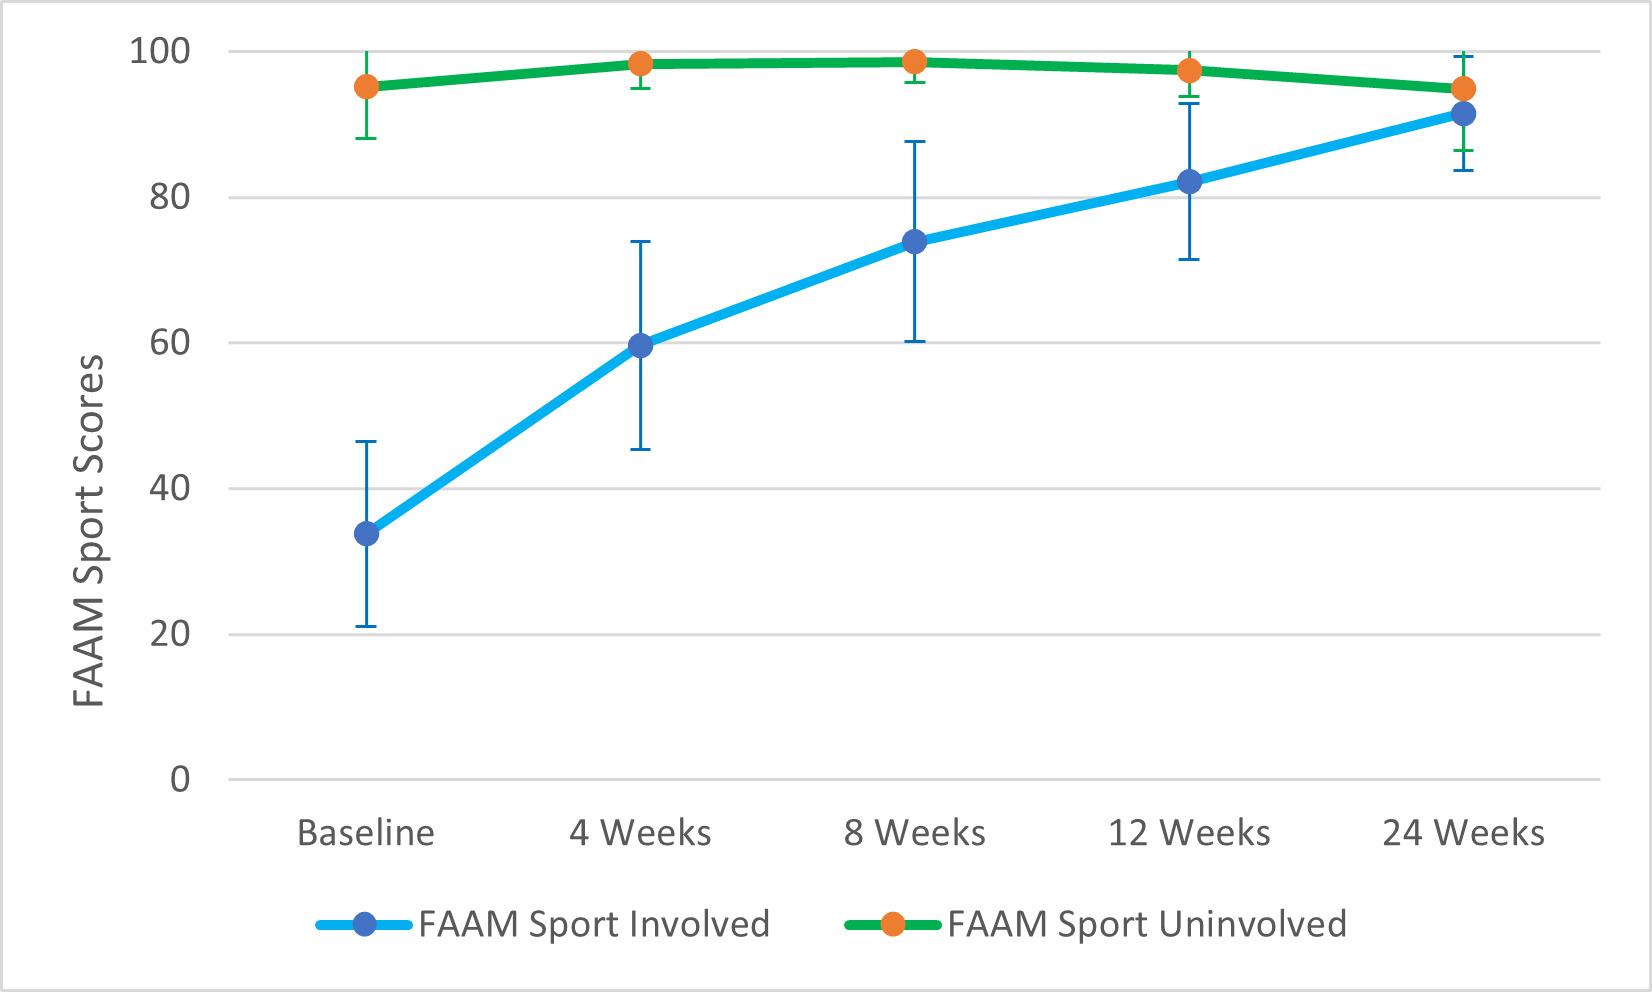
Figure 1. Foot and Ankle Measure Sport subscale scores (Involved and Uninvolved ankles). Error bars indicate 95% CI.
eight weeks met or exceeded the MDC of 1.9 cm. It was observed in this case series that rehab strategies focused on restoring range of motion and bracing strategies based on clinical practice guidelines did not result in prolonged joint stiffness or a loss in dorsiflexion range of motion.38,61‑64
TSK-11 scores from baseline to 24 weeks improved from 28.0 to 21.5, exceeding the MDC of 5.6 points, suggesting a decrease in pain related movement and fear of reinjury.49 All individuals scored well below the threshold score of ≤ 25 on the CAIT at baseline with a mean score of 7.1. A 14.1-point improvement was observed over 24 weeks which exceeded the MCID of ≥ 3 but only one of eleven participants completing the CAIT at 24 weeks scored above 25 points, indicating that 90% of participants continued to be classified as having CAI of the injured ankle, which is associated with increased recurrence.53
For dynamic balance, there was a significant difference in normalized anterior reach direction scores and composite scores of the involved limb at eight and 12 weeks when compared to initial data collected at four weeks, suggesting that improvements in dynamic balance were maintained.
The results of this case series are consistent with the findings of Sanjay et al. who reported on the management of 80 grade one and grade two lateral ankle sprains with ultrasound guided management and bracing strategies.65 Grade two ankle sprains were braced for six weeks with a short leg synthetic cast with restricted weight bearing for the first four weeks.65 The current case series utilized functional bracing (Table 1) for six to 12 weeks depending on injury severity that allowed for full weight bearing during this time period. Improvement in outcomes over the first eight
Table 4. Patient reported outcomes at all time points
statistically significant (p≤ 0.05) compared to *baseline; †4 weeks compared to 8 weeks, ‡4 weeks compared to 12 weeks. PROMIS Patient Reported Outcome Measures Information System, Comp Composite, CAIT Cumberland Ankle Instability Tool, TSK-11 Tampa Scale for Kinesiophobia, NPRS Numeric Pain Rating Scale, ALT Ankle Lunge Test, IS involved side, US uninvolved side, SEBT Star Excursion Balance Test, ARD anterior reach direction, FAAM Foot and Ankle Ability Measure, ADL activities of daily living, FAOS Foot and Ankle Outcome Score, NS not significant
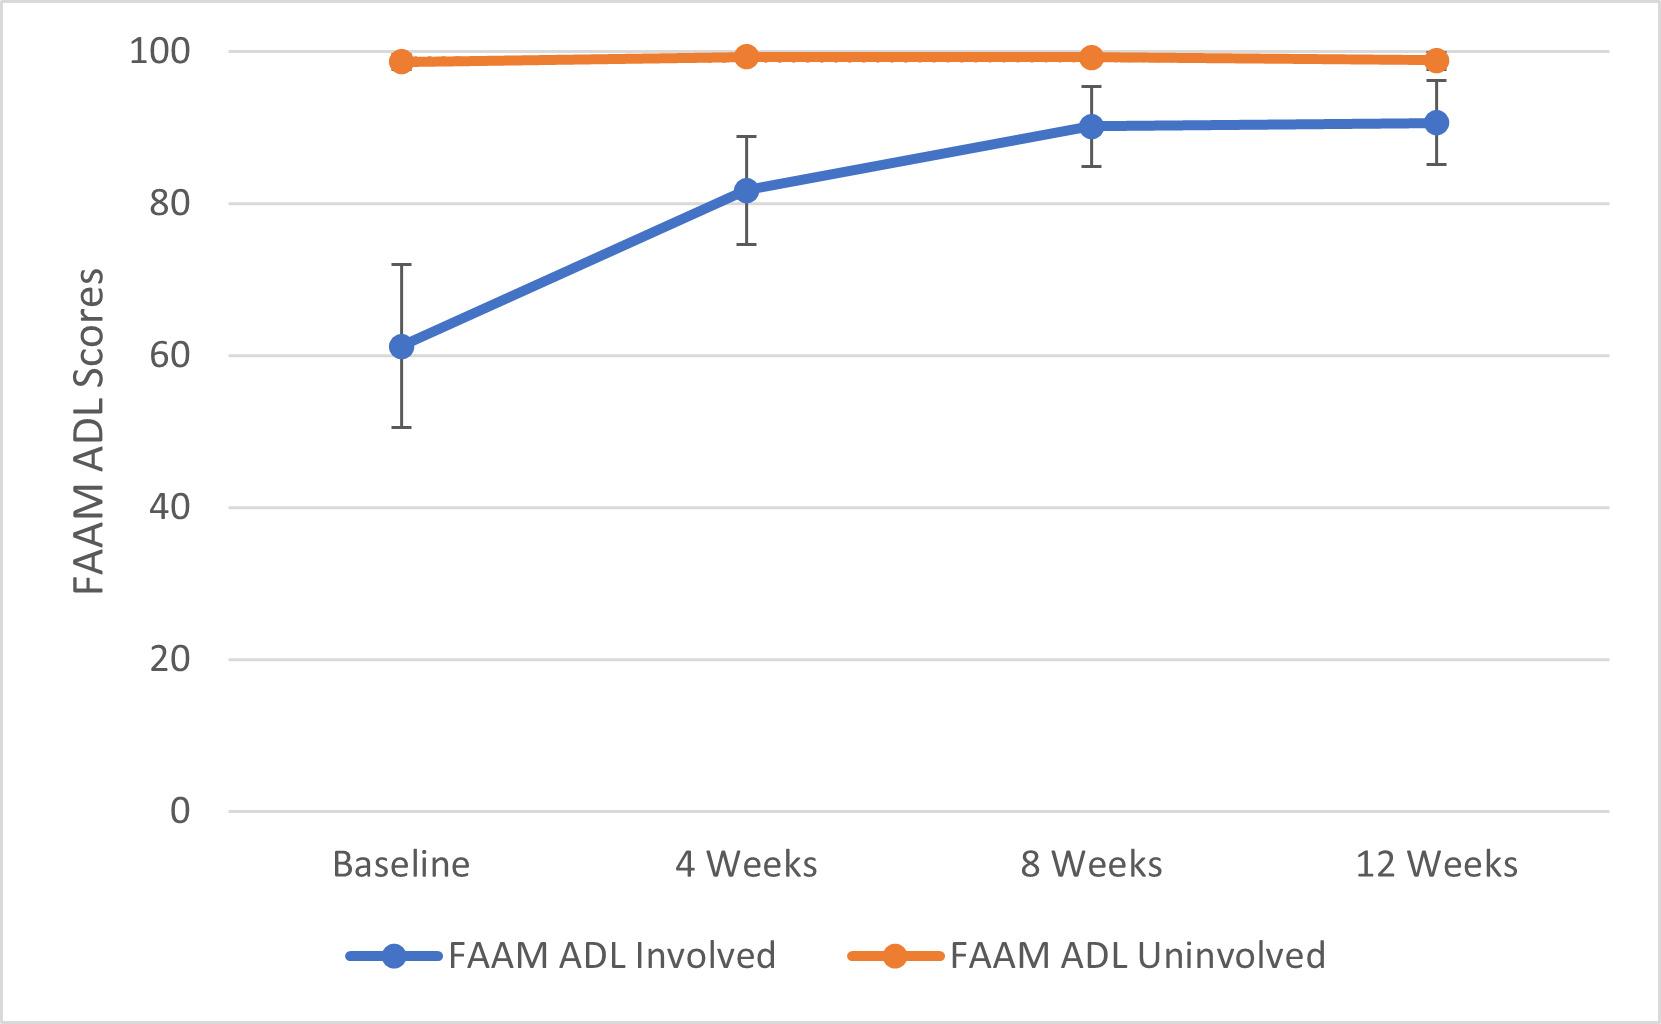
Figure 2. Foot and Ankle Measure Activities of Daily Living (ADL) subscale scores (Involved and Uninvolved ankles). Error bars indicate 95% CI.
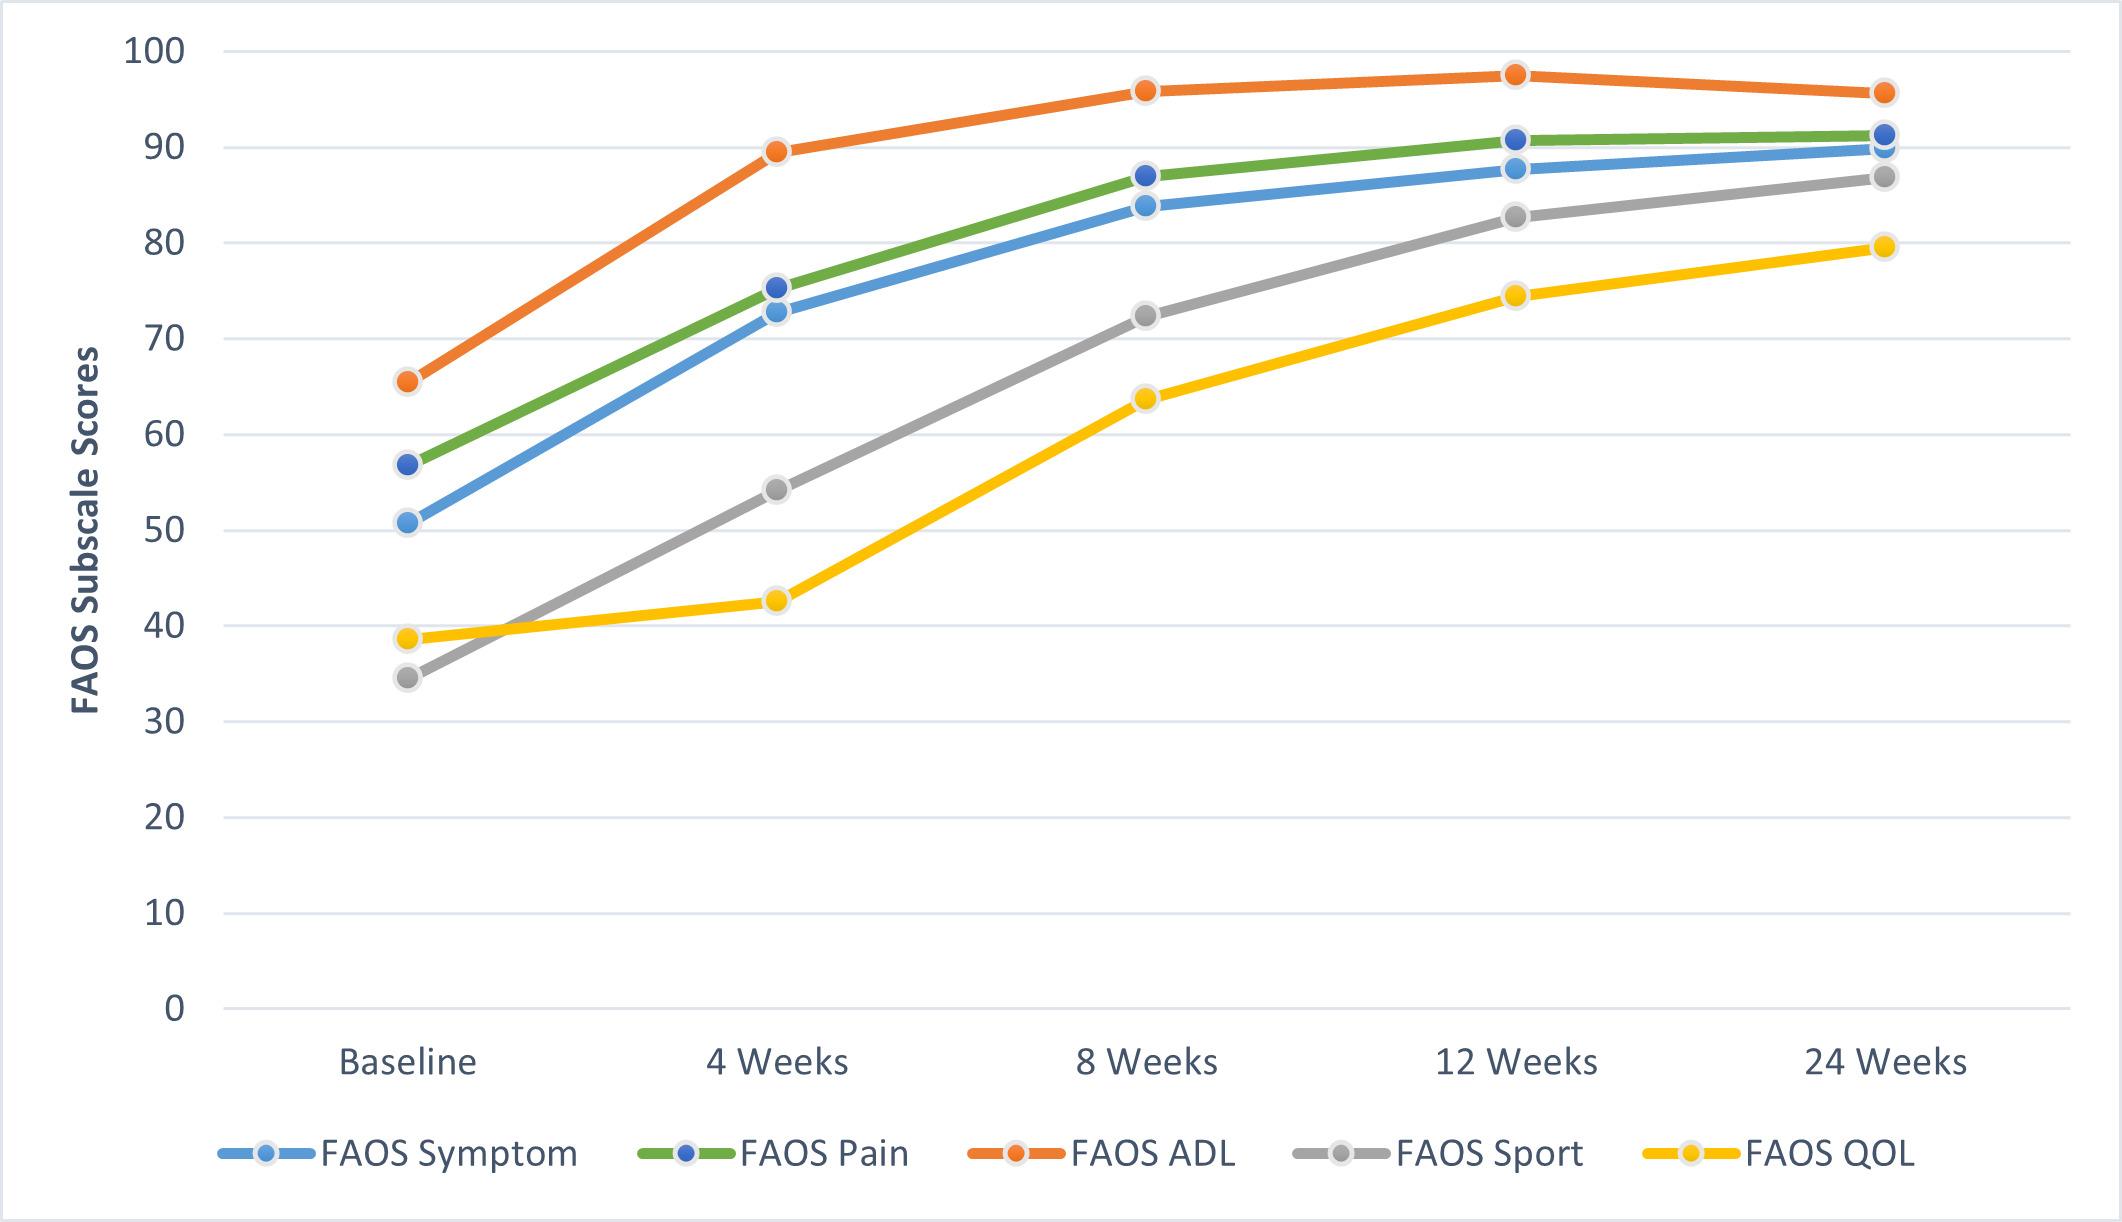
Figure 3. Foot and Ankle Outcome Score (FAOS) subscale scores. Activities of Daily Living (ADL) and Quality of Life (QOL).
weeks of treatment was observed with the use of functional bracing
Brison et al. conducted a randomized controlled trial of 503 participants to assess the efficacy of supervised physiotherapy in the management of clinically diagnosed grade one and grade two acute ankle sprains.51 Results at four weeks for FAOS ADL and Sport scores in a per protocol
analysis showed mean differences favoring physiotherapy care and reported mean scores of 28 and 34 respectively, while the current study observed mean ADL scores of 89.4 and Sport scores of 54.1 at four weeks. Brison et al. also reported FAOS ADL scores of 37 and Sport scores of 58 at 24 weeks, compared to the current study reporting FAOS ADL scores of 95.6 and Sport scores of 86.8, in which 65% of par-
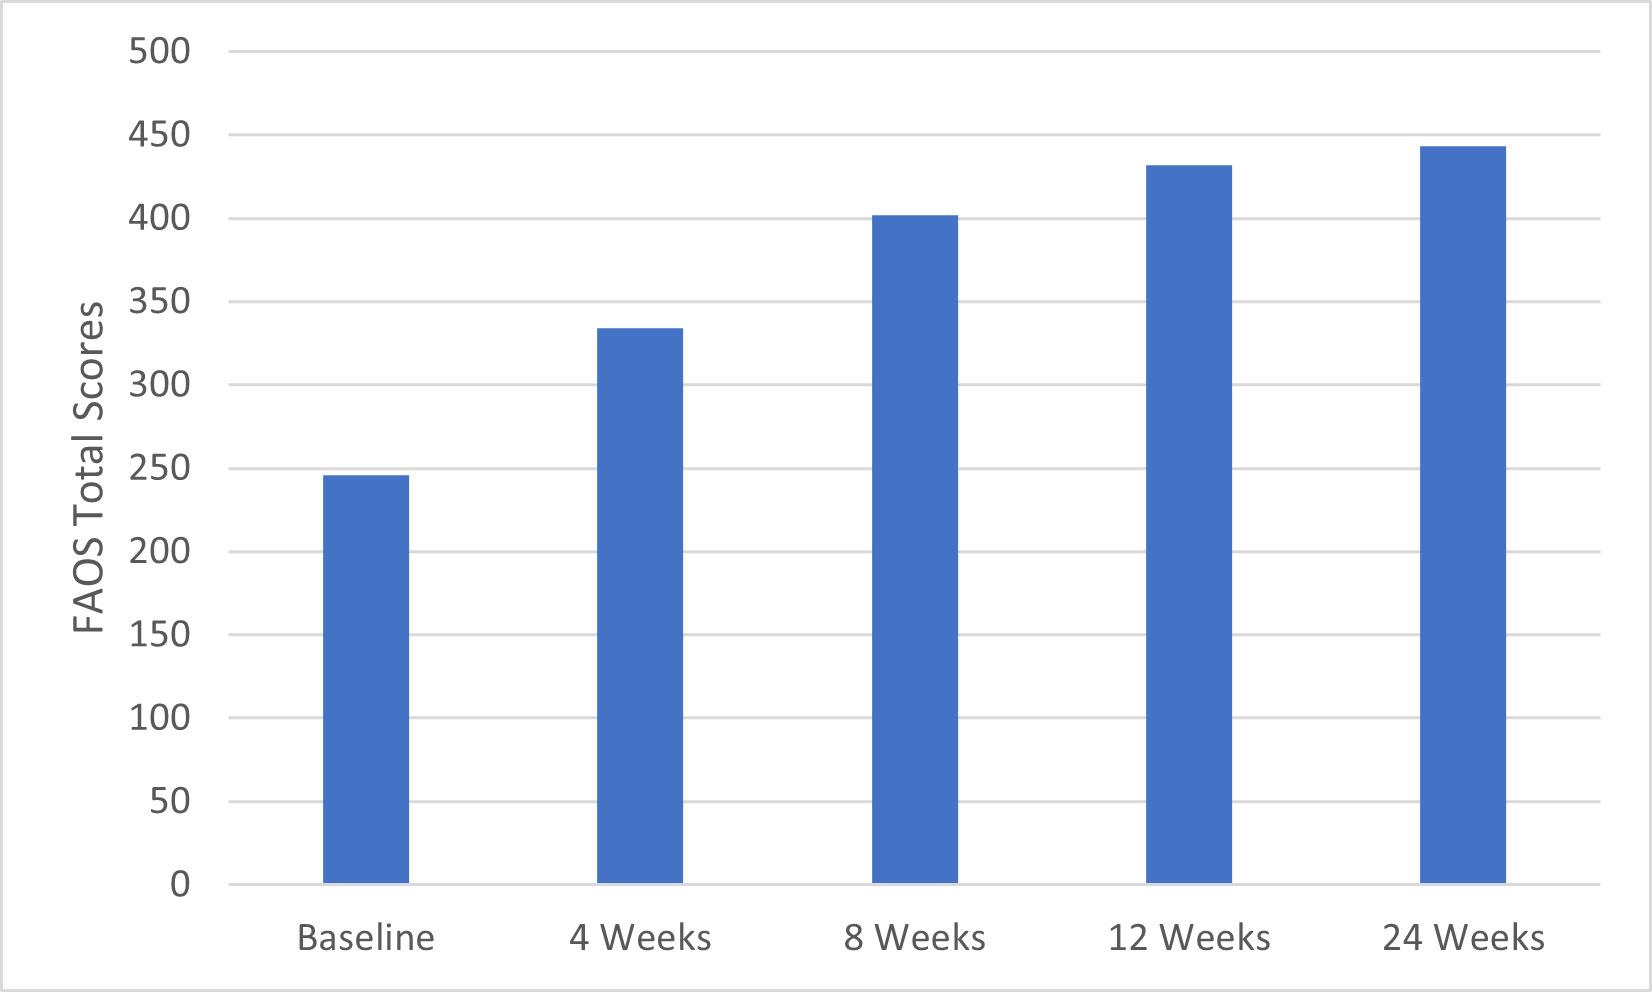
Figure 4. Foot and Ankle Outcome Score (FAOS) total scores.
ticipants were classified as a Grade 2 sprain and 30% classified as a Grade 3 or 4 sprain while utilizing a more restrictive bracing strategy for the first six to eight weeks.
In this case series, FAAM ADL score improvement from baseline to 12 weeks of 28.1 points and FAAM Sport score improvement from baseline to 24 weeks of 57.7 points, exceeded previously published MCIDs of 8 points for the ADL and nine points for the Sport subscale.39 Similar improvement in the FAOS ADL and Sport scores from baseline to 24 weeks of 30.2 and 52.3 points, exceeded the MCIDs of 17.6 and 22.5 points respectively 50 In this case series it was observed that the management strategy described above was beneficial in the management of lateral ankle sprains in the included participants. It was observed that more restrictive bracing strategies focused on ligamentous protection to promote healing and reduce re-injury rates did not result in worse outcomes over a 24-week period. Early and accurate diagnosis is critical to the proper management of acute musculoskeletal injuries. During the initial phase of an acute injury, ligamentous tissues remain mechanically weak and subject to reinjury.66 This is due to the fact that significant improvements in mechanical ligamentous stability do not occur until at least six weeks to three months after injury 67 During this process, acute inflammatory, proliferation and remodeling phases are ongoing with increases in tissue tensile strength not seen until late in the remodeling phase.66 Patients who return to activity during this time period are at an increased risk of reinjury and further disease progression.23,68 The timeline for returning to activity is highly dependent on the severity of the injury and phases of tissue healing.66 Utilizing a progressive rehabilitation process while protecting fragile and injured structures should be the primary focus following injury 69,70 This manuscript is one of the first to describe and observe the
use of POCUS guided clinical management of lateral ankle sprains along with ligamentous protection. These findings provide a model for the integration of POCUS examination of lateral ankle sprains into clinical practice and warrant further research.
Over the course of this case series two participants suffered additional inversion ankle injuries.
One participant sustained an inversion injury of the uninvolved ankle at 22 weeks post enrollment, resulting in decreased FAOS scores across all subscales and a reduced FAAM sport score of the uninvolved ankle at 24 weeks. A second participant reinjured the involved ankle while stepping out of the shower at 11 weeks post enrollment, resulting in a significant decrease in the individual’s SEBT scores at 12 weeks. SEBT scores of all other participants continued to improve at this time point. The 14% re-injury rate observed during this case series is consistent with previously reported re-injury rates of 14-17%.71
The current study had several strengths including the implementation of POCUS-guided management of lateral ankle sprains and ligamentous protection strategies. The pragmatic management approach along with a heterogenous sample of injury severity and acuity is consistent with current clinical practice and may aid clinicians in managing this patient population.
This study has several limitations. The first is the small number of participants, rendering it a case series, due to insufficient number of subjects to achieve power while also increasing the chance of a type I error Second, all participants were from a single patient group, which may limit generalizability beyond this population. Future research should investigate this management strategy with a comparison group and longer follow up periods.
Using POCUS to guide early management and ligamentous protection of lateral ankle sprains may be useful in improving function and return to sporting activity When comparing the results to previously published studies that did not adhere to any or used less restrictive ligamentous protection strategies, primary and secondary outcomes in this case series were observed to be equal to or improved at higher rates.51,65 The use of POCUS can help accurately diagnose ligamentous injuries, enabling the implementation of protection strategies specific to the grade of ligamentous injury, while also maintaining joint function and overall joint health. The observations from this study suggest that conservative functional bracing strategies focused on ligamentous protection to promote healing and reduce reinjury rates does not delay improvement in functional outcomes.
None
The authors are military service members or employees of the U.S. Government. This work was prepared as part of their official duties. Title 17, U.S.C. §105 provides that copyright protection under this title is not available for any work of the U.S. Government. Title 17, U.S.C. §101 defines a U.S. Government work as work prepared by a military service member or employee of the U.S. Government as part of that person’s official duties. The views expressed herein are those of the author(s) and do not necessarily reflect the official policy or position of the Defense Health Agency, Brooke Army Medical Center, the Department of Defense, nor any agencies under the U.S. Government. The study protocol was approved by the San Antonio Institutional Review Board in compliance with all applicable Federal regulations governing the protection of human subjects. Research data were derived from an approved San Antonio Institutional Review Board protocol, number C.2021.104d.
Submitted: January 19, 2024 CDT, Accepted: July 02, 2024 CDT
© The Author(s)
This is an open-access article distributed under the terms of the Creative Commons Attribution 4.0 International License (CCBY-NC-4.0). View this license’s legal deed at https://creativecommons.org/licenses/by-nc/4.0 and legal code at https://creativecommons.org/licenses/by-nc/4.0/legalcode for more information.
1. Waterman BR, Owens BD, Davey S, Zacchilli MA, Belmont PJ Jr The epidemiology of ankle sprains in the United States. J Bone Joint Surg Am. 2010;92(13):2279-2284. doi:10.2106/jbjs.I.01537
2. Fraser JJ, MacGregor A, Ryans CP, Dreyer MA, Gibboney MD, Rhon DI. Sex and occupation are salient factors associated with lateral ankle sprain risk in military tactical athletes. J Sci Med Sport Published online 2021. doi:10.1016/ j.jsams.2021.02.016
3. Waterman BR, Belmont PJ, Cameron KL, Deberardino TM, Owens BD. Epidemiology of ankle sprain at the United States Military Academy Am J Sports Med 2010;38(4):797-803. doi:10.1177/ 0363546509350757
4. Wallace RF, Wahi MM, Hill OT, Kay AB. Rates of ankle and foot injuries in active-duty U.S. Army Soldiers, 2000–2006. Mil Med. 2011;176(3):283-290. doi:10.7205/milmed-d-10-00098
5. Cameron KL, Owens BD, Deberardino TM. Incidence of ankle sprains among active-duty members of the United States Armed Services From 1998 Through 2006. J Athl Train 2010;45(1):29-38. doi:10.4085/1062-6050-45.1.29
6. Doherty C, Delahunt E, Caulfield B, Hertel J, Ryan J, Bleakley C. The incidence and prevalence of ankle sprain injury: A systematic review and meta-analysis of prospective epidemiological studies. Sports Med. 2014;44(1):123-140. doi:10.1007/s40279-013-0102-5
7 Gribble PA, Bleakley CM, Caulfield BM, et al. 2016 consensus statement of the International Ankle Consortium: prevalence, impact and long-term consequences of lateral ankle sprains. Br J Sports Med. 2016;50(24):1493-1495. doi:10.1136/ bjsports-2016-096188
8. Stahlman S, Taubman SB. Incidence of acute injuries, active component, U.S. Armed Forces, 2008-2017 Msmr 2018;25(7):2-9.
9. Hubbard-Turner T Lack of medical treatment from a medical professional after an ankle sprain. J Athl Train 2019;54(6):671-675. doi:10.4085/ 1062-6050-428-17
10. Herzog MM, Kerr ZY, Marshall SW, Wikstrom EA. Epidemiology of ankle sprains and chronic ankle instability J Athl Train 2019;54(6):603-610. doi:10.4085/1062-6050-447-17
11. Hertel J, Corbett RO An updated model of chronic ankle instability J Athl Train 2019;54(6):572-588. doi:10.4085/1062-6050-344-18
12. Konradsen L, Bech L, Ehrenbjerg M, Nickelsen T Seven years follow-up after ankle inversion trauma. Scand J Med Sci Sports. 2002;12(3):129-135. doi:10.1034/j.1600-0838.2002.02104.x
13. Rosenthal MD, Ziemke GW, Bush ML, Halfpap J. Physical therapists forward deployed on Aircraft Carriers: A retrospective look at a decade of service. Mil Med 2018;183(11-12):e377-e382. doi:10.1093/ milmed/usy070
14. Dijksma I, Bekkers M, Spek B, Lucas C, Stuiver M. Epidemiology and financial burden of musculoskeletal injuries as the leading health problem in the military Mil Med 2020;185(3-4):e480-e486. doi:10.1093/milmed/ usz328
15. Wikstrom EA, Hubbard-Turner T, Mckeon PO. Understanding and treating lateral ankle sprains and their consequences. Sports Med. 2013;43(6):385-393. doi:10.1007/s40279-013-0043-z
16. Delco ML, Kennedy JG, Bonassar LJ, Fortier LA. Post-traumatic osteoarthritis of the ankle: A distinct clinical entity requiring new research approaches. J Orthop Res 2017;35(3):440-453. doi:10.1002/ jor.23462
17. Martin RL, Davenport TE, Paulseth S, Wukich DK, Godges JJ. Ankle stability and movement coordination impairments: ankle ligament sprains. J Orthop Sports Phys Ther. 2013;43(9):A1-40. doi:10.2519/jospt.2013.0305
18. Thompson JY, Byrne C, Williams MA, Keene DJ, Schlussel MM, Lamb SE. Prognostic factors for recovery following acute lateral ankle ligament sprain: a systematic review BMC Musculoskelet Disord. 2017;18(1). doi:10.1186/s12891-017-1777-9
19. Netterström-Wedin F, Bleakley C. Diagnostic accuracy of clinical tests assessing ligamentous injury of the ankle syndesmosis: A systematic review with meta-analysis. Phys Ther Sport 2021;49:214-226. doi:10.1016/j.ptsp.2021.03.005
20. Netterström-Wedin F, Matthews M, Bleakley C. Diagnostic accuracy of clinical tests assessing ligamentous injury of the talocrural and subtalar joints: A systematic review with meta-analysis. Sports Health 2022;14(3):336-347 doi:10.1177/ 19417381211029953
21. Choi WS, Cho JH, Lee DH, Chung JY, Lim SM, Park YU. Prognostic factors of acute ankle sprain: Need for ultrasonography to predict prognosis. J Orthop Sci 2020;25(2):303-309. doi:10.1016/j.jos.2019.04.012
22. Doherty C, Bleakley C, Hertel J, Caulfield B, Ryan J, Delahunt E. Clinical tests have limited predictive value for chronic ankle instability when conducted in the acute phase of a first-time lateral ankle sprain injury Arch Phys Med Rehabil 2018;99(4):720-725.e1. doi:10.1016/j.apmr.2017.11.008
23. Pourkazemi F, Hiller CE, Raymond J, Nightingale EJ, Refshauge KM. Predictors of chronic ankle instability after an index lateral ankle sprain: a systematic review. J Sci Med Sport. 2014;17(6):568-573. doi:10.1016/j.jsams.2014.01.005
24. Croy T, Koppenhaver S, Saliba S, Hertel J. Anterior talocrural joint laxity: diagnostic accuracy of the anterior drawer test of the ankle. J Orthop Sports Phys Ther 2013;43(12):911-919. doi:10.2519/ jospt.2013.4679
25. Henderson REA, Walker BF, Young KJ. The accuracy of diagnostic ultrasound imaging for musculoskeletal soft tissue pathology of the extremities: a comprehensive review of the literature. Chiropr Man Therap 2015;23(31):31-31. doi:10.1186/ s12998-015-0076-5
26. Ekinci S, Polat O, Günalp M, Demirkan A, Koca A. The accuracy of ultrasound evaluation in foot and ankle trauma. Am J Emerg Med. 2013;31(11):1551-1555. doi:10.1016/ j.ajem.2013.06.008
27. Lee SH, Yun SJ. The feasibility of point-of-care ankle ultrasound examination in patients with recurrent ankle sprain and chronic ankle instability: Comparison with magnetic resonance imaging. Injury 2017;48(10):2323-2328. doi:10.1016/ j.injury.2017.07.015
28. Klauser AS, Tagliafico A, Allen GM, et al. Clinical indications for musculoskeletal ultrasound: a Delphibased consensus paper of the European Society of Musculoskeletal Radiology. Eur Radiol. 2012;22(5):1140-1148. doi:10.1007/ s00330-011-2356-3
29. Meyer R, Loncar LR, Jensen E, et al. The role of ultrasound in the management of ankle sprains and a clinically relevant geisinger ankle sprain sports ultrasound protocol. Curr Sports Med Rep. 2023;22(9):320-327 doi:10.1249/ jsr.0000000000001105
30. Beckenkamp PR, Lin CC, Macaskill P, Michaleff ZA, Maher CG, Moseley AM. Diagnostic accuracy of the Ottawa Ankle and Midfoot Rules: a systematic review with meta-analysis. Br J Sports Med. 2017;51(6):504-510. doi:10.1136/ bjsports-2016-096858
31. Simondson D, Brock K, Cotton S. Reliability and smallest real difference of the ankle lunge test post ankle fracture. Man Ther 2012;17(1):34-38. doi:10.1016/j.math.2011.08.004
32. Esterson PS. Measurement of ankle joint swelling using a figure of 8* J Orthop Sports Phys Ther 1979;1(1):51-52. doi:10.2519/jospt.1979.1.1.51
33. Devoogdt N, Cavaggion C, Van der Gucht E, et al. Reliability, ralidity, and feasibility of water displacement method, figure-of-eight method, and circumference measurements in determination of ankle and foot edema. Lymphat Res Biol 2019;17(5):531-536. doi:10.1089/lrb.2018.0045
34. Rohner-Spengler M, Mannion AF, Babst R. Reliability and minimal detectable change for the figure-of-eight-20 method of, measurement of ankle edema. J Orthop Sports Phys Ther. 2007;37(4):199-205. doi:10.2519/jospt.2007.2371
35. Martinoli C. Musculoskeletal ultrasound: technical guidelines. Insights into Imaging. 2010;1(3):99-141. doi:10.1007/s13244-010-0032-9
36. Palmer W, Bancroft L, Bonar F, et al. Glossary of terms for musculoskeletal radiology. Skeletal Radiol. 2020;49(Suppl 1):1-33. doi:10.1007/ s00256-020-03465-1
37 Wells B, Allen C, Deyle G, Croy T Management of acute grade II lateral ankle sprains with an emphasis on ligament protection: A descriptive case series. Int J Sports Phys Ther. 2019;14(3):445-458. doi:10.26603/ ijspt20190445
38. Martin RL, Davenport TE, Fraser JJ, et al. Ankle stability and movement coordination impairments: lateral ankle ligament sprains revision 2021. J Orthop Sports Phys Ther 2021;51(4):CPG1-CPG80. doi:10.2519/jospt.2021.0302
39. Martin RL, Irrgang JJ, Burdett RG, Conti SF, Swearingen JMV Evidence of validity for the Foot and Ankle Ability Measure (FAAM). Foot Ankle Int 2005;26(11):968-983. doi:10.1177/ 107110070502601113
40. Roos EM, Brandsson S, Karlsson J. Validation of the foot and ankle outcome score for ankle ligament reconstruction. Foot Ankle Int 2001;22(10):788-794. doi:10.1177/107110070102201004
41. Hays RD, Bjorner JB, Revicki DA, Spritzer KL, Cella D. Development of physical and mental health summary scores from the patient-reported outcomes measurement information system (PROMIS) global items. Qual Life Res 2009;18(7):873-880. doi:10.1007/s11136-009-9496-9
42. Hapidou EG, O’Brien MA, Pierrynowski MR, de Las Heras E, Patel M, Patla T. Fear and avoidance of movement in people with chronic pain: Psychometric properties of the 11-Item Tampa Scale for Kinesiophobia (TSK-11). Physiother Can 2012;64(3):235-241. doi:10.3138/ptc.2011-10
43. Wright CJ, Linens SW, Cain MS. Establishing the minimal clinical important difference and minimal detectable change for the Cumberland Ankle Instability Tool. Arch Phys Med Rehabil. 2017;98(9):1806-1811. doi:10.1016/ j.apmr.2017.01.003
44. Childs JD, Piva SR, Fritz JM. Responsiveness of the numeric pain rating scale in patients with low back pain. Spine (Phila Pa 1976) 2005;30(11):1331-1334. doi:10.1097/ 01.brs.0000164099.92112.29
45. Hertel J, Braham RA, Hale SA, Olmsted-Kramer LC. Simplifying the star excursion balance test: analyses of subjects with and without chronic ankle instability J Orthop Sports Phys Ther 2006;36(3):131-137. doi:10.2519/jospt.2006.36.3.131
46. Gribble PA, Hertel J, Plisky P. Using the Star Excursion Balance Test to assess dynamic posturalcontrol deficits and outcomes in lower extremity injury: A literature and systematic review. J Athl Train 2012;47(3):339-357 doi:10.4085/ 1062-6050-47.3.08
47. Powden CJ, Dodds TK, Gabriel EH. The reliability of the STAR Excursion Balance Test and Lower Quarter Y-Balance Test in healthy adults: A systematic review. Int J Sports Phys Ther. 2019;14(5):683-694. doi:10.26603/ijspt20190683
48. Sieradzki JP, Larsen N, Wong I, Ferkel RD Symptom and disability measurement by common foot and ankle-specific outcome rating scales. Foot Ankle Int 2020;41(7):849-858. doi:10.1177/ 1071100720920635
49. Carcia CR, Martin RL, Drouin JM. Validity of the Foot and Ankle Ability Measure in athletes with chronic ankle instability. J Athl Train. 2008;43(2):179-183. doi:10.4085/1062-6050-43.2.179
50. Çelik D, Çoban Ö, Kılıçoğlu Ö Minimal clinically important difference of commonly used hip-, knee-, foot-, and ankle-specific questionnaires: a systematic review J Clin Epidemiol 2019;113:44-57 doi:10.1016/ j.jclinepi.2019.04.017
51. Brison RJ, Day AG, Pelland L, et al. Effect of early supervised physiotherapy on recovery from acute ankle sprain: randomised controlled trial. BMJ 2016:i5650. doi:10.1136/bmj.i5650
52. Hiller CE, Refshauge KM, Bundy AC, Herbert RD, Kilbreath SL. The Cumberland ankle instability tool: a report of validity and reliability testing. Arch Phys Med Rehabil. 2006;87(9):1235-1241. doi:10.1016/ j.apmr.2006.05.022
53. Wright CJ, Arnold BL, Ross SE, Linens SW Recalibration and validation of the Cumberland Ankle Instability Tool cutoff score for individuals with chronic ankle instability Arch Phys Med Rehabil 2014;95(10):1853-1859. doi:10.1016/ j.apmr.2014.04.017
54. Woby SR, Roach NK, Urmston M, Watson PJ. Psychometric properties of the TSK-11: a shortened version of the Tampa Scale for Kinesiophobia. Pain 2005;117(1-2):137-144. doi:10.1016/ j.pain.2005.05.029
55. George SZ, Lentz TA, Zeppieri G, Lee D, Chmielewski TL. Analysis of shortened versions of the Tampa Scale for Kinesiophobia and Pain Catastrophizing Scale for Patients after anterior cruciate ligament reconstruction. Clin J Pain 2012;28(1):73-80. doi:10.1097/ajp.0b013e31822363f4
56. Woby SR, Roach NK, Urmston M, Watson PJ. Psychometric properties of the TSK-11: a shortened version of the Tampa Scale for Kinesiophobia. Pain. 2005;117(1-2):137-144. doi:10.1016/ j.pain.2005.05.029
57. Beazell JR, Grindstaff TL, Sauer LD, Magrum EM, Ingersoll CD, Hertel J. Effects of a proximal or distal tibiofibular joint manipulation on ankle range of motion and functional outcomes in Individuals with chronic ankle instability J Orthop Sports Phys Ther 2012;42(2):125-134. doi:10.2519/jospt.2012.3729
58. Powden CJ, Hoch JM, Hoch MC. Reliability and minimal detectable change of the weight-bearing lunge test: A systematic review Man Ther 2015;20(4):524-532. doi:10.1016/j.math.2015.01.004
59. Plisky PJ, Rauh MJ, Kaminski TW, Underwood FB. Star Excursion Balance Test as a predictor of lower extremity injury in high school basketball players. J Orthop Sports Phys Ther 2006;36(12):911-919. doi:10.2519/jospt.2006.2244
60. Hertel J. Sensorimotor deficits with ankle sprains and chronic ankle instability Clin Sports Med 2008;27(3):353-370. doi:10.1016/j.csm.2008.03.006
61. Cleland JA, Mintken PE, McDevitt A, et al. Manual physical therapy and exercise versus supervised home exercise in the management of patients with inversion ankle sprain: a multicenter randomized clinical trial. J Orthop Sports Phys Ther 2013;43(7):443-455. doi:10.2519/jospt.2013.4792
62. Whitman JM, Cleland JA, Mintken PE, et al. Predicting short-term response to thrust and nonthrust manipulation and exercise in patients post inversion ankle sprain. J Orthop Sports Phys Ther. 2009;39(3):188-200. doi:10.2519/jospt.2009.2940
63. de Souza MV, Venturini C, Teixeira LM, Chagas MH, de Resende MA. Force-displacement relationship during anteroposterior mobilization of the ankle joint. J Manipulative Physiol Ther 2008;31(4):285-292. doi:10.1016/j.jmpt.2008.03.005
64. Venturini C, Penedo MM, Peixoto GH, Chagas MH, Ferreira ML, De Resende MA. Study of the force applied during anteroposterior articular mobilization of the talus and its effect on the dorsiflexion range of motion. J Manipulative Physiol Ther 2007;30(8):593-597. doi:10.1016/j.jmpt.2007.08.002
65. Sanjay M, Bommireddy B, Umamahesh M. Ultasound guided management of ankle sprain. Int J Res Orthop 2018;4(4):591. doi:10.18203/ issn.2455-4510.IntJResOrthop20182508
66. Cottrell JA, Turner JC, Arinzeh TL, O’Connor JP The biology of bone and ligament healing. Foot Ankle Clin 2016;21(4):739-761. doi:10.1016/ j.fcl.2016.07.017
67. Hubbard TJ, Cordova M. Mechanical instability after an acute lateral ankle sprain. Arch Phys Med Rehabil 2009;90(7):1142-1146. doi:10.1016/ j.apmr.2009.01.020
68. Konradsen L, Magnusson P Increased inversion angle replication error in functional ankle instability Knee Surg Sports Traumatol Arthrosc. 2000;8(4):246-251. doi:10.1007/s001670000124
69. Hubbard T Ankle sprain: pathophysiology, predisposing factors, and management strategies. Open Access J Sports Med 2010:115. doi:10.2147/ oajsm.s9060
70. Vuurberg G, Hoorntje A, Wink LM, et al. Diagnosis, treatment and prevention of ankle sprains: update of an evidence-based clinical guideline. Br J Sports Med. 2018;52(15):956-956. doi:10.1136/bjsports-2017-098106
71. Kemler E, van de Port I, Schmikli S, Huisstede B, Hoes A, Backx F. Effects of soft bracing or taping on a lateral ankle sprain: a non-randomised controlled trial evaluating recurrence rates and residual symptoms at one year. J Foot Ankle Res. 2015;8:13. doi:10.1186/s13047-015-0069-6
Annemieke
D. Corbitt1a , William D. Bandy1
1 Department of Physical Therapy, University of Central Arkansas
Keywords: elbow, ulnar collateral ligament, cheerleader, weight-bearing https://doi.org/10.26603/001c.120900
Ulnar collateral ligament (UCL) injury is a common elbow injury among overhead athletes, particularly baseball pitchers. However, limited research exists for non-throwing athletes, especially regarding rehabilitation. The purpose of this case report is to illustrate the use of early weight-bearing activities into the rehabilitation protocol for non-operative management of athletes with a UCL injury.
The subject was a 17-year-old female competitive cheerleader Two weeks prior, during the performance of an acrobatic skill in which she transitioned to full upper extremity (UE) weight-bearing, she sustained an injury to her right elbow Physical therapy examination findings indicated a diagnosis of a UCL sprain. Self-reported outcome measures revealed a FOTO score of 69/100 and a Quick Dash score of 43/100. The subject attended 14 therapy sessions over nine weeks to address physical function and performance, which were assessed at intervals during her therapy program. Rehabilitation consisted of therapeutic exercise for the progression of UE functional weight-bearing including planks, ball push-ups, handstands, crab walks, stool pulls, handstand walks, and UE plyometric jumps.
Along with documented improvement of the standard musculoskeletal examination measures of range of motion, strength, and functional performance, the subject demonstrated no elbow instability and improved FOTO and Quick Dash scores of 98 and 0, respectively. The subject demonstrated 105% limb symmetry index with the return to sport (RTS) UE functional testing of one-armed seated shot-put throw (SSPT) and achieved normative values with the closed kinetic chain upper extremity stability test (CKCUEST).
This case report highlights the successful treatment of a subject with a UCL injury and the integration of therapy interventions with a focus on UE weight-bearing. Further research on performing high level UE weight-bearing activities during rehabilitation and RTS guidelines is needed.
Corresponding Author: Annemieke
D. Corbitt, PT, DPT, OCS
PTC 313
Department of Physical Therapy
201 Donaghey Ave. Conway, AR 72035
Fax 501-450-5822
Phone 501-336-7346
Email acorbitt@uca.edu
Ulnar collateral ligament (UCL) injury is a common elbow injury among overhead athletes, particularly baseball pitchers; however, limited research exists for non-throwing athletes.1 While the understanding of UCL pathology is most robust in the specific context of repetitive valgus loading of the ligament during the throwing motion, other sporting activities can impart stress on the medial elbow which places the UCL at risk for injury 2 Therefore, UCL pathology is not limited to pitchers and does occur in other sport populations, primarily those classified as contact sports.
Contact sports, however, exclude a large population of athletes encompassed in upper extremity weight-bearing (UEWB) competition, including gymnastics and cheerleading. A retrospective study of UCL injury among athletes in the National Collegiate Athletic Association (NCAA) from 2009-2014 revealed “ a high rate [not defined] of UCL injury exists in non-throwing sports populations” with little data regarding return to play criteria. The statistics from that study indicate 76.1% of the documented UCL injuries occurred during contact-related sports as compared to 23.1% that were classified as related to throwing sports as the mechanism of injury.3 Another study evaluating UCL epidemiology reviewed a consecutive series of 136 UCL injuries sustained during sport at a single institution over a 16-year period of time.1 These results indicated that 26.7% of the sustained injuries occurred in athletes that were participating in non-throwing sporting activities including gymnastics, cheerleading, mixed martial arts, and football. A problem exists with athletes being rehabilitated with nonsport-specific evidence and recommendations.
The UCL is the primary restraint to valgus loads across the elbow. The ligament is composed of three bundles- the anterior oblique, posterior oblique, and transverse. The anterior oblique bundle is the strongest of the three and composed of two bands: the anterior, which is the primary valgus stabilizer with the elbow in 30-90 degrees of flexion and the posterior, which is the primary valgus stabilizer with the elbow in 90-120 degrees of flexion.4 The anterior oblique bundle originates on the medial epicondyle of the humerus and inserts on the sublime tubercle of the proximal ulna. In throwing athletes, UCL injuries are noted to be chronic, attritional stress related injuries. In contrast, a non-throwing athlete’s mechanism of injury is more consistent with an acute, traumatic incident.2 The differences between throwing and non-throwing athletes reflects a distinct subset of UCL pathology, often with different prognostic implications. The acute traumatic injuries sustained by non-throwers often induce a partial injury or complete tear of the ligament at a single site, compared to the more common attritional tear patterns seen in throwing athletes.2 These structural differences attributable to the nature of the injury lead to different treatment options, both non-surgically and surgically
For high-demand overhead athletes, surgical management is often recommended for complete and partial tears or following failed conservative therapy as a way to effectively return athletes to their preoperative level of play. In fact, research shows that over the past 15 years, a significant increase has been noted in UCL reconstruction.5 Although outcomes after surgery have been favorable with the throwing athlete, UCL reconstruction usually requires at least 10 to 16 months for full recovery with potential surgical risks and complications, such as fracture, inadequate healing, and nerve injury.6
Swindell et al5 noted that nonsurgical treatment of UCL injuries may be helpful among non-throwing athletes (what is termed “lower demand populations”) as well as highdemand overhead athletes suffering from partial tears and sprains found on MRI examination. In addition, Cain et al7 report that nonoperative treatment of UCL injuries is generally indicated in non-throwing athletes with acceptable results. In a case report including five Division 1 collegiate gymnasts with UCL injuries, four out of five were able to return to a component (limited to event specialists at this higher competitive level) of competitive gymnastics following a structured rehabilitation program.8
Currently, the focus of conservative therapy primarily revolves around rest, anti-inflammatory medication, immobilization under certain conditions, and structured rehabilitation protocols. Few studies have been published detailing the nonsurgical treatment options currently utilized in practice for UEWB athletes. Furthermore, return to sport (RTS) criteria largely focuses on open chain activities such as throwing for speed, accuracy, and distance with UCL integrity analysis and only minimal emphasis on weightbearing capabilities. Clinical commentaries based on expert opinion to guide decision making on RTS for upper extremity (UE) athletes have been suggested but these documents lack standardized scoring, classifications, and testing criteria.9 This lack of evidence-based data on RTS limits therapists’ prognoses for a large population of athletes.
In general, nonsurgical physical therapy rehabilitation consists of three phases: (1) reduction of inflammation and restoration of ROM, (2) progressive muscle strengthening and endurance, and (3) gradual RTS.5 Swindell et al5 indicated most protocols in nonsurgical rehabilitation accomplish RTS through an interval-throwing program, which would not be used with non-throwing athletes. Unfortunately, no other structured exercise program has been referenced or documented for UEWB athletes to ensure success with RTS criteria. Therefore, the purpose of this case report is to illustrate the use of early weight-bearing activities into the rehabilitation protocol for non-operative management of athletes with a UCL injury The authors hope that this will encourage further research in this population regarding RTS testing.
The subject was a 17-year-old right hand dominant female who participated in both competitive and high school cheerleading. The case report was successfully reviewed for
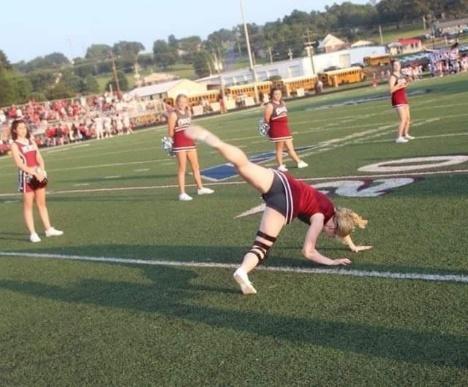
IRB exemption to allow publication, which included informed assent for the subject and consent for the subject’s mother through the University of Central Arkansas Institutional Review Board. The subject presented with a twoweek history of medial elbow pain following a sports injury The injury occurred during the performance of an acrobatic skill (Arabian), where the subject performed the following mobility sequence: exited a twisting flip, landed on a single lower extremity, transferred weight to the opposite lower extremity, and then proceeded to place both hands on the artificial turf (football field) to perform a round off. While entering the round off, she experienced what she described as a “crackle” of her elbow. During this skill, she is transferring weight from her initial contact hand (right) to the other hand (left) with bilateral lower extremities extended in the air (Figure 1). She denied feeling a distinct “pop” in her right elbow but expressed a sense of instability, prompting her to discontinue the remaining tumbling pass to avoid further and potential catastrophic injury She had immediate pain and resultant swelling with ecchymosis at medial elbow and her symptoms were addressed by the athletic trainer on site. The subject utilized an ice pack and kinesiology tape (KT), per the trainer’s recommendation, and refrained from any weight-bearing activities for the remainder of the sporting event. She chose to not pursue any additional medical treatment or imaging and was managed by the athletic trainer with modalities for two weeks prior to her self-referral for a physical therapy evaluation.
The examination was performed by a board-certified orthopedic clinical specialist with 10 years of physical therapy experience. Additionally, the physical therapist was a 15-year veteran gymnastics coach. A physical examination followed the subjective history and screening, which included a systems review and upper quarter screen indicating no other concerns. The subject had normal body mass index, age-appropriate vitals, and only musculoskeletal system involvement noted. The subject did have a his-
tory of a successful anterior cruciate ligament reconstruction two years prior but no other medical history of significance.
The physical examination was tailored to the subject’s tolerance, based on the severity and behavior of symptoms and focused on obtaining an appropriate diagnosis. Elements of the physical examination included inspection, palpation, range of motion (ROM), flexibility, soft tissue mobility, strength, and special tests. Joints above and below the noted injured area were cleared during the upper quarter screen. The subject expressed no pain at rest but maintained right elbow and shoulder adducted with 90 degrees of elbow flexion in a guarded position. The subject had two previously applied strips of KT tape in place on the right medial elbow and with removal, demonstrated mild skin irritation and hypersensitivity to touch. Mild residual swelling was present at medial epicondyle but no ecchymosis during the initial examination. Photographic evidence of moderate ecchymosis after the initial soft tissue trauma is presented in Figure 2
The subject demonstrated full pain-free active range of motion (AROM) for bilateral elbow flexion and extension, forearm supination and pronation, with +5 degrees of passive hyperextension on the right compared to +1 degrees on the left. The subject demonstrated slight weakness and no pain with resistance testing of the elbow flexors, forearm pronators, and wrist extensors on the right; however, moderate weakness with minimal pain of the elbow extensors, forearm supinators, and wrist flexors on the right. Bilateral shoulder and left upper extremity strength testing revealed no deficits with resistance in all planes of movement. Hand dynamometry for mass grasp revealed 58 lbs. on the right (dominant) upper extremity and 55 lbs. with left (non-dominant) upper extremity. She exhibited facial grimacing and
apprehension with dynamometer strength testing but indicated no significant pain.
Orthopedic special tests were selected based on the hypotheses developed during the subject interview and with the previous objective findings. Findings included a positive valgus stress test, positive moving valgus stress test, and negative varus stress test. Neurovascular screen was unremarkable with appropriate sensation to light touch and no neural tension present for bilateral upper extremities. Return to sport UE functional testing was deferred at this time due to acuteness of injury. These tests would have consisted of Closed Kinetic Chain Upper Extremity Stability Test (CKCUEST) and the Seated Shot-Put Test (SSPT) both of which have well established reliability and validity 9
Patient-reported outcome measures were selected to adequately capture the subject’s perception of her functional status. In addition, these outcome measures are responsive to individual patient preferences, needs and values, and assist to guide clinical treatment decisions. The subject completed a self-report outcome measure with Focus on Therapeutic Outcomes (FOTO) with a score of 69/100, with 100 established as the highest functioning level without limitations. Administration of the Quick Dash resulted in a raw score of 43/100, on a scale ranging from 0 (no disability) to 100 (most severe disability). Both FOTO and Quick DASH were utilized to assess functional outcomes with documented reliability,10‑12 per the clinic’s policies and procedures.
DIAGNOSIS/PROGNOSIS
Clinical decision making and development of a hypothesis began with the subject profile, location of symptoms, and reported mechanism of injury Questioning during the interview and findings of the physical examination refined the hypothesis. The physical therapist’s diagnosis based upon clinical experience was a potential grade II UCL sprain, as evident by presentation and performance of ligamentous valgus instability test with positive findings of joint space opening.13 Alternative hypotheses and differential diagnoses included acute fractures, radio-humeral contusion, and radial head subluxation which were ruled out with further tests and measures. With reference to the International Classification of Function and personal goals, the subject, parent, and therapist discussed a non-surgical rehabilitation approach with a goal of return to sport participation, with no need for outside referral at that time and to initiate physical therapy
The subject attended 14 physical therapy sessions over the course of nine weeks. Additionally, the subject participated in independent and modified workouts with the subject’s designated sports team, developed by the physical therapist. The initial goal for the chosen interventions was to reduce pain, improve functional movement, and restore strength at the elbow Subsequent goals were to achieve desired and functional strength for weight-bearing activities and RTS. The subject was scheduled to attend colle-
giate try-outs in a few months and participate in a world cheerleading competition in six months. Treatment sessions included interventions consisting of manual therapy, therapeutic exercise, therapeutic activity, neuromuscular re-education, and standard modalities as needed.
Manual therapy in the initial phase of treatment consisted of soft tissue mobilization and friction massage to reduce adhesions, improve blood flow, and reduce pain. Interventions designed for neuromuscular re-education included proprioceptive and stability training. Therapeutic exercise consisted of graded exposure with ROM, endurance activities, strength training, and the inclusion of blood flow restriction (BFR) with the Delfi Personalized Tourniquet System (Owens Recovery Science, San Antonio, TX). Therapeutic activity included functional weight-bearing components as well as dynamic movements of lifting, carrying, jumping, and return to sport- specific training. The modalities selected for this subject included interferential current (IFC), cryotherapy with cold packs, and self-application of ice massage as needed.
This impairment-based approach was not based on a set protocol, due to lack of supporting research for a weightbearing subject, but tailored to the individual subject based on examination findings and desired functional goals. Interventions were modified based on current/daily status, delayed onset muscle soreness, physical activity performed outside of the clinic, and physical capabilities. Both the subject and guardian agreed with established goals and designated treatment plan of care.
The initial evaluation consisted of a one-hour session which included a subject interview, physical examination, treatment interventions, and the prescription of a detailed home exercise program. The subsequent 30-45-minute sessions consisted of hands-on assessment and interventions as described above. Table 1 includes a broad description of the treatment program. In addition to the in-clinic treatment sessions, the subject performed independent exercises daily as part of a home exercise program and inclusion of previous cardio and core fitness routine. The intensity of each session was monitored and adjusted based on the subject’s symptoms and numerical pain rating.
Weight-bearing exercises for the upper extremity come in a variety of forms and levels of difficulty, beginning with a standing weight shift with palms on a support surface or static quadruped hold and progressing through plank positions to inverted push-up positions. These aforementioned exercises, however, are not challenging enough for high-level weight-bearing athletes who necessitate additional sports specific training requiring more creativity with implementation. The focus on upper extremity weight-bearing exercises can be beneficial for overall strength and stability with the general athlete. However, for these unique athletes, more advanced weight-bearing exercises are vital to return to their perspective sport and safety with performance of acrobatic skills.
The progression of weight-bearing was discerned in parallel with the subject’s response to treatment interventions
• Creation of HEP
• Shoulder/Elbow Isometrics
• Rhythmic Stabilization-open chain perturbations
• Scapular Stabilization/Strengthening
• Elbow resisted AROM
• UE Weight Shifts standing beside plinth
• BFR-Wrist Ulnar Deviation and UBE
• Shoulder RC strengthening with resistance bands
• Scapular strengthening with resistance bands
• Rhythmic Stabilization-UE weight-bearing at wall with perturbations
• Weight-bearing-wall push ups
• Resisted wrist flexion
• Weight-bearing triceps dips
• Resisted forearm supination/pronation with therabar
• BFR-UBE, resisted wrist ulnar deviation, resisted wrist flexion/extension
• PNF diagonal strengthening with resistance bands
• Scapular strengthening with resistance bands
• Open chain resisted stabilization- alphabet with resistance bands
• Rhythmic Stabilization- overhead ball bouncing to wall
• Quadruped weight-bearing on plinth
• Weight-bearing plinth push ups
• Resisted elbow flexion
• Resisted wrist flexion
• Resisted forearm supination/pronation with therabar
• BFR- weighted wrist roller for flexion and extension; UBE
• Rhythmic Stabilization-overhead ball bouncing to wall with various angles
• Weight-bearing plinth push-ups on small physio ball
• PNF diagonal strengthening with resistance bands
• Open chain resisted stabilization- alphabet with resistance bands
• Ulnar nerve glides
• Isokinetic elbow flexion/extension
• Weighted ball throws
• Plank hold with weight shift and tennis ball catches (Figure 3)
• BOSU ball plank lateral walk overs
• UE weight-bearing “wheelbarrow” timed holds
• Elevated LE with UE weight-bearing- various positions and time
• BFR- “skull crushers”, resisted wrist roller, UBE
• Rhythmic Stabilization-overhead ball bouncing to wall with various angles
• UE wall resisted clock taps with blaze pods
• Push-ups with LE elevated-on physio ball
• PNF diagonal strengthening with resistance bands
• BOSU ball push-ups with elevation “jump” (Figure 4)
• Scapular strengthening with resistance bands
• Cable column- elbow flexion
• Cable column- elbow extension
• Partial body weight triceps dips
• Weighted ball throws and catches
• UE weight transfer with basic tumbling (cartwheels, round offs)
• Shuttle plyo jumps with UE
• UE “wheelbarrow” stool pulls (Figure 5)
• Crab walk, bear crawl
• BFR-incline push-ups, UBE
• Modified HEP
• UBE
• UE “wheelbarrow” stool pulls with longer lever
• Weighted ball throws and catches
• Plyometric push-ups
• Crab walk, bear crawl
• UE weight transfer with basic tumbling (cartwheels, round offs)
• Rhythmic Stabilization-oscillating therabar at various angles
• UE weight shifts on floor with blaze pods
• UE weight-bearing with handstand against wall holds (Figure 6)
• Inverted UE weight-bearing with handstand mini push ups
• Bosu- push-ups and walk overs
• Cable column- elbow flexion
• Cable column- elbow extension
• ¾ body weight triceps dips
• BFR-skull crushers
• UE return to sport testing
• UE “wheelbarrow” stool pulls
• Weighted ball throws and catches
• Plyometric push-ups
• Crab walk, bear crawl
• Cheer stunt work- weighted overhead presses; weighted ball throws
• Assisted/spotted tumbling on air floor (back handspring, back walk over)
• Supported handstand walks (Figure 7)
• BOSU platform push ups
• Cable column- elbow flexion
• Cable column- elbow extension
• Cable column- rows
• Cable column- bow and arrow
• Rebounder- UE plyo jumps
• Modified hanging pull-ups
• ¾-full body weight triceps dips
• BFR-weighted ball presses
• Creation and performance of HEP for D/C
• UE “wheelbarrow” stool pulls with 1 LE extended in air
• Weighted ball throws and catches
• Plyometric push-ups
• Crab walk, bear crawl
• Performance of traveling tumbling on air floor; spotted with standing tumbling
• Supported handstand walks
• BOSU platform push-ups
• BOSU- push up and walk overs
• Cable column- elbow flexion
• Cable column- elbow extension
• Cable column- rows
• Cable column- bow and arrow
• Rebounder- UE plyo jumps
• ¾-full body weight triceps dips
• UE return to sport testing
Abbreviations: AROM-Active Range of Motion; BFR-Blood Flow Restriction; D/C- Discharge; HEP- Home Exercise Program; LE- Lower Extremity; PNF- Proprioceptive Neuromuscular Facilitation; RC- Rotator Cuff; UBE-Upper Body Ergometer; UE-Upper Extremity **Weekly progressions with increased resistance, reps, duration, hold time and weight acceptance on UEs
and daily visual re-assessments and a broad overlay of interventions is presented in Table 1. The subject was initiated with light UE weight shifts in standing in week one for joint approximation, biofeedback, kinesthetic awareness, muscle engagement, and joint mobility These exercises were a prelude to additional weight acceptance with perturbations and performance of wall push-ups and limited range triceps dips in week two. By week three, the subject was able to sustain additional weight through her UEs with quadruped activities and inclined push-ups. Week four was pivotal with majority of her exercises performed in a weight-bearing position; these exercises consisted of various angles of weight acceptance on upper extremities, lateral shifts to unilateral UE support, increased duration, and dynamic integration of exercise games (Figure 3).
With the steady advancement demonstrated by improved tolerance to exercise duration and additional weight-bearing, the focus of therapy shifted to the subject’s tolerance of transitions to other weight-bearing positions.
Although she could withstand 30 seconds of a handstand (UE weight-bearing) position, she had difficulty with the quick transition into this position, which is essential with tumbling. Cheerleaders need to be able to withstand the quick impact and joint force that is a result of tumbling. The amount of force generated by a cheerleader during tumbling can vary based on factors such as the athlete’s speed of movement, body mass, technique, and the level of skill being performed. Tumbling involves rapid and dynamic movements and the force exerted is influenced by the acceleration and deceleration of the body. At this point, she was unsafe to pursue any higher-level tumbling, requiring these quick unweighted to weighted positions; however, with implementation of week five exercises (Figures 4-5), she exhibited continued positive strides in her rehabilitation plan.
With week six and facilitation of a re-evaluation, the subject was noted to have successfully passed the RTS testing for UE involvement, although the practitioner did not
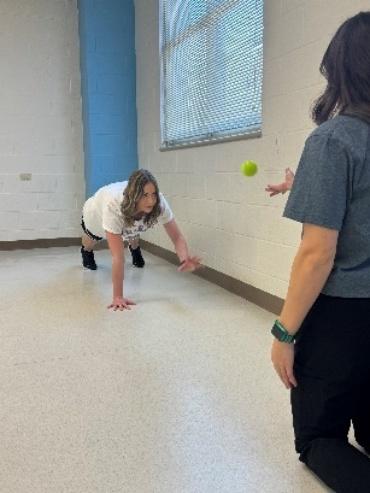
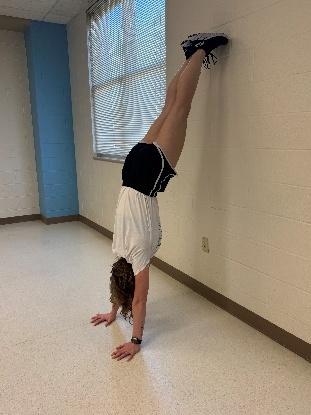
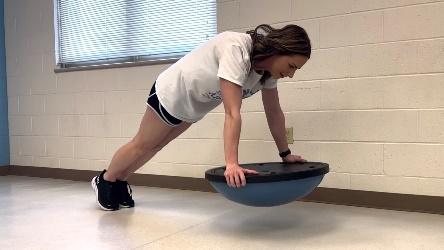
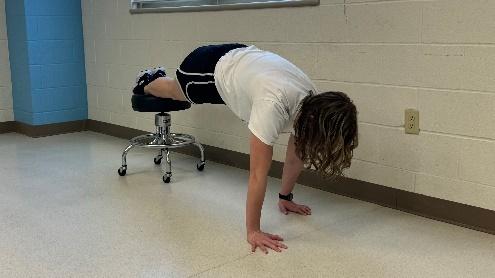
clear her for full return to sports due to the remaining deficits of unweighted to weighted UE activities and the subject’s lack of confidence with release to full activity. The
subject continued with previous UEWB exercises and progressed with weight acceptance focus and UE plyometric activity With the subject’s transition to less clinical appointments and additional hours with sports specific training at cheer practice, she was able to have more isolated training in her therapy sessions. These sessions included shock absorption during transitional movements while receiving education on proper technique, strength, and conditioning to handle the desired higher-level skills (Figures 6-7).
With the early initiation of weight-bearing exercises that increased in both difficulty and duration, the subject was able to return to full sports participation with her advanced tumbling skills on padded surfaces (as required for her participation with competitive cheerleading) within the anticipated three-month timeline. Traditional sports rehabilitation for a UCL injury primarily focuses on shoulder and scapular strengthening with open-chain UE activities. This individualized treatment program focused on more dynamic exercise interventions, as evident by the abundance of weight-bearing exercises. Using functional, sport specific, weight-bearing activities, the subject was more invested and confident during interventions and exhibited a more successful outcome.
Within the first week of treatment, the subject was able to resume and perform daily tasks (writing, grooming, bathing) with little to no difficulty or complaint of pain. Following the second week of therapy, the subject reported discomfort only with more challenging daily tasks (i.e. opening a door with full triceps extension) or with inadvertent performance of quick UE cheer motions. Within the
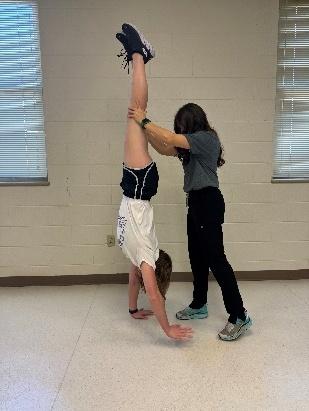
Figure 7. Supported handstand walks.
third week of therapy, the subject was able to participate with UE motions during cheerleading and perform non-UE weighted acrobatic movements without difficulty. By weeks four and five, the subject was able to resume basic cheerleading tumbling activities but had mild discomfort with full elbow extension activities.
At six weeks, the subject was re-evaluated and demonstrated improved self-reported FOTO and Quick Dash scores of 83 (improvement by 14) and 34 (improvement by 9), respectively She reported a 2/10 pain rating (utilizing the numerical pain scale) during performance of tumbling but 0/10 pain at rest. During this reassessment, the subject demonstrated 80% limb symmetry index with the RTS UE functional testing of one-armed SSPT and 25 touches with the CKCUEST Previous literature indicated the average touches were 22.5 for college football players,14 25 for healthy adolescents,15 and 30 for college baseball players.16 To date, variance is noted with researchers and no data exists for cheerleaders or gymnasts to assist a clinician with acceptable RTS status. Additional assessment exhibited a negative valgus stress test with lack of instability detected but she did report mild discomfort. Both PROM and AROM were near symmetrical with no deficits noted. She demonstrated no pain or weakness with resisted testing of right UE with the exception of right elbow extension which exhibited mild weakness. Dynamometer grip strength was not reassessed. She was limited with upper extremity full weight-bearing tolerance to 30 seconds before having deficits with strength tolerance and discomfort.
Based on these findings, continued skilled physical therapy intervention was recommended with frequency reduced to one day a week in the clinic and implementation of more sports-specific integration with competitive cheer coach and school athletic trainer. A detailed plan was provided
to these individuals with acknowledgement of communication and collaboration demonstrating desired therapeutic alliance.
With the reduction of therapy sessions, the subject was able to implement additional cardiovascular and core programs previously performed which assisted in the therapy plan. Following week seven, the subject focused on psychological readiness and was self-monitoring her abilities and fatigue with implementation of sports specific training. During week eight, the client had returned to more advanced tumbling skills but was hesitant with standing weight-bearing skills (specifically the standing back handspring) due to more prolonged weight acceptance on upper extremities. Modifications were addressed with her competitive and school cheer teams to avoid these skills and more focus in therapy was placed on duration in UE weightbearing and quick transitions to this positioning.
At week nine, the client was re-evaluated and demonstrated no elbow pain, instability, ROM, or strength deficits. Through the functional self-report questionnaires, she rated her abilities as 98 on FOTO and 0 on Quick Dash; this calculated score achieved the desired minimal clinical improvement differential. She performed the UE functional RTS (CKCUEST) testing and scored at 105% with her dominant, injured UE. Additionally, she was able to tolerate approximately one minute of prolonged UE weight-bearing, sufficient for her to return to all routine tumbling sports participation. At this time, she was performing her most advanced tumbling skills on surfaces that provided spring assist (rod floor and Tumble Trak®) with no need to perform on the ground with completion of football season.
The purpose of this case report was to describe an innovative approach to rehabilitation of an UEWB athlete, who achieved full return to sports following a UCL injury To the authors’ knowledge, limited research exists supporting return to sports for this unique athlete population which impedes prognosis and professional consensus regarding rehabilitative approach. Presently, the only recommendation provided in the literature for non-throwing athletes with non-operative UCL injury is an individualized rehabilitation program with reassessment of the athlete’s pain with valgus stress once they have reached their baseline performance metrics and prior to return to play 17 Additional studies indicate the need for an evidence-based nonoperative protocol and consensus for the treatment of UCL injuries in UEWB athletes.18 Unfortunately, no specific testing exists to determine readiness both physically and psychologically to develop more sports specific protocols. This multimodal treatment approach that highlights progressive loading of the upper extremity was beneficial for this subject. The tailored treatment plan combined with the subject’s motivation was successful with restoration of UCL stability With the recommended non-operative UCL rehab of traditional focus on rotator cuff and periscapular strengthening combined with more sport specific gradual
weight-bearing activities, this athlete was able to progress to full weight acceptance and return to sport demands. Although this case report demonstrates positive outcomes for one UEWB athlete with a UCL injury, this rehabilitation program may or may not be beneficial for additional UEWB athletes with an upper extremity injury with moderate impairment deficits. While speculation may exist that the results were due to the implementation of sports specific weight-bearing activities, determining the true causeand-effect relationship of interventions to outcomes is not possible in a case report.
This case report highlights the successful treatment of an upper extremity weight-bearing athlete with a UCL injury after integration of various treatment interventions with a focus on progressive UE weight-bearing. Further research is imperative regarding the non-operative rehabilitation of athletes who perform high level UEWB activities as a part of their sport as well as more in-depth study of return to sport testing.
Submitted: February 14, 2024 CDT, Accepted: June 17, 2024 CDT
©
The Author(s)
This is an open-access article distributed under the terms of the Creative Commons Attribution 4.0 International License (CCBY-NC-4.0). View this license’s legal deed at https://creativecommons.org/licenses/by-nc/4.0 and legal code at https://creativecommons.org/licenses/by-nc/4.0/legalcode for more information.
1. Zaremski JL, McClelland J, Vincent HK, Horodyski M. Trends in sports-related elbow ulnar collateral ligament injuries. Orthop J Sports Med. 2017;5(10):2325967117731296. doi:10.1177/ 2325967117731296
2. Ramos N, Limpisvasti O. UCL injury in the nonthrowing athlete. Curr Rev Musculoskelet Med 2019;12(4):527-533. doi:10.1007/s12178-019-09590-2
3. Li NY, Goodman AD, Lemme NJ, Owens BD. Epidemiology of elbow ulnar collateral ligament injuries in throwing versus contact athletes of the national collegiate athletic association: Analysis of the 2009-2010 to 2013-2014 seasons. Orthop J Sports Med 2019;7(4):1-6. doi:10.1177/2325967119836428
4. Erickson BJ, Chalmers PN, Bush-Joseph CA, Verma NN, Romeo AA. Ulnar collateral ligament reconstruction of the elbow Orthop J Sports Med Published online December 2015:1-7. doi:10.1177/ 2325967115618914
5. Swindell HW, Trofa DP, Alexander FJ, et al. Nonsurgical management of ulnar collateral ligament injuries. J Am Acad Orthop Surg Glob Res Rev 2021;5(4). doi:10.5435/JAAOSGlobal-D-20-00257
6. Cascia N, Picha K, Hettrich CM, Uhl TL. Considerations of conservative treatment after a partial ulnar collateral ligament injury in overhead athletes: A systematic review. Sports Health. 2019;11(4):367-374. doi:10.1177/1941738119853589
7 Cain EL Jr, Dugas JR, Wolf RS, Andrews JR. Elbow injuries in throwing athletes: A current concepts review. Am J Sports Med. 2003;31(4):621. doi:10.1177/ 03635465030310042601
8. Nicolette GW, Gravlee JR. Ulnar collateral ligament injuries of the elbow in female division I collegiate gymnasts: A report of five cases. Open Access J Sports Med 2018;9:183-189. doi:10.2147/OAJSM.S159624
9. Barber P, Pontillo M, Bellm E, Davies G. Objective and subjective measures to guide upper extremity return to sport testing: A modified delphi survey Phys Ther Sport. 2023;62:17-24. doi:10.1016/ j.ptsp.2023.05.009
10. Gummesson C, Ward MM, Atroshi I. The shortened disabilities of the arm, shoulder and hand questionnaire (QuickDASH): Validity and reliability based on responses within the full-length DASH. BMC Musculoskelet Disord 2006;7:44. doi:10.1186/ 1471-2474-7-44
11. Beaton DE, Wright JG, Katz JN, Upper Extremity collaborative group. Development of the QuickDASH: Comparison of three item-reduction approaches. J Bone Joint Surg Am 2005;87(5):1038-1046. doi:10.2106/JBJS.D.02060
12. Guyatt GH, Osoba D, Wu AW, Wyrwich KW, Norman GR. Methods to explain the clinical significance of health status measures. Mayo Clin Proc. 2002;77(4):371-383. doi:10.4065/77.4.371
13. Dutton M. Orthopedic Examination, Evaluation, and Intervention Sixth. McGraw Hill; 2023.
14. Pontillo M, Spinelli BA, Sennett BJ. Prediction of in-season shoulder injury from preseason testing in division I collegiate football players. Sports Health 2014;6(6):497-503. doi:10.1177/1941738114523239
15. de Oliveira VMA, Pitangui ACR, Nascimento VYS, et al. Test-retest reliability of the closed kinetic chain upper extremity stability test (CKCUEST) in adolescents: Reliability of CKCUEST in adolescents. Int J Sports Phys Ther 2017;12(1):125-132.
16. Roush JR, Kitamura J, Waits MC. Reference values for the closed kinetic chain upper extremity stability test (CKCUEST) for collegiate baseball players. North Am J Sports Phys Ther 2007;2(3):159-163.
17. Vaswani R, White A, Dines J. Medial ulnar collateral ligament injuries in contact athletes. Curr Rev Musculoskelet Med 2022;15(6):474-482. doi:10.1007/s12178-022-09785-0
18. Clark NJ, Desai VS, Dines JD, Morrey ME, Camp CL. Nonreconstruction options for treating medial ulnar collateral ligament injuries of the elbow in overhead athletes. Curr Rev Musculoskelet Med 2018;11(1):48-54. doi:10.1007/s12178-018-9458-3
Ayrton MOIROUX--SAHRAOUI1,2,3 , Florian FORELLI1,2,3,4a , Jean MAZEAS1,2 , Alexandre JM RAMBAUD4,5 , Andreas BJERREGAARD6 , Jérôme RIERA7,8
1 Orthosport Rehab Center, Domont, France, 2 Orthopaedic Surgery Department, Clinic of Domont, Ramsay Healthcare, @OrthoLab, Domont, France, 3 Physiotherapy School, IPMR, Nevers, France, 4 SFMK Lab, Pierrefite sur seine, France, 5 Physiotherapy School of Saint Etienne, St Michel Campus, Saint Etienne, France, 6 Rehabilitation Department, Aspetar Orthopaedic and Sports Medicine Hospital, Doha, Qatar, 7 University Jean Monnet SaintEtienne, Lyon 1, University Savoie Mont-Blanc, Inter-university Laboratory of Human Movement Biology, EA 7424, F-42023, Saint-Etienne, France, 8 University of Bordeaux, College of Health Sciences, IUSR, 33000, Bordeaux, France
Keywords: arthrogenic muscle inhibition, anterior cruciate ligament reconstruction, early management, quadriceps activation https://doi.org/10.26603/001c.121423
Arthrogenic Muscle Inhibition (AMI) is a phenomenon observed in individuals with joint injury or pathology, characterized by a reflexive inhibition of surrounding musculature, altered neuromuscular control, and compromised functional performance. After anterior cruciate ligament reconstruction (ACLR) one of the most obvious consequences of AMI is the lack of quadriceps activation and strength.
Understanding the underlying mechanisms of AMI is crucial for developing effective therapeutic interventions. The surgical procedure needed to reconstruct the ACL has biochemical et physiological consequences such as inflammation, pain, and altered proprioception. These alterations contribute to the development of AMI.
Therapeutic interventions aimed at addressing AMI encompass a multidimensional approach targeting pain reduction, inflammation management, proprioceptive training, and quadriceps activation. Early management focusing on pain modulation through modalities like ice, compression, and pharmacological agents help mitigate the inflammatory response and alleviate pain, thereby reducing the reflexive inhibition of quadriceps.
Quadriceps activation techniques such as neuromuscular electrical stimulation (NMES) and biofeedback training aid in overcoming muscle inhibition and restoring muscle strength. NMES elicits muscle contractions through electrical stimulation, bypassing the inhibitory mechanisms associated with AMI, thus facilitating muscle activation and strength gains.
Comprehensive rehabilitation programs tailored to individual needs and stage of recovery are essential for optimizing outcomes in AMI.
The objective of this clinical viewpoint is to delineate the significance of adopting a multimodal approach for the effective management of AMI, emphasizing the integration of pain modulation, proprioceptive training, muscle activation techniques, and manual therapy interventions. Highlighting the critical role of early intervention and targeted rehabilitation programs, this article aims to underscore their importance in restoring optimal function and mitigating long-term complications associated with AMI.
Anterior cruciate ligament (ACL) injury is a common sports injury with an incidence rate of up to 250 000 personyears.1 The risk of ACL injuries is significant among adolescent athletes, with approximately 1 injury per 10,000 exposures in female athletes, who are 1.5 times more likely than male athletes to suffer an ACL injury A multisport
female athlete has an approximately 10% risk of ACL injuries during her high school career. Sports such as soccer, basketball, lacrosse, and football pose a particular risk of ACL injuries in adolescents, highlighting the need for targeted interventions to optimize muscle strength and activation.2 ACL injury has long-terms consequences, reducing quality of life and increasing the risk of developing early knee osteoarthritis by sevenfold 3 The most common treat-
Corresponding Author: florian.forelli.mk@gmail.com
ment to ACL injury is a surgical reconstruction of the ligament (ACLR), with nearly 130 000 patients operated on each year in the United States.4 There is evidence that only 55% of patients return to their previous level of sports performance after ACLR.5 Alteration in neuromuscular function is one hypothesis to explain this.6 Evidence shows that quadriceps strength deficit persist for up to two years after ACLR.7 After ACL rupture, there is knee joint effusion and therefore distension which is known to increase the recruitment of type II and type Ib afferent fibers, which have an inhibitory effect on the motoneuron.8 Pain, through the activation of type III and IV nociceptors is also known to inhibit the ability to contract the quadriceps.9 This interruption of afferent input leads to reflexive inhibition at the spinal level, known as arthrogenic muscle inhibition (AMI). AMI reduces both the availability of motor neuron (motor neuron pool)10 and the ability to voluntarily activation motor neurons to a normal extent (central activation failure). This motoneuron pool inhibition is seen at the spinal level. Although AMI typically occurs after ACL rupture, and persists for weeks after surgery, central activation failure has been shown to resolve by 6 months post-surgery and can delay effective progression of rehabilitation.10,11 Persisted AMI may cause strength deficits and, in combination with change in sensorimotor input due to the ligament rupture, causes neuroplastic changes within the motor cortex.12 Several studies show a reduced corticospinal excitability of the quadriceps in the long term after ACLR and return to sport (RTS).11,13 AMI is also thought to initiate quadriceps motor unit catabolism contributing to long term muscle atrophy and strength deficits.13 Quadriceps strength deficits after ACLR are impactful and it is associated with changes in locomotion biomechanics that may initiate the onset of osteoarthritis14,15 Failure to achieve a good level of quadriceps strength symmetry may increase the risk of re-injury.16 AMI has a potential impact on the long-term reduction in quality of life, function, and return to performance rate. Therefore, it is essential to develop an evidence-based treatment strategy for our patients. Our aim is to provide a clinical perspective based on the literature to review evidence regarding therapeutic intervention for AMI after ACLR.
QUADRICEPS LEVELS OF ACTIVATION
The AMI phenomenon is often misunderstood leading to delays or difficulties in rehabilitation and recurrent injuries when returning to sport. Many physiotherapists believe that reaching full active knee extension or quadricipital contraction with superior patellar glide will put an end to the AMI and allow for earlier and more intensive muscle strengthening. This is a common misconception that can lead to knee pain, swelling, and inflammation if the load and modalities of strengthening are not appropriate. Scales that allow clinicians to quantify AMI and/or quadriceps contractility (AMI classification and Rachet Scale, respectively) exist. They suggest a classification to guide thera-
peutic intervention. A grade 0 is defined as normal contraction, grade 1: inhibited contraction with no extension deficit, grade 2 : inhibited contraction with associated knee extension deficit due to hamstrings’ contracture and grade 3 : passive chronic extension deficit due to posterior capsular retraction . 17,18 However, these scales are primarily based on clinical experience, and there is limited evidence regarding their validity and reliability Another concern is that these scales are based on vastus medialis activation only and not on the activity being performed. Many patients can lock their knee in an unloaded state (Rachet Scale)17 or even perform a straight leg raise (SLR) without lag (AMI classification),18 indicating minimal quadriceps activation (figure 1).19‑21 However, adding resistance to exercises may cause a new flexion contracture to appear highlighting inadequate quadriceps activation during the proposed movement.
To prevent this, clinicians must be able to distinguish between three levels of activation (figure 1):
• Minimal activation (SLR without lag with ability to sense quadriceps contraction )
• Adequate activation (full knee extension regardless of activity). It is related to patients’ ability to perform a highly qualitative quadriceps contraction (including patient feedback and sensation control) during specific movement seem to be key indicators in quadriceps activation and strengthening after ACLR
• Fast activation which is related to rate of force development (RFD) is important in the later phase of rehabilitation, particularly during the return to plyometric activities.22‑25
There is a linear interdependent relationship between the three levels of activation. Clinicians should be able to classify patients within these three levels to propose an appropriate treatment strategy, regarding the clinical signs, that aligns with their goal of returning to sports.
AMI is a complex neurophysiological phenomenon but it is important to understand the patient’s perspective. Clinicians need to understand that a patient may regain full extension without necessarily having full quadriceps activation. The evaluation of muscle activation may be a particularly important milestone for detecting the presence of AMI, as the persistence of this problem may hinder the return to sport and increase the risk of recurrence.
In the initial phase of rehabilitation, patients typically report experiencing pain spontaneously and during activity. Pain is commonly perceived on the medial and lateral aspects of the patella. Patients may not consciously perceive the contraction of the quadriceps and may omit it from their description. For instance, when performing exercises such as leg press/extensions or jumps, patients report experiencing painful sensations around the patella without any sensation of quadriceps engagement. Furthermore, patients frequently report experiencing patellar catching and
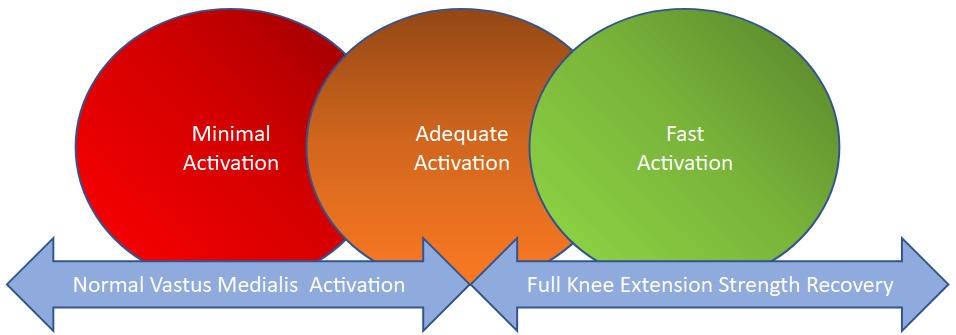
Figure 1. Differentiate various level of quadriceps activity
Image Credit: Inspired from Pr.Nicola Maffiuletti
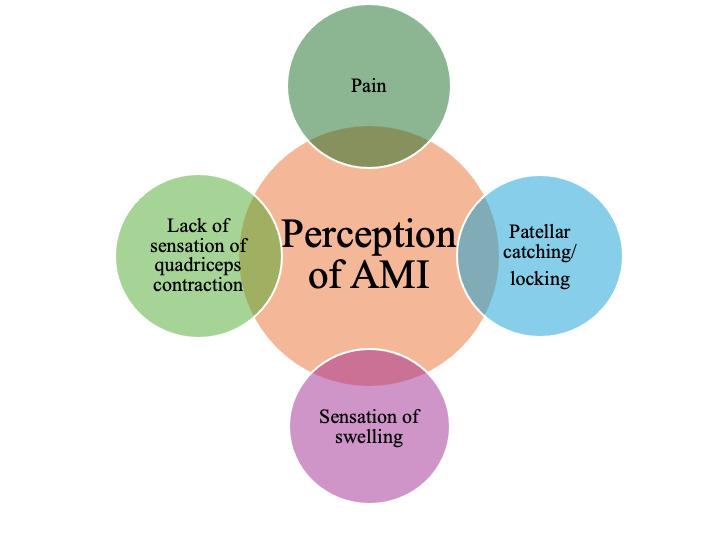
locking, which may indicate impaired knee function (Figure 2).
Various modalities may be considered in the treatment of AMI. Sonnery-Cottet et al. conducted a comprehensive analysis of studies highlighting the effectiveness of quadriceps-based interventions for AMI. Their review encompassed multiple studies, all of which underline significant improvements in quadriceps activation attributed to exercise therapy.26 The efficacy of various modalities, such as blood flow restriction (BFR) training has been shown to have superiority addressing muscle activity.27 BFR may be relevant in the early rehabilitation stage after surgery to prevent loss of muscle mass, strength, and function with lower load on the knee , helping to reduce the consequences of AMI.28,29 Reciprocal inhibition has also been studied, using hamstring fatigue to reduce quadriceps inhibition has
shown some promising results, although based on limited quality evidence.30‑32
It is hypothesized that AMI induces changes in the motor cortex function. Various interventions have been tested with the objective of addressing these changes. For example, training the non-involved limb has been theorized to increase bilateral motor cortices (cross-education therapy (CET)) 30Investigations into CET have been conducted but yielded conflicting findings regarding its impact on quadriceps isometric strength.33‑35 Motor imagery (MI) is another intervention that has been shown to increase excitability and activity of motor neuron within the motor cortex and the spinal cord through mental practice in healthy individual. Although, it is of great interest it has yet to be tested in individuals after ACLR 30
Virtual reality (VR) may create changes in cortical circuits.36 These adaptations can be produced by different VR systems. The simplest of these systems provide sensory feedback, while more immersive systems facilitate learning by placing patients in a motivating environment or by allowing them to learn based on the observation of reality, action, and/or imitation in a modified environment. The primary outcome is an improvement in therapeutic adherence. However, it is uncertain whether there is a significant improvement in the excitability of the motor cortex function, which would reestablish cortical drive to quadriceps motor neurons.30 EMG biofeedback is another modality that has gained increasingly popularity to address motor cortex dysfunction. Real-time biofeedback may help patient better voluntarily recruit specific muscle groups. Visual or auditory guidance are two components found in the literature used to help patient perceive muscle activation during exercise. This may be useful in lack of quadriceps activation due to AMI.37 Also when combined with conventional exercise biofeedback has been shown to be more effective in improving early quadriceps muscle activation than conventional exercise alone.38 Therefore, it could be useful in restoring quadriceps activation in the early stages of reha-
bilitation. It is also postulated that vibration may be beneficial in the treatment of deficiencies associated with AMI.. There is evidence that vibration is a strong stimulus to modulate the central nervous system through the activation of Ia afferents fibers that project on both the spinal cord and supra-spinal structures. When local vibration is acutely applied, a decrease in force-generation capacities has been reported, principally triggered by adaptations within the central nervous system. Thus, local vibration stimuli have the potential to act as a significant neuromuscular workload by inducing some fatigue which, when repeated, could enhancing voluntary recruitment and longterm neural adaptations leading to improved muscle function.30 Indeed, Souron et al shows that local vibration training can increase motor performance through a wide range of training and vibration parameters. While there seems to be a consensus about the neural nature of the induced adaptations, the precise mechanisms of these adaptations at both the spinal and supra-spinal levels remain to be clarified . 39 Sonnery-Cottet et al revealed that vibration has low-quality evidence for efficacy to treat AMI.26 A randomized controlled trial looked at the effectiveness of whole-body vibration and the results are consistent with this evidence. Another randomized controlled trial was conducted to assess the efficacy of local vibration. Local vibration allows to allocate localized stimulus to one or a group of muscles in which vibration is believed to modify the excitability, associated with muscle contraction. Despite the lack of statistical power, the results were found to be promising for increased muscle strength, countermovement jump and sprint which is encouraging.40‑42
Some of the modalities we have already mentioned may also be included in this section. Transcutaneous electrical nerve stimulation (TENS) and neuromuscular electrical stimulation (NEMS) are two modalities that have been studied to determine if they have any effect on AMI. It is theorized that sensory TENS aims to stimulate large-diameter sensory nerves and fibers (Aβ), which results in the presynaptic inhibition of pain signals to the transmission cell (T-cell), and thereby reduce the number of sensory pain signals being transmitted to the brain. Further, excitatory afferent stimuli created by sensory TENS may override the inhibitory signals, which can increase the excitability of the quadriceps motor neuron pool. Previous evidence demonstrates that TENS plays a significant role in managing joint pain.43 When applied before or during exercises, the decreased inhibition creates a window where potential for neuron motor excitability and motor unit is temporarily restored. NMES is a clinical modality that has the potential to prevent quadriceps activation failure and associated muscle atrophy It initiates action potentials in intramuscular nerve branches, resulting in an unvoluntary contraction of the muscle. NMES exogenously stimulates the muscle, large diameter, type II muscle fibers which are thought to be selectively recruited, resulting in a greater potential for muscle force production.11 There is some evidence to support the efficacy of NMES and TENS for AMI following
ACLR.26,35,44 Published by Michael J Toth & al,45 the first study addressing the usefulness of NMES showing a significant impact on muscle contractility The second explored the effect of stimulation of the common peroneal nerve. This intervention shows a significant impact on reducing inhibition and increasing knee extension.45,46 Findings indicate that cryotherapy also demonstrates a degree of effectiveness in treating AMI.47‑50 The application of cryotherapy to the knee joint have been shown to increases EMG activity and isometric strength in the quadriceps immediately after cryotherapy.51,52 Furthermore, compressive cryotherapy has been shown to have a small effect on swelling, pain and medication reduction compared to cryotherapy alone in reduce medical use in the first three days post ACLR.35 Cooling may also reduce the effect of AMI by altering sensory input from receptors in the skin or by reducing presence of pain.10
The management of AMI after ACLR is multifaceted and requires a comprehensive understanding of the various levels of activation, clinical signs, and potential modalities for interventions targeting muscles, brain, and nerves. It is crucial to recognize the complexity of AMI to avoid misconceptions and ensure appropriate rehabilitation strategies.
It is of paramount importance to evaluate quadriceps activation at different levels, including minimal activation, adequate activation, and rapid activation, to tailor rehabilitation programs to the individual patient’s needs and goals, through a shared decision process related to return to sports activities. It is of significant consequence to address patients’ complaints of pain, sensation of patellar catching, and impaired knee function to manage AMI effectively and facilitate successful rehabilitation outcomes.
To resolve any early signs of AMI we propose several muscle-based treatment modalities and AMI targeted interventions, including BFR, CE therapy, hamstring fatigue, and cryotherapy, that have demonstrated promising results in the treatment of AMI. However, further research is required to establish their efficacy conclusively Similarly, cortical interventions, including virtual reality and transcranial magnetic stimulation, have demonstrated potential in modulating cortico-spinal circuits and improving therapeutic adherence. NEMS, TENS, and vibration therapy also seem promising in addressing AMI, and warrant further investigation in order to fully appreciate their effectiveness.
Overall, a comprehensive approach integrating multiple modality interventions targeting muscles, brain, and nerves may offer the most effective management of AMI following ACLR. Future research should focus on elucidating the mechanisms underlying AMI and evaluating the long-term effectiveness of various already existing interventions to optimize functional outcomes and improve patients’ quality of life and return-to-performance rates and delays.
Submitted: May 14, 2024 CDT, Accepted: June 28, 2024 CDT
© The Author(s)
Table 1. Type of intervention according to target structure
Interventions Number of sessions Sets and repetitions
Muscle intervention
BFR training Minimum 2-3 times per week for 8 weeks
Hamstring fatigue exercise 1 time
Brain intervention
Virtual reality 1 time per week for 3 weeks
Crosseducation therapy 3 times per week for 8-24 weeks
EMG
Biofeedback with exercises every day during the first week post ACLR
4 sets of 30-15-15-15 reps of quadriceps target exercises at 30% of predicted 1RM with BFR at 40-80% when muscle exhaustion is achieved
5-minute warm-up exercise of between 70 and 80 RPM + tempo squat until participant RPE was 15 out of 20
15 minutes of bilateral and unilateral knee flexion and extension, bilateral and unilateral quadriceps contraction, bipodal walk
3 sets of 12 repetitions at 60°/s ranging from 10° to 90° flexion
3 sets of 10 repetitions of isometric quadriceps contraction, short arc quadriceps, heel slides, long arc quadriceps
Motor imagery 8-12 times for 6-8 weeks 5 seconds imagining and 5 seconds rest for 10-15 minutes of visualization of muscle contraction
Nerve intervention
NMES 2-5 times per week for 3-6 weeks. Intensity is aim for as max tolerance at least 100mA (200 energy) 60 minutes (5-minute warm-up, 50-minute stimulation session and 5-minute cool down)
2-5 times per week for 3-6 weeks
Cryotherapy 3-4 time per week for 1-2 weeks
Percutaneous electrical stimulation 1 time
3 sets of 6 seconds isometric contraction with electrical stimulation
Note: BFR; blood flow restriction, NMES; neuromuscular electrical stimulation, TENS; transcutaneous electrical stimulation, RPM; revolutions per minute, RPE; rating of perceived exertion
This is an open-access article distributed under the terms of the Creative Commons Attribution 4.0 International License (CCBY-NC-4.0). View this license’s legal deed at https://creativecommons.org/licenses/by-nc/4.0 and legal code at https://creativecommons.org/licenses/by-nc/4.0/legalcode for more information.
1. Chia L, De Oliveira Silva D, Whalan M, et al. Noncontact Anterior Cruciate Ligament Injury Epidemiology in Team-Ball Sports: A Systematic Review with Meta-analysis by Sex, Age, Sport, Participation Level, and Exposure Type. Sports Med 2022;52(10):2447-2467. doi:10.1007/ s40279-022-01697-w
2. Bram JT, Magee LC, Mehta NN, Patel NM, Ganley TJ. Anterior Cruciate Ligament Injury Incidence in Adolescent Athletes: A Systematic Review and Metaanalysis. Am J Sports Med 2021;49(7):1962-1972. doi:10.1177/0363546520959619
3. Webster KE, Hewett TE. Anterior Cruciate Ligament Injury and Knee Osteoarthritis: An Umbrella Systematic Review and Meta-analysis. Clin J Sport Med 2022;32(2):145-152. doi:10.1097/ JSM.0000000000000894
4. Mall NA, Chalmers PN, Moric M, et al. Incidence and Trends of Anterior Cruciate Ligament Reconstruction in the United States. Am J Sports Med 2014;42(10):2363-2370. doi:10.1177/ 0363546514542796
5. Ardern CL, Taylor NF, Feller JA, Webster KE. Fiftyfive per cent return to competitive sport following anterior cruciate ligament reconstruction surgery: an updated systematic review and meta-analysis including aspects of physical functioning and contextual factors. Br J Sports Med 2014;48(21):1543-1552. doi:10.1136/ bjsports-2013-093398
6. Tayfur B, Charuphongsa C, Morrissey D, Miller SC. Neuromuscular Function of the Knee Joint Following Knee Injuries: Does It Ever Get Back to Normal? A Systematic Review with Meta-Analyses. Sports Med 2021;51(2):321-338. doi:10.1007/s40279-020-01386-6
7. Chung KS, Ha JK, Yeom CH, et al. Are Muscle Strength and Function of the Uninjured Lower Limb Weakened After Anterior Cruciate Ligament Injury?: Two-Year Follow-up After Reconstruction. Am J Sports Med 2015;43(12):3013-3021. doi:10.1177/ 0363546515606126
8. Iles JF, Stokes M, Young A. Reflex actions of knee joint afferents during contraction of the human quadriceps. Clin Physiol 1990;10(5):489-500. doi:10.1111/j.1475-097X.1990.tb00828.x
9. Palmieri-Smith RM, Villwock M, Downie B, Hecht G, Zernicke R. Pain and Effusion and Quadriceps Activation and Strength. J Athl Train. 2013;48(2):186-191. doi:10.4085/1062-6050-48.2.10
10. Norte G, Rush J, Sherman D Arthrogenic Muscle Inhibition: Best Evidence, Mechanisms, and Theory for Treating the Unseen in Clinical Rehabilitation. J Sport Rehabil 2022;31(6):717-735. doi:10.1123/ jsr.2021-0139
11. Lepley LK, Wojtys EM, Palmieri-Smith RM. Combination of eccentric exercise and neuromuscular electrical stimulation to improve quadriceps function post-ACL reconstruction. The Knee. 2015;22(3):270-277 doi:10.1016/j.knee.2014.11.013
12. Lepley AS, Lepley LK. Mechanisms of Arthrogenic Muscle Inhibition. J Sport Rehabil. 2022;31(6):707-716. doi:10.1123/jsr.2020-0479
13. Sherman DA, Rush J, Stock MS, Ingersoll D, Norte EG. Neural drive and motor unit characteristics after anterior cruciate ligament reconstruction: implications for quadriceps weakness. PeerJ 2023;11:e16261. doi:10.7717/peerj.16261
14. Lewek M, Rudolph K, Axe M, Snyder-Mackler L. The effect of insufficient quadriceps strength on gait after anterior cruciate ligament reconstruction. Clin Biomech 2002;17(1):56-63. doi:10.1016/ S0268-0033(01)00097-3
15. Pietrosimone B, Loeser RF, Blackburn JT, et al. Biochemical markers of cartilage metabolism are associated with walking biomechanics 6-months following anterior cruciate ligament reconstruction. J Orthop Res. 2017;35(10):2288-2297. doi:10.1002/ jor.23534
16. Grindem H, Snyder-Mackler L, Moksnes H, Engebretsen L, Risberg MA. Simple decision rules can reduce reinjury risk by 84% after ACL reconstruction: the Delaware-Oslo ACL cohort study. Br J Sports Med. 2016;50(13):804-808. doi:10.1136/ bjsports-2016-096031
17 Quelard B, Rachet O, Sonnery-Cottet B, Chambat P. Rééducation postopératoire des greffes du ligament croisé antérieur EMC - Kinésithérapie - Médecine Phys - Réadapt. 2010;6(3):1-16. doi:10.1016/ S1283-0887(10)43946-8
18. Sonnery-Cottet B, Hopper GP, Gousopoulos L, et al. Arthrogenic Muscle Inhibition Following Knee Injury or Surgery: Pathophysiology, Classification, and Treatment. Video J Sports Med 2022;2(3):263502542210862. doi:10.1177/ 26350254221086295
19. Williams GN, Barrance PJ, Snyder-Mackler L, Buchanan TS. Altered Quadriceps Control in People with Anterior Cruciate Ligament Deficiency Med Sci Sports Exerc. 2004;36(7):1089-1097. doi:10.1249/ 01.MSS.0000131959.20666.11
20. Lobo Júnior P, Barbosa Neto IA, Borges JHDS, Tobias RF, Boitrago MVDS, Oliveira MDP CLINICAL MUSCULAR EVALUATION IN PATELLOFEMORAL PAIN SYNDROME. Acta Ortopédica Bras 2018;26(2):91-93. doi:10.1590/ 1413-785220182602187215
21. Ward SH, Blackburn JT, Padua DA, et al. Quadriceps Neuromuscular Function and JumpLanding Sagittal-Plane Knee Biomechanics After Anterior Cruciate Ligament Reconstruction. J Athl Train. 2018;53(2):135-143. doi:10.4085/ 1062-6050-306-16
22. Angelozzi M, Madama M, Corsica C, et al. Rate of Force Development as an Adjunctive Outcome Measure for Return-to-Sport Decisions After Anterior Cruciate Ligament Reconstruction. J Orthop Sports Phys Ther. 2012;42(9):772-780. doi:10.2519/ jospt.2012.3780
23. Suzuki M, Ishida T, Samukawa M, et al. Rate of Torque Development in the Quadriceps after Anterior Cruciate Ligament Reconstruction with Hamstring Tendon Autografts in Young Female Athletes. Int J Environ Res Public Health. 2022;19(18):11761. doi:10.3390/ijerph191811761
24. Maestroni L, Read P, Turner A, Korakakis V, Papadopoulos K. Strength, rate of force development, power and reactive strength in adult male athletic populations post anterior cruciate ligament reconstruction - A systematic review and metaanalysis. Phys Ther Sport 2021;47(24):91-104. doi:10.1016/j.ptsp.2020.11.024
25. Hunnicutt JL, McLeod MM, Slone HS, Gregory CM. Quadriceps Neuromuscular and Physical Function After Anterior Cruciate Ligament Reconstruction. J Athl Train. 2020;55(3):238-245. doi:10.4085/1062-6050-516-18
26. Sonnery-Cottet B, Saithna A, Quelard B, et al. Arthrogenic muscle inhibition after ACL reconstruction: a scoping review of the efficacy of interventions. Br J Sports Med 2019;53(5):289-298. doi:10.1136/bjsports-2017-098401
27. DePhillipo NN, Kennedy MI, Aman ZS, Bernhardson AS, O’Brien LT, LaPrade RF. The Role of Blood Flow Restriction Therapy Following Knee Surgery: Expert Opinion. Arthrosc J Arthrosc Relat Surg 2018;34(8):2506-2510. doi:10.1016/ j.arthro.2018.05.038
28. Curran MT, Bedi A, Mendias CL, Wojtys EM, Kujawa MV, Palmieri-Smith RM. Blood Flow Restriction Training Applied With High-Intensity Exercise Does Not Improve Quadriceps Muscle Function After Anterior Cruciate Ligament Reconstruction: A Randomized Controlled Trial. Am J Sports Med. 2020;48(4):825-837. doi:10.1177/ 0363546520904008
29. Hughes L, Rosenblatt B, Haddad F, et al. Comparing the Effectiveness of Blood Flow Restriction and Traditional Heavy Load Resistance Training in the Post-Surgery Rehabilitation of Anterior Cruciate Ligament Reconstruction Patients: A UK National Health Service Randomised Controlled Trial. Sports Med Auckl NZ 2019;49(11):1787-1805. doi:10.1007/s40279-019-01137-2
30. Norte G, Rush J, Sherman D Arthrogenic Muscle Inhibition: Best Evidence, Mechanisms, and Theory for Treating the Unseen in Clinical Rehabilitation. J Sport Rehabil 2022;31(6):717-735. doi:10.1123/ jsr.2021-0139
31. Lowe T, Dong XN. The Use of Hamstring Fatigue to Reduce Quadriceps Inhibition After Anterior Cruciate Ligament Reconstruction. Percept Mot Skills 2018;125(1):81-92. doi:10.1177/0031512517735744
32. Yu S, Lowe T, Griffin L, Dong XN. Single bout of vibration-induced hamstrings fatigue reduces quadriceps inhibition and coactivation of knee muscles after anterior cruciate ligament (ACL) reconstruction. J Electromyogr Kinesiol Off J Int Soc Electrophysiol Kinesiol. 2020;55:102464. doi:10.1016/ j.jelekin.2020.102464
33. Harput G, Ulusoy B, Yildiz TI, et al. Crosseducation improves quadriceps strength recovery after ACL reconstruction: a randomized controlled trial. Knee Surg Sports Traumatol Arthrosc Off J ESSKA 2019;27(1):68-75. doi:10.1007/s00167-018-5040-1
34. Zult T, Gokeler A, van Raay JJAM, et al. Crosseducation does not accelerate the rehabilitation of neuromuscular functions after ACL reconstruction: a randomized controlled clinical trial. Eur J Appl Physiol 2018;118(8):1609-1623. doi:10.1007/ s00421-018-3892-1
35. Kotsifaki R, Korakakis V, King E, et al. Aspetar clinical practice guideline on rehabilitation after anterior cruciate ligament reconstruction. Br J Sports Med 2023;57(9):500-514. doi:10.1136/ bjsports-2022-106158
36. Flórez Fonnegra JP, Pino Prestan AC, López LL, Yepes JC, Pérez VZ. Rehabilitation of Patients with Arthrogenic Muscular Inhibition in Pathologies of Knee Using Virtual Reality. Sensors. 2023;23(22):9114. doi:10.3390/s23229114
37 Ananías J, Vidal C, Ortiz-Muñoz L, Irarrázaval S, Besa P. Use of electromyographic biofeedback in rehabilitation following anterior cruciate ligament reconstruction: a systematic review and metaanalysis. Physiotherapy 2024;123:19-29. doi:10.1016/ j.physio.2023.12.005
38. Achens JT, Victor VSR, Joseph JK. Early Activation of Quadriceps With Pressure Biofeedback for the Prevention of Arthrogenic Muscle Inhibition Following Lower Limb Orthopedic Surgeries: A Proof of Concept Clinical Trial. J Chiropr Med 2022;21(4):296-304. doi:10.1016/j.jcm.2022.05.005
39. Souron R, Besson T, Millet GY, Lapole T Acute and chronic neuromuscular adaptations to local vibration training. Eur J Appl Physiol 2017;117(10):1939-1964. doi:10.1007/ s00421-017-3688-8
40. Coulondre C, Souron R, Rambaud A, et al. Local vibration training improves the recovery of quadriceps strength in early rehabilitation after anterior cruciate ligament reconstruction: A feasibility randomised controlled trial. Ann Phys Rehabil Med 2022;65(4):101441. doi:10.1016/ j.rehab.2020.08.005
41. Costa KSA da, Borges DT, Macedo L de B, Lins CA de A, Brasileiro JS. Whole-Body Vibration on Performance of Quadriceps After ACL Reconstruction: A Blinded Randomized Controlled Trial. J Sport Rehabil 2019;28(1):52-58. doi:10.1123/ jsr.2017-0063
42. Canet-Vintró M, Rodríguez-Sanz J, López-deCelis C, Campañá-Arnal E, Hidalgo-Garcia C, PérezBellmunt A. Effects of focal vibration on changes in sports performance in amateur athletes: A randomized clinical trial. J Orthop Res Off Publ Orthop Res Soc Published online April 10, 2024:42. doi:10.1002/jor.25857
43. Son SJ, Kim H, Seeley MK, Feland JB, Hopkins JT. Effects of transcutaneous electrical nerve stimulation on quadriceps function in individuals with experimental knee pain. Scand J Med Sci Sports 2016;26(9):1080-1090. doi:10.1111/sms.12539
44. Conley CEW, Mattacola CG, Jochimsen KN, Dressler EV, Lattermann C, Howard JS. A Comparison of Neuromuscular Electrical Stimulation Parameters for Postoperative Quadriceps Strength in Patients After Knee Surgery: A Systematic Review Sports Health 2021;13(2):116-127 doi:10.1177/ 1941738120964817
45. Toth MJ, Tourville TW, Voigt TB, et al. Utility of Neuromuscular Electrical Stimulation to Preserve Quadriceps Muscle Fiber Size and Contractility After Anterior Cruciate Ligament Injuries and Reconstruction: A Randomized, Sham-Controlled, Blinded Trial. Am J Sports Med 2020;48(10):2429-2437. doi:10.1177/ 0363546520933622
46. Rafsanjani H, Khademi-Kalantari K, Rezasoltani A, Naimi SS, Ghasemi M, Jaberzadeh S. Immediate effect of common peroneal nerve electrical stimulation on quadriceps muscle arthrogenic inhibition in patients with knee osteoarthritis. J Bodyw Mov Ther 2017;21(4):879-883. doi:10.1016/ j.jbmt.2017.03.003
47. Hopkins J, Ingersoll CD, Edwards J, Klootwyk TE. Cryotherapy and Transcutaneous Electric Neuromuscular Stimulation Decrease Arthrogenic Muscle Inhibition of the Vastus Medialis After Knee Joint Effusion. J Athl Train 2002;37(1):25-31.
48. Effects of cryotherapy on arthrogenic muscle inhibition using an experimental model of knee swelling. doi:10.1002/art.24168
49. Hart JM, Kuenze CM, Diduch DR, Ingersoll CD Quadriceps Muscle Function After Rehabilitation With Cryotherapy in Patients With Anterior Cruciate Ligament Reconstruction. J Athl Train 2014;49(6):733-739. doi:10.4085/1062-6050-49.3.39
50. Kuenze C, Eltoukhy M, Kelly A, Kim CY. Impact of quadriceps strengthening on response to fatiguing exercise following ACL reconstruction. J Sci Med Sport. 2017;20(1):6-11. doi:10.1016/ j.jsams.2016.04.015
51. Loro WA, Thelen MD, Rosenthal MD, Stoneman PD, Ross MD. The effects of cryotherapy on quadriceps electromyographic activity and isometric strength in patient in the early phases following knee surgery. J Orthop Surg Hong Kong. 2019;27(1):2309499019831454. doi:10.1177/ 2309499019831454
52. Churchill L, Bade JM, Koonce RC, Stevens-Lapsley JE, Bandholm T The past and future of peri-operative interventions to reduce arthrogenic quadriceps muscle inhibition after total knee arthroplasty: A narrative review Osteoarthr Cartil Open 2024;6(1):100429. doi:10.1016/j.ocarto.2023.100429


Cohorts run for a duration of 13 months, August through the following September. Application windows opens from October-December of the preceding year through RF-PTCAS.

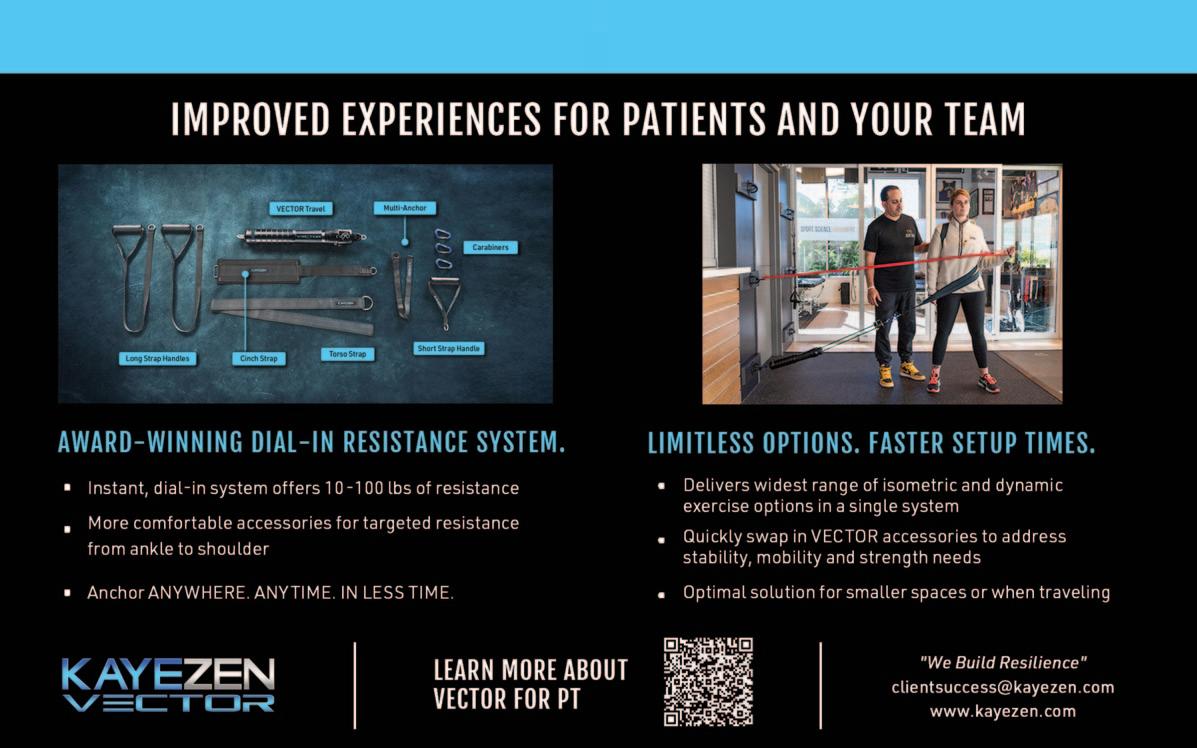


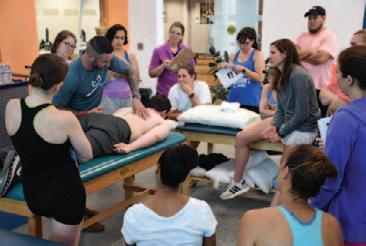
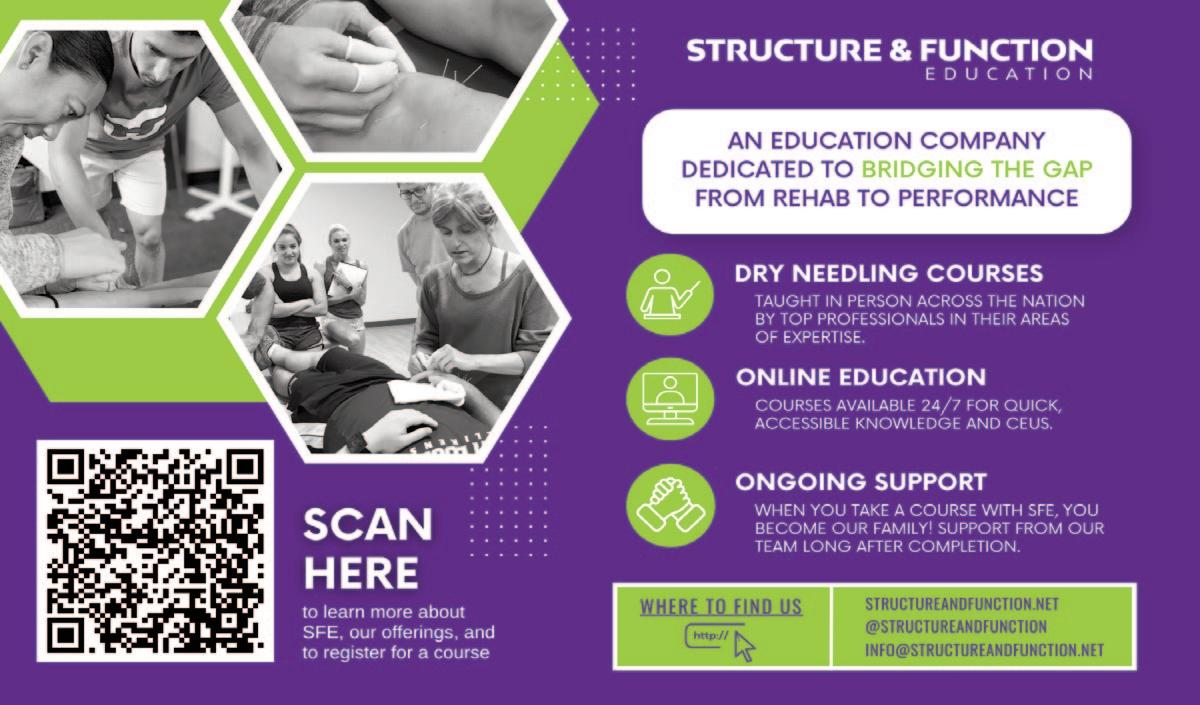
Most Advanced Electrotherapy Device: Powerful, intuitive and user-friendly
Treat up to three body zones at once on all types of tissues
Effective in less than 10 minutes Enter A New Era of Therapy
TECAR
HIGH FREQUENCY
Metabolic Action at Cell Level
Hi-TENS
LOW FREQUENCY IN PULSED HIGH FREQUENCY
Ultimate Pain Management
Hi-EMS
MEDIUM FREQUENCY
Deep Muscle Contraction