


INTERNATIONAL JOURNAL OF SPORTS PHYSICAL THERAPY An Official Publication of A North American Sports Medicine Institute Publication I J S PT Partnering with


Extracorporeal Shockwave Therapy (ESWT) is a versatile modality that can be used to treat a variety of musculoskeletal dysfunctions. In this free, on-demand webinar, Dr. Pavel Novak, Director of Science and Technology at Storz Medical AG in Tägerwilen, Switzerland, provides insight that will help you drive positive outcomes with this technology.
Dr. Novak has been involved with the design of shockwave equipment for the past 25 years in addition to conducting other biomedical research for almost 50 years. In that time, he has developed 90 patents and written more than 100 research papers and presentations. Dr. Novak’s extensive experience with shockwave technology, biomedical research, and product development makes for an illuminating discussion. Topics of discussion include the following:
• Identifying an inferior piece of ESWT equipment
• RPW vs FSW
• Mechanisms behind treatment outcomes
• The future of ESWT technology

Register using the QR code above or visit learn.chattanoogarehab.com/ ijspt-mar-24-journal

PRESENTED BY


Welcome to the Fifth World Congress of Sports Physical Therapy, presented by the International Federation of Sports Physical Therapy and NFFs Faggruppe for Idrettsfysioterapi og Aktivitesmedisin!
Join us June 14-15, 2024 in beautiful Oslo, Norway for a fantastic experience, whether you are a novice or experienced clinician. You will meet up with colleagues from all around the world, sharing knowledge, best practices, create networks and have a lot of fun. Enjoy an exciting schedule full of interesting lectures and engaging workshops!
Key Dates:
May 14, 2024 Workshops
June 13, 2024 IFSPT General Meeting
June 14-15, 2024 Congress
From Research to Clinical Practice
• 18 practical Workshops
• Oral presentations
• Posters
• Networking opportunities IMPORTANT!
BOOK YOUR HOTEL ROOM NOW WHILE SELECTION AND EXCHANGE RATE ARE IDEAL!
REGISTRATION IS NOW OPEN AT WCSPT.ORG!
TITLE SPONSOR


November 8, 2024
Bern, Switzerland

Board of Directors / Business Advisory Board
Turner A Blackburn, APTA Life Member, AT-Ret, AOSSM-Ret President
Mary Wilkinson Executive Director
Michael Voight Executive Editor and Publisher
Joe Black, PT, DPT, SCS, ATC
Eric Fernandez
Jay Greenstein, DC
Skip Hunter, PT, ATC-Ret
Russ Paine, PT, DPT
Tim Tyler, PT, ATC
Sports Legacy Advisory Board
Turner A. Blackburn, PT, ATC
George Davies, PT, DPT, MEd, SCS, ATC, LAT, CSCS, PES, FAPTA
Terry Malone, PT, PhD
Bob Mangine, PT
Barb Sanders, PT, PhD
Tim Tyler, PT, ATC
Kevin Wilk, PT, DPT, FAPTA
Staff
Executive Editor/Publisher
Michael L. Voight, PT, DHSc, OCS, SCS, ATC, CSCS Executive Director/Operations and Marketing
Mary Wilkinson
Editor in Chief
Barbara Hoogenboom, PT, EdD, SCS, ATC Managing Editor
Ashley Campbell, PT, DPT, SCS, CSCS
Manuscript Coordinator
Casey Lewis, PTA, ATC
NORTH AMERICAN SPORTS MEDICINE INSTITUTE
Publisher
Contact Information
International Journal of Sports Physical Therapy 6011 Hillsboro Pike
Nashville, TN 37215, US, http://www.ijspt.org
IJSPT is a monthly publication, with release dates on the first of each month.
ISSN 2159-2896
Underwriting Sponsor
Genie Health
Founding Sponsors
Enovis
Exertools
Hyperice
Trazer
Woodway
Platinum Sponsors
ATI
Elvation
Gold Sponsors
Hawkgrips
Kayezen
Structure + Function Education
Winback
Partners
Northeast Seminars
Academy of Human Movement
American Academy of Sports Physical Therapy
IJSPT is an official journal of the International Federation of Sports Physical Therapy (IFSPT). Countries with access to IJSPT as a member benefit. Reach us at www.ifspt.org.

IJSPT is an official journal of the ICCUS Society for Sports Rehabilitation. www.iccus.org


Stand out in your community with a diversified patient experience. Designed to improve outcomes, attract new patients, and increase revenue through insurance, cash-based services, and retail sales.
Designed for clinicians, supported by the world’s best
Gain access to a robust library of research, clinical education, and marketing tools including:
• On-demand clinical education courses
• Written treatment protocols
• Over 50 research studies specific to Hyperice technology
• Marketing tips and best practices including social media content, videos, and more
• Live trainings
Email rehab@hyperice.com for more information
Executive Editor/Publisher
Michael L. Voight, PT, DHSc, OCS, SCS, ATC, CSCS
Belmont University
Nashville, Tennessee – USA
Editor in Chief
Barbara Hoogenboom, PT, EdD, SCS, ATC
Grand Valley State University Grand Rapids, Michigan - USA
Managing Editor
Ashley Campbell, PT, DPT, SCS, CSCS
Nashville Sports Medicine and Orthopaedic Center
Nashville, Tennessee – USA
Manuscript Coordinator
Casey Lewis, PTA, ATC
Nashville Sports Medicine and Orthopaedic Center
Nashville, Tennessee – USA
Executive Director/Marketing
Mary Wilkinson
Indianapolis, Indiana – USA
Editors
Robert Manske PT, DPT, Med, SCS, ATC, CSCS
University of Wichita Wichita, KS, USA
Terry Grindstaff, PT, PhD, ATC, SCS, CSCS
Creighton University Omaha, NE, USA
Phil Page PT, PhD, ATC, CSCS
Franciscan University DPT Program Baton Rouge, LA, USA
Kevin Wilk PT, DPT, FAPTA
Clinical Viewpoint Editor
Champion Sports Medicine Birmingham, AL, USA
International Editors
Luciana De Michelis Mendonça, PT, PhD
UFVJM
Diamantina, Brazil
Colin Paterson PT, MSc PGCert(Ed), MCSP, RISPT, SFHEA
University of Brighton
Brighton, England, UK
Chris Napier, PT, PhD
Clinical Assistant Professor
University of British Coumbia, Vancouver, BC, Canada
Nicola Phillips, OBE, PT, PhD, FCSP
Professor School of Healthcare Sciences
Cardiff University, Cardiff, Wales, UK
Associate Editors
Eva Ageberg, PT, PhD
Professor, Lund University
Lund, Sweden
Lindsay Becker, PT, DPT, SCS, USAW
Buckeye Performance Golf Dublin, Ohio, USA
Keelan Enseki, PT, MS, OCS, SCS, ATC
University of Pittsburgh
Pittsburgh, PA, USA
John Heick, PT, PhD, DPT, OCS, NCS, SCS
Northern Arizona University
Flagstaff, AZ, USA
Julie Sandell Jacobsen, MHSc, PhD
VIA University
Aarhus, Denmark
RobRoy L. Martin, PhD, PT, CSCS
Duquesne University
Pittsburgh, PA, USA
Andrea Mosler, PhD, FACP, FASMF
La Trobe Sport and Exercise Medicine Research
Centre, School of Allied Health, Human Services and Sport, La Trobe University
Melbourne, Victoria, Australia
Brandon Schmitt, DPT, ATC
PRO Sports Physical Therapy
Scarsdale, NY, USA
Barry Shafer, PT, DPT
Elite Motion Physical Therapy
Arcadia, CA, USA
Laurie Stickler, PT, DHSc, OCS
Grand Valley State University
Grand Rapids, MI, USA
Editorial Board
James Andrews, MD
Andrews Institute & Sports Medicine Center
Gulf Breeze, AL, USA
Amelia (Amy) Arundale, PT, PhD, DPT, SCS
Red Bull/Ichan School of Medicine
Salzburg, Austria/New York, NY, USA
Gary Austin, PT PhD
Belmont University
Nashville, TN, USA
Roald Bahr, MD
Oslo Sports Trauma Research Center
Oslo, Norway
Lane Bailey, PT, PhD
Memorial Hermann IRONMAN Sports Medicine Institute
Houston, Texas, USA
Gül Baltaci, PT,Ph.D. Professor, CKTI, FACSM
Private Guven Hospital
Ankara, Turkey
Asheesh Bedi, MD
University of Michigan
Ann Arbor, MI, USA
David Behm, PhD
Memorial University of Newfoundland St. John's, Newfoundland, Canada
Barton N. Bishop, PT, DPT, SCS, CSCS
Kaizo Clinical Research Institute Rockville, Maryland, USA
Mario Bizzini, PhD, PT
Schulthess Clinic Human Performance Lab Zürich, Switzerland
Joe Black, PT, DPT, SCS, ATC Total Rehabilitation Maryville, Tennesse, USA
Turner A. "Tab" Blackburn, APTA Life Member, ATC-Ret, AOSSM-Ret
NASMI
Lanett, AL, USA
Lori Bolgla, PT, PhD, MAcc, ATC
Augusta University Augusta, Georgia, USA
Matthew Briggs
The Ohio State University Columbus, OH, USA
Tony Brosky, PT, DHSc, SCS Bellarmine University Louisville, KY, USA
Brian Busconi, MD
UMass Memorial Hospital Boston, MA, USA
Robert J. Butler, PT, PhD
St. Louis Cardinals
St. Louis, MO, USA
Duane Button, PhD Memorial University
St. Johns, Newfoundland, Canada
J. W. Thomas Byrd, MD
Nashville Sports Medicine and Orthopaedic Center Nashville, TN, USA
Lyle Cain, MD
Andrews Institute & Sports Medicine Center Birmingham, AL, USA
Gary Calabrese, PT, DPT Cleveland Clinic Cleveland, Ohio, USA
Meredith Chaput, PT, DPT, SCS Ohio University Athens, OH, USA
Rita Chorba, PT, DPT, MAT, SCS, ATC, CSCS United States Army Special Operations Command Fort Campbell, KY, USA
John Christoferreti, MD
Texas Health
Dallas, TX, USA
Richard Clark, PT, PhD
Tennessee State University Nashville, TN, USA
Juan Colado, PT, PhD
University of Valencia Valencia, Spain
Brian Cole, MD
Midwest Orthopaedics at Rush Chicago, IL, USA
Ann Cools, PT, PhD
Ghent University
Ghent, Belgium
Andrew Contreras, DPT, SCS Washington, DC, USA
George Davies, PT, DPT, MEd, SCS, ATC, LAT, CSCS, PES, FAPTA
Georgia Southern University Savannah, Georgia, USA
Pete Draovich, PT Jacksonville Jaguars Footbal Jacksonvile, FL, USA
Jeffrey Dugas, MD
Andrews Institute & Sports Medicine Center Birmingham, AL, USA
Jiri Dvorak, MD Schulthess Clinic Zurich, Switzerland
Todd Ellenbecker Rehab Plus Phoenix, AZ, USA
Carolyn Emery, PT, PhD University of Calgary Calgary, Alberta, Canada
Ernest Esteve Caupena, PT, PhD University of Girona Girona, Spain
Sue Falsone, PT, MS, SCS, ATC, CSCS, COMT Structure and Function Education and A.T. Still University Phoenix, Arizona, USA
J. Craig Garrison, PhD, PT, ATC, SCS Texas Health Sports Medicine Fort Worth, Texas, USA
Maggie Gebhardt, PT, DPT, OCS, FAAOMPT Fit Core Physical Therapy/Myopain Seminars Atlanta, GA and Bethesda, MD, USA
Lance Gill, ATC LG Performance-TPI Oceanside, CA, USA
Phil Glasgow, PhD, MTh, MRes, MCSP Sports Institute of Northern Ireland Belfast, Northern Ireland, UK
Robert S. Gray, MS, AT Cleveland Clinic Sports Health Cleveland, Ohio, USA
Jay Greenstein, DC Kaizo Health Baltimore, MD, USA
Martin Hagglund, PT PhD
Linkoping University
Linkoping, Sweden
Allen Hardin, PT, SCS, ATC, CSCS
University of Texas Austin, TX, USA
Richard Hawkins, MD
Professor of surgery, University of South Carolina
Adjunct Professor, Clemson University
Principal, Steadman Hawkins, Greenville and Denver (CU)
John D.Heick, PT, PhD, DPT, OCS, NCS, SCS
Northern Arizona University Flagstaff, AZ, USA
Tim Hewett, PhD
Hewett Consulting Minneapolis, Minnesota, USA
Per Hølmich, MD
Copenhagen University Hospital
Copenhagen, Denmark
Kara Mae Hughes, PT, DPT, CSCS
Wolfe PT Nashville, TN, USA
Lasse Ishøi, PT, MSc
Sports Orthopedic Research Center
Copenhagen University Hospital Hvidovre, Denmark
Jon Karlsson, MD
Sahlgrenska University Goteborg, Sweden
Brian Kelly, MD
Hospital for Special Surgery New York, NY, USA
Benjamin R. Kivlan, PhD, PT, OCS, SCS
Duquesne University Pittsburgh, PA, USA
Dave Kohlrieser, PT, DPT, SCS, OCS, CSCS
Ortho One
Columbus, OH, USA
Andre Labbe PT, MOPT
Tulane Institute of Sports Medicine New Orleans, LA USA
Henning Langberg, PT, PhD
University of Copenhagen Copenhagen, Denmark
Robert LaPrade, MD
Twin Cities Orthopedics Edina, MN, USA
Lace Luedke, PT, DPT
University of Wisconsin Oshkosh Oshkosh, WI, USA
Phillip Malloy, PT, PhD
Arcadia University/Rush University Medical Center Glenside, PA and Chicago, IL, USA
Terry Malone, PT, EdD, ATC, FAPTA
University of Kentucky
Lexington, KY, USA
Robert Mangine, PT University of Cincinnati Cincinnati, OH, USA
Eric McCarty, MD
University of Colorado
Boulder, CO, USA
Ryan P. McGovern, PhD, LAT, ATC
Texas Health Sports Medicine Specialists
Dallas/Fort Worth, Texas, USA
Mal McHugh, PhD NISMAT
New York, NY, USA
Joseph Miller, PT, DSc, OCS, SCS, CSCS
Pikes Peak Community College
Colorado Springs, CO, USA
Havard Moksnes, PT PhD
Oslo Sports Trauma Research Center
Oslo, Norway
Andrew Murray, MD, PhD
European PGA Tour
Edinburgh, Scotland, UK
Andrew Naylor, PT, DPT, SCS
Bellin Health
Green Bay, WI, USA
Stephen Nicholas, MD
NISMAT New York
New York, NY, USA
John O'Donnel, MD
Royal Melbourne Hospital Melbourne, Australia
Russ Paine, PT
McGovern Medical School
Houston, TX, USA
Snehal Patel, PT, MSPT, SCD
HSS Sports Rehabilitation Institute
New York, NY, USA
Marc Philippon, MD
Steadman-Hawkins Clinic Vail, CO, USA
Kevin Plancher, MD, MPH, FAAOS
Plancher Orthopedics and Sports Medicine
New York, NY USA
Marisa Pontillo, PT, PhD, DPT, SCS
University of Pennsylvania Health System
Philadelphia, PA, USA
Matthew Provencher, MD
Steadman Hawkins Clinic Vail, CO, USA
Charles E. Rainey, PT, DSc, DPT, MS, OCS, SCS, CSCS, FAAOMPT
United States Public Health Service
Springfield, MO, USA
Alexandre Rambaud, PT PhD
Saint-Etienne, France
Carlo Ramponi, PT
Physiotherapist, Kinè Rehabilitation and Orthopaedic Center
Treviso, Italy
Michael Reiman, PT, PhD
Duke University
Durham, NC, USA
Mark F. Reinking, PT, PhD, SCS, ATC
Regis University
Denver, CO, USA
Mark Ryan, ATC
Steadman-Hawkins Clinic
Vail, CO, USA
David Sachse, PT, DPT, OCS, SCS
USAF
San Antonio, TX, USA
Marc Safran, MD
Stanford University Palo Alto, CA, USA
Alanna Salituro, PT, DPT, SCS, CSCS New York Mets
Port Saint Lucie, FL, USA
Mina Samukawa, PT, PhD, AT (JSPO)
Hokkaido University Sapporo, Japan
Barbara Sanders, PT, PhD, FAPTA, Board Certified Sports Physical Therapy Emeritus
Professor and Chair, Department of Physical Therapy
Texas State University Round Rock, TX, USA
Felix “Buddy” Savoie, MD, FAAOS
Tulane Institute of Sport Medicine
New Orleans, LA, USA
Teresa Schuemann, PT, DPT, ATC, CSCS, Board
Certified Specialist in Sports Physical Therapy
Evidence in Motion Fort Collins, CO, USA
Timothy Sell, PhD, PT, FACSM
Atrium Health Musculoskeletal Institute Charlotte, NC, USA
Andreas Serner, PT PhD
Aspetar Orthopedic and Sports Medicine Hospital Doha, Qatar
Ellen Shanley, PT, PhD
ATI
Spartanburg, SC, USA
Karin Silbernagel, PT, PhD
University of Delaware Newark, DE, USA
Holly Silvers, PT, PhD
Velocity Physical Therapy
Los Angeles, CA, USA
Lynn Snyder-Mackler, PT, ScD, FAPTA
STAR University of Delaware Newark, DE, USA
Alston Stubbs, MD Wake Forest University Winston-Salem, NC, USA
Amir Takla, B.Phys, Mast.Physio (Manip), A/Prof Australian Sports Physiotherapy
The University of Melbourne Melbourne, Australia
Charles Thigpen, PhD, PT, ATC
ATI
Spartanburg, SC, USA
Steven Tippett, PT, PhD, ATC, SCS
Bradley University
Peoria, IL, USA
Tim Tyler, PT, ATC
NISMAT
New York, NY, USA
Timothy Uhl, PT, PhD, ATC
University of Kentucky Lexington, KY, USA
Bakare Ummukulthoum, PT University of the Witswatersrand
Johannesburg, Gauteng, South Africa
Yuling Leo Wang, PT, PhD Sun Yat-sen University
Guangzhou, China
Mark D. Weber, PT, PhD, SCS, ATC Texas Women’s University Dallas, TX, USA
Richard B. Westrick, PT, DPT, DSc, OCS, SCS US Army Research Institute Boston, MA, USA
Chris Wolfe, PT, DPT
Belmont University Nashville, TN, USA
Tobias Wörner, PT, MSc Lund University
Stockholm, Sweden
CLINICAL VIEWPOINT
Isokinetic Testing: Why it is More Important Today than Ever.
Wilk KE, Arrigo CA, Davies GJ.
SYSTEMATIC REVIEW
Validity and Reliability of Dynamic and Functional Balance Tests in People Aged 19-54: A Systematic Review.
Lesch KJ, Tuomisto S, Tikkanen HO, et al.
ORIGINAL RESEARCH
Effects of Glenohumeral Mobilization and Sleeper Stretches Alone or in Combination with Thoracic Manipulation on Shoulder ROM, Joint Mobility, and EMG Activity- Results of a Randomized, Sequential Interventions Trial.
Swanson B, Hagenbruch M, Lapaan B, et al.
Establishing Normal Variances and Expectations For Quadriceps Limb Symmetry Index Benchmarks Based On Time From Surgery After Anterior Cruciate Ligament Reconstruction.
Hazzard S, Connolly S, Wiater A, et al.
Quadriceps and Hamstrings Activation Peaks Earlier as Athletes Repeatedly Hop, but There are Differences Depending on ACL Reconstruction Technique.
Einarson E, Kotsifaki A, Briem K, et al.
Reliability of an Instrumented Pressure Walkway for Measuring Walking and Running Characteristics in Young, Athletic Individuals.
Jorgensen A, McManigal M, Post A, et al.
Validity and Responsiveness of a Modified Balance Error Scoring System Assessment Using a Mobile Device Application in Patients Recovering from Ankle Sprain.
Crowell MS, Thomasma E, Miller EM, et al.
Effects of Nontraditional Division III Lacrosse Participation on Movement Pattern Quality and Dynamic Postural Control.
Rosenborough CJ, Collins SM, Smith ER, et al.
Muscle Activations of the Upper Extremity and Core during Elevation and Rotational Movements in Overhead Throwing Athletes.
Owens LP, Khaiyat O, Coyles G.
Tissue Flossing: A Commentary on Clinical Practice Recommendations. Cheatham SW, Baker R.
A Biomechanical Review of the Squat Exercise: Implications for Clinical Practice. Straub RK, Powers CM.
Utilizing Diagnostic Musculoskeletal Ultrasound in the Evaluation of Cubital Tunnel Syndrome and Ulnar Nerve Pathology.
Manske RC, Voight M, Page P, Wolfe C.
Data-Driven Prognosis and Improved Outcomes – Part 1: The Demands of Practice-Based Evidence. Gray Cook, MSPT, OCS, CSCS.


digital physical therapy solution
combining remote monitoring and telehealth
in-clinic and remote sports/functional assessment and management risk assessment and remote management tools for occupational health


Northeast Region
Sudbury - Boston Post Rd
Mark Gorman
Glasgow
Kyle Fennemore
Southeast Region
Mount Pleasant - Wingo Way
Marcella White
North Trussville - Happy Hollow Rd
Christopher Baker
Central Region
Sioux City
Lee Hahn
Lilly Tech South
Victoria Lehman
Oakville - South Country
Kristen Brewer
Lombard
Kelsey Nevell
Fort Worth - W 7th St
Jacob Myers
Dallas - Lake Highlands
Gregory Lark
West Region
Queen Creek - E Victoria Lane
Adam Harries
Vancouver - NE 81st St
George Koutsouvanos


Keywords: Isokinetics, Isokinetic Testing, Knee Testing, Return to Sport, Objective Assessment https://doi.org/10.26603/001c.95038
Isokinetics is a proven method to train and objectively assess the capability of muscle groups, particularly at the knee. The current re-injury rates and less than optimal return to sport percentages seen following anterior cruciate ligament surgery highlights the need for greater focus on what tests and methods are used to make these critical decisions. Isokinetics remains the best single method to objectively determine dynamic muscle strength, power, rate of force development and endurance. These factors make it well-suited to play a crucial role in influencing the appropriate patient progression through a rehabilitation program and assisting in determining return to play readiness following injury or surgery. In this article we will discuss why we believe isokinetics is a useful and necessary testing method, and elucidate testing parameters and goals used during knee extension/flexion assessment.
Isokinetics has been used in testing and rehabilitation for the last 60 years. Its most common use has been for selected musculoskeletal injuries at the knee because of the frequency of injury and ease of testing. Looking back historically, several trends can be identified regarding isokinetics, testing, and rehabilitation. Beginning in the 1960s–1970s an integrated approach combining open kinetic chain (OKC) (isolated joint exercises), closed kinetic chain (CKC) (multi-joint exercises), and functional rehabilitation interventions was advocated. The use of OKC Isokinetic testing and rehabilitation peaked in the 1980s, due largely to the increasing body of evidence demonstrating its effectiveness in assessment and rehabilitation of patients with knee injuries. In the 1990s the focus switched to almost exclusively CKC exercises because they were considered more functional and thought to produce fewer rehabilitation complications, compared to OKC exercises. Beginning in the early 2000s an approach best characterized as “Functional rehabilitation” has been employed almost exclusively largely due to the empirical notion that it has a greater specificity to performance. Investigations in the 2020s have shown many patients following injuries/surgeries oftentimes still have residual strength and power deficits rendering them unable to return to their previous levels of performance. Due to these issues with difficulty returning to unrestricted participation, the current trend is heading back to performing objective isokinetic testing to assess the performance capabilities of associated muscle groups, in conjunction with a battery of other functional tests to both guide rehabilitation and determine readiness to resume higher-level activities.
The proven effectiveness of isokinetics and the large number of patients unable to return to pre-injury levels of activity because of significant strength, power and endurance deficits are why we advocate a “Test, Don’t Guess!” approach that makes the data derived from isokinetics a critical part of the return to play methodology There are 2
imperatives employed when using isokinetic testing. First, it assists in providing objective data to help guide progression through a rehabilitation program, particularly in the advanced phases. Second, isokinetic testing assists the assessment of readiness for discharge aimed at ensuring a successful return to sport (RTS). RTS readiness frequently includes a number of assessments, including patient reported outcomes (PROs) impairment measurements, muscular strength, power and endurance tests, functional performance tests, neuro-cognitive reactive tests,1 and finally sport specific tests.
Recently there have been several articles which have reported a quadriceps strength value of 90% or better when compared to the contralateral (uninjured) knee as one of the four or five criteria to reduce the risk of reinjury to the knee following anterior cruciate ligament (ACL) surgery 2, 3 Furthermore, anecdotally clinicians and researchers have repeatedly stated they are looking for limb symmetry of the quadriceps and hamstrings before returning individuals to a running program or sports participants. With these important criteria stated by many – clinicians require an accurate, objective, and reproducible method of testing to ensure these parameters are met prior to returning anyone back to unrestricted athletic participation.
The focus of this clinical commentary is to address testing of muscle strength, power, and endurance. Using the knee as a model, muscle performance testing can be performed using a variety of methods including manual muscle testing (MMT), handheld dynamometry (HHD), isotonic progressive resistive exercise (PREs) testing using knee extensions and/or leg press movements, squatting, and isokinetics. Multi-joint isotonic tests like the leg press or squat may demonstrate a performance weakness, but because multiple muscle groups are being used in the movement the actual point of weakness and degree of deficit within the kinetic chain are difficult to truly isolate.
• Provides reliable objective documentation of dynamic muscle performance
• Efficient: loads a dynamically contracting muscle to its maximum capability at all points throughout the range of motion
• Because of the accommodating resistance, a muscle can be challenged to its maximal capability through an entire range of motion (physiologic Blix curve)
• Muscle groups can be isolated for testing and rehabilitation
• Inherently safe for pain and fatigue
• Validity based on correlations with other functional tests
• Concentric isokinetic exercises produce minimal postexercise delayed-onset muscle soreness
• Exercise at different angular velocities through a velocity spectrum
• Because of specificity of training, exercising at the faster angular velocities at higher intensities can recruit fast-twitch muscle fibers which are critically important in functional activities. There is the potential to increase muscle power, rate of force development (RFD) quickness of muscle force development, time rate of torque development TRTD), torque acceleration energy (TAE); all are important for athletic performance.
• The reciprocal innervation time is the time from contracting one muscle group (agonist) (quadriceps), and then reciprocally contracting the opposite muscle group (antagnoist) (hamstrings). When the patient exercises at faster angular velocities in a reciprocal manner (contracting quads and then immediately the hamstring, etc.), it decreases the reciprocal innervation time.
• Joint compressive forces decrease with higher angular velocities (fluid film lubrication model)
• Bernoulli’s principle indicates that the faster a surface (articular cartilage) moves over fluid, (synovial fluid in a joint), the less the compressive forces on the surface
• There is a 30°/s physiologic (strengthening) overflow to slower angular velocities with isokinetic resistance
• There is a 30°–40° range of motion strengthening overflow during performance of short-arc exercises
• Computerized feedback allows improvement in torque control accuracy
• Real-time feedback is available to the patient for motivation during exercise
• Short arc testing and/or using a proximally placed pad can decrease anterior tibial translation
(Table from: Davies, GJ, Riemann, BL, Ellenbecker, TS. Role of Isokinetic Testing and Training after ACL Injury and Reconstruction. In F. R. Noyes, S. Barber-Westin (Eds.), ACL Injuries in the Female Athlete. Springer-Nature, 2018)18
Objective muscle performance testing using isokinetics has numerous advantages. (Table 1) It can be used for preparticipation screening to identify potential deficits and allow for preventive interventions to reduce injury risk. Isokinetic testing can be used to assess a patient’s status during rehabilitation to guide program progression. The objective documentation provided from isokinetic testing can be used in the development of criteria-based treatment plans. Despite the benefits the trend over the last few decades has been away from isokinetic testing. The movement away from isokinetics has by in large not been replaced with another form of dynamic muscle performance assessment. This lack of objective muscle performance data is partly responsible for the unfavorable RTS4‑7 and high reinjury rates8‑10currently prevalent following ACL surgery The criteria needed for an accurate RTS determination are multi-factorial but muscular strength, power, rate of force development, and endurance are critical metrics that should be routinely tested as part of this decision-making process.1 Numerous studies have demonstrated the reliability of isokinetic muscle performance testing.11‑14 Additionally, several studies have demonstrated that although
the patient is strapped into the isokinetic testing device, it has good validity, and several studies have demonstrated a correlation between isokinetic performance and functional skills.15‑17 For these reasons, isokinetic testing is still the “Gold Standard” for measuring dynamic muscle performance.
In contrast, performing isometric knee testing at a 90-degree angle with the patient in the seated position has become a popular assessment for quadriceps strength. There are several limitations to this technique: 1) the 90 degree angle pre-stretches the distal quads, but shortens the rectus femoris, 2) if this position is used, perhaps it should replicate the functional position of the hips with standing, walking or running by having the patient laying supine on the table, 3) the 90-degree position of the knee does not replicate the functional angle of the knee during most sporting activities and certainly not the position of the knee for the mechanism of injury with ACL injuries, and 4) the isometric contraction is not a dynamic motion, therefore, the measure is not a functional movement pattern and only has limited translation to strength beyond the 90-degree position of knee flexion.
Isokinetics has the ability to perform dynamic velocity spectrum testing to sample muscle performance at multiple speeds. Because sporting activities occur during multiple speeds of movement there is a need to assess the muscles involved in multiple ways that can mimic acceleration, deceleration, and speed of movement. Moreover, by testing and strengthening muscles at various speeds, the patient should be better prepared to successfully progress through their rehabilitation program and ultimately RTS. The uniqueness of isokinetics is predicated on the concept of accommodating resistance. As the biomechanics of the joint and the length of the muscle-tendon unit changes throughout the range of motion, the forces will change and isokinetics allows for specificity of testing or rehabilitation by providing accommodation as the range of movement changes. Isokinetic testing allows for dynamic muscle performance testing which has been shown to correlate with functional movements.19‑25 Isokinetics have been used for 56 years,26 the first book dedicated to isokinetics was published 40 years ago,27 an entire journal was developed that was dedicated to isokinetics (Isokinetics & Exercise Science) and there have been thousands of articles demonstrating the effectiveness for testing, training, and rehabilitation, with a PubMed search in January of 2024 returning 9,381 articles in Index Medicus journals including isokinetics.
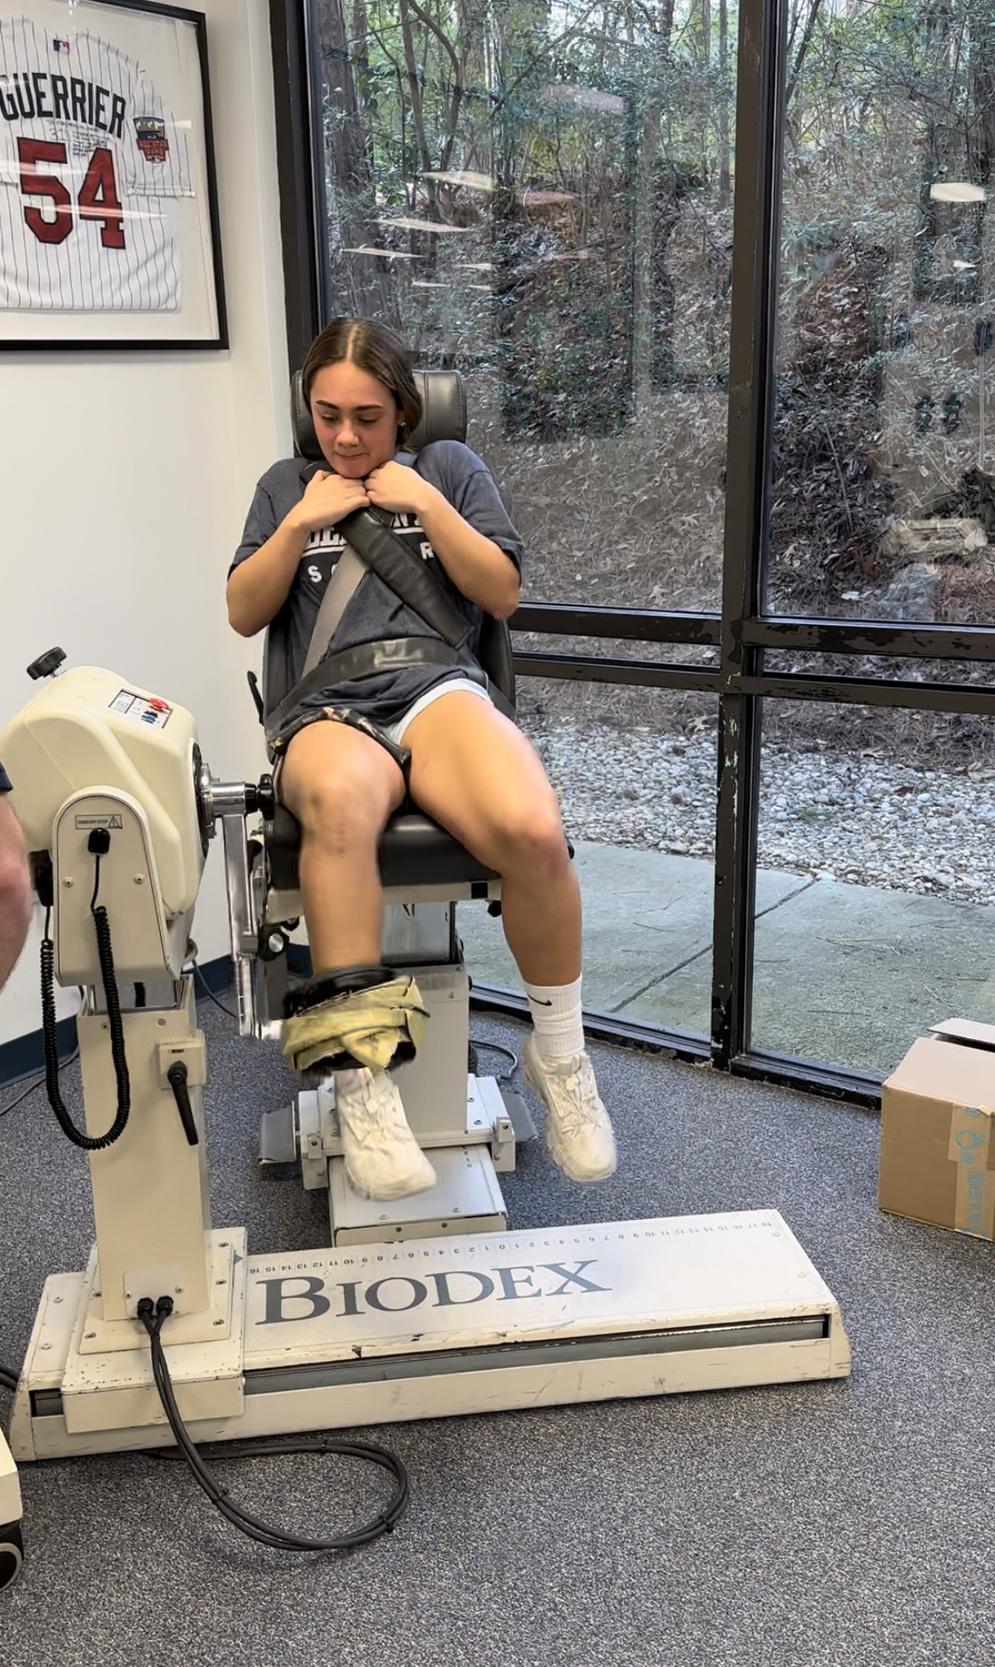
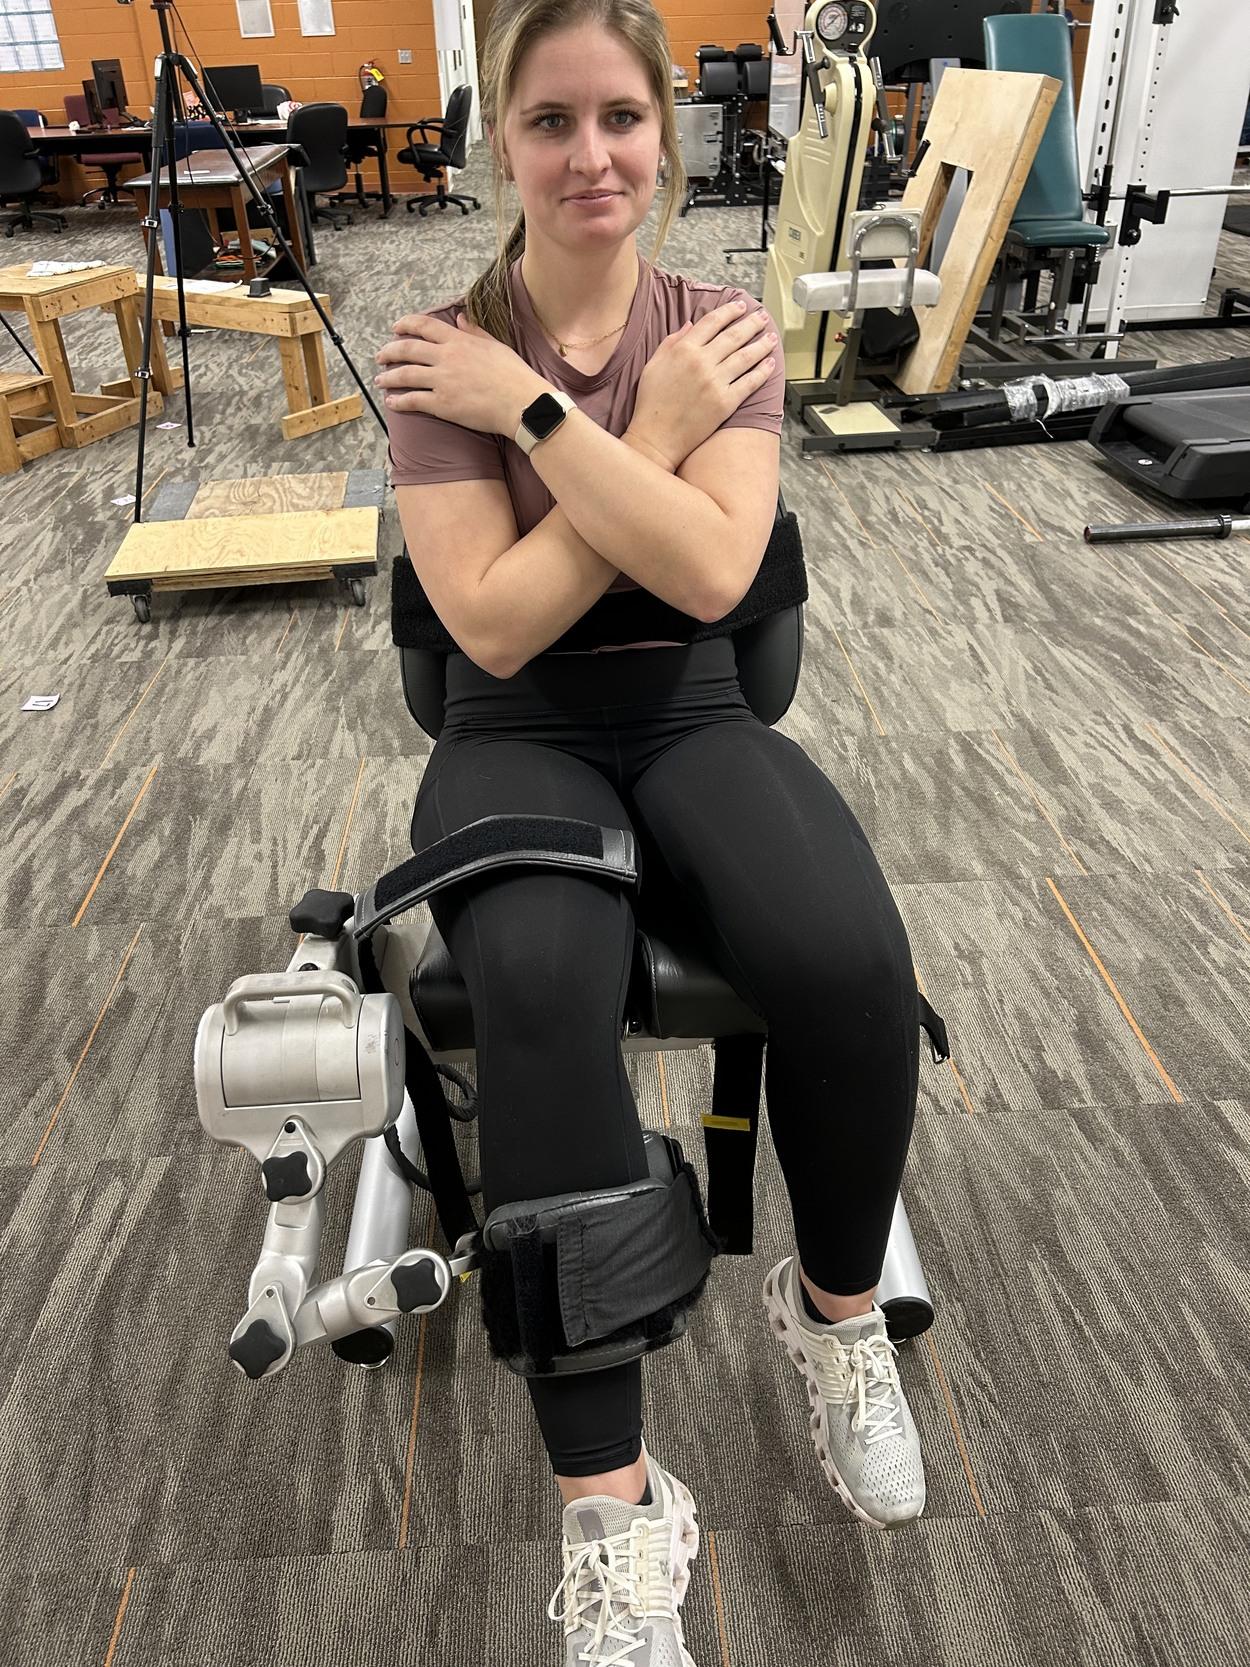
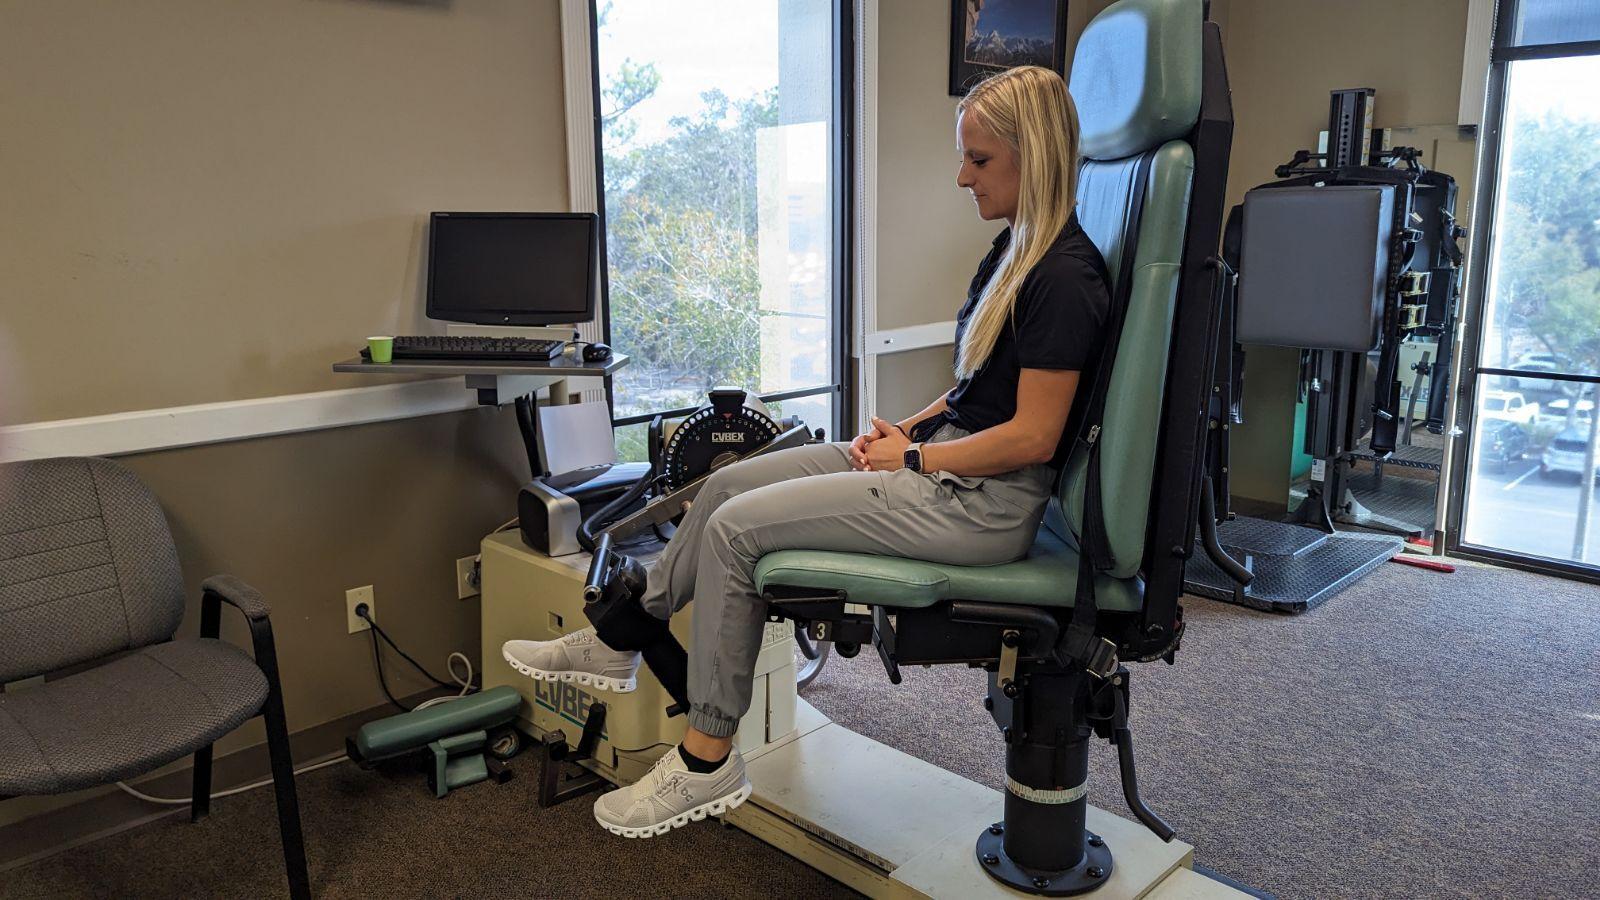
The decline in use of isokinetics noted previously was not solely related to shifting trends in rehabilitation philosophy. The 4 most cited barriers to isokinetics are accessibility, unit size, device complexity and most importantly cost. Not everyone has access to an isokinetic device, generally for the other 3 reasons and they are becoming less and less available. As clinic size has decreased from the once extravagantly large facilities of the 1980’s and 1990’s, the overall footprint of the current large devices are no longer practical. The device systems are terribly complex owing to the attempt to test as many joints and movements as possible, despite the practical clinical need for most of this complexity (Figure 1). Finally, cost has become the driving factor in so many healthcare decisions and the ability to afford an isokinetic testing system is no different. To address all these barriers a prototype isokinetic knee dynamometer system has been developed (Figure 2). This device has a very small footprint, only tests knee extension/flexion, and promises to provide a lower cost method of isokinetic knee testing.
Isokinetic testing of the knee flexors and extensors is performed in a seated position using a dynamometer to measure the muscle performance parameters of strength, power, rate of force development, work, and endurance (Figure 3a and 3b). Testing can be performed at multiple angular velocities but is most commonly performed at 180 and 300 degrees/second, as these speeds have been shown to closely approximate functional activity 16,17,28 It is worth mentioning here that one of the persistent criticisms against isokinetics is creating large
patellofemoral compression forces and tibial sheer during testing. This is attributable to the early use of testing at 60 degrees/second. Historically, the measurement of peak torque was determined by manually measuring the value on thermal graph paper. Sixty degrees/second was adopted because it was the simplest way to generate a force curve that could be easily measured and interpreted with the testing methods available. Unfortunately, not only is 60 degrees/
Figure 1. Biodex Isokinetic Dynamometer Figure 2. Prototype Small BiodexKnee Isokinetic Dynamometer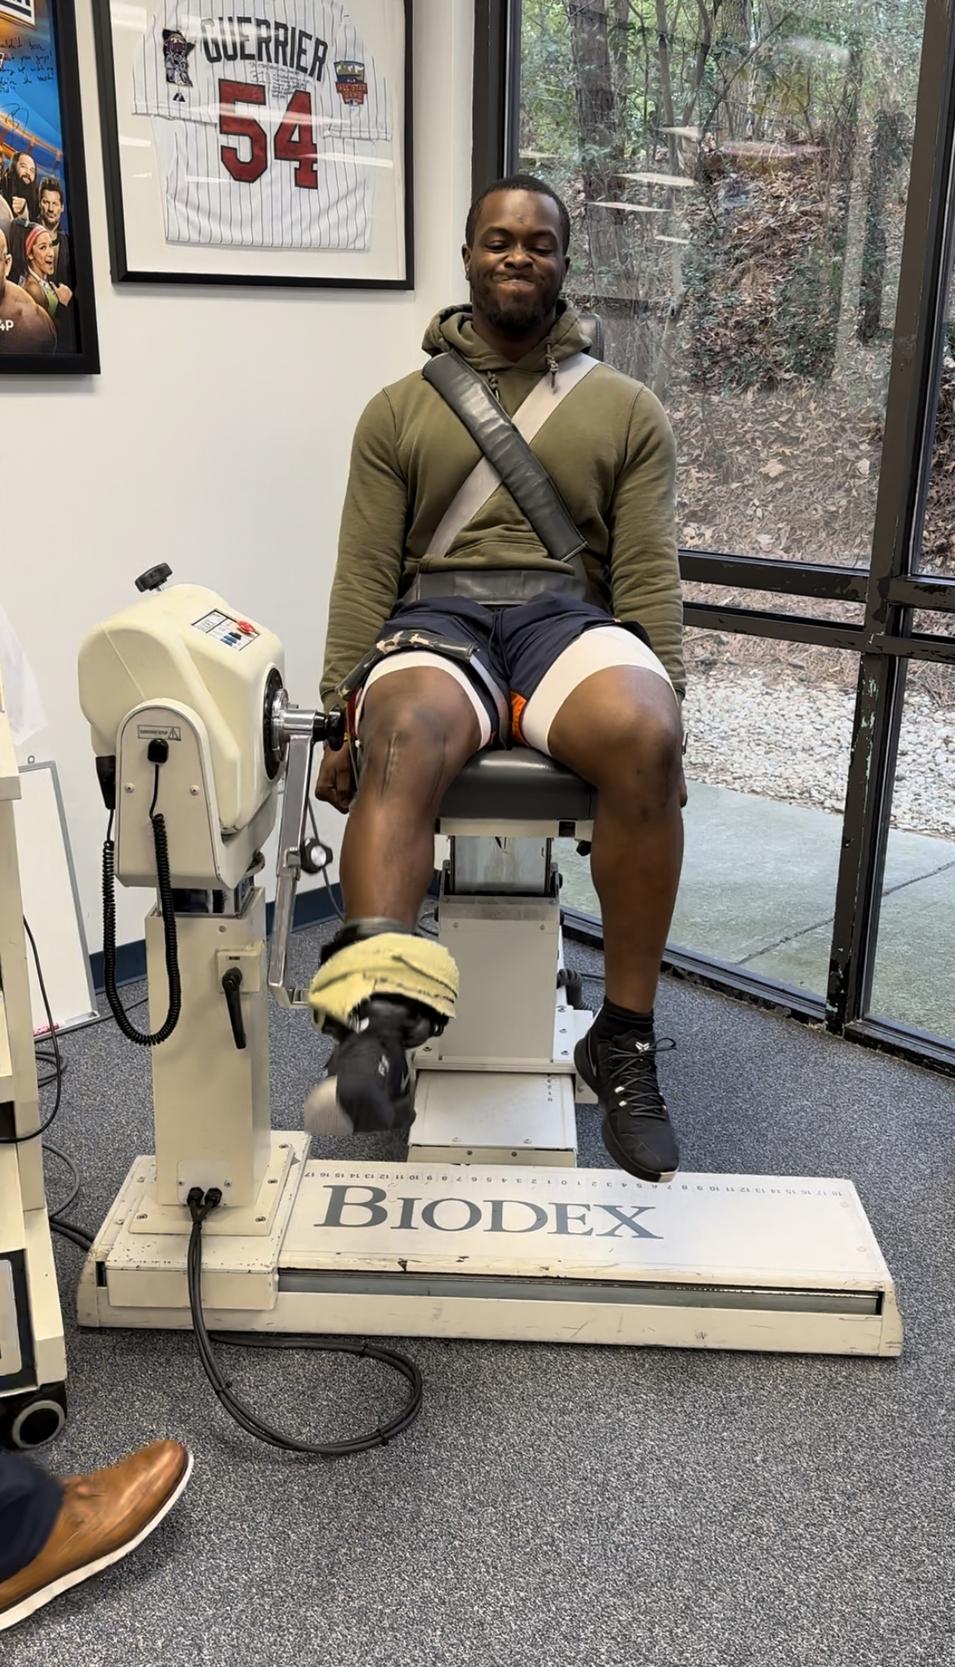
second not functional or ideal for testing, the practice of using this speed in testing has persisted despite advancements in the computerized software used to assess a test which make the need for manual measurement unnecessary In Addition, testing at 60 degrees/second produces significantly higher patellofemoral reaction forces and greater anterior tibial translation than the faster speeds of 180 and 300 degrees/second.29 Conversely, speeds beyond 300 degrees/second have been shown to be too fast for many but the highest functioning athlete to be able to “catch” the dynamometer and register values during testing.30
Key isokinetic testing parameters to evaluate include quadriceps torque to body weight ratio at 180 degrees/second, hamstring/quadriceps ratios, bilateral comparisons (Limb Symmetry Index-LSI) of the quadriceps and hamstrings, acceleration rate at 0.2 seconds of knee extension, and endurance values for both the quadriceps and hamstrings musculature. The complete isokinetic testing para-
• Quadriceps Peak Torques to Body Weight Ratio:
◦ Males 180 deg/sec 60-65%
◦ Females 180 deg/sec 50-55%
• Hamstring/Quadriceps Ratio:
◦ Males 180 deg/sec 66-75%
◦ Females 180 deg/sec 75%>
• Bilateral Quadriceps Peak Torque Comparison:
◦ Males: 85%>
◦ Females: 85%
• Hamstring Bilateral Peak Torque Comparison:
◦ Males: 90%>
◦ Females: 100%>
• Acceleration Rates at 0.2 sec
◦ ≥ 90% Quadriceps
• Endurance Values:
◦ Quadriceps work fatigue ratio 12% decrease or less.
meters evaluated and their goals for RTS assessment are outlined in Table 2 While a comprehensive assessment of all parameters and their correlation of other functional testing measures is imperative for an overall picture of the patient as a whole, the testing parameters that have been found to be most beneficial in a battery of test assessments are: T-shuttle run, hop testing, force plate data, and neurocognitive reactive functional testing.
It is important to perform a battery of tests for pre-participation screening, assessing a patient’s progress through a rehabilitation program, and criterion-based subjective and objective testing protocols for RTS. Isokinetic testing allows for dynamic velocity spectrum testing of multiple muscle groups, although this clinical commentary only focused on knee testing. There is ample research to demonstrate quadriceps deficits last for prolonged periods of time following ACL injuries and after reconstructions. Therefore, it is important to assess the muscle’s performance in each link of the kinetic chain to determine if any isolated weaknesses exist. Despite the limitations of cost and availability isokinetics remains an integral part of the successful formula to assess muscular strength, power, and endurance in an objective manner. Because of the compelling arguments in favor of isokinetics and the need to solve the current re-
Figure 3a. Biodex Isokinetic Dynamometer Figure 3b. Cybex Isokinetic Dynamometerinjury and readiness in return to play issues perhaps the future lies in a dedicated isokinetic knee testing and rehabilitation system.31 This type of dedicated isokinetic knee system may provide the solution to cost effective objective muscle testing. The authors of this article look forward to the future direction of objective muscle assessment, return
to play testing, and reducing the incidence of ACL injuries and reinjuries. We feel that isokinetics remains the best method to objectively determine dynamic muscle strength, power, rate of force development, and endurance.
© The Author(s)
This is an open-access article distributed under the terms of the Creative Commons Attribution 4.0 International License (CCBY-NC-4.0). View this license’s legal deed at https://creativecommons.org/licenses/by-nc/4.0 and legal code at https://creativecommons.org/licenses/by-nc/4.0/legalcode for more information.
1. Wilk KE, Thomas ZM, Arrigo CA, Davies GJ. The Need To Change Return to Play Testing in Athletes Following ACL Injury: A Theoretical Model. Int J Sports Phys Ther 2023;18(1):272-281. doi:10.26603/0 01c.67988
2. Grindem H, Snyder-Mackler L, Moksnes H, Engebretsen L, Risberg MA. Simple decision rules can reduce reinjury risk by 84% after ACL reconstruction: the Delaware-Oslo ACL cohort study. Br J Sports Med. 2016;50(13):804-808. doi:10.1136/bjsports-2016-096 031
3. Kyritsis P, Bahr R, Landreau P, Miladi R, Witvrouw E. Likelihood of ACL Graft Rupture: Not Meeting Six Clinical Discharge Criteria Before Return to Sport is Associated With A Four Times Greater Risk of Rupture. Br J Sports Med 2016;50(15):946-951. doi:1 0.1136/bjsports-2015-095908
4. Markström JL, Naili JE, Häger CK. A Minority of Athletes Pass Symmetry Criteria in a Series of Hop and Strength Tests Irrespective of Having an ACL Reconstructed Knee or Being Noninjured. Sports Health 2023;15(1):45-51. doi:10.1177/194173812210
97949
5. Ithurburn MP, Thomas S, Paterno MV, Schmitt LC. Young athletes after ACL reconstruction with asymmetric quadriceps strength at the time of return-to-sport clearance demonstrate drop-landing asymmetries two years later Knee 2021;29:520-529. doi:10.1016/j.knee.2021.02.036
6. Read PJ, Michael Auliffe S, Wilson MG, GrahamSmith P Lower Limb Kinetic Asymmetries in Professional Soccer Players With and Without Anterior Cruciate Ligament Reconstruction: Nine Months Is Not Enough Time to Restore “Functional” Symmetry or Return to Performance. Am J Sports Med. 2020;48(6):1365-1373. doi:10.1177/0363546520
912218
7 Cognetti DJ, Lynch TB, Rich E, Bedi A, Dhawan A, Sheean AJ. Quadriceps Dysfunction Following Joint Preservation Surgery: A Review of the Pathophysiologic Basis and Mitigation Strategies. Curr Rev Musculoskelet Med. 2023;16(8):338-345. do i:10.1007/s12178-023-09844-0
8. Simonson R, Piussi R, Högberg J, et al. Effect of Quadriceps and Hamstring Strength Relative to Body Weight on Risk of a Second ACL Injury: A Cohort Study of 835 Patients Who Returned to Sport After ACL Reconstruction. Orthop J Sports Med. 2023;11(4):232596712311573. doi:10.1177/232596712
31157386
9. Rodriguez-Merchan EC, Valentino LA. Return to Sport Activities and Risk of Reinjury Following Primary Anterior Cruciate Ligament Reconstruction. Arch Bone Jt Surg 2022;10(8):648-660.
10. Manara JR, Salmon LJ, Kilani FM, et al. Repeat Anterior Cruciate Ligament Injury and Return to Sport in Australian Soccer Players After Anterior Cruciate Ligament Reconstruction With Hamstring Tendon Autograft. Am J Sports Med. 2022;50(13):3533-3543. doi:10.1177/03635465221125 467
11. Thompson BJ, Xu J. Isokinetic Dynamometer Leg Extensor Peak Torque Measurement: A Time-Delayed Reliability and Score Selection Analysis Study J Funct Morphol Kinesiol. 2023;8(2):62. doi:10.3390/jfmk8020 062
12. Tuominen J, Leppänen M, Jarske H, Pasanen K, Vasankari T, Parkkari J. Test−Retest Reliability of Isokinetic Ankle, Knee and Hip Strength in Physically Active Adults Using Biodex System 4 Pro. Methods Protoc. 2023;6(2):26. doi:10.3390/mps6020026
13. Urhausen AP, Berg B, Øiestad BE, et al. Measurement properties for muscle strength tests following anterior cruciate ligament and/or meniscus injury: What tests to use and where do we need to go? A systematic review with meta-analyses for the OPTIKNEE consensus. Br J Sports Med. 2022;56(24):1422-1431. doi:10.1136/bjsports-2022-1 05498
14. Muñoz-Bermejo L, Pérez-Gómez J, Manzano F, Collado-Mateo D, Villafaina S, Adsuar JC. Reliability of isokinetic knee strength measurements in children: A systematic review and meta-analysis. PLoS One 2019;14(12):e0226274. doi:10.1371/journa l.pone.0226274
15. Wilk KE, Romaniello WT, Soscia SM, Arrigo CA, Andrews JR. The relationship between subjective knee scores, isokinetic testing, and functional testing in the ACL-reconstructed knee. J Orthop Sports Phys Ther 1994;20(2):60-73. doi:10.2519/jospt.1994.20.2.6 0
16. Ogawa M, Matsumoto T, Harada R, et al. Reliability and Validity of Quadriceps Muscle Thickness Measurements in Ultrasonography: A Comparison with Muscle Mass and Strength. Prog Rehabil Med 2023;8:20230008. doi:10.2490/prm.2023 0008
17 Urhausen AP, Berg B, Øiestad BE, et al. Measurement properties for muscle strength tests following anterior cruciate ligament and/or meniscus injury: What tests to use and where do we need to go? A systematic review with meta-analyses for the OPTIKNEE consensus. Br J Sports Med 2022;56(24):1422-1431. doi:10.1136/bjsports-2022-1 05498
18. Davies GJ, Riemann B, Ellenbecker T Role of Isokinetic Testing and Training after ACL Injury and Reconstruction. In: Noyes FR, Barber-Westin S, eds. ACL Injuries in the Female Athlete Springer-Nature; 2018:567-588. doi:10.1007/978-3-662-56558-2_24
19. Wang S, Guo F, Song X, et al. Analysis of Isokinetic Strength Test in Arthroscopic Meniscus Suture to Improve Knee Joint Strength and Function. Altern Ther Health Med 2023;29(6):416-424.
20. Blackburn JR, Morrissey MC. The relation-ship between open and closed kinetic chain strength of the lower limb and jumping performance. J Orthop Sports Phys Ther 1998;27(6):430-435. doi:10.2519/jos pt.1998.27.6.430
21. Iossifidou A, Baltzopoulos V, Giakas G. Isokinetic knee extension and vertical jumping: are they related? Role of Isokinetic Testing and Training After ACL Injury and Reconstruction. J Sports Sci. 2005;23(10):1121-1127 doi:10.1080/02640410500128 189
22. Ithurburn MP, Paterno MV, Ford KR, Hewett TE, Schmitt LC. Young athletes with quadriceps femoris strength asymmetry return to sport after anterior cruciate ligament reconstruction demonstrate asymmetric single-leg drop-landing mechanics. Am J Sports Med. 2015;43(11):2727-2737. doi:10.1177/0363 546515602016
23. Newman MA, Tarpenning KM, Marino FE. Relationships between isokinetic knee strength, single-sprint performance, and repeated-sprint ability in football players. J Strength Cond Res 2004;18(4):867-872.
24. Rouis M, Coudrat L, Jaafar H, et al. Assessment of isokinetic knee strength in elite young female basketball players: correlation with vertical jump. J Sports Med Phys Fitness. 2015;55(12):1502-1508.
25. Uçar M, Koca I, Eroglu M, et al. Evaluation of open and closed kinetic chain exercises in rehabilitation following anterior cruciate ligament reconstruction. J Phys Ther Sci. 2014;26(12):1875-1878. doi:10.1589/jpts.26.1875
26. Hislop HJ, Perrine J. The isokinetic concept of exercise. Phys Ther. 1967;47(1):114-117. doi:10.1093/ ptj/47.1.114
27 Davies GJ. A Compendium of Isokinetics in Clinical Usage. S&S Publishers; 1984.
28. Wilk KE, Keirns MA, Andrews JR, Clancy WG, Arrigo CA, Erber DJ. Anterior Cruciate Ligament Reconstruction Rehabilitation: A Six-Month Followup of Isokinetic Testing in Recreational Athletes. Isokinet Exerc Sci 1991;1(1):36-43. doi:10.3233/ies-1991-1107
29. Wilk KE, Andrews JR. The effects of pad placement and angular velocity on tibial displacement during isokinetic exercise. J Orthop Sports Phys Ther. 1993;17(1):24-30. doi:10.2519/josp t.1993.17.1.24
30. Wilk KE, Andrews JR, Arrigo CA, et al. Anterior cruciate ligament reconstruction rehabilitation: a twelve-week follow-up of isokinetic testing in recreational athletes. Isokin Ex Sci 1992;2(2):82-91.
31. Riemann BL, Watson MD, Davies GJ. Reliability and Validity of a Novel Isokinetic Knee Dynamometer System. Acta Bioeng Biomech 2021;23(4):107-111. do i:10.37190/abb-01936-2021-03
Kim J Lesch1 a ,
Sanni Tuomisto1 ,
Heikki O Tikkanen1 ,
Mika Venojärvi1
1 Institute of Biomedicine, Sports and Exercise Medicine, University of Eastern Finland, Kuopio, Finland
Keywords: "Reliability", "Validity", "Dynamic postural balance", "Clinical settings", "Healthcare professionals", "Systematic review", "healthy adults" https://doi.org/10.26603/001c.94612
Evaluating an impairment in an individual’s capacity to maintain, achieve, or restore balance suggests a deficiency in postural control. For effective identification of individuals at risk for falls, balance assessment should exhibit reliability, validity, and ease of use. This systematic review concentrated on dynamic and functional balance assessment methods and their validity in healthy adults aged 19-54. The objective was to clarify the tools that health professionals can utilize to assess balance in this healthy population.
A systematic literature search conducted in August 2019 yielded nine articles meeting predefined selection criteria. Inclusion criteria required studies featuring healthy adult participants aged 19-54, published in English, and focusing on dynamic and functional balance testing. Exclusion criteria excluded studies involving participants with chronic diseases or musculoskeletal disorders, systematic reviews, professional athletes, and those lacking specific participant age information. The quality of the studies was evaluated using a modified PEDro scale.
This review analyzed ten distinct postural balance tests. The Star Excursion Balance Test and Y-Balance Test exhibited moderate to high reliability, establishing them as dependable measures of dynamic balance. The Nintendo Wii Balance Board, Clever Balance Board, and Posturomed device also displayed excellent reliability for assessing dynamic postural balance. Comparing one-arm and two-arm functional reach tests, the one-arm reach test emerged as a more suitable option for evaluating dynamic balance among young adults. Moreover, an investigation comparing three dynamic balance tests (one-leg jump landing, Posturomed device, and stimulated forward fall) revealed a low correlation among these tests, indicating a measurement of different balance constructs.
In conclusion, the Y-Balance Test stands out as the most practical dynamic balance assessment for clinical use, characterized by a standardized protocol, good repeatability, affordability, and ease of application. The Nintendo Wii Balance Board also presents itself as a cost-effective and reliable tool for dynamic balance evaluation in clinical settings. It is crucial to recognize that these tests appraise discrete postural skills, preventing direct comparisons between test outcomes. This review equips healthcare professionals with valuable insights into optimal balance assessment methods for the healthy, 19 to 54 aged population.
Levels of evidence
Level 3
Corresponding author: Kim Lesch, kim.lesch@uef.fi, Yliopistonranta 1, 70210 Kuopio, Finland ORCID iD: 0000-0002-7389-0177
One definition of postural balance is the ability to achieve a state of equilibrium by keeping the body’s center of gravity (COG) over the base of support (BOS).1 Postural balance can be categorized into static and dynamic balance. Static balance involves maintaining balance while standing or sitting, with the BOS remaining stationary and only the COG moving. Dynamic balance, on the other hand, is the ability to maintain balance while moving from one point to another, such as during walking. In dynamic balance, both the BOS and COG are in motion, and the COG never stays within the BOS during periods of single-limb support.2,3
Balance comprises both postural and equilibrium components. Postural control involves managing gravitational forces to maintain posture, while equilibrium control involves managing acceleration forces to maintain overall stability.3 The control of balance is achieved through a continuous feedback system that processes somatosensory (proprioception), vestibular, and visual inputs and elicits neuromuscular responses.1 Disturbances in these systems can make maintaining balance more challenging.3
Current standardized clinical balance assessment tools are designed to screen for balance problems and predict the risk of falls, particularly in elderly individuals.4 Common dynamic or functional balance tests, such as the Berg Balance Scale, Get Up and Go test (with or without timing), Functional Reach test, Tinetti Balance and Mobility scale, and the Dynamic Gait Index, are widely used to differentiate fallers from non-fallers and assess fall risk among older adults who are more prone to balance issues and increased risk of falling. These tests are also applicable to post-stroke patients, individuals with certain neurological conditions such as Parkinson’s disease or multiple sclerosis, and those with vestibular disorders, all of whom have an elevated risk of falling.3,5
Most of the current standardized balance tests are primarily applicable to the elderly population or individuals with specific disabilities. While there is abundant scientific literature on these balance assessment tools, to best of the authors’ knowledge, only a few studies have focused on balance testing in healthy adults between 18 to 64. Moreover, encouraging the inclusion of middle-aged in balance testing recommendations can assist in identifying the pattern of balance decline. The Star Excursion Balance Test (SEBT) appears to be one of the most extensively investigated clinical balance assessment tools in this age group.6,7 The SEBT is a functional and cost-effective measurement tool for assessing postural control, and it is sensitive to age-related changes in balance.6 The test involves reaching in eight directions: anterior, medial, lateral, posterior, anteromedial, anterolateral, posteromedial, and posterolateral. The individual stands on a single leg and reaches as far as possible in each direction, lightly touching the floor tape with the free-floating leg.8 However, due to the time-consuming nature of performing the SEBT with several directions and trials, researchers have developed modified versions of the test that include only three out of the eight directions.6,7 As a result, a clinically applicable version called the Y-Bal-
ance Test (YBT) was developed. The YBT focuses on three reach directions: anterior, posterolateral, and posteromedial. Unlike the SEBT where the measurement is executed in floor level, in the YBT, the subject needs to push a reach indicator block as far as possible using the foot. The YBT follows a standardized protocol and takes less time to complete than the SEBT Additionally, the YBT has shown good to excellent intra-rater (0.85-0.91) and inter-rater reliability (0.99-1.00).7,9
This systematic review concentrated on dynamic and functional balance assessment methods and their validity in healthy adults aged 19-54. The objective was to clarify the tools that health professionals can utilize to assess balance in this healthy population.
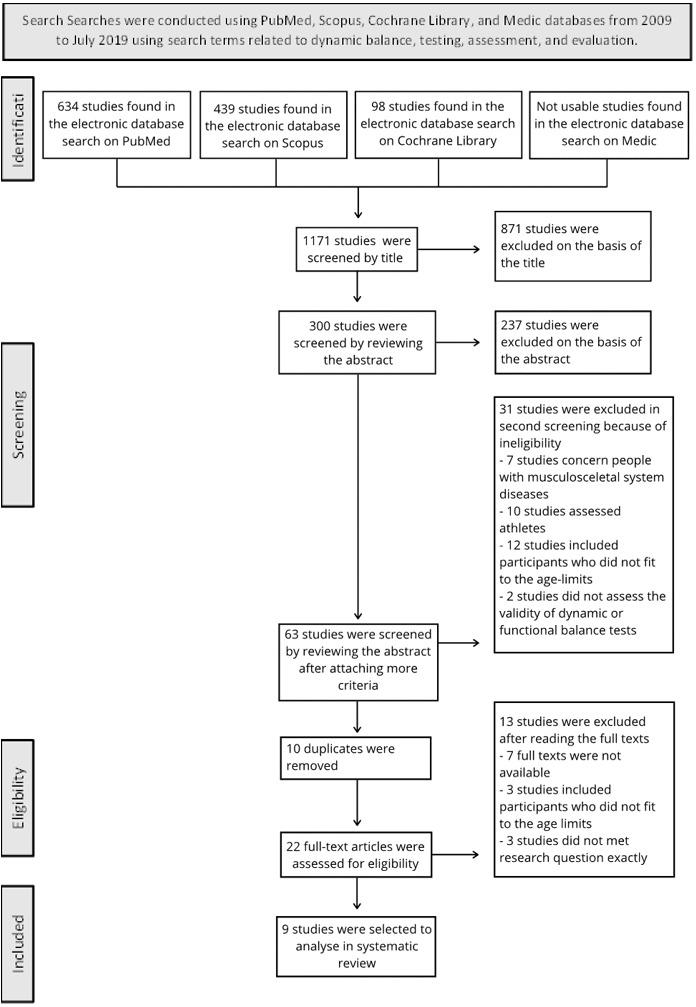
Searches were conducted using PubMed, Scopus, Cochrane Library, and Medic databases from 2009 to July 2019 using search terms related to dynamic balance, testing, assessment, and evaluation. Full search strategies are provided in Appendix 1.
The included studies had to meet the following criteria: 1) participants were healthy adults aged 19 to 64 years old, 2) the study was published in English, and 3) the study focused on dynamic and functional balance testing methods.
The primary exclusion criteria were: 4) participants had chronic diseases that could affect balance, and 5) the article was a systematic review
Additional exclusion criteria included: To further narrow down the selection of articles to the desired target group, an additional exclusion criterion was implemented. 6) studies involving participants with musculoskeletal diseases, that affect postural balance 7) studies focused on athletes (either amateur or professional level), and 8) the articles had to mention the exact ages of the participants (Figure 1).
Initially, the titles of all the studies identified through the database search were screened. After excluding studies that did not meet the criteria, the abstracts were analyzed by two reviewers (ST and KL). If any important information (e.g., exact age of participants) was not found in the abstract, the full text was reviewed by reviewers (ST and KL). Finally, when only a few potential studies remained, the full texts were read to make a final decision on eligibility For detailed information about the study selection, refer to Figure 1, the Prisma flowchart.
The methodological quality of the studies was assessed using the Physiotherapy Evidence Database (PEDro) scale. The PEDro scale consists of eleven items and is primarily designed for rating the methodological quality of randomized controlled trials (RCTs). However, there is evidence suggesting the need to revise the PEDro scale to better suit
the purpose of use for in studies based of methodological aspects. Items such as randomization, concealed allocation, and blinding have discriminative validity and may not be applicable in certain study designs, 10
In controlled training studies, blinding is often not feasible, so for this review, the items related to blinding of subjects, therapists, and assessors were excluded from the PEDro scale. As a result, the total PEDro score was adjusted to 7 points instead of 10, and a modified rating system was used: 6 to 7 points indicated “excellent quality,” 5 points indicated “good quality,” 4 points indicated “moderate quality,” and 0 to 3 points indicated “ poor quality” 10 The studies were independently rated on this modified PEDro scale by two reviewers (ST and KL).
The systematic literature search identified a total of 1,171 studies. After screening the titles, 300 studies remained for further evaluation through abstracts. The screening process was repeated twice, resulting in 64 studies that met criteria 1-5. To further narrow down the selection of articles to the desired target group, an additional exclusion criterion was implemented and (criteria 6-8) were then applied, and duplicates were excluded, leaving 22 studies for full-text analysis. After independent screening by two researchers, a total of nine articles (total of 319 participants) were se-
Figure 1. Prisma flowchart of article selectionlected for inclusion in this research. Please refer to Figure 1 for a detailed overview of the screening process
Among the selected studies, three were rated as having “good” methodological quality,6,7,11 three as having “moderate” quality,12‑14 and three received a score of 3 on the modified PEDro scale, indicating “poor” quality,15‑17 Most participants in the included studies were young adults, ranging in age from 19 to 39 years,; 7,11‑17 only one study included middle-aged adults aged 40-54 years,6 and no studies healthy adults aged 55 to 64. Two studies exclusively included women,6,14 one study included only men,7 while five studies included both men and women,11‑13,16,17 and one study did not specify the sex of the participants.15
The studies included in this systematic review investigated a total of ten different postural balance tests. Three studies focused on the Star Excursion Balance Test (SEBT) or the Y-Balance Test, which is a modification of the SEBT.6,7,17 The Functional Reach Test (performed with one arm or two arms) was used in two studies.12,15 One study utilized the Nintendo Wii Balance Board (NBB),15 while another study did not involve any specific devices.12 The NBB was also employed in a study by Bonnechère et al.,16 along with a force plate (FP). The Posturomed device was used in two studies,13,14 and the Clever Balance Board (CBB) was used in one study 11 Other methods employed to investigate dynamic balance included one-leg jump landing and simulated forward falls.14 Detailed information on the results can be found in Table 2.
Based on this systematic review, it is evident that among healthy adults aged 19-54 years, one of the most used dynamic balance tests in clinical settings are the functional tests like Star Excursion Balance Test (SEBT) and the Y-Balance Test (YBT). These tests were employed in three out of the nine studies included in this review: one study exclusively used the SEBT,6 one study focused on the YBT,17 and one study compared the two tests.7
Bouillon and Baker6 used the SEBT to investigate the effect of age on functional balance. Their hypothesis was that increasing age would lead to lower excursion scores, indicating poorer dynamic balance. Notably, the partici-
pants’ ages spanned from adults (30.4 ± 6.73) to middleaged (46.6 ± 3.95), (p < 0.01). The intraclass correlation coefficient (ICC) values for reaching distance ranged from 0.95-0.97 in the adult group and from 0.72-0.96 in the middle-aged group, indicating moderately high to high reliability in reaching distance between the two groups. Using the SEBT to investigate differences between the groups, the results showed that the adult group achieved greater reach distances in every direction compared to middle-aged group, indicating a decline in dynamic balance with increasing age.6
Coughlan et al.,7 compared results between the SEBT and the YBT and found a difference in anterior reach-direction distance between the two tests. The SEBT demonstrated significantly greater reach distances in the anterior direction for both the left (p = 0.0002) and right legs (p = 0.003) compared to the YBT Bland-Altman analysis showed strong agreement between the left leg results (5.08 [-4.69 to 14.85]), with a performance difference of 5.08% of limb length based on a 95% confidence interval. Distinct results were found also for the right leg (4.59 [-7.41 to 16.60]), indicating the reach SEBT score higher than the YBT score. No significant differences were noted in the posteromedial and posterolateral directions. Paired sample correlations were all equivalence (0.572-0.781), indicating that both the SEBT and YBT are reliable tools for assessing dynamic balance.7
Teyhen et al.17 found a correlation between greater reach distance in the YBT and better performance in other physical activities. Their results demonstrated that better performance on the YBT was associated with better performance on the Functional Movement Screen (FMS⯑) in-line lunge (r = 0.40, p = 0.001), shoulder/upper trunk mobility (r = 0.29, p = 0.017), greater gastrocnemius flexibility (r = 0.38, p = 0.004), and a reduced number of hops needed during a 6-meter hop test (r = -0.35, p = 0.004).17
Various balance boards were used in the included studies.11,13‑16 The Nintendo Wii Balance Board (NBB) was utilized in two studies, both of which demonstrated its suitability for assessing dynamic balance.15,16 Mengarelli et al.15 found a high correlation between the NBB and an instrumented dynamic force platform (Bertec 4060H, 60x40 cm) in both the anterior-posterior and medial-lateral di-
Authors/ year PEDro scale score
Kage et al.200912
Šarabon et al.200911
Objectives
4 To discern which functional reach test (a one-arm reach or a two-arm reach) correlates better with center of pressure excursion.
Sample Balance testing device or tool?
25 healthy young adults (14 males, 11 females, range 19-30 years)
One-Arm and Two-Arm Functional Reach test
Implementation Results
In one-arm reach subjects reached as forward as they could with holding right arm horizontal and keeping left arm at the side of the body.
In two-arm reach subjects reached forward with both arms horizontal.
Subjects repeated both conditions and better results were accepted for analysis.
For the one-arm reach, the correlation between the reach distance and the center of pressure deflection was remarkably higher as compared to two-arm reach.
The one-arm reach is more convenient to assess dynamic balance among young adults.
The one-arm reach is more convenient to assess dynamic balance among young adults.
Type of research
Comparative study
Bouillon et al.20116
5 To determine the intra- and intersession reliability of a Clever Balance Board, an original dynamic balance diagnostic tool.
5 To evaluate how age affects dynamic balance and excursion scores in Star Excursion Balance test.
Group 2:
20 healthy young adults (8 men, 12 women, age range 23.4 ±1.8 years)
29 adult aged women (age range 23-39 years)
24 middleaged women (age range 40-54 years).
Clever Balance Board (CBB)
Star Excursion Balance test
The participants performed a doubleleg balance test on a CBB. Intention was to stand with both legs on the board in a semi-squat posture with arms on the hips and eyes open and maintain balance for 40 s. Test was repeated 2 days later by the same examiner
Participants carried out 3 reaches in a randomized order. Directions were anteromedial, medial and posteromedial. There were 3 trials for each.
A high retest correlation was found for all three balance indicators (percentage of active time, average angular velocity during active balancing and average frequency of changing the direction of movement). Within-individual variation was acceptable. Between the two sessions, no significant differences were found.
By using SEBT to investigate dynamic balance, moderate to high reliability was found between the adult and middle-aged groups across all directions.
Crosssectional study
Coughlan et al. 20127
5 To compare the anterior, posteromedial, and posterolateral directions between SEBT and YBT and figure out if any differences appear in a reach distance.
20 healthy active males (age 22.5 ± 3.05 years).
Star Excursion Balance Test SEBT and Y Balance Test YBT
Participants performed two test sessions at least 7 days apart. 3 trials were allowed in each test direction.
There was a difference in the anterior reach between SEBT and YBT The Bland-Altman analysis demonstrated SEBT reach excursions to be greater than YTB values on average. Reach distance was further in SEBT on both legs. In the posteromedial and posterolateral directions there were no differences. Paired sample correlations were parallel between SEBT and YBT
Crosssectional study
Comparative study
Table 2. Overview of included articles.Authors/ year PEDro scale score
Teyhen et al. 201417
Schmidt et al. 201513
Objectives
3 To clarify the association between specific balance, flexibility, strength, power, and endurance measures. Y-Balance test and functional movement screen (FMS) were used in a comparison.
4 To use the Posturomed device to analyze intra- and inter-day reliability of dynamic balance responses after perturbations that were unexpected.
Bonnechère et al.
201616
Mengarelli et al. 201815
3 To verify the usability of Nintendo Wii Balance Board (NBB) assessing dynamic balance responses after perturbations that were unexpected.
3 To establish if the Nintendo Wii Balance Board NBB could be used as reliable device for dynamic balance measuring.
Ringhof et al. 201814
4 To compare three common dynamic balance tests and investigate how these tests measure dynamic postural stability
Sample Balance testing device or tool?
64 healthy, active, duty service members. (53 men and 11 women, age 25.2 ± 3.8 years).
30 healthy young adults (15 men and 15 women, age range 24.3 ± 3.2 years).
35 healthy adults (21 men and 14 women, age 25 ± 3 years).
48 healthy young adults (age range 23.4 ± 2.1 years).
24 healthy young females (12 training swimming, 12 gymnastics, age 23.7 ± 1.0 years).
Balance measurement: Y-Balance Test YBT
There were 7 testing positions and subjects performed the tests in a counterbalanced order.
Balance measurements: Assessed using Y-Balance Test. 6 trials were allowed to achieve 3 successful trials. Of these 3 trials the maximum and average reaching distance of each direction were recorded.
The Posturomed device Participants were standing on the Posturomed with their dominant leg. Anterior-posterior and medial-lateral perturbations were caused. 12 trials in both directions were gathered in a randomized order. Each participant performed the testing procedure twice per day and repeated it another day.
Nintendo Wii Balance Board NBB and a gold standard force plate FP
The Functional Reach Test by using Nintendo Wii Balance Board NBB
One-leg jump landing, Posturomed perturbation and stimulated forward fall.
Subjects played two serious games that were specially developed. Displacements of center of pressure were concurrent registered with NBB and FP. FP was embedded within the laboratory floor and NBB layed on the top of it.
The participants accomplished the Functional Reach Test standing on NBB that was placed on a force plate FP. Data were simultaneously obtained from both devices.
The participants needed to regain balance as fast as possible in each of the tests. Footwear was standardized and subjects used the dominant leg. 3 valid trials were registered for each test.
Better performance on the YBT related better performance on FMS and upper trunk mobility tests, greater flexibility of gastrocnemius muscle and reduced hops in a 6-m hop test.
Type of research
Single cohortCorrelational study
For both perturbation directions and analyzed intervals were found good absolute
Repeatability study
Results showed an excellent correlation between Nintendo Wii Balance Board and force plate for each parameter for the two games.
Comparative study
FP and NBB-COP (center-of-pressure) displacements pointed a high correlation in both anterior-posterior and medial-lateral directions.
Comparative study
Low correlation was found between the tests in all measurements of dynamic stability.
Comparative study
rections (r > 0.990). The root-mean-square error values for center of pressure displacements were 1.14 ± 0.88 mm and 0.55 ± 0.28 mm in the anterior-posterior and medial-lateral directions, respectively. Bonnechère et al.16 reported an excellent correlation (r = 0.95 and 0.96) between the NBB and a gold standard force plate (AMTI model OR6-6, Watertown, MA), in two video games played by the participants during the examination.
Šarabon et al.11 investigated the inter-session reliability of the Clever Balance Board (CBB), a diagnostic tool for assessing dynamic balance. They used ICC-values, where values below 0.5 indicate poor reliability, between 0.5 and 0.75 moderate reliability, between 0.75 and 0.9 good reliability, and any value above 0.9 indicates excellent reliability They found a high test-retest correlation (ICC = 0.77-0.90) and acceptable within-individual variation (CV = 8.4-13.9%). No significant differences were observed between the two test sessions for all three CBB scores (t = 0.27-0.57; p > 0.5). These results suggest that the Clever Balance Board could be a reliable tool for assessing dynamic balance among healthy, physically active individuals.11 Another reliable electronic dynamic balance measuring system in healthy individuals is the Posturomed device (Haider Bioswing GmbH, Germany). Schmidt et al.13 demonstrated good relative and absolute reliability for the analyzed intervals and perturbation directions, with ICC values ranging between 0.71-0.97 for all intervals and intra- and inter-day comparisons. A mild learning effect was detected in the anterior-posterior direction when considering intra-day comparisons.13
Kage et al.12 compared the one-arm and two-arm functional reach tests and found that the one-arm reach test was more appropriate for assessing dynamic balance among young adults than the two-arm reach test. Significant correlations were observed between all reach distances (fingerto-finger, heel-to-finger, and finger forward distance) and center of pressure excursion in the one-arm reach test (r = 0.4-0.78). In contrast, the two-arm reach distances showed no significant correlation with center of pressure excursion, except for the heel-to-finger distance (r = 0.46, p < 0.05).12
Mengarelli et al.15 also used the functional reach test to establish the validity of the NBB for assessing dynamic balance. The validity of the NBB was evaluated by comparing it to a laboratory-grade force plate. They found a high correlation between the force plate and NBB center of pressure displacements in both the anterior-posterior (r = 0.998 ± 0.004) and medial-lateral (r = 0.995 ± 0.010) directions.15
Ringhof and Stein14 compared three common dynamic balance tests: one-leg jump landing, Posturomed perturbations, and simulated forward falls. They hypothesized a low correlation between these tests. However, no significant correlations were found between the dynamic balance tests, with r-values ranging from -0.161 to 0.057 There was also no significant correlation between static stability in single-leg stance, measured for comparison to dynamic stability, and the dynamic stability tests, with r-values ranging from -0.152 to 0.201. These findings suggest that different balance tests do not measure the same construct, i.e., dynamic postural balance, but rather task-specific sensorimo-
tor skills. Therefore, the results of different tests cannot be directly compared to each other.14
This systematic review underscores the importance of selecting appropriate postural balance assessment methods based on the target population and emphasizes the critical evaluation of validity, reliability, and repeatability. The study provides evidence supporting the Star Excursion Balance Test (SEBT) and the Y-Balance Test (YBT) as valid and reliable tools for measuring functional balance in healthy adults aged 19-54 years. Both tests have been extensively studied, with moderate to high reliability reported for the SEBT and high interrater and intrarater reliability for the YBT.
The YBT, specifically designed to enhance repeatability and standardize testing procedures, exhibits promising reliability and validity 9,18 Studies suggest an association between better YBT performance and improved physical capacity, highlighting its potential as an equipment free,19 valid and reliable dynamic balance measurement tool.17,20 However, the comparison between SEBT and YBT is complex, as differences in setup and participants’ postural control strategies influence assessment outcomes. The SEBT tends to yield higher results in anterior reach distance than the YBT especially with previously trained individuals,21 cautioning against direct comparisons7 between the two tests. Ultimately, both the YBT and SEBT are valuable tools for assessing dynamic balance, and the selection between them may be influenced by factors such as available equipment, specific research questions, or clinical preferences.
Additionally, the one-arm Functional Reach Test (FRT) challenges the prevailing use of the two-arm FRT, offering distinct benefits in evaluating dynamic balance. The onearm FRT, originally developed by Duncan et al.22 shows a higher correlation between reach distance and center of pressure excursion, suggesting advantages in assessing dynamic balance.12 Notably, the one-arm FRT is cost-effective, user-friendly, and demonstrates good intra-rater reliability,.23 The FRT has been established as a reliable measure for assessing limits of stability,24 detecting agerelated declines in performance,25,26 indicating physical frailty,27 and predicting fall risk.28 Further, no relationship has been reported between one-arm reach and trunk rotation.12,29
Furthermore, the Nintendo Wii Balance Board (NBB) exhibits a strong correlation with Force Plate (FP) measurements,15,16 showcasing potential as an affordable and portable balance assessment tool. Despite variations in reliability reported in different age groups, the NBB shows promise in clinical settings for assessing static balance.30‑32 Notably, despite the absence of a calibration procedure, the NBB exhibited good agreement with the a force plate.16 The NBB is a relatively new device for balance assessment, characterized by its affordability (<$100 USD) and portability, with a compact platform measuring 23 x 43 cm that captures vertical ground reaction forces when the user stands on it.30,33
Bower et al.34 conducted a study showing the NBB to be highly reliable for assessing static and dynamic balance in stroke patients. Zhong and Rau32 concluded that the NBB is a feasible tool for evaluating postural balance in a clinical setting, exhibiting good reliability and validity in older individuals. Conversely, Chang et al.35 reported lower reliability in young adults (mean age 22.17 ± 1.35 years) but higher reliability in elderly individuals (mean age 67.32 ± 3.43 years) when measuring standing balance using three different tests: standing with eyes open, standing with eyes closed, and one-leg standing.35 Clark et al.36 highlighted the acceptable reliability and validity of the NBB in measuring static standing postural balance. Hence, the NBB could be introduced as a reliable method for assessing postural balance in clinical settings.
The Posturomed device demonstrates good reliability for assessing dynamic balance among healthy adults.37 One major benefit is, that it is also employed as a training and therapy device for rehabilitation and sports injury prevention.38 However, the challenge related to its usability is the high price of the device (> 1800 €).39 While the Posturomed device may find utility in large clinics specializing in sports medicine, its everyday use in common clinics may be impractical.
The CBB’s reliability, particularly highlighted in the included study,40 positions it as a promising tool for evaluating dynamic balance in healthy, physically active adults. Its portability and moderate price further enhance its appeal, suggesting a potential role for widespread clinical use.40,41
The one-leg jump landing test is widely utilized for assessing dynamic balance.42‑44 The challenging nature of performing this measurement has highlighted significant variability in stability-based measurements of dynamic postural control.45 Thus, based on this research and the existing literature, it appears that the one-leg jump landing test may not be a reliable tool for assessing dynamic balance in individuals other than athletes.
In conclusion, the SEBT, YBT, one-arm FRT, NBB, CBB, and Posturomed device offer valid and reliable options for assessing dynamic balance, as well as to investigate the fall risk among elderly of individuals, predict future falls, and screen for potential balance-related disorders,1,46,47 each with unique advantages and considerations. The choice of method should align with the specific goals, target population, and available resources in clinical settings.
When assessing postural control in a clinical setting, it is essential to utilize quantitative, norm-referenced tools that meet specific criteria. These tools should: 1) Consider both the functional capabilities and quality of movements, 2) Demonstrate sensitivity and selectivity for identifying abnormalities in postural control, 3) Possess reliability and validity, and 4) Be practical, meaning they should be easy to use and cost-effective.47
This systematic review investigated the reliability and validity of various dynamic balance tests or testing devices. Based on the results of this research, the following tests have demonstrated both validity and reliability in assessing
dynamic balance: the Star Excursion Balance Test (SEBT), the Y-Balance Test (YBT), the One-Arm Functional Reach Test (FRT), the Clever Balance Board, the Posturomed device, and the Nintendo Wii Balance Board. SEBT, YBT, and FRT are all practical and cost-effective options, but YBT stands out due to its standardized protocol.9 Among the electronic balance boards, the Nintendo Wii Balance Board is the most practical tool, and thanks to its affordability and portability,33 it holds potential for broader clinical utilization.
Regarding the demands mentioned earlier, specifically 1) considering both the functional capabilities and quality of movements, and 2) demonstrating sensitivity and selectivity for identifying abnormalities in postural control, the results of this systematic review were unable to inform a definitive stance. Further investigation is required to address these aspects.
This systematic review has some limitations that should be acknowledged. Firstly, the number of studies included in this review was relatively small, comprising only nine studies. This limited sample size may restrict the comprehensiveness of the review Additionally, the number of participants in the studies included was also small, ranging from 20 participants to 64 participants. Furthermore, most participants were young adults, with ages ranging from 19 to 30 years, making it challenging to directly apply the results to aging adult’s individuals e.g., 50 to 54 years. The study by Bouillon and Baker,6 was the only one that included older participants, but it solely consisted of women, thereby lacking data on older men. This gender imbalance is a notable deficiency since gender can influence performance in balance tests.
The quality of the studies assessed using the modified PEDro scale ranged from “poor” to “good,” indicating an overall weak quality. Blinding participants in controlled training studies is often impractical, and blinding therapists or investigators is uncommon. As a result, the PEDro scale may not be the most suitable tool for evaluating the quality of the examined studies. Alternatively, the CASP Appraisal Checklist or LEGEND Evidence Evaluation Tools might have been more suitable for assessing systematic review articles of this nature. Furthermore, some studies did not properly divide participants into groups or used arbitrary divisions based on different characteristics such as age. It is also important to note that the participants in these studies were healthy adults without any specific treatment or therapy, further affecting the applicability of the PEDro score in assessing study quality.
In conclusion, this systematic review highlights the limited availability of dynamic and functional balance tests specifically designed for healthy, aged 19 to 54 years old individuals compared to elderly individuals. Among the tests reviewed, the YBT emerges as the most suitable option for
functional balance assessment in clinical settings. Additionally, the Nintendo Wii Balance Board stands out as a low-cost and reliable tool for balance assessment, showing potential for clinical use. Other viable tests include the SEBT and the one-arm functional reach test.
It is important to note that each dynamic and functional balance test measures different postural skills, making it challenging to directly compare results between tests. Further research is warranted, particularly focused on middleaged individuals who represent a potential at-risk population for future falls. By conducting more studies targeting this age group, a better understanding of their dynamic bal-
ance characteristics can be gained, contributing to the development of effective fall prevention strategies.
The authors report no conflicts of interest
© The Author(s) Submitted: September 18, 2023 CDT, Accepted: January 28, 2024 CDT
This is an open-access article distributed under the terms of the Creative Commons Attribution 4.0 International License (CCBY-NC-4.0). View this license’s legal deed at https://creativecommons.org/licenses/by-nc/4.0 and legal code at https://creativecommons.org/licenses/by-nc/4.0/legalcode for more information.
1. Hrysomallis C. Relationship between balance ability, training and sports injury risk. Sports Med 2007;37(6):547-556.
2. Woollacott MH, Tang PF. Balance control during walking in the older adult: research and its implications. Phys Ther. 1997;77(6):646-660. doi:10.1 093/ptj/77.6.646
3. Huxham FE, Goldie PA, Patla AE. Theoretical considerations in balance assessment. Aust J Physiother 2001;47(2):89-100. doi:10.1016/s0004-951 4(14)60300-7
4. Horak FB, Wrisley DM, Frank J. The balance evaluation systems test (BESTest) to differentiate balance deficits. Phys Ther 2009;89(5):484-498. doi:1 0.2522/ptj.20080071
5. Bronstein AM, Pavlou M. Chapter 16 - Balance. Barnes MP, Good DC, eds. Handb Clin Neurol 2013;110:189-208. doi:10.1016/b978-0-444-5290 1-5.00016-2
6. Bouillon LE, Baker JL. Dynamic balance differences as measured by the star excursion balance test between adult-aged and middle-aged women. Sports Health 2011;3(5):466-469. doi:10.1177/19417381114
14127
7. Coughlan GF, Fullam K, Delahunt E, Gissane C, Caulfield BM. A comparison between performance on selected directions of the star excursion balance test and the Y balance test. J Athl Train. 2012;47(4):366-371. doi:10.4085/1062-6050-47.4.03
8. Hertel J, Braham RA, Hale SA, Olmsted-Kramer LC. Simplifying the star excursion balance test: analyses of subjects with and without chronic ankle instability J Orthop Sports Phys Ther 2006;36(3):131-137 doi:1 0.2519/jospt.2006.36.3.131
9. Plisky PJ, Gorman PP, Butler RJ, Kiesel KB, Underwood FB, Elkins B. The reliability of an instrumented device for measuring components of the star excursion balance test. N Am J Sports Phys Ther 2009;4(2):92-99.
10. Kümmel J, Kramer A, Giboin LS, Gruber M. Specificity of balance training in healthy individuals: A systematic review and meta-analysis. Sports Med 2016;46(9):1261-1271. doi:10.1007/s40279-016-051 5-z
11. Šarabon N, Mlaker B, Markovic G. A novel tool for the assessment of dynamic balance in healthy individuals. Gait Posture. 2010;31(2):261-264. doi:1 0.1016/j.gaitpost.2009.11.001
12. Kage H, Okuda M, Nakamura I, Kunitsugu I, Sugiyama S, Hobara T. Comparison of the one-arm and two-arm functional reach test in young adults. J Phys Ther Sci 2009;21(2):207-212. doi:10.1589/jpts.2 1.207
13. Schmidt D, Germano AM, Milani TL. Aspects of dynamic balance responses: inter- and intra-day reliability. PLoS One. 2015;10(9):e0136551. doi:10.13 71/journal.pone.0136551
14. Ringhof S, Stein T Biomechanical assessment of dynamic balance: specificity of different balance tests. Hum Mov Sci 2018;58:140-147 doi:10.1016/j.h umov.2018.02.004
15. Mengarelli A, Cardarelli S, Strazza A, Di Nardo F, Fioretti S, Verdini F. Validity of the Nintendo Wii balance board for the assessment of balance measures in the functional reach test. IEEE Trans Neural Syst Rehabil Eng 2018;26(7):1400-1406. doi:1 0.1109/tnsre.2018.2843884
16. Bonnechère B, Jansen B, Omelina L, Sholukha V, Van Sint Jan S. Validation of the balance board for clinical evaluation of balance during serious gaming rehabilitation exercises. Telemed J E Health. 2016;22(9):709-717. doi:10.1089/tmj.2015.0230
17 Teyhen DS, Shaffer SW, Lorenson CL, et al. Clinical measures associated with dynamic balance and functional movement. J Strength Cond Res. 2014;28(5):1272-1283. doi:10.1519/jsc.000000000000 0272
18. Gribble PA, Robinson RH, Hertel J, Denegar CR. The effects of gender and fatigue on dynamic postural control. J Sport Rehabil 2009;18(2):240-257 doi:10.1123/jsr.18.2.240
19. Gribble PA, Hertel J, Plisky P Using the star excursion balance test to assess dynamic posturalcontrol deficits and outcomes in lower extremity injury: a literature and systematic review J Athl Train 2012;47(3):339-357 doi:10.4085/1062-6050-4 7.3.08
20. Lopes PB, Pereira G, Lodovico A, Bento PCB, Rodacki ALF. Strength and power training effects on lower limb force, functional capacity, and static and dynamic balance in older female adults. Rejuvenation Res 2016;19(5):385-393. doi:10.1089/rej.2015.1764
21. Thorpe JL, Ebersole KT Unilateral balance performance in female collegiate soccer athletes. J Strength Cond Res 2008;22(5):1429-1433. doi:10.151 9/jsc.0b013e31818202db
22. Duncan PW, Weiner DK, Chandler J, Studenski S. Functional reach: a new clinical measure of balance. J Gerontol 1990;45(6):M192-M197 doi:10.1093/geronj/ 45.6.m192
23. Rockwood K, Awalt E, Carver D, MacKnight C. Feasibility and measurement properties of the functional reach and thetimed up and go tests in the Canadian study of health and aging. J Gerontol A Biol Sci Med Sci 2000;55(2):M70-M73. doi:10.1093/geron a/55.2.m70
24. Spreitzer L, Perkins J, Ustinova KI. Challenging stability limits in old and young individuals with a functional reaching task. Am J Phys Med Rehabil. 2013;92(1):36-44. doi:10.1097/phm.0b013e318269d8f 9
25. Hageman PA, Leibowitz JM, Blanke D. Age and gender effects on postural control measures. Arch Phys Med Rehabil 1995;76(10):961-965. doi:10.1016/s 0003-9993(95)80075-1
26. de Waroquier-Leroy L, Bleuse S, Serafi R, et al. The functional reach test: strategies, performance and the influence of age. Ann Phys Rehabil Med. 2014;57(6-7):452-464. doi:10.1016/j.rehab.2014.03.00 3
27. Weiner DK, Duncan PW, Chandler J, Studenski SA. Functional reach: a marker of physical frailty J Am Geriatr Soc 1992;40(3):203-207 doi:10.1111/j.1532-5 415.1992.tb02068.x
28. Duncan PW, Studenski S, Chandler J, Prescott B. Functional reach: predictive validity in a sample of elderly male veterans. J Gerontol. 1992;47(3):M93-M98. doi:10.1093/geronj/47.3.m93
29. Volkman KG, Stergiou N, Stuberg W, Blanke D, Stoner J. Methods to improve the reliability of the functional reach test in children and adolescents with typical development. Pediatr Phys Ther 2007;19(1):20-27.
30. Clark RA, Bryant AL, Pua Y, McCrory P, Bennell K, Hunt M. Validity and reliability of the Nintendo Wii balance board for assessment of standing balance. Gait Posture. 2010;31(3):307-310. doi:10.1016/j.gaitpo st.2009.11.012
31. Huurnink A, Fransz DP, Kingma I, van Dieën JH. Comparison of a laboratory grade force platform with a Nintendo Wii Balance Board on measurement of postural control in single-leg stance balance tasks. J Biomech 2013;46(7):1392-1395. doi:10.1016/j.jbiome ch.2013.02.018
32. Zhong R, Rau PLP Are cost-effective technologies feasible to measure gait in older adults? A systematic review of evidence-based literature. Arch Gerontol Geriatr. 2020;87:103970. doi:10.1016/j.archger.2019.1 03970
33. Bartlett HL, Ting LH, Bingham JT Accuracy of force and center of pressure measures of the Wii balance board. Gait Posture. 2014;39(1):224-228. do i:10.1016/j.gaitpost.2013.07.010
34. Bower KJ, McGinley JL, Miller KJ, Clark RA. Instrumented static and dynamic balance assessment after stroke using Wii balance boards: reliability and association with clinical tests. PLoS One 2014;9(12):e115282. doi:10.1371/journal.pone.01152 82
35. Chang WD, Chang WY, Lee CL, Feng CY Validity and reliability of Wii fit balance board for the assessment of balance of healthy young adults and the elderly J Phys Ther Sci 2013;25(10):1251-1253. d oi:10.1589/jpts.25.1251
36. Clark RA, Mentiplay BF, Pua YH, Bower KJ. Reliability and validity of the Wii balance board for assessment of standing balance: A systematic review. Gait Posture 2018;61:40-54. doi:10.1016/j.gaitpost.20 17.12.022
37. Boeer J, Mueller O, Krauss I, Haupt G, Horstmann T Reliability of a measurement technique to characterize standing properties and to quantify balance capabilities of healthy subjects on an unstable oscillatory plattform (Posturomed). Sportverletz Sportschaden 2010;24(01):40-45. doi:10.1 055/s-0029-1245184
38. Kiss RM. A new parameter for characterizing balancing ability on an unstable oscillatory platform. Med Eng Phys. 2011;33(9):1160-1166. doi:10.1016/j.m edengphy.2011.04.017
39. Sport tec: Hider Bioswing Posturomed. Published 2022. https://www.sport-tec.com/posturomed-202-wi th-railings-60x60-cm-silver-3
40. Šarabon N, Omejec G. A novel testing tool for balance in sports and rehabilitation. IFMBE Proc. 2007;16(1):998-1001. doi:10.1007/978-3-540-7304 4-6_258/COVER
41. Panjan A, Sarabon N. Review of methods for the evaluation of human body balance. Sport Science Review 2010;19(5-6). doi:10.2478/v10237-011-0036-5
42. Liu K, Dierkes C, Blair L. A new jump-landing protocol identifies differences in healthy, coper, and unstable ankles in collegiate athletes. Sports Biomech 2016;15(3):245-254. doi:10.1080/14763141.2016.1158 859
43. Pau M, Arippa F, Leban B, et al. Relationship between static and dynamic balance abilities in Italian professional and youth league soccer players. Phys Ther Sport 2015;16(3):236-241. doi:10.1016/j.pt sp.2014.12.003
44. Brazen DM, Todd MK, Ambegaonkar JP, Wunderlich R, Peterson C. The effect of fatigue on landing biomechanics in single-leg drop landings. Clin J Sport Med. 2010;20(4). https://journals.lww.co m/cjsportsmed/Fulltext/2010/07000/The_Effect_of_Fa tigue_on_Landing_Biomechanics_in.7.aspx
45. Troester JC, Jasmin JG, Duffield R. Reliability of single-leg balance and landing tests in rugby union; prospect of using postural control to monitor fatigue. J Sports Sci Med. 2018;5(17):174-180. http://www.jss m.org
46. Tinetti ME, Baker DI, McAvay G, et al. A multifactorial intervention to reduce the risk of falling among elderly people living in the community. N Engl J Med 1994;331(13):821-827 doi:10.1056/nej m199409293311301
47. Horak FB. Clinical measurement of postural control in adults. Phys Ther 1987;67(12):1881-1885. doi:10.1093/ptj/67.12.1881
Appendix 1
Download: https://ijspt.scholasticahq.com/article/94612-validity-and-reliability-of-dynamic-and-functional-balancetests-in-people-aged-19-54-a-systematic-review/attachment/ 198517.docx?auth_token=ExW97QY0n3NU3koM5HW6
Brian T Swanson1 a , Marissa Hagenbruch1 , Bernardine Lapaan1 , Kirill Skipalskiy1
1 Rehabilitation Sciences, University of Hartford
Keywords: manipulation, mobilization, range of motion, shoulder, stretching, thoracic spine https://doi.org/10.26603/001c.95040
Background/purpose
Interventions including posterior glenohumeral mobilizations (PGM), sleeper stretches, and thoracic manipulation are commonly used to address posterior shoulder tightness. The purpose of this study was to assess the effects of adding thoracic manipulation to PGM and sleeper stretches on passive range of motion (PROM), joint mobility, and infraspinatus electromyographic (EMG) activity in shoulders with decreased internal rotation (IR) PROM.
Design
Randomized Sequential Intervention Laboratory Study
Methods
Forty individuals with clinically significant IR loss attended two study sessions. Participants were randomized to receive five 30 seconds bouts of either grade III PGM or sleeper stretching. Following a seven-day washout period, all participants attended a second session and received a prescriptive supine HVLA manipulation targeting the T3-4 segment, followed by the previously randomized intervention. Outcome measures included internal rotation PROM, horizontal adduction PROM, posterior glenohumeral joint translation assessed via ultrasound imaging, and EMG activity of the infraspinatus during a PGM. All outcome measures were assessed pre- and immediately post-intervention and compared statistically
Results
There were significant within-group, but not between-group, differences for IR and horizontal adduction PROM following a single session of PGM or sleeper stretch. When combined with thoracic manipulation, significantly smaller within session changes of IR PROM were observed for both PGM (mean difference 4.4 , p=0.017) and sleeper stretches (mean difference 6.4 , p=0.0005). There were no significant between group differences for horizontal adduction PROM, humeral head translation, or EMG activity across all time points.
Discussion
Both GH posterior mobilizations and sleeper stretches improved IR and horizontal adduction PROM in a single session. The addition of thoracic manipulation prior to local shoulder interventions resulted in smaller gains of both IR and horizontal adduction ROM.
Corresponding author:
Brian Swanson PT, DSc
University of Hartford, Department of Rehabilitation Sciences 200 Bloomfield Ave W. Hartford, CT 06117 bswanson@hartford.edu a
Level of evidence
Level 2
Shoulder pain is among the most common musculoskeletal conditions in adults. Posterior shoulder tightness (PST), and associated glenohumeral internal rotation deficit (GIRD), is one cause of shoulder pain that has been consistently associated with shoulder pathology.1‑6 PST may result from both muscular tightness and/or posterior capsular tightness,6‑10 and manifests clinically as limited internal rotation (IR)11 and horizontal adduction range of motion (ROM).12 Posterior capsular tightness has been shown to increase antero-superior humeral head migration,13 potentially leading to impingement syndrome,12 while the posterior rotator cuff and posterior deltoid have also been described as potential sources of PST 6 Electromyographic activity of the posterior rotator cuff muscles has been shown to be elevated in individuals with shoulder pain14 and stiffness,15 and elevated levels of muscular activity can influence angular ROM.16 Clinically, other than non-validated end feel testing which clinically appears more elastic in the presence of muscle shortening and firmer in the presence of capsular shortening, one challenge is the inability to differentiate muscular and capsular tightness as a cause of PST17 and thus guide treatment. Overall, this distinction may not be possible, as the infraspinatus has been shown to be reflexively active in response to discharge of capsular afferents as part of the synergistic interplay of static and dynamic stabilizers,18,19 and a combined source of PST is likely in most individuals.6
Posterior glide mobilizations (PGM) have been demonstrated to improve ROM in patients with a variety of shoulder pathologies.11,20 PGM are an anterior-to-posterior directed force applied to the humeral head, designed to translate the humeral head posteriorly within the glenoid fossa. Improved ROM may be due to capsular stretch, as the ability of PGM to produce a tensile load on the posterior capsule has been well established.21‑23 Prolonged bouts of joint mobilization may also produce neuromuscular changes, including decreased local resting electromyographic (EMG) activity 24 Previous authors have demonstrated improved humeral head translation accompanied by decreased EMG activity of the infraspinatus following sustained or oscillatory grade III PGM.15 Accordingly, improvements observed post-mobilization may be, at least partially, the result of decreased muscular activity
Stretching techniques are also well supported in the literature to improve shoulder ROM,2,25 commonly assumed to target elongation of the local musculature. Decreased neuromuscular activity following stretching in individuals with pathology is also well documented.26 Static stretching appears to have an inhibitory effect on the involved muscles, although this effect has not been seen consistently in healthy individuals.27 Static stretching has also been shown to result in decreased force output and decreased EMG activity of the involved muscle group(s).27 Stretching the muscles of the rotator cuff may decrease their overall
resistance to humeral head translation. However, the effects of stretching interventions on translatoric mobility within the shoulder and EMG activity of the rotator cuff have not been established.
Thoracic manipulation is commonly included in the treatment of individuals with shoulder pathology although systematic reviews offer conflicting conclusions regarding the effects in this population.28,29 Mintken et al. found baseline IR passive range of motion (PROM) limited to <53°, as is observed in individuals with PST, to be predictive as part of a test battery to determine likelihood of success for individuals with shoulder pain receiving cervicothoracic manual therapy including thoracic manipulation,30 and da Silva et al. observed increased shoulder flexion and abduction ROM in individuals with shoulder pain following a single T4-5 manipulation.31 Prior researchers have suggested that observed functional and GH ROM changes following thoracic manipulation are likely not due to mechanical changes, i.e. alterations of thoracic mobility or scapular kinematics.32 Rather, spinal manipulation is generally believed to cause a wide array of neurophysiologic effects, including either muscular excitation or inhibition.33, 34 It is possible that the observed functional improvements observed following thoracic manipulation are due to neurophysiologic effects, potentially including some combination of decreased posterior rotator cuff activity and/or alterations in the afferent discharge from the glenohumeral capsule, and it is currently unclear if thoracic manipulation will result in decreased infraspinatus EMG activity, along with increased shoulder IR PROM and posterior joint mobility, in individuals with a loss of IR PROM.
In clinical practice, each of these techniques are widely utilized, and often in combination. However, the authors are not aware of any trials reporting a comparison of the immediate effects of the PGM and sleeper stretches in conjunction with thoracic manipulation on PROM, humeral head translation, and EMG activity in individuals who lack glenohumeral IR PROM. The authors hypothesized that the addition of thoracic manipulation would result in inhibition of the infraspinatus and be accompanied by greater gains in ROM and translation following PGM or stretching when compared to PGM or stretching alone. The purpose of this study was to assess the effects of adding thoracic manipulation to PGM and sleeper stretches on PROM, joint mobility, and infraspinatus EMG activity in shoulders with decreased IR PROM.
This study utilized an assessor blinded, sequential, quasiexperimental repeated measures design that occurred in the human performance lab at the University of Hartford, West Hartford, CT, USA between March 31 and June 30, 2021. The study was approved by the University of Hartford Institutional Review Board, and prospectively registered at clinicaltrials.gov, NCT04777370.
Of the variables considered for this study, while IR PROM was considered the primary outcome of interest, EMG activity had the smallest reported effect size. Therefore, the sample size was determined using the differences in EMG activity observed in prior studies. Utilizing an α=0.05, 1-β=0.80, and a 5% difference in EMG activity between groups as observed by Muth35 and a standard deviation of ±5 as reported by Dunning and Rushton,36 a minimum of 16 subjects per group were required. To account for potential attrition and to ensure adequate sample size, 40 individuals (20 per combined intervention group) were enrolled.
A convenience sample of individuals who self-identified as having limited IR ROM was recruited via flyer, email, and word of mouth at the University of Hartford.
All participants were screened for inclusion/exclusion criteria via questionnaire and a brief screening exam. Volunteers were included if they were between the ages of 18-60 years old, and presented with a loss of GH IR PROM greater than 15° at 90° of shoulder abduction while seated with the scapula manually stabilized compared to the contralateral side.2
Consistent with prior studies examining the shoulder and thoracic spine,37,38 individuals were excluded if they reported any of the following conditions: current neck or upper back pain; prior shoulder, neck or upper back surgery; any previous injury to the neck or thoracic area; active inflammatory disease; osteoporosis; signs/symptoms of radiculopathy; upper motor neuron lesions; spinal cord pathology; local infection; active or history of cancer; long term corticosteroid use; systemically unwell; systemic hypermobility; connective tissue disease; pregnancy or recent pregnancy; blood clotting disorder; receiving workman’s compensation or involved in active litigation; or any other known contraindication to manual therapy
Participants were randomized to either the mobilization or stretching intervention during the first session. A blinded third party prepared a set of sealed, opaque envelopes containing the intervention; participants selected an envelope and allocation was revealed to the examiner immediately prior to the intervention. During the second session, all participants received the thoracic manipulation intervention followed by the previously selected mobilization or stretching intervention.
All outcome measures were assessed by research associates blinded to group allocation.
Internal rotation PROM at 90° abduction: IR PROM of the involved shoulder was assessed in a seated position at 90 degrees abduction, with the scapula manually stabilized9 (MDC90: <5.5°).38 Measurements were performed using the inclinometer app for Android; smartphone based inclinometers have demonstrated excellent agreement with goniometry for ROM measurements of the shoulder (SEM overall: 3.6°, IR at 90° abd: 6.3°).39 Two trials were performed both pre-post intervention with the mean ROM used for analysis.
Horizontal adduction PROM: PST was assessed with the participant side-lying on the uninvolved side with the hips and knees flexed,1 as humeral horizontal adduction
motion is suggested to be the most consistent indicator of posterior shoulder mobility deficits.40 The participants arm was placed in 90° abduction and neutral rotation and grasped by the researcher just distal to the humeral epicondyles.8 The scapula was stabilized by the researcher and the arm was passively brought into maximal horizontal adduction, defined as the point at which movement ceased or the researcher could no longer stabilize the scapula1 (SEM 3°, MDC90 8°).41 Two trials were performed both pre-post intervention; measurements were performed using the inclinometer app for Android with the mean ROM used for analysis.
Electromyography (EMG): Muscle activity of the infraspinatus was collected using a Delsys Trigno EMG system (Delsys, Boston, MA) via surface electrodes. After exposing the posterior shoulder girdle, the area of the infraspinatus was cleaned using a cloth alcohol prep pad, and the skin at the area of electrode placement was vigorously abraded for 5 seconds. A calibrated wireless electrode was then placed according to SENIAM guidelines.42 Once electrode placement was complete, each participant performed a standardizing reference contraction of the infraspinatus to ensure optimal EMG activity The infraspinatus Maximal Voluntary Isometric Contraction (MVIC) was performed in standing, with the participant’s elbow against their side and flexed to 90°, and their distal forearm in neutral placed against a wall. The participant was asked to provide their maximal effort into external rotation against the wall for a period of five seconds. The peak activity during MVIC was selected for analysis using EMGworks (Delsys, Boston, MA) software.
Participants were then positioned supine on a standard plinth. To assess muscular activity during posterior humeral head translation, all participants received a 15 second sustained grade III PGM serving as the reference mobilization,43 with concurrent EMG and ultrasound data collection. To minimize motion artifact, the middle five seconds were utilized as the epoch of interest for EMG analysis. Reference mobilizations occurred at two time points: immediately pre- and immediately post-intervention.
Prior to analysis, all EMG data were RMS filtered using EMGworks software to create linear envelopes and normalized to the MVIC. Intraday EMG assessment of the infraspinatus using sub-maximal contraction has been shown to be reliable (ICC=0.98)44 and SEM values of 3.2-6.4% have been reported for surface EMG of the infraspinatus.45 Mean and peak values of infraspinatus activity during the reference mobilizations were calculated and compared between conditions during analysis.
Humeral Head Translation: A SonoSite MiniMaxx musculoskeletal ultrasound (US) unit (SonoSite, Bothell, WA) with a 5-11MHz linear transducer was utilized to measure the amount of humeral head translation occurring in the shoulder joint during the PGM techniques. US imaging has been shown to be a reliable measure of posterior translation of the humeral head during mobilization.46 The transducer was oriented horizontally over the anterior shoulder visualizing the coracoid process, the lesser
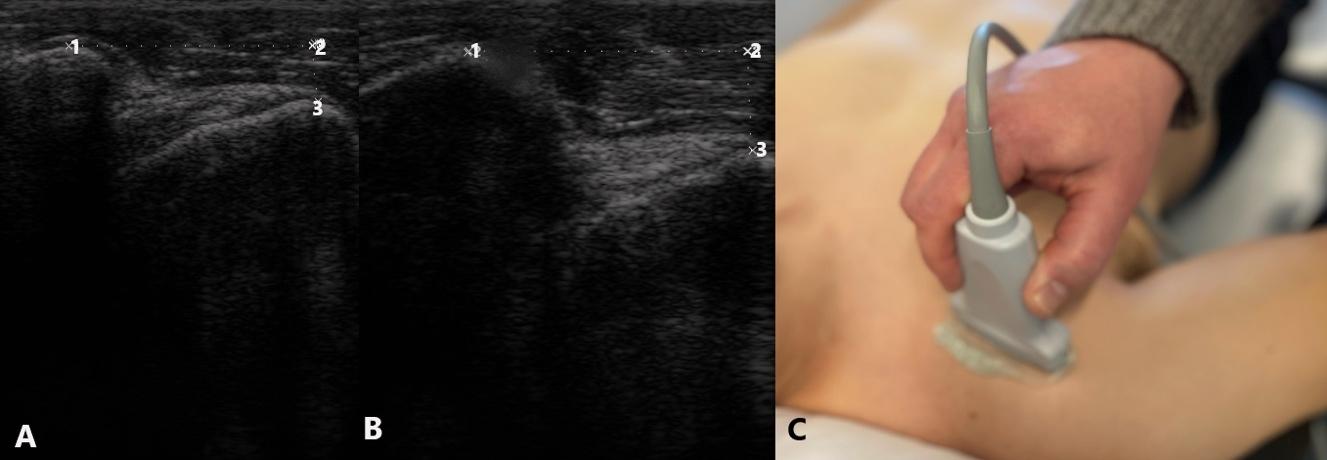
tuberosity, and the biceps tendon in the display (Figure 1) With the arm held in the GH resting position, a resting image was taken. The examiner then performed a PGM of the shoulder (static x 15 seconds) and a second image was obtained. For each image, a measurement of the distance between the most anterior aspect of the coracoid and the most anterior aspect of the lesser tuberosity was obtained. The amount of posterior humeral head translation was determined by subtracting the distance at rest from the distance during mobilization. Measures of humeral head position assessing anterior landmarks have been shown to have high levels of intra-tester reliability (ICC 0.93), SEM 0.5-1.0mm, SDD 1.6-2.7mm.47
Mobilization: All interventions were performed by an experienced therapist with fellowship training in manual therapy. The participant was positioned supine on a plinth, with their scapula stabilized against a firm wedge on the table, and the shoulder joint in the resting position (approx. 55° abduction, 30° horizontal adduction, and slight external rotation). With the extremity held in the same position, the researcher applied five 30-second bouts of sustained grade III PGM.15
Stretching: All participants randomized to the stretching group performed five 30-second holds of the sleeper stretch. This was performed by lying on the side to be stretched, elevating the upper arm to 90° on the support surface with the elbow bent 90°, then passively internally rotating the shoulder with force provided by with the opposite arm.2 Participants were instructed to push to the point of moderate-to-strong stretch within their tolerance and no more than mild discomfort (<4/10).
Thoracic manipulation: All individuals received a single supine grade V thrust manipulation as described by Cleland,48,49 localized to the T3-4 segment. The supine technique was selected as it has been shown to elicit a greater
change in pain when compared to seated techniques,50 and is more readily applied to the upper thoracic region than prone techniques. If a cavitation (“pop”) was not heard or felt by either the subject or examiner, a second thrust was performed.
Session #1: Baseline data collection → randomized intervention → post-intervention data collection → 7-day washout period51,52
Session #2: Baseline data collection → Thoracic manipulation → post-manipulation data collection → randomized intervention → post-intervention data collection
Based on the findings of Wang and Meadows, the effects of spinal manipulation on the shoulder last greater than 10 but less than 20 minutes post intervention.53 Therefore, all additional interventions and assessment took place within a 10-minute timeframe following the initial thoracic manipulation. The results of the final measurements taken during session two were compared to the results of session one to assess the additive effect of the thoracic manipulation.
All data were analyzed quantitatively in aggregate form using SPSS (IBM SPSS 25, Armonk, NY) and descriptive statistics were calculated using Microsoft Excel. The level of significance was established a priori with the α value set to .05 and the β set at 0.2.
Dependent variables included changes in IR and horizontal adduction ROM, change in humeral head translation, and change in EMG activity during reference PGM. Analysis followed intention-to-treat principles, and any missing data were imputed using baseline observations carried forward as a conservative estimate of effect.54 All data were assessed for normality using the Shapiro-Wilk test, visual inspection of the Q-Q plot and the Levene statistic
Figure 1. Ultrasound imaging of posterior translation A: Glenohumeral joint in resting position, B: Glenohumeral joint during posterior glide,for homogeneity of variance. Analyses were completed with and without outliers, defined as data points beyond the 95th percentile. No outliers materially affected the results, and therefore remained as the observed values best represent the sample characteristics.
Between group differences were assessed with repeated measures analysis of variance (ANOVA), pairwise testing, and post-hoc testing as appropriate. Simple between group comparisons were assessed with independent t-tests, and within group comparisons were assessed with paired ttests. As participants served as their own controls, the cumulative effects of the combined thoracic manipulation and mobilization/stretching intervention were compared to the single intervention session results. Effect sizes were calculated using the Cohen’s d statistic; effect sizes d=0.2 were considered small, d=0.5 medium, and d=0.8 large. Between session analyses of EMG data were not performed, as between session reliability of surface EMG is modest at best.55
Participant flow is detailed in Figure 2; demographics and baseline characteristics are shown in Table 1 There were no adverse events reported at any time during this study
SESSION 1
Following single interventions (PGM, sleeper stretching) no significant differences were observed between groups for IR ROM, horizontal adduction ROM, humeral head translation, or EMG activity. However, both interventions resulted in statistically significant within group changes (p<0.0001) with large effect sizes for IR (PGM 8.8±5.5°, 95% CI [6.4, 11.2], d=1.6; Sleeper 10.0±4.9°, 95% CI [7.9, 12.2], d=2.02) and horizontal adduction ROM (PGM 5.2±4.5°, 95% CI [3.2,7.2] d=1.15; Sleeper 3.1±2.1°, 95% CI [2.2,4.0], d=1.48) which also exceeded the SEM of the measures and IR ROM exceeding the MDC90 for both groups.
Changes in humeral head translation were observed within each group that were not intuitive. The change in measured excursion [(end position2 – starting position2)(end position1 – starting position1)] resulted in significant within group differences for the sleeper stretch (1.72±2.93mm, 95% CI 0.4, 3.0], p=0.017, d=0.59) but not
the PGM (1.23±3.56mm, 95% CI [-0.3, 2.8], p=0.138, d=0.35). However, the PGM resulted in a significant change (2.01±2.94mm, 95% CI [0.72, 3.30], p=.006, d=0.68) in posterior positioning of the humeral head (starting position2-starting position1) that was not observed for the sleeper stretch group (0.54±1.86mm, 95% CI [-0.28, 1.35], p=0.209, d=0.29) and exceeded the SEM and SDD of the measure. When both change in starting position and excursion were considered, there were significant within group changes for total posterior humeral head translation following both interventions (PGM 3.23±2.77mm, 95% CI [2.02, 4.44], p<0.0001, d=1.17; sleeper 2.68±2.77mm, 95% CI [1.47, 3.89] p=0.0003, d=0.97). EMG activity decreased following both interventions, but changes were not significantly different within (PGM -0.50±1.30%, 95% CI [-1.07, 0.07], p=0.102; sleeper -0.17±0.57%, 95% CI [-0.42, 0.08], p=0.209) or between groups (0.33%, p=0.305). (Table 2, Figure 3)
There were small carryover effects for baseline IR ROM (1.9°) and horizontal adduction ROM (0.5°) between Session 1 and Session 2 that were smaller than possible measurement error and did not reach statistically significant differences. There was a significant difference in baseline GH translation between Session 1 and Session 2 (2.0mm); this difference was significant for both the PGM (2.1±4.0mm, 95% CI[0.2, 4.0], p=0.03) and sleeper stretch (2.0±3.4, 95% CI[0.4, 3.6], p=0.019) groups and was within the proposed range of SDD for the measurement.
Thoracic manipulation resulted in a small increase in IR ROM (0.4°±4.5, 95% CI [-1.0, 1.8], p=0.539) that was not statistically significant. There were significant between group differences following single interventions (mobilization or sleeper [session 1] and thoracic manipulation [session 2]), F1,38=60.55, p<0.001. Post-hoc testing revealed significant differences between PGM and thoracic manipulation, (mean difference -8.4°, 95% CI [-11.5,-5.3], p<0.001,
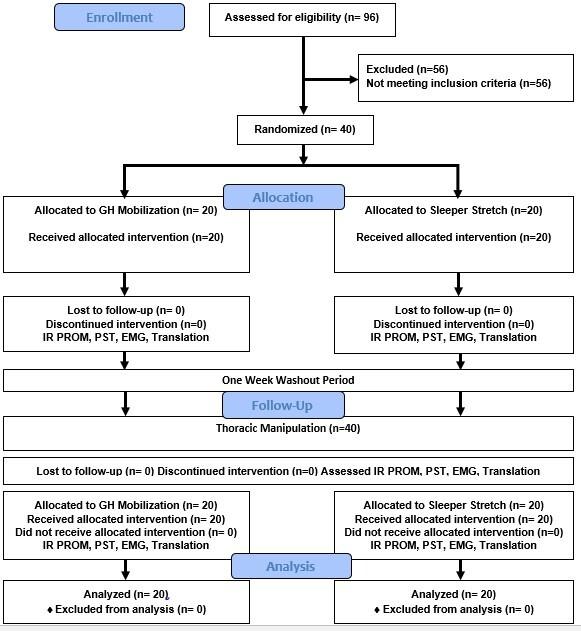
IR PROM= Internal rotation passive range of motion; PST= horizontal adduction ROM as a measure of posterior shoulder tightness; EMG= electromyography of the infraspinatus; Translation= glenohumeral posterior glide assessed with imaging ultrasound
d=1.67) and between sleeper stretching and thoracic manipulation, (mean difference -9.5°, 95% CI [-12.6, -6.4], p<0.001, d=2.04) with thoracic manipulation resulting in much smaller changes than the local shoulder interventions. (Table 3)
Thoracic manipulation resulted in small changes in horizontal adduction ROM (0.6°±3.4, 95% CI [-0.5, 1.7], p=0.285) that were not statistically significant. There were significant between group differences following single interventions (mobilization or sleeper [Session 1] vs thoracic manipulation [Session 2]), F1,38=21.69, p<0.0001. Post-hoc testing revealed significant differences between PGM and thoracic manipulation, (mean difference -4.6°, 95% CI [-6.9, -2.3], p<0.0001, d=1.15) and between sleeper stretches and thoracic manipulation, (mean difference -2.5°, 95% CI [-4.7, -0.2], p=0.031, d=0.88). (Table 3)
Thoracic manipulation resulted in small changes in mean EMG activity of the infraspinatus that were not statistically significant (mean difference -0.07±0.30, 95% CI [-0.03, 0.16], p=0.177, d=0.218]. Peak EMG demonstrated statistically significant changes that did not exceed SEM (mean difference 0.41±0.94% MVIC, 95% CI [0.11, 0.71], p=0.008, d=0.44). (Table 3)
Thoracic manipulation resulted in small changes in humeral head translation (0.3±3.0mm, 95% CI [-0.63, 1.23], p=.517) that were not statistically significant. For change in humeral head translation, there were significant between group differences for single interventions (mobilization or sleeper [Session 1] vs thoracic manipulation [Session 2]), F1,39=9.60, p=0.004. Post-hoc testing revealed significant differences between PGM and thoracic manipulation (mean difference -1.7±3.1mm, 95% CI [-3.1, -0.2], p=0.028, d=0.58) while between group differences for sleeper stretches and
Figure 2. Participant Flow DiagramBetween Group Comparisons
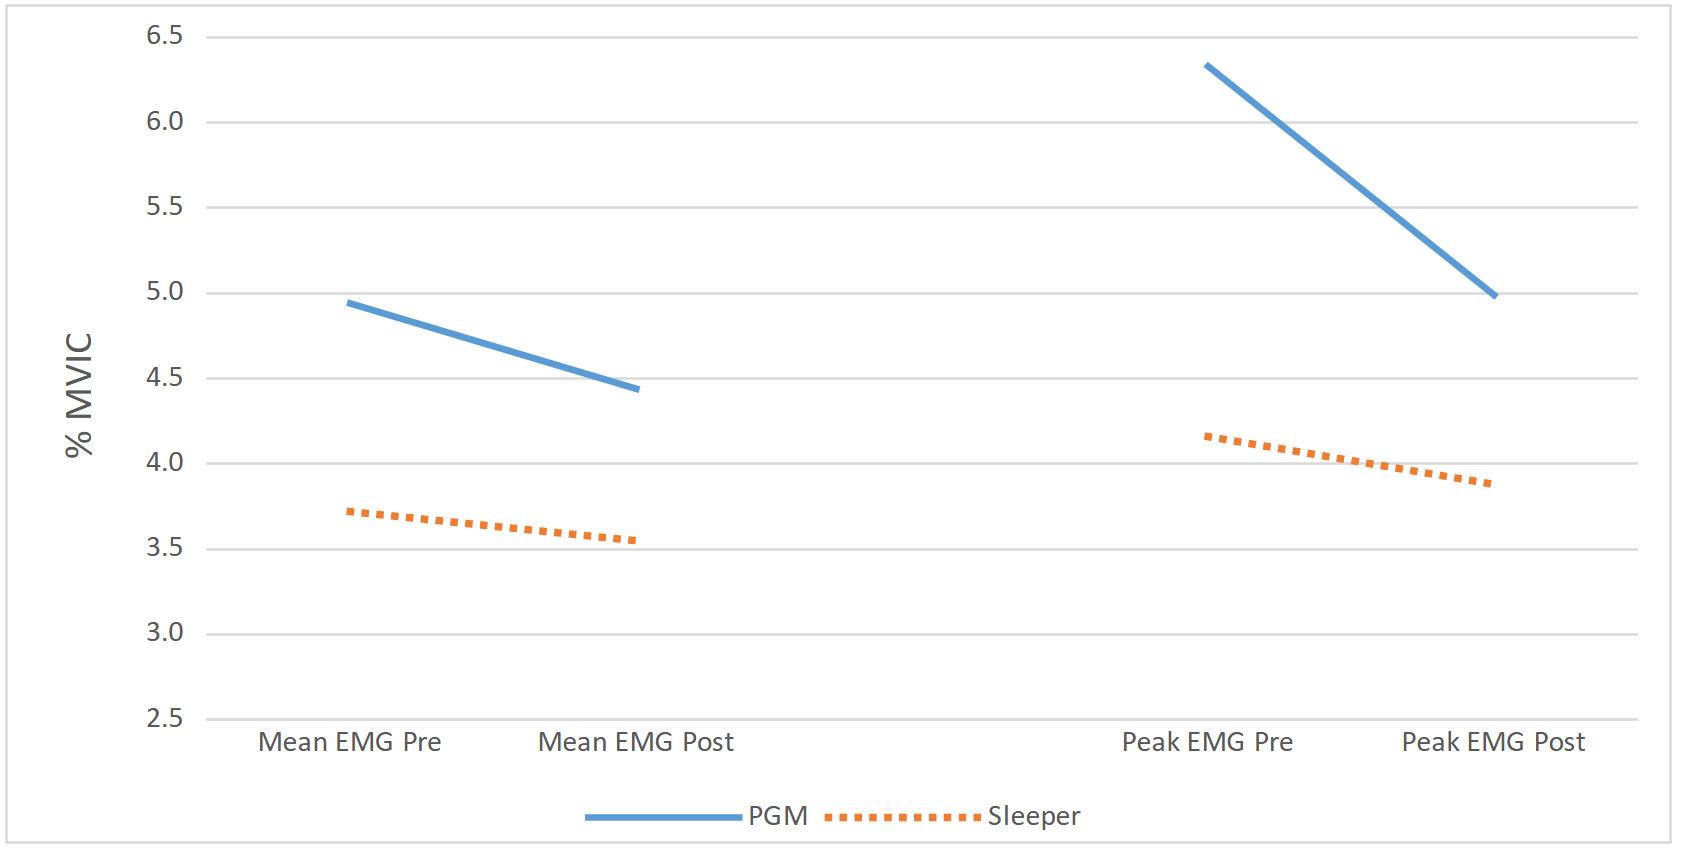
thoracic manipulation did not reach statistically significant differences (mean difference -1.8±4.0mm, 95% CI [-3.7, 0.1], p=0.057, d=0.66). (Table 3)
Table 2. Change following shoulder interventions only (Session #1)There were significant differences in IR ROM between single and combined interventions, F1,38=42.17, p<0.001. When combined with thoracic manipulation, both PGM and sleeper stretches resulted in significantly smaller within session changes for IR ROM compared to single interventions: PGM (mean difference 4.4°±7.5, 95% CI [0.9, 7.9] p=0.017, d=0.77); sleeper stretch (mean difference 6.4°±6.9, 95% CI [3.2, 9.6] p=0.0005, d=1.32). (Table 3, Figure 5)
Across all participants, there were significant differences in horizontal adduction ROM between single and combined interventions, F1,38=12.53, p=0.001. When combined with thoracic manipulation, both PGM and sleeper stretches resulted in smaller within session changes compared to single interventions that were not statistically significant: PGM (mean difference 2.6°±5.7, 95% CI [-0.04, 5.2] p=0.054, d=0.63); sleeper stretch (mean difference 1.5°, 95% CI [-0.9, 3.9] p=0.199, d=0.44). (Table 3, Figure 5)
When combined with thoracic manipulation, subsequent PGMs resulted in no further decrease in peak (mean difference -.02%±0.44% MVIC, 95% CI [-0.22, 0.19], p=.876, d=.04) and mean (mean difference .001±0.17% MVIC, 95% CI [-0.08, .08], p=0.979, d=.01) EMG activity When combined with thoracic manipulation, subsequent sleeper stretches resulted in further reductions in both peak (mean difference 0.21±0.68% MVIC, 95% CI [-0.11, 0.53], p=0.188, d=0.31) and mean (mean difference 0.16±0.30% MVIC, 95%
CI [0.02, 0.30], p=.027, d=0.53) EMG activity. (Table 3, Figure 4)
When combined with thoracic manipulation, changes in humeral head translation were smaller compared to mobilization or stretching alone: PGM (mean difference 0.26mm, 95% CI [-1.83, 2.35] p=0.775, d=0.08); sleeper stretch (mean difference 0.66mm, 95% CI [-1.07, 2.39] p=0.450, d=0.24), differences that were not statistically significantly different. (Table 3, Figure 5)
Overall, there were no significant differences in effect between five bouts of PGM and five bouts of sleeper stretching for IR ROM, horizontal adduction ROM, or humeral head translation. Change exceeded measurement error for each of these outcomes, suggesting that both interventions were helpful in achieving the desired outcomes. While both horizontal adduction and IR assess the motion of both the posterior muscles and posterior capsule,8 the greater observed improvement of horizontal adduction following PGM may be due to a more direct mechanical influence of PGM on the posterior capsule where mechanically the mobilization more closely approximates the test. Application of PGM at the resting position rather than in progressive end range motion may have limited the overall ROM gains observed.
Conversely, the sleeper stretch resulted in slightly greater IR gains than the PGM. The sleeper stretch is a more direct analog to the IR PROM test, with the greatest strain on the inferior fibers of the infraspinatus occurring in this position.56 Both PGM and sleeper stretches resulted in decreased EMG activity of the infraspinatus. This finding is in agreement with the conclusions of the recent system-
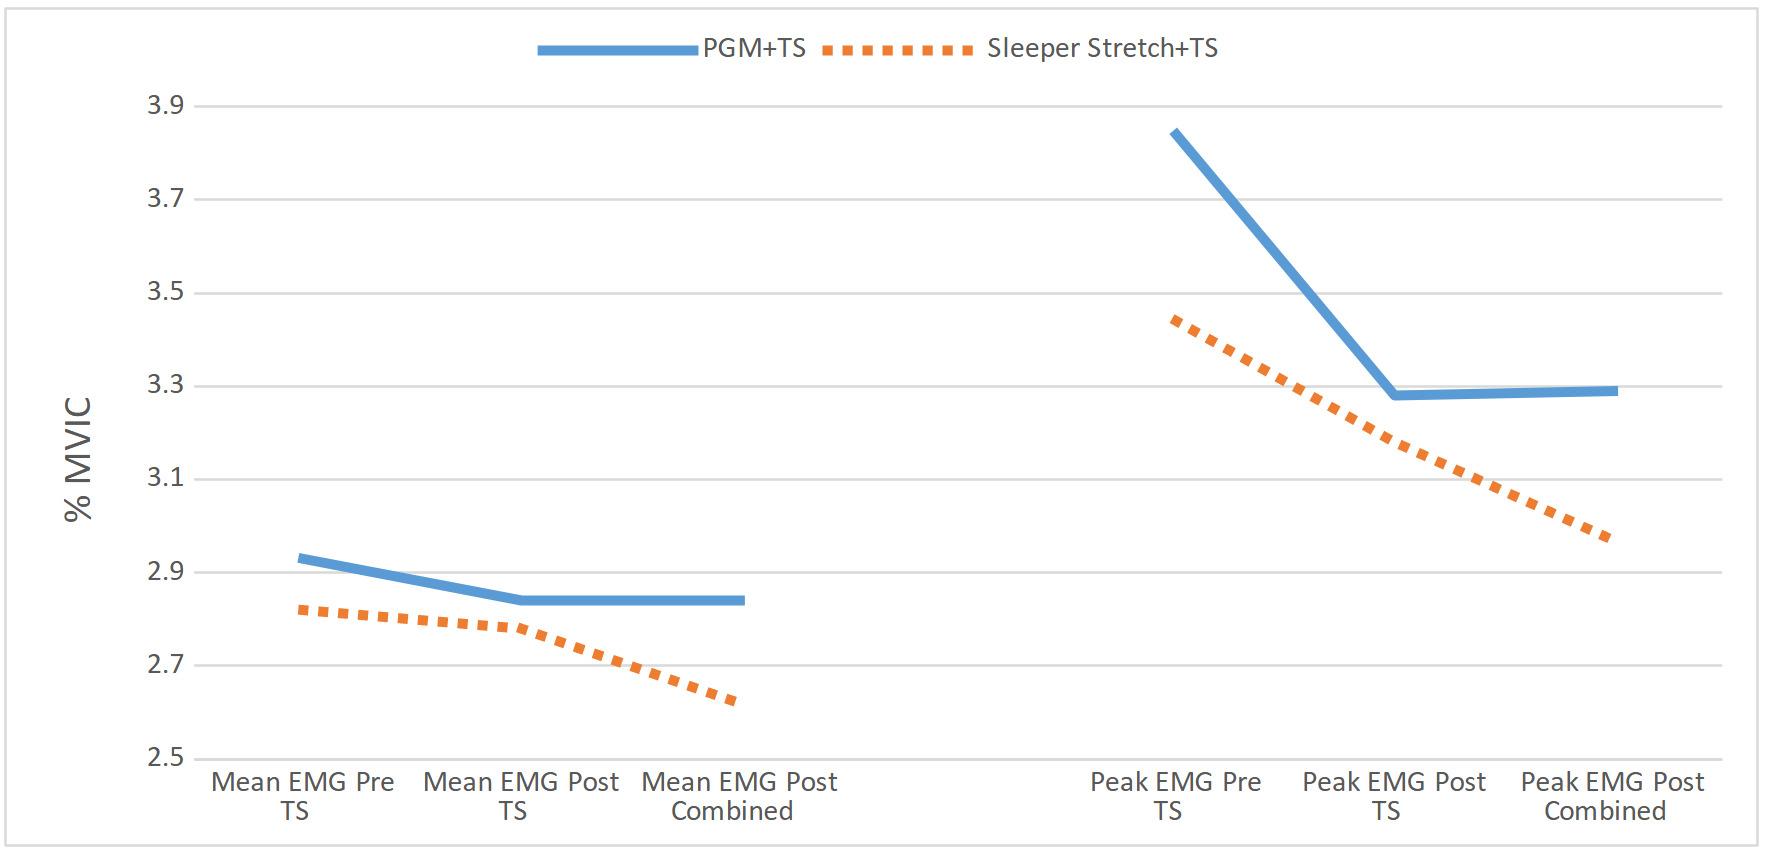
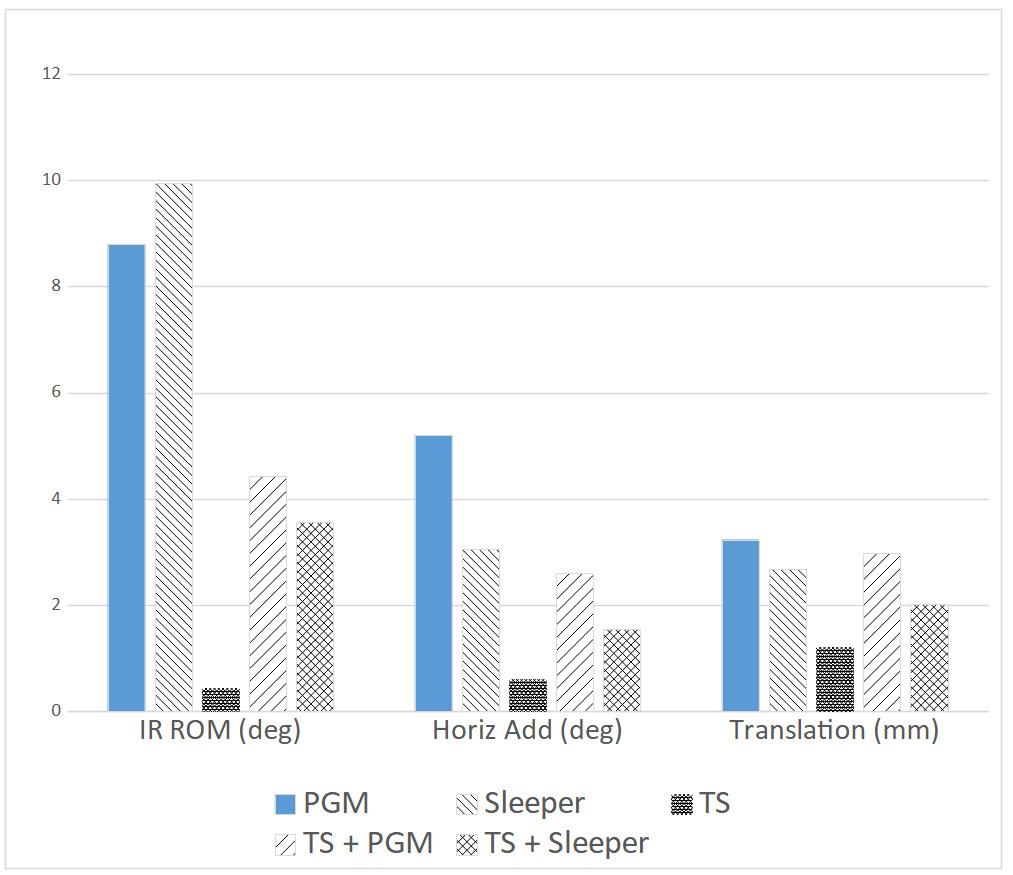
atic review by Pfleuger et al., who reported finding moderate quality evidence that “(peripheral) joint mobilization immediately decreases the activation of superficial muscles during low load conditions in symptomatic individuals”57 while also in concordance with studies regarding muscular inhibition following static stretching.27 Accordingly, clinicians should expect to see improvements in IR PROM following these interventions.
Contrary to the initial hypothesis, the addition of thoracic manipulation prior to mobilization or stretching resulted in significantly smaller gains in IR PROM which ex-
ceeded potential measurement error compared to mobilization or stretching alone. Changes in resting position were greater following combined interventions while infraspinatus EMG activity decreased following the combined interventions. Overall interpretation of the impact of combined interventions on GH translation is limited, as there were significant differences at baseline between session #1 and session #2. However, the overall difference in translation between sessions was smaller than SDD for the measure and accompanied by a difference in IR PROM of less than 2°. Accordingly, the observed 2mm difference may not be of clinical significance. It appears unlikely that the observed differences in ROM between single and combined interventions were due to differences in humeral head translation or infraspinatus EMG activity
From the current study, it is not entirely clear which muscles or mechanisms were responsible for limiting the IR PROM gains post thoracic manipulation. Previous work has demonstrated an increase in distal muscular activity following manipulation,36,53,58 and it is possible that thoracic manipulation had an excitatory effect on the middle deltoid58,59 or other shoulder musculature. For example, Hawkes et al. observed an increase in teres minor and latissimus dorsi activation in concert with deltoid contraction in individuals with rotator cuff pathology, proposed to be a means to decrease humeral head translation.60 Given the apparent lack of linear relationship between infraspinatus activity, GH translation, and IR PROM observed in this study, the assessment of only a single RC muscle is a clear limitation of this research, and further research is required to determine which muscles are responsible for the decrease in PROM observed following thoracic manipulation.
From a neurophysiologic perspective, when considering that the addition of PGM following thoracic manipulation resulted in no further changes in EMG activity of the in-
Figure 4. Mean and Peak EMG (%MVIC) Pre-Post Thoracic PGM= Posterior glenohumeral mobilization, TS= thoracic manipulation, Sleeper= sleeper stretch Figure 5. Change in ROM and Humeral Head Translation PGM= Posterior glenohumeral mobilization, TS= thoracic manipulation, Sleeper= sleeper stretchfraspinatus, it appears that PGM and thoracic manipulation may function through similar pathways/mechanisms. Following mobilization/manipulation, centrally mediated reflex arcs or changes in the sensitivity of the α-motoneurons have been described.61 Proprioceptive input comes from stretch sensitive mechanoreceptors in the joint capsule, muscle spindles, and from the Golgi tendon organs of local musculature, which is then mediated by the dorsal root ganglion.62 Fisher et al. suggested that high velocity manipulation appears to generate a supraspinal response, while changes following low velocity mobilization were likely the result of reduced spinal excitability 63 Contrary to their conclusions, in the current study, it appears that thoracic manipulation (high velocity) and PGM (low velocity) may have influenced a similar pathway as PGM generated no further inhibitory effect at the infraspinatus following thoracic manipulation. This discrepancy may be due to the presence of few mechanoreceptors in the shoulder capsule/ligaments,62 and responses to manual therapy may be region/tissue dependent. It is also possible that altered stretch tolerance is the result of changes to the input to nociceptive nerve endings in the joint and muscle.64 If the reduction in reflexive contraction during mobilization is due to altered nociceptive response, the current findings align with those of Coronado et al., who found a non-specific pain reduction effect at the shoulder that did not differ between cervical and shoulder thrust manipulation.65 However, the relation between the delivered manual therapy dose and subsequent treatment outcome remains unknown,66 and it may be plausible that there is not further neurophysiologic effect to be gained from further glenohumeral mobilizations following thoracic HVLA manipulation.
Conversely, stretching, and thoracic manipulation may influence different mechanisms/pathways as sleeper stretches, but not PGM, resulted in further reductions of EMG activity following thoracic manipulation. Previous research has suggested that stretching results in decreased EMG activity, likely via altered reflex sensitivity67 involving the fusiform/muscle spindle system.68 The discharge of muscle spindle endings is affected by local muscular stretch,69 while the γ-motoneuron controls the sensitivity of muscle spindle afferents as length detectors.70 Changes in γ-motoneuron activity may result in changes in 1a afferent activity and decreased α-motoneuron output.71 These apparent differences in mechanism of action between manipulation/mobilization and stretching support the concept of combined interventions with the intention of improving IR ROM, and may help explain the additive benefits of PGM and sleeper stretching observed previously.11
There is conflicting evidence regarding thoracic manipulation for individuals with shoulder dysfunction. Improvement following thoracic manual therapy has been observed in a case series of individuals with shoulder pain.72 Prior studies have demonstrated a short-term increase in scapular muscle strength, including the middle35 and lower trapezius.73 However, the observed improvements are not accompanied by changes in scapular mechanics,74 and the inclusion of thoracic manipulation vs sham manipulation
may not influence outcomes for individuals with shoulder impingement.75 A recent systematic review concluded that that manipulation of the thoracic spine has questionable effectiveness when compared to other interventions for improving pain and function for individuals with upper quarter musculoskeletal dysfunctions.76 Considering the results of the current study in the context of this previous research, the authors suggest the effect of thoracic manipulation is not one size fits all, but rather should be tailored to fit the clinical goals. If the clinical goal is to decrease pain28 or improve middle/lower trapezius recruitment, then thoracic manipulation may be indicated.73,77 However, if the primary impairment is limited IR PROM with the clinical goal to improve ROM, thoracic manipulation may at best have little benefit, or at worst be counter-productive. In this instance, it appears that either PGM or sleeper stretches would yield greater benefits.
There are several limitations to consider in the interpretation of these results. First, the sample was comprised of individuals with non-clinical shoulder stiffness, and most reported very low levels of pain. Since individuals with higher levels of pain have been shown to have higher levels of posterior rotator cuff EMG activity during PGM,14 a pain dominant sample may present with different results. Inclusion was based on the presence of a significant IR PROM loss. The screening and inclusion/exclusion did not account for the possibility of osseous limitations. It is possible that individuals within the study presented with IR PROM loss due to humeral torsion or other osseous limitations which would limit the individual’s ability to demonstrate change post intervention. The EMG measures only assessed the infraspinatus, and only during PGM. Based on the results, it appears clear that assessment of a greater range of shoulder muscles is required to elucidate the source of decreased ROM after the inclusion of thoracic manipulation, and that these muscles should be assessed during IR ROM measurements as well. Thoracic manipulation was only applied at one prescriptive spinal level. While prescriptive application improves internal validity of the study in answering the question of manipulative force applied to the upper thoracic region, this is not how the techniques are generally applied clinically It is not known if individuals would respond differently if the manipulation were applied at pragmatically identified symptomatic stiff and/or painful levels of the thoracic spine. It remains unknown whether the observed 2mm change in baseline translation between sessions was clinically meaningful, although the changes in translation were accompanied by very small changes in angular motion, and therefore appear unlikely to be meaningful. Further, while performed for a duration that is substantially less than general clinical application, the possibility that the initial PG used to determine baseline translation and EMG activity resulted in a treatment effect cannot be eliminated.
As expected, both GH posterior mobilizations and sleeper stretches improved both IR and horizontal adduction
PROM. The addition of thoracic manipulation prior to local shoulder intervention resulted in progressive reductions of infraspinatus EMG activity but also a reduction in ROM gains for both IR and horizontal adduction. These findings suggest that if the therapeutic intent is to improve IR ROM in individuals with non-painful, stiff shoulders, the addition of thoracic manipulation may be counterproductive.
This work was supported in part by a University of Hartford Greenberg Junior Faculty Grant. This support does not necessarily imply endorsement by the University of Hartford of project conclusions.
Submitted: August 11, 2023 CDT, Accepted: February 07, 2024 CDT
© The Author(s)
This is an open-access article distributed under the terms of the Creative Commons Attribution 4.0 International License (CCBY-NC-4.0). View this license’s legal deed at https://creativecommons.org/licenses/by-nc/4.0 and legal code at https://creativecommons.org/licenses/by-nc/4.0/legalcode for more information.
1. Kolber MJ, Hanney WJ. The reliability, minimal detectable change and construct validity of a clinical measurement for identifying posterior shoulder tightness. N Am J Sports Phys Ther 2010;5(4):208.
2. McClure P, Balaicuis J, Heiland D, Broersma ME, Thorndike CK, Wood A. A randomized controlled comparison of stretching procedures for posterior shoulder tightness. J Orthop Sports Phys Ther 2007;37(3):108-114. doi:10.2519/jospt.2007.2337
3. Tyler TF, Nicholas SJ, Roy T, Gleim GW Quantification of posterior capsule tightness and motion loss in patients with shoulder impingement. Am J Sports Med 2000;28(5):668-673. doi:10.1177/03 635465000280050801
4. Johnson JE, Fullmer JA, Nielsen CM, Johnson JK, Moorman CTI. Glenohumeral Internal Rotation Deficit and Injuries: A Systematic Review and Metaanalysis. Orthop J Sports Med. 2018;6(5):2325967118773322. doi:10.1177/232596711 8773322
5. Duzgun I, Turgut E, Çinar-Medeni Ö, et al. The presence and influence of posterior capsule tightness on different shoulder problems. J Back Musculoskelet Rehab. 2017;30(2):187-193. doi:10.3233/bmr-160731
6. Hall K, Borstad JD. Posterior shoulder tightness: to treat or not to treat? J Orthop Sports Phys Ther 2018;48(3):133-136. doi:10.2519/jospt.2018.0605
7. Myers JB, Oyama S, Wassinger CA, et al. Reliability, precision, accuracy, and validity of posterior shoulder tightness assessment in overhead athletes. Am J Sports Med. 2007;35(11):1922-1930. doi:10.1177/0363 546507304142
8. Tyler TF, Roy T, Nicholas SJ, et al. Reliability and validity of a new method of measuring posterior shoulder tightness. J Orthop Sports Phys Ther 1999;29(5):262-274. doi:10.2519/jospt.1999.29.5.262
9. Manske R, Wilk KE, Davies G, Ellenbecker T, Reinold M. Glenohumeral motion deficits: friend or foe? Int J Sports Phys Ther Oct 2013;8(5):537-553.
10. Kibler WB, Sciascia A, Thomas SJ. Glenohumeral internal rotation deficit: pathogenesis and response to acute throwing. Sports Med Arthrosc Rev 2012;20(1):34-38. doi:10.1097/jsa.0b013e318244853e
11. Manske RC, Meschke M, Porter A, Smith B, Reiman M. A randomized controlled single-blinded comparison of stretching versus stretching and joint mobilization for posterior shoulder tightness measured by internal rotation motion loss. Sports Health. 2009;2(2):94-100. doi:10.1177/194173810934 7775
12. Warner JJP, Micheli LJ, Arslanian LE, Kennedy J, Kennedy R. Patterns of flexibility, laxity, and strength in normal shoulders and shoulders with instability and impingement. Am J Sports Med 1990;18(4):366-375. doi:10.1177/03635465900180040 6
13. Harryman DT II, Sidles JA, Clark JM, McQuade KJ, Gibb TD, Matsen FA 3rd. Translation of the humeral head on the glenoid with passive glenohumeral motion. JBJS 1990;72(9):1334-1343. doi:10.2106/000 04623-199072090-00009
14. Swanson BT, Holst B, Infante J, Poenitzsch J, Ortiz A. EMG activity of selected rotator cuff musculature during grade III distraction and posterior glide glenohumeral mobilization: Results of a pilot trial comparing painful and non-painful shoulders. J Man Manip Ther. 2016;24(1):7-13. doi:1 0.1080/10669817.2015.1106819
15. Swanson BT, McAuley JA, Lawrence M. Changes in glenohumeral translation, electromyographic activity, and pressure-pain thresholds following sustained or oscillatory mobilizations in stiff and healthy shoulders: Results of a randomized, controlled laboratory trial. Musculoskelet Sci Pract 2020;50(102243):102243. doi:10.1016/j.msksp.2020.1 02243
16. Diong J, Gandevia SC, Nguyen D, et al. Small amounts of involuntary muscle activity reduce passive joint range of motion. J Appl Physiol. 2019;127(1):229-234. doi:10.1152/japplphysiol.0016 8.2019
17. Dashottar A, Borstad J. Posterior glenohumeral joint capsule contracture. Shoulder & Elbow 2012;4(4):230-236. doi:10.1111/j.1758-5740.2012.001 80.x
18. Diederichsen LP, Nørregaard J, Krogsgaard M, Fischer-Rasmussen T, Dyhre-Poulsen P Reflexes in the shoulder muscles elicited from the human coracoacromial ligament. J Orthop Res 2004;22(5):976-983. doi:10.1016/j.orthres.2003.12.01 9
19. Guanche C, Knatt T, Solomonow M, Lu Y, Baratta R. The synergistic action of the capsule and the shoulder muscles. Am J Sports Med 1995;23(3):301-306. doi:10.1177/03635465950230030 8
20. Johnson AJ, Godges JJ, Zimmerman GJ, Ounanian LL. The effect of anterior versus posterior glide joint mobilization on external rotation range of motion in patients with shoulder adhesive capsulitis. J Orthop Sports Phys Ther. 2007;37(3):88-99. doi:10.2519/josp t.2007.2307
21. Hsu AT, Ho L, Chang JH, Chang GL, Hedman T Characterization of tissue resistance during a dorsally directed translational mobilization of the glenohumeral joint. Arch Phys Med Rehabil 2002;83(3):360-366. doi:10.1053/apmr.2002.30621
22. Hsu AT, Ho L, Ho S, Hedman T. Joint position during anterior-posterior glide mobilization: its effect on glenohumeral abduction range of motion. Arch Phys Med Rehabil. 2000;81(2):210-214. doi:10.10 16/s0003-9993(00)90143-6
23. Muraki T, Yamamoto N, Berglund LJ, et al. The effect of cyclic loading simulating oscillatory joint mobilization on the posterior capsule of the glenohumeral joint: a cadaveric study J Orthop Sports Phys Ther. 2011;41(5):311-318. doi:10.2519/jospt.201 1.3448
24. DeVocht JW, Pickar JG, Wilder DG. Spinal manipulation alters electromyographic activity of paraspinal muscles: a descriptive study Journal of Manipulative and Physiological Therapeutics 2005;28(7):465-471. doi:10.1016/j.jmpt.2005.07.002
25. Tahran Ö, Yeşilyaprak SS. Effects of modified posterior shoulder stretching exercises on shoulder mobility, pain, and dysfunction in patients with subacromial impingement syndrome. Sports Health 2020;12(2):139-148. doi:10.1177/1941738119900532
26. De Vries HA. Electromyographic observations of the effects of static stretching upon muscular distress. Res Q 1961;32(4):468-479. doi:10.1080/1067 1188.1961.10613174
27 Herda TJ, Cramer JT, Ryan ED, McHugh MP, Stout JR. Acute effects of static versus dynamic stretching on isometric peak torque, electromyography, and mechanomyography of the biceps femoris muscle. J Strength Cond Res 2008;22(3):809-817 doi:10.1519/js c.0b013e31816a82ec
28. Peek AL, Miller C, Heneghan NR. Thoracic manual therapy in the management of non-specific shoulder pain: a systematic review. J Man Manip Ther. 2015;23(4):176-187 doi:10.1179/2042618615y.000000 0003
29. Bizzarri P, Buzzatti L, Cattrysse E, Scafoglieri A. Thoracic manual therapy is not more effective than placebo thoracic manual therapy in patients with shoulder dysfunctions: A systematic review with meta-analysis. Musculoskelet Sci Pract 2018;33:1-10. doi:10.1016/j.msksp.2017.10.006
30. Mintken PE, Cleland JA, Carpenter KJ, Bieniek ML, Keirns M, Whitman JM. Some factors predict successful short-term outcomes in individuals with shoulder pain receiving cervicothoracic manipulation: a single-arm trial. Phys Ther 2010;90(1):26-42. doi:10.2522/ptj.20090095
31. da Silva AC, Santos GM, de Godoy Marques CM, Marques JLB. Immediate effects of spinal manipulation on shoulder motion range and pain in individuals with shoulder pain: a randomized trial. J Chiro Med 2019;18(1):19-26. doi:10.1016/j.jcm.201 8.10.001
32. Kardouni JR, Pidcoe PE, Shaffer SW, et al. Thoracic spine manipulation in individuals with subacromial impingement syndrome does not immediately alter thoracic spine kinematics, thoracic excursion, or scapular kinematics: a randomized controlled trial. J Orthop Sports Phys Ther 2015;45(7):527-538. doi:10.2519/jospt.2015.5647
33. Bicalho E, Setti JAP, Macagnan J, Cano JLR, Manffra EF. Immediate effects of a high-velocity spine manipulation in paraspinal muscles activity of nonspecific chronic low-back pain subjects. Man Ther 2010;15(5):469-475. doi:10.1016/j.math.2010.0
3.012
34. Maduro de Camargo V, Alburquerque-Sendín F, Bérzin F, Cobos Stefanelli V, Rodrigues de Souza DP, Fernández-de-las-Peñas C. Immediate effects on electromyographic activity and pressure pain thresholds after a cervical manipulation in mechanical neck pain: a randomized controlled trial. J Manipulative Physiol Ther 2011;34(4):211-220. doi:1 0.1016/j.jmpt.2011.02.002
35. Muth S, Barbe MF, Lauer R, McClure P. The effects of thoracic spine manipulation in subjects with signs of rotator cuff tendinopathy J Orthop Sports Phys Ther. 2012;42(12):1005-1016. doi:10.2519/jospt.201
2.4142
36. Dunning J, Rushton A. The effects of cervical high-velocity low-amplitude thrust manipulation on resting electromyographic activity of the biceps brachii muscle. Man Ther 2009;14(5):508-513. doi:1 0.1016/j.math.2008.09.003
37 Puentedura EJ, Cleland JA, Landers MR, Mintken P, Louw A, Fernández-de-Las-Peñas C. Development of a clinical prediction rule to identify patients with neck pain likely to benefit from thrust joint manipulation to the cervical spine. J Orthop Sports Phys Ther 2012;42(7):577-592. doi:10.2519/jospt.201 2.4243
38. Cools AM, De Wilde L, Van Tongel A, Ceyssens C, Ryckewaert R, Cambier DC. Measuring shoulder external and internal rotation strength and range of motion: comprehensive intra-rater and inter-rater reliability study of several testing protocols. J Shoulder Elbow Surg. 2014;23(10):1454-1461. doi:10.1 016/j.jse.2014.01.006
39. Werner BC, Holzgrefe RE, Griffin JW, et al. Validation of an innovative method of shoulder range-of-motion measurement using a smartphone clinometer application. J Shoulder Elbow Surg 2014;23(11):e275-e282. doi:10.1016/j.jse.2014.02.030
40. Laudner KG, Stanek JM, Meister K. Assessing posterior shoulder contracture: the reliability and validity of measuring glenohumeral joint horizontal adduction. J Athl Train 2006;41(4):375-380.
41. Salamh PA, Kolber MJ. The reliability, minimal detectable change and construct validity of a clinical measurement for quantifying posterior shoulder tightness in the post-operative population. Int J Sports Phys Ther Dec. 2012;7(6):565-575.
42. Stegeman D, Hermens H. Standards for surface electromyography: The European project Surface EMG for non-invasive assessment of muscles (SENIAM). Enschede: Roessingh Research and Development 2007:108-112.
43. Kaltenborn FM, Evjenth O, Kaltenborn TB, Morgan D, Vollowitz E. Manual Mobilization of the Joints. Joint Examination and Basic Treatment: The Extremities Vol I. OPTP; 2011.
44. Ha SM, Cynn HS, Kwon OY, Park KN, Kim GM. A reliability of electromyographic normalization methods for the infraspinatus muscle in healthy subjects. J Human Kinet. 2013;36(1):69-76. doi:10.247 8/hukin-2013-0007
45. Alizadehkhaiyat O, Hawkes DH, Kemp GJ, Frostick SP. Electromyographic analysis of the shoulder girdle musculature during external rotation exercises. Orthop J Sports Med 2015;3(11):232596711561398. do i:10.1177/2325967115613988
46. Talbott and NR, Witt DW In vivo measurements of humeral movement during posterior glenohumeral mobilizations. J Man Manip Ther. 2016;24(5):269-276. doi:10.1179/2042618615y.0000000007
47 Bdaiwi AH, Herrington L, Almangoush A, Mackenzie TA, Porter SB. Assessment of the reliability of real time ultrasound scanning to measure the humeral head position in a number of glenohumeral joint positions. Phys Ther Rehabil 2014;1(1):1. doi:10.7243/2055-2386-1-1
48. Cleland JA, Childs JD, Fritz JM, Whitman JM, Eberhart SL. Development of a clinical prediction rule for guiding treatment of a subgroup of patients with neck pain: use of thoracic spine manipulation, exercise, and patient education. Phys Ther 2007;87(1):9-23. doi:10.2522/ptj.20060155
49. Cleland JA, Mintken PE, Carpenter K, et al. Examination of a clinical prediction rule to identify patients with neck pain likely to benefit from thoracic spine thrust manipulation and a general cervical range of motion exercise: multi-center randomized clinical trial. Phys Ther 2010;90(9):1239-1250. doi:1 0.2522/ptj.20100123
50. Karas S, Olson Hunt MJ. A randomized clinical trial to compare the immediate effects of seated thoracic manipulation and targeted supine thoracic manipulation on cervical spine flexion range of motion and pain. J Man Manip Ther 2014;22(2):108-114. doi:10.1179/2042618613y.00000 00052
51. Lee J, Cho JH, Kim KW, et al. Chuna manual therapy vs usual care for patients with nonspecific chronic neck pain: a randomized clinical trial. JAMA Netw Open 2021;4(7):e2113757 doi:10.1001/jamanet workopen.2021.13757
52. Teys P, Bisset L, Collins N, Coombes B, Vicenzino B. One-week time course of the effects of Mulligan’s Mobilisation with Movement and taping in painful shoulders. Man Ther 2013;18(5):372-377 doi:10.101 6/j.math.2013.01.001
53. Wang SS, Meadows J. Immediate and carryover changes of C5-6 joint mobilization on shoulder external rotator muscle strength. J Manipulative Physiol Ther. 2010;33(2):102-108. doi:10.1016/j.jmp t.2009.12.006
54. Jørgensen AW, Lundstrøm LH, Wetterslev J, Astrup A, Gøtzsche PC. Comparison of results from different imputation techniques for missing data from an anti-obesity drug trial. PLoS ONE 2014;9(11):e111964. doi:10.1371/journal.pone.01119 64
55. Balshaw TG, Fry A, Maden-Wilkinson TM, Kong PW, Folland JP Reliability of quadriceps surface electromyography measurements is improved by two vs. single site recordings. Eur J Appl Physiol 2017;117(6):1085-1094. doi:10.1007/s00421-017-359 5-z
56. Muraki T, Yamamoto N, Zhao KD, et al. Effect of posteroinferior capsule tightness on contact pressure and area beneath the coracoacromial arch during pitching motion. Am J Sports Med. 2009;38(3):600-607 doi:10.1177/0363546509350074
57 Pfluegler G, Kasper J, Luedtke K. The immediate effects of passive joint mobilisation on local muscle function. A systematic review of the literature. Musculoskelet Sci Pract 2020;45(102106):102106. do i:10.1016/j.msksp.2019.102106
58. Hegarty AK, Hsu M, Roy JS, Kardouni JR, Kutch JJ, Michener LA. Evidence for increased neuromuscular drive following spinal manipulation in individuals with subacromial pain syndrome. Clin Biomech. 2021;90(105485):105485. doi:10.1016/j.clinbiomech.2 021.105485
59. Lee JN, Yang SH, Gong WT. The effects of thoracic spine thrust manipulation on shoulder pain, range of motion and muscle activity in 30′ s adults with rounded shoulder posture. J Korean Acad Orthop Man Ther 2016;22(1):17-25.
60. Hawkes DH, Alizadehkhaiyat O, Kemp GJ, Fisher AC, Roebuck MM, Frostick SP. Shoulder muscle activation and coordination in patients with a massive rotator cuff tear: an electromyographic study. J Orthop Res. 2012;30(7):1140-1146. doi:10.100 2/jor.22051
61. Potter L, McCarthy C, Oldham J. Physiological effects of spinal manipulation: a review of proposed theories. Phys Ther Rev 2005;10(3):163-170. doi:10.1 179/108331905x55820
62. Diederichsen L, Krogsgaard M, Voigt M, DyhrePoulsen P Shoulder reflexes. J Electromyogr Kinesiol 2002;12(3):183-191. doi:10.1016/s1050-6411(02)0001 9-6
63. Fisher BE, Piraino A, Lee YY, et al. The effect of velocity of joint mobilization on corticospinal excitability in individuals with a history of ankle sprain. J Orthop Sports Phys Ther 2016;46(7):562-570. doi:10.2519/jospt.2016.6602
64. Magnusson SP, Simonsen EB, Aagaard P, Sørensen H, Kjaer M. A mechanism for altered flexibility in human skeletal muscle. J Physiol 1996;497(1):291-298. doi:10.1113/jphysiol.1996.sp02 1768
65. Coronado RA, Bialosky JE, Bishop MD, et al. The comparative effects of spinal and peripheral thrust manipulation and exercise on pain sensitivity and the relation to clinical outcome: a mechanistic trial using a shoulder pain model. J Orthop Sports Phys Ther. 2015;45(4):252-264. doi:10.2519/jospt.2015.5745
66. Pasquier M, Daneau C, Marchand AA, Lardon A, Descarreaux M. Spinal manipulation frequency and dosage effects on clinical and physiological outcomes: a scoping review. Chiropr Man Ther. 2019;27(1):23. doi:10.1186/s12998-019-0244-0
67 Marek SM, Cramer JT, Fincher AL, et al. Acute effects of static and proprioceptive neuromuscular facilitation stretching on muscle strength and power output. J Athl Train 2005;40(2):94-103.
68. Feher JJ. Quantitative Human Physiology: An Introduction. Academic press; 2017.
69. Edin BB, Vallbo AB. Dynamic response of human muscle spindle afferents to stretch. J Neurophysiol 1990;63(6):1297-1306. doi:10.1152/jn.1990.63.6.1297
70. Macefield VG, Knellwolf TP. Functional properties of human muscle spindles. J Neurophysiol 2018;120(2):452-467. doi:10.1152/jn.00071.2018
71. Avela J, Kyröläinen H, Komi PV. Altered reflex sensitivity after repeated and prolonged passive muscle stretching. J Appl Physiol 1999;86(4):1283-1291.
72. Strunce JB, Walker MJ, Boyles RE, Young BA. The immediate effects of thoracic spine and rib manipulation on subjects with primary complaints of shoulder pain. J Man Manip Ther 2009;17(4):230-236. doi:10.1179/106698109791352102
73. Cleland J, Selleck B, Stowell T, et al. Short-term effects of thoracic manipulation on lower trapezius muscle strength. J Man Manip Ther 2004;12(2):82-90. doi:10.1179/106698104790825284
74. Haik MN, Alburquerque-Sendín F, Silva CZ, Siqueira-Junior AL, Ribeiro IL, Camargo PR. Scapular kinematics pre–and post–thoracic thrust manipulation in individuals with and without shoulder impingement symptoms: a randomized controlled study. J Orthop Sports Phys Ther. 2014;44(7):475-487 doi:10.2519/jospt.2014.4760
75. Riley SP, Cote MP, Leger RR, et al. Short-term effects of thoracic spinal manipulations and message conveyed by clinicians to patients with musculoskeletal shoulder symptoms: a randomized clinical trial. J Man Manip Ther. 2015;23(1):3-11. do i:10.1179/2042618613y.0000000066
76. Schenk R, Donaldson M, Parent-Nichols J, Wilhelm M, Wright A, Cleland JA. Effectiveness of cervicothoracic and thoracic manual physical therapy in managing upper quarter disorders – a systematic review. J Man Manip Ther. 2021;30(1):1-10. doi:10.10 80/10669817.2021.1923313
Sean Hazzard1a , Saoirse Connolly2 , Ashley Wiater3 , Isabella Sprague3 , Emily Doolan-Roy3 , Rachel Lampros3 , Peter D Asnis4
1 Orthopaedic Surgery/Sports Medicine Service, Massachusetts General Hospital, 2 Massachusetts General Hospital, 3 Department of Physical Therapy, Massachusetts General Hospital, 4 Department of Orthopaedic Surgery/Sports Medicine Service, Massachusetts General Hospital
Keywords: Key Words: Anterior cruciate ligament, ACL, ACL rehabilitation, ACL quadriceps strength, limb symmetry index https://doi.org/10.26603/001c.94602
The anticipated timeline for muscle strength as well as return to running and sports are some of the most common inquiries by patients undergoing anterior cruciate ligament reconstruction. Despite the popularity of this procedure, the answers to these inquiries are not well described in the literature. The purpose of this study was to evaluate the range of quadriceps strength percentage and function benchmarks at various points after anterior cruciate ligament reconstruction surgery based on sex, age, and graft.
Methods
Patients who underwent anterior cruciate ligament reconstruction (ACLR) were evaluated at various points after their surgery with handheld dynamometer assessments. Additional hop and balance testing was performed and patients were evaluated for clearance for running and sport via a physical therapist directed functional movement assessment (FMA). The progression of quadriceps symmetry throughout the postoperative period was examined with multi-level models, estimates of time to reach 70%, 80%, and 90% quadriceps symmetry were obtained from the fitted model.
A total of 164 patients were evaluated. Patients either received bone-tendon-bone (BTB) autograft (n=118) or BTB allograft (n=46) for their ACL graft. Average age was 31.1 years-of-age (SD: 13.6). Males undergoing ACLR using BTB autograft (n=53) were able to achieve 80% quadriceps symmetry earlier than females (n=65) (5.7 months vs 7.1 months), were cleared to return to run sooner (5.6 months vs 6.8 months) and passed an FMA exam earlier (8.5 months vs 10 months). Males undergoing ACLR with allograft (n=13) were able to achieve 80% quadriceps symmetry earlier than females (n=33) (3.9 months vs 5.4 months) and were cleared to run sooner (4.5 months vs 5.8 months).
Patients undergoing BTB autograft obtain 80% quadriceps symmetry at an average of 5.7 months for males and 7.1 months for females. Individuals under the age of 25 obtain their quadriceps symmetry faster and are cleared to return to running faster than individuals over 25. Male sex is associated with decreased amount of time to obtain clearance for
Corresponding Author.
Sean HazzardMassachusetts General Hospital. Department of Orthopaedic Surgery; Sports Medicine Service. 52 Second Ave, 3rd Floor Blue Building, Waltham MA 02481
Shazzard@mgb.org. Phone: 617-643-0803
running and for full activity Male sex is associated with decreased amount of time to regain quadriceps symmetry however this was not significant.
4 (Case series)
Skilled post-operative rehabilitation after anterior cruciate ligament reconstruction (ACLR) with a specific focus on quadriceps strength symmetry has been a topic of increased attention especially in athletes returning to a pivoting sport.1‑4 A variety of return-to-sport (RTS) assessments and protocols have been suggested with evidence suggesting a decreased risk of reinjury based on passing certain criteria including quadriceps strength symmetry 2,5 Limb symmetry index (LSI) testing has become one of the most common ways to assess strength between limbs to help the patient and clinician customize exercise progressions.1,4,5 Pre-operatively and post-operatively, one of the more common inquiries patients have is when they would be estimated to reach certain quadriceps strength milestones to allow them to progress to activities like running and other activities.
The purpose of this study was to evaluate the range of quadriceps strength percentage and function benchmarks at various points after anterior cruciate ligament reconstruction surgery based on sex, age, and graft. The hypothesis was that most patients, especially autograft ACL reconstructions, will not reach 80% quadriceps symmetry until 4-6 months post-operatively.
After institutional review board approval, a REDCap database was established to collect demographic and outcomes data. Patients who underwent ACLR were evaluated at various points after surgery by one of the author team physical therapists and informed consent was obtained from the patient. Rights of the patient were protected. Surgeries were performed by various surgeons with unknown surgical technique other than type of graft utilized.
A handheld dynamometer (HHD) (MicroFET2 - Hoggan Scientific, Salt Lake City, Utah) was stabilized against an open-chain knee extension machine arm that was locked in a fixed position at 60 degrees of flexion (Figure 1).
This fixed position provides a more universal medium for strength examination and reduces the dependency on the measurer. Examiners included four experienced sports physical therapists who used the same setup and HHD device. All patients performed maximum effort knee extension against the HHD for three trials of five-second contractions and the average of these trials was recorded. Timing of this testing varied by patient physical comfort and ability to perform single leg strength training exercises such as step-downs, split squats, and single-leg dead lift without significant pain. This usually started 8-12 weeks form surgery. Clearance to initiate a walk-to-run progression was initiated when the patient had minimal to no effusion on
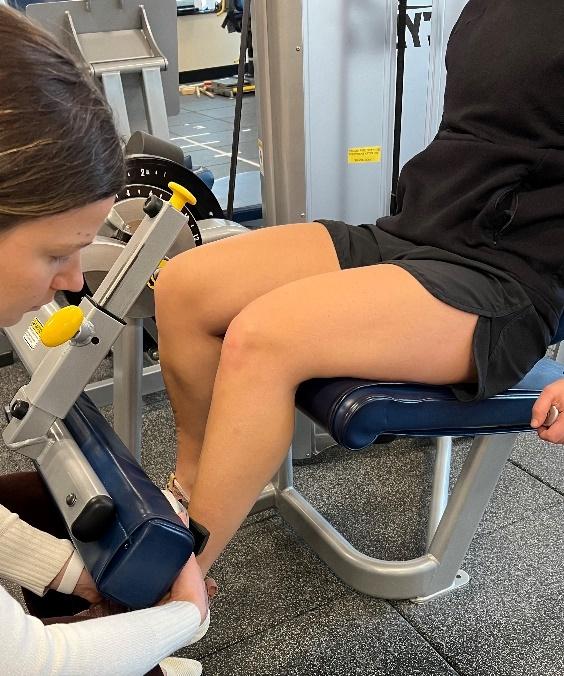
physical exam (Sweep test), had no pain with loading the knee with walking/light impact, stationary hop mechanics showed adequate load absorption (judged by physical therapist), and when the quadriceps index was at least 80%. Clearance to full activity and agility sport (if applicable) was when the patient underwent a standardized functional movement assessment (FMA) and the patient exhibited no pain, no effusion, quadriceps index over 90%, tolerated jogging, and hop testing (single leg, triple leg, crossover hop) was greater than 90% compared to the uninvolved limb, with good mechanics (as judged by the physical therapist: including no significant dynamic knee valgus or hip drop, appropriate knee excursion, and able to stick landing without loss of balance, etc). The same series of tests was used by all physical therapists and patients.
Descriptive statistics including mean and standard deviation for continuous variables and frequency and proportion for categorical variables were calculated to characterize the study group. The progression of quadriceps symmetry throughout the postoperative period was examined with multi-level models. A varying intercept at the patient level was included to account for repeated observations along with a varying slope for postoperative months to allow the effect of time on symmetry to vary across patients. Estimates of time to reach 70%, 80%, and 90% quadriceps symmetry were obtained from the fitted model,
Figure 1. Patient set-up with knee-extension machine locked at 60 degrees of flexion with HHD placed between tibia and arm of the machine.BTB=
which included fixed effects for graft and sex. To explore the role of age, the model was extended to include patients of age less than 25 and patients 25 or greater Results of inferential analyses are presented with 95% confidence intervals. All analyses with performed using R version 4.2.1 (R Core Team 2022) and the following packages: lme46 and ggeffects.6
A total of 164 patients were evaluated (98 female, 66 male) who underwent ACL reconstruction. Patients either received bone-tendon-bone (BTB) autograft (n=118) or BTB allograft (n=46) for their ACL graft. Average age was 31.1 years-of-age (SD: 13.6). The multilevel model for progression of quadriceps symmetry over postoperative period is presented in Table 1
The estimated time to reach quadriceps symmetry thresholds were evaluated by sex and graft type (Table 2, Figure 1).
A group of age under 25 years was added to the model to better reflect high school and collegiate athletes (Table 3).
On average, patients undergoing ACLR using BTB autograft (n=65) were estimated to achieve 70% quad symmetry at an average of 4.1 months, 80% at 7.1 months, and 90% at 10.2 months. Females were cleared to run at an average of 6.8 months and were able to pass a FMA exam at an average of 10 months. On average, males undergoing ACLR using BTB autograft (n=53) were estimated to achieve 70% quad
symmetry at an average of 2.6 months, 80% at 5.7 months, and 90% at 8.7 months. Males were cleared to run at an average of 5.6 months and were able to pass a FMA exam at an average of 8.5 months.
Patients undergoing ACL allograft were evaluated and separated by sex. On average, females undergoing ACLR using allograft (n=33, mean age 48.7 +/-7.0) were estimated to achieve 70% quad symmetry at an average of 2.3 months, 80% at 5.4 months, and 90% at 8.4 months. Average time to be cleared to return to running for female allografts was 5.8 months. Only two of 33 (6%) female patients were able to pass a FMA exam at an average of 8.3 months. On average, males undergoing ACLR using allograft (n=13, mean age 50.9 +/- 8.1) were estimated to achieve 70% quad symmetry at an average of 0.9 months, 80% at 3.9 months, and 90% at 7.0 months. Average time to be cleared for running for male allografts was 4.5 months (+/-2.0 months). Only 1 of 13 (8%) male patients passed an FMA exam at an average of 6.2 months.
Females under the age of 25 years-of-age (n=48, mean age 18.8 +/- 2.7) undergoing ACLR using BTB autograft were estimated to achieve 70% quad symmetry at an average of 3.91 months, 80% at 6.96 months, and 90% at 10.0 months. Average clearance to return to running was 4.7 months (+/-2.7) and clearance to full activities 9.0 months (+/- 1.7). Males under the age of 25 years-of-age (n=29, mean age 21.0 +/- 3.1) undergoing ACLR using BTB autograft were estimated to achieve 70% quad symmetry at an average of 2.40 months, 80% at 5.44 months, and 90%
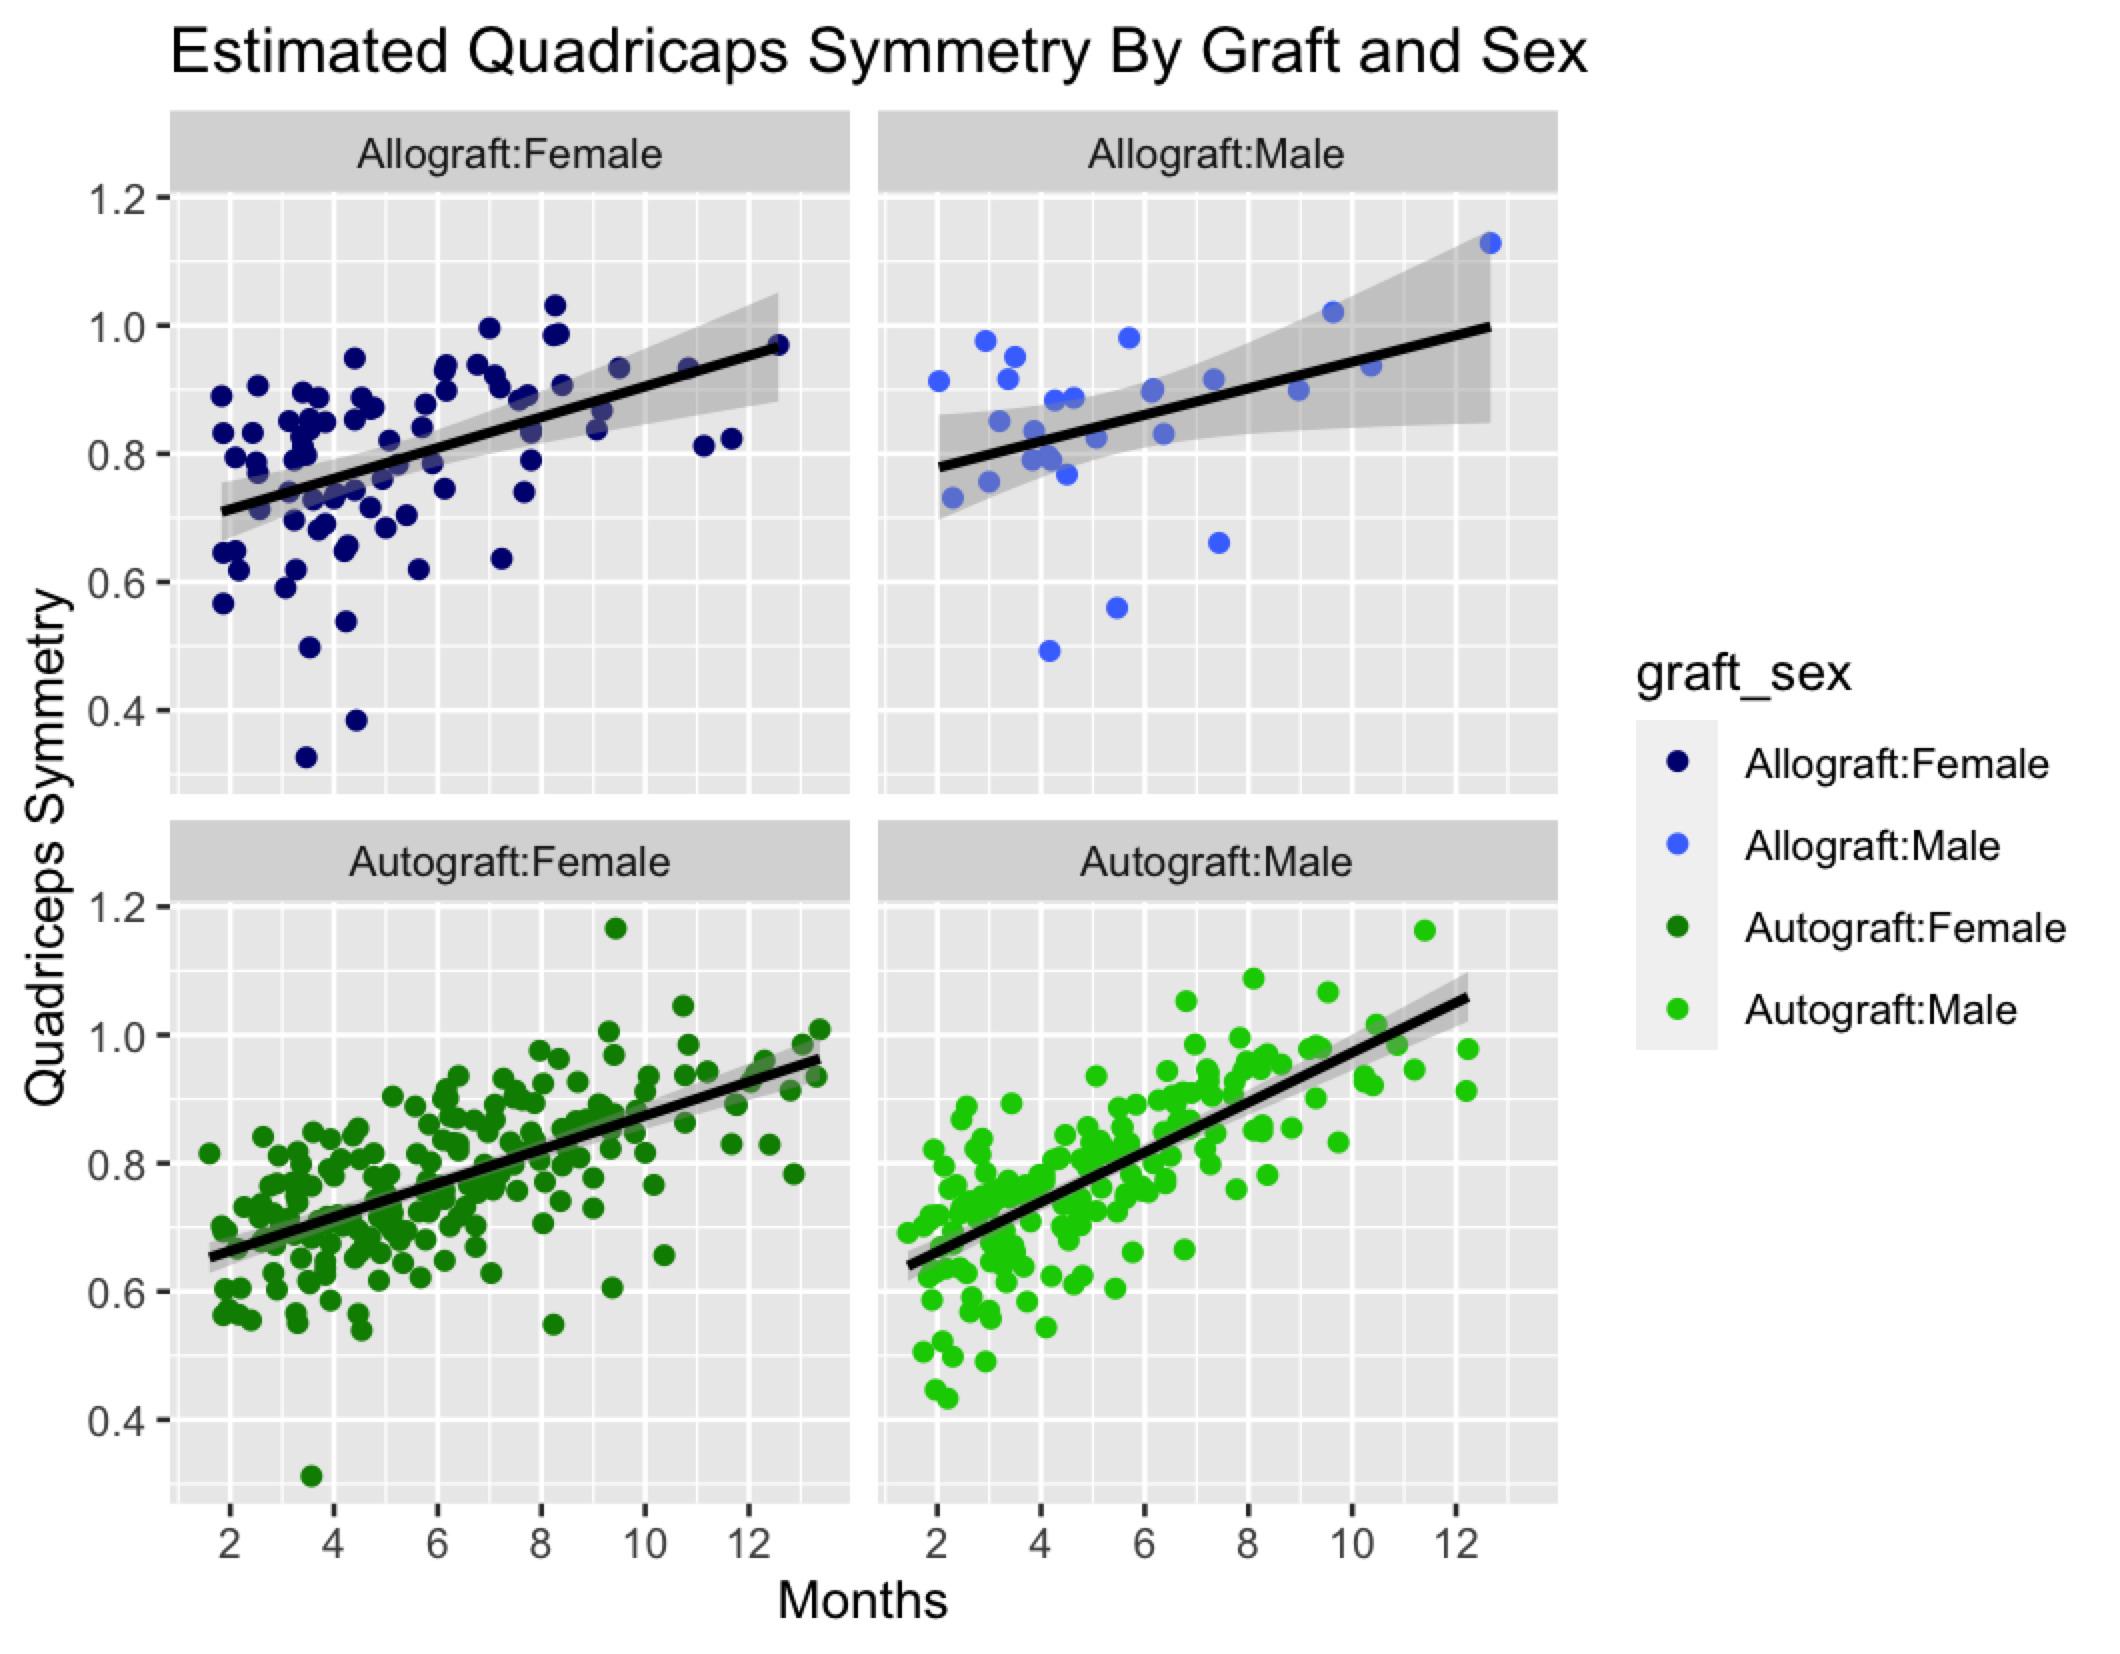
at 8.49 months. Average clearance to return to running was 3.3 months (+/-1.8) and clearance to full activities 6.6 months (+/- 2.6). Tables 3 and 4 further illustrates this breakdown by age.
Table 5 further evaluates the probability of patient testing out with various quadriceps percentages at different points after surgery based on confidence intervals.
The rehabilitation of ACL surgery is a widely discussed clinical phenomena with a myriad of methods and reviews articles available.7‑9 One of the most important factors that makes a clinical difference not only on patient reported outcomes but also ACL re-injury rates is quadriceps strength.10‑12 With only 55-80% of athletes reported to return to competitive sports there is opportunity for
providers to optimize the recovery of patients with the goal of increasing the percentage of athletes that return to their pre-injury level of competition.13‑15 Recognition of the importance of quadriceps strength symmetry can help decrease complications in athletes at the time of their return to sport and create a more accurate guideline for patients and providers to refer to during their recovery period rather than chronological guidelnes.2,5
The results of this study demonstrate a slower estimated progression of quadriceps strength return in patients who underwent BTB autografts in comparison to BTB allograft procedures regardless of age or sex. It took both males and females under 25 who underwent a BTB autograft over two months longer on average to reach the same quadriceps milestones (70%, 80%, 90%) as those who underwent allografts. This result is expected due to the increased trauma the knee experiences during graft harvest in patients un-
25 and greater
BTB= bone-tendon-bone
dergoing reconstruction using autografts. While a difference was observed between the estimated average recovery time for males and females, the difference in average time was not significantly different. Hannon et al. stated that age and sex only added 0.8% of variance for quad strength which is supported by the results of the current investigation.16 In counseling patients (and parents of younger patients), describing evidence-based expectations are important to establish especially given the notably high risk of re-injury (including contralateral injury) or ACL re-tear in the under-20 years-of-age population.17‑20
25 and greater
Limitations of this study include that only a small patient population that underwent allograft procedures. With only 13 males over 25 undergoing allograft reconstructions, the results may not be entirely representative of the recovery timeline for the larger population. Another limitation includes the separation of patients into cohorts based on age to represent athletic status may similarly misrepresent the larger population. A total of only three patients out of a possible 46 allograft patients passed an FMA exam though
Table 4. Estimated quadriceps strength symmetry by month separated by over/under age 25.all 46 attempted testing. It is unclear if patients simply elected to discontinue PT before passing it having achieved their relative goals or if they simply could not pass this in general. In order to fully account for outliers in overall quadriceps strength, future studies could separate patients based on pre-surgical quadriceps strength instead of age. Strengths of this study include the objective assessment of muscle strength and evaluation of hop mechanics by four experienced sports medicine physical therapists via the same methodologies.
Patients undergoing BTB autograft are estimated to obtain 80% quadriceps symmetry at an average of 5.7 months for males and 7.1 months for females. Individuals under the
age of 25 obtain their quadriceps symmetry faster and are cleared to return to running faster than individuals over 25. Male sex is associated with decreased amount of time to obtain clearance for running and for full activity. Male sex is associated with a decreased amount of time to regain quadriceps symmetry however this was not significant.
Submitted: October 22, 2023 CDT, Accepted: February 07, 2024 CDT
© The Author(s)
This is an open-access article distributed under the terms of the Creative Commons Attribution 4.0 International License (CCBY-NC-4.0). View this license’s legal deed at https://creativecommons.org/licenses/by-nc/4.0 and legal code at https://creativecommons.org/licenses/by-nc/4.0/legalcode for more information.
1. Ithurburn MP, Altenburger AR, Thomas S, Hewett TE, Paterno MV, Schmitt LC. Young athletes after ACL reconstruction with quadriceps strength asymmetry at the time of return-to-sport demonstrate decreased knee function 1 year later Knee Surg Sports Traumatol Arthrosc. 2018;26(2):426-433. doi:10.1007/s00167-017-4678-4
2. Lepley LK. Deficits in quadriceps strength and patient-oriented outcomes at return to activity after ACL reconstruction: A review of the current literature. Sports Health 2015;7(3):231-238. doi:10.11 77/1941738115578112
3. Schwery NA, Kiely MT, Larson CM, et al. Quadriceps strength following anterior cruciate ligament reconstruction: normative values based on sex, graft type and meniscal Status at 3, 6 & 9 Months. Int J Sports Phys Ther 2022;17(3):434-444. d oi:10.26603/001c.32378
4. Zwolski C, Schmitt LC, Quatman-Yates C, Thomas S, Hewett TE, Paterno MV The influence of quadriceps strength asymmetry on patient-reported function at time of return to sport after anterior cruciate ligament reconstruction. Am J Sports Med 2015;43(9):2242-2249. doi:10.1177/036354651559125 8
5. Grindem H, Snyder-Mackler L, Moksnes H, Engebretsen L, Risberg MA. Simple decision rules can reduce reinjury risk by 84% after ACL reconstruction: the Delaware-Oslo ACL cohort study Br J Sports Med 2016;50(13):804-808. doi:10.1136/bjsports-2016-096 031
6. Capin JJ, Snyder-Mackler L, Risberg MA, Grindem H. Keep calm and carry on testing: a substantive reanalysis and critique of ‘what is the evidence for and validity of return-to-sport testing after anterior cruciate ligament reconstruction surgery? A systematic review and meta-analysis.’ Br J Sports Med. 2019;53(23):1444-1446. doi:10.1136/bjsports-20 19-100906
7 Lüdecke D ggeffects: Tidy data frames of marginal effects from regression models. Journal of Open Source Software. 2018;3(26):772. doi:10.21105/joss.00 772
8. Abrams GD, Harris JD, Gupta AK, et al. Functional performance testing after anterior cruciate ligament reconstruction: A systematic review Orthop J Sports Med 2014;2(1). doi:10.1177/2325967113518305
9. Glattke KE, Tummala SV, Chhabra A. Anterior Cruciate Ligament Reconstruction Recovery and Rehabilitation: A Systematic Review. J Bone Joint Surg Am 2022;104(8):739-754. doi:10.2106/jbjs.21.00688
10. Rambaud AJM, Ardern CL, Thoreux P, Regnaux JP, Edouard P. Criteria for return to running after anterior cruciate ligament reconstruction: a scoping review Br J Sports Med 2018;52(22):1437-1444. doi:1 0.1136/bjsports-2017-098602
11. Goto S, Garrison JC, Hannon JP, et al. Quadriceps strength changes across the continuum of care in adolescent male and female athletes with anterior cruciate ligament injury and reconstruction. Phys Ther Sport 2020;46:214-219. doi:10.1016/j.ptsp.202 0.08.016
12. Harput G, Ulusoy B, Yildiz TI, et al. Crosseducation improves quadriceps strength recovery after ACL reconstruction: a randomized controlled trial. Knee Surg Sports Traumatol Arthrosc 2019;27(1):68-75. doi:10.1007/s00167-018-5040-1
13. Potts G, Reid D, Larmer P. The effectiveness of preoperative exercise programmes on quadriceps strength prior to and following anterior cruciate ligament (ACL) reconstruction: A systematic review. Phys Ther Sport 2022;54:16-28. doi:10.1016/j.ptsp.20 21.12.004
14. Ardern CL, Taylor NF, Feller JA, Webster KE. Fifty-five per cent return to competitive sport following anterior cruciate ligament reconstruction surgery: an updated systematic review and metaanalysis including aspects of physical functioning and contextual factors. Br J Sports Med 2014;48(21):1543-1552. doi:10.1136/bjsports-2013-0 93398
15. Hughes JD, Burnham JM, Hirsh A, et al. Comparison of short-term biodex results after anatomic anterior cruciate ligament reconstruction among 3 autografts. Orthop J Sports Med 2019;7(5):2325967119847630. doi:10.1177/232596711 9847630
16. Hannon JP, Wang-Price S, Goto S, et al. Twelveweek quadriceps strength as a predictor of quadriceps strength at time of return to sport testing following bone-patellar tendon-bone autograft anterior cruciate ligament reconstruction. Int J Sports Phys Ther 2021;16(3):681-688. doi:10.26603/001c.23421
17 Barber-Westin S, Noyes FR. One in 5 Athletes sustain reinjury upon return to high-risk sports after ACL reconstruction: a systematic review in 1239 athletes younger than 20 years. Sports Health. 2020;12(6):587-597 doi:10.1177/1941738120912846
18. Hartigan EH, Zeni J Jr, Di Stasi S, Axe MJ, SnyderMackler L. Preoperative predictors for noncopers to pass return to sports criteria after ACL reconstruction. J Appl Biomech 2012;28(4):366-373. d oi:10.1123/jab.28.4.366
19. Noyes FR, Barber-Westin SD Neuromuscular retraining in female adolescent athletes: effect on athletic performance indices and noncontact anterior cruciate ligament injury Rates. Sports. 2015;3(2):56-76. doi:10.3390/sports3020056
20. Padua DA, DiStefano LJ. Sagittal plane knee biomechanics and vertical ground reaction forces are modified following ACL injury prevention programs: a systematic review Sports Health 2009;1(2):165-173. doi:10.1177/1941738108330971
Original Research
Einar Einarsson1a , Olivia Barbosa2 , Magnus Kjartan Gislason3 , Kristin Briem4 , Argyro Kotsifaki2 , Rodney Whiteley2
1 School of Engineering, University of Reykjavik, 2 Rehabilitation, Qatar Orthopaedic and Sports Medicine Hospital, 3 School of Engineering, University of Reykjavik, 4 Department of Physical Therapy, University of Iceland
Keywords: electromyography, anterior cruciate ligament, rehabilitation, injury
https://doi.org/10.26603/001c.94610
Background
After Anterior Cruciate Ligament Reconstruction (ACLR) athletes face the challenge of regaining their previous competitive level while avoiding re-injury and early knee joint cartilage degeneration. Quadriceps and hamstrings strength reductions and neuromuscular alterations potentially related to risk of re-injury are present after ACLR and relate to deficits in muscle activation.
Design
Cross-sectional laboratory study
Purpose
To examine quadriceps and hamstrings muscle activation during repeated hops in healthy pivoting-sport athletes and those who had undergone ACLR (bone-tendon-bone and semitendinosus graft) who had met functional criteria allowing return to training.
Methods
Surface electromyography (SEMG) was recorded from vastus medialis and lateralis and medial and lateral hamstrings bilaterally during 30 seconds’ repeated hopping in male athletes on average eight months after ACLR surgery (5-12 months). All patients underwent hamstring (HS) (n=24) or bone-tendon-bone (BTB) reconstruction (n=20) and were compared to healthy controls (n=31). The SEMG signals were normalized to those obtained during maximal voluntary isometric contraction.
Results
A significant time shift in peak muscle activation (earlier) was seen for: vastus medialis and vastus lateralis activation in the control group, in the BTB group’s healthy (but not injured) leg and both legs of the HS group. A significant time shift in peak muscle activation was seen for lateral hamstrings (earlier) in all but the BTB group’s injured leg and the medial hamstrings in the control group only. Lower peak activation levels of the vastus lateralis (p<0.001) and vastus medialis (p<0.001) were observed in the injured compared to healthy legs and lower peak lateral hamstrings activity (p<0.009) in the injured leg compared to control leg. Decline in medial hamstring peak activation (p<0.022) was observed between 1st and 3rd phase of the hop cycle in all groups.
a
Corresponding author:
Einar Einarsson
University of Reykjavik, School of Engineering, Menntavegur 1, 102 Reykjavik Iceland Tel: +354 5996200 Fax: Email: einarei@ru.is
Repeated hop testing revealed quadriceps and hamstring activation differences within ACLR athletes, and compared to healthy controls, that would be missed with single hop tests.
Athletes having surgery after anterior cruciate ligament (ACL) injury expect to return to sport with more than 90% of previous injury level capacity1 yet only 55-60 % will return to their previous competitive level.2 Additionally, those undergoing ACL reconstruction (ACLR) have a higher risk of reinjury3 and osteoarthritis4 and show worse subsequent performance and career duration.5 Reasons for reduced participation and impaired performance are complex6 and while results from return to sport (RTS) testing after ACLR can be useful to estimate the athlete’s readiness to participate in sports,7 clinical testing methods often used as a measure of lower limb function do not always identify specific local impairments8 likely due to compensatory strategies9 which suggests alternative RTS evaluations might be required.7
Surface electromyographical (SEMG) analysis can help identify alterations in neuromuscular control, however this is rarely used in RTS assessment.10 While ACLR patients demonstrate continued alterations in neuromuscular control11 it is not clear which SEMG measuring method would inform the RTS decision regarding readiness to return to sport.10 SEMG can provide information about: the absolute magnitude of muscle activation, the relative timing of muscle activation during a single action, and changes in magnitude and timing during repeated actions.
Regarding the absolute magnitude, ACLR patients likely have a reduction in quadriceps activation. Quadriceps strength is often reported to be lower during MVIC strength testing (compared to their uninjured leg12 and controls13) even years after returning to sport and quadriceps and hamstring strength reductions are associated with reduced performance and risk of reinjury in ACL reconstructed individuals compared to controls at RTS14,15 and up to four years after surgery.16 Changes in muscle activation are thought to play a role in these deficits13 as strength loss does not fully explain the biomechanical differences observed between athletes that did not sustain re-injury after ACLR (greater knee flexion, increased contact time).17 Persistent neuromuscular alterations which could be related to risk of re-injury are present after ACLR18 and can be identified during the rehabilitation process.19
With regard to the timing of muscle activation, co-contraction of the quadriceps and hamstrings at the time of landing is thought to be a protective mechanism for knee joint stability. Neuromuscular alterations, including earlier thigh muscle onset and increased duration of activation pre-landing, are seen in ACLR athletes during a variety of different drop jump landing tasks20 and after inducing fatigue.21 Information regarding time to peak activity are
sparse but delayed time to peak activation in quadriceps and hamstrings compared to the healthy leg has been reported in a jump cut task in ACLR males,22 which may negatively affect attenuation of knee loading during drop jump landing.23 Athletes who have undergone ACLR have also shown lower quadriceps activation but increased hamstring pre-activity often thought of as protective mechanism to control translation before landing in a repeated jump squat task.24
Commonly, ACLR is conducted using either an autologous hamstring (HS) or bone-patellar-tendon-bone graft (BTB). The surgical technique is seen to have an effect on quadriceps and hamstrings muscle strength15 but it is not known if there are persisting differences in relative activation of these muscles during repeated functional tasks.
A single leg countermovement jump appears to be a valid return to sport test that will identify deficits in knee function in ACLR athletes.25 Information from a single event such as a drop jump or single cutting movement may not represent the full demands of sporting activity where athletes perform repeated movements, often to the point of muscle failure. More information may be found in a repeated hopping task which might reveal differences in muscle activation patterns as athletes’ fatigue. A 30-second maximum effort hopping task has been shown to induce decline in physical performance throughout the task.26
Therefore, the purpose of this study was to examine quadriceps and hamstrings muscle activation during repeated hops in healthy pivoting-sport athletes and those who had undergone ACLR (bone-tendon-bone and semitendinosus graft) who had met functional criteria allowing return to training. In particular, the intent was to document the peak muscle activation of the quadriceps and hamstrings during the initial (first 10 seconds) and final (last 10 seconds) of a fatiguing hop task as well as the typical pattern of muscle activation during the individual hops performed during these periods. By examining both legs of the athletes who had undergone ACLR (both hamstring and bone-patellar tendon-bone grafts) and comparing to uninjured healthy controls the authors attempted to better understand any effect on both the timing and magnitude of activity in relation to surgical technique.
The hypothesis was that there would be a change in time to peak and absolute magnitude of activation as participants tire, and that the surgical technique (graft choice) would be associated with specific differences in the activation patterns seen.
Male participants (“patients”) who had undergone an isolated ACLR either with BTB or HS graft and a comparison cohort of active healthy adults (“control”) were recruited for the study All patients participated in pivoting sports and were all at level 9 or 10 on the Tegner scale. The athletes had completed all clinical criteria (<10% deficit on isokinetic and functional field testing, pain-free, no swelling on swipe test, and full ROM)27 and had demonstrated competence in repeated single leg hops during rehabilitation. All controls were injury-free in the last three months prior to the assessment, had never had a major lower limb injury such as a 3rd degree ligament sprain or ACLR, fracture of bone in lower leg, or 3rd degree muscle strain which could affect neuromuscular profiles. Informed consent was obtained for each volunteer participant and the experiment was conducted with the approval of the local ethics committee.
Muscle activation was examined28 by means of wireless surface electromyography (SEMG) signals (hereafter termed ‘muscle activation’) of the quadriceps muscles (vastus medialis and vastus lateralis) and hamstrings muscles (lateral hamstring and medial hamstring) of both legs during a minimum of 30 seconds repeated single leg countermovement hopping.
SEMG data collection was performed after a 10-minute warm up on a stationary bike, by having skin shaved and cleaned with alcohol swabs (70%), and electrodes were placed following SENIAM guidelines.28 Muscle activation SEMG from vastus medialis and vastus lateralis and lateral hamstrings and medial hamstrings were recorded at 2000 Hz using a Delsys Trigno Wireless System (Boston, MA), with rectangular electrodes (sized 37mmx26mmx15mm), and a SEMG signal band-with of 20-450Hz. For normalization purposes, each subject’s maximal voluntary isometric muscle activation (MVIC) was then assessed with SEMG. Both muscle groups were tested in 60° knee flexion using a hand-held dynamometer, fixated with a belt, for a total of three repetitions of five seconds MVIC for each leg, with one minute’s rest in between each repetition. During quadriceps testing the participants were sitting while during hamstrings testing, subjects were lying prone. Standardized instructions and verbal encouragement were provided during testing.
A 3-axis accelerometry inertial measurement unit was placed on the sacrum to identify foot contact and toe-off based on its acceleration signal.29 The toe-off event was defined as the maximum acceleration value prior to the flight phase and the initial foot contact was defined as the point when the acceleration exceeded 1g after the flight phase on
its way to reach maximum value during the load absorption phase. The flight phase was defined where the acceleration was consistently below 1g (Appendix A). The time events from the accelerometer were finally synchronized with the SEMG signal.
Instructions for the jumping task were given immediately before the task was executed, and the participants were asked to perform a minimum of one familiarization trial (without recording) to confirm they understood the task. Participants were instructed to start the test and to hop on one leg as high as possible and as fast as possible until the test was terminated vocally by the examiner who ensured the athletes hopped at least 30 seconds. Athletes who did not hop for 30 seconds were excluded from the data (one participant from BTB group).
Data from all the hops for each subject, for each leg, were explored with a customized Matlab script for visualization and analyses of SEMG and accelerometer signal. The accelerometer data were low-pass filtered with a 5 Hz finiteimpulse-response (FIR) and the SEMG signal was filtered using 8th-order band-pass filter, with high pass cut at 30Hz and low pass cut at 500Hz using Matlab (R2022a, The Mathworks Inc, Natick, MA). After this, data for each hop was extracted and normalized from one toe off to the following and presented as 101 data points (0-100%) with foot contact centered to 50%. The relative SEMG (%MVC) was then used for subsequent analysis for each of the 101 (0-100%) time points for each hop. Every hop sequence was divided into three phases based on the total hop count for that individual. Where the total number of hops was not exactly divisible by three, care was taken to ensure that the first and third phases had an identical number of hops. Separate analyses were conducted examining: the overall peak activation (magnitude and point of peak); and the relative activation patterns averaged from all hops in each of the three phases during the entire 30-second period.
Peak SEMG activation for each participant was compared between legs using linear mixed models. Distributions (including linear mixed model residuals) were examined using frequency histograms, Q-Q plots, and Shapiro Wilk testing. Descriptive statistics were then calculated, and subsequently linear mixed models for each muscle group were created for their average peak normalized SEMG with fixed (group and leg) and random (participant) effects used to identify main differences and interaction effects. Subsequent pairwise comparisons with Tukey post-hoc corrections were done for each muscle group examining peak SEMG activation across all hop phases for each patient group and leg.
For the control group, no significant differences were found comparing left and right legs so data for a single healthy leg was randomly extracted from both left and right legs for further analyses. For the patient cohort, data are presented for both their operated (“injured”) and uninjured legs.
Spatial Parametric Mapping30 (SPM) was conducted in Matlab (version: 2018a, The Mathworks Inc., Natick, USA)
to compare the activation pattern of the hop cycles during the first and third hop phases. The significance level was set to p<0.05.
Forty-four male participants were included. Over half of the participants had undergone ACLR with a HS graft (n=24; age 22.2± 4.83 years, weight 74.9±11.87 kg, and height 178.3±9.22 cm) and the rest using BTB reconstruction (n=20; age 22.4±4.89 years, weight 72.0 ±10.58.1 kg, and height: 174.1±7.46. cm), and both groups were on average eight months (±2.8 months) post-surgery. Thirty-one injury-free male footballers (age 24.5 ± 4.23 years, weight 72.7 ± 9.49kg, height 177.1 ± 7.53 cm) were recruited as controls.All included participants were able to perform the minimum 30 seconds’ hop testing task on each leg. The number of hops completed in the 30 seconds ranged from 21 to 56 results from groups are present in Table 1
Figures 1 and 2 show the average activation for the 1st , 2nd , and 3rd phases of the 30 seconds’ hop task. SPM analysis comparing the first and third phase of the repeated hop cycle for quadriceps activation revealed statistically significant differences in activation levels (an effective shift to earlier in the hop cycle, Figure 1) of peak vastus medialis and vastus lateralis activation in the control group, in the BTB healthy and injured, and healthy HS group. The SPM for hamstring activation revealed statistically significant differences in activation levels for lateral hamstring in all but BTB-injured group and medial hamstring in the control group only (Figure 2).
Linear mixed model analysis results revealed lower peak activation levels of the vastus lateralis (p=0.001, CI 95%: 27.9 to 41.3) and vastus medialis (p=0.001, 95% CI: 39.0 to 59.6) with a main effect of leg, showing a lower activation in the injured compared to healthy legs. For lateral hamstrings there were significant between group differences (p<0.009) in peak activation with BTB lower than controls (p<0.035, 95% CI: -43.1 to -1.3) and HS lower than controls (p<0.029, 95% CI: -41.4 to -1.8) with main effect seen in healthy legs (lower) compared to injured. Linear mixed model analysis showed a significantly lower peak muscle activation in the medial hamstring with main affect seen between 1st and 3rd phase of the hop cycle in all groups (p=0.022, 95% CI: 0.6 to 10.0).
The main findings of the present study show a shift in quadriceps and hamstrings peak activation - an earlier peak
activation in the hop cycle in relation to foot contact as the participants repeatedly maximally executed single leg hops for 30 seconds. This pattern for quadriceps and lateral hamstrings muscles was seen in all groups but was not statistically significant for the injured leg of the BTB group. The same pattern was seen for medial hamstrings but the shift in peak activation was only statistically significant in the control group.
The changes in activation pattern during the 30 seconds’ maximal hops may have implications for return to sport testing. The timing of peak activation of the quadriceps and hamstrings relative to foot contact likely influences tibial translation. The results demonstrated that quadriceps and hamstrings peak activation generally occurred earlier in the hop cycle, ultimately prior to foot contact, as the repeated hop cycle progresses. The authors suggest that a more complete picture of motor behavior during hopping is provided by this repeated hopping task and venture that this may be more relevant to many sporting contexts where repeated efforts are required. The authors further suggest that clinicians should be cautious in extrapolating from an isolated hop test (as is commonly performed at discharge testing31) if the aim is to understand an individual’s motor behavior during repeated hopping.
The shift in activation during the repeated hop task was only revealed through analyzing activation during the entire hop task and comparing the activation across the entire 30 seconds’ hopping. More commonly, SEMG is analyzed as a single scalar value – e.g., peak activation during the task. Examining the entire movement instead of an arbitrary point in the movement, or a single scalar such as peak activation during the entire action, may therefore allow a better appreciation of the change in motor pattern during the task. This approach may be a useful addition to existing return to sport functional testing which may ultimately shed light on risk of re-injury32 and other posttraumatic problems (pain, weakness, instability, osteoarthrosis).4,33, 34
This alteration in motor pattern seen during the 30 seconds’ hopping may be in response to fatigue, tibial translation, or other factors.35,36 Researchers looking at the effect of fatigue on neuromuscular control have shown more cocontraction and higher activation in the leg muscles at contact and in ACLR athletes earlier muscle pre-activation during landing task to establish knee stability.21 In our study, despite peak activation moving closer to foot contact, repeated hopping was not associated with higher activation of the quadriceps or hamstrings, conversely in our study lower peak quadriceps activation in the ACLR leg was observed in the BTB and HS groups compared to the uninjured leg and compared to the Control group. Previously, de-
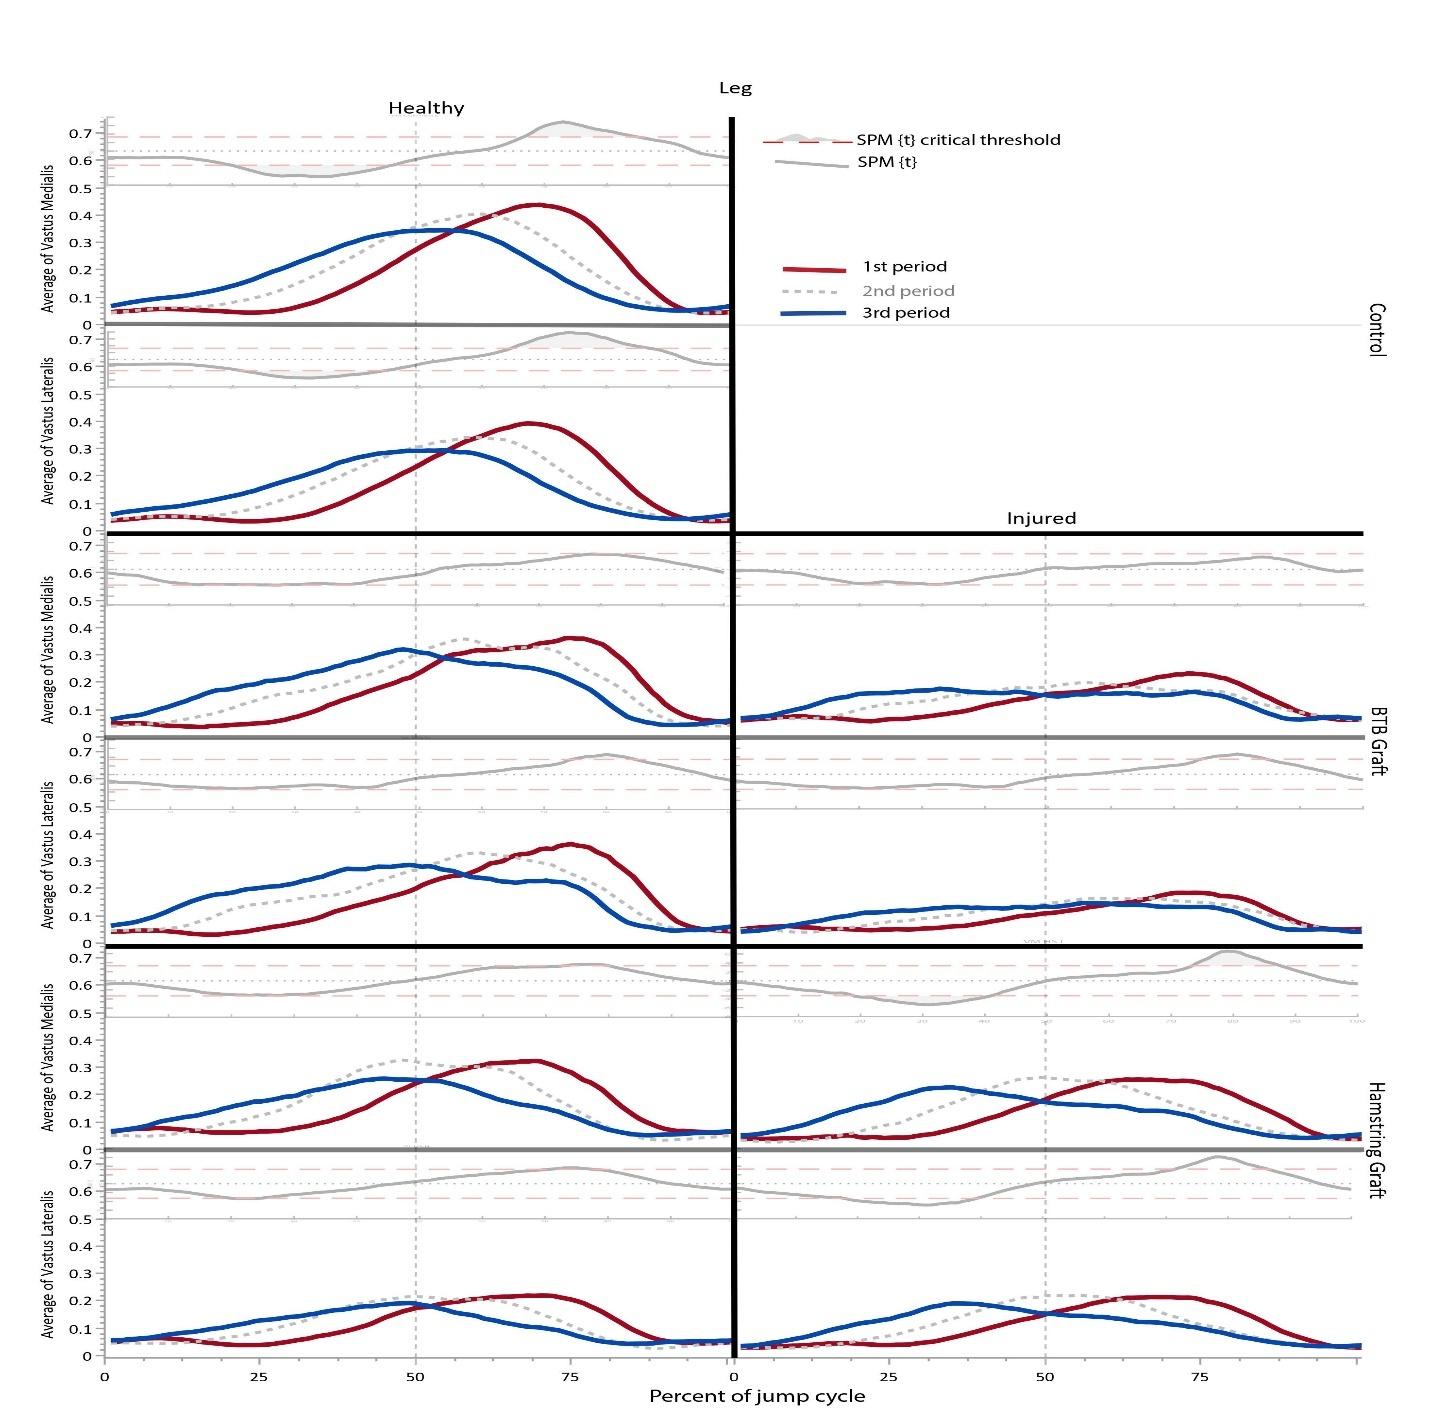
Figure 1. Mean vastus lateralis (VL) and medialis (VM) activation comparison between the first (red) and the last (blue) period during the 30-second vertical hop task.
Each panel illustrates the mean for the first phase (red) second phase (dotted gray) and the last phase (blue) of the hop task. The Y-axis represents the relative muscle activation compared to maximum voluntary contraction (0-1, vertical scale truncated to 0-0.7 for clarity) and the X-axis represents the entire hop phase with foot contact at 50% (0-100) presented with dotted vertical line. Within each panel, the inset above illustrates the Statistical Parametric Mapping comparing the first and third hop periods. The thick black line depicts the test statistic continuum, which in this case is a t continuum, or “SPM{t}” The red hashed line depicts the critical threshold at alpha 5%. From a classical hypothesis testing perspective, the null hypothesis is rejected at alpha if the SPM{t} exceeds this threshold, indicated by the shaded grey area where p<0.05. No statistical analyses were made using the 2nd period; it is shown for reference only
creased quadriceps and hamstrings activation has been reported in ACLR athletes after a sequence of fatiguing deep squats followed by a dynamic jump endurance protocol37 suggesting fatigue may be an influencing factor for this observation.
Overall, few differences in activation patterns were observed between the HS and BTB groups. In contrast, previous researchers examining a dynamic forward hop task reported increased quadriceps before landing (“pre-activation”) for the HS ACLR participants, while the BTB- graft group did not present a clear pre-activation pattern.38 The different tasks – vertical compared to horizontal hops –likely contribute to the different results.25,39 In healthy knees35 and in the ACLR knees,40 tibial anterior translation
increases with quadriceps pre-activation40 and adequate hamstring activation can be important to control the translation36 while low quadriceps amplitude decreases the attenuation of landing forces.23 Fatigue is known to affect the magnitude of hamstrings activation41 which agrees with the findings of present study as the authors found a decline in medial hamstring activation from the 1st to 3rd phase of the hop cycle was present in all groups The shift in activation to earlier in the hop cycle could represent a protective strategy to minimize tibial translation through co-contraction prior to foot strike.42,43
The athletes examined in the current study had demonstrated >90% between-leg symmetry in isokinetic tests of knee flexion and extension strength. During the repeated
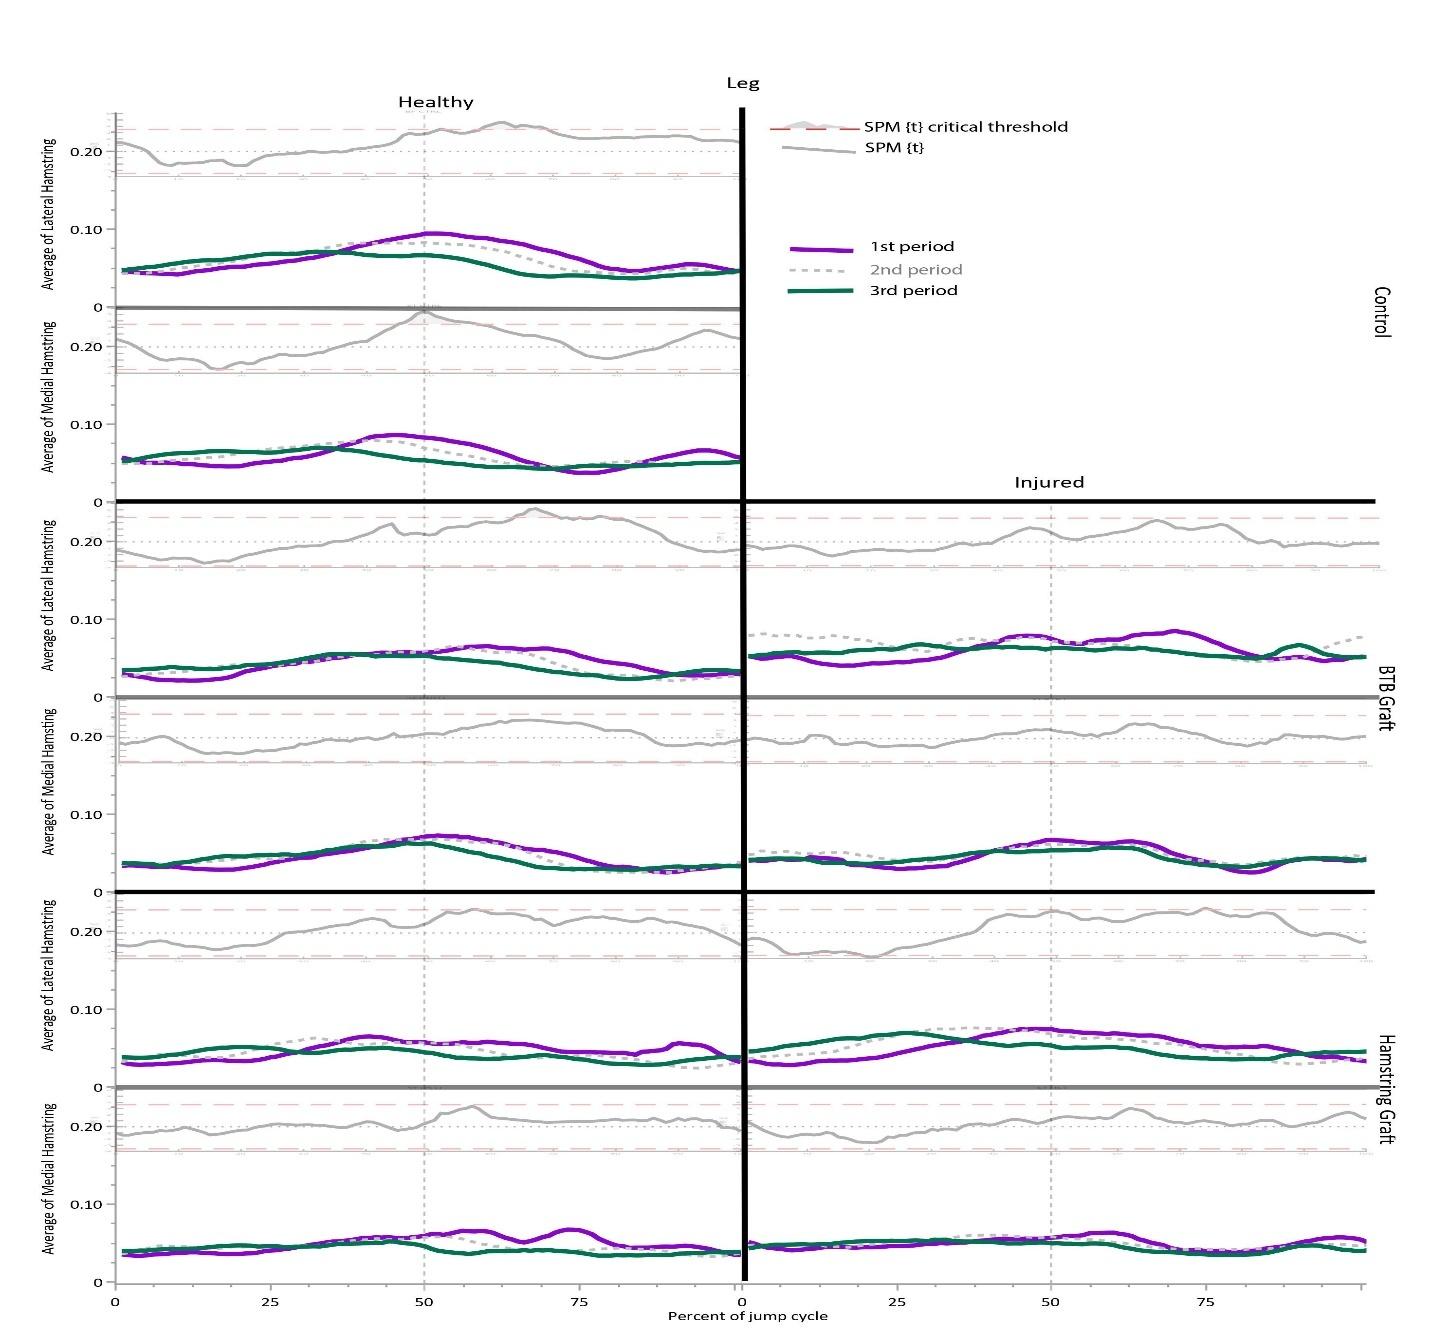
2. Mean lateral and medial
activation comparison between the first (purple) and the last (green) period during the 30-second vertical hop task.
Each panel illustrates the mean for the first phase (purple) second phase (dotted gray) and the last phase (green) of the hop task. The Y-axis represents the relative muscle activation to maximum voluntary contraction (0-1, vertical scale truncated to 0-0.2 for clarity) and the X-axis represents the entire hop phase with foot contact at 50% (0-100) presented with dotted vertical line. Within each panel, the inset above illustrates the Statistical Parametric Mapping comparing the first and third hop periods. The thick black line depicts the test statistic continuum, which in this case is a t continuum, or “SPM{t}” The red hashed line depicts the critical threshold at alpha 5%. From a classical hypothesis testing perspective, the null hypothesis is rejected at alpha if the SPM{t} exceeds this threshold, indicated by the shaded grey area where p<0.05. No statistical analyses were made using the 2nd period; it is shown for reference only
hopping task, reduced peak activation of the quadriceps and hamstrings was observed for the ACLR leg. Previous research examining vertical and horizontal hop tasks suggests ACLR patients adopt a strategy shifting work away from their knee to their hip and ankle.25,39 While not investigated in the present study, this would plausibly explain these findings (of reduced peak activation) despite apparent adequate knee strength. Differences in muscle activation are commonly presented in ACLR male athletes during jump testing but results are mixed showing decreased,24 or increased activation.44,45 The disparities in results could be related to differences in testing i.e., cohort, protocol, and normalization methods.46
While this research has shown alterations in activation patterns, the current research did not consider any kinematic or kinetic implications of these which now should be addressed in future research given these findings. Due to the lack of kinematic data we are unable to determine whether the changes seen in muscle activation are related to changes in kinematic or kinetics47 and/or reduced jump height.
The patients examined in this study had reached clinical discharge criteria,27 but the time taken to do so varied (5 to 12 months). The present study is not powered to examine the effect of time since surgery, and it is possible that
Figure hamstringthe athletes continue to alter their neuromuscular profiles across their rehab and beyond, nevertheless differences in muscle activation have been reported 1-2 years post ACLR in functional movements.23,25
The current research included only hamstring and patellar tendon grafts, other graft choices (e.g. quadriceps tendon, allografts, artificial ligaments, etc) would likely yield different results again. It should also be noted that the control group consisted only of professional footballers while the ACLR group included professional athletes playing football, futsal, rugby, handball, and volleyball.
A shift in activation of the thigh muscles was shown (earlier) as the 30-second hop task progressed. EMG analysis of single hops is therefore not necessarily representative of the muscles’ activation patterns and the changes seen during repeated hops. Repeated jump and hop testing protocols that induce endurance and motor control challenges probably provide complementary information to return to
sport testing which may be more relevant to many sports where repeated efforts are required.
The authors declare no conflicts of interest.
The authors express their appreciation to the patients and subjects for participating in this study
Special thanks and gratitude to the ACL rehabilitation group of Aspetar Sports Medicine Hospital Doha Qatar for the assistance in patient recruitment.
Submitted: March 23, 2023 CDT, Accepted: January 28, 2024 CDT
© The Author(s)
This is an open-access article distributed under the terms of the Creative Commons Attribution 4.0 International License (CCBY-NC-4.0). View this license’s legal deed at https://creativecommons.org/licenses/by-nc/4.0 and legal code at https://creativecommons.org/licenses/by-nc/4.0/legalcode for more information.
1. Feucht MJ, Cotic M, Saier T, et al. Patient expectations of primary and revision anterior cruciate ligament reconstruction. Knee Surg Sports Traumatol Arthrosc 2016;24(1):201-207 doi:10.1007/ s00167-014-3364-z
2. Ardern CL, Taylor NF, Feller JA, Webster KE. Fiftyfive per cent return to competitive sport following anterior cruciate ligament reconstruction surgery: an updated systematic review and meta-analysis including aspects of physical functioning and contextual factors. Br J Sports Med 2014;48(21):1543-1552. doi:10.1136/bjsports-2013-0 93398
3. Barber-Westin S, Noyes FR. One in 5 athletes sustain reinjury upon return to high-risk sports after ACL reconstruction: A systematic review in 1239 athletes younger than 20 years. Sports Health 2020;12(6):587-597. doi:10.1177/1941738120912846
4. Luc B, Gribble PA, Pietrosimone BG. Osteoarthritis prevalence following anterior cruciate ligament reconstruction: A systematic review and numbersneeded-to-treat analysis. J Athl Train 2014;49(6):806-819. doi:10.4085/1062-6050-49.3.35
5. Niederer D, Engeroff T, Wilke J, Vogt L, Banzer W. Return to play, performance, and career duration after anterior cruciate ligament rupture: A case–control study in the five biggest football nations in Europe. Scand J Med Sci Sports 2018;28(10):2226-2233. doi:10.1111/sms.13245
6. Truong LK, Mosewich AD, Holt CJ, Le CY, Miciak M, Whittaker JL. Psychological, social and contextual factors across recovery stages following a sportrelated knee injury: a scoping review. Br J Sports Med. 2020;54(19):1149-1156. doi:10.1136/bjsports-2019-1 01206
7. Webster KE, Hewett TE. What is the evidence for and validity of return-to-sport testing after anterior cruciate ligament reconstruction surgery? A systematic review and meta-analysis. Sports Med. 2019;49(6):917-929. doi:10.1007/s40279-019-01093-x
8. Wellsandt E, Failla MJ, Snyder-Mackler L. Limb symmetry indexes can overestimate knee function after ACL injury J Orthop Sports Phys Ther 2017;47(5):334-338. doi:10.2519/jospt.2017.7285
9. Kotsifaki A, Van Rossom S, Whiteley R, et al. Symmetry in triple hop distance hides asymmetries in knee function after ACL reconstruction in athletes at return to sports. Am J Sports Med. 2022;50(2):441-450. doi:10.1177/03635465211063192
10. Blasimann A, Koenig I, Baert I, Baur H, Vissers D Which assessments are used to analyze neuromuscular control by electromyography after an anterior cruciate ligament injury to determine readiness to return to sports? A systematic review BMC Sports Sci Med Rehabil. 2021;13(1):142. doi:10.1 186/s13102-021-00370-5
11. He X, Leong HT, Lau OY, Ong MTY, Yung PSH. Altered neuromuscular activity of the lowerextremities during landing tasks in patients with anterior cruciate ligament reconstruction: A systematic review of electromyographic studies. J Sport Rehabil 2020;29(8):1194-1203. doi:10.1123/js r.2019-0393
12. Otzel DM, Chow JW, Tillman MD. Long-term deficits in quadriceps strength and activation following anterior cruciate ligament reconstruction. Phys Ther Sport. 2015;16(1):22-28. doi:10.1016/j.pts p.2014.02.003
13. Lisee C, Lepley AS, Birchmeier T, O’Hagan K, Kuenze C. Quadriceps strength and volitional activation after anterior cruciate ligament reconstruction: A systematic review and metaanalysis. Sports Health. 2019;11(2):163-179. doi:10.11 77/1941738118822739
14. Lepley LK. Deficits in quadriceps strength and patient-oriented outcomes at return to activity after ACL reconstruction: A review of the current literature. Sports Health 2015;7(3):231-238. doi:10.11 77/1941738115578112
15. Petersen W, Taheri P, Forkel P, Zantop T Return to play following ACL reconstruction: a systematic review about strength deficits. Arch Orthop Trauma Surg 2014;134(10):1417-1428. doi:10.1007/s00402-01 4-1992-x
16. Brown C, Marinko L, LaValley MP, Kumar D. Quadriceps strength after anterior cruciate ligament reconstruction compared with uninjured matched controls: A systematic review and meta-analysis. Orthop J Sports Med 2021;9(4):2325967121991534. do i:10.1177/2325967121991534
17. King E, Richter C, Daniels KAJ, et al. Biomechanical but not strength or performance measures differentiate male athletes who experience ACL reinjury on return to level 1 sports. Am J Sports Med 2021;49(4):918-927 doi:10.1177/036354652098 8018
18. Kuenze CM, Hertel J, Weltman A, Diduch D, Saliba SA, Hart JM. Persistent neuromuscular and corticomotor quadriceps asymmetry after anterior cruciate ligament reconstruction. J Athl Train. 2015;50(3):303-312. doi:10.4085/1062-6050-49.5.06
19. Lepley AS, Ericksen HM, Sohn DH, Pietrosimone BG. Contributions of neural excitability and voluntary activation to quadriceps muscle strength following anterior cruciate ligament reconstruction. The Knee 2014;21(3):736-742. doi:10.1016/j.knee.2014.02.008
20. Rocchi JE, Labanca L, Laudani L, Minganti C, Mariani PP, Macaluso A. Timing of muscle activation is altered during single-leg landing tasks after anterior cruciate ligament reconstruction at the time of return to sport. Clin J Sport Med 2020;30(6):e186-e193. doi:10.1097/jsm.00000000000 00659
21. Dashti Rostami K, Alizadeh MH, Minoonejad H, Yazdi H, Thomas A. Effect of fatigue on electromyographic activity patterns of the knee joint muscles in anterior cruciate ligament reconstructed and deficient patients during landing task. J Funct Morphol Kinesiol 2018;3(2):22. doi:10.3390/jfmk3020 022
22. Coats-Thomas MS, Miranda DL, Badger GJ, Fleming BC. Effects of ACL reconstruction surgery on muscle activity of the lower limb during a jump-cut maneuver in males and females. J Orthop Res. 2013;31(12):1890-1896. doi:10.1002/jor.22470
23. Ward SH, Blackburn JT, Padua DA, et al. Quadriceps neuromuscular function and jumplanding sagittal-plane knee biomechanics after anterior cruciate ligament reconstruction. J Athl Train. 2018;53(2):135-143. doi:10.4085/1062-6050-30 6-16
24. Jordan MJ, Aagaard P, Herzog W Asymmetry and thigh muscle coactivity in fatigued anterior cruciate ligament-reconstructed elite skiers. Med Sci Sports Exerc 2017;49(1):11-20. doi:10.1249/mss.0000000000 001076
25. Kotsifaki A, Rossom SV, Whiteley R, et al. Single leg vertical jump performance identifies knee function deficits at return to sport after ACL reconstruction in male athletes. Br J Sports Med. 2022;56(9):490-498. doi:10.1136/bjsports-2021-1046 92
26. Ha TG, Lee SR, Lee SY, et al. Assessment of repeated vertical jump for anaerobic exercise performance. Int J Phys Educ Sports Health 2020;7(3):405-409.
27 Kyritsis P, Bahr R, Landreau P, Miladi R, Witvrouw E. Likelihood of ACL graft rupture: not meeting six clinical discharge criteria before return to sport is associated with a four times greater risk of rupture. Br J Sports Med 2016;50(15):946-951. doi:10.1136/bjs ports-2015-095908
28. Hermens HJ, Freriks B, Disselhorst-Klug C, Rau G. Development of recommendations for SEMG sensors and sensor placement procedures. J Electromyogr Kinesiol. 2000;10(5):361-374. doi:10.1016/s1050-641 1(00)00027-4
29. Magnúsdóttir Á, Orgilsson B, Karlsson B. Comparing three devices for jump height measurement in a heterogeneous group of subjects. J Strength Cond Res 2014;28(10):2837-2844. doi:10.151 9/jsc.0000000000000464
30. Robinson MA, Vanrenterghem J, Pataky TC. Statistical Parametric Mapping (SPM) for alpha-based statistical analyses of multi-muscle EMG time-series. J Electromyogr Kinesiol. 2015;25(1):14-19. doi:10.101 6/j.jelekin.2014.10.018
31. Ebert JR, Du Preez L, Furzer B, Edwards P, Joss B. Which hop tests can best identify functional limb asymmetry in patients 9-12 months after anterior cruciate ligament reconstruction employing a hamstrings tendon autograft? Int J Sports Phys Ther. 2021;16(2):393-403. doi:10.26603/001c.21140
32. Wright RW, Magnussen RA, Dunn WR, Spindler KP. Ipsilateral graft and contralateral ACL rupture at five years or more rollowing ACL reconstruction. J Bone Joint Surg Am 2011;93(12):1159-1165. doi:10.21 06/jbjs.j.00898
33. Simon D, Mascarenhas R, Saltzman BM, Rollins M, Bach BR, MacDonald P The relationship between Anterior Cruciate Ligament injury and osteoarthritis of the knee. Adv Orthop 2015;2015:e928301. doi:10.1 155/2015/928301
34. Wang LJ, Zeng N, Yan ZP, Li JT, Ni GX. Posttraumatic osteoarthritis following ACL injury Arthritis Res Ther 2020;22(1):57 doi:10.1186/s1307 5-020-02156-5
35. Wojtys EM, Wylie BB, Huston LJ. The effects of muscle fatigue on neuromuscular function and anterior tibial translation in healthy knees. Am J Sports Med 1996;24(5):615-621. doi:10.1177/0363546 59602400509
36. MacWilliams BA, Wilson DR, Desjardins JD, Romero J, Chao EYS. Hamstrings cocontraction reduces internal rotation, anterior translation, and anterior cruciate ligament load in weight-bearing flexion. J Orthop Res 1999;17(6):817-822. doi:10.100 2/jor.1100170605
37 Thomas AC, Lepley LK, Wojtys EM, McLean SG, Palmieri-Smith RM. Effects of neuromuscular fatigue on quadriceps strength and activation and knee biomechanics in individuals post–anterior cruciate ligament reconstruction and healthy adults. J Orthop Sports Phys Ther 2015;45(12):1042-1050. doi:10.251 9/jospt.2015.5785
38. Bryant AL, Newton RU, Steele J. Successful feedforward strategies following ACL injury and reconstruction. J Electromyogr Kinesiol. 2009;19(5):988-997 doi:10.1016/j.jelekin.2008.06.001
39. Ithurburn MP, Paterno MV, Ford KR, Hewett TE, Schmitt LC. Young athletes with quadriceps femoris strength asymmetry at return to sport after anterior cruciate ligament reconstruction demonstrate asymmetric single-leg drop-landing mechanics. Am J Sports Med 2015;43(11):2727-2737 doi:10.1177/0363 546515602016
40. Tsarouhas A, Giakas G, Malizos KN, et al. Dynamic effect of quadriceps muscle activation on anterior tibial translation after single-bundle and double-bundle anterior cruciate ligament reconstruction. Arthroscopy 2015;31(7):1303-1309. d oi:10.1016/j.arthro.2015.02.028
41. Gehring D, Melnyk M, Gollhofer A. Gender and fatigue have influence on knee joint control strategies during landing. Clin Biomech 2009;24(1):82-87. doi:10.1016/j.clinbiomech.2008.0 7.005
42. Melnyk M, Gollhofer A. Submaximal fatigue of the hamstrings impairs specific reflex components and knee stability. Knee Surg Sports Traumatol Arthrosc 2007;15(5):525-532. doi:10.1007/s00167-00 6-0226-3
43. Toor AS, Limpisvasti O, Ihn HE, McGarry MH, Banffy M, Lee TQ. The significant effect of the medial hamstrings on dynamic knee stability Knee Surg Sports Traumatol Arthrosc. 2019;27(8):2608-2616. do i:10.1007/s00167-018-5283-x
44. Vairo GL, Myers JB, Sell TC, Fu FH, Harner CD, Lephart SM. Neuromuscular and biomechanical landing performance subsequent to ipsilateral semitendinosus and gracilis autograft anterior cruciate ligament reconstruction. Knee Surg Sports Traumatol Arthrosc 2008;16(1):2-14. doi:10.1007/s00 167-007-0427-4
45. Palmieri-Smith RM, Strickland M, Lepley LK. Hamstring muscle activity after primary anterior cruciate ligament reconstruction—A protective mechanism in those who do not sustain a secondary injury? A preliminary study Sports Health 2019;11(4):316-323. doi:10.1177/1941738119852630
46. Sherman DA, Glaviano NR, Norte GE. Hamstrings neuromuscular function after anterior cruciate ligament reconstruction: A systematic review and meta-analysis. Sports Med. 2021;51(8):1751-1769. do i:10.1007/s40279-021-01433-w
47 Hu Z, Kim Y, Zhang Y, et al. Correlation of lower limb muscle activity with knee joint kinematics and kinetics during badminton landing tasks. Int J Environ Res Public Health 2022;19(24):16587 doi:10.3390/ijer ph192416587
Appendix A
Download: https://ijspt.scholasticahq.com/article/94610-quadriceps-and-hamstrings-activation-peaks-earlier-asathletes-repeatedly-hop-but-there-are-differences-depending-on-acl-reconstruction-technique/attachment/ 198511.docx?auth_token=9F8t9tQGzIpn6FqLOu-P
Alyx Jorgensen1 , Matthew McManigal2 , Austin Post3 , David Werner4 , Christopher Wichman5 , Matthew Tao6 , Elizabeth Wellsandt7a
1 Department of Health and Rehabilitation Sciences; Medical Sciences Interdepartmental Area Program, University of Nebraska Medical Center, 2 Department of Health and Rehabilitation Sciences, University of Nebraska Medical Center, 3 College of Medicine, University of Nebraska Medical Center, 4 Medical Sciences Interdepartmental Area Program; Department of Health and Rehabilitation Sciences, University of Nebraska Medical Center, 5 Department of Biostatistics, University of Nebraska Medical Center, 6 Department of Orthopaedic Surgery and Rehabilitation; Department of Health and Rehabilitation Sciences, University of Nebraska Medical Center, 7 Department of Health and Rehabilitation Sciences; Department of Orthopaedic Surgery and Rehabilitation, University of Nebraska Medical Center
Keywords: gait, biomechanics, physical activity, healthy, test-retest reliability https://doi.org/10.26603/001c.94606
Background
Spatiotemporal parameters of gait are useful for identifying pathological gait patterns and presence of impairments. Reliability of the pressure-sensitive ZenoTM Walkway has not been established in young, active individuals without impairments, and no studies to this point have included running.
Purpose
The purposes of this study were to 1) determine if up to two additional trials of walking and running on the ZenoTM Walkway are needed to produce consistent measurements of spatiotemporal variables, and 2) establish test-retest reliability and minimal detectable change (MDC) values for common spatiotemporal variables measured during walking and running.
Study Design
Cross-Sectional Laboratory Study
Methods
Individuals (n=38) in this cross-sectional study walked and ran at self-selected comfortable speed on a pressure-sensitive ZenoTM Walkway. Twenty-one participants returned for follow-up testing between one and 14 days later Intraclass correlation coefficients (ICCs) were used to assess reliability of spatiotemporal variable means using three, four, or five passes over the ZenoTM Walkway and to assess test-retest reliability of spatiotemporal variables across sessions.
Results
All variables showed excellent reliability (ICC > 0.995) for walking and running when measured using three, four, or five passes. Additionally, all variables demonstrated moderate to excellent test-retest reliability during walking (ICC: 0.732-0.982) and running (ICC: 0.679-0.985).
Conclusion
This study establishes a reliable measurement protocol of three one-way passes when using the ZenoTM Walkway for walking or running analysis. This is the first study to
a
Corresponding Author:
Elizabeth Wellsandt
984420 Nebraska Medical Center Omaha, NE 68198-4420 elizabeth.wellsandt@unmc.edu
establish reliability of the ZenoTM Walkway during running and in young, active individuals without neuromusculoskeletal pathology.
Objective human movement is traditionally studied in research laboratories with force platforms, motion capture systems, and other instrumented tools. The introduction of portable pressure walkways like the GAITRite® (CIR Systems, Inc, Franklin, NJ, USA) and ZenoTM Walkway (ProtoKinetics LLC, Havertown, PA, USA) has enabled objective assessment of gait and other movement parameters in clinical spaces. These walkways measure and collect data including spatiotemporal variables, which are useful in identifying pathological gait patterns,1‑4 assessing changes in gait related to medical intervention or aging,5‑14 and identifying sensorimotor impairments.15 Instrumented walkways have predominantly been used to assess older adults6, 8,10‑13,16,17 and those with known pathological gait patterns,2,4,5,7,18 but few studies exist that assess younger, more active individuals or include analysis of running in addition to walking.9,19
Although the ZenoTM Walkway has previously been used in research and clinical settings, standard protocols outlining the number of trials required to capture valid gait parameters have not been established. Studies that have measured gait parameters on instrumented walkways utilized anywhere from two to 10 walking trials.1,17‑20 Besser et al.20 reported that, for a given spatiotemporal variable, five to 10 gait cycles were required for 90% of individuals in the study population to be within 5%-10% of their mean. However, this study was performed using the GAITRite® mat, and up to 24.2% difference in GAITRite® and ZenoTM measurements have been reported.16 Although instrumented walkways are generally understood to be reliable measurement tools,2,21‑27 these reported differences indicate the need to assess the reliability of the ZenoTM Walkway independently Sufficient data are required to establish an accurate representation of an individual’s gait pattern and to reduce error in identifying changes in gait over time. Furthermore, unnecessarily excessive data collection increases patient burden and fatigue. A standardized data collection protocol is needed so that researchers and clinicians can confidently identify when measured spatiotemporal characteristics fall outside the range of typical variability during walking or running on the ZenoTM Walkway.8,13,28
The purposes of this study were to 1) determine if up to two additional trials of walking and running on the ZenoTM Walkway are needed to produce consistent measurements of spatiotemporal variables, and 2) establish test-retest reliability and MDC values for common spatiotemporal variables measured during walking and running.
This cross-sectional study included 38 participants (21 females; age: 24.2±3.5 years; BMI: 24.3±3.6 [range: 16.7-30.8]) recruited between July 2019 and January 2020. Twenty-one participants completed follow-up testing between one and 14 days later (12 females; age: 24.4±3.4 years; time between sessions: 5.9±2.9 days). Participants were included in this study if the following criteria were met: 15-35 years of age, no previous history of lower extremity injury or surgery during the prior six months, who participated in at least 50 hours per year of Level I (e.g. soccer, basketball, football) or II (e.g. tennis, skiing, dancing) cutting and pivoting sports.29 Exclusion criteria included recent history of hip, knee, or ankle pain or surgery during the prior six months, balance or neurological disorders, or current pregnancy Testing was performed in the Clinical Movement Analysis Laboratory at the University of Nebraska Medical Center (UNMC). All participants provided written informed consent. This study was approved by the UNMC Institutional Review Board (IRB #0233-19-EP).
Spatiotemporal variables were measured using a ZenoTM Walkway with a sensor area 20 feet long and two feet wide with 0.4 square inch sensors. Spatiotemporal data was collected at 120 Hz with a resolution of 1.27 cm (0.5 in2).
Testing procedures included five trials each of walking and running at a self-selected comfortable speed. A trial was defined as a single pass in one direction along the full length of the ZenoTM Walkway. Participants were given approximately three meters of floor space before and after the length of the walkway to minimize effects of acceleration and deceleration on measured gait parameters. Speed was measured using a laser timing system (Brower Timing Systems, Draper, UT) placed at the beginning and end of the walkway Self-selected speed was determined using three unrecorded trials of walking or running, respectively, during the baseline (T1) data collection. To ensure consistency during follow-up testing (T2), the laser timing system was used to maintain walking and running speed within ±5% of the self-selected speed measured during the baseline data collection. Participants wore their own athletic shoes and were instructed to wear the same pair of shoes for both testing sessions. Testing order was standardized, with walking completed first, followed by running. Walking and running testing procedures for the twenty-one participants who returned for follow-up reliability testing were identical to the baseline testing session. Data was collected and processed using ProtoKinetics Movement Analysis Software
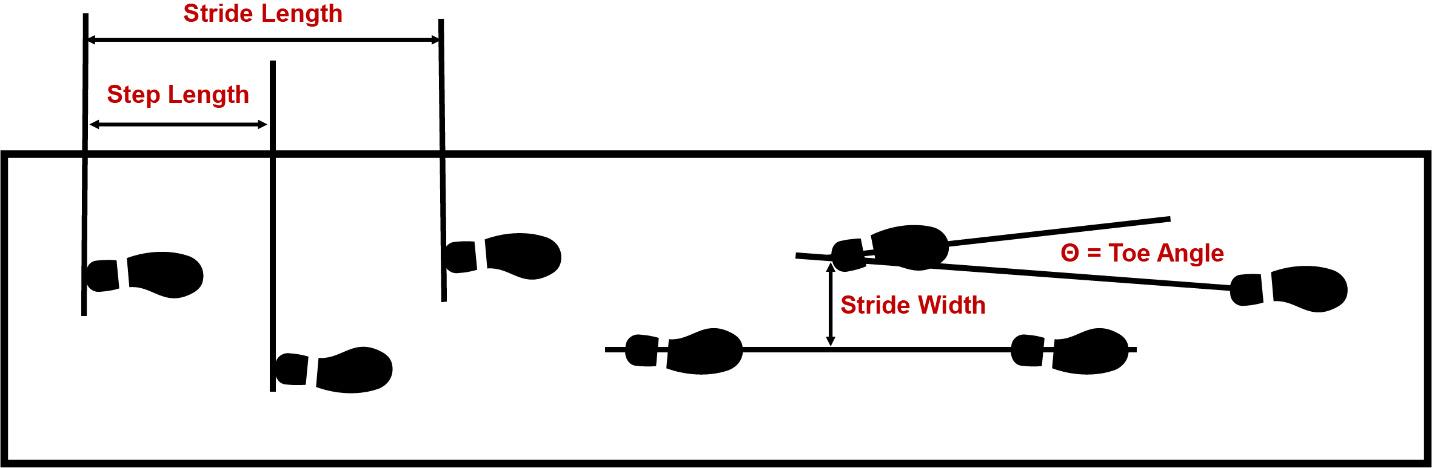
(PKMAS) (ProtoKinetics LLC, Havertown, PA). Right and left footfalls (i.e., footstrikes) were automatically labeled by PKMAS then confirmed by a research assistant. Variables of interest included stride length, stride width, step length, step time, stride time, stance time, swing time, percent stance phase, percent swing phase, single support time, total double support time, single support percent, total double support percent, speed, cadence, integrated pressure, and toe angle. Single support and double support variables were not analyzed for running.
Figure 1 illustrates each of the four spatial variables (stride length, stride width, step length, and toe angle). For toe angle, positive values indicate an externally rotated foot relative to the direction of progression. As defined by PKMAS software, step time and stride time were calculated using the first contact of two consecutive contralateral or ipsilateral footfalls, respectively Stance time was defined as the time between initial and final contacts for a single footfall. Swing time was calculated as the difference between stride time and stance time. Percentage variables were calculated as a percent of one full gait cycle, defined as the time between the first contact of two consecutive ipsilateral footfalls (i.e., stride time). Single support time was defined as the time during which only one foot is in contact with the ground. Total double support time was defined as the period during which both feet were in contact with the ground during stance phase, including both the initial and terminal portions of double support during a single gait cycle. Cadence was calculated using the number of footfalls divided by the total ambulation time of a single trial and then converted to steps per minute. Integrated pressure was defined as the area under the relative pressure curve for a single footfall and was averaged across all footfalls of the same limb for each trial.
An a priori power analysis was conducted using unpublished pilot data of 18 healthy, uninjured participants collected prior to this study Each participant completed three
trials of walking and running along the length of the ZenoTM Walkway. Mean and standard deviation (SD) of sample SDs for integrated pressure, step length, step width, and stance time were calculated for walking (integrated pressure: 7.40±1.80; step length: 2.10±0.65 cm; step width: 2.00±0.50 cm; stance time: 0.015±0.005 sec) and running (integrated pressure: 4.70±1.40; step length: 4.70±1.90 cm; step width: 2.20±0.70 cm; stance time: 0.012±0.003 sec). A total sample size of n=37 was required to achieve at least 80% power and a significance level of 0.05 for all gait variables during walking and running using an equivalence margin of ±20%. To determine test-retest reliability, a sample size of n=17 was determined sufficient to detect intraclass correlation of 0.85 (vs. a null intraclass correlation coefficient (ICC) of 0.5) with 80% power and a significance level of 0.05.
Statistical analysis was performed using IBM SPSS Statistics 26 (Armonk, NY). Two-way mixed effects intraclass correlation coefficients (ICC3,k) were used to assess absolute agreement between means of spatiotemporal variables calculated using three, four, or five passes over the ZenoTM Walkway.30 ICC values range from 0-1, with higher numbers indicating better agreement between variables. According to published literature, ICC values less than 0.5 indicate poor reliability, 0.5-0.75 indicates moderate reliability, 0.75-0.9 indicates good reliability, and values > 0.90 indicate excellent reliability.31
Two-way mixed effects intraclass correlation coefficients (ICC3,1) were used to assess absolute agreement of spatiotemporal variable means between testing sessions. For both walking and running, the average of each spatiotemporal variable during the first three trials was used in the analysis. MDC was calculated using the sample standard er-
Figure 1. Schematic illustration of spatiotemporal variable definitions (step length, stride length, stride width, and toe angle).ror of the mean (SEM), pooled standard deviation between both testing sessions (SDpooled), and ICC3,1:
The standard error of the mean provides information about precision, or repeatability, of a measurement. Bland-Altman plots (the difference between sessions vs. the mean between sessions) were used to visualize the agreement between sessions for each variable. Bland-Altman plots can be used to evaluate the amount of measurement bias. For example, if the absolute value of the difference between measurements tends to be greater than zero, or ±1 MDC in this analysis, it would suggest bias in the measurement.32,33 Limits of agreement were set as ± 1 MDC to visually assess the magnitude of difference between measurements and observe whether a majority of measurement differences fell within the range of the MDC (i.e. would be interpreted as a true change or not).
This analysis included data collected in a single testing session for 38 participants (21 female; age: 24.2±3.5 years). During walking, the number of footfalls per trial for a single limb for the first three, four, and five one-way trials were 2.75±0.38, 2.73±0.38, and 2.73±0.39, respectively. During running, the number of footfalls for the first three, four, and five one-way trials were 1.58±0.49, 1.57±0.49, and 1.58±0.49, respectively Mean (SD) values for each spatiotemporal variable calculated from all footfalls during either the first three, four, or five trials are provided in Table 1 (walking) and Table 2 (running). ICC values ranged from 0.995-1.000 for all variables during walking and running, indicating excellent reliability of spatiotemporal variables when using three, four or five passes over the ZenoTM Walkway
2: ESTABLISHING
The mean of the first three trials for each spatiotemporal variable was used to assess test-retest reliability Table 3 (walking) and Table 4 (running) show mean, ICC, and MDC values for each spatiotemporal variable. Bland-Altman plots of the mean value between T1 and T2 vs. the difference between T1 and T2 for stride length, stride width, step time, and step length are provided in Figure 2 (walking) and Figure 3 (running). Bland Altman plots for the remaining variables are available in Appendices A and B.
ICC values during walking ranged from 0.732-0.982. Variables with excellent test-retest reliability (ICC > 0.90) during walking on the ZenoTM Walkway were step length, stride length, step time, stride time, stance time, integrated pressure, toe angle, speed, and cadence. Variables with good reliability (ICC 0.75-0.90) were swing time, percent stance, percent swing, single support time, double support
time, single support percent, and double support percent. Stride width (ICC=0.732) was the least reliable variable and the only walking variable with moderate reliability (ICC 0.5-0.75).
For running, ICC values ranged from 0.683-0.939. Variables with excellent test-retest reliability during running on the ZenoTM Walkway included step length, stride length, integrated pressure, and speed. Variables with good reliability included stride width, step time, stride time, percent stance, percent swing, and toe angle. Variables with moderate reliability during running included stance time, swing time, and cadence. No variables demonstrated poor testretest reliability during running.
The purposes of this study were to 1) determine if up to two additional trials of walking and running on the ZenoTM Walkway are needed to produce consistent measurements of spatiotemporal variables, and 2) establish test-retest reliability and MDC values for common spatiotemporal variables measured during walking and running. The results of the first aim suggest that three one-way passes over the walkway are sufficient to collect reliable walking and running data in young, active individuals, when compared with using four or five one-way passes. This information can serve as a guideline for efficient and effective use of a ZenoTM Walkway in clinical and research settings. Fewer trials may reduce patient or participant fatigue and the burden of time on both the patient and clinician/researcher collecting the data.
Use of the ZenoTM Walkway and other instrumented pressure walkways has historically been limited to older adults or populations with known gait pattern abnormalities. The results of this study support its use in younger, more active populations and with higher-level movements like running. The use of pressure walkways with these movements would allow a deeper understanding of running without the time and cost of three-dimensional motion capture. Results from the second aim demonstrate that the ZenoTM Walkway is a reliable measurement tool for spatiotemporal characteristics of walking and running in a relatively young (15-35 years old) population, with most variables showing good to excellent reliability Stride width, percent stance, and percent swing were the least reliable variables during walking with ICCs of 0.732-0.766, although they still show moderate to good reliability when measured by a ZenoTM Walkway Although these values showed lower ICCs, they each demonstrated relatively small magnitude SEMs, supporting the precision and reliability of the measurements.34 Participants in this trial demonstrated comparable walking gait parameters to previously published data collected on the ZenoTM Walkway in samples of a similar age range.9 Minimal detectable change values indicate the amount of expected variability between testing sessions for each variable during walking or running. Variations larger than the MDC indicate true changes in gait pattern. The MDC values reported in this study are unique to the ZenoTM Walkway and may be useful in clinical and re-
Intraclass correlation coefficient (ICC3,k) values indicate absolute agreement of spatiotemporal variables. ICC, intraclass correlation coefficient; CI, confidence interval; cm, centimeters; sec, seconds; %, percentage; p x sec, pressure times seconds; min, minute.
Table 2. Descriptive statistics for spatiotemporal variables during running as measured using 3, 4, or 5 one-way passes over the ZenoTM Walkway. Spatiotemporal values are presented as mean (SD).
search settings to discern subtle but legitimate changes in gait parameters longitudinally or in response to intervention that would not otherwise be perceived. Further investigation is needed to determine whether these MDC values
correspond to clinically-meaningful changes in spatiotemporal characteristics of walking and running.
This is the first study to quantify spatiotemporal parameters of running when using the ZenoTM Walkway All spatiotemporal variables included in this analysis showed
and T2. Symbols indicate excellent, good, or moderate reliability
moderate to excellent test-retest reliability during running. Temporal variables including cadence, stride time, step time, and stance time were the least reliable with ICCs ranging from 0.683-0.771. In general, reliability decreased during running compared to walking. This reduction in reli-
ability during running could be a result of measurement error at higher velocities. Despite showing reduced reliability, differences in measured spatiotemporal variables between sessions may still fall within the range of normal variability
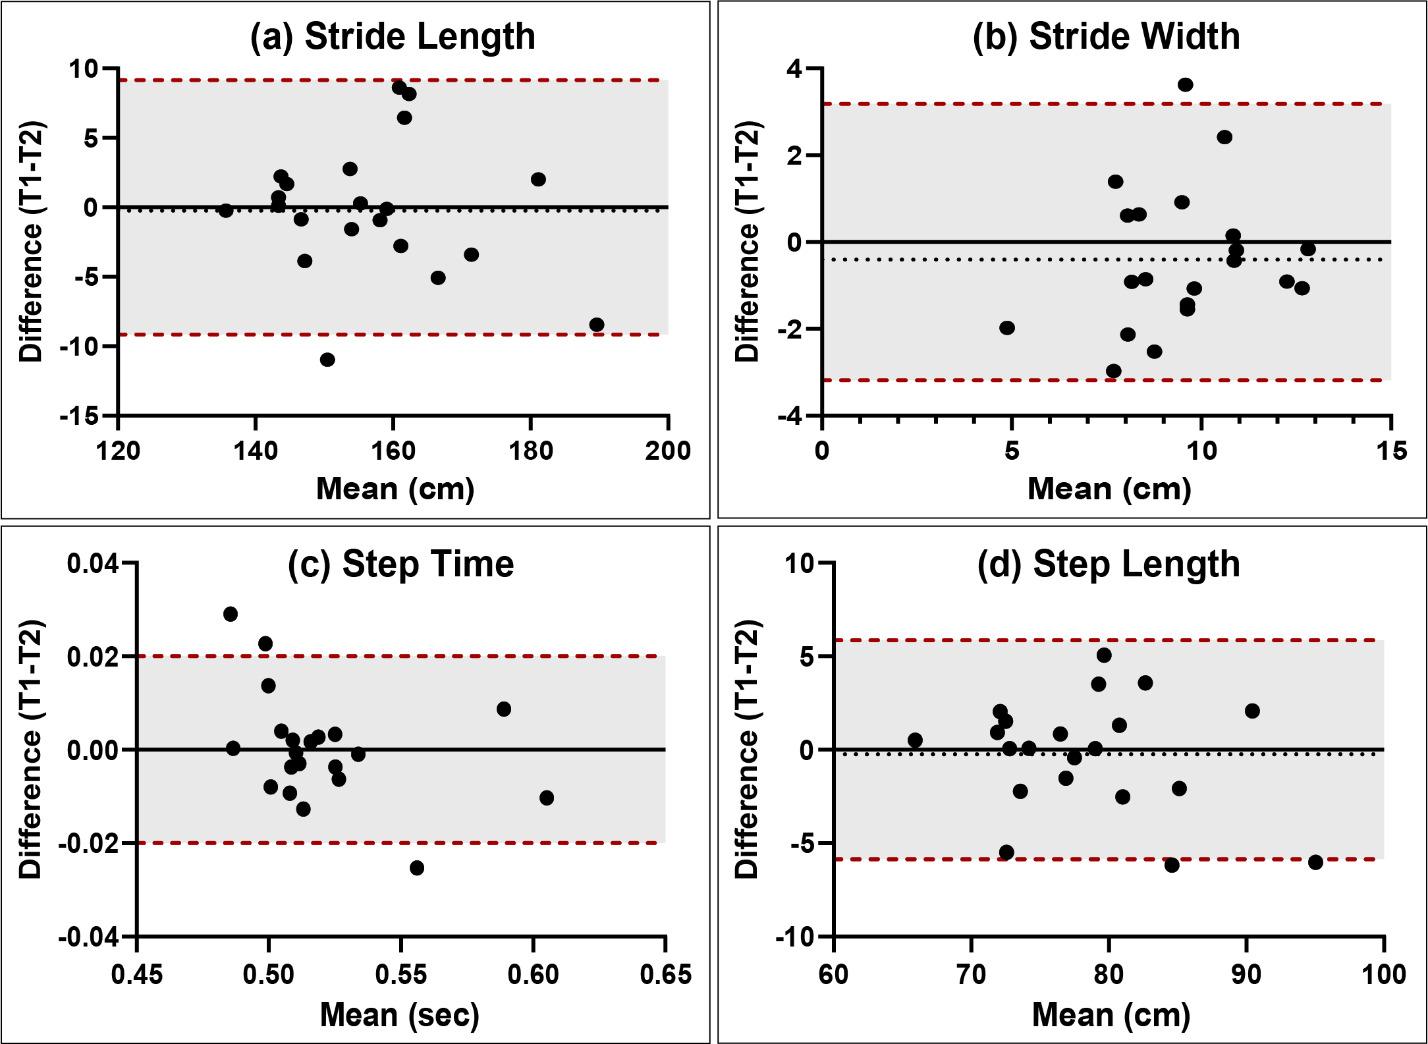
and not affect the larger goal of assessing for clinically-relevant changes in running characteristics.
Limitations of this study include the narrow inclusion criteria such that results may only be generalized to young, active individuals and not to older, active adults and sedentary young people. Future studies should aim to assess the reliability of specific high-level movements like hopping to increase the utility of the ZenoTM Walkway for young, athletic populations.
The findings of this study recommend a reliable measurement protocol of three one-way passes over the ZenoTM Walkway for assessment of walking or running. During both tasks, spatiotemporal variables of gait show moderate to excellent test-retest reliability when measured at least one day apart. The ZenoTM Walkway is a reliable measurement tool for gait analysis and can be used in the assessment and management of young, active populations without neuromusculoskeletal impairment or injury.
None
This work was supported by the Nebraska Bankers Association and the University of Nebraska Medical Center The funding sources had no involvement in study design, data collection, analysis, interpretation, manuscript writing, or decision to submit the article for publication.
Submitted: July 31, 2023 CDT, Accepted: February 07, 2024
CDT
© The Author(s)
Figure 2. Sample Bland-Altman plots for spatiotemporal variables during walking. The dashed red lines and shaded areas indicate limits of agreement equal to ±1 MDC. The dashed black line indicates the mean difference for all participants between the first and second testing sessions. The solid black line is included as a reference and indicates no difference between testing sessions. Plots for all variables are available in Appendix A. T1, baseline timepoint; T2, follow-up timepoint; cm, centimeters; sec, seconds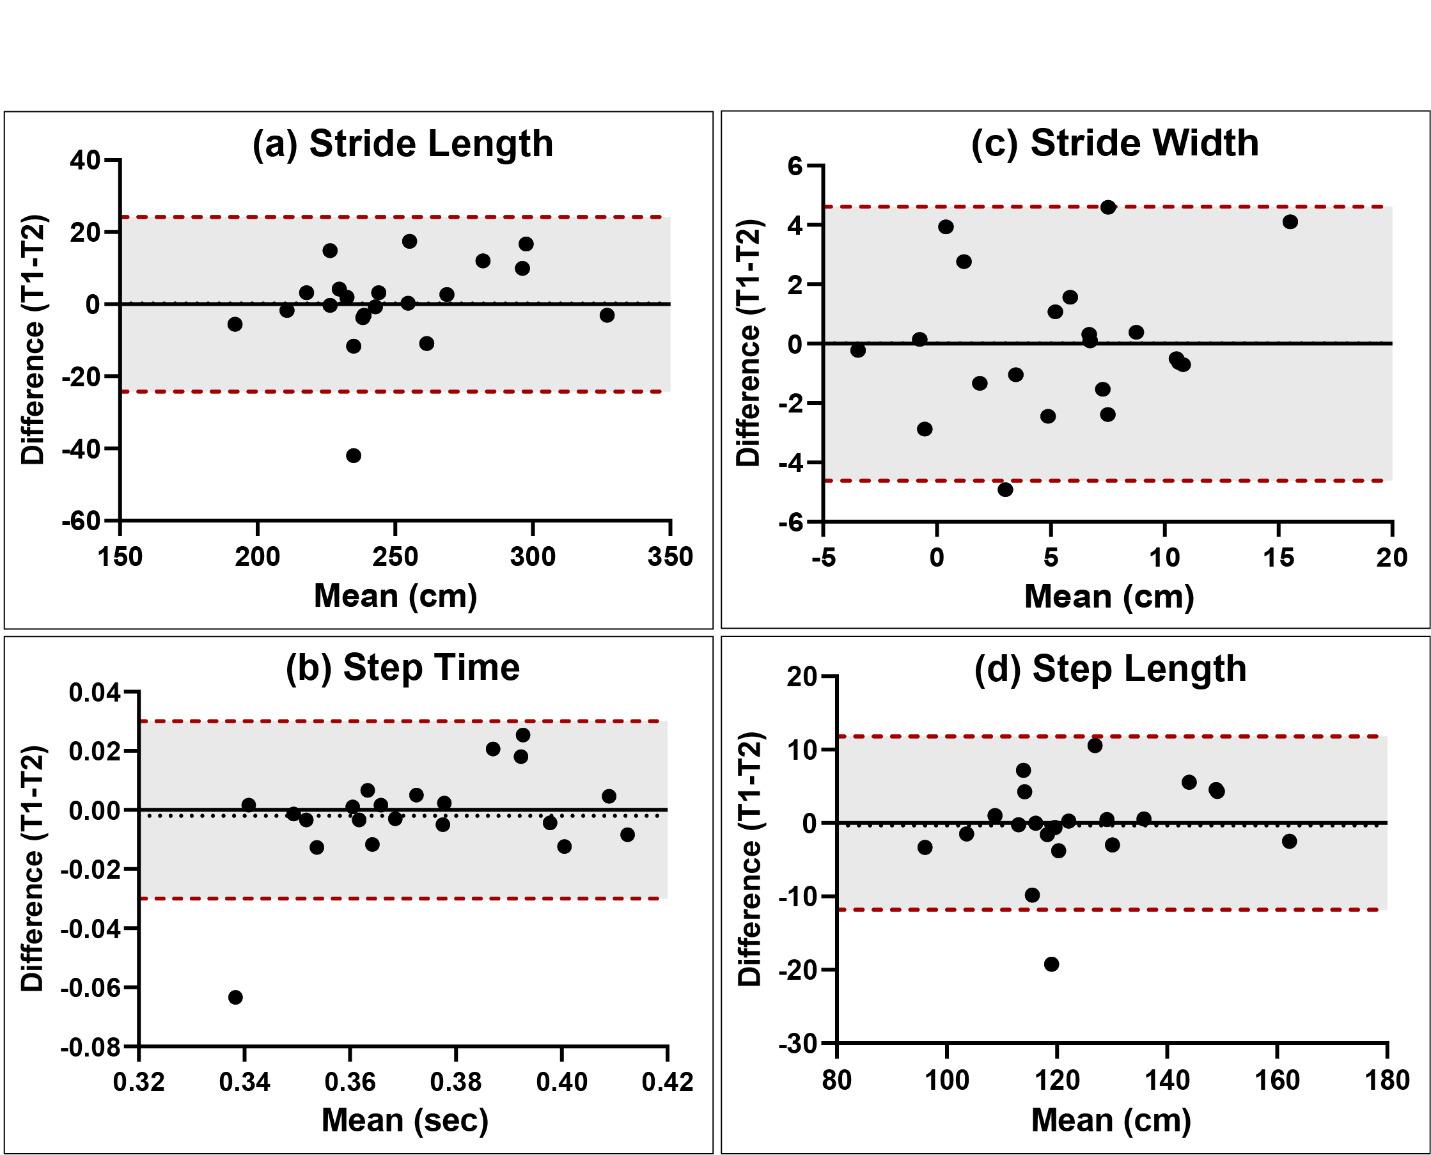
The dashed red lines and shaded areas indicate limits of agreement equal to ±1 MDC. The dashed black line indicates the mean difference for all participants between the first and second testing sessions. The solid black line is included as a reference and indicates no difference between testing sessions. Plots for all variables are available in Appendix B. T1, baseline timepoint; T2, follow-up timepoint; cm
centimeters;
This is an open-access article distributed under the terms of the Creative Commons Attribution 4.0 International License (CCBY-NC-4.0). View this license’s legal deed at https://creativecommons.org/licenses/by-nc/4.0 and legal code at https://creativecommons.org/licenses/by-nc/4.0/legalcode for more information.
Figure 3. Sample Bland-Altman plots for spatiotemporal variables during running. , sec, seconds1. Brach JS, Studenski S, Perera S, VanSwearingen JM, Newman AB. Stance time and step width variability have unique contributing impairments in older persons. Gait Posture 2008;27(3):431-439. doi:10.101 6/j.gaitpost.2007.05.016
2. Roche B, Simon AL, Guilmin-Crépon S, et al. Testretest reliability of an instrumented electronic walkway system (GAITRite) for the measurement of spatio-temporal gait parameters in young patients with Friedreich’s ataxia. Gait Posture 2018;66:45-50. doi:10.1016/j.gaitpost.2018.08.017
3. Guo G, Guffey K, Chen W, Pergami P. Classification of normal and pathological gait in young children based on foot pressure data. Neuroinformatics 2017;15(1):13-24. doi:10.1007/s12021-016-9313-x
4. Monticone M, Ambrosini E, Fiorentini R, et al. Reliability of spatial–temporal gait parameters during dual-task interference in people with multiple sclerosis. A cross-sectional study Gait Posture 2014;40(4):715-718. doi:10.1016/j.gaitpost.2014.06.0 15
5. Song M, Lieberman A, Fife T, et al. A prospective study on gait dominant normal pressure hydrocephalus. Acta Neurol Scand. 2019;139(4):389-394. doi:10.1111/ane.13064
6. Virmani T, Gupta H, Shah J, Larson-Prior L. Objective measures of gait and balance in healthy non-falling adults as a function of age. Gait Posture. 2018;65:100-105. doi:10.1016/j.gaitpost.2018.07.167
7 Urquhart DM, Morris ME, Iansek R. Gait consistency over a 7-day interval in people with Parkinson’s disease. Arch Phys Med Rehabil 1999;80(6):696-701. doi:10.1016/s0003-9993(99)9017 5-2
8. Hausdorff JM, Rios DA, Edelberg HK. Gait variability and fall risk in community-living older adults: a 1-year prospective study. Arch Phys Med Rehabil 2001;82(8):1050-1056. doi:10.1053/apmr.200 1.24893
9. McKay MJ, Baldwin JN, Ferreira P, et al. Spatiotemporal and plantar pressure patterns of 1000 healthy individuals aged 3–101 years. Gait Posture 2017;58:78-87. doi:10.1016/j.gaitpost.2017.07.004
10. Verlinden VJA, van der Geest JN, Hoogendam YY, Hofman A, Breteler MMB, Ikram MA. Gait patterns in a community-dwelling population aged 50 years and older Gait Posture 2013;37(4):500-505. doi:10.1016/ j.gaitpost.2012.09.005
11. Herssens N, Verbecque E, Hallemans A, Vereeck L, Van Rompaey V, Saeys W Do spatiotemporal parameters and gait variability differ across the lifespan of healthy adults? A systematic review Gait Posture 2018;64:181-190. doi:10.1016/j.gaitpost.201 8.06.012
12. Hars M, Herrmann FR, Trombetti A. Reliability and minimal detectable change of gait variables in community-dwelling and hospitalized older fallers. Gait Posture 2013;38(4):1010-1014. doi:10.1016/j.gait post.2013.05.015
13. Marigold DS, Patla AE. Age-related changes in gait for multi-surface terrain. Gait Posture 2008;27(4):689-696. doi:10.1016/j.gaitpost.2007.09.00 5
14. Paterson KL, Lythgo ND, Hill KD Gait variability in younger and older adult women is altered by overground walking protocol. Age Ageing. 2009;38(6):745-748. doi:10.1093/ageing/afp159
15. Kirkland MC, Wadden KP, Ploughman M. Bipedal hopping as a new measure to detect subtle sensorimotor impairment in people with multiple sclerosis. Disabil Rehabil 2022;44(8):1544-1555. doi:1 0.1080/09638288.2020.1820585
16. Vallabhajosula S, Humphrey SK, Cook AJ, Freund JE. Concurrent validity of the Zeno Walkway for measuring spatiotemporal gait parameters in older adults. J Geriatr Phys Ther. 2019;42(3):E42-E50. doi:1 0.1519/jpt.0000000000000168
17 Hollman JH, McDade EM, Petersen RC. Normative spatiotemporal gait parameters in older adults. Gait Posture 2011;34(1):111-118. doi:10.1016/j.gaitpost.2 011.03.024
18. Chen A, Kirkland MC, Wadden KP, Wallack EM, Ploughman M. Reliability of gait and dual-task measures in multiple sclerosis. Gait Posture 2020;78:19-25. doi:10.1016/j.gaitpost.2020.03.004
19. Paterson KL, Hill KD, Lythgo ND, Maschette W The reliability of spatiotemporal gait data for young and older women during continuous overground walking. Arch Phys Med Rehabil 2008;89(12):2360-2365. doi:10.1016/j.apmr.2008.06.0
20. Besser M, Kmieczak K, Schwartz L, Snyderman M, Wasko J, Selby-Silverstein L. Representation of temporal spatial gait parameters using means in adults without impairment. Gait Posture 1999;9:113.
21. Parati M, Ambrosini E, De Maria B, et al. The reliability of gait parameters captured via instrumented walkways: a systematic review and meta-analysis. Eur J Phys Rehabil Med. 2022;58(3):363-377 doi:10.23736/s1973-9087.22.070 37-x
22. Cutlip RG, Mancinelli C, Huber F, DiPasquale J. Evaluation of an instrumented walkway for measurement of the kinematic parameters of gait. Gait Posture. 2000;12(2):134-138. doi:10.1016/s096 6-6362(00)00062-x
23. Ade V, Schalkwijk D, Psarakis M, et al. Between session reliability of heel-to-toe progression measurements in the stance phase of gait. PLOS ONE. 2018;13(7):e0200436. doi:10.1371/journal.pone.0200 436
24. McDonough AL, Batavia M, Chen FC, Kwon S, Ziai J. The validity and reliability of the GAITRite system’s measurements: A preliminary evaluation. Arch Phys Med Rehabil. 2001;82(3):419-425. doi:10.10 53/apmr.2001.19778
25. van Uden CJT, Besser MP Test-retest reliability of temporal and spatial gait characteristics measured with an instrumented walkway system (GAITRite®). BMC Musculoskel Disord 2004;5:13. doi:10.1186/147 1-2474-5-13
26. Bilney B, Morris M, Webster K. Concurrent related validity of the GAITRite® walkway system for quantification of the spatial and temporal parameters of gait. Gait Posture 2003;17(1):68-74. doi:10.1016/s0 966-6362(02)00053-x
27. Menz HB, Latt MD, Tiedemann A, Mun San Kwan M, Lord SR. Reliability of the GAITRite® walkway system for the quantification of temporo-spatial parameters of gait in young and older people. Gait Posture 2004;20(1):20-25. doi:10.1016/s0966-6362(0 3)00068-7
28. Stergiou N, Decker LM. Human movement variability, nonlinear dynamics, and pathology: is there a connection? Hum Mov Sci 2011;30(5):869-888. doi:10.1016/j.humov.2011.06.00 2
29. Grindem H, Eitzen I, Snyder-Mackler L, Risberg MA. Online registration of monthly sports participation after anterior cruciate ligament injury: a reliability and validity study Br J Sports Med 2014;48(9):748-753. doi:10.1136/bjsports-2012-0920 75
30. Shrout PE, Fleiss JL. Intraclass correlations: uses in assessing rater reliability Psychol Bull 1979;86(2):420-428. doi:10.1037/0033-2909.86.2.420
31. Koo TK, Li MY A guideline of selecting and reporting intraclass correlation coefficients for reliability research. J Chiropr Med. 2016;15(2):155-163. doi:10.1016/j.jcm.2016.02.012
32. Giavarina D Understanding Bland Altman analysis. Biochem Med. 2015;25(2):141-151. doi:10.11 613/bm.2015.015
33. Hergott CG, Bolgla LA, Waller JL, et al. TUG-10: A modification of the timed up and go test for aerobic assessment in older adults. Cardiopulm Phys Ther J 2022;33(4):157-165. doi:10.1097/cpt.00000000000002 02
34. Denegar CR, Ball DW. Assessing the reliability and precision of measurement: an introduction to intraclass correlation and standard error of measurement. J Sport Rehabil 1993;2(1):35-42. doi:1 0.1123/jsr.2.1.35
Appendix A
Download: https://ijspt.scholasticahq.com/article/94606-reliability-of-an-instrumented-pressure-walkway-formeasuring-walking-and-running-characteristics-in-young-athletic-individuals/attachment/ 198489.docx?auth_token=rPpPg7HdoNxGX5fE_ycU
Appendix B
Download: https://ijspt.scholasticahq.com/article/94606-reliability-of-an-instrumented-pressure-walkway-formeasuring-walking-and-running-characteristics-in-young-athletic-individuals/attachment/ 198490.docx?auth_token=rPpPg7HdoNxGX5fE_ycU
Original Research
Michael S Crowell1,2 a , Eliot Thomasma3 , Erin Florkiewicz4 , Richard Brindle5 , Megan Roach6 , Donald Goss7 , Will Pitt8 1 University of Scranton, 2 Baylor University - Keller Army Community Hospital Division 1 Sports Physical Therapy Fellowship, 3 Carl R. Darnall Army Medical Center, 4 Baylor University – Keller Army Community Hospital Division 1 Sports Physical Therapy Fellowship, 5 Shaw Sports Turf, Shaw Industries Group, 6 DoD-VA Extremity Trauma & Amputation Center of Excellence, Womack Army Medical Center, 7 High Point University, 8 ArmyBaylor Doctoral Program in Physical Therapy
Keywords: Ankle Sprain, Balance Training, Validity, Smart Phone Application
https://doi.org/10.26603/001c.94608
Background
Static balance is often impaired in patients after ankle sprains. The ability to identify static balance impairments is dependent on an effective balance assessment tool. The Sway Balance Mobile Application (SWAY App) (Sway Medical, Tulsa, OK) uses a smart phone or tablet to assess postural sway during a modified Balance Error Scoring System (mBESS) assessment and shows promise as an accessible method to quantify changes in static balance after injury.
Purpose
The primary purposes of this study were to determine the ability to differentiate between those with ankle sprain versus controls (construct validity) and ability to detect change over time (responsiveness) of a mBESS assessment using a mobile device application to evaluate static balance after an acute ankle sprain.
Study Design
Case-control study.
Methods
Twenty-two military academy Cadets with an acute ankle sprain and 20 healthy Cadets were enrolled in the study. All participants completed an assessment measuring self-reported function, ankle dorsiflexion range of motion (via the weightbearing lunge), dynamic balance, and static balance. Static balance measured with the mBESS using the SWAY App was validated against laboratory-based measures. Cadets with ankle sprains completed their assessment twice: once within two weeks of injury (baseline) and again after four weeks of rehabilitation that included balance training. Independent and paired t-tests were utilized to analyze differences over time and between groups. Effect sizes were calculated and relationships explored using Pearson’s correlation coefficients.
The mBESS scores measured by the SWAY App were lower in participants with acute ankle sprains than healthy Cadets (t = 3.15, p = 0.004). Injured participants improved their mBESS score measured by SWAY at four weeks following their initial assessments (t = 3.31, p = 0.004; Baseline: 74.2 +/- 16.1, 4-weeks: 82.7 +/- 9.5). The mBESS measured by
CORRESPONDING AUTHOR:
Michael S Crowell, PT, DSc
Department of Physical Therapy, University of Scranton 800 Linden St, Scranton PA 18510 michaelcrowell99@gmail.com; (912) 656-1562
the SWAY App demonstrated moderate to good correlation with a laboratory measure of static balance (r = -0.59, p < 0.001).
The mBESS assessed with a mobile device application is a valid and responsive clinical tool for evaluating static balance. The tool demonstrated construct (known groups) validity detecting balance differences between a healthy and injured group, concurrent validity demonstrating moderate to good correlation with established laboratory measures, and responsiveness to changes in static balance in military Cadets during recovery from an acute ankle sprain.
Level
Ankle sprains are among the most common musculoskeletal injuries. The greater incidence of lateral ankle sprains amongst athletes,1,2 military academy Cadets,3 and the general population4 presents a considerable challenge for rehabilitation professionals. In military academy Cadets, the incidence rate of ankle sprains between 2005 and 2007 was 58.4 per 1000 person-years with 64.1% of those sprains occurring during athletics.3 A history of prior injury leads to increased rates of ankle sprains.5,6 Military Cadets with a prior ankle sprain had between three and six times the risk of sustaining an ankle sprain during basic training than Cadets without an ankle sprain history.7 Unfortunately, an initial ankle sprain has a high rate of recurrence and often leads to chronic ankle instability (CAI), which can greatly impact quality of life.8‑11
One impairment routinely identified in patients after an ankle sprain is decreased balance control.12 Static balance is often impaired immediately after an ankle sprain and likely improves approximately two to four weeks following the injury 13 Clinicians evaluating and treating patients after ankle sprains frequently use non-instrumented tools to assess static balance and assess risk for chronic ankle instability 14,15 One such test, the Balance Error Scoring System (BESS), may be able to detect individuals with and without chronic ankle instability and requires the clinician to tally “errors” while the patient attempts to maintain a static position for a prescribed length of time.14‑16 The BESS demonstrates moderate reliability (ICC 0.57 – 0.74) in assessing static balance;17,18 however, it may not be able to detect subtle deficits in static balance, such as those present in the late stages of ankle sprain rehabilitation. An instrumented assessment of static balance using a force plate can detect impairments after an ankle sprain with greater sensitivity than clinician scored assessments.16 The ability to detect subtle deficits in static balance during recovery from ankle sprains may result in decreased rates of injury recurrence and risk for chronic ankle instability.14,15 However, the requirement of expensive technology to detect subtle deficits in static balance may not be practical for clinical implementation.
Mobile technology may be a portable and affordable solution to objectively measure static balance. Previous studies have explored the role of wearable inertial sensors to
evaluate static balance in patients with Parkinson’s Disease, concussion, fall risks, and diabetic neuropathy 19 Recently, the addition of a wearable inertial measurement unit (IMU) during the BESS produced reliable, clinically accessible objective BESS scores without requiring human judgment from a trained test administrator 20 The Sway Mobile Balance Application (SWAY App) similarly uses the accelerometer in a modern smart phone or tablet to assess static balance during a modified BESS (mBESS). The mBESS administered by the SWAY App demonstrated good testretest reliability in healthy participants (ICC = 0.76)21 and is often used for concussion baseline testing in youth and collegiate athletics (r = 0.75-0.78).22 This commercially available tool may also be useful for clinical assessment of static balance in individuals with acute ankle sprains.
The primary purposes of this study were to determine the ability to differentiate between those with ankle sprain versus controls (construct validity) and ability to detect change over time (responsiveness) of a mBESS assessment using a mobile device application to evaluate static balance after an acute ankle sprain. A secondary purpose was to determine the relationship between the mobile device application and laboratory-based static balance assessment (concurrent validity). It was hypothesized that the application could differentiate individuals with an ankle sprain from healthy controls, measure improvements in balance control over time, and demonstrate strong correlation with the laboratory assessments of static balance control.
This study was a case-control design. The first primary aim compared static balance between participants with an acute ankle sprain with a group of healthy controls (construct validity). The second primary aim assessed static balance following a four-week rehabilitation program (responsiveness). The secondary aim determined the relationship between static balance as assessed by the SWAY application and laboratory-based static balance assessments using a laboratory-grade force plate (concurrent validity).
Military academy Cadets were recruited through brochures and announcements within the Arvin Cadet Physical Therapy Clinic within Keller Army Community Hospital. The study was approved by the Naval Medical Center Portsmouth Institutional Review Board, and all participants provided written informed consent prior to participation.
Participants in the injured group were diagnosed with an acute grade I or II lateral ankle sprain by a physical therapist practicing in a direct-access musculoskeletal clinic. Acute was defined as occurring within the past two weeks at the time of the initial evaluation. Participants in the healthy group were Cadets free from any lower extremity injury including an ankle sprain within 12 weeks of enrollment. Participants with a history of lower extremity surgery involving the foot or ankle, concussion within the past six months, or any disorders known to affect balance (i.e. knee sprain, lumbar radiculopathy, etc) were excluded from both groups.
All participants completed a baseline assessment that included, in order, pain (via the Numerical Pain Rating Scale), self-reported function, (via the Single Assessment Numeric Evaluation and Quick-Foot and Ankle Ability Measure), ankle dorsiflexion range of motion (weight-bearing lunge test), dynamic balance (Y-Balance Test/Modified Stare Excursion Balance Test)), and static balance (SWAY modified Balance Error Scoring System).
The NPRS measures a patient’s subjective report of pain on an 11-point scale with ratings ranging from 0 (no pain) to 10 (worst possible pain). Participants reported their current pain and maximum pain over the past seven days. This scale is a valid and reliable measure of global pain intensity, with an MCID of two points.23,24
The SANE is a global rating scale that is a reliable and responsive (CVME <1%, MCID 7-19%) tool of global function.25,26 The SANE is scored on a 0-100% scale with 0% being unable to function and 100% equaling full function.
The Quick-FAAM is a 12-item questionnaire shortened from the 29-item Foot and Ankle Ability Measure (FAAM).27 The FAAM is a reliable, valid, and responsive (ICC 0.82, MDC 6.5%) measure of ankle function28‑31 and compares favorably to other self-report instruments that measure ankle instability in categories of test-retest reliability, internal consistency, construct validity, and responsiveness.32
Ankle dorsiflexion range of motion is often limited in people with ankle instability12,33 and can influence performance on balance tasks.34 Performance of the WBLT is reliable (ICC 0.85 – 0.96) and demonstrates adequate responsiveness (MCD 3.7 – 3.8 degrees) in the clinical assessment of ankle dorsiflexion range of motion.35 Both the involved and uninvolved ankles were tested. Participants were instructed to attempt to place their ankle in maximum dorsiflexion while maintaining full foot contact with the floor while the investigator placed a digital inclinometer in the sagittal plane along the anterior tibia to measure the WBLT.35,36 Hand support on a wall was allowed during all test trials. Participants were instructed to move “ as far as you can” through their entire available range without stopping because of pain. Three practice trials were followed by three record trials and the average of the three trials was recorded.
: Y-BALANCE TEST LOWER QUARTER (MODIFIED STAR EXCURSION BALANCE TEST)
The Y-Balance Test Lower Quarter (YBT-LQ) is an instrumented version of the Star Excursion Balance Test. The test is performed by standing on one leg without shoes while reaching in three different directions (anterior, posteromedial, and posterolateral) with the other leg.37 The YBT-LQ has good to excellent interrater reliability (0.85 – 0.91).38 Participants completed six practice trials in each reach direction (anterior, posteromedial, and posterolateral) bilaterally prior to the assessment to account for learning effects.39 Participants then performed three record trials, the average of which was recorded. If any errors occurred (i.e. touching the foot to the ground), the trial was terminated and not recorded. Limb length was measured from the anterior superior iliac spine (ASIS) to the medial malleolus. The recorded distances were normalized to limb length then summed to calculate a composite score.
The SWAY App uses a proprietary algorithm to calculate a balance score using information collected from the mobile device’s inertial sensors during testing. The SWAY App mBESS consists of five test positions all performed for 10 seconds with the participant’s eyes closed on a hard level surface. The positions were feet together, tandem involved (injured leg behind uninjured leg), tandem uninvolved (uninjured leg behind injured leg), single leg stance involved, and single leg stance uninvolved. For the injured group, the tandem and single leg test positions were categorized as involved and uninvolved leg based on the side of ankle injury For the healthy control group participants, the involved side (right or left) was categorized the same as their matched injured participant. The participant held the mobile device administering and recording postural sway during the mBESS flat against their chest with elbows maintaining contact with the trunk. After an acclimation trial with the SWAY App and mobile device, the participant per-
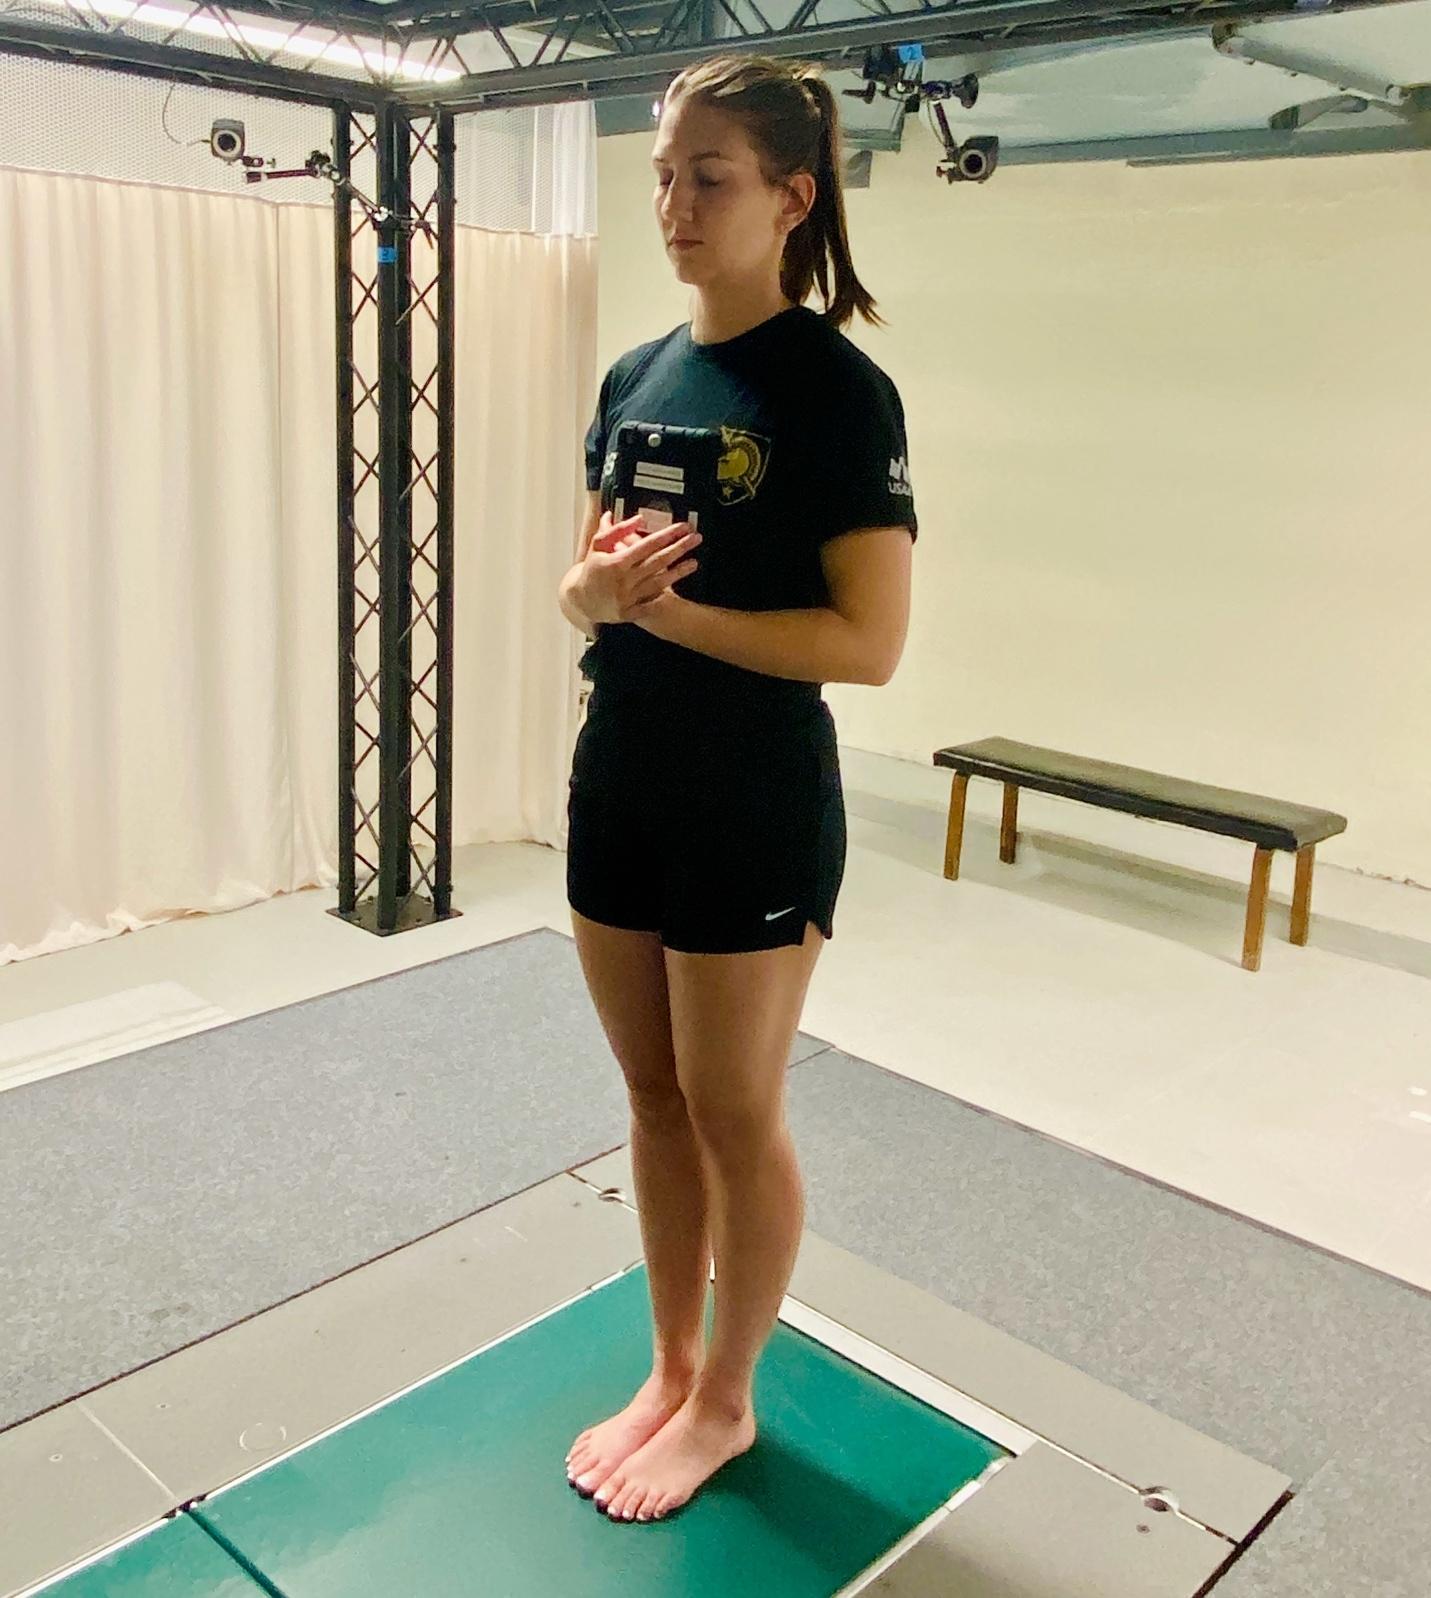
formed three trials of the mBESS. SWAY mBESS scores are unitless, derived from undisclosed proprietary manufacturer calculations, and can range from 0 to 100, with greater scores indicating better balance.
Prior to performing the modified version of the BESS, the investigator applied a retroreflective marker to the mobile device (Figure 1). Concurrently with measurements taken from the mobile device, center of pressure (COP) was captured with a force plate (AMTI, Watertown, MA) sampling at 1200 Hz. Ground reaction forces were recorded using Vicon Nexus software (Vicon, Oxford UK) and processed in Visual3D software (C-Motion, Germantown, MD USA). Force plate COP data were filtered using a zero-lag, 2nd order, low-pass Butterworth filter with a cut off frequency of six Hz. Root-Mean-Square (RMS) sway area was calculated about the mean anterior-posterior (A-P) and mediallateral (M-L) COP displacement (disp) (RMS = ) along with mean and peak A-P and M-L COP velocities using a custom LabVIEW program (National Instruments Corp., Austin, TX, USA).
Participants in the injured group then completed four weeks of ankle of rehabilitation based on the current standard of care for acute ankle sprains.5 Rehabilitation was performed by six sports physical therapy fellows and consisted of a combination of in-clinic therapy and at-home exercise programs with interventions to restore normal range of motion, strength, and balance. Balance training included single leg stance activities progressing in level of difficulty (i.e. single leg stance with eyes open to single leg stance with eyes closed over stable surfaces to over unstable surfaces). Rehabilitation was progressed based on patient presentation and symptom response. Details of the ankle sprain rehabilitation program and criteria for progression
can be found in Appendix A. Upon completion of four weeks of rehabilitation, participants in the injured group were reassessed using the same protocol described at baseline.
Descriptive statistics for age, height, and body mass were calculated with means and standard deviations reported. Differences in overall and mean SWAY scores for each test position between the injured and healthy groups were compared using an independent t-test. A paired t-test compared the mean overall and individual test position SWAY scores of the injured group at baseline to four-week followups. Cohen’s d (d) effect sizes were calculated, with 0.8 indicating a large, 0.5 indicating a medium, and 0.3 indicating a small effect.40 Additionally, Pearson correlations explored the associations between SWAY scores and a laboratory-based measure of static balance from the force plate (COP RMS and velocities). Correlation coefficients were interpreted as strong (r 0.75), moderate-good (r = 0.50 –0.74), low-fair (r = 0.25 – 0.49).40 All tests were two tailed and the significance level for all analyses was set at α = .05. A Bonferroni correction was used to control for family-wise type 1 error with multiple comparisons when testing the hypotheses of the ability of SWAY scores to distinguish between healthy and injured participants and to detect change over time (six comparisons, p = .008). All statistical analyses were completed using SPSS (version 28; IBM Corp, Armonk, NY, USA). Secondary analysis of subjective functional outcomes, ankle dorsiflexion range of motion, and dynamic balance included independent t-tests to examine differences between participants with ankle sprain and health controls and paired t-tests to examine differences in participants with ankle sprain at baseline and after four weeks of rehabilitation.
Forty-two military Cadets consented to participate in this study: 22 (5 Females) with acute ankle sprains (injured group) and 20 (5 Females) healthy controls (healthy group). The mean ± SD time from the evaluation for ankle sprain to first data collection was 6.1 ± 3.2 days. Two participants in the injured group did not complete their second data collection after completion of the standard rehabilitation and their data were not included in the analysis of responsiveness over time within the injured group; their data were used in the comparison with the healthy controls. There were no statistically significant differences in age, height, and weight between groups (Table 1).
Participants with acute ankle sprains had lower total SWAY scores than healthy participants (p =0.004) with a mean overall SWAY score of 74.4 ± 15.3 in injured versus 85.6 ± 6.5 in healthy participants. Injured participants scored worse than healthy participants in two mBESS stances: Tandem Involved (injured leg behind uninjured leg) [71.5 ± 22.4 for
Figure 1. SWAY position example for static balance assessment** = significant difference between injured and
injured and 88.6 ± 8.5 for healthy; p = 0.002] and single leg involved [58.6 ± 21.7 for injured and 76.7 ± 14.2 for healthy; p = 0.002] (Table 2).
The magnitude of SWAY score difference between injured and healthy groups was greatest during the single leg involved test position (d = 1.01). SWAY scores were not significantly different between injured and healthy groups during the tandem uninvolved (uninjured leg behind injured leg) and single leg uninvolved test positions. The injured and healthy groups were also significantly different in all self-report and clinical measures assessed (Table 3).
Injured participants’ overall SWAY scores significantly increased from 74.2 ± 16.1 at baseline to 82.7 ± 9.5 after four weeks of ankle rehabilitation (p = .004, mean assessment interval: 32.4 ± 6.5 days) (Table 4). Overall SWAY scores for healthy participants (85.6 ± 6.5) were not significantly different from the SWAY scores for injured participants af-
ter four weeks of ankle rehabilitation (p = 0.17). Individual test position mBESS scores of the injured participants significantly improved between baseline and follow-up assessments in the tandem involved position (70.3 ± 23.2 at baseline and 84.7 ± 13.3 at follow-up; p = 0.006) and single leg involved position (61.7 ± 20.0 at baseline and 72.5 ± 12.9 at follow-up; p = 0.008) (Table 4).
The test position with the greatest magnitude improvement in SWAY score between baseline and follow-up assessment times was the tandem involved position (d = 0.70). There were no differences in SWAY scores between baseline and follow-up assessment for the feet together and single leg uninvolved test positions. All self-reported and clinical measures also significantly improved between the baseline and four-week assessments (Table 5).
*
Total SWAY scores were moderately negatively correlated to RMS total displacement of COP (r = -0.59, p < 0.001) (Figure 2).
The purposes of this study were to assess the construct validity, responsiveness, and concurrent validity of the SWAY App for detection of differences in static balance in individuals after an acute ankle sprain. The results of this study confirmed the hypotheses that the mBESS measured with the SWAY App is a valid and responsive measure of static balance in individuals recovering from a grade I or II lateral ankle sprain.
The SWAY differentiated the injured group at baseline and the healthy group, with a large effect size for the total SWAY score (d = 0.94). Additionally, the SWAY detected change in static balance for the injured group after four weeks of ankle rehabilitation, with a medium-large effect size for the total SWAY score (d = 0.74). Total SWAY scores of the healthy group (85.6 ± 6.5) in this study agree with previously published normative values for 20-year-old males (85.8 ± 11.5) and females (89.0 ± 11.2).41
Identifying a streamlined protocol for static balance assessment may reduce the number of test positions within the SWAY needed to assess static balance. The total SWAY score had a smaller effect size than the individual single leg involved test position (d = 0.94 versus d = 1.01) when comparing injured and healthy participants, suggesting that the individual test position may be the most efficient assessment in differentiating between these two known groups. For determining change over time, the single leg involved test position had a similar effect size to the total SWAY score (d = 0.66 versus d = 0.74), again suggesting that the individual test position of single leg involved may be the most efficient assessment. In a study comparing center-ofmass acceleration measurements from a mobile deice versus motion capture in healthy individuals, single leg stance on firm and unstable surfaces similarly demonstrated the highest correlations.42 Further evaluation of a simplified SWAY testing procedure with only the single leg involved test position would better determine the most efficient method for assessing static balance with the SWAY mBESS after ankle sprains.
These findings demonstrate concurrent validity, with the mBESS measured by the SWAY App having a moderate, negative correlation to the reference standard of RMS total displacement of COP (r = -0.59, p < 0.001). Previous research conducted by Dewan et al. evaluating the relation-
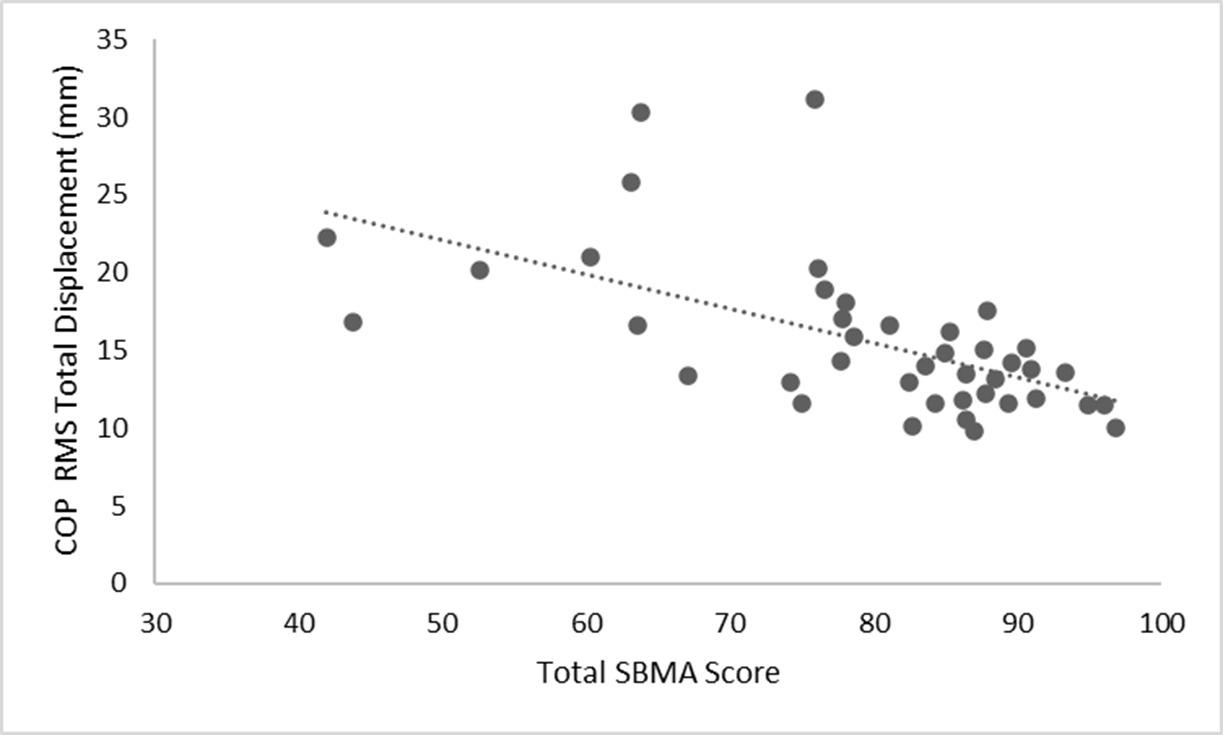
ship between the SWAY and COP measured by a force plate in healthy young adults observed significant negative correlations ranging from low-fair to moderate-good across multiple test conditions.43 In the present study, the magnitude of correlation was stronger (moderate-good) between the SWAY and RMS COP total displacement. Additionally, this study assessed the aggregated SWAY total score in relationship to COP RMS total displacement across all test positions, while Dewan et al. compared measures of static balance within each test position.
The ability of the SWAY App to provide quantitative data during the mBESS may be a more sensitive assessment of static balance than raters attempting to subjectively count errors. Traditional qualitative balance assessment trials with increased postural sway but no errors could hypothetically achieve a perfect score using observational assessment tools while the SWAY App is able to capture postural sway with or without errors. Additionally, rehabilitation professionals working in telemedicine could employ this technology to assess balance remotely and use that information to recommend rehabilitation programs better tailored to specific patient impairments.
This study has several limitations. The population assessed was a relatively young, healthy, and active population, which may not generalize to other population groups. Static balance was only assessed at two time points in recovery. Adding additional assessments through the first six weeks of recovery from ankle sprain may increase understanding of variability over time. Also, long term follow-up assessments were not completed, which limits the ability to determine the sensitivity of the SWAY to detect subtle, lingering deficits in static balance. Future research in this area should incorporate more frequent assessments and
follow participants for a longer duration to attempt to determine patients at increased risk for CAI. Identifying patients at risk for CAI relatively early in rehabilitation may allow more effective intervention and justify additional focus on balance control training even after the most obvious ankle sprain symptoms have resolved.
The SWAY can identify deficits in static balance in patients after acute ankle sprains and is responsive to improvements in static balance during recovery SWAY scores have moderate to strong negative linear relationships with laboratory-based assessments of balance control illustrating the application’s technical sensitivity. Overall, this study demonstrates the validity and responsiveness of the SWAY and expands the utility of the clinical assessment into musculoskeletal conditions, specifically, acute ankle sprains. The SWAY may warrant inclusion in the routine assessment of static balance after ankle sprain.
The opinions or assertions contained herein are the private views of the authors and are not to be construed as official or reflecting the views of the United States Army or Department of Defense.
The authors report no conflicts of interest.
Figure 2. Correlation between SWAY Balance Total Score and Center of Pressure (COP) Root Mean Squared (RMS) Total Displacement (r = -0.59, p < 0.001)This work was supported by the Telemedicine and Advanced Technology Research Center (TATRC) at the US Army Medical Research and Development Command.
Submitted: June 22, 2023 CDT, Accepted: January 28, 2024 CDT
© The Author(s)
This is an open-access article distributed under the terms of the Creative Commons Attribution 4.0 International License (CCBY-NC-4.0). View this license’s legal deed at https://creativecommons.org/licenses/by-nc/4.0 and legal code at https://creativecommons.org/licenses/by-nc/4.0/legalcode for more information.
1. Doherty C, Delahunt E, Caulfield B, Hertel J, Ryan J, Bleakley C. The incidence and prevalence of ankle sprain injury: A systematic review and meta-analysis of prospective epidemiological studies. Sports Med 2014;44(1):123-140. doi:10.1007/s40279-013-0102-5
2. Roos KG, Kerr ZY, Mauntel TC, Djoko A, Dompier TP, Wikstrom EA. The epidemiology of lateral ligament complex ankle sprains in National Collegiate Athletic Association sports. Am J Sports Med 2017;45(1):201-209. doi:10.1177/036354651666 0980
3. Waterman BR, Belmont PJ, Cameron KL, DeBerardino TM, Owens BD Epidemiology of ankle sprain at the United States Military Academy Am J Sports Med. 2010;38(4):797-803. doi:10.1177/0363546 509350757
4. Waterman BR, Owens BD, Davey S, Zacchilli MA, Belmont PJ. The epidemiology of ankle sprains in the United States. J Bone Joint Surg Am 2010;92(13):2279-2284. doi:10.2106/jbjs.i.01537
5. Martin RL, Davenport TE, Fraser JJ, et al. Ankle stability and movement coordination impairments: Lateral ankle ligament sprains revision 2021: Clinical practice guidelines linked to the International Classification of Functioning, Disability and Health rrom the Academy of Orthopaedic Physical Therapy of the American Physical Therapy Association. J Orthop Sports Phys Ther 2021;51(4):CPG1-CPG80. do i:10.2519/jospt.2021.0302
6. Rhon DI, Greenlee TA, Cook CE, Westrick RB, Umlauf JA, Fraser JJ. Fractures and chronic recurrence are commonly associated with ankle sprains: a 5-year population-level cohort of patients seen in the U.S. Military health system. Int J Sports Phys Ther 2021;16(5). doi:10.26603/001c.27912
7. Kucera KL, Marshall SW, Wolf SH, Padua DA, Cameron KL, Beutler AI. Association of injury history and incident injury in cadet basic military training. Med Sci Sports Exerc. 2016;48(6):1053-1061. doi:10.12 49/mss.0000000000000872
8. Hertel J. Functional Anatomy, pathomechanics, and pathophysiology of lateral ankle instability. J Athl Train 2002;37(4):364-375.
9. Hertel J, Corbett RO An updated model of chronic ankle instability. J Athl Train. 2019;54(6):572-588. do i:10.4085/1062-6050-344-18
10. Houston MN, Van Lunen BL, Hoch MC. Healthrelated quality of life in individuals with chronic ankle instability. J Athl Train. 2014;49(6):758-763. do i:10.4085/1062-6050-49.3.54
11. Hubbard-Turner T, Turner MJ. Physical activity levels in college students with chronic ankle instability J Athl Train 2015;50(7):742-747 doi:10.40 85/1062-6050-50.3.05
12. Gribble PA. Evaluating and differentiating ankle instability J Athl Train 2019;54(6):617-627 doi:10.40 85/1062-6050-484-17
13. Hertel J. Functional anatomy, pathomechanics, and pathophysiology of lateral ankle instability. J Athl Train 2002;37(4):364-375.
14. Kwon YU. Static postural stability in chronic ankle instability, an ankle sprain and healthy ankles. Int J Sports Med 2018;39(8):625-629. doi:10.1055/a-0 608-4552
15. Linens SW, Ross SE, Arnold BL, Gayle R, Pidcoe P. Postural-stability tests that identify individuals with chronic ankle instability J Athl Train 2014;49(1):15-23. doi:10.4085/1062-6050-48.6.09
16. McKeon PO, Hertel J. Systematic review of postural control and lateral ankle instability, part I: Can deficits be detected with instrumented testing? J Athl Train 2008;43(3):293-304. doi:10.4085/1062-605 0-43.3.293
17. Hunt TN, Ferrara MS, Bornstein RA, Baumgartner TA. The reliability of the modified Balance Error Scoring System. Clin J Sport Med 2009;19(6):471-475. doi:10.1097/jsm.0b013e3181c12c7b
18. Finnoff JT, Peterson VJ, Hollman JH, Smith J. Intrarater and interrater reliability of the Balance Error Scoring System (BESS). PM R. 2009;1(1):50-54. doi:10.1016/j.pmrj.2008.06.002
19. Ghislieri M, Gastaldi L, Pastorelli S, Tadano S, Agostini V Wearable inertial sensors to assess standing balance: A systematic review. Sensors. 2019;19(19):4075. doi:10.3390/s19194075
20. Brown HJ, Siegmund GP, Guskiewicz KM, Van Den Doel K, Cretu E, Blouin JS. Development and validation of an objective balance error scoring system. Med Sci Sports Exerc 2014;46(8):1610-1616. d oi:10.1249/mss.0000000000000263
21. Amick RZ, Chaparro A, Patterson JA. Test-retest reliability of the sway balance mobile application. J Mob Technol Med 2015;4(2):40-47 doi:10.7309/jmt m.4.2.6
22. Mummareddy N, Brett BL, Yengo-Kahn AM, Solomon GS, Zuckerman SL. Sway balance mobile application: Reliability, acclimation, and baseline administration. Clin J Sports Med. 2020;30(5):451-457. doi:10.1097/jsm.0000000000000626
23. Price DD, McGrath PA, Rafii A, Buckingham B. The validation of visual analogue scales as ratio scale measures for chronic and experimental pain. Pain 1983;17(1):45-56. doi:10.1016/0304-3959(83)90126-4
24. Price DD, Bush FM, Long S, Harkins SW. A comparison of pain measurement characteristics of mechanical visual analogue and simple numerical rating scales. Pain. 1994;56(2):217-226. doi:10.1016/0 304-3959(94)90097-3
25. Garcia AN, Cook C, Lutz A, Thigpen CA. Concurrent validity of the single assessment numerical evaluation and patient-reported functional measures in patients with musculoskeletal disorders: An observational study. Musculoskel Sci Pract. 2019;44:102057 doi:10.1016/j.msksp.2019.102057
26. Nazari G, Bobos P, Lu S, MacDermid JC. Psychometric properties of the single assessment numeric evaluation in patients with lower extremity pathologies. A systematic review Disabil Rehabil 2021;43(15):2092-2099. doi:10.1080/09638288.2019.1 693641
27 Hoch MC, Hoch JM, Houston MN. Development of the Quick-FAAM: A preliminary shortened version of the foot and ankle ability measure for chronic ankle instability Int J Athl Ther Train 2016;21(4):45-50. do i:10.1123/ijatt.2016-0002
28. Carcia CR, Martin RL, Drouin JM. Validity of the foot and ankle ability measure in athletes with chronic ankle instability. J Athl Train. 2008;43(2):179-183. doi:10.4085/1062-6050-43.2.179
29. Hoch JM, Powden CJ, Hoch MC. Reliability, minimal detectable change, and responsiveness of the Quick-FAAM. Phys Ther Sport 2018;32:269-272. d oi:10.1016/j.ptsp.2018.04.004
30. Martin RL, Irrgang JJ, Burdett RG, Conti SF, Swearingen JMV. Evidence of validity for the Foot and Ankle Ability Measure (FAAM). Foot Ankle Int 2005;26(11):968-983. doi:10.1177/1071100705026011
13
31. Matheny LM, Clanton TO Rasch analysis of reliability and validity of scores from the Foot and Ankle Ability Measure (FAAM). Foot Ankle Int 2020;41(2):229-236. doi:10.1177/1071100719884554
32. Eechaute C, Vaes P, Van Aerschot L, Asman S, Duquet W The clinimetric qualities of patientassessed instruments for measuring chronic ankle instability: A systematic review. BMC Musculoskelet Disord 2007;8(1):6. doi:10.1186/1471-2474-8-6
33. Hoch MC, Staton GS, Medina McKeon JM, Mattacola CG, McKeon PO. Dorsiflexion and dynamic postural control deficits are present in those with chronic ankle instability J Sci Med Sport 2012;15(6):574-579. doi:10.1016/j.jsams.2012.02.009
34. Hoch MC, Staton GS, McKeon PO Dorsiflexion range of motion significantly influences dynamic balance. J Sci Med Sport. 2011;14(1):90-92. doi:10.101 6/j.jsams.2010.08.001
35. Powden CJ, Hoch JM, Hoch MC. Reliability and minimal detectable change of the weight-bearing lunge test: A systematic review Man Ther 2015;20(4):524-532. doi:10.1016/j.math.2015.01.004
36. Bennell K, Talbot R, Wajswelner H, Techovanich W, Kelly D, Hall A. Intra-rater and inter-rater reliability of a weight-bearing lunge measure of ankle dorsiflexion. Aust J Physiother. 1998;44(3):175-180. d oi:10.1016/s0004-9514(14)60377-9
37 Plisky PJ, Gorman PP, Butler RJ, Kiesel KB, Underwood FB, Elkins B. The reliability of an instrumented device for measuring components of the Star Excursion Balance Test. N Am J Sports Phys Ther. 2009;4(2):92.
38. Plisky P, Schwartkopf-Phifer K, Huebner B, Garner MB, Bullock G. Systematic review and meta-analysis of the Y-Balance Test Lower Quarter: Reliability, discriminant validity, and predictive validity Int J Sports Phys Ther 2021;16(5):1190-1209. doi:10.2660 3/001c.27634
39. Robinson RH, Gribble PA. Support for a reduction in the number of trials needed for the Star Excursion Balance Test. Arch Phys Med Rehabil. 2008;89(2):364-370. doi:10.1016/j.apmr.2007.08.139
40. Portney LG. Foundations of Clinical Research: Applications to Evidence-Based Practice 4th ed. F.A. Davis; 2020.
41. Brett BL, Zuckerman SL, Terry DP, Solomon GS, Iverson GL. Normative data for the sway balance system. Clin J Sport Med. 2020;30(5):458-464. doi:1 0.1097/jsm.0000000000000632
42. Alberts JL, Thota A, Hirsch J, et al. Quantification of the Balance Error Scoring System with mobile technology Med Sci Sports Exerc 2015;47(10):2233-2240. doi:10.1249/mss.0000000000 000656
43. Dewan BM, Roger James C, Kumar NA, Sawyer SF. Kinematic validation of postural sway measured by Biodex Biosway (Force Plate) and SWAY Balance (Accelerometer) technology. Biomed Res Int. 2019;2019:1-10. doi:10.1155/2019/8185710
Christopher Rosenborougha , Sean M. Collins, Edward Smith, Thomas G Bowman
Keywords: injury prevention, motor control, FMS, y-balance test
https://doi.org/10.26603/001c.115423
No studies have observed the effects of a collegiate lacrosse season on movement pattern quality, dynamic postural control, or the accuracy of athletes’ perceived movement pattern quality The purpose was to examine the effects of a nontraditional fall season on movement pattern quality, perceived movement pattern quality, and dynamic postural control in collegiate lacrosse athletes.
Design
Cross-sectional laboratory study.
Methods
Fifty men’s (age=19.38±1.24 years, height=182.63±6.16 cm, mass=82.37±8.46 kg) and 22 women’s (age=19.68±1.17 years, height=165.10±6.88 cm, mass=64.09±8.72 kg) lacrosse players were recruited. Outcome measures included individual Functional Movement Screen™ (FMS™) scores, self-reported perceived movement pattern quality scores, lower and upper extremity Y-Balance Test (YBT) measurements, and active dorsiflexion range of motion (ROM) before the start and again at the end of the fall lacrosse season. Preand post-season measurements were assessed using paired t-tests and chi-squared analyses.
FMS™ composite scores did not significantly change from preseason to postseason for males (p=0.74) or females (p=0.07). Male perceived movement pattern quality was significantly higher than measured for 10 of 12 movements (p<0.05). Female perceived movement pattern quality was significantly higher than measured for four of 12 movements (p<0.05). Asymmetry frequency significantly increased in males in the hurdle step from two individuals to nine ( 1=25.52, p<0.01), inline lunge from 10 to 20 ( 1=12.50, p<0.01), and shoulder mobility from 4 to 21 ( 1=78.53, p<0.01). Asymmetries in male athletes significantly decreased in the active straight leg raise from 26 to 8 ( 1=25.96, p<0.01). YBT composite scores increased in males for the right leg (p=0.001) and left leg (p<0.03). Right dorsiflexion ROM (p<0.001) and left dorsiflexion ROM (p<0.001) significantly decreased in males from preseason to postseason. YBT scores for the right leg significantly increased in females from preseason to postseason (p=0.01). YBT scores for females for the right arm significantly increased from preseason to postseason (p=0.045).
Corresponding Author:
Christopher J. Rosenborough, MS, ATC
9509 West Coal Mine Ave, Apt. D Littleton, CO 80123
Rosenborough.c@alum.lynchburg.edu
@CJ_Rosenborough (804) 878-2045
A 5-week season may not change overall movement pattern quality of men’s or women’s lacrosse players, but some individual movement scores diminished. Athletes may overestimate self-reported movement pattern quality and are therefore unlikely to individually address movement deficits. Male dynamic postural control may change throughout a season, resulting in a potential increased risk of injury later in the season due to compensatory patterns or changes in mobility, proprioception, or balance.
Lacrosse is rapidly growing as a National Collegiate Athletic Association (NCAA) sport with the addition of 253 men’s and 416 women’s teams across all three divisions since the 1981-82 season.1 Men’s lacrosse has the largest growth of men’s teams by percentage of total NCAA members at 17.1%, with 15.1% growth since the 2000-01 season.1 In the same period, women’s lacrosse has the sixth-largest growth of women’s teams by percentage of total NCAA members at 33.4%. However, women’s lacrosse has the largest growth of women’s teams by percentage of total NCAA members since the 2000-01 season at 23.4%.1 In 2020-21, Division III recorded the highest number of men’s lacrosse teams at 246, while Division I and II had 73 and 72 teams, respectively 1 For women’s lacrosse in the same season, Division III had 292 participating teams while Division I had 118 and Division II had 111 teams.1
The nontraditional men’s and women’s lacrosse season for Division III consists of a maximum of 16 scheduled practices and either two scrimmages or a total of 120 minutes of competitive play.2 The season is limited to five weeks, with no more than four practices each week.2 Stress loads from the shorter fall season may differ from that of a traditional spring competitive season due to the length, which contains a condensed schedule with practices and games, as well as regular strength training workouts. The length of the nontraditional season may reflect the stress loads seen in preseason play before the start of the regular spring season. Preseason can be defined as the time of practice before the first regular-season competition during the championship season,3,4 which is during the spring for lacrosse. Preseason practice injury rates for women’s lacrosse players3‑6 and men’s lacrosse players7 are nearly twice as high as in-season practice injury rates, suggesting early-season play poses an increased injury risk to athletes with most injuries occurring in the lower extremity
Previous authors have documented the injury risk associated with decreased dorsiflexion range of motion (ROM) resulting in the potential development of several pathologies such as patellar tendinopathy or increased stress on the anterior cruciate ligament due to altered stress through decreased eccentric loading of the gastroc-soleus complex.8,9 Decreased dorsiflexion may occur due to a range of issues, including increased gastroc-soleus complex tightness, joint stiffness, or from lasting effects of ankle trauma.8 Regardless of underlying cause, decreased dorsiflexion ROM may alter stress loads throughout the lower
extremity kinetic chain and contribute to the development of altered movement patterns.
Previous authors have documented changes in physiological, biomechanical, and performance measures over the course of a competitive athletic season in sports other than lacrosse.10‑15 The changes over time may alter the kinetic chain and affect ROM or stability Mobility changes may lead to compensatory patterns resulting in overuse injury or decreased proprioception and a lower quality of coordinated movement. If the stress of a season leads to changes in movement quality and are not identified and addressed, athletes may be at an increased injury risk as the season progresses. Since improving functional movement may reduce injury risk and improve performance, Functional Movement Screen™ (FMS™) score measurements may provide insight into injury risk and athletic performance.16 Functional movement includes the ability to perform quality novel movements that require mobility and stability across three planes of movement. The movements require coordination from the central nervous system to ensure that all required muscles have proper proprioceptive functions needed for coordinated movement. While injury risk is multifaceted, functional testing is often utilized in rehabilitative programs to provide objective measures of patients’ progress as well as determine potential limb asymmetries and the development of compensatory patterns in functional movements as these factors may increase injury risk.17 A concentrated, individualized training program focused on areas of deficit can improve functional mobility scores regarding the FMS™ scoring criteria.18 The FMS™ has been used as a potential predictor of injury in sports such as hockey, football, and soccer with varying results.19‑23 A score of 14 or less has commonly been set as the cutoff for FMS™ scores for the best sensitivity and specificity for injury.24 However, different cutoff points based on maximum specificity and sensitivity have been found for men and women at ≤11 and ≤14, respetively.25 The inability to perform functional movements can lead to an increased risk of injury due to the loss of mobility, stability, or neuromuscular control.17 The Y-Balance Test (YBT) is a tool used to assess dynamic postural control in both the upper and lower extremities through motions that require mobility, stability, and neuromuscular control.17, 26‑30 The YBT classifies an asymmetry as greater than a 4 cm difference bilaterally 31 A difference greater than 4 cm between lower extremity limbs in the anterior direction has been reported to increase injury risk.28,32 The effect of a sport season on YBT performance has been observed in
sports such as field hockey with no significant difference in reach distance from preseason to the postseason.33 While several factors play a role in injury risk, screening and implementing appropriate corrective exercises can aid in improving mobility, stability, or neuromuscular control.17
The effect of a sport season on movement pattern quality has been observed in various sports such as rugby, collegiate soccer, and volleyball.16,34 While no significant changes in FMS™ composite scores were reported,34 there were significant changes in individual FMS™ movement scores and a decrease of asymmetries and scores of 1 (1 = inability to complete movement).16 Australian football athletes with asymmetries present on the FMS screening were more likely to sustain an injury during the season, indicating that asymmetries may be risk factors for injury 35 Additionally, the ability of athletes to accurately assess their potential movement pattern quality limitations may be helpful in identifying abnormalities in functional movement prior to the development of injury To the authors knowledge, no such study has observed the effects of a season on collegiate lacrosse athletes or the accuracy of athletes’ perceived movement pattern quality. Therefore, the purpose of this study was to examine the effects of a nontraditional lacrosse fall season on movement pattern quality and dynamic postural control in Division III collegiate lacrosse athletes. A secondary goal of this study was to observe how Division III lacrosse athletes perceived their movement pattern quality when compared to FMS scores.
This cross-sectional study design allowed for the observation of data from preseason to postseason. The research design was utilized to test the hypothesis that functional mobility and stability would change over the course of a lacrosse fall season and that perceived movement pattern quality would be different than actual movement pattern quality. The use of the FMS™ for the dependent variables allowed data points on all major functional movements. Dorsiflexion ROM measurements allowed a quantifiable approach to documenting change in an important aspect of functional stability The Y-Balance Test allowed for data points in both upper and lower extremity dynamic postural control.
Seventy-eight participants volunteered to participate in this study. Participants included Division III collegiate athletes from both men’s (n=50, age=19.4±1.2 years, height=182.6±6.2 cm, mass=82.4±8.5 kg) and women’s (n=22, age=19.7±1.2 years, height=165.1±6.9 cm, mass=64.1±8.7 kg) lacrosse teams at a single University Inclusion criteria consisted of participating in the fall, nontraditional lacrosse season and being part of their University’s men’s or women’s lacrosse team. Exclusion criteria included having had orthopedic surgery within the 12 months prior to the fall lacrosse season that resulted in at least three months of time lost, any injury that required re-
moval from lacrosse activity during the study period, the inability to complete the full YBT screen, and being under the age of 18 years old. Participants suffering from an injury resulting in any amount of time lost between the two timepoints for data collection during the fall lacrosse season, as well as athletes who did not complete the entire season, were removed from the study Participants participated in their normal strength training with the same certified strength and conditioning coach throughout the fall season. Both teams completed a tiered system of training rotating the emphasis between lower body, upper body, and total body sessions. This study was approved by the host Institutional Review Board (#LHS1819011) prior to initiating recruitment. We educated participants on their ability to opt out of this study and provided informed consent prior to being included in the study
Materials used included the FMS Test KitTM (Functional Movement Systems, Chatham, VA), which has been shown to have a moderate to good intratester reliability.34,36‑41 The FMS™ scoring criteria have been found to be reliable in assessing athletes’ movement patterns.34 Movement patterns were assessed by one examiner using the FMS™ screening during the first week of voluntary workouts with the team’s certified strength and conditioning coach and again during the last week of the nontraditional lacrosse season. The screening protocol outlined by Cook et al.42, 43 was utilized. Time from the first voluntary workout to the last practice of the nontraditional season totaled eight weeks. The FMS screening was completed with shoes on. Each participant was allotted a 10-minute window to perform the screening. Participants were allowed three graded trials of each FMS movement: deep squat, hurdle step, inline lunge, shoulder mobility, active straight leg raise, trunk stability, and rotary stability Movement scores ranged from 0-3 based on the FMS™ scoring criteria. The examiner recorded the best score of the three trials. In movements that involved two sides, the lower score determined the score of the overall movement. The examiner rated movements as 0 if there was pain present, 1 if the movement could not be completed, 2 if the movement could be completed with compensatory patterns, or 3 if the movement was performed without compensation. In addition to the seven movements, three clearing tests were included to identify potential pain. Participants received a score of 0 on the associated movement if the shoulder clearing test, spinal extension clearing test, or spinal flexion clearing test produced pain. Scores from the FMS™ screening (individual and overall scores) were compared to cut points using the Move2Perform software (Move2Perform LLC, Evansville, Indiana, USA) including optimal, pass, and below for both males and females. The examiner obtained participants’ perceived movement pattern quality by having them rate their movement pattern quality from 0-3 in each movement of the FMS™ screen. A score of 0 was described as an inability to perform the movement as described or if pain was involved. A score of 1 indicated the movement could be done with significant limitations, 2 indicated the move-
ment could be done with minimal limitations, and 3 indicated completion of the movement perfectly with no limitations.42,43 The examiner recorded perceived movement pattern quality scores immediately before the athlete completed the postseason FMS™ screening.
Dynamic postural control was assessed utilizing the Y Balance Test Kit (Move2Perform, Evansville, IN, USA), which has been shown to have good intrarater reliability and test-retest reliability ranging from 0.80 to 0.99 for all tests.28,44 One examiner assessed dynamic postural control during both the first and last week of the fall lacrosse season using the YBT The YBT consisted of three portions: measurements of limb length, lower quarter screen (YBTLQ), and upper quarter screen (YBT-UQ). YBT testing was performed bilaterally
A tape measure was used to assess limb length in centimeters.31 The examiner assessed true leg length using the most distal portion of the anterior superior iliac spine and the most distal portion of the ipsilateral medial malleolus utilizing the tape measure method, which has been shown to have excellent intrarater reliability45 (Figure 2). The examiner measured arm length by using the spinous process of cervical spine 7 and the tip of the third digit of the right arm while in 90 degrees of shoulder abduction (Figure 3). Both measurements were recorded to the nearest half-centimeter Each participant was read standard instructions on errors31 and allowed up to four errors in each direction. Errors included the participant placing the reaching foot or hand on the ground or on top of the block, quickly sliding the block beyond their reach, or failing to return to the start position without placing their foot or hand on the ground. Participants were read the corrective cues from the YBT manual when an error was performed.31 Participants completed the YBT-LQ portion first, with three practice trials being completed in each direction prior to three graded trials in the same direction before proceeding to the next direction. Participants performed the anterior direction first, posteromedial direction second, and posterolateral direction third for the lower quarter screen. Participants completed the medial direction first for the upper quarter screen, followed by the inferolateral and superolateral directions. In each screening, the stance limb was labeled as the limb being measured. The examiner scored each attempt to the nearest half-centimeter, with the highest score in each direction being recorded for analysis. Individual scores were used to assess individual changes over the course of the season.
Composite scores take limb length into account to provide comparable scores across individuals, allowing standardization of YBT-LQ and YBT-UQ scores. Composite scores were calculated by taking the sum of the three greatest direction scores over the product of three times the limb length (of either the UE or the LE as measured) and then multiplying by 100, to compare changes across participants utilizing the Move2Perform software (Move2Perform LLC, Evansville, Indiana, USA), as seen in the formula below
Scores from the YBT screening31 were compared to cutoff points using the specific algorithm which is part of the
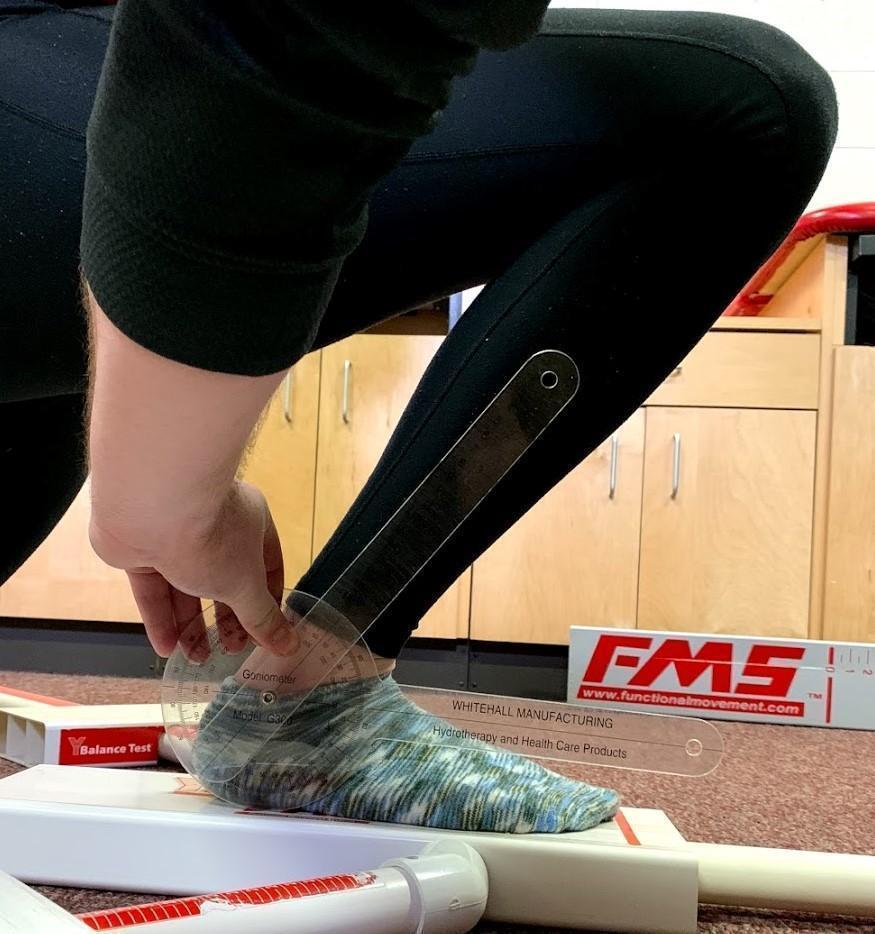
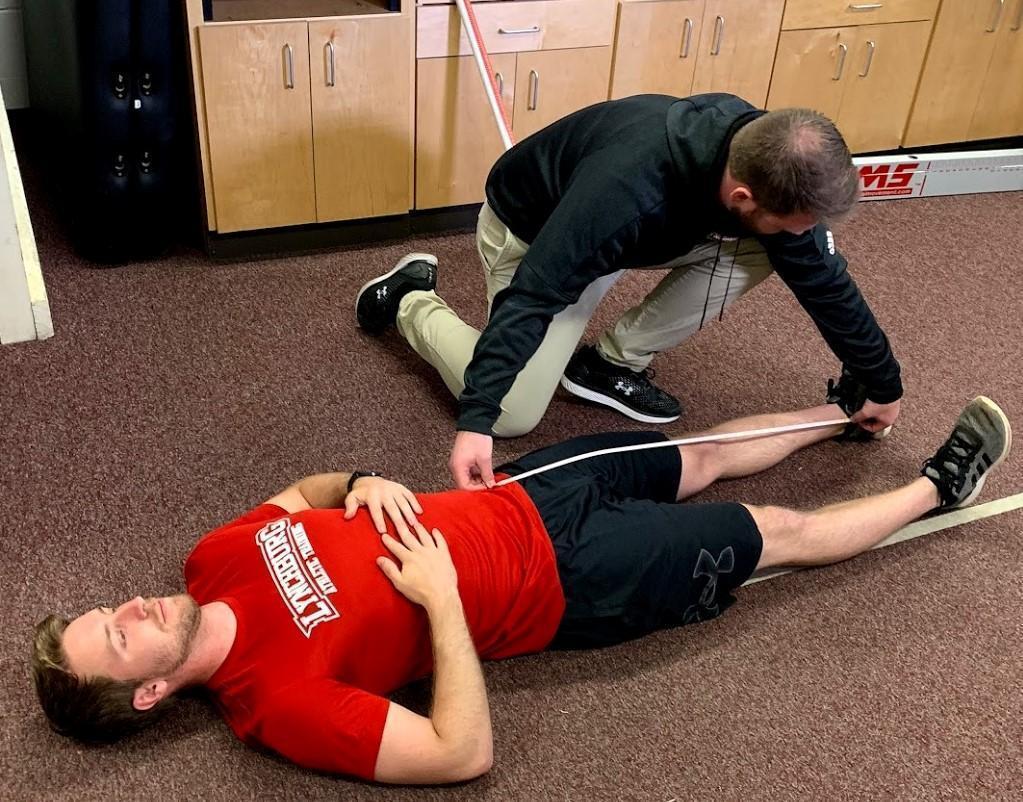
Move2Perform software. Individual score categories for YBT reach distances, which are not normalized to account for limb length, and composite scores, which are normalized to account for limb length, include optimal, pass, and below The categories compared participants’ scores with their peers in the Move2Perform system and classified their scores accordingly Composite scores for the left and right YBT-UQ screen as well as the left and right YBT-LQ screen were combined and compared to sport and population-specific normative scores. For the lower quarter YBT, asymmetries were defined as differences greater than 4 cm between limbs in the anterior direction and a difference greater than 6 cm between limbs in the posteromedial and posterolateral directions.17 A difference greater than 4 cm between
Figure 1. Ankle dorsiflexion measurement. Figure 2. Leg length measurement.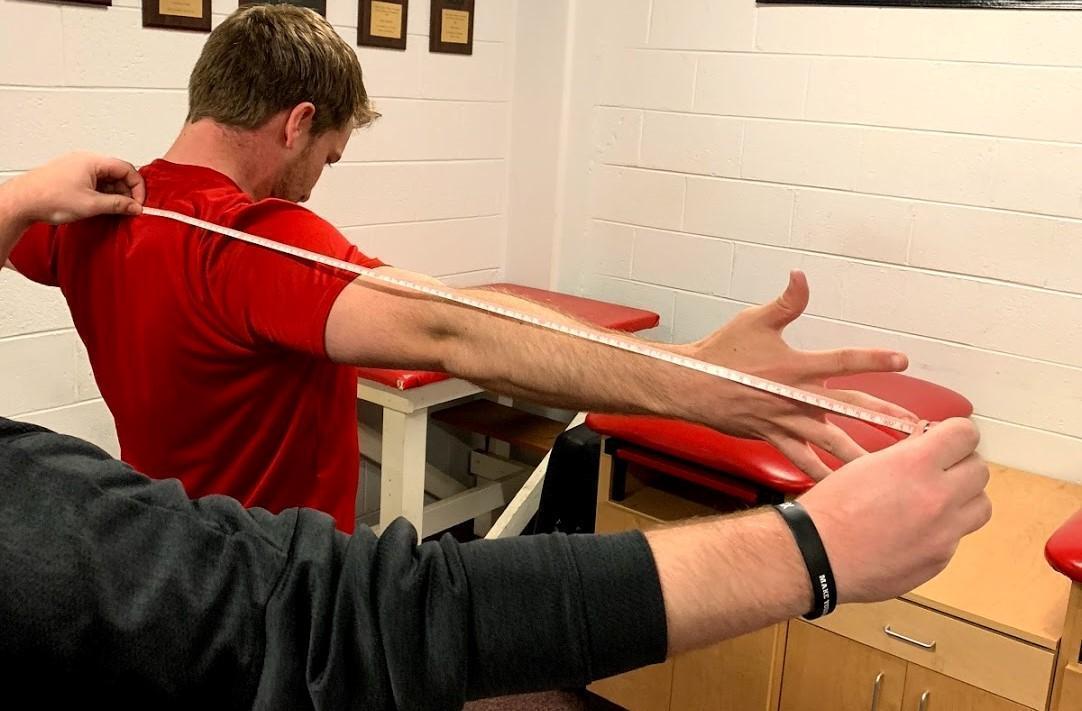
limbs determined an asymmetry in the upper quarter screen for all three directions.31
The examiner used a universal goniometer (Whitehall Manufacturing, Model G300, Industry, CA) to measure closed chain (weightbearing) active dorsiflexion ROM, which has been shown to have a standard error of measure ranging from 1.8-4.0°, with good to excellent intratester reliability 46,47 The examiner measured closed-chain dorsiflexion of both ankles using a goniometer in degrees. Each participant knelt on one knee while the measured foot was flat on the ground and the knee proximal to the measured foot was brought anteriorly 31 Participants were instructed to move the knee of the limb being measured forward as far as possible with the heel remaining in contact with the ground, as seen in Figure 1 Dorsiflexion measurements for the right and left were also compared to normative data.31 Dorsiflexion was analyzed by degrees measured, with greater than 35 degrees being considered acceptable and greater than 5 degrees bilateral difference being considered an asymmetry.
IBM SPSS Statistics version 25.0 (IBM Inc, Armonk, NY) was used to analyze data. Data files were split by sex then FMS scores were analyzed using a Wilcoxon signed ranks test to compare FMS scores over time (preseason, postseason). Paired t-tests were used to analyze YBT scores and dorsiflexion ROM with the repeated measure being time (preseason, postseason) for each of the dependent variables (YBT scores, dorsiflexion ROM). Differences in perceived movement pattern quality scores were analyzed using chisquare. Chi-square analysis was used to determine if there was a significant difference in the number of participants below passing on the FMS threshold score from preseason to postseason with passing being scored as 1 and below passing scored as 0. Move2Perform category scores were entered into a Wilcoxon signed ranks test to be analyzed from preseason to postseason. A one-way chi-square was run to determine if there was a significant change in the number of participants with an asymmetry in the YBT screening or dorsiflexion measurements from preseason to postseason. The expected distribution for the chi-square
analysis was the preseason distribution. For values that had less than the expected value of 5, a Fisher’s Exact Test was utilized. Simple linear regression was used to analyze the relationship between dorsiflexion and YBT-LQ composite scores. Pearson’s correlations were interpreted as weak = .25-.49, moderate = .50-.74, and strong= .75-1.48 Level of significance was set at p<0.05 for all statistical tests a priori
Male, female, and total median FMS scores with descriptive statistics are listed in Table 1 and perceived FMS scores with descriptive statistics are listed in Table 2. Time did not significantly change FMS composite scores from preseason to postseason for males (preseason=16, postseason=15; z=-0.34, p=0.74) or females (preseason=16, postseason=15; z=-1.83, p=0.07). However, left active straight leg raise significantly increased from preseason to postseason for males and right shoulder mobility and left active straight leg raise significantly increased for females (Table 1). No other unilateral comparisons were significant (p>0.05). Male perceived movement pattern quality was significantly higher than measured for 10 of 12 movements (p<0.05, Table 2). Female perceived movement pattern quality was significantly higher than measured for 4 of 12 movements (p<0.05, Table 2). There was no significant difference in the number of male (preseason=8, postseason=4; =2.38, p=0.12) or female (preseason=5, postseason=1; =2.15, p=0.14) participants who recorded a total FMS score below the injury risk cutoff of 14 at the end of the season, indicating injury susceptibility did not change.
The number of male participants who had an asymmetry in the hurdle step increased significantly from preseason (n=2) to postseason (n=9; 1=25.52, p<0.01). There was also a significant increase in male participants with an asymmetry in the inline lunge from preseason (n=10) to postseason (n=20; 1=12.50, p<0.01). Time significantly increased the number of male participants with asymmetries in the shoulder mobility movement from preseason (n=4) to postseason (n=21; 1=78.53, p<0.01). For the active straight leg raise in males, time significantly decreased the number of participants with an asymmetry from preseason (n=26) to postseason (n=8; 1=25.96, p<0.01). No significant changes were found in female asymmetry scores from preseason to postseason in any of the movements (p>0.05).
Male and female preseason and postseason YBT scores with descriptive statistics are listed in Table 1. Male YBT scores significantly improved in the right leg from preseason (mean=102.47±9.24) to postseason (mean=105.64±10.86;
t49=11.78, p<0.01, d=0.31, d CI95=-0.08, 0.71). Male left leg YBT scores also significantly improved from preseason (mean=102.41±9.24) to postseason (mean=104.32±9.69;
t49=5.08, p=0.03, d=0.20, d CI95=-0.19, 0.59). Female YBT scores for the right leg significantly increased from presea-
Figure 3. Arm length measurement.son (mean=98.67±8.18) to postseason (mean=101.62±8.11; t21=8.69, p=0.01, d=0.36, d CI95=-0.23, 0.96). However, left leg YBT scores for females did not significantly change from preseason (98.19±9.18) to postseason (100.51±8.25, t21=3.02, p=0.10, d=0.27, d CI95=-0.33, 0.86). There were no significant changes preseason to postseason for upper extremity YBT scores (p>0.05) except for the right upper extremity improving for females from preseason (78.21±12.15) to postseason (81.21±11.55, t21=4.55, p=0.045, d=0.25, d CI95=-0.34, 0.85).
The number of female participants with an asymmetry in the posteromedial direction on the lower quarter screen significantly increased over the season from three participants to eight participants ( 1=4.70, p=0.03). The number of female participants with an asymmetry in the superolateral direction of the upper quarter screen decreased significantly from preseason (n=9) to postseason (n=4; 1=4.70, p=0.030). No other comparisons were significant (p>0.05).
Male and female preseason and postseason dorsiflexion active ROM means with descriptive statistics are listed in Table 3. Dorsiflexion ROM in male’s right ankle worsened from preseason (mean=34.36±7.70) to postseason (mean=30.26±6.35; t49=24.98, p<0.01, d=-0.58, d CI95=-0.98, -0.18). Left dorsiflexion in males ROM also decreased from preseason (mean=34.70±6.03) to postseason (mean=30.34±5.23; F49=34.21, p<0.01, d=-0.77, d CI95=-1.18, -0.37). Dorsiflexion ROM in females did not significantly change for the right ankle (t21=0.22, p=0.64, d=-0.02, d CI95=-0.61, 0.57) or left ankle (t21=0.74, p=0.40, d=-0.14, d CI95=-0.74, 0.45) from preseason to postseason. The number of males with a dorsiflexion asymmetry did not significantly change from preseason (n=11) to postseason (n=12; 1=0.12, p=0.73). The number of females with a dorsiflexion asymmetry also did not change from preseason (n=5) to postseason (n=5; 1=0.00, p=1.00). However, the number of participants with right dorsiflexion below the passing score of 35 degrees did significantly increase from preseason (n=24 for males, n=5 for females) to postseason (n=38 for males, n=20 for females) for both males ( 1=15.71, p<0.001) and females ( 1=58.24, p<0.001). The number of participants with left dorsiflexion below the passing score of 35 degrees also significantly increased from preseason (n=24 for males, n=2 for females) to postseason (n=45 for males, n=20 for females) for males ( 1=35.34, p<0.001) and females ( 1=178.20, p<0.001).
During preseason measurements for males, there was a statistically significant weak positive relationship (r=0.35) between right dorsiflexion ROM and right leg YBT composite scores (F1,48=6.63, p=0.013), with right dorsiflexion accounting for 12.1% of the variance in right leg YBT composite scores. The relationship improved to moderate positive (r=0.51) for postseason measurements (F1,48=16.45, p<0.001), with 25.5% of YBT composite score variance being attributed to dorsiflexion ROM. Left leg dorsiflexion ROM at preseason for males also had a statistically significant weak positive relationship (r=0.31) to left leg YBT composite scores (F1,48=5.18, p=0.03), though only 9.7% of
the variance in the left YBT composite score was explained by left ankle dorsiflexion. Postseason measurements maintained a statistically significant weak positive relationship (r=0.43) between left ankle dorsiflexion and left YBT composite scores (F1,48=10.89, p=0.01), but the amount of variance attributed to dorsiflexion ROM increased to 18.5%. Female left dorsiflexion ROM also had a statistically significant weak positive relationship (r=0.49) with left YBT composite scores (F1,20=4.51, p=0.05) in preseason measurements, with 18.4% of left YBT composite score variance attributed to left dorsiflexion. While the weak positive relationship (r=0.38) remained in postseason measurements, it was not significant (F1,20=3.44, r2=0.147, p=0.08). Female right dorsiflexion did not have a significant relationship to YBT composite scores (p>0.05).
Median Move2Perform scores can be seen in Table 4. Move2Perform deficit categories did not significantly change from preseason (median=1.00) to postseason (median=1.00; z=-1.89; p=0.06) in males. Female Move2Perform deficit categories also did not significantly change from preseason (median=2.00) to postseason (median=2.00; z=-182 0.58, p=0.56).
The results of this study indicate no significant change in the FMS composite scores over time for males and females. These results support previous studies that have examined FMS composite score changes over the course of a rugby season.16,34 While Waldron et al34 found improvements in physical fitness during the early portion of the season, FMS scores did not significantly change (p>0.05), potentially demonstrating the difference between physical fitness and function. Mean FMS composite scores of soccer and volleyball athletes, as well as adolescent hockey athletes, increased over time but the increases were not statistically significant.16,49 The current findings do not support these results as no significant differences were found in FMS composite scores between the two-time points for either sex. However, findings support previous research and indicate that sex may not play a role in functional movement composite score change over time.16,49
When individual movements were assessed, significant differences were found in the right hurdle step, right shoulder mobility, and left active straight leg raise while the composite score difference was not significant. The difference in findings suggests that FMS individual scores should be assessed by limb and not just as composite scores. Sprague et al.16 also reported a change in the number of players with an asymmetry and score of one and noted a significant decrease in the frequency of asymmetries from preseason to postseason when all participants were included. However, it should be noted that the authors only assessed the number of participants with an asymmetry present in any of the five individual movements and not the change in the frequency in asymmetries. The use of
these criteria would not account for the fact that one participant could have several asymmetries and therefore may not provide an accurate picture of changes over the season. The injury risk increase with only one asymmetry present was found to have a relatively low predictive specificity and sensitivity for lower extremity injury at 0.62 and 0.58, respectively.19 To the authors’ knowledge, no study has assessed the effect of more than one asymmetry on the risk
of injury
The current study found significant differences in the frequency of asymmetries in the inline lunge and active straight leg raise from preseason to postseason, indicating individual score asymmetries should be assessed in addition to FMS composite scores in order to accurately assess functional movement abilities of athletes.
Significant differences were found in multiple movement scores and perceived scores in both males and females.
Male participants were accurate in assessing the mobility of the right shoulder. All other movements were significantly overestimated by the male participants with the exception of trunk stability, which was significantly underestimated. The underestimation may be due to the fact that many athletes assess strength visually by observable muscle mass. If abdominal muscle mass is not visible, athletes may perceive this as indicating a lack of core strength, resulting in an underestimation. Females overestimated significantly in several movements but did not underestimate any and were accurate on 8 of the 12 categories. It is unclear whether this is due to the accuracy of their perception or the fact that they were more mobile and scored higher in each movement category Neither group was accurate in assessing rotary stability or their ability to adequately perform a functional squat. Overestimations may be due to athletes not adequately understanding the demands of the functional movements and how they differ from their understood sense of success in their sport. If athletes are unable to accurately assess their movement quality, they may not be able to identify and address areas that are deficient.
Significant increases in the right arm and right leg YBT composite scores were observed (which accounted for limb length) over the course of a Division III fall lacrosse season in females. This increase indicates an increase in dynamic postural control and may therefore relate to decreased injury risk. The result contrasts previous findings in Division I field hockey athletes where there were no significant differences reported over time in any reach direction or limb (p>0.31).34 Hoch et al34 observed the effects of a 12-week competitive field hockey season while the current study looked at the effects of an eight-week fall lacrosse season. The discrepancy between findings may be due to the difference in competition level or from the difference in season length.
The YBT has been utilized as a tool for assessing injury risk in various populations.29,30,50 An asymmetry greater than 4 cm on the lower extremity posteromedial direction in soccer athletes has been found to have a 3.86 times increased risk of non-contact injury 50 The same asymmetry difference on the lower quarter screen anterior reach direction in basketball athletes resulted in a 2.5 times increase in the risk of injury.29 Results indicated that 40% (n=20/50) of males recorded a preseason asymmetry greater than 6 cm, the distance considered an asymmetry in the posteromedial and posterolateral directions31 of the lower quarter screen. At the postseason measurement, the number increased to 48% (n=24/50) of males. For females in the same reach direction, 14% (N=3/22) had an asymmetry of greater than 6 cm present at preseason compared to 36% (n=8/22) at the postseason measurements. Male participants also recorded higher percentages of anterior reach asymmetries greater than the previously suggested 4 cm threshold31 from 40% (n=20/50) at both preseason and postseason when compared to females at 18% (n=4/22) for preseason and 23% (n=5/22) for postseason. Findings indicate that males may be at an increased risk of suffering a non-contact injury both at the start of a season and after eight weeks of competitive play, while women may stay in the same risk cat-
egory throughout a season. An additional risk factor for lower extremity injury may be a decrease in composite reach on the lower quarter screen.29 In our study, we found that both males and females increased their lower quarter scores over the season yet noted increased frequencies of asymmetries for both populations. Perhaps clinicians should consider various injury risk factors when assessing athletes, as one risk factor may potentially affect the risk of injury more than another.
Limited dorsiflexion ROM has been described as a risk factor for injury, with asymmetry being noted as an additional risk factor Closed chain dorsiflexion below 45° degrees in an active weight-bearing lunge has been associated with the development of patellar tendinopathy in adult volleyball athletes9 and limited dorsiflexion has also been suggested as a risk factor for anterior cruciate ligament (ACL) sprains.8 When observing landing biomechanics, reduced dorsiflexion ROM decreased knee-flexion displacement and resulted in an increased ACL load due to greater ground reaction forces.8,51 The current findings place both male (right preseason ROM=34.36±7.70; left preseason ROM=34.70±6.03) and female (right preseason ROM=31.5±5.28; left preseason ROM=31.45±4.66) Division III lacrosse athletes at an increased risk for both patellar tendinopathy and ACL sprains. Decreases in male athlete dorsiflexion ROM were observed over the course of a season (right postseason ROM=30.26±6.30; left postseason ROM=30.34±5.23), indicating dorsiflexion should be monitored over the course of a season to ensure athletes do not increase their injury risk over a season due to limited dorsiflexion. While females did not change from preseason to postseason as male participants did, the mean dorsiflexion ROM for both groups was below 35 degrees and therefore they entered the season below passing.31 Dorsiflexion ROM in both groups decreased over the season yet increased the amount of lower quarter YBT score variance it accounted for
Lehr et al.23 used the Move2Perform classifications, including playing level, YBT and FMS scores, dorsiflexion measurements, and injury history, to determine the relative risk of injury Athletes in the “High-Risk” category, which consisted of moderate and substantial risk, were found to be 3.4 times more likely to become injured when compared to the “Low-Risk” group, which consisted of normal and slight risk.23 All participants included in this study were placed in the “High-Risk” category in both the preseason and postseason largely due to dorsiflexion ROM being below the risk threshold and low YBT upper and lower quarter screen scores.23 Competition level (i.e. DI vs. DIII) may play a factor in lower extremity function and stability. Dynamic postural control as measured by the YBT may not stay consistent across different levels of competition. Butler et al. found that dynamic balance was greater in professional baseball players compared to Division I collegiate and high school players.32 Their population differs in that participants of the current study were all Division III athletes. While the current findings suggest dynamic postural control changes from preseason to postseason in men but
not women, the results may not be applicable to all NCAA divisions or other populations.
Preseason screening of movement pattern quality is useful when assessing movement quality and neuromuscular control. However, since movement pattern quality changes over the course of a season, measurements should be conducted again during the season. Findings of the current study indicate several areas that should be addressed in order to accurately improve movement pattern quality and decrease injury risk with a focus on identifying poor movement quality In females, the movement pattern quality of the right shoulder and left active straight leg raise should be assessed. Emphasis should be placed on the active straight leg raise for men due to the possible increase in left hip mobility resulting in possible asymmetry
Female dorsiflexion should be assessed prior to the season for possible lack of ROM. Dorsiflexion in males should be assessed both before a season to identify possible dorsiflexion deficits, and throughout a season to ensure ROM does not decrease, leading to a possible increased risk of injury. As there are several factors that may result in decreased dorsiflexion ROM, it is important to identify the cause of the decrease in dorsiflexion when implementing appropriate corrective exercises to ensure the correct cause is addressed. Clinicians should focus on mobility in the gastroc-soleus complex to prevent muscle tightness at both preseason and during the season. Preseason posterior talar glides should also be performed to ensure that the joint capsule is not tight prior to the season, thus further limiting dorsiflexion ROM.52 Hip flexors and extensors may also be assessed periodically throughout the season to ensure proper movement of the lower extremity kinetic chain. In addition, clinicians should focus on maintaining lower extremity dynamic postural control in both males and females as a season progresses. Based on the findings of this study, preseason screenings of individual lower extremity movement, notably in the posteromedial and anterior directions, can aid clinicians in identifying and addressing potential injury risk factors via asymmetries. The current findings suggest that overall, lower quarter dynamic postural control increased over the course of the season. While male dorsiflexion concurrently decreased; this may be due to an increase in stability of the talocrural joint over the course of a season. Therefore, importance should be placed on ensuring athletes enter the season with dorsiflexion ROM above the specific at-risk categories to account for possible decreases in ROM as stability increases.
One limitation of this study is the number of participants included. A larger sample size, especially for women, would have increased generalizability Future research should focus on increasing sample size to improve statistical power, specifically on the upper quarter screen and dorsiflexion for females and recruiting athletes from multiple Division III athletic sponsoring universities, as well as Division I and
II athletic sponsoring universities, to increase the generalizability of results. A second limitation was that all athletes were recruited from the same university We also did not control for the time of day, nutritional status, or workout regimen when scheduling screening times, though both teams were coached by the same strength and conditioning coach. This may have resulted in participants performing mobility screens after a lifting session and being more fatigued, which could have affected our results. Factors such as injury history, nutrition, time of day, and strength and conditioning routines should be examined to determine how they might alter dynamic postural control measurements. Of note, all participants included in the current study were placed in the “High Risk” category by Move2Perform at both time points, a function of the Move2Perform algorithm. Finally, this study is the first to report and measure perceived mobility among athletes. The validity and reliability of the methods utilized to capture perceived mobility is unknown.
Future research should examine the relationship between dorsiflexion ROM and athletic performance. While dorsiflexion below the threshold of 35 degrees is a risk factor for injury on the YBT, the decreased ROM may be due to anatomical muscle changes to the gastroc-soleus complex. Therefore, clinicians should assess dorsiflexion range of motion throughout the season due to potential anatomical muscle changes as physical fitness increases over the early portion of a season.34 Although specific cut points have been established for different populations, researchers should examine the injury risk for collegiate athletes to determine the sport-specific cut points in an effort to better assess injury risk. Additionally, due to the multifaceted aspect of injury risk, these screenings may have an increased effectiveness when combined with other tests. Future research should look into the effect of the number of asymmetries present on the risk of injury. Lastly, 45 of 50 male and 20 of 22 female participants listed their dominant hand and leg as being the right side. Limb domination may be examined to determine if this plays a role in dynamic postural control.
The results of this study suggest that a nontraditional lacrosse season did not change overall movement pattern quality (composite scores) in men’s or women’s lacrosse players. However, clinicians should assess movement pattern quality in each individual movement as opposed to using composite scores. Clinicians should be aware that males are not accurate in assessing their own movement pattern quality and are therefore unlikely to individually address movement deficits. Clinicians should be aware of dynamic postural control changes over the course of a competitive season in both males and females. While lower extremity dynamic postural control in male lacrosse athletes may increase over the season, dorsiflexion ROM may decrease. Clinicians should focus on ensuring athletes maintain a dorsiflexion ROM above 40 degrees31 prior to the season beginning to allow for a decrease in ROM as talocrural
joint stability increases. Clinicians should be aware of potential asymmetries in lower extremity stability, notably in the posteromedial and anterior directions, with no asymmetries in dorsiflexion ROM.
The authors report no conflicts of interest
No funding
Submitted: September 11, 2023 CDT, Accepted: January 29, 2024 CDT
© The Author(s)
This is an open-access article distributed under the terms of the Creative Commons Attribution 4.0 International License (CCBY-NC-4.0). View this license’s legal deed at https://creativecommons.org/licenses/by-nc/4.0 and legal code at https://creativecommons.org/licenses/by-nc/4.0/legalcode for more information.
1. NCAA Sports Sponsorship and Participation Rates Report (1956-57 through 2020-21). Published online January 6, 2022.
2. Legislative Services Database - LSDBi. Playing and Practice Seasons. Published online May 9, 2017 Accessed March 16, 2023. https://web3.ncaa.org/lsdb i/search/bylawView?id=9024#result
3. Dick R, Romani WA, Agel J, Case JG, Marshall SW Descriptive Epidemiology of Collegiate Men’s Lacrosse Injuries: National Collegiate Athletic Association Injury Surveillance System, 1988–1989 Through 2003–2004. J Athl Train. 2007;42(2):255-261.
4. Dick R, Agel J, Marshall SW National Collegiate Athletic Association Injury Surveillance System Commentaries: Introduction and Methods. J Athl Train 2007;42(2):173-182.
5. Dick R, Lincoln AE, Agel J, Carter EA, Marshall SW, Hinton RY. Descriptive Epidemiology of Collegiate Women’s Lacrosse Injuries: National Collegiate Athletic Association Injury Surveillance System, 1988–1989 Through 2003–2004. J Athl Train 2007;42(2):262-269.
6. Kerr ZY, Lincoln AE, Caswell SV, Klossner DA, Walker N, Dompier TP. Epidemiology of National Collegiate Athletic Association Women’s Lacrosse Injuries, 2009–10 Through 2014–15. J Sport Rehabil. 2017;27(2):118-125. doi:10.1123/jsr.2016-0124
7 Kerr ZY, Quigley A, Yeargin SW, et al. The epidemiology of NCAA men’s lacrosse injuries, 2009/ 10-2014/15 academic years. Inj Epidemiol. 2017;4(1):6. doi:10.1186/s40621-017-0104-0
8. Fong CM, Blackburn JT, Norcross MF, McGrath M, Padua DA. Ankle-Dorsiflexion Range of Motion and Landing Biomechanics. J Athl Train 2011;46(1):5-10. doi:10.4085/1062-6050-46.1.5
9. Malliaras P, Cook JL, Kent P. Reduced ankle dorsiflexion range may increase the risk of patellar tendon injury among volleyball players. J Sci Med Sport. 2006;9(4):304-309. doi:10.1016/j.jsams.2006.0 3.015
10. Carling C, Orhant E. Variation in body composition in professional soccer players: interseasonal and intraseasonal changes and the effects of exposure time and player position. J Strength Cond Res. 2010;24(5):1332-1339. doi:10.151 9/jsc.0b013e3181cc6154
11. Dwelly PM, Tripp BL, Tripp PA, Eberman LE, Gorin S. Glenohumeral Rotational Range of Motion in Collegiate Overhead-Throwing Athletes During an Athletic Season. J Athl Train 2009;44(6):611-616. do i:10.4085/1062-6050-44.6.611
12. Freehill MT, Ebel BG, Archer KR, et al. Glenohumeral Range of Motion in Major League Pitchers: Changes Over the Playing Season. Sports Health. 2011;3(1):97-104. doi:10.1177/194173811037 4627
13. McGill SM, Andersen JT, Horne AD Predicting Performance and Injury Resilience From Movement Quality and Fitness Scores in a Basketball Team Over 2 Years. J Strength Cond Res 2012;26(7):1731-1739. d oi:10.1519/jsc.0b013e3182576a76
14. Mills JD, Taunton JE, Mills WA. The effect of a 10-week training regimen on lumbo-pelvic stability and athletic performance in female athletes: A randomized-controlled trial. Phys Ther Sport 2005;6(2):60-66. doi:10.1016/j.ptsp.2005.02.006
15. Silvestre R, Kraemer WJ, West C, et al. Body Composition and Physical Performance During a National Collegiate Athletic Association Division I Men’s Soccer Season. J Strength Cond Res. 2006;20(4):962. doi:10.1519/r-18165.1
16. Sprague PA, Mokha GM, Gatens DR. Changes in Functional Movement Screen Scores Over a Season in Collegiate Soccer and Volleyball Athletes. J Strength Cond Res 2014;28(11):3155-3163. doi:10.1519/jsc.000 0000000000506
17. Chorba RS, Chorba DJ, Bouillon LE, Overmyer CA, Landis JA. Use of a Functional Movement Screening Tool to Determine Injury Risk in Female Collegiate Athletes. North Am J Sports Phys Ther NAJSPT. 2010;5(2):47-54.
18. Kiesel K, Plisky P, Butler R. Functional movement test scores improve following a standardized offseason intervention program in professional football players. Scand J Med Sci Sports. 2011;21(2):287-292. d oi:10.1111/j.1600-0838.2009.01038.x
19. Kiesel K, Plisky PJ, Voight ML. Can Serious Injury in Professional Football be Predicted by a Preseason Functional Movement Screen? North Am J Sports Phys Ther NAJSPT 2007;2(3):147-158.
20. Kiesel KB, Butler RJ, Plisky PJ. Prediction of Injury by Limited and Asymmetrical Fundamental Movement Patterns in American Football Players. J Sport Rehabil. 2014;23(2):88-94. doi:10.1123/jsr.201 2-0130
21. Smith PD, Hanlon MP Assessing the Effectiveness of the Functional Movement Screen in Predicting Noncontact Injury Rates in Soccer Players. J Strength Cond Res 2017;31(12):3327-3332. doi:10.1519/jsc.000 0000000001757
22. Warren M, Smith CA, Chimera NJ. Association of the Functional Movement Screen With Injuries in Division I Athletes. J Sport Rehabil 2015;24(2):163-170. doi:10.1123/jsr.2013-0141
23. Lehr ME, Plisky PJ, Butler RJ, Fink ML, Kiesel KB, Underwood FB. Field-expedient screening and injury risk algorithm categories as predictors of noncontact lower extremity injury Scand J Med Sci Sports 2013;23(4):e225-e232. doi:10.1111/sms.12062
24. Garrison M, Westrick R, Johnson MR, Benenson J. Association between the functional movement screen and injury development in college athletes. Int J Sports Phys Ther. 2015;10(1):21-28.
25. Knapik JJ, Cosio-Lima LM, Reynolds KL, Shumway RS. Efficacy of Functional Movement Screening for Predicting Injuries in Coast Guard Cadets. J Strength Cond Res 2015;29(5):1157-1162. doi:10.1519/jsc.0000 000000000704
26. Hrysomallis C. Balance Ability and Athletic Performance. Sports Med 2011;41(3):221-232. doi:1 0.2165/11538560-000000000-00000
27 Lai WC, Wang D, Chen JB, Vail J, Rugg CM, Hame SL. Lower Quarter Y-Balance Test Scores and Lower Extremity Injury in NCAA Division I Athletes. Orthopaedic Journal of Sports Medicine. 2017;5(8):232596711772366. doi:10.1177/2325967117 723666
28. Plisky PJ, Gorman PP, Butler RJ, Kiesel KB, Underwood FB, Elkins B. The Reliability of an Instrumented Device for Measuring Components of the Star Excursion Balance Test. North Am J Sports Phys Ther NAJSPT 2009;4(2):92-99.
29. Plisky PJ, Rauh MJ, Kaminski TW, Underwood FB. Star Excursion Balance Test as a Predictor of Lower Extremity Injury in High School Basketball Players. J Orthop Sports Phys Ther 2006;36(12):911-919. doi:1 0.2519/jospt.2006.2244
30. Smith CA, Chimera NJ, Warren M. Association of y balance test reach asymmetry and injury in division I athletes. Med Sci Sports Exerc 2015;47(1):136-141. d oi:10.1249/mss.0000000000000380
31. Cook G, Plisky P YBT Online Manual. Published online 2010. https://www.functionalmovement.com/f iles/Articles/660a_YBT%20Online%20Manual%20v1.p df
32. Butler RJ, Bullock G, Arnold T, Plisky P, Queen R. Competition-Level Differences on the Lower Quarter Y-Balance Test in Baseball Players. J Athl Train 2016;51(12):997-1002. doi:10.4085/1062-6050-51.1 2.09
33. Hoch MC, Welsch LA, Hartley EM, Powden CJ, Hoch JM. Y-Balance Test Performance After a Competitive Field Hockey Season: A Pretest-Posttest Study J Sport Rehabil 2017;26(5). doi:10.1123/jsr.201 7-0004
34. Waldron M, Gray A, Worsfold P, Twist C. The Reliability of Functional Movement Screening and InSeason Changes in Physical Function and Performance Among Elite Rugby League Players. J Strength Cond Res 2016;30(4):910-918. doi:10.1519/js c.0000000000000270
35. Chalmers S, Fuller JT, Debenedictis TA, et al. Asymmetry during preseason Functional Movement Screen testing is associated with injury during a junior Australian football season. J Sci Med Sport 2017;20(7):653-657 doi:10.1016/j.jsams.2016.12.076
36. Gribble PA, Brigle J, Pietrosimone BG, Pfile KR, Webster KA. Intrarater Reliability of the Functional Movement Screen. J Strength Cond Res 2013;27(4):978-981. doi:10.1519/jsc.0b013e31825c32 a8
37 Minick KI, Kiesel KB, Burton L, Taylor A, Plisky P, Butler RJ. Interrater Reliability of the Functional Movement Screen. J Strength Cond Res 2010;24(2):479-486. doi:10.1519/jsc.0b013e3181c09c 04
38. Parenteau-G E, Gaudreault N, Chambers S, et al. Functional movement screen test: A reliable screening test for young elite ice hockey players. Phys Ther Sport 2014;15(3):169-175. doi:10.1016/j.ptsp.20 13.10.001
39. Shultz R, Anderson SC, Matheson GO, Marcello B, Besier T Test-Retest and Interrater Reliability of the Functional Movement Screen. J Athl Train 2013;48(3):331-336. doi:10.4085/1062-6050-48.2.11
40. Smith CA, Chimera NJ, Wright NJ, Warren M. Interrater and Intrarater Reliability of the Functional Movement Screen. J Strength Cond Res. 2013;27(4):982-987 doi:10.1519/jsc.0b013e3182606df 2
41. Teyhen DS, Shaffer SW, Lorenson CL, et al. The Functional Movement Screen: A Reliability Study. J Orthop Sports Phys Ther 2012;42(6):530-540. doi:10.2 519/jospt.2012.3838
42. Cook G, Burton L, Hoogenboom BJ, Voight M. Functional movement screening: the use of fundamental movements as an assessment of function ‐ part 1. Int J Sports Phys Ther. 2014;9(3):396-409.
43. Cook G, Burton L, Hoogenboom BJ, Voight M. Functional movement screening: the use of fundamental movements as an assessment of function‐part 2. Int J Sports Phys Ther 2014;9(4):549-563.
44. Gorman PP, Butler RJ, Plisky PJ, Kiesel KB. Upper Quarter Y Balance Test: Reliability and Performance Comparison Between Genders in Active Adults. J Strength Cond Res 2012;26(11):3043-3048. doi:10.151 9/jsc.0b013e3182472fdb
45. Neelly K, Wallmann HW, Backus CJ. Validity of measuring leg length with a tape measure compared to a computed tomography scan. Physiother Theory Pract. 2013;29(6):487-492. doi:10.3109/09593985.201 2.755589
46. Fraser JJ, Koldenhoven RM, Saliba SA, Hertel J. Reliability of ankle-foot morphology, mobility, strength, and motor performance measures. Int J Sports Phys Ther 2017;12(7):1134-1149. doi:10.2660
3/ijspt20171134
47 Konor MM, Morton S, Eckerson JM, Grindstaff TL. Reliability of three measures of ankle dorsiflexion range of motion. Int J Sports Phys Ther 2012;7(3):279-287.
48. Schober P, Boer C, Schwarte LA. Correlation coefficients: appropriate use and interpretation. Int Anethesia Res Soc 2018;126(5):1763-1768. doi:10.121 3/ane.0000000000002864
49. Avery M, Wattie N, Holmes M, Dogra S. Seasonal Changes in Functional Fitness and Neurocognitive Assessments in Youth Ice-Hockey Players. J Strength Cond Res 2018;32(11):3143-3152. doi:10.1519/jsc.000 0000000002399
50. Gonell AC, Romero JAP, Soler LM. Relationship between the y balance test scores and soft tissue injury incidence in a soccer team. Int J Sports Phys Ther. 2015;10(7):955-966.
51. Amraee D, Alizadeh MH, Minoonejhad H, Razi M, Amraee GH. Predictor factors for lower extremity malalignment and non-contact anterior cruciate ligament injuries in male athletes. Knee Surg Sports Traumatol Arthrosc 2017;25(5):1625-1631. doi:10.100 7/s00167-015-3926-8
52. Kang MH, Oh JS, Kwon OY, Weon JH, An DH, Yoo WG. Immediate combined effect of gastrocnemius stretching and sustained talocrural joint mobilization in individuals with limited ankle dorsiflexion: A randomized controlled trial. Man Ther 2015;20(6):827-834. doi:10.1016/j.math.2015.03.016
Original Research
Liam P Owens1a , Omid Khaiyat1 , Ginny Coyles1
1 School of Health and Sport Sciences, Liverpool Hope University
Keywords: Overhead, EMG, Functional Task, Shoulder, Throwing https://doi.org/10.26603/001c.94604
Background
A strong body of literature has been published outlining muscle activity differences during sports performance in groups of overhead athletes. However, there are limited studies that have directly compared the muscle activity in overhead athletes with and without history of shoulder injury during functional everyday tasks.
Purpose
This study aimed to identify muscle activities across fourteen upper extremity and core muscles during three functional everyday movements in athletes with and without history of shoulder injury
Study Design
Cross-Sectional Study
Methods
Thirty-two male overhead throwing athletes (fifteen healthy and seventeen injured) were recruited and completed three everyday functional movements of high elevation, low elevation, and rotation, using their dominant arm to move an object between two fixed positions. Electromyography (EMG) was recorded for fourteen muscles including: biceps brachii, deltoids (anterior, medial, and posterior), trapezius (upper and lower), pectoralis major, latissimus dorsi, serratus anterior, infraspinatus, external obliques, and gluteus maximus (all surface electrodes) and supraspinatus (fine wire electrode). Mixed model repeated measures ANOVA and post-hoc analysis assessed mean muscle activity (%MVC) between groups and each movement phase.
Results
Upper trapezius elicited higher mean activity in healthy athletes during both phases of the arm rotation task (p < 0.05). No differences between groups were evident for arm elevation tasks. Qualitative analysis of muscle patterns during functional tasks reflected a temporal shift in muscle activation timings and magnitudes between athlete groups, suggesting potential compensatory mechanisms in injured athletes.
Corresponding Author:
Liam P. Owens
Telephone: 00 44 151 291 3442 a
School of Health and Sport Sciences
Liverpool Hope University
Liverpool L16 9JD
Email Contact: OWENSL2@HOPE.AC.UK
Injured overhead athletes appear to utilize other upper limb and shoulder girdle muscles to compensate for lower upper trapezius activity during functional everyday tasks.
Shoulder injury and pain are among the most prevalent musculoskeletal complaints, ranking third in reporting to primary care1 and a lifetime prevalence of 67%.2 Daily shoulder pain has been reported within 30% of the working population,3 with chronic shoulder pain occurring in approximately 50% of all cases.2 However, pain and injury prevalence has been reported to be much higher in overhead sports. Research has shown shoulder pain history in 44-75% of elite handball players,4 with injury occurrence recorded at 48% in tennis,5 23% in cricket6 and 31% in baseball.7 Shoulder injury occurrence in overhead athletes is usually as a result of breakdown(s) in the function of the upper extremity kinetic chain (KC) which causes mechanical adaptations and performance dysfunction.8 Injuries and adaptations have been reported to include acquired glenohumeral instability, Glenohumeral Internal Rotation Deficit (GIRD), scapular muscle imbalances, scapular dyskinesis, and rotator cuff disease.9‑12
In order to assess diagnosis and management strategies in populations with shoulder injury, understanding of functional performance, impact on quality of life through measures of health and well-being, and greater appreciation of the ramifications of pain are required.13 Functional assessment of the shoulder can be categorized as either a selfreport measure (SRM) or a physical performance measure (PPM),14 although little focus has been given to identifying similarities and differences between healthy and injured overhead athletes during functional movement. Several testing protocols are available to practitioners to assess the function of the injured limb, with the vast majority focusing on requiring the injured patient to complete an everyday movement or task. The Simple Shoulder Endurance Test,15 involves turning and twisting bolts but in a single position and although this is an endurance-based test, it does not consider the broader functional demands of the shoulder The most recently published testing protocol is the Timed Functional Arm and Shoulder Test (TFAST),16 consisting of three main tasks, each assessing the endurance, ROM and strength of the injured shoulder and focused on reaching, circular upper extremity motion, and lifting related tasks. Another performance-based test of upper extremity function is the 9-Hole Peg Test, whereby patients pick up pegs and place them into specified holes.17
One of the most popular testing protocols for functionality is the FIT-HaNSA (Functional Impairment Test-Hand and Neck/Shoulder/Arm) which is a functional assessment designed to test the upper extremity across multiple levels with the aim of simulating daily activities.18 The protocol consists of a test battery of three tasks, each lasting up to five minutes or until the participant feels unable to con-
tinue any longer The three tasks consisted of a “waistup” movement, an “eyedown” movement and an “overhead work” movement. Kumta and colleagues19 correlated FITHaNSA scores with shoulder strength measurements and found positive correlations for flexion (r = 0.66) and abduction (r = 0.55). Research on symptomatic patients using the FIT-HaNSA protocol has produced important findings; firstly, patients with impingement had issues completing the “eye-down” task, averaging a total task performance time of 246s out of a maximum of 300s18; and secondly, when comparing healthy controls to a symptomatic group with sub-acromial impingement syndrome (SAIS) the latter group scored significantly lower overall (59.9% vs. 98.5%) as well as on each individual task.13 FIT-HaNSA has also been used to assess functionality in patients with a massive rotator cuff tears and were found to have increased rotator cuff and latissimus dorsi (LD) activity during the elevation phase of the “waist-up” protocol.20 This was attributed to the increased need to provide stability of the glenohumeral (GH) joint. Due to this being the only protocol with previously published muscle activity findings, although for only one movement, it may be the most effective protocol to assess muscle activities across different types of performers as it requires a controlled environment and relies little on skill to complete.
While previous research studies have focussed on functional movements in injured populations,18,20 several more-recent studies have investigated the impact of fatigue in overhead athletes,21‑23 during movement assessment of athletes with and without shoulder injury24 and preventative/ rehabilitative exercises.25‑28 However, there is a lack of information relating to utilising functional tests to assess muscle activity during controlled, non-skilled everyday tasks. As a result, this study aimed to identify muscle activities across fourteen upper extremity and core muscles during three functional everyday movements in athletes with and without history of shoulder injury.
A total of thirty-two male overhead throwing athletes participated in this study; fifteen were healthy (age: 25.1 ± 6.7 years) and seventeen were injured (age: 32.7 ± 10.7 years). All participants were overhead athletes recruited from local and regional baseball, cricket and handball sports clubs, and were allocated into two groups; healthy and injured. Inclusion criteria was based on shoulder injury history, with healthy defined as those who had no history of injury to their throwing shoulder or upper limb. Injured participants had a clinical history of shoulder injury (i.e. shoulder in-
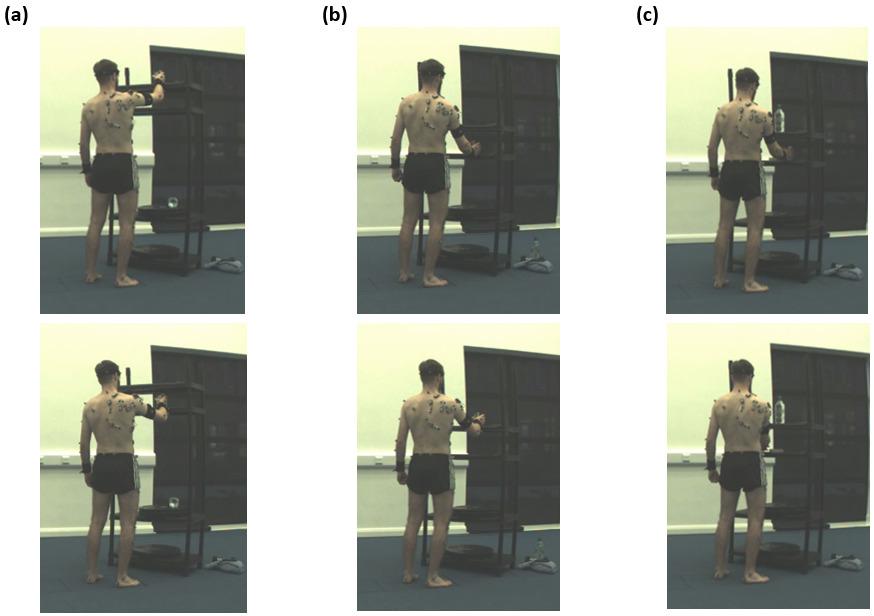
stability [n = 3] or rotator cuff disease [n = 14]) within the previous three years, as well as difficulty or pain during performance indicated in the Sports Module section of the quick Disability of the Arm, Shoulder and Hand (qDASH) questionnaire. Overhead athletes were excluded if they had no history of shoulder injury but registered difficulty or pain when completing the qDASH. The study received ethical approval from the national Research Ethics Committee. All participants were provided with a detailed information sheet at least 72 hours before their participation outlining the main details of the project and measurement procedures. All participants gave written consent before undertaking any data collection.
Three everyday functional movements using the dominant arm (high elevation, low elevation and rotation) were investigated (Figure 1). The high and low elevation tasks were adapted from the FIT-HaNSA protocol18 which requires participants to move a tin can (1kg) between two fixed positions at 25cm height increments. For the rotation task, participants moved the tin can between two fixed positions, 20cm apart, on a shelf positioned at waist height. Each movement was divided into two phases for data analysis purposes. For high elevation, Phase 1 was defined as the tin can moving from the top shelf to the bottom shelf and Phase 2 defined as bottom to top. For low elevation, Phase 1
was defined as the tin can moving from bottom shelf to top shelf and Phase 2 defined from top to bottom. For the rotation task, Phase 1 was defined as the tin can being moved medially across the shelf and the arm internally rotating and Phase 2 defined as the tin can being moved laterally across the shelf and the arm externally rotating.
A 16-channel TeleMyo TDS System (Noraxon USA, Inc., Scottsdale, Arizona, USA) and associated MyoResearch software (version 3.8.6) were used for signal acquisition, processing, and analysis. Raw EMG signals were amplified (CMR: > 100 dB; input impedance: > 100 Mohm; and Base Gain: 200 dB), with signals collected at 1500 Hz and bandpass filtered at 20 to 250 Hz for surface electrodes and at 20 to 350 Hz for fine-wire electrodes.
Self-adhesive Ag/AgCL snap, surface dual electrodes (Noraxon USA, Inc) were placed parallel with the muscle fibers, with an inter-electrode distance of 20mm, to record EMG from muscles across KC segments. Surface EMG was collected for thirteen muscles; biceps brachii (BB), anterior, medial and posterior deltoids (AD, MD, PD), upper and lower trapezius (UT and LT), pectoralis major (PM), latissimus dorsi (LD), serratus anterior (SA), infraspinatus (ISP), contralateral and ipsilateral external bliques (contraEO and ipsilEO), and gluteus maximus (GM). Skin preparation included shaving the site and cleaning by an alcohol-free
Figure 1. Functional Movement Tasks (a) High Elevation (b) Low Elevation (c) Rotationmoist tissue (Kay’s Medical, UK). Fine-wire electrodes were used to record signals from the supraspinatus (SSP) using a disposable bi-polar hook intramuscular fine-wire electrode (size: 0.50x30mm (10cm wire)) (Spes Medica S.r.l., Genova, Italy) using a hypodermic needle.29
Raw EMG signals from twelve full cycles for each task (the first two and last two cycles omitted for consistency purposes) were smoothed (1500 sample/window), full-wave rectified (400 sample/window) and a root mean square (RMS) amplitude algorithm with a window size of 100ms applied. EMG from each muscle was recorded during Maximal Voluntary Contraction (MVC) for normalisation purposes. Manual muscle testing was performed by the lead investigator using procedures previously reported in functional exercise research.30‑34 Two, five second efforts, with verbal encouragement, were recorded for each muscle, with the mean calculated for normalization during each functional task and reported as %MVC. A one-minute rest period was permitted between each MVC trial.
Descriptive statistics are reported as %MVC for each individual muscle (mean ± standard deviation [SD]) during each phase of functional everyday task. Mixed model repeated measures ANOVA tests were performed for each functional task to determine group effects, time (phase) effects and interaction between them. Mauchly’s Test of Sphericity was performed to assess the variance of within-subject conditions35 and on occurrences of violation (p < 0.05), the appropriate epsilon correction was chosen (> 0.75, a HuynhFeldt correction was applied; < 0.75, a Greenhouse-Geisser correction was applied). Post-hoc independent t-tests were performed to assess the statistical differences between groups during each phase of each functional task for mean activity values. The level of statistical significance was set at p < 0.05. SPSS (Statistical Package for Social Sciences, version 25) was used for all data analysis procedures.
Table 1 summarizes the mean activation of muscles during each functional task.
Significant time effects were evident for PM (p = 0.000), LD (p = 0.003), all deltoid (AD: p = 0.000; MD: p = 0.041; PD: p = 0.000), trapezius (UT: p = 0.000; LT: p = 0.000) and rotator cuff musculature (SSP: p = 0.024; ISP: p = 0.000). However, post-hoc tests found no differences in mean activity between groups during downward (Phase 1) or upward (Phase 2) movements.
Significant time effects were evident for BB (p = 0.001), trapezius muscles (UT: p = 0.001; LT: p = 0.002), ISP (p = 0.000) and GM (p = 0.049). Post-hoc tests determined no
differences in mean activity between groups upward (Phase 1) or downward (Phase 2) movements.
A significant group effect was evident for UT (p = 0.038) only Significant time effects were evident for the AD (p = 0.033 and PM (p = 0.034). Post-hoc tests revealed significant differences in mean UT activity between groups during both medial movement (Phase 1: p = 0.038) and lateral movement (p = 0.048). In both phases, mean UT activity was higher in healthy overhead athletes compared to injured (Phase 1: 6.0 %MVC (± 5.3) compared to 2.7 %MVC (± 2.1); Phase 2: 6.1 %MVC (± 5.1) compared to 3.0 %MVC (± 2.5)).
This research study investigated differences in muscle activities of fourteen muscles across upper extremity and core segments during three everyday tasks in overhead athletes with and without shoulder injury. Across elevation and rotational functional tasks, only significant differences in mean UT activity during both phases of the rotational task were evident, with greater UT activity recorded in healthy overhead athletes. However, potential compensatory mechanisms between key scapula and rotator cuff muscles may be evident in injured throwers to assist in humeral elevation and internal rotation of the arm.
In addition to the higher mean UT activity, differences in UT activity patterns were also evident throughout the rotational functional task movement cycle, with three distinct peaks identified for healthy overhead athletes that were not evident in injured overhead athletes (Figure 4). The healthy group appear to activate the UT to assist with raising the tin can, most notably around as the arm internally rotates over mid-shelf during Phase 1 and again at the start of Phase 2 as the tin can was lifted back off the shelf at the start of the external rotation phase. In addition, UT activity increases for a third time as the arm is lowered back to the start point. Actions of the UT encompass both scapular control and clavicle elevation36 and the activity profiles identified in this research study could be a method employed by the healthy group to assist in glenohumeral joint stability but also in elevating the clavicle to assist in clearance and initial elevation. In contrast, injured throwers elicited more SSP activity when lifting the tin can off the shelf and internally rotating across mid-shelf This suggests SSP activity is needed during humeral elevation as previously proposed by Otis and colleagues37 and to counteract the reduction in UT activity at these points of the movement cycle which may increase the risk of impingement.
The High Elevation protocol required participants to move a tin can from a shelf positioned at eye level to another 25cm below before returning it to the higher shelf The findings of this study identified no differences between healthy and injured groups for mean muscle activation either during or between phases for this protocol, although differences in muscle activity patterns were evident. Activ-
BB – Biceps Brachii; AD – Anterior Deltoid; MD – Medial Deltoid; PD – Posterior Deltoid; UT – Upper Trapezius; LT – Lower Trapezius; PM – Pectoralis Major; LD – Latissimus Dorsi; SA – Serratus Anterior; SSP – Supraspinatus; ISP – Infraspinatus; contraEO – Contralateral External Oblique; GM – Gluteus Maximus; ispilEO – Ipsilateral External Oblique] [ipsilEO data was only collected for seven participants. Note: * denotes statistically significant difference (p < 0.05) between healthy and injured throwers during P1 or P2 for each task.
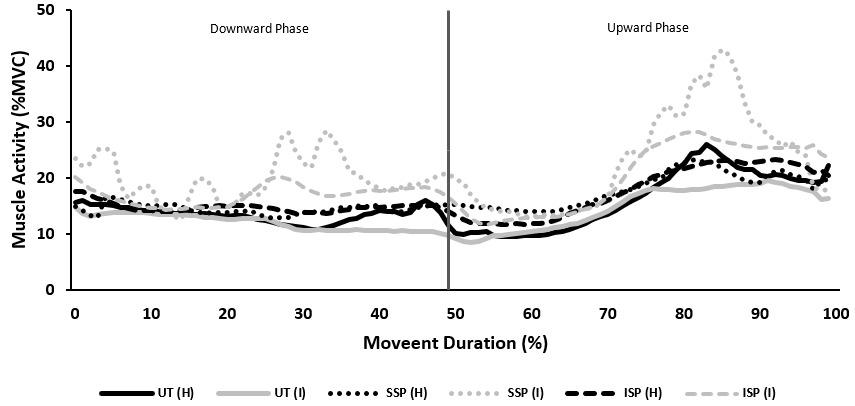
ity patterns for the AD, UT and rotator cuff musculature exhibited some variation between healthy and injured throwers, agreeing with findings in previous research studies investigating shoulder elevation tasks.13,38 At mid-elevation, AD and UT activity increased as rotator cuff activity increased, with higher SSP and ISP activity evident in injured throwers (Figure 2). This supports the previous findings of Hawkes and colleagues,20 who attributed increased rotator cuff activity as a mechanism to ensure glenohumeral joint stability during arm elevation movements. In addition, patients with anterior shoulder instability exhibited higher peak ISP, UT and PD activity, but lower SSP activity when compared to healthy controls during elevation tasks.38 They deemed activity differences were significant around mid-elevation and determined that the early onset of ISP and SSP resulted in delayed onset of UT activity This is in slight contrast to the findings of the present study, as although ISP and SSP activity were higher in injured throwers during mid-elevation, UT activity was lower when compared to healthy throwers. This suggests that injured throwers utilize rotator cuff musculature to compensate for reduced UT activity as the arm is elevated. During the midelevation range through to the end of Phase 2 as the arm is raised to its highest point, healthy throwers exhibited higher AD, UT and LT activity whereas injured throwers exhibited higher ISP, SSP, MD and PD activity. The increased eccentric activities of both the SSP and PD could be strategies to counteract AD activity as it contracts to flex the shoulder joint and in turn, aid repositioning of the humeral head during upward movement39 to support humeral elevation37 similar to the previously proposed mechanism during the rotation task.
Similar to the High Elevation protocol, no mean muscle activity differences were evident between groups during or between phases for the Low Elevation protocol. However, differences in activity patterns were evident around midelevation in both upward and downward phases for the
same muscles as previously highlighted. Therefore, it is suggested that similar compensatory mechanisms should be applied towards this protocol. However, differences in BB activity patterns were noted for this protocol. The BB plays an important role during initial arm elevation, and when the arm is elevated to 30o , the BB provides stability to the glenohumeral joint as it moves through the range.40 In the present study, BB activity increased in both groups approaching mid-elevation during the upward phase, although activity was higher in injured throwers. This activity could be as a result of increased elbow flexion mid-elevation, although it is possible that the higher BB activity exhibited in injured throwers was required to assist in providing additional stability to the shoulder joint during the upward movement. Landin and colleagues41 reported that continued BB activity was evident when the arm was further elevated past 30o and this activity is in combination with increased AD activity as the shoulder continues to be flexed.42 This is consistent with the findings of the present study, with peak AD activity being exhibited in both groups after peak BB activity, approaching the end of the upward phase (Figure 3). Healthy throwers also exhibited a greater peak activity of AD compared to BB which contrasts the activity magnitudes of injured throwers. Peak BB activity during the downward phase was less than peak activity during the upward phase for both groups. This could suggest that muscle activity needs to be increased in the upward phase due to working against gravity (as proposed by Hawkes and colleagues),20 but also as a result of the need to enhance glenohumeral joint stability and reduce the anterior translation of the humeral head.43 BB activity patterns identified in this present study are comparable to those previously reported in similar studies,20 which detailed a gradual reduction in BB activity until around 70% of the movement cycle, where re-activation is evident.
Future studies should focus attention towards increasing the weight of the object being manipulated during func-
Figure 2. Upper Trapezius and Rotator Cuff muscle activity during High Elevation functional task [H – Healthy, I – Injured; Upper Trapezius (UT), Supraspinatus (SSP), Infraspinatus (ISP)]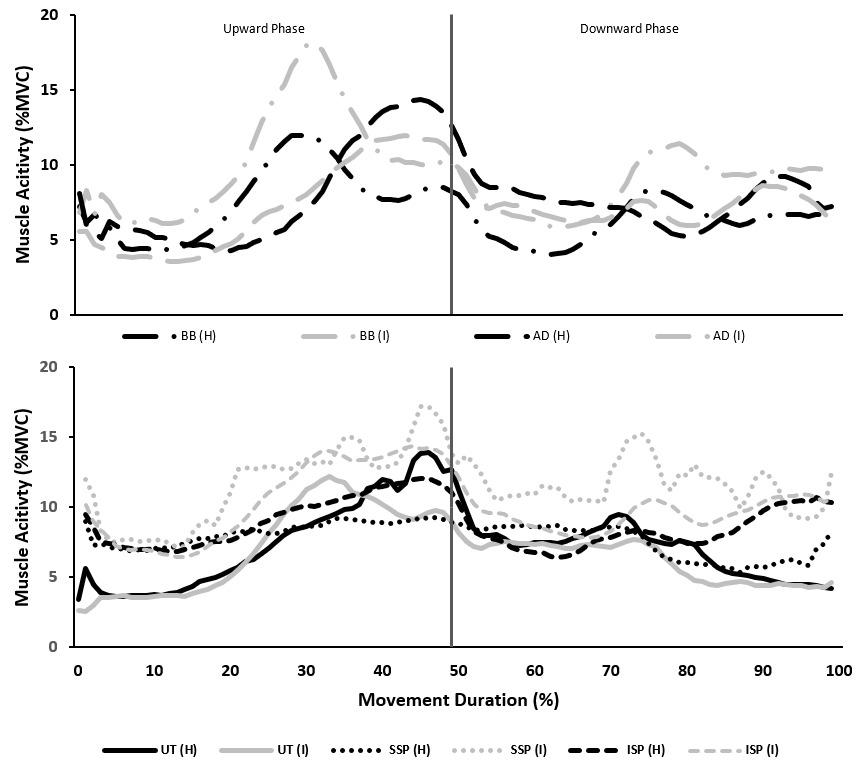
tional everyday tasks, or increase the time permitted to complete the task. The fatiguability of key muscles could be investigated alongside postural movement during each trial. Due to the ballistic movement associated with overhead throwing, functional movements at greater speeds could be investigated to assess muscle activities across the upper extremity and core, and identify differences between healthy and injured throwers. This may provide further insights to those provided by Castillo-Lozano and colleagues44 who investigated the muscle activity of healthy participants during arm elevation through different planes and at different speeds. This may provide an intermediate test condition between controlled functional and throwingrelated movements. Finally, for overhead throwing athletes, more complex functional tasks could be designed that reflect similar movements to an overhead throwing task where participants move through various planes of movement in succession.
The results of this study present the activity of selected upper extremity and core muscle in healthy and injured overhead throwing athletes during three functional everyday tasks (high elevation, low elevation, and rotation). While both groups recorded similar mean activities for high and low elevation movements, healthy throwers elicited higher UT activity during both phases of the rotational movement. Qualitative examination of muscle activity patterns presented temporal shifts in muscle activation timings and magnitudes which could relate to potential compensatory mechanisms in order to achieve task completion.
The functional movements were designed to allow the participants to complete tasks without any inhibitory or adaptations in technique, controlling the intensity of action demanded on an injured limb. While the results may be useful to evaluate the impact of injury on completing every day functional tasks, caution should be taken when
Figure 3. Key muscle activity during Low Elevation functional task [H – Healthy, I – Injured; Biceps Brachii (BB), Anterior Deltoid (AD), Upper Trapezius (UT), Supraspinatus (SSP), Infraspinatus (ISP)]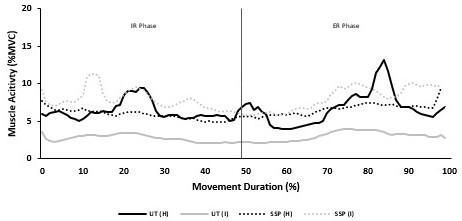
attempting to apply findings to overhead throwing performance. Overhead throwing is reliant on the interaction of muscles through the KC, and the functional tasks investigated do not engage the core musculature or reflect the intensity of a maximal throwing motion.
Submitted: October 17, 2023 CDT, Accepted: February 07, 2024
CDT
© The Author(s)
This is an open-access article distributed under the terms of the Creative Commons Attribution 4.0 International License (CCBY-NC-4.0). View this license’s legal deed at https://creativecommons.org/licenses/by-nc/4.0 and legal code at https://creativecommons.org/licenses/by-nc/4.0/legalcode for more information.
Figure 4. Key muscle activity during a Rotational functional task [H – Healthy, I – Injured; Upper Trapezius (UT), Supraspinatus (SSP).1. van Doorn PF, de Schepper EIT, Rozendaal RM, et al. The incidence and management of shoulder complaints in general practice: a retrospective cohort study Fam Pract 2021;38(5):582-588. doi:10.1093/fa mpra/cmab022
2. Luime JJ, Koes BW, Hendriksen IJM, et al. Prevalence and incidence of shoulder pain in the general population; a systematic review Scand J Rheumatol. 2004;33(2):73-81. doi:10.1080/030097403 10004667
3. Roquelaure Y, Ha C, Leclerc A, et al. Epidemiologic surveillance of upper-extremity musculoskeletal disorders in the working population. Arthrit Rheumat 2006;55(5):765-778. doi:10.1002/art.22222
4. Andersson SH, Bahr R, Clarsen B, Myklebust G. Preventing overuse shoulder injuries among throwing athletes: a cluster-randomised controlled trial in 660 elite handball players. Br J Sports Med. 2017;51(14):1073-1080. doi:10.1136/bjsports-2016-0 96226
5. Pluim BM, van Cingel REH, Kibler WB. Shoulder to shoulder: stabilising instability, re-establishing rhythm, and rescuing the rotators! Br J Sports Med 2006;44(5):299.
6. Ranson C, Gregory PL. Shoulder injury in professional cricketers. Phys Ther Sport 2008;9(1):34-39. doi:10.1016/j.ptsp.2007.08.001
7. Lin DJ, Wong TT, Kazam JK. Shoulder injuries in the overhead-throwing athlete: epidemiology, mechanisms of injury, and imaging findings. Radiology. 2018;286(2):370-387. doi:10.1148/radiol.20 17170481
8. Kibler WB, Thomas SJ. Pathomechanics of the throwing shoulder. Sports Med Arthrosc Rev. 2012;20(1):22-29. doi:10.1097/jsa.0b013e3182432cf2
9. Burkhart SS, Morgan CD, Kibler WB. The disabled throwing shoulder: spectrum of pathology Part I: Pathoanatomy and biomechanics. Arthroscopy 2003;19(4):404-420. doi:10.1053/jars.2003.50128
10. Kibler BW, McMullen J. Scapular dyskinesis and its relation to shoulder pain. J Am Acad Orthop Surg. 2003;11(2):142-151. doi:10.5435/00124635-20030300 0-00008
11. Wilk KE, Andrews JR, Arrigo CA, Keirns MA, Erber DJ. The strength characteristics of internal and external rotator muscles in professional baseball pitchers. Am J Sports Med 1993;21(1):61-66. doi:10.1 177/036354659302100111
12. Wilk KE, Yenchak AJ, Arrigo CA, Andrews JR. The advanced Throwers Ten Exercise Programme: A new exercise series for enhanced dynamic shoulder control in the overhead throwing athlete. Phys Sportsmed 2011;39(4):90-97 doi:10.3810/psm.2011.1 1.1943
13. Alizadehkhaiyat O, Roebuck MM, Makki AT, Frostick SP Pain, functional disability, psychological status, and health-related quality of life in patients with subacromial impingement syndrome. Cogent Med 2017;4(1):1-14. doi:10.1080/2331205x.2017.140 6631
14. Hegedus EJ, Vidt ME, Tarara DT. The best combination of physical performance and self-report measures to capture function in three patient groups. Phys Ther Rev. 2014;19(3):196-203. doi:10.1179/1743 288x13y.0000000121
15. Hughes RE, Johnson ME, Skow A, An KN, O’Driscoll SW. Reliability of a simple shoulder endurance test. J Musculoskelet Res 1999;3(3):195-200. doi:10.1142/s0218957799000208
16. Shah KM, Baker T, Dingle A, et al. Early development and reliability of the Timed Functional Arm and Shoulder Test. J Orthop Sports Phys Ther 2017;47(6):420-431. doi:10.2519/jospt.2017.7136
17. Kellor M, Frost J, Silberberg N, Iversen I, Cummings R. Hand strength and dexterity Am J Occup Ther. 1971;25:77-83.
18. MacDermid JC, Ghobrial M, Quirion KB, et al. Validation of a new test that assesses functional performance of the upper extremity and neck (FITHaNSA) in patients with shoulder pathology. BMC Musculoskelet Disord 2007;8(1):42-52. doi:10.1186/14 71-2474-8-42
19. Kumta P, MacDermid JC, Mehta SP, Stratford PW. The FIT-HaNSA demonstrates reliability and convergent validity of functional performance in patients with shoulder disorders. J Orthop Sports Phys Ther 2012;42(5):455-464. doi:10.2519/jospt.2012.379 6
20. Hawkes DH, Alizadehkhaiyat O, Kemp GJ, Fisher AC, Roebuck MM, Frostick SP. Shoulder muscle activation and coordination in patients with a massive rotator cuff tear: An electromyographic study J Orthop Res 2012;30(7):1140-1146. doi:10.100 2/jor.22051
21. Klich S, Kawczyński A, Pietraszewski B, et al. Electromyographic evaluation of the shoulder muscle after a fatiguing isokinetic protocol in recreational overhead athletes. Int J Environ Res Public Health. 2021;18(5):2516. doi:10.3390/ijerph18052516
22. Oleksy L, Czarny W, Bajorek W, Krol P, Mika A, Kielnar R. The evaluation of shoulder muscle fatigue in volleyball players. J Nov Physiother. 2018;8(2):388. doi:10.4172/2165-7025.1000388
23. Joshi M, Thigpen CA, Bunn K, Karas SG, Padua DA. Shoulder external rotation fatigue and scapular muscle activation and kinematics in overhead athletes. J Athl Train 2011;46(4):349-357
24. Kim Y, Lee JM, Wellsandt E, Rosen AB. Comparison of shoulder range of motion, strength, and upper quarter dynamic balance between NCAA division I overhead athletes with and without a history of shoulder injury Phys Ther Sport 2020;42:53-60. doi:10.1016/j.ptsp.2019.12.007
25. Borms D, Maenhout A, Cools AM. Incorporation of the kinetic chain Into shoulder elevation exercises: Does it affect scapular muscle activity? J Athl Train 2020;55(4):343-349. doi:10.4085/1062-6050-136-19
26. Werin M, Maenhout A, Smet S, Van Holder L, Cools A. Muscle recruitment during plyometric exercises in overhead athletes with and without shoulder pain. Phys Ther Sport 2020;43:19-26. doi:1 0.1016/j.ptsp.2020.01.015
27. Oliver GD, Plummer HA, Gascon SS. Electromyographic analysis of traditional and kinetic chain exercises for dynamic shoulder movements. J Strength Cond Res. 2016;30(11):3146-3154. doi:10.151 9/jsc.0000000000001389
28. Oliver GD, Weimar WH, Plummer HA. Gluteus medius and scapula muscle activations in youth baseball pitchers. J Strength Cond Res 2015;29(6):1494-1499. doi:10.1519/jsc.000000000000 0797
29. Lee HJ, DeLisa JA. Surface Anatomy for Clinical Needle Electromyography Demos Medical (New York); 2000.
30. Maenhout A, Benzoor M, Werin M, Cools A. Scapular muscle activity in a variety of plyometric exercises. J Electromyogr Kinesiol 2016;27:39-45. do i:10.1016/j.jelekin.2016.01.003
31. Ha S, Oh J, Jeon I, Kwon O The effects of surface condition on abdominal muscle activity during single-legged hold exercise. J Electromyogr Kinesiol 2015;25(1):28-33. doi:10.1016/j.jelekin.2014.07.001
32. Herrington L, Waterman R, Smith L. Electromyographic analysis of shoulder muscles during press-up variations and progressions. J Electromyogr Kinesiol. 2015;25(1):100-106. doi:10.101 6/j.jelekin.2014.10.002
33. Kelly BT, Kadrmas WR, Speer KP The manual muscle examination for shoulder rotator cuff strength. An electromyographic investigation. Am J Sports Med 1996;24(5):581-588. doi:10.1177/0363546 59602400504
34. Safee MKM, Abas WABW, Ibrahim F, Osman NAA, Salahuddin MHR. Electromyographic activity of the lower limb muscles during salat and specific exercises. J Phys Ther Sci 2012;24(6):549-552. doi:1 0.1589/jpts.24.549
35. Field A. Discovering Statistics Using SPSS. 3rd ed. Sage Publications Ltd; 2009.
36. Johnson G, Bogduk N, Nowitzke A, House D Anatomy and actions of the trapezius muscle. Clin Biomech 1994;9(1):44-50. doi:10.1016/0268-0033(9 4)90057-4
37 Otis JC, Jiang CC, Wickiewicz TL, Peterson MG, Warren RF, Santner TJ. Changes in the moment arms of the rotator cuff and deltoid muscles with abduction and rotation. J Bone Jt Surg. 1994;76(5):667-676. doi:10.2106/00004623-19940500 0-00007
38. Rajaratnam BS, Goh JCH, Kumar PV Control strategies to re-establish glenohumeral stability after shoulder injury BMC Sports Sci Med Rehabil 2013;5(26):1-9. doi:10.1186/2052-1847-5-26
39. Cools AM, Witvrouw EE, Declercq GA, Danneels LA, Cambier DC. Scapular muscle recruitment patterns: trapezius muscle latency with and without impingement symptoms. Am J Sports Med. 2003;31(4):542-549. doi:10.1177/03635465030310041 101
40. Landin D, Myers J, Thompson M, Castle R, Porter J. The role of the biceps brachii in shoulder elevation. J Electromyogr Kinesiol 2008;18(2):270-275. doi:10.10 16/j.jelekin.2006.09.012
41. Landin D, Thompson M, Jackson MR. Actions of the Biceps Brachii at the Shoulder: A Review J Clin Med Res. 2017;9(8):667-670. doi:10.14740/jocmr2901
w
42. Liu J, Hughes RE, Smutz WP, Niebur G, Nan-An K. Roles of deltoid and rotator cuff muscles in shoulder elevation. Clin Biomech 1997;12(1):32-38. doi:10.101 6/s0268-0033(96)00047-2
43. Itoi E, Motzkin NE, Morrey BF, An KN. Bulk effect of rotator cuff on inferior glenohumeral stability as function of scapular inclination angle: a cadaver study. Tohoku J Exp Med. 1993;171(4):267-276. doi:1 0.1620/tjem.171.267
44. Castillo-Lozano R, Cuesta-Vargas A, Gabel CP Analysis of arm elevation muscle activity through different movement planes and speeds during inwater and dry-land exercise. J Shoulder Elbow Surg. 2014;23(2):159-165. doi:10.1016/j.jse.2013.04.010
Scott W. Cheatham1a , Rusty Baker2
1 Kinesiology, California State University, Dominguez Hills, 2 University of Idaho
Keywords: compression, floss, band, myofascial, intervention https://doi.org/10.26603/001c.94598
Tissue flossing is an emerging myofascial intervention used by sports medicine professionals with a growing body of research evidence. Sports medicine professionals may use tissue flossing to increase myofascial mobility, improve joint ROM, enhance athletic performance, and reduce pain. Despite the increasing use, there is no consensus on clinical practice recommendations for this intervention. The purpose of this commentary is to discuss proposed clinical practice recommendations for tissue flossing and to encourage sports medicine professionals and researchers to contribute their expertise to further develop best practices.
5
Tissue flossing is an emerging myofascial intervention gaining popularity among sports medicine professionals since its introduction by Starrett and Cordoza in 2013.1 The intervention consists of wrapping a latex tissue flossing band around a body region (joint or soft-tissue) using a 50% overlapping circumferential pattern (distal to proximal), with a relative stretch ranging from 50-90% of the band maximal length (Figures 1 and 2).1‑3 After applying the band, the individual performs up to an eight-minute treatment session that may include different active and passive movements of the wrapped body region.1‑5
Tissue flossing has been used by sports medicine professionals to attempt to increase myofascial mobility, improve joint range of motion (ROM), enhance athletic performance, and reduce pain.3‑6 This intervention has also been explored as a method for performing blood flow restriction training.7,8 Several companies manufacture tissue flossing bands, such as The Ready State™, RockTape®, and Rogue Fitness®, with most bands being constructed of latex rubber (1.5 mm thick) and available in 2 inch (5.08 cm) and 4 inch (10.16 cm) widths and an average length of 7 feet long (213.36cm).2 Some manufacturers offer professional education on this technique, but most focus on the production and sale of the band products. Sports medicine profes-
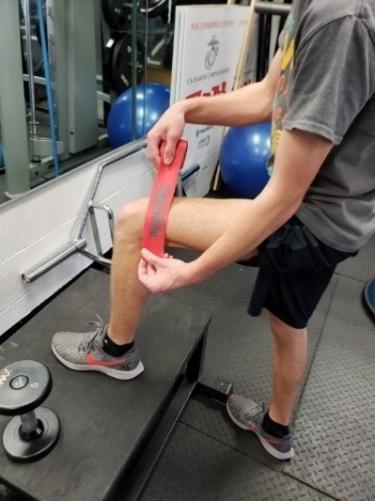
Corresponding Author:
Scott W. Cheatham, Ph.D., DPT, PT, OCS, ATC, CSCS
California State University Dominguez Hills 1000 E. Victoria Street, Carson, California 90747 Scheatham@csudh.edu
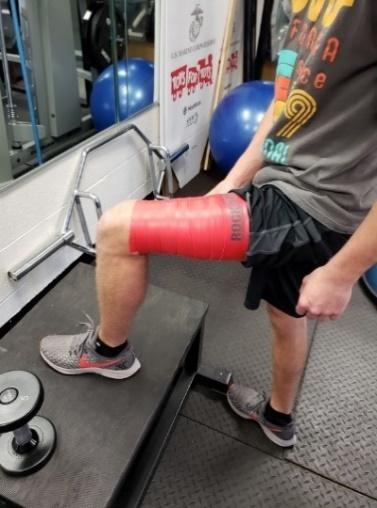
sionals should consider that the tissue flossing bands may have different architectural properties, such as width and thickness, than other flat latex resistance bands (e.g., TheraBand® CLX™) commonly used for fitness and sports rehabilitation.2,9,10
The current body of evidence has grown over that past 10 years with several researchers reporting positive post intervention effects for joint ROM, muscle stiffness, muscle strength, pain reduction, and athletic performance.3‑5 Despite the growing popularity, there seems to be a lack of consensus regarding tissue flossing clinical practice recommendations such as indications, precautions, contraindications, and patient management during treatment. A review of the research evidence conducted in January 2024 (PubMed, PEDro, Science Direct, and EBSCOhost) did not reveal any manuscripts specifically discussing best practices for the use of tissue flossing bands.
The lack of evidence-based clinical practice recommendations creates a challenge for sports medicine professionals who use tissue flossing within their practice as well as for researchers studying the efficacy of this intervention in different populations. Therefore, the purpose of this commentary is to discuss proposed clinical practice recommendations for tissue flossing and to encourage sports medicine professionals and researchers to contribute their expertise to further develop best practice recommendations. Due to the lack of guidelines and emerging body of research evidence, this commentary integrates the tissue flossing research with existing clinical standards from other myofascial interventions as they relate to this discussion.11,12 The following topic areas will be discussed: indications, precautions and contraindications, intervention description, patient assessment, patient monitoring, and band hygiene and care.
Currently, consensus has not been established on the optimal tissue flossing intervention parameters including amount of band stretch length, wrapping pattern, and total intervention time.2 Despite the lack of universal agreement on optimal treatment parameters, the existing literature provides evidence that tissue flossing may improve joint ROM, muscle strength, athletic performance, and balance in specific situations, while also being a potential intervention to reduce musculoskeletal pain (Table 1).3‑6,13 It is important to note that selected studies were used to support the specific indications discussed and this commentary is not meant to serve as a comprehensive literature review or systematic analysis of the current body of research evidence. Sports medicine professionals are encouraged to review published systematic and scoping reviews that further appraise the tissue flossing research evidence.3‑5 Specific indications, related treatment parameters, and postulated mechanisms are discussed further in subsequent sections.
Several researchers have documented short term post intervention changes in joint active ROM, passive ROM, and related muscle length (e.g., passive knee extension for hamstring length) after a tissue flossing intervention. For the ankle, researchers have documented post intervention changes in active ROM dorsiflexion and plantar flexion using manual goniometric or digital ROM devices among healthy adults14,15 and recreational adult athletes.16‑19 Researchers have also documented post intervention changes in weightbearing lunge test performance among recreational adult athletes.16,17,19,20
For the knee, post intervention changes in quadriceps length (Ely’s test) and hamstring length (active and passive knee extension tests, active straight leg raise test) have been documented among healthy adults.21‑23 For the lumbo-pelvic-hip complex, post intervention changes in hip flexion ROM have been documented via the active and passive straight leg raise test among healthy adults.22,24, 25 However, one study reported nonsignificant immediate post intervention changes for passive hip and knee ROM where the modified Thomas test was used to assess changes among healthy adults.26
For the upper extremity, researchers have documented short term post intervention changes in shoulder passive ROM (internal and external rotation) using a manual goniometer among adult amateur overhead athletes27 and recreational adult athletes.28 Researchers also documented the post intervention physical and perceptual changes in shoulder flexion passive ROM among healthy adults after a tissue flossing intervention that included the Child’s Pose stretch (5 sets of 30 seconds).29 Shoulder ROM was measured with a manual goniometer and a 6-point Likert scale (0 no change, 5 dramatic change) was used to document perceived changes in ROM. The researchers reported nonsignificant post-intervention physical ROM changes; despite the lack of statistically significant physical improve-
Figure 2. Tissue flossing band application to the thigh.Description “tissue flossing is an intervention that uses a compressive latex band wrapped around a body region at a specific stretch length, followed by movement of the body region to manipulate the skin, myofascia, muscles, tendons, and/or joint structures.”
*Indications Impaired joint ROM (hip, knee, ankle, shoulder, sit and reach), muscle strength and power (hip, knee, ankle), athletic performance (vertical jump, sprint, hop distance, and jump landing), balance (static, dynamic), tissue stiffness (quadriceps, hamstrings, plantar flexors), Achilles tendinopathy, Keinbock’s disease, Osgood-Schlatter’s disease, shoulder pain, elbow pain, and delayed onset of muscle soreness.
*Indications: references provided in the written section; ROM: range of motion
ment, participant’s reported significant improvements in their perceived ROM.29 The researchers postulated that the positive post intervention perception of ROM improvement may help individuals with better adherence to a treatment plan due the perceived progress. Further research is needed to confirm or refute these findings.29
Researchers have also documented the post intervention effects of tissue flossing on reducing tissue stiffness at the plantar flexors and ankle (measured via ultrasonography),15,30,31 hamstrings (measured via ultrasonography),22 and quadriceps (measured via tensiomyography)32 and it has been postulated that changes in muscle tissue stiffness can influence joint ROM.3
In summary, the tissue flossing research on joint ROM, muscle length, and tissue stiffness has documented positive short term (up to 45 min) post intervention changes for healthy individuals and athletes after a single session. Researchers used tissue flossing interventions that included wrapping the joint (e.g., knee, ankle)16,17,20,23,27‑29,31 or soft-tissue (e.g., thigh, calf)14,15,18‑22,24,30,32 and various active (e.g., bodyweight squats, lunges, joint motion) and passive (e.g., child’s pose stretch) movements for a total treatment time range of 2 minute to 8 minute. Several studies used a predetermined band stretch pressure ranging between 100mm Hg and 200mm Hg which was directly measured by different sub-band digital pressure sensors.14,16, 17,19,24,25 Other researchers only used the recommended stretch length (e.g., 50% band maximal length) and did not document any methods for measuring or monitoring band stretch pressure.15,20,21,23,27‑29 All studies used control comparison groups that included no intervention, tissue flossing band at different stretch lengths, instrument assisted soft-tissue mobilization (IASTM), self-myofascial rolling, kinesiology tape, or other interventions (e.g., dynamic or static stretching).14,16,17,19‑30,33,34
Researchers have documented short-term post intervention changes after a tissue flossing intervention for lower extremity muscle strength and power. For the ankle, several studies have documented post intervention changes in ankle dorsiflexion and plantar flexion strength and power measured by isokinetic dynamometry among healthy adults14 and recreational adult athletes.15 One study also documented decreased soleus H-reflex activity (up to 10 min) after a tissue flossing intervention.33 For the knee, several studies have documented post intervention changes in knee flexion and extension strength measured by isoki-
netic dynamometry among healthy adults,15,23,26 However, nonsignificant post intervention changes for knee flexor and extensor strength measured by isokinetic dynamometry were also found.35 For the upper extremity, researchers have documented post intervention changes in shoulder isokinetic strength (internal and external rotation) and power among adult amateur overhead athletes27 and power among recreational adult athletes.28 Researchers that conducted strength testing used a combination of measures such as isokinetic maximum voluntary contraction, maximum eccentric contraction, rate of force development, and peak torque.14,15,23,26,33,35 Researchers also measure power with the one arm shot put test27 and bench press test with an 3D accelerometer.28
Researchers have also documented short term post intervention changes in specific athletic performance measures after a tissue flossing intervention. For counter movement jump performance, researchers reported post intervention changes after a tissue flossing intervention to the ankle and knee among recreational adult athletes16,17, 30 and professional adult rugby players.34 Researchers used digital force plates or mats to document participant performance for these investigations.16,17,30,34
For sprint performance, researchers have also documented short term post intervention changes after tissue flossing to the ankle among recreational adult athletes16, 30 and professional adult rugby players.34 The researchers used different digital speed timing systems to document participant performance in these investigations.16,30,34 Researchers have also documented post intervention changes in static and dynamic balance, hop distance, and jump landing performance among healthy adults using the Biodex isokinetic dynamometer (Biodex System, Shirley, NY, USA), Y-Balance test, Landing Error Scoring System (LESS), and single-leg triple hop test.21,23 However, some researchers reported nonsignificant post intervention changes in counter movement jump performance as measured by a force plate.26,32
In summary, the research on muscle and athletic performance has documented positive short term (up to 60 min) post intervention changes after tissue flossing. Researchers used tissue flossing interventions that included wrapping the joint (e.g., knee, ankle)16,17,23,26,30,33,34 or soft-tissue (e.g., thigh, calf)14,15,21,24,26,33,35 and various active movements (e.g., joint motion) for a total treatment time range of 2 minutes to 8 minutes. Several studies used a predetermined band stretch pressure ranging between 100mm Hg and 200mm Hg which was directly measured by
different sub-band digital pressure sensors.14,16,17,19,24,25, 34 Other researchers only used the recommended stretch length (e.g., 50% band maximal length) or used a handheld dynamometer (measured band stretch force) and did not document any methods for measuring or monitoring band stretch pressure during the intervention.15,20,21,23,27‑29,32, 36 All studies used control comparison groups that included no intervention, cotton elastic bandage, tissue flossing band at different stretch length pressures, IASTM, self-myofascial rolling, kinesiology tape, or other interventions (e.g. dynamic or static stretching).
Hand Disability Index (WHDI), maximal repetition single leg squat, and standing long jump to measure treatment outcomes.39‑41 For each patient case, total treatment duration ranged from two to six weeks.39‑41
14‑16,19,21‑24,26‑30,33,34,36
Researchers have studied the short term effects of a tissue flossing intervention on delayed onset of muscle soreness (DOMS) after strenuous exercise. For the upper extremity, one research group documented decreased post intervention DOMS (up to 48 hours) in healthy adults after a tissue flossing intervention as documented using the 100-mm Visual Analog Scale (VAS).37 For the lower extremity, another group did not find any significant changes in DOMS after a tissue flossing intervention among healthy adults as documented using the numeric pain rating scale (0-10).38 When considering possible physiological mechanisms, researchers postulated that tissue flossing compression may have reduced the inflammatory response that accompanies the muscle microdamage from DOMS and may have lowered intracellular osmotic pressure that may reduce nociceptor sensitivity 37
In summary, the two available studies on tissue flossing for DOMS produced mixed results. Both studies used a tissue flossing band intervention that wrapped the soft tissue (e.g., upper arm, upper thigh) and included various active movements (e.g., joint motion) for a total treatment time range of 2 minutes to 6 minutes. Researchers only used the recommended band stretch length (e.g., 50% band maximal length) and did not document any methods for measuring or monitoring band stretch pressure.37,38 Both studies used a non-treatment control comparison groups.37,38 Sports medicine professionals should consider the few studies on this topic and the limitations of each study when considering tissue flossing for the treatment of DOMS.
Researchers have published different case studies and clinical studies that suggest a tissue flossing intervention may help reduce pain, improve function, and improve lower extremity muscle endurance and power for specific conditions. Favorable results of tissue flossing for Achilles tendinopathy,39 Keinbock’s disease,40 and Osgood-Schlatter’s disease41 have been reported in case reports on adolescent and adult athletes. All case reports used tissue flossing as their primary treatment except for the case study on Achilles tendinopathy which used a combined tissue flossing and self-myofascial release (e.g., lacrosse ball) intervention.39 These case reports used outcome measures such as visual analog pain scale, pressure pain threshold algometry, lower extremity functional scale (LEFS), Wrist/
Clinical studies have also been conducted that document post intervention changes in pain after a tissue flossing intervention. One researcher group reported post intervention improvements in elbow pain measured by the VAS.13 Another research group reported post intervention improvements in knee pain measured by the VAS, pressure pain threshold algometry, and Short Form McGill Pain Questionnaire II.42
In summary, the research on tissue flossing for specific injuries and pain has documented post intervention changes for pain, function, and muscle performance. However, the evidence is mixed among different case and clinical studies.13,39‑42 Several studies used a tissue flossing intervention that wrapped the joint (e.g., wrist, elbow)13,40,42 and soft tissue (e.g., upper arm, upper thigh)39,41 and included various active movements (e.g., joint motion) for a total treatment time range of 2 minutes to 6 minutes. For all studies, researchers only used the recommended tissue floss band stretch length (e.g., 50% band maximal length) and did not document any methods for measuring or monitoring band stretch pressure during the intervention.13, 39‑42 The clinical studies used one group of participants without a controlled comparison group.13,42
Three studies have documented the potential interchangeability of a tissue flossing intervention with other myofascial interventions. One research group43 found that tissue flossing, self-myofascial rolling, and IASTM (applied by a professional) equivalently increased short term post intervention knee joint passive ROM. Researchers also reported similar post intervention changes with IASTM (applied by a professional) and tissue flossing on ankle passive ROM after a four week intervention (two sessions per week).44 Another research group reported similar post intervention changes with tissue flossing and a self-myofascial rollers on Achilles stiffness (measured by a myotonometry device), countermovement jump, and sprint performance.30
In summary, the emerging research suggests that tissue flossing may be interchangeable with IASTM and self-myofascial rolling for improving knee and ankle joint ROM and triceps surae stiffness.30,43,44 Tissue flossing and self-myofascial rolling may also improve countermovement jump and sprint performance.30 Studies used a tissue flossing intervention that wrapped the joint (e.g., ankle)44 or soft tissue (e.g., thigh)30,43 and included various active movements (e.g., joint motion) for a total treatment time range of 2 minutes to 5 minutes. For all studies, researchers only used the recommended tissue floss band stretch length (e.g., 50% band maximal length) and did not document any methods for measuring or monitoring band stretch pressure. All studies used matched intervention times for the comparison groups.30,43,44 While similar results were reported across interventions, sports medicine professionals should also consider individual patient needs and situa-
tions, as well as clinical considerations (e.g., contraindications), when selecting between these interventions.
Sports medicine professionals should consider that many different treatment parameters noted among the aforementioned studies included but were not limited to a single treatment session, a 50% overlap of the band on the tissues or joint, different wrapping patterns (e.g., circumferential, figure 8), preset band stretch length (e.g., 50%-75% maximal length) or stretch pressure (e.g., 100 to 200 mmHg), active movements, passive movements, and a treatment duration ranging from 2 minutes to 6 minutes or exercise repetition range from 10 to 30 repetitions.3‑5 To date, no consensus has been reached on the optimal treatment parameters for specific patients of conditions. The sports medicine professional will have to translate the existing research evidence to their practice and match the best parameters to each patient.
Researchers have postulated different physiological mechanisms for the post intervention changes observed with tissue flossing.3‑6 For joint ROM & tissue stiffness, researchers have hypothesized that tissue flossing may increase muscle stretch tolerance, reduce muscle stiffness, and improve myofascial thixotropy 3‑6 For muscle and athletic performance, researchers have postulated that a tissue flossing intervention may enhance hormonal responses, reflex facilitation, and overall neuromuscular function.3 Researchers have also postulated that these effects may occur from the potential vascular occlusion from the tissue band stretch pressure or from a physiological response once the band is released.14, 16 Researchers have also theorized that ischemic preconditioning (e.g. tissue flossing) may improve athletic performance.20 Tissue previously submitted to ischemic conditions may become more resistant to ischemia and its negative effects.45 For DOMS, researchers have hypothesized that immediate application of tissue flossing after strenuous exercise may reduce inflammation, intracellular osmotic pressure, and nociceptor sensitivity 3,37 For specific injuries and pain, the mechanism behind patient recovery may be multifactorial making it difficult to suggest a specific mechanism for the effects of a tissue flossing intervention and researchers have not provided specific discussions regarding potential physiological mechanisms in prior research.3,39‑42 For interchangeability, preliminary research has suggested that tissue flossing may produce similar mechanical and neurophysiological effects as other myofascial interventions, such as IASTM, kinesiology tape, and selfmyofascial rolling. Researchers have documented positive post-intervention changes in knee flexion,43 ankle dorsiflexion,44 Achilles stiffness,30 and athletic performance34 when all three myofascial interventions were compared.
In summary, several researchers have postulated different post intervention physiological effects from tissue flossing. To date, these theories have not been fully validated and remain under study.3‑6,14,16,20 The sports med-
icine professional should consider the lack of understanding of mechanism(s) by which effect occur and the need for further investigations on the physiological effects of tissue flossing for different patient populations and medical conditions. This may be most applicable to sports medicine professionals who use tissue flossing to achieve a specific post intervention physiological change with their patients.
Currently, a universal consensus on tissue flossing precautions and contraindications is lacking. Starrett and Cordoza1 documented a few conditions in their book, such as abnormal sensation (e.g., numbness or tingling or pin and needles), inadequate arterial and vascular function (e.g., skin turns cyanotic), or an abnormal feeling of claustrophobia around the band and body region. Since their book was published, there have been no other available peer-reviewed commentaries or studies on proposed tissue flossing precautions and contraindications. This section will provide suggested precautions and contraindications based upon Starrett and Cordoza1 and adapted from other myofascial interventions that have published guidelines (Tables 2 and 3).11,12
The sports medicine professional should consider that some common conditions or clinical presentations may be considered as either precautionary or contraindicative depending on the patient. In the presence of such conditions, sports medicine professionals should conduct a comprehensive clinical examination to determine if tissue flossing is safe for these individuals, and what might constitute a precaution or contraindication depending on the patient. While an all-inclusive list is outside of the scope of this commentary, sports medicine professionals and researchers should be aware of common conditions or clinical presentations that may need to be considered prior to or during a tissue flossing intervention. This may include but are not limited to latex allergy, arterial and vascular inhibited function before or during treatment, abnormal sensations during treatment, fragile or sensitive skin, connective tissue disorders, congestive heart disease/circulatory disorders, cancer, pregnancy, patient intolerance, hypersensitivity, high pain sensation due to injury, peripheral vascular disease or insufficiency, varicose veins, lymphedema, tissue edema/swelling , medications that thin blood or alter sensation, diabetes, neuropathy or polyneuropathy, and hypertension.
In summary, this section proposes possible precautions and contraindications for consideration. It is anticipated that the discussed conditions and clinical presentations will be modified to provide evidence-based guidelines with future research and lessons learned from clinical practice. Tables 2 and 3 provide a more thorough list of suggested precautions and contraindications for consideration when using tissue flossing bands.
• Latex allergy
• Abnormal sensations during treatment (e.g., numbness)
• Fragile or sensitive skin
• Varicose veins or burn scars
• Acute inflammatory conditions
• Cancer
• Hypertension
• Unhealed closed or non-complicated fractures
• Post injection (e.g., steroid)
• Congestive heart disease, circulatory disorders
• Kidney dysfunction
• Body art
• Latex allergy
• Abnormal sensations during treatment (e.g., numbness)
• Fragile or sensitive skin
• Skin rash, open wounds, blisters, local tissue inflammation, burn scars, or tumors
• Peripheral vascular disease or insufficiency, varicose veins
• Acute inflammatory conditions
• Cancer or malignancy
• Hypertension (controlled or uncontrolled)
• Unhealed or unstable bone fracture
• Hematoma, myositis ossificans
• Acute or severe cardiac, liver, or kidney disease
• Neurologic conditions resulting in loss or altered sensation (e.g., Multiple Sclerosis)
• Medications that thin blood or alter sensations.
• Recent surgery or injury or unhealed surgical site
• Pacemaker or insulin pumps (treatment around devices)
• Arterial and vascular inhibited function during treatment (e.g., cyanotic skin)
• Patient intolerance, hypersensitivity, high pain sensation due to injury
• Connective tissue disorder
• Medications that thin blood or alter sensations
• Lymphedema or tissue edema or swelling
• Pregnancy
• Osteoporosis
• Rheumatoid arthritis, ankylosing spondylitis
• Diabetes, neuropathy, or polyneuropathy
• Direct pressure over face, eyes, arteries, veins, or nerves
• Pacemaker or insulin pumps (treatment around devices)
• Insect bite of unexplained origin
• Arterial and vascular inhibited function during treatment (e.g., cyanotic skin)
• Patient intolerance, hypersensitivity, high pain sensation due to injury
• Connective tissue disorders (e.g., Ehlers-Danlos syndrome, Marfan’s syndrome)
• Acute injury or infection (viral or bacterial), fever, or contagious condition
• Medications that thin blood or alter sensations
• Lymphedema or tissue edema or swelling
• Pregnancy (e.g., over abdomen)
• Osteoporosis (advanced)
• Rheumatoid arthritis, ankylosing spondylitis
• Diabetes, neuropathy, or polyneuropathy
• Congestive heart disease, circulatory disorders
• Bleeding disorders (Hemophilia)
• Thrombophlebitis or osteomyelitis
• Direct pressure over face, eyes, arteries, veins, or nerves
• Autoimmune disorders, reflex sympathetic dystrophy, or complex regional pain syndrome
Over the past 10 years, sports medicine professionals, researchers, and manufacturers have used different names to classify this intervention such as tissue flossing,3,5,13, 16,17,21,22,24‑26,32‑37 compression tissue flossing,4 voodoo floss,29 ankle flossing,31 floss bands,5,7,14 and Rockfloss®.2
To date, no formal description of tissue flossing has been proposed in the body of research evidence. Given the diversity of nomenclature, tissue flossing needs to have a
Table 2. Precautions for Tissue Flossing Table 3. Contraindications for Tissue FlossingPatient Reported Outcomes
Joint ROM, Muscle Length, and Tissue Stiffness
Tissue Flossing: A Commentary on Clinical Practice Recommendations
Pain/Delayed Onset of Muscle Soreness:
• Visual analog pain scale,37 numeric pain scale,38 Short Form McGill Pain Questionnaire II.42
Function/Disability:
• Lower Extremity Function Scale39 and Wrist/Hand Disability Index40
Joint ROM:
• Manual goniometer and digital ROM devices14 19,27,28
• Weight bearing lunge test16 20
Muscle Length:
• Knee: Ely’s test, active and passive knee extension tests21 23
• Lumbo-pelvic-hip complex: active and passive straight leg raise test, sit and reach test, modified Thomas test22,24 26
• Tissue stiffness/blood flow: ultrasonography,15 22 30 31 tensiomyography,32 myotonometry,35 acoustic radiation force impulse,10 and power doppler sonography10
Muscle and Athletic Performance
Muscle Performance:
• *Strength/Power: Isokinetic dynamometry14 15,23,26 28,33,35
• Neuromuscular activity: soleus h-reflex33
Athletic Performance:
• Counter movement jump: digital force plates or mats16 17,30,34
• Sprints: digital speed timing systems16,30 34
• Hop distance: single leg triple hop test, standing long jump21 23 41
• Jump landing: Landing error scoring system21
• Dynamic balance: Y-balance test, Biodex Isokinetic dynamometer21,23
*Strength/Power: Testing included isokinetic maximum voluntary contraction, maximum eccentric contraction, rate of force development, and peak torque.
working description to clearly communicate the intervention to fellow sports medicine professionals, other healthcare providers, researchers, and patients. Furthermore, a working description may provide a clear understanding of the intervention and may prevent confusion between tissue flossing and other interventions. Therefore, the authors propose the following working description of tissue flossing: "tissue flossing is an intervention that uses a compressive latex band wrapped around a body region at a specific stretch length, followed by movement of the body region to manipulate the skin, myofascia, muscles, tendons, and/or joint structures."
In summary, the existing body of tissue flossing research evidence lacks a clear description of the intervention. The proposed tissue flossing description is novel and should be considered a work-in-progress that can be updated over time as the knowledge and research in this area grows (Table 1).
Sports medicine professionals should use outcomes measures to assess the efficacy of their tissue flossing band intervention on their patients. Researchers have used different patient reported outcomes (PROs) and clinical outcomes to measure the post intervention changes of this intervention.3‑5 These outcomes and related research were discussed in the prior section on indications for tissue flossing. Table 4 provide a summary of common outcomes used in those studies with the related references.
In summary, sports medicine professionals should consider using similar PROs and clinical outcomes to measure the post treatment effects of their tissue flossing intervention. There is always a need to translate the research evi-
dence into clinical practice to optimize treatment results. Researchers would benefit from the use of outcomes from clinical practice to inform future research questions and study design. The outcome measures noted in this discussion have been used by tissue flossing researchers and may fit well into clinical practice.3‑5
Sports medicine professionals should consider the importance of monitoring the amount of tissue flossing band stretch pressure and the patient’s response during application. Several researchers have studied the efficacy of a tissue flossing intervention at various band stretch lengths measured as pressure (e.g., 100 to 295 mm Hg) or general intensity (e.g., from “low” to “high” tension).7,8,14,16‑18,24, 26,32,33 Researchers used ultrasound imaging (Philips iU22 Ultrasound, Bothell, WA, USA) to monitor limb occlusion pressure and hemodynamic responses during the intervention.8 Researchers have also used different pressure devices under the tissue floss band such as the PicoPress™ pressure sensor (Microlab Ellettronica Sas, Italy),32 Kikuhime™ pressure monitor (TT MediTrade, Sorø, Denmark),16,17,33, 34 Tekscan pressure sensor (Tekscan, South Boston, MA),24 AMI pressure sensor device (AMI Techno., Ltd. Japan),15,22 an adapted sphygmomanometer (generic),26 and a homemade pressure monitor using a bulb, valve, and plastic tube.14
Researchers have suggested that a tissue flossing intervention with low stretch pressure (100 to 150 mm Hg; based upon thigh circumference) may produce short term post intervention improvements in joint active ROM and muscle strength.14,25 Consequently, research groups studying
Table 4. Tissue Flossing Outcome Measuresdifferent tissue flossing band stretch pressures have documented adverse effect (e.g., pain, numbness, loss of ROM, decreased strength) with high band pressure (e.g., ≥ 200 mm Hg).3,14 Another group of researchers46 measured the blood supply to the biceps brachii using the Précisé 8008 (Ulrichstein, Germany) and documented an unusual physiological response. The researchers measured before and after a 2-minute tissue flossing intervention based upon a prior published protocol (e.g., 50% overlapping, 30-60% maximum band length) with no monitoring of stretch pressure.46 The researchers documented a large depression of blood perfusion to the biceps brachii after the intervention which was opposite of their expectations of a rapid perfusion of blood to the area.46 The researchers suggested that tissue flossing should be administered with caution and monitored due to these potential effects and until further validation research is conducted. Some researchers have explored the use of tissue flossing as a method of blood flow restriction training.7,8
Currently, there are no standard guidelines or methods to monitor and measure tissue flossing stretch pressure during application (e.g., soft tissue or joints) without having some digital or adapted pneumatic device.8 Some researchers have tried to use a patient reported numeric perceived tightness scale (0-10) but found that it was unreliable to track and document stretch pressure.47 Cheatham and Baker2 developed an exploratory clinical method to measure tissue flossing band tension force (Newtons) at different band elongation lengths. Their study methodology provided a simple way to quantify and document a tissue flossing intervention using band strength length and force. Other researchers7,23 have replicated these testing methods and documented favorable results. However, this quantification method still needs to be fully validated because sports medicine professionals and researchers may require an external device to monitor and measure band stretch pressure during treatment.
In summary, sports medicine professionals should consider the patient safety implications when using a tissue flossing band at different stretch lengths because the pressure cannot be measured without using a monitoring device.3 Researchers have suggested that higher band stretch pressure may create some injury risks, if not properly monitored. It appears that low stretch pressure may be the safest approach along with proper patient monitoring.3 The research noted in this section does have limitations but clearly alludes to the importance of patient safety. Observing the patient’s response and measuring band stretch pressure with a monitoring device may be the best method to ensure patient safety. Further research is warranted in this area.
Tissue flossing band hygiene is another clinical practice consideration that has not been discussed in the body of research evidence. A recent search revealed no published studies or commentaries on this topic. Other myofascial interventions, such as self-myofascial rolling and IASTM have
suggested published recommendations for hygiene practices.11,12 The following section will provide recommended cleaning and care practices for latex tissue flossing bands. These recommendations are adapted from published cleaning recommendations from the Center for Disease Control (CDC) and a major manufacturer of latex resistance bands.48,49
Based upon the CDC guidelines, tissue flossing bands would be considered a non-critical item (e.g., gym equipment) as the bands are in contact with intact skin and no mucous membranes or other sterile tissues.50,51 Noncritical items generally require an Environment Protection Agency (EPA) approved low-level chemical disinfectant to clean.49,51 The following proposed recommendations are a starting point to develop best practice standards for tissue flossing band hygiene and care. For general cleaning, it is recommended to hand wash the band with mild soap and water and avoid strong detergents. The band should not be cleaned and dried in a washing machine or dryer The tissue flossing band should lay flat when drying and talcum powder can be applied when dry If chlorinated water is used, the band should be rinsed with clean water and talcum powder applied when dry For disinfecting, it is recommended to use a lactic acid-based sanitizer (e.g., Clorox EcoClean™) or a product based on colloidal silver (e.g., Silver Guard®).48,50 Alcohol based sanitizers should not be used because they can degrade the band.48 For storage, it is recommended to store the band in a temperature-controlled area between 40-110° F (5 to 45° C) with less than 95% relative humidity and to avoid exposing the band to direct sunlight and contact with oils, solvents, or grease.48
Other recommended best practices include but are not limited to each patient having their own tissue flossing band/s, teaching patients how to care for their band/s, following manufacturer cleaning guidelines, and wearing the appropriate personal protective equipment (e.g., gloves, mask) during cleaning or disinfecting.48
In summary, the sports medicine professional should consider these hygiene and care recommendations as a starting point for best practices. Sports medicine professionals should have written hygiene and care guidelines for their work setting and for patients to ensure proper care of the tissue flossing bands.
This commentary provides a framework for the development of tissue flossing clinical standards and recommended best practices. The lack of clinical practice recommendations creates a challenge for sports medicine professionals and researchers. Sports medicine professionals may default to using their own preferred tissue flossing band intervention methods versus evidence-based sources. Researchers may also use unique methodology in their investigations that do not build on the existing body of evidence, creating a gap and making it challenging to determine best practices to maximize treatment effect.3‑6 The following section provides a summary of key points from this commentary
Researchers have documented post intervention changes from tissue flossing for different indications while a small amount have documented nonsignificant results.3‑5 When interpreting these results, sports medicine professionals should also consider the variations in study methodology including sample population, sample size, treatment application (e.g., treatment parameters), treatment location (e.g., soft tissue or joint), manufactured tissue floss bands, main study outcome measures (e.g., weight-bearing lunge test, knee flexion ROM), and short-term investigations. For example, the reported treatment effect sizes have often been classified as small to medium for joint ROM, indicating the overall effect of tissue flossing may be limited.3‑6 However, the reported treatment effect sizes varied by study and intervention location and measures,3‑5 further emphasizing the need for a clear description of the intervention and well-designed research with clear and consistent outcomes to establish a sound body of research evidence. Overall, the body of research evidence is still emerging with a need for higher quality research and more longitudinal investigations.
Currently, there is no consensus on precautions and contraindications for a tissue flossing intervention. The precautions and contraindications noted in this commentary are not all inclusive but a starting point for sports medicine professionals and researchers to consider when using tissue flossing with different patients. It is important to note that some medical conditions or clinical presentations can be both a precaution and contraindication depending on the patient. Sports medicine professionals and researchers should always consider patient safety when using tissue flossing within their clinical practice or research study
Currently, there is no consensus among sports medicine professionals and researchers on a clear description of tissue flossing. This has produced different terms in the nomenclature without a clear description of the intervention. The proposed working description is a starting point. Sports medicine professionals and researchers are encouraged to build upon this working description by refining and updating these topics as the body of knowledge grows in this area.
Sports medicine professionals and researchers should follow methodological reporting guidelines, such as the Consensus on Exercise Reporting Template (CERT) to document their tissue flossing intervention. The CERT provides an organized process of reporting clinical exercise interventions using a 16-item checklist (in seven categories).52 Key sections of the checklist include but are not limited to what materials (e.g., equipment) were used, who provided the intervention, how was it delivered, location (e.g., setting), and when and how much (e.g., dosage) of the intervention. The CERT checklist is often used in conjunction
with more comprehensive reporting guidelines (e.g., CONSORT statement for randomized controlled trials.).53 The use of reporting guidelines to guide the description of tissue flossing methodology will enhance technique replication and our understanding of treatment effectiveness.52,53
Researchers have used different tissue flossing PROs and clinical measures in their investigations. Sports medicine professionals are encouraged to integrate such patient and clinical measures (presented in Table 4) into their practice, with an emphasis on selecting valid measures relevant to the specific patient and situation. This may help with documenting and tracking the efficacy of the tissue flossing intervention. There is a need to translate research to clinical practice and using such outcome measures will assist in this process.
Currently, there are no evidence-based guidelines or best practices for patient safety monitoring during a tissue flossing intervention. There may be a risk for injury with higher levels of band stretch pressure. Sports medicine professionals may need to monitor both the patient’s response and amount of band stretch pressure using a monitoring device during application.3,14
Tissue flossing band hygienic practices and care have not been documented in the research evidence. The suggested best practices are a starting point for sports medicine professionals and researchers. Tissue flossing bands (made of latex) require unique cleaning and care procedures when compared to other myofascial interventions such as selfmyofascial rollers or IASTM instruments.11,12 Perhaps, the best hygiene and care strategy is to encourage patients to have their own set of tissue flossing bands and follow manufacturer recommendations for tissue band hygiene and care.
This clinical commentary discusses proposed tissue flossing clinical practice recommendations for indications, precautions and contraindications, intervention description, patient assessment, patient monitoring, and band hygiene and care. Sports medicine professionals and researchers should consider this commentary as a starting point for further developing such standards and recommended best practices for tissue flossing.
The authors report no conflict of interest with the subject of this manuscript.
Submitted: June 22, 2023
© The Author(s)
Tissue Flossing: A Commentary on Clinical Practice Recommendations
CDT, Accepted: February 07, 2024
This is an open-access article distributed under the terms of the Creative Commons Attribution 4.0 International License (CCBY-NC-4.0). View this license’s legal deed at https://creativecommons.org/licenses/by-nc/4.0 and legal code at https://creativecommons.org/licenses/by-nc/4.0/legalcode for more information.
1. Starrett K, Cordoza G. Becoming a Supple Leopard: The Ultimate Guide to Resolving Pain, Preventing Injury, and Optimizing Athletic Performance. Victory Belt Publishing; 2013.
2. Cheatham SW, Baker R. Quantification of the rockfloss® floss band stretch force at different elongation lengths. J Sport Rehabil 2020;29(3):377-380. doi:10.1123/jsr.2019-0034
3. Konrad A, Močnik R, Nakamura M. Effects of tissue flossing on the healthy and impaired musculoskeletal system: A scoping review Front Physiol 2021;12:666129. doi:10.3389/fphys.2021.666129
4. Kielur DS, Powden CJ. Changes of ankle dorsiflexion using compression tissue flossing: A systematic review and meta-analysis. J Sport Rehabil. 2020;30(2):306-314. doi:10.1123/jsr.2020-0129
5. Jianhong G, Chee CS, Seng TJ, Zaremohzzabieh Z, Samsudin S. The effect of tissue flossing technique on sports and injury prevention and rehabilitation: A systematic review of recent research. Int J Hum Mov Sports Sci. 2021;9(6):1157-1173. doi:10.13189/saj.202 1.090611
6. Rodrigues S, Forte P, Dewaele E, et al. Effect of blood flow restriction technique on delayed onset muscle soreness: A systematic review. Medicina. 2022;58(9):1154. doi:10.3390/medicina58091154
7 Lee Y, Choi J. A study to identify the optimum forearm floss band intensity in 29 young adults performing blood flow restriction training. Med Sci Monit 2022;28:e935771. doi:10.12659/msm.935771
8. Winchester LJ, Blake MT, Fleming AR, et al. Hemodynamic responses to resistance exercise with blood flow restriction using a practical method versus a traditional cuff-inflation system. Int J Environ Res Public Health 2022;19(18):11548. doi:10.3390/ijerph1 91811548
9. Uchida MC, Nishida MM, Sampaio RAC, Moritani T, Arai H. Thera-band(®) elastic band tension: Reference values for physical activity J Phys Ther Sci 2016;28(4):1266-1271. doi:10.1589/jpts.28.1266
10. Agustín RMS, Medina-Mirapeix F, Gacto-Sánchez M, Cánovas-Ambit G, Vecchia AAD Mechanical evaluation of the resistance of theraband clx. J Sport Rehabil 2023;32(2):220-226. doi:10.1123/jsr.2022-01 15
11. Cheatham SW, Baker R, Kreiswirth E. Instrument assisted soft-tissue mobilization: A commentary on clinical practice guidelines for rehabilitation professionals. Int J Sports Phys Ther 2019;14(4):670-682. doi:10.26603/ijspt20190670
12. Cheatham SW, Stull KR. Roller massage: A commentary on clinical standards and survey of physical therapy professionals- part 1. Int J Sports Phys Ther. 2018;13(4):763-772. doi:10.26603/ijspt201 80763
13. Kelly CF, Oliveri Z, Saladino J, et al. The acute effect of tissue flossing on pain, function, and perception of movement: A pilot study Int J Exerc Sci 2023;16(3):855-865.
14. Galis J, Cooper DJ. Application of a floss band at differing pressure levels: Effects at the ankle joint. J Strength Cond Res 2022;36(9):2454-2460. doi:10.151 9/jsc.0000000000003833
15. Kaneda H, Takahira N, Tsuda K, et al. The effects of tissue flossing and static stretching on gastrocnemius exertion and flexibility. Isokin Exerc Sci 2020;28(2):205-213. doi:10.3233/ies-192235
16. Driller M, Mackay K, Mills B, Tavares F. Tissue flossing on ankle range of motion, jump and sprint performance: A follow-up study. Phys Ther Sport. 2017;28:29-33. doi:10.1016/j.ptsp.2017.08.081
17 Driller MW, Overmayer RG. The effects of tissue flossing on ankle range of motion and jump performance. Phys Ther Sport 2017;25:20-24. doi:1 0.1016/j.ptsp.2016.12.004
18. Vogrin M, Novak F, Licen T, Greiner N, Mikl S, Kalc M. Acute effects of tissue flossing on ankle range of motion and tensiomyography parameters. J Sport Rehabil. 2020;30(1):129-135. doi:10.1123/jsr.2019-01 60
19. Stevenson P, Stevenson R, Duarte K. Acute effects of the voodoo flossing band on ankle range of motion. J Med Biomed Appl Sci 2019;7(6):244-253.
20. Huang YS, Lee CL, Chang WD, Chang NJ. Comparing the effectiveness of tissue flossing applied to ankle joint versus calf muscle on exercise performance in female adults: An observational, randomized crossover trial. J Bodyw Mov Ther. 2023;36:171-177 doi:10.1016/j.jbmt.2023.07.012
21. Wu SY, Tsai YH, Wang YT, et al. Acute effects of tissue flossing coupled with functional movements on knee range of motion, static balance, in single-leg hop distance, and landing stabilization performance in female college students. Int J Environ Res Public Health 2022;19(3):1427 doi:10.3390/ijerph19031427
22. Kaneda H, Takahira N, Tsuda K, et al. Effects of tissue flossing and dynamic stretching on hamstring muscles function. J Sports Sci Med 2020;19(4):681-689.
23. Chang NJ, Hung WC, Lee CL, Chang WD, Wu BH. Effects of a single session of floss band intervention on flexibility of thigh, knee joint proprioception, muscle force output, and dynamic balance in young adults. Applied Sci 2021;11(24):12052. doi:10.3390/a pp112412052
24. Maust Z, Bradney D, Collins SM, Wesley C, Bowman TG. The effects of soft tissue flossing on hamstring range of motion and lower extremity power. Int J Sports Phys Ther. 2021;16(3):689-694. do i:10.26603/001c.24144
25. Vogrin M, Kalc M, Ličen T Acute effects of tissue flossing around the upper thigh on neuromuscular performance: A study using different degrees of wrapping pressure. J Sport Rehabil 2020;30(4):601-608. doi:10.1123/jsr.2020-0105
26. Konrad A, Bernsteiner D, Budini F, et al. Tissue flossing of the thigh increases isometric strength acutely but has no effects on flexibility or jump height. Eur J Sport Sci 2021;21(12):1648-1658. doi:1 0.1080/17461391.2020.1853818
27. Angelopoulos P, Mylonas K, Tsepis E, Billis E, Vaitsis N, Fousekis K. The effects of instrumentassisted soft tissue mobilization, tissue flossing, and kinesiology taping on shoulder functional capacities in amateur athletes. J Sport Rehabil 2021;30(7):1028-1037 doi:10.1123/jsr.2020-0200
28. Plocker D, Wahlquist B, Dittrich B. Effects of tissue flossing on upper extremity range of motion and power Int J Exercise Sci: Conference Proceeding 2015;12(1):37.
29. Kiefer BN, Lemarr KE, Enriquez CC, Tivener KA, Daniel T A pilot study: Perceptual effects of the voodoo floss band on glenohumeral flexibility. Int J Athl Ther Train 2017;22(4):29-33. doi:10.1123/ijatt.2 016-0093
30. Klich S, Smoter M, Michalik K, et al. Foam rolling and tissue flossing of the triceps surae muscle: an acute effect on Achilles tendon stiffness, jump height and sprint performance – a randomized controlled trial. Res Sports Med 2022;2022:1-14. doi:10.1080/15 438627.2022.2125317
31. Pasurka M, Lutter C, Hoppe MW, et al. Ankle flossing alters periarticular stiffness and arterial blood flow in asymptomatic athletes. J Sports Med Phys Fitness. 2020;60(11):1453-1461. doi:10.23736/s0 022-4707.20.10992-7
32. Paravlic AH, Segula J, Drole K, Hadzic V, Pajek M, Vodicar J. Tissue flossing around the thigh does not provide acute enhancement of neuromuscular function. Front Physiol 2022;13:870498. doi:10.3389/ fphys.2022.870498
33. Kalc M, Mikl S, Žökš F, Vogrin M, Stöggl T. Effects of different tissue flossing applications on range of motion, maximum voluntary contraction, and hreflex in young martial arts fighters. Front Physiol. 2021;12:752641. doi:10.3389/fphys.2021.752641
34. Mills B, Mayo B, Tavares F, Driller M. The effect of tissue flossing on ankle range of motion, jump, and sprint performance in elite rugby union athletes. J Sport Rehabil 2020;29(3):282-286. doi:10.1123/jsr.2 018-0302
35. Hadamus A, Jankowski T, Wiaderna K, et al. Effectiveness of warm-up exercises with tissue flossing in increasing muscle strength. J Clin Med. 2022;11(20):6054. doi:10.3390/jcm11206054
36. Hadamus A, Kowalska M, Kędra M, Wiaderna K, Białoszewski D. Effect of hamstring tissue flossing during warm-up on sit and reach performance. J Sports Med Phys Fitness 2022;62(1):51-55. doi:10.237 36/s0022-4707.21.11828-6
37 Prill R, Schulz R, Michel S. Tissue flossing: A new short-term compression therapy for reducing exercise-induced delayed-onset muscle soreness. A randomized, controlled and double-blind pilot crossover trial. J Sports Med Phys Fitness 2019;59(5):861-867. doi:10.23736/s0022-4707.18.087 01-7
38. Gorny V, Stöggl T [tissue flossing as a recovery tool for the lower extremity after strength endurance intervals]. Sportverletz Sportschaden 2018;32(1):55-60. doi:10.1055/s-0043-122782
39. Borda J, Selhorst M. The use of compression tack and flossing along with lacrosse ball massage to treat chronic achilles tendinopathy in an adolescent athlete: A case report. J Man Manip Ther. 2017;25(1):57-61. doi:10.1080/10669817.2016.115940 3
40. Cage A, Warner B, Stevenson P, Arce-Esquivel A. Flossing bands to treat keinböck’s disease in a collegiate men’s basketball player: A case report. Int Phys Med Rehabil J. 2018;3(2):166-168.
41. Weber P Flossing: An alternative treatment approach to osgood-schlatter’s disease: Case report of an adolescent soccer player J Bodyw Mov Therap 2018;22(4):860-861. doi:10.1016/j.jbmt.2018.09.043
42. García-Luna MA, Cortell-Tormo JM, GonzálezMartínez J, García-Jaén M. The effects of tissue flossing on perceived knee pain and jump performance: A pilot study. Int J Hum Mov Sports Sci. 2020;8(2):63-68. doi:10.13189/saj.2020.080203
43. Cheatham S, Martinez R, Montalvo A, et al. Comparison of roller massage, instrument assisted soft-tissue mobilization, and floss band on passive knee motion among inexperienced individuals. Clin Pract Athl Train. 2020;3(3):24-36. doi:10.31622/2020/ 0003.3.5
44. Carlson SK, Rife G, Williams ZF. Comparing the effects of tissue flossing and instrument assisted soft tissue mobilization on ankle dorsiflexion. 2019: The Research and Scholarship Symposium. 5.
45. Marocolo M, Billaut F, da Mota GR. Ischemic preconditioning and exercise performance: An ergogenic aid for whom? Opinion. Front Physiol 2018;9. doi:10.3389/fphys.2018.01874
46. Pavlů D, Pánek D, Kuncová E, Thung JS. Effect of blood circulation in the upper limb after flossing strategy. Appl Sci. 2021;11(4):1634. doi:10.3390/app1 1041634
47 Bell ZW, Dankel SJ, Spitz RW, Chatakondi RN, Abe T, Loenneke JP. The perceived tightness scale does not provide reliable estimates of blood flow restriction pressure. J Sport Rehabil 2019;29(4):516-518. doi:10.1123/jsr.2018-0439
48. Rolyan. Roylan exercise band-use & storage instructions 2023. https://www.performancehealth.co m/amfile/file/download/file/5351/product/127345/
49. Nielsen A, Kligler B, Koll BS. Safety protocols for Gua sha (press-stroking) and Baguan (cupping). Complement Ther Med 2012;20(5):340-344. doi:10.10 16/j.ctim.2012.05.004
50. Grace Ho KL, Luzuriaga DA, Rodde KM, Tang S, Phan C. Efficacy of a novel sanitizer composed of lactic acid and peroxyacetic acid against single strains of nonpathogenic escherichia coli k-12, listeria innocua, and lactobacillus plantarum in aqueous solution and on surfaces of romaine lettuce and spinach. J Food Prot. 2011;74(9):1468-1474. doi:1 0.4315/0362-028x.jfp-11-110
51. Veiga-Malta I. Preventing healthcare-associated infections by monitoring the cleanliness of medical devices and other critical points in a sterilization service. Biomed Instrumentation Technol 2016;50(Suppl 3):45-52. doi:10.2345/0899-8205-50.s 3.45
52. Page P, Hoogenboom B, Voight M. Improving the reporting of therapeutic exercise interventions in rehabilitation research. Int J Sports Phys Ther 2017;12(2):297-304.
53. Slade SC, Dionne CE, Underwood M, Buchbinder R. Consensus on exercise reporting template (cert): Explanation and elaboration statement. Br J Sports Med. 2016;50(23):1428-1437. doi:10.1136/bjsports-20 16-096651
Rachel K Straub, Christopher M Powersa
Keywords: kinetics, kinematics, biomechanics, squatting, clinical commentary https://doi.org/10.26603/001c.94600
The squat is one of the most frequently prescribed exercises in the rehabilitative setting. Performance of the squat can be modified by changing parameters such as stance width, foot rotation, trunk position, tibia position, and depth. An understanding of how the various squatting techniques can influence joint loading and muscular demands is important for the proper prescription of this exercise for various clinical conditions. The purpose of this clinical commentary is to discuss how the biomechanical demands of the squat can be influenced by various modifiable parameters. General recommendations for specific clinical conditions are presented.
5
Squatting is an essential movement pattern for activities of daily living (i.e., toileting and getting into or out of a chair) and various athletic tasks. As such, the squat exercise is commonly used in rehabilitation and sport performance settings to strengthen the primary lower extremity muscle groups (i.e., hip extensors and knee extensors).1‑5 In addition, the squat exercise requires a high level of recruitment from the trunk muscles to provide stabilization for the spine and torso.4,6,7
The squat exercise can be highly variable in its execution. For example, the squat can be adapted by modifying trunk position, tibia position, foot rotation, stance width, and depth. Given that each modifiable factor can influence the biomechanics of the squat (i.e., muscular demands, joint loading, etc.), it is not surprising that the literature is conflicting when recommending various squatting techniques for different clinical situations.4,8 Interpretation of research related to squatting is difficult owing to the fact that many studies fail to control for the various modifiable parameters when assessing the influence of a specific variable.
It is important that clinicians be mindful of the various interactions among the modifiable parameters so that cor-
rect clinical recommendations can be made. As such, the purpose of this clinical commentary is to discuss how the biomechanical demands of the squat can be influenced by various modifiable parameters. General recommendations for specific clinical conditions are presented. It is hoped that the information presented will assist clinicians in the appropriate prescription of the squat exercise for patients with various diagnoses.
The moments at the hip and knee during squatting are highly influenced by the orientation of the trunk, which in turn affects the center of mass of the body 9,10 During a typical squat, the resultant ground reaction force vector passes anterior to the hip and posterior to the knee, thereby creating flexion moments at both joints (Figure 1).9 Muscular actions of the hip and knee extensors are required to generate extensor moments to counteract these external moments. Moving the trunk from a more upright position (Figure 1A) to more forward position (Figure 1B) shifts the resultant ground reaction force vector anteriorly, resulting in an increase in the hip flexion moment while simultaneously decreasing the knee flexion moment.11 Conversely, moving
Email: powers@usc.edu a
Corresponding Author:
Christopher M. Powers, PT, PhD, FACSM, FAPTA
USC Division of Biokinesiology & Physical Therapy
1540 E. Alcazar St. CHP-155
Los Angeles, CA 90089-9006
Phone: 323.442.1928
Fax: 323.442.1515
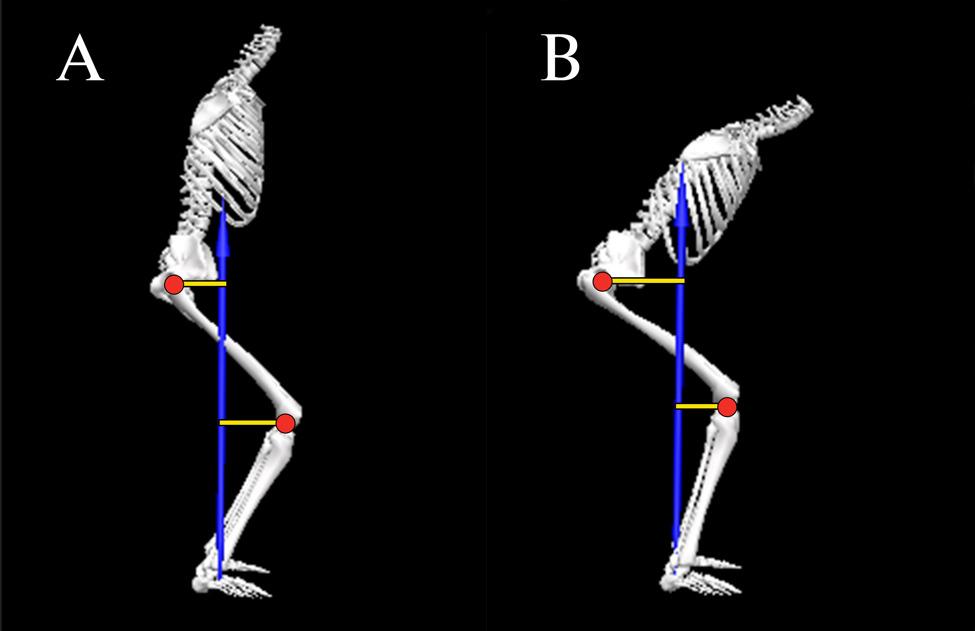
the trunk from a forward position (Figure 1B) to more upright position (Figure 1A) shifts the resultant ground reaction force vector posteriorly, thereby decreasing the hip flexion moment while simultaneously increasing the knee flexion moment.11
Apart from its influence on the hip and knee flexion moments, squatting with a forward trunk has an impact on the lumbar spine flexion moment. Generally speaking, the greater the forward trunk inclination, the greater the muscular demand on the back extensors to stabilize the trunk.12 It should be noted however, that forward inclination of the trunk can be obtained through flexion of the hip or flexion of the lumbar spine (Figure 2).13 Attainment of a forward trunk position using lumbar spine flexion (Figure 2A) results in decreased tolerance to compressive loads14 and lumber spine anterior shear forces as compared to when forward trunk inclination is achieved with a neutral spine position (Figure 2B).15 Maintaining a neutral spine position increases the moment arm for the spinal extensors thereby allowing better control of compressive loads and shear forces.14,15
Compared to trunk inclination, inclination of the tibia during squatting has an opposite influence on the knee flexion moment.9,10,16‑18 Moving the tibia from a more upright position (Figure 3A) to more forward position (Figure 3B) shifts the knee joint center further away from the resultant ground reaction force vector, thereby increasing the knee flexion moment. Conversely, moving the tibia from a forward position (Figure 3B) to more upright position (Figure
3A) shifts the knee joint center closer to the resultant ground reaction force vector, thereby decreasing the knee flexion moment.
Forward tibia inclination can be achieved by either ankle dorsiflexion (with the foot flat on the floor) or squatting with the heels off the floor (i.e., using an external lift under the rearfoot or weightlifting shoes with an elevated heel).19 In general, elevating the heels during squatting facilitates a greater degree of forward tibia inclination, thereby increasing the knee flexion moment and the demand on the quadriceps.19,20 It should be noted however, that the forward tibia position when squatting with the heels elevated can occur without a corresponding increase in ankle dorsiflexion.
The degree of foot rotation during squatting can be accomplished by hip external rotation, knee external rotation, or a combination of both. The degree of toe out influences the frontal and transverse plane moments at the knee while having a negligible effect on the sagittal plane moments. For example, rotating the feet outward 30° has been reported to decrease the valgus moment at the knee by 50% while simultaneously increasing the varus moment by 80%.21 In addition, rotating the feet outward 30° decreases the external rotation moment at the knee by 20% when compared to a neutral stance.21
From a muscle recruitment standpoint, rotation of the foot outward 30° has no effect on activation of the quadriceps, hamstrings, or gastrocnemius when compared to a neutral foot position.2,22 Similarly, varying rotations of the
Figure 1. Sagittal plane orientation of the trunk influences the external moments at the hip and knee. (A) Squatting with the trunk in a more upright position increases the knee flexion moment while decreasing the hip flexion moment. (B) Moving the trunk forward increases the hip flexion moment while decreasing the knee flexion moment.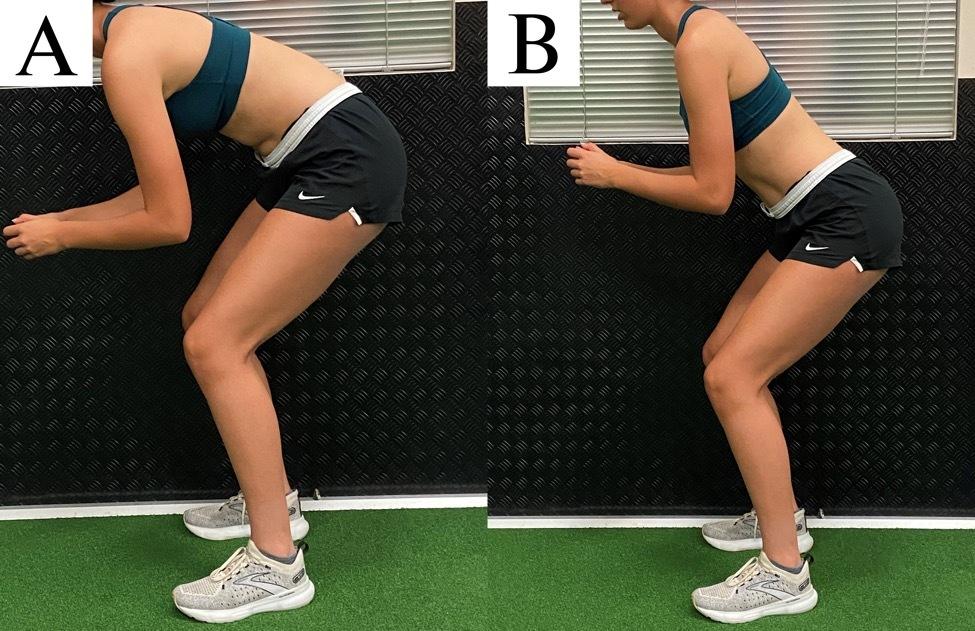
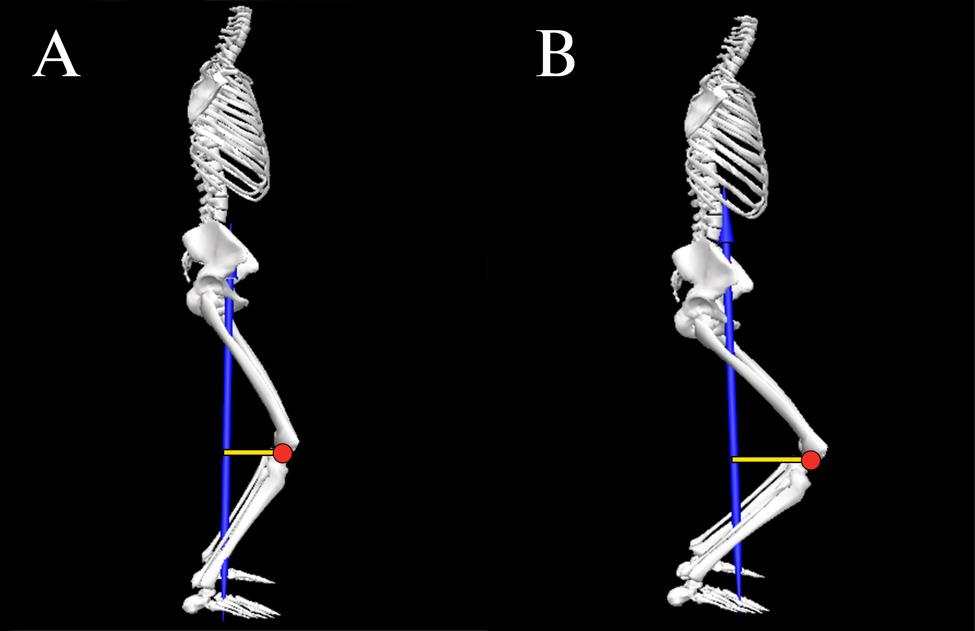
tibia and femur from 30° inward to 80° outward has no effect on quadriceps activity 23 However, squatting with the hip externally rotated 30° to 50° has been reported to increase hip adductor activity compared to a neutral stance by 17% and 23% respectively (neutral: 13% of maximum
voluntary isometric contraction [MVIC] vs. 17% and 23% MVIC for 30° and 50° rotation, respectively).24
Figure 2. Forward inclination of the trunk that is achieved by spine flexion (A) results in decreased tolerance to compressive loads and less control of anterior shear forces as compared to when forward trunk inclination is achieved with a neutral spine position (B). Figure 3. Sagittal plane orientation of the tibia influences the external moment at the knee. (A) Squatting with the tibia in a more upright position decreases the knee flexion moment. (B) Moving the tibia forward increases the knee flexion moment.For the purposes of this perspective, the authors operationally define stance width as narrow (75% to 100% shoulder width), medium (100% to 150% shoulder width), or wide (150% to 200% shoulder width). With respect to the frontal and transverse planes, a wide stance results in greater knee valgus moments (23%)25 and higher hip external rotation moments (19%-37%) when compared to narrow/medium stance squats.26 In terms of the sagittal plane, however, the impact of stance width is conflicting.25‑27 Compared to a narrow/medium stance, the knee flexion moment during wide stance squatting has been reported to be higher (69%-80%),27 lower (11%),25 or not different.26 Similarly, the hip flexion moment during wide stance squatting has been reported to be higher (10%-48%)26,27 or not different compared to narrow/medium stance squatting.25 The conflicting results among studies can be explained by how authors controlled for other modifiable factors such as trunk and tibia orientation. For example, performing a wide stance squat with the trunk inclined would yield a different result than if the squat was performed with the trunk more upright.
From a muscle recruitment standpoint, a medium/wide stance squat has been reported to result in higher gluteus maximus activity (13%-61%)28,29 and 18% lower gastrocnemius activity (14% vs. 17% MVIC) compared to narrow/ medium stance squats.2 Stance width does not appear to influence hamstring,28,29 quadriceps,28,29 or gluteus medius activity.29 In regards to hip adductor recruitment, stance width does not influence overall muscle activation.29 However, if the descending and ascending phases are analyzed separately, a wider stance increases hip adductor activity during the accent phase of squatting compared to the descent phase by approximately 50%.28
For the purposes of this perspective, the authors operationally define squat depth as partial/shallow (0°-90° knee flexion), medium (90°-110° knee flexion or thigh parallel to floor), or full/deep (110°-135° knee flexion). Generally speaking, the knee flexion moment tends to steadily increase from an upright position to maximum knee flexion during squatting.30‑32 Similarly, the hip flexion moment also increases with squat depth.32 However, the increase in the knee flexion moment with greater squat depth is not consistent across studies,33,34 and can be affected by the trunk and tibia orientation. For example, if the increase in trunk inclination with increasing depth is more pronounced than the increase in tibia inclination, this could potentially result in a relatively higher hip flexion moment relative to the knee flexion moment at higher depths. Conversely, if the increase in tibia inclination with increasing depth is more pronounced than the increase in trunk inclination, this could potentially result in a higher knee flexion moment relative to the hip flexion moment at greater squatting depths.
Apart from the influence of squat depth on hip and knee moments, studies examining muscle recruitment with in-
creasing depth are conflicting. In regards to quadriceps activity, some studies have reported an increase in EMG activity with squat depth (29%),35 while others have not.1, 5,36 Similarly, evidence related to hamstring activity also is conflicting, as studies have reported no change1,5,35 or a slight decrease in activation (absolute difference: 12% MVIC) with increasing squat depth.36 With respect to gluteus maximus, activity has been shown to increase from shallow to medium depth squatting by 65%1 but what happens thereafter is controversial. Compared to medium depth squats, gluteus maximus activity has been reported to be similar,5 or 25% greater with deep squats (28% vs. 35% MVIC).1 When comparing partial to deep squats, gluteus maximus activity has been reported to be higher with partial depths (absolute difference: 29% MVIC).36 As noted above, failure to account for trunk and tibia position with deep squatting likely underlies the inconsistent findings among studies.
From a joint motion standpoint, the primary limitation to deep squatting is the amount of available hip flexion. When end range of hip flexion is reached during squatting, a posterior pelvic tilt will occur (Figure 4). The posterior rotation of the pelvis is the result of the femur compressing into the acetabulum.37 Given that posterior pelvic tilt is coupled with lumbar spine flexion,37,38 compressive and shear forces occur at the lumbar spine.14,15,39 The fact that lumbar erector spinae activity does not increase beyond 90° of knee flexion,36 suggests that passive structures (i.e., posterior longitudinal ligament) provide the resistance to the spine flexion moment.
As noted above, inclination of the trunk and tibia have opposite effects on the knee flexion moments and therefore the demand on the quadriceps. Forward inclination of the tibia increases the knee flexion moment, while forward trunk inclination decreases the knee flexion moment. As such, considering the degree of tibia inclination without considering the degree of trunk inclination can result in erroneous interpretation of the biomechanical demand at the knee. For example, the increase in the knee flexion moment resulting from inclination of the tibia could be offset by forward inclination of the trunk.10 Therefore, the relationship between trunk and tibia inclination may be a better way to characterize the biomechanical demands of the knee extensors during squatting.
Evidence in support of this premise is provided by Barrack et al., who demonstrated that the relative demand of the hip and knee extensors during squatting could be predicted based on the relative inclination of the trunk and tibia.11 Specifically, the authors reported that the difference between sagittal plane inclination of the trunk and sagittal plane inclination of the tibia (i.e., trunk-tibia angle) at peak knee flexion was predictive of the average hip/ knee flexion moment ratio during the decent phase of squatting. The regression model indicated that a trunktibia angle of -8° resulted in a hip/knee flexion moment ratio equal to 1.0.11 When the degree of trunk inclination
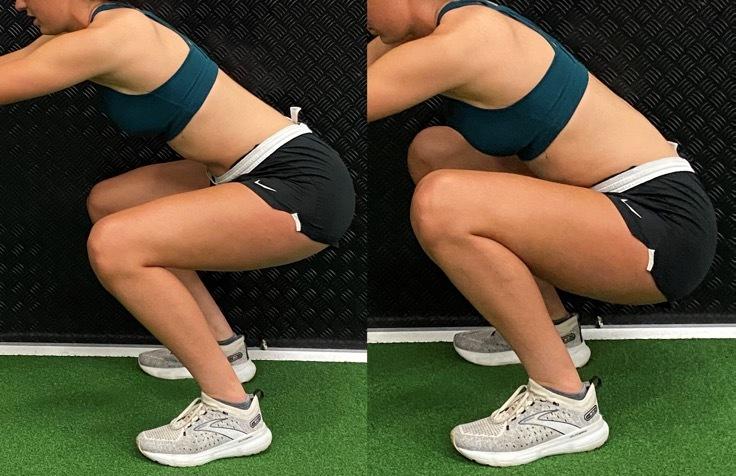
exceeded the degree of tibia inclination (i.e., trunk-tibia angle > 0), a hip extensor bias squat was observed (i.e., hip/ knee flexion moment ratio > 1.0). Conversely, when tibia inclination exceeded trunk inclination (by at least 8°), the squat became knee extensor biased (i.e., hip/knee flexion moment ratio < 1.0).11
Based on the findings of Barrack et al., it is possible to characterize the relative demand of the hip and knee extensors using the trunk-tibia inclination difference.11 When the degree of trunk inclination exceeds the degree of tibia inclination by 10°, a hip extensor bias can be inferred (Figure 5A). When the degree of tibia inclination exceeds the degree of trunk inclination by 10°, a knee extensor bias squat can be inferred (Figure 5B). In situations where the degree of trunk and tibia inclination are within 10° or each other, the relative demands on the hip and knee extensors can be considered equal (i.e., neutral bias) (Figure 5C).
The orientation of the trunk relative to the tibia (and therefore the hip/knee flexion moment ratio) can be influenced by the location of the applied load. For example, when the load is placed anteriorly (i.e., barbell front squat or goblet squat), the trunk is typically held in a more upright position. Conversely, a traditional barbell back squat typically is performed with greater trunk flexion.4,40 Therefore, it is not surprising that studies have reported differing muscular demands during these squat types. Back squats are associated with higher hip flexion moments, whereas front squats exhibit higher knee flexion moments, assuming the same absolute load.40
When prescribing the squat as a therapeutic exercise, the desired clinical outcome needs to be considered. For ex-
ample, knee extensor bias squatting may be indicated for patients with quadriceps weakness. In contrast, performing the squat with a hip extensor bias may be preferred if the goal is to the increase strength of the hip musculature. Based on the literature reviewed above, recommendations for performing the squat exercise for various clinical conditions are presented below (Table 1).
Clinical guidelines for persons with PFP advocate for hip and knee extensor strengthening.41 During the acute phase of the rehabilitation process, hip biased squats should be considered to reduce the demand on the quadriceps. This is important as quadriceps force contributes directly to patellofemoral joint reaction force and patellofemoral joint stress.42 During the sub-acute or recovery phase, squats can be progressed as tolerated to be more neutral biased or even quadriceps biased by modifying the trunk-tibia relationship.
During the acute phase, gluteus maximus activation should be emphasized as this muscle controls hip adduction and internal rotation, motions known to contribute to patellofemoral joint stress and PFP 43,44 Increased gluteus maximus activation can be achieved through the use of wider stance squats,26‑29 as well as external band resistance around the thighs.45,46 However, a squat stance that exceeds 150% shoulder width may result in elevated knee valgus moments.25 During the sub-acute or recovery phase, transitioning to more narrow/medium stance squats will promote greater tibial inclination47 and a quadriceps bias. Regardless of phase, a toe out position should be considered as this will result in a decrease in the knee valgus moment.21
Figure 4. Squatting to a depth that exceeds available hip flexion results in a posterior pelvic tilt.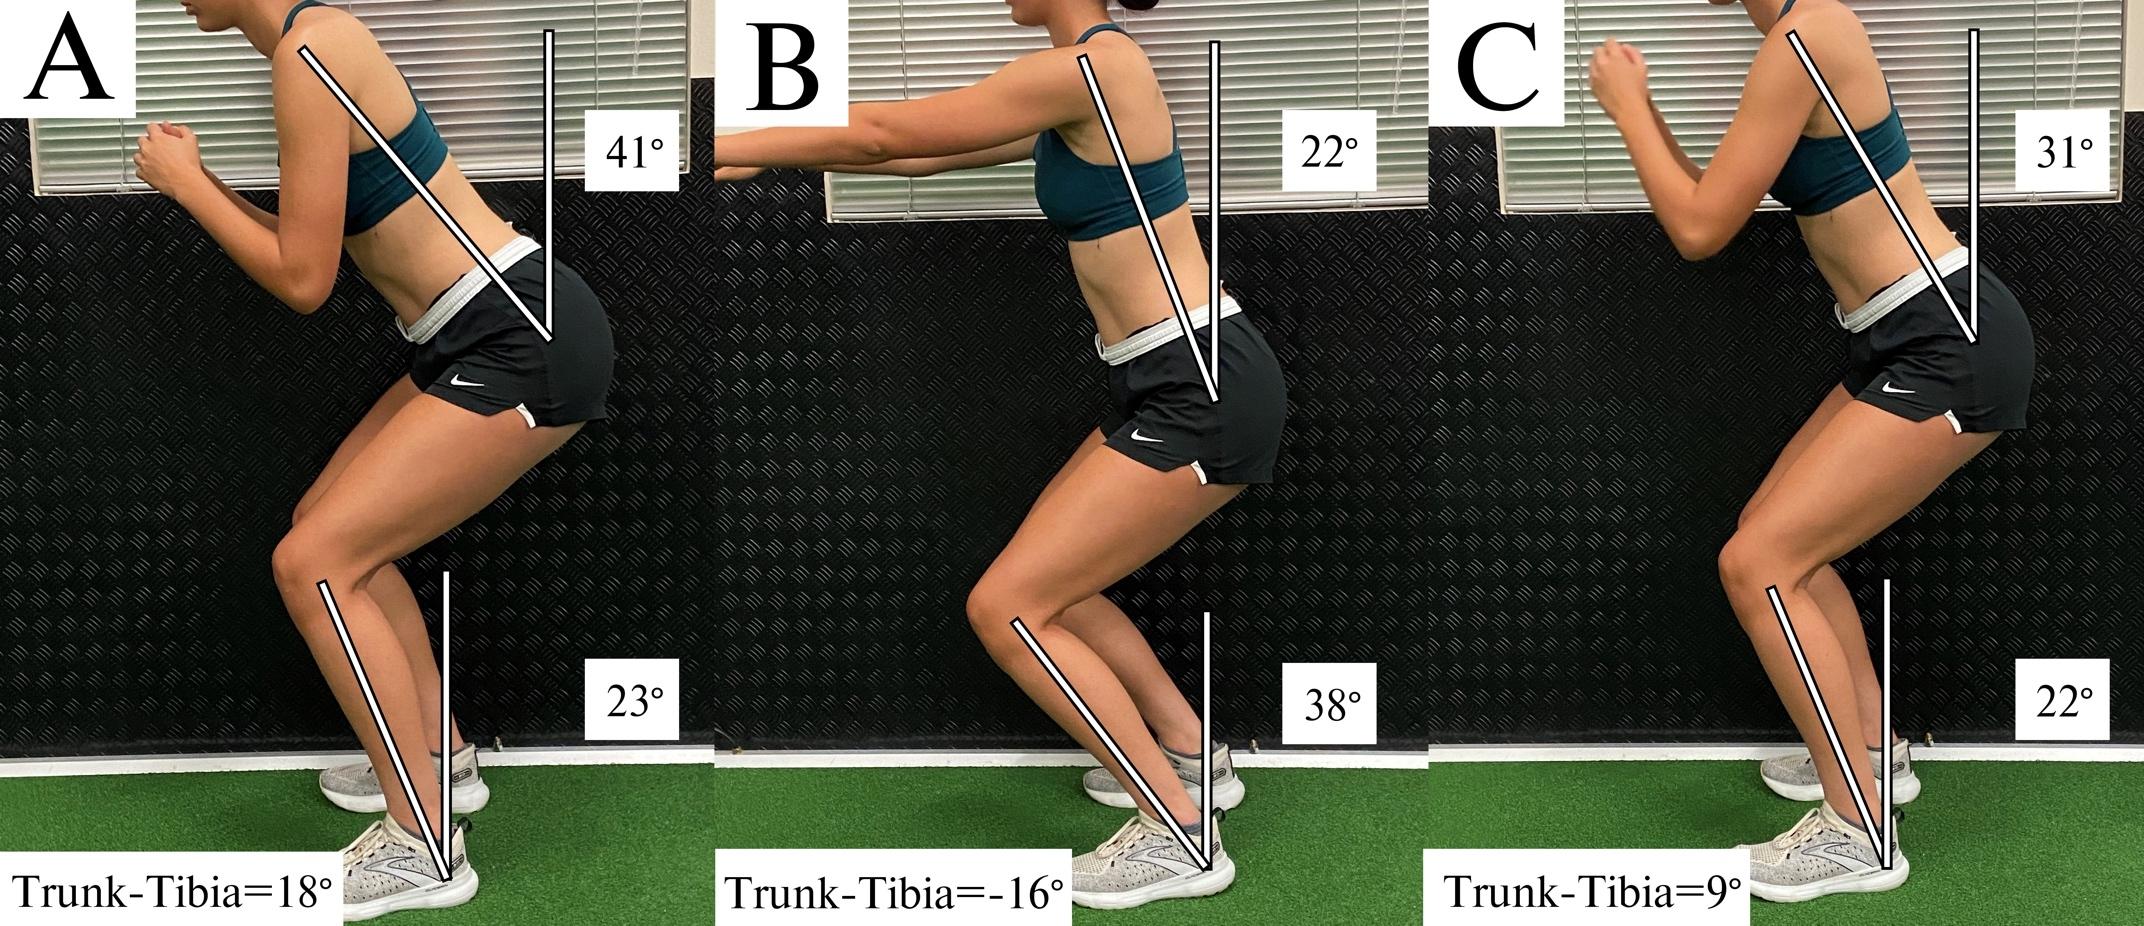
Another important consideration for the patient with patellofemoral pain is squat depth. Patellofemoral joint stress steadily increases from partial to medium depth squatting (0° to 90°).42 The increase in patellofemoral joint stress is the result of a steadily increasing patellofemoral joint reaction force that is more pronounced than the increase in contact area as the knee flexes.42 Generally speaking, shallow-medium depth squats should be prescribed for the patient with patellofemoral pain to minimize joint stress. Furthermore, there is evidence that shallow squats may be more desirable for gluteus maximus activation compared to deep squats.36
Clinical guidelines for persons post ACL reconstruction advocate for the restoration of knee extensor strength and symmetry 48,49 Patients with patellar tendon or quadriceps tendon autografts regain quadriceps strength more slowly and are more prone to anterior knee pain.50 Thus, slow and progressive loading of the quadriceps should be the focus. For patients with donor-site pain, slower rates of loading/tempo may be better tolerated to stimulate tendon remodeling and muscular strengthening.50 Given that patients post ACL reconstruction are susceptible to anterior knee pain, hip biased squatting should be considered to lower the demand on the quadriceps using the trunk-tibia relationship recommendations above. Secondary considerations for hip bias squatting early in the recovery process include external band resistance around the thighs to promote gluteus maximus and gluteus medius activation45,46 and avoidance of deep squats (i.e., recommendations highlighted above for PFP). Medium stance squats are preferred over wide stance squats to minimize the knee valgus moment.
As tolerance to donor site loading improves, squats should be modified to progressively emphasize quadriceps loading (i.e., knee biased squatting). This can be achieved by either modifying the trunk position (more upright), promoting greater tibial inclination, or a combination of both. Secondary considerations for the introduction of more knee bias squatting include the use of deeper squats to increase quadriceps demands (moments)30,32 and narrow/medium stance widths. Regardless of squat type utilized (hip vs. knee bias), care should be taken to avoid valgus and transverse plane moments at the knee by promoting some degree of toe out.21
FAI, or abutment or impingement of the femoral neck against the acetabular labrum, can result in chondrolabral damage, thereby contributing to early onset of hip osteoarthritis.51,52 Persons with FAI exhibit impaired mobility at the hip (specifically hip flexion) and deficits in gluteal muscle activation.51,53 As such, selecting squatting mechanics that emphasize gluteus maximus and medius activation is prudent by optimizing the trunk-tibia relationship, utilizing a wider stance, and external band resistance around the thighs (see recommendations above).
Squat depth should be limited to avoid hip flexion beyond the patient’s available range of motion. This is important as patients with FAI have limited ability to posteriorly tilt the pelvis during squatting, which places them at greater risk for impingement.54 Deep squats (even if pain free) should be avoided. Although up to 25% of patients with FAI can perform deep squats without pain,55 it is important to note that deep squats impose large amplitudes of hip joint stress56 and increase the requirements for hip flexion and hip internal rotation,54,57 the hallmark movements that contribute to impingement. A toe out stance also should be considered as this will promote a greater de-
Figure 5. Trunk-tibia angle (bottom left). (A) Hip extensor bias with trunk-tibia angle > 10°; (B) Knee extensor bias with trunk-tibia angle < -10°; (C) Neutral bias with -10° trunk-tibia angle 10°.Patellofemoral pain
Post Anterior Cruciate Ligament Reconstruction
Femoroacetabular impingement
Low Back Pain
Tibiofemoral Osteoarthritis
• Avoid deep squats (limits patellofemoral joint stress)
• Outward toe rotation (decreases knee valgus moment)
Acute Phase (hip bias)
• Trunk-Tibia angle >10°
• Wider stance
• External band resistance around thighs
Sub-Acute Phase (progress to neutral and/or knee bias squat)
• -10° <= Trunk-Tibia angle <= 10° (neutral bias) OR Trunk-Tibia angle < -10° (knee bias)
• Narrow/medium stance
• Outward toe rotation (decreases knee valgus moment and knee transverse moment)
• Medium stance preferred over wide (decreases knee valgus moment)
Acute Phase (hip bias)
• Trunk-Tibia angle >10°
• External band resistance around thighs
• Avoid deep squats
Sub-Acute Phase (progress to knee bias squat)
• Trunk-Tibia angle < -10°
• Deeper squats
• Narrow/medium stance
• Trunk-Tibia angle >10° (hip bias)
• Wider stance (hip bias)
• External band resistance around thighs (hip bias)
• Avoid deep squats (protects against hip impingement)
• Outward toe rotation to promote hip external rotation (protects against hip impingement)
• Minimize trunk inclination (protects against lumbar muscle strain)
• Trunk-Tibia angle >10° (hip bias)
• Wider stance (minimizes lumbar loading)
• External band resistance around thighs (hip bias)
• Avoid deep squats (facilitates neutral spine)
• Avoid deep squats (minimizes tibiofemoral compressive forces)
• Outward toe rotation (if lateral compartment osteoarthritis)
• Neutral foot (if medial compartment osteoarthritis)
Acute Phase (hip bias)
• Trunk-Tibia angle >10°
• Wider stance
• External band resistance around thighs
Sub-Acute Phase (progress to knee bias squat)
• Trunk-Tibia angle < -10°
• Narrow/medium stance A
gree of hip external rotation and gluteal activation, thereby minimizing the potential for impingment.54,58
Hip weakness (abductors, adductors, and extensors) is a common finding in persons with low back pain.59 As such, squatting recommendations for low back pain should aim to minimize the compressive and shear loads on the lumbar spine, while simultaneously promoting adequate hip muscle activation. However, trunk inclination should be limited to avoid excessive lumbar muscle strain. To obtain a hip bias squat with limited forward trunk lean, a wider stance width can be used. A wider stance will reduce ankle dorsiflexion,47 which will facilitate a more favorable trunk-tibia relationship to produce a hip bias. Additionally, a wider stance during squatting reduces lumbar loading26 and per-
mits a more upright lumbar (less kyphosis).60 Secondary considerations for hip bias squatting include external band resistance around the thighs to promote gluteus maximus and gluteus medius activation.45,46
Similar to what was described above for FAI, squat depth should be limited to avoid flexing the hip beyond the available range of motion, thereby limiting posterior pelvic tilt. That is, squat depth should be limited to a depth in which a neutral spine can be maintained. As noted above, posterior pelvic tilt is coupled with lumbar spine flexion,37,38 resulting in compressive and shear forces occur at the lumbar spine.14,15,39
Osteoarthritis is the most common joint disease,61 primarily affecting the tibiofemoral joint.62,63 Lower-extremity
Table 1. Summary of Squat Parameters for Clinical Conditionsstrength deficits are common in patients with knee osteoarthritis,64 highlighting the importance of appropriate squatting for overall lower extremity strength. High compressive loads in the tibiofemoral joint can worsen osteoarthritis by increasing stress/strain on internal structures (e.g., articular cartilage and menisci).65,66 Therefore, squatting recommendations for tibiofemoral osteoarthritis should prioritize lower extremity strengthening while reducing tibiofemoral loading. Similar to PFP and ACL recommendations above, patients with tibiofemoral joint arthritis should progress from a hip bias to knee bias using the trunk-tibia relationship recommendations.
As for the tibiofemoral joint, compressive forces steadily increase when squatting from a partial to a deep position.3, 67 Since tibiofemoral contact area decreases with increasing knee flexion, contact stresses also increase.68,69 Therefore, deep squats should be avoided. Additional considerations for hip bias squatting early in the rehabilitation process to improve gluteal activation include external band resistance around the thighs45,46 and a wider stance.28,29 However, tibiofemoral compressive forces during a wide squat (compared to narrow squat) are approximately 15% higher.2
Considerations for knee bias squatting later in the rehabilitation process include transitioning to more narrow/ medium stance squats to promote greater tibial inclination47 and a quadriceps bias. Regardless of squat type (hip vs. knee bias), outward foot rotation may need to be limited in the presence of medial compartment osteoarthritis but advised in the presence of lateral compartment osteoarthritis. An outwardly rotated foot decreases loading in the lateral compartment (by decreasing the knee valgus moment) but increases loading in the medial compartment (by increasing the knee varus moment).21
The squat can be a safe and effective exercise if properly executed for both rehabilitation and sport performance purposes. However, selection of specific squatting parameters requires a thorough understanding of their impact on muscle activity and joint loading. The preceding review examines these factors in detail and provides evidence to guide clinical decision making. It is important for clinicians to prescribe appropriate squatting parameters based on the individual needs of the patient to maximize the effectiveness of the exercise. Additional work is necessary to establish the appropriateness and effectiveness of squat exercise for patients with various musculoskeletal conditions. While the current review summarizes important research in this area, it should be noted that comparisons across the numerous studies cited (particularly those related to EMG) should be approached with caution owing to differences in data reduction/analysis (including normalization) and how various confounding factors were controlled.
The authors report no conflicts of interest.
Submitted: November 28, 2023 CDT, Accepted: February 07, 2024 CDT
© The Author(s)
This is an open-access article distributed under the terms of the Creative Commons Attribution 4.0 International License (CCBY-NC-4.0). View this license’s legal deed at https://creativecommons.org/licenses/by-nc/4.0 and legal code at https://creativecommons.org/licenses/by-nc/4.0/legalcode for more information.
1. Caterisano A, Moss RF, Pellinger TK, et al. The effect of back squat depth on the EMG activity of 4 superficial hip and thigh muscles. J Strength Cond Res. 2002;16(3):428-432.
2. Escamilla RF, Fleisig GS, Zheng N, et al. Effects of technique variations on knee biomechanics during the squat and leg press. Med Sci Sports Exerc 2001;33(9):1552-1566. doi:10.1097/00005768-200109 000-00020
3. Escamilla RF. Knee biomechanics of the dynamic squat exercise. Med Sci Sports Exerc 2001;33(1):127-141. doi:10.1097/00005768-20010100 0-00020
4. Yavuz HU, Erdağ D, Amca AM, Aritan S. Kinematic and EMG activities during front and back squat variations in maximum loads. J Sports Sci 2015;33(10):1058-1066. doi:10.1080/02640414.2014.9 84240
5. Contreras B, Vigotsky AD, Schoenfeld BJ, Beardsley C, Cronin J. A Comparison of Gluteus Maximus, Biceps Femoris, and Vastus Lateralis Electromyography Amplitude in the Parallel, Full, and Front Squat Variations in Resistance-Trained Females. J Appl Biomech. 2016;32(1):16-22. doi:10.11 23/jab.2015-0113
6. Hamlyn N, Behm DG, Young WB. Trunk muscle activation during dynamic weight-training exercises and isometric instability activities. J Strength Cond Res 2007;21(4):1108-1112. doi:10.1519/r-20366.1
7 Andersen V, Fimland MS, Brennset Ø, et al. Muscle activation and strength in squat and Bulgarian squat on stable and unstable surface. Int J Sports Med 2014;35(14):1196-1202. doi:10.1055/s-0034-1382016
8. Gullett JC, Tillman MD, Gutierrez GM, Chow JW. A biomechanical comparison of back and front squats in healthy trained individuals. J Strength Cond Res 2009;23(1):284-292. doi:10.1519/jsc.0b013e31818546 bb
9. Biscarini A, Benvenuti P, Botti F, Mastrandrea F, Zanuso S. Modelling the joint torques and loadings during squatting at the Smith machine. J Sports Sci 2011;29(5):457-469. doi:10.1080/02640414.2010.5348 59
10. Straub RK, Barrack AJ, Cannon J, Powers CM. Trunk Inclination During Squatting is a Better Predictor of the Knee-Extensor Moment Than Shank Inclination. J Sport Rehabil 2021;30(6):899-904. doi:1 0.1123/jsr.2020-0397
11. Barrack AJ, Straub RK, Cannon J, Powers CM. the relative orientation of the trunk and tibia can be used to estimate the demands on the hip and knee extensors during the barbell back squat. Int J Sports Sci Coaching 2021;16(4):1004-1010. doi:10.1177/1747 954121997957
12. Lee TS, Song MY, Kwon YJ. Activation of back and lower limb muscles during squat exercises with different trunk flexion. J Phys Ther Sci. 2016;28(12):3407-3410. doi:10.1589/jpts.28.3407
13. Esola MA, McClure PW, Fitzgerald GK, Siegler S. Analysis of lumbar spine and hip motion during forward bending in subjects with and without a history of low back pain. Spine 1996;21(1):71-78. do i:10.1097/00007632-199601010-00017
14. McGill SM. The biomechanics of low back injury: implications on current practice in industry and the clinic. J Biomech. 1997;30(5):465-475. doi:10.1016/s0 021-9290(96)00172-8
15. McGill SM, Hughson RL, Parks K. Changes in lumbar lordosis modify the role of the extensor muscles. Clin Biomech 2000;15(10):777-780. doi:10.1 016/s0268-0033(00)00037-1
16. Kernozek TW, Gheidi N, Zellmer M, Hove J, Heinert BL, Torry MR. Effects of anterior knee displacement during squatting on patellofemoral joint stress. J Sport Rehabil. 2018;27(3):237-243. doi:1 0.1123/jsr.2016-0197
17 Fry AC, Smith JC, Schilling BK. Effect of knee position on hip and knee torques during the barbell squat. J Strength Cond Res. 2003;17(4):629-633.
18. Lorenzetti S, Gülay T, Stoop M, et al. Comparison of the angles and corresponding moments in the knee and hip during restricted and unrestricted squats. J Strength Cond Res 2012;26(10):2829-2836. doi:10.151 9/jsc.0b013e318267918b
19. Pangan AM, Leineweber M. Footwear and elevated heel influence on barbell back squat: A review J Biomech Eng 2021;143(9). doi:10.1115/1.405 0820
20. Legg HS, Glaister M, Cleather DJ, Goodwin JE. The effect of weightlifting shoes on the kinetics and kinematics of the back squat. J Sports Sci. 2017;35(5):508-515. doi:10.1080/02640414.2016.1175 652
21. Han S, Ge S, Liu H, Liu R. Alterations in threedimensional knee kinematics and kinetics during neutral, squeeze and outward squat. J Hum Kinet 2013;39(1):59-66. doi:10.2478/hukin-2013-0068
22. Ninos JC, Irrgang JJ, Burdett R, Weiss JR. Electromyographic analysis of the squat performed in self-selected lower extremity neutral rotation and 30 degrees of lower extremity turn-out from the selfselected neutral position. J Orthop Sports Phys Ther 1997;25(5):307-315. doi:10.2519/jospt.1997.25.5.307
23. Signorile JF, Kacsik D, Perry A, et al. The effect of knee and foot position on the electromyographical activity of the superficial quadriceps. J Orthop Sports Phys Ther. 1995;22(1):2-9. doi:10.2519/jospt.1995.2 2.1.2
24. Pereira GR, Leporace G, Chagas D, Furtado LFL, Praxedes J, Batista LA. Influence of hip external rotation on hip adductor and rectus femoris myoelectric activity during a dynamic parallel squat. J Strength Cond Res. 2010;24(10):2749-2754. doi:10.151 9/jsc.0b013e3181c6a139
25. Lahti J, Hegyi A, Vigotsky AD, Ahtiainen JP Effects of barbell back squat stance width on sagittal and frontal hip and knee kinetics. Scand J Med Sci Sports 2019;29(1):44-54. doi:10.1111/sms.13305
26. Swinton PA, Lloyd R, Keogh JWL, Agouris I, Stewart AD A biomechanical comparison of the traditional squat, powerlifting squat, and box squat. J Strength Cond Res. 2012;26(7):1805-1816. doi:10.151 9/jsc.0b013e3182577067
27 Escamilla RF, Fleisig GS, Lowry TM, Barrentine SW, Andrews JR. A three-dimensional biomechanical analysis of the squat during varying stance widths. Med Sci Sports Exerc 2001;33(6):984-998. doi:10.109 7/00005768-200106000-00019
28. McCaw ST, Melrose DR. Stance width and bar load effects on leg muscle activity during the parallel squat. Med Sci Sports Exerc. 1999;31(3):428-436. doi:1 0.1097/00005768-199903000-00012
29. Paoli A, Marcolin G, Petrone N. The effect of stance width on the electromyographical activity of eight superficial thigh muscles during back squat with different bar loads. J Strength Cond Res 2009;23(1):246-250. doi:10.1519/jsc.0b013e31818768 11
30. Cotter JA, Chaudhari AM, Jamison ST, Devor ST Knee joint kinetics in relation to commonly prescribed squat loads and depths. J Strength Cond Res 2013;27(7):1765-1774. doi:10.1519/jsc.0b013e31
82773319
31. Wallace DA, Salem GJ, Salinas R, Powers CM. Patellofemoral joint kinetics while squatting with and without an external load. J Orthop Sports Phys Ther 2002;32(4):141-148. doi:10.2519/jospt.2002.32.4.141
32. Bryanton MA, Kennedy MD, Carey JP, Chiu LZF. Effect of squat depth and barbell load on relative muscular effort in squatting. J Strength Cond Res 2012;26(10):2820-2828. doi:10.1519/jsc.0b013e31826 791a7
33. Zavala L, Flores V, Cotter JA, Becker J. Patellofemoral joint kinetics in females when using different depths and loads during the barbell back squat. Eur J Sport Sci 2021;21(7):976-984. doi:10.108 0/17461391.2020.1806935
34. Salem GJ, Powers CM. Patellofemoral joint kinetics during squatting in collegiate women athletes. Clin Biomech. 2001;16(5):424-430. doi:10.10 16/s0268-0033(01)00017-1
35. Gorsuch J, Long J, Miller K, et al. The effect of squat depth on multiarticular muscle activation in collegiate cross-country runners. J Strength Cond Res 2013;27(9):2619-2625. doi:10.1519/jsc.0b013e318280 55d5
36. da Silva JJ, Schoenfeld BJ, Marchetti PN, Pecoraro SL, Greve JMD, Marchetti PH. Muscle activation differs between partial and full back squat exercise with external load equated. J Strength Cond Res 2017;31(6):1688-1693. doi:10.1519/jsc.000000000000 1713
37 Mata AJ, Hayashi H, Moreno PA, Dudley RI, Sorenson EA. Hip flexion angles during supine range of motion and bodyweight squats. Int J Exerc Sci. 2021;14(1):912-918.
38. Campos MH, Alaman LI, Seffrin-Neto AA, Vieira CA, MC DEP, CA DEL. The geometric curvature of the lumbar spine during restricted and unrestricted squats. J Sports Med Phys Fitness 2016;57(6):773-781.
39. Delitto RS, Rose SJ. An electromyographic analysis of two techniques for squat lifting and lowering. Phys Ther 1992;72(6):438-448. doi:10.1093/ ptj/72.6.438
40. Krzyszkowski J, Kipp K. Load-dependent mechanical demands of the lower extremity during the back and front squat. J Sports Sci 2020;38(17):2005-2012. doi:10.1080/02640414.2020.1 766738
41. Wallis JA, Roddy L, Bottrell J, Parslow S, Taylor NF. A systematic review of clinical practice guidelines for physical therapist management of patellofemoral pain. Phys Ther 2021;101(3). doi:10.1093/ptj/pzab021
42. Powers CM, Ho KY, Chen YJ, Souza RB, Farrokhi S. Patellofemoral joint stress during weight bearing and non-weight bearing quadriceps exercises. J Orthop Sports Phys Ther. 2014;44(5):320-327. doi:10.2519/jos pt.2014.4936
43. Liao TC, Yang N, Ho KY, Farrokhi S, Powers CM. Femur rotation increases patella cartilage stress in females with patellofemoral pain. Med Sci Sports Exerc 2015;47(9):1775-1780. doi:10.1249/mss.000000 0000000617
44. Nakagawa TH, Serrão FV, Maciel CD, Powers CM. Hip and knee kinematics are associated with pain and self-reported functional status in males and females with patellofemoral pain. Int J Sports Med. 2013;34(11):997-1002. doi:10.1055/s-0033-1334966
45. Foley RCA, Bulbrook BD, Button DC, Holmes MWR. Effects of a band loop on lower extremity muscle activity and kinematics during the barbell squat. Int J Sports Phys Ther 2017;12(4):550-559.
46. Martins EC, Steffen LB, Gomes D, Herzog W, Haupenthal A, de Brito Fontana H. Looped elastic resistance during squats: How do band position and stiffness affect hip myoelectric activity? J Funct Morphol Kinesiol 2022;7(3):60. doi:10.3390/jfmk7030 060
47. Demers E, Pendenza J, Radevich V, Preuss R. The Effect of stance width and anthropometrics on joint range of motion in the lower extremities during a back squat. Int J Exerc Sci. 2018;11(1):764-775.
48. Andrade R, Pereira R, van Cingel R, Staal JB, Espregueira-Mendes J. How should clinicians rehabilitate patients after ACL reconstruction? A systematic review of clinical practice guidelines (CPGs) with a focus on quality appraisal (AGREE II). Br J Sports Med. 2020;54(9):512-519. doi:10.1136/bjsp orts-2018-100310
49. Kotsifaki R, Korakakis V, King E, et al. Aspetar clinical practice guideline on rehabilitation after anterior cruciate ligament reconstruction. Br J Sports Med 2023;57(9):500-514. doi:10.1136/bjsports-202 2-106158
50. Brinlee AW, Dickenson SB, Hunter-Giordano A, Snyder-Mackler L. ACL Reconstruction rehabilitation: Clinical data, biologic healing, and criterion-based milestones to inform a return-to-sport guideline. Sports Health 2022;14(5):770-779. doi:10.1177/19417 381211056873
51. Keogh MJ, Batt ME. A review of femoroacetabular impingement in athletes. Sports Med 2008;38(10):863-878. doi:10.2165/00007256-2008381 00-00005
52. Ganz R, Leunig M, Leunig-Ganz K, Harris WH. The etiology of osteoarthritis of the hip: an integrated mechanical concept. Clin Orthop Relat Res 2008;466(2):264-272. doi:10.1007/s11999-007-0060-z
53. Agricola R, Weinans H. What is femoroacetabular impingement? Br J Sports Med 2016;50(4):196-197 d oi:10.1136/bjsports-2015-094766
54. Bagwell JJ, Snibbe J, Gerhardt M, Powers CM. Hip kinematics and kinetics in persons with and without cam femoroacetabular impingement during a deep squat task. Clin Biomech. 2016;31:87-92. doi:10.1016/ j.clinbiomech.2015.09.016
55. Ayeni O, Chu R, Hetaimish B, et al. A painful squat test provides limited diagnostic utility in CAMtype femoroacetabular impingement. Knee Surg Sports Traumatol Arthrosc 2014;22(4):806-811. doi:1 0.1007/s00167-013-2668-8
56. Ng KCG, Lamontagne M, Labrosse MR, Beaulé PE. Hip joint stresses due to cam-type femoroacetabular impingement: A systematic review of finite element simulations. PLoS One 2016;11(1):e0147813. doi:10.1 371/journal.pone.0147813
57. Delp SL, Hess WE, Hungerford DS, Jones LC. Variation of rotation moment arms with hip flexion. J Biomech 1999;32(5):493-501. doi:10.1016/s0021-929 0(99)00032-9
58. Bagwell JJ, Powers CM. The influence of squat kinematics and cam morphology on acetabular stress. Arthroscopy. 2017;33(10):1797-1803. doi:10.1016/j.art hro.2017.03.018
59. Pizol GZ, Ferro Moura Franco K, Cristiane Miyamoto G, Maria Nunes Cabral C. Is there hip muscle weakness in adults with chronic non-specific low back pain? A cross-sectional study BMC Musculoskelet Disord. 2023;24(1):798. doi:10.1186/s12 891-023-06920-x
60. McKean MR, Dunn PK, Burkett BJ. The lumbar and sacrum movement pattern during the back squat exercise. J Strength Cond Res. 2010;24(10):2731-2741. doi:10.1519/jsc.0b013e3181e2e166
61. D’Ambrosia RD Epidemiology of osteoarthritis. Orthopedics. 2005;28(2 Suppl):S201-205.
62. Felson DT, Zhang Y, Hannan MT, et al. The incidence and natural history of knee osteoarthritis in the elderly. The Framingham Osteoarthritis Study. Arthritis Rheum 1995;38(10):1500-1505. doi:10.1002/ art.1780381017
63. Zhang Y, Hunter DJ, Nevitt MC, et al. Association of squatting with increased prevalence of radiographic tibiofemoral knee osteoarthritis: the Beijing Osteoarthritis Study. Arthritis Rheum. 2004;50(4):1187-1192. doi:10.1002/art.20127
64. Alnahdi AH, Zeni JA, Snyder-Mackler L. Muscle impairments in patients with knee osteoarthritis. Sports Health. 2012;4(4):284-292. doi:10.1177/194173
8112445726
65. Englund M, Guermazi A, Lohmander SL. The role of the meniscus in knee osteoarthritis: a cause or consequence? Radiol Clin North Am 2009;47(4):703-712. doi:10.1016/j.rcl.2009.03.003
66. Clements KM, Bee ZC, Crossingham GV, Adams MA, Sharif M. How severe must repetitive loading be to kill chondrocytes in articular cartilage? Osteoarthritis Cartilage. 2001;9(5):499-507. doi:10.105 3/joca.2000.0417
67 Nisell R. Joint load during the parallel squat in powerlifting and force analysis of in vivo bilateral quadriceps tendon rupture. Scand J Sports Sci 1986;8:63-70.
68. Maquet PG, Van de Berg AJ, Simonet JC. Femorotibial weight-bearing areas. Experimental determination. J Bone Joint Surg Am 1975;57(6):766-771. doi:10.2106/00004623-19755706 0-00005
69. Nagura T, Matsumoto H, Kiriyama Y, Chaudhari A, Andriacchi TP. Tibiofemoral joint contact force in deep knee flexion and its consideration in knee osteoarthritis and joint replacement. J Appl Biomech 2006;22(4):305-313. doi:10.1123/jab.22.4.305
Robert C. Manske, PT, DPT, MEd, SCS, ATC, CSCS, FAPTA
Michael Voight, PT, DHSC, SCS, OCS, ATC, CSCS, FAPTA
Chris Wolfe, PT, DPT, OCS, Cert MDT
Phil Page, PT, PhD, ATC, CSCS, FACSM
Abstract
Cubital tunnel syndrome (CTS), is a frequently encountered condition in clinical settings, typically arising from static or dynamic compression of the ulnar nerve. CTS is characterized by the irritation of the ulnar nerve within the cubital tunnel and is a common neuropathic condition that can significantly impact functional abilities and quality of life. This article explores the utility of diagnostic musculoskeletal ultrasound (MSK-US) in the evaluation of the cubital tunnel and the ulnar nerve. The cubital tunnel syndrome, a common entrapment neuropathy of the ulnar nerve, often presents diagnostic challenges. Traditionally, nerve conduction studies and electromyography have been the primary diagnostic tools used to diagnose CTS. Given the superficial nature of the ulnar groove and its adjacent structures, MSK-US imaging known for its non-invasive nature and high-resolution imaging capabilities, has become an increasingly valuable tool in the assessment and management of various musculoskeletal conditions. This article reviews the technical aspects of MSK-US, its advantages in visualizing the ulnar nerve and related structures, and its implications in clinical practice for rehabilitation providers. By integrating MSK-US in the evaluation of CTS, rehabilitation professionals can enhance diagnostic accuracy, tailor interventions, and improve patient outcomes.
Keywords: Cubital Tunnel Syndrome, Ulnar Nerve, Musculoskeletal Ultrasound, Rehabilitation, Diagnostic Imaging.
Introduction
Cubital tunnel syndrome (CTS), characterized by the entrapment of the ulnar nerve at the elbow, is a prevalent condition causing symptoms that include but are not limited to pain, numbness, and muscle weakness in the affected limb. It often results in sensory disturbances and motor deficits, significantly affecting patients' daily activities and livelihood. The diagnosis of CTS relies on a thorough understanding of the ulnar nerve and its sensory and motor branch distribution. However, the clinical identification of ulnar nerve pathology is often complex due to anatomical variations, a wide array of differential diagnoses, and diverse clinical presentations. Untreated or
inadequately managed injury to the ulnar nerve may lead to severe complications, including persistent sensory impairments, muscle weakness, and joint contractures.1 Therefore, early and accurate diagnosis is crucial for effective management and rehabilitation. Electromyography (EMG) and nerve conduction studies (NCS) have traditionally been the mainstay in the diagnosis of ulnar nerve pathology. While effective, they also have limitations including cost, accessibility, and patient discomfort. MSK-US imaging is emerging as a valuable diagnostic tool, particularly in cases where the diagnosis of ulnar nerve pathology is uncertain.2 The integration of MSK-US imaging into the diagnostic process offers clinicians a real-time, dynamic approach to correlate imaging findings with clinical symptoms directly. This article aims to provide an in-depth exploration of the application of ultrasound imaging in the diagnosis of ulnar neuropathy at the elbow, underscoring its significance as a non-invasive, real-time, and highly informative diagnostic modality.
Epidemiology, Risk Factors, and Pathophysiology
Ulnar neuropathy at the elbow is a condition with diverse etiologies and mechanisms of injury. The ulnar nerve is vulnerable to compression at several anatomical locations in the vicinity of the elbow, predominantly at the ulnar groove and beneath the humeroulnar aponeurotic arcade.2 However, entrapment can also occur at various other points, including the medial intermuscular septum of the arm, the arcade of Struthers, the cubital tunnel, and between the flexor carpi ulnaris (FCU) and flexor digitorum superficialis (FDS) muscles.2
Ulnar neuropathy at the elbow is estimated to affect up to 5.9% of the general population, as highlighted in recent studies.3,4 Research has identified several risk factors associated with the development of ulnar neuropathy. A significant correlation has been observed between smoking and the onset of ulnar neuropathy, as indicated by epidemiological data.4 Furthermore, demographic factors such as advancing age and male sex have been identified as potential risk factors for the development of ulnar neuropathy.5 Occupational factors, particularly hand-arm vibration exposure in specific jobs, have also been implicated in ulnar neuropathy development.6
The pathophysiological mechanisms underlying dynamic ulnar nerve compression at the elbow are not entirely known. An intriguing aspect is the congenital absence of the ulnar groove retinaculum, potentially accounting for increased ulnar nerve mobility outside the ulnar groove upon elbow flexion.7 Additionally, a shallow bony ulnar groove might contribute to instability.8 Although ulnar nerve instability is frequently observed in asymptomatic individuals, its exact relationship to symptomatic presentations remains ambiguous.9 Notably, while often asymptomatic, ulnar nerve instability can be implicated in pain syndromes due to friction and increased pressure.
Furthermore, the hypermobility of the ulnar nerve, particularly during flexion, renders it susceptible to damage from direct trauma or pressure.2 The notion of "frictional neuritis" suggests that the subluxing or dislocating ulnar nerve may become irritated against bony irregularities, particularly in arthritic or post-traumatic joints.10 Additionally, it has been proposed that complete ulnar nerve dislocation might paradoxically act as a protective mechanism against nerve strain.11
The diagnosis of ulnar neuropathy at the elbow is a multifaceted process that hinges on a comprehensive patient history, physical examination, electrophysiological testing, and MSK-US examination. Clinical manifestations of ulnar nerve entrapment typically include medial elbow pain, tingling, and numbness in the area supplied by the ulnar nerve, primarily affecting the fourth and fifth digits. These symptoms are often exacerbated by elbow flexion, such as during phone use, leaning on an elbow, or sleeping with the elbow bent beyond 90 degrees.2 Difficulties in fine motor tasks, such as typing or opening bottles, are also reported, although overt motor symptoms like muscle atrophy or weakness may not be initially present.
Diagnostic provocative tests, including the Tinel test at the ulnar groove and the elbow flexion test with wrist extension, are valuable in confirming ulnar nerve entrapment. Enhancing these tests with additional shoulder internal rotation can improve their sensitivity and specificity.12 Impairment in two-point discrimination in the ring and small fingers may also be present. Clinical examination may reveal the snapping of the dislocating ulnar nerve beneath the fingertips anterior to the medial epicondyle during elbow flexion.
Electrodiagnostic testing, including motor and sensory nerve conduction studies and needle examination, plays a crucial role in diagnosing ulnar nerve entrapment, pinpointing the site of entrapment, and determining the severity of the condition.13 Despite their utility, electrodiagnostic studies have limitations in visualizing the morphology of the ulnar nerve and its surrounding tissues. Imaging examinations, like MSK-US or MRI, become indispensable, especially in cases with ambiguous diagnoses or secondary causes of compression.14
MSK-US involves the use of high-frequency sound waves to create detailed images of muscles, ligaments, nerves, and other soft tissues. Its high resolution allows for the visualization of the ulnar nerve and its surrounding structures with exceptional clarity. MSK-US offers several advantages over traditional diagnostic methods:
1. Dynamic Imaging: MSK-US enables the observation of the ulnar nerve in motion, helping to identify pathological changes during different arm positions.
2. Accessibility and Cost-effectiveness: Compared to MRI, MSK-US is more accessible and cost-effective, making it a practical choice in various clinical settings.
3. Patient Comfort: Being non-invasive and painless, MSK-US enhances patient comfort and compliance.
4. Immediate Feedback: Real-time imaging allows for immediate evaluation and diagnosis, facilitating quicker decision-making in treatment planning.
MSK-US is a valuable tool in the evaluation of cubital tunnel syndrome and ulnar nerve pathology. Its non-invasive nature, coupled with the ability to provide dynamic and detailed visualization of the nerve, makes it an excellent adjunct to clinical examination and traditional nerve conduction studies. The integration of MSK-US aids in the early detection of ulnar nerve pathologies, which is crucial for timely intervention and preventing progression to chronic stages. Rehabilitation providers, equipped with knowledge and skills in MSK-US, can significantly enhance their diagnostic and therapeutic approach to ulnar nerve pathology, ultimately improving patient outcomes.
References
1. Staples JR, Calfee R. Cubital tunnel syndrome: current concepts. J Am Acad Orthop Surg. 2017;25:215–224.
2. Mezian K, Jacisko J, Kaiser R, et al. Ulnar neuropathy at the elbow: from ultrasound scanning to treatment. Front Neurol. 2021;12(5):1-17.
3. An TW, Evanoff BA, Boyer MI, Osei DA. The prevalence of cubital tunnel syndrome: a crosssectional study in a U.S. Metropolitan Cohort. J Bone Joint Surg Am. 217;99:408-416.
4. Frost P, Johnsen B, Fuglsang-Frederiksen A, et al. Lifestyle risk factors for ulnar neuropathy and ulnar neuropathy-like symptoms. Muscle Nerve. 2013;48:507515.
5. Uzunkulaoglu A, Ikbali Afsar S, Karataş M. Association between gender, body mass index, and ulnar nerve entrapment at the elbow: a retrospective study. J Clin Neurophysiol. 2016;33:545-548.
6. Jacisko J, Sobotová K, Mezian K. The utility of ultrasound examination in cubital tunnel syndrome caused by heterotopic ossification. Med Ultrason. 2020;22:117-118. 10.11152/mu-2419
7. Michelin P, Leleup G, Ould-Slimane M, et al. Ultrasound biomechanical anatomy of the soft structures in relation to the ulnar nerve in the cubital tunnel of the elbow. Surg Radiol Anat. 2017;39:12151221.
8. Rosenberg ZS, Beltran J, Cheung Y, Broker M. MR imaging of the elbow: normal variant and potential diagnostic pitfalls of the trochlear groove and cubital tunnel. AJR Am J Roentgenol. 1995;164:415-418.
9. Cornelson SM, Sclocco R, Kettner NW. Ulnar nerve instability in the cubital tunnel of asymptomatic volunteers. J Ultrasound. 2019;22:337-344.
10. Bordes SJ, Jenkins S, Bang K, et al.. Ulnar nerve subluxation and dislocation: a review of the literature. Neurosurg Rev. 2020;44:793–798.
11. Leis AA, Smith BE, Kosiorek HE, et al. Complete dislocation of the ulnar nerve at the elbow: a protective effect against neuropathy? Muscle Nerve. 2017;56:242246.
12. Ochi K, Horiuchi Y, Tanabe A, et al. Shoulder internal rotation elbow flexion test for diagnosing cubital tunnel syndrome. J Shoulder Elbow Surg. 2012;21:777-781.
13. Dimberg EL. Electrodiagnostic evaluation of ulnar neuropathy and other upper extremity mononeuropathies. Neurol Clin. 2012;30:479-503.
14. Gans P, Van Alfen N. Nerve ultrasound showing Martin-Gruber anastomosis. Muscle Nerve. 2017;56:E46E47.
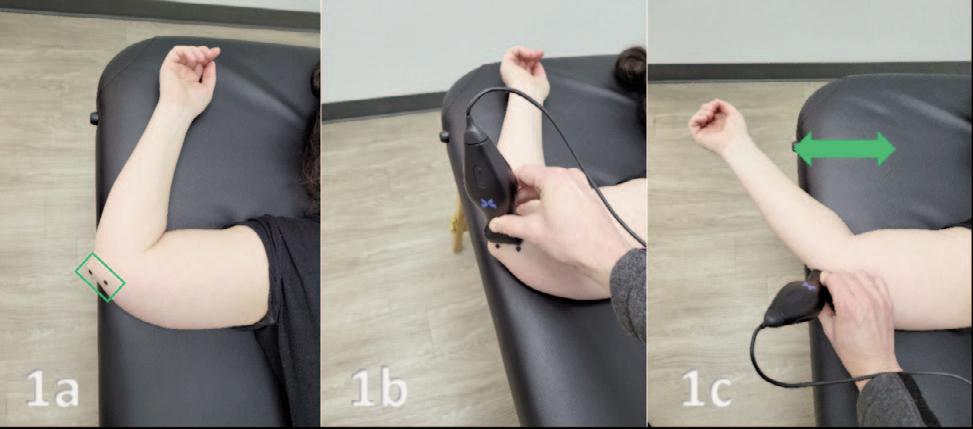
and 1b.
Figures 1a: Patient Position. Supine with the involved arm abducted to 90 degrees, elbow flexed to 60-90 degrees and maintained in full external rotation. Figure 1a and 1b: Transducer Placement. The transducer is placed in a Short Axis (SAX) position. The green box outlines the SAX position of the transducer in Figure 1a. The two black dots over the medial epicondyle and olecranon indicate the placement for the lateral and medial aspects of the transducer in both Figures 1a A common pitfall is to place the transducer in a Long Axis (LAX) position directly into the ulnar groove. Figure 1c: Transducer Placement with a Dynamic Assessment of a Subluxing Ulnar Nerve. With the transducer in place, the arm can be flexed and extended. This exam becomes a dynamic assessment showing the subluxing ulnar nerve in real time.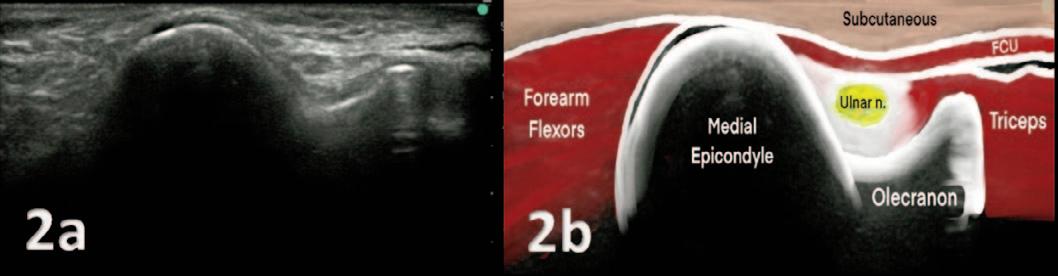
the triceps. The stability of the ulnar groove is ensured by the intermuscular septum of the flexor carpi ulnaris.
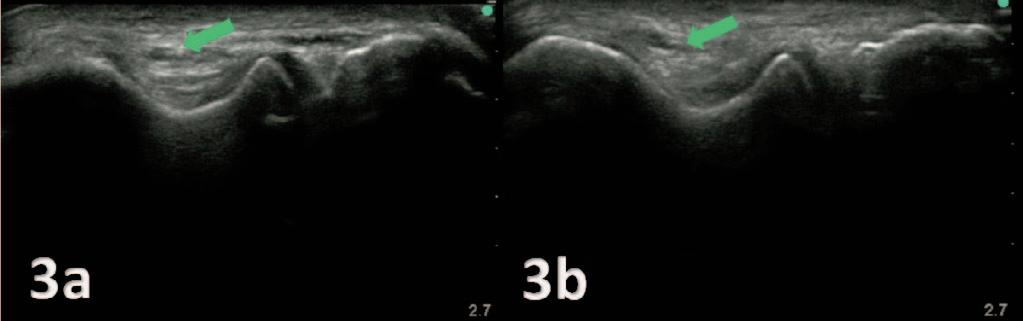
3A and 3B:
dislocation, dynamic imaging of the elbow was conducted, ranging from full extension to full flexion. Special care was taken to reduce transducer pressure on the nerve, minimizing its impact on nerve movement. The observed ulnar nerve (green arrow) is categorized as a partial dislocation and is characterized by the ulnar nerve shifting over the tip of the medial epicondyle during elbow flexion, while a complete dislocation is defined as the nerve moving anteriorly beyond the tip of the medial epicondyle.
Figures 2A and 2B: The ulnar nerve is positioned within the ulnar groove, resembling a trough, situated on the epicondyle side. Unlike other nerves in different locations that appear hyperechoic, the ulnar nerve here exhibits a hypoechoic quality. Within this groove, you'll also find the medial head of Figures To assess ulnar nerve
Keywords: digital healthcare, data driven care, evidence based practice https://doi.org/10.26603/001c.115492
The future of orthopedic prognosis is a discussion about information: what we need to know, when and where we can obtain it, and how we should use it to improve outcomes.
The science of diagnosis begins with our education, which includes definitions, protocols, and assessment tools. To that foundation we add applicable imaging, screens, and tests. We also lean on our clinical experience as a whole. Where those three concepts meet the individual presentation of disease, dysfunction, or injury is the formation of a diagnosis.
The art of diagnosis begins when you make an incorrect or incomplete assessment, commit to understanding the “why, how and when” of your error and choose to develop a strategy to reduce similar errors in the future. We’re better for having been there but without clinical mentorship or intense scrutiny of our outcomes, how do we refine our clinical decisions?
Clinical outcomes can improve if we employ a functional wellness screening mentality, considering risk associated with:
1. Undiagnosed MSK complicating factors affecting outcome,
2. Diagnosed complicating factors, outside of specialty, affecting outcome, and
3. Undiagnosed complicating factors, outside of specialty, affecting outcome.
1. Accuracy of diagnosis (the target), and
2. Identification of regional interdependence (the obstacles in front of the target).
In my case, that’s the origin story of the Selective Functional Movement Assessment. The SFMA improved my clinics by offering: Diagnostic ability and diagnostic accuracy have reached a high point with the addition of technological advancements. Most clinicians I encounter have reason to be very confident in their diagnostic abilities. More often than not, it’s how we form a prognosis that leaves outcomes lacking.
How do we make a prognosis? With a diagnosis in hand, we must also consider the variables and obstacles unique to the particular case - its complicating factors.
In most cases, over the term of rehabilitation, the diagnosis will not change. The complicating factors can and will change. The pertinent questions become: Are we doing enough to be fully informed of the diagnosed and undiagnosed complicating factors that arrive with our patients? How can we be better informed of those complicating factors, their changes and their impact on the initial diagnosis, care, and prognosis?
As with the art of diagnosis, the art of prognosis is about making errors, learning from those errors and using a system to make ourselves better For prognostic abilities, that system should focus on functional wellness - a holistic consideration of movement behaviors alongside lifestyle behaviors.
Giving greater value to additional factors may seem unsettling, as the assumption is that diagnosis is the greater part of prognosis. Diagnosis is the first consideration of prognosis, but does that always make it the greatest determinant of outcome? Can complicating factors carry equal weight with the diagnosis when making a prognosis? As Hippocrates stated: “It is more important to know what sort of person has a disease than to know what sort of disease a person has.”
Many clinicians are hesitant to consider factors outside of their diagnostic specialty, however it is logical and reasonable to screen for complicating factors of wellness that impact the outcome prediction. When risk is identified, monitor, treat, or refer as appropriate.
Consider the outcomes discussed in Rhon, et al.1 Using the SFMA as an audit, this study tracks injury, rehabilitation and return to duty for a cohort of 449 U.S. Army soldiers.
After rehabilitation and after being cleared to return to unrestricted full duty:
• 25% did not feel fully mission capable.
• 99.8% presented with at least 1 dysfunctional movement pattern.
• 37.0% had dysfunction with 9 of the 10 movement patterns.
• 44.1% had pain with at least 1 of the movements.
• 79.5% demonstrated asymmetry with movement from side to side.
These numbers are startling and they likely represent outcomes compromised by unaccounted-for complicating (risk) factors. Without questioning diagnostic and treatment standards, we have data confirming a generalized reduction in wellness and fitness in the military since the late 1960s. Military fitness standards have been consistently relaxed to remove physical barriers to service. As a fellow clinician, I would like to believe that the prognosis of each
soldier did not include known risk factors like post-rehabilitation pain, dysfunction, asymmetry, and lack of physical confidence.
How can we better know what sort of person has the disease? If those 449 cases were the last 449 patients I had treated, I would want to know what complicating factors I had missed. Had I known, what would I have done differently at the beginning?
The use of technology can provide us more efficient and effective feedback to enhance our diagnostic and prognostic abilities. We must be willing to confront our confirmation bias and adjust our practice when the data tells us that our outcomes could and should be better.
Part two of this editorial will explore how evidencebased prognostic data can be practically and preemptively collected at scale to achieve improved outcomes.

©
This is an open-access article distributed under the terms of the Creative Commons Attribution 4.0 International License (CCBY-NC-4.0). View this license’s legal deed at https://creativecommons.org/licenses/by-nc/4.0 and legal code at https://creativecommons.org/licenses/by-nc/4.0/legalcode for more information.
Gray Cook, MSPT, OSC CSCS The Author(s)1. Rhon DI, Teyhen DS, Kiesel K, et al. Recovery, Rehabilitation, and Return to Full Duty in a Military Population After a Recent Injury: Differences Between Lower-Extremity and Spine Injuries. Arthrosc Sports Med Rehabil 2022;4(1):e17-e27 doi:1 0.1016/j.asmr.2021.09.028