I J S PT


INTERNATIONAL JOURNAL OF SPORTS PHYSICAL THERAPY An Official Publication of A North American Sports Medicine Institute Publication
Photo by Miikka Luotio on Unsplash
Partnering with


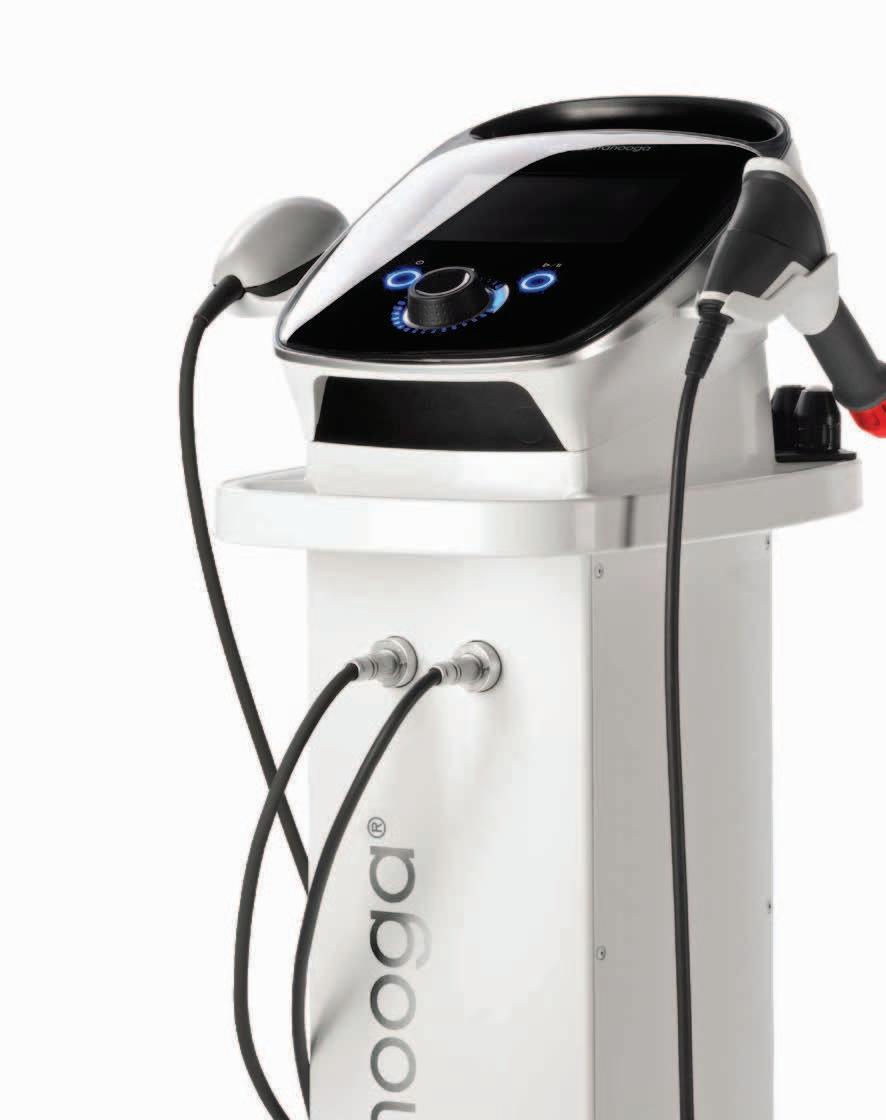
TARGETED PAIN RELIEF
The Intelect® RPW 2 allows for the treatment of indications with pneumatically-generated acoustic waves, or ‘pressure pulses’. The applied pressure pulse propagates radially within the tissue generating a therapeutic effect.
THE INTELECT® RPW 2 IS INDICATED TO TEMPORARILY INCREASE BLOOD FLOW & HELP REDUCE PAIN ASSOCIATED WITH:
• Achilles Tendinopathy1
• Disorders of Tendon Insertions
• Myofascial Trigger Points 2
• Plantar Fasciitis 3
Scan the QR code to request a demo, or visit https://learn.chattanoogarehab.com/ijspt-journal-2024.
1. Gerdesmeyer L, Mittermayr R, Fuerst M, et al. Current evidence of extracorporeal shock wave therapy in chronic Achilles tendinopathy. Int J Surg. 2015;24(Pt B):154-159. doi:10.1016/j.ijsu.2015.07.718
2. Kartaloglu IF, Kus AA. Evaluation of Radial Extracorporeal Shock Wave Therapy on Treatment-Resistant Trigger Points Using Sonographic Shear Wave Elastography. J Coll Physicians Surg Pak. 2023;33(10):1159-1164. doi:10.29271/jcpsp.2023.10.1159
3. Aqil A, Siddiqui MR, Solan M, Redfern DJ, Gulati V, Cobb JP. Extracorporeal shock wave therapy is effective in treating chronic plantar fasciitis: a meta-analysis of RCTs. Clin Orthop Relat Res. 2013;471(11):3645-3652. doi:10.1007/s11999-013-3132-2


https://www.wcspt.org


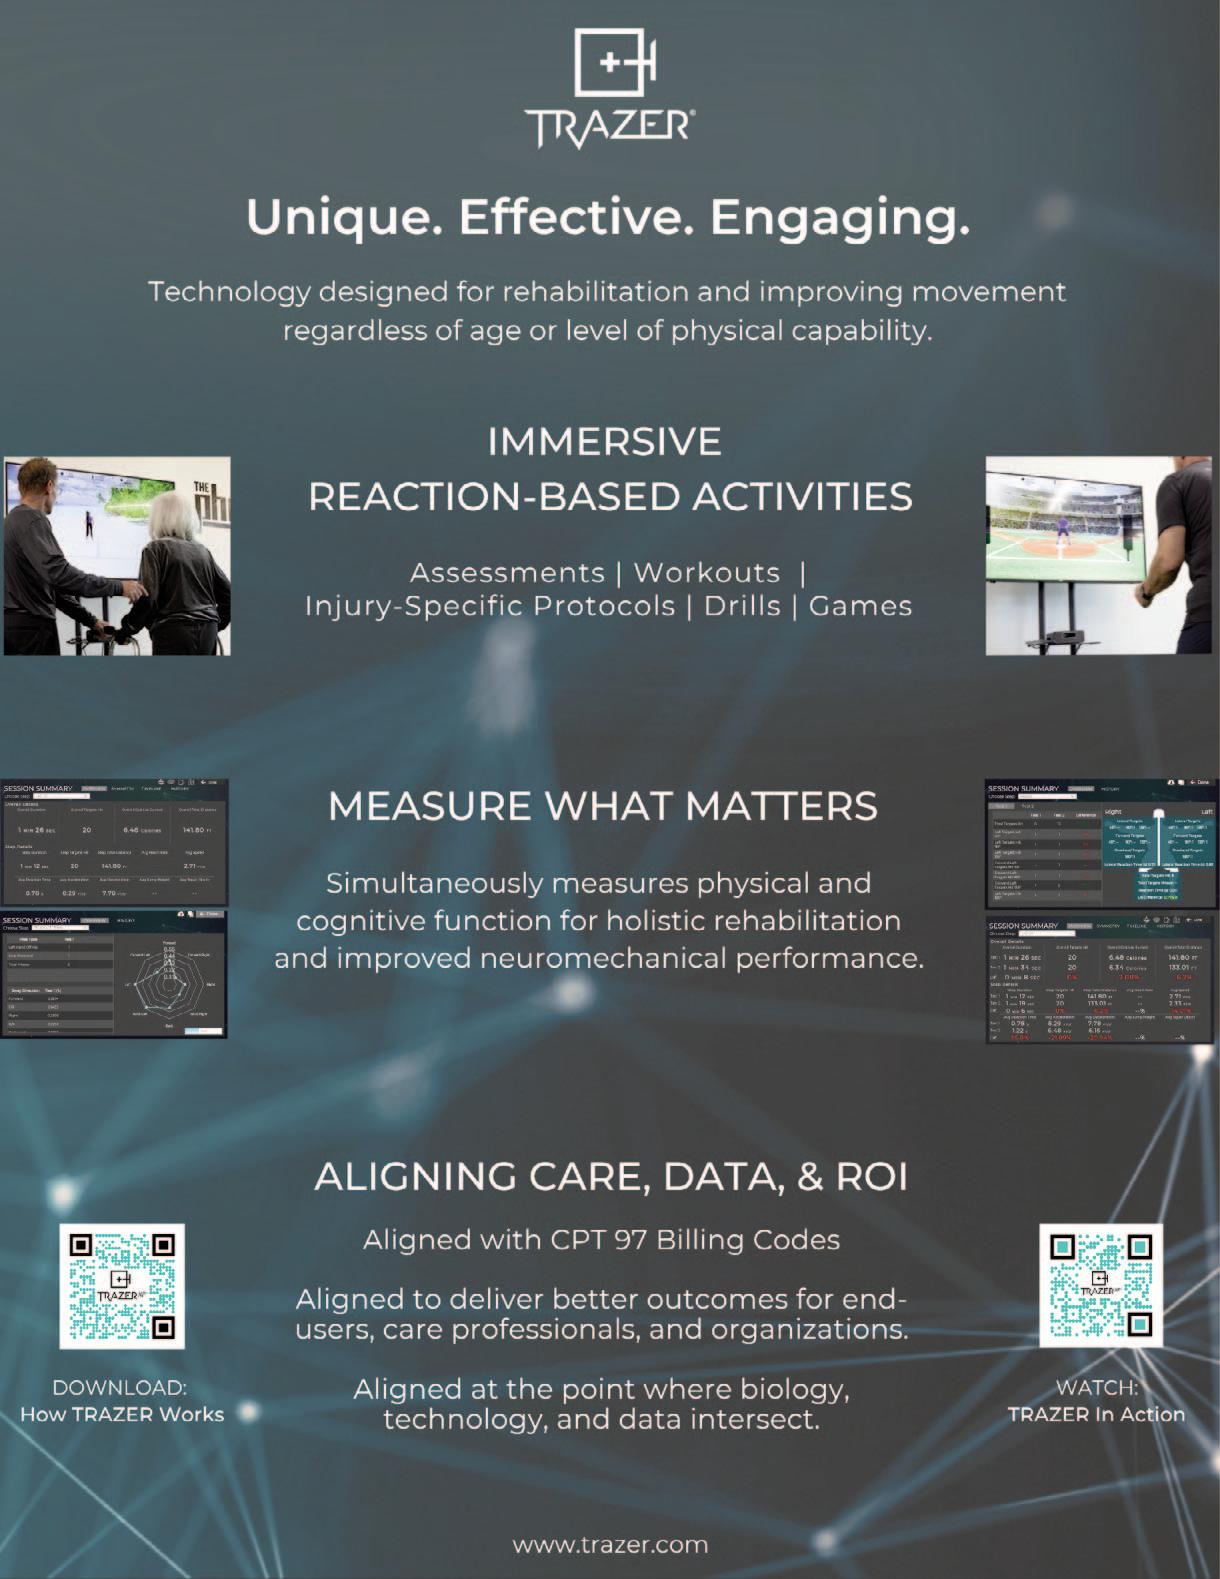
Focus on Neurocognitive Enriched Rehabilitation
November 8, 2024
Bern, Switzerland


Stand out in your community with a diversified patient experience. Designed to improve outcomes, attract new patients, and increase revenue through insurance, cash-based services, and retail sales.
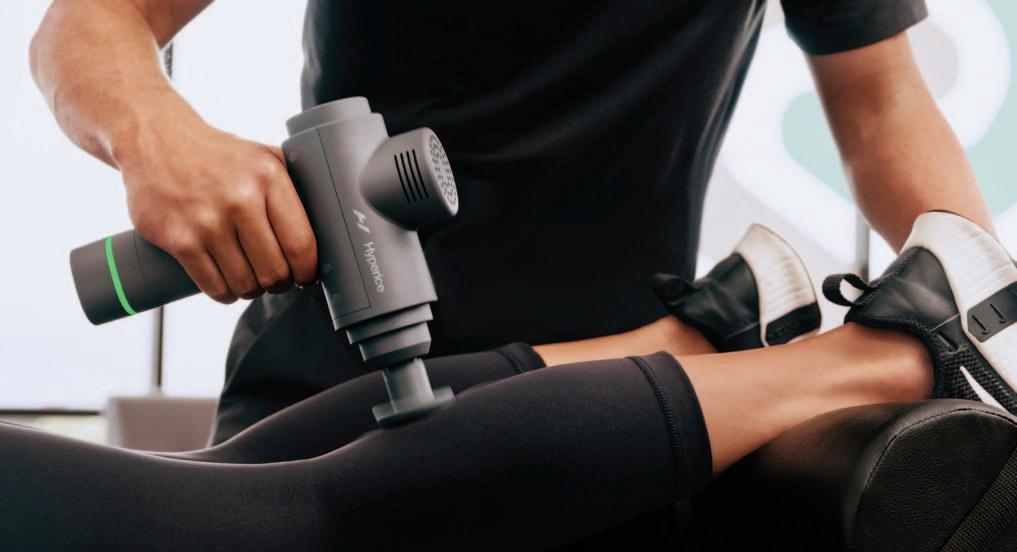
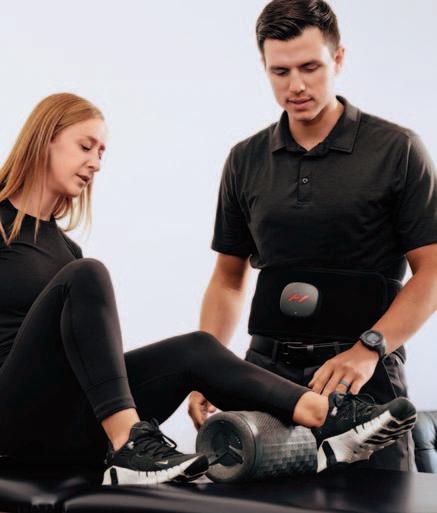
Gain access to a robust library of research, clinical education, and marketing tools including:
• On-demand clinical education courses
• Written treatment protocols
• Over 50 research studies specific to Hyperice technology
• Marketing tips and best practices including social media content, videos, and more
• Live trainings
Turner A Blackburn, APTA Life Member, AT-Ret, AOSSM-Ret President
Mary Wilkinson Executive Director
Michael Voight Executive Editor and Publisher
Joe Black, PT, DPT, SCS, ATC
Eric Fernandez
Jay Greenstein, DC
Skip Hunter, PT, ATC-Ret
Russ Paine, PT, DPT
Tim Tyler, PT, ATC
Sports Legacy Advisory Board
Turner A. Blackburn, PT, ATC
George Davies, PT, DPT, MEd, SCS, ATC, LAT, CSCS, PES, FAPTA
Terry Malone, PT, PhD
Bob Mangine, PT
Barb Sanders, PT, PhD
Tim Tyler, PT, ATC
Kevin Wilk, PT, DPT, FAPTA
Executive Editor/Publisher
Michael L. Voight, PT, DHSc, OCS, SCS, ATC, CSCS
Executive Director/Operations and Marketing
Mary Wilkinson
Editor in Chief
Barbara Hoogenboom, PT, EdD, SCS, ATC
Managing Editor
Ashley Campbell, PT, DPT, SCS, CSCS
Manuscript Coordinator
Casey Lewis, PTA, ATC
AMERICAN SPORTS MEDICINE INSTITUTE
Publisher
Contact Information
International Journal of Sports Physical Therapy 6011 Hillsboro Pike Nashville, TN 37215, US, http://www.ijspt.org
IJSPT is a monthly publication, with release dates on the first of each month.
ISSN 2159-2896
Underwriting Sponsor Genie Health
Founding Sponsors Enovis Exertools Hyperice Trazer Woodway
Platinum Sponsors ATI Elvation
Gold Sponsors Hawkgrips Kayezen Structure + Function Education Winback Partners
Northeast Seminars Academy of Human Movement
American Academy of Sports Physical Therapy
IJSPT is an official journal of the International Federation of Sports Physical Therapy (IFSPT). Countries with access to IJSPT as a member benefit. Reach us at www.ifspt.org.

IJSPT is an official journal of the ICCUS Society for Sports Rehabilitation. www.iccus.org

Executive Editor/Publisher
Michael L. Voight, PT, DHSc, OCS, SCS, ATC, CSCS
Belmont University
Nashville, Tennessee – USA
Editor in Chief
Barbara Hoogenboom, PT, EdD, SCS, ATC
Grand Valley State University
Grand Rapids, Michigan - USA
Managing Editor
Ashley Campbell, PT, DPT, SCS, CSCS
Nashville Sports Medicine and Orthopaedic Center
Nashville, Tennessee – USA
Manuscript Coordinator
Casey Lewis, PTA, ATC
Nashville Sports Medicine and Orthopaedic Center
Nashville, Tennessee – USA
Executive Director/Marketing
Mary Wilkinson
Indianapolis, Indiana – USA
Editors
Robert Manske PT, DPT, Med, SCS, ATC, CSCS
University of Wichita Wichita, KS, USA
Terry Grindstaff, PT, PhD, ATC, SCS, CSCS
Creighton University Omaha, NE, USA
Phil Page PT, PhD, ATC, CSCS
Franciscan University DPT Program
Baton Rouge, LA, USA
Kevin Wilk PT, DPT, FAPTA
Clinical Viewpoint Editor Champion Sports Medicine Birmingham, AL, USA
International Editors
Luciana De Michelis Mendonça, PT, PhD UFVJM
Diamantina, Brazil
Colin Paterson PT, MSc PGCert(Ed), MCSP, RISPT, SFHEA
University of Brighton Brighton, England, UK
Chris Napier, PT, PhD
Clinical Assistant Professor
University of British Coumbia, Vancouver, BC, Canada
Nicola Phillips, OBE, PT, PhD, FCSP Professor School of Healthcare Sciences Cardiff University, Cardiff, Wales, UK
Associate Editors
Eva Ageberg, PT, PhD Professor, Lund University Lund, Sweden
Lindsay Becker, PT, DPT, SCS, USAW Buckeye Performance Golf Dublin, Ohio, USA
Keelan Enseki, PT, MS, OCS, SCS, ATC University of Pittsburgh Pittsburgh, PA, USA
John Heick, PT, PhD, DPT, OCS, NCS, SCS
Northern Arizona University Flagstaff, AZ, USA
Julie Sandell Jacobsen, MHSc, PhD
VIA University Aarhus, Denmark
RobRoy L. Martin, PhD, PT, CSCS
Duquesne University Pittsburgh, PA, USA
Andrea Mosler, PhD, FACP, FASMF
La Trobe Sport and Exercise Medicine Research Centre, School of Allied Health, Human Services and Sport, La Trobe University Melbourne, Victoria, Australia
Brandon Schmitt, DPT, ATC
PRO Sports Physical Therapy Scarsdale, NY, USA
Barry Shafer, PT, DPT
Elite Motion Physical Therapy Arcadia, CA, USA
Laurie Stickler, PT, DHSc, OCS
Grand Valley State University
Grand Rapids, MI, USA
Editorial Board
James Andrews, MD
Andrews Institute & Sports Medicine Center
Gulf Breeze, AL, USA
Amelia (Amy) Arundale, PT, PhD, DPT, SCS
Red Bull/Ichan School of Medicine
Salzburg, Austria/New York, NY, USA
Gary Austin, PT PhD
Belmont University Nashville, TN, USA
Roald Bahr, MD
Oslo Sports Trauma Research Center
Oslo, Norway
Lane Bailey, PT, PhD
Memorial Hermann IRONMAN Sports Medicine Institute
Houston, Texas, USA
Gül Baltaci, PT,Ph.D. Professor, CKTI, FACSM
Private Guven Hospital Ankara, Turkey
Asheesh Bedi, MD
University of Michigan
Ann Arbor, MI, USA
David Behm, PhD Memorial University of Newfoundland St. John's, Newfoundland, Canada
Barton N. Bishop, PT, DPT, SCS, CSCS Kaizo Clinical Research Institute Rockville, Maryland, USA
Mario Bizzini, PhD, PT Schulthess Clinic Human Performance Lab Zürich, Switzerland
Joe Black, PT, DPT, SCS, ATC Total Rehabilitation Maryville, Tennesse, USA
Turner A. "Tab" Blackburn, APTA Life Member, ATC-Ret, AOSSM-Ret NASMI Lanett, AL, USA
Lori Bolgla, PT, PhD, MAcc, ATC Augusta University Augusta, Georgia, USA
Matthew Briggs The Ohio State University Columbus, OH, USA
Tony Brosky, PT, DHSc, SCS Bellarmine University Louisville, KY, USA
Brian Busconi, MD UMass Memorial Hospital Boston, MA, USA
Robert J. Butler, PT, PhD St. Louis Cardinals St. Louis, MO, USA
Duane Button, PhD Memorial University St. Johns, Newfoundland, Canada
J. W. Thomas Byrd, MD Nashville Sports Medicine and Orthopaedic Center Nashville, TN, USA
Lyle Cain, MD Andrews Institute & Sports Medicine Center Birmingham, AL, USA
Gary Calabrese, PT, DPT Cleveland Clinic Cleveland, Ohio, USA
Meredith Chaput, PT, DPT, SCS Ohio University Athens, OH, USA
Rita Chorba, PT, DPT, MAT, SCS, ATC, CSCS United States Army Special Operations Command Fort Campbell, KY, USA
John Christoferreti, MD Texas Health Dallas, TX, USA
Richard Clark, PT, PhD Tennessee State University Nashville, TN, USA
Juan Colado, PT, PhD University of Valencia Valencia, Spain
Brian Cole, MD Midwest Orthopaedics at Rush Chicago, IL, USA
Ann Cools, PT, PhD
Ghent University Ghent, Belgium
Andrew Contreras, DPT, SCS Washington, DC, USA
George Davies, PT, DPT, MEd, SCS, ATC, LAT, CSCS, PES, FAPTA
Georgia Southern University Savannah, Georgia, USA
Pete Draovich, PT
Jacksonville Jaguars Footbal Jacksonvile, FL, USA
Jeffrey Dugas, MD Andrews Institute & Sports Medicine Center Birmingham, AL, USA
Jiri Dvorak, MD Schulthess Clinic Zurich, Switzerland
Todd Ellenbecker Rehab Plus Phoenix, AZ, USA
Carolyn Emery, PT, PhD University of Calgary Calgary, Alberta, Canada
Ernest Esteve Caupena, PT, PhD University of Girona Girona, Spain
Sue Falsone, PT, MS, SCS, ATC, CSCS, COMT Structure and Function Education and A.T. Still University Phoenix, Arizona, USA
J. Craig Garrison, PhD, PT, ATC, SCS Texas Health Sports Medicine Fort Worth, Texas, USA
Maggie Gebhardt, PT, DPT, OCS, FAAOMPT Fit Core Physical Therapy/Myopain Seminars Atlanta, GA and Bethesda, MD, USA
Lance Gill, ATC
LG Performance-TPI Oceanside, CA, USA
Phil Glasgow, PhD, MTh, MRes, MCSP Sports Institute of Northern Ireland Belfast, Northern Ireland, UK
Robert S. Gray, MS, AT Cleveland Clinic Sports Health Cleveland, Ohio, USA
Jay Greenstein, DC Kaizo Health Baltimore, MD, USA
Martin Hagglund, PT PhD
Linkoping University Linkoping, Sweden
Allen Hardin, PT, SCS, ATC, CSCS
University of Texas Austin, TX, USA
Richard Hawkins, MD
Professor of surgery, University of South Carolina
Adjunct Professor, Clemson University
Principal, Steadman Hawkins, Greenville and Denver (CU)
John D.Heick, PT, PhD, DPT, OCS, NCS, SCS
Northern Arizona University Flagstaff, AZ, USA
Tim Hewett, PhD
Hewett Consulting Minneapolis, Minnesota, USA
Per Hølmich, MD
Copenhagen University Hospital Copenhagen, Denmark
Kara Mae Hughes, PT, DPT, CSCS
Wolfe PT Nashville, TN, USA
Lasse Ishøi, PT, MSc
Sports Orthopedic Research Center
Copenhagen University Hospital Hvidovre, Denmark
Jon Karlsson, MD Sahlgrenska University Goteborg, Sweden
Brian Kelly, MD Hospital for Special Surgery New York, NY, USA
Benjamin R. Kivlan, PhD, PT, OCS, SCS Duquesne University Pittsburgh, PA, USA
Dave Kohlrieser, PT, DPT, SCS, OCS, CSCS
Ortho One Columbus, OH, USA
Andre Labbe PT, MOPT
Tulane Institute of Sports Medicine New Orleans, LA USA
Henning Langberg, PT, PhD University of Copenhagen Copenhagen, Denmark
Robert LaPrade, MD Twin Cities Orthopedics Edina, MN, USA
Lace Luedke, PT, DPT University of Wisconsin Oshkosh Oshkosh, WI, USA
Phillip Malloy, PT, PhD
Arcadia University/Rush University Medical Center Glenside, PA and Chicago, IL, USA
Terry Malone, PT, EdD, ATC, FAPTA University of Kentucky Lexington, KY, USA
Robert Mangine, PT University of Cincinnati Cincinnati, OH, USA
Eric McCarty, MD University of Colorado Boulder, CO, USA
Ryan P. McGovern, PhD, LAT, ATC Texas Health Sports Medicine Specialists Dallas/Fort Worth, Texas, USA
Mal McHugh, PhD
NISMAT
New York, NY, USA
Joseph Miller, PT, DSc, OCS, SCS, CSCS
Pikes Peak Community College Colorado Springs, CO, USA
Havard Moksnes, PT PhD
Oslo Sports Trauma Research Center Oslo, Norway
Andrew Murray, MD, PhD
European PGA Tour Edinburgh, Scotland, UK
Andrew Naylor, PT, DPT, SCS
Bellin Health
Green Bay, WI, USA
Stephen Nicholas, MD NISMAT New York New York, NY, USA
John O'Donnel, MD
Royal Melbourne Hospital Melbourne, Australia
Russ Paine, PT McGovern Medical School Houston, TX, USA
Snehal Patel, PT, MSPT, SCD
HSS Sports Rehabilitation Institute New York, NY, USA
Marc Philippon, MD
Steadman-Hawkins Clinic Vail, CO, USA
Kevin Plancher, MD, MPH, FAAOS
Plancher Orthopedics and Sports Medicine
New York, NY USA
Marisa Pontillo, PT, PhD, DPT, SCS
University of Pennsylvania Health System Philadelphia, PA, USA
Matthew Provencher, MD
Steadman Hawkins Clinic Vail, CO, USA
Charles E. Rainey, PT, DSc, DPT, MS, OCS, SCS, CSCS, FAAOMPT
United States Public Health Service Springfield, MO, USA
Alexandre Rambaud, PT PhD Saint-Etienne, France
Carlo Ramponi, PT Physiotherapist, Kinè Rehabilitation and Orthopaedic Center Treviso, Italy
Michael Reiman, PT, PhD Duke University Durham, NC, USA
Mark F. Reinking, PT, PhD, SCS, ATC Regis University Denver, CO, USA
Mark Ryan, ATC Steadman-Hawkins Clinic Vail, CO, USA
David Sachse, PT, DPT, OCS, SCS USAF San Antonio, TX, USA
Marc Safran, MD Stanford University Palo Alto, CA, USA
Alanna Salituro, PT, DPT, SCS, CSCS New York Mets Port Saint Lucie, FL, USA
Mina Samukawa, PT, PhD, AT (JSPO) Hokkaido University Sapporo, Japan
Barbara Sanders, PT, PhD, FAPTA, Board Certified Sports Physical Therapy Emeritus Professor and Chair, Department of Physical Therapy Texas State University Round Rock, TX, USA
Felix “Buddy” Savoie, MD, FAAOS Tulane Institute of Sport Medicine New Orleans, LA, USA
Teresa Schuemann, PT, DPT, ATC, CSCS, Board Certified Specialist in Sports Physical Therapy Evidence in Motion Fort Collins, CO, USA
Timothy Sell, PhD, PT, FACSM Atrium Health Musculoskeletal Institute Charlotte, NC, USA
Andreas Serner, PT PhD
Aspetar Orthopedic and Sports Medicine Hospital Doha, Qatar
Ellen Shanley, PT, PhD ATI Spartanburg, SC, USA
Karin Silbernagel, PT, PhD University of Delaware Newark, DE, USA
Holly Silvers, PT, PhD Velocity Physical Therapy Los Angeles, CA, USA
Lynn Snyder-Mackler, PT, ScD, FAPTA STAR University of Delaware Newark, DE, USA
Alston Stubbs, MD Wake Forest University Winston-Salem, NC, USA
Amir Takla, B.Phys, Mast.Physio (Manip), A/Prof
Australian Sports Physiotherapy The University of Melbourne Melbourne, Australia
Charles Thigpen, PhD, PT, ATC ATI
Spartanburg, SC, USA
Steven Tippett, PT, PhD, ATC, SCS Bradley University Peoria, IL, USA
Tim Tyler, PT, ATC NISMAT New York, NY, USA
Timothy Uhl, PT, PhD, ATC University of Kentucky Lexington, KY, USA
Bakare Ummukulthoum, PT University of the Witswatersrand Johannesburg, Gauteng, South Africa
Yuling Leo Wang, PT, PhD Sun Yat-sen University Guangzhou, China
Mark D. Weber, PT, PhD, SCS, ATC Texas Women’s University Dallas, TX, USA
Richard B. Westrick, PT, DPT, DSc, OCS, SCS US Army Research Institute Boston, MA, USA
Chris Wolfe, PT, DPT Belmont University Nashville, TN, USA
Tobias Wörner, PT, MSc Lund University Stockholm, Sweden


MSK Certi昀cation Program
Prepare for success with our tailored program.
D No Cost for ATI Clinicians
Invest in your future without the price tag.
D Self-Paced Online Learning
Flexible learning, fit for your schedule.
D 45+ CEU Hours
Stay current with recognized CEUs.


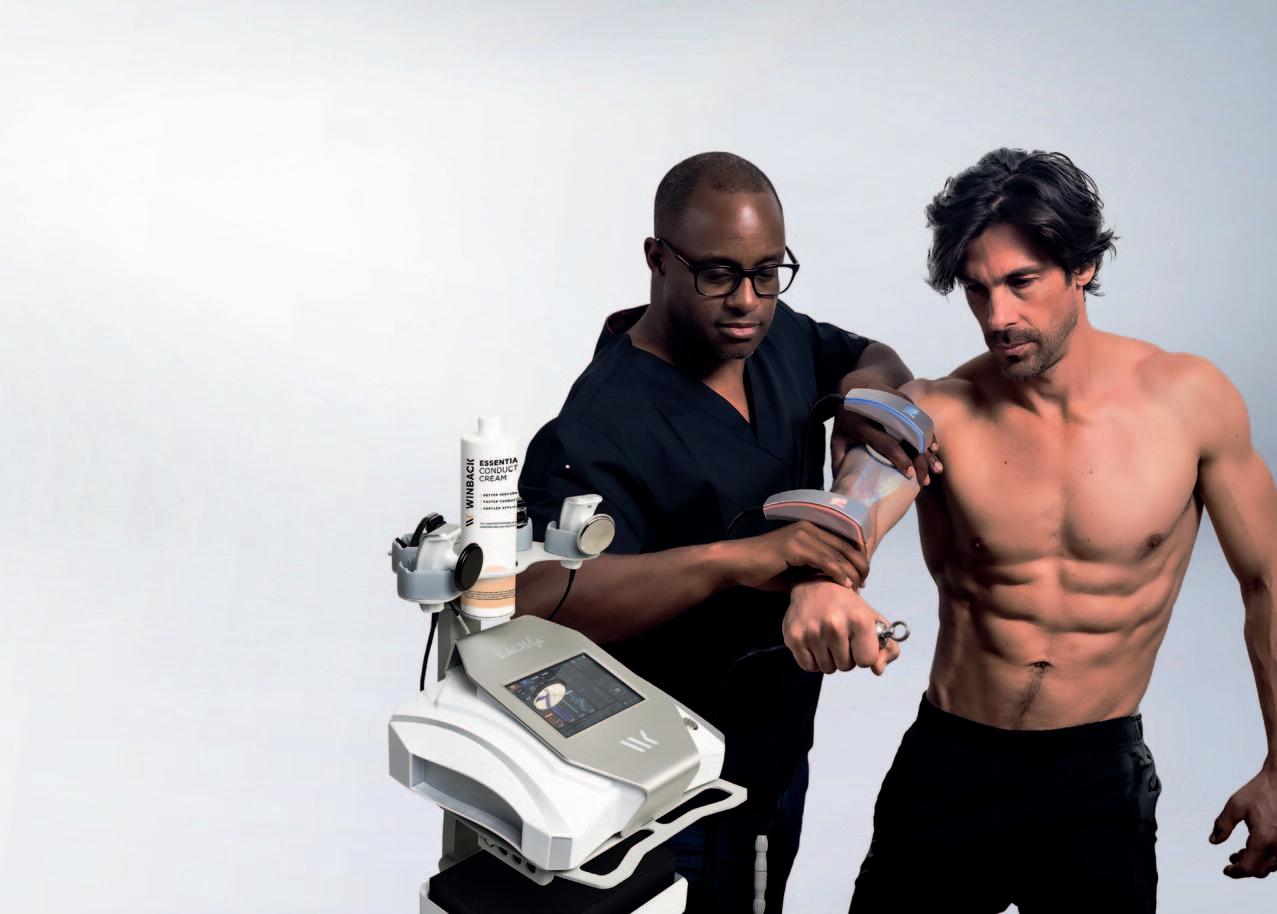
Most Advanced Electrotherapy Device: Powerful, intuitive and user-friendly
Treat up to three body zones at once on all types of tissues
Effective in less than 10 minutes Enter A New Era of Therapy
TECAR
HIGH FREQUENCY
Metabolic Action at Cell Level
Hi-TENS
LOW FREQUENCY IN PULSED HIGH FREQUENCY
Ultimate Pain Management
Hi-EMS
MEDIUM FREQUENCY
Deep Muscle Contraction

VOLUME 19, NUMBER 5
PAGE TITLE
INTERNATIONAL PERSPECTIVE
510 The SportsComp Erasmus+ project. An Initial WP2 Protocol Overview: The International and Multidisciplinary Delphi and Qualitative Study.
Tassignon B, Ramponi C, Hirvonen A, Arend M, Kapreli E, Verschueren J.
CLINICAL VIEWPOINT
513 Management of High Ankle Sprains Utilizing the Tightrope Surgical Procedure – A Novel Approach for a Rapid Return to Play.
Voight ML, Norman C, Wilk K, Lucas M, Wolfe C.
SYSTEMATIC REVIEW
522 Risk Factors Associated With First Time and Recurrent Shoulder Instability: A Systematic Review. Wright AA, Wassinger C, Spontelli Gisselman A, et al.
ORIGINAL RESEARCH
535 Individualized Technique Feedback for Instant Technique Improvements and Knee Abduction Moment Reductions – A New Approach for "Sidestepping" ACL Injuries?
Bill K, Mai P, Mausehund L, et al.
548 Interpersonal Coordination between Female Soccer Players: Leader-Follower Roles within a Collision-\ Avoidance Task.
Fernandes CA, Norte GE, Schwab SM, et al.
561 Are Functional Performance Test Scores Better When Compared to Baseline or Contralateral Limb Scores Following LE Injury in Adolescent Athletes.
Jones E, Jochum J, Corn H, et al.
569 Muscle Activity and Kinematics During Three Hamstring Strengthening Exercises Compared to Sprinting: A Cross-Sectional Study.
Jorge A, Lichtenstein E, Faude O, et al.
581 Reliability and Validity of Visual Estimation in Determining Thorax Rotation Mobility using the Quadruped Lumbar-Locked Position.
Whetstone K, Matsel K, Patton A, et al.
591 Preparation For Flight: The Physical Profile of Pre-Professional and Professional Circus Artists in the United States.
Greenspan SJ, Stuckey MI.
CASE REPORT
609 Clinical Progression and Load Management for Proximal Hamstring Tendinopathy in A Long-Distance Runner – A Case Report.
Campos Villegas C, Ortega-Pérez de Villar L, Alarcon-Jimenez J, et al.
618 Triceps Tendon Avulsion in a Soldier: A Case Report.
Chorba RS, Hu CG, Feldtmann JJ.
CLINICAL COMMENTARY
625 Associations Between Hip Pathology, Hip and Groin Pain, and Injuries in Hockey Athletes: A Clinical Commentary.
Kelly M, Secomb JL.
MSK ULTRASOUND BITES: TIPS AND TRICKS
642 The Utilization of Diagnostic Musculoskeletal Ultrasound in the Evaluation of Gluteus Medius Tendon Pathology: A Perspective for Rehabilitation Providers.
Manske RC, Voight M, Page P, Wolfe C.
DIGITAL HEALTH CORNER BY GENIE HEALTH
646 Data-Driven Prognosis and Improved Outcomes Part 2: The Opportunity of Grading Risk.
Gray Cook, MSPT, OSC CSCS
VOLUME 19, NUMBER 5
PAGE TITLE
LETTER TO THE EDITOR
649 Letter to the Editor Concerning: "An Interval Throwing Program for Baseball Pitchers Based upon Workload Data.”
Wong R, Evans D, Meister K.
RESPONSE TO LETTER TO THE EDITOR
653 Author Response - Letter to the Editor Concerning: "An Interval Throwing Program for Baseball Pitchers Based upon Workload Data.”
Reinold MM, Dowling B, Fleisig GS, Macrina LC, Wilk KE, Streepy JT, Andrews JR.
Bruno Tassignon
VUB co-coordinator - Human Physiology and Sports Physiotherapy Research Group, Vrije Universiteit Brusse
Carlo Ramponi
IFSPT Project Management Group Representative, International Federation of Sports Physical Therapy
Armi Hirvonen
SportsComp Project Manager, Jamk University of Applied Sciences
Mati Arend
UT Coordinator, University of Tartu
Eleni Kapreli
UTH coordinator, University of Thessaly
Jo Verschueren
VUB coordinator - Human Physiology and Sports Physiotherapy Research Group, Vrije Universiteit Brussel
Within the overarching framework of the SportsComp Erasmus+ project, Work Package 2 (WP2) aims to enhance the quality of sports physiotherapy education through competencies update and development.1 WP2 is coordinated by the Vrije Universiteit Brussel (VUB) in collaboration with the University of Thessaly (UTH), the International Federation of Sports Physical Therapy (IFSPT), the University of Tartu (UT) and Jamk University of Applied Sciences (Jamk). This phase is dedicated to updating competencies and delineating the role of sports physiotherapists within sports and health systems. WP2 is envisioned as a foundational step toward creating e-learning courses and a tutor guide intended to facilitate competence development, learning, and pedagogy across academic, professional, and diverse learning environments.
In the first phase of WP2, the consortium pursues ethical approval and refines the methodology for the Delphi survey-based study, stakeholder interviews and focus groups.
Central to the progression of WP2 is the Delphi survey, a methodical approach to soliciting expert perspectives and building consensus. The process commences with Round 1, where surveys are crafted with the intention to distribute to all 40 IFSPT member organisations and
through four members of World Physiotherapy for reaching the submitted aim to reach a consensus as wide and global as possible. As stated in the SportsComp Erasmus+ application, the study aims to secure participation from at least 30 member organisations, ensuring representation across high-, middle- and low-income countries. Each member organisation is called upon to nominate expert sports physiotherapists. These surveys, rooted in the foundational 11 competencies identified in prior stages, serve as the initial catalyst for dialogue and reflection within the global sports physiotherapy community.
Following the dissemination of surveys, monitoring mechanisms through REDCap® track survey rounds and participant engagement2,3 as the project is committed to achieving consensus on over 80% of the competency profile within two rounds. Next, data analysis ensues to distil key insights and propose updates to the existing competency framework. The findings are compiled into data reports, ensuring transparency and accountability in communicating the results. This phase also entails active engagement with survey participants, IFSPT member organisations, and project stakeholders to foster a collaborative environment conducive to knowledge exchange and refinement of ideas.
As the Delphi process evolves, subsequent surveys (minimally two rounds) are deployed across six continents to capture diverse perspectives and ensure a holistic representation of global insights. Iterative rounds continue until a consensus is achieved, with periodic reviews and adjustments to accommodate emerging trends and evolving practices within the field of sports physiotherapy.
From Survey to Synthesis: Charting the Course for Competency Advancement
Focus groups and interviews complement the Delphi study. Under the leadership of the UTH, these qualitative research methodologies are employed to capture the voices of end-users and stakeholders. Athletes, alongside athlete support personnel and sporting or national healthcare organisations, form the crux of the end-users. Stakeholders range from Regional Olympic committees to international sport federations and International Olympic and Paralympics committee. Through the focus groups and structured interviews, insights are garnered and transcribed for in-depth thematic analysis.
The qualitative data obtained from these engagements serve as the foundation for delineating the expected competencies of sports physiotherapists across different contexts, ranging from elite sports settings to community healthcare environments. The data analysis culminates in extensive reports at each project stage. This qualitative exploration adds depth and nuance to the competency framework, ensuring alignment with the evolving needs and expectations of end-users and stakeholders within the sports and healthcare systems.
Cultivating Consensus: A Collaborative Endeavour in Sports Physiotherapy Education
As WP2 progresses, an essential milestone is the Partner Consensus Meeting, scheduled for 24-26 April 2024 in
Brussels (Belgium). This meeting brings together all project partners to deliberate and solidify consensus on identified competencies and roles collectively. It is an opportunity for further knowledge exchange and crosspollination of ideas, fostering synergy and alignment across diverse perspectives and expertise.
Ultimately, the conclusion of WP2 lies in synthesising the findings into a comprehensive Final Report. Led by Jamk and participated by all project partners, this report contains an international consensus on sports physiotherapy competency profiles within a global context. Grounded in the European Qualifications Framework (EQF) Level 7 standards, this report will elevate the standards of sports physiotherapy practice and will propel the field forward on a global scale. The dissemination of the updated competency profile to all stakeholders underscores the commitment to transparency and collaboration. Integrating this approach, WP2 aims to inspire the improvement of sports physiotherapy education, catalysing advancements in healthcare and sports systems worldwide.
1. Ramponi C, Hirvonen A, Arend M, et al. The Sportscomp Erasmus+ Project: Higher Education to Improve Competency in Sports Physiotherapy. Int J Sports Phys Ther. 2024;19(2):142-144.
2. Harris PA, Taylor R, Minor BL, et al. The REDCap consortium: Building an international community of software platform partners. J Biomed Inform. 2019;95:103208.
3. Harris PA, Taylor R, Thielke R, et al. Research electronic data capture (REDCap)—A metadatadriven methodology and workflow process for providing translational research informatics support. J Biomed Inform. 2009;42(2):377-381.


Michael L. Voight, DHSc, OCS, SCS, ATC, FAPTAa , Connor Norman, PT, DPT, ATC, SCS, NREMT, Kevin Wilk, PT, DPT, FAPTA, Matthew Lucas, PT, DPT, Chris Wolfe, PT, DPT, OCS, Cert MDT
Keywords: syndesmotic sprain, ankle, tightrope procedure, ankle rehab, ankle sprain https://doi.org/10.26603/001c.116862
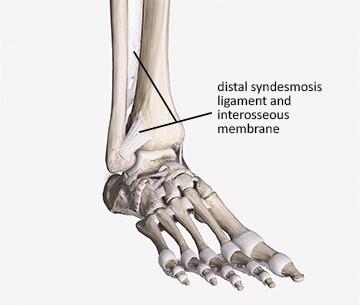
The distal tibiofibular joint is described as a syndesmosis. The syndesmosis is important to the structural integrity of the ankle joint by maintaining the proximity of the tibia, fibula, and talus. Syndesmotic or high ankle sprains, involving the syndesmotic ligaments, pose a significant rehabilitative challenge due to their intricate anatomy, prolonged recovery periods following injury, and high susceptibility to persistent disability Traditional management strategies have often been conservative, marked by lengthy periods of immobilization and a gradual return to activity. Severe syndesmotic injuries with diastasis have been treated surgically with screw fixation which may require a second intervention to remove the hardware and carries an inherent risk of breaking the screw during rehabilitation. Another fixation technique, the Tightrope™, has gained popularity in treating ankle syndesmosis injuries. The TightRope™ involves inserting Fiberwire® through the tibia and fibula, which allows for stabilization of the ankle mortise and normal range of motion. The accelerated rehabilitation protocol promotes early weight-bearing and has been shown to expedite the return to sport. This emerging strategy has shown promise in reducing recovery time as it is now possible to return to sport in less than 2 months after a tightrope repair and accelerated rehabilitation, compared with 3–6 months post screw fixation. This clinical commentary delves into this novel approach, highlighting the procedure, rehabilitation protocols, and the implications for physical therapy practice.
Syndesmosis injuries, or ‘high ankle sprains’, are relatively uncommon making up between 1% and 18% of ankle ligament injuries.1,2 This large variation might indicate an under-reporting of these injuries,6 reflecting the difficulty identifying syndesmotic ligament damage.3 Syndesmotic ankle sprains, occur less frequently than the traditional lateral ankle sprain. Syndesmotic injuries result from excessive external rotation or forced dorsiflexion of the foot, often seen in sports involving a cutting motion.4 Injury can also occur following a forced external rotation movement on a fixed foot as can occur during contact sports.4 Unlike lateral ankle sprains, high ankle sprains are notorious for prolonged recovery times and a high rate of residual symptoms, often leading to diminished performance.5‑7 Sporting populations are more likely to suffer from syndesmotic injuries due to the forces required to damage the ligaments.3,
8 Delayed or inadequate treatment can lead to chronic instability, pain, and early joint degeneration. Not only are syndesmotic injuries associated with higher levels of disability, but they also present with prolonged periods out of sporting participation lasting for 3 – 6 months.5‑11 Syndesmotic sprains have often been described as one of the most difficult sporting injuries to treat,3 with rehabilitation potentially taking between twice and 30 times longer than isolated lateral ligament sprains.12 Undiagnosed or incorrectly treated syndesmosis injuries can lead to pain, worsen athletic performance, lengthen recovery, and cause arthrosis.13
Before delving into treatment options, it is essential to understand the anatomy. An intact distal syndesmotic ligament complex is important for stability in the ankle joint.
Corresponding Author mike.voight@belmont.edu
anatomy
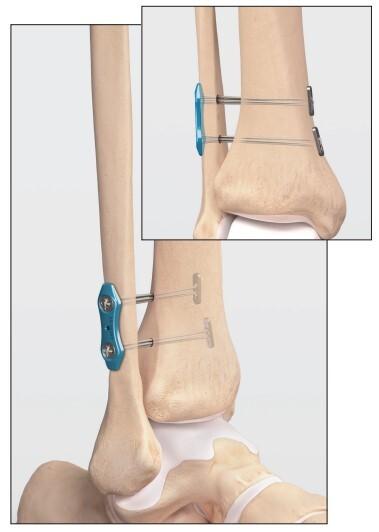
The distal tibiofibular joint is described as a syndesmosis. It comprises the tibia and fibula, the fibrous interosseous membrane (IOM) between the two bones, the anterior inferior tibiofibular ligament (AITFL), posterior inferior tibiofibular ligament (PITFL), transverse ligament (TL) and the interosseous ligament (IOL).1 (Figure 1)
Treatment strategies for high ankle sprains range from conservative management with immobilization and physical therapy to surgical intervention. Conservative management revolves around the RICE protocol (Rest, Ice, Compression, Elevation), bracing, and a gradual approach to rehabilitation. There are several surgical options to consider in maintaining the structural integrity of the ankle joint after a grade II or when a higher syndesmosis injury has occurred. Syndesmotic screw (SS) fixation has traditionally been accomplished with transosseous screws, and it remains the most commonly utilized method of fixation for syndesmosis injury 14 In this procedure, screws are implanted through the fibula into the tibia to stabilize the syndesmosis. This poses problems for the athletic population as screw fixation can lead to syndesmosis malreduction and has been reported in up to 50% of cases.15‑18 Additional concerns of this technique include screw loosening, screw breakage, and the potential need for screw removal between 3 and 6 months post fixation, potentially delaying rehabilitation and return to sport.17,19‑21 An unstable syndesmosis injury requiring surgical fixation will commonly require 4–6 months before successful return to sport.16 However, this paradigm is shifting with the introduction of the tightrope surgical procedure, which promotes dynamic stabilization of the syndesmosis, and aggressive post-operative rehabilitation.
2. Tight rope procedure (Arthrex Inc. (2017). Dual Syndesmosis TightRope® Implant System Surgical Technique [Brochure]. Retrieved from https://www.arthrex.com/resources/LT1-00066-EN/ dual-syndesmosis-tightrope-implantsystem?referringteam=foot_and_ankle)
The tightrope procedure has been popularized in high profile sports and gained traction in recent years as a minimally invasive surgical option that provides immediate stabilization of the syndesmosis. This technique uses a suture-button construct, known as the Tight-Rope™ (Arthrex, Inc, Naples, FL).22 This surgical procedure is performed by inserting a No.5 FiberWire® loop (Arthrex) through the tibia and fibula and placing tension on the FiberWire® (Figure 2). (Video animation: https://youtu.be/ imsmVQyRGRA?si=9fj7gVY5UoN0UMXq) This provides physiologic stabilization of the ankle mortise and reduces the need for a second procedure to remove the hardware.16 The tightrope procedure has a number of advantages over traditional screw fixation: it allows for a small amount of normal biomechanical movement at the syndesmosis; it rarely requires a second operation to remove the device; it provides significantly better anatomic reduction and it allows for earlier return to weight-bearing, rehabilitation and ultimately sport.8,16,22‑24
1. Immediate Weight Bearing Stability: The construct creates immediate stabilization of the syndesmosis which allows for early weight-bearing expediting the recovery and minimizing muscle atrophy
Figure 1. Syndesmosis Figure2. Maintains Joint Mobility: Traditional screw fixation can limit tibiofibular motion, potentially altering ankle biomechanics. The tightrope maintains physiologic motion while ensuring stability and reducing the risk of malreduction and hardware failure. This can accelerate rehabilitation and reduce post-operative stiffness.
3. No Need for Secondary Surgery: In many cases, the tightrope remains in place indefinitely and does not typically need to be removed, unlike syndesmotic screws which may require a second procedure in cases of breakage or discomfort.
Rehabilitation plays a pivotal role in optimizing outcomes post-tightrope surgery In conjunction with the tightrope procedure, the rehabilitation approach is more intensive and initiated earlier than traditional protocols in order to expedite recovery. This approach challenges traditional protocols by promoting earlier weight-bearing and active motion. The primary goals are to restore range of motion (ROM), enhance muscular strength, improve proprioception, and facilitate a quicker return to full activity An aggressive post-operative rehabilitation strategy after the tightrope procedure is essential for optimal outcomes.
The approach should be progressive and tailored, focusing on:
1. Early Mobilization: Aided by the tightrope procedure’s stability, early ankle mobilization can combat stiffness, enhance circulation, and facilitate tissue healing. Gentle range-of-motion exercises can be introduced within the first post-operative week.
2. Early Weight-bearing Progression: The stability conferred by the tightrope allows for a quicker transition to partial and then full weight-bearing. Therefore, Controlled weight-bearing can be introduced earlier than traditional protocols. This progression not only aids in functional recovery but also decreases the risk of osteopenia associated with prolonged immobilization.
3. Strength Training: Resistance exercises targeting the calf, peroneals, and intrinsic foot muscles should be initiated as soon as pain allows. Strengthening these muscles ensures dynamic ankle stability and promotes optimal gait patterns. In addition, improving hip and core strength is critical in controlling medial/ lateral ankle movements which is important to control with ankle injuries. Proximal stability for distal mobility is critical to restore and improve.
4. Proprioceptive Training: High ankle sprains can impair proprioceptive feedback. Incorporating balance exercises more quickly can restore proprioceptive acuity and reduce reinjury risk. Essential element to successful rehabilitation is the enhance proprioception & improve neuromuscular control of the entire lower extremity
5. Functional Retraining: Sport or activity-specific drills should be integrated as the patient approaches the fi-
nal rehabilitation stages. This ensures a safe return to pre-injury activity levels. The authors of this article strongly believe a functional return to play testing protocol and criteria.
Goals: Manage pain, control swelling, and protect the surgical site.
Immediate Post-Operative Phase (0-1 weeks): The rehabilitation commences within 24-48 hours post-surgery, a stark contrast to the traditional approach of immobilization. Pain management is crucial, utilizing cryotherapy, elevation, and analgesics. During the first 4 days the ankle will be wrapped in a compressive bandage and treated with elevation, pain control, cold compression device, and kept NWB. The dressing is typically removed on day 4 and the focus shifts to rehabilitation, focusing on a weight bearing progression with selling control. Given the dynamic stability offered by the tightrope system, partial weight-bearing progressing begins on day 4 to weight bearing tolerated in CAM walking boot is encouraged, using assistive devices as necessary The rehabilitation specialist must closely monitor for any signs of excessive pain, swelling, or complications. Early interventions include passive and active-assisted ROM exercises, isometric contractions of the ankle musculature, and gentle mobilizations performed by the therapist to preserve joint mobility
Strengthening of the hip and core, quads and hamstrings can be successfully & safely performed during the first week following surgery Intrinsic strengthening of the foot muscles can be performed but we recommend no ankle strengthening during the early healing phase. (See Table 1)
Goals: Gradual restoration of ankle motion, strength, and proprioception. Full weight bearing out of the boot with normal range of motion by day 20.
During this phase, the intensity of the rehabilitation program increases. Weight-bearing is progressed and wean out of the boot day 8 to 12, and progress to an ASO brace for ambulation. Emphasis during this this phase will focus on normalizing gait patterns. Therapists incorporate proprioceptive exercises, such as single leg stands and balance board activities, to restore neuromuscular control. Proprioception and neuromuscular control drill should be emphasized during this timeframe.
During week 2, ankle strengthening exercises are initiated and other lower extremity strengthening exercises employing closed kinetic chain exercises and functional balance drills within pain limits. Pool exercises may also be utilized, to employ the water’s buoyancy to facilitate safe, effective strength exercises and gait training. Continuous reassessment ensures that the interventions align with the healing timeline and patient tolerance. Be sure to restore hip mobility and hip/core strength before beginning a running and agility program in the phase.
Table 1. Immediate Post Operative Phase
Immediate Post Operative Phase (0-7 days)
Phase Goals: Milestones:
• Tissue healing
• Wound care
• Edema control
• Regain full ROM
ROM:
Muscle Performance: Neuro Re-Education:
• Effusion: 0-trace
• AROM initiated
• PROM tolerated
• Early strengthening
Treatment Strategies
• Begin with active and active assist ROM exercise dorsiflexion/plantarflexion sliders
• PROM: calf stretch w/ belt
• Avoid rotational stresses to the ankle.
• Avoid eversion stress to ankle if deltoid ligament is also injuries.
• Foot intrinsics: toe yoga, marbles, towel scrunches
• Ankle 4-way isometrics
• OKC Hamstring strengthening.
• OKC Quadricep strengthening.
• OKC Hip muscle strengthening
• BAPS
• Medial/lateral stability board: seated.
• Anterior/posterior stability board: seated.
Manual Therapy: Progressing based on patient tolerance.
Modalities
Table 2. Intermediate Phase
• Ice, Laser, Shock Wave
• Compression
• NMES for motor unit recruitment
Intermediate Phase (Weeks 1-3)
Phase Goals: Milestones:
• Progressed weight bearing (full WB out of boot by day 20)
• Improved proprioception
• Improved ankle strength
• >75% ankle strength in all directions compared to unaffected limb
• Within 5 degrees ankle AROM in all directions compared to unaffected limb
Treatment Strategies ROM:
Muscle Performance:
Neuro Re-Education:
Manual Therapy: Gait Training:
Modalities:
• Continue to full AROM with previous phase exercises (Note: No ankle stretching into dorsiflexion for 2 weeks-active ROM first)
• Begin isotonic strengthening.
• Ankle 4-way w/ resistance (day 14)
• Calf raises: start on shuttle then progress to WB
• CKC double leg strengthening within pain limits.
• Weight shifts based on WB restriction.
• Continue neuro re-education from previous phase.
• Restore/Maintain normal arthrokinematics if needed.
• Begin with partial weight bearing once edema and pain are controlled.
• Continued progressions of WB to full unrestricted.
• Blood flow restriction for strengthening.
• NMES
• Ice
• Compression
It is important to note that during this phase the rehabilitation team does not need to slow the progression down if the athlete is moving faster (See Table 2)
Phase Goals:
• Full AROM
• Full weight bearing
• Improved proprioception
• Strengthening progressions
• Introduction to sport specific activity (late stage)
ROM:
Muscle Performance:
Neuro Re-Education:
Manual Therapy:
Gait Training:
Modalities:
Other:
Functional Rehabilitation Phase (3-5 weeks)
Milestones:
• Normal gait
• > 80% ankle strength compared to unaffected leg.
• Normal AROM bilaterally
Treatment Strategies
• AROM exercises in all directions
• Continued with stretching.
• Continued from previous phase.
• Begin CKC single leg strengthening emphasizing eccentrics.
• Entire lower extremity strengthening
• Hip/Core Strengthening
• Quadriceps/Hamstrings
• Continued from previous phase: progress to challenging unstable surfaces (balance board, BOSU)
• Continue as needed
• Educate proper gait mechanics to normalize gait.
• Hurdles (forward, lateral, retro)
• Heel walking.
• Toe walking
• If normal walking, and has passed return to run protocol, begin running program
• Continued from previous phase as needed.
• Aerobic exercise for warm up
• Basic sport/activity specific movement
Goals: single leg muscular strength, enhance proprioception & neuromuscular control and restore functional movement patterns.
The objective shifts to restoring full function and a safe return to sport or activity. Exercises are more dynamic, incorporating plyometrics, agility drills, and sport-specific movements. Strength training progresses to include eccentric exercises for muscle-tendon optimization. Gradually progress to agility drills, neurocognitive drills and reactive dynamic stabilization.
During this phase, gait training continues with resumption of a normal gait pattern in a normal shoe. A running progression is implemented after 2 full weeks of pain free walking. The introduction straight line running and cutting are evaluated using functional assessments to gauge readiness for return to play, focusing on symmetry and performance in comparison to the uninjured side. In addition, the athlete must continue lower extremity strengthening, ankle mobility, and dynamic stabilization and neuromuscular control drills. (See Table 3)
Goals: Gradual return to sports or desired activities, improve agility, and enhance performance.
Interventions: Sport-specific drills, plyometrics, and high-intensity functional exercises. Focus on change of direction and deceleration drills.
Return to play testing and criteria: Consider using a reactive T run for time, reactive L run for time, single leg hop tests, single leg squat that’s symmetrical and 15 single leg hops which are pain free and symmetrical.25 (See Table 4)
The tightrope procedure and the associated aggressive rehabilitation model have several implications for rehabilitation:
1. Early Intervention: Given the potential for early weight-bearing, rehabilitation providers must be equipped to manage these patients sooner post-operatively than traditional surgical interventions.
2. Dynamic Assessment: The suture-button device allows for tibiofibular motion. Clinicians should be skilled in assessing this motion and understanding its implications for rehabilitation.
Return to Play Phase (week 4-6 >)
Phase Goals: Milestones:
• Improve muscular strength.
• Restore functional movement patterns.
• Improve agility
• Functional return to Play Testing
• Return to sport/activity
• Enhance performance.
ROM:
Muscle Performance:
Neuro Re-Education:
Manual Therapy:
Gait Training:
Modalities:
Other:
• >90% ankle strength compared to unaffected leg
• T & L Runs
• Hop Testing
• Sprinting (if applicable)
Treatment Strategies
• Continued from previous phase if needed – full symmetrical ROM
• Continued from previous phase.
• Progressions from static strengthening exercise to CKC dynamic strengthening for stability and function
• Continued single leg strengthening
• Sport specific activity
• Acceleration drills
• Deceleration drills
• Change of direction
• Sprinting progressions
• Reactive balance activity
• Dynamic balance activity
• Balance with landing/plyometrics
• Sprinter hops
• Continued from previous phase - if needed
• Continued from previous phase.
• Work on running mechanics.
• Continued from previous phase as needed.
• Begin low level plyometrics (return to jogging on treadmill-field)
• Progress agility drills
• Progress sport specific movements (acceleration, hopping, etc)
3. Patient Education: Educating patients about the procedure, recovery timeline, and importance of adherence to rehabilitation is crucial.
4. Interdisciplinary Collaboration: Understanding the surgeon’s preferences, post-operative protocols, and any potential complications is essential for individualized patient care. Collaboration between orthopedic surgeons, physical therapists, and other healthcare professionals is crucial for the success of this protocol.
Despite the promising outcomes associated with the tightrope procedure and aggressive rehabilitation, clinicians must remain circumspect. Not all patients with high ankle sprains may be suitable candidates for this approach. Factors like the extent of injury, patient’s general health, activity levels, and goals should be considered. Individual variability in pain tolerance, healing capacity, deltoid ligament involvement, and pre-injury fitness levels necessitates a tailored approach. Furthermore, the definition of “aggressive” can vary significantly; thus, therapists must avoid a one-size-fits-all methodology. While the tightrope
procedure with aggressive rehabilitation offers many advantages, clinicians must be wary of potential pitfalls:
1. Over-aggression: Pushing too hard, too soon can exacerbate inflammation and delay healing. Rehabilitation progression should always be pain guided.
2. Scar Tissue Formation: Early mobilization minimizes scar tissue but does not eliminate the risk. Manual therapy techniques, like cross-friction massage or instrument-assisted soft tissue mobilization, can help address fibrotic changes.
3. Residual Instability: Despite surgical stabilization, some patients may report feelings of instability Bracing or taping techniques can be adjunctive tools in these instances.
Compliance and education are pivotal. Patients who are informed about their recovery timelines and the rationale behind their rehabilitation protocol are more likely to adhere to home exercise programs and post-operative instructions. Additionally, interprofessional collaboration is essential.
The tightrope surgical procedure is a new surgery procedure for high ankle sprains presents a promising avenue for expedited recovery and optimal functional outcomes. When paired with aggressive post-operative rehabilitation, patients can expect a comprehensive approach that addresses not just anatomical integrity but functional prowess as well. The combination of this procedure with an aggressive post-operative rehabilitation approach can lead to faster recovery times, improved function, and a quicker return to sport or desired activities. While initial studies have shown promising results, long-term outcomes and randomized controlled trials comparing this method to conservative treatments are still needed. With interdisciplinary collaboration, evidence-based practice, and patientcentered care, the management of high ankle sprains will continue to evolve, leading to better outcomes for patients. As with all treatment strategies, individualized care, patient feedback, and evidence-based practice remain at the forefront of ensuring optimal outcomes.
There are several keys to successful rehabilitation, these include allow early healing, restoration of normal hip range of motion and strength, improve ankle dynamic stabilization & control and utilize an objective return to play criteria.
Continued research is imperative to validate the long-term efficacy and safety of the tightrope procedure coupled with aggressive rehabilitation. Comparative studies with traditional management strategies, investigations into patient satisfaction, and qualitative research into patient experiences will enrich the existing body of knowledge. Furthermore, developing standardized guidelines for what constitutes “aggressive rehabilitation” will mitigate the risks of overtreatment and ensure consistency in care delivery © The Author(s)
This is an open-access article distributed under the terms of the Creative Commons Attribution 4.0 International License (CCBY-NC-4.0). View this license’s legal deed at https://creativecommons.org/licenses/by-nc/4.0 and legal code at https://creativecommons.org/licenses/by-nc/4.0/legalcode for more information.
1. Hermans JJ, Beumer A, de Jong TA, et al. Anatomy of the distal tibiofibular syndesmosis in adults: a pictorial essay with a multimodality approach. J Anat. 2010;217:633-645. doi:10.1111/ j.1469-7580.2010.01302.x
2. Mak MF, Gartner L, Pearce CJ. Management of syndesmosis injuries in the elite athlete. Foot Ankle Clin 2013;18:195-214. doi:10.1016/j.fcl.2013.02.002
3. Miller TL, Skalak T. Evaluation and treatment recommendations for acute injuries to the ankle syndesmosis without associated fracture. Sports Med 2014;44:179-188. doi:10.1007/s40279-013-0106-1
4. Hunt KJ, Phisitkul P, Pirolo J, et al. High ankle sprains and syndesmotic injuries in athletes. J Am Acad Orthop Surg. 2015;23:661-673. doi:10.5435/ JAAOS-D-13-00135
5. Sman AD, Hiller CE, Rae K, et al. Diagnostic accuracy of clinical tests for ankle syndesmosis injury. Br J Sports Med. 2015;49:323-329. doi:10.1136/ bjsports-2013-092787
6. Wright RW, Barile RJ, Surprenant DA, et al. Ankle syndesmosis sprains in national hockey league players. Am J Sports Med 2004;32:1-5. doi:10.1177/ 0363546504264581
7. Gerber JP, Williams GN, Scoville CR, et al. Persistent disability associated with ankle sprains: a prospective examination of an athletic population. Foot Ankle Int. 1998;19:653-660. doi:10.1177/ 107110079801901002
8. Hsu AR, Garras DN, Lee S. Syndesmotic injuries in athletes. Oper Tech Sports Med. 2014;22:270-281. doi:10.1053/j.otsm.2014.09.003
9. Vancolen SY, Nadeem I, Horner NS, Johal H, Alolabi B, Khan M. Return to sport after ankle syndesmotic injury: a systematic review. Sports Health 2019;11(2):116-122. doi:10.1177/ 1941738118816282
10. Schepers T. Acute distal tibiofibular syndesmosis injury: a systematic review of suture-button versus syndesmotic screw repair. Int Orthop. 2012;36(6):1199-1206. doi:10.1007/ s00264-012-1500-2
11. Levy DM, Reid K, Gross CE. Ankle syndesmotic injuries: a systematic review. Tech Orthop. 2017;32(2):80-83. doi:10.1097/ BTO.0000000000000226
12. Sman AD, Hiller CE, Rae K, et al. Prognosis of ankle syndesmosis injury Med Sci Sports Exerc 2014;46:671-677. doi:10.1249/ MSS.0000000000000151
13. Street SB, Rawlins M, Miller J. Efffectiveness of the tightrope fixation in treating ankle syndesmotic injuries: A critically appraised topic. J Sports Rehab 2021;30:676-679.
14. Bava E, Charlton T, Thordarson D. Ankle fracture syndesmosis fixation and management: the current practice of orthopedic surgeons. Am J Orthop 2010;39(5):242-246.
15. Gardner MJ, Demetrekopolous D, Briggs SM, Helfet DL, Lorich DG. Malreduction of the tibiofibular syndesmosis in ankle fractures. Foot Ankle Int. 2006;27(10):788-792. doi:10.1177/ 107110070602701005
16. Naqvi GA, Cunningham P, Lynch B, Galvin R, Awan N. Fixation of ankle syndesmotic injuries: comparison of tightrope fixation and syndesmotic screw fixation for accuracy of syndesmotic reduction. Am J Sports Med 2012;40(12):2828-2835. doi:10.1177/0363546512461480
17 Sagi HC, Shah AR, Sanders RW The functional consequence of syndesmotic joint malreduction at a minimum 2-year follow-up. J Orthop Trauma 2012;26(7):439-443. doi:10.1097/ BOT.0b013e31822a526a
18. Weening B, Bhandari M. Predictors of functional outcome following transsyndesmotic screw fixation of ankle fractures. J Orthop Trauma. 2005;19(2):102-108. doi:10.1097/ 00005131-200502000-00006
19. Kocadal O, Yucel M, Pepe M, Aksahin E, Aktekin CN. Evaluation of reduction accuracy of suturebutton and screw fixation techniques for syndesmotic injuries. Foot Ankle Int. 2016;37(12):1317-1325. doi:10.1177/1071100716661221
20. Magan A, Golano P, Maffulli N, Khanduja V Evaluation and management of injuries of the tibiofibular syndesmosis. Br Med Bull 2014;111(1):101-115. doi:10.1093/bmb/ldu020
21. Schepers T, Van Lieshout EM, Van der Linden HJ, De Jong VM, Goslings JC. Aftercare following syndesmotic screw placement: a systematic review J Foot Ankle Surg. 2013;52(4):491-494. doi:10.1053/ j.jfas.2013.03.032
22. Naqvi GA, Shafqat A, Awan N. Tightrope fixation of ankle syndesmosis injuries: clinical outcome, complications and technique modification. Injury 2012;43(22):838-842. doi:10.1016/ j.injury.2011.10.002
23. Rigby RB, Cottom JM. Does the arthrex TightRope® provide maintenance of the distal tibiofibular syndesmosis? A 2-year follow-up of 64 TightRopes® in 37 patients. J Foot Ankle Surg 2013;52:563-567. doi:10.1053/j.jfas.2013.04.013
24. Willmott HJ, Singh B, David LA. Outcome and complications of treatment of ankle diastasis with tightrope fixation. Injury 2009;40(24):1204-1206. doi:10.1016/j.injury.2009.05.008
25. Wilk KE, Thomas ZM, Arrigo CA, Davies GJ. The need to change return to play testing in athletes following ACL injury: A theoretical model. IJSPT 2023;18(25):272-281. doi:10.26603/001c.67988
Systematic Review/Meta-Analysis
Alexis Wright1a , Brandon Ness1 , Angela Spontelli-Gisselman1 , Dora Gosselin2 , Joshua Cleland1 , Craig Wassinger1
1 Department of Rehabilitation Sciences, Tufts University, 2 Pediatric Physical Therapy and Occupational Therapy, Duke Health
Keywords: shoulder, joint instability, shoulder dislocation, odds ratio, risk factor https://doi.org/10.26603/001c.116278
Background
Shoulder instabilities constitute a large proportion of shoulder injuries and have a wide range of presentations. While evidence regarding glenohumeral dislocations and associated risk factors has been reported, less is known regarding the full spectrum of instabilities and their risk factors.
Purpose
The purpose of this systematic review was to identify modifiable risk factors to guide patient management decisions with regards to implementation of interventions to prevent or reduce the risk of shoulder instability.
Systematic Review
Methods
A systematic, computerized search of electronic databases (CINAHL, Cochrane, Embase, PubMed, SportDiscus, and Web of Science) was performed. Inclusion criteria were: (1) a diagnosis of shoulder instability (2) the statistical association of at least one risk factor was reported, (3) study designs appropriate for risk factors, (4) written in English, and (5) used an acceptable reference standard for diagnosed shoulder instability Titles and abstracts were independently screened by at least two reviewers. All reviewers examined the quality studies using the Newcastle-Ottawa Scale (NOS). At least two reviewers independently extracted information and data regarding author, year, study population, study design, criterion standard, and strength of association statistics with risk factors.
Results
Male sex, participation in sport, hypermobility in males, and glenoid index demonstrated moderate to large risk associated with first time shoulder instability. Male sex, age <30 years, and history of glenohumeral instability with concomitant injury demonstrated moderate to large risk associated with recurrent shoulder instability.
Conclusion
There may be an opportunity for patient education in particular populations as to their increased risk for suffering shoulder instability, particularly in young males who appear to be at increased risk for recurrent shoulder instability
Corresponding Author:
Email: alexis.wright@tufts.edu a
Alexis A. Wright, PT, DPT, PhD
Doctor of Physical Therapy Program – Boston, MA
Tufts University School of Medicine
136 Harrison Ave
Boston, MA 02111
Shoulder instability is a common injury with a range of presentations. Attempts to classify shoulder instability commonly include three primary descriptors that depict the severity and mechanism of injury 1 Traumatic shoulder dislocation generally describes structural injury linked to a specific destabilizing event. Microtraumatic subluxations often include structural damage but are not tied to any specific event. Atraumatic instability is not tied to a specific incident and is often linked with altered neuromuscular control, systemic laxity, or anomalies of body structure.
Glenohumeral dislocations are straightforward to diagnose with radiographs in acute assessment and advanced imaging to determine additional tissue injury as needed. The incidence of glenohumeral dislocations has been reported as high as 23.9 (95% CI: 20.8 to 27.0) per 100,000 person-years and a lifetime prevalence between 2-8% in the general population in the United States.2‑4 Risk factors for acute (mostly anterior) dislocation have been identified and include age, sex, sport participation, immobilization protocol, and glenoid shape.5‑12
Instability associated with microtrauma or atraumatic instability is more difficult to diagnose and may present with a range of symptoms from the feeling of looseness or instability to humeral subluxation with immediate reduction.13 The incidence of glenohumeral instability is therefore more difficult to measure.14 Risk factors for instability not associated with dislocation have been infrequently investigated.
Once the diagnosis of glenohumeral instability has been confirmed, management may include surgical stabilization, bracing, and physical therapy 15 Injuries involving glenohumeral instability are associated with high medical costs (with ranges between $973 to $7,800) depending on the complexity and potential surgical interventions.15
Despite the frequency of GH shoulder instability, many unknowns remain regarding risk factors. No consensus exists regarding identifiable risk factors that may be beneficial for physicians and rehabilitation professionals to discern either prevention or appropriate management strategies. Furthermore, the authors are unaware of any systematic review that has investigated risk factors associated with all types of instability, not just shoulder dislocation. Thus, the purpose of this systematic review was to identify modifiable risk factors to guide patient management decisions with regards to implementation of interventions to prevent or reduce the risk of shoulder instability.
This systematic review was performed following the Preferred Reporting Items for Systematic Reviews and MetaAnalyses (PRISMA) guidelines.16 The protocol for this sys-
tematic review was sent for registration a priori to the International Prospective Register of Systematic Reviews (PROSPERO). However, it was “rejected” because “PROSPERO was focusing on COVID-19 registrations during the pandemic.” This registration was automatically rejected because it did not meet all acceptance requirements (i.e. not Covid related). Therefore, the authors registered the protocol in the Open Science Framework. This registration describes all the methods used in this systematic review.
An research librarian with greater than 30 years of experience performed a systematic search in compliance with PRISMA protocol in October of 2022 and again in March of 2023 in the following databases from the time of their inception: PubMed, EMBASE, Cochrane, CINAHL, Web of Science Core Collection, and SportDiscus databases. Search terms (Appendix 1) were developed along with guidance from the librarian and included a combination of the following: shoulder, shoulder joint, glenohumeral joint, instability, dislocation, subluxation, hyperlaxity, prevalence, incidence, risk ratios, and odds ratios. The librarian was not an author or investigator of the review Filters included human subjects and published in the English language. Date restrictions were not applied.
Once the search was complete the librarian imported citations into Covidence software which eliminated any duplicates from multiple databases. Studies were included if they were prospective and retrospective cohort studies which investigated risk factors associated with first time or recurrent shoulder instability defined as dislocation, subluxation, or other symptoms of instability either alone or together Anterior, posterior, and multidirectional instability were all included as were all mechanisms of injury including both traumatic and atraumatic. A diagnosis of instability had to be confirmed with a reference standard of surgery, diagnostic imaging, or required reduction, and a history of prior dislocation for the recurrent instability group. Studies had to include an analytical component (ie, the study examined the relationship between risk factor and shoulder instability), or sufficient data for these to be calculated. All studies needed to be published in the English language. Studies were excluded if they did not meet the above criteria, when subjects had co-existing conditions (e.g., Ehlers-Danlos syndrome), neurological conditions (e.g., Stroke), syndromes, or congenital conditions (e.g. skeletal dysplasia) as well as studies investigating risk factors of instability following surgical intervention. Search strategies along with the number of citations captured in each search are displayed in Appendix 1. Bibliographic reference lists from identified articles were hand searched for any other potential study not identified during the database searches.
After the duplicate articles from the different databases were removed, two independent reviewers screened titles
and abstracts to determine which studies might possibly meet the eligibility criteria. Studies that appeared to satisfy the inclusion/exclusion criteria or whose eligibility could not be determined from the title/abstract screening were retrieved for full-text review All retrieved studies were independently reviewed by at least two named authors. Disagreements between reviewers were resolved by consulting a third author who was blind to other reviewers’ decisions on whether the study should be included.
All six authors used a standardized data extraction form to collate the following information: Author and the year of the study, study design (cohort or case-control) sample size, age, sex, description of shoulder instability reported in the study, refence standard used to determine instability, risk factors and odd ratios or relative risk. If odds ratios or risk ratios were not provided, but summary injury data were provided, ratios were calculated by the authors of this manuscript.
All reviewers examined the quality studies using the Newcastle-Ottawa Scale (NOS) which has been shown to be both reliable and valid for examining longitudinal and case-control studies.17,18 The NOS evaluates three quality parameters (selection, comparability, and outcome) divided across eight specific items, which slightly differ when scoring case control and longitudinal studies.19 A study can be awarded a maximum of one star for each numbered item within the selection and exposure categories. A maximum of two stars can be given for comparability Thus, the maximum for each study is 9, with studies having less than 5 points being identified as representing a high risk of bias.19 Using previously reported recommendations regarding strength of association with likelihood ratios,20 the reported risk factor strength of associated odds ratios was classified as shown in Table 1.
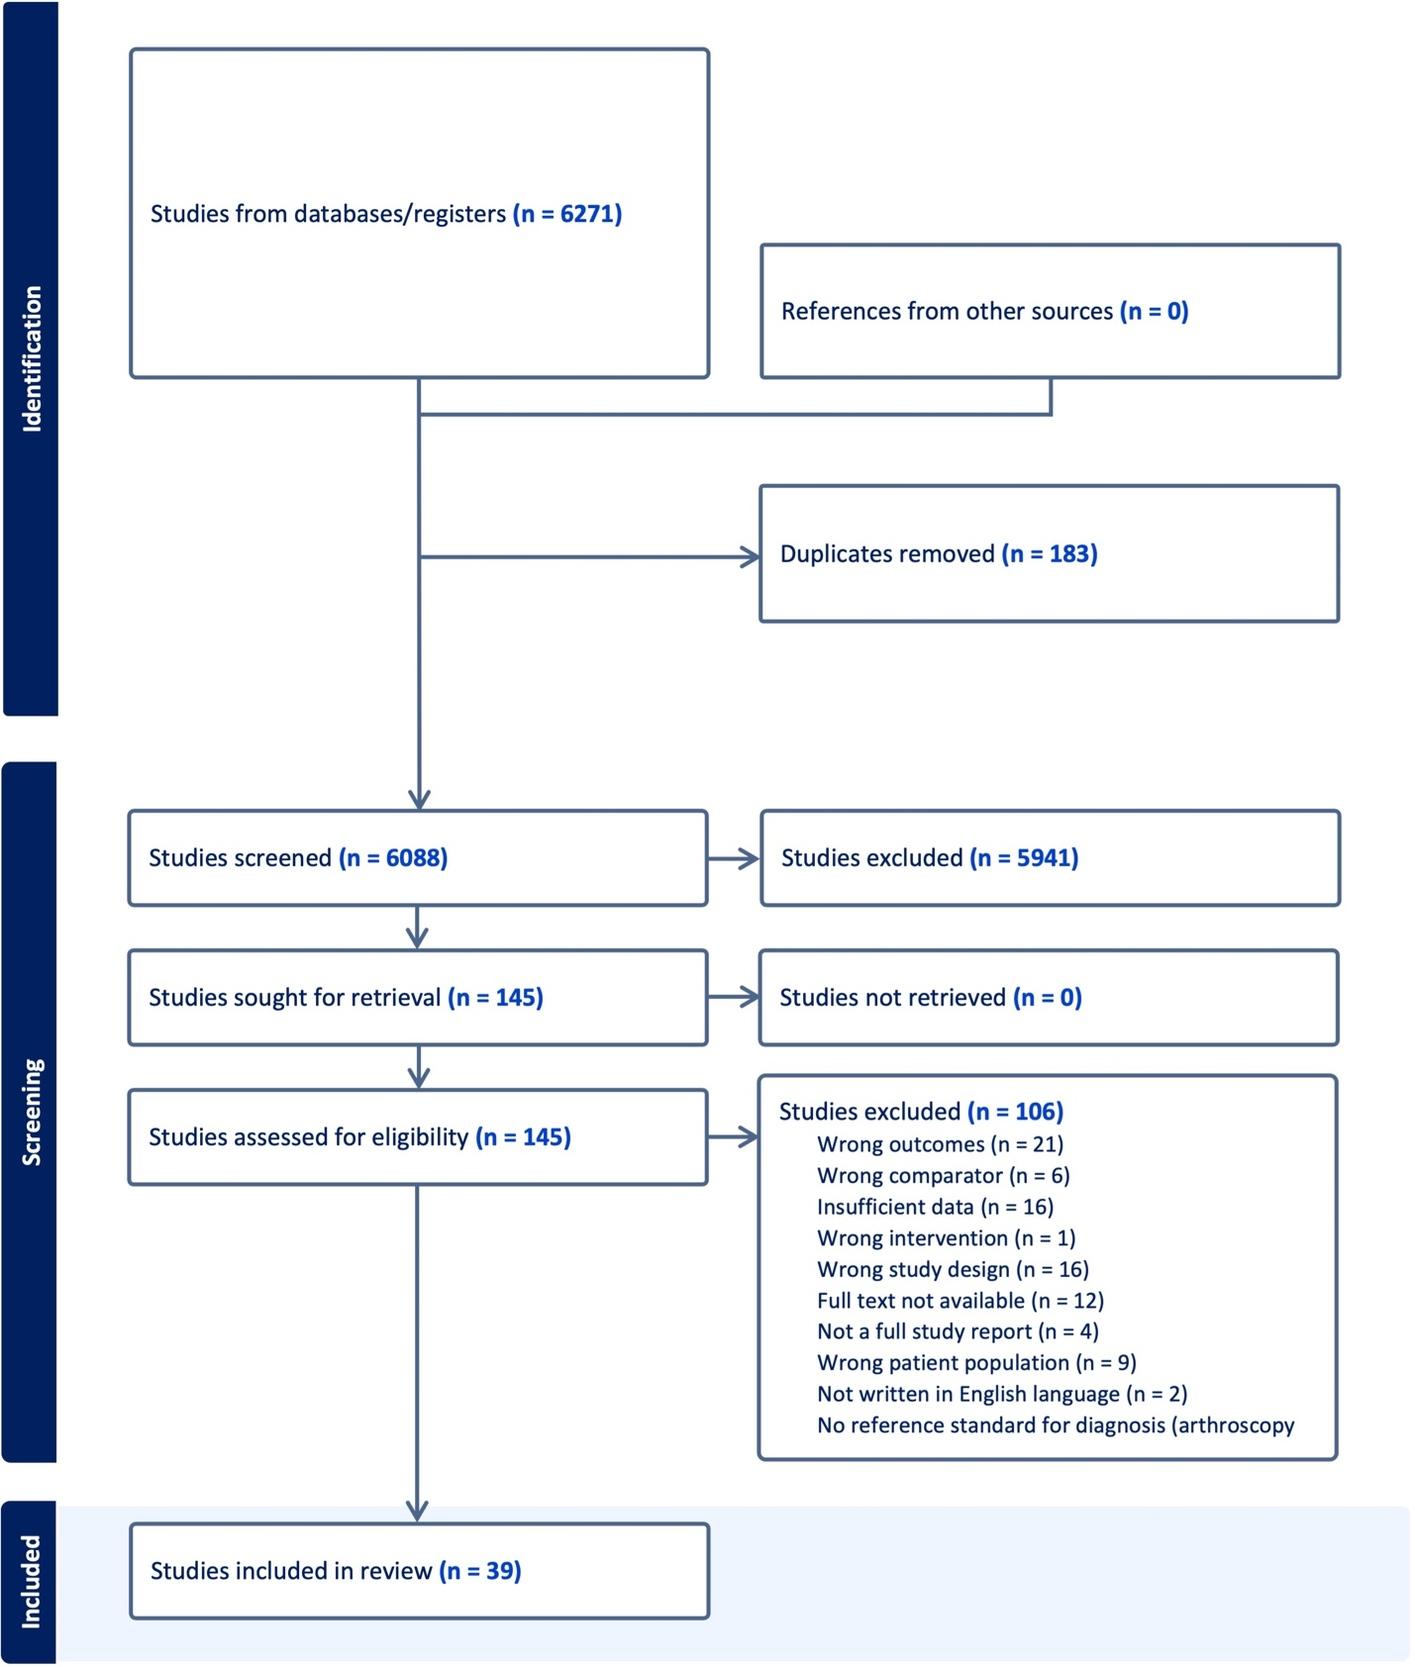
The initial search strategy (Appendix 1) identified 6271 citations potentially eligible for this systematic review After 183 duplicates were eliminated a total of 6088 citations remained. Of these 6088 underwent title and abstract screening. A total of 147 articles were selected for full text review with 395‑12,21‑51 included in the final review. (Figure 1) Of those 39 studies, 18 focused on first time shoulder instability (Appendix 2), 18 focused on recurrent instability (Appendix 3), and three studies reported on both.5,11,51 Of the
21 studies reporting on first time shoulder instability, 19 were classified as dislocation and/or subluxation and two were classified as shoulder instability Of those 19 studies reporting on first time dislocation and/or subluxation, five studies reported on anterior dislocation and/or subluxation, three studies reported on posterior dislocation and/or subluxation; seven studies reported on mixed populations or multidirectional dislocation and/or subluxation; and four studies did not report on the direction of shoulder dislocation and/or subluxation. Of the two studies reporting on shoulder instability, both were in the anterior direction. Of the 21 studies reporting on recurrent shoulder instability, all 21 studies were classified as dislocation and/or subluxation. Of those 21 studies, 12 reported in the anterior direction; two in the posterior direction; six on mixed populations or multidirectional dislocation and/or subluxation; and one study did not report on the direction of recurrent shoulder dislocation and/or subluxation. Figure 1 represents the flow diagram of study inclusion. The results of the quality assessment are shown in Table 2 Of the 39 included studies, five7,24,44,45,48 scored less than 5/9 rating them at high risk of bias. Most methodological shortcomings concerned comparability of cases and controls, specifically controlling for a second variable that could have a mediating effect; clear definition of controls; and report of non-response rate and adequacy of follow up of cohorts.
RISK FACTORS ASSOCIATED WITH FIRST TIME SHOULDER INSTABILITY (APPENDIX 2)
Of the total number of studies included reporting on risk factors associated with first time shoulder instability, 24% (5/21) were related to sports participation.5,9,11,36,48 Of these studies one48 scored 2/9; three5,11,36 scored 6/9; and one9 scored 8/9; on the Newcastle Ottawa Risk of Bias Report (NRoB).17,18 (Table 2) Based on the current findings it is possible that the type of sport an individual participates in may increase the risk for first time shoulder dislocation. Participation in sports including skiing and snowboarding,36 and both intercollegiate and intramural male wrestling9 demonstrated a moderate to large risk for experiencing a shoulder dislocation. Additionally, studies examining the risk of individuals playing football5,9 found moderate associations with participation in the sport.
Participation in other sports demonstrated a smaller risk of shoulder dislocation include rugby, boxing, American football, lacrosse, and Judo.5,11,48 Interestingly, one study11 found sports such as wrestling, indoor obstacles,
fitness testing, and swimming to have a protective effect against shoulder dislocation. These findings should be interpreted with caution they are from only one dataset in a population of students attending a United States Military academy
Four5,11,36,48 out of five9 of the included studies were from mixed populations suggesting that participation in sport is not unique to a particular direction of shoulder instability
The risk factor of anatomical variation contributing to first time shoulder instability was studied in 5/21 (24%) of included manuscripts. Of the studied anatomical variations, risk related to increased glenoid index (GI), or the glenoid height to width ratio, was included in three manuscripts and was reported as a moderate (((OR = 7.88 (CI: 2.14, 29.13))8 and ((OR = 8.12 (CI: 1.07-61.72)))10 to large ((OR = 16.71 (CI: 4.26,65.62))51 risk factor Notably, the large
risk was identified by a study that used a lower (>1.45) GI compared to the others which used >1.6. Of the studies that investigated GI, two8,10 scored 6/9 on the NRoB while the study that reported large related risk scored a 7/9.51 Of these studies, all risk factors were reported in anterior shoulder dislocation and/or subluxation populations. Four other anatomical variations were found in studies that met the search criteria. Two variations, humeral containing angle >64 degrees8 and coracohumeral interval,10 had minimal association with risk yielding OR’s of <1.20 in those with anterior dislocation and/or subluxation while there was a small association between glenoid dysplasia and injury ((OR = 2.84, CI: (1.14, 7.09) in those with posterior dislocation and/or subluxation.7 Regarding glenoid retroversion, three studies7,10,37 included this variation. Two studies resulted nearly identical OR’s of 1.157 and 1.1737 (CI: 1.14, 1.16 and CI: 1.03, 1.34) in those with posterior dislocation and/or subluxation while one determined there to be a small risk ((OR = 4.83, (CI: 1.75, 13.33)) in those with anterior dislocation and/or subluxation.10 With
Figure 1. PRISMA Flow Diagram2. Newcastle Ottawa Risk of Bias Report
Author, year Selection
Albright, 20221 *** ***
Amako, 20162 *** ***
Cameron, 20135 ****
Chahal, 20106 ** ***
Enger, 20189 **** ** ***
Galvin, 201610 * ***
Heidari, 201413 **
Hoelen, 199014 ****
Hong, 201915 ***
Kardouni, 201616 ****
Khoschnau, 200817 ***
Kim, 201718 ****
Lanzi, 201720 ***
Leroux, 201521 ****
Leroux, 201422 ***
Liavaag, 201124 ****
Lill, 200125 ***
Longo, 202126 ***
Murray, 202028 ****
Nordqvist, 199529 **
Ogawa, 201130 ****
Owens, 201331 ****
Owens, 201432 ****
Owens, 200733 ****
Pihlajamaki, 202035 ***
Roach, 201336 ***
Roberts, 201537 ***
Robinson, 200638 ***
Robinson, 200239 ***
Robinson, 201140 ***
Saygi, 201841 **
Schultz, 200542 *
Shields 201843 **
Szyluk, 201845 ****
Szyluk, 202246 ****
Trojan, 202047 *
Vermeiren, 199348 ****
Weishaupt, 200050 ****
Yellin, 202151 ** *
the exception of the single study that investigated glenoid dysplasia7 which scored 4/9 on the NRoB, other studies scored either 6/9 or 7/9.
Of the six out of the 21 papers that examined the risk of first time shoulder instability on the basis of sex,6,9,35,36,44, 46 males exhibited a greater risk for first time shoulder dislocation compared to females in all studies. Of these studies, the NRoB Report scores ranged from 3-9 (out of 9) with
a median score of 5.5. The strength of association between male gender and risk for first time shoulder dislocation ranged from minimal/small6,9,35,36,46 to large.44 Included studies were representative of all shoulder instability types, severity, and direction making it impossible to link sex to any specific shoulder instability type.
Relative to those ≥35 years of age, a moderate association was observed between younger age (15-19) and risk for first time shoulder dislocation, OR 7.4 (95% CI: 2.7, 20.7), while the ORs were relatively less (ORs: 1.0-3.7) for patient groups between 20-34 in the same study 46 Older age (≥65) had a small association with increased risk for first time shoulder dislocation compared to those aged < 65 in one study.35
In the study by Syzluk,12 the ORs were calculated for males relative to females across nine different age groups separated into ten-year increments, where the ORs ranged from 0.62 (80-89 years old) to 7.49 in the 20-29 age group. When examining this study based on risk by age group, 0-9 years old and 10-19 years old demonstrated a small to large protective effect for first time shoulder dislocation.12 All included studies were representative of those with shoulder dislocation and/or subluxation but populations were mixed regarding direction.
Hypermobility and shoulder range of motion were investigated in one, small (n = 57 cases) retrospective case control study for their association with acute, first-time traumatic shoulder dislocations.23 Hypermobility was assessed by the Hospital del Mar criteria,52 which measures the degree of passive hypermobility across ten joints. Regardless of sex, a score of >4/10 for males and >5/10 for females on the Hospital del Mar scale was found to be statistically significant in predisposing an individual to shoulder dislocation risk OR = 2.79 (95%: CI 1.27, 6.09) in this lower quality study (NRoB = 5/9).23 The association of hypermobility and dislocation was statistically significant when combined with greater than 85 degrees of external rotation at the shoulder ((OR = 3.6 (95% CI: 1.49, 8.68)).23 When sex was analyzed separately, hypermobility had a moderate association with firsttime shoulder dislocation for both males (OR= 7.43, 95% CI: 2.13, 25.57) and females ((OR = 8.36 (CI:1.08, 61.10)). Combining shoulder external range of motion greater than 85 degrees to the hypermobility score resulted in similar, moderate associations with shoulder dislocation risk, but only in males ((OR 6.75 (CI 1.92, 23.36)).23 This study is specific to those with first time anterior shoulder dislocation and/or subluxation.
Strength as a risk factor for first time shoulder dislocation was investigated in two studies. Internal and external rotation shoulder strength at various degrees of shoulder abduction had minimal association with shoulder dislocation that did not reach statistical significance, as assessed by hazard ratios.37,39 One study investigating the association between strength and instability boasted a “good qual-
ity” rating (Table 2) and a large cohort size (n = 1,428),39 whereas the other failed to report critical data and was received a “fair” quality rating.37 These studies included both anterior and posterior first time shoulder dislocation and/or subluxation making it difficult to link strength to any particular direction of shoulder instability.
One population-based study12 from Poland examined glenohumeral dislocation rates between urban and rural areas. Overall incidence and risk of first time dislocations did not differ based on area of residence (25.97 vs 25.62 per 100,000 person-years in rural vs urban communities respectively, OR = 1.01 (0.97-1.05)). Risk of shoulder dislocation when incorporating age and gender is highest in rural areas for females aged 70-79 years (OR = 4.17, (4.17–5.33)) whereas the highest risk in urban areas is in females aged 80+ years (OR = 5.07 (4.58–5.61)). The greatest disparity between rural and urban areas is among females aged 0-9 years where the odds ratio = 20.39 (CI 8.25-50.4) for females living in rural areas compared to females living in urban areas. The study population was not reported in this study in terms of direction of shoulder dislocation and/or subluxation.
RISK FACTORS ASSOCIATED WITH RECURRENT SHOULDER INSTABILITY (APPENDIX 3)
SPORT PARTICIPATION
Of the total number of studies included reporting on risk factors associated with recurrent shoulder instability, 9.5% (2/21) were related to sports participation. The Amako et al. and Owens et al. studies both scored 6/9 NRoB Report.5, 11 These two studies suggest that participation in sport may pose a minimal risk for recurrent shoulder dislocation. Specifically, participation in rugby, American football, and Judo sports demonstrated a small to minimal risk of recurrent shoulder dislocation. Owens11 reports a large association between skiing/snowboarding and ice hockey with shoulder dislocation. Included studies were from mixed populations suggesting that participation in sport is not unique to a particular direction of recurrent shoulder instability
Gender as a risk factor was described in 32% (6/19) of studies that reported on risk of recurrent instability,25,26,29,30, 34,41 with NRoB Report scores ranging from 6-9 out of 9. As compared to females, males were identified to be at greater risk for recurrent instability in five of the six studies (83%).25,29,30,34,41 A moderate association with recurrent instability according to male gender was reported by one study25 which identified an OR of 7.21 (95% CI: 2.84, 18.27). A majority of included studies referred to patients suffering from recurrent anterior shoulder dislocation and/ or subluxation with two reporting on mixed populations.
Of the total number of studies reporting on risk of recurrent glenohumeral dislocations, 58% (11/19) reported on patient age as a risk factor.21,25,26,29,30,32,34,40,41,43,47 The NRoB Report scores for each study are reported in Table 2 The strongest associations with risk of recurrent shoulder instability were identified in four studies, which demonstrated a moderate-large association with age as a risk factor.25, 32,34,40 ORs for individuals less than 30 years old were reported by Hoelen25 and Lill32 at 20.22 (95% CI: 8.34, 48.51) and 22.67 (95% CI: 7.76, 70.81), respectively, and for those under 20 years old was 6.75 (95% CI: 1.19, 38.41) as described by Murray.34 One study47 examining younger age found an inverse association with risk of recurrent dislocation primarily for individuals in the 0-9 age group, where ORs ranged from 0.07 - 0.24. Included studies were representative of all directions of recurrent instability making it impossible to link age to any particular direction of recurrent shoulder instability
Only two studies considered elements of sociodemographics as a risk factor for recurrent shoulder instability 26,30 The three elements investigated were marital status, socioeconomic status, and educational level. None of these elements were found to have more than minimal association with OR’s between .80 and 1.23.
Prior history of glenohumeral dislocation with or without concomitant injury was reported as a risk factor for recurrent shoulder dislocation in five (26%) of the nineteen studies.22,26,30,33,50 The strength of these associations ranged from minimal to large. Each of the five studies looked at a different type of prior shoulder injury history from prior history of glenohumeral instability and rotator cuff tears33 to instability and axillary nerve injury.26 The largest association with recurrent shoulder dislocation included a history of instability alongside of rotator cuff injury in those with recurrent anterior shoulder instability33 with OR of 10.8 (CI: 3.1, 37.9), and a history of instability and posteroinferior defect with crandiocaudal length of >12mm in those with recurrent posterior instability50 with OR of 32.5 (CI 5.53, 191.09). Both of these studies were high quality with NRoB scores of six and eight, respectively (Table 2); the strong association with shoulder instability as reported by Weishaupt et al. 2000 should be interpreted with caution given the small sample size (n = 45, with 15 exposed cases). Of the remaining risk factors related to prior shoulder injury, a self-reported prior history of posterior glenohumeral instability was the only risk factor with a moderate association (OR 8.67 CI 1.81, 41.59) from a high-quality study (NRoB = 9/9).22 This study included a mixed population of anterior, posterior, and multidirectional instability
The risk factor of anatomical variation contributing to recurrent shoulder instability was studied in 1/21 (4.8%) of included manuscripts and did not differentiate between first time or recurrent shoulder instability As reported above, Yellin51 reports a large association (OR = 16.71 (4.26, 65.62) between the glenoid index > 1.45 and risk of recurrent anterior shoulder instability.
“High-risk” manual laborers are at increased risk of recurrent dislocation compared to more sedentary professions (e.g. office work).33 This study with a NRoB score of 6/9 attributed the increased risk (OR 4.3 (1.2,15.5)) due to the loads applied during work (bricklayer, paratrooper, firefighters, etc.) Manual laborers’ risk was also measured in one other study (NRoB = 7/9) that reported a similar risk of recurrent dislocation (OR: 1.39 (0.55,3.51)) to a group of non-manually intensive professions.49 Both of these studies were specific to those suffering from recurrent anterior shoulder dislocation and/or subluxation.
The position of immobilization (internal vs external rotation) following first-time dislocation was reported in three studies.24,31,34 Risk of recurrent shoulder dislocation based on immobilized position was similar [OR: 2.23 (0.67,7.4), 1.75 (0.61,5.04)} in two high quality (NRoB scores: 8/9) studies of anterior and mixed direction recurrent shoulder dislocation and/or subluxation.31,34 The third lower quality study (NRoB score: 2/9) showed a risk reduction (OR 0.08 (0.02,0.38) when immobilized in abduction with external rotation in those with recurrent anterior shoulder dislocation and/or subluxation.24
The odds of recurrence were compared by the providers performing the closed reduction in two high-quality studies from one large epidemiological investigation.29,30 Orthopedic surgeons were compared to other specialties. In pediatric patients, aged 10-16 years, there was no difference in recurrence rate (OR: 0.69 (0.43-1.07)) whereas in adult patients, aged 16-70 years, the risk of recurrence was lower in patients with recurrent anterior shoulder dislocation and/ or subluxation (HR: 0.76 (0.64-0.90) when orthopedic surgeons performed the reduction compared to other providers.
Patient’s overall health, utilizing combined aggregate diagnostic groups (CADG),53 was compared between patients with fewer (0-4) comorbid health conditions and patients with ≥ 5 comorbid health conditions.30 Patients with higher comorbidity were found to have a lower risk (HR: 0.92 (0.87, 0.98) of recurrent anterior shoulder dislocation and/or subluxation compared to patients with fewer comorbidities in one high-quality study 30 Comorbidity was defined as any number of 12 disease categories based on ICD-9 and ICD-10 codes.
The results of this study shed light on several key risk factors associated with both first-time and recurrent shoulder instability
Sports Participation: A moderate to large risk of firsttime shoulder dislocation was observed in individuals participating in sports such as skiing, snowboarding, intercollegiate and intramural male wrestling, and football. Conversely, sports like rugby, boxing, American football, lacrosse, and Judo showed a smaller risk. Notably, certain sports like wrestling, indoor obstacles, fitness tests, and swimming demonstrated a protective effect against shoulder dislocation. However, caution is warranted due to the limited dataset and specific population demographics. Patient education is important in helping athletes understand the potential risk of participating in some sports over others.
Anatomical Variations: An increased glenoid index (GI) was associated with a moderate to large risk of firsttime shoulder instability, particularly in anterior dislocation populations. When this ratio is increased the morphology of the glenoid is that it is taller and narrower, decreasing the contact area of the joint which results in greater instability compared to joints with lower glenoid height to width ratios. One hypothesis is that infants who fail to crawl properly lack the necessary weightbearing to further develop the glenoid height to width ratio placing them at increased risk for shoulder dislocation later in life. Further research is needed to explore this hypothesis and potentially support the need for early intervention to reduce the incidence of shoulder instability later in life. Other anatomical variations such as humeral containing angle, coracohumeral interval, glenoid dysplasia, and glenoid retroversion showed minimal to small associations with dislocation risk.
Sex and Age: Males exhibited a greater risk of both firsttime and recurrent shoulder instability compared to females. Younger age groups, especially those between 15-19 years old, demonstrated a moderate association with firsttime shoulder dislocation. Conversely, older age groups (≥65 years) showed a small association with increased risk.
Laxity, Motion, and Strength Measures: Hypermobility, particularly in combination with excessive shoulder external rotation, showed a significant association with firsttime shoulder dislocation, especially in males. However, the quality of evidence for this association was limited. Measures of strength, including internal and external rotation shoulder strength, demonstrated minimal associations with shoulder dislocation.
Urban or Rural Living: Interestingly, urban versus rural living did not significantly affect the overall incidence or risk of shoulder dislocation, although certain age and gender demographics showed variations in risk across different residential settings.
Other Factors: Factors such as manual labor, immobilization position, and the specialty of medical providers performing reduction procedures also influenced the risk of recurrent shoulder instability. Additionally, patients with a
higher number of comorbid health conditions showed a decreased risk of recurrence compared to those with fewer comorbidities. This finding could potentially be contributed to the idea that those with additional comorbidities may be less active thus reducing the number of exposures to activities attributed to shoulder instability.
Overall, understanding these risk factors can inform targeted strategies for prevention and management of shoulder instability, potentially improving patient outcomes and guiding clinical decision-making. However, further research is needed to validate these findings and elucidate the underlying mechanisms driving these associations.
There are a number of limitations with this systematic review. Despite the authors’ best intentions, studies meeting inclusion criteria were dominated by a diagnosis of shoulder dislocation and/or subluxation. Only two included studies reported on less severe symptoms of shoulder instability making it impossible to report on risk factors associated with less severe yet inhibiting shoulder instability. The lack of studies assessing instability may be related to the challenges or controversies in diagnosing instability (vs. dislocation).13 Intersectionality, specifically age and gender was not clearly delineated in many of the studies which could potentially limit the generalizability of the results. Three of the included studies did not differentiate between first time and recurrent shoulder instability Additionally, cohort sizes varied amongst the studies which would be expected considering the number of variables examined would have a direct impact on the necessary sample sizes to achieve adequate power and narrow confidence intervals. Another limitation was that fewer studies examined predictors for first time shoulder dislocation or recurrent instability for females versus males. Furthermore, ORs were not provided in every study Although the authors attempted to calculate those for each study it was evident that insufficient data was provided in many of them to do so.
Additional limitations include the quality of studies identified. For first time shoulder instability, two studies scored 2/9; one scored 3/9; two scored 4/9; four scored 5/ 9; six scored 6/9; two scored 7/9; one scored 8/9; and three scored 9/9 on the NRoB. For recurrent shoulder instability, one study scored 2/9; two scored 5/9; six scored 6/9; four scored 7/9; three scored 8/9 and three scored 9/9. Results of this systematic review suggested higher quality studies were reported as part of recurrent shoulder instability as compared to first time shoulder instability. The reference standard utilized in the studies was not consistent nor were the age norms. As a result of the heterogeneity, a metaanalysis was unable to be performed.
The results of this systematic review suggest there may be a number of predictive variables for first time dislocation or recurrent dislocations. Male sex, participation in sport, hypermobility in males, and glenoid index demonstrated
moderate to large risk associated with first time shoulder instability. Male sex, age < 30 years, and prior history of glenohumeral instability with concomitant injury demonstrated moderate to large risk associated with recurrent shoulder instability However, the quality of included studies was mixed with higher quality studies reported in populations with recurrent shoulder instability Therefore, it is necessary to perform additional studies to determine if the findings are consistent with well-designed prospective studies. An opportunity may exist for patient education in particular populations as to their increased risk for suffering shoulder instability, particularly in young males who
appear to be at increased risk for recurrent shoulder instability.
The authors declare no conflicts of interest in the creation of this manuscript.
Submitted: October 25, 2023 CDT, Accepted: February 29, 2024 CDT
© The Author(s)
This is an open-access article distributed under the terms of the Creative Commons Attribution 4.0 International License (CCBY-NC-4.0). View this license’s legal deed at https://creativecommons.org/licenses/by-nc/4.0 and legal code at https://creativecommons.org/licenses/by-nc/4.0/legalcode for more information.
1. Sadi J, Torchia E, Faber KJ, et al. Posterior shoulder instability classification, assessment, and management: An international delphi study. J Orthop Sports Phys Ther 2020;50(7):373-380. doi:10.2519/ jospt.2020.9225
2. Brophy RH, Marx RG. The treatment of traumatic anterior instability of the shoulder: nonoperative and surgical treatment. Arthroscopy 2009;25(3):298-304. doi:10.1016/j.arthro.2008.12.007
3. Kirkley S. Primary anterior dislocation of the shoulder in young patients. A ten-year prospective study. J Bone Joint Surg Am. 1998;80(2):300-301.
4. Zacchilli MA, Owens BD. Epidemiology of shoulder dislocations presenting to emergency departments in the United States. J Bone Joint Surg Am. 2010;92(3):542-549. doi:10.2106/jbjs.i.00450
5. Amako M, Sasao H, Matsuhashi Y, et al. Incidence and characteristics of traumatic shoulder instability in Japanese military cadets. Mil Med. 2016;181(6):577-581. doi:10.7205/milmedd-15-00245
6. Enger M, Skjaker SA, Melhuus K, et al. Shoulder injuries from birth to old age: A 1-year prospective study of 3031 shoulder injuries in an urban population. Injury. 2018;49(7):1324-1329. doi:10.1016/j.injury.2018.05.013
7 Galvin JW, Parada SA, Li X, Eichinger JK. Critical findings on magnetic resonance arthrograms in posterior shoulder instability compared with an agematched controlled cohort. Am J Sports Med 2016;44(12):3222-3229. doi:10.1177/ 0363546516660076
8. Hong J, Huang Y, Ma C, et al. Risk factors for anterior shoulder instability: a matched case-control study J Shoulder Elbow Surg 2019;28(5):869-874. doi:10.1016/j.jse.2018.09.014
9. Lanzi JT Jr, Chandler PJ, Cameron KL, Bader JM, Owens BD Epidemiology of posterior glenohumeral instability in a young athletic population. Am J Sports Med. 2017;45(14):3315-3321. doi:10.1177/ 0363546517725067
10. Owens BD, Campbell SE, Cameron KL. Risk factors for anterior glenohumeral instability. Am J Sports Med 2014;42(11):2591-2596. doi:10.1177/ 0363546514551149
11. Owens BD, Duffey ML, Nelson BJ, DeBerardino TM, Taylor DC, Mountcastle SB. The incidence and characteristics of shoulder instability at the United States Military Academy Am J Sports Med 2007;35(7):1168-1173. doi:10.1177/ 0363546506295179
12. Szyluk K, Niemiec P, Sieroń D, et al. Shoulder dislocation incidence and risk factors-Rural vs. urban populations of Poland. Int J Environ Res Public Health. 2022;19(19):11857 doi:10.3390/ijerph191911857
13. DeLong JM, Jiang K, Bradley JP Posterior instability of the shoulder: A systematic review and meta-analysis of clinical outcomes. Am J Sports Med 2015;43(7):1805-1817 doi:10.1177/ 0363546515577622
14. Moya D, Aydin N, Yamamoto N, et al. Current concepts in anterior glenohumeral instability: diagnosis and treatment. SICOT J. 2021;7(48):48. doi:10.1051/sicotj/2021048
15. Comadoll SM, Landry Jarvis D, Yancey HB, Graves BR. The financial burden associated with multiple shoulder dislocations and the potential cost savings of surgical stabilization. JSES Int 2020;4(3):584-586. doi:10.1016/j.jseint.2020.04.023
16. Page MJ, Moher D, McKenzie JE. Introduction to PRISMA 2020 and implications for research synthesis methodologists. Res Synth Methods. 2022;13(2):156-163. doi:10.1002/jrsm.1535
17 Zhang Y, Huang L, Wang D, Ren P, Hong Q, Kang D The ROBINS-I and the NOS had similar reliability but differed in applicability: A random sampling observational studies of systematic reviews/metaanalysis. J Evidence Based Med. 2021;14(2):112-122. doi:10.1111/jebm.12427
18. Li W, Ma D, Liu M, et al. Association between metabolic syndrome and risk of stroke: a metaanalysis of cohort studies. Cerebrovasc Dis. 2008;25(6):539-547 doi:10.1159/000131672
19. Luchini C, Stubbs B, Solmi M, Veronese N. Assessing the quality of studies in meta-analyses: Advantages and limitations of the Newcastle Ottawa Scale. World J Meta-Analysis 2017;5(4):80-84. doi:10.13105/wjma.v5.i4.80
20. Ekelund S. Comparing D-dimer assays using likelihood ratios and Fagan nomograms. Published 2016. https://acutecaretesting.org/-/media/ acutecaretesting/files/pdf/comparing-ddimer-assaysusing-likelihood-ratios-and-fagan-nomograms.pdf
21. Albright JA, Meghani O, Lemme NJ, Owens BD Characterization of shoulder instability in Rhode Island: Incidence, surgical stabilization, and recurrence. R I Med J. 2022;105(5):56-62.
22. Cameron KL, Mountcastle SB, Nelson BJ, et al. History of shoulder instability and subsequent injury during four years of follow-up: a survival analysis. J Bone Joint Surg Am. 2013;95(5):439-445. doi:10.2106/ jbjs.l.00252
23. Chahal J, Leiter J, McKee MD, Whelan DB. Generalized ligamentous laxity as a predisposing factor for primary traumatic anterior shoulder dislocation. J Shoulder Elbow Surg 2010;19(8):1238-1242. doi:10.1016/j.jse.2010.02.005
24. Heidari K, Asadollahi S, Vafaee R, et al. Immobilization in external rotation combined with abduction reduces the risk of recurrence after primary anterior shoulder dislocation. J Shoulder Elbow Surg 2014;23(6):759-766. doi:10.1016/ j.jse.2014.01.018
25. Hoelen MA, Burgers AMJ, Rozing PM. Prognosis of primary anterior shoulder dislocation in young adults. Arch Orthop Trauma Surg. 1990;110(1):51-54. doi:10.1007/bf00431367
26. Kardouni JR, McKinnon CJ, Seitz AL. Incidence of Shoulder Dislocations and the Rate of Recurrent Instability in Soldiers. Med Sci Sports Exerc 2016;48(11):2150-2156. doi:10.1249/ mss.0000000000001011
27 Khoschnau S, Melhus H, Jacobson A, et al. Type I collagen alpha1 Sp1 polymorphism and the risk of cruciate ligament ruptures or shoulder dislocations. Am J Sports Med 2008;36(12):2432-2436. doi:10.1177/0363546508320805
28. Kim S, Kleimeyer JP, Ahmed MA, et al. A Genetic Marker Associated with Shoulder Dislocation. Int J Sports Med 2017;38(7):508-514. doi:10.1055/ s-0043-106190
29. Leroux T, Ogilvie-Harris D, Veillette C, et al. The epidemiology of primary anterior shoulder dislocations in patients aged 10 to 16 years. Am J Sports Med 2015;43(9):2111-2117 doi:10.1177/ 0363546515591996
30. Leroux T, Wasserstein D, Veillette C, et al. Epidemiology of primary anterior shoulder dislocation requiring closed reduction in Ontario, Canada. Am J Sports Med. 2014;42(2):442-450. doi:10.1177/0363546513510391
31. Liavaag S, Brox JI, Pripp AH, Enger M, Soldal LA, Svenningsen S. Immobilization in external rotation after primary shoulder dislocation did not reduce the risk of recurrence: a randomized controlled trial. J Bone Joint Surg Am 2011;93(10):897-904. doi:10.2106/jbjs.j.00416
32. Lill H, Korner J, Hepp P, Verheyden P, Josten C. Age-dependent prognosis following conservative treatment of traumatic anterior shoulder dislocation. Eur J Trauma. 2001;27(1):29-33. doi:10.1007/ s00068-001-1070-2
33. Longo UG, Papalia R, Ciapini G, et al. Instability severity index score does not predict the risk of shoulder dislocation after a first episode treated conservatively Int J Environ Res Public Health 2021;18(22):12026. doi:10.3390/ijerph182212026
34. Murray JC, Leclerc A, Balatri A, Pelet S. Immobilization in external rotation after primary shoulder dislocation reduces the risk of recurrence in young patients. A randomized controlled trial. Orthop Traumatol Surg Res 2020;106(2):217-222. doi:10.1016/j.otsr.2018.10.007
35. Nordqvist A, Petersson CJ. Incidence and causes of shoulder girdle injuries in an urban population. J Shoulder Elbow Surg 1995;4(2):107-112. doi:10.1016/ s1058-2746(05)80063-1
36. Ogawa H, Sumi H, Sumi Y, Shimizu K. Glenohumeral dislocations in snowboarding and skiing. Injury. 2011;42(11):1241-1247. doi:10.1016/ j.injury.2010.12.004
37 Owens BD, Campbell SE, Cameron KL. Risk factors for posterior shoulder instability in young athletes. Am J Sports Med 2013;41(11):2645-2649. doi:10.1177/0363546513501508
38. Pihlajamäki H, Silvennoinen A, Kuikka PI, Luukkaala T, Kröger H, Kyröläinen H. Incidence and risk factors of upper extremity injuries in young adult men: A nationwide registry-based study of 128,714 conscripts. Mil Med 2020;185(3-4):e487-e494. doi:10.1093/milmed/usz340
39. Roach CJ, Cameron KL, Westrick RB, Posner MA, Owens BD Rotator cuff weakness is not a risk factor for first-time anterior glenohumeral instability Orthop J Sports Med. 2013;1(1):2325967113489097. doi:10.1177/2325967113489097
40. Roberts SB, Beattie N, McNiven ND, Robinson CM. The natural history of primary anterior dislocation of the glenohumeral joint in adolescence. Bone Joint J 2015;97-B(4):520-526. doi:10.1302/ 0301-620x.97b4.34989
41. Robinson CM, Howes J, Murdoch H, Will E, Graham C. Functional outcome and risk of recurrent instability after primary traumatic anterior shoulder dislocation in young patients. J Bone Joint Surg Am. 2006;88(11):2326-2336. doi:10.2106/jbjs.e.01327
42. Robinson CM, Kelly M, Wakefield AE. Redislocation of the shoulder during the first six weeks after a primary anterior dislocation: risk factors and results of treatment. J Bone Joint Surg Am 2002;84(9):1552-1559. doi:10.2106/ 00004623-200209000-00007
43. Robinson CM, Seah M, Akhtar MA. The epidemiology, risk of recurrence, and functional outcome after an acute traumatic posterior dislocation of the shoulder J Bone Joint Surg Am 2011;93(17):1605-1613. doi:10.2106/jbjs.j.00973
44. Saygi B, Karahan N, Karakus O, Demir AI, Ozkan OC, Soylu-Boy FN. Analysis of glenohumeral morphological factors for anterior shoulder instability and rotator cuff tear by magnetic resonance imaging. J Orthop Surg 2018;26(2):2309499018768100. doi:10.1177/ 2309499018768100
45. Schulz CU, Anetzberger H, Glaser C. Coracoid tip position on frontal radiographs of the shoulder: a predictor of common shoulder pathologies? Br J Radiol 2005;78(935):1005-1008. doi:10.1259/bjr/ 27340997
46. Shields DW, Jefferies JG, Brooksbank AJ, Millar N, Jenkins PJ. Epidemiology of glenohumeral dislocation and subsequent instability in an urban population. J Shoulder Elbow Surg. 2018;27(2):189-195. doi:10.1016/j.jse.2017.09.006
47 Szyluk K, Jasiński A, Niemiec P, Mielnik M, Widuchowski W, Koczy B. Male gender and age range 20–29 years are the most important non-modifiable risk factors for recurrence after primary posttraumatic shoulder dislocation. Knee Surg Sports Traumatol Arthrosc 2018;26(8):2454-2464. doi:10.1007/s00167-018-4924-4
48. Trojan JD, Meyer LE, Edgar CM, Brown SM, Mulcahey MK. Epidemiology of shoulder instability injuries in collision collegiate sports from 2009 to 2014. Arthroscopy 2020;36(1):36-43. doi:10.1016/ j.arthro.2019.07.008
49. Vermeiren J, Handelberg F, Casteleyn PP, Opdecam P. The rate of recurrence of traumatic anterior dislocation of the shoulder A study of 154 cases and a review of the literature. Int Orthop. 1993;17(6):337-341. doi:10.1007/bf00180449
50. Weishaupt D, Zanetti M, Nyffeler RW, Gerber C, Hodler J. Posterior glenoid rim deficiency in recurrent (atraumatic) posterior shoulder instability. Skeletal Radiol 2000;29(4):204-210. doi:10.1007/ s002560050594
51. Yellin JL, Fabricant PD, Anari JB, et al. Increased glenoid index as a risk factor for pediatric and adolescent anterior glenohumeral dislocation: An MRI-based, case-control study. Orthop J Sports Med. 2021;9(3):2325967120986139. doi:10.1177/ 2325967120986139
52. Bulbena A, Duro JC, Porta M, Faus S, Vallescar R, Martin-Santos R. Clinical assessment of hypermobility of joints: assembling criteria. J Rheumatol. 1992;19(1):115-122.
53. The Johns Hopkins ACG Case-Mix System Version 6.0 Release Notes Johns Hopkins University; 2003.
Download: https://ijspt.scholasticahq.com/article/116278-risk-factors-associated-with-first-time-and-recurrentshoulder-instability-a-systematic-review/attachment/223299.docx?auth_token=THwnf0si3YOAT1gnkKHk
Download: https://ijspt.scholasticahq.com/article/116278-risk-factors-associated-with-first-time-and-recurrentshoulder-instability-a-systematic-review/attachment/223300.docx?auth_token=THwnf0si3YOAT1gnkKHk
Download: https://ijspt.scholasticahq.com/article/116278-risk-factors-associated-with-first-time-and-recurrentshoulder-instability-a-systematic-review/attachment/223301.docx?auth_token=THwnf0si3YOAT1gnkKHk
Bill K, Mai P, Mausehund L, Solbakken S, Krosshaug T, Kersting UG. Individualized
Technique Feedback for Instant Technique Improvements and Knee Abduction Moment Reductions – A New Approach for ‘Sidestepping’ ACL Injuries? IJSPT. Published online May 1, 2024:535-547. doi:10.26603/001c.116274
Kevin Bill1a , Patrick Mai1,2,3 , Lasse Mausehund4 , Sigurd Solbakken5 , Tron Krosshaug4 , Uwe G. Kersting1
1 Institute of Biomechanics and Orthopaedics, German Sport University Cologne, 2 Department of Physical Performance, Norwegian School of Sport Sciences, 3 Institute of Advanced Biomechanics and Motion Studies, Offenburg University of Applied Sciences, 4 Oslo Sports Trauma Research Center, Department of Sports Medicine, Norwegian School of Sport Sciences, 5 Department of Sports Medicine, Norwegian School of Sport Sciences
Keywords: biomechanics, injury, knee, prevention, sidestep cutting https://doi.org/10.26603/001c.116274
Background
Sidestep cutting technique is highly individual and has been shown to influence knee joint loading. However, studies assessing whether individualized technique feedback improves technique and ACL injury-relevant knee joint loads instantly in a sport-specific task are lacking.
Purpose
To determine the instant effects of individualized augmented technique feedback and instructions on technique and the peak external knee abduction moment (pKAM) in a handball-specific sidestep cut. Additionally, to determine the effects of technique modifications on the resultant ground reaction force and its frontal plane moment arm to the knee joint center.
Study Design
Controlled laboratory cohort study
Methods
Three-dimensional biomechanics of 48 adolescent female handball players were recorded during a handball-specific sidestep cut. Following baseline cuts to each side, leg-specific visual and verbal technique feedback on foot strike angle, knee valgus motion, or vertical impact velocity using a hierarchically organized structure accounting for the variables’ association with performance was provided. Subsequently, sidestep cuts were performed again while verbal instructions were provided to guide technique modifications. Combined effects of feedback and instructions on technique and pKAM as well as on the resultant ground reaction force and its frontal plane moment arm to the knee joint center were assessed.
Results
On average, each targeted technique variable improved following feedback and instructions, leading to instant reductions in pKAM of 13.4% to 17.1%. High inter-individual differences in response to feedback-instruction combinations were observed. These differences were evident in both the adherence to instructions and the impact on pKAM and its components.
Corresponding author:
Kevin Bill
Telephone number: +49 221 4982-5652
Email address: k.bill@dshs-koeln.de
Most players were able to instantly adapt their technique and decrease ACL injury-relevant knee joint loads through individualized augmented technique feedback, thereby potentially reducing the risk of injury. More research is needed to assess the retention of these adaptations and move towards on-field technique assessments using low-cost equipment.
The anterior cruciate ligament (ACL) is a crucial structure of the knee joint that serves multiple vital functions, including resistance against anterior tibial translation, tibial internal-external rotation, and varus-valgus angulation.1 The importance of the ACL becomes especially evident in team ball sports, where non-contact ACL injuries are highly prevalent, especially in female athletes.2 These injuries often occur during dynamic jump landings or cutting maneuvers,3,4 where the ligament’s ability to resist the aforementioned loads is paramount for maintaining knee joint stability and function. Regardless of whether a surgical procedure or conservative approach is chosen, more than half the athletes sustaining an ACL injury will have developed osteoarthritis 10 – 20 years later, often resulting in chronic pain and disability.5,6 Therefore, preventing ACL injuries is essential to preserving the overall health and performance of athletes. However, since non-contact ACL tears occur rapidly, typically within 40 milliseconds after initial contact of the foot with the ground,3 sensory feedback strategies are too slow to correct the movement pattern after contact between the foot and the ground has been made. This suggests that feed-forward strategies aiming at adopting a safe posture at initial ground contact need to be targeted in injury prevention programs to mitigate the risk of ACL injury
While real-time feedback solutions on joint biomechanics to facilitate motor learning have been proven successful in, e.g., gait retraining studies,7 the highly dynamic nature of landing and cutting tasks makes real-time solutions unsuitable. Therefore, researchers are challenged with developing solutions to provide feedback shortly after the completion of the movement. A systematic review and meta-analysis8 investigating the effects of augmented feedback on jump landing technique found positive effects on sagittal plane hip and knee kinematics and vertical ground reaction forces (GRF). However, little effect was observed on frontal plane biomechanics, which are crucial for reducing the magnitude of the peak external knee abduction moment (pKAM). Previous research strongly suggests that pKAM and the resulting knee valgus are main components of the injury mechanism.3,4,9,10 While a large amount of feedback interventions have focused on drop vertical jumps,8,11 this task might lack external validity and might therefore be unsuitable as a screening task for females participating in team ball sports.12 Hence, adequately designed studies investigating the immediate effect of augmented feedback on team ball sport-specific tasks are lacking. Further, while previous work has mainly focused on a single a priori selected variable for feedback, an individ-
ualized approach with the feedback variable tailored to an individual’s technique might improve the outcome of feedback interventions.
Therefore, the primary purpose of this study was to assess the instant effect of individualized augmented technique feedback and instructions on technique and pKAM during a handball-specific sidestep cut. It was hypothesized that highly trained players are able to adapt their technique after a combination of visual and verbal expert feedback and internally- and externally directed verbal instructions. Furthermore, since injury prevention programs usually report group means, thereby potentially concealing meaningful individual responses,13 the relative shares at which the feedback-instruction combinations translated to technique improvements and pKAM reductions were determined. The secondary purpose of the study was to determine the effects of the feedback-instruction combinations on the individual pKAM components, i.e., the resultant GRF and its frontal plane moment arm to the knee joint center It was hypothesized that feedback aiming at improved foot strike angles or reduced vertical impact velocities reduces GRF magnitudes while feedback aiming at a reduction in knee valgus motion reduces the GRF moment arm to the knee joint center
A total of forty-eight female high-level handball players were recruited. All played in the first, second or third Norwegian division. Prior to the commencement of the study, all players confirmed that they were free from any injuries or pain. Informed written consent was obtained from all players, and the study protocol received approval from the University Ethics Committee.
Each player was outfitted with a full-body marker set of 82 retro-reflective markers. The marker data were acquired using a system comprising 23 infrared cameras (Qualisys, Gothenburg, Sweden, 200 Hz). Additionally, GRF data were recorded using two floor-embedded force platforms (AMTI, Watertown, MA, USA; 600 x 1200 mm, 1000 Hz).
The players underwent a standardized warm-up and familiarization period. Subsequently, the players accelerated over a distance of six meters and approached the force platforms at an approximate angle of 35° to the longitudinal axis of the runway The players received a pass from an experienced handball player during the penultimate step and
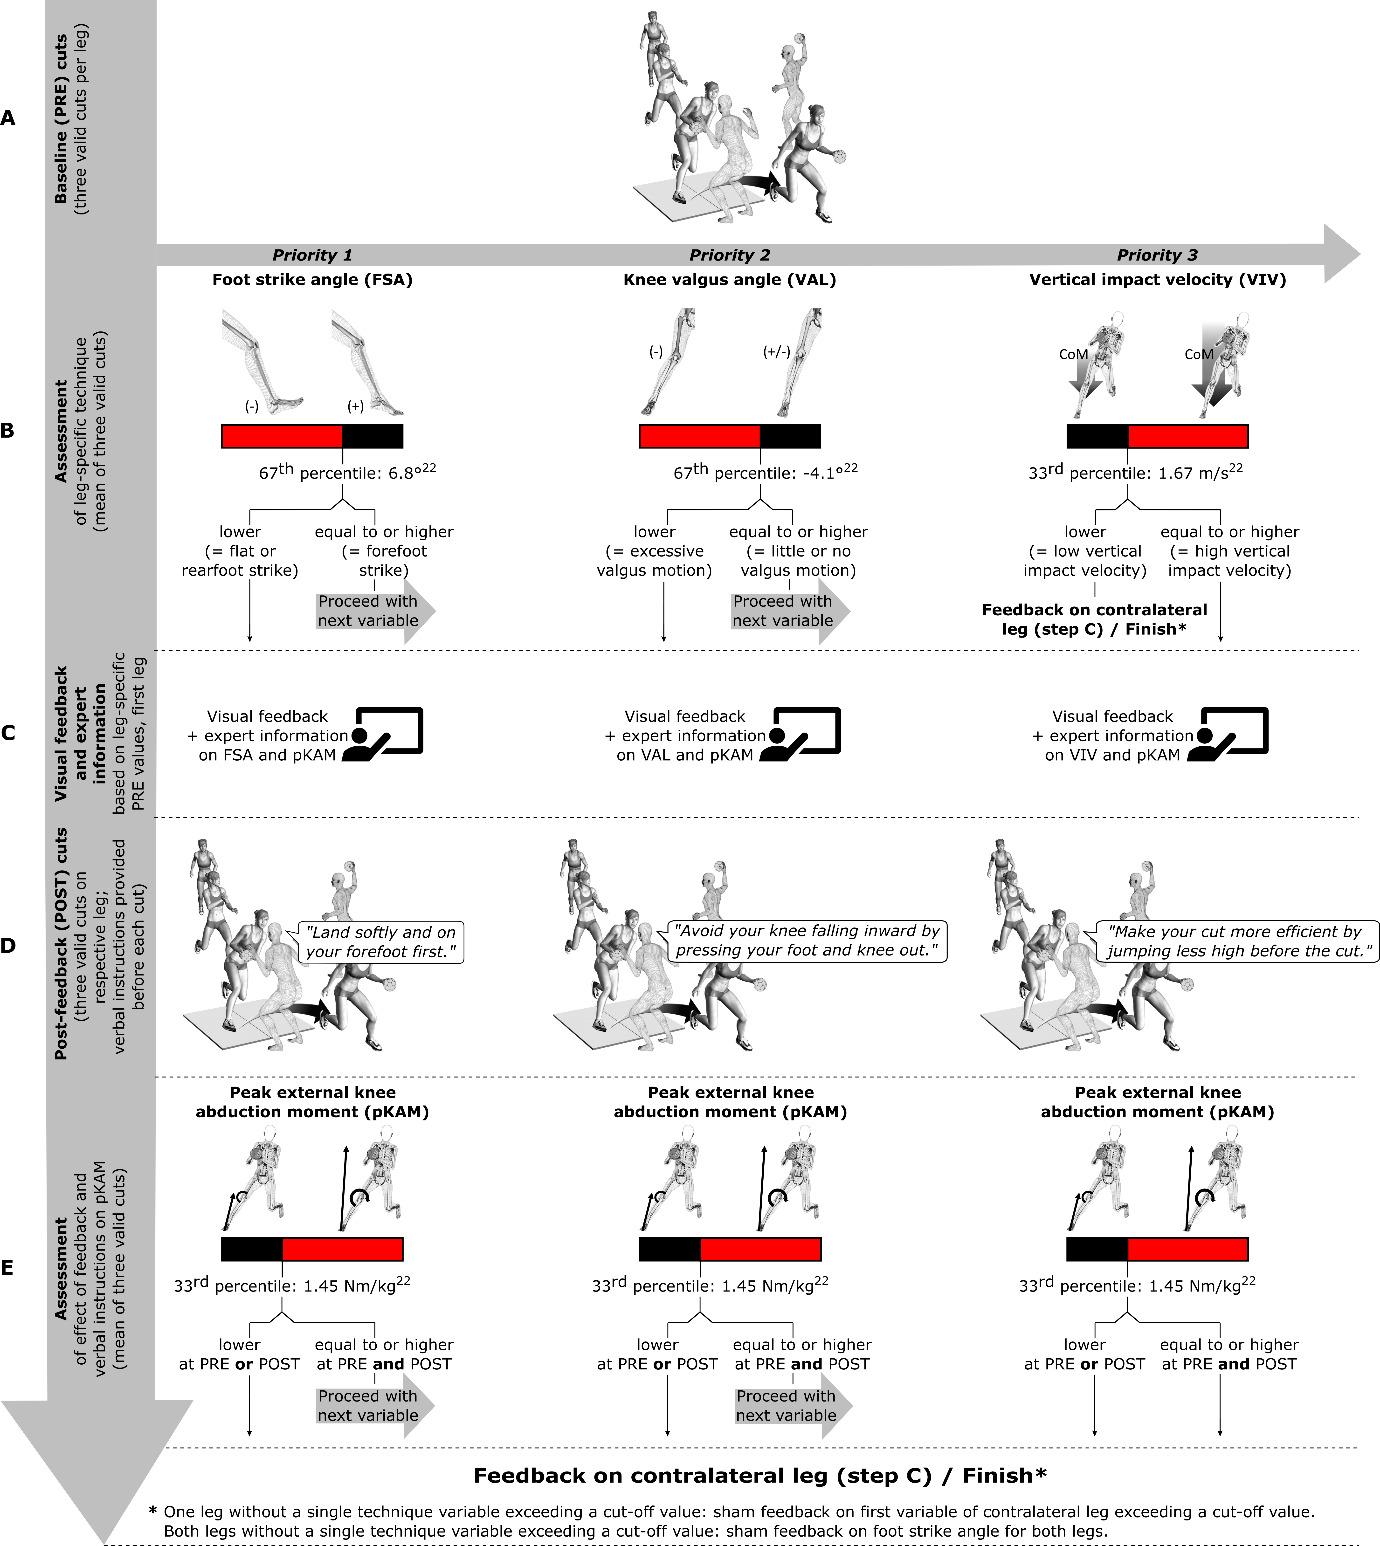
Figure 1. Full feedback procedure.
A: Players performed three valid handball-specific sidestep cuts on each leg that served as their baseline (PRE) values. The order of legs was randomized. B: Assessment of technique variables and their magnitudes of the first leg. C: Visual feedback with bar graphs and stick figures and standardized verbal feedback for the first leg. Feedback was provided on the peak external knee abduction moment (pKAM) and the first technique variable in the hierarchical order of foot strike angle (FSA), knee valgus angle (VAL), and vertical impact velocity (VIV) that exceeded its predefined cut-off value. D: Players performed three valid post-feedback (POST) cuts. Verbal instructions using a combination of internally- and externallydirected foci of attention were provided before each POST cut to guide technique modifications. E: Assessment of pKAM and presentation of results (bar graphs, stick figures) to players. When feedback ceased, focus shifted to the other leg, starting with step C.
subsequently executed a handball-specific sidestep cutting maneuver to pass a static human defender (Figure 1). Each player performed three valid cuts on each leg, which served as their individual baseline (PRE).
Following the completion of the PRE cuts, the players received personalized feedback regarding their individual pKAM and cutting technique for each leg (see Variable selection and feedback structure).
The feedback component in this study was implemented using a custom MATLAB application (R2021b, The Mathworks Inc., Natick, Massachusetts, USA).14 The Automatic Identification of Markers (AIM) and Project Automation Framework (PAF) features, integrated into Qualisys Track Manager, were employed for automatic export of marker trajectories and GRF after each recorded trial. Concurrently, the MATLAB application continuously scanned the desig-
nated folder in the background to immediately process any newly recorded trial and plot results.
The joint centers of the ankle and knee were determined as the midpoint between the malleoli and epicondyle markers, respectively The hip joint center was determined using the methodology described by Harrington et al.15 Segmental inertial properties were calculated based on regression equations from de Leva.16 The stance phase was defined as the period during which the unfiltered vertical GRF exceeded 30 N. All marker trajectories and GRF were filtered using a fourth-order low-pass Butterworth filter with a cutoff frequency of 20 Hz.17,18
To ensure the exclusion of invalid trials, a function was implemented to verify the accurate positioning of the foot within the boundaries of the force platform. After performing automated inverse dynamics calculations,19 pKAM normalized to body mass within the first 60 milliseconds of stance and technique variables at initial ground contact were computed. Following all calculations, essential kinematic and kinetic data were plotted and visible to the principal investigator to ensure data validity The calculation and plotting of the results were completed within three seconds after each recording.
Technique variables, i.e., foot strike angle (FSA), knee valgus angle (VAL), and vertical impact velocity of the center of mass (VIV), were chosen based on their established association with pKAM in female handball players.20,21 Cut-off values were set conservatively using a previously collected dataset.22 (Figure 1) Those cut-off values were:
• Mean FSA ≤ 6.8° (67th percentile in previously collected dataset; a negative angle corresponds to a rearfoot strike),
• Mean VAL ≤ -4.1° (67th percentile in previously collected dataset; a negative value corresponds to an increase in knee valgus at initial ground contact relative to the standing reference trial), and
• Mean VIV ≥ 1.67 m/s (33rd percentile in previously collected dataset; a higher value corresponds to an increased vertical impact velocity of the center of mass).
As high within-player differences in pKAM and technique were evident during pilot testing between cuts performed with the left and right leg, feedback was provided leg-specific. Players received feedback on the first variable in the hierarchical order of 1) FSA, 2) VAL, and 3) VIV that exhibited values exceeding its cut-off FSA served as the primary feedback variable due to its strong association with ACL injury and pKAM in various sports4,20,23‑26 and its association with performance.27 Knee valgus angle served as the second priority despite its established association with pKAM and ACL injury4,20,26,28 due to its absent relationship with performance.27 While longer airtime might make the cuts less efficient, some athletes could rely on that technique to better execute a fake, however, sufficient data on this variable’s relationship with performance are lacking.
Therefore, VIV feedback was the lowest priority in the feedback hierarchy (Figures 1 – 3).
Applying the same approach as for technique variables, a mean pKAM cut-off value of 1.45 Nm/kg was determined. This, along with the number of technique variables surpassing cut-off values at PRE, defined the maximum number of feedback cycles (see Communication to Players and Post-feedback Testing).
Players received instant visual feedback through bar graphs displaying the magnitude of pKAM and technique variables, along with stick figure representations of their movements including the GRF vector (Figure 2), displayed on a 65-inch screen. All players received standardized information on knee abduction moments and feedback (Table 1) on the first technique variable in the hierarchy exceeding a cutoff value. Subsequently, players performed three post-feedback (POST) cuts. Verbal instructions combining internallyand externally directed foci of attention were provided by the static human defender for each technique variable before each POST cut to guide technique modifications (Figure 1 and Table 1). Due to the previously reported relationship between approach speed and pKAM (20), a function in the custom MATLAB application rendered all POST trials performed with less than 90% of the mean PRE approach speed invalid. Following the POST cuts, outcomes were discussed. If pKAM was ≥ 1.45 Nm/kg at PRE and POST, and more than one technique variable exceeded its cut-off value at PRE, feedback on the next technique variable in the hierarchy exceeding its cut-off at PRE was provided. If PRE pKAM was < 1.45 Nm/kg or POST pKAM fell below that cutoff, or if only one technique variable exceeded its cut-off at PRE, the focus shifted to the other leg, and the same procedure consisting of PRE information and feedback as well as three POST cuts with verbal instructions was followed. For legs with no technique variable in excess of a cut-off value, sham feedback was provided on the first technique variable of the contralateral leg exceeding the cut-off If no technique variable exceeded a cut-off in either leg, sham FSA feedback was provided for both legs (Figure 1). Hence, feedback was offered to all players after each leg. As the present study was an initial step in a comprehensive intervention study, this choice warranted uniform conditions for both intervention and control groups at the start of the program. Nevertheless, potential effects of sham feedback were disregarded in the analysis.
POST values for technique variables (FSA, VAL, and VIV) and pKAM were compared to their respective PRE values. Additionally, to better understand the mechanisms through which feedback affects pKAM, the resultant GRF at pKAM and its frontal plane moment arm to the knee joint center were compared between PRE and POST
Data normality was assessed, and Student t-tests and Wilcoxon signed-rank tests were performed for normally
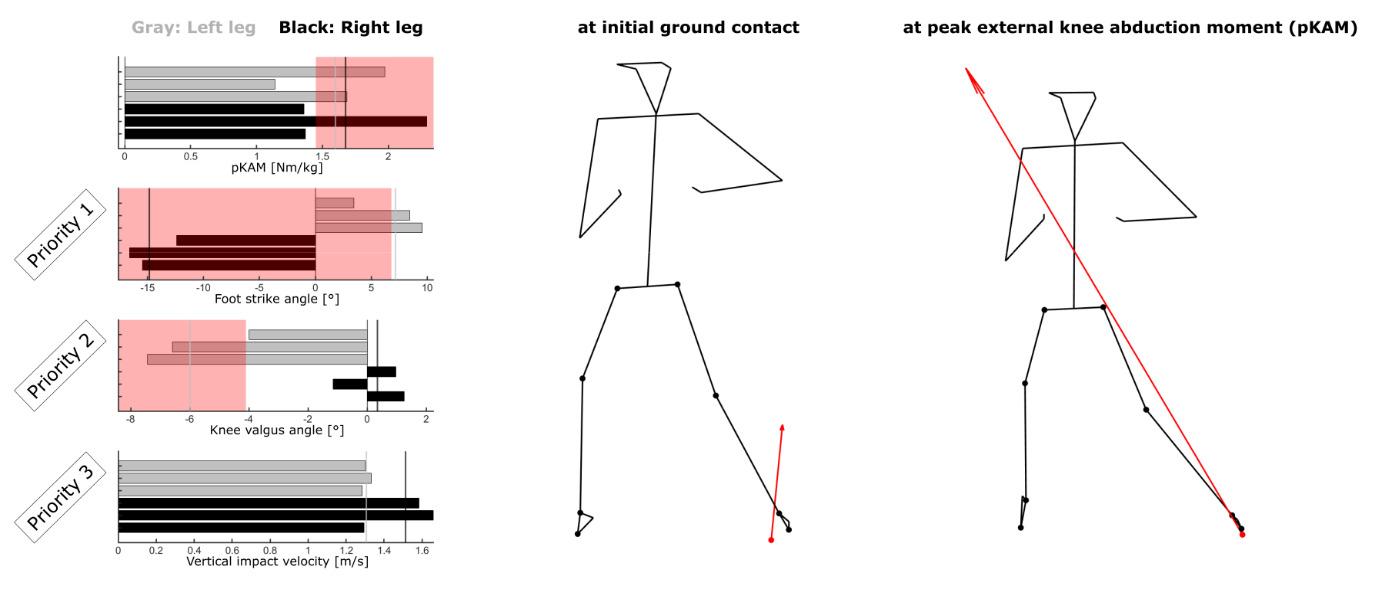
Figure 2. Visual feedback provided to a player after three baseline (PRE) cuts per leg.
The left and right stick figures represent the player’s posture during the most recently performed cut at initial ground contact and at peak external knee abduction moment (pKAM), respectively The bar graphs from top to bottom indicate pKAM within the first 60 milliseconds of stance, foot strike angle (FSA), knee valgus angle (VAL), and vertical impact velocity (VIV). Gray bars represent left-legged cuts, black bars represent right-legged cuts, vertical lines represent means over three cuts. Red patches indicate values exceeding the cut-off (not shown for VIV since magnitudes for this player were well below that cut-off). This player went on to receive FSA feedback for the right leg and VAL feedback for the left leg.
Table 1. Standardized feedback information and instructions provided to the players after baseline (PRE) and before each post-feedback (POST) cut, respectively.
Variable
External knee abduction moment
Expert information after PRE cuts
“An external knee abduction moment is a rotational force around your knee joint that can cause your knee to move inward, increasing the risk of knee injuries. By reducing the force, illustrated by the length of the arrow here, or bringing it closer to the knee joint, we aim to decrease the knee abduction moment shown in this graph. Targeted instructions will be provided to help you achieve this reduction.”
Foot strike angle “The foot strike angle indicates how your foot lands when you cut. Landing flatfooted or with the heel first, corresponding to low or negative values in the graph, is associated with elevated knee abduction moments. To avoid this, try to land softly and with your forefoot first, corresponding to high values in the graph.”
Knee valgus angle “The knee valgus angle indicates the alignment of your knee between your foot and hip when you land. If your knee moves inward, corresponding to negative values in the graph, it can contribute to elevated knee abduction moments. To avoid this, press your foot and knee out to maintain proper alignment, corresponding to values close to zero in the graph.”
Vertical impact velocity
“The vertical impact velocity indicates how fast your body moves downward and results from the height of your jump before the cut. High vertical impact velocities, corresponding to high values in the graph, are associated with elevated knee abduction moments. To make your cut more efficient, try jumping less high before the cut, corresponding to low values in the graph.”
and non-normally distributed data, respectively Effect sizes were calculated using Cohen’s d (for normally distributed data) and the rank biserial correlation coefficient, rrb (for non-normally distributed data). Significance was set at α = .05, and all statistical analyses were performed with JASP (Version 0.16.3, University of Amsterdam, Amsterdam, The Netherlands).
Verbal instructions provided before each POST cut
“Land softly and on your forefoot first.”
“Avoid your knee falling inward by pressing your foot and knee out.”
“Make your cut more efficient by jumping less high before the cut.”
Forty-eight female high-level handball players (mean ± SD: 16.7 ± 0.9 years, height: 1.72 ± 0.06 m, weight: 68.7 ± 8.9 kg) voluntarily participated in this study. The players reported their weekly handball training, strength training, and active game minutes as 480 ± 121 minutes, 216 ± 65 minutes, and 42 ± 23 minutes, respectively From the initial sample of 96 legs (48 players), four legs were excluded due to four players having difficulties performing sidestep cuts on the non-preferred leg. As a result, a final sample of 92 legs was
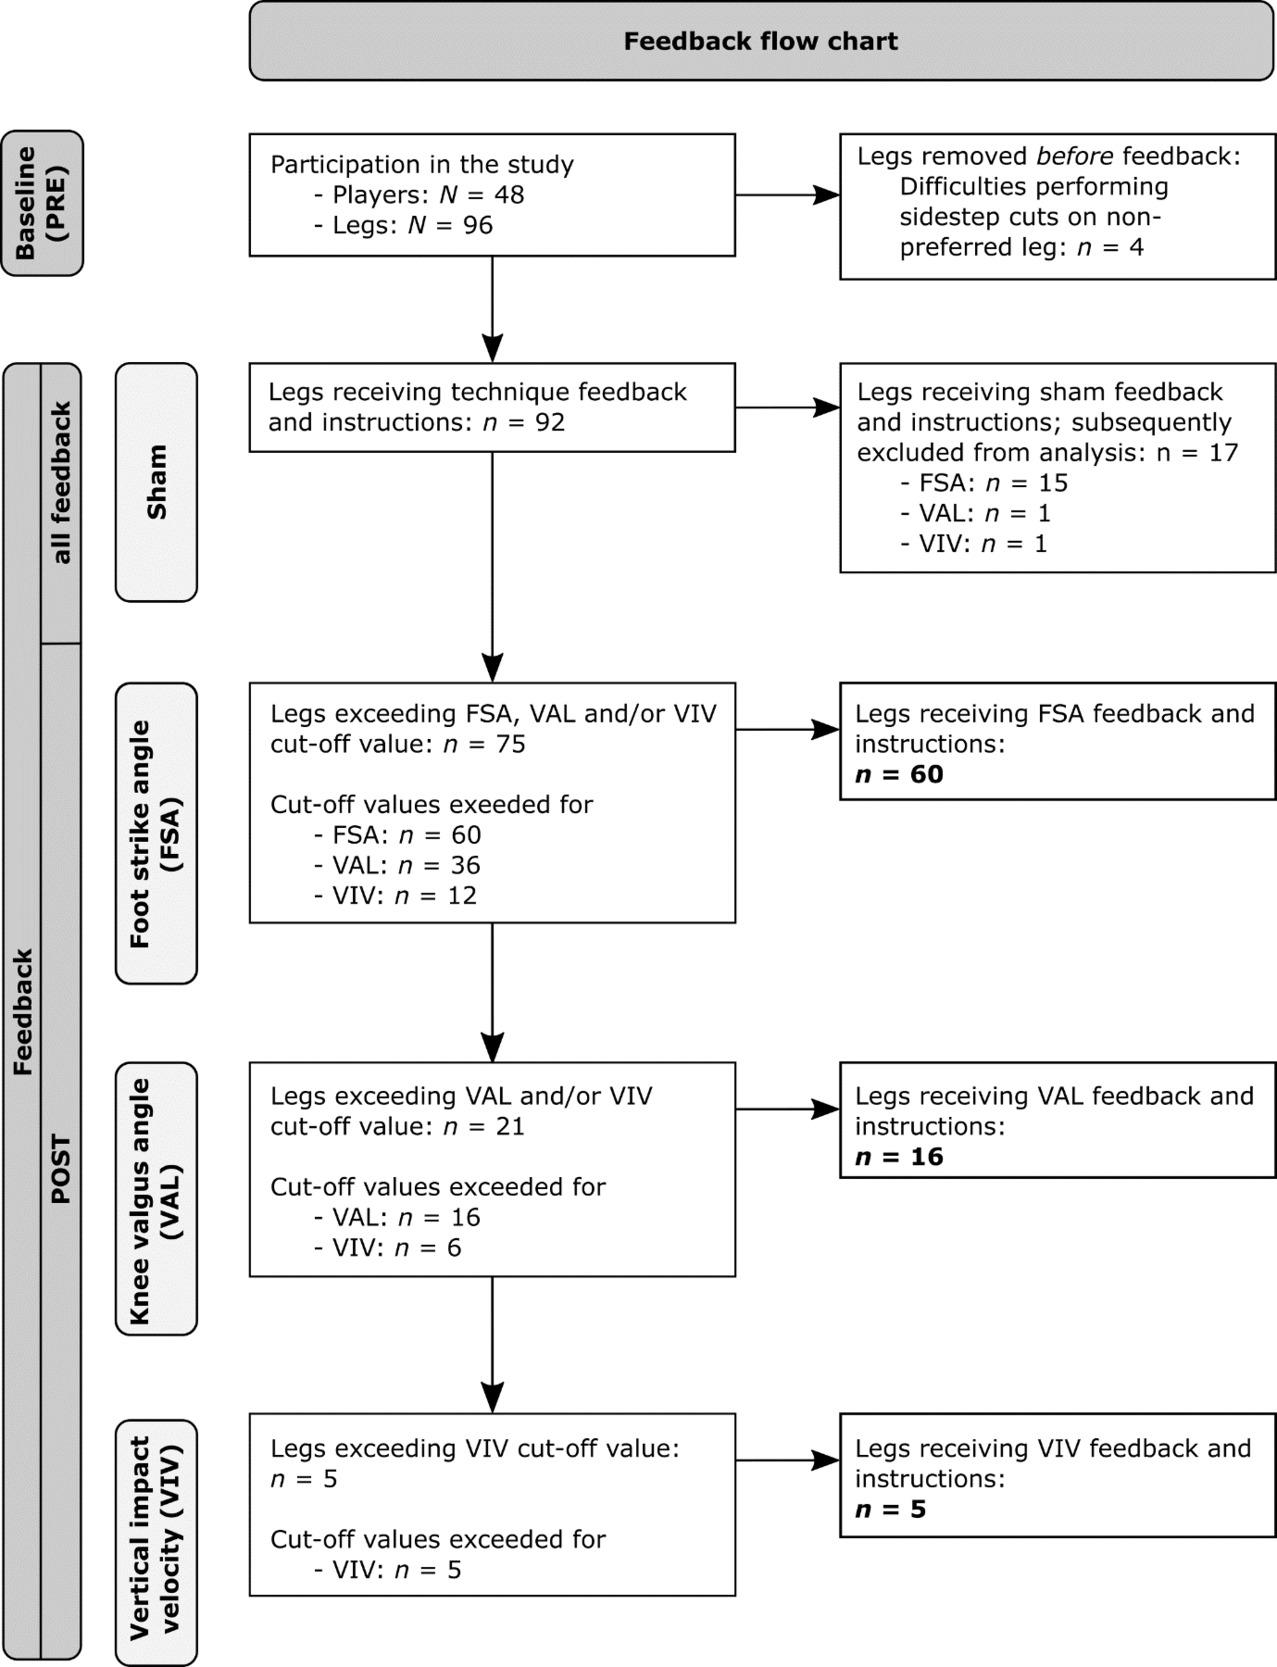
Figure 3. Flow chart of the provided feedback and instructions.
considered for analysis. Among this refined sample, sham feedback was administered on 17 occasions, with sham FSA feedback being provided in 15 instances, and sham VAL and sham VIV feedback each provided once. These instances of sham feedback were subsequently excluded from the analysis. The final analysis comprised 75 legs (Figure 3).
In total, 29 legs exhibited pKAM ≥ 1.45 Nm/kg at PRE. Out of these 29 legs, 14 legs also displayed multiple technique variables exceeding their cut-off, thus rendering them eligible for multiple cycles of feedback. Of these 14 legs, eight legs went through a single cycle of feedback before falling
below the pKAM cut-off of 1.45 Nm/kg, while six legs went through two cycles of feedback. No leg went through all three cycles of feedback.
FSA feedback was given a total of 60 times. While 36 legs were eligible for VAL feedback and 12 legs were eligible for VIV feedback (Figure 3), VAL and VIV feedback were provided only 16 and five times, respectively, due to the hierarchical feedback structure (Figure 1). In short, the 20 instances in which VAL feedback was not provided can be explained by 11 cases in which these legs also exhibited poor foot strike angles (≤ 6.8°) but low pKAM (< 1.45 Nm/ kg) at PRE so that only feedback on the foot strike angle was provided. In the remaining nine cases, the legs also exhibited poor foot strike angles (≤ 6.8°) combined with high
pKAM (≥ 1.45 Nm/kg) at PRE while successfully decreasing their pKAM below 1.45 Nm/kg at POST so that no feedback beyond the one targeting the foot strike angle was provided.
FSA feedback resulted in an improvement in foot strike angle of 12.7° (95% CI [10.5, inf]) on average (PRE vs. POST: -4.8 ± 8.4° vs. 7.9 ± 10.3°; p < 0.001, d = -1.26). Out of 60 legs, 41 legs (68.3%) showed improvements above the cut-off value of 6.8° at POST (Figure 4A). Importantly, FSA feedback resulted in a median reduction in pKAM of 0.14 Nm/kg (95% CI for Hodges-Lehmann Estimate [0.04, 0.24]) or 13.4% on average (PRE vs. POST: 1.19 ± 0.47 vs. 1.03 ± 0.46; p = 0.003, rrb = .40). Among the 20 legs with pKAM ≥ 1.45 Nm/kg at PRE, 14 legs (70%) improved to values below the cut-off at POST (Figure 4D). The resultant GRF at pKAM decreased by 2.7 N/kg (95% CI [1.0, inf]) or 13.8% on average (PRE vs. POST: 19.6 ± 6.2 N/kg vs. 16.9 ± 6.2; p = 0.004, d = 0.36). Changes in the frontal plane GRF moment arm to the knee joint center at pKAM (-0.2 cm, 95% CI [-0.9, 0.5], or -3.0%) were not statistically significantly different (PRE vs. POST: 6.6 ± 2.9 cm vs. 6.4 ± 2.7 cm; p = 0.590, d = 0.07) (Figure 4G).
VAL feedback resulted in a reduction in knee valgus angle of 1.5° (95% CI [0.3, inf]) on average (PRE vs. POST: -6.8 ± 2.1° vs. -5.3 ± 2.1°; p = 0.022, d = -0.55). Among the 16 legs, four legs (25%) successfully improved beyond the cut-off of -4.1° after VAL feedback (Figure 4B). Importantly, VAL feedback significantly reduced pKAM by 0.28 Nm/kg (95% CI [0.05, 0.51]) or 17.1% on average (PRE vs. POST: 1.64 ± 0.54 vs. 1.36 ± 0.44; p = 0.020, d = 0.65). Among the 11 legs with PRE pKAM ≥ 1.45 Nm/kg, six legs (54.5%) improved to values below the cut-off at POST (Figure 4E). Changes in the resultant GRF at pKAM (-0.43 N/kg, 95% CI [-3.0, 2.1], or -2.3%; PRE vs. POST: 17.4 ± 5.4 N/kg vs. 17.0 ± 7.0; p = 0.725, d = 0.09) and the frontal plane GRF moment arm to the knee joint center at pKAM (-0.8 cm, 95% CI [-inf, 0.3], or -8.2%; PRE vs. POST: 9.7 ± 1.2 cm vs. 8.9 ± 2.9 cm; p = 0.110, d = 0.32) were not statistically significantly different (Figure 4H).
VIV feedback significantly reduced the vertical impact velocity by 0.35 m/s (95% CI [0.15, inf]) or 19.0% on average (PRE vs. POST: 1.84 ± 0.14 m/s vs. 1.49 ± 0.17 m/s; p = 0.010, d = 1.66). Out of five legs, four legs (80%) achieved values below the cut-off of 1.67 m/s at POST (Figure 4C). Changes in pKAM (-0.20 Nm/kg, 95% CI [-0.68, 0.29], or -14.4%; PRE vs. POST: 1.32 ± 0.54 vs. 1.13 ± 0.52; p = 0.328, d = 0.50) were not statistically significantly different. None of the two legs with pKAM ≥ 1.45 Nm/kg at PRE improved to values below the cut-off at POST (Figure 4F). Changes in the resultant GRF at pKAM (-2.8 N/kg, 95% CI [-inf, 1.3], or -17.3%; PRE vs. POST: 16.2 ± 4.7 N/kg vs. 13.4 ± 4.2; p = 0.108, d = 0.66) and the frontal plane GRF moment arm to the knee joint center at pKAM (-0.1 cm, 95% CI [-1.9, 1.8], or -1.2%; PRE vs. POST: 8.4 ± 2.2 cm vs. 8.3 ± 2.7 cm; p = 0.925, d = 0.05) were not statistically significantly different (Figure 4I).
The primary objective of this study was to investigate the effect of individualized augmented feedback and instructions on cutting technique and pKAM during handball-specific sidestep cutting in female athletes. On average, all three targeted technique variables improved with medium to very strong effect sizes. Interestingly, despite large variations in both sample size and relative adherence to the instructions, all three targeted technique modifications yielded similar relative reductions in pKAM with medium effect sizes. This finding supports the high potential of feedback interventions addressing knee joint loading and suggests that even minor technique adjustments, as observed following VAL feedback, can lead to substantial reductions in pKAM. However, it is important to acknowledge the high inter-individual differences in technique and pKAM that persisted even after feedback and instructions. Adherence to the provided instructions did not consistently lead to reductions in pKAM, highlighting the complex nature of technique modifications and individual responses to feedback.
In scenarios where multiple variables exceeded their predefined cut-off value, the selection of the feedback variable was contingent upon PRE pKAM magnitudes and the variables’ performance-related relevance. Foot strike angle served as the primary feedback variable due to its strong association with ACL injury and pKAM in various sports4, 20,23‑26 and its positive effect on performance.27 Knee valgus angle was believed to be more challenging to modify instantaneously and seems to have no relationship with performance.27 It was therefore selected as the second priority for feedback despite its established association with pKAM and ACL injury.4,20,26,28 Spending more time airborne could reduce the efficiency of cuts, yet it might enable players to more effectively deceive or misdirect opponents. Therefore, VIV feedback was the last priority in the feedback hierarchy The authors believe that reducing the vertical impact velocity might hold a distinct advantage over previously proposed variables such as the knee flexion angle or range of motion that are common targets for technique modifications.29‑31 Increasing the knee flexion range of motion aims at dragging out the deceleration period to reduce the peak vertical GRF. By doing so, ground contact times might increase, and performance deteriorate.27 Lower vertical impact velocities reduce the need for high verticallydirected decelerating forces, thereby reducing the need for prolonged deceleration phases and increased contact times.
Knee valgus angle and vertical impact velocity have been previously shown to be consistently increased in handball players showing high pKAM across handball-specific sidestep cuts of varying complexity.21 The authors of that study therefore suggested these variables might be part of the players’ inherent movement strategy In that same dataset, the same task complexity used in the present study was the only one that, on average, provoked a rearfoot strike and, additionally, produced the highest pKAM across differently complex cutting maneuvers. Other technique variables such as the width of the cut, cutting angle, and ap-
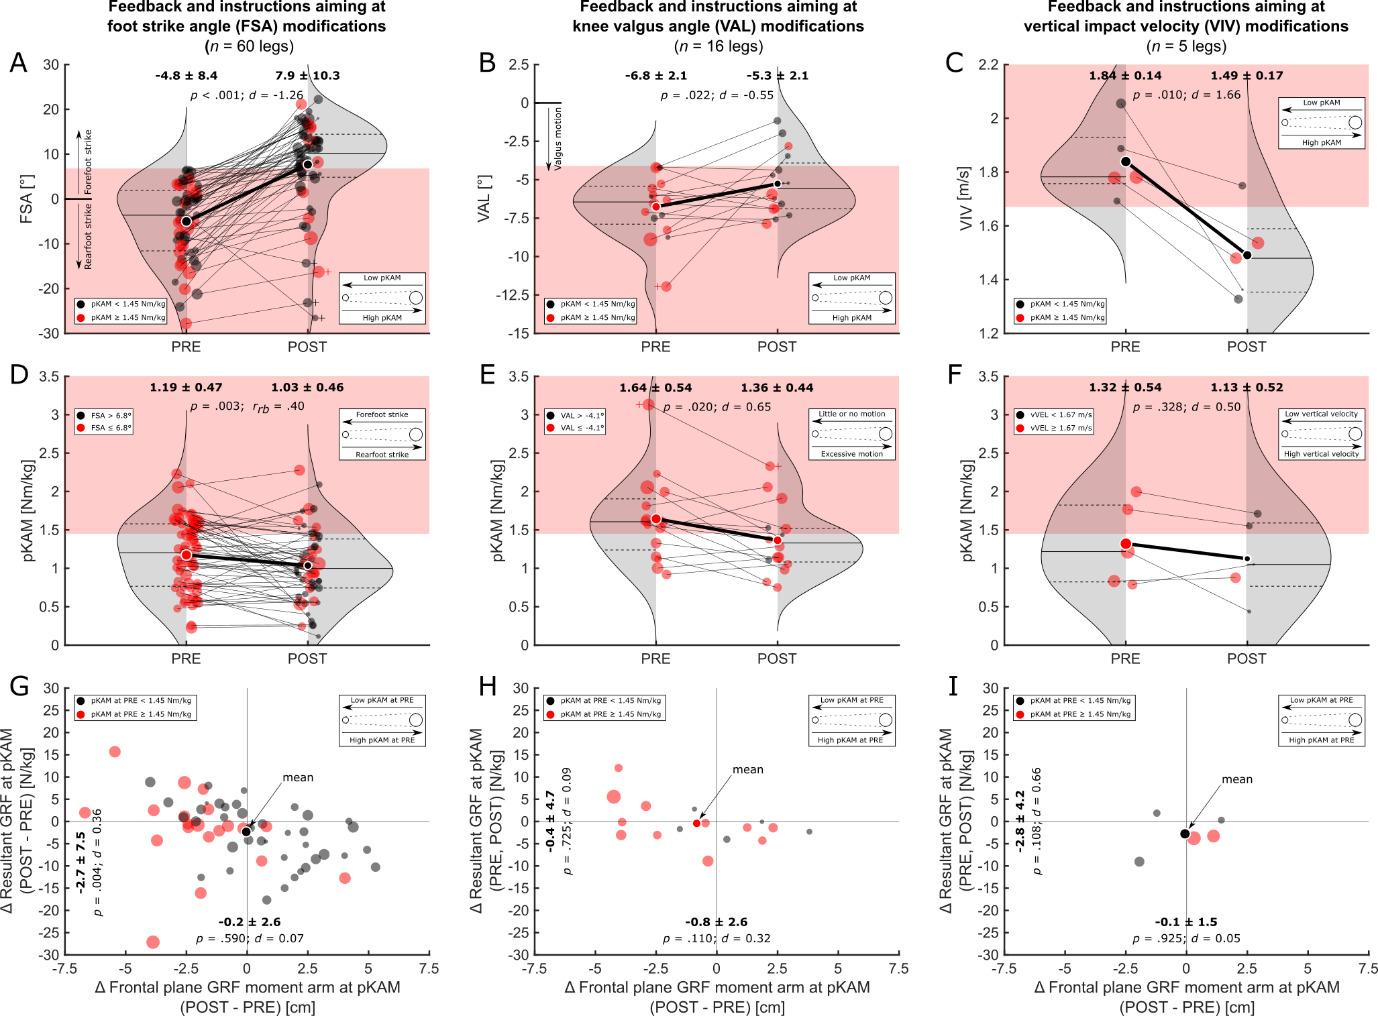
Figure 4. Results for the three feedback-instruction combinations targeting the foot strike angle (FSA; left column), knee valgus angle (VAL; middle column), and vertical impact velocity (VIV; right column).
A) – C): Technique at baseline (PRE) and after feedback (POST). The left portion of each figure shows the technique at baseline (PRE) while the right portion shows the technique after feedback (POST). Red patches in the background represent values exceeding the respective technique variable’s cut-off Dots represent individual legs, and dots with white edges represent means. To relate these values to each leg’s peak external knee abduction moment (pKAM), larger dots indicate higher pKAM, and black and red dots indicate legs below and above the pKAM cut-off, respectively Gray-shaded areas represent the distribution density with horizontal lines indicating interquartile ranges and medians.
D) – F): pKAM at baseline (PRE) and after feedback (POST). The left portion of each figure shows the pKAM at baseline (PRE) while the right portion shows the pKAM after technique feedback (POST). Red patches in the background represent values exceeding the pKAM cut-off Dots represent individual legs, and dots with white edges represent means. To relate these values to each leg’s technique, larger dots indicate more unfavorable technique, and black and red dots indicate values below or in excess of the respective technique variable’s cut-off, respectively Gray-shaded areas represent the distribution density with horizontal lines indicating interquartile ranges and medians. G) – I): Absolute changes in the resultant ground reaction force (GRF) at pKAM (vertical axis) and its frontal plane moment arm (horizontal axis). Larger dots indicate higher pKAM at baseline (PRE), and black and red dots indicate pKAM magnitudes below and above the pKAM cut-off, respectively
proach speed have been previously shown to explain a large proportion of the variance in pKAM.20 However, they did not differ between players showing consistently high and low pKAM across different sidestep cut complexities and are therefore potentially not part of a player’s automated motor program used across different game scenarios. Furthermore, changes to these variables might have detrimental effects on performance27 and might therefore be unattractive to players and coaches. Therefore, these variables were not part of the feedback variables of the present study. It is interesting to note that the foot strike angle (“toe landing”) and knee valgus angle were also significant predictors of pKAM in the study by Kristianslund and colleagues.20
Employing cut-off values as criteria for assessing technique improvements following feedback yielded improvements in 68.3%, 25%, and 80% of the cases following FSA, VAL, and VIV feedback, respectively. However, even slight
improvements in technique might have substantial effects on pKAM as evident with VAL feedback. Using the cutoff values to assess technique enhancements resulted in the lowest percentage of improvement in that group, however, it demonstrated the highest pKAM at PRE and the highest relative (-17.1%) and absolute reductions in pKAM (-0.28 Nm/kg) at POST, highlighting the relationship between knee valgus angle and pKAM and the potential of the variable in reducing frontal plane knee joint loading. Looking at average changes in technique from PRE to POST and neglecting cut-off values, the vast majority of players were able to improve their technique. However, the response to technique modifications as measured by pKAM is highly individual and reductions in pKAM were not always achieved when players adhered to feedback. This highlights the complex interplay between feedback and technique variables and the potential to change whole-body dynamics. Yet, it
seems that the selected variables show great potential in reducing pKAM, and the effect might be magnified when used in combination. Considering that female players between the age of 15 and 19 have the highest incidence rate of ACL injury,32 coaches should stress sound technique early in the playing career.
Only a limited number of studies have previously aimed at reducing pKAM following feedback on sidestep cutting technique.33,34 Benjaminse et al.33 investigated the immediate effects of verbal instructions compared to visual feedback on kinematics and kinetics at peak frontal plane knee joint moment during unanticipated sidestep cutting in males and females while also investigating the retention of the new technique over time. While the authors found that males are more responsive to visual feedback and able to retain improvements in technique over a four-week period, the authors concluded that females might prefer a combination of visual and verbal feedback, as used in the present study Interestingly, frontal plane knee joint moments were unresponsive to either feedback strategy in both males and females. The results regarding the frontal plane knee joint loading are in contrast to those by Dempsey et al.34 who used a six-week technique modification program transitioning from closed- to open-skills practice in male team sport athletes. In their study, athletes received a combination of oral and visual feedback twice a week including reference videos of athletes demonstrating the desired sidestep cutting technique to bring the stance leg closer to the midline of the body while keeping the torso upright and facing in the direction of travel. Using this approach, the authors successfully decreased frontal plane knee joint moments in both planned and unplanned sidestep cuts.34
More research has focused on feedback interventions for jumping or landing tasks, with two systematic reviews shedding light on the topic.8,35 Armitano et al.35 and Neilson et al.8 synthesized the findings of these studies and reported that feedback can lead to reductions in vertical GRF and increases in knee flexion angles during various jump landing tasks. Furthermore, it has been observed that learning acquired through feedback can transfer to similar tasks.35 However, the transfer of newly acquired motor skills to sidestep cutting tasks has yielded conflicting results in the literature. In support of providing feedback specific to the movement that requires technique optimization, a study utilizing a combination of oral and video feedback found no transfer of learning from drop jumps to sidestep cutting tasks.36 This suggests that feedback should be tailored to the specific movement pattern in order to facilitate effective skill transfer and improvement which is further highlighted by poor correlations between pKAM in drop jumps and sidestep cuts.37 In contrast, another study demonstrated that improved jump landing technique could be transferred to sidestep cutting when incorporating an external attentional focus and self-controlled feedback.29 Nevertheless, it is important to acknowledge that these improvements related to increases in the range of motion of the knee flexion angle, which could potentially impact performance negatively 27
The secondary objective of the current study was to explore the underlying mechanisms responsible for changes in pKAM. FSA feedback significantly reduced the magnitude of the resultant GRF at pKAM, potentially due to the ankle plantar flexors acting as an additional damping element.28 Differences in the resultant GRF and the frontal plane moment arm to the knee joint center from PRE to POST were not statistically significant after VAL and VIV feedback. However, the medium effect size for changes in the resultant GRF after VIV feedback indicates potentially meaningful improvements. Interestingly, in total, there were only three instances where both the resultant GRF and frontal plane moment arm increased simultaneously, indicating that the feedback interventions generally resulted in positive changes in at least one component of pKAM (Figure 4G–I). However, it is important to note that the responsible mechanisms for pKAM changes showed high inter-individual variability. Future research might investigate whether the optimal feedback selection can be determined based on the main factor in driving pKAM alone, i.e., the resultant GRF or its frontal plane moment arm to the knee joint center.
Incorporating immediate feedback and outcome discussions with players within long-term interventions might hold potential for enhancing player motivation and adherence. For researchers, the implementation of immediate feedback and insights into the present state of the player serve as critical tools to verify the effectiveness of prescribed interventions, allowing for adjustments to be made in a timely manner to optimize outcomes. Moreover, the reliance on technology becomes indispensable in the identification of players at risk and the differentiation between kinematic and kinetic improvements. Feedback based on visual assessments might fall short in inducing changes in kinetics unless given by experts,38 underlining the necessity for advanced technological solutions. These solutions, however, must be user-friendly and efficient to accommodate the practical constraints of time, manpower, and equipment associated with the present approach. Transitioning from lab-based setups to portable and cost-effective technological systems that enable on-field assessments would enhance the practical applicability of feedback interventions. This would democratize access to advanced training aids across different levels of sport and foster more evidence-based approaches to injury prevention and performance optimization, ultimately bridging the gap between research findings and their application in real-world sports scenarios.
Although the overall results of the study demonstrate the positive effects of feedback interventions, it is important to acknowledge certain limitations. Firstly, the hierarchical structure used for selecting feedback variables led to a reduced number of players receiving comprehensive feedback across all variables. The cut-off values utilized to determine the need for feedback were selected arbitrarily, drawing from an existing dataset.22 It is important to clarify that these cut-offs were not intended to indicate injury risk levels, but rather, were conservatively chosen benchmarks aimed at evaluating the practicability of tech-
nique adjustments. Furthermore, the hierarchical structure for variable selection primarily stemmed from the relevance of technique variables to cutting performance.27 Nevertheless, it is worth noting that performance predominantly revolved around ground contact times or time to complete a task, which may not be of highest importance in a maneuver aimed at successful opponent passage. Instead, a more pertinent performance metric might be the successful deception of the opponent into perceiving a contrary direction of movement. Secondly, although previous research39 demonstrated good to excellent within-session and fair to good between-session reliability with three trials of the task, the optimal number of trials required to establish a stable movement pattern after feedback remains unclear Thirdly, the risk of sustaining an ankle injury when modifying the foot strike angle remains unknown. While a recent systematic review suggests that ankle plantar flexion might not play a crucial role in the occurrence of lateral ankle sprains,40 a combination of ankle plantar flexion and inversion strains the anterior tibiofibular ligament and calcaneofibular ligament more than inversion alone.41 Therefore, caution is necessary when transitioning to a new cutting technique, especially for players with a history of lateral ankle sprains. It is possible that these players should focus on landing on the forefoot only during the early impact absorption phase while having the foot firmly planted during the main part of the cut. Alternatively, these players might benefit from other technique modifications. Next, the study did not investigate the long-term retention of the newly adopted technique or its transfer to unanticipated sidestep cutting scenarios. Although the knee valgus motion and vertical impact velocity have been proposed as components of a player’s inherent movement strategy during handballspecific sidestep cuts with varying complexity,21 it remains unclear whether training designed to alter cutting technique in preplanned cuts automatically translates to complex unplanned cuts. Lastly, it is important to acknowledge that the diverse nature of feedback approaches (visual, verbal, self-guided, expert, etc.) and instructions (internallyor externally directed) was not specifically investigated in
the present study The selection and combination of these feedback modalities and instruction types potentially impact the outcomes, however, exploring these factors was beyond the scope of the current study.
To the authors’ knowledge, the current study represents a pioneering effort in the field as it is the first to employ augmented feedback immediately following a sport-specific task known for its high incidence of non-contact ACL injury4 using an individualized approach while also uncovering individual responses and mechanisms responsible for reductions in frontal plane knee joint loading. Future investigations should aim to examine the long-term retention of feedback effects and transferability to unanticipated sidestep cutting scenarios. Furthermore, possibilities for on-filed assessments should be explored. Additionally, further research is needed to compare the effectiveness of individualized feedback approaches to generic approaches in optimizing technique and performance outcomes. Understanding the sustainability and generalizability of feedback interventions in different contexts will provide valuable insights for sports practitioners, coaches, and researchers.
Individualized augmented feedback interventions show great potential in improving sidestep cutting technique instantly. Consequently, these improvements contribute to a 13.4% to 17.1% reduction in knee joint loading associated with ACL injury, while the adherence to the instructions and the underlying mechanism responsible for pKAM reductions vary between targeted technique variables and players. Future studies may explore possibilities for individualized on-field technique feedback using low-cost equipment.
Submitted: November 22, 2023 CDT, Accepted: March 18, 2024 CDT
©The Author(s)
This is an open-access article distributed under the terms of the Creative Commons Attribution 4.0 International License (CCBY-NC-4.0). View this license’s legal deed at https://creativecommons.org/licenses/by-nc/4.0 and legal code at https://creativecommons.org/licenses/by-nc/4.0/legalcode for more information.
1. Markolf KL, Burchfield DM, Shapiro MM, Shepard MF, Finerman GAM, Slauterbeck JL. Combined knee loading states that generate high anterior cruciate ligament forces. J Orthop Res 1995;13(6):930-935. doi:10.1002/jor.1100130618
2. Chia L, De Oliveira Silva D, Whalan M, et al. Noncontact anterior cruciate ligament injury epidemiology in team-ball sports: A systematic review with meta-analysis by sex, age, sport, participation level, and exposure type. Sports Med 2022;52(10):2447-2467 doi:10.1007/ s40279-022-01697-w
3. Koga H, Nakamae A, Shima Y, et al. Mechanisms for noncontact anterior cruciate ligament injuries: Knee joint kinematics in 10 injury situations from female team handball and basketball. Am J Sports Med 2010;38(11):2218-2225. doi:10.1177/ 0363546510373570
4. Olsen OE, Myklebust G, Engebretsen L, Bahr R. Injury mechanisms for anterior cruciate ligament injuries in team handball: A systematic video analysis. Am J Sports Med 2004;32(4):1002-1012. doi:10.1177/0363546503261724
5. Lohmander LS, Östenberg A, Englund M, Roos H. High prevalence of knee osteoarthritis, pain, and functional limitations in female soccer players twelve years after anterior cruciate ligament injury: High OA prevalence in ACL-injured female soccer players. Arthritis & Rheumatism 2004;50(10):3145-3152. doi:10.1002/art.20589
6. Lohmander LS, Englund PM, Dahl LL, Roos EM. The long-term consequence of anterior cruciate ligament and meniscus injuries: Osteoarthritis. Am J Sports Med 2007;35(10):1756-1769. doi:10.1177/ 0363546507307396
7. Richards R, van den Noort JC, Dekker J, Harlaar J. Gait retraining with real-time biofeedback to reduce knee adduction moment: Systematic review of effects and methods used. Arch Phys Med Rehabil. 2017;98(1):137-150. doi:10.1016/j.apmr.2016.07.006
8. Neilson V, Ward S, Hume P, Lewis G, McDaid A. Effects of augmented feedback on training jump landing tasks for ACL injury prevention: A systematic review and meta-analysis. Phys Ther Sport 2019;39:126-135. doi:10.1016/j.ptsp.2019.07.004
9. Hewett TE, Myer GD, Ford KR, et al. Biomechanical measures of neuromuscular control and valgus loading of the knee predict anterior cruciate ligament injury risk in female athletes: A prospective study Am J Sports Med 2005;33(4):492-501. doi:10.1177/ 0363546504269591
10. Krosshaug T, Nakamae A, Boden BP, et al. Mechanisms of anterior cruciate ligament injury in basketball: Video analysis of 39 cases. Am J Sports Med 2007;35(3):359-367 doi:10.1177/ 0363546506293899
11. Heinert B, Rutherford D, Kernozek TW. Effectiveness of augmented feedback on drop landing using baseline vertical ground reaction in female athletes. Int J Athl Ther Train. 2023;28(1):40-45. doi:10.1123/ijatt.2021-0132
12. Krosshaug T, Steffen K, Kristianslund E, et al. The vertical drop jump is a poor screening test for ACL injuries in female elite soccer and handball players: A prospective cohort study of 710 athletes. Am J Sports Med. 2016;44(4):874-883. doi:10.1177/ 0363546515625048
13. Dos’Santos T, Thomas C, Comfort P, Jones PA. Biomechanical effects of a 6-week change-ofdirection technique modification intervention on anterior cruciate ligament injury risk. J Strength Condit Res. 2021;35(8):2133-2144. doi:10.1519/ jsc.0000000000004075
14. Mai P, Bill K, Mausehund L, et al. Fast-feedback on joint biomechanics for team sport athletes: A feasibility study with implications for injury risk monitoring. In: Dallas, TX, USA; 2023. https://www.ors.org/transactions/2023/1764.pdf
15. Harrington ME, Zavatsky AB, Lawson SEM, Yuan Z, Theologis TN. Prediction of the hip joint centre in adults, children, and patients with cerebral palsy based on magnetic resonance imaging. J Biomech 2007;40(3):595-602. doi:10.1016/ j.jbiomech.2006.02.003
16. de Leva P. Joint center longitudinal positions computed from a selected subset of Chandler’s data. J Biomech. 1996;29(9):1231-1233. doi:10.1016/ 0021-9290(96)00021-8
17 Mai P, Willwacher S. Effects of low-pass filter combinations on lower extremity joint moments in distance running. J Biomech. 2019;95:109311. doi:10.1016/j.jbiomech.2019.08.005
18. Kristianslund E, Krosshaug T, van den Bogert AJ. Effect of low pass filtering on joint moments from inverse dynamics: Implications for injury prevention. J Biomech. 2012;45(4):666-671. doi:10.1016/ j.jbiomech.2011.12.011
19. Hof AL. An explicit expression for the moment in multibody systems. J Biomech 1992;25(10):1209-1211. doi:10.1016/ 0021-9290(92)90076-d
20. Kristianslund E, Faul O, Bahr R, Myklebust G, Krosshaug T. Sidestep cutting technique and knee abduction loading: implications for ACL prevention exercises. Br J Sports Med 2014;48(9):779-783. doi:10.1136/bjsports-2012-091370
21. Bill K, Mai P, Willwacher S, Krosshaug T, Kersting UG. Athletes with high knee abduction moments show increased vertical center of mass excursions and knee valgus angles across sport-specific fake-and-cut tasks of different complexities. Front Sports Act Living. 2022;4:983889. doi:10.3389/fspor.2022.983889
22. Mai P, Bill K, Glöckler K, et al. Unanticipated fakeand-cut maneuvers do not increase knee abduction moments in sport-specific tasks: Implication for ACL injury prevention and risk screening. Front Sports Act Living 2022;4:983888. doi:10.3389/fspor.2022.983888
23. Boden BP, Torg JS, Knowles SB, Hewett TE. Video analysis of anterior cruciate ligament injury: Abnormalities in hip and ankle kinematics. Am J Sports Med. 2009;37(2):252-259. doi:10.1177/ 0363546508328107
24. Donnelly CJ, Chinnasee C, Weir G, Sasimontonkul S, Alderson J. Joint dynamics of rear- and fore-foot unplanned sidestepping. J Sci Med Sport 2017;20(1):32-37 doi:10.1016/j.jsams.2016.06.002
25. Lucarno S, Zago M, Buckthorpe M, et al. Systematic video analysis of anterior cruciate ligament injuries in professional female soccer players. Am J Sports Med. 2021;49(7):1794-1802. doi:10.1177/03635465211008169
26. Donelon TA, Dos’Santos T, Pitchers G, Brown M, Jones PA. Biomechanical determinants of knee joint loads associated with increased anterior cruciate ligament loading during cutting: A systematic review and technical framework. Sports Med - Open. 2020;6(1):53. doi:10.1186/s40798-020-00276-5
27 Fox AS. Change-of-direction biomechanics: Is what’s best for anterior cruciate ligament injury prevention also best for performance? Sports Med 2018;48(8):1799-1807 doi:10.1007/ s40279-018-0931-3
28. Boden BP, Sheehan FT Mechanism of noncontact ACL injury: OREF Clinical Research Award 2021. J Orthop Res 2022;40(3):531-540. doi:10.1002/ jor.25257
29. Myer GD, Stroube BW, DiCesare CA, et al. Augmented feedback supports skill transfer and reduces high-risk injury landing mechanics: A double-blind, randomized controlled laboratory study Am J Sports Med 2013;41(3):669-677 doi:10.1177/0363546512472977
30. Benjaminse A, Welling W, Otten B, Gokeler A. Transfer of improved movement technique after receiving verbal external focus and video instruction. Knee Surg Sports Traumatol Arthrosc. 2018;26(3):955-962. doi:10.1007/s00167-017-4671-y
31. Mandelbaum BR, Silvers HJ, Watanabe DS, et al. Effectiveness of a neuromuscular and proprioceptive training program in preventing anterior cruciate ligament injuries in female athletes: 2-year followup. Am J Sports Med. 2005;33(7):1003-1010. doi:10.1177/0363546504272261
32. Renstrom P, Ljungqvist A, Arendt E, et al. Noncontact ACL injuries in female athletes: an International Olympic Committee current concepts statement. Br J Sports Med 2008;42(6):394-412. doi:10.1136/bjsm.2008.048934
33. Benjaminse A, Otten B, Gokeler A, Diercks RL, Lemmink KAPM. Motor learning strategies in basketball players and its implications for ACL injury prevention: a randomized controlled trial. Knee Surg Sports Traumatol Arthrosc 2017;25(8):2365-2376. doi:10.1007/s00167-015-3727-0
34. Dempsey AR, Lloyd DG, Elliott BC, Steele JR, Munro BJ. Changing sidestep cutting technique reduces knee valgus loading. Am J Sports Med. 2009;37(11):2194-2200. doi:10.1177/ 0363546509334373
35. Armitano CN, Haegele JA, Russell DM. The use of augmented information for reducing anterior cruciate ligament injury risk during jump landings: A systematic review. J Athl Train. 2018;53(9):844-859. doi:10.4085/1062-6050-320-17
36. Etnoyer J, Cortes N, Ringleb SI, Van Lunen BL, Onate JA. Instruction and jump-landing kinematics in college-aged female athletes over time. J Athl Train 2013;48(2):161-171. doi:10.4085/ 1062-6050-48.2.09
37 Kristianslund E, Krosshaug T Comparison of drop jumps and sport-specific sidestep cutting: Implications for anterior cruciate ligament injury risk screening. Am J Sports Med 2013;41(3):684-688. doi:10.1177/0363546512472043
38. Leonard KA, Simon JE, Yom J, Grooms DR. The immediate effects of expert and dyad external focus feedback on drop landing biomechanics in female athletes: An instrumented field study. Int J Sports Phys Ther 2021;16(1):96-105.
39. Mok KM, Bahr R, Krosshaug T Reliability of lower limb biomechanics in two sport-specific sidestep cutting tasks. Sports Biomech. 2018;17(2):157-167. doi:10.1080/14763141.2016.1260766
40. Lysdal FG, Wang Y, Delahunt E, et al. What have we learnt from quantitative case reports of acute lateral ankle sprains injuries and episodes of ‘givingway’ of the ankle joint, and what shall we further investigate? Sports Biomech 2022;21(4):359-379. doi:10.1080/14763141.2022.2035801
41. Wei F, Fong DTP, Chan KM, Haut RC. Estimation of ligament strains and joint moments in the ankle during a supination sprain injury Comp Meth Biomech Biomed Engineer. 2015;18(3):243-248. doi:10.1080/10255842.2013.792809
Courtney A Fernandes1 , Grant E Norte2 , Sarah M Schwab3 , Alli Gokeler4 , Amanda Murray5 , David M Bazett-Jones6 , David A Sherman7,8 a
1 Student Health Services, Boston University, 2 Cognition Neuroplasticity and Sarcopenia Laboratory, University of Central Florida, 3 3. Department of Rehabilitation, Exercise, & Nutrition Sciences, University of Cincinnati, 4 4. Exercise Science and Neuroscience, Department of Exercise & Health, Paderborn University, 5 College of Health and Human Services, University of Toledo, 6 5. College of Health and Human Services, University of Toledo, 7 Chobanian & Avedisian School of Medicine, Boston University, 8 Live4 Physical Therapy and Wellness
Keywords: Complex Systems, Rehabilitation, Return to Sport, Interpersonal Dynamics, Coordination https://doi.org/10.26603/001c.116156
Return to sport decision-making may be improved by assessing an athlete’s ability to coordinate movement with opponents in sport. The purpose was to investigate whether previous injuries associated with female soccer players’ interpersonal coordination during a collision avoidance task. The authors hypothesized that external perturbations would disrupt the strength and stability of coordinated movement, and that individuals with a history of injury would be less likely to recover coordinated movement.
Study Design
Cross-Sectional
Methods
Nine female athletes with a history of lower extremity injuries and nine without injuries were paired into dyads. Each dyad completed twenty trials of an externally paced collision-avoidance agility task with an unanticipated perturbation. Participant trajectories were digitized and analyzed using cross-recurrence quantification analysis (CRQA) to determine the strength and stability of interpersonal coordination dynamics. Trials in which participants with injury history assumed leader or follower roles within each dyad were then used to study how dyadic coordination varied across task stages (early, perturbation, and late) using linear mixed effect models. Cohen’s d effect sizes were calculated to demonstrate magnitude of differences. In exploratory analysis, psychological readiness (i.e., self-reported knee functioning, fear of injury, and risk-taking propensity) was evaluated for their association with leader-follower status.
Results
Perturbation disrupted the strength (R2=0.65, p<0.001, early=49.7±1.7, perturbation=41.1±1.7, d=0.39) and stability (R2=0.71, p < 0.001, early=65.0±1.6, perturbation=58.0±1.7, d=0.38) of interpersonal coordination regardless of leader-follower status. Individuals with injury history failed to restore coordination after the perturbation compared to control participants (injury=44.2.0±2.1, control=50.8±2.6, d=0.39). Neither demographic nor psychological measures were associated with leader-follower roles (B=0.039, p=0.224).
Corresponding Author:
David A. Sherman, PhD, DPT, ATC (https://orcid.org/0000-0002-3027-9124)
Live4 Physical Therapy and Wellness Acton, MA 01720
Phone: (401) 225-1233
Email: dave@live4pt.com
Individuals with a history of lower extremity injury may have a diminished ability to adapt interpersonal coordination to perturbations, possibly contributing to a higher risk of re-injury.
3
With an estimated 240 million players in over two hundred countries and territories, soccer is often considered the world’s most popular sport.1 High rates of injury (30.3 injuries/1000 hours) result in socioeconomic and quality of life burdens,2 and they have motivated decades of research and practical efforts towards primary and secondary injury prevention. The nature of soccer involves high-intensity movements, coordinated action between teammates, and evasive collision-avoidant actions with opponents. This contributes to the majority of lower extremity injuries occurring through non-contact mechanisms (60-90%), which primarily include hamstring strains, anterior cruciate ligament (ACL) tears, and ankle sprains.2,3 Once an individual experiences injury, they are at increased risk for future injuries,4 a risk that is often attributed to faults in neuromuscular control strategies.2,5,6 Yet, isolated environments used in testing neuromuscular control are not representative of games in which players continuously interact with other independent actors (i.e., interpersonal dynamics). While there is a body of literature that supports the importance of controlling interpersonal dynamics to team success,7‑12 whether and how previous injuries influence interpersonal dynamics remains unclear.2
Sports are complex systems composed of an intricate network of continuously evolving tasks and environments.12‑14 Athletes often face challenging interpersonal interactions and perturbations from their environment that require them to adapt their movements.15 For example, athletic movements are influenced by the movements of other players. Higher injury rates in defensive players16‑18 are theorized to occur in part because defenders need to react quickly to evasive offensive strategies.16,18 In a sense, defenders must follow their opponents lead. Furthermore, psychological constructs, such as confidence, fear of painrelated movement, and self-efficacy, are risk factors in sport-related injury,19‑24 indicating that there are complex interactions between physical capacity and psychological readiness. Interestingly, female athletes frequently perceive the risk of re-injury as beyond their control,22 suggesting athletes are unprepared to control the ‘chaotic’ environment of sport.25 These findings challenge the construct validity of rehabilitation and return to sport protocols that fail to recreate the complex sport environment or elicit comparable behavioral demands.13,25‑28 This protocol shortfall may be a contributor to the elevated risk of re-injury upon returning to sport after rehabilitation. Return to sport decision-making may be improved with a screening tool to assess an athlete’s ability to control interpersonal dynamics in a continuously evolving task, and
to determine whether psychological factors influence interpersonal dynamics.13,27
Therefore, this investigation focused on whether factors such as injury history and psychological readiness associate with interpersonal dynamics. To do so, interpersonal interactions were examined during a novel agility-based task during which participant dyads coordinated their movements along intersecting paths. The task included perturbations designed to temporarily disrupt coordination. To quantify the predictability (i.e., “strength”) and duration (i.e., “stability”) of interpersonal coordination during a collision avoidance task, this study used cross-recurrence quantification analysis (CRQA), an analytic approach used to describe distinct dynamics between two interacting people.27 The authors hypothesized that participants would naturally assume de facto leader-follower roles within dyads and would develop and retain a highly coordinated movement pattern. Additionally, it was hypothesized that external perturbations would disrupt the strength and stability of their coordinated movement, and that individuals with a history of injury would be less likely to recover coordinated movement than controls. To explore the degree to which a player’s psychological outlook may have influenced movement pattern coordination within the task, differences in psychological measures between dyad members were characterized. The authors hypothesized that individuals with histories of injury and lower psychological readiness would predict the de facto follower within each dyad.
This study used a cross-sectional design with each dyad completing twenty trials within a single visit. Independent variables were leader-follower status (with/without injury history) and task stage (early, perturbation, and late).
High-school and collegiate female soccer players in the geographical area (metropolitan area with population >250k) were recruited via flyers, communication with coaching and athletic trainers, and word-of-mouth recruitment. To be eligible, participants had to be actively playing on a high school or collegiate soccer team and between the ages of 15 and 25. Participants were excluded if they self-reported a current injury that limited participation in soccer or an inability to run 30 minutes with multiple changes in direction. All adult participants provided written and verbal informed consent, while legal guardians gave written and verbal informed consent on behalf of minor participants.
Additionally, minors provided written and verbal assent to participate before completing any study procedures. Our University Institutional Review Board approved this study
As predictor variables, a range of psychological and physical measures were measured. Self-reported knee function was assessed using the International Knee Documentation Committee (IKDC) Subjective Knee Evaluation, developed by Irrgang et al.29,30 This scale has demonstrated high reliability and validity in measuring knee function in athletic populations.29,30 Fear of movement was measured using the Tampa Scale of Kinesiophobia (TSK-11), created by Woby et al.31 The TSK-11 has been validated for its reliability in capturing fear-related constructs in musculoskeletal disorders.31,32 Psychological readiness for sport was assessed using the Anterior Cruciate Ligament Return to Sport after Injury (ACL-RSI) scale, authored by Webster et al.33 This scale has been widely used to measure athletes’ emotion, confidence, and risk appraisal when returning to sports and has shown strong psychometric properties, including a Cronbach’s alpha of 0.92.34,35 Risk-taking propensity was assessed using the General Risk Propensity Scale (GRiPS), which is considered reliable for measuring risk-taking behaviors in athletic contexts.36 Physical activity level was also recorded using the Tegner Activity Score (TAS), developed by Briggs, et al.,37,38 and perceived task workload was recorded using the NASA Task Load Index (NASA-TLX) by Hart & Staveland.39 Both TAS and NASATLX have been validated for their reliability and responsiveness in athletic and high-workload settings, respectively.37‑39
DEPENDENT VARIABLES AND MEASURES
Cross recurrence quantification analysis (CRQA) is particularly useful for uncovering distinct dynamics between two interacting people40 and analyzing data from a complex dynamic systems perspective. For instance, CRQA has been used in prior work to examine interpersonal motor coordination in the context of dyadic problem-solving,41 suprapostural task demands,42 developmental disability,43 and dance.44 The methodological details and mathematical description of CRQA have been documented extensively elsewhere.40,45,46 In brief, CRQA quantifies the shared locations (i.e., cross-recurrence) of two time-series in a reconstructed phase space. These shared locations (in time and space) are illustrated as dark points on cross-recurrence plots (CRPs; as shown in Figure 1d). The resultant structure and patterns in CRPs (e.g., the number and length of diagonal lines in the plot) can then be quantified to describe how the two time-series unfold together over time and reveal information about the coordination of the systems under study. Furthermore, an extension of CRQA, diagonal-wise cross-recurrence (DWCR),40 permits the quantification and analysis of leader-follower dynamics within an interacting dyad (i.e., whether one member of the dyad is leading the coordinated behavior).
Strength of Coordination. In this study, CRQA was used to determine coordination strength as defined by determinism (DET) and mean line length (MEANLINE). DET was the percentage of recurrent points that formed diagonal lines in the CRP Higher DET indicated more deterministic coordination between members of a dyad with stronger and more frequent coupling (as opposed to random). High DET suggested that the system transitioned less frequently between different states and tended to remain within recurrent patterns for longer durations, indicating the participant’s locations unfolded similarly over time without falling out of synchronization. MEANLINE indexed how long the average cross-recurring trajectory was,47 with higher MEANLINE indicating that dyads achieved more continuous, or longer duration, coordination on average.
Stability of Coordination. Where DET and MEANLINE characterized diagonal line structures and represented the strength of coordination between dyads over time, laminarity (LAM) and trapping time (TT) characterized vertical line structures and represented temporal persistence or stability of each participant’s location while the other participant’s location varied over time. LAM was the percentage of recurrent points that formed vertical line structures in the CRP Higher LAM indicated a greater redundancy in the system, indicating persistence or stability in the observed recurrent patterns without changing coordination strategy TT was the average length of time that the dyad remained trapped within laminar points. Higher TT indicated a longer period where one member of the dyad was “trapped” with respect to the other’s location over time (i.e., temporal persistence).
Screening Procedures and Dyad Assignment. An initial screening survey was used to gather self-reported demographic information about participants, including their years of soccer experience, physical activity level, and pertinent self-reported injury history Injury history was operationally defined as history of lower extremity surgery (lifetime) or lower extremity injury resulting in >two weeks of lost time from participation in soccer within the prior six months.
Individuals with a history of injury and those without were deliberately paired into dyads. From the participant pool, dyads were randomly assigned using anonymized scheduling with 1:1 assignment. Participants from each group self-scheduled their visits to a scheduling block using an online scheduling software (Calendly, Remote, www.calendly.com). Participants were blinded to factors determining group allocation (i.e., injury history, years of soccer experience).
Participant Setup. When participants arrived at their study visit, they were outfitted with retroreflective markers, which were adhered to boney landmarks on the pelvis and thorax. Participants were randomly assigned to one of two marker sets including the following landmarks (set 1: bilateral ASIS, bilateral PSIS, C7 spinous process, and right twelfth rib; set 2: bilateral ASIS, bilateral iliac crest, and median sacral crest). Two marker sets were used to differ-
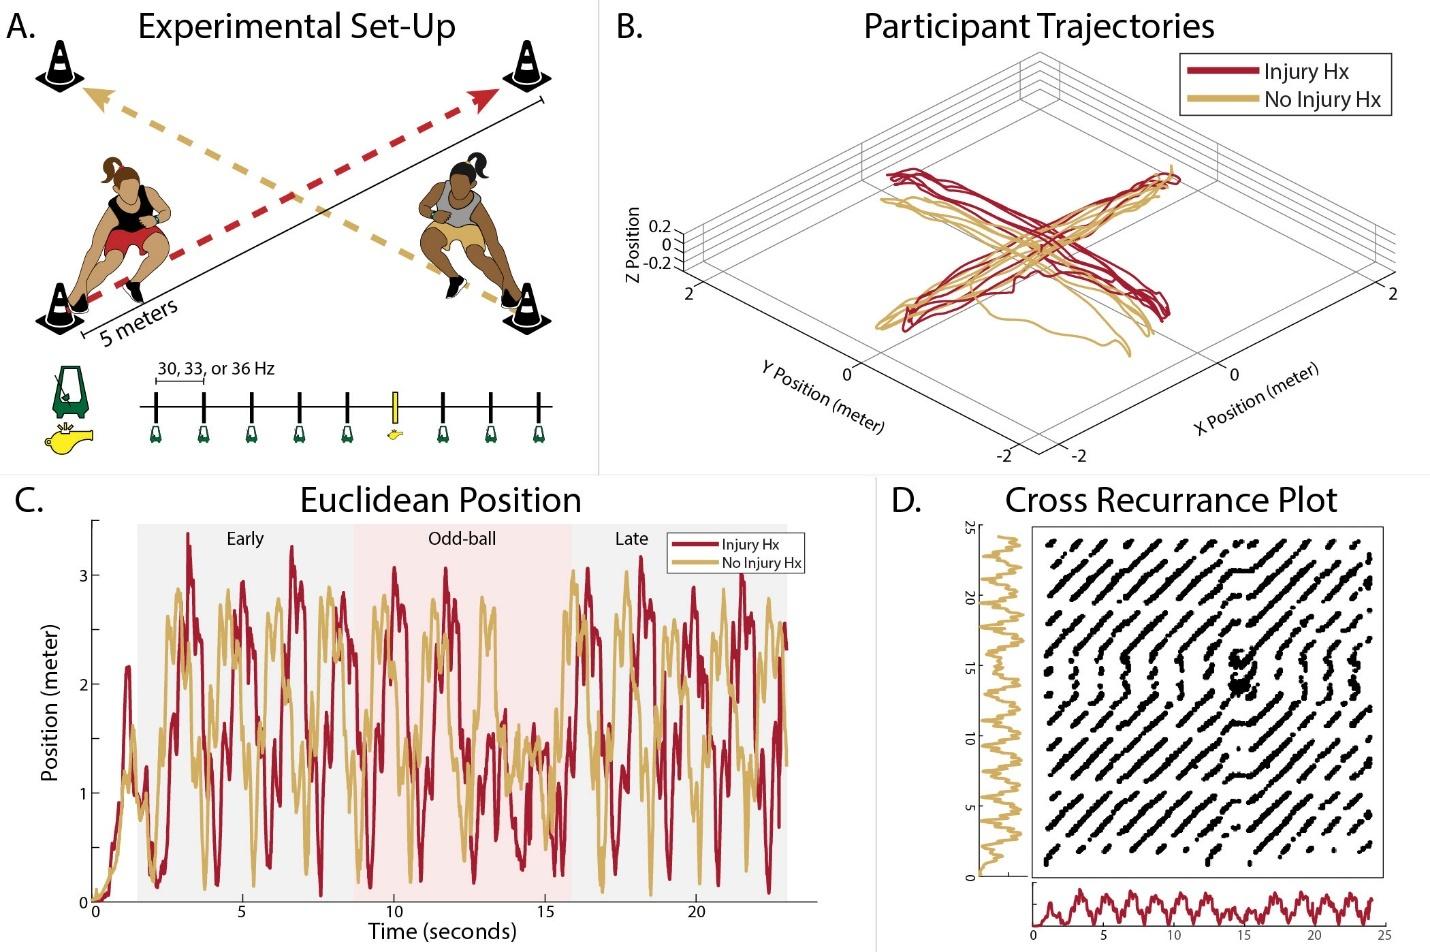
Figure 1. A. Schematic of collision-avoidance task. Upon oddball tone (whistle) within the audio, participants would make a 90 degree turn at the center and continue the task (e.g., red would follow gold path and vice versa).
B. Raw Cartesian position of the dyad movement. C. Euclidean displacement of participant position. D. The time series subjected to CRQA analysis, producing the cross-recurrence plot.
Abbreviations: Hx, History
entiate participants in data processing. Prior to testing participants completed a static calibration trial while standing in the anatomical position.
Data Acquisition and Procedures. A twelve-camera motion capture system (Raptor E-Digital Cameras, Motion Analysis Corporation, Santa Rosa, CA) captured participant location and maker trajectories with a sampling frequency of 120 Hz throughout each agility task trial. Data were acquired using Cortex software (v 7.10, Motion Analysis Corporation, Santa Rosa, CA). Participant markers were visible throughout the agility task course, which was centered within a 25 ft2 capture area.
Four pylons were organized in a square with 3.5-meter sides (5-meter hypotenuse) (Figure 1a). The task involved running diagonally across the square area, following paths that intersected perpendicularly, necessitating that participants avoid colliding with each other. Each trial lasted for 24 seconds and included a three-second countdown at the beginning.). The trials were paced using custom audio tracks featuring a metronome set to play at one of three frequencies: 30, 33, or 36 beats per minute (Hz). Each track contained an oddball tone—a whistle sound—randomly inserted in place of a metronome beat. Upon hearing this whistle, participants were instructed to execute a sharp 90-degree turn before continuing along their intersecting paths. Tracks and direction of the turn were selected at random (using a custom MATLAB script [v R2019b, MathWorks, Natick, MA]) for each trial to prevent participants from anticipating the pace.
Prior to beginning the experiment, each participant was asked to complete one practice trial by running between the pylons to a sample audio track. They did so independently, without the other participant on the course. To ensure uniformity in the participants’ experience, participants were provided standardized instructions using a script that emphasized the importance of timing their movements to reach each pylon synchronously with the metronome beats. A total of twenty trials were conducted for each pair of participants (dyad), incorporating two-minute rest breaks between trials and a longer 5-minute break after completing half of the trials. This structure was intended to mitigate fatigue and maintain the quality of the data collected.
Following data collection, Cortex software (v 7.10, Motion Analysis Corporation, Santa Rosa, CA) was used to fill marker gaps, identify unnamed markers, and prune ghost markers. Center of mass trajectories were calculated for each participant and trial using Visual 3D software (C-Motion, Germantown, MD) using bilateral PSIS and bilateral ASIS markers for each participant and exported in cartesian coordinate planes (Figure 1b). The three-dimensional cartesian coordinate paths were then collapsed into two dimensions as Euclidean displacement using a custom MATLAB (v R2019b, MathWorks, Natick, MA) script (Figure 1c).
CROSS-RECURRENCE QUANTIFICATION ANALYSIS AND DIAGONAL WISE CROSS-RECURRENCE ANALYSIS
Resultant center of mass trajectories of the two members of the interacting dyad from each trial were then subjected to CRQA (Figure 1d) to index coordination strength (DET and MEANLINE) and stability (LAM and TT) as described above. It is important to note that recurrence metrics are not absolute quantities. Thus, the relative pattern of change is considered most important for achieving the aims of this study.
To determine leader follower dynamics, DWCR considers a narrower band of the entire CRP, resulting in a window around the main diagonal line of the plot where x = y (i.e., line of incidence).42 In the current study, this window was restricted to ± 1.5 seconds around the line of incidence for each trial. Recurrence points that fell on the line of incidence represented moments where the two time-series exhibited 0-lag synchronization over consecutive samples. Recurrence points that fell on diagonal lines above or below the line of incidence indicated situations where one timeseries was revisiting a state previously occupied by the other at a given time delay (i.e., >0 lag in either direction). In other words, members of the dyad were coordinated with a lag (i.e., one was leading the other). MAXLAG is a metric of DWCR that indexed the lag at which cross-recurrence was highest within the set window around the line of incidence. Accordingly, a MAXLAG of 0 indicated that the most frequent dyad interaction was perfect synchrony (i.e., occupying the same space at the same time). A positive or negative MAXLAG indicated that the maximum number of recurrent points in a single diagonal fell above or below the line of incidence and that similarities in dyad movement occurred most frequently with a lag (i.e., one participant was leading/following the other).
To achieve the aims of the study, both CRQA and DWCR were performed on windows of the data surrounding the odd-ball tone. As such, each trial was divided into three, non-overlapping seven-second temporal windows (e.g., early, odd-ball, late), to examine the effect of the perturbation on the stability of the leader-follower relationship. Trials with an odd-ball tone occurring outside of the middle seven-second temporal window (i.e., odd-ball stage) were excluded so as not to corrupt the early and late temporal windows (50 of 170 trials). CRQA and DWR were completed using custom R scripts in RStudio (v 1.4.1106, RStudio, Inc., Boston, MA). CRQA parameters were determined for each trial using the routine of Coco and Dale.40 Radius was adjusted per trial to achieve a fixed recurrence rate between with a lower bound of 2.25% and upper bound of 2.5%, following prior recommendations.47 Embedding dimension ranged from 4 - 10 (5.17 ± 1.04), delay ranged from 3 – 51 (24.85 ± 5.75), and radius ranged from 0.24 – 0.74 (0.39 ± 0.08). Prior to phase space reconstruction and CRQA calculations, signals were centered about their respective means. MAXLAG values for each stage of each trial were extracted from DWCR and used to assign participants within each dyad the leader or follower designation. Because leader-follower status is an emergent property of dyad interaction, leader-follower status was used to reallocate groups for sta-
tistical analysis. In other words, each trial was characterized in the context of whether the participant with a history of injury or the control became the de facto follower Furthermore, within each dyad, the majority leader was determined using counts of leader-follower status (whomever led for most of the 20-trials).
To ensure adequate data for CRQA, a minimum of 120 trials were included based on recommendations from previous authors.42,43 Differences in demographic and self-reported function were assessed using independent t-tests, while coordination strength and stability were evaluated with a linear mixed effect model. In this model, leader-follower status, stage, and their interaction were fixed effects and each dyads’ trial were random effects. Tukey’s Honestly Significant Difference Test confirmed differences between groups and stages. Cohen’s d effect sizes were calculated to demonstrate magnitude of differences, interpreted as small (≥0.2), medium (≥0.5), or large (≥0.8) effects. Lastly, participant descriptors were used to determine leader-follower status using logistic regression, including participant descriptors that were statistically different within dyads as predictor variables. A priori this could have included age, height, weight, years playing experience, IKDC, ACL-RSI, TSK-11, and GRiPS. All data met assumptions of normality of residuals. No violations of sphericity (Mauchly test) were observed. Due to the experiment’s novel statistical analysis, a traditional power analysis was not possible for the primary analyses. Observed power from these analyses is provided in Supplement 1. Secondary analyses using logistic regression were underpowered and should be considered exploratory Statistical Analysis Software (SAS) v 9.4 (SAS Institute, Cary, NC) was used for all statistical analyses, with a significance level of p<0.05.
A total of eighteen women’s collegiate soccer athletes between the (age = 19.7 ± 1.6 years) were recruited for and enrolled in this study. Participant demographics and self-reported function are presented in Table 1 Participants with a history of lower extremity injury reported lower ACL-RSI scores compared to their uninjured control counterparts (d = -1.15 [0.16, 2.15]). Participants with lower extremity injury were heterogenous regarding injuries. Reported histories included primary unilateral ACL reconstruction (n = 2), bilateral ACL reconstruction (n = 2), unilateral meniscectomy (n = 1), hamstring strain (n = 1), ankle syndesmosis sprain (n = 1), Lisfranc fracture (n = 1), and avascular necrosis of sesamoid bones of great toe (n = 1). One dyad completed only ten trials due to the participant’s aggravation of low back pain that was not disclosed prior to beginning the task but was reported after the 10th trial. Available data from this dyad were retained because both participants had still met inclusion criteria and group allocation was not affected.
Table 1. Participant Demographics (mean ± SD)
Abbreviations: SD, standard deviation; IKDC, International Knee Documentation Committee;
Scale of Kinesiophobia; GRiPS, General Risk Propensity Scale; NASA-TLX, NASA Task Load Index.
Table 2. Simple Leader-Follower Frequency Analysis
LEADER-FOLLOWER STATUS
Using MAXLAG to dichotomize the leader-follower of each trial indicated that the roles were unstable within participant dyads (i.e., the individual leading often flipped from trial to trial). However, the participant with a history of injury was the follower in 60.8% of trials (in individual dyads, the incidence of this occurrence ranged from 40–70% ) (Table 2). The control participant was the majority leader in 7 of the 9 dyads.
COORDINATION STRENGTH AND STABILITY
Results of the linear mixed effect model demonstrated a significant interaction effect between group (leader/follower) and task stage (R2 = 0.65, p < 0.001) for DET (Figure 2a). When individuals with a history of injury were the follower, post hoc testing revealed lower DET during the perturbation (i.e., odd-ball stage, d = 0.52 [0.19, 0.85]) and late stage (d = 0.34 [0.01, 0.67]) compared to the early stage. In contrast, when control participants were the follower, post hoc testing revealed lower DET only during the perturbation compared to both early (d = 0.46 [0.05, 0.87]) and late stages (d = 0.55 [0.14, 0.97]). Furthermore, DET in the late stage was lower when individuals with a history of injury were the follower compared to controls (d = 0.39 [0.02, 0.76]).
Results of MEANLINE analysis demonstrated a significant interaction effect between group and task stage (R2
= 0.67, p < 0.001) with post hoc testing revealing shorter MEANLINE during the perturbation compared to early stage (d = 0.40 [0.08, 0.73]) when individuals with history of injury were the follower, and late stage (d = 0.46 [0.05, 0.86]) when control participants were the follower (Figure 2b). Furthermore, MEANLINE in the late stage was shorter when individuals with a history of injury were the follower compared to controls (d = 0.37 [0.00, 0.74]).
Results of the LAM and TT analyses both demonstrated significant stage effects (LAM: R2 = 0.71, p < 0.001; TT: R2 = 0.87, p < 0.001). Post hoc testing revealed lower LAM and shorter TT occurring within the perturbation compared to the early stage (LAM: d = 0.38 [0.12, 0.63]; TT: d = 0.24 [-0.01, 0.50]) and late stage (LAM: d = 0.22 [-0.03, 0.47]; TT: d = -0.16 [-0.03, 0.36]) regardless of group (Figure 2c-d).
The ACL-RSI score was the only metric of self-reported function that differed between groups. Binary logistic regression with predictor variable ACL-RSI was not predictive of leader-follower status (B = 0.039, p = 0.224, Exp(B) = 1.039). Figure 3 presents visualization of these data for all dyad pairs. For descriptive purposes, demographic and selfreported metrics are presented by majority leader-follower roles for logistic regression (Table 3).
In this study, the strength and stability of interpersonal coordination in a collision-avoidance task were examined among female soccer athletes. By assessing leader-follower status and contrasting coordination strength and stability with the dyads, there are three key findings. First, all participants experienced disruption in their coordinated actions due to the external perturbations, indicating the in-
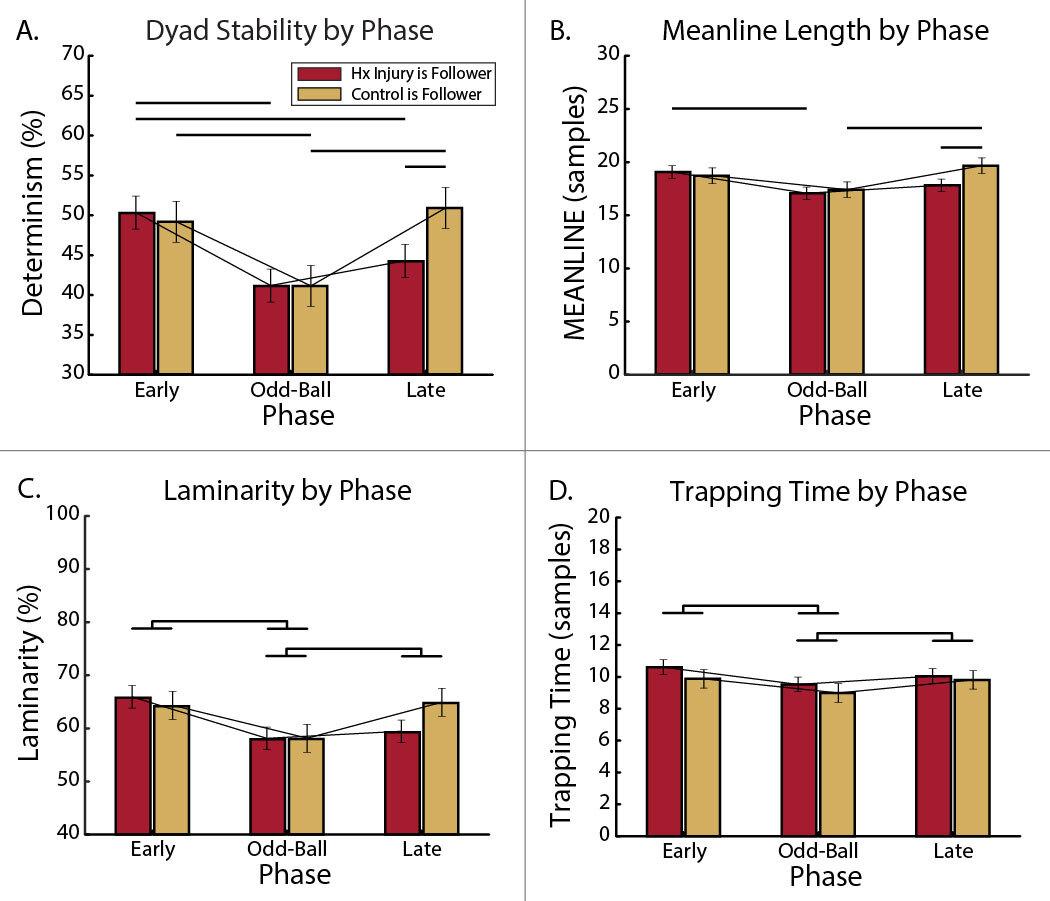
Figure 2. Windowed analysis by leader-follower status through each stage of the collision-avoidance task for outcomes of (A) DET, (B) MEANLINE, (C) LAM, and (D) TT Error bars depict standard error of measurement. Connecting bars indicate relative change for each group (History of Injury, Control) through each stage. Statistically significant differences are present for group*stage interaction comparisons with horizontal lines. Statistically significant differences are present for stage main effects with brackets.
Abbreviations: Hx, History
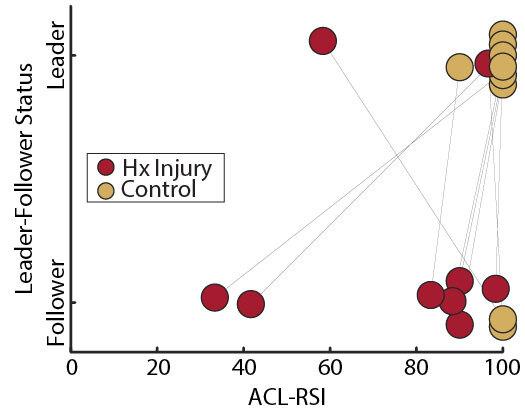
Figure 3. Majority leader-follower status by ACL-RSI score. Group allocation indicated by circle color. Black lines connect the participants within each dyad.
fluence of external factors on dyadic coordination in sport. Second, despite the initial disruption, all participants were able to regain stable coordinated actions, demonstrating dyadic adaptation to the temporary disruption and a return to the task. However, third, those participants with a history of injury faced challenges in restoring the strength of this coordination after the perturbation, whereas control
participants did not, indicating a weaker coupling when the previously injured participants attempted to follow the control participant’s actions. These findings provide evidence for the value of measuring interpersonal dynamics in soccer and offer insights into how injury history can affect both the strength and stability of interpersonal coordination during sport.
A large body of literature in sport sciences supports the idea that controlling interpersonal dynamics in sport is critical to team success.7‑12 Despite this, few investigators have employed CRQA to study interpersonal coordination and leader-follower dynamics in sport. To our knowledge, the available literature demonstrates that dyads of people typically converge upon highly stable coordinated behavior when given a shared motor task.44,48 Furthermore, a more dominant individual almost always emerges to lead dyadic coordination.8,15 Commonalities between these works and the current paradigm include stable interpersonal coordination despite task complexity, limited practice, and de facto leader-follower dynamics. With recent evidence suggesting that injuries occur more often in players who assume defensive roles16,18 that require them to adapt movements to external perturbations (e.g., evasive action by opponent),8,12,15 the authors sought to determine whether unexpected events (perturbations) would influence interpersonal coordination strength and stability
The odd-ball tone in the middle stage of each trial disrupted task strength and stability regardless of leader-follower status; however, stability (DET) and strength (MEAN-
LINE) did not recover when participants with a history of injury were in the follower role. The lesser ability of individuals with history of injury to recover strong coupling to a leader’s actions suggests that unexpected stimuli may disrupt interpersonal movement execution differently in previously injured individuals than in individuals without a history of injury Within the limitations of these data (see below) and in the context of moderate and small effect sizes, the current results suggest that players with history of injury are apt to show less adaptable behavior or longer intervals to recover after injury. Given the unpredictable nature of sport and an understanding that history of injury significantly increases risk for future injury,2,4 this finding is particularly interesting and worthy of further investigation, especially in the context of increasing neurocognitive demands and task complexity Historically, many returnto-sport protocols do not replicate unanticipated stimuli or neurocognitive demands that athletes face upon returning to their sport, further indicating a need to consider these factors.25,49
The current efforts to determine which factors predicted leader-follower status were less informative. Although individuals with injury history more frequently assumed the follower role and reported lower confidence in returning to sport, their self-reported functioning was not found to associate with leader-follower roles. Injuries do not follow a traditional cause and effect model, but rather are multifactorial, influenced by interactions between people within the constraints of a particular physical and social environment.50 Biopsychosocial constructs of confidence, kneefunction, and risk-propensity are among many of the factors that were previously found to contribute to motor behavior and success in sport.24,51,52 Lower confidence, fear of pain-related movement, and low self-efficacy are associated with failure to return to sport21,24 and heightened risk of secondary injury in athletes,23 although the mechanisms of the latter are unclear Psychological readiness for sport, as measured by self-report instruments, differed between groups within this sample, but the hypothesis that leaderfollower behavior would be predicted by biopsychosocial constructs was not supported. While beneficial, the use of patient reported outcome measures following injury are not all encompassing and the association of biopsychoso-
cial factors with leader-follower status may be small due to the complex nature of sport and the many interacting constraints.
The current study has limitations. The concept of this study was novel, making it difficult to assess the most descriptive measures of interpersonal coordination representative of sport. The task was meant to mimic on-field dynamics, but its cyclically repetitive nature may have still been a reductive representation of soccer play Motion capture technology also necessitated that the study take place in a laboratory, threating ecological validity compared to on-field assessment. The repetitive perturbation, an odd-ball tone, was more predictable than are real sport conditions. While participants were randomly assigned to dyads, some participants had a prior relationship with their dyad partner, due to team or club dynamics. The influences of these social and psychological behavioral determinants may have contaminated this attempt to measure history of injury as the basis for leader-follower roles. These results with all female athletes may not be generalizable to male athletes. Enrollment was limited to females because they continue to suffer higher rates of soccer related injury than their male counterparts, making it particularly important l to identify biological and social factors responsible for those injuries.50 Lastly, the attempt to measure differences in psychological readiness between players with and without history of injury may have been limited by the fact that participants with a history of lower extremity injury who return to sport have fewer psychological barriers than individuals who fail to return to play 51,52 Finally, our ability to fully address the complexity of biopsychosocial factors amidst the many interacting constraints of sport were limited by our small sample size. Particularly, when there were no significant group differences on variables of interest, questions arise as to whether the current sample size was associated with insufficient statistical power There is a clear need to replicate and extend this research by incorporating a complex system approach with larger samples of dyadic interpersonal relationships.
Abbreviations: SD, standard deviation; IKDC,
Cruciate Ligament – Return to Sport after Injury; TSK-11, Tampa Scale of Kinesiophobia; GRiPS, General Risk Propensity Scale
In this study, dyads of female soccer players successfully coordinated behavior during a collision-avoidance agility task. However, the strength and stability of their interpersonal coordination was disrupted by external perturbation, and individuals within these pairs with history of injury were less able to adapt when in the follower role than their counterparts without history of injury. Although additional work in this field is needed, diminished ability to recover coordinated behavior following an unanticipated stimulus
may contribute to higher re-injury risk in athletes with previous lower extremity injury.
The authors report no competing interests.
Submitted: November 23, 2023 CDT, Accepted: February 29, 2024 CDT
© The Author(s)
This is an open-access article distributed under the terms of the Creative Commons Attribution 4.0 International License (CCBY-NC-4.0). View this license’s legal deed at https://creativecommons.org/licenses/by-nc/4.0 and legal code at https://creativecommons.org/licenses/by-nc/4.0/legalcode for more information.
1. Terrell E. Library of congress research guide: soccer Soccer Accessed June 9, 2023. https://guides.loc.gov/sports-industry/soccer
2. Owoeye OBA, VanderWey MJ, Pike I. Reducing injuries in soccer (football): an umbrella review of best evidence across the epidemiological framework for prevention. Sports Med - Open 2020;6(1):46. doi:10.1186/s40798-020-00274-7
3. Junge A, Dvorak J. Soccer injuries: a review on incidence and prevention. Sports Med 2004;34(13):929-938. doi:10.2165/ 00007256-200434130-00004
4. McCall A, Carling C, Davison M, et al. Injury risk factors, screening tests and preventative strategies: a systematic review of the evidence that underpins the perceptions and practices of 44 football (soccer) teams from various premier leagues. Br J Sports Med 2015;49(9):583-589. doi:10.1136/ bjsports-2014-094104
5. Clark BC, Grooms DR, Etheridge T, et al. Editorial: integrative physiology of common chronic musculoskeletal disorders. Front Physiol 2022;13:971103. doi:10.3389/fphys.2022.971103
6. Mueller-Wohlfahrt HW, Haensel L, Mithoefer K, et al. Terminology and classification of muscle injuries in sport: the Munich consensus statement. Br J Sports Med. 2013;47(6):342-350. doi:10.1136/ bjsports-2012-091448
7 Aguiar M, Gonçalves B, Botelho G, Lemmink K, Sampaio J. Footballers’ movement behaviour during 2-, 3-, 4- and 5-a-side small-sided games. J Sports Sci. 2015;33(12):1259-1266. doi:10.1080/ 02640414.2015.1022571
8. Duarte R, Araújo D, Davids K, Travassos B, Gazimba V, Sampaio J. Interpersonal coordination tendencies shape 1-vs-1 sub-phase performance outcomes in youth soccer. J Sports Sci. 2012;30(9):871-877 doi:10.1080/ 02640414.2012.675081
9. Esteves PT, Araújo D, Davids K, Vilar L, Travassos B, Esteves C. Interpersonal dynamics and relative positioning to scoring target of performers in 1 vs. 1 sub-phases of team sports. J Sports Sci. 2012;30(12):1285-1293. doi:10.1080/ 02640414.2012.707327
10. Frencken W, Poel H de, Visscher C, Lemmink K. Variability of inter-team distances associated with match events in elite-standard soccer. J Sports Sci. 2012;30(12):1207-1213. doi:10.1080/ 02640414.2012.703783
11. Gonçalves BV, Figueira BE, Maçãs V, Sampaio J. Effect of player position on movement behaviour, physical and physiological performances during an 11-a-side football game. J Sports Sci. 2013;32(2):191-199. doi:10.1080/ 02640414.2013.816761
12. Vilar L, Araújo D, Davids K, Travassos B. Constraints on competitive performance of attacker–defender dyads in team sports. J Sports Sci 2012;30(5):459-469. doi:10.1080/ 02640414.2011.627942
13. Bittencourt NFN, Meeuwisse WH, Mendonça LD, Nettel-Aguirre A, Ocarino JM, Fonseca ST. Complex systems approach for sports injuries: moving from risk factor identification to injury pattern recognition—narrative review and new concept. Br J Sports Med 2016;50(21):1309-1314. doi:10.1136/ bjsports-2015-095850
14. Correia V, Araújo D, Vilar L, Davids K. From recording discrete actions to studying continuous goal-directed behaviours in team sports. J Sports Sci 2013;31(5):546-553. doi:10.1080/ 02640414.2012.738926
15. Meerhoff LA, De Poel HJ. Asymmetric interpersonal coupling in a cyclic sports-related movement task. Hum Mov Sci 2014;35:66-79. doi:10.1016/j.humov.2014.04.003
16. Della Villa F, Buckthorpe M, Grassi A, et al. Systematic video analysis of ACL injuries in professional male football (soccer): injury mechanisms, situational patterns and biomechanics study on 134 consecutive cases. Br J Sports Med 2020;54(23):1423-1432. doi:10.1136/ bjsports-2019-101247
17. Gupta AS, Pierpoint LA, Comstock RD, Saper MG. Sex-based differences in anterior cruciate ligament injuries among united states high school soccer players: an epidemiological study Orthop J Sports Med 2020;8(5):2325967120919178. doi:10.1177/ 2325967120919178
18. Lucarno S, Zago M, Buckthorpe M, et al. Systematic video analysis of anterior cruciate ligament injuries in professional female soccer players. Am J Sports Med. 2021;49(7):1794-1802. doi:10.1177/03635465211008169
19. Ardern CL, Taylor NF, Feller JA, Webster KE. Fear of re-injury in people who have returned to sport following anterior cruciate ligament reconstruction surgery Journal of Science and Medicine in Sport 2012;15(6):488-495. doi:10.1016/j.jsams.2012.03.015
20. Ardern CL, Taylor NF, Feller JA, Webster KE. A systematic review of the psychological factors associated with returning to sport following injury Br J Sports Med. 2012;47(17):1120-1126. doi:10.1136/ bjsports-2012-091203
21. Burland JP, Toonstra J, Werner JL, Mattacola CG, Howell DM, Howard JS. Decision to return to sport after anterior cruciate ligament reconstruction, part i: a qualitative investigation of psychosocial factors. J Athl Train. 2018;53(5):452-463. doi:10.4085/ 1062-6050-313-16
22. Lisee CM, DiSanti JS, Chan M, et al. Gender differences in psychological responses to recovery after anterior cruciate ligament reconstruction before return to sport. J Athl Train 2020;55(10):1098-1105. doi:10.4085/1062-6050-558.19
23. McPherson AL, Feller JA, Hewett TE, Webster KE. Psychological readiness to return to sport is associated with second anterior cruciate ligament injuries. Am J Sports Med 2019;47(4):857-862. doi:10.1177/0363546518825258
24. Truong LK, Mosewich AD, Holt CJ, Le CY, Miciak M, Whittaker JL. Psychological, social and contextual factors across recovery stages following a sportrelated knee injury: a scoping review. Br J Sports Med. 2020;54(19):1149-1156. doi:10.1136/ bjsports-2019-101206
25. Taberner M, Allen T, Cohen DD. Progressing rehabilitation after injury: consider the ‘controlchaos continuum.’ Br J Sports Med 2019;53(18):1132-1136. doi:10.1136/ bjsports-2018-100157
26. Gokeler A, McKeon PO, Hoch MC. Shaping the functional task environment in sports injury rehabilitation: a framework to integrate perceptualcognitive training in rehabilitation. thletic Training & Sports Health Care. 2020;12(6):283-292. doi:10.3928/ 19425864-20201016-01
27 Forelli F, Le Coroller N, Gaspar M, et al. Ecological and specific evidence-based safe return to play after anterior cruciate ligament reconstruction in soccer players: a new international paradigm. Int J Sports Phys Ther 2023;18(2):526-540. doi:10.26603/ 001c.73031
28. Buckthorpe M. Optimising the late-stage rehabilitation and return-to-sport training and testing process after ACL reconstruction. Sports Med 2019;49(7):1043-1058. doi:10.1007/ s40279-019-01102-z
29. Irrgang JJ, Anderson AF, Boland AL, et al. Development and validation of the international knee documentation committee subjective knee form. Am J Sports Med 2001;29(5):600-613. doi:10.1177/ 03635465010290051301
30. Irrgang JJ, Anderson AF, Boland AL, et al. Responsiveness of the international knee documentation committee subjective knee form. Am J Sports Med. 2006;34(10):1567-1573. doi:10.1177/ 0363546506288855
31. Woby SR, Roach NK, Urmston M, Watson PJ. Psychometric properties of the TSK-11: A shortened version of the Tampa scale for kinesiophobia. Pain 2005;117(1):137-144. doi:10.1016/j.pain.2005.05.029
32. Dupuis F, Cherif A, Batcho C, Massé-Alarie H, Roy JS. The Tampa scale of kinesiophobia: a systematic review of its psychometric properties in people with musculoskeletal pain. The Clin J Pain. 2023;39(5):236-247 doi:10.1097/ ajp.0000000000001104
33. Webster KE, Feller JA, Lambros C. Development and preliminary validation of a scale to measure the psychological impact of returning to sport following anterior cruciate ligament reconstruction surgery. Phys Ther Sport 2008;9(1):9-15. doi:10.1016/ j.ptsp.2007.09.003
34. Gagnier JJ, Shen Y, Huang H. Psychometric Properties of patient-reported outcome measures for use in patients with anterior cruciate ligament injuries: a systematic review. JBJS Rev. 2018;6(4):e5. doi:10.2106/jbjs.rvw.17.00114
35. Webster KE, Feller JA. Development and validation of a short version of the anterior cruciate ligament return to sport after injury (ACL-RSI) scale. Orthop J Sports Med 2018;6(4):2325967118763763. doi:10.1177/2325967118763763
36. Zhang DC, Highhouse S, Nye CD Development and validation of the general risk propensity scale (GRiPS). J Beh Decis Making. 2018;32(2):152-167. doi:10.1002/bdm.2102
37 Briggs KK, Steadman JR, Hay CJ, Hines SL. Lysholm score and Tegner activity level in individuals with normal knees. Am J Sports Med 2009;37(5):898-901. doi:10.1177/0363546508330149
38. Briggs KK, Lysholm J, Tegner Y, Rodkey WG, Kocher MS, Steadman JR. The reliability, validity, and responsiveness of the Lysholm score and Tegner activity scale for anterior cruciate ligament injuries of the knee: 25 years later Am J Sports Med 2009;37(5):890-897. doi:10.1177/0363546508330143
39. Hart SG, Staveland LE. Development of NASATLX (task load index): results of empirical and theoretical research. In: Hancock PA, Meshkati N, eds. Human Mental Workload. Vol 52. Adv Psychol. North-Holland; 1988:139-183. doi:10.1016/ s0166-4115(08)62386-9
40. Coco MI, Dale R. Cross-recurrence quantification analysis of categorical and continuous time series: an R package. Front Psychol 2014;5:510. doi:10.3389/ fpsyg.2014.00510
41. Abney DH, Paxton A, Dale R, Kello CT Movement dynamics reflect a functional role for weak coupling and role structure in dyadic problem solving. Cogn Process 2015;16(4):325-332. doi:10.1007/ s10339-015-0648-2
42. Davis TJ, Pinto GB, Kiefer AW. The stance leads the dance: the emergence of role in a joint suprapostural task. Front Psychol 2017;8:718. doi:10.3389/ fpsyg.2017.00718
43. Schwab SM, Carver NS, Forman MH, et al. Childcaregiver interactions during a collaborative motor task in children with cerebral palsy: a descriptive exploratory study J Dev Phys Disabil 2021;34(2):255-277 doi:10.1007/s10882-021-09798-6
44. Washburn A, DeMarco M, de Vries S, et al. Dancers entrain more effectively than non-dancers to another actor’s movements. Front Hum Neurosci 2014;8:800. doi:10.3389/fnhum.2014.00800
45. Marwan N, Carmen Romano M, Thiel M, Kurths J. Recurrence plots for the analysis of complex systems. Physics Reports 2007;438(5-6):237-329. doi:10.1016/ j.physrep.2006.11.001
46. Webber C, Joseph P. Recurrence quantification analysis of nonlinear dynamical systems. Tutorials in contemporary nonlinear methods for the behavioral sciences [electronic resource] / edited by Michael A Riley & Guy C Van Orden Published online 2005:33-101.
47 Wallot S, Leonardi G. Analyzing multivariate dynamics using cross-recurrence quantification analysis (CRQA), diagonal-cross-recurrence profiles (DCRP), and multidimensional recurrence quantification analysis (MdRQA) - A Tutorial in R. Front Psychol 2018;9:2232. doi:10.3389/ fpsyg.2018.02232
48. Richardson MJ, Harrison SJ, Kallen RW, et al. Selforganized complementary joint action: Behavioral dynamics of an interpersonal collision-avoidance task. J Exp Psychol Hum Percept Perform. 2015;41(3):665-679. doi:10.1037/xhp0000041
49. Yung KK, Ardern CL, Serpiello FR, Robertson S. Characteristics of complex systems in sports injury rehabilitation: examples and implications for practice. Sports Med - Open 2022;8(1):24. doi:10.1186/s40798-021-00405-8
50. Parsons JL, Coen SE, Bekker S. Anterior cruciate ligament injury: towards a gendered environmental approach. Br J Sports Med. 2021;55(17):984-990. doi:10.1136/bjsports-2020-103173
51. Nwachukwu BU, Adjei J, Rauck RC, et al. How much do psychological factors affect lack of return to play after anterior cruciate ligament reconstruction? a systematic review Orthop J Sports Med 2019;7(5):2325967119845313. doi:10.1177/ 2325967119845313
52. Webster KE, Nagelli CV, Hewett TE, Feller JA. Factors associated with psychological readiness to return to sport after anterior cruciate ligament reconstruction surgery Am J Sports Med 2018;46(7):1545-1550. doi:10.1177/ 0363546518773757
Download: https://ijspt.scholasticahq.com/article/116156-interpersonal-coordination-between-female-soccerplayers-leader-follower-roles-within-a-collision-avoidance-task/attachment/ 222858.pdf?auth_token=WqzpWTpXUCZfJ0G3TH5F
Edward Jones1a , Jessica Jochum2 , Hannah Corn3 , Michaela O'Brien4 , Melissa Parks5 , Jamal Armoush6 , Amanda Annee2
1 Krannert School of Physical Therapy, University of Indianapolis, 2 Athletic Training, University of Indianapolis, 3 Physical Therapy, Team Rehabilitation Physical Therapy, 4 Physical Therapy, PT Solutions, 5 Physical Therapy, Indiana University Health, 6 Athletic Training, University of Southern Indiana
Keywords: functional performance testing, return-to-play, lower extremity injury, adolescent athlete https://doi.org/10.26603/001c.116272
International Journal of Sports Physical Therapy
Background
Functional performance tests (FPT) have been used with athletes following an injury to determine readiness to return-to-play (RTP), usually using limb symmetry indices to the contralateral limb or a baseline score. There is not a consensus as to which criterion scores are best compared.
This study aimed to compare common functional performance test scores from injured athletes at the time of release to RTP to both preseason baseline scores and to the contralateral limb. It was hypothesized that using baseline scores for comparison would be more responsive to residual deficits following injury than using the contralateral limb.
Study Design
Prospective longitudinal cohort study
Methods
High school athletes (n=395) from all varsity sports completed a battery of FPTs including the Y-Balance Test (YBT), single limb hop tests and T-Test for agility (TT) during their preseason to establish baseline data. Injured athletes (n=19) were re-tested using all FTP’s again at the time of RTP Paired t-tests were used to detect if significant (p<0.05) residual deficits were present at time of RTP when compared to baseline and to contralateral scores on FPTs.
Results
Differences in YBT scores were found in the anterior direction only (p=0.021) when comparing RTP to preseason, but there were no differences when compared to RTP data for the contralateral limb. Differences were detected with the single leg hop test (p = 0.001) when comparing the RTP to preseason and were also detected in both the single leg hop (p= 0.001) and triple hop (p=0.018) when compared to the contralateral limb. Differences in TT scores were detected when comparing RTP to preseason for cutting first with both the unaffected (p = 0.019) and affected (p = 0.014) limbs.
Corresponding Author:
Ed Jones, PT, DHSc, OCS University of Indianapolis Krannert School of Physical Therapy 1400 E. Hanna Ave. Indianapolis, IN 46227 Joneser@uindy.edu a
The YBT in the anterior direction and the TT are better able to detect residual deficits when comparing RTP to preseason scores. Hop tests are better able to detect deficits when compared to the contralateral limb. These results could make preseason testing more efficient when creating a reference for determining RTP readiness following lower extremity injury.
A significant number of high school students participating in various athletics in the United States. As of the 2021-2022 academic calendar year, an astounding 7,618,054 students were participating in at least one high school sport.1 With so many students participating in sports, it is inevitable a correspondingly high number of injuries in high school athletes are reported each year On average, two million injuries related to high school athletics are reported annually 2 This includes injuries of all magnitudes, circumstances, and body regions. Nagle, et al. reported that approximately 11.6 lower extremity injuries occurred in this population per 10,000 athlete exposures over nine years across nine different sports.3 In addition, roughly 10.5% of all injuries reported in the past 10 or more years were recurrent injuries.4 While factors for this high rate of reinjury are unknown, one explanation could be that many athletes are returning to sport participation before achieving complete recovery of function. These numbers began to call into question the current standards for baseline injury predictors and return-to-play (RTP) criteria for high school athletes.
Most research focusing on RTP has focused on athletes following an anterior cruciate ligament reconstruction (ACLR) and not on general lower extremity injuries. In a recent systematic review, Vereijken, et al. found only eight high-quality studies that examined performance on FPTs and RTP decisions following ACLR or posterior cruciate ligament reconstruction (PCLR), and no studies were found investigating their use with any other lower extremity injury This led to their conclusion that more prospective research is needed to determine if an association exists between standardized criteria like FPTs and return to performance following lower extremity injury.5 Peterson et al. surveyed surgeons performing ACLRs and found that most physicians will release an injured athlete to return to sport based on predetermined time frames for the specific injury rather than muscle function at the time of RTP; however, these time frames are not standardized among physicians.6 This could result in physicians releasing athletes before full recovery, thus increasing the potential for re-injury.
The 2016 consensus statement on return to sport from the First World Congress in Sports Physical Therapy identifies that the decision to RTP is complex and multifactorial in nature, which involves not only the assessment of healing factors and recovery of function following an injury but also contextual factors, including the sport demands, psychological readiness, and risk tolerance.7 The collaborative decision should involve all stakeholders and should be comprehensive in scope during the decision process. Historically, physical testing has received the most attention
in this decision, but biopsychosocial factors are equally important to consider 7 When considering physical testing, care should be taken to include a comprehensive evaluation of functional recovery to have the most complete information available in the decision process. Understanding the effect an injury has on an individual’s overall balance, power, agility, and function is essential to the athlete’s RTP 8 For this reason, clinicians and researchers have attempted to use FPTs to bring some objectivity to RTP decisions and to help quantify limb function and recovery following an injury
Acknowledging that the RTP decision involves more than the assessment of physical function, this study focuses on identifying the criteria to which these FPTs should be compared. Functional performance tests (FPT) have been used to determine the risks of injuries in athletes, as well as following an injury to detect if an athlete is prepared to return to their sport.9‑15 Several studies have successfully used some variation of functional performance testing for RTP criteria, but there is no set standard for which tests are the best to use.9‑15 The most common functional tests used were the Star Excursion Balance Test (SEBT), the Y-Balance Test (YBT), single-leg hop tests, and the drop jump test.9‑14 Of these functional tests, hop tests and the YBT have been used to examine the limb symmetry following ACLR.11,13 These studies also showed asymmetries in scores following injury compared to baseline scores. Finally, the TT has been proposed as part of RTP criteria following ankle injury as a functional measure of agility, which is an essential component in most sports.15 Despite strides made to objectify the RTP decision using FTPs there is still a lack of consistency in protocol and terminology.9,10
Most studies looking at RTP criteria have focused on youth athletes or collegiate-level athletes, leaving a gap in the literature for the large population of high school athletes. Overall, the evidence suggests that there is not currently an accepted battery of functional performance tests used to inform RTP decisions with high school athletes following injury, nor is there a gold standard for which comparison measurement (baseline vs contralateral limb) is best for this population. Therefore, this study aimed to compare common functional performance test scores from injured athletes at the time of release to RTP to both preseason baseline scores and to scores of the contralateral limb. It was hypothesized that using baseline scores for comparison would be more responsive to residual deficits following injury than using the contralateral limb.
METHODS
STUDY DESIGN
The design of this study was a prospective longitudinal cohort study.
PARTICIPANTS
A convenience sample of varsity athletes from a local high school were recruited via emails and flyers, informing them and their guardians of optional participation in the study. The participants of this study were 14-19 year-old male and female high school athletes competing in any varsity sport at a single area high school. Inclusion criteria were any varsity athlete participating in a school-sponsored sport who completed baseline functional performance testing prior to the beginning of the sporting season. Participants were excluded from the study if there was any reason they could not or should not perform the tests (injury or illness, etc.). History of injury did not exclude participation, nor was it controlled for in this study Informed consent and assent were obtained prior to participation in the study This study was approved by the Community Health Network Institutional Review Board.
Baseline testing was administered prior to the start of each participant’s athletic season in one large group testing session at the participants’ school. Research personnel completed a one-hour training session to standardize test administration. Each athlete completed the FPTs in random order. Functional performance tests included the YBT, the Single-Leg Hop, the Single-Leg Triple Hop (Triple Hop), the Single-Leg Triple Crossover Hop (Crossover Hop), and the TT. This group of tests was selected to provide a comprehensive functional assessment of the lower extremity kinetic chain, balance, strength, power, and agility. Demographic data was also collected during testing.
After baseline testing was completed, the athletic training staff completed injury surveillance at the high school. An injury was defined as missing five or more consecutive team activities due to an injury sustained during sports participation. Various definitions of injury have been proposed in the past, but missing five consecutive team activities was determined by the researchers to capture injuries that may require confirmation of functional recovery. Following any qualifying injury, the athletes were instructed to consult the athletic trainers at the school who re-administered all the functional performance tests again when the injured athlete had been cleared to RTP
Y-Balance Test - The YBT was administered by a certified clinician per the YBT manual protocol using the Y-Balance Testing Kit.16 Participants were first instructed on how to perform the test. Three scores were measured in each direction, with one “do-over” allowed if any of the criteria for a valid test were not met. Trials in all three directions were
recorded on each leg, and the difference between legs was calculated. A composite score was also calculated for each leg to normalize scores relative to leg length. The equation for the composite score is shown below. The YBT is valid and reliable, with ICC values ranging from 0.89-0.93.17
Hop Tests –This study included the following hop tests: Single-Leg Hop, the Single-Leg Triple Hop, and the SingleLeg Triple Crossover Hop. Each participant was allowed two practice trials to account for a learning effect before each of the hop tests. Each participant completed three trials on each leg for each hop test. Participants were allowed one “do-over” if the test could not be successfully completed. Measurements were taken from the back of the heel, and a marker was placed to allow for accurate measurement to the nearest 0.5 cm. A symmetry index was calculated to evaluate the differences between each leg. This was done by taking the lowest-scoring leg and dividing it by the higherscoring leg to obtain a percentage. These hop tests are reliable and valid with ICC values ranging from 0.92-0.97 18
T-test for Agility - Participants completed two trials for both cutting to the right and left of the middle cone, for a total of four timed trials. Two practice trials for each direction were allowed before the timed trials to account for a learning effect. Participants started with one hand on the ground and paused in this position for three seconds before starting. Participants ran to the middle cone, touched it, cut right first, side-stepped to the cone on the right and touched it, side-stepped to the far cone on the left, touched it and side-stepped back to the middle cone and touched it, and ended by back pedaling through the beginning cone. This same sequence was repeated on the left side. Times were measured using an electronic timing device and were rounded to the nearest 100th of a second. The participant was allowed up to 60 seconds of rest between each trial. The TT is valid and reliable with an ICC of 0.98.19
Data analysis was completed using IBM SPSS Statistics for Mac, Version 25.0 (IBM Corp., Armonk, NY). The normality of data was confirmed using the Shapiro-Wilk test, and normally distributed data was analyzed using parametric testing (vs. non-parametric testing for data with non-normal distribution). Paired t-tests were used to compare means with pre-test and post-test measurements (alpha of 0.05), for each injured athlete.
A total of 395 athletes participated in preseason testing consisting of the Y-balance test, hop testing, and the TT. Of the athletes tested, 23 experienced lower extremity injuries meeting the criteria outlined by this study. Four injured athletes did not complete the RTP re-testing of the functional performance tests and therefore were not included. Two of the athletes transferred schools, one graduated,
Table
Measure
YBT - Ant: Y-Balance Test - anterior reach
YBT - PM: Y-Balance Test - posteromedial reach
YBY - PL: Y-Balance test - posterolateral reach
YBT - Composite - Y-Balance Test Composite score
RTP: measurement at time of return to play
Pre- measurement during preseason testing
SD - Standard Deviation
Bolded values indicate statistically significant difference at p<0.05
and one failed to follow up with the athletic trainer Nineteen (11 female, 8 male) injured athletes completed testing when released to RTP and were included in statistical analysis. The 19 injuries included four knee injuries, nine ankle and/or lower leg injuries, three hip injuries, and three foot injuries. The injuries occurred in seven male football players, five female cross-country runners, two female soccer players, one female volleyball player, three female basketball players, and one male basketball player.
Table 1 shows the comparison of scores for the Y-BT on the affected limb during preseason to time of RTP. The results showed a decrease in mean scores at the time of RTP for the anterior and posterior-medial directions, as well as the composite scores. There was an increase in mean score at the time of RTP in the posterior-lateral direction. However, the only statistically significant difference in the mean scores occurred in the anterior direction (p=0.021).
Table 1 also shows the comparison between the affected limb at RTP and the unaffected limb at time of RTP for YBT The results showed differences in means in all three directions (anterior, posterior-medial, posterior-lateral) and in the composite scores, with the unaffected limb showing higher mean scores in each direction. However, none of these differences were statistically significant.
Table 2 shows the comparison of the Single-Leg, Triple Hop, and Crossover Hops on the affected limbs during preseason testing compared to the affected limb at the time of RTP A statistically significant difference was found between the means in the single-leg hop test (p = 0.001), with a decrease in the mean at the time of RTP Although there were also decreases found in means of the Triple Hop and Crossover Hop tests at the time of RTP, these were not statistically significantly different.
Table 2 also shows the comparison between the affected limb and the unaffected limb at the time of RTP The results showed a higher mean in the unaffected limb at the time of RTP in the Single-Leg, Triple Hop, and crossover hop tests,
although only the Single-Leg Hop (p= 0.001) and Triple Hop (p=0.018) differences were statistically significant.
Table 3 shows the comparison of both the unaffected limb and the affected limb at preseason and time of RTP. Unaffected and affected are differentiated in terms of the direction the participants cut first in the test. After completing the TT and comparing preseason scores to the time of RTP, the unaffected (p = 0.019) and affected (p = 0.014) limbs both showed statistically significant differences in the means.
The purpose of this study was to compare common functional performance test scores from injured athletes at the time of release to RTP to both preseason baseline scores and to scores of the contralateral limb. It was hypothesized that using baseline scores for comparison would be more responsive to residual deficits following injury than using the contralateral limb. This study found mixed results for determining the best reference criteria. The YBT was better able to discern differences due to the residual deficits following an injury when compared to baseline measures but hop and agility testing were better able to discern differences when compared to the contralateral limb. The information about functional performance tests used in this study may help guide clinicians in making RTP decisions for adolescent athletes.
Results for the YBT indicated that it is most beneficial to conduct the anterior reach when testing athletes during the preseason and compare this to the anterior reach of the affected limb at the time of RTP. This is significant because it would allow for more efficient testing by only requiring the performance of one direction rather than all three directions. These results are consistent with findings from Plisky et al. who found that those high school athletes who had differences in the anterior reach direction between limbs were more likely to incur a lower extremity injury, sug-
Table 2. Mean of Hop Test score comparisons (in cm) Measure
RTP: measurement at time of return to play
Pre- measurement during preseason testing
SD - Standard Deviation
Bolded values indicate statistically significant difference at p<0.05
Table 3. T-test for agility score comparisons (in seconds)
Measure
RTP: measurement at time of return to play
Pre- measurement during preseason testing
SD - Standard Deviation
Bolded values indicate statistically significant difference at p<0.05
gesting it may be the most responsive direction to changes in function and symmetry However, Plisky et al. only observed differences at pre-season and did not re-test the injured athletes at the time of RTP.17 Several other studies have looked at the Star Excursion Balance Test (SEBT) or Y-Balance Test as a means of evaluating the risk of lower extremity injury, but none of them have completed testing both at preseason and at the time of RTP.8,9 This cohort of athletes did not demonstrate statistically different scores from the contralateral limb at the time of returning to their sport. Furthermore, the scores from the injured limb did not differ between and preseason scores in any direction except the anterior reach. This study’s findings suggest that screening the anterior reach portion of the YBT during the preseason may be better able to detect symmetry of balance and limb function when compared to the scores of the same injured limb at the time of RTP.
Results for the hop tests indicated that collecting preseason data may not be necessary, as statistically significant scores were only found in the Single-Leg and Triple Hop tests when comparing limbs at the time of RTP Similar results were reported by Gokeler et al. who found significant differences between limbs in the Single-Leg Hop and Triple Hop following an anterior cruciate ligament reconstruction.10 Other studies examining hop tests have only completed preseason testing to determine risk of lower extremity injury and have not completed testing at time of RTP as was completed in this study 8,9 Simon et al. mea-
sured high school athletes at both points in time and found that scores on hop testing were decreased on both the affected and contralateral limb at the time of RTP 20 This would affect comparisons looking for symmetry between limbs to determine readiness to return to sport. While limb symmetry indices are often used to determine this readiness, that was not the objective of the present study The cohort of athletes in the present study had scores of the injured limb compared to both preseason measures and contralateral limb measures. Significant differences in power production and overall limb function were present when the reference criteria was the contralateral limb for SingleLeg and Triple Hop tests (and nearly significantly different for crossover hop test) indicating comparison to the contralateral limb was responsive to differences in scores for these athletes. Collecting preseason scores on all athletes may not be an efficient use of resources if scores of the contralateral limb are responsive enough to detect deficits in power production and overall limb function that may remain when released to sport. Therefore, the authors propose only completing Single-Leg and Triple Hop tests on athletes who have already been injured when attempting to determine RTP readiness and comparing to contralateral limb.
Results for the TT indicate that the participants recorded slower times when released to RTP compared to baseline preseason scores. This test has been used less frequently in studies examining functional performance tests and injury
risk than the YBT and hop tests. The authors believe that this reduced speed on this test indicates reduced agility as fatigue would likely not be a factor following a minimum of five days without sport participation. While it was hypothesized that differences may exist depending on which direction came first (toward or away from the injured leg) in the test, there were no side-to-side differences noted. The cohort of athletes in this study had lower/slower scores on this agility measure between the preseason and at the time of RTP This suggests that it is beneficial to perform agility testing during preseason to establish a baseline for comparison and at the time of RTP for athletes following lower extremity injury to detect agility deficits and gain a better picture of overall limb function. These results indicate that it may be a useful tool in determining RTP readiness in high school athletes with lower extremity injuries.
There are limitations of this study to consider Due to the large volumes of athletes in all sports, multiple testers were used throughout the different sessions. Although testers were all trained for standardization, it may have affected inter-rater reliability Also, there was no distinction between the severity of the injury nor the specific location of the injury in the lower quarter For instance, both ankle sprains and ACL injuries could meet our requirements for five days of missed participation. This study aimed to examine the use of comprehensive lower extremity functional tests to help further guide comparisons used in RTP decisions following injury While this is applicable to use a set of standard FTPs in sports medicine clinical practice,
the diversity of the injuries included in this study may confound the research findings.
The results of this study indicate that high school athletes who sustained a lower extremity injury demonstrate poorer scores on functional performance testing when they return to play compared to both preseason scores as well as contralateral limb scores. The YBT in the anterior direction and the TT appear best able to detect residual functional deficits when comparing injured limb scores to preseason scores. Conversely, hop testing is better able to detect deficits when compared to the contralateral limb at the time of RTP Overall, the results from this study could affect choices for preseason functional testing when creating a reference for determining RTP readiness in high school athletes following a lower extremity injury.
The authors report no conflicts of interest.
Submitted: October 31, 2023 CDT, Accepted: February 29, 2024 CDT
© The Author(s)
This is an open-access article distributed under the terms of the Creative Commons Attribution 4.0 International License (CCBY-NC-4.0). View this license’s legal deed at https://creativecommons.org/licenses/by-nc/4.0 and legal code at https://creativecommons.org/licenses/by-nc/4.0/legalcode for more information.
1. NFHS Releases First High School Sports Participation Survey in Three Years. NFHS. Accessed October 9, 2023. https://www.nfhs.org/articles/nfhsreleases-first-high-school-sports-participationsurvey-in-three-years/
2. Youth Sports Injuries Statistics. Statistics. American Orthopaedic Society for Sports Medicine. Accessed May 25, 2019. https://www.stopsportsinjuries.org/STOP/Resources/ Statistics/STOP/Resources/ Statistics.aspx?hkey=24daffdf-5313-4970-a47ded621dfc7b9b
3. Nagle K, Johnson B, Brou L, Landman T, Sochanska A, Comstock RD Timing of lower extremity injuries in competition and practice in high school sports. Sports Health 2017;9(3):238-246. doi:10.1177/ 1941738116685704
4. Welton KL, Kraeutler MJ, Pierpoint LA, Bartley JH, McCarty EC, Comstock RD Injury recurrence among high school athletes in the United States: A decade of patterns and trends, 2005-2006 through 2015-2016. Orthop J Sports Med 2018;6(1):1-9. doi:10.1177/ 2325967117745788
5. Vereijken A, Aerts I, Jetten J, et al. Association between functional performance and return to performance in high-impact sports after lower extremity injury: A systematic review. J Sports Sci Med 2020;19(3):564-576.
6. Petersen W, Zantop T Return to play following ACL reconstruction: survey among experienced arthroscopic surgeons (AGA instructors). Arch Orthop Trauma Surg 2013;133(7):969-977 doi:10.1007/ s00402-013-1746-1
7. Ardern CL, Glasgow P, Schneiders A, et al. 2016 Consensus statement on return to sport from the First World Congress in Sports Physical Therapy, Bern. Br J Sports Med 2016;50(14):853-864. doi:10.1136/bjsports-2016-096278
8. Onate JA, Starkel C, Clifton DR, et al. Normative functional performance values in high school athletes: The functional pre-participation evaluation project. J Athl Train. 2018;53(1):35-42. doi:10.4085/ 1062-6050-458.16
9. Smith J, DePhillipo N, Kimura I, Kocher M, Hetzler R. Prospective functional performance testing and relationship to lower extremity injury incidence in adolescent sports participants. Int J Sports Phys Ther 2017;12(2):206-218.
10. Powell C, Jensen J, Johnson S. Functional performance measures used for return-to-sport criteria in youth following lower-extremity injury. J Sport Rehabil 2018;27(6):581-590. doi:10.1123/ jsr.2017-0061
11. Logerstedt D, Grindem H, Lynch A, et al. Singlelegged hop tests as predictors of self-reported knee function after anterior cruciate ligament reconstruction: the Delaware-Oslo ACL cohort study. Am J Sports Med 2012;40(10):2348-2356. doi:10.1177/0363546512457551
12. Toole AR, Ithurburn MP, Rauh MJ, Hewett TE, Paterno MV, Schmitt LC. Young athletes cleared for sports participation after anterior cruciate ligament reconstruction: How many actually meet recommended return-to-sport criterion cutoffs? J Orthop Sports Phys Ther 2017;47(11):825-833. doi:10.2519/jospt.2017.7227
13. Gokeler A, Welling W, Benjaminse A, Lemmink K, Seil R, Zaffagnini S. A critical analysis of limb symmetry indices of hop tests in athletes after anterior cruciate ligament reconstruction: A case control study OTSR 2017;103(6):947-951. doi:10.1016/j.otsr.2017.02.015
14. Smith J, DePhillipo N, Azizi S, et al. The Lower Extremity Grading System (LEGS) to evaluate baseline lower extremity performance in high school athletes. Int J Sports Phys Ther 2018;13(3):401-409. doi:10.26603/ijspt20180401
15. Clanton TO, Matheny LM, Jarvis HC, Jeronimus AB. Return to play in athletes following ankle injuries. Sports Health 2012;4(6):471-474. doi:10.1177/1941738112463347
16. Cook G, Plisky P. YBT – Y-Balance Testing Manual.; 2015.
17 Plisky PJ, Rauh MJ, Kaminski TW, Underwood FB. Star excursion balance test as a predictor of lower extremity injury in high school basketball players. J Orthop Sports Phys Ther. 2006;36(12):911-919. doi:10.2519/jospt.2006.2244
18. Ross MD, Langford B, Whelan PJ. Test-retest reliability of 4 single-leg horizontal hop tests. J Strength Cond Res. 2002;16(4):617.
19. Pauole K, Madole K, Garhammer J, Lacourse M, Rozenek R. Reliability and validity of the T-Test as a measure of agility, leg power, and leg speed in college-aged men and women. J Strength Cond Res 2000;14(4):443.
20. Simon JE, Yom J, Grooms DR. Symmetry does not indicate recovery: Single-leg hop before and after a lower extremity injury Int J Sports Med 2021;42(4):344-349. doi:10.1055/a-1244-9959
Jorge A, Lichtenstein E, Faude O, Roth R. Muscle Activity and Kinematics During Three Hamstring Strengthening Exercises Compared to Sprinting: A Cross-Sectional Study. IJSPT. Published online May 1, 2024:569-580. doi:10.26603/001c.116158
Adelso Jorge1a , Eric Lichtenstein1 , Oliver Faude1 , Ralf Roth1
1 Department of Sport, Exercise and Health, University of Basel
Keywords: biceps femoris, electromyography, exercise, hamstring injury prevention, high-speed running, joint-dominance, semitendinosus https://doi.org/10.26603/001c.116158
International Journal of Sports Physical Therapy
Background
During sprinting, the biceps femoris long head predominantly gets injured, while hamstring strengthening exercises predominantly activate the semitendinosus more effectively. Understanding how joint dominance influences hamstring activity may offer clarity on appropriate exercise selection in strengthening programs.
Purpose
This study compared three hip-dominant hamstring exercises: the rocker, perpetuum mobile fast and slow (PMfast and PMslow) and the Nordic Hamstring exercise (NHE) on their potential to simulate sprint-like activity and kinematics.
Methods
Muscle activity of the posterior kinetic chain (biceps femoris, semitendinosus, gluteus maximus, and medial gastrocnemius) was measured with surface electromyography (sEMG) during the exercises and treadmill running at 75% of the individual maximal sprint velocity in male athletes. sEMG data were normalized to maximal sprinting. 3D-motion capture was employed to assess hip and knee angles.
Results
Eight male athletes were included (age: 24.0 years ± SD 2.9; body mass: 76.8 kg ± 7.7; height: 1.79 m ± 0.08). Greater activity of the hamstrings occurred during the explosive exercises ranging from 63.9% [95%CI: 56.3-71.5%] (rocker) to 49.0% [95%CI: 40.4-57.6%] (PMfast) vs. 34.0% [95%CI: 29.1-38.9%] (NHE) to 32.1% [95%CI: 26.9-37.3%] (PMslow). The rocker showed greatest hamstring and gluteus maximus activity. Biceps femoris consistently showed greater activity than the semitendinosus across all exercises in peak (mean difference: 0.16, [95%CI: 0.07-0.26]) and average (mean difference: 0.06, [95%CI: 0.01-0.11]) activity PMfast, PMslow and NHE demonstrated less hip flexion angle at peak hamstring activity than the rocker and high-speed running and every exercise showed less hamstring elongation stress than during high-speed running.
Discussion
Hamstring activity is comparable to high-intensity treadmill running for NHE and PMslow, and greater for the rocker and PMfast. Gluteus maximus activity varied, with the
a
Corresponding Author:
Adelso Jorge, MSc
Department of Sport, Exercise and Health
University of Basel, Grosse Allee 6, 4052 Basel
Switzerland
E-mail: adelso.jorge@hotmail.com
Phone: +41 76 681 65 15
rocker and PMfast showing greater activity than in sprinting. All examined exercises demonstrated their peak activity at short hamstring muscle length.
Level of evidence
3b
Sprinting is a key activity and a determinant of performance in many sports such as soccer, rugby or track and field. However, sprinting near maximum velocity is the main activity during which hamstring muscle injuries typically occur.1‑3 Muscle injuries are frequent throughout many sports,4‑7 with a high risk of recurrence and creating above average time-loss from competition.4,6,8
The bi-articular hamstrings are subjected to a stretchshortening cycle during sprinting, with stretching taking place in the terminal swing phase and shortening starting shortly before the foot strike and lasting throughout the stance phase.2 This coincides with neuromuscular activation being most pronounced within those time frames.9 From a kinematic standpoint, the bi-articular hamstrings reach their greatest muscle-tendon length during the terminal swing phase.2 The majority of data suggests that injuries typically occur during terminal swing phase, though it is still a matter of debate.10 This phase is characterized by peak muscle-tendon force, high muscle excitation, negative work, and peak muscle-tendon length.2,9,11,12 Out of all hamstring muscle injuries, approximately 70% affect the biceps femoris long head (BFlh) with lesions evenly distributed throughout the muscle.13 The exposure to a greater lengthening strain of the BFlh may be explained by the relatively longer hip extension moment arm,14 its lower stretch tolerance or its ability to store energy through negative work compared to the other hamstring muscles.15
It might be appropriate to consider these factors when selecting isolated training exercises to properly address the specific hamstring activation during late swing in combination with the prevailing lengthening stress. Therefore, it may be reasonable to assess exercises for their capacity to simulate sprint-like conditions.
The Nordic hamstring exercise (NHE) has demonstrated its effectiveness regarding reducing the risk of hamstring injuries. Several meta-analyses have shown that programs consisting of or including the NHE revealed a remarkable decrease in hamstring injury incidence of about 50%.16‑18 In several cross-sectional studies assessing muscle activity, the NHE demonstrated the greatest eccentric muscle activity out of a variety of exercises.19‑21 Nevertheless, hamstring injury incidence is still rising in professional football.6 It has been speculated that hamstring exercises including the NHE lack sprint-specificity 19,22‑24 Therefore, such exercises may not fully realize the potential transfer of strength gains into horizontal force production or capabilities to resist muscle strain stress.24 In addition, numerous studies indicate that hamstring exercises, including the NHE, typically result in a more pronounced activation of the semitendinosus muscle (ST).19,25‑27 Both aspects may limit the efficacy of injury prevention exercises. Studies us-
ing functional magnetic resonance imaging suggest that hip-dominant exercises (hamstring activation through hip extension) may lead to a greater activity of the BFlh.28 Hence, this study aimed to investigate two hip-dominant hamstring exercises, which may more closely reflect the electromyographical activity and kinematic characteristics of sprint / high-speed running. Together with the NHE, these exercises were compared through application of sprint normalization.29
This study aimed to analyze the peak and average muscle activity as well as joint angles of peak activity and resulting elongation stress (subtraction of knee from hip angle) of the posterior kinetic chain during several exercises and high-speed running. The purpose of this study was to compare three hip-dominant hamstring exercises: the rocker, perpetuum mobile fast and slow (PMfast and PMslow) and the Nordic Hamstring exercise (NHE) on their potential to simulate sprint-like activity and kinematics. It was hypothesized that (1) BFlh excitation would be greater in hipdominant exercises than in the knee-dominant exercise, (2) BFlh-ST ratio would differ depending on dominant joint, (3) elongation stress during exercises would be significantly smaller than in treadmill high-speed running.
STUDY
The cross-sectional intervention study was conducted with adult male athletes from sprint intensive sports. Participants performed two maximal and one submaximal sprints and four selected exercises in one testing measurement session. Muscular activity of the biceps femoris and semitendinosus as well as hip and knee joint angles were assessed. The study protocol complied with the latest version of the Declaration of Helsinki and was evaluated and approved by the regional ethics committee.
This study recruited amateur athletes from surrounding clubs via convenience sampling from December 2022 to September 2023. Inclusion criteria were male sex, between 18 and 30 years old, with at least one year of more than 4.5 hours of sprint-related training per week to ensure that both performance and technical proficiency would be homogeneous in sprinting. Athletes with recent injuries in lower extremities in the prior six months as well as the presence of any kind of discomfort or pain during sprinting were excluded from participation. Participants were informed about the study and all procedures and signed a written consent before participation.
Athletes were scheduled for two sessions. The first habituation session, served to familiarize the standardized warmup, ensure correct technical execution of the exercises and to determine exercise load. This session lasted approximately 45 minutes and took place at least 48h prior to the second session. The second testing session consisted of a warm-up, two maximal sprints, a submaximal high-speed run at 75% of maximal sprint and the four exercises in randomized order. This session lasted about two hours.
At the beginning of the testing session, standardized surface electromyographic sensors (sEMG) were applied to four muscles of interest (biceps femoris long head [BF], semitendinosus [ST], gastrocnemius medialis [GCM], gluteus maximus [GMax]) on the right leg of each participant. Sensor application was in accordance with the SENIAM guidelines (http://www.seniam.org). Before electrode fixation, the skin was shaved, abraded with scrubbing gel and wiped with alcohol. Electrodes were placed parallel to the muscle fibers with an inter-electrode distance of 20mm. After a resting period of 5 min, impedance was tested (<10kΩ) and correct electrode placement was verified through manual muscle test and visual inspection of raw signals. The standardized 20 min warm-up consisted of running drills, mobilization exercises and time for individual necessities designed to enable maximal sprinting. After warming up two 40 m maximal sprints on an outdoor sprint track with similar weather conditions for all participants (dry, sunny, about 25ºC) and a resting period of 5 min in between were performed. Participants started from a standing start with self-chosen set-off with their usual running shoes performing with maximal effort. Velocity calculations based on 35 to 40m sprint time was obtained through a single-beamed photocell (Witty, Microgate Srl, Bolzano, Italy).
After a 10-minute rest, three-dimensional (3D) motion capture system (Vicon Motion Systems Ltd, United Kingdom) reflective markers were bilaterally placed on the lower body with a total of 36 markers positioned on anatomical landmarks. After calibration of the motion capture model, participants performed one high-speed run at 75% of maximum sprint velocity on a motorized treadmill. It has been shown that this is the fastest speed which does not lead to technical failure within 15 strides and still represents kinematics close to a maximal sprint.30 Subsequently the four exercises of interest were conducted. Three repetitions were completed per exercise, with a 5 min rest in between, and the order was randomized as to avoid the influence of fatigue or order bias. Constant speed, pelvic tilt and leg alignment were controlled to ensure similar interindividual movement execution. Perceived loading and exertion were quantified with the Borg CR10 scale31 immediately after exercises and before initiating the new one to ensure that the participants were sufficiently recovered.
EXERCISE DESCRIPTION
The rocker is a custom-made apparatus which is currently used by Swiss track and field athletes on national level (Figure 1A). The hip is secured to the device, the right leg ele-
vated on a 42 cm high surface padded with a mat (Balancepad Elite, Airex AG, Sins, CH). The device weight additional to the body weight gets lifted through unilateral hip extension. Participants were instructed to thrust their hip as high and explosively as possible. The rocker operates as a class 2 lever system and has multiple resistance levels, with increasing intensity moving the fulcrum further cranially This level was individually adjusted during habituation for highest possible load with no significant decrease in execution speed for three repetitions without technical failure.
The perpetuum mobile exercise (Figure 1B) originates from physical therapy and is used to train reactive hip stabilization and propulsion in gait as described by Klein-Vogelbach.32 Participants positioned their shank atop a gymnastic ball (53cm diameter), while hip and left leg stayed airborne, supported through the arms spread on the ground. In the starting position the ball was fully pulled towards the hip. Through extension in the hip the ball was rolled caudally while the left leg imitates the swing during running cycle through hip and knee flexion. The exercise was performed in two variations: one with an explosive concentric phase (PMfast) and the other with every movement phase lasting five seconds controlled with a metronome (PMslow).
A custom-made device with adjustable slope was used to perform the NHE (Figure 1C). Participants knelt on a padded board, with the ankles secured directly superior to the lateral malleolus by individual ankle braces. Only the lowering (eccentric) portion of the exercise was performed. Starting from an initial kneeling position with arms on the chest, participants were instructed to lower their bodies while keeping an extended hip, reaching ground contact after five seconds. During habituation session, the slope level was adjusted to ensure that the shank angle allowed for exactly three technically correct full range of motion repetitions without loss of control.
Muscular activity was measured through bipolar surface electrodes (Wave Plus, Cometa srl, Milan, IT) with an interelectrode distance of 20mm, at a sampling rate of 1 kHz. Raw EMG data were filtered using the Butterworth bandpass filter (10-400Hz), full-wave rectification, and smoothed by a root mean square (25ms width) using the proEMG software (prophysics AG, Kolten, CH). Peak and average (contraction phase) RMS values of every repetition of every exercise were extracted and the median activity for every exercise was calculated. sEMG data were normalized based on maximal sprint, utilizing the greater activity out of the two tries. The 30ms plateaus were averaged over three consecutive strides and applied for every muscle of interest.29 BFlh/ST-ratio was calculated by dividing BFlh activity by ST activity
The 3D motion capture utilized twelve cameras with a recording frequency of 200 Hz. The musculoskeletal model based on Vicon Plug-In Gait Lower Body AI was modified by additional markers (Figure 2) to best facilitate the modelling of the submaximal sprints and exercises according to prior tests.33 Raw trajectory data was processed using
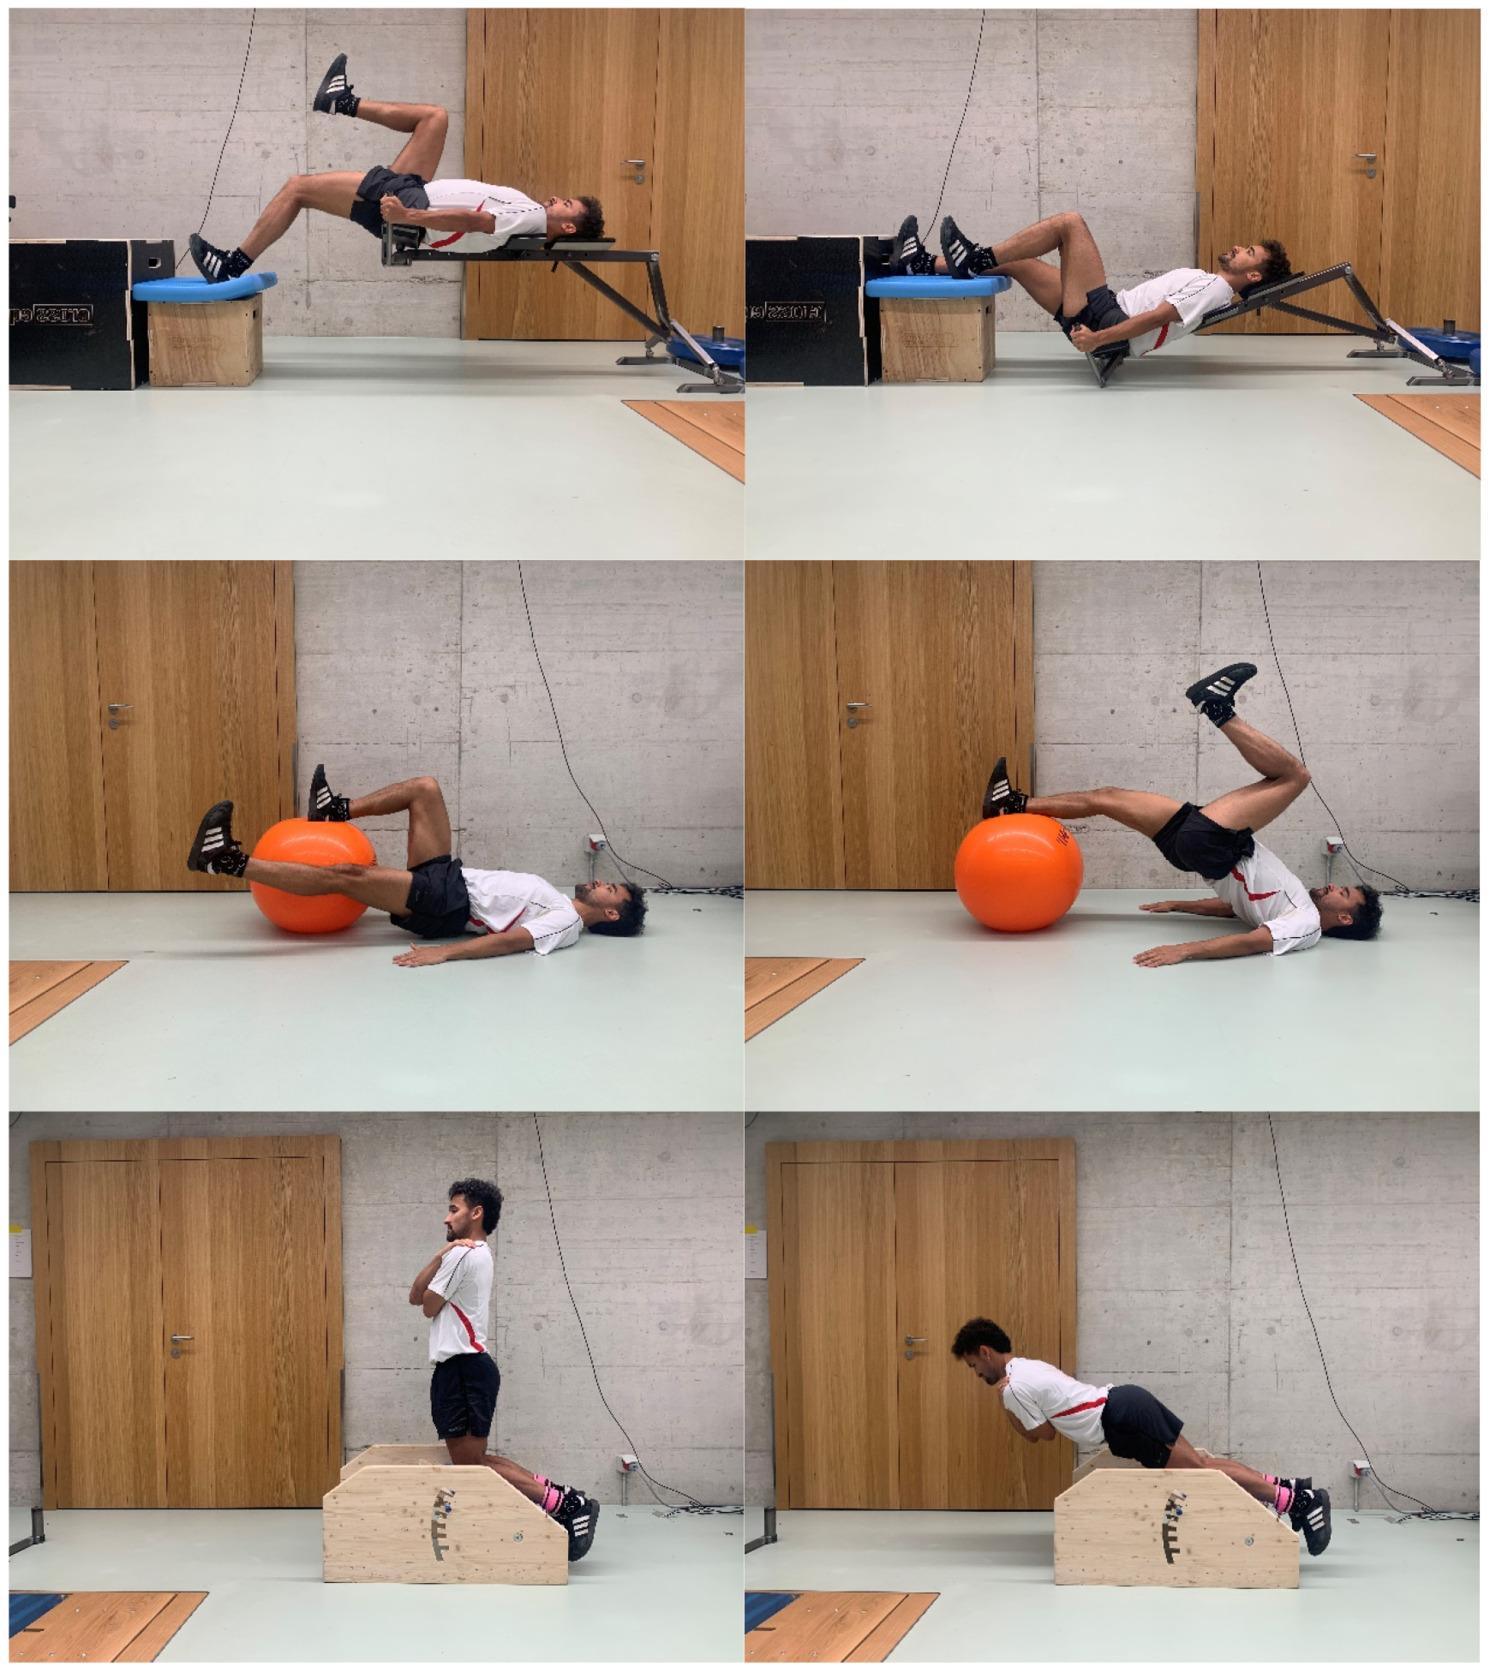
Figure 1. Start and end position of every exercise.
From top to bottom: (A) the rocker, (B) perpetuum mobile, and (C) the Nordic Hamstring. Note: Perpetuum mobile consists of two execution variations (fast and slow).
software inbuilt pipelines for dynamic movements (Vicon Nexus 2.15, Vicon Motion Systems Ltd, United Kingdom). 3D motion capture data was synchronized with the EMG data. Hip and knee joint angles corresponding to the maximal muscle activity in the BF and ST were recorded and the median of the three repetitions per exercise was used for further analysis. Joint angles were measured as depicted in Figure 4A. Elongation stress was calculated by subtracting knee flexion angle from hip flexion angle.22
A random effects linear mixed model (GAMLj, Jamovi) was employed to examine differences in muscular activity (peak and average) for each muscle and angles in hip and knee, elongation stress and BFlh/ST-ratio in hamstrings. Random intercept per participant model was used to account for repeated measures. All values are reported with mean difference (MD) and confidence interval (CI), and level of significance was set at p < 0.05. Standardized effect sizes (SMD) were acquired by standardizing all estimates to the treadmill SD Normal distribution of residuals was verified visually through inspection of Q-Q-Plots.
Descriptive data is shown in Table 1 Post-hoc computation of achieved power showed us values > 0.92 for the applied statistical calculations.
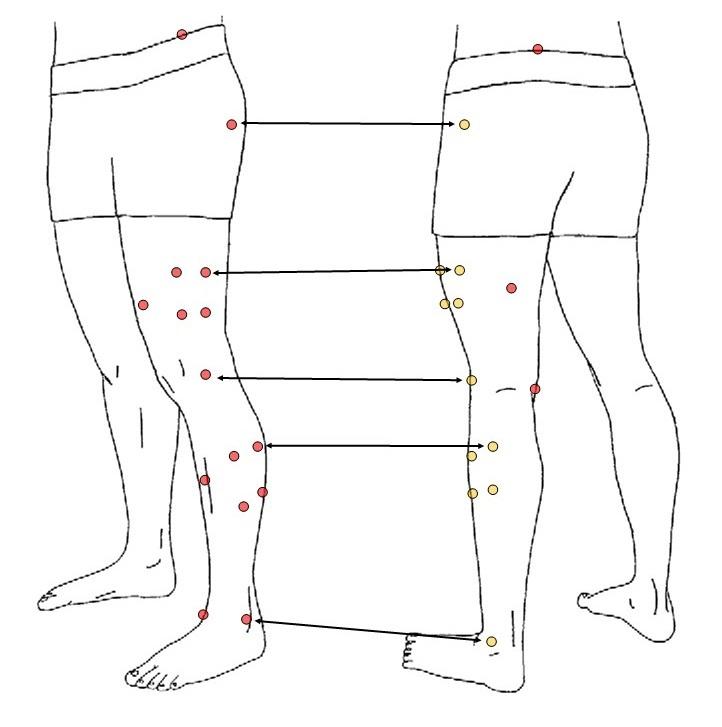
Figure 2. Illustration of the 18 reflective markers used per limb. The markers that appear twice are highlighted in orange in the second frame.
Peak and average EMG data for hamstrings is visible in Table 2. The rocker showed significantly greater peak hamstring activity than PMslow, NHE and high-speed running (MD: 0.28-0.39, p< 0.006, [95%CI: 0.13-0.54], SMD: 1.5-2.0). Average hamstring activity in the rocker was significantly greater than in any other exercise (MD: 0.15-0.35, p< 0.002, [95%CI: 0.08-0.42], SMD: 1.9-4.4). Additionally, in PMfast hamstring activity was significantly greater than in PMslow, NHE and high-speed running (MD: 0.15-0.20, p< 0.002, [95%CI: 0.07-0.27], SMD: 1.9-2.5). BFlh activation was consistently greater in peak (MD: 0.16, p< 0.002, [95%CI: 0.07-0.26], SMD: 0.8) and average activity (MD: 0.06, p< 0.014, [95%CI: 0.01-0.11], SMD: 0.8) compared to the ST.
Peak and average muscle activity of all muscles is depicted in Figure 3. Peak GMax activity was significantly greater in the rocker, PMfast, and high-speed running than in NHE (MD: 1.08-1.43, p< 0.004, [95%CI: 0.55-1.94], SMD: 1.7-2.3), as well as to a smaller extent in the rocker than in PMslow (MD: 0.85, p= 0.047, [95%CI: 0.30-1.39], SMD = 1.3).
Average GMax activity in the rocker and PMfast was significantly greater than in PMslow and NHE (MD: 0.37-0.68, p< 0.038, [95%CI: 0.13-0.89], SMD: 1.6-3.0). GCM activities of every exercise showed significantly smaller values than during high-speed running for peak (MD: 0.37-0.74, p< 0.009, [95%CI: 0.18-0.94], SMD: 1.0-2.0) and average activity (MD: 0.18-0.28, p< 0.001, [95%CI: 0.11-0.36], SMD: 1.2-1.8), respectively
Table 1. Demographics of all male participants
Table 2. Peak (PV) and average (AV) sprint normalized EMG group mean data for the four exercises and highspeed running divided by lateral and medial hamstring.
Mean [95%CI]
(0.59-0.96)*
Angles of peak activity as well as elongation stress are shown in Table 3. Hip flexion angle differed significantly between exercises. High-speed running (MD: 34-38°, p< 0.001, [95%CI: 21-51°], SMD: 2.6-2.9) as well as the rocker (MD: 19-23°, p< 0.044, [95%CI: 7-36°], SMD: 1.5-1.8) displayed a more flexed hip than the other exercises (Figure 4). No differences in knee flexion angle were observed (MD: 1-20°, [95%CI: -9-34]) except a significantly more flexed knee during the rocker than during PMslow (MD: 27°, p= 0.013, [95%CI: 11-42°], SMD: 1.4). Elongation stress of peak hamstring activity was smaller for every exercise than for high-speed running (MD: 25-29, p< 0.001, [95%CI: 16-37], SMD: 2.1-2.5).
MUSCLE SELECTIVITY
Muscle selectivity of every exercise is shown in Figure 5. Peak and average activity BFlh/ST-ratio did not differ between exercises (MD = 0.02-0.35, [95%CI: -0.23-0.41]).
DISCUSSION
The hamstrings are frequently prone to injury Gaining insight into how various exercises activate the individual
muscles and considering the influence of joint dominance could provide clarity on the appropriate exercise selection in strengthening programs. This study evaluated muscle sprint-specificity of three hip dominant exercises looking at task-specific muscle activity and joint angles. The main findings were that the rocker elicited greatest muscle activity in BFlh and ST followed by PMfast NHE showed high peak, but low average normalized muscle activity (Table 2). All examined exercises demonstrated their peak activity at short hamstring muscle length (range) with none of them reaching elongation stress of 0. This represents the average elongation stress at peak activity determined during at least 10 running cycles on the treadmill.
The results consistently demonstrated high peak normalized muscle activity for all exercises in reference to the utilized thresholds by other sEMG studies that consider high muscle excitation over 60 to 80% of MVIC normalized activity.19,23‑25,34 The contraction phase averages of this study are barely smaller than the peak sprint normalized activity in the reference studies.19,23,24 Therefore, rather than evaluating the results based on absolute values, as is common in EMG studies for activity assessments, the data were examined in relation to each other and referenced to the sprint. The results show that the explosive exercises elicit
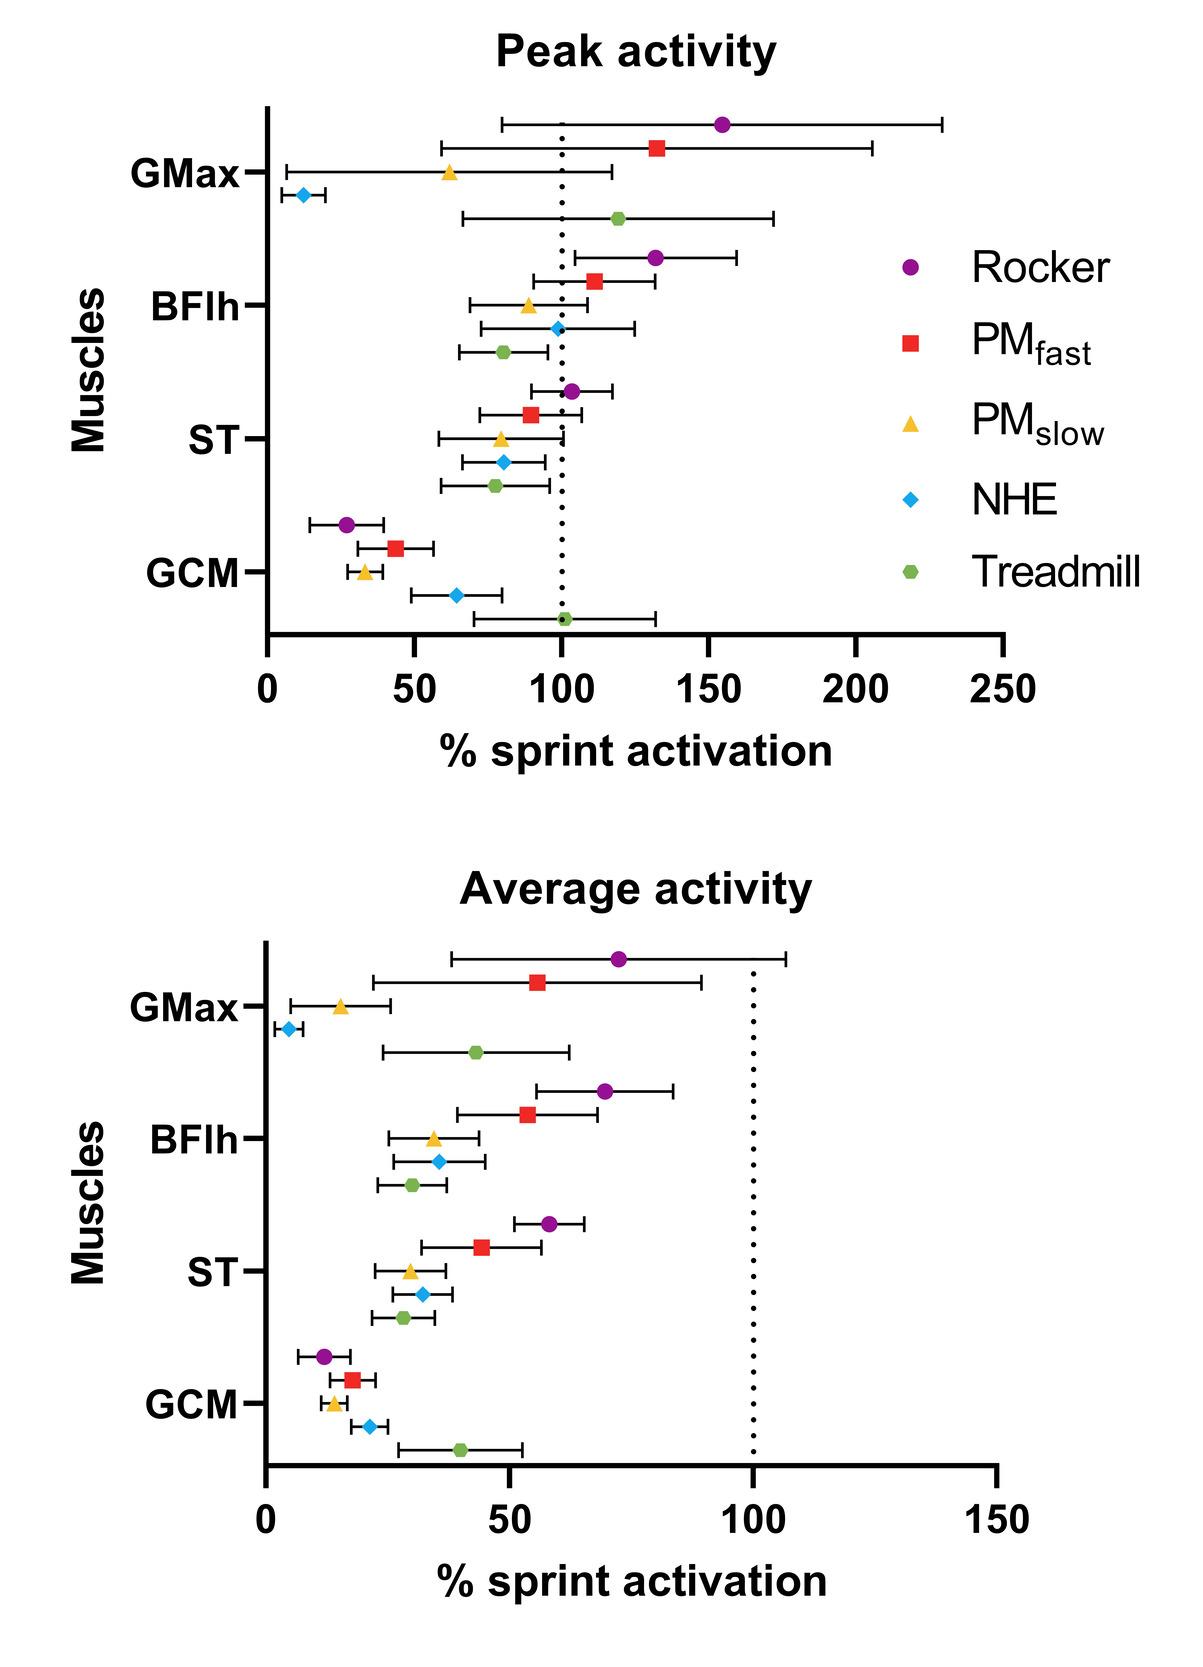
Figure 3. Sprint normalized peak (1A) und average (1B) activity (95% CI) of the posterior kinetic chain of all examined exercises and treadmill high-speed running. The dotted line corresponds to the peak muscle activation for each muscle during sprinting.
Note: 100% lines are in different scales. PMfast: perpetuum mobile exercise fast version; PMslow: perpetuum mobile exercise slow version; NHE: nordic hamstring exercise. GMax: gluteus maximus; BFlh: biceps femoris long head; ST: semitendinosus; GCM: gastrocnemius medius.
greater average hamstring muscle activity in comparison to the slow exercises which induced between 26-40% of maximal sprint for NHE and 25-39% for PMslow There are several possible reasons. Firstly, one can assume that a contributing factor is the extra load imposed by the rocker on hip extension. As demonstrated in previous research,35 increased load enhances muscle activity, which could offer a partial explanation for the observed greater muscle activity Secondly, overall peak normalized EMG showed more similar values among exercises, in contrast the discrepancies are great in average normalized values (Figure 3). The rea-
son may be the explosive exercises having short concentric phases where average activity approximates peak activity while slow exercises have longer contraction windows that allowed for more fluctuations and therefore smaller average values. In addition, during initial phase of the NHE the load is negligibly small which also pulls down the average EMG values. Lastly, variations in execution may influence muscle activity magnitude during the NHE. Previous research has incorporated variations with a more flexed hip and different shank angles.36 All variations exerted less activity in hamstring muscles than the original with neutral hip and shank level which is in accordance with another similar study 37 It seems that similarity to sprinting in NHE faces a tradeoff in less activity magnitude. Since the previously reported study showed NHE hip flexion angles closer to sprint conditions and more extended knee starting angle,36 this could also be the case for the procedure of this study This would imply that EMG values during NHE could reach higher levels with a different execution, making its execution comparable to the rocker.
To the authors knowledge there are only few explosive hamstring exercises examined in a closed kinetic chain as seen in the rocker and PMfast Two studies examined the laying kick,21,23 a related movement involving a unilateral glut bridge with 90° knee flexion angle in the hip extending extremity with the contralateral side kicking up explosively as to lose ground contract with the supporting leg. Although no additional load was used both studies reported among the greatest hamstrings and GMax excitation. Both study outcomes support the finding of this study advocating for closed kinetic chain hip-dominant exercises.
Hip-dominant exercises, especially like the rocker and PMfast revealed high variability of GMax activity, these high deviations are also visible in the previously reported study 21 It seems unlikely that this spread originates from the generated maximum values while sprinting because with increasing speed leg muscle activation patterns get more repeatable.38 Ultimately, this consolidation results in a “motor program getting dominant” during maximal sprinting leading to utilization of a uniform neural strategies.39 A more probable reason lies in the exercises being new to most participants leading to them using different neural strategies. Therefore, explosive hip extension may be achieved with or without much participation of GMax.
Table 3. Mean hip and knee flexion angles of peak EMG activity averaged for both hamstrings in degrees and resulting elongation stress at which peak activity occurs.
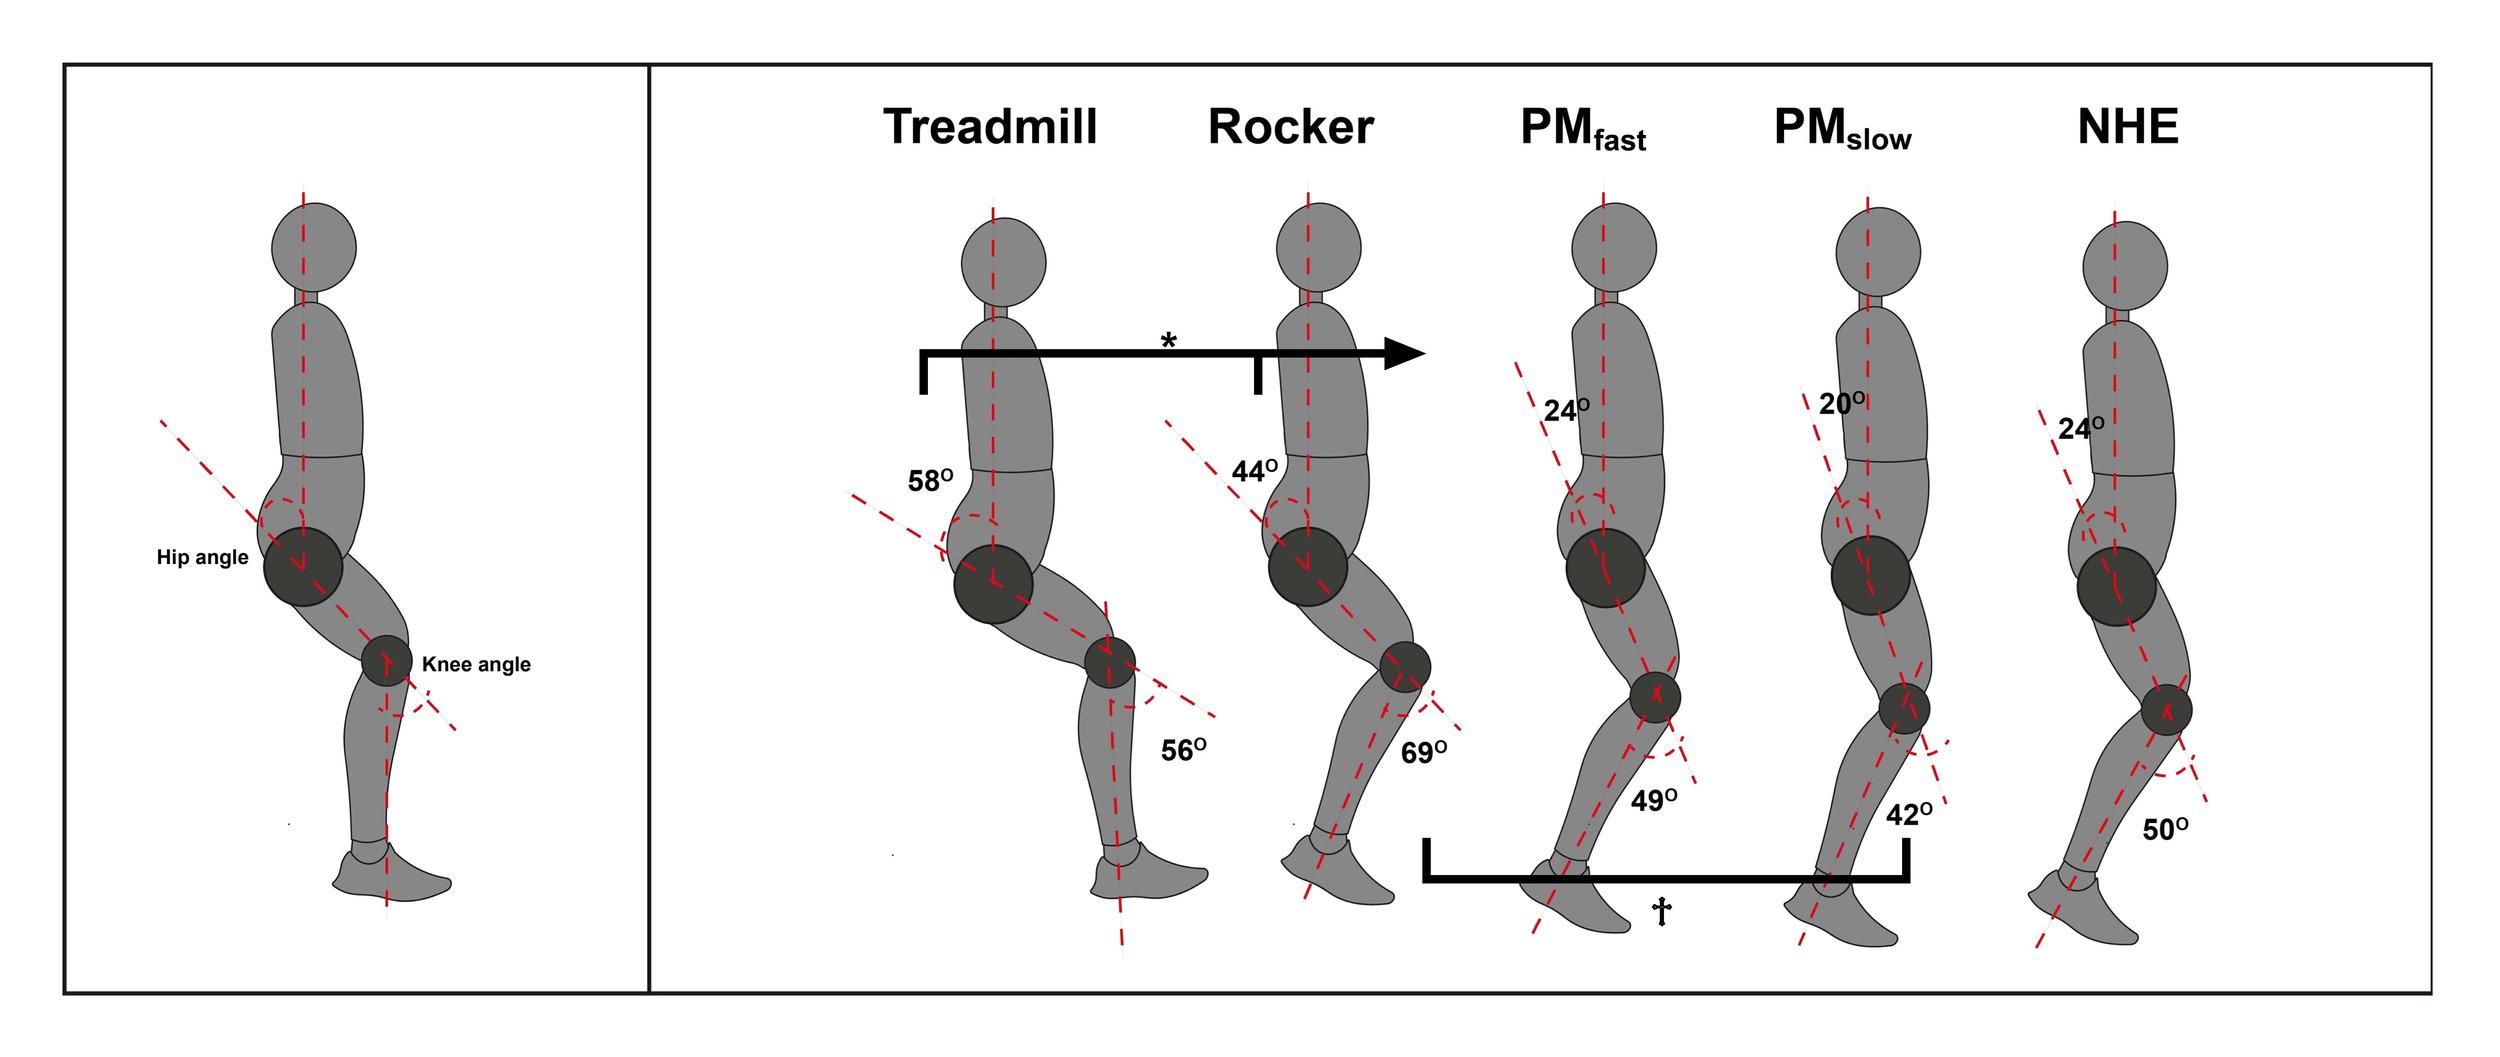
Figure 4. Definition of joint angles (A) and hip and knee flexion angles of peak muscle activity during every exercise and high-speed running (B) averaged for both hamstrings.
PMfast: perpetuum mobile exercise fast version; PMslow: perpetuum mobile exercise slow version; NHE: Nordic hamstring exercise.
* different from the rest to the right (<0.05)
† different from each other (<0.05)
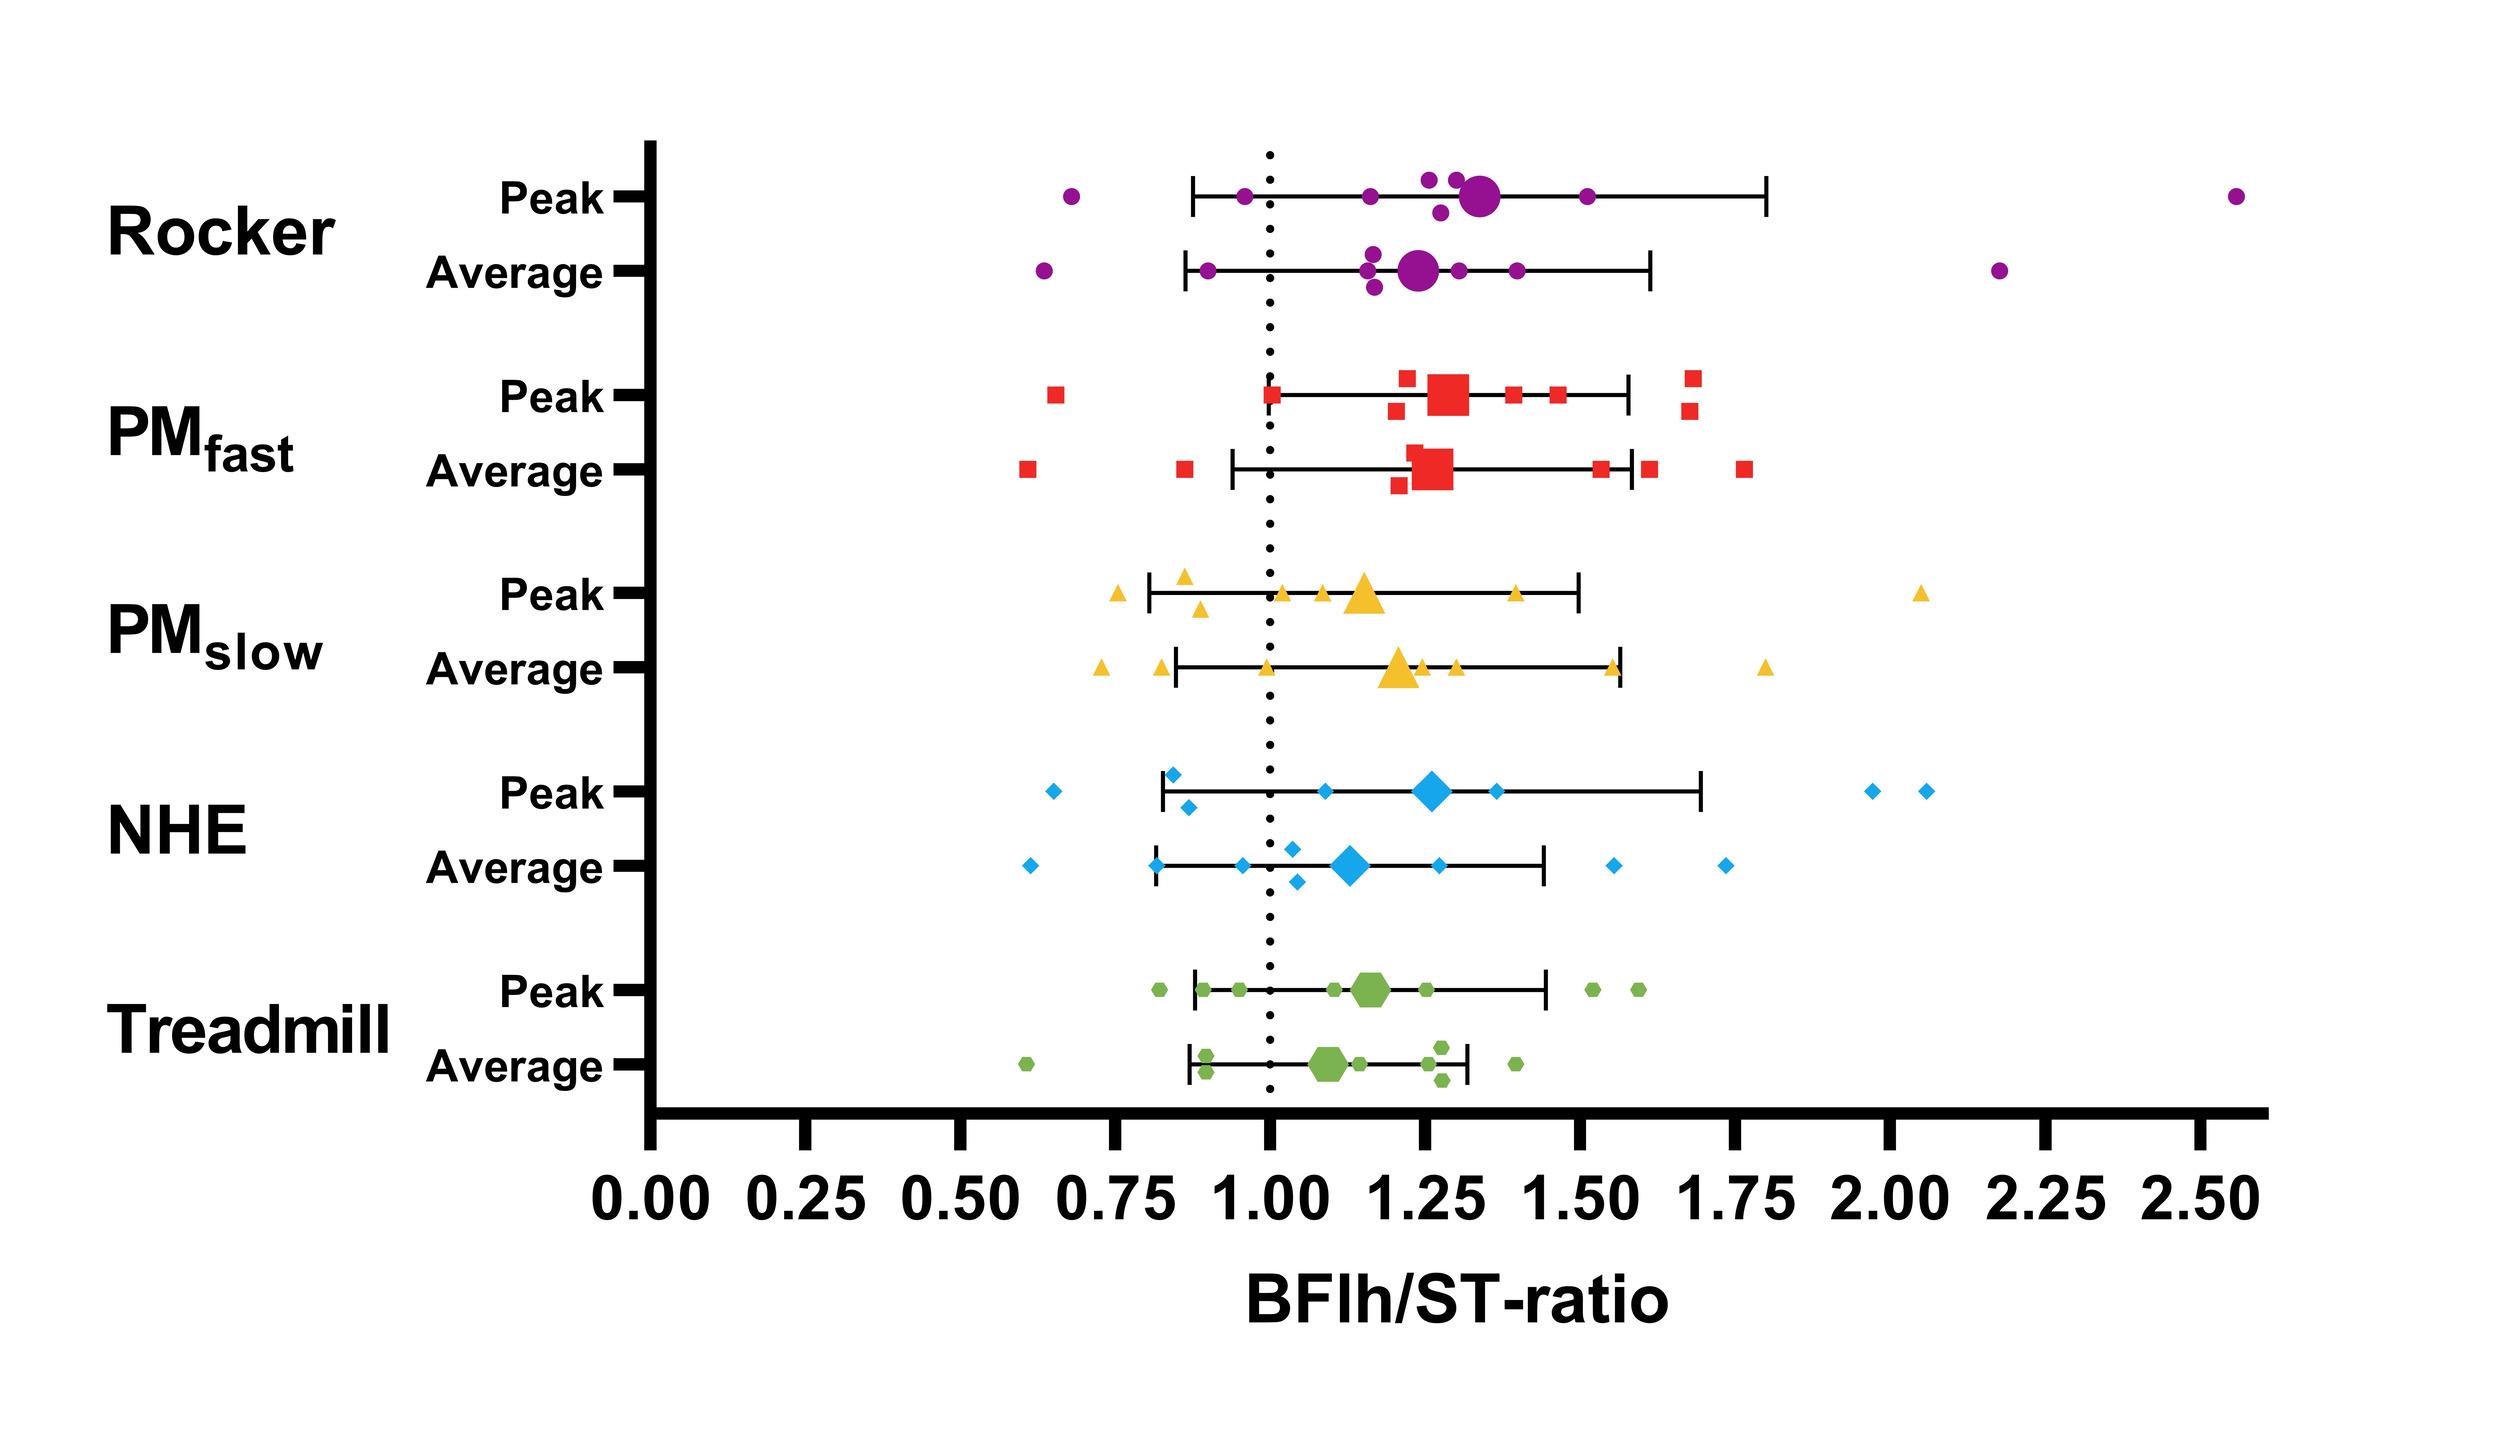
Figure 5. Peak and average sprint normalized ratio of BFlh and ST activity (95%CI) for every exercise and treadmill high-speed running with the dotted line symbolizing equal intermuscular activation.
PMfast: perpetuum mobile exercise fast version; PMslow: perpetuum mobile exercise slow version; NHE: Nordic hamstring exercise.
Further research is needed to determine if this variability decreases with experience ultimately answering the question of hamstring selectivity of the examined exercises.
In the present study, treadmill high-speed running elicited among the lowest level of peak and average hamstring muscle activity This contrasts the results of another study which also investigated 75% of maximal sprint (24.4 km/h ± 1.4km/h) and found that chosen speed already elicited greater BF and ST activity than maximally executed exercises.30 Despite employing similar speeds (23.9 km/h ± 1.9 km/h), the present study did not reach the same conclusion. One plausible explanation for this phenomenon could be the running velocity-dependent engagement of the hamstring muscles. During higher velocities, specifically at speeds exceeding 26 km/h, a 30% increase in run-
ning speed results in approximately a doubling of the demands on the hamstring muscles.40 This sensitivity to speed fluctuations might account for the difference in EMG levels present. Hence, it may be that used running speeds are not as representative of maximal sprint kinematics as initially anticipated.
Angles of peak activity for high-speed running at 75% of maximal speed was at approximately the same time in late swing for both hamstring muscles and is consistent with findings of previous studies.23,41 NHE presented a peak activity hip flexion angle of 26° (CI: 18.8°;33.3°) which occurred at 68.1% (CI: 61.5%;74.6%) of movement progression and was also visible in a similar study,23 which showed an even greater hip flexion. This is noteworthy as participants were instructed to perform the exercise with the effort to keep the hip fully extended and was strictly controlled by the instructor when hip flexion was visible. As anterior pelvic tilt shifts optimal hamstring muscle length during movement progression, this can affect angle of peak activity as it prolongs hamstring optimal force generation. Thus, potentially, the window in which peak activity could occur may increase. Hip and knee flexion angles for PMfast as well as for the NHE show similar composition as during high-speed running. The similarity entails that they exert peak hamstring activity at a similar time as during the late swing phase even though contraction modes in joints differ The rocker displayed the most flexed hip next to highspeed running which indicates that peak hamstring activity occurs during the initial phase of the movement. On the other hand, if the knee was too flexed, it could target and adapt hamstring muscles at an unfavorable angle in the knee. This issue may be resolved by adjusting knee start-
ing angle to be more extended. Shifting peak activity to a later stage of movement could potentially enhance hamstring engagement.
Elongation stress is a measure to quantify lengthening stress on the hamstrings by subtracting the knee from the hip flexion angle.22 For reference, elongation stress during the late swing phase corresponds to a maximum value of 32 (i.e. 60° hip flexion -28° knee flexion) and starting position in NHE equals to -90 (0° hip flexion – 90° knee flexion). As hypothesized, none of the exercises came close to elongation stress values during high-speed running. Elongation stress, as a simple measure, neglects the greater moment arm at the hip. Given that all exercises exhibited less hip flexion than during treadmill high-speed running (Table 3), the actual elongation stress and therefore muscle length at peak activity would likely be less.22 It is recommended to use exercises for hamstring muscle injury (HMI) prevention that stretch the hamstrings over their optimal length (>0), to induce changes in fascicle length effectively moving knee flexor torque-joint relationship to a more extended knee. At least from this point of view, the selected exercises including the NHE are not suitable for reducing the risk of HMI. On the contrary, concentric exercises can even lead to shortening of the muscle fibers.42 Elongation stress for high-speed running was surprisingly low considering that peak activity coincides with peak lengthening stress on the hamstrings.41 Though these values correspond to the results of another similar study 23 This implies that between 75% and maximal sprint speed elongation stress increase by a collective amount of 30 angle units. Thus, the kinematics at this speed do not stress the hamstrings to a comparable extent as in maximal sprint, as originally assumed.
As hypothesized, two of the three hip-dominant exercises elicited greater BFlh activity than the NHE but BFlh/ST-ratios did not differ depending on joint-dominance. Regarding this, a study examined the “stiff-leg deadlift” and found significantly greater BFlh and SM activity than in ST. They argue that ST’s selectivity for eccentric knee-flexion may be attributed to its morphological properties, including long fibers with many sarcomeres in series, allowing it to contract over large distances. In contrast, BFlh and SM, as pennate muscles with a substantial cross-sectional area, are essential for high torque production. They conclude that medial and lateral hamstrings each have one muscle primarily responsible for high-excursion movements predominantly through the knee joint and one muscle for hightorque particularly in the hip joint.43 Their suggestion is substantiated by a review of this possiblity.28 This partially accounts for the greater activity of the BFlh in hip-dominant exercises but it does not apply to the NHE which is proven many times to be a ST-favoring exercise,23,24,27,36,44 although there are studies that did not find significant activity differences between BFlh and ST.19,21 A study which examined NHE and “stiff-leg deadlift” reported greater BFlh than ST activity for NHE which supports the presented results.45 However, the muscle of greatest activity greatly varied between individuals. This is consistent with another
study whose results indicate that hamstring activity cannot be solely based on joint dominance.46 The BFlh/ST activity ratio of the latter also showed large individual variability, suggesting individual neural strategies for the activation of these muscles in running and sprinting as well as exercises. Great interindividual variability in muscle activity-dominance was the case for this study’s results but does not add to the explanation of why mean ratios were all in favor of BFlh.
ST is selectively more active when a high shortening capacity and speed is required (preferably in combination). BFlh seems to have a certain affinity with hip movements, also due to the longer lever arm.14,28 The selected exercises in the current study all utilize small ranges of motion at short muscle length with the rocker additionally demanding high torque levels. This could account for the consistent observation of BFlh/ST ratios exceeding 1 in the examined hip-dominant exercises. However, the limited range of motion alone does not provide a sufficient explanation for this ratio in the context of the NHE. Next to the possibility of BFsh crosstalk, execution type of NHE can be a possible reason as it alters the activity magnitude and pattern.36 In the present procedure, shank level was adjusted for the exercise to be technically correct for three repetitions, ensuring no signs of early loss of control. Consequently, NHE starting position was at an average knee flexion angle of 81.5° (CI: 65.1°;98.0°). This reduction in range and absence of a breakpoint may alter the contribution ratio over one and may be further supported by two studies who found that ST activity is greater during the initial movement and relative BFlh activity progressively increases towards full knee extension.37,47 This study’s findings of NHE execution variation add evidence to the already stated suggestion that full ROM without loss of control could improve BFlh selectivity in NHE.
It should be noted that the use of single surface EMG gives an estimate of only one area of the muscle and is prone to crosstalk.48 Additionally, muscle activity does not always correlate to peak muscle forces, requiring the need to make assumptions in the absence of peak muscle force data. Lastly to control load as an effect modifier, the authors decided to adjust the intensity of those exercise where it was possible. In doing so, load became a potential source of error because the effort to standardize load may have altered the kinetics of the rocker and the NHE between subjects which in turn potentially increased variability of angle values and possibly muscle activation.
The outcomes of this study are intended to provide insights for practitioners, therapists, and researchers exploring sprint-specific alternatives to the NHE. The authors found alternatives that elicit the same or greater activity in hamstrings and can be used in different training states reaching as far back as early therapy stages. Based on the findings, it
seems advisable when utilizing the NHE to do so in its full ROM to improve BFlh selectivity and to combine hip- and knee-dominant exercises to extensively target both hamstrings.
Despite finding high activity for both hamstrings and especially BFlh, there is presently no evidence that advocates that training using these exercises causes sprint-specific adaptations in the muscles, let alone reduces risk for HMI. For that, it will be necessary to investigate whether closed kinetic chain hip-dominant exercises improve horizontal force production and further if they impact known risk factors for HMI.
This study presented EMG data that shows that the three hip-dominant exercises exert high amounts of hamstring
muscle activity that reaches and even surpasses those seen during the NHE. Additionally, GMax activity played a leading role in hip extension whereby hamstring selectivity of the exercises is still uncertain. The hip and knee flexion angles of peak muscle activity do partly correspond with treadmill high-speed running. Elongation stress being below zero for all examined exercises poses the possibility for adaptations of hamstring muscles at an unfavorable angle. Nevertheless, the authors suggest that further analysis of the closed kinetic chain hip-dominant exercises and their possible upside of exerting high amounts of hamstring muscle activity be undertaken.
Submitted: November 17, 2023 CDT, Accepted: March 17, 2024 CDT
© The Author(s)This is an open-access article distributed under the terms of the Creative Commons Attribution 4.0 International License (CCBY-NC-4.0). View this license’s legal deed at https://creativecommons.org/licenses/by-nc/4.0 and legal code at https://creativecommons.org/licenses/by-nc/4.0/legalcode for more information.
1. Brooks JHM, Fuller CW, Kemp SPT, Reddin DB. Incidence, risk, and prevention of hamstring muscle injuries in professional rugby union. Am J Sports Med. 2006;34(8):1297-1306. doi:10.1177/ 0363546505286022
2. Schache AG, Dorn TW, Blanch PD, Brown NAT, Pandy MG. Mechanics of the human hamstring muscles during sprinting. Med Sci Sports Exerc 2012;44(4):647-658. doi:10.1249/ mss.0b013e318236a3d2
3. Guex K, Gojanovic B, Millet GP Influence of hipflexion angle on hamstrings isokinetic activity in sprinters. J Athl Train 2012;47(4):390-395. doi:10.4085/1062-6050-47.4.04
4. Chavarro-Nieto C, Beaven M, Gill N, Hébert-Losier K. Hamstrings injury incidence, risk factors, and prevention in Rugby Union players: a systematic review. Phys Sportsmed. 2021;51(1):1-19. doi:10.1080/ 00913847.2021.1992601
5. Forsythe B, Knapik DM, Crawford MD, et al. Incidence of injury for professional soccer players in the United States: A 6-year prospective study of Major League Soccer Orthop J Sports Med 2022;10(3):23259671211055136. doi:10.1177/ 23259671211055136
6. Ekstrand J, Bengtsson H, Waldén M, Davison M, Khan KM, Hägglund M. Hamstring injury rates have increased during recent seasons and now constitute 24% of all injuries in men’s professional football: the UEFA Elite Club Injury Study from 2001/02 to 2021/ 22. Br J Sports Med 2022;57(5):292-298. doi:10.1136/ bjsports-2021-105407
7. Okoroha KR, Conte S, Makhni EC, et al. Hamstring injury trends in Major and Minor League Baseball: Epidemiological findings from the Major League Baseball health and injury tracking system. Orthop J Sports Med 2019;7(7):2325967119861064. doi:10.1177/2325967119861064
8. Edouard P, Branco P, Alonso JM. Muscle injury is the principal injury type and hamstring muscle injury is the first injury diagnosis during top-level international athletics championships between 2007 and 2015. Br J Sports Med 2016;50(10):619-630. doi:10.1136/bjsports-2015-095559
9. Yu B, Queen RM, Abbey AN, Liu Y, Moorman CT, Garrett WE. Hamstring muscle kinematics and activation during overground sprinting. J Biomech 2008;41(15):3121-3126. doi:10.1016/ j.jbiomech.2008.09.005
10. Kenneally-Dabrowski CJB, Brown NAT, Lai AKM, Perriman D, Spratford W, Serpell BG. Late swing or early stance? A narrative review of hamstring injury mechanisms during high-speed running. Scand J Med Sci Sports 2019;29(8):1083-1091. doi:10.1111/ sms.13437
11. Chumanov ES, Heiderscheit BC, Thelen DG. Hamstring musculotendon dynamics during stance and swing phases of high-speed running. Med Sci Sports Exerc 2011;43(3):525-532. doi:10.1249/ mss.0b013e3181f23fe8
12. Chumanov ES, Schache AG, Heiderscheit BC, Thelen DG. Hamstrings are most susceptible to injury during the late swing phase of sprinting. Br J Sports Med. 2011;46(2):90. doi:10.1136/ bjsports-2011-090176
13. Grange S, Reurink G, Nguyen AQ, et al. Location of hamstring injuries based on magnetic resonance imaging: A systematic review Sports Health 2022;15(1):111-123. doi:10.1177/19417381211071010
14. Thelen DG, Chumanov ES, Hoerth DM, et al. Hamstring muscle kinematics during treadmill sprinting. Med Sci Sports Exerc 2005;37(1):108-114. doi:10.1249/01.mss.0000150078.79120.c8
15. Schuermans J, Van Tiggelen D, Danneels L, Witvrouw E. Biceps femoris and semitendinosus—teammates or competitors? New insights into hamstring injury mechanisms in male football players: a muscle functional MRI study Br J Sports Med. 2014;48(22):1599-1606. doi:10.1136/ bjsports-2014-094017
16. Al Attar WSA, Soomro N, Sinclair PJ, Pappas E, Sanders RH. Effect of injury prevention programs that include the Nordic hamstring exercise on hamstring injury rates in soccer players: a systematic review and meta-analysis. Sports Med. 2016;47(5):907-916. doi:10.1007/s40279-016-0638-2
17 van Dyk N, Behan FP, Whiteley R. Including the Nordic hamstring exercise in injury prevention programmes halves the rate of hamstring injuries: a systematic review and meta-analysis of 8459 athletes. Br J Sports Med. 2019;53(21):1362-1370. doi:10.1136/ bjsports-2018-100045
18. Almeida MO, Maher CG, Saragiotto BT Prevention programmes including Nordic exercises to prevent hamstring injuries in football players (PEDro synthesis). Br J Sports Med 2018;52(13):877-878. doi:10.1136/bjsports-2017-098862
19. Krommes K, Jakobsen MD, Bandholm T, et al. Cross-sectional study of EMG and EMG rise during fast and slow hamstring exercises. Int J Sports Phys Ther. 2021;16(4):1033-1042. doi:10.26603/001c.25364
20. Guruhan S, Kafa N, Ecemis ZB, Guzel NA. Muscle activation differences during eccentric hamstring exercises. Sports Health 2020;13(2):181-186. doi:10.1177/1941738120938649
21. Ferri-Caruana A, Mollà-Casanova S, BaquedanoMoreno M, Serra-Añó P Electromyographic activity of posterior kinetic chain muscles during hamstring strengthening exercises. Phys Ther Sport 2022;55:205-210. doi:10.1016/j.ptsp.2022.04.008
22. Guex K, Millet GP. Conceptual framework for strengthening exercises to prevent hamstring strains. Sports Med 2013;43(12):1207-1215. doi:10.1007/ s40279-013-0097-y
23. van den Tillaar R, Solheim JAB, Bencke J. Comparison of hamstring muscle activation during high-speed running and various hamstring strengthening exercises. Intl J Sports Phys Ther 2017;12(5):718-727 doi:10.26603/ijspt20170718
24. Prince C, Morin JB, Mendiguchia J, et al. Sprint specificity of isolated hamstring-strengthening exercises in terms of muscle activity and force production. Front Sports Act Living. 2021;2:609636. doi:10.3389/fspor.2020.609636
25. Malliaropoulos N, Panagiotis T, Jurdan M, et al. Muscle and intensity based hamstring exercise classification in elite female track and field athletes: implications for exercise selection during rehabilitation. Open Access J Sports Med. 2015;6:209. doi:10.2147/oajsm.s79189
26. Hegyi A, Péter A, Finni T, Cronin NJ. Regiondependent hamstrings activity in Nordic hamstring exercise and stiff-leg deadlift defined with highdensity electromyography Scand J Med Sci Sports 2017;28(3):992-1000. doi:10.1111/sms.13016
27. Bourne MN, Williams MD, Opar DA, Al Najjar A, Kerr GK, Shield AJ. Impact of exercise selection on hamstring muscle activation. Br J Sports Med. 2016;51(13):1021-1028. doi:10.1136/ bjsports-2015-095739
28. Bourne MN, Timmins RG, Opar DA, et al. An evidence-based framework for strengthening exercises to prevent hamstring injury Sports Med 2017;48(2):251-267. doi:10.1007/s40279-017-0796-x
29. Albertus-Kajee Y, Tucker R, Derman W, Lamberts RP, Lambert MI. Alternative methods of normalising EMG during running. J Electromyogr Kinesiol 2011;21(4):579-586. doi:10.1016/j.jelekin.2011.03.009
30. Hegyi A, Goncalves BAM, Finni T, Cronin NJ. Individual region- and muscle-specific hamstring activity at different running speeds. Med Sci Sports Exerc. 2019;51(11):2274-2285. doi:10.1249/ mss.0000000000002060
31. Borg G. Borg’s Perceived Exertion and Pain Scales Human kinetics; 1998.
32. Klein-Vogelbach S. Ballgymnastik Zur Funktionellen Bewegungslehre Springer Berlin Heidelberg; 1985. doi:10.1007/978-3-662-05975-3
33. Kadaba MP, Ramakrishnan HK, Wootten ME. Measurement of lower extremity kinematics during level walking. J Orthop Res 1990;8(3):383-392. doi:10.1002/jor.1100080310
34. Jakobsen MD, Sundstrup E, Andersen CH, Persson R, Zebis MK, Andersen LL. Effectiveness of hamstring knee rehabilitation exercise performed in training machine vs. elastic resistance: electromyography evaluation study Am J Phys Med Rehabil 2014;93(4):320-327. doi:10.1097/ phm.0000000000000043
35. Pinto R, Cadore E, Correa C, et al. Relationship between workload and neuromuscular activity in the bench press exercise. Med Sport 2013;17(1):1-6. doi:10.5604/17342260.1041876
36. Šarabon N, Marušič J, Marković G, Kozinc Ž. Kinematic and electromyographic analysis of variations in Nordic hamstring exercise. PLoS One 2019;14(10):e0223437. doi:10.1371/ journal.pone.0223437
37 Hegyi A, Lahti J, Giacomo JP, Gerus P, Cronin NJ, Morin JB. Impact of hip flexion angle on unilateral and bilateral Nordic hamstring exercise torque and high-density electromyography activity J Orthop Sports Phys Ther. 2019;49(8):584-592. doi:10.2519/ jospt.2019.8801
38. Frigo C, Shiavi R. Applications in movement and gait analysis. Electromyography: Physiology, engineering, and noninvasive applications. Published online July 12, 2004:381-401. doi:10.1002/ 0471678384.ch15
39. Shiavi R, Bugle HJ, Limbird T. Electromyographic gait assessment, Part 1: Adult EMG profiles and walking speed. J Rehabil Res Dev 1987;24(2):13-23.
40. Dorn TW, Schache AG, Pandy MG. Muscular strategy shift in human running: dependence of running speed on hip and ankle muscle performance. J Exp Biol. 2012;215(11):1944-1956. doi:10.1242/ jeb.064527
41. Higashihara A, Nagano Y, Ono T, Fukubayashi T Relationship between the peak time of hamstring stretch and activation during sprinting. Eur J Sport Sci. 2014;16(1):36-41. doi:10.1080/ 17461391.2014.973913
42. Timmins RG, Shield AJ, Williams MD, Lorenzen C, Opar DA. Architectural adaptations of muscle to training and injury: a narrative review outlining the contributions by fascicle length, pennation angle and muscle thickness. Br J Sports Med. 2016;50(23):1467-1472. doi:10.1136/ bjsports-2015-094881
43. Ono T, Higashihara A, Fukubayashi T Hamstring functions during hip-extension exercise assessed with electromyography and magnetic resonance imaging. Res Sports Med. 2010;19(1):42-52. doi:10.1080/15438627.2011.535769
44. Messer DJ, Bourne MN, Williams MD, Al Najjar A, Shield AJ. Hamstring muscle use in women during hip extension and the Nordic hamstring exercise: A functional magnetic resonance imaging study J Orthop Sports Phys Ther. 2018;48(8):607-612. doi:10.2519/jospt.2018.7748
45. Boyer A, Hug F, Avrillon S, Lacourpaille L. Individual differences in the distribution of activation among the hamstring muscle heads during stiff-leg Deadlift and Nordic hamstring exercises. J Sports Sci. 2021;39(16):1830-1837 doi:10.1080/ 02640414.2021.1899405
46. Hegyi A, Csala D, Péter A, Finni T, Cronin NJ. High-density electromyography activity in various hamstring exercises. Scand J Med Sci Sports 2018;29(1):34-43. doi:10.1111/sms.13303
47. Soga T, Nishiumi D, Furusho A, Akiyama K, Hirose N. Effect of different slopes of the lower leg during the Nordic hamstring exercise on hamstring electromyography activity. J Sports Sci Med. 2021;20(2):216-221. doi:10.52082/jssm.2021.216
48. Hermens HJ, Freriks B, Disselhorst-Klug C, Rau G. Development of recommendations for SEMG sensors and sensor placement procedures. J Electromyogr Kinesiol 2000;10(5):361-374. doi:10.1016/ s1050-6411(00)00027-4
Whetstone KS, Matsel KA, Patton AS, Gehres SE, Schwartzkopf-Phifer K. Reliability and Validity of Visual Estimation in Determining Thorax Rotation Mobility using the Quadruped Lumbar-Locked Position. IJSPT. Published online May 1, 2024:581-590. doi:10.26603/001c.116154
1a ,
Kyle A Matsel1 ,
Andrew S Patton2 ,
Sarah E Gehres2 , Kate Schwartzkopf-Phifer11 Physical Therapy, University of Evansville, 2 Rehabilitation and Performance Institute
Keywords: lumbar-locked, thoracic spine, visual estimation, reliability https://doi.org/10.26603/001c.116154
Background
Thoracic rotation mobility is crucial for athletes in rotational sports such as baseball, golf, and swimming to maintain the proper biomechanics associated with the sport. Accurate differentiation between normal mobility and active and passive physiological deficits in the thoracic region is critical for identifying the need for intervention to the thorax.
Purpose
To establish the reliability and discriminant validity of visual estimation of thorax rotation range of motion across clinicians of differing experience levels in determining normal mobility and active or passive physiological deficits when utilizing the quadruped lumbar-locked position.
Study Design
Cross-sectional
Methods
Thirty-eight subjects (21 female, 17 male) with a mean age of 27 years ± 6.67 were assessed with the quadruped lumbar-locked thorax rotation test by three examiners with various clinical experience in real-time and again one week later Bilateral active and passive lumbar-locked thorax rotation mobility was assessed by all raters and categorized as “Unrestricted” (≥50°) or “Restricted” (<50°) while a research assistant simultaneously measured the motion with a digital inclinometer All raters were blinded to the results. All results were analyzed for intra-rater reliability and agreement.
Results
Test-retest intra-rater reliability ranged from 0.55-0.72 and percent absolute agreement ranged from 0.82-0.89. Inter-rater reliability ranged from 0.45-0.59 while percent absolute agreement between raters ranged from 0.74-0.84. There was a significant difference in range of motion between “Unrestricted” and “Restricted” categories for both active (Unrestricted=54.6-58.9; Restricted=40.4-44.4; p<0.001) and passive motion (Unrestricted=61.3-63.5; Restricted=39.2-39.7; p<0.001). The only interaction effect was for passive left rotation [Rater A Restricted x =34.3(30.4-38.2); Rater C Restricted (x ) =43.8(41.3-46.4); p=.000].
Corresponding Author:
Email: kl68@evansville.edu a
Katie Whetstone, PT, DPT, SCS University of Evansville 515 Bob Jones Way Evansville, IN 47708
Phone: (812) 488-2549
The quadruped lumbar-locked thorax rotation test demonstrates moderate to substantial test-retest intra-rater and inter-rater reliability regardless of clinical experience. The quadruped lumbar-locked thorax rotation test can accurately discriminate between individuals with active and passive physiological deficits regardless of rater experience using visual estimation.
Level of Evidence
3b
Functional thoracic spine mobility is crucial for normal components of daily living such as reaching arms overhead and turning to look behind oneself, but is even more critical in rotational sports such as baseball, golf, and swimming where loss of normal thoracic mobility can increase risk for injury and diminish performance.1‑5 Impairments involving the thorax have been linked to musculoskeletal pathologies in both the axial and appendicular regions of the body, including dysfunctions in the upper and lower extremities.6‑9 Many of the established clinical practice recommendations for the treatment of pain in the neck, low back, shoulder, and even elbow include interventions that address movement dysfunctions and mobility restrictions within the thoracic spine.6‑8,10‑12 Because knowledge regarding the impact of thoracic function on regional pathologies is growing, especially in athletic populations, and due to the frequent utilization of interventions that address the thorax (consisting of the thoracic vertebrae, ribs, sternum, thoracic viscera, and muscles attaching in and acting on the region), it is important for clinicians to be able to quickly and reliably assess isolated range of motion (ROM) of the thoracic region.
A multitude of reliable ROM measurement procedures exist that attempt to reduce the contribution of the lumbar spine when quantifying thoracic mobility.13‑15 Of these known measurements for the thoracic region, none claim to isolate the movement of the thoracic spine from the lumbar spine during spinal rotation other than the quadruped lumbar-locked position.14,15 The quadruped lumbar-locked position utilizes maximal hip and lumbar spine flexion to “lock” these regions from potential contribution to the thorax rotation motion.14 Researchers have suggested that the lumbar-locked thorax rotation testing method results in a more accurate representation of isolated thoracic spine rotation ROM by minimizing the confounding contributions from adjacent joints.14 Additionally, the quadruped lumbar-locked position has demonstrated good intertester (ICC = 0.87), intratester (ICC = 0.87-0.90) and test-retest (ICC = 0.88-0.90) reliability when using a bubble inclinometer placed at the T1-2 vertebral level.14
While obtaining a reliable numerical measurement with a device is crucial in quantifying clinical progress, it may not be necessary when testing for gross passive and active physiological deficits in the thorax. Previous authors have noted the accuracy and clinical importance of visual measurements for joints such as the proximal interphalangeal and metacarpophalangeal joints of the hand, and radio-
carpal joint of the wrist.16,17 Visual measurements can aid clinicians in efficient assessment strategies which can maximize time dedicated to implementation of interventions. However, the reliability and validity of a visual estimation of thoracic rotation ROM using the quadruped lumbarlocked position is unknown. Establishing the reliability and validity of visual estimation for the quadruped lumbarlocked thorax rotation test could greatly improve its utilization in the clinical setting but also in sideline assessments or pre-participation exams for athletes where time is often limited. Therefore, the purpose of this study was to establish the reliability and discriminant validity of visual estimation of thorax rotation range of motion across clinicians of differing experience levels in determining normal mobility and active or passive physiological deficits when utilizing the quadruped lumbar-locked position.
Because accurate measurement of range of motion and interpretation of findings is an entry level skill for the physical therapist, it is crucial that physical therapy students and clinicians alike are capable of reliably assessing for mobility deficits in all regions of the body Therefore, it was hypothesized that an expert clinician, orthopedic physical therapy resident, and physical therapy student would demonstrate “good” inter-rater reliability (k=0.40-0.59) when identifying normal mobility, and active and passive deficits in thoracic rotation. It was hypothesized that subjects identified with active and/or passive physiological restrictions would have lower ROM values compared to subjects with normal mobility.
STUDY DESIGN
A prospective cross-sectional design was used to establish the reliability and validity of the visual estimation of the lumbar-locked thorax rotation test among raters of differing experience levels. The study was approved by the Institutional Review Board at the University of Evansville and informed consent was read and signed by all subjects prior to data collection.
A minimum sample size of 24 subjects was needed to detect a kappa value of >0.40 for a two-tailed test with an alpha level of significance equal to 0.05 and 80% power A total of 38 individuals (21 female, 17 male) volunteered to participate in the study Subjects included were active adults recruited from the University of Evansville campus and sur-
rounding community Inclusion criteria consisted of an active lifestyle defined by the American Heart Association as someone who engages in “at least 150 minutes of moderate intensity aerobic exercise or 75 minutes of vigorous aerobic exercise per week”,18 and an age between 18 and 50 years old. Exclusion criteria consisted of any of the following: current pain, history of spinal surgery with permanent spinal hardware, and inability to get into the starting position for the quadruped lumbar-locked thorax rotation test. Subjects were screened for their ability to get into the starting position in a separate room by a research assistant prior to testing. Subjects were not provided further training regarding the test prior to data collection.
The raters included an expert rater (rater A), an orthopedic residency-trained physical therapist (rater B), and a student physical therapist (rater C). Rater A was a licensed physical therapist with a board certification in sports and 12 years of clinical experience. Rater B was a licensed physical therapist who recently completed a residency program specializing in orthopedics with two years of clinical experience. Rater C was a student physical therapist in the second year of a three-year Doctor of Physical Therapy program who had completed one 8-week clinical experience in an outpatient orthopedic clinical setting. Each rater had consistently used the quadruped lumbar-locked thorax rotation test in clinical practice prior to the study
The raters and research assistants completed a training session one week prior to data collection in order to review the standard testing position, stabilization contact points, and planned order of operations as well as to ensure that the tester could stay blind to the measurement device throughout testing. Additionally, research assistants who were involved in measuring thoracic rotation ROM using the digital inclinometers performed a palpation and measurement skills check-off with the expert rater. The purpose of the skills check off was to ensure the research assistant’s ability to palpate the T1-2 interspinous space by counting down from C7 while the participant was in the quadruped position. Further, the training session allowed each research assistant to calibrate their inclinometer device to the horizontal and the vertical which permitted each research assistant to correctly identify the axis for the zero start and ending positions using the digital inclinometer
The order in which subjects were evaluated by each rater was randomized prior to data collection. At the assigned rater station, subjects assumed the starting position for the quadruped lumbar-locked thoracic rotation test in the manner previously described by Johnson et al.14 and Bucke et al.15 of quadruped with hips and knees in full flexion, and elbows and forearms resting on the plinth in front of knees (Figure 1a). The testing position for the quadruped lumbar-locked thoracic rotation test was altered from that described by Johnson et al.14 and Bucke et al.15 by having the subjects place the dorsum of the testing-side hand on the sacrum (Figure 1b) before rotating the test side thorax up toward the ceiling (Figure 1c) in the direction of thoracic rotation. Subjects were cued by raters to stay within the
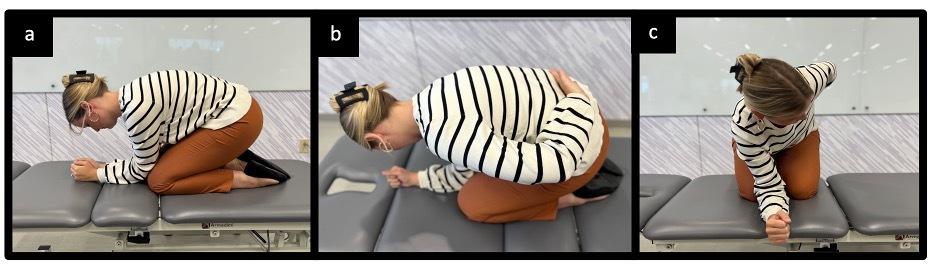
Starting position is quadruped on a plinth with hips and knees in full flexion and elbows resting in front of knees. (1b) The dorsum of the subject’s hand is placed on the sacrum. (1c) Subject actively rotates the test side up toward the ceiling.
imaginary “tunnel” of their body from the starting position in order to avoid side bending of the trunk during the testing motion. Raters observed the active motion of the subject and categorized his or her performance as “Unrestricted” (visually observed 50 degrees thoracic rotation or greater) or “Restricted” (visually observed less than 50 degrees thoracic rotation), while a research assistant simultaneously measured the motion with the Apple iPhone “Measure” application (iPhone© is a trademark of Apple Inc, Cupertino, CA, USA) placed horizontally at T1-2 (Figure 2). This Unrestricted/Restricted criterion was selected based on the previously established normative values for isolated thoracic spine rotation motion.13‑15 The rater was blinded to the digital measurement obtained by the research assistant. To obtain a measurement of passive motion, the rater placed the palm of one hand on the anterior aspect of the participant’s shoulder on the side being tested and provided gentle, passive movement in the direction of thoracic rotation up toward the ceiling to the first level of resistance while stabilizing the participant’s opposite shoulder and pelvis (Figures 3a and 3b). The rater categorized the performance as “Unrestricted” or “Restricted” while a research assistant simultaneously measured the passive motion with a digital inclinometer (Apple iPhone “Measure” application) placed horizontally at T1-2 and kept the rater blind to the measurement (Figures 3c and 3d). All testing procedures were performed twice on both the right and left sides and the average of two trials per side were used for data analysis. After completing all measurements with the first rater, the subject repeated the same procedures with the remaining two raters. This process was repeated following a one week washout period in order to capture intrarater and test-retest reliability
Descriptive statistics including means and standard deviations were calculated for all subjects. Intra and inter-rater reliability for all categorical variables were compared between each rater (rater A vs. rater B, rater A vs. rater C, rater B vs. rater C) using a weighted Cohen’s kappa statistic with 95% confidence intervals and percent absolute agreement. Cohen’s kappa statistic quantifies the strength of agreement and was interpreted as: ≤0.40 = poor to slight, 0.41-0.60 = moderate, 0.61-0.80 = substantial, ≥0.80 = ex-
Figure 1. Lumbar-Locked Thorax Rotation Test: (1a)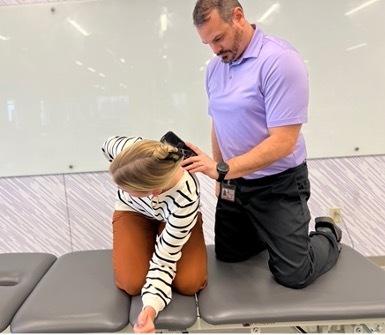
Figure 2. Quadruped Lumbar-Locked Active Thorax Rotation Measurement. Raters observed the active motion of the subject from a cephalocaudal direction and categorized as “Unrestricted” or “Restricted”, while a research assistant simultaneously measured the motion with a digital inclinometer placed horizontally at T1-2.
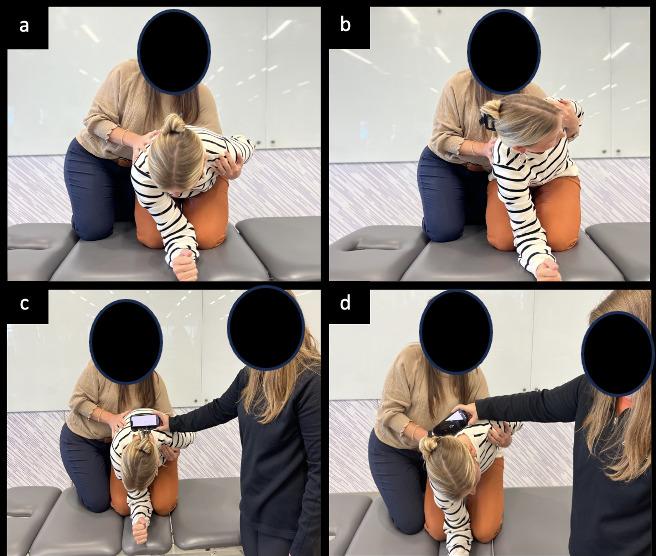
Figure 3. Lumbar-Locked Passive Thorax Rotation measurement. a) start position, b) end position, c) start position with measurement, d) end position with measurement.
cellent.19 Secondary outcomes include lumbar-locked thoracic rotation measurements on a continuous scale using a digital inclinometer In order to determine discriminate validity, a two-way analysis of variance (ANOVA) with three levels was performed to determine main effects between rater (A, B, and C) and category by comparing the rater’s interpretation of mobility using a previously established threshold of 50 degrees or greater of thoracic rotation (categorized as Unrestricted or Restricted) to a range of motion
measurement obtained with a digital inclinometer Interaction effects were evaluated to determine if differences existed between test performance category (Unrestricted or Restricted) and rater experience level (expert, resident, student). All data were analyzed using SPSS statistical software (IBM SPSS Statistics for Windows, Version 24.0). Tests were considered statistically significant if they did not exceed an alpha level of p < 0.05.
Demographic characteristics of the participating subjects are summarized in Table 1. Significant differences in height (p=0.01) and weight (p=0.01) were noted between male and female subjects. No significant difference in age (p=0.16) was observed. All 38 subjects completed the testing procedures, and the results were included in the data analysis.
Results of test-retest intra-rater reliability following a oneweek washout period within all three raters are presented in Table 2, including corresponding Cohen’s kappa values with 95% confidence intervals and percent agreement. Weighted Cohen’s kappa coefficient for test-retest intrarater reliability demonstrated “moderate to substantial” agreement and ranged from 0.55 to 0.72. Percent absolute agreement ranged from 0.82 to 0.89. The expert rater (rater A) demonstrated the highest level of intra-rater reliability followed by the orthopedic resident (rater B) and finally the PT student (rater C).
Results of inter-rater reliability with Cohen’s kappa values, 95% confidence intervals, and percent absolute agreement are presented in Table 3. Cohen kappa values ranged from 0.45 to 0.59 demonstrating “moderate” agreement between all three raters. Percent absolute agreement between raters ranged from 0.74 to 0.84. Overall agreement was the highest between raters with the greatest clinical experience.
Results for the assessment of discriminant validity using a Two-way ANOVA with three levels are presented in Table 4 Interaction effects were evaluated to determine if dif-
* y = years, in = inches, lbs. pounds
** Indicates a statistically significant association
ferences existed between test performance category (Unrestricted or Restricted) and rater experience level (expert, resident, student) which would allow the researchers to determine if experience level affected the rater’s interpretation of the test. If a significant interaction was not present, then main effects and the mean differences were examined. Two-way ANOVA identified a main effect of category, indicating a significant difference in inclinometer measurements between “Unrestricted” and “Restricted” categories for both active (Unrestricted=54.6-58.9; Restricted=40.4-44.4; p<0.001) and passive measurements (Unrestricted=61.3-63.5; Restricted=39.2-39.7; p<0.001). The only interaction effect present that showed a difference in performance category between raters of different experience levels was for passive left rotation [rater A Restricted =34.3(30.4-38.2); rater C Restricted =43.8(41.3-46.4); p<0.001; (Table 5)].
The overarching aim of this study was to establish the reliability and discriminant validity of visual estimation of thorax rotation ROM in the quadruped lumbar-locked position. While several reliable methods for measuring thoracic spine rotation ROM exist, no study to date has established the reliability or validity of utilizing visual estimation in the quadruped lumbar-locked position to test for active and passive physiological deficits of thorax rotation mo-
tion. The results of this study support the primary hypothesis indicating that visual estimation of thoracic rotation ROM in the quadruped lumbar-locked position has “moderate to substantial” test-retest intra-rater reliability and “moderate” inter-rater reliability, regardless of clinician level of experience. Consistency among these measures, despite level of expertise, enhances communication amongst clinicians and further validates the therapist’s ability to differentiate between mobility impairments and deficits in strength or neuromuscular control of the thorax.
Similar to previous research, the current study utilized a population of young, healthy individuals and attempted to limit compensatory lumbar motion by positioning the hips, knees, and lumbar spine into full flexion. The lumbarlocked position utilized in the current study was adapted from the positions used by Bucke et al.15 and Johnson et al.14 with both studies using minor positional differences of the upper extremity. Despite minor differences, the results of the current study are consistent with all previous research, which have demonstrated “good” reliability when assessing isolated thoracic rotation motion utilizing the lumbar-locked position.
Unlike previous studies that utilized a measurement tool such as a bubble inclinometer,13,14 universal goniometer,13 or iPhone application15 in determining thoracic spine rotation ROM, this study established the reliability and validity of visual estimation to test isolated thoracic rotation active and passive physiological deficits. Due to its established re-
Table 2. Test-Retest Reliability of the Lumbar-Locked Thorax Rotation Test (n=38)
Table 3. Inter-Rater Reliability of the Lumbar-Locked Thorax Rotation Test
liability and validity in previous studies the Apple iPhone “Measure” application was used as the gold standard in this study to compare ROM measurements to Unrestricted/Restricted criteria when establishing the validity of the test.20 It is interesting to note that in the current study the range for differentiating active Unrestricted/Restricted categories (Unrestricted =54.6 to 58.9, Restricted=40.4 to 44.4) were narrower than the passive Unrestricted/Restricted categories (Unrestricted=61.3 to 63.5, Restricted=39.2 to 39.7).
Given that the quadruped lumbar-locked starting position allows the acromion processes to align horizontally, and that the ending position for typical thoracic rotation is approximately half-way between the horizontal and the vertical, visual estimation of this motion of the thoracic spine may be easier to assess actively. This may be due to the therapist’s position during the test as the therapist is able to examine the transverse plane motion from a cephalocaudal position relative to the subject. Though the range
Table 4. Two-Way ANOVA for Thoracic Spine Measurements – Main Effects
Active Right
Active Left
Passive Right
* SD = Standard Deviation
** Indicates a statistically significant association
Table 5. Two-Way ANOVA for Thoracic Spine Measurements – Interaction Effects
* SD = Standard Deviation
** Indicates a statistically significant association
differed for active motion compared to passive, the performance among raters was similar. Because subjects were performing several series of measurements within a session, the current study attempted to control for carryover effects through randomization of testing order at each rater station. Additionally, only two trials of all testing procedures were performed per side at each rater station in an effort to limit subject fatigue as well as to limit testing effects.
Comparing the agreement of clinical tests among clinicians with various experience levels is a common method for assessing the level of expertise needed to obtain accurate results. Previous studies have not utilized a consistent experience level of raters when establishing reliability of the quadruped lumbar-locked thoracic rotation test. Common methodologies in these studies have used expert clinicians14,15 while others utilized students20 which left the establishment of inter-rater reliability between experience levels of therapists when determining thoracic mobility yet to be explored. Due to the frequent use of students and novice clinicians, such as residents, at pre-participation sports physicals and injury screening events, it is crucial for clinicians at all experience levels to be able to reliably perform field expedient testing such as the quadruped lumbar-locked thorax rotation test in order to identify mobility and neuromuscular impairments. To the authors’ knowledge, this is the first study to compare raters of various experience levels (expert, resident, and student) to establish test-retest intra-rater and inter-rater reliability for visually estimating thorax rotation. The current study found “moderate to substantial” agreement between raters across multiple levels of experience. The clinical implications of this finding are very encouraging as a student physical therapist can assess thoracic rotation ROM similarly to an expert clinician.
Similar to the current study, previous researchers have reported greater intra-rater reliability among clinicians with greater experience when testing the weight-bearing lunge test for ankle dorsiflexion20 and the Functional Movement Screen™.21 While the test-retest and inter-rater reliability of the expert rater (rater A) was consistently higher than that of the student physical therapist (rater C) in the current study, all clinicians were found to have almost perfect agreement on test-retest, and all had moderate inter-rater reliability. The higher reliability of the expert rater (rater A) is likely due to the rater’s ability to determine Unrestricted/Restricted in a narrower range of mobility based on means and standard deviations compared to the more novice raters. A study by Glaws et al21 reported similar findings when establishing intra-rater reliability of the Selective Functional Movement Assessment (SFMA™), which includes the lumbar-locked thorax rotation test. When using criterion checklists, the rater with the greatest experience also had the highest reliability21 This should give confidence to all clinicians utilizing the lumbar-locked thorax rotation test in determining thoracic mobility deficits, though novice clinicians may need to use a more precise measure such as an inclinometer to quantify
the available ROM when assessing patients who are demonstrating mobility near restricted ranges.
Though reliability was consistently high for all levels of experience, an interaction effect between rater and category in left passive rotation was found indicating that there was a distinction between raters of differing experience levels when rating left passive rotation only The mean ROM for participants in the Restricted category was 34.33 (+/5.00) for rater C, while the mean ROM for participants in the Restricted category was 43.85 (+/-9.7) for rater A. This interaction effect was not present in any other measure, and as such, the cause is not well-understood. More research is needed to determine the source of this effect and its implications for clinicians. Additionally, future research should investigate the cause of active physiological deficits in thoracic rotation compared to passive physiological deficits as well as determine appropriate interventions for the respective deficit.
Impairments in mobility and neuromuscular control of the thorax have significant implications for athletes across many sports as well as for clinicians treating a multitude of pathologies in the upper quarter and spine. Therefore, it is important for clinicians to have an expedient method to assess for mobility or neuromuscular loss in the thoracic region. If clinicians can quickly and reliably identify a mobility restriction in a patient’s thoracic region, then they may accurately and efficiently determine the need for an intervention. Additionally, a field expedient test for thoracic mobility deficits may be better utilized in the athletic population during sideline assessments, pre-participation exams, and injury risk assessments due to its timeliness and efficiency Finally, utilizing a visual estimation of thoracic rotation during pre-treatment and post-treatment assessments may allow the therapist to quickly determine the effectiveness of the intervention within the same day
As with all studies, some limitations should be acknowledged. First, the sample recruited for this study does not reflect the population to whom these techniques are often applied. This sample was relatively young, with a mean age of 27 years-old, and no subject was experiencing musculoskeletal pain. Although this specific population demographic maximizes homogeneity, the results may not be generalizable to other age groups and or to individuals in current pain. Second, specific information regarding the subjects’ activity levels, sport participation, and hand dominance were not collected. Doing so may have provided insight into observed asymmetries in thoracic mobility Thirdly, scapulothoracic joint mobility was not measured or controlled for in this study with positional or active stabilization of the scapula which could have led to participant compensation during the test motion such as excessive scapular retraction in place of spinal rotation. Additionally, this study did not control for learning effects as the same subjects participated in both sessions that occurred one week apart; however, to control variability, subjects were tested by raters in a random order at both sessions. Further, to reduce variability in technique, all research as-
sistants completed a hands-on one-hour training session facilitated and supervised by the expert rater. Research assistants who were involved in measuring thoracic rotation ROM using the digital inclinometers performed a palpation and measurement skills check-off and were obtained approval from the expert rater (KW). Finally, this study only utilized three testers, one representing each experience level from student to resident to expert, and all testers were graduates from the same physical therapy program where the quadruped lumbar-lumbar thorax rotation test is taught within the program. Due to these therapists being similarly trained, the results may not be representative of all physical therapists.
Visual estimation of thorax rotation ROM using the quadruped lumbar-locked position is a reliable and valid method in determining normal mobility as well as active and passive physiological deficits of thoracic rotation. Novice and expert clinicians can confidently perform this
method to test for rotational mobility deficits in the thorax to expedite the examination and test-retest process.
The authors report no conflict of interest.
The authors of this study would like to thank Dr Suzanne Leach and the University of Evansville Doctor of Physical Students Parker Rose, Kourtney West, Kyle Patton, Lauren Rennie, Jamie Vance, and McKenzie Goebel for their assistance with the study organization and data collection.
Submitted: November 04, 2023 CDT, Accepted: February 29, 2024 CDT
© The Author(s)
This is an open-access article distributed under the terms of the Creative Commons Attribution 4.0 International License (CCBY-NC-4.0). View this license’s legal deed at https://creativecommons.org/licenses/by-nc/4.0 and legal code at https://creativecommons.org/licenses/by-nc/4.0/legalcode for more information.
1. Johnson KD, Grindstaff TL. Thoracic rotation measurement techniques: clinical commentary N Am J Sports Phys Ther. 2010;5(4):252-256.
2. Feijen S, Kuppens K, Tate A, Baert I, Struyf T, Struyf F. Intra- and interrater reliability of the ‘lumbar-locked thoracic rotation test’ in competitive swimmers ages 10 through 18 years. Phys Ther Sport 2018;32:140-144. doi:10.1016/j.ptsp.2018.04.012
3. Winters E, Doty S, Lott M, Baker J.
Neuromechanical integration of pelvic-thoracic rotation among youth baseball throwers. Sports Med Int Open. 2022;6(1):E47-E52. doi:10.1055/ a-1854-1007
4. Sakata J, Nakamura E, Suzuki T, et al. Throwing injuries in youth baseball players: Can a prevention program help? A randomized controlled trial. Am J Sports Med 2019;47(11):2709-2716. doi:10.1177/ 0363546519861378
5. Myers J, Lephart S, Tsai YS, Sell T, Smoliga J, Jolly J. The role of upper torso and pelvis rotation in driving performance during the golf swing. J Sports Sci 2008;26(2):181-188. doi:10.1080/ 02640410701373543
6. Sueki DG, Cleland JA, Wainner RS. A regional interdependence model of musculoskeletal dysfunction: research, mechanisms, and clinical implications. J Man Manip Ther. 2013;21(2):90-102. doi:10.1179/2042618612y.0000000027
7 Heneghan NR, Rushton A. Understanding why the thoracic region is the ‘Cinderella’ region of the spine. Man Ther. 2016;21:274-276. doi:10.1016/ j.math.2015.06.010
8. McDevitt A, Young J, Mintken P, Cleland J. Regional interdependence and manual therapy directed at the thoracic spine. J Man Manip Ther 2015;23(3):139-146. doi:10.1179/ 2042618615y.0000000005
9. Berglund KM, Persson BH, Denison E. Prevalence of pain and dysfunction in the cervical and thoracic spine in persons with and without lateral elbow pain. Man Ther 2008;13(4):295-299. doi:10.1016/ j.math.2007.01.015
10. Suzuki K, Akasaka K, Otsudo T, et al. Effects of functional movement screen training in high-school baseball players: A randomized controlled clinical trial. Medicine. 2021;100(14):e25423. doi:10.1097/ md.0000000000025423
11. Masaracchio M, Kirker K, States R, Hanney WJ, Liu X, Kolber M. Thoracic spine manipulation for the management of mechanical neck pain: A systematic review and meta-analysis. PLoS ONE 2019;14(2):e0211877 doi:10.1371/ journal.pone.0211877
12. Childs JD, Cleland JA, Elliott JM, et al. Neck pain: Clinical practice guidelines linked to the international classification of functioning, disability, and health from the orthopedic section of the american physical therapy association. J Orthop Sports Phys Ther. 2008;38(9):A1-A34. doi:10.2519/ jospt.2008.0303
13. Norkin CC, White DJ. Measurement of Joint Motion. A Guide to Goniometry. 4th ed. F.A. Davis Company; 2009.
14. Johnson KD, Kim KM, Yu BK, Saliba SA, Grindstaff TL. Reliability of thoracic spine rotation range-ofmotion measurements in healthy adults. J Athl Train 2012;47(1):52-60. doi:10.4085/1062-6050-47.1.52
15. Bucke J, Spencer S, Fawcett L, Sonvico L, Rushton A, Heneghan NR. Validity of the digital inclinometer and iphone when measuring thoracic spine rotation. J Athl Train. 2017;52(9):820-825. doi:10.4085/ 1062-6050-52.6.05
16. Lee HH, St. Louis K, Fowler JR. Accuracy and reliability of visual inspection and smartphone applications for measuring finger range of motion. Orthopedics 2018;41(2):e217-e221. doi:10.3928/ 01477447-20180103-02
17. McVeigh KH, Murray PM, Heckman MG, Rawal B, Peterson JJ. Accuracy and validity of goniometer and visual assessments of angular joint positions of the hand and wrist. J Hand Surg Am. 2016;41(4):e21-e35. doi:10.1016/j.jhsa.2015.12.014
18. Benjamin EJ, Virani SS, Callaway CW, et al. Heart disease and stroke statistics—2018 update: A report from the american heart association. Circulation 2018;137(12):e67-e492. doi:10.1161/ cir.0000000000000558
19. Portney LG, Watkins MD Foundations of Clinical Research: Applications to Practice 3rd ed. F.A Davis Company; 2015.
20. Furness J, Schram B, Cox AJ, Anderson SL, Keogh J. Reliability and concurrent validity of the iPhone® Compass application to measure thoracic rotation range of motion (ROM) in healthy participants. PeerJ. 2018;6:e4431. doi:10.7717/peerj.4431
Reliability and Validity of Visual Estimation in Determining Thorax Rotation Mobility using the Quadruped…
21. Glaws KR, Juneau CM, Becker LC, Di Stasi SL, Hewett TE. Intra- and inter-rater reliability of the selective functional movement assessment (sfma). Int J Sports Phys Ther. 2014;9(2):195-207.
1,2a ,
Melanie I Stuckey3
1 Physical Therapy, Samuel Merritt University, 2 Artletic Science, 3 Centre de recherche, d'innovation et de transfert en arts du cirque, École nationale de cirque
Keywords: acrobat, fitness, strength, flexibility, performing arts https://doi.org/10.26603/001c.116332
Background
Established norms for fitness and performance measures are lacking in circus arts. These would assist healthcare professionals and coaches to screen for readiness to participate in training or performance, determine post-injury return to performance, and develop targeted conditioning programs.
Purpose
The purpose of this research was to establish norms for trunk and extremity physical exam and performance measures in circus artists by professional status, assigned sex at birth (ASAB), and age.
Study Design
Descriptive laboratory study
Methods
Circus artists (n=201; ages 13-69y; 172 females ASAB, 29 males ASAB) from 10 cities across the United States underwent a baseline physical examination including shoulder, hip and trunk measures of passive (PROM) and active (AROM) range of motion, measures of flexibility (shoulder and hip), strength (manual muscle tests, grip strength), cardiovascular fitness (3 minute-step test), balance (single limb and handstand), and performance, (pull-ups, and the closed kinetic chain upper extremity stability test [CKCUEST]). ANOVAs were used to determine between group differences by age and T-tests to discern differences by ASAB or professional status.
Results
Differences existed by professional status for shoulder external rotation PROM, hip PROM, hip flexibility, shoulder and abdominal strength, and cardiovascular fitness. Sex differences were seen in active scapular upward rotation, hip and shoulder PROM and flexibility, hip and grip strength, and for functional performance measures (pull-ups, CKCUEST). Differences by age were limited to active scapular upward rotation, shoulder PROM, flexibility and strength, cardiovascular fitness, and balance. Overall, professionals outperformed pre-professionals for lower abdominal strength, pull-ups, handstand balance, cardiovascular fitness, hamstring, and straddle flexibility Generally, males ASAB demonstrated greater shoulder flexibility and upper body functional strength while females ASAB had greater hip and lumbar flexibility and hip strength. No measures showed consistent declines with increasing age, though some showed differences between adolescents and adults.
Corresponding author: Stephanie Greenspan Artletic Science, 785 7th Street, Oakland, CA, 94607, fax: 1-510-244-0571, email: sgreenspan@samuelmerritt.edu
These normative values for physical characteristics and functional performance in pre-professional and professional circus artists may be used to guide screening for readiness to participate in advanced training or performance, return to performance after injury, and the development of targeted strength and conditioning programs.
Contemporary circus arts integrate artistry with acrobatics requiring high levels of athleticism to express a story or wow an audience. While individual circus disciplines and artistic styles have specific physical requirements including flexibility for contortion and muscle power for tumbling, advanced circus arts practice generally requires balance, strength, flexibility, and coordination beyond that of the general population.1‑3 Circus arts disciplines have been classified into eight subgroups with similar physical demands to facilitate the study of injury patterns and development of prevention strategies.4,5 The five acrobatic subgroups can be combined into aerial (e.g. trapeze and pole) and ground (e.g. handbalancing, trampoline, and tumbling) categories.4,5 Established norms are needed for measures of fitness and performance to guide screening for readiness to participate in advanced training or performance, postinjury return to performance, and the development of targeted conditioning programs.
Circus arts are practiced across a variety of recreational to professional contexts and by individuals of all ages, with adults ages 55y and up accounting for 11% of circus arts students in the United States (U.S.),6 different from acrobatic sports like gymnastics where participation typically spans from early childhood to early adulthood.7 In a recent survey including 197 U.S. circus educational organizations, 43% had a youth troupe, 29% an adult troupe, 22% a professional program, and 20% a residency program.6 In preprofessional and professional circus training programs students participate in group training sessions, discipline specific classes, and additional independent training several days a week, as well as program specific shows. Preprofessionals without access to a structured program often create a similar training schedule to prepare themselves to perform in student or community shows. Although some U.S. professionals work for large companies with resident or touring shows that run year-round,3 many are considered freelance artists hired on individual contracts for theatrical shows, corporate events, nightclub, or other venue entertainment, or by smaller companies producing limited engagement shows.8 These different contexts likely have different fitness demands that could be important to consider when screening readiness to participate or designing preparatory conditioning or rehabilitation programs.
Two recent studies examined physical characteristics in different circus artist populations. One found that shoulder active range of motion (AROM) and strength were greater in circus artists compared to the general population.9 They also found acrobats training both aerial and ground acro-
batics had greater shoulder flexion and extension AROM versus those that trained only ground or aerial, suggesting that there are discipline specific physical demands.9 However, participants were only required to train aerial and/ or ground acrobatics two hours per month, which may not meet the threshold for physiological adaptations. A small study in recreational aerialists found that VO2max was similar to collegiate dancers but lower than gymnasts, pullup and grip strength was lower than gymnasts, whereas hamstring flexibility with a sit-and-reach test was higher in the aerialists than both other groups.10 While these studies provide initial insight, more extensive study of physical characteristics is needed with a broad sample of circus practitioners.
Normative data would be useful to inform programming for prevention and management of injuries, which can require the modification or cessation of circus training and performance, negatively impacting the artist’s mental or physical health and work status. For pre-professional and professional circus artists, injuries were most common to the shoulder (22%), lumbosacral (13%), elbow (10%), wrist (8%), and hip/groin (7%).11 No differences in injury frequency per body region were found between groups by professional status, age, or assigned sex at birth (ASAB).2 To provide optimal care, healthcare professionals should have knowledge about typical injuries in circus, the discipline specific physical demands and norms for physical exam and performance measures as they may differ from the general population, other athletes, or performing artists.10
There are specific guidelines in dance,12 gymnastics,13, 14 and Olympic sports15 but not in circus arts for screening participants prior to participation to detect health conditions or physical characteristics that might increase risk for injury or illness. This type of screening can help identify intrinsic risk factors, for example, a shoulder internal rotation mobility deficit is associated with upper extremity injury in overhead athletes,16 and muscle flexibility and low or high generalized joint mobility for musculoskeletal injury in elite modern dancers.17 Determining norms for physical characteristics in circus arts and the relationship with injury risk can inform screening guidelines and assist healthcare professionals and coaches to implement targeted interventions to reduce injury risk and enhance performance. Characteristics of different circus populations should be established so, like in sport talent identification,18 physical readiness for advanced levels of participation in circus arts such as an intensive training program or high-demand professional contract, or the need for interventions to enhance readiness can be identified.
Dance19 and sport20,21 also have reference standards in guidelines to ensure safe return to participation following injury The lack of similar standards in circus arts may result in healthcare professionals providing inadequate physical preparation for return to participation, potentially reducing performance or increasing the risk of re-injury. The purpose of this study was to establish norms for trunk and extremity physical exam and performance measures in circus artists by professional status, ASAB, and age. The authors hypothesized that the professionals and artists assigned male at birth (AMAB) would perform better on strength and performance measures, artists assigned female at birth (AFAB) on flexibility measures, and that joint range of motion (ROM) and strength would decrease with age.
This descriptive study was a secondary analysis of a prospective, observational cohort study.11 Rolling enrollment occurred September - December 2018 (four facilities) and September 2019 - January 2020 (six facilities). This included completion of informed consent/assent forms and an intake questionnaire for demographics, training, and medical history, followed by an examination with the physical therapist (PT) assigned to the facility PTs had at least five years of orthopedic or sports-related experience and underwent standardized training with the lead investigator (SG), including a study protocol review and practice of the examination procedures. To ensure standardization, each study PT and SG individually performed all baseline physical examination tests/measures on a single participant. Their results were compared and for any discrepancies the procedure was reviewed to ensure proficiency.
The Samuel Merritt University Internal Review Board approved this study (SMUIRB#18-021).
Ten circus training facilities across the U.S. were selected as host sites based on the size of the eligible target population, presence of long-term intensive training programs, and willingness to assist with study recruitment. Participants were recruited through the host facilities, other local circus businesses, social media, and the American Circus Educators newsletter Eligible participants included preprofessional circus artists training ≥ 6 hours a week and performing in ≥ 2 shows per year, and self-identified professional circus artists over age 13 years, able to read/comprehend English and fulfill the requirements of the study Participants with ongoing injuries were not excluded. A power analysis determined that 200 was an adequate sample size for a medium-to-large (.25-.50) effect size with p-value .05.
All 201 participants (ages 13-69 years; n=172 AFAB; n=29 AMAB) underwent a physical examination by a study PT assigned to the host facility Participants were identified
by ASAB for analysis due to a low number identifying as non-binary (n=8, ages 24-36 years, six pre-professionals and two professionals). Additional demographic information was previously published.11 Physical examination measures included height, mass, shoulder, hip, and lumbar ROM, shoulder and hip flexibility, accelerated three minute-step test, shoulder, abdominal, and hip manual muscle testing (MMT), and grip dynamometry Functional tests including single limb and handstand balance, closed kinetic chain upper extremity stability (CKCUEST) test, and pull-ups. Extremity measures were performed bilaterally. Appendices 1 and 2 provide detailed procedures for each testing procedure. Findings were recorded with a secure online survey form in Qualtrics. If participants were unable to perform a test due to an injury, the test was excluded for that participant.
Descriptive statistics were conducted using Microsoft Excel 365 (version 2211, Redmond, WA) for baseline intake data. IBM SPSS Statistics (version 26; Armonk, NY) was used to analyze physical examination data with significance set at p <.05. Both parametric and non-parametric analyses were conducted. ANOVAs were used to determine between group differences by age (participants 50y or above were excluded due to the small sample, n=9) and T-tests for differences by ASAB or professional status. Pearson Chi-Square analysis was used to determine differences in distribution of MMT scores. If participants were unable to perform a test due to pain or injury, the participant was excluded from analysis for that individual test. Reporting errors were also excluded from the analysis.
Height, t(197)=7.57, p <.001, and body mass, t(198)=6.62, p <0.001, were higher in participants AMAB compared to those AFAB (Table 1). Teen participants had lower body mass than those in their 30s (p <0.04).
Participants AFAB had greater active lumbar extension than those AMAB, t(196)=1.79, p <0.04 (Table 1). Average lumbar extension was highest in the teens and 20s then decreased. The difference was significant between 20s and 40s (p <0.024). Active lumbar flexion also decreased with age. Differences were significant between the teens compared to both 20s (p <0.048) and 30s (p <0.047). Though average flexion was less in the 40s group there was no significant difference due to overlapping variances.
Participants AMAB had greater left active scapular upward rotation AROM compared to those AFAB, t(198)=2.87, p <0.005 (Tables 2 and 3). Left scapular upward rotation was also higher in teens compared to both 20s (p <0.04) and 40s
Table 1. Non-sided physical examination and functional performance measures for all groups
Lumbar AROM flexion (°)
Lumbar AROM ext (°)
Straddle flexibility (°)
Accelerated step test 1-minute post-HR (bpm)
(p <0.04). Right scapular upward rotation showed a between group difference for age, F(3,189)=2.63, p <0.05, with teens significantly higher than all the other groups.
Shoulder passive range of motion (PROM) was greater for participants AFAB than those AMAB for left sided flexion, t(197)=1.90, p<0.03, for external rotation on the left, t(197)=2.08, p<0.04, and right, t(198)=2.14, p<0.033, and shoulder extension on the left, t(197)=2.41, p<0.017, and right, t(198)=2.14, p<0.034. Professionals had greater left passive shoulder external rotation than pre-professionals, t(197)=1.69, p<0.0046. Teens had greater passive shoulder flexion than other age groups on the left side F(3,188)=3.54, p<0.016. Both teens and 30s had greater left passive shoulder internal rotation than the 20s group, F(3,188)=3.2, p<0.025.
Participants AMAB had a higher left pec minor index,22 or greater pectoralis minor muscle length, than AFAB, t(197)=2.02, p<0.044 (Tables 2 and 3). Teens demonstrated greater latissimus dorsi length bilaterally than other age groups on both the left, F(3,189)=5.03, p<0.002 and right sides, F(3, 189)=0.24, p<0.001.
HIP PROM
Participants AFAB had greater passive hip flexion bilaterally, left, t(196)=3.47, p<0.001, and right, t(196)=3.46, p<0.001, and internal rotation, left, t(198)=2.93, p<0.004, and right, t(198)=3.29, p<0.001, whereas AMAB had greater passive hip external rotation, left, t(198)=2.44, p<0.016, and right, t(198)=3.07, p<0.002 (Tables 2 and 3). Pre-professionals had greater passive hip internal rotation bilaterally, left, t(198)=2.42, p<0.016, and right, t(198)=1.84, p<.033, 1-sided, and professionals has greater passive hip flexion bilaterally, left, t(196)=2.15, p<0.034, and right, t(196)=1.74, p<0.042. The only difference in hip ROM by age was for teens with greater left passive hip internal rotation, F(93,189)=3.79, p<0.011, than the other age groups.
HIP FLEXIBILITY
Professionals had greater bilateral hamstring, left, t(198)=2.16, p<0.016, and right, t(198)=2.06, p<0.02, and straddle flexibility, t(198)=4.03, p<0.001, than pre-professionals (Tables 1-3). AFAB had greater hamstring flexibility, left, t(198)=4.06, p<0.001, and right t(198)=4.74, <0.001, and straddle flexibility, t(198)=3.9, p<0.001, than those AMAB. No significant differences by age were found.
For right middle trapezius MMT, professionals had significantly more scores of normal (72%) than pre-professionals (58%), while pre-professionals had significantly more scores of good (33% vs. 23%), and fair (9% vs. 3%), X2 (3)=9.33, p<0.025 (Figures 1-3). For left lower trapezius MMT, significant differences included that the teens had more ratings of fair minus than 20s (32% vs. 6%), and rat-
ings of fair (21%) than the 20s (12%) or 40s (0%) groups. The 30s had more ratings of good (34%) than teens and 20s (16 and 28%). The 20s and 40s group had more ratings of normal (54 and 57%) compared to the 30s (42%) or teens (32%), X2 (9)=20.46, p<0.015. For right lower trapezius MMT, significant differences included teens with more ratings of fair minus than 20s, 30s, or 40s (33% vs. 5%; 7%; 8%), as well as more of fair (17%) than the 40s (4%). Participants ages 20-49y had more ratings of good (33-39%) than the teens (22%). Similarly, teens had less ratings of normal (28%) compared to 20s and 30s (41% and 45%), while the 40s had the most scores of normal (54%), X2 (9)=18.34, p<0.03.
There was a significant difference in left hip abduction strength such that AFAB had more scores of normal than AMAB (74% vs. 54%) and less scores of good (22 vs. 43%), X2 (2)=5.93, p<0.05 (Figures 1-3).
There was a significant difference in lower abdominal strength, t(198)=2.06, p<0.04, such that professionals performed better than pre-professionals (Table 1).
Participants AMAB performed significantly more pull-ups than those AFAB, t(196)=4.99, p<0.001, as did professionals compared to pre-professionals, t(196)=3.10, p<0.002 (Table 1).
Participants AMAB performed more repetitions in the CKCUEST, t(195)=2.57, p<0.011, than those AFAB (Table 1).
Maximal grip strength was greater bilaterally for participants’ AMAB versus AFAB, left, t(197)=6.30, p<0.001, and right, t(196)=7.38, p<0.001, even though there was a significant difference in variances by ASAB in left hand grip (p<0.001) (Tables 2 and 3).
Professionals had a lower recovery heart rate 1-minute post completion of the 3-minute accelerated step test than preprofessionals, t(197) – 1.67, p<0.05, 1-sided. Recovery heart rate for teens was also higher than other age groups F(3,188)=3,86, p<0.01 (Table 1).
There was a significant difference between age groups in left single limb balance with eyes closed, F (3,189)=2.74, p<0.044 (Tables 2 and 3). Balance was better for 20s versus 40s (left p<0.014; right p< 0.013) and 30s versus 40s (left
Table 2. Sided physical examination measures by professional status and sex at birth
Scapular upward rotation at rest (°)
Scapular upward rotation full elevation (°)
Scapular AROM upward rotation (°)
Shoulder
Shoulder PROM external rotation (°)
(8-74)
(5-68)
(2-70)
(12-64)
(5-74)
Latissimus dorsi flexibility (°)
Pec Minor Index
Max Grip Strength (kg)
(64-137)
Hip PROM external rotation (°)
Single limb stance - eyes closed (secs)
(13-58)
(16-58)
Table 3. Physical examination by side (left and right) measures by age group
Scapular upward rotation at rest (°)
Scapular upward rotation full elevation (°)
Scapular AROM upward rotation (°)
(10-70)
(5-68)
Shoulder PROM external rotation (°)
Shoulder PROM internal rotation (°)
(°)
Latissimus dorsi flexibility (°)
Pec Minor Index
Max Grip Strength (kg)
(84-127)
(43-87)
(35-76)
Hip PROM external
Hip PROM internal rotation (°)
Single limb stance - eyes closed (secs)
(14-42)
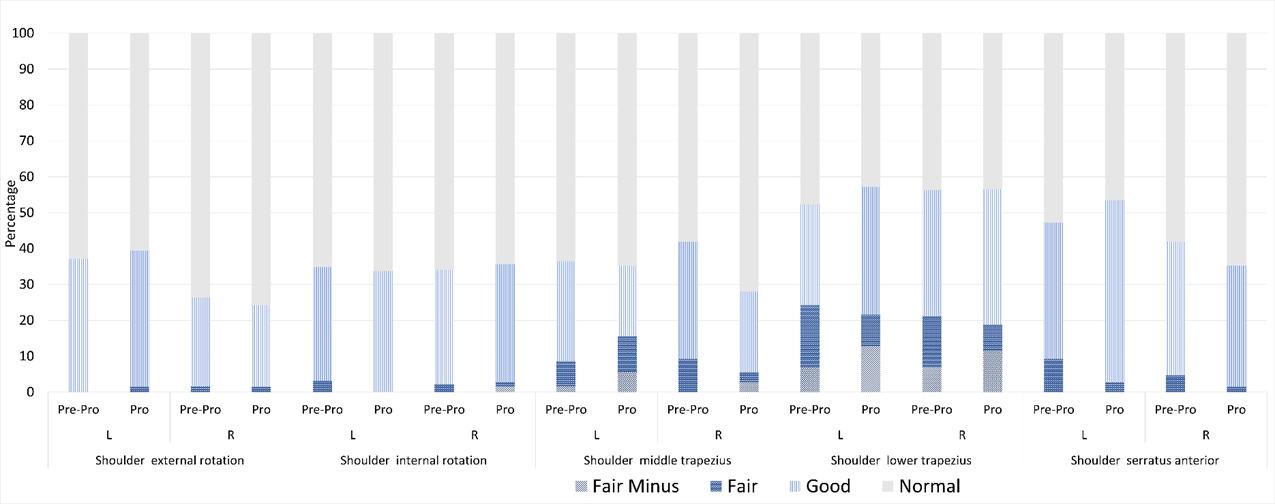
Each column represents the MMT performance in that group. Abbreviations: Pre-pro = pre-professional; Pro = professional. The light gray portion at the top of each column represents the percentage of participants in the group with normal strength. The categories below represent an increasing degree of weakness (good to fair minus). Preparation For Flight: The Physical Profile of Pre-Professional and Professional Circus Artists in the
Figure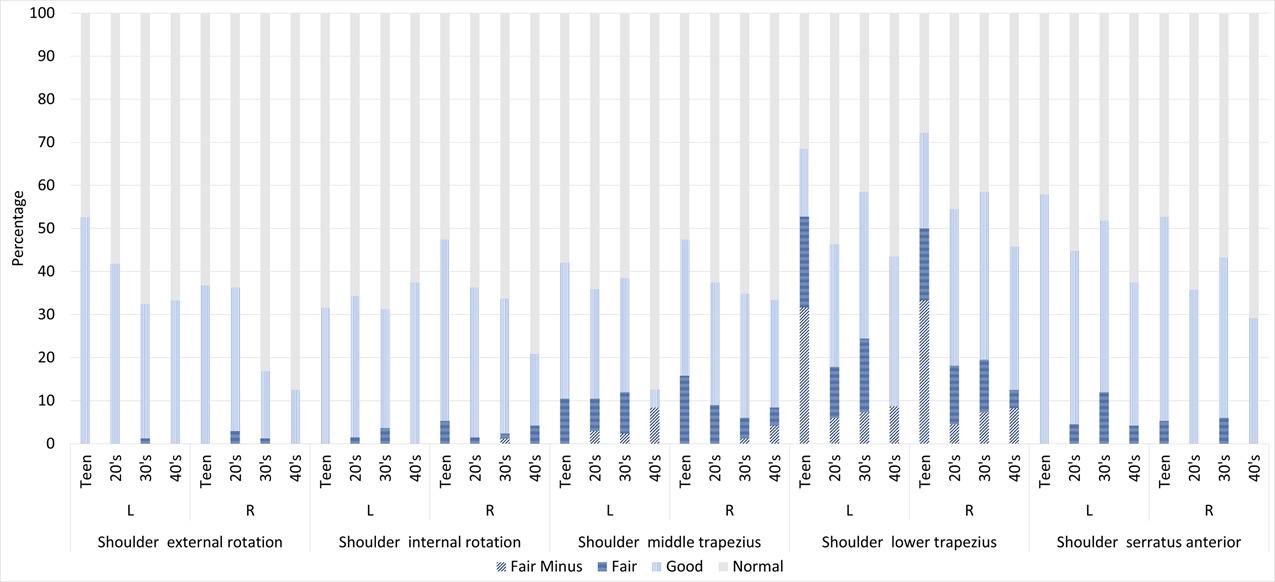
Each column represents the MMT performance in that group. The light gray portion at the top of each column represents the percentage of participants in the group with a normal strength. The categories below represent an increasing degree of weakness (good to fair minus).
Figure 2. Shoulder manual muscle testing scores by age groupEach column represents the MMT performance in that group. The light gray portion of the column represents the percentage of participants in the group with a normal strength. The categories below represent an increasing degree of weakness (good to fair minus). Preparation For Flight: The Physical Profile of Pre-Professional and Professional Circus Artists in the United States
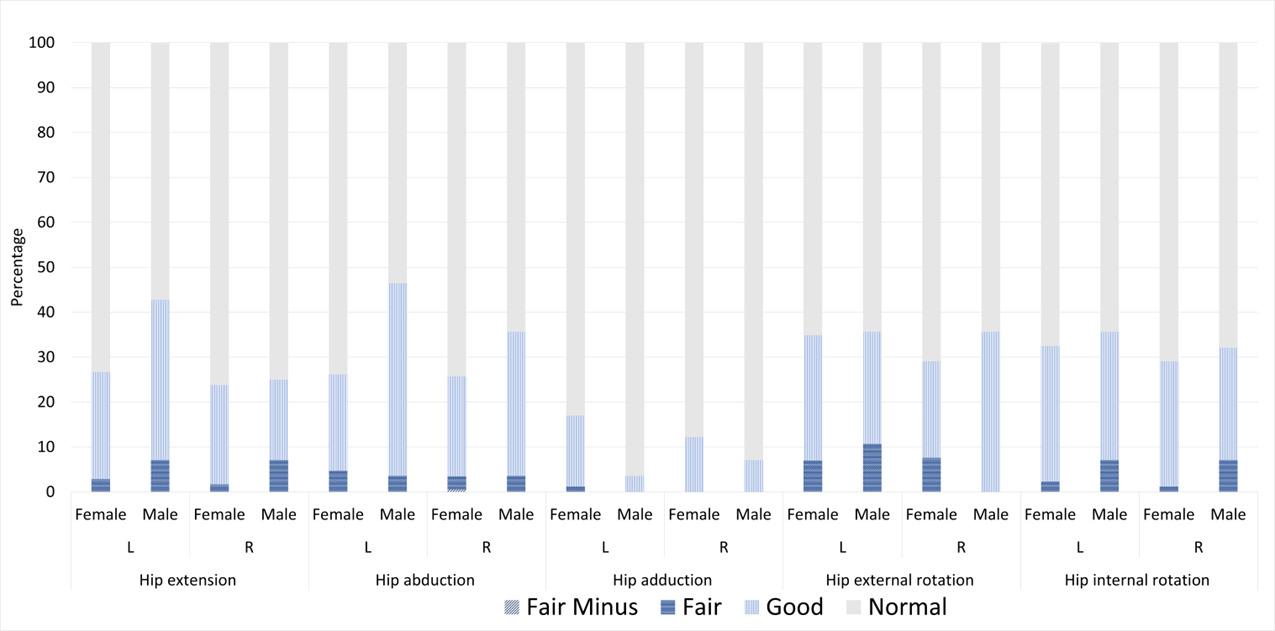 Figure 3. Hip manual muscle testing scores by sex at birth
p<0.052; right p<0.044). There was a significant difference in variance in handstand balance (p<0.015) by professional status, with professionals demonstrating longer handstand balance than pre-professionals, t(193)=1.86, p<0.04, 1-sided (Table 1).
No statistically significant differences were found in any of the physical examination or functional performance measures based on discipline exposure for six months prior to the physical examination characterized by aerial only (n=50), ground only (n=10), or both aerial and ground disciplines (n=135).
This research presents trunk and extremity physical exam and performance measures by professional status, ASAB, and age to establish norms for circus artists. It broadens the scope of current literature9,10 and strengthens the validity by having the physical examinations performed by experienced PTs with standardization training. In alignment with the hypothesis, professional artists performed better on functional and cardiovascular measures but also demonstrated greater mobility than pre-professional artists. Partially contradicting the hypotheses, artists AMAB tended to have greater upper extremity flexibility and functional strength, while artists AFAB tended to have greater lower extremity ROM and strength. Finally, contrary to the hypothesis, there was not an age-related decline in ROM.
Professionals outperformed pre-professionals on several measures including lower abdominal strength, pull-ups, handstand balance, and cardiovascular fitness (Table 1). In the year following the examination, professionals trained more than pre-professionals (9.27 vs 6.87 sessions/week).11 Training load for the period prior to testing was not collected and may have been very different since some training time was reduced due to the COVID-19 pandemic. However, average pull-ups in the pre-professional group (4.87+/-3.66) was similar to recreational aerialists who reported a similar training load (6 hr/week; 4.56+/-3.81 pullups),10 suggesting that training time may be a factor. Professionals demonstrated greater hamstring and straddle flexibility than pre-professionals despite both groups participating in a low number of flexibility-specific conditioning sessions (0.01 /week).11 Differences may be due to the content of the conditioning sessions or professionals may better integrate relevant exercises into skills-based training. Differences by professional status may demonstrate physiologic adaptations necessary for the performance demands of a professional career and could potentially be used as screening measures to assess preparedness for performance in professional companies or progression to professional status, but it may be context specific based on the demands of the show or professional company 11
As hypothesized, participants AMAB scored higher than AFAB on several upper extremity functional and strength tests including pull-ups, CKCUEST, and grip strength whereas participants AFAB demonstrated greater hip flexibility, lumbar extension, shoulder flexion, extension and external rotation AROM. Sex differences have been shown for similar measures in comparable athletic populations except lumbar mobility which has only been assessed in the general population.23‑26 Differences are likely due to physical sex differences, including the center of gravity location, combined with gender asymmetry in circus training, where boys and men tend to be encouraged toward strength and dynamic skills versus girls and women toward grace and flexibility.27 Women aerial artists in social circus have reported concerns about gaining strength and looking too masculine.28 Thus, it is possible that circus artists identifying as women may limit upper body training to maintain a more feminine aesthetic. More research is needed to explore associations between gender identity and bodily aesthetic ideals in various contexts, as pressures may differ for artists working, for example in theatrical, street, or corporate performances. With growing awareness of gender identity, gender may be challenged in circus, and there may be a shift away from gender-specific training making it important to regularly update normative data by sex and gender, as social views and practices change.
Contrary to the hypothesis, consistent declines in average strength or ROM by age were not apparent, though in some cases, teens were different from some or all categories of adults. Teens tended to have greater shoulder ROM and flexibility than adults, but also more middle and lower trapezius weakness, though differences between teens and each age group were not always significant. This suggests conditioning exercises for shoulder overhead function may be inadequate in younger circus artists, or that strength develops with longer participation. However, adults had on average only 1.19 years more experience than teens in this study.11 Age differences were also seen in lumbar flexion and extension with teens showing generally greater AROM compared to adults, though differences between teens and each adult age category were not always significant. In adults, aged 20-60+, lumbar mobility decreased with age, with extension more affected than flexion and what visually appears as the greatest declines between the 40-49y and 50-59y age groups.23 The 50y+ age group was excluded in the circus study analysis, potentially missing the expected decreases. Alternatively, the training effects of circus could mitigate normal age-related declines.
Considering that 10% of the U.S. circus student population were reportedly over 55 years of age,6 and circus artists up to 69 years of age have participated in American11 and international29 circus research, investigation of circus students and artists over age 50 appears warranted. In this study adults in the 40-49 age category scored lower on balance than both the 20-29 and 30-39 age groups. Similarly,
in the general population, there was a slight decrease in balance between the 18-39 and 40-49 age category with accelerated declines thereafter 30 Importantly, despite the decline, this population of circus artists scored higher on balance than the general population for both the 18-39 and 40-49 age categories.30 If this trend extends into the 50+ age categories of circus artists, it could mitigate fall risk in older adulthood. Participation in circus arts could have implications for healthy aging and warrants further investigation.
An interesting finding is that there were no differences in any physical exam or performance measures based on exposure to aerial and/or ground acrobatics six months prior to the examination (aerial, n=50; ground, n=10; both aerial and ground, n=135). This could be due to the large discrepancies in group size. However, a previous study with similarly skewed group sizes showed significant differences such that the “both aerial and ground” group had greater shoulder extension AROM than the ground only group and greater shoulder flexion PROM, flexion, and extension AROM than the aerial only group.9 It is possible that tracking exposure and breaking down the participants into smaller discipline subgroups4,5 would reveal different physiologic effects by discipline. While the biomechanical stresses of various disciplines have not been tested in artists bodies, forces on rigging points (where an apparatus is attached to a support structure) when artists are performing dynamic tricks, range from 2.5-7.3x body weight for nine different circus apparatuses.31 The materials and characteristics of different apparatuses may result in different impacts on artists’ bodies, requiring different bodily characteristics and training adaptations. Larger study populations will be needed for discipline-specific study and the common practice of cross-training multiple disciplines will add complexity to the analysis.
Several physical factors are considered particularly relevant to circus practice. Grip strength is important for object manipulation, gripping of an apparatus or a partner’s wrists or hands, sometimes holding full body weight, and often for prolonged time. Maximal isometric grip strength in this study (Table 3) was similar to a study of amateur to professional circus acrobats.9 Like the general population,32 AMAB participants in this study demonstrated greater grip strength than those AFAB (Table 2), although these findings are not consistent with another circus study.9 Interestingly, AMAB artists in both studies had lower isometric grip strength than the general population, while AFAB participants’ strength was similar (present study) or statistically higher9 than the general population. These findings are surprising due to the prevalent use of grip in circus arts practice. Interestingly, maximal grip strength of recreational female aerialists was 66% less than female gymnasts, though they had as little as six months of aerial training and their maximal grip strength was lower than
AFAB participants in this study 10 Collectively, these studies highlight the need to better understand the functional requirements of forearm and grip strength for circus, as it seems that similar sports, such as gymnastics, may not be relevant surrogates for this information. It may be useful to additionally establish norms for grip endurance with dynamometry, or with a task like a double or single arm hang for aerialists to have more functional relevance for circus arts.
Shoulder flexibility and scapular controlled mobility are beneficial to many circus disciplines including aerial disciplines, handbalancing, and tumbling. Decreased flexibility of the latissimus dorsi and pec minor can limit scapular upward rotation, external rotation, and posterior tilt.22,33, 34 Though average pec minor flexibility in all groups was above the threshold for a short muscle (pec minor index > 7.4435; Tables 2 and 3), artists AMAB demonstrated greater pec minor flexibility than artists AFAB, but it was significant only on the left. Teens had greater latissimus dorsi flexibility than other age groups. The AMAB and teens also had greater scapular upward rotation with active shoulder flexion compared to the AFAB or adult age groups respectively, though ASAB differences were only apparent on the left. The serratus anterior, upper and lower trapezius muscles upwardly rotate the scapula with shoulder elevation.36, 37 Interestingly, despite having more active scapular upward rotation a greater proportion of teens had ratings of fair or fair minus indicating significant weakness with lower trapezius MMT than adults, although these differences were not present for the serratus anterior Other research has shown that limitations in scapular upward rotation along with medial rotation and posterior tilt of the scapula have been shown to be present with subacromial impingement syndrome and shoulder instability.33 With the high prevalence of shoulder injuries in circus arts2,11 the influence of flexibility limitations and scapular muscle function should be further investigated to guide preventative strategies.
Overhead shoulder mobility, combining shoulder flexion and external rotation, is advantageous for many circus disciplines making it a focus of mobility training for many artists. Hypermobility for the shoulder joint is considered PROM flexion greater than 180° or 180° of combined internal and external rotation according to the Upper Limb Hypermobility Assessment Tool.38 Average shoulder flexion but not combined rotation across groups met the hypermobility criteria (Tables 2 and 3). However, similar to overhead athletes,39 average external rotation for all groups exceeded the norm of 90° for the general population. Therefore, shoulder mobility differences in the circus population may be due to adaptive changes from training and possibly also the higher prevalence of generalized joint hypermobility (34.5%) compared to the general population.11
There is no similar criterion for hip joint hypermobility but combined average internal and external hip rotation in this study was higher (AFAB 84°, AMAB 84°) than a study of college athletes across multiple sports (female 73°, male 70°).40 Similarly, both studies showed participants AFAB had greater passive hip internal rotation compared
to AMAB which could contribute to greater dynamic knee valgus, a risk factor for anterior cruciate ligament injuries and patellofemoral pain.40 Differently, in the athletes, average internal rotation was higher than external rotation40 whereas, the opposite was true in the circus artists. Hamstring muscle hyperflexibility, or flexibility that exceeds the normal ROM of 80° with the straight-leg raise hamstring length test,41 was the average for the AFAB and professional groups. Increased hamstring flexibility, like overhead shoulder mobility, is advantageous and a focus of flexibility training for many circus disciplines including, aerial, contortion, and handbalancing (to get the palms flat the floor with the legs straight), likely contributing to this finding.
Some of the study findings suggest that strength and conditioning practices could be improved for younger artists and pre-professionals (Figures 1-3). Shoulder weakness was more prevalent for teens for the lower trapezius muscles compared to adults, and the teens and twenties had more prevalent weakness of the right shoulder external rotators than the 30-40s. Pre-professionals had more prevalent weakness for the right middle trapezius than professionals. Weakness of these muscles are associated with various shoulder injuries42 and improving strength may improve shoulder mechanics especially with the high demand on the shoulder with many circus disciplines and the frequency of shoulder injuries.2,11 There were not similar findings for hip strength where weakness appeared less prevalent than for the shoulder. Although there wasn’t a relationship between shoulder weakness and overall injuries in the study, and injury risk is always multifactorial, a more focused study of the relationship between these factors and shoulder injuries may provide further insight. Based on the study findings, a focus on shoulder strength and conditioning programs is recommended for younger artists and pre-professionals. Future research should investigate the impact of shoulder conditioning on upper extremity injury risk.
Strengths of this study include the large sample of circus artists from across the United States with varied training practices. Multiple body regions were assessed with focus on those more commonly injured in circus artists, and a broad range of assessments including functional performance measures were performed. The CKUEST was tested with knees off the ground for both sexes making it make more valid comparison between these groups and demonstrating that circus artists AFAB may not be adequately challenged using the standard method with females having knees on the ground.43,44
Limitations include the small samples of adolescents (n=16) due to recruitment challenges in this population, and participants AMAB (n=29) which seems to reflect U.S. circus demographics.6,9 Only handedness and not limb domi-
nance was determined, so extremity measures were not reported by dominant and non-dominant side; however, limb dominance may be challenging to determine in circus where, due to the asymmetry of certain skills, artists may have different “dominant” strengths and flexibilities for each limb (e.g. dominant pushing vs pulling arm, dominant hip flexor vs hamstring flexibility, etc). To reflect a typical circus population, participants were not excluded if they had a pre-existing injury possibly affecting performance on some tests/measures although tests were excluded if participants reported specific pain or limitations with a test due to injury The straddle flexibility, pull-ups on trapeze, and handstand balance tests were created by SG and standardized for the study but have not been validated; however, similar tests were createdtests were created specific to a gymnastics context.14 The CKCUEST was not adapted to height as has been recently recommended,45 possibly preventing one participant from performing it and limiting performance in others. Handheld dynamometry would have provided more precise data on muscle performance than traditional MMT, but adequate resources were not available. Handstand balance tests were stopped at 60 seconds, so peak performance was not captured in some participants, which may have limited the detection of differences in balance between groups. Pull-ups were performed on a trapeze bar but the rigging (single vs. double point) varied between facilities which may have affected pull-up performance and limited comparison to studies with a rigid pullup bar. To avoid contact between the inclinometers in individuals with very mobile lumbar extension, lumbar spine extension AROM was repeated twice, once with an inclinometer at the sacrum and again with the inclinometer at T12.
Normative studies across the diverse circus population are needed to strengthen the understanding of the variations in the physical profiles in circus artists by age, participation level, ASAB or gender identity, specific disciplines, and training or performance context. Larger populations are needed to see if deficits in physical exam or performance measures predict injury and if addressing deficits reduces injury risk. Longitudinal monitoring of training and physiological characteristics according to discipline subgroups4, 5 would also be useful to determine training adaptations, which could inform performance and injury prevention interventions.
This normative data generated in this study offers information regarding physical characteristics and performance in a group of pre-professional and professional circus artists. Differences were found by age, ASAB, and professional status. The physical profile of circus artists also differed from the general population and other athletes. The findings from this study can be used to guide screening for readiness to participate in advanced training or performance, return
to performance after injury, and the development of targeted strength and conditioning programs for circus artists.
This work was supported by the Samuel Merritt University FSGP Grant. (grant number 215111820)
CONFLICTS OF INTEREST
The authors report no conflicts of interest.
We are grateful to the 201 circus artists who participated, Sarah Tiffin for her role as study coordinator, Mary McCall and Robin Greenspan for assistance with data analysis. We are thankful for our host facilities AcroSports, Circadium, The Circus Project, Esh Circus Arts, Kinetic Arts Center, Kinetic Theory, MOTH, New England Center for Circus Arts, Sky Candy, and Versatile Arts. We would also like to acknowledge the study physical therapists Carol Bailey, Melissa Buffer-Trenouth, Michele Frances Benedisuk, Marisa Hentis, Traci Hurley, Greg Kowal, Emily Scherb, Tracey Wagner, and Pan Zhang.
Submitted: October 05, 2023 CDT, Accepted: February 29, 2024 CDT
© The Author(s)
This is an open-access article distributed under the terms of the Creative Commons Attribution 4.0 International License (CCBY-NC-4.0). View this license’s legal deed at https://creativecommons.org/licenses/by-nc/4.0 and legal code at https://creativecommons.org/licenses/by-nc/4.0/legalcode for more information.
1. Bailey A, MacMahon C. Exploring talent identification and recruitment at circus arts training and performance organizations. High Ability Studies. 2018;29(2):213-240. doi:10.1080/ 13598139.2018.1518776
2. Munro D. Injury patterns and rates amongst students at the national institute of circus arts: an observational study Med Probl Perform Art 2014;29(4):235-240. doi:10.21091/mppa.2014.4046
3. Shrier I, Meeuwisse WH, Matheson GO, et al. Injury patterns and injury rates in the circus arts: an analysis of 5 years of data from Cirque du Soleil. Am J Sports Med 2009;37(6):1143-1149. doi:10.1177/ 0363546508331138
4. Greenspan S. Injury patterns in subgroups of circus artists by Circus discipline: a pilot study Orthop Phys Ther Pract 2022;34:162-170.
5. Greenspan S, Munro D, Nicholas J, Stubbe J, Stuckey MI, Van Rijn RM. Circus-specific extension of the International Olympic Committee 2020 consensus statement: methods for recording and reporting of epidemiological data on injury and illness in sport. BMJ Open Sport Exerc Med 2022;8(3):e001394. doi:10.1136/ bmjsem-2022-001394
6. American Circus Educators, American Youth Circus Organization. Circus census 2022 final report. Accessed July 17, 2023. https://www.americancircuseducators.org/wpcontent/uploads/2022/10/ACE-AYCO-Survey-FinalReport.pdf
7 Geurin-Eagleman AN. Online communities among international masters gymnastics participants: a uses and gratifications analysis. Int J Sport Communication. 2015;8(3):313-329. doi:10.1123/ijsc.2015-0045
8. American Circus Alliance. Circus survey 2022 final report. Accessed August 17, 2023. https://americancircusalliance.org/
9. Huberman C, Scales M, Vallabhajosula S. Shoulder range of motion and strength characteristics in circus acrobats. Med Probl Perform Art 2020;35(3):145-152. doi:10.21091/mppa.2020.3025
10. Ruggieri RM, Costa PB. Contralateral muscle imbalances and physiological profile of recreational aerial athletes. J Funct Morphol Kinesiol 2019;4(3):49. doi:10.3390/jfmk4030049
11. Greenspan S, Stuckey MI. Untangling risk factors including discipline-specific exposure for injuries in preprofessional and professional circus artists in the USA. BMJ Open Sport Exerc Med 2023;9(2):e001551. doi:10.1136/bmjsem-2023-001551
12. Dance/USA Task Force on Dancer Health. Annual Post-Hire Health Screen for Professional Dancers. Accessed July 17, 2023. https://www.danceusa.org/ tfodh-screening-project
13. Ling D, Sleeper M, Casey E. Identification of risk factors for injury in women’s collegiate gymnastics with the Gymnastics Functional Measurement Tool. PM R 2020;12(1):43-48. doi:10.1002/pmrj.12184
14. Sleeper MD, Kenyon LK, Elliott JM, Cheng MS. Measuring sport-specific physical abilities in male gymnasts: the men’s gymnastics functional measurement tool. Int J Sports Phys Ther 2016;11(7):1082-1100.
15. Ljungqvist A, Jenoure P, Engebretsen L, et al. The International Olympic Committee (IOC) Consensus Statement on periodic health evaluation of elite athletes March 2009. Br J Sports Med 2009;43(9):631-643. doi:10.1136/bjsm.2009.064394
16. Johnson JE, Fullmer JA, Nielsen CM, Johnson JK, Moorman CT III. Glenohumeral internal rotation deficit and injuries: a systematic review and metaanalysis. Orthop J Sports Med. 2018;6(5):2325967118773322. doi:10.1177/ 2325967118773322
17 Bronner S, Bauer NG. Risk factors for musculoskeletal injury in elite pre-professional modern dancers: a prospective cohort prognostic study. Phys Ther Sport. 2018;31:42-51. doi:10.1016/ j.ptsp.2018.01.008
18. Slater LV, Vriner M, Zapalo P, Arbour K, Hart JM. Difference in agility, strength, and flexibility in competitive figure skaters based on level of expertise and skating discipline. J Strength Cond Res 2016;30(12):3321-3328. doi:10.1519/ jsc.0000000000001452
19. Glasser L, Frey M, Frias GC, et al. Ballet rehabilitation: a novel return to sport protocol. Cureus. 2022;14(8):e27896. doi:10.7759/ cureus.27896xx
20. Michener LA, Abrams JS, Bliven KCH, et al. National Athletic Trainers’ Association Position Statement: Evaluation, management, and outcomes of and return-to- play criteria for overhead athletes with superior labral anterior-posterior injuries. J Athl Train 2018;53(3):209-229. doi:10.4085/ 1062-6050-59-16
21. Sweeney EA, Howell DR, James DA, Potter MN, Provance AJ. Returning to sport after gymnastics injuries. Curr Sports Med Rep. 2018;17(11):376-390. doi:10.1249/jsr.0000000000000533
22. Rosa DP, Borstad JD, Pires ED, Camargo PR. Reliability of measuring pectoralis minor muscle resting length in subjects with and without signs of shoulder impingement. Braz J Phys Ther 2016;20(2):176-183. doi:10.1590/bjpt-rbf.2014.0146
23. Van Herp G, Rowe P, Salter P, Paul JP. Threedimensional lumbar spinal kinematics: a study of range of movement in 100 healthy subjects aged 20 to 60+ years. Rheumatology. 2000;39(12):1337-1340. doi:10.1093/rheumatology/39.12.1337
24. Taylor JB, Wright AA, Smoliga JM, DePew JT, Hegedus EJ. Upper-extremity physical-performance tests in college athletes. J Sport Rehabil 2016;25(2):146-154. doi:10.1123/jsr.2014-0296
25. Smetanka RG, Armenta RF, Nessler JA, Newcomer SC. Heart rate response, duration, grip strength, and anthropometric characteristics in recreational indoor rock climbers. J Strength Cond Res. 2022;36(3):832-837 doi:10.1519/ jsc.0000000000003540
26. Höög S, Andersson EP. Sex and age-group differences in strength, jump, speed, flexibility, and endurance performances of swedish elite gymnasts competing in TeamGym. Front Sports Act Living. 2021;3:653503. doi:10.3389/fspor.2021.653503
27 Funk A. Gender asymmetry and circus education. Performance Matters. 2018;4(1-2):19-35.
28. Watt C. Social circus in aerials: Female experience, muscularity, pain and trust. Theatre, Dance and Performance Training. 2022;13(1):136-152. doi:10.1080/19443927.2021.1968025
29. van Rens FE, Metse AP, Heritage B. Exploring the mental health of circus artists: circus factors, psychological resilience, and demographics predict disordered eating and exercise addictions. Psychology Sport Exercise. 2022;59:102-107. doi:10.1016/ j.psychsport.2021.102107
30. Springer BA, Marin R, Cyhan T, Roberts H, Gill NW. Normative values for the unipedal stance test with eyes open and closed. J Geriatr Phys Ther 2007;30(1):8-15. doi:10.1519/ 00139143-200704000-00003
31. Cossin M, Bergeron-Parenteau A, Ross A. Maximal dynamic forces exerted by acrobats on nine circus apparatuses. Circus: Arts, Life, and Sciences. 2022;1(1). doi:10.3998/circus.2776
32. Wong SL. Grip strength reference values for Canadians aged 6 to 79: Canadian Health Measures Survey, 2007 to 2013. Health Rep 2016;27(10):3-10.
33. Laudner KG, Williams JG. The relationship between latissimus dorsi stiffness and altered scapular kinematics among asymptomatic collegiate swimmers. Phys Ther Sport 2013;14(1):50-53. doi:10.1016/j.ptsp.2012.02.007
34. Sahrmann SA. Diagnosis and Treatment of Movement Impairment Syndromes Mosby; 2002:210-211.
35. Borstad JD, Ludewig PM. The effect of long versus short pectoralis minor resting length on scapular kinematics in healthy individuals. J Orthop Sports Phys Ther 2005;35(4):227-238. doi:10.2519/ jospt.2005.35.4.227
36. Castelein B, Cagnie B, Parlevliet T, Cools A. Serratus anterior or pectoralis minor: which muscle has the upper hand during protraction exercises? Man Ther. 2016;22:158-164. doi:10.1016/ j.math.2015.12.002
37 Turgut E, Duzgun I, Baltaci G. Effect of trapezius muscle strength on three-dimensional scapular kinematics. J Phys Ther Sci. 2016;28(6):1864-1867. doi:10.1589/jpts.28.1864
38. Nicholson LL, Chan C. The Upper Limb Hypermobility Assessment Tool: A novel validated measure of adult joint mobility Musculoskelet Sci Pract 2018;35:38-45. doi:10.1016/ j.msksp.2018.02.006
39. Borsa PA, Laudner KG, Sauers EL. Mobility and stability adaptations in the shoulder of the overhead athlete: a theoretical and evidence-based perspective. Sports Med 2008;38(1):17-36. doi:10.2165/ 00007256-200838010-00003
40. Hogg JA, Schmitz RJ, Nguyen AD, Shultz SJ. Passive hip range-of-motion values across sex and sport. J Athl Train 2018;53(6):560-567 doi:10.4085/ 1062-6050-426-16
41. Page P, Frank CC, Lardner R. Assessment and Treatment of Muscle Imbalance. The Janda Approach. Human Kinetics; 2010:97-98. doi:10.5040/ 9781718211445
42. Struyf F, Nijs J, Baeyens JP, Mottram S, Meeusen R. Scapular positioning and movement in unimpaired shoulders, shoulder impingement syndrome, and glenohumeral instability. Scand J Med Sci Sports. 2011;21(3):352-358. doi:10.1111/ j.1600-0838.2010.01274.x
43. de Oliveira VM, Pitangui AC, Nascimento VY, da Silva HA, Dos Passos MH, de Araújo RC. Test-retest reliability of the closed kinetic chain upper extremity stability test (CKCUEST) in adolescents: reliability of CKCUEST in adolescents. Int J Sports Phys Ther 2017;12:125-132.
44. Tucci HT, Martins J, Sposito G de C, Camarini PMF, de Oliveira AS. Closed Kinetic Chain Upper Extremity Stability test (CKCUES test): a reliability study in persons with and without shoulder impingement syndrome. BMC Musculoskelet Disord 2014;15(1). doi:10.1186/1471-2474-15-1
45. Callaway A, Peck J, Ellis S, Williams J. A randomised observational study of individualised variations in the start position of the closed-kinetic chain upper extremity stability test. Phys Ther Sport. 2020;41:16-22. doi:10.1016/j.ptsp.2019.10.007
Download: https://ijspt.scholasticahq.com/article/116332-preparation-for-flight-the-physical-profile-of-preprofessional-and-professional-circus-artists-in-the-united-states/attachment/ 223475.pdf?auth_token=Pgypzmywdu5P7GuW_k35
Download: https://ijspt.scholasticahq.com/article/116332-preparation-for-flight-the-physical-profile-of-preprofessional-and-professional-circus-artists-in-the-united-states/attachment/ 223474.pdf?auth_token=Pgypzmywdu5P7GuW_k35
Campos-Villegas C, Ortega-Pérez de Villar L, Gámez-Payá J, Alarcón-Jiménez J, de Bernardo N. Clinical Progression and Load Management For Proximal Hamstring Tendinopathy In A Long-Distance Runner: A Case Report. IJSPT. Published online May 2, 2024:609-617. doi:10.26603/001c.116578
Cristina Campos-Villegas1 , Lucía Ortega-Pérez de Villar2a , Javier Gámez-Payá2 , Jorge Alarcón-Jiménez3,4 , Nieves de Bernardo1
1 Department of Physiotherapy, Faculty of Medicine and Health Sciences, Catholic University of Valencia, 2 Department of Nursing, Faculty of Nursing and Podiatry, university of Valencia, 3 Department of Physiotherapy, Faculty of Health Sciences, universidad Europea de Valencia, 4 Biomechanics & Physiotherapy in Sports Research Groups (BIOCAPS)
Keywords: exercise, running, tendon, eccentric training, injury https://doi.org/10.26603/001c.116578
International Journal of Sports Physical Therapy
Background and Purpose
The characteristics of Proximal Hamstring Tendinopathy (PHT) include deep, localized pain in the region of the ischial tuberosity. Chronic lesions are often found in long-distance runners. Compression of the tendon and shear force at its insertion at the ischial tuberosity during hip flexion/adduction is a key etiologic factor The aim of this case report is to analyze the effectiveness of an exercise protocol with progression of tendon loading in PHT in an amateur runner, by assessing pain and functional capacity
The subject was a 30-year-old male runner. After participating in a 10km race, he experienced an insidious onset of deep buttock pain in the right ischial tuberosity His pain was aggravated by running on sloped roads and prolonged sitting on hard surfaces, particularly while driving. The visual analog scale (VAS) for pain, the Puranen-Orave test (PO), the Bent-Knee stretch test (BK stretch), the supine plank test, the Victorian Institute of Sport Assessment-proximal hamstring tendons (VISA-H) questionnaire, and the sciatic nerve mobility (via the Slump test) were assessed. The intervention involved a 12-week progressive loading exercise program divided into four phases.
Outcomes
The initial pain was reduced at 6 weeks of intervention and further decreased at 12 weeks (VAS from 7, to 5 and to 1). Function increased at 6 weeks and at 12 weeks (VISA-H from 23, to 53, to 80). Sciatic nerve mobility was normal.
Conclusion
The progression of training in a subject with PHT tendon injury based on isometric exercise, concentric/eccentric, energy storage, progressively increasing hip flexion was beneficial, increasing function and decreasing pain. Studies with a larger sample size and a more precise methodological design would be necessary to support this type of intervention in clinical practice.
Level of Evidence
5
a
Corresponding author:
Lucía Ortega Pérez de Villar Calle de Menéndez y Pelayo, 19, El Llano del Real, 46010, Valencia (Spain) phone: +34 963 86 41 82 email: lucia.ortega@uv.es
Chronic injuries are common in long-distance runners and are often associated with muscle weakness and inability to run. Proximal Hamstring Tendinopathy (PHT) involves deep pain located in the ischial tuberosity region. Acute lesions commonly result from rapid acceleration and deceleration movements and are often associated with activities such as soccer, skiing, and field hockey. Chronic injuries usually have an insidious onset and pain worsens during sports activities and prolonged sitting.1 There is limited literature on the diagnosis and clinical management of PHT 2 Diagnosis can be challenging, as PHT is one of several potential sources of symptoms in this region. Regarding PHT, it is believed that tendon compression and shear force at its insertion at the ischial tuberosity during hip flexion/adduction is a key etiology 3 Extrinsic factors related to the etiology include training errors including excessively rapid increase in volume or intensity, accelerations or decelerations, changes in direction, training on slopes. Authors of several case reports suggest that these training errors would precede PHT, since during these trainings the tension and compression load on the tendon may be excessive at the insertion due to the hip flexion angle.4 During running the hamstrings perform eccentric deceleration of knee extension with maximal force at the end of swing phase. Energy storage in the late swing cycle is associated with increased hamstring loads. Increased hip or trunk flexion (climbing slopes or trunk forward) can increase the energy storage load on the proximal hamstring insertion.5
Cook and Purdam6 proposed the continuum model of tendon pathology, where diffuse increase in cellularity and ground substance (reactive tendinopathy) precedes focal areas of collagen disorganization and neurovascular ingrowth, with progression over time to address a degenerative tendinopathy morphology. According to Lempainen et al.7 samples of pathological proximal hamstring tendon tissue show increased cellularity, accumulation of ground substance, collagen disorganization and neurovascular ingrowth, similar to what is seen in other tendinopathies such as Achilles and patellar tendinopathy.
Regarding the diagnosis of PHT, pain in the region of the ischial tuberosity, well localized, which after a few minutes of activity improves and then worsens, confirms the typical behavior of tendon pain.8 During activities involving increased hip flexion (prolonged sitting, bending down), the onset of pain is frequent. The occurrence of pain during activities that do not involve energy storage or compression is infrequent. Stiffness may occur in the morning or when starting to move after prolonged rest. Regarding the differential diagnosis, multiple pathologies that can cause symptoms in the ischial region should be considered, such as pathologies of lumbar, hip, sacroiliac regions, as well as radiculopathy or sciatic nerve involvement. Sometimes PHT can coexist with these pathologies, which makes diagnosis and clinical management difficult. According to Cushman and Rho,9 it is presumed that overuse, poor lumbopelvic stability, and relatively weak hamstring musculature contribute to the development of PHT. Exces-
sive movement of the sagittal lumbopelvic plane (i.e., anterior tilt and hip flexion) has been linked to hamstring injury by causing increased hamstring origin tightness.10 This reasoning may support the inclusion of trunk stabilization/strengthening exercises, which have been used in the therapeutic management of PHT.4 An elevated stride length can potentially amplify the tensile load on the proximal hamstring tendon, whereas an increase in running cadence leads to a reduction in stride length, hip flexion, and an increase in gluteal activity during the terminal swing. Although this intervention holds promise in lessening the tensile load on the hamstring, the application of running gait retraining remains unexplored in the treatment of PHT 11
Case reports have linked hamstring weakness to longterm symptoms in athletes with PHT 8,12 Other kinetic chain deficits have the potential to increase hamstring stress concentration of origin. Gluteus maximus atrophy in PHT may contribute to hamstring overload, while gluteus medius weakness has been associated with PHT as a consequence of increased hip adduction and/or contralateral pelvic drop during monopedal stance.4,13,14 Several authors have explored the management of those with PHT 15‑18 However, concerning clinical management, published case reports predominantly concentrate on manual therapy and exercise programs centered around eccentric activity Notably, these reports have overlooked the role of programmed tendon load adaptation, no taking in consideration the increase in hip flexion as a criterion for progression of tensile load on the tendon. The key to the management of all tendinopathies is progressive loading, performed within a pain monitoring framework, to reduce pain and restore function.8
The intervention proposed in this case report was based on the progression of the exercises by monitoring the response of the injured tendon to the load, (with the recording of VAS after the daily load test performed at the same time daily) supported by the study of Mascaró et al.19 regarding treatment of patellar and Achilles tendinopathy For PHT, intervention based on load progression and assessment of functionality by means of validated scales has been recommended by authors such as Goom et al.8 At present, there is no clear guidance from the literature on PHT rehabilitation. Weight-bearing exercises for PHT have not been investigated in randomized controlled trials. Limited case series and case presentations have been published demonstrating improvements in pain and function with conservative treatment, including hamstring strengthening. The results of these studies cannot be generalized, due to sample size, different diagnostic methods, and the use of adjunctive interventions along with exercise.
The aim of this case report was to analyze the effectiveness of an exercise protocol with progression of tendon load in PHT in an amateur runner, by assessing pain and functional capacity
Table 1. Signs and symptoms throughout the duration of the case report
stretch test
at 30º of flexion
Abbreviation: BK stretch, Bent-Knee stretch test; PO, Puranen-Orave test; VAS, Visual Analog test (a score of 0 indicates no pain, while a score of 10 indicates a higher pain); VISA-H, Victoria Institute of Sport Assessment-proximal hamstring tendons. (a score of 100 represents no impairment)
The subject, a 30-year-old healthy male recreational runner who had actively participated in marathons and mid-distance races for the prior decade. Following a 10km race, an insidious onset of deep buttock pain in the right ischial tuberosity occurred without any traumatic incident. The pain was exacerbated during run training on sloped roads and prolonged sitting on hard surfaces, particularly while driving. Using the Visual Analog Scale (VAS), the subject rated the pain as 7/10, with 0 indicating no pain and 10 being the worst imaginable pain. The VAS scale, spanning from 0 to 10 on a 10 cm straight horizontal line, has been described as a reliable measure for assessing pain intensity in subjects with similar conditions.20 A higher score on the scale denotes greater pain intensity, and the test has demonstrated reliability in subjects with chronic musculoskeletal pain.
The subject denied any referred pain, numbness, tingling, weakness, bowel or bladder function changes, medication usage, recent or prior trauma, prior hamstring injury, or prior history of stress fractures. He reported previous treatment during two manual therapy sessions, femoral biceps and semitendinosus dry needling and four weeks of eccentric hamstring exercise (Nordic Hamstring Exercise) without any significant relief.
The subject’s signs and symptoms through his treatment course are reported in Table 1 Subject clinical and anthropometric data were collected. Pain and function were evaluated with the Victorian Institute of Sport Assessmentproximal hamstring tendons (VISA-H) questionnaire21 which is a valid and reliabile outcome measure for subjects with PHT (Cronbach α coefficient=0.84 95%CI 0.77-0.89; ICC for non-surgical subjects=0.92). The questionnaire consists of eight items. Pain and function are evaluated from items 1 to 6. Items 7 and 8 evaluate sporting activity. Questions 1 to 7 are scored from 0 to 10 while question 8 is scored from 0 to 30. The maximum possible score is 100 (an asymptomatic person would score 100, whereas the worst possible score is 0 points). The subject presented with a VISA-H score of 23.
Throughout the physical examination, no pain was elicited during concentric and resistance contractions. However, discomfort was observed during the eccentric contraction of the right hamstring muscle. Despite this, no weakness was detected in the muscle during the manual muscle testing, and the reported pain was localized to the right ischial tuberosity.
The Puranen-Orave test (PO), bent-knee stretch test (BK stretch) and supine plank test were positive, in that pain was exacerbated in the affected area. The PO is a valid and reliable test (specificity= p=0.82; 95%CI=0.68-0.92).15 It is a standing test that actively stretches the hamstrings muscles in a standing position with the hip flexed at about 90º and the knee is extended fully, and the foot is on a support at 90º. BK stretch test is a validity and reliability test (specificity= p=0.87; 95%CI=0.73-0.95).15 It is performed in the supine position. The hip and knee of the affected leg are in a maximally flexed position. The examiner slowly straightens the knee till its maximally extended. To evaluate the supine plank test the participant was asked to sit down with the hands on the ground behind the hips, fingers pointing backwards and arms straight.22 The subject must push down with the heels and lift the pelvis in the air, creating a straight line from shoulders to ankles. The subject was asked to lift the non-sympotamic leg off the ground (with knee extended).
The SLUMP test yielded negative results. This neurodynamic test involves a progressive series of maneuvers designed to increase tension in the sciatic nerve. While the SLUMP test is validated for subjects with lumbar disc herniation (sensitivity=0.84, CI=0.74-0.90; specificity=0.83, CI=0.73-0.90), its applicability to subjects with PHT has not been specified.23
Musculoskeletal ultrasound conducted in the medical provider’s office revealed notable findings. The left (symptomatic) tendon exhibited increased thickness, measuring up to 1.6 cm (normal range: 0.6-0.7 cm). Additionally, there were indications of hypoanechogenicity and significant intratendon neoangiogenesis, suggestive of severe tendinopathy in an active phase and of long-standing duration. In contrast, the right leg (non-symptomatic) demonstrated a tendon thickness ranging from 0.8 to 0.9 cm, characterized as discrete thickening with hypoanechogenicity and an absence of neoangiogenesis.
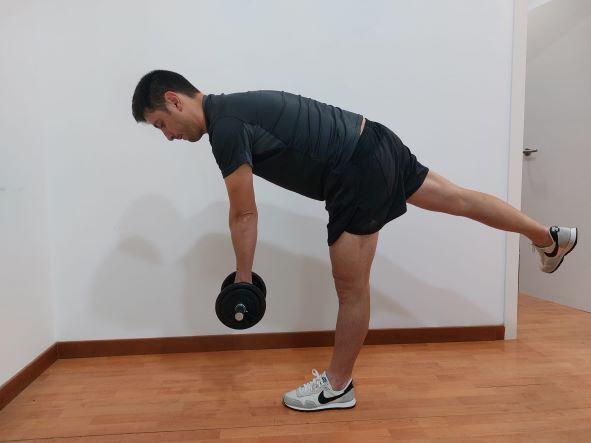
The intervention involved a progressive load exercise program structured into four phases. Advancement to the next phase was contingent upon the load test (Figure 1), registering ≤4 on the VAS, on two consecutive days. The evaluation was conducted consistently at the same hour each day and recorded.
The exercise program implemented in this case study adhered to the regimen outlined by Goom et al8 for HT and the protocol detailed by Mascaró et al.19 which employs a safe load progression method to modify and enhance the structure of affected tendons in conditions like patellar and Achilles’ tendinopathy. Progression through the various phases was determined by the response to the exercise load on consecutive days rather than being dictated by specific time periods. The intervention lasted 12 weeks and measurements were taken at baseline (T1), at week 6 (T2) and at 12 weeks (T3) coinciding with the end of the intervention program. The exercises are described in Figures 2 to 7 and in Table 2.
For return to running, the subject followed the protocol suggested by the authors, which is described in Table 3. He was instructed to run on alternate days and to remain at least two days at each level. If no pain was described, he could move on to the next level. Running intensity at all levels was at a gentle pace (65% of maximum speed).
After the first week of initiating the load exercise program, the subject observed a decrease in pain, enabling progression to the second phase, incorporating exercises with a higher tendon load. By the sixth week, his pain had reduced to 5/10. By week 9, the subject started combining the load exercise program with return to running program (Table 3). At the conclusion of the 12-week intervention, the pain had diminished to 1/10. Currently, the subject persists in performing the load exercise program and refrains from sloped
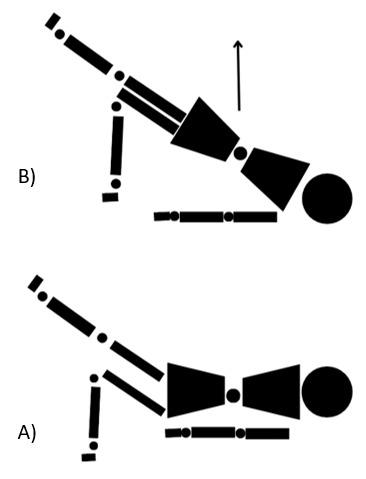
Figure 2. Single leg bridge. A) Start position: lying on the back, one leg bent, and the other leg extended. B) Lift the pelvis as high as able.
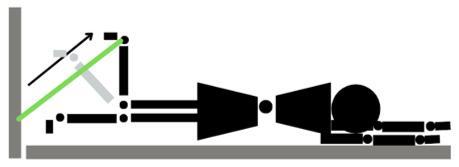
Figure 3. Lying leg curls with resistance band. Lying down on the belly, secure the band behind the ankles, beginning with legs straight and curl the leg to 90º
running training. He reports training at the previous injury intensity and distance without experiencing any pain.
On physical examination (Table 1), the subject exhibited a notable reduction in tenderness to palpation of the proximal hamstring tendon, diminished pain with the mentioned provocative maneuvers, and reported a decreased intensity of pain during rest. At the nine-week mark after the initial examination, he commenced run training, and his VISA-H score improved. The subject maintained the same load exercise program throughout this period.
Six weeks after the commencement of the progressive load exercise program, ultrasound imaging was repeated in the medical providers office. The examination revealed that the left tendon showed no thickening and measured within the normal range (0.6-0.7 cm). This provided evidence of improvement in tissue quality
Figure 1. Single leg arabesque (load test).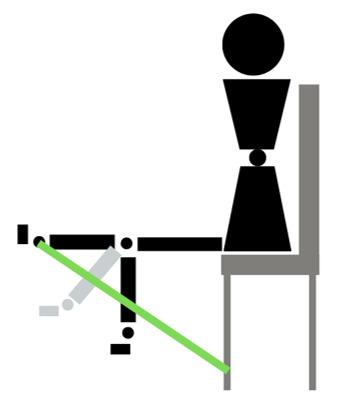
Figure 4. Seated one leg curl with resistance band. Seated on the bench, secure the band behind the ankles, begin with both legs straight, flex the knee, bringing the foot towards the bench.
Figure 5. Single leg arabesque. Standing on one leg, knee slightly bent, slowly bring chest towards floor, extending the opposite leg and keeping the back in a neutral position.
In this case, the training progression for PHT tendon injury, supported by Goom et al.,8 was beneficial, emphasizing a
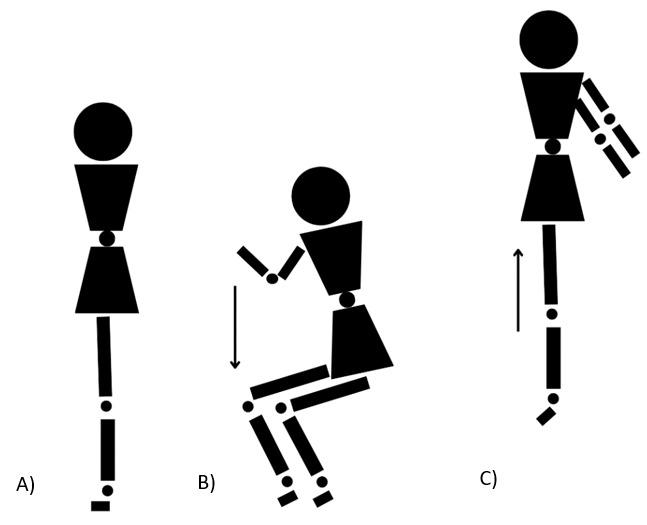
Figure 6. Squat Jump. A plyometric exercise. A) Standing position (feet-shoulder width apart) B) bend the knees as if to sit back on a chair, push through the heels, C) jump straight up.
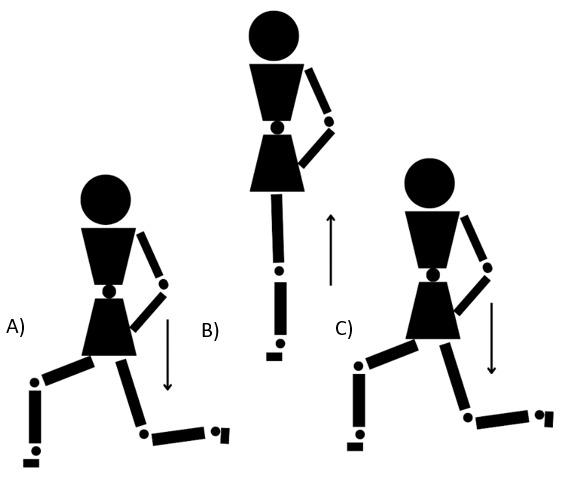
Figure 7. Alternate leg split squats. A) Start position: legs split with one leg in front of the body (as taking one step forward) and the other behind (as step back), lower down until the back knee touches the floor, B) Jump up, changing leg position, C) return to the start position
gradual increase in hip flexion position from less to more. The progression suggested by Mascaró et al.19 for patellar and Achilles tendinopathy, based on isometric, concentric/ eccentric and energy storage exercise was beneficial for this subject.
The observed improvement in this subject who used the approach compared to previous treatments may be attributed to the meticulous management of tendon load progression, prioritizing pain control. The inadequacy of past treatments, involving manual therapy and dry needling, or excessive load application like eccentric Nordic Hamstring
Table 2. Description of the exercise program.
PHASE Frequency
1 Exercises performed three times a day
2
Every two days followed by one day of Phase 1
3 Every two days followed by one day of Phase 1
Type of contraction Exercise
Isometric 5 reps 45 sec (70% MVIC) 1 sec of rest
Concentric + eccentric with minimum hip flexion
4 sets 8 reps (3 sec CC + 3 sec EC)
30 sec of rest
Concentric + eccentric with hip flexion
4 Every three days followed by 1 day of phase one and the next day followed by Phase 2 or 3
Table 3. Return to running program.
Energy storage/ loading
LEVEL WALK-RUN INTERVALS (mins) PROTOCOL
Level 1 1 min walking+2 min running x 5 sets
Level 2 1 min walking + 4 min running x 5 sets
Level 3 1 min walking + 6 min running x 5 sets
Level 4 1 min walking+ 8 min running x 5 sets
Level 5 Continuos running 25 minutes
exercises, underscores the importance of a carefully calibrated approach. While prior soft-tissue treatments may have contributed to a more rapid recovery for this subject, it is essential to highlight that the current methodology may have played a pivotal role in facilitating an even swifter recuperation than the previous treatment.
As pointed out by Goom et al.8 pain has to be a criteria to progress in the exercises program to adjust to the load that the tendon is capable of supporting at that moment. During this case, in order to make a comparison and contrast of the pain results throughout the process, the subject performed the same test (single leg arabesque) regardless of the training phase in which he was. Perhaps, in future studies, a test with less potential for irritability of the PHT, for example the single leg bridge, should be chosen to reduce required hip flexion during the test.
Other exercise treatment approaches as described by Cushman et al.9 in their case report, have proven beneficial.
Single leg bridge
Prone one leg curl with resistance band
4 sets 8 reps (3 sec CC + 3 sec EC)
30 sec of rest
4 sets 8 reps (3 sec)
30 sec of rest
3 sets 15 reps 2 min of rest
3 sets 15 reps 2 min of rest
Seated one leg curl with resistance band
Single leg arabesque
Squat jump
Alternate leg split squats
Rich et al.24 published a proposed crossover protocol for treatment of PHT using isometric/eccentric exercises. To enhance the robustness of future intervention protocols, it is crucial to investigate the proposed approach with greater number of subjects. The incorporation of isometric/eccentric exercises, along with the gradual introduction of hip flexion as recommended by Goom et al.8 should be considered as essential elements in the design of subsequent studies with larger sample sizes of those with PHT.
Functional questionnaires and pain assessments (VISAH) during and after activity should serve as the primary outcome measures for evaluating tendon pathology Numerous studies suggest that it is not solely the state of tendon structure but rather its inadequate adaptation to load that triggers the onset of symptoms.19,25‑27 Futhermore, it would be interesting to include imaging studies in future research to evaluate the extent to which the state of the
tendon structure contributes to the improvement of function and pain.
An exercise protocol focused upon load progression management for the treatment of PHT was beneficial to a male runner Studies with a larger sample size and a more precise methodological design would be necessary to support this type of intervention in clinical practice.
This research received no specific grat from any funding agency in the public, commercial or not for profit sectors.
The authors report no conflicts of interest.
Submitted: December 14, 2023 CDT, Accepted: March 17, 2024 CDT
© The Author(s)
This is an open-access article distributed under the terms of the Creative Commons Attribution 4.0 International License (CCBY-NC-4.0). View this license’s legal deed at https://creativecommons.org/licenses/by-nc/4.0 and legal code at https://creativecommons.org/licenses/by-nc/4.0/legalcode for more information.
1. Startzman AN, Fowler O, Carreira D Proximal hamstring tendinosis and partial ruptures. Orthopedics. 2017;40(4):e574-e582. doi:10.3928/ 01477447-20170208-05
2. Benazzo F, Marullo M, Zanon G, Indino C, Pelillo F. Surgical management of chronic proximal hamstring tendinopathy in athletes: a 2 to 11 years of follow-up. J Orthop Traumatol 2013;14(2):83-89. doi:10.1007/ s10195-013-0226-2
3. Cook J, Purdam C. Is compressive load a factor in the development of tendinopathy? Br J Sports Med 2012;46(3):163-168. doi:10.1136/ bjsports-2011-090414
4. Jayaseelan DJ, Moats N, Ricardo CR. Rehabilitation of proximal hamstring tendinopathy utilizing eccentric training, lumbopelvic stabilization, and trigger point dry needling: 2 case reports. J Orthop Sports Phys Ther. 2014;44(3):198-205. doi:10.2519/ jospt.2014.4905
5. Schache AG, Dorn TW, Blanch PD, Brown NAT, Pandy MG. Mechanics of the Human Hamstring Muscles during Sprinting. Med Sci Sport Exerc 2012;44(4):647-658. doi:10.1249/ mss.0b013e318236a3d2
6. Cook JL, Purdam CR. Is tendon pathology a continuum? A pathology model to explain the clinical presentation of load-induced tendinopathy. Br J Sports Med. 2009;43(6):409-416. doi:10.1136/ bjsm.2008.051193
7 Lempainen L, Sarimo J, Mattila K, Vaittinen S, Orava S. Proximal hamstring tendinopathy: Results of surgical management and histopathologic findings. Am J Sports Med. 2009;37(4):727-734. doi:10.1177/0363546508330129
8. Goom TSH, Malliaras P, Reiman MP, Purdam CR. Proximal hamstring tendinopathy: Clinical aspects of assessment and management. J Orthop Sports Phys Ther 2016;46(6):483-493. doi:10.2519/ jospt.2016.5986
9. Cushman D, Rho ME. Conservative treatment of subacute proximal hamstring tendinopathy using eccentric exercises performed with a treadmill: A case report. J Orthop Sports Phys Ther. 2015;45(7):557-562. doi:10.2519/jospt.2015.5762
10. Mason DL, Dickens VA, Vail A. Rehabilitation for hamstring injuries. Cochrane Database of Systematic Reviews 2007;12(1). doi:10.1002/ 14651858.cd004575.pub2
11. Chumanov ES, Wille CM, Michalski MP, Heiderscheit BC. Changes in muscle activation patterns when running step rate is increased. Gait Posture 2012;36(2):231-235. doi:10.1016/ j.gaitpost.2012.02.023
12. Mccormack JR. The management of bilateral high hamstring tendinopathy with ASTYM®treatment and eccentric exercise: a case report. J Man Manip Ther 2012;20(3):142-146. doi:10.1179/ 2042618612y.0000000003
13. Jesus JF de, Bryk FF, Moreira VC, Nakaoka GB, Reis AC dos, Lucareli PRG. Gluteus Maximus inhibition in proximal hamstring tendinopathy. Med Express 2015;2(4):150406. doi:10.5935/ medicalexpress.2015.04.06
14. White KE. High hamstring tendinopathy in 3 female long distance runners. J Chiropr Med 2011;10(2):93-99. doi:10.1016/j.jcm.2010.10.005
15. Cacchio A, Borra F, Severini G, et al. Reliability and validity of three pain provocation tests used for the diagnosis of chronic proximal hamstring tendinopathy. Br J Sports Med. 2012;46(12):883-887. doi:10.1136/bjsports-2011-090325
16. Schroeter S, Heiss R, Hammer CM, et al. Pathogenesis and Diagnosis of Proximal Hamstring Tendinopathies. Sportverletzung-Sportschaden. 2024;38(1):31-39.
17 Pietrzak JRT, Kayani B, Tahmassebi J, Haddad FS. Proximal hamstring tendinopathy: pathophysiology, diagnosis and treatment. Br J Hosp Med 2018;79(7):389-394. doi:10.12968/ hmed.2018.79.7.389
18. Nasser AM, Pizzari T, Grimaldi A, Vicenzino B, Rio E, Semciw AI. Proximal hamstring tendinopathy; expert physiotherapists’ perspectives on diagnosis, management and prevention. Phys Ther Sport 2021;48:67-75. doi:10.1016/j.ptsp.2020.12.008
19. Mascaró A, Cos MÀ, Morral A, Roig A, Purdam C, Cook J. Gestión de la carga en las tendinopatías: progresión clínica para tendinopatías de Aquiles y rotuliana. Apunt Med l’Esport. 2018;53(197):19-27. doi:10.1016/j.apunts.2017.11.005
20. Boonstra AM, Schiphorst Preuper HR, Reneman MF, Posthumus JB, Stewart RE. Reliability and validity of the visual analogue scale for disability in patients with chronic musculoskeletal pain. Int J Rehabil Res. 2008;31(2):165-169. doi:10.1097/ mrr.0b013e3282fc0f93
21. Cacchio A, De Paulis F, Maffulli N. Development and validation of a new visa questionnaire (VISA-H) for patients with proximal hamstring tendinopathy Br J Sports Med. 2014;48(6):448-452. doi:10.1136/ bjsports-2012-091552
22. Fredericson M, Moore W, Guillet M, Beaulieu C. High Hamstring Tendinopathy in RunnersMeeting the Challenges of Diagnosis, Treatment, and Rehabilitation. Phys Sportsmed 2005;33(5):32-43. doi:10.3810/ psm.2005.05.89
23. Majlesi J, Togay H, Ünalan H, Toprak S. The sensitivity and specificity of the Slump and the Straight Leg Raising tests in patients with lumbar disc herniation. J Clin Rheumatol. 2008;14(2):87-91. doi:10.1097/rhu.0b013e31816b2f99
24. Rich A, Cook JL, Hahne AJ, Rio EK, Ford J. Randomised, cross-over trial on the effect of isotonic and isometric exercise on pain and strength in proximal hamstring tendinopathy: trial protocol. BMJ Open Sport Exerc Med. 2021;7(1):e000954. doi:10.1136/bmjsem-2020-000954
25. Cook JL, Rio E, Purdam CR, Docking SI. Revisiting the continuum model of tendon pathology: what is its merit in clinical practice and research? Br J Sports Med. 2016;50(19):1187-1191. doi:10.1136/ bjsports-2015-095422
26. Holla JFM, Leeden MVD, Peter WFH, et al. Proprioception, laxity, muscle strength and activity limitations in early symptomatic knee osteoarthritis: Results from the CHECK cohort. J Rehabil Med 2012;44(10):862-868. doi:10.2340/16501977-1029
27. De Vos RJ, Weir A, Tol JL, Verhaar J, Weinans H, Van Schie H. No effects of PRP on ultrasonographic tendon structure and neovascularisation in chronic midportion Achilles tendinopathy. Br J Sports Med. 2011;45(5):387-392. doi:10.1136/bjsm.2010.076398
1 Fort Campbell Physical Therapy Clinic, KY, 2 Fort Campbell Medical Clinic, KY
Keywords: elbow pain, musculoskeletal ultrasound, point of care ultrasound, triceps brachii tendon partial thickness tear, triceps brachii tendon avulsion
https://doi.org/10.26603/001c.116276
International Journal of Sports Physical Therapy
Background
Clinical assessment of triceps brachii tendon tears is challenging, and conventional imaging methods have limitations. Timely surgical referral is important in high-grade tears to maximize patient outcomes, and musculoskeletal ultrasound (MSK US) can be used at the time of clinical examination to identify such injuries requiring advanced imaging and orthopedic referral.
Hypothesis/Purpose
The purpose of this case report is to describe how MSK US was used to facilitate advanced imaging and timely orthopedic referral for a patient presenting to a physical therapist with a high-grade triceps tendon avulsion.
Study Design
Case Report
Case Description
A 35-year-old male soldier presented to a direct access sports physical therapist with acute-on-chronic right elbow pain. Physical examination and MSK US were used to identify a high-grade partial triceps brachii tendon tear. The MSK US findings informed the physical therapist’s decision-making process to refer the subject for timely advanced imaging studies as well as referral to an orthopedic physician.
Outcomes
A high-grade partial triceps tendon avulsion was confirmed on magnetic resonance imaging (MRI). The subject was then seen by an orthopedic surgeon and underwent surgical repair of the tendon within the recommended three-week timeframe for optimal outcomes. The subject completed a post-operative rehabilitation program and returned to full physical and occupational activities.
Conclusion
MSK US can assist in the diagnosis of challenging triceps tendon injuries, facilitating timely advanced imaging and orthopedic referrals for high-grade injuries to optimize patient outcomes.
Level of Evidence
5
Corresponding Author: Rita Chorba, PT, DPT, MAT, SCS, ATC, CSCS, RMSK rita@ritapt.com
The triceps brachii tendon, an integral component of the elbow’s musculotendinous system, plays a crucial role in arm extension. Tears of the triceps brachii tendon can lead to significant disability related to loss of elbow extension strength.1 Diagnosis can pose challenges in the clinical setting due to the nature of triceps injury presentation; partial-thickness tears tend to selectively involve the superficial layer of the tendon, leaving the deep layer intact.1 This means that patients with significant tendon tears may still be able to generate sufficient elbow extension force during manual muscle testing, which may obscure the severity of tissue injury.2
Imaging evaluation is often necessary to assess the extent of triceps tendon injury. While radiography is the initial choice for acute elbow injuries, it falls short in assessing soft tissue structures. Magnetic resonance imaging (MRI) excels in soft tissue evaluation; however its accessibility may be hindered by cost, availability, and contraindications.3 In high-grade acute triceps tendon injuries, optimal outcomes are suggested when surgical repair occurs within three weeks of injury onset.1 Therefore, timely diagnosis is crucial in order to facilitate appropriate orthopedic referral.
Musculoskeletal ultrasound (MSK US) can be advantageous in diagnosing triceps brachii tendon injuries due to its capacity for high-resolution, real-time imaging in the clinical setting. While soft tissue contrast is inferior to MRI, ultrasound generates a greater spatial resolution and allows for dynamic assessment of acute muscle and tendon injuries.4 It is adept at detecting changes in tendon tissue composition and integrity, particularly the characteristic sonographic appearance of tendinopathies and partialthickness triceps tendon tears.5,6 It can also identify tendon retraction and bone fragments, such as with tendon avulsion from the olecranon.6
The purpose of this case report is to describe how MSK US was used to facilitate advanced imaging and timely orthopedic referral for a patient presenting to the physical therapist with a high-grade partial thickness triceps tendon tear.
A 35-year-old male soldier presented to a direct access sports physical therapist (PT) for worsening right posterior elbow pain. The subject’s pain began several months prior concurrent with an increase in upper body strength training activities and was gradually worsening in severity with this activity. The subjects’s history included a right partial triceps brachii distal tendon avulsion eight years prior which was treated conservatively, allowing him to resume unlimited military duty and weightlifting activities in subsequent years. The subject denied red flags including experiencing a new traumatic event, joint swelling, or signs of infection.
Physical examination noted a palpable defect and mild tenderness on the posterior aspect of the elbow at the insertion of the triceps tendon. There was no ecchymosis, erythema, or edema appreciated. Triceps strength (manual
muscle test 5/5), elbow range of motion (0-135 degrees), and elbow stability (varus and valgus stress tests) were intact and asymptomatic. Differential diagnoses included triceps strain, triceps tendinopathy, olecranon bursopathy, and symptomatic osteoarthritic changes.
MSK US was performed by the physical therapist using a Sonosite IViz (Fujifilm Sonosite, Bothell, WA) with portable 10-5 MHz 38 mm linear array transducer with the subject lying in supine. The shoulder was positioned in internal rotation with the elbow flexed to ninety degrees and elevated on a bolster so that the hand could rest on the abdomen (Figure 1). The probe was positioned in the sagittal plane over the distal triceps and posterior elbow and maneuvered until the bony landmarks of the olecranon process of the ulna and the distal humeral cortex were visualized. The triceps tendon and portions of the myotendinous junction were visualized superficial to the bony landmarks.6,7
The long-axis ultrasound view demonstrated a thickened distal triceps tendon with a loss of normal fibrous echotexture (Figure 2). There was hypoechogenicity of the superficial layer of the conjoined tendon compared to the deep portion and a loss of the normal tendon tapering conformity at the insertion on the olecranon process. Tendon thickening, hypoechogenicity, and a loss of normal fibrous echotexture are findings consistent with chronic tendinosis.8
A week later, prior to initiating a care plan, the subject reported re-injury while performing resisted elbow extension strength training exercises. Physical examination revealed moderate elbow effusion with a more prominent palpable triceps tendon defect. Triceps strength was 3+/5 through the available range of motion of 15–125 degrees. Differential diagnoses included acute triceps tendon tear, triceps tendon avulsion, and olecranon fracture.
Immediate post-injury MSK US demonstrated a selective area of complete fiber non-visualization of the distal triceps tendon’s superficial portion near its insertion on the proximal ulna, indicating a high-grade partial tendon avulsion (Figure 3). The subject was referred by the physical therapist for MRI two days later MRI findings confirmed a partial triceps tendon avulsion with a partially retracted conjoined tendon of the long and lateral heads of the triceps and tendinosis (Figure 4).
The subject was referred to an orthopedic surgeon and underwent a distal triceps repair within the recommended three-week timeframe from injury 1 Post-operative rehabilitation was informed by the clinical practice guideline for distal triceps repair by Hock.9 Return to duty/sport and physical therapy discharge criteria were informed by the guidelines of Plisky et al. for upper extremity injuries.10 Early rehabilitation phases were timeline-based per the clinical practice guideline; later phases transitioned to criteria-based upper extremity testing to prepare the subject for return to full military duty, including competence on the Army Combat Fitness Test (ACFT).11 An overview of the rehabilitation program is summarized in Figure 5.
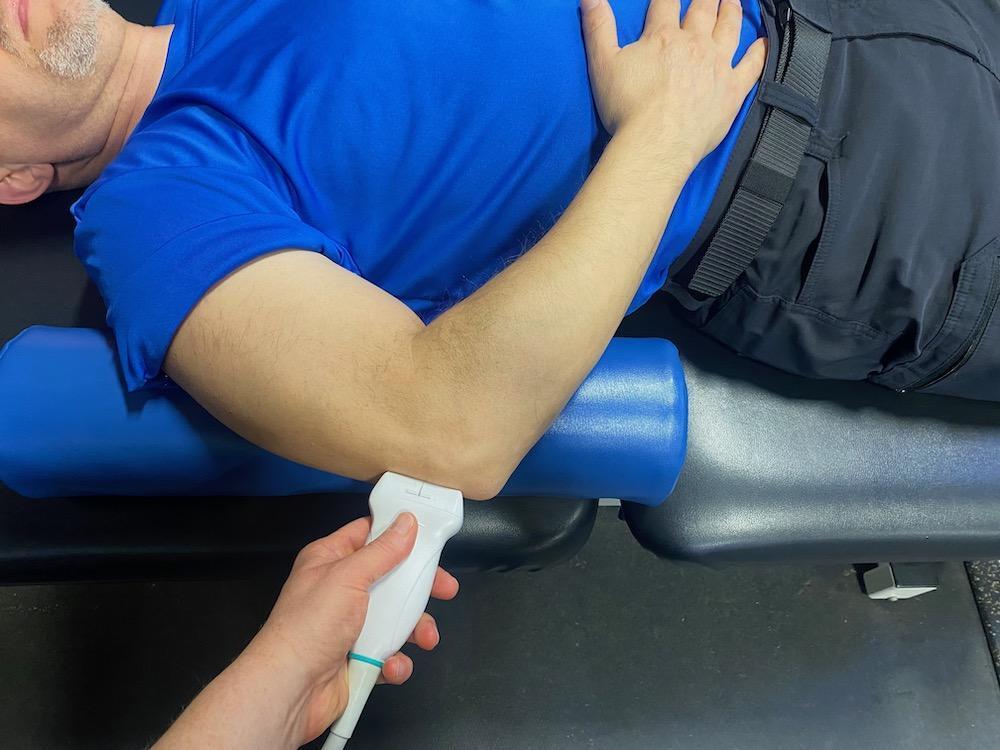
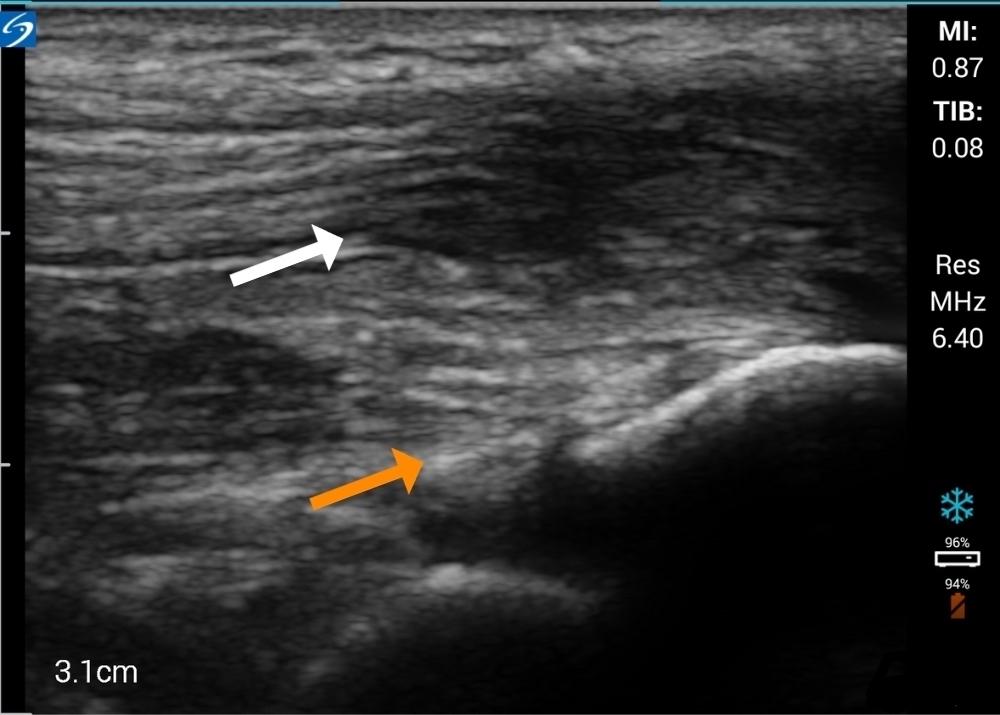
Figure 2. Initial MSK US long-axis view using a 10-5 MHz 38 mm linear array transducer demonstrating a thickened distal triceps tendon with a loss of normal fibrous echotexture. There is hypoechogenicity of the superficial layer of the conjoined tendon (white arrow) compared to the deep portion (orange arrow) and a loss of the normal tendon tapering conformity at the insertion on the olecranon process.
The subject successfully completed the rehabilitation program and returned to full active military duties, including heavy strength training and ACFT performance, at eleven months postoperatively He continued to report pain-free physical and occupational capabilities upon follow-up at two years post-surgery
The purpose of this case report is to describe how MSK US was used to facilitate advanced imaging and timely orthopedic referral for a subject presenting to the physical ther-
Figure 1. MSK US performed on the posterior aspect of the elbow.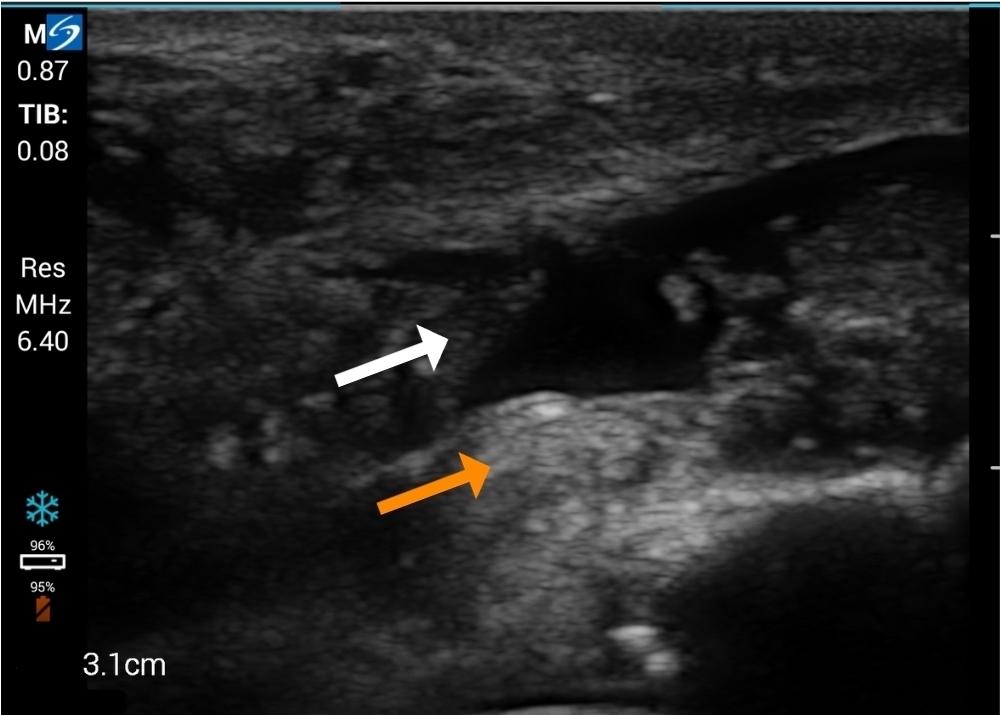
Figure 3. Post-injury MSK US long-axis view demonstrating a selective area of complete fiber non-visualization of the distal triceps tendon’s superficial portion near its insertion on the proximal ulna (white arrow), demonstrating a high-grade partial tendon avulsion. Deep fibers of the medial triceps head (orange arrow) are preserved.
apist with a high-grade triceps tendon tear To the authors’ knowledge this is the first case report to include both preand post-injury MSK US imaging of an acute triceps injury While high grade triceps tears are relatively rare injuries,6 they occur most frequently in athletic and physically demanding occupational populations12 where physical therapists and other sports medicine professionals may serve as the first point of triage and care. As delayed recognition and subsequent surgical care may lead to suboptimal outcomes in high grade triceps tendon injuries,1 MSK US offers several advantages in their assessment.
First, MSK US aids the assessment of injury severity compared to physical examination alone. As demonstrated in this case report, clinical examination findings may not accurately reflect the extent of tissue damage, particularly in partial-thickness tears where active elbow extension is preserved.2 As an extension of the physical examination in this case, MSK US provided clinical utility through realtime visualization of tendon integrity to further define the severity of injury at the initial point of care.
Due to advances in technology, MSK US may provide field-expedient access to initial imaging that is not readily available with other imaging modalities, such as MRI. This feature may be particularly useful in settings where immediate assessment and management decisions are necessary in order to optimize patient outcomes. In the present case report, rapid determination of injury severity was crucial to inform both the subject and their military leadership of recommended limitations to work responsibilities in order to ensure safety Unlike MRI, which often requires scheduling appointments, travel considerations, and may be sub-
ject to availability constraints, ultrasound was performed at the point of care, facilitating rapid diagnosis and expedited referral. Timeliness of diagnosis was particularly advantageous to the subject of the present case report, where prompt surgical planning and early surgical intervention was indicated to optimize outcomes.1
Additionally, MSK US enables ease of repeated examination in real-time and as a patient’s presentation evolves. In the current case report, while the change in clinical examination findings from initial encounter to re-injury may have been sufficient to prompt early orthopedic referral, the change in triceps tendon integrity as visualized on US reinforced the need to expedite this subject’s care plan. MSK US can also be used to provide ongoing assessment throughout the rehabilitative process. Dynamic assessment of tendon function, response to stress maneuvers, and surveillance of tendon healing over time are capabilities of MSK US that may be advantageous for assessing treatment response and guiding more personalized rehabilitation and management strategies.5
Despite these advantages, there are several limitations to the use of MSK US in the diagnosis and management of triceps tendon injuries. Compared to MRI, MSK US provides greater spatial resolution however its soft tissue contrast capabilities are inferior.4 MSK US lacks validity compared to the gold standard of MRI in the diagnosis of triceps tendon injuries. This limitation may be attributed, in part, to the paucity of the imaging literature addressing triceps tendon tears.6 While other upper extremity tendons, such as the rotator cuff, have shown acceptable agreement between MSK US and MRI findings,13 to the authors’ knowl-
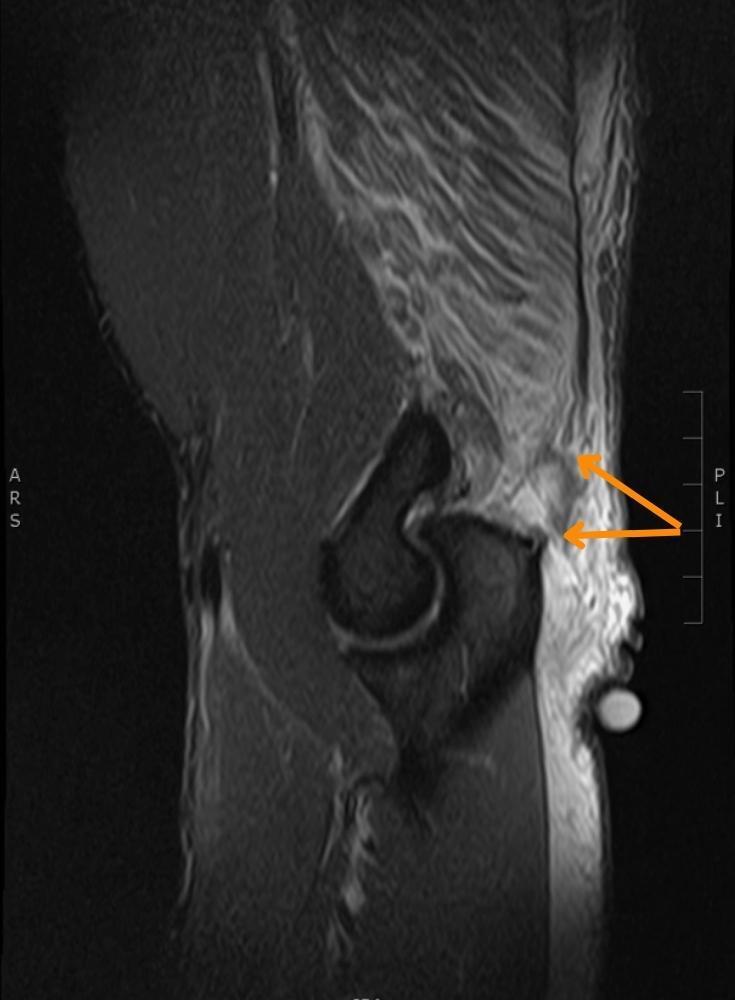
Figure 4. Sagittal T-2 weighted magnetic resonance image of the right elbow demonstrating a partially retracted conjoined tendon of the long and lateral heads of the triceps (arrows) and tendinosis.
edge there are no studies in the current literature specifically addressing the triceps tendon beyond case studies.
MSK US imaging is also limited to a visual window commensurate with the physical size of the ultrasound transducer. As such, ultrasound can provide a focused and relatively superficial examination but cannot provide a global assessment of the injury region, potentially missing con-
comitant pathologies pertinent to a patient’s presentation.8 While the subject in the present case report sustained a non-contact re-injury to a small area of previously known pathology, a different, traumatic mechanism of injury, common in both military and athletic populations, would require an imaging window beyond the local capabilities of ultrasound.
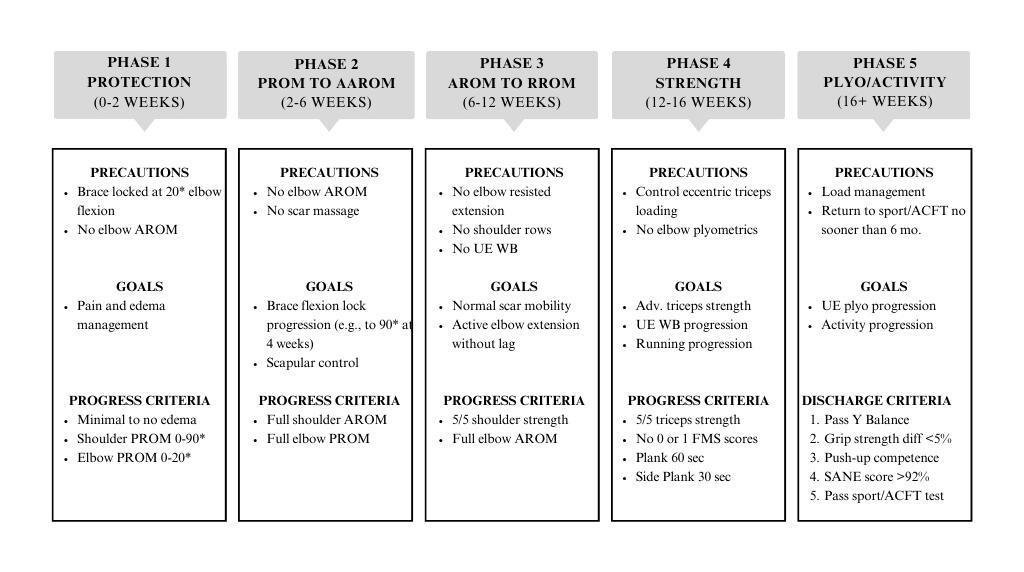
5.
AROM: Active Range of Motion. PROM: Passive Range of Motion. RROM: Resisted Range of Motion. UE WB: Upper Extremity Weightbearing. ACFT: Army Combat Fitness Test.
The upfront costs associated with implementing MSK US into clinical practice, while considerably less than MRI, can present a significant barrier to its widespread adoption. Despite the advances in portable US devices the upfront technology costs are likely to exceed $10,000 which may pose a significant financial challenge to small physical therapy teams and those with limited resources. Obtaining the necessary expertise in musculoskeletal ultrasound interpretation requires specialized training, which may not be readily available to all clinicians. Furthermore, the experience and skill of the ultrasound operator significantly influence the accuracy and reliability of the examination. Interpretation of ultrasound images relies heavily on the operator’s proficiency in probe manipulation, image optimization, and recognition of anatomical structures. Inexperienced operators may struggle to identify subtle abnormalities or may misinterpret normal variations as pathological findings, leading to diagnostic errors and potential delays in appropriate management.
While MSK US has inherent disadvantages compared to MRI, including limitations in validity, upfront costs, and operator dependence, its advantages in providing field-expedient assessment of injury severity and enabling ease of repeated examination made it a valuable diagnostic tool in the evaluation of triceps tendon injuries. In the present case report, MSK US aided in the rapid assessment of triceps tendon injury severity, prompting rapid referral and treatment in order to optimize the subject’s outcomes.
As active elbow extension is often preserved in cases of triceps tendon avulsion, high-grade injury cannot be ruled out by clinical examination alone. Timely diagnosis of highgrade injuries can facilitate optimal surgical outcomes within the recommended three-week timeframe from injury MSK US may be a valuable tool in these cases, due to its high-resolution visualization and ability to provide real-time assessment of tendon injuries. MSK US may also play a role in enhancing physical therapist decision-making for advanced imaging studies and time-sensitive orthopedic referral to optimize treatment outcomes.
The opinions and assertions contained herein are those of the authors and are not to be construed as official or reflecting the views of the US Army Medical Department, the US Army, or the Department of Defense.
The authors have no conflicts of interest to report.
Submitted: December 07, 2023 CDT, Accepted: March 20, 2024 CDT
© The Author(s)
This is an open-access article distributed under the terms of the Creative Commons Attribution 4.0 International License (CCBY-NC-4.0). View this license’s legal deed at https://creativecommons.org/licenses/by-nc/4.0 and legal code at https://creativecommons.org/licenses/by-nc/4.0/legalcode for more information.
Figure Triceps tendon repair rehabilitation overview1. Alnaji O, Erdogan S, Shanmugaraj A, et al. The surgical management of distal triceps tendon ruptures: a systematic review. J Shoulder Elbow Surg. 2022;31(1):217-224. doi:10.1016/j.jse.2021.06.019
2. Demirhan M, Ersen A. Distal triceps ruptures. EFORT Open Rev. 2017;1(6):255-259. doi:10.1302/ 2058-5241.1.000038
3. Jacobson JA. Musculoskeletal ultrasound: focused impact on MRI. Am J Roentgenol. 2009;193(3):619-627 doi:10.2214/ajr.09.2841
4. Woodhouse JB, McNally EG. Ultrasound of skeletal muscle injury: an update. Semin Ultrasound CT MRI 2011;32(2):91-100. doi:10.1053/j.sult.2010.12.002
5. Manske RC, Voight M, Wolfe C, Page P Using MSK Ultrasound in the evaluation of subscapularis injuries. Int J Sports Phys Ther. 2023;18(3):77406. doi:10.26603/001c.77406
6. Downey R, Jacobson JA, Fessell DP, Tran N, Morag Y, Kim SM. Sonography of partial-thickness tears of the distal triceps brachii tendon. J Ultrasound Med 2011;30(10):1351-1356. doi:10.7863/ jum.2011.30.10.1351
7 Moore RE. Sonography of the Extremities: Techniques and Protocols 4th ed. General Musculoskeletal Imaging Inc; 2023.
8. Chang A, Miller TT Imaging of tendons. Sports Health 2009;1(4):293-300. doi:10.1177/ 1941738109338361
9. Hock G. Distal triceps repair clinical practice guideline. The Ohio State University Wexner Medical Center. Published 2021. https://wexnermedical.osu.edu
10. Plisky PJ. Return to Sport/Activity & Discharge Criteria - Upper Extremity. Published online January 2021.
11. Army Combat Fitness Test. United States Army Accessed March 17, 2024. https://www.army.mil/acft/
12. Tom JA, Kumar NS, Cerynik DL, Mashru R, Parrella MS. Diagnosis and treatment of triceps tendon injuries: a review of the literature. Clin J Sport Med. 2014;24(3):197-204. doi:10.1097/ jsm.0000000000000010
13. Al-Shawi A, Badge R, Bunker T The detection of full thickness rotator cuff tears using ultrasound. J Bone Joint Surg Br 2008;90(7):889-892. doi:10.1302/ 0301-620x.90b7.20481
Matt Kelly1a , Josh Secomb2,3
1 Physiotherapy and Biomechanics, Sport Science Rehab and Performance Centre, 2 Applied Sports Science and Exercise Testing Laboratory, University of Newcastle Australia, 3 Active Living Research Program, Hunter Medical Research Institute
Keywords: femoroacetabular impingement, labrum, biomechanics, skating, shooting https://doi.org/10.26603/001c.116580
Femoroacetabular impingement (FAI), particularly cam morphology, is highly prevalent among elite hockey athletes. Moreover, hip and groin pain has become a common issue in hockey, with approximately 50% of European professional athletes reported to experience a hip or groin problem during a season. While most athletes will not miss training or competition due to this, restricted competitive performance and increased risk of reduced physical and psychological well-being are likely Recent research suggests that the development of cam morphology is related to the repetitive shear stresses experienced at the hip joint during adolescence from skating. This condition likely increases the potential for intra-articular and extra-articular injuries in these athletes later in their careers. Research also indicates that the hip joint mechanics during forward skating substantially increase the possibility of sustaining a labral tear compared to other sports. Such an injury can increase femoral head movement within the joint, potentially causing secondary damage to the iliofemoral ligament, ligamentum teres and joint capsule. These injuries and the high density of nociceptors in the affected structures may explain the high prevalence of hip and groin pain in hockey athletes. Compensatory adaptations, such as reduced hip strength, stability, and range-of-motion (ROM) likely increase the opportunity for core muscle injuries and hip flexor and adductor injuries. Specifically, the limited hip ROM associated with cam morphology appears to exacerbate the risk of these injuries as there will be an increase in pubic symphysis stress and transverse strain during rotational movements. It is hoped that this article will assist practitioners currently working with hockey athletes to develop evidence-informed monitoring strategies and training interventions, aimed at reducing the incidence and severity of hip and groin problems, ultimately enhancing athlete performance and well-being. Therefore, the purpose of this clinical commentary was to examine current evidence on common hip pathologies in hockey athletes, exploring potential associations between hip and groin pain and the biomechanics of hockey activities.
Level of Evidence
5
Hip and groin pain is a common issue in elite hockey,1,2 with approximately 50% of professional European hockey athletes reporting a hip or groin problem during a competitive season.3 Furthermore, during the 2014-15 to the 2018-19 collegiate hockey seasons, injuries to the hip and groin constituted the body region with the highest pro-
a
Corresponding Author: Matt Kelly
1051 Baxter Rd Unit 22B, Ottawa, ON, Canada, K2C 3P1 mkelly@hwhealth.com 1-343-574-1788
portion (~20%) of injuries sustained during practice.4 However, it is important to note that the majority of these (~50-60%) do not cause time-loss from training or competition.5,6 Nonetheless, on-going hip and groin pain can have debilitating long-term effects, such as increased dependency on medication, higher surgical intervention rates, and potentially early retirement.7‑9 While hockey athletes can still participate in training and competition, their per-
formance capacity is likely to be reduced.1,3 This diminished performance capacity can negatively impact their ability to showcase their skills to coaches and scouts, which may limit playing time and reduce their chances of being selected for higher competitive levels.
To address the high prevalence of hip and groin pain in hockey athletes, it is crucial to gain a deeper understanding of the underlying pathologies and injury mechanisms that may contribute to the development of such pathologies. The most common hip pathologies observed in elite hockey athletes include: femoroacetabular impingement (FAI), injuries to the non-contractile tissues including the labrum, iliofemoral ligament (IFL), and ligamentum teres (LT), as well as muscular injuries, such as core muscle injuries (CMI), hip flexor, and adductor injuries. Increased knowledge of the functional links between these pathologies, pain, and the biomechanics of key hockey activities will allow practitioners to develop evidence-informed monitoring strategies and training interventions aimed at reducing the likelihood or severity of these. Together, this may improve the athletes’ performance potential and overall well-being. Therefore, the purpose of this clinical commentary was to examine current evidence on common hip pathologies in hockey athletes, exploring potential associations between hip and groin pain and the biomechanics of hockey activities.
IMPINGEMENT
FAI is often considered a primary cause of hip and groin pain in hockey athletes and may contribute to the development of other hip and groin injuries.10 It is clinically characterized by symptoms of pain, clicking, catching and stiffness, as well as signs of limited hip range-of-motion (ROM), a positive impingement test, and radiographic evidence of cam or pincer morphology 11,12 Concerningly, Lerebours et al.13 identified that approximately 70% of elite hockey athletes fit the criteria for cam morphology. In addition, these athletes are reported to display significantly lower hip internal rotation (IR), external rotation (ER), total rotation, and flexion ROM, which can cause compensatory movement patterns during key activities including skating, shooting, and passing.12‑15 While there is evidence that the presence of cam morphology does not impact on-ice skating performance, such compensatory movements may alter the mechanics of the hip, thereby changing the mechanical forces experienced in this region and increasing the opportunity for future hip and groin injuries.16‑18
SKATING MECHANICS AND DEVELOPMENT OF FEMOROACETABULAR IMPINGEMENT
The exact mechanism for the development of FAI in athletes, and particularly hockey athletes, is yet to be fully understood. However, the most commonly proposed theory for the cause of cam morphologies in hockey athletes is the abutment of the femoral neck on the anterior aspect of the acetabular rim during the unique skating mechanics.13,19, 20 Research investigating potential causes of hip impingement has demonstrated that positions of end-range hip

flexion, adduction and IR are needed to induce contact between the femoral neck and acetabular rim, which are the combination of joint actions required during the stance and recovery phases of a skating stride (Figure 1).19,21,22 Specifically, Bedi et al.23 used computerized tomography scans to model dynamic hip impingement in 18 symptomatic FAI patients. It was identified that anterior impingement occurred in both a position of 85° of hip flexion with 15° of hip IR, as well as a position of 85° of hip flexion, with 5° of IR and 20° of hip adduction. Similarly, Han et al.24 utilized cadaver models and determined that the greatest anterior impingement occurred at 120° of hip flexion with maximal adduction and IR. However, current evidence suggests that typical skating mechanics may not necessarily achieve these joint angle combinations required to induce substantial impingement, and therefore, the development of FAI.
During a sprint skating start, it was identified that adolescent hockey athletes reached a maximum position of 44° of hip flexion, with concurrent IR of approximately 6° during the swing phase of a stride.19 Similarly, Renaud et al.21 reported that during the first two strides of a start, highcaliber skaters achieved joint angle positions of approximately 65-76° of hip flexion, with 5-16° of ER and 17-33° of hip abduction. Whereas, in the weight acceptance phase of steady state skating, the positions have been recorded as approximately 40-47° of hip flexion, with neutral hip abduction and slight ER.22,25 Although differences in acetabular and femoral version can lead to abutment within lesser hip joint angles,26 it is likely that only a small percentage of hockey athletes deviate substantially from the typical presentation for hip anatomy, compared to the high prevalence of FAI in this population.13 Based on these concurrent hip positions during sprint starts and steady state strides, it appears unlikely that hockey athletes are reaching the positions required for femoral neck abutment on
Figure 1. Hockey skating, as depicted via AI generated image.the acetabulum during forward skating. However, it is important to note that current research has only investigated the mechanics of forward skating, with further research required to better understand the hip joint actions and angles of other skating movements such as crossovers, tight turns, backward skating, and open hip maneuvers, which may achieve such positions.
Early sport specialization (ESS) is defined as intentionally focusing on a single sport for more than eight months of the year before the age of 12.27 Interestingly, there is limited evidence suggesting that ESS increases the likelihood of successful performance pathway progression in hockey 28 However, recent authors have suggested that it may have detrimental effects on an adolescent athlete’s hip health, potentially increasing the risk of cam morphology and FAI.27 Specifically, there is evidence suggesting that cam morphology often begins during periods of accelerated growth in early adolescence, particularly in hockey athletes.2,29 During adolescent growth spurts, and especially in males, the repetitive joint loading from intense sports activities evokes an increase in growth hormone, which leads to the proliferation and differentiation of chondrocytes into bone cells, making the epiphyseal plate more susceptible to adaptive changes.30 For example, Laor et al.31 identified that adolescent athletes with overuse knee injuries exhibited widening of the distal femur, and proximal tibia and fibula epiphyseal plates. This plate widening was attributed to hypertrophic chondrocytes extending into the metaphysis, which was likely caused by a disruption in blood supply from the repetitive trauma. Similarly, numerous authors have observed hypertrophic increases in femoral neck cartilage in adolescent athletes, which preceded epiphyseal extension and the development of a cam morphology 32,33
The activity level of adolescent athletes (12 to 14 years old) has been reported as a stepwise relationship with the magnitude of epiphyseal extension and alpha angle increase. For instance, it has been observed that adolescents who participated in organized sport more than three days per week or more than 12.5 hours per week, doubled their risk of developing a cam morphology 16,33 When considering the recent trend in adolescent hockey of a substantially increased proportion of ESS, and hence, greater onice practice time, it appears that this may help explain the high prevalence of cam morphologies observed in elite hockey athletes.34,35 Specifically, there are large-magnitude repetitive shear stresses applied to the proximal femur during skating, which the femoral cartilage has a low resistance to.36,37 This can lead to a disruption in blood supply and an increase in epiphyseal plate hypertrophy, particularly in a skeletally immature hip.36 The result is an altered epiphyseal plate shape, and eventually the formation of a callus, representing the presence of a cam morphology. Taken together, the evidence suggests it is not the specific mechanics of forward skating that likely explain the high prevalence of FAI in hockey athletes, but rather potentially
the repetitive shear stress applied to the femoral head, particularly during load sensitive periods in adolescence.37
To reduce the likelihood of early FAI, the adolescent hockey athlete should participate in a variety of physical activities, undertake appropriately designed resistance training programs, and have their workload monitored effectively during the reported high-risk phase of 12 to 14 years of age. Such strategies may help reduce the prevalence, or at least delay the development and severity of cam morphology in these athletes by ensuring that a wider variety of loading patterns and stimuli are applied to the femoral head, with adequate rest provided from repetitive stresses. However, despite the high prevalence of cam morphology in elite hockey athletes, several authors have shown limited associations between cam morphology and hip and groin pain, which is a significant performance limiter 35,38 This suggests that cam morphology may not be a direct cause of pain in hockey athletes. Rather, there are various concomitant intra-articular and extra-articular hip pathologies observed in hockey athletes alongside cam morphology, providing a potential explanation of this pain and indicating an indirect relationship. These pathologies include labral, IFL, and LT tears, CMI, and hip flexor and adductor injuries.35
Intra-articular injuries accounted for 10.6% of all hip and groin injuries in the NHL over four seasons (2006-2010).35 Furthermore, hip labrum tears have been identified in 56-69% of elite hockey athletes,35,38 while LT tears have been reported in 26 out of 28 (~93%) professional hockey athletes’ hips in one study.2 These structures, along with the IFL, have of a large distribution of nociceptors, which elicit a pain response if damaged.39 Furthermore, these non-contractile tissues also play an integral role as passive hip stabilizers, which serve to increase hip joint stability and reduce femoral head translation.40 Given the high incidence of both hip and groin pain in hockey athletes and the presence of non-contractile tissue pathology on imaging, it is possible that the majority of hockey athletes’ hip and groin pain is initiated by an intra-articular hip injury.35 This may also elicit a type of hip microinstability that can increase the opportunity of further hip and groin injuries, and therefore, additional pain.41
The hip positions reported to cause the greatest magnitude of compressive and shearing forces on the labrum are positions of: approximately 60° of hip flexion with slight IR, a combined position of hip ER and extension, and hip abduction at an angle of 40° or greater.21,25,42‑45 These all increase labral tissue deformation and can result in damage to this structure and other non-contractile tissues through acute or overuse mechanisms.21 Importantly, during the push-off phase of the skating stride, hip extension, abduction and ER are combined to generate forward propulsion, whereas during stride recovery the combination of hip flex-
ion, adduction and IR is required.19,21,22,25 Therefore, forward skating mechanics likely explain the high prevalence of hip labrum injuries.
Hip labrum tears in hockey athletes typically occur in the antero-superior region.35,46 In this region, the anterior fibers of the labrum attach parallel to the bony acetabulum, making them less resistant to shearing forces and more susceptible to injury 47,48 Importantly, the presence of femoral head asphericity, as observed with cam morphology, further reduces the resistance of these fibers to the shearing forces.40,47 As such, the incidence and location of labrum tears in hockey athletes’ hips are likely preceded by the development of a cam morphology, which in combination with the repetitive skating mechanics, can lead to delamination of the labrum from the acetabulum in the antero-superior region.46
The IFL is recognized as the strongest of the three capsular ligaments, and in combination with the labrum provides substantial passive stability to the hip, particularly in limiting excessive hip extension and ER.49 As described above, the cyclical loading pattern during the push-off and recovery phases of the skating stride will likely induce stressrelaxation of the labrum, potentially leading to a labrum tear 46 This subsequently increases the reliance on the IFL and LT to provide passive stabilization of the hip, which may eventually result in fatigue-failure of these tissues too.21,27,50 The data of Johanssen et al.51 supports this suggestion, as it was observed that repetitive hip extension combined with ER induced substantial IFL tissue creep, which is the progressive lengthening of soft tissue that has been subjected to constant load. If these loads are sustained over a long duration of time with minimal recovery (or unloaded) durations, the elastic behavior of the tissues can be reduced, resulting in viscous-like behaviors, and hence, more permanent lengthening.49 Considering the substantial on-ice training durations and cyclical loading patterns of skating, tissue creep of these crucial non-contractile tissues appears likely, particularly in the hockey athlete with a labral injury
The combination of a labrum tear and IFL lengthening is reported to allow for significantly greater femoral head translation (~2mm), compared to one of these injuries in isolation.49,51 Recent research by Kalisvaart et al.52 defined this increase in femoral head translation relative to the acetabulum as hip microinstability and noted that it is associated with eventual damage of each of the labrum, cartilage, and capsular structures. Therefore, a hockey athlete with a labrum tear and IFL lengthening, is likely to experience an increase in femoral head translation during skating, which will subsequently increase the strain on the capsule and LT. This may lead to failure of the LT as a secondary restraint on femoral head motion, further exacerbating the potential magnitude of femoral head translation during these movements and increasing the opportunity of osteochondral damage and perception of pain.53,54 Together, this evidence suggests that a hockey athlete with cam morphology is likely to exhibit an increased risk of a labrum tear due to the repetitive forward skating mechanics combined with femoral head asphericity. If a labrum tear occurs, there will
be an increased reliance on the IFL, LT and capsule to provide passive stabilization to the hip, thereby increasing the strain on and risk of subsequent failure of these tissues.40
While potential relationships between hip microinstability and pain are still not understood, there is evidence suggesting a potential connection.52 As the anterior labrum, IFL and LT contain a large distribution of mechanoreceptors and nociceptors, they are crucial structures for hip joint proprioception and stability, and also highly efficient in transmitting pain signals to the central nervous system (CNS).39,54 Therefore, damage to the labrum, and potential IFL and LT lengthening, will likely compromise the feedback loop to the CNS, resulting in poor hip joint proprioception, reduced passive and active stability and exacerbated femoral head translation. Together, this will likely increase tissue irritation, inflammation, and pain in the labrum, IFL and LT, as well as potential osteochondral damage.54 Importantly, it has been identified that bony hip deformities, joint capsule laxity, and muscle dysfunction or imbalance are likely to exacerbate the strain on the anterior hip joint.41,55 As such, a large proportion of hip and groin pain experienced by hockey athletes may be due to a constant cycle of poor mechanoreceptor feedback from a torn labrum, lengthened IFL or LT, and inadequate feedforward adjustments from the stabilizing muscles of the hip, resulting from hip microinstability
Panjabi’s model of joint stability emphasizes the interplay between the passive, neural, and active sub-systems to optimize joint stability 56 Consequently, deficits in the labrum and ligamentous tissues (passive sub-system) will result in joint instability However, the inherent protective mechanism of the body is to compensate with the neural and active sub-systems, by way of muscle guarding.49 This guarding can effectively limit excessive femoral head movement and improve overall joint stability, yet the increased muscle activation and tension may result in greater muscular imbalances and tightness around the hip.49,57 The presence of hip microinstability has been reported to cause joint capsule thickening, and importantly, such an increase in anterior hip capsule thickness has been associated with significantly reduced hip flexion and IR ROM in patients with FAI.58,59 Together, this highlights that microinstability of the hip joint appears to evoke a protective mechanism, whereby the muscular and capsular structures respond with adaptations that may further limit hip ROM in a variety of joint actions. While the concept of hip microinstability in hockey athletes is not commonly discussed, practitioners working with these athletes should consider the use of targeted exercise interventions aimed at restoring or improving hip joint ROM and reducing muscular strength imbalances or joint action-specific weakness when they are identified. Specifically, interventions targeting the strength and coordinated co-contraction of the “hip rotator cuff” (deep hip rotators, gluteus medius, gluteus minimus), as well as the iliopsoas and piriformis are believed to increase joint compression and joint stability Additionally, it
is crucial that any inert tissue pathology is appropriately reviewed and treated.
Patients with hip and groin pain often display reduced hip strength, changes in muscle activation patterns, and decreased muscle cross-sectional area.12,57,60‑62 These adaptations will likely further reduce hip joint stability and may increase the risk of hip and groin injuries, particularly during movements that exert high stresses on the lumbopelvic complex. This reduced potential of the musculoskeletal system to withstand load is particularly relevant for multi-directional sport athletes, where repetitive changes-of-direction and forceful accelerations and decelerations can strain the lumbopelvic complex and lead to sports-related groin pain (SRGP).63 In addition to the multi-directional nature, the mechanics of shooting and forward sprint skating appear to be significant contributors to the development of three highly prevalent muscular injuries of the lumbopelvic region in hockey: CMI, and hip flexor and adductor injuries. These injuries, with a combined annual prevalence of approximately 20 injuries per 100 elite hockey athletes, can result in significant time-loss from training and competition.64
It is important to recognize that hip and groin pain can result from both pelvic-related or intra-articular hip injuries, and assessments such as the resisted adduction situp test have been reported effective in differentiating these pathologies.65 Crucially, pelvic-related injuries can result in uneven contractile abilities between the adductor and lower abdominal muscles, increasing the risk of further soft tissue damage. Conversely, the restricted hip ROM and reduced strength associated with intra-articular injuries, will likely lead to compensatory movements during key hockey activities. Regardless of the underlying pathology, both are likely to significantly alter the mechanics in the lumbopelvic region of the hockey athlete, further increasing the strain on the musculoskeletal system and increasing the risk of these highly prevalent extra-articular hip injuries.
CMI, characterized by the presence of pain to the groin and lower abdominal regions, are considered overuse injuries resulting from repetitive, high-force rotational movements around the lumbopelvic region, particularly when such activities occur over a fixed lower extremity.66‑68 The pubic symphysis acts as a fulcrum for the forces generated by the muscles at the anterior pelvis, with the arcuate ligament recognized as the primary stabilizing ligament of this joint. Therefore, these structures are of great importance for the hockey athlete, as the repetitive rotational activities during hockey, such as shooting and skating, generate substantial shearing forces across the pubic symphysis, the arcuate ligament, and between the parallel tissue fibers.69,70 Due to the commonality of the tendons between the: external oblique and adductor longus (AL), the rectus abdo-
minis (RA) with the adductor brevis (AB) and gracilis, and the transversus abdominis and internal oblique (known as the “conjoint tendon”), CMI can involve disruption to the musculature, fascia or tendons of these adductor or lower abdominal muscles.65,71,72 However, it is becoming increasingly common in the literature for CMI surgical interventions to involve repair of the pubic aponeurotic complex, which is the region where the above described muscles, along with the inguinal ligament and pectineus converge on the pubis.65,73
High-level hockey athletes may be at an increased risk of a CMI due to the significant transverse strain experienced at the pubic symphysis, particularly with the presence of FAI.74 Specifically, the limited hip IR ROM often associated with cam morphology, is reported to significantly increase this shearing force and transverse plane movement during high-force rotational movements.74 This will substantially increase the opportunity for disruption of the numerous components of the aponeurotic complex.70 Supporting this proposed association was the finding that among 38 professional athletes from various sports diagnosed with a symptomatic CMI, 39% (15/38) had all symptoms resolve following FAI corrective surgery alone. Furthermore, the 12 athletes that had previously received surgery for the CMI alone were only able to return to competition following additional surgery to correct the FAI.70 Thus, the reduction in hip IR ROM associated with cam morphology may explain the relatively high prevalence of CMI in hockey athletes, particularly during the key activities of shooting and skating.64
A higher shot velocity requires significantly greater peak trunk rotation away from the puck during the wind-up phase of shooting, to evoke a stretch-shortening cycle action of the trunk muscles.75 This increases the rotational acceleration of the trunk, and hence, the ability to apply a greater impulse to the puck. As the rotation occurs over a fixed lower extremity, the result is a forceful IR of the head of the femur on the ipsilateral side of the body that the shot is directed towards.76 If the athlete has a cam morphology on this side, there will likely be a substantial increase in the transverse strain experienced at the pubic symphysis, arcuate ligament and aponeurotic complex.74 Additionally, during the follow through of the shot a rapid lengthening of the internal oblique and transversus abdominis occurs on the contralateral side, due to the eccentric strength requirements at end range needed to decelerate the trunk.
For an athlete with inadequate trunk muscle strength, motor control or rotational ROM, there could be an increase in the risk of disruption to the abdominal muscles and the conjoint tendon.
Current evidence suggests that more than 30% of hockey athletes have RA-adductor dysfunction on MRI, and the mechanics of forward sprint acceleration strides may help explain this prevalence.38,66,71,77 Higher-caliber hockey athletes utilize significantly greater hip extension ROM and angular velocity, combined with increased pelvic tilt and trunk rotation during acceleration strides.25,78,79 Importantly, Economopoulos et al.77 reported that repetitive hip hyperextension combined with trunk and pelvic rotation
leads to significant degradation of the RA and adductor tendons. Concerningly, partial disruption of one of these tendons can lead to an uneven distribution of contractile force between the AL and RA. This imbalance further increases the shearing force at the pubic symphysis, particularly at the enthesis of the RA inferior fibers, potentially resulting in a CMI.
During abrupt changes-of-direction, hockey athletes initiate deceleration by rotating the trunk towards the intended direction of the turn, immediately prior to lowering their center-of-mass using a combination of trunk, hip, and knee flexion.80 Simultaneously, there is a deliberate movement of ipsilateral trunk lateral flexion towards the outside leg, along with hip IR, to increase friction between the skate blades (which are perpendicular to the direction of travel) and the ice, facilitating more rapid deceleration. This combined trunk action of contralateral rotation and ipsilateral lateral flexion, with hip IR of the outside leg, will likely increase the eccentric lengthening and force on the contralateral trunk muscles and ipsilateral adductor muscles, which together may increase the likelihood of RAadductor dysfunction, particularly in athletes with insufficient lumbopelvic control or strength. Interestingly, it has been reported that following effective rehabilitation from SRGP, athletes can demonstrate reduced pelvic drop and ipsilateral trunk lateral flexion during a continuous side-toside hop task, which may decrease the force experienced at the anterior pelvis, reducing the opportunity of RA-adductor dysfunction.81 Therefore, targeted training prescription aimed at enhancing lumbopelvic control and strength is likely beneficial for hockey athletes.
Lastly, higher-caliber hockey athletes are reported to apply hip abduction force with greater angular velocity through an increased ROM (up to 50° of hip abduction) during propulsive strides, when compared to lower-caliber athletes.21,82,83 While the application of hip abduction force through this large ROM significantly increases strain on the labrum, it may also increase the opportunity of muscular injuries to the hip and groin, particularly in the presence of an intra-articular injury or cam morphology 44,45 A hockey athlete with restricted hip ROM or reduced strength in abduction or extension, will likely utilize compensatory movement strategies to generate the required impulse into the ice surface to achieve a high sprint skating velocity 61, 79,84,85 These strategies typically involve increased ipsilateral rotation and anterior tilting of the lumbopelvic region to compensate for limited abduction or extension ROM, while also facilitating visual scanning during play 61,84,86
The abduction and extension demands of the hockey stride lengthens the adductors, while the increased pelvic tilt and ipsilateral lumbopelvic rotation will elongate the lower abdominal muscles on the propulsive leg. Together, these requirements likely increase the strain on these muscles and their common tendons, further enhancing the opportunity of a CMI or RA-adductor dysfunction. This strain will be further magnified with the presence of femoral head asphericity, limited hip ROM, or if these skating mechanics are combined with activities that exacerbate the trunk ro-
tation demands, such as passing, shooting and body checking.74
Hip flexor and adductor injuries are highly prevalent in hockey and can significantly limit both short-term and long-term performance.64,87‑89 Notably, hip flexor strains have been reported as high as 2.47 per 10,000 athlete exposures in collegiate-level hockey athletes, with these athletes also more susceptible to adductor strains compared to their counterparts in other sports.88,89 While only ~24% of hip flexor strains and ~55% of adductor injuries result in significant time-loss from training and competition, indicating that athletes can still perform, albeit at a lower performance level, the unique skating mechanics and potential intra-articular hip injuries may increase the likelihood of hip flexor and adductor injuries.1,3
Although limited research has examined the risk factors for hip flexor injuries in hockey athletes, hip flexor discomfort can be a common complaint and incite a similar pain response to adductor strains.87 The hip flexors are essential for rapid recovery of the leg under the pelvis during a skating stride, however, it is likely that the majority of discomfort is related to tissue irritation as opposed to a muscular strain.25 Importantly, the hip flexors are crucial for both stabilization of the femoral head, as well as limiting excessive hip extension ROM. As a result, damage to the labrum or lengthening of the IFL, may increase the reliance on these muscles to provide the required stability and restraint, potentially leading to increased muscular tightness.90 Therefore, compression of the iliopsoas against the acetabulum to stabilize the femoral head anteriorly, may result in hip and groin pain due to inflammation of the posterior iliopsoas tendon and acetabular labrum.91 Furthermore, restricted iliopsoas length to limit hip extension ROM can also cause irritation and audible popping as the iliopsoas tendon moves laterally over the iliopectineal eminence or femoral prominence (“coxa saltans”).92 This highlights the importance of screening and regularly monitoring hip extension ROM and hip flexor strength in the hockey athlete.
Originally emphasized by Chang, Turcotte and Pearsall,43 the importance of the adductor magnus (AM) in sprint skating was highlighted with hockey athletes displaying greater activation with increased sprint skating speed and peak activation at ice-contact, suggesting a role in hip stability for single leg stance. Additionally, the AM experienced a greater peak at the end of the propulsive phase, highlighting that the greatest demand on the adductor occurs in a lengthened position. Therefore, the repetitive high-force concentric and eccentric actions during the propulsive and recovery phases of the skating stride may lead to acute strains of the adductor muscles, or the accumulation of fatigue and potential overuse injuries at the musculotendinous junction (MTJ) or tendon.93
The AL is the most typically injured adductor muscle during high-force movements, and research indicates that its proximal tendon exhibits significantly reduced vascularity when compared to the AB and gracilis.71,94,95 This raises
the possibility that AL injuries in hockey are commonly associated with tendinopathy or an incomplete and delayed repair at or near the MTJ, where force requirements are high.43 Considering the highly fibrocartilaginous nature of the tendons and entheses of the AL, AB, AM and gracilis, which provide additional strength in the direction of stress, it appears that the contractile components of the adductors may be more susceptible to injury when there is limited ROM or a lack of muscular strength at end range.71 As such, the reduced hip muscle function typically associated with intra-articular hip injuries will likely cause hockey athletes to reach their upper limit of abduction ROM earlier during skating strides, further highlighting the importance of optimizing hip strength and ROM.12,57,60‑62
The primary factor associated with future adductor strain injury risk has been reported as an adduction to abduction strength ratio of less than 80%.87 Additionally, preseason adductor injuries in semi-professional hockey athletes have been associated with lower hip abduction ROM and a greater magnitude of decline in adductor strength at a joint-angle position of 50° of hip abduction compared to a position of 25° of hip abduction, when compared to an uninjured cohort.96 Due to the trunk position required to maintain equilibrium during change-of-direction efforts while skating, it is theorized that this increases the eccentric load on the pubic symphysis and adductor muscles.81 Therefore, the reduced hip strength and muscle strength imbalances associated with cam morphology, intra-articular hip injuries, and the presence of hip and groin pain may increase the opportunity of adductor injuries in hockey athletes.1,87,96 Importantly, Suits et al.97 recently identified that hip total rotation ROM, adductor strength and the adduction to abduction strength ratio was significantly reduced following a single on-ice training session. Therefore, with the presence of fatigue or RA-adductor dysfunction there may be a reduced ability to withstand the substantial loads experienced during forward sprint skating and change-of-direction efforts.94,95,98 As such, prescribing training aimed at increasing the adduction to abduction strength ratio, enhancing adductor joint angle-specific strength, and improving or maintaining total rotation, abduction and extension ROM of the hip, are suggested to potentially mitigate the opportunity and severity of these injuries in hockey athletes.
Future research should aim to establish normative ROM and strength data for the trunk and hips in the joint actions specific to hockey athletes. Whilst reductions in hip rotation ROM and adductor strength have been reported following on-ice training, additional research is required to determine whether these reductions are associated with an increased risk of intra-articular hip injuries, CMI, or hip flexor and adductor injuries. In the absence of such research, it is recommended that practitioners screen and monitor hockey athletes’ ROM and strength in the key joint actions and utilize evidence-informed and experiencebased judgement to benchmark the data and prescribe targeted exercise interventions aimed at mitigating injury risk. Based upon the current literature and anecdotal evidence, the authors suggestions for screening and monitoring as-
sessments and target values are provided in Table 1 and Figures 2 and 3.
FAI is highly prevalent in hockey, with most elite-level hockey athletes exhibiting cam morphology Previously attributed to the unique skating mechanics, recent research suggests that repetitive joint loading during adolescence, particularly between the ages of 12 to 14 years old, plays a pivotal role in the development of cam morphology in these athletes. Specifically, large shear stresses on the femoral head during skating may disrupt blood flow to the epiphyseal plate, leading to hypertrophic chondrocytes in this region, and eventually callus formation and a cam morphology. Given the increasing incidence of ESS and early-onset hip and groin issues in hockey, early intervention is crucial. Strategies including managing the intensity and volume of hockey activities, promoting participation in other sports, prescribing comprehensive physical training, and developing a variety of movement literacy skills, are suggested to expose the tissues to a variety of loads and allow for adequate recovery from repetitive stresses.
Over half of elite hockey athletes experience hip and groin pain, which are likely attributed to intra-articular hip injuries that result from the unique skating mechanics and are exacerbated by cam morphology. These injuries affect the passive stabilizers of the hip, such as the labrum and ligamentous tissues, which can reduce joint stability and heighten pain perception, due to the large distribution of nociceptors and mechanoreceptors. If tissue creep of the IFL and LT occurs there can be greater femoral head translation, exacerbating pain due to tissue irritation and potential osteochondral damage. The inherent protective mechanism involves increased muscular activation and tension, likely resulting in capsular tightness and reduced hip joint ROM and strength. Moreover, the combination of restricted hip ROM and strength associated with cam morphology, along with fatigue, can evoke compensatory strategies during skating and shooting, contributing to the high prevalence of CMI and hip flexor and adductor injuries in hockey athletes. Specifically, limited hip IR ROM increases shearing forces at the pubic symphysis during rotational movements, exacerbating strain at the aponeurotic complex, while factors such as hip and groin pain, intra-articular injuries, or fatigue may further worsen joint angle-specific weaknesses and increase the risk of adductor strains.
The authors report no conflicts of interest.
Submitted: December 11, 2023 CDT, Accepted: March 29, 2024 CDT
© The Author(s)
Table 1. Suggested screening and monitoring assessments for the hockey athlete, with target values.
Physical
Hip Abduction ROM
Hip Extension ROM
Hip Flexion ROM
• Facilitates a complete forward sprint skating stride:
◦ Insufficient ROM can result in greater likelihood that upper-limit of adductor strength at end range is achieved during stride (adductor injury)
• Facilitates a complete forward sprint skating stride:
◦ Insufficient ROM can result in compensation with anterior pelvic tilting (CMI or hip flexor injury) or excessive hip abduction (adductor injury)
• Facilitates a complete leg recovery following a propulsive stride:
◦ Insufficient ROM may be indicative of intra-articular pathology or a result of anterior translation of the femoral head or a lack of posterior glide of the femoral head during hip flexion
Supine active hip abduction with 0° hip and knee flexion (Figure 2A)
Prone active hip extension with 0° knee flexion (Figure 2B)
Hip IR and ER ROM
Trunk Rotation ROM
• Required for rapid changes-of-direction, forwards to backwards transitions, performance of open hip maneuvers (puck protection and “Mohawk” turns), and shooting:
◦ Insufficient ROM may result in greater shearing force across pubic symphysis (CMI) or strain in the joint (intra-articular injury)
• Facilitates trunk acceleration and deceleration during high-force rotational activities (shooting and body checking):
◦ Insufficient ROM may place excessive strain on the abdominal muscles during eccentric contractions or stretch-shortening cycle (CMI)
Supine active hip flexion (Figure 2C)
Hip Abduction and Adduction Strength
• Contributes to the impulse generated into the ice surface during propulsive strides (abduction), and decelerates and returns the propulsive leg under the pelvis (adduction):
◦ Insufficient adduction strength relative to abduction strength can increase likelihood of acute or overuse adductor injury
ROM= range of motion, CMI= Core muscle injury, IR=internal rotation, ER=external rotation, BW=body weight, ADD= adduction, ABD=abduction
Supine active unilateral IR and ER with 90° hip and knee flexion (Figure 2D and 1E, respectively)
≥ 30° each leg, ER: ≥ 60° each leg,
90°
Seated active trunk rotation with 90° hip and knee flexion (Figure 2F)
Bilateral isometric assessments with fixed load cells or strain gauge:
For greater face validity to force application during skating:
Supine with 0° hip and knee flexion and force applied at ankles (Figure 3A)
40° each side
0.30xBW, ADD:ABD: > 1.20
ADD and ABD relative peak force: ≥ 0.60xBW, ADD:ABD: >1.05
For reduced athlete discomfort and perceived injury risk: Seated with 90° hip and knee flexion (Figure 3B) or supine with 60° hip flexion and force applied at knees (Figure 3C) ADD and ABD relative peak force:
Associations Between Hip Pathology, Hip and Groin Pain, and Injuries in Hockey Athletes: A Clinical Commentary
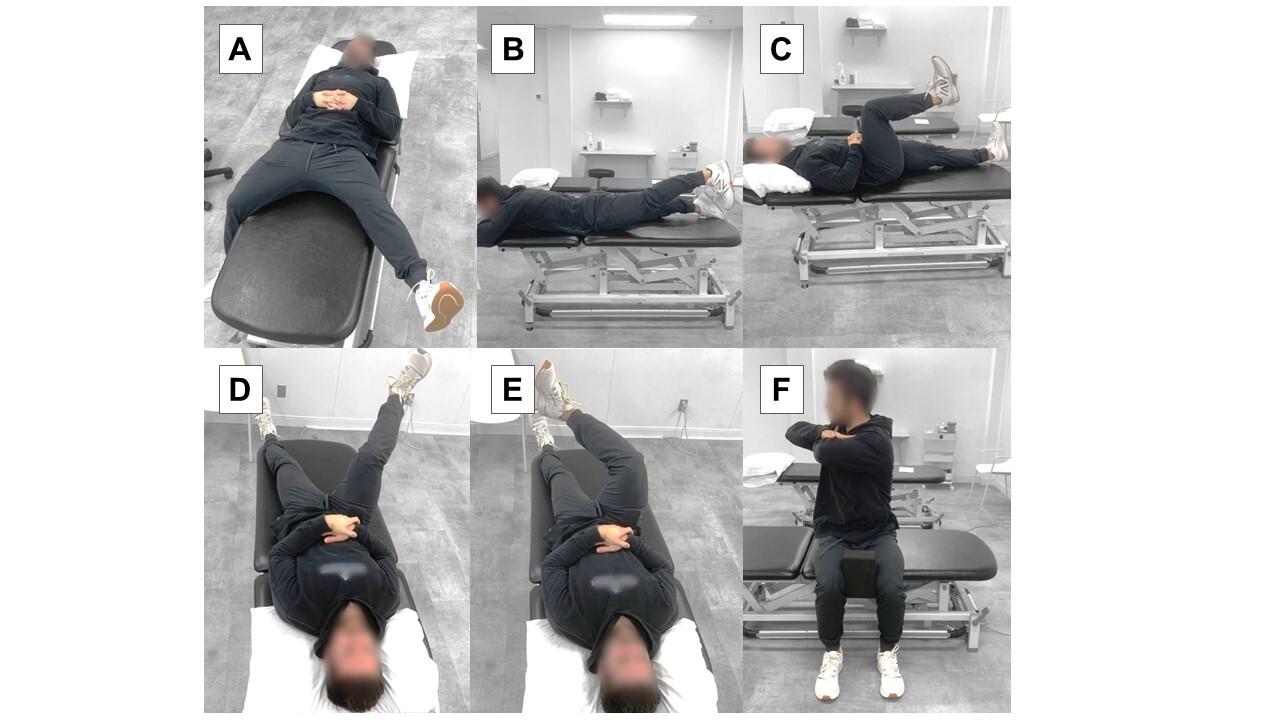
2. The positions for the active range-of-motion assessments for: hip abduction (A), hip extension (B), hip flexion (C), hip internal rotation (D), hip external rotation (E), and trunk rotation (F).
Figure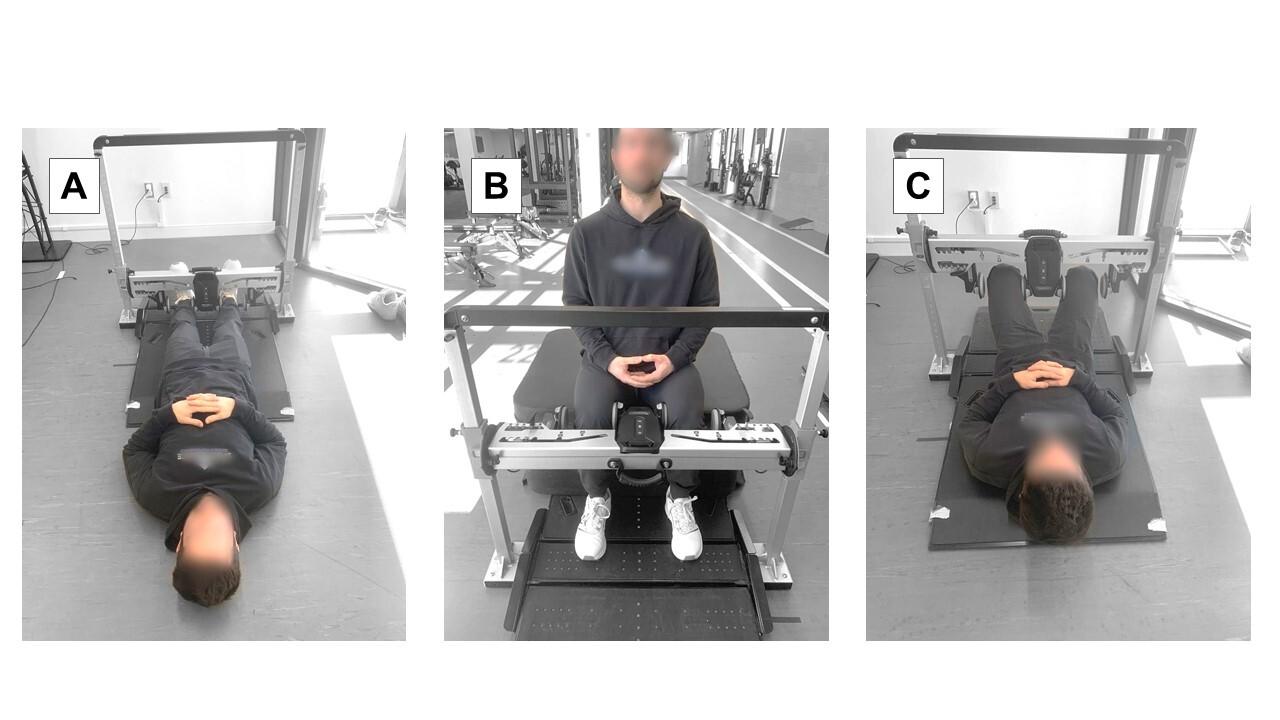
Figure 3. The positions for the bilateral hip abduction and adduction strength assessments for: supine with 0° hip and knee flexion and force applied at ankles (A), seated with 90° hip and knee flexion and force applied at knees (B), and supine with 60° hip and 90° knee flexion and force applied at knees (C).
Associations Between Hip Pathology, Hip and Groin Pain, and Injuries in Hockey Athletes: A Clinical Commentary
This is an open-access article distributed under the terms of the Creative Commons Attribution 4.0 International License (CCBY-NC-4.0). View this license’s legal deed at https://creativecommons.org/licenses/by-nc/4.0 and legal code at https://creativecommons.org/licenses/by-nc/4.0/legalcode for more information.
1. Oliveras R, Bizzini M, Brunner R, Maffiuletti NA. Field-based evaluation of hip adductor and abductor strength in professional male ice hockey players: Reference values and influencing factors. Phys Ther Sport 2020;43:204-209. doi:10.1016/ j.ptsp.2020.03.006
2. Philippon MJ, Ho CP, Briggs KK, Stull J, LaPrade RF. Prevalence of increased alpha angles as a measure of cam-type femoroacetabular impingement in youth ice hockey players. Am J Sports Med 2013;41(6):1357-1362. doi:10.1177/ 0363546513483448
3. Wörner T, Thorborg K, Eek F. High prevalence of hip and groin problems in professional ice hockey players, regardless of playing position. Knee Surg Sports Traumatol Arthrosc 2020;28(7):2302-2308. doi:10.1007/s00167-019-05787-7
4. Boltz AJ, Nedimyer AK, Chandran A, Robison HJ, Collins CL, Morris SN. Epidemiology of injuries in National Collegiate Athletic Association men’s ice hockey: 2014–2015 through 2018–2019. J Athl Train. 2021;56(7):703-710. doi:10.4085/1062-6050-611-20
5. Wörner T, Thorborg K, Clarsen B, Eek F. Incidence, prevalence, and severity of and risk factors for hip and groin problems in Swedish male ice hockey players: A 1-season prospective cohort study J Athl Train. 2022;57(1):72-78. doi:10.4085/ 1062-6050-0522.20
6. Wörner T, Thorborg K, Eek F. Five-second squeeze testing in 333 professional and semiprofessional male ice hockey players: how are hip and groin symptoms, strength, and sporting function related? Orthop J Sports Med. 2019;7(2):2325967119825858. doi:10.1177/2325967119825858
7 King E, Ward J, Small L, Falvey E, Franklyn-Miller A. Athletic groin pain: a systematic review and metaanalysis of surgical versus physical therapy rehabilitation outcomes. Br J Sports Med 2015;49(22):1447-1451. doi:10.1136/ bjsports-2014-093715
8. Hölmich P, Phillips M, Heaven S, et al. Athletic groin pain: a systematic review of surgical diagnoses, investigations and treatment. Br J Sports Med 2016;50(19):1181-1186. doi:10.1136/ bjsports-2015-095137
9. Lindman I, Löfskog M, Öhlin A, et al. Return to sport for professional and subelite ice hockey players after arthroscopic surgery for femoroacetabular impingement syndrome. Orthop J Sports Med 2022;10(5):23259671221089984. doi:10.1177/ 23259671221089984
10. Ayeni OR, Banga K, Bhandari M, et al. Femoroacetabular impingement in elite ice hockey players. Knee Surg Sports Traumatol Arthrosc. 2014;22(4):920-925. doi:10.1007/s00167-013-2598-5
11. Griffin DR, Dickenson EJ, O’Donnell J, et al. The Warwick Agreement on femoroacetabular impingement syndrome (FAI syndrome): an international consensus statement. Br J Sports Med 2016;50(19):1169-1176. doi:10.1136/ bjsports-2016-096743
12. Nepple JJ, Goljan P, Briggs KK, Garvey SE, Ryan M, Philippon MJ. Hip strength deficits in patients with symptomatic femoroacetabular impingement and labral tears. Arthroscopy 2015;31(11):2106-2111. doi:10.1016/j.arthro.2015.04.095
13. Lerebours F, Robertson W, Neri B, Schulz B, Youm T, Limpisvasti O Prevalence of cam-type morphology in elite ice hockey players. Am J Sports Med. 2016;44(4):1024-1030. doi:10.1177/ 0363546515624671
14. Larson CM, Ross JR, Kuhn AW, et al. Radiographic hip anatomy correlates with range of motion and symptoms in National Hockey League players. Am J Sports Med. 2017;45(7):1633-1639. doi:10.1177/ 0363546517692542
15. Bedi A, Dolan M, Hetsroni I, et al. Surgical treatment of femoroacetabular impingement improves hip kinematics: a computer-assisted model. Am J Sports Med 2011;39(S1):43-49. doi:10.1177/ 0363546511414635
16. Tak I, Weir A, Langhout R, et al. The relationship between the frequency of football practice during skeletal growth and the presence of a cam deformity in adult elite football players. Br J Sports Med. 2015;49(9):630-634. doi:10.1136/ bjsports-2014-094130
17. Kloskowska P, Morrissey D, Small C, Malliaras P, Barton C. Movement patterns and muscular function before and after onset of sports-related groin pain: a systematic review with meta-analysis. Sports Med. 2016;46(12):1847-1867 doi:10.1007/ s40279-016-0523-z
18. Brunner R, Maffiuletti NA, Casartelli NC, et al. Prevalence and functional consequences of femoroacetabular impingement in young male ice hockey players. Am J Sports Med. 2016;44(1):46-53. doi:10.1177/0363546515607000
19. Stull JD, Philippon MJ, LaPrade RF. “At-risk” positioning and hip biomechanics of the Peewee ice hockey sprint start. Am J Sports Med. 2011;39(S1):29-35. doi:10.1177/0363546511414012
20. Cruz CA, Kerbel Y, Smith CM, Prodromo J, Trojan JD, Mulcahey MK. A sport-specific analysis of the epidemiology of hip injuries in National Collegiate Athletic Association athletes from 2009 to 2014. Arthroscopy. 2019;35(9):2724-2732. doi:10.1016/ j.arthro.2019.03.044
21. Renaud PJ, Robbins SMK, Dixon PC, Shell JR, Turcotte RA, Pearsall DJ. Ice hockey skate starts: a comparison of high and low calibre skaters. Sports Eng 2017;20(4):255-266. doi:10.1007/ s12283-017-0227-0
22. Kaartinen S, Venojärvi M, Lesch KJ, Tikkanen H, Vartiainen P, Stenroth L. Lower limb muscle activation patterns in ice-hockey skating and associations with skating speed. Sports Biomech 2021;1:1-16. doi:10.1080/14763141.2021.2014551
23. Bedi A, Dolan M, Magennis E, Lipman J, Buly R, Kelly BT Computer-assisted modeling of osseous impingement and resection in femoroacetabular impingement. Arthroscopy. 2012;28(2):204-210. doi:10.1016/j.arthro.2011.11.005
24. Han S, Owens VL, Patel RV, et al. The continuum of hip range of motion: From soft-tissue restriction to bony impingement. J Orthop Res 2020;38(8):1779-1786. doi:10.1002/jor.24594
25. Upjohn T, Turcotte R, Pearsall DJ, Loh J. Threedimensional kinematics of the lower limbs during forward ice hockey skating. Sports Biomech 2008;7(2):206-221. doi:10.1080/14763140701841621
26. Tannenbaum EP, Zhang P, Maratt JD, et al. A computed tomography study of gender differences in acetabular version and morphology: implications for femoroacetabular impingement. Arthroscopy 2015;31(7):1247-1254. doi:10.1016/ j.arthro.2015.02.007
27. Sheppard M, Nicknair J, Goetschius J. Early sport specialization and subjective hip and groin dysfunction in collegiate ice hockey athletes. J Athl Train 2020;55(3):232-237 doi:10.4085/ 1062-6050-0375-19
28. Black S, Black K, Dhawan A, Onks C, Seidenberg P, Silvis M. Pediatric sports specialization in elite ice hockey players. Sports Health 2019;11(1):64-68. doi:10.1177/1941738118800446
29. Hanke MS, Schmaranzer F, Steppacher SD, Reichenbach S, Werlen SF, Siebenrock KA. A cam morphology develops in the early phase of the final growth spurt in adolescent ice hockey players: results of a prospective MRI-based study Clin Orthop Relat Res. 2021;479(5):906-918. doi:10.1097/ corr.0000000000001603
30. Mirtz TA, Chandler JP, Eyers CM. The effects of physical activity on the epiphyseal growth plates: a review of the literature on normal physiology and clinical implications. J Clin Med Res 2011;3(1):1-7 doi:10.4021/jocmr477w
31. Laor T, Wall EJ, Vu LP. Physeal widening in the knee due to stress injury in child athletes. Am J Roentgenol 2006;186(5):1260-1264. doi:10.2214/ ajr.04.1606
32. Palmer A, Fernquest S, Gimpel M, et al. Physical activity during adolescence and the development of cam morphology: a cross-sectional cohort study of 210 individuals. Br J Sports Med 2018;52(9):601-610. doi:10.1136/bjsports-2017-097626
33. Polat G, Arzu U, Dinç E, Bayraktar B. Prevalence of femoroacetabular impingement and effect of training frequency on aetiology in paediatric football players. HIP Int. 2019;29(2):204-208. doi:10.1177/ 1120700018781939
34. De Bosscher V, Descheemaeker K, Shibli S. Starting and specialisation ages of elite athletes across olympic sports: An international crosssectional study Eur J Sport Sci 2023;3(5):9-19.
35. Epstein DM, McHugh M, Yorio M, Neri B. Intraarticular hip injuries in National Hockey League players: a descriptive epidemiological study Am J Sports Med. 2013;41(2):343-348. doi:10.1177/ 0363546512467612
36. Sadeghian SM, Lewis CL, Shefelbine SJ. Predicting growth plate orientation with altered hip loading: potential cause of cam morphology Biomech Model Mechanobiol 2020;19(2):701-712. doi:10.1007/ s10237-019-01241-2
37. Siebenrock KA, Kaschka I, Frauchiger L, Werlen S, Schwab JM. Prevalence of cam-type deformity and hip pain in elite ice hockey players before and after the end of growth. Am J Sports Med 2013;41(10):2308-2313. doi:10.1177/ 0363546513497564
38. Silvis ML, Mosher TJ, Smetana BS, et al. High prevalence of pelvic and hip magnetic resonance imaging findings in asymptomatic collegiate and professional hockey players. Am J Sports Med. 2011;39(4):715-721. doi:10.1177/0363546510388931
39. Laumonerie P, Dalmas Y, Tibbo ME, et al. Sensory innervation of the hip joint and referred pain: a systematic review of the literature. Pain Med. 2021;22(5):1149-1157 doi:10.1093/pm/pnab061
40. Hoffer AJ. The Shared Contributions of the Capsule, Labrum, and Bone on the Suction Seal of the Hip. Masters thesis. The University of Western Ontario; 2023.
41. Pullen WM, Curtis DM, Safran MR. Central femoral head chondromalacia is associated with a diagnosis of hip instability Arthro Sports Med Rehabil. 2022;4(2):e453-e457. doi:10.1016/ j.asmr.2021.10.023
42. Fernquest S, Arnold C, Palmer A, et al. Osseous impingement occurs early in flexion in cam-type femoroacetabular impingement: a 4D CT model. Bone Joint J 2017;99(S4):41-48. doi:10.1302/ 0301-620x.99b4.bjj-2016-1274.r1
43. Chang R, Turcotte R, Pearsall D Hip adductor muscle function in forward skating. Sports Biomech 2009;8(3):212-222. doi:10.1080/14763140903229534
44. Dy CJ, Thompson MT, Crawford MJ, Alexander JW, McCarthy JC, Noble PC. Tensile strain in the anterior part of the acetabular labrum during provocative maneuvering of the normal hip. J Bone Joint Surg 2008;90(7):1464-1472. doi:10.2106/jbjs.g.00467
45. Ollivier M, Le Corroller T, Parratte S, Chabrand P, Argenson JN, Gagey O. Mechanical strains passing through the acetabular labrum modify its shape during hip motion: an anatomical study. Knee Surg Sports Traumatol Arthrosc 2017;25(6):1967-1974. doi:10.1007/s00167-017-4524-8
46. Philippon MJ, Weiss DR, Kuppersmith DA, Briggs KK, Hay CJ. Arthroscopic labral repair and treatment of femoroacetabular impingement in professional hockey players. Am J Sports Med. 2010;38(1):99-104. doi:10.1177/0363546509346393
47 Grant AD, Sala DA, Davidovitch RI. The labrum: structure, function, and injury with femoroacetabular impingement. J Chil Orthops. 2012;6(5):357-372. doi:10.1007/s11832-012-0431-1
48. Smith CD, Masouros S, Hill AM, Amis AA, Bull AMJ. A biomechanical basis for tears of the human acetabular labrum. Br J Sports Med 2009;43(8):574-578. doi:10.1136/bjsm.2008.053645
49. Myers CA, Register BC, Lertwanich P, et al. Role of the acetabular labrum and the iliofemoral ligament in hip stability: an in vitro biplane fluoroscopy study Am J Sports Med. 2011;39(S1):85-91. doi:10.1177/ 0363546511412161
50. Philippon MJ, Schenker ML. Athletic hip injuries and capsular laxity Oper Tech Orthop 2005;15(3):261-266. doi:10.1053/j.oto.2005.07.001
51. Johannsen AM, Ejnisman L, Behn AW, Shibata K, Thio T, Safran MR. Contributions of the capsule and labrum to hip mechanics in the context of hip microinstability Othrop J Sports Med 2019;7(12):2325967119890846. doi:10.1177/ 2325967119890846
52. Kalisvaart MM, Safran MR. Microinstability of the hip—it does exist: etiology, diagnosis and treatment. J Hip Preserv Surg. 2015;2(2):123-135. doi:10.1093/ jhps/hnv017
53. Rosinsky PJ, Shapira J, Lall AC, Domb BG. All about the ligamentum teres: from biomechanical role to surgical reconstruction. J Am Acad Orthop Surg 2020;28(8):e328-e339. doi:10.5435/jaaos-d-19-00352
54. Berthelot JM, Brulefert K, Arnolfo P, Le Goff B, Darrieutort-Laffite C. Update on contribution of hip labral tears to hip pain: a narrative review Joint Bone Spine. 2023;90(1):105465. doi:10.1016/ j.jbspin.2022.105465
55. Lewis CL, Sahrmann SA, Moran DW Anterior hip joint force increases with hip extension, decreased gluteal force, or decreased iliopsoas force. J Biomech 2007;40(16):3725-3731. doi:10.1016/ j.jbiomech.2007.06.024
56. Hoffman J, Gabel P. Expanding Panjabi’s stability model to express movement: A theoretical model. Med Hypotheses. 2013;80(6):692-697. doi:10.1016/ j.mehy.2013.02.006
57 Diamond LE, Wrigley TV, Hinman RS, et al. Isometric and isokinetic hip strength and agonist/ antagonist ratios in symptomatic femoroacetabular impingement. J Sci Med Sport 2016;19(9):696-701. doi:10.1016/j.jsams.2015.10.002
58. Devitt BM, Smith BN, Stapf R, Tacey M, O’Donnell JM. Generalized joint hypermobility is predictive of hip capsular thickness. Othrop J Sports Med 2017;5(4):2325967117701882. doi:10.1177/ 2325967117701882
59. Zhang K, de SA D, Yu H, Choudur HN, Simunovic N, Ayeni OR. Hip capsular thickness correlates with range of motion limitations in femoroacetabular impingement. Knee Surg Sports Traumatol Arthrosc. 2018;26(10):3178-3187 doi:10.1007/ s00167-018-4915-5
60. Harris-Hayes M, Mueller MJ, Sahrmann SA, et al. Persons with chronic hip joint pain exhibit reduced hip muscle strength. J Orthop Sports Phys Ther 2014;44(11):890-898. doi:10.2519/jospt.2014.5268
61. Diamond LE, Dobson FL, Bennell KL, Wrigley TV, Hodges PW, Hinman RS. Physical impairments and activity limitations in people with femoroacetabular impingement: a systematic review. Br J Sports Med. 2015;49(4):230-242. doi:10.1136/ bjsports-2013-093340
62. Malloy P, Stone AV, Kunze KN, Neal WH, Beck EC, Nho SJ. Patients with unilateral femoroacetabular impingement syndrome have asymmetrical hip muscle cross-sectional area and compensatory muscle changes associated with preoperative pain level. Arthroscopy. 2019;35(5):1445-1453. doi:10.1016/j.arthro.2018.11.053
63. Thorborg K, Reiman MP, Weir A, et al. Clinical examination, diagnostic imaging, and testing of athletes with groin pain: an evidence-based approach to effective management. J Orthop Sports Phys Ther 2018;48(4):239-249. doi:10.2519/jospt.2018.7850
64. Emery CA, Meeuwisse WH, Powell JW. Groin and abdominal strain injuries in the National Hockey League. Clin J Sport Med 1999;9(3):151-156. doi:10.1097/00042752-199907000-00006
65. Galano GJ, Tyler TF, Stubbs T, et al. Resisted adduction sit-up test (RASUT) as a screening tool for pelvic versus hip pathology. J Hip Preserv Surg. 2021;8(4):331-336. doi:10.1093/jhps/hnab075
66. Cohen B, Kleinhenz D, Schiller J, Tabaddor R. Understanding athletic pubalgia: a review. R I Med J. 2016;99(10):31-35.
67 Strosberg DS, Ellis TJ, Renton DB. The role of femoroacetabular impingement in core muscle injury/athletic pubalgia: diagnosis and management. Front Surg 2016;3:1-5. doi:10.3389/fsurg.2016.00006
68. Hammoud S, Bedi A, Magennis E, Meyers WC, Kelly BT. High incidence of athletic pubalgia symptoms in professional athletes with symptomatic femoroacetabular impingement. Arthroscopy. 2012;28(10):1388-1395. doi:10.1016/ j.arthro.2012.02.024
69. Ross JR, Bedi A, Stone RM, Sibilsky Enselman E, Kelly BT, Larson CM. Characterization of symptomatic hip impingement in butterfly ice hockey goalies. Arthroscopy. 2015;31(4):635-642. doi:10.1016/j.arthro.2014.10.010
70. Elattar O, Choi HR, Dills VD, Busconi B. Groin injuries (athletic pubalgia) and return to play Sports Health. 2016;8(4):313-323. doi:10.1177/ 1941738116653711
71. Davis JA, Stringer MD, Woodley SJ. New insights into the proximal tendons of adductor longus, adductor brevis and gracilis. Br J Sports Med 2012;46(12):871-876. doi:10.1136/ bjsports-2011-090044
72. Tharnmanularp S, Muro S, Nimura A, Ibara T, Akita K. Significant relationship between musculoaponeurotic attachment of the abdominal and thigh adductor muscles to the pubis: implications for the diagnosis of groin pain. Anat Sci Int. 2024;99(2):190-201. doi:10.1007/ s12565-023-00750-6
73. Emblom BA, Mathis T, Aune K. Athletic pubalgia secondary to rectus abdominis–adductor longus aponeurotic plate injury: Diagnosis, management, and operative treatment of 100 competitive athletes. Othrop J Sports Med. 2018;6(9):2325967118798333. doi:10.1177/2325967118798333
74. Birmingham PM, Kelly BT, Jacobs R, McGrady L, Wang M. The effect of dynamic femoroacetabular impingement on pubic symphysis motion: a cadaveric study Am J Sports Med 2012;40(5):1113-1118. doi:10.1177/0363546512437723
75. Robbins SM, Renaud PJ, MacInnis N, Pearsall DJ. The relationship between trunk rotation and shot speed when performing ice hockey wrist shots. J Sports Sci 2021;39(9):1001-1009. doi:10.1080/ 02640414.2020.1853336
76. Michaud-Paquette Y, Magee P, Pearsall D, Turcotte R. Whole-body predictors of wrist shot accuracy in ice hockey: a kinematic analysis. Sports Biomech. 2011;10(1):12-21. doi:10.1080/ 14763141.2011.557085
77 Economopoulos KJ, Milewski MD, Hanks JB, Hart JM, Diduch DR. Radiographic evidence of femoroacetabular impingement in athletes with athletic pubalgia. Sports Health 2014;6(2):171-177 doi:10.1177/1941738113510857
78. Buckeridge E, LeVangie MC, Stetter B, Nigg SR, Nigg BM. An on-ice measurement approach to analyse the biomechanics of ice hockey skating. PLoS One 2015;10(5):1-16. doi:10.1371/ journal.pone.0127324
79. Turcotte R, Pearsall D, Montgomery D, Lefebvre R, Nicolaou M, Loh J. Plantar force measures during forward skating in ice hockey In: International Symposium on Biomechanics in Sport. ; 2001:81-85.
80. Hallihan A. Analysis of Male and Female Hockey Players during a Stop and Go Skating Task Masters thesis. McGill University; 2018.
81. Baida S, King E, Gore S, Richter C, FranklynMiller A, Moran K. Movement variability and loading characteristics in athletes with athletic groin pain: changes after successful return to play and compared with uninjured athletes. Othrop J Sports Med 2022;10(10):23259671221125159. doi:10.1177/ 23259671221125159
82. Shell JR, Robbins SMK, Dixon PC, et al. Skating start propulsion: Three-dimensional kinematic analysis of elite male and female ice hockey players. Sports Biomech 2017;16(3):313-324. doi:10.1080/ 14763141.2017.1306095
83. Budarick AR, Shell JR, Robbins SMK, Wu T, Renaud PJ, Pearsall DJ. Ice hockey skating sprints: run to glide mechanics of high calibre male and female athletes. Sports Biomech. 2020;19(5):601-617. doi:10.1080/14763141.2018.1503323
84. Kierkegaard S, Mechlenburg I, Lund B, Søballe K, Dalgas U. Impaired hip muscle strength in patients with femoroacetabular impingement syndrome. J Sci Med Sport 2017;20(12):1062-1067 doi:10.1016/ j.jsams.2017.05.008
85. Catelli DS, Kowalski E, Beaulé PE, Smit K, Lamontagne M. Asymptomatic participants with a femoroacetabular deformity demonstrate stronger hip extensors and greater pelvis mobility during the deep squat task. Othrop J Sports Med 2018;6(7):2325967118782484. doi:10.1177/ 2325967118782484
86. Cejudo A, Moreno-Alcaraz VJ, Izzo R, SantonjaMedina F, Sainz de Baranda P. External and total hip rotation ranges of motion predispose to low back pain in elite Spanish inline hockey players. Int J Environ Res Public Health. 2020;17(13):4858. doi:10.3390/ijerph17134858
87 Tyler TF, Nicholas SJ, Campbell RJ, McHugh MP
The association of hip strength and flexibility with the incidence of adductor muscle strains in professional ice hockey players. Am J Sports Med 2001;29(2):124-128. doi:10.1177/ 03635465010290020301
88. Dalton SL, Zupon AB, Gardner EC, Djoko A, Dompier TP, Kerr ZY. The epidemiology of hip/groin injuries in National Collegiate Athletic Association men’s and women’s ice hockey: 2009-2010 through 2014-2015 academic years. Othrop J Sports Med 2016;4(3):1-7 doi:10.1177/2325967116632692
89. Eckard TG, Padua DA, Dompier TP, et al. Epidemiology of hip flexor and hip adductor strains in National Collegiate Athletic Association athletes, 2009/2010-2014/2015. Am J Sports Med. 2017;45(12):2713-2722.
90. Mendis MD, Wilson SJ, Hayes DA, Watts MC, Hides JA. Hip flexor muscle size, strength and recruitment pattern in patients with acetabular labral tears compared to healthy controls. Man Ther 2014;19(5):405-410. doi:10.1016/j.math.2014.02.006
91. Domb BG, Shindle MK, McArthur B, Voos JE, Magennis EM, Kelly BT Iliopsoas impingement: a newly identified cause of labral pathology in the hip. HSS J. 2011;7(2):145-150. doi:10.1007/ s11420-011-9198-z
92. Komarasamy B, Vadivelu R, Kershaw CJ. Clinical outcome following a modified approach for psoas lengthening for coxa saltans in adults. HIP Int 2007;17(3):150-154. doi:10.1177/ 112070000701700305
93. Vila Pouca MCP, Parente MPL, Jorge RMN, Ashton-Miller JA. Injuries in muscle-tendon-bone units: a systematic review considering the role of passive tissue fatigue. Othrop J Sports Med 2021;9(8):23259671211020731. doi:10.1177/ 23259671211020731
94. Strauss EJ, Campbell K, Bosco JA. Analysis of the cross-sectional area of the adductor longus tendon: a descriptive anatomic study. Am J Sports Med. 2007;35(6):996-999. doi:10.1177/0363546506298583
95. Tuite DJ, Finegan PJ, Saliaris AP, Renström PAFH, Donne B, O’Brien M. Anatomy of the proximal musculotendinous junction of the adductor longus muscle. Knee Surg Sports Traumatol 1998;6(2):134-137. doi:10.1007/s001670050086
96. Secomb JL, Kelly M, Dascombe BJ. Hip strength profiling of ice hockey athletes across various jointspecific angles: monitoring and injury implications. J Strength Cond Res 2023;37(7):e422-e429. doi:10.1519/jsc.0000000000004420
97. Suits WH, O’Neil MM, Fogarty KJ. Acute effects of ice hockey on hip range of motion, strength, and pelvic tilt in competitive male players. Sports Health Published online 2023.
98. Whittaker JL, Small C, Maffey L, Emery CA. Risk factors for groin injury in sport: an updated systematic review Br J Sports Med 2015;49(12):803-809. doi:10.1136/ bjsports-2014-094287
Robert C. Manske, PT, DPT, MEd, SCS, ATC, CSCS, FAPTA
Chris Wolfe, PT, DPT, OCS, Cert MDT
Phil Page, PT, PhD, ATC, CSCS, FACSM
Michael Voight, PT, DHSC, SCS, OCS, ATC, CSCS, FAPTA
Beth Bardowski, MSN, APN, ACNP-BC
Abstract
Gluteus medius tendon pathology, encompassing tendinopathy and tears, is a significant source of lateral hip pain and functional impairment. Traditional diagnostic approaches have relied on clinical examination and magnetic resonance imaging (MRI). However, the advent of diagnostic musculoskeletal ultrasound MSKUS has transformed the evaluation process. Musculoskeletal ultrasound MSKUS has emerged as a highly valuable diagnostic tool in the evaluation of gluteus medius tendon pathology, offering a non-invasive, cost-effective, and dynamic assessment method. This modality provides real-time visualization of soft tissue, enabling the detailed examination of tendon structure, vascularity, and associated musculature. For rehabilitation providers, understanding the application, strengths, and limitations of diagnostic MSKUS can enhance clinical decision-making, facilitate targeted therapeutic interventions, and potentially expedite the recovery process. This article reviews the application of MSKUS in diagnosing gluteus medius tendon pathology and its implications for rehabilitation practice. This should help to equip rehabilitation professionals with knowledge to better integrate this diagnostic tool into their clinical repertoire.
Key Words: GTPS, Gluteus Medius, diagnostic MSK ultrasound
Introduction
Greater trochanteric pain syndrome (GTPS) is a prevalent hip condition characterized by lateral hip pain, dysfunction, and diminished quality of life.1 GTPS is considered a multifaceted condition that
encompasses pain originating from various traumatic and degenerative changes within the peritrochanteric space, including the tendons, bursae, and trochanteric bone structures.2,3 The etiology of this condition encompasses a broad spectrum, including trauma, infection, avascular necrosis, stress fractures of the femoral neck, and referred pain originating from the spine. Moreover, conditions such as arthritis, tumors, and entrapment neuropathies are also documented contributors to lateral hip pain.2 A subset of patients may experience this pain due to tendinopathy of the gluteus medius and minimus muscles, a condition initially proposed by Schein and Lehmann, who attributed calcifications near the greater trochanter observed in radiographs to injury or degeneration of the gluteus medius tendon.4 Subsequent research by Gordon in 1961 linked trochanteric bursitis to the attachments of the gluteus tendons, proposing a secondary involvement of adjacent bursae akin to the relationship between the rotator cuff and subacromial-subdeltoid bursitis.5 The terms "gluteus tendinopathy" or "greater trochanteric pain syndrome" are now preferred over "trochanteric bursitis," given the frequent absence of the latter.
This syndrome, which primarily affects the gluteus medius and minimus tendons, represents the most common tendinopathy of the lower limb, with an annual incidence rate ranging from 1.8 to 5.6 per 1,000 individuals.3,6 This pathology typically manifests unilaterally in middle-aged women, particularly those in their fourth through sixth decades of life, and its prevalence escalates with age.3 GTPS is characterized by a dull ache and tenderness on the lateral aspect of the hip, worsened by weight bearing and
impairing the ability to sleep on the affected side. The impact of gluteal tendinopathy on function and quality of life is comparable to the effects of end-stage hip osteoarthritis.7
The diagnostic process for GTPS integrates clinical history, palpation, and specific physical examination maneuvers, with magnetic resonance imaging (MRI) serving as the definitive modality for confirming the diagnosis.3,8 Differentiating among these conditions presents a challenge due to the complex morphology of the hip region and the presence of significant adipose tissue overlaying the greater trochanter.1 MRI is regarded as the definitive diagnostic tool, revealing changes in tendon insertions at the greater trochanter, muscle atrophy, and bursal distension.3,8 Despite MRI’s status as a gold standard for diagnosing GTPS, ultrasound (US) imaging has shown considerable efficacy, particularly for early-stage detection of gluteal tendinopathy and other peritrochanteric pathologies, due to advancements in diagnostic capabilities. Westacott et al8 highlighted the comparative diagnostic accuracy of US and MR imaging in detecting gluteal tears, with US showing superior sensitivity. However, the study primarily focused on tears, without addressing tendinosis or distinguishing between tear types. Docking et al1 investigated the ability of MRI and MSKUS to identify the presence of a a pathological gluteus medius tendon in comparison to surgical and histological findings. MSKUS identified 17 out of 19 pathological gluteus medius tendons correctly. However, 5 of the 6 normal tendons were incorrectly identified as exhibiting pathology on US. MRI rated 11 out of 17 pathological tendons as abnormal, with 4 out of 6 normal identified correctly. This study demonstrated that US can be used reasonably to detect gluteus medius tendon pathology. The limitations in imaging's capacity to differentiate between tendinosis and partial-thickness tears are further exemplified in studies of the Achilles and shoulder rotator cuff tendons, underscoring the need for refined diagnostic criteria and methodologies in the evaluation of GTPS-related pathologies. Research indicates a significant incidence of gluteal tendon abnormalities in asymptomatic individuals, with findings of gluteal tendinosis or partial tears in up to 50% of evaluated hips.9,10,11 Despite this, there is a scarcity of studies focusing on the diagnostic precision of imaging techniques in identifying and distinguishing structural abnormalities within the gluteal tendons.
MSKUS employs high-frequency sound waves to produce images of soft tissues, joints, and bones. The principal advantages include real-time imaging capabilities, absence of ionizing radiation, and the ability to conduct comparative assessments of the affected and contralateral sides. Furthermore, its portability and lower cost relative to MRI make it accessible in various clinical settings.
The evaluation of the gluteus medius tendon with US begins with the patient in a lateral decubitus or standing position, targeting the lateral aspect of the hip. The normal gluteus medius tendon appears as a fan shaped fibrillar structure composed of hyperechoic, striated fascicles with bright, linear bands running within the muscle.2 Pathological changes such as tendinopathy are characterized by hypoechoic (darker) regions within the tendon, tendon thickening, and loss of the normal fibrillar pattern. Tears are identified by discontinuity in the tendon fibers, with partial tears showing as anechoic (black) areas and complete tears as a full separation of the tendon from its insertion.
Diagnostic MSKUS ability to visualize these pathological changes in real-time provides immediate feedback that can inform treatment decisions. Rehabilitation providers can use this information to tailor exercise programs, guide manual therapy techniques, monitor the progression of tendon healing over time, or refer to another provider in instances of tears or ruptures that may require further imaging or surgical intervention. Additionally, ultrasound-guided interventions, such as injections, can be performed with greater accuracy and safety.
While MSKUS offers several advantages, including patient comfort and dynamic assessment capabilities, it also has limitations. Operator dependency, a steep learning curve, and variability in image interpretation are notable challenges. Therefore, comprehensive training and experience are essential for maximizing the diagnostic utility of this modality.
Conclusion
Diagnostic MSKUS represents a valuable adjunct in the evaluation of gluteus medius tendon pathology for rehabilitation providers. By facilitating an accurate and detailed assessment of tendon condition, it supports more informed clinical decision-making and personalized patient care. As technology advances and proficiency in US techniques grows within the rehabilitation community, its application in clinical practice is likely to expand, further enhancing the management of musculoskeletal conditions.
References
1. Docking SL, Cook J, Chen S, et al. Identification and differentiation of gluteus medius tendon pathology using ultrasound and magnetic resonance imaging. Musculoskelet Sci Pract. 2019;41:1-5. Doi:10.1016/j.msksp.2019.01.011.
2. Connell DA, Bass C, Sykes CJ, et al. Sonographic evaluation of gluteus medius and minimus tendinopathy. Eur Radio. 2003;13:1339-1347.
3. Atilano L, Martin N, Iglesias G, et al. Sonographic pathoanatomy of greater trochanteric pain syndrome. J Ultrasound. 2023; https://doi.org/10.1007/s40477-02300836-x
4. Schein AJ, Lehmann O. Acute trochanteric bursitis with calcification. Surgery. 1941;9:771-779.
5. Gordon EJ. Trochanteric bursitis and tendonitis. Clin Orthop. 1661;20:193-202.
6. Barratt PA, Brookes N, Newson A. Conservative treatments for greater trochanteric pain syndrome: a systematic review. Br J Sports Med. 2017;51(2):97-104.
7. Ebert JR, Retheesh T, Mutreja R, et al. The clinical, functional and biomechanical preseantion of patients with symptomatic hip abductor tendon tears. Int J Sports Phys Ther. 2016;11(5):725.
8. Westacott DJ, Minns JI, Foguet P. The diagnostic accuracy of magnetic resonance imaging and ultrasonography in gluteal tendon tears – A systematic review. Hip Int. 2011;21(6):637-645.
9. Bird PA, Oakley SP, Shiner R, et al. Prospective evaluation of magnetic resonance imaging and physical examination findings in patients with greater trochanteric pain syndrome. Arthritis Rheum. 2001;44(9):2138-2145.
10. Blankenbaker DG, Ullrick SR, Davis KW, et al. Correlation of MRI findings with clinical findings of trochanteric pain syndrome. Skeletal Radiol. 2008;37(10):903-909.
11. Woodley SJ, Nicholson HD, Livingstone V, et al. Lateral Hip Pain. Findings from magnetic resonance imaging and clinical examination. J Orthop Sports Phys Ther. 2008:38(6):313-328.
GLUTEUS MEDIUS TENDON:
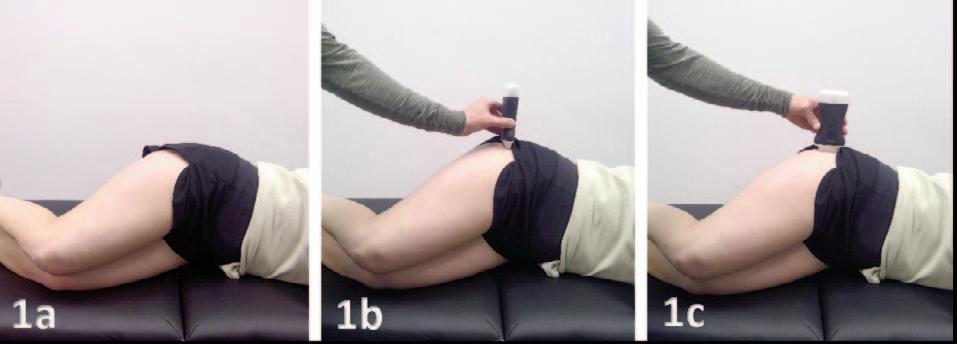
Figures 1a: Patient Position. Patient is lying on the contralateral hip with the hips and knees slightly flexed. Using a towel or bolster between the knees can be helpful to reduce excessive strain to the gluteus medius tendon.
Figure 1b: Short Axis (SAX) Transducer Placement. For a SAX view, the transducer is placed in the transverse plane, perpendicular to the femoral shaft and placed directly over the apex of the greater trochanter.
Figure 1c: Long Axis (LAX) Transducer Placement. For a LAX transducer placement, the transducer is placed initially directly over the apex of the greater trochanter placed parallel with the femoral shaft.
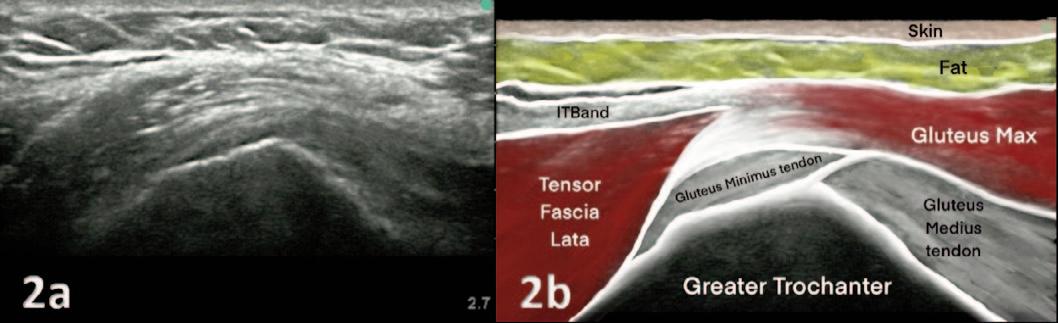
Figures 2A and 2B: The apex/peak of the femoral greater trochanter is located by translating/skimming the transverse/short axis transducer in proximal and distal directions (arrows) to visualize the sharpest peak of the bony contour. This sharp peak of the greater trochanter can be described as the sharpest peak of the roof of a house. The “peak” of the greater trochanter will display the sharp/steep slope of the anterior facet and the less sheer/abrupt margin of the lateral facet. The gluteus minimus tendon attachment is at the anterior facet and the gluteus medius tendon utilizes the lateral facet. The hypoechoic, ellipsoidal/oblong tensor fascia lata muscle is superficial to the gluteus mMinimus and gluteus medius attachments.
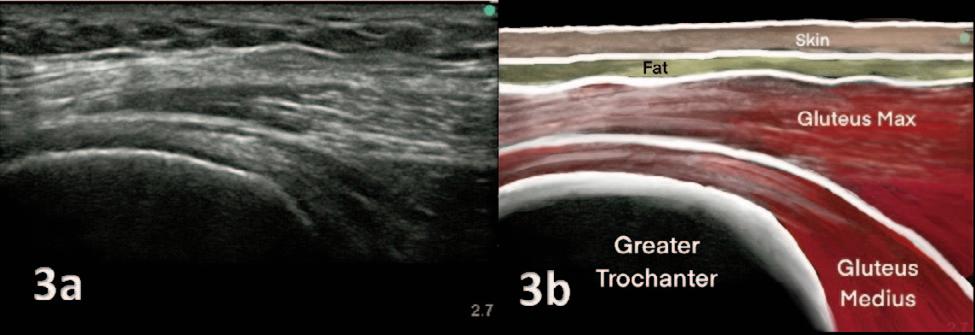
Figures 3A and 3B: To view the gluteus medius tendon, intentional posterior to anterior beam angulation reveals the bright cortical reflection of the lateral facet. The hyperechoic, fibrous and tapering contour of the gluteus medius tendon attachment is along the bony margin under the iliotibial band (IT band) and gluteus maximus. The coarse fibers of the gluteus maximus muscle are the most common interface superficial to the gluteus medius tendon.
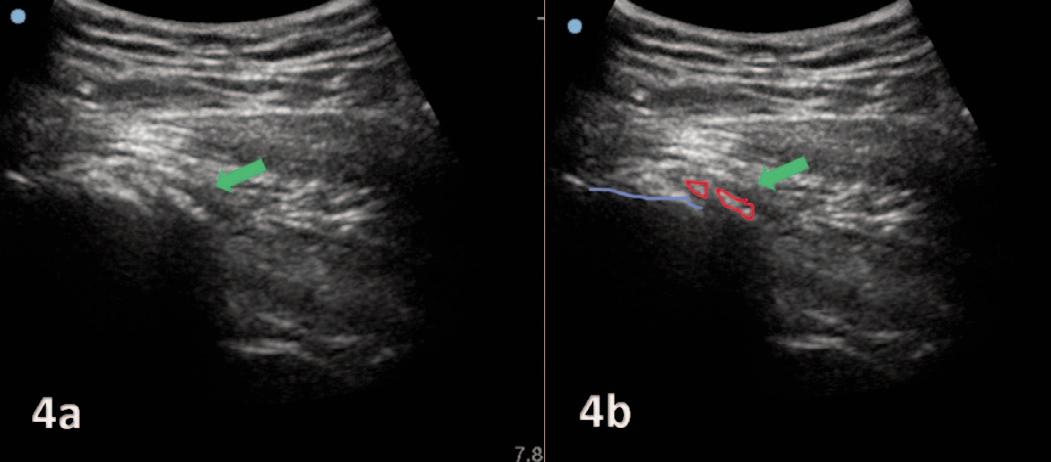
Figures 4A and 4B: Gluteus medius calcific tendinitis of the right gluteus medius tendon. Ultrasound image confirms a hyperechogenic calcification in the gluteus medius tendon. Figure 4b outlines the greater trochanter and the insertion of the gluteus medius tendon in blue and red outlines the calcification.
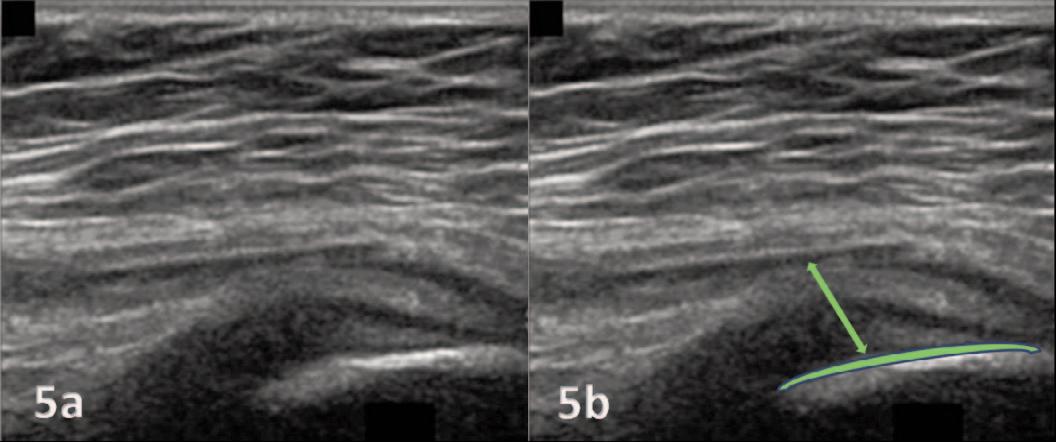
Figures 5A and 5B: A long axis view showing hypoechoic thickening at the attachment of the posterior band onto the superolateral facet of the greater trochanter. Figure 5b outlines the greater trochanter and the thickened tendon.
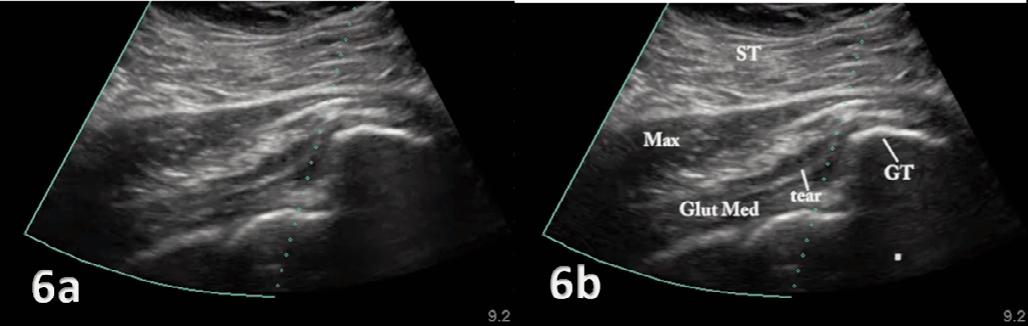
Figures 6A and 6B: Long-axis sonogram of the anterior band showing a partial-thickness tear of the gluteus medius tendon. Figure 6b outlines the subcutaneous tissue (ST), gluteal maximus (Max), gluteus medius (Glut Med), tendon tear (tear) and greater trochanter (GT).
https://doi.org/10.26603/001c.116860
In the preceding editorial, I demonstrated how diagnosis helps us partially arrive at prognosis while risk factors help complete the data set that allows us to project outcomes with greater confidence.
One of my greatest concerns for the future of physical therapy is that, although there may be agreement with my statements, I do not feel that today’s clinician is armed with objective, measurable action points that will allow them to adjust orthopedic-and sports-accepted protocols of treatment with the clear valuation of the burden of MSK risk factors outside of the primary diagnosis.
I previously posed these questions: “Diagnosis is the first consideration of prognosis, but does that always make it the greatest determinant of outcome? Can complicating factors carry equal weight with the diagnosis when making a prognosis?”
The answers are fully dependent on the level of risk presented by the complicating factors:
• High Risk - the risk factor could possibly take priority over diagnosis.
• Medium Risk - the risk factor shares priority with diagnosis.
• Low Risk - proceed to treat the diagnosis and monitor risk factors.
We are accustomed to grading the severity of our diagnoses, and know that different grades of sprains or fractures can change a patient’s prognosis. Complicating risk factors are no different. There need to be actionable gradations.
A grade 1 ankle sprain with a high level of MSK risk could potentially be a more complicated prognosis than a grade 2 or 3 ankle sprain with low MSK risk. If we only focus on the diagnosis and the protocols associated with it, we would assume the latter diagnosis would be the more complicated treatment. Those are the assumptions that hurt our outcomes.
We know that diagnosis alone is insufficient. It must be weighted for severity. If additional risk factors are considered in prognosis they must be weighted for severity as well.
If we reflect on the less-than-favorable Army recovery study outcomes1 we are seeing a problem that spans the rehabilitation industry: much of the information that is collected to justify graduation from rehabilitation is historically based on pain measurements and impairment measures - ROM and strength - and although these impairment measures are helpful in charting progress they do not
paint the complete picture of function, even though functional measures can have significant predictive value.
Many of these soldiers likely bore the burden of high MSK risk entering rehabilitation and retained it upon return to duty
The clarity of the Army study outcomes came from postrehabilitation use of the SFMA to demonstrate that therapy was largely targeted at MSK symptoms and impairment measures, but not overall functions like balance, mobility, stability and symmetry within practical patterns of movement. All too often, functional measures are seen as complementary or non-essential screening/testing or as having an educational barrier to their use. That is not the case.
After 25 years in education, I’ve consistently heard two excuses for not including a measurable functional perspective: “I don’t need it and/or I don’t have the time.”
A recent study suggests that you do need it and that you do have the time.
Matsel, et al demonstrates that capturing risk imposes little burden on the rehabilitation process.2 This study looks at an app-based movement self-screen (Symmio) and vets it as a “reliable and feasible screening tool that can be used to identify MSK risk factors.”
If self-screening and reporting of movement quality works to identify known risk factors for MSK injury, why aren’t we using it?
There are valid reasons why it may not be possible on intake, though it could provide beneficial information that may change the course of treatment. What is stopping the implementation of a self-screen on exit? How about in the pre-participation physical for athletes? Pre-employment for any workforce? Pre-service for military, tactical, or first responders?
We can now reliably and practically identify the presence of MSK risk factors and determine their level (High, Medium, or Low) in a low-cost manner This perspective will allow us to target and factor risk severity alongside diagnostic severity, pointing us toward more accurate prognoses and improved feedback loops with the intent of more favorable outcomes. The feedback loops that are most beneficial are those that constantly challenge your confirmation bias.
The Functional Movement Screen has long been our feedback loop on exit. The FMS consistently forced acknowledgement of the functional inconsistencies in our outcomes and gave us an opportunity to help those patients focus on additional dysfunctions. It also allowed us to refine our intake protocols and build the Selective Functional Movement Assessment (SFMA). This perspective also
demonstrated the efficiency of using rehabilitation to target MSK risk factors - many of which fit the definition of regional interdependence - while still addressing diagnostic protocols.
The knowledge from Matsel, et al2 that we can reliably and efficiently gain information regarding MSK risk factors is not the same as knowing how to use the specific risk factor information on the patient in your care.
If the individual presents with additional movement risk factors, should I consider how they may contribute to the current episode or injury and its resolution? If the risk persists through release, what is my responsibility? What are my opportunities?
Self-screening can bring transparency to risk factors that affect outcomes. Those associated with behavior change should be accessible to the patient for testing and intervention. Are you prepared to have the proactive conversations that support the data your prognosis must consider?
I personally find that managing patients and clients with a relevant dashboard of MSK risk factors allows me to be both transparent about my responsibilities for prognosis as well as any risk factors that can be monitored and managed with simple behavior and health modifications.
Having these conversations earlier in the rehabilitation process helps me feel like a more complete provider and makes me want to modify Ben Franklin’s aphorism as it applies to my practice:
“An ounce of proactive wellness is worth a pound of reactive healthcare.”
In part three of this editorial, we will look at MSK risk factors collected by screens and surveys associated with lifestyle and self-care behaviors alongside what we’ve already learned regarding movement self-screens.
© The Author(s)
This is an open-access article distributed under the terms of the Creative Commons Attribution 4.0 International License (CCBY-NC-4.0). View this license’s legal deed at https://creativecommons.org/licenses/by-nc/4.0 and legal code at https://creativecommons.org/licenses/by-nc/4.0/legalcode for more information.
1. Rhon DI, Teyhen DS, Kiesel K, et al. Recovery, Rehabilitation, and Return to Full Duty in a Military Population After a Recent Injury: Differences Between Lower-Extremity and Spine Injuries. Arthrosc Sports Med Rehabil 2022;4(1):e17-e27 doi:10.1016/j.asmr.2021.09.028
2. Matsel K, Kirsch J, Netelbeek T, Rodriguez R, Velic E, Schwartzkopf-Phifer K. Self-Movement Screening using the Symmio Application is Reliable and Valid for Identifying Musculoskeletal Risk Factors. Int J Sports Phys Ther 2023;18(2):439-449. doi:10.26603/ 001c.73319
1a
Regan Wong, PT, DPT, CSCS , Daniel Evans, PT, MSPT, CSCS2 , Keith Meister, MD1,2
1 Texas Rangers Baseball Club, 2 TMI Sports Medicine & Orthopedic Surgery https://doi.org/10.26603/001c.116585
Dear Editor:
This letter is written in response to the article “An Interval Throwing Program for Baseball Pitchers Based upon Workload Data” by Reinold et al.1 The authors should be applauded for their attempt to design an interval throwing program (ITP) with the goal of providing a gradual workload buildup. The researchers had good intentions of designing a program to allow healing of the ulnar collateral ligament after elbow reconstruction without experiencing setbacks. However, we would like to raise our own concerns of the study’s methodology that have led to false conclusions, which are: the newly created ITP was able to achieve a gradual buildup in chronic workload, returns pitchers back to competition safely and efficiently with potentially less risk of setbacks or reinjury, and is the new modern throwing program after Tommy John surgery 1
We agree when progressing an athlete performing an ITP coming back from an upper extremity injury, the program should progressively apply load to the healing tissue in which the clinician carefully monitors the thrower’s mechanics, throwing intensity, distances, and volume.1‑4
However, Reinold et al.1 utilized in their methodology an unvalidated inertial measurement unit (IMU) device, the motusBaseball (Motus Global now Driveline Pulse; Driveline Baseball, Kent, WA), to propose an ITP based on a workload formula that factors in elbow varus torque and number of throws at a particular distance in a given day The workload formula was modeled after the work of coauthor Dowling et al.5 that insinuated the IMU was able to produce precise and reproducible data. Both studies reference an index paper6 that was not originally designed to validate the IMU. In fact, one of the co-authors Fleisig et al.7 publicly acknowledged the index study6 was not designed to be a validation study Fleisig et al.7 agreed with Driggers et al.8 that several rigorous studies are required to validate this particular IMU device. Furthermore, there are multiple scientific publications that have clearly demonstrated that this particular IMU device is not valid for accurately measuring elbow arm stress in the absence of the gold standard motion capture system.8‑10 When looking at Figure 1. showing 2nd order polynomial regression model
to classify relationship between throwing distance (ft) and peak elbow varus torque (Nm), Reinold et al.1 report peak elbow torque means of 45-48 Nm between 175 ft and 300 ft in their throw analysis. The values are not consistent with the literature of reported values of 90 Nm at 120 ft and 95 Nm at 180 ft as reported using motion capture.11 One explanation for the difference is explained by Driggers et al. that the accuracy of the IMU decreases as torques increase in their Bland-Altman plot for elbow torques indicating a bias in the torques estimated.8
We agree with Reinold et al.1 that throws being carried out during an interval throwing program should be thrown with a slight arc through the majority of the program to the intended target using distance as the guide. Similar to our clinical experience, athlete’s should be instructed to initially “throw to the target and not through the target” with a slight arc and not on a line during the majority of the program to properly apply controlled stresses to the reconstructed elbow ligament.2‑4 Given that this is an important concept, there is no way of knowing what throwing technique (arc vs on-line throws) were captured and data mined retrospectively in the throwing data analyzed by Reinold et al.1 Daily workload was calculated by taking the accumulation of elbow torque from every throw in a given day in their study.1 Without knowing the throwing technique for each distance is not sound methodology The authors acknowledge in their limitations section that the relationship between elbow torque and workload will vary for pitchers and their throwing technique!1
Reliability is not the same as validity. For example, possessing a ruler that states one foot equals fourteen inches can reliably measure fourteen inches repeatedly between multiple points very predictably However, it is not valid because one foot is equal to twelve inches. Camp et al.10 demonstrated that the IMU reliably produces untrustworthy numbers within the same subject. In our extensive experience using the IMU, we have found that the IMU indiscriminately records all sudden movement as pitches thus making it difficult to review retrospectively, the sleeve that contains the IMU tended to slip down the throwing arm thus skewing measurements over time, and required another person to stand behind the thrower in close proximity
Corresponding Author: rwong@texasrangers.com
while using the phone app to accurately tag the distance that is thrown to match up with the IMU elbow torque data. Driggers et al.8 brought to light the flaw in the manufacturer claiming accuracy of data collected as long as a 2-inch radius of movement from the correct placement of the IMU device was allowed by conducting a pilot study examining a sleeve outfitted with 3 IMUs in succession 3.5 cm medial or lateral to the recommended placement. Testing results showed low agreement with the reference IMU, displacing the notion the sensor movement of less than a 2-inch radius would provide meaningful data. Other researchers have described a protocol to conduct live charting of thrower’s distance with each throw and to recheck sleeve IMU placement every 3-4 throws to minimize device error 12 None of these standards were incorporated in the methods when they data mined retrospectively 111,196 throws.1 This is an additional source of measurement error, making the study lacking reliability. Despite all this, Reinold et al.1 proceeded to use this methodology and submit for publication believing their overall findings were accurate.
Reinold et al.1 referenced papers reporting acute:chronic workload concepts as related to injury risk in pitchers.13,14 A closer inspection of these referenced papers show they erroneously used the same unvalidated IMU in their methods to create injury statistics. This is a huge problem when studies are building off the work of other researchers who are using an unvalidated device to create erroneous statements and conclusions.5,6,13‑22 For example, in their discussion, Reinold et al.1 stated they do not suggest using radar guns to monitor intensity during ITP because it doesn’t match actual elbow load. Unfortunately, this is a completely inaccurate statement because they referenced a study that utilized the IMU to draw those conclusions.20 Careful inspection of their other cited reference23 to substantiate their additional claim that velocity does not correlate with elbow varus torque is inaccurate because they failed to acknowledge that the researchers demonstrated that within an individual pitcher, higher ball velocity was strongly associated with higher elbow varus torque. It has been shown in the literature that velocity is directly correlated to the rate of elbow injuries and ulnar collateral ligament reconstructions in Major League baseball pitch-
ers.24‑27 Biomechanical studies demonstrate that higher velocity pitches, such as the fastball and slider, are highly correlated with increased shoulder and elbow torques during the pitching motion.28,29 Using this evidence from the literature, we carefully monitor the throwing intensity of the rehabbing athlete by utilizing a radar gun to measure the velocity at each of the distances of the throwing program to help control and monitor intensity to ensure that appropriate and gradual loads to the elbow are applied throughout the program. This method of monitoring throwing intensity has proven to be highly successful in our clinical practice.
In summary, Reinold et al.1 utilized an unvalidated device in their study methodology to calculate elbow torque, did not control for technique of throws (arc vs on-line throws), had no accountability of appropriately tagging throwing distance with elbow torque data, and no control of whether the IMU sleeve was worn correctly in their retrospective analysis to calculate workload. This presents with issues of both validity and reliability in the methods of their study Therefore, the notion of being able to calculate elbow workload and claim to have devised a more modern and safer interval throwing program is very much flawed and inaccurate. We advise the medical community to be wary of conclusions and statements from studies1,5,6,13‑22 that continue using this unvalidated IMU device before making changes to existing interval throwing programs.
Regan Wong, PT, DPT, CSCS
Texas Rangers Baseball Club Arlington, Texas, USA
Daniel Evans, PT, MSPT, CSCS
TMI Sports Medicine & Orthopedic Surgery Arlington, Texas, USA
Keith Meister, MD
TMI Sports Medicine & Orthopedic Surgery
Texas Rangers Baseball Club Arlington, Texas, USA
© The Author(s)
This is an open-access article distributed under the terms of the Creative Commons Attribution 4.0 International License (CCBY-NC-4.0). View this license’s legal deed at https://creativecommons.org/licenses/by-nc/4.0 and legal code at https://creativecommons.org/licenses/by-nc/4.0/legalcode for more information.
1. Reinold MM, Dowling B, Fleisig GS, et al. An Interval Throwing Program for Baseball Pitchers Based upon Workload Data. Int J Sports Phys Ther. 2024;19(3):326-336. doi:10.26603/001c.94146
2. Reinold MM, Wilk KE, Reed J, Crenshaw K, Andrews JR. Interval sport programs: guidelines for baseball, tennis, and golf J Orthop Sports Phys Ther 2002;32(6):293-298. doi:10.2519/jospt.2002.32.6.293
3. Wong R, Laudner K, Evans D, Meister K. The Effect of the Crow Hop on Elbow Stress During an Interval Throwing Program: letter to the editor Am J Sports Med. 2021;49(8):NP31-NP32. doi:10.1177/ 03635465211021409
4. Wong R, Meister K. Interval throwing program and baseball pitching: letter to the editor. Am J Sports Med 2014;42(6):NP37-NP38. doi:10.1177/ 0363546514536692
5. Dowling B, Brusalis CM, Streepy JT, et al. Workload Comparison of Contemporary Interval Throwing Programs and a Novel Optimized Program for Baseball Pitchers. Int J Sports Phys Ther. 2024;19(2):176-188. doi:10.26603/001c.92016
6. Camp CL, Tubbs TG, Fleisig GS, et al. The relationship of throwing arm mechanics and elbow varus torque: within-subject variation for professional baseball pitchers across 82,000 throws. Am J Sports Med. 2017;45(13):3030-3035. doi:10.1177/0363546517719047
7 Fleisig GS, Camp CL, Tubbs TG, et al. The Relationship of Throwing Arm Mechanics and Elbow Varus Torque: Response. Am J Sports Med. 2019;47(1):NP4-NP5. doi:10.1177/0363546518809064
8. Driggers AR, Bingham GE, Bailey CA. The relationship of throwing arm mechanics and elbow varus torque: letter to the editor Am J Sports Med 2019;47(1):NP1-NP5. doi:10.1177/0363546518809061
9. Boddy KJ, Marsh JA, Caravan A, Lindley KE, Scheffey JO, O’Connell ME. Exploring wearable sensors as an alternative to marker-based motion capture in the pitching delivery. PeerJ. 2019;7:e6365. doi:10.7717/peerj.6365
10. Camp CL, Loushin S, Nezlek S, Fiegen AP, Christoffer D, Kaufman K. Are Wearable Sensors Valid and Reliable for Studying the Baseball Pitching Motion? An Independent Comparison with MarkerBased Motion Capture. Am J Sports Med. 2021;49(11):3094-3101. doi:10.1177/ 03635465211029017
11. Fleisig GS, Bolt B, Fortenbaugh D, Wilk KE, Andrews JR. Biomechanical comparison of baseball pitching and long-toss: implications for training and rehabilitation. J Orthop Sports Phys Ther 2011;41(5):296-303. doi:10.2519/jospt.2011.3568
12. Lizzio VA, Cross AG, Guo EW, Makhni EC. Using Wearable Technology to Evaluate the Kinetics and Kinematics of the Overhead Throwing Motion in Baseball Players. Arthros Tech. 2020;9(9):e1429-e1431. doi:10.1016/ j.eats.2020.06.003
13. Mehta S. Relationship Between Workload and Throwing Injury in Varsity Baseball Players. Phys Ther Sport 2019;40:66-70. doi:10.1016/j.ptsp.2019.08.001
14. Mehta S, Tang S, Rajapakse C, Juzwak S, Dowling B. Chronic Workload, Subjective Arm Health, and Throwing Injury in High School Baseball Players: 3-Year Retrospective Pilot Study. Sports Health. 2022;14(1):119-126. doi:10.1177/19417381211055142
15. Dowling B, McElheny KD, Camp CL, Ling DI, Dines JS. Effects of mound versus flat-ground pitching and distance on arm mechanics and elbow torque in high school pitchers. Orthop J Sports Med 2020;8(12):1-6. doi:10.1177/2325967120969245
16. Dowling B, McNally MP, Laughlin WA, Onate JA. Changes in throwing arm mechanics at increased throwing distances during structured long-toss. Am J Sports Med. 2018;46(12):3002-3006. doi:10.1177/ 0363546518795892
17 Fleisig GS, Diffendaffer AZ, Ivey B, Oi T Do mound height and pitching distance affect youth baseball pitching biomechanics? Am J Sports Med 2018;46(12):2996-3001. doi:10.1177/ 0363546518795890
18. Leafblad ND, Larson DR, Fleisig GS, et al. Variability in baseball throwing metrics during a structured long-toss program: does one size fit all or should programs be individualized? Sports Health 2019;11(6):535-542. doi:10.1177/1941738119869945
19. Lizzio VA, Smith DG, Guo EW, et al. The effect of the crow hop on elbow stress during an interval throwing program. Am J Sports Med 2021;49(2):359-363. doi:10.1177/0363546520976629
20. Lizzio VA, Smith DG, Jildeh TR, et al. Importance of radar gun inclusion during return-to-throwing rehabilitation following ulnar collateral ligament reconstruction in baseball pitchers: a simulation study J Shoulder Elbow Surg 2020;29(3):587-592. doi:10.1016/j.jse.2019.08.014
21. Melugin HP, Larson DR, Fleisig GS, et al. Baseball pitchers’ perceived effort does not match actual measured effort during a structured long-toss throwing program. Am J Sports Med. 2019;47(8):1949-1954. doi:10.1177/ 0363546519850560
22. Okoroha KR, Meldau JE, Lizzio VA, et al. Effect of fatigue on medial elbow torque in baseball pitchers: A simulated game analysis. Am J Sports Med 2018;46(10):2509-2513. doi:10.1177/ 0363546518782451
23. Slowik JS, Aune KT, Diffendaffer AZ, Cain EL, Dugas JR, Fleisig GS. Fastball Velocity and ElbowVarus Torque in Professional Baseball Pitchers. J Ath Train 2019;54(3):296-301. doi:10.4085/ 1062-6050-558-17
24. Bushnell BD, Anz AW, Noonan TJ, Torry MR, Hawkins RJ. Association of maximum pitch velocity and elbow injury in professional baseball pitchers. Am J Sports Med. 2010;38(4):728-732. doi:10.1177/ 0363546509350067
25. Chalmers PN, Erickson BJ, Ball B, Romeo AA, Verma NN. Fastball pitch velocity helps predict ulnar collateral ligament reconstruction in major league baseball pitchers. Am J Sports Med. 2016;44(8):2130-2135. doi:10.1177/ 0363546516634305
26. Keller RA, Marshall NE, Guest JM, Okoroha KR, Jung EK, Moutzouros V. Major league baseball pitch velocity and pitch type associated with risk of ulnar collateral ligament injury. J Shoulder Elbow Surg. 2016;25(4):671-675. doi:10.1016/j.jse.2015.12.027
27 Whiteside D, Martini DN, Lepley AS, Zernicke RF, Goulet GC. Predictors of ulnar collateral ligament reconstruction in major league baseball pitchers. Am J Sports Med 2016;44(9):2202-2209. doi:10.1177/ 0363546516643812
28. Fleisig GS, Kingsley DS, Loftice JW, et al. Kinetic comparison among the fastball, curveball, change-up, and slider in collegiate baseball pitchers. Am J Sports Med. 2006;34(3):423-430. doi:10.1177/ 0363546505280431
29. Fleisig GS, Laughlin WA, Aune KT, Cain EL, Dugas JR, Andrews JR. Differences among fastball, curveball, and change-up pitching biomechanics across various levels of baseball. Sports Biomech 2016;15(2):128-138. doi:10.1080/ 14763141.2016.1159319
https://doi.org/10.26603/001c.116858
We have received the letter to the editor by Wong, Evans, and Meister and appreciate the authors’ interest in our manuscript “An Interval Throwing Program for Baseball Pitchers Based upon Workload Data.” Thank you for the opportunity to respond. In their letter, Wong et al. made several statements that we find are not supported by science and may be misleading to the reader The letter states that Reinold et al.1 “utilized an unvalidated inertial measurement unit (IMU) device” because “multiple scientific studies”2‑4 have “clearly demonstrated that this particular IMU device is not valid for accurately measuring elbow arm stress.” The letter points out that elbow torque magnitudes from the IMU sensor reported by Reinold et al.1 are significantly less than torque magnitudes reported by “gold standard” motion capture systems. In summary, they state elbow torque magnitudes are different when measured with IMU than when measured with camera-based motion capture, and therefore IMU data are wrong.
We agree that elbow throwing torque magnitudes reported in Reinold et al.1 and nearly two dozen other peerreviewed studies2,3,5‑21 using the IMU are consistently less than elbow torque magnitudes reported by camera-based motion capture studies. However, we challenge the letter’s implication that differences between the two technologies show that motion capture data are correct and IMU data are incorrect. The technologies are different and utilize different capture rates as well as models to build kinematics and kinetics, so naturally there will be variation in values measured. This also happens when comparing camera-based motion capture studies from different labs all the time, as well as between marker-based and markerless motion capture systems.22 It is important for the reader to understand that elbow torque magnitudes are different when comparing between methods, however produce similar patterns that are reliable.
Of the three “scientific studies” cited in the letter, one was simply a letter and not a peer-reviewed study.4 The two actual peer-reviewed validity studies showed significant differences (“inaccuracy”) between the IMU and motion capture but conclude that data were consistent within the IMU (“reliable”).2,3 Wong et al, in their letter, incorrectly stated that the Camp et al paper found the “IMU reliably produces untrustworthy numbers within the same subject”. While in fact, Camp et al specifically stated “intrathrower reliability was not formally assessed.”3 Furthermore, both validation studies showed that elbow torque
from IMU correlated with elbow torque from motion capture. Motion capture may be viewed as the “gold standard” in throwing biomechanics because it has been used in published studies for decades (including many times by us), but the newer IMU technology also produces reliable data that can be used to develop interval throwing programs.
The biomechanical model developed in Dowling et al.5 and used in Reinold et al.1 calculates workload based upon within-subject changes in elbow torque for different types of throws. Because IMU and motion capture data are correlated, the chronic workload graphs for the interval throwing programs presented in these studies would likely be remarkably similar to what is shown even if motion capture data had been used; simply, the magnitude of chronic workload would be on a different scale. Acute:chronic workload ratios likely would not change.
The authors of the letter explained difficulties they had in the past with their past experience using the IMU, which may be the basis for their biased feelings that any research using data from this IMU is inaccurate and invalid. We acknowledge that they had difficulty with this IMU and respect their decision to continue their rehabilitation protocols without using biomechanical data. However, their implication that data in the current study were unreliable because no one was monitoring the throwing with the IMU is absolutely incorrect. One of our researchers (B. Dowling) was in charge of the original data collection and was part of a team that, in fact, did stand with players during throwing activities to monitor the throwing and tag the distance for every throw made. During this collection, researchers instructed players to check and ensure their sleeve did not move throughout each throwing session. Properly fitted sleeves did not move and this was not a substantial issue with each throwing session. In retrospect, we acknowledge it may have been helpful for us to include these details in the methods of our papers.
Another point of consideration is that intensity is only part of the equation of workload modeling, along with volume and frequency While there are other methods of measuring intensity in addition to torque, such as distance, perceived effort, and velocity measured by radar as the letter authors mention, until these methods are studied it is our recommendation to utilize torque. Regardless, considering the program (and all other interval throwing programs) uses partial effort throws to build up volume on flat ground,
intensity is likely not the most significant factor in workload modeling when compared to volume and frequency. When formulating the interval throwing program in our paper1 and Dowling’s previous paper,5 what we actually found was that past programs did a generally acceptable job of progressing workload. But by strategically manipulating the volume and frequency, we were able to formulate a more optimized progression that we feel will be much better tolerated by the patient and help them return to sport safer and more effectively This is the novel approach that we feel makes our throwing program optimal.
It is our belief that any interval throwing program should utilize the most current evidence in regard to biomechanics and workload monitoring. While there may be multiple
ways to quantify intensity, using an interval throwing program that does not consider workload is shortsighted. As explained in our study and furthermore in this response, the updated interval throwing program presented in Reinold et al.1 is based upon reliable biomechanical data and workload management to safely and efficiently rehabilitate pitchers back to pitching after shoulder and elbow injuries.
Michael M. Reinold, DPT; Brittany Dowling, MS; Glenn S. Fleisig, PhD; Leonard C. Macrina, DPT; Kevin E. Wilk, DPT; John T Streepy; James R. Andrews, MD © The Author(s)
This is an open-access article distributed under the terms of the Creative Commons Attribution 4.0 International License (CCBY-NC-4.0). View this license’s legal deed at https://creativecommons.org/licenses/by-nc/4.0 and legal code at https://creativecommons.org/licenses/by-nc/4.0/legalcode for more information.
1. Reinold MM, Dowling B, Fleisig GS, et al. An Interval Throwing Program for Baseball Pitchers Based upon Workload Data. Int J Sports Phys Ther. 2024;19(3):326-336. doi:10.26603/001c.94146
2. Boddy KJ, Marsh JA, Caravan A, Lindley KE, Scheffey JO, O’Connell ME. Exploring wearable sensors as an alternative to marker-based motion capture in the pitching delivery PeerJ 2019;7(1):e6365. doi:10.7717/peerj.6365
3. Camp CL, Loushin S, Nezlek S, Fiegen AP, Christoffer D, Kaufman K. Are Wearable Sensors Valid and Reliable for Studying the Baseball Pitching Motion? An Independent Comparison With MarkerBased Motion Capture. Am J Sports Med 2021;49(11):3094-3101. doi:10.1177/ 03635465211029017
4. Driggers AR, Bingham GE, Bailey CA. Comments on, “The relationship of throwing arm mechanics and elbow varus torque: within-subject variation for professional baseball pitchers across 82,000 throws.” American Journal of Sports Medicine.
5. Dowling B, Brusalis CM, Streepy JT, et al. Workload Comparison of Contemporary Interval Throwing Programs and a Novel Optimized Program for Baseball Pitchers. Int J Sports Phys Ther 2024;19(2):176-188. doi:10.26603/001c.92016
6. Reinold MM, Macrina LC, Fleisig GS, Aune K, Andrews JR. Effect of a 6-week weighted baseball throwing program on pitch velocity, pitching arm biomechanics, passive range of motion, and injury rates. Sports Health 2018;10(4):327-333. doi:10.1177/ 1941738118779909
7. Okoroha KR, Meldau JE, Lizzio VA, et al. Effect of fatigue on medial elbow torque in baseball pitchers: A simulated game analysis. Am J Sports Med 2018;46(10):2509-2513. doi:10.1177/ 0363546518782451
8. Makhni EC, Lizzio VA, Meta F, Stephens JP, Okoroha KR, Moutzouros V. Assessment of Elbow Torque during the Pitching Motion: which has higher torque, the fastball or curveball? ArthroscopyJournal of Arthroscopic and Related Surgery.
9. Dowling B, McNally MP, Laughlin WA, Onate JA. Changes in Throwing Arm Mechanics at Increased Throwing Distances During Structured Long-Toss. Am J Sports Med. 2018;46(12):3002-3006. doi:10.1177/0363546518795892
10. Melugin HP, Larson DR, Fleisig GS, et al. Baseball Pitchers’ Perceived Effort Does Not Match Actual Measured Effort During a Structured Long-Toss Throwing Program. Am J Sports Med 2019;47(8):1949-1954. doi:10.1177/ 0363546519850560
11. Lizzio VA, Smith DG, Jildeh TR, et al. Importance of radar gun inclusion during return-to-throwing rehabilitation following ulnar collateral ligament reconstruction in baseball pitchers: a simulation study J Shoulder Elbow Surg 2020;29(3):587-592. doi:10.1016/j.jse.2019.08.014
12. Camp CL, Tubbs TG, Fleisig GS, et al. The Relationship of Throwing Arm Mechanics and Elbow Varus Torque: Within-Subject Variation for Professional Baseball Pitchers Across 82,000 Throws. Am J Sports Med 2017;45(13):3030-3035. doi:10.1177/0363546517719047
13. Leafblad ND, Larson DR, Fleisig GS, et al. Variability in Baseball Throwing Metrics During a Structured Long-Toss Program: Does One Size Fit All or Should Programs Be Individualized? Sports Health 2019;11(6):535-542. doi:10.1177/1941738119869945
14. Carr JB II, Manzi JE, Estrada J, Dowling B, McElheny KL, Dines JS. Interval Throwing Programs at Distances Beyond 150 Feet Can Be Equivalent to Pitching Over Five Innings. Arthroscopy. 2022;38(9):2638-2646. doi:10.1016/ j.arthro.2022.05.006
15. Lizzio VA, Gulledge CM, Smith DG, et al. Predictors of elbow torque among professional baseball pitchers. J Shoulder Elbow Surg 2020;29(2):316-320. doi:10.1016/j.jse.2019.07.037
16. Okoroha KR, Lizzio VA, Meta F, Ahmad CS, Moutzouros V, Makhni EC. Predictors of Elbow Torque Among Youth and Adolescent Baseball Pitchers. Am J Sports Med 2018;46(9):2148-2153. doi:10.1177/0363546518770619
17. Sakurai M, Barrack AJ, Lobb NJ, et al. Collegiate baseball pitchers demonstrate a relationship between ball velocity and elbow varus torque, both within and across pitchers. Sports Biomech. Published online 2023. doi:10.1080/14763141.2023.2205380
18. Dias T, Lerch BG, Slowik JS, et al. Biomechanical Basis of Interval Throwing Programs for Baseball Pitchers: A Systematic Review. Int J Sports Phys Ther. 2023;18(5):1036-1053. doi:10.26603/001c.87811
19. Dowling B, McElheny KD, Camp CL, Ling DI, Dines JS. Effects of Mound Versus Flat-Ground Pitching and Distance on Arm Mechanics and Elbow Torque in High School Pitchers. Orthop J Sports Med. 2020;8(12). doi:10.1177/2325967120969245
20. Mehta S. Relationship between workload and throwing injury in varsity baseball players. Physical Therapy in Sport. 2019;40:66-70. doi:10.1016/ j.ptsp.2019.08.001
21. Manzi JE, Dowling B, Trauger N, et al. The Relationship Between Maximum Shoulder Horizontal Abduction and Adduction on Peak Shoulder Kinetics in Professional Pitchers. Sports Health. 2023;15(4):592-598. doi:10.1177/19417381221104038
22. Fleisig GS, Slowik JS, Wassom D, Yanagita Y, Bishop J, Diffendaffer A. Comparison of marker-less and marker-based motion capture for baseball pitching kinematics. Sports Biomech Published online May 19, 2022:1-10. doi:10.1080/ 14763141.2022.2076608