


INTERNATIONAL JOURNAL OF SPORTS PHYSICAL THERAPY An Official Publication of A North American Sports Medicine Institute Publication
PT
I J S
Unsplash Partnering with
Photo by CHUTTERSNAP on
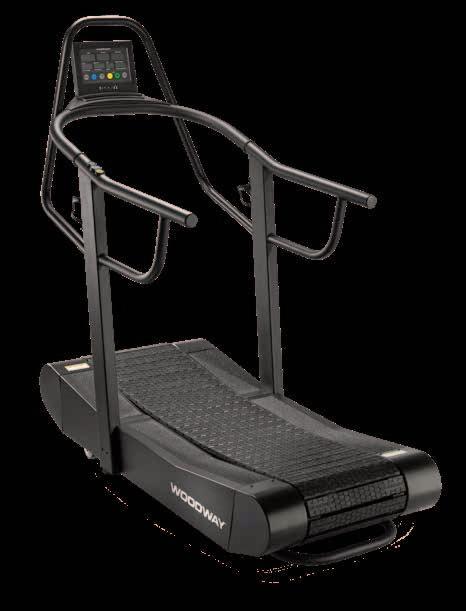
Build on the unrivaled Woodway running experience by adding resistance to your run and reap the benefits of sled pushes, parachute runs and more with the Woodway FTG.
Contact us at 800-WOODWAY or info@woodway.com to experience the Woodway difference.
#1 Performance Treadmill. The Runner’s Choice.

[FREE,
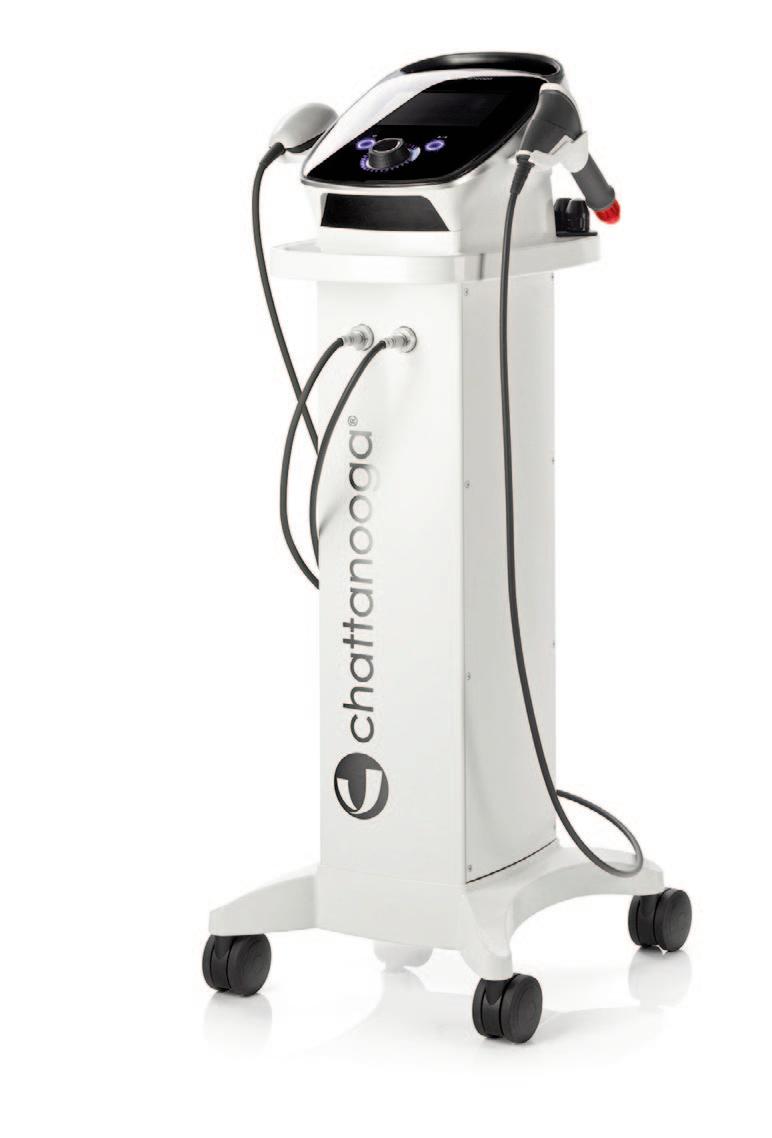
WHAT YOU DON’T KNOW ABOUT ESWT
Extracorporeal Shockwave Therapy (ESWT) is a versatile modality that can be used to treat a variety of musculoskeletal dysfunctions. In this free, on-demand webinar, Dr. Pavel Novak, Director of Science and Technology at Storz Medical AG in Tägerwilen, Switzerland, provides insight that will help you drive positive outcomes with this technology.
Dr. Novak has been involved with the design of shockwave equipment for the past 25 years in addition to conducting other biomedical research for almost 50 years. In that time, he has developed 90 patents and written more than 100 research papers and presentations. Dr. Novak’s extensive experience with shockwave technology, biomedical research, and product development makes for an illuminating discussion. Topics of discussion include the following:
• Identifying an inferior piece of ESWT equipment
• RPW vs FSW
• Mechanisms behind treatment outcomes
• The future of ESWT technology

Register using the QR code above or visit learn.chattanoogarehab.com/ ijspt-mar-24-journal

ON-DEMAND
WEBINAR]
Copyright © 2024 by DJO, LLC • MKT00-12867 Rev A Individual results may vary. Neither DJO, LLC nor any of the Enovis companies dispense medical advice. The contents of this document do not constitute medical, legal, or any other type of professional advice. Rather, please consult your healthcare professional for information on the courses of treatment, if any, which may be appropriate for you.
PRESENTED BY


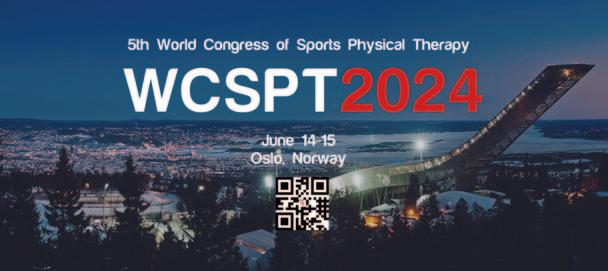
Welcome to the Fifth World Congress of Sports Physical Therapy, presented by the International Federation of Sports Physical Therapy and NFFs Faggruppe for Idrettsfysioterapi og Aktivitesmedisin!
Join us June 14-15, 2024 in beautiful Oslo, Norway for a fantastic experience, whether you are a novice or experienced clinician. You will meet up with colleagues from all around the world, sharing knowledge, best practices, create networks and have a lot of fun. Enjoy an exciting schedule full of interesting lectures and engaging workshops!
Key Dates:
May 14, 2024 Workshops
June 13, 2024 IFSPT General Meeting
June 14-15, 2024 Congress
From Research to Clinical Practice
• 18 practical Workshops
• Oral presentations
• Posters
• Networking opportunities
IMPORTANT!
BOOK YOUR HOTEL ROOM NOW WHILE SELECTION AND EXCHANGE RATE ARE IDEAL!
REGISTRATION IS NOW OPEN AT WCSPT.ORG!


SUPPORTED BY
iIFSPT TITLE SPONSOR
AND
WCSPT MARKETING PARTNER
WCSPT GOLD SPONSORS

November 8, 2024
Bern, Switzerland

SAVE THE DATE!
Neurocognitive Enriched Rehabilitation
Focus on
IJSPT
international JOURNAL OF SPORTS PHYSICAL THERAPY
Board of Directors / Business Advisory Board
Turner A Blackburn, APTA Life Member, AT-Ret, AOSSM-Ret President
Mary Wilkinson Executive Director
Michael Voight Executive Editor and Publisher
Joe Black, PT, DPT, SCS, ATC
Eric Fernandez
Jay Greenstein, DC
Skip Hunter, PT, ATC-Ret
Russ Paine, PT, DPT
Tim Tyler, PT, ATC
Sports Legacy Advisory Board
Turner A. Blackburn, PT, ATC
George Davies, PT, DPT, MEd, SCS, ATC, LAT, CSCS, PES, FAPTA
Terry Malone, PT, PhD
Bob Mangine, PT
Barb Sanders, PT, PhD
Tim Tyler, PT, ATC
Kevin Wilk, PT, DPT, FAPTA
Staff
Executive Editor/Publisher
Michael L. Voight, PT, DHSc, OCS, SCS, ATC, CSCS Executive Director/Operations and Marketing
Mary Wilkinson
Editor in Chief
Barbara Hoogenboom, PT, EdD, SCS, ATC Managing Editor
Ashley Campbell, PT, DPT, SCS, CSCS Manuscript Coordinator
Casey Lewis, PTA, ATC
NORTH AMERICAN SPORTS MEDICINE INSTITUTE
Publisher
Contact Information
International Journal of Sports Physical Therapy
6011 Hillsboro Pike
Nashville, TN 37215, US,
http://www.ijspt.org
IJSPT is a monthly publication, with release dates on the first of each month.
ISSN 2159-2896
Underwriting Sponsor
Genie Health
Founding Sponsors
Biodex
Enovis
Exertools
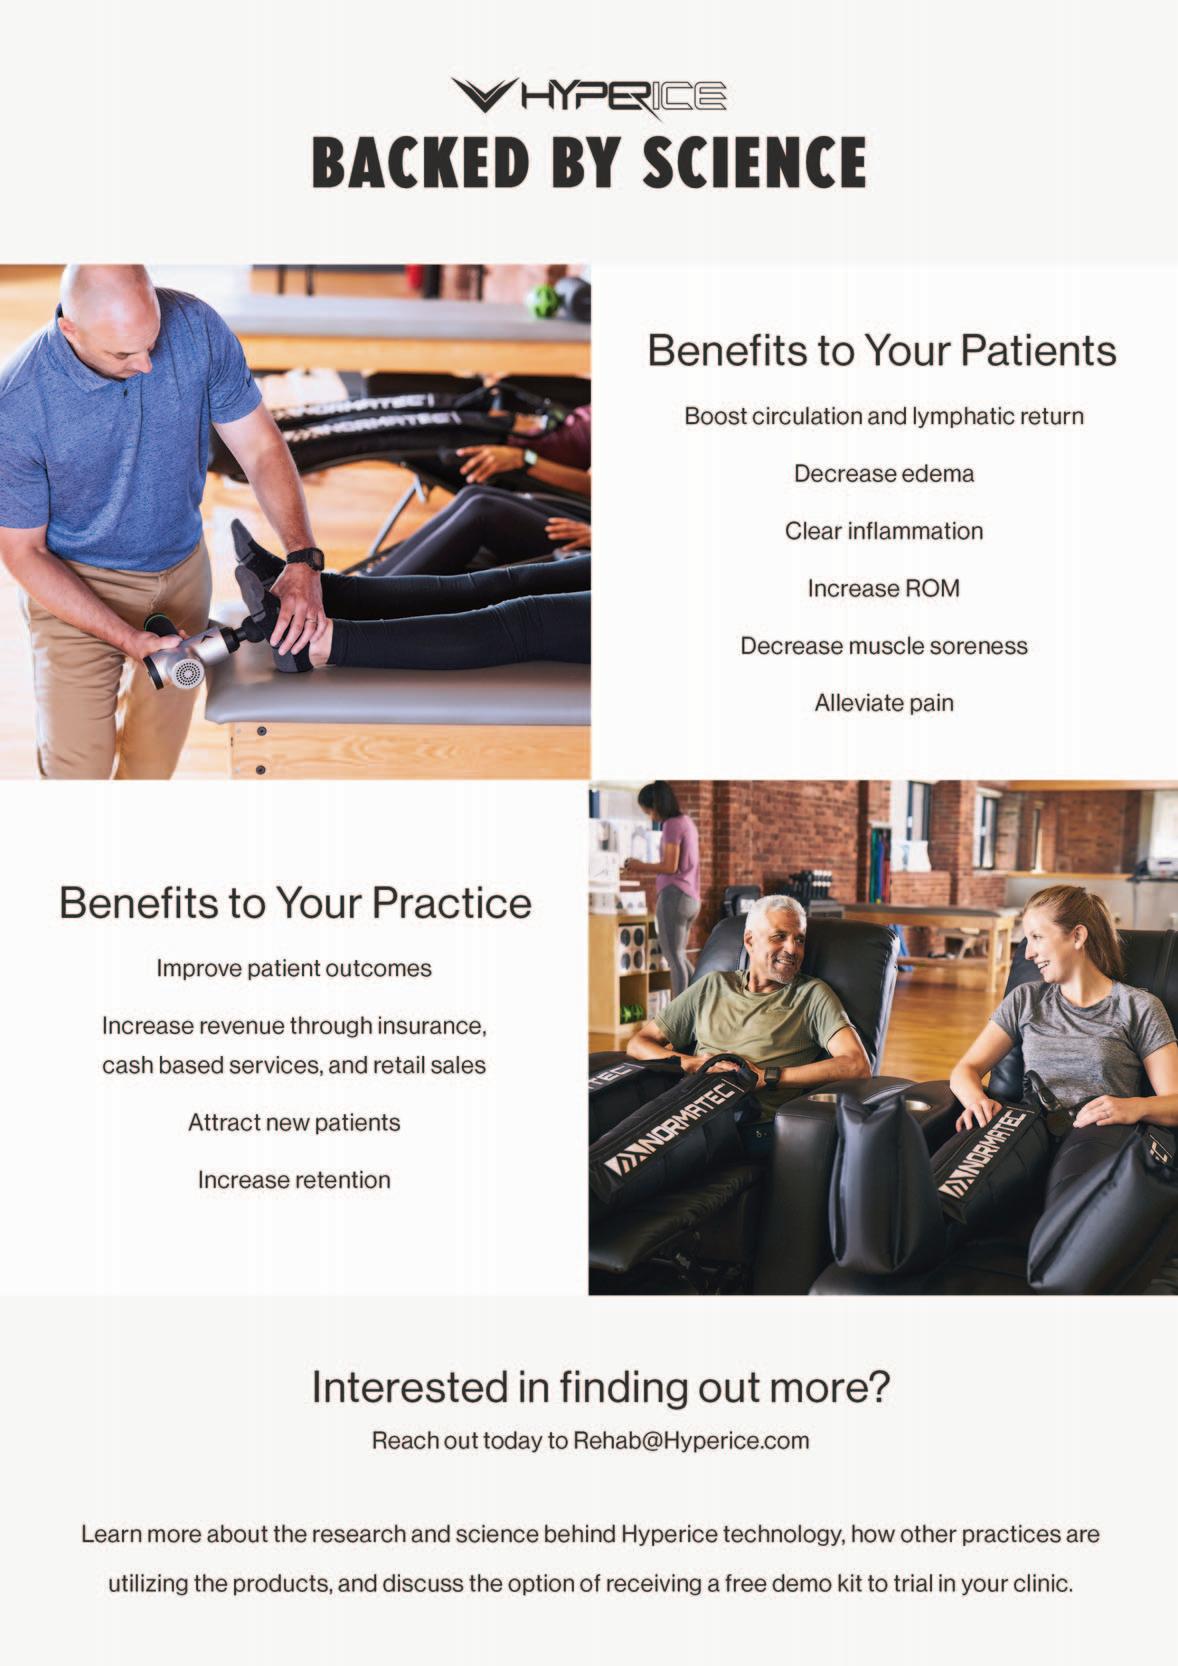
Hyperice
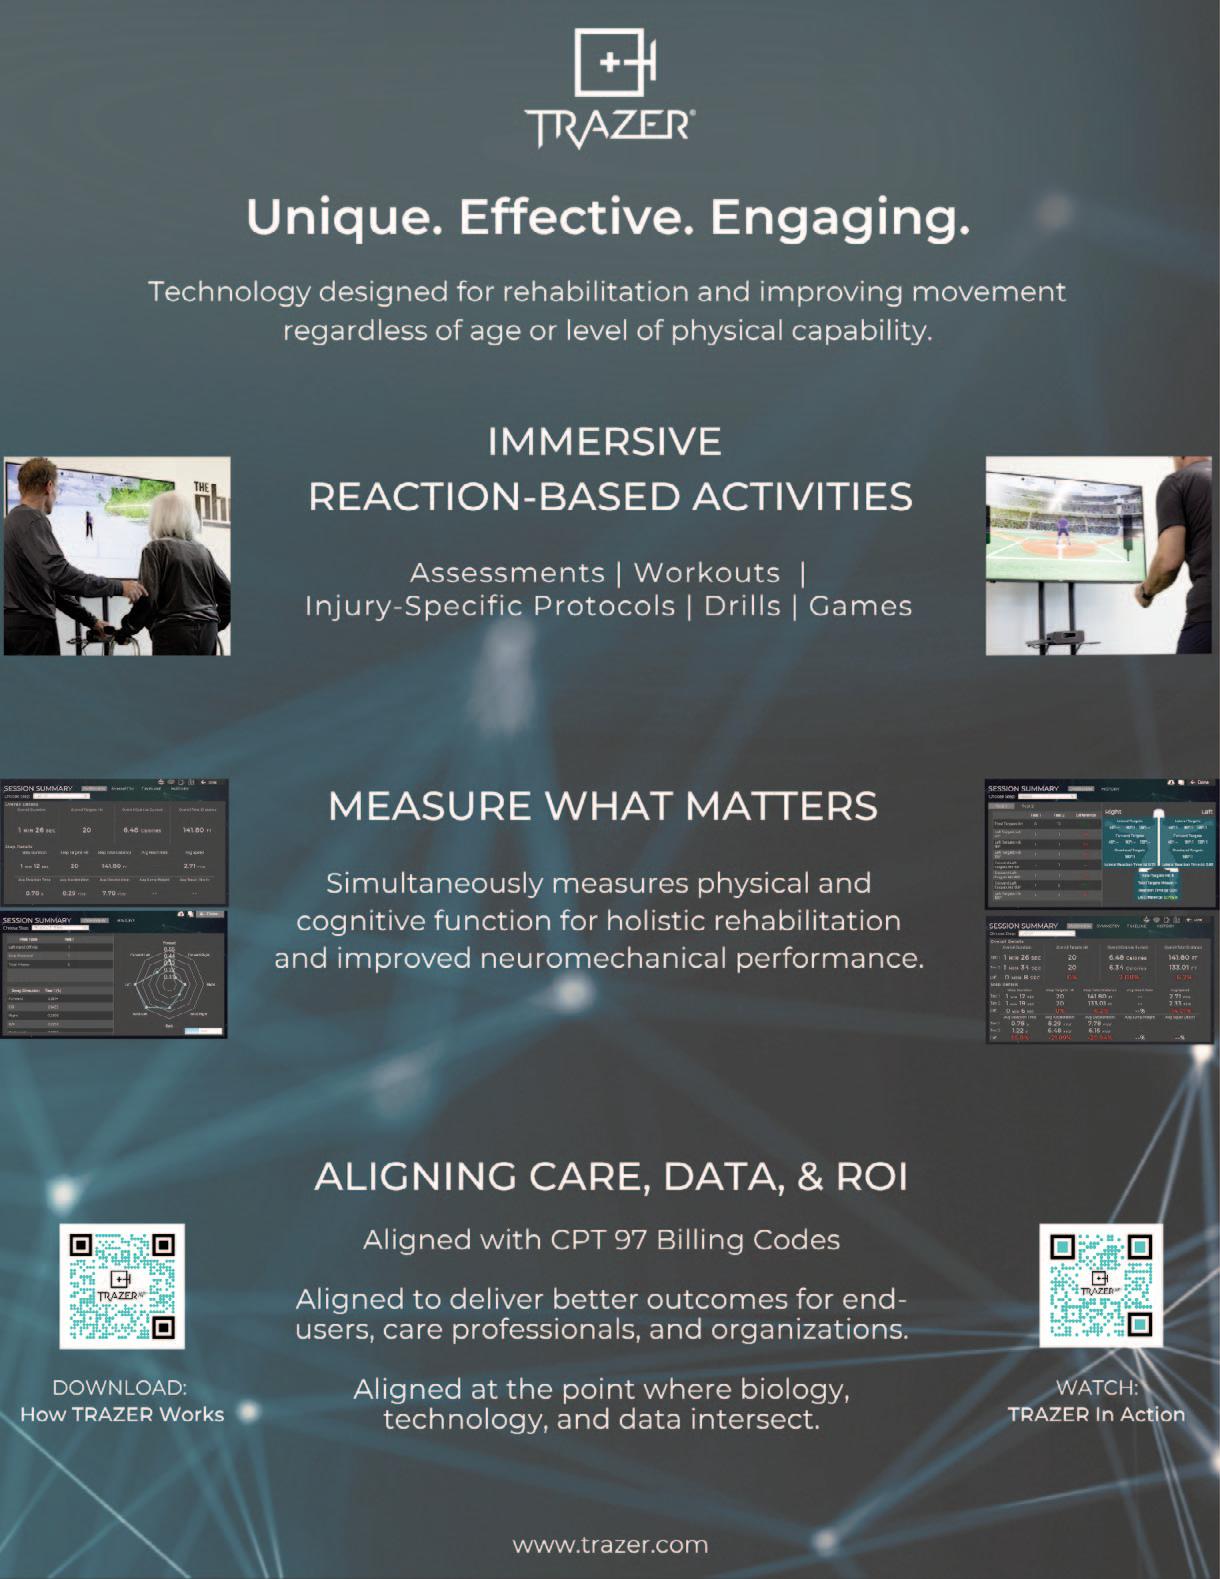
Trazer
Woodway
Platinum Sponsors
ATI
Elvation
Gold Sponsors
Hawkgrips
Kayezen
Structure + Function Education
Winback Partners
Northeast Seminars
Academy of Human Movement
American Academy of Sports Physical Therapy
IJSPT is an official journal of the International Federation of Sports Physical Therapy (IFSPT). Countries with access to IJSPT as a member benefit. Reach us at www.ifspt.org.

IJSPT is an official journal of the ICCUS Society for Sports Rehabilitation. www.iccus.org

EDITORIAL
THE CHANGING WORLD OF SPORTS PHYSICAL THERAPY.
Robert Mangine, PT, CPT, ATC. Med.
Senior Associate Athletic Director Sports Medicine
University of Cincinnati, Men’s Basketball and Golf Athletic Trainer
University of Cincinnati
National Director Sports PT Residency
NovaCare Rehabilitation
The role of the sports physical therapist has changed drastically in the last few years. No longer do we serve just a clinical role in the rehabilitation aspects of the athlete’s post injury recovery and guide the return to play. Sports physical therapy has now become fully immersed into the variety of topographies that make up the contemporary athlete of today. An interprofessional team of sports medicine healthcare providers assist athletes in all areas of physical and psychological training to be prepared for competition; assess physical abilities and performance techniques in order to judge risk of injury and enhance performance; rehabilitate following traumatic and overuse injuries that encumber the athlete’s ability to compete; and manage acute injuries during performance. Yet with all this work being done, there is still more work to do; much more that we can learn every day when working with diverse athletes from a multitude of different sports at all levels of competition.
On June 16, 2020, my life was changed forever when my 16-year-old grandson passed away on a soccer field after collapsing near the end of practice, suffering a cardiac event. I never in my wildest imagination thought that such an event could hit so close to home… to my own family.
Less than two years later, on January 2, 2023, the world watched as members of the Cincinnati Bengals and Buffalo Bills sports medicine teams saved the life of Damar Hamlin - just six miles from the soccer field where Matthew Mangine Jr. participated for the last time as a promising high school athlete.
The difference: in the case of Damar, the members of the sports medicine team were prepared with a properly executed emergency action plan
that was practiced and executed with haste and precision in response to a sudden cardiac event. Yet, within this country, the incidence of sudden cardiac death (SCD) of athletes has been reported to be as high as one every three days in competitive sports activities.1,2 It is important to note that reported incidences of SCD vary drastically1 due to variations in demographic information collected as well as variability in the operational definition of who is an athlete, further complicating how we as sports medicine professionals address this cataclysm.
This is an unacceptable dilemma, due to the disparities in access to quality sports medicine care for all athletes of all levels of competition. At the professional and collegiate level, there are checks and balance systems that requires all members of the sports medicine staff to work in unison to avoid catastrophic outcomes. Even with this level of preparation, athletes are still at risk. There is still so much more work to do to safeguard athletes as they train and compete, whether it be on a national stage in front of thousands of fans or in a community park with only the most resolute family and friends present.
Throughout my career as a sports physical therapist I have worked with athletes of all levels of competition – reactional athletes to Olympic medalists. In current practice I serve as senior associate athletic director of sports medicine, physical therapist and athletic trainer for men’s basketball and golf teams at the University of Cincinnati. I also serve as director of an APTA credentialed sports residency program which I have actively participated for many years. Our residents serve side by side with us on the field and court, and train tirelessly to respond to all aspects of athletes’ health
and wellness, including catastrophic emergencies. We do more than just rehabilitate athletes following orthopedic injury.
Sports physical therapists are part of the sports healthcare professional team and should play an integral role in prevention and reduction of catastrophic events such as sudden cardiac death, heat related illness, and other non-orthopedic medical conditions that affect athletes. We must be involved in the prevention, education, and management of all aspects of athletes’ health and wellbeing – meeting the needs of the person/athlete, not solely the management of specific high incidence conditions like ACL and RTC.
Sports physical therapists must participate within the community of sports at all levels,recreational, competitive youth, collegiate, professional, seniors, athletes with disabilities and other special interest groups, to do more than just manage sports related injuries and conditions. We must also be an integral part in the mitigation of sports related injury and illnesses through education and prevention programs. We, as Sports Physical Therapists, need to step up and take on a new role, becoming more involved in the communities we live in to change the focus of sports medicine care from care to the high-profile athlete with the high profile conditions to care of all athletes for all aspects of health and wellbeing.
Sports physical therapists must educate parents, assist in the design of Emergency Action Plans, educate coaches and parents on CPR and AED usage, provide lifesaving equipment, and assist coaches in practicing emergency response. Practicing for a lifesaving event needs to be more than just an annual event, but performed over and over again so it becomes as common place as rehabbing an ACL. We must go out to the fields and on the courts and become advocates for awareness, training, and action plans. We must also prepare others for the future of sports physical therapy through mentoring and leadership programs.
The American Academy of Sports Physical Therapy leadership team must lead the way and approach the future of sports medicine by addressing the needs of those we have trained to and pledged to protect – the athletes. The leaders of today will shape and mold the future leaders of our Academy in the future. Just as residency programs have positively impacted the qualifications and experience level of our member-
ship, leadership training and mentorship will provide future leaders of our organization with practical, professional engagement strategies to meet the needs of the organization and all of its stakeholders. Successful leadership training is key to development of leadership succession that will foster consistent growth in membership participation and continued self-assessment to ensure our organization is meeting the needs of not only its members but also those individuals that the members provide care to. This should be the business of the American Academy of Sports Physical Therapy.
We no longer can look at the sports physical therapist as an adjunct to other members of the sports medicine team in the clinical model. Instead, the Academy must be more engaged in the growth and development of our organization’s role to serve its members by providing them with the resources and training needed to be an integral member of a sports medicine team that address all elements of the athlete’s healthcare needs. Quality, evidence-based rehabilitation care following athletic injury is the job of a sports physical therapist, but saving lives through prevention, preparation and education is the responsibility of ALL members of the sports medicine team.
In the current position of the Academy within the sports medicine family, we must focus on increasing membership, providing inclusive engagement opportunities, producing quality educational programming for members, supporting quality research efforts, establishing financial stability, and developing external programs that meet the needs of athletes in our communities. We, as sports physical therapists, must strive to meet these needs in the future for the health and safety of all athletes at every level, specialty interest, and activity engagement.
We are at a crisis in our ability to achieve these goals. In the not-too-distant past, our Academy has failed to lead us in that direction. The current Academy leadership has made significant gains in changing the direction of the Academy and has produced a level of financial solvency, but there is so much more to do. We must approach this crisis with bold moves, effective leadership, complete transparency, and the resolve that we ask of our patients and athletes.
References
1. Finocchiaro G, Westaby J, Sheppard MN, et al. Sudden cardiac death in young athletes: JACC State-of-the-Art Review. Journal of the American College of Cardiology. 2024;83(2):350-370. doi:10.1016/j.jacc.2023.10.032
2. Ghani U, Farooq O, Alam S, et al. Sudden cardiac death in athletes: Consensuses and controversies. Cureus. 2023;15(6):e39873. doi:10.7759/cureus.39873

IJSPT
Executive Editor/Publisher
INTERNATIONAL JOURNAL OF SPORTS PHYSICAL THERAPY
Michael L. Voight, PT, DHSc, OCS, SCS, ATC, CSCS
Belmont University
Nashville, Tennessee – USA
Editor in Chief
Barbara Hoogenboom, PT, EdD, SCS, ATC
Grand Valley State University Grand Rapids, Michigan - USA
Managing Editor
Ashley Campbell, PT, DPT, SCS, CSCS
Nashville Sports Medicine and Orthopaedic Center
Nashville, Tennessee – USA
Manuscript Coordinator
Casey Lewis, PTA, ATC
Nashville Sports Medicine and Orthopaedic Center
Nashville, Tennessee – USA
Executive Director/Marketing
Mary Wilkinson
Indianapolis, Indiana – USA
Editors
Robert Manske PT, DPT, Med, SCS, ATC, CSCS
University of Wichita Wichita, KS, USA
Terry Grindstaff, PT, PhD, ATC, SCS, CSCS
Creighton University Omaha, NE, USA
Phil Page PT, PhD, ATC, CSCS
Franciscan University DPT Program Baton Rouge, LA, USA
Kevin Wilk PT, DPT, FAPTA
Clinical Viewpoint Editor
Champion Sports Medicine Birmingham, AL, USA
International Editors
Luciana De Michelis Mendonça, PT, PhD
UFVJM
Diamantina, Brazil
Colin Paterson PT, MSc PGCert(Ed), MCSP, RISPT, SFHEA
University of Brighton
Brighton, England, UK
Chris Napier, PT, PhD
Clinical Assistant Professor
University of British Coumbia, Vancouver, BC, Canada
Nicola Phillips, OBE, PT, PhD, FCSP
Professor School of Healthcare Sciences
Cardiff University, Cardiff, Wales, UK
Associate Editors
Eva Ageberg, PT, PhD
Professor, Lund University
Lund, Sweden
Lindsay Becker, PT, DPT, SCS, USAW
Buckeye Performance Golf Dublin, Ohio, USA
Keelan Enseki, PT, MS, OCS, SCS, ATC
University of Pittsburgh
Pittsburgh, PA, USA
John Heick, PT, PhD, DPT, OCS, NCS, SCS
Northern Arizona University
Flagstaff, AZ, USA
Julie Sandell Jacobsen, MHSc, PhD
VIA University
Aarhus, Denmark
RobRoy L. Martin, PhD, PT, CSCS
Duquesne University
Pittsburgh, PA, USA
Andrea Mosler, PhD, FACP, FASMF
La Trobe Sport and Exercise Medicine Research
Centre, School of Allied Health, Human Services and Sport, La Trobe University
Melbourne, Victoria, Australia
Brandon Schmitt, DPT, ATC
PRO Sports Physical Therapy
Scarsdale, NY, USA
Barry Shafer, PT, DPT
Elite Motion Physical Therapy
Arcadia, CA, USA
Laurie Stickler, PT, DHSc, OCS
Grand Valley State University
Grand Rapids, MI, USA
Editorial Board
James Andrews, MD
Andrews Institute & Sports Medicine Center
Gulf Breeze, AL, USA
Amelia (Amy) Arundale, PT, PhD, DPT, SCS
Red Bull/Ichan School of Medicine
Salzburg, Austria/New York, NY, USA
Gary Austin, PT PhD
Belmont University
Nashville, TN, USA
Roald Bahr, MD
Oslo Sports Trauma Research Center
Oslo, Norway
Lane Bailey, PT, PhD
Memorial Hermann IRONMAN Sports Medicine Institute
Houston, Texas, USA
Gül Baltaci, PT,Ph.D. Professor, CKTI, FACSM
Private Guven Hospital
Ankara, Turkey
Asheesh Bedi, MD
University of Michigan
Ann Arbor, MI, USA
EDITORIAL BOARD
David Behm, PhD
Memorial University of Newfoundland St. John's, Newfoundland, Canada
Barton N. Bishop, PT, DPT, SCS, CSCS
Kaizo Clinical Research Institute Rockville, Maryland, USA
Mario Bizzini, PhD, PT
Schulthess Clinic Human Performance Lab Zürich, Switzerland
Joe Black, PT, DPT, SCS, ATC Total Rehabilitation Maryville, Tennesse, USA
Turner A. "Tab" Blackburn, APTA Life Member, ATC-Ret, AOSSM-Ret
NASMI
Lanett, AL, USA
Lori Bolgla, PT, PhD, MAcc, ATC
Augusta University Augusta, Georgia, USA
Matthew Briggs
The Ohio State University Columbus, OH, USA
Tony Brosky, PT, DHSc, SCS Bellarmine University Louisville, KY, USA
Brian Busconi, MD
UMass Memorial Hospital Boston, MA, USA
Robert J. Butler, PT, PhD
St. Louis Cardinals
St. Louis, MO, USA
Duane Button, PhD Memorial University
St. Johns, Newfoundland, Canada
J. W. Thomas Byrd, MD
Nashville Sports Medicine and Orthopaedic Center Nashville, TN, USA
Lyle Cain, MD
Andrews Institute & Sports Medicine Center Birmingham, AL, USA
Gary Calabrese, PT, DPT Cleveland Clinic Cleveland, Ohio, USA
Meredith Chaput, PT, DPT, SCS Ohio University Athens, OH, USA
Rita Chorba, PT, DPT, MAT, SCS, ATC, CSCS United States Army Special Operations Command Fort Campbell, KY, USA
John Christoferreti, MD
Texas Health
Dallas, TX, USA
Richard Clark, PT, PhD
Tennessee State University Nashville, TN, USA
Juan Colado, PT, PhD
University of Valencia Valencia, Spain
Brian Cole, MD
Midwest Orthopaedics at Rush Chicago, IL, USA
Ann Cools, PT, PhD
Ghent University
Ghent, Belgium
Andrew Contreras, DPT, SCS Washington, DC, USA
George Davies, PT, DPT, MEd, SCS, ATC, LAT, CSCS, PES, FAPTA
Georgia Southern University Savannah, Georgia, USA
Pete Draovich, PT Jacksonville Jaguars Footbal Jacksonvile, FL, USA
Jeffrey Dugas, MD
Andrews Institute & Sports Medicine Center Birmingham, AL, USA
Jiri Dvorak, MD Schulthess Clinic Zurich, Switzerland
Todd Ellenbecker Rehab Plus Phoenix, AZ, USA
Carolyn Emery, PT, PhD University of Calgary Calgary, Alberta, Canada
Ernest Esteve Caupena, PT, PhD University of Girona Girona, Spain
Sue Falsone, PT, MS, SCS, ATC, CSCS, COMT Structure and Function Education and A.T. Still University Phoenix, Arizona, USA
J. Craig Garrison, PhD, PT, ATC, SCS Texas Health Sports Medicine Fort Worth, Texas, USA
Maggie Gebhardt, PT, DPT, OCS, FAAOMPT Fit Core Physical Therapy/Myopain Seminars Atlanta, GA and Bethesda, MD, USA
Lance Gill, ATC LG Performance-TPI Oceanside, CA, USA
Phil Glasgow, PhD, MTh, MRes, MCSP Sports Institute of Northern Ireland Belfast, Northern Ireland, UK
Robert S. Gray, MS, AT Cleveland Clinic Sports Health Cleveland, Ohio, USA
Jay Greenstein, DC Kaizo Health Baltimore, MD, USA
EDITORIAL BOARD
Martin Hagglund, PT PhD
Linkoping University
Linkoping, Sweden
Allen Hardin, PT, SCS, ATC, CSCS
University of Texas Austin, TX, USA
Richard Hawkins, MD
Professor of surgery, University of South Carolina
Adjunct Professor, Clemson University
Principal, Steadman Hawkins, Greenville and Denver (CU)
John D.Heick, PT, PhD, DPT, OCS, NCS, SCS
Northern Arizona University Flagstaff, AZ, USA
Tim Hewett, PhD
Hewett Consulting Minneapolis, Minnesota, USA
Per Hølmich, MD
Copenhagen University Hospital
Copenhagen, Denmark
Kara Mae Hughes, PT, DPT, CSCS
Wolfe PT Nashville, TN, USA
Lasse Ishøi, PT, MSc
Sports Orthopedic Research Center
Copenhagen University Hospital Hvidovre, Denmark
Jon Karlsson, MD
Sahlgrenska University Goteborg, Sweden
Brian Kelly, MD
Hospital for Special Surgery New York, NY, USA
Benjamin R. Kivlan, PhD, PT, OCS, SCS
Duquesne University Pittsburgh, PA, USA
Dave Kohlrieser, PT, DPT, SCS, OCS, CSCS
Ortho One
Columbus, OH, USA
Andre Labbe PT, MOPT
Tulane Institute of Sports Medicine New Orleans, LA USA
Henning Langberg, PT, PhD
University of Copenhagen Copenhagen, Denmark
Robert LaPrade, MD
Twin Cities Orthopedics Edina, MN, USA
Lace Luedke, PT, DPT
University of Wisconsin Oshkosh Oshkosh, WI, USA
Phillip Malloy, PT, PhD
Arcadia University/Rush University Medical Center Glenside, PA and Chicago, IL, USA
Terry Malone, PT, EdD, ATC, FAPTA
University of Kentucky
Lexington, KY, USA
Robert Mangine, PT University of Cincinnati Cincinnati, OH, USA
Eric McCarty, MD
University of Colorado
Boulder, CO, USA
Ryan P. McGovern, PhD, LAT, ATC
Texas Health Sports Medicine Specialists
Dallas/Fort Worth, Texas, USA
Mal McHugh, PhD NISMAT
New York, NY, USA
Joseph Miller, PT, DSc, OCS, SCS, CSCS
Pikes Peak Community College
Colorado Springs, CO, USA
Havard Moksnes, PT PhD
Oslo Sports Trauma Research Center
Oslo, Norway
Andrew Murray, MD, PhD
European PGA Tour
Edinburgh, Scotland, UK
Andrew Naylor, PT, DPT, SCS
Bellin Health
Green Bay, WI, USA
Stephen Nicholas, MD
NISMAT New York
New York, NY, USA
John O'Donnel, MD
Royal Melbourne Hospital Melbourne, Australia
Russ Paine, PT
McGovern Medical School
Houston, TX, USA
Snehal Patel, PT, MSPT, SCD
HSS Sports Rehabilitation Institute
New York, NY, USA
Marc Philippon, MD
Steadman-Hawkins Clinic Vail, CO, USA
Kevin Plancher, MD, MPH, FAAOS
Plancher Orthopedics and Sports Medicine
New York, NY USA
Marisa Pontillo, PT, PhD, DPT, SCS
University of Pennsylvania Health System
Philadelphia, PA, USA
Matthew Provencher, MD
Steadman Hawkins Clinic Vail, CO, USA
Charles E. Rainey, PT, DSc, DPT, MS, OCS, SCS, CSCS, FAAOMPT
United States Public Health Service
Springfield, MO, USA
EDITORIAL BOARD
Alexandre Rambaud, PT PhD
Saint-Etienne, France
Carlo Ramponi, PT
Physiotherapist, Kinè Rehabilitation and Orthopaedic Center
Treviso, Italy
Michael Reiman, PT, PhD
Duke University
Durham, NC, USA
Mark F. Reinking, PT, PhD, SCS, ATC
Regis University
Denver, CO, USA
Mark Ryan, ATC
Steadman-Hawkins Clinic
Vail, CO, USA
David Sachse, PT, DPT, OCS, SCS
USAF
San Antonio, TX, USA
Marc Safran, MD
Stanford University Palo Alto, CA, USA
Alanna Salituro, PT, DPT, SCS, CSCS New York Mets
Port Saint Lucie, FL, USA
Mina Samukawa, PT, PhD, AT (JSPO)
Hokkaido University Sapporo, Japan
Barbara Sanders, PT, PhD, FAPTA, Board Certified Sports Physical Therapy Emeritus
Professor and Chair, Department of Physical Therapy
Texas State University Round Rock, TX, USA
Felix “Buddy” Savoie, MD, FAAOS
Tulane Institute of Sport Medicine
New Orleans, LA, USA
Teresa Schuemann, PT, DPT, ATC, CSCS, Board
Certified Specialist in Sports Physical Therapy
Evidence in Motion Fort Collins, CO, USA
Timothy Sell, PhD, PT, FACSM
Atrium Health Musculoskeletal Institute Charlotte, NC, USA
Andreas Serner, PT PhD
Aspetar Orthopedic and Sports Medicine Hospital Doha, Qatar
Ellen Shanley, PT, PhD
ATI
Spartanburg, SC, USA
Karin Silbernagel, PT, PhD
University of Delaware Newark, DE, USA
Holly Silvers, PT, PhD
Velocity Physical Therapy
Los Angeles, CA, USA
Lynn Snyder-Mackler, PT, ScD, FAPTA
STAR University of Delaware Newark, DE, USA
Alston Stubbs, MD Wake Forest University Winston-Salem, NC, USA
Amir Takla, B.Phys, Mast.Physio (Manip), A/Prof Australian Sports Physiotherapy
The University of Melbourne Melbourne, Australia
Charles Thigpen, PhD, PT, ATC
ATI
Spartanburg, SC, USA
Steven Tippett, PT, PhD, ATC, SCS
Bradley University
Peoria, IL, USA
Tim Tyler, PT, ATC
NISMAT
New York, NY, USA
Timothy Uhl, PT, PhD, ATC
University of Kentucky Lexington, KY, USA
Bakare Ummukulthoum, PT University of the Witswatersrand
Johannesburg, Gauteng, South Africa
Yuling Leo Wang, PT, PhD Sun Yat-sen University
Guangzhou, China
Mark D. Weber, PT, PhD, SCS, ATC Texas Women’s University Dallas, TX, USA
Richard B. Westrick, PT, DPT, DSc, OCS, SCS US Army Research Institute Boston, MA, USA
Chris Wolfe, PT, DPT
Belmont University Nashville, TN, USA
Tobias Wörner, PT, MSc Lund University
Stockholm, Sweden
TABLE OF CONTENTS
VOLUME 19, NUMBER 3
EDITORIAL
The Changing World of Sports Physical Therapy. Mangine R.
CLINICAL VIEWPOINT
251 Why Your Patient May Need an ACL Reconstruction Plus Lateral Extra-Articular Tenodesis Procedure. Momaya A, Harris C, Hargreaves M.
ORIGINAL RESEARCH
258 The Validity of a Portable Strain-Gauge Apparatus Versus a Commercial Isokinetic Dynamometer for Evaluating Knee Extension Kinetics. Oranchuk DJ, Juneau CM, Diewald SS, et al.
268 Reliability and Validity of the End Range Hamstring Strength Test with Handheld Dynamometry. Kristiansen JB, Eddy C, Magnusson SP.
275 The Effect of Variations in Knee and Hip Angles on Electromyographic Activity of the Hamstring and Related Muscles During the Nordic Hamstring Exercise. Keerasomboom T, Soga T, Hirose N.
284 Effects of Verbal and Tactile Cues on Gluteus Maximus Strength and Broad Jump Distance. Lehecka BJ, Daniels T, Koester B, et al.
290 The Effect of Exercise-Induced Central Fatigue on Cervical Spine Joint Position Error, Strength, and Endurance.
Vintimilla A, Sizer P, Hooper T, et al.
301 Development and Feasibility of an Adolescent Dancer Screen. Schultz K, Worrall KS, Tawa Z, et al.
316 “I Feel Like I Have Lost Part of My Identity” - A Qualitative Study Exploring The Impact of Chronic Ankle Instability.
Mohrsen A, Sørensen T, Lund H, et al.
326 An Interval Throwing Program for Baseball Pitchers Based upon Workload Data. Reinold MM, Dowling B, Fleisig GS, Macrina LC, Wilk KE, Streepy JT, Andrews JR.
LITERATURE REVIEW
337 Hypertrophy Training Following A Total Hip Replacement: A Literature Review. Takla A, Rafla M, O’Donnell J, et. al.
CLINICAL COMMENTARY
351 Suggestions and Considerations for Application of Movement Screens to Clinical Practice. Skibski A, Onate JA, Mangum LC.
355 Implementing Velocity-Based Training to Optimize Return to Sprinting After Anterior Cruciate Ligament Reconstruction in Soccer Players: A Clinical Commentary. Forelli F, Riera J, Marine P, et al.
MSK ULTRASOUND BITES: TIPS AND TRICKS
366 MSK Ultrasound: A Powerful Tool for Evaluating and Diagnosing Pectoralis Major Injuries in Healthcare Practice.
Manske RC, Wolfe C, Page P, Voight M.
DIGITAL HEALTH CORNER BY GENIE HEALTH
372 Gaining Ground.
Bührs D.
PAGE TITLE


digital physical therapy solution
combining remote monitoring and telehealth
the top

risk assessment and remote management tools for occupational health


sports genie PT genie woRx genie
in-clinic and remote sports/functional assessment and management revenue staffing challenges accessibility
is managed
value-
genie health at a glance... deliver a virtual therapy solution tech platform & optional clinical staff turn-key solution to your organization genie.health | sales@genie.health | 321-558-6855 improve Drive revenue through remote monitoring
Founded by two prominent orthopedic surgeons and leveraged by two of
10 largest orthopedic groups in the country, Genie Health
by therapists and industry experts. Featuring a monitored HEP using computer vision, Genie Health offers both fee-for-service and
based-care models on the same platform.
112
14
Advancing MSK Research, Advancing Clinical Care Introduc g Introduc g The Institute for Musculoskeletal Advancement (iMSKA) is dedicated to impacting MSK patient outcomes with research and education. SCAN THE QR CODE OR VISIT i-MSKA.ORG TO LEARN MORE ABOUT OUR RESEARCH AND EDUCATIONAL OPPORTUNITIES
Peer Reviewed Publications
Research Partners $3M Partnered in Grant Funding
Residency & Fellowship Graduates Our Team’s Impact
148

Advanced Electrotherapy Device: Powerful, intuitive and user-friendly
up to three body zones at once on all types of tissues
in less than 10 minutes Enter A New Era of Therapy
FR E QU E NCY
Action at Cell Level
FR E QU E NCY IN P ULS ED HIGH FR E QU E NCY Ultimate Pain Management
IU M FR E QU E NCY Deep Muscle Contraction Access BACK4 Case Studies Schedule a consultation with a Winback Expert hello@winback.com 133 Westchester Ave Ste N-220 White Plains NY 10604 www winback.com www winback-academy org
Most
Treat
Effective
TECAR HIGH
Metabolic
Hi-TENS LOW
Hi-EMS MED


GOLD STANDARD OF IASTM NEW TOPICAL SOLUTIONS CERTIFICATION COURSES ® GET A GRIP ON SOFT TISSUE INJURIES See what’s new at HawkGrips Scan me www.HawkGrips.com • info@hawkgrips.com • 484-351-8050 This shoulder home study course will provide comprehensive information on multiple topics relevant to the sports physical therapist who actively engages with shoulder sports injuries. REGISTER HERE! https://learn.sportspt.org/courses/ 48245#

Why Your Patient May Need an ACL Reconstruction Plus Lateral Extra-Articular Tenodesis Procedure
Amit Momaya, MD, Chandler Harris, Matt Hargreaves
Keywords: ACL, Lateral extra-articular tenodesis (LET), knee https://doi.org/10.26603/001c.94015
International Journal of Sports Physical Therapy
Anterior cruciate ligament (ACL) tears are one of the most common knee injuries experienced by active individuals engaging in cutting sports. Despite improved surgical techniques and rehabilitation, the return to sport rate and re-tear rates remain unsatisfactory. Lateral extra-articular tenodesis (LET) is a procedure that has been growing in interest when performed in conjunction with ACL reconstruction. The benefits of adding an LET procedure to an ACL surgery may include greater rotational stability, decreased re-tear rates, and improved return to play.
Level of evidence: V
INTRODUCTION
Approximately 250,000 anterior cruciate ligament (ACL) tears occur annually in the United States, with most tears arising from non-contact mechanisms.1,2 Anterior cruciate ligament reconstruction (ACLR) is considered a cost-effective treatment for such injuries in competitive athletes and the standard of care for those who wish to return to sport.3 Worldwide, ACLR appears to be growing for both adult and pediatric populations.4‑7 Despite advancements in ACLR techniques, retear rates and return-to-play rates remain unsatisfactory in certain populations.8‑10 The overall return to previous level of play is reported to be just below 65% for athletes.3 A recent study on female soccer athletes who underwent ACLR reported that 28% of all female soccer players and 34% of those players who returned to soccer experienced a second ACL tear. In another study on female soccer athletes, less than half returned to preinjury level of sport.9
Increased attention has been placed on residual postoperative rotary instability, which may correlate with increased failure rates, especially in young, highly active individuals.11,12 ACLRs have evolved significantly from one of the first ACL repair operations pioneered by Sir Arthur Mayo-Robson in 1895, and many techniques now exist.13 While most techniques focus on intra-articular graft reconstruction, high graft failure rates and persistent pivot shift have been seen in high-demand individuals.12,14 Persistent pivot shift and rotatory laxity have been shown to correlate with graft failure, lower clinical outcome scores, and increased reoperation rates.15 Such adverse outcomes are particularly pronounced in young patients participating in sports requiring regular pivoting, such as soccer, basketball, and football.16,17
Recent investigations into the persistence of anterolateral rotatory laxity in these patients have led to an increased focus on the role of the anterolateral complex in modulating knee stability.18 Specifically, lateral extra-artic-
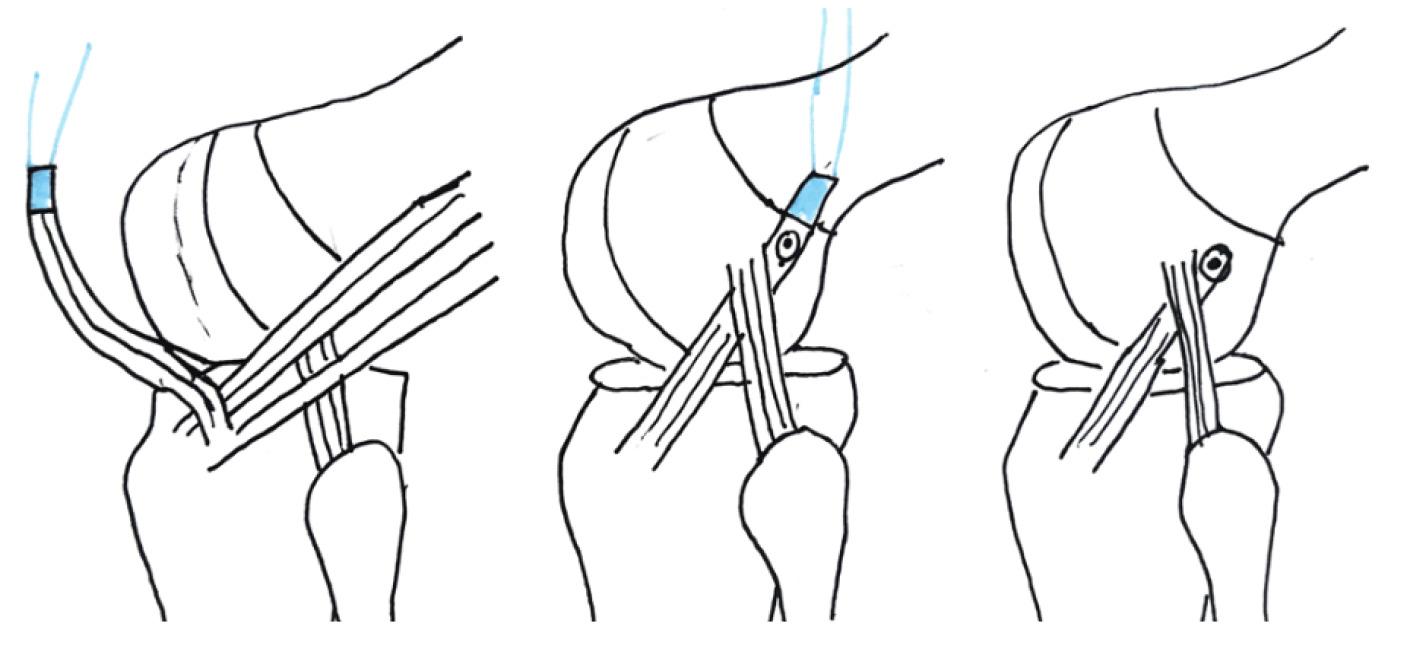
ular tenodesis (LET) has grown in popularity in the setting of ACLR. This procedure was initially utilized in ACL-deficient knees before the advent of intra-articular reconstruction techniques.19 One method by which to perform an LET is known as the Modified Lemaire Technique. This procedure entails a transfer of approximately an 8x1 cm graft of the iliotibial band (ITB) while leaving it anchored distally to Gerdy’s tubercle. The graft is released proximally from the vastus lateralis, passed under the lateral collateral ligament (LCL), and fixed to the femur just proximal and posterior to the lateral epicondyle (Figures 1-4).20
BIOMECHANICS OF LET
The biomechanical aims of performing a LET in conjunction with an ACLR are the restoration of normal knee kinematics, correcting a high-grade pivot shift, and correcting increased internal tibial rotation. There has been significant investigation into the biomechanical effects of the LET, with cadaveric studies generally supporting its use in conjunction with ACLR.21‑23 Studies have shown reduced anterolateral residual laxity, ACL graft force, and anterior tibial translation (ATT).24,25 Further biomechanical studies have also investigated the utility of the LET + ACLR with a concurrent medial meniscectomy,26 showing reductions in ATT and internal rotation. These biomechanical studies suggest that a combined ACLR and LET may provide a protective effect on ACL graft and meniscus repair by increasing knee stability.
Despite such benefits, concerns have been raised regarding over-constraint and increased loading of the lateral compartment of the knee, although clinically, short to midterm studies have not shown increased osteoarthritis of the lateral compartment.27‑29 Furthermore, there have been mixed results regarding the effect of LET on in-vivo mechanics.30,31 Nonetheless, a recent systematic review concluded that the LET procedure can resist internal rota-
Clinical Viewpoint
March 1,
doi:10.26603/001c.94015
Momaya
A, Harris C, Hargreaves M. Why Your Patient May Need an ACL Reconstruction Plus Lateral Extra-Articular Tenodesis Procedure. IJSPT. Published online
2024:251-257.
tion and improve residual knee rotatory laxity when performed in conjunction with ACLR.21
CLINICAL OUTCOMES
While the biomechanical results establish a foundation for the benefits of LET, recent clinical studies have provided further support for the use of LET In the largest randomized clinical trial of LETs performed to date, 618 patients with a mean age of 18.9 years (range: 14-25) were randomized into ACLR vs. ACLR+LET groups. The addition of a LET to a hamstring autograft ACLR led to a statistically and clinically significant decrease in graft rupture rates from
11% to 4% and clinical failure rates (persistent asymmetric rotatory laxity and graft rupture) from 40% to 25%.32 The number to treat with LET to prevent one graft rupture was 14.
In another study, 49 consecutive patients aged 11 to 16 years old (mean 14.2 years) with a 98% participation rate in high-risk competitive sports demonstrated a graft re-rupture rate of 0% with a mean follow-up of 3.4 years and a return to sports rate of 100% following a quadriceps autograft ACLR with LET 33 Furthermore, another study of 66 pediatric patients between 12-16 years old showed patients who received a LET in addition to an ACLR had better KT-1000 arthrometer readings, better rotational stability
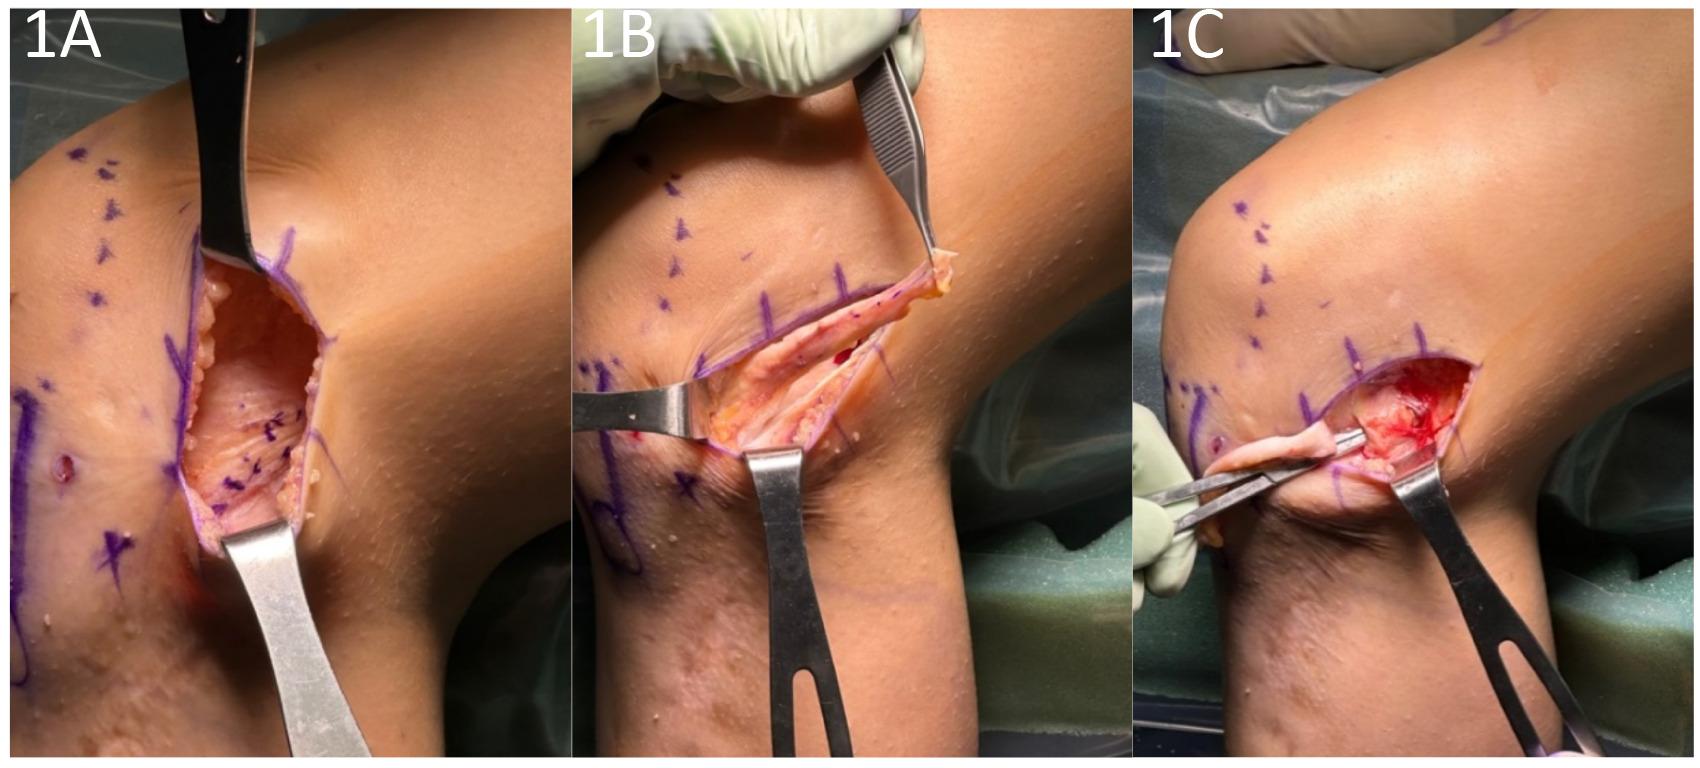
Figure 1. A. The iliotibial band is identified and marked. B 1x8 cm strip of IT band is harvested. C. The LCL is identified and a pathway underneath it is exposed.
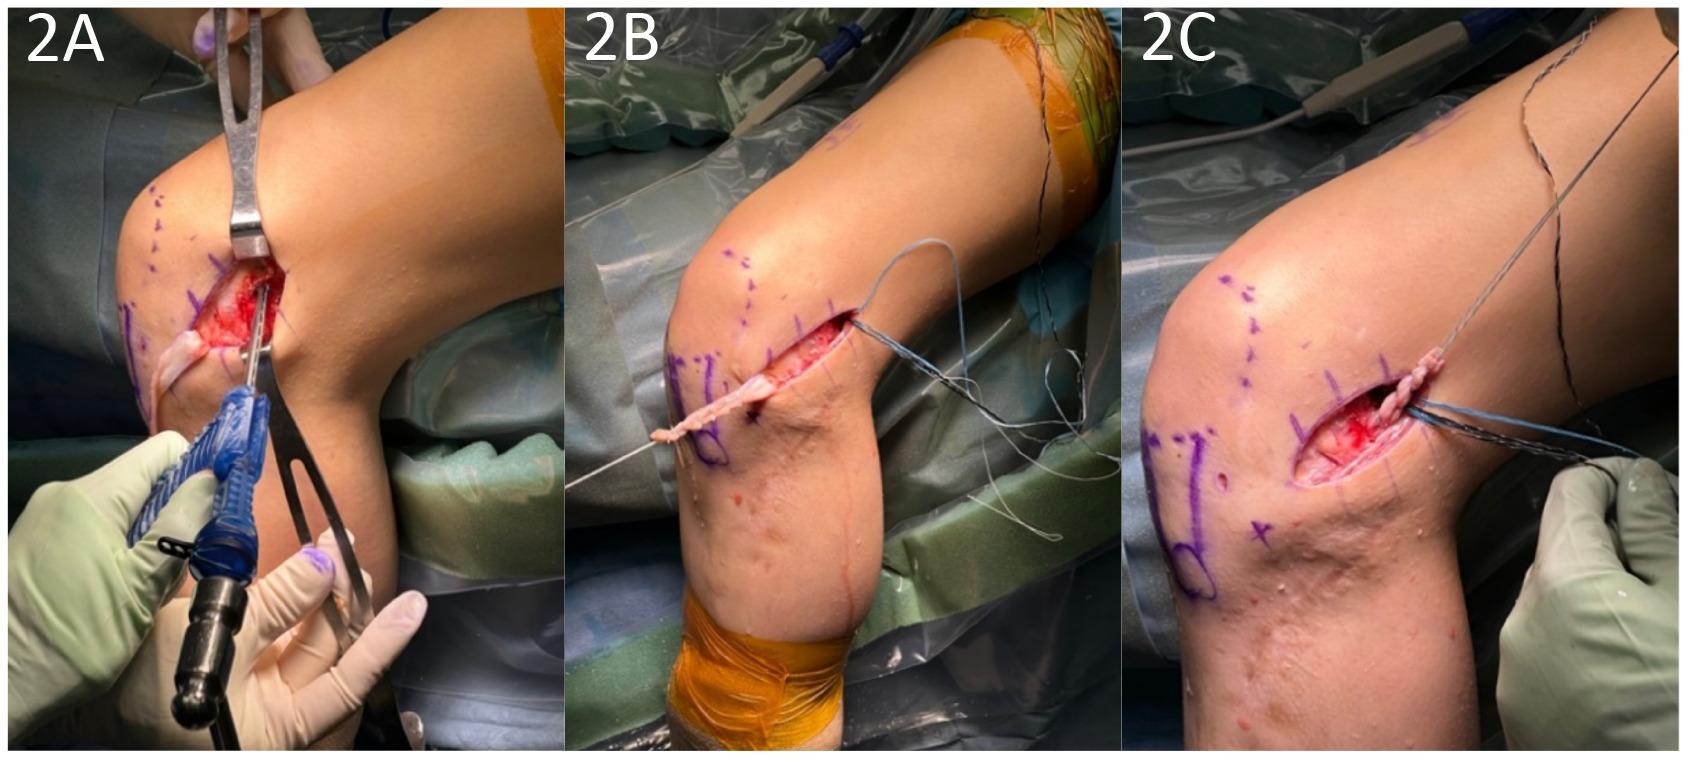
Figure 2. A. The knotless anchor is inserted on the femur. B. The IT band is prepped with suture. C. The IT band is passed under the LCL.
Why Your Patient May Need an ACL Reconstruction Plus Lateral Extra-Articular Tenodesis Procedure International Journal of Sports Physical Therapy
measurements using kinematic rapid assessment (triaxial accelerometer), and lower graft rupture and cumulative failure rates than patients who underwent ACLR alone.34
In the revision setting, LET has been shown to improve International Knee Documentation Committee scores, restore rotational stability, and reduce failure rates compared with isolated ACLR.35
When considering operation morbidity, adding the LET does not appear to be a significant factor, as there were no clinically significant differences in motion or adverse events in a large-scale randomized trial.36
INDICATIONS
Significant risk factors for ACL re-tear include but are not limited to gender, age, sport, anatomic variation, hyperextension, and athletic level, all of which should be considered when deciding on the utility of a LET. The senior author of this paper (AMM) typically adds an LET for “highrisk” patients during ACLR. Common indications include female sex, soccer athletes, elite athletes, inherent ligamentous laxity, increased posterior tibial slope, high-grade
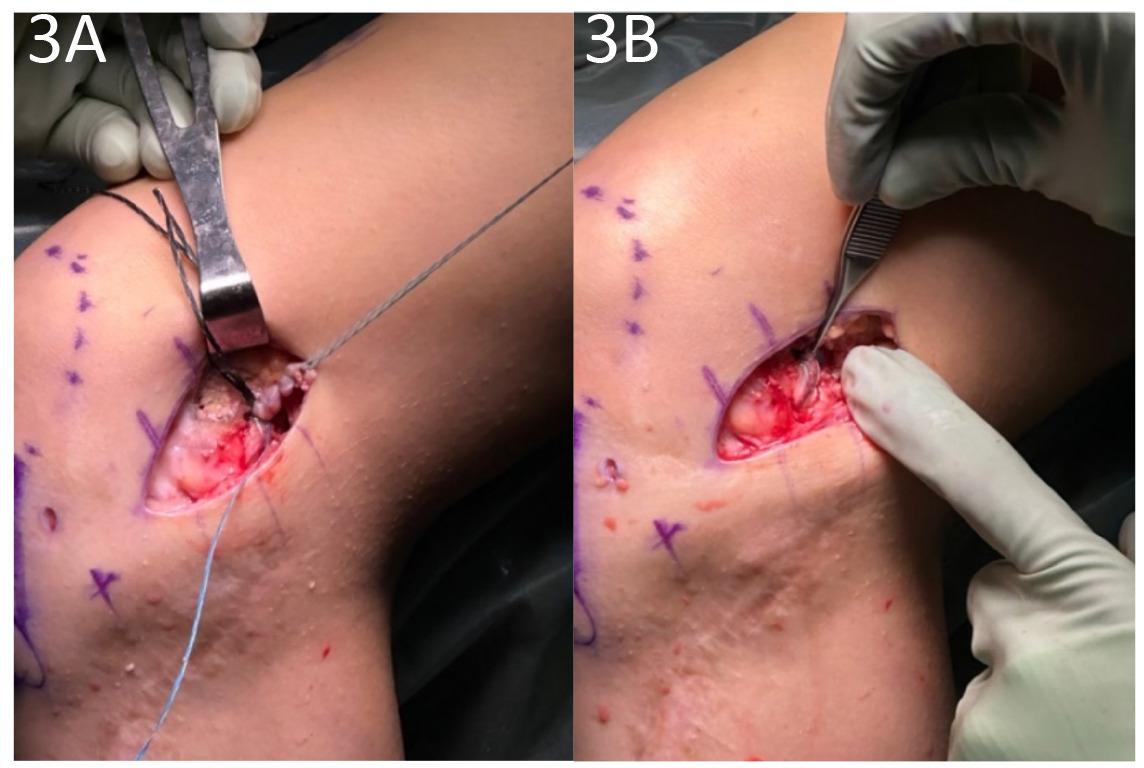
Figure 3. A. The graft is tensioned and fixed to the femur proximal and posterior to the lateral epicondyle. B. The picture shows the final construct.
Figure 4. Illustration detailing the harvest of the IT band followed by passage deep to LCL.
Why Your Patient May Need an ACL Reconstruction Plus Lateral Extra-Articular Tenodesis Procedure International Journal of Sports Physical Therapy
Relative Indications for LET
Female Population
Soccer Athletes
Elite Athletes (national or international level)
Inherent ligamentous laxity
Increased posterior tibial slope
High grade pivot shift
Revision ACL surgery
Meniscal root tears and subtotal meniscectomies
Chronic ACL tear
pivot shift, revision ACL surgery, meniscal root tears/subtotal meniscectomies, and chronic ACL tears (Table 1).
In the revision setting, LET+ACLR has shown good return to sport rates in high-level basketball and soccer players.37 A study of 78 athletes in the Netherlands found a significant difference in RTS rates for revision ACL with LET (52%) compared to ACLR without LET (31%).38 Similar benefits have been seen for athletes competing at an elite (national or international) level. In a study of 455 elite athletes (83% male, mean age 22.5 years), 117 underwent ACLR + LET, and 338 underwent ACLR only. The cohort with ACLR only had a 9.5% retear rate, whereas the ACLR + LET group had a 3.4% retear rate. This reduction equated to ACLR + LET reducing graft failure by a factor of 2.8.39
REHABILITATION
One concern often raised regarding the addition of the LET is the effect on rehabilitation timelines. In the senior author’s practice, the LET does not change the rehabilitation protocol compared to a stand-alone ACLR. Furthermore,
there is not increased rate of adverse events. The study by Heard et al. demonstrated that the ACLR + LET group had increased hardware irritation and increased pain at 3 months only. With regard to hardware irritation, many of the patients in that trial underwent LET fixation with a metal staple, which can be proud and irritating. Current techniques allow us to fix the LET with low-profile, knotless anchors.36
CONCLUSION
LET, when performed in conjunction with ACLR, has the potential to improve rotational stability, re-tear rates, and return to play for athletes. The procedure results in minimal morbidity and should be selectively used for higher risk patients. Further randomized studies are underway to better understand the indications for LET in patients with ACL injuries.
© The Author(s)
This is an open-access article distributed under the terms of the Creative Commons Attribution 4.0 International License (CCBY-NC-4.0). View this license’s legal deed at https://creativecommons.org/licenses/by-nc/4.0 and legal code at https://creativecommons.org/licenses/by-nc/4.0/legalcode for more information.
Table 1. The indications for adding an LET to ACLR are generally those that increase the risk of graft failure
Why Your Patient May Need an ACL Reconstruction Plus Lateral Extra-Articular Tenodesis Procedure International Journal of Sports Physical Therapy
REFERENCES
1. Kaeding CC, Léger-St-Jean B, Magnussen RA. Epidemiology and Diagnosis of Anterior Cruciate Ligament Injuries. Clin Sports Med. 2017;36(1):1-8. d oi:10.1016/j.csm.2016.08.001
2. Musahl V, Karlsson J. Anterior Cruciate Ligament Tear. N Engl J Med. 2019;380(24):2341-2348. doi:10.1 056/nejmcp1805931
3. Stewart BA, Momaya AM, Silverstein MD, Lintner D. The Cost-Effectiveness of Anterior Cruciate Ligament Reconstruction in Competitive Athletes. Am J Sports Med 2017;45(1):23-33. doi:10.1177/0363 546516664719
4. Sherman SL, Calcei J, Ray T, et al. ACL Study Group presents the global trends in ACL reconstruction: biennial survey of the ACL Study Group. J ISAKOS. 2021;6(6):322-328. doi:10.1136/jisakos-2020-000567
5. Herzog MM, Marshall SW, Lund JL, Pate V, Mack CD, Spang JT Trends in Incidence of ACL Reconstruction and Concomitant Procedures Among Commercially Insured Individuals in the United States, 2002-2014. Sports Health. 2018;10(6):523-531. doi:10.1177/1941738118803616
6. Janssen KW, Orchard JW, Driscoll TR, van Mechelen W High incidence and costs for anterior cruciate ligament reconstructions performed in Australia from 2003–2004 to 2007–2008: time for an anterior cruciate ligament register by Scandinavian model? Scand J Med Sci Sports. 2011;22(4):495-501. d oi:10.1111/j.1600-0838.2010.01253.x
7 Zbrojkiewicz D, Vertullo C, Grayson JE. Increasing rates of anterior cruciate ligament reconstruction in young Australians, 2000–2015. Med J Aust 2018;208(8):354-358. doi:10.5694/mja17.00974
8. Allen MM, Pareek A, Krych AJ, et al. Are Female Soccer Players at an Increased Risk of Second Anterior Cruciate Ligament Injury Compared With Their Athletic Peers? Am J Sports Med. 2016;44(10):2492-2498. doi:10.1177/03635465166484 39
9. Britt E, Ouillette R, Edmonds E, et al. The Challenges of Treating Female Soccer Players With ACL Injuries: Hamstring Versus Bone–Patellar Tendon–Bone Autograft. Orthop J Sports Med. 2020;8(11):232596712096488. doi:10.1177/232596712 0964884
10. Ellman MB, Sherman SL, Forsythe B, LaPrade RF, Cole BJ, Bach BRJ. Return to play following anterior cruciate ligament reconstruction. J Am Acad Orthop Surg 2015;23(5):283-296. doi:10.5435/jaaos-d-13-00 183
11. Noyes FR, Huser LE, West J, Jurgensmeier D, Walsh J, Levy MS. Two Different Knee Rotational Instabilities Occur With Anterior Cruciate Ligament and Anterolateral Ligament Injuries: A Robotic Study on Anterior Cruciate Ligament and Extra-articular Reconstructions in Restoring Rotational Stability Arthroscopy. 2018;34(9):2683-2695. doi:10.1016/j.arth ro.2018.04.023
12. Jesani S, Getgood A. Modified Lemaire Lateral Extra-Articular Tenodesis Augmentation of Anterior Cruciate Ligament Reconstruction. JBJS Essent Surg Tech 2019;9(4):e41. doi:10.2106/jbjs.st.19.00017
13. Gee MSM, Peterson CDR, Zhou ML, Bottoni CR. Anterior Cruciate Ligament Repair: Historical Perspective, Indications, Techniques, and Outcomes. J Am Acad Orthop Surg. 2020;28(23):963-971. doi:10.5 435/jaaos-d-20-00077
14. Prodromos CC, Joyce BT, Shi K, Keller BL. A metaanalysis of stability after anterior cruciate ligament reconstruction as a function of hamstring versus patellar tendon graft and fixation type. Arthroscopy 2005;21(10):1202.e1-1202.e9. doi:10.1016/j.arthro.20 05.08.036
15. Ayeni OR, Chahal M, Tran MN, Sprague S. Pivot shift as an outcome measure for ACL reconstruction: a systematic review Knee Surg Sports Traumatol Arthrosc 2012;20(4):767-777 doi:10.1007/s00167-01 1-1860-y
16. Webster KE, Feller JA. Exploring the High Reinjury Rate in Younger Patients Undergoing Anterior Cruciate Ligament Reconstruction. Am J Sports Med 2016;44(11):2827-2832. doi:10.1177/0363 546516651845
17. Webster KE, Feller JA, Leigh WB, Richmond AK. Younger patients are at increased risk for graft rupture and contralateral injury after anterior cruciate ligament reconstruction. Am J Sports Med. 2014;42(3):641-647 doi:10.1177/0363546513517540
18. Musahl V, Herbst E, Burnham JM, Fu FH. The Anterolateral Complex and Anterolateral Ligament of the Knee. J Am Acad Orthop Surg. 2018;26(8):261-267. doi:10.5435/jaaos-d-16-00758
Why Your Patient May Need an ACL Reconstruction Plus Lateral Extra-Articular Tenodesis Procedure International Journal of Sports Physical Therapy
19. Kennedy JC, Stewart R, Walker DM. Anterolateral rotatory instability of the knee joint. An early analysis of the Ellison procedure. J Bone Joint Surg Am. 1978;60(8):1031-1039.
20. Cerciello S, Batailler C, Darwich N, Neyret P. Extra-Articular Tenodesis in Combination with Anterior Cruciate Ligament Reconstruction: An Overview. Clin Sports Med. 2018;37(1):87-100. doi:1 0.1016/j.csm.2017.07.006
21. van der Wal WA, Meijer DT, Hoogeslag RAG, LaPrade RF. The Iliotibial Band is the Main Secondary Stabilizer for Anterolateral Rotatory Instability and both a Lemaire Tenodesis and Anterolateral Ligament Reconstruction Can Restore Native Knee Kinematics in the Anterior Cruciate Ligament Reconstructed Knee: A Systematic Review of Biomechanical Cadaveric Studies. Arthroscopy 2024;40(2):632-647.e1. doi:10.1016/j.arthro.2023.05.0 05
22. Delaloye JR, Hartog C, Blatter S, et al. Anterolateral Ligament Reconstruction and Modified Lemaire Lateral Extra-Articular Tenodesis Similarly Improve Knee Stability After Anterior Cruciate Ligament Reconstruction: A Biomechanical Study Arthroscopy. 2020;36(7):1942-1950. doi:10.1016/j.arth ro.2020.03.027
23. Mayr R, Sigloch M, Coppola C, Hoermann R, Iltchev A, Schmoelz W. Modified Lemaire tenodesis reduces anterior cruciate ligament graft forces during internal tibial torque loading. J Exp Orthop 2022;9(1):45. doi:10.1186/s40634-022-00484-w
24. Inderhaug E, Stephen JM, Williams A, Amis AA. Anterolateral Tenodesis or Anterolateral Ligament Complex Reconstruction: Effect of Flexion Angle at Graft Fixation When Combined With ACL Reconstruction. Am J Sports Med 2017;45(13):3089-3097. doi:10.1177/03635465177244 22
25. Marom N, Ouanezar H, Jahandar H, et al. Lateral Extra-articular Tenodesis Reduces Anterior Cruciate Ligament Graft Force and Anterior Tibial Translation in Response to Applied Pivoting and Anterior Drawer Loads. Am J Sports Med. 2020;48(13):3183-3193. doi:1 0.1177/0363546520959322
26. Özbek EA, Runer A, Dadoo S, et al. The Effect of Lateral Extra-articular Tenodesis in an ACLReconstructed Knee With Partial Medial Meniscectomy: A Biomechanical Study Am J Sports Med. 2023;51(13):3473-3479. doi:10.1177/036354652 31198856
27 Geeslin AG, Moatshe G, Chahla J, et al. Anterolateral Knee Extra-articular Stabilizers: A Robotic Study Comparing Anterolateral Ligament Reconstruction and Modified Lemaire Lateral Extraarticular Tenodesis. Am J Sports Med 2017;46(3):607-616. doi:10.1177/0363546517745268
28. Marom N, Jahandar H, Fraychineaud TJ, et al. Lateral Extra-articular Tenodesis Alters Lateral Compartment Contact Mechanics under Simulated Pivoting Maneuvers: An In Vitro Study. Am J Sports Med 2021;49(11):2898-2907 doi:10.1177/036354652 11028255
29. Pearce SL, Bryniarski AR, Brown JR, et al. Biomechanical Analysis of Tibial Motion and ACL Graft Forces After ACLR With and Without LET at Varying Tibial Slopes. Am J Sports Med. 2023;51(10):2583-2588. doi:10.1177/03635465231184 389
30. Chiba D, Gale T, Nishida K, et al. Lateral Extraarticular Tenodesis Contributes Little to Change In Vivo Kinematics After Anterior Cruciate Ligament Reconstruction: A Randomized Controlled Trial. Am J Sports Med 2021;49(7):1803-1812. doi:10.1177/03635 465211003298
31. Sheean AJ, Lian J, Tisherman R, et al. Augmentation of Anatomic Anterior Cruciate Ligament Reconstruction With Lateral Extra-articular Tenodesis Does Not Significantly Affect Rotatory Knee Laxity: A Time Zero, In Vivo Kinematic Analysis. Am J Sports Med 2020;48(14):3495-3502. do i:10.1177/0363546520966624
32. Getgood AMJ, Bryant DM, Litchfield R, et al. Lateral Extra-articular Tenodesis Reduces Failure of Hamstring Tendon Autograft Anterior Cruciate Ligament Reconstruction: 2-Year Outcomes From the STABILITY Study Randomized Clinical Trial. Am J Sports Med. 2020;48(2):285-297. doi:10.1177/0363546 519896333
33. Green DW, Hidalgo Perea S, Brusalis CM, Chipman DE, Asaro LA, Cordasco FA. A Modified Lemaire Lateral Extra-articular Tenodesis in HighRisk Adolescents Undergoing Anterior Cruciate Ligament Reconstruction With Quadriceps Tendon Autograft: 2-Year Clinical Outcomes. Am J Sports Med 2023;51(6):1441-1446. doi:10.1177/0363546523 1160681
34. Perelli S, Costa GG, Terron VM, et al. Combined Anterior Cruciate Ligament Reconstruction and Modified Lemaire Lateral Extra-articular Tenodesis Better Restores Knee Stability and Reduces Failure Rates Than Isolated Anterior Cruciate Ligament Reconstruction in Skeletally Immature Patients. Am J Sports Med 2022;50(14):3778-3785. doi:10.1177/0363 5465221128926
Why Your Patient May Need an ACL Reconstruction Plus Lateral Extra-Articular Tenodesis Procedure International Journal of Sports Physical Therapy
35. Boksh K, Sheikh N, Chong HH, Ghosh A, Aujla R. The Role of Anterolateral Ligament Reconstruction or Lateral Extra-articular Tenodesis for Revision Anterior Cruciate Ligament Reconstruction: A Systematic Review and Meta-analysis of Comparative Clinical Studies. Am J Sports Med 2023;52(1):269-285. doi:10.1177/03635465231157377
36. Heard M, Marmura H, Bryant D, et al. No increase in adverse events with lateral extra-articular tenodesis augmentation of anterior cruciate ligament reconstruction – Results from the stability randomized trial. J ISAKOS 2023;8(4):246-254. doi:1 0.1016/j.jisako.2022.12.001
37. Borim FM, Jubert NJ, Vinaixa MMR, et al. Good rates of return-to-sport in athletes after revision anterior cruciate ligament reconstruction using autologous patellar tendon and lateral extra-articular tenodesis: a 2-year follow-up prospective study. Eur J Orthop Surg Traumatol. 2023;33(7):3125-3133. doi:1 0.1007/s00590-023-03544-8
38. Keizer MNJ, Brouwer RW, de Graaff F, Hoogeslag RAG. Higher return to pre-injury type of sports after revision anterior ligament reconstruction with lateral extra-articular tenodesis compared to without lateral extra-articular tenodesis. Knee Surg Sports Traumatol Arthrosc 2022;31(5):1699-1703. doi:10.1007/s0016
7-022-07018-y
39. Borque KA, Jones M, Laughlin MS, et al. Effect of Lateral Extra-articular Tenodesis on the Rate of Revision Anterior Cruciate Ligament Reconstruction in Elite Athletes. Am J Sports Med 2022;50(13):3487-3492. doi:10.1177/03635465221128 828
Why Your Patient May Need an ACL Reconstruction Plus Lateral Extra-Articular Tenodesis Procedure International Journal of Sports Physical Therapy
Original Research
The Validity of a Portable Strain-Gauge Apparatus Versus a Commercial Isokinetic Dynamometer for Evaluating Knee
Extension Kinetics
Dustin Oranchuk1a , Chris Juneau2 , Shelley Diewald3 , Jono Neville2 , John Cronin2
1 Department of Physical Medicine and Rehabilitation, University of Colorado Anschutz Medical Campus, 2 Sports Performance Research Institute
New Zealand, Auckland University of Technology, 3 Sports Performance Research Institute, Auckland University of Technology
Keywords: force, impulse, rate of force development, reliability, quadriceps
https://doi.org/10.26603/001c.92742
International Journal of Sports Physical Therapy
Background
Isokinetic dynamometers are widely used when assessing neuromuscular function including knee extension kinetics. However, these dynamometers are often prohibitively expensive and are not portable. Thus strain-gauge technology has grown in popularity.
Purpose
The purpose of this study was to compare kinetic data captured via an isokinetic dynamometer against an affordable and portable strain-gauge with a treatment plinth during maximal isometric knee extensions.
Study Design
Cross-sectional study.
Methods
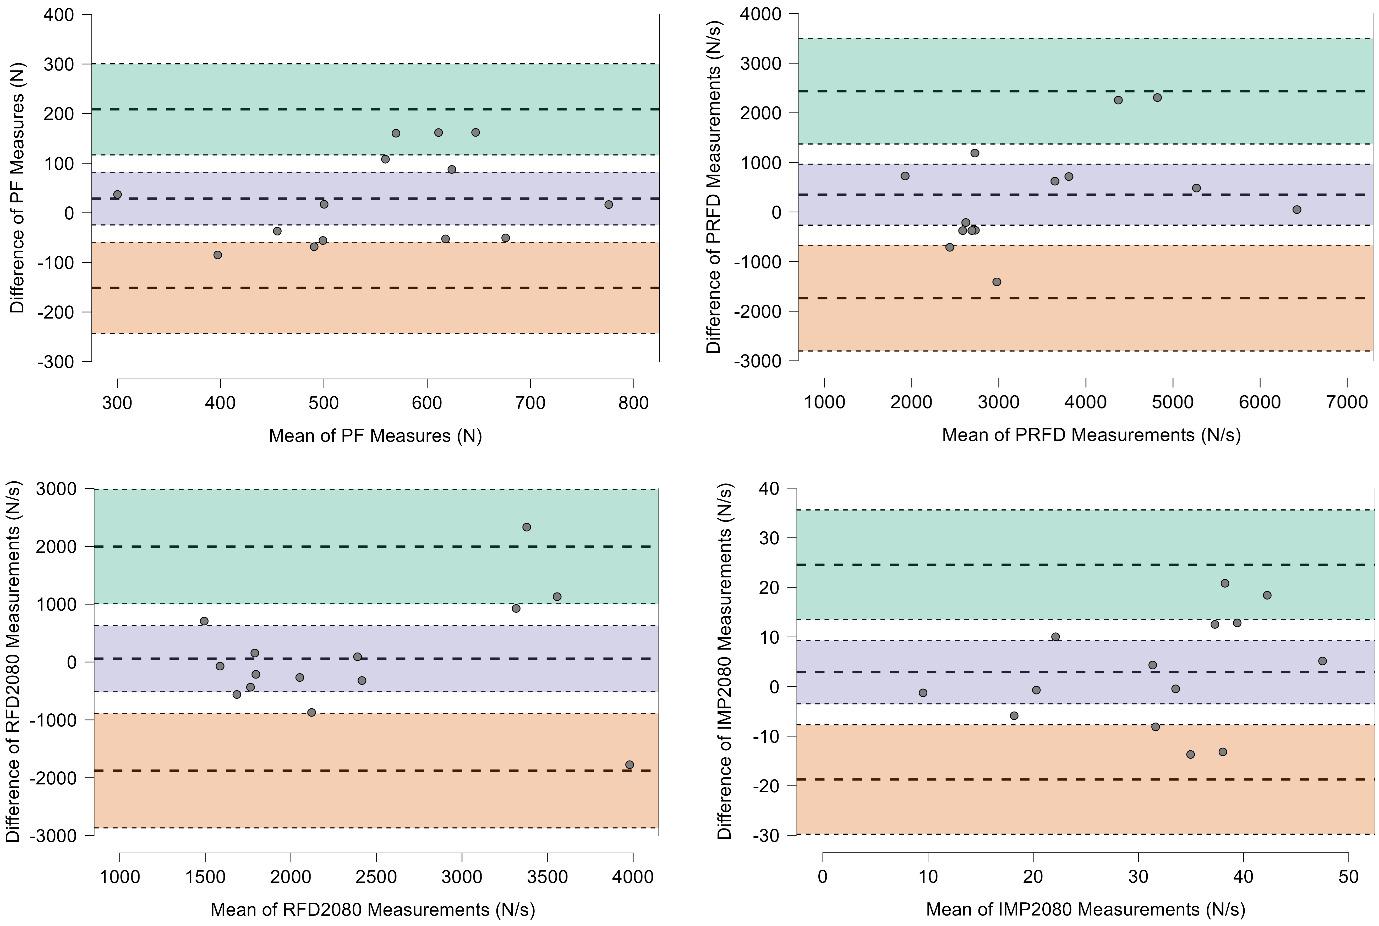
Healthy participants (8 males and 6 females; age 30.2±7.1 years) volunteered and performed knee extensions at a 90° knee angle on a dynamometer and a treatment plinth with a portable strain-gauge. Peak force (PF), peak rate of force development (PRFD), rate of force development (RFD2080) and impulse (IMP2080) from 20-80% of onset to peak force were assessed using both strain-gauge and isokinetic dynamometer. Between-device differences were evaluated by the Wilcoxon signed-rank test, Cohen’s d effect sizes (ES), Pearson’s correlation coefficients (r), and Bland-Altman plots.
Results
No significant or meaningful differences were identified between isokinetic and strain-gauge devices (all p≥0.268, ES≤0.35). However, slightly greater (2.5-9.5%) outputs were observed with the isokinetic dynamometer. Very large significant between-device correlations were found for PF (r=0.77, p=0.001) and PRFD (r=0.73, p=0.003), while small and moderate non-significant between-device correlations were found for RFD2080 (r=0.48, p=0.079) and IMP2080 (r=0.59, p=0.060). Bland-Altman plots did not reveal apparent biases from high to low performers.
Conclusions
These results indicate that the strain-gauge device can produce valid maximal and rapid force expression measurements. Similar results, such as those quantified via an isokinetic device, can be obtained without extreme rigour and constraint. The study’s findings support using the practically relevant treatment plinth and strain-gauge combination as a suitable alternative to the isokinetic dynamometry for measuring PF and PRFD.
a
Corresponding author: Dustin J. Oranchuk
+1-303-886-4056
Denver, Colorado, USA
dustinoranchuk@gmail.com
Oranchuk D, Juneau C, Diewald S, Neville J, Cronin J. The Validity of a Portable StrainGauge Apparatus Versus a Commercial Isokinetic Dynamometer for Evaluating Knee Extension Kinetics. IJSPT. Published online March 1, 2024. doi:10.26603/001c.92742
Therefore, more rehabilitation and sports performance practitioners can confidently assess knee extension kinetics.
Level of Evidence 3
INTRODUCTION
Rate of force development (RFD) and impulse (IMP) are valuable components of force production and neuromuscular capacity 1‑4 These metrics can translate into the ability of motor units to develop force quickly,1 which can enhance sporting performance,5,6 and is beneficial in activities that affect the quality of life.7 Additionally, RFD and IMP may better predict functional abilities than maximal strength or peak force (PF) assessments.6,8 Rapid force characteristics are also strongly associated with the prevention of falls, the maintenance of balance, stabilizing the body during reactive tasks,7,9 and providing valuable insight into the stiffness and physiology of the muscle-tendon unit10 and neural capacity 1
A primary consideration of rapid force assessment is related to the availability and practicality of the technology and equipment needed, including back-end analytics. Appreciating the expected variability in RFD and IMP data, a measurement device must contain sensitive, high-frequency components to accurately record this data. Isokinetic testing apparatus, often the standard in open chain joint and muscle-specific force testing,11,12 collects kinematic and kinetic data in a constrained and standardized manner and hence very little variability is associated with the assessed measures.11,12 However, research-grade isokinetic dynamometers are prohibitively expensive and nonportable, especially compared to other force assessment tools, such as strain-gauges.
Sports performance and rehabilitation staff often lack affordable, portable, and clinically useful tools to adequately measure and track kinetic force variables from joints such as the knee. While various testing mediums and tools are available, the strain-gauge can offer a lower financial price point, greater portability, and, therefore, higher utility for clinicians to assess neuromuscular function. While shown to be reliable in several contexts,13,14 limited data exist concerning the validity and transferability of data collected via strain-gauge compared to isokinetic dynamometers. Thus, established practices may be hesitant to transfer their collection protocols from isokinetic dynamometry to portable strain-gauge. Therefore, the purpose of this study was to compare kinetic data captured via an isokinetic dynamometer against an affordable and portable strain-gauge with a treatment plinth during maximal isometric knee extensions. The hypothesis was that there would be no difference in the kinetic data collected by the highly constrained, isokinetic dynamometer device versus those same variables collected on the strain-gauge device.
METHODS
STUDY DESIGN
A single-session cross-sectional study design was implemented, comparing various kinetic variables during the knee extensors’ maximal voluntary isometric contractions (MVIC) with an isokinetic dynamometer versus straingauge device. These two data collection tools were evaluated using three protocols where a range of kinetic variables were assessed. Participants completed three explosive MVICs of the knee extensors for each protocol. Testing was completed bilaterally for all participants. However, only the right leg was used for analysis. Testing order was randomized for each subject, and one rater with ~3 years of experience collected all data.
PARTICIPANTS
A total of fourteen participants volunteered and completed the study, including eight men and six women. Participants were recruited via posters placed throughout the university campus and by word of mouth; they were predominantly graduate students and university staff. All participants were healthy with no current health conditions limiting strenuous exercise or the ability to complete maximal knee extensions. Participants were excluded if they had a prior surgical intervention that would limit knee extension performance or reported any pain throughout the trials. All participants reported their right leg as dominant (kicking leg). Ethics approval for this study was obtained from the Auckland University of Technology Ethics Committee, and all participants provided written informed consent.
TESTING EQUIPMENT
The isokinetic device (Humac Norm; CSMi; Lumex, Ronkonkoma, NY) was used as the gold standard for data collection. The isokinetic dynamometer sampling rate was increased to 1000 Hz through custom software (LabView; National Instruments, New Zealand) to match the straingauge’s sampling frequency and improve the accuracy of RFD and IMP calculations as per previous research.15,16 The pre-tension threshold for this device was set at 40 Nm (torque), which was reported subjectively as being like the 120 N (force) used with the strain-gauge. The collection threshold for this protocol was 50 Nm.
The strain-gauge device was a wireless force measurement system that consisted of a strain-gauge, Bluetooth connectivity, and an internally designed software package (SPRINZ Laboratories, Auckland University of Technology) sampling at 1000 Hz. The computer, with software visible, was placed directly in front of the subject for practice trials, feedback, and the pre-tension threshold. Following pilot
International Journal of Sports Physical Therapy
The Validity of a Portable Strain-Gauge Apparatus Versus a Commercial Isokinetic Dynamometer for Evalu…
testing, the pre-tension mark was set to 120 Newtons (N), while the collection threshold was set to 160 N (i.e., the trial initiation was established once the force produced was above 160 N).13,14
PROCEDURE
Two data collection protocols were implemented. Each collection used either the isokinetic dynamometer or the portable strain-gauge with treatment plinth. Kinetic variables were collected at 90º of knee flexion.
PROTOCOL 1: ISOKINETIC DYNAMOMETER
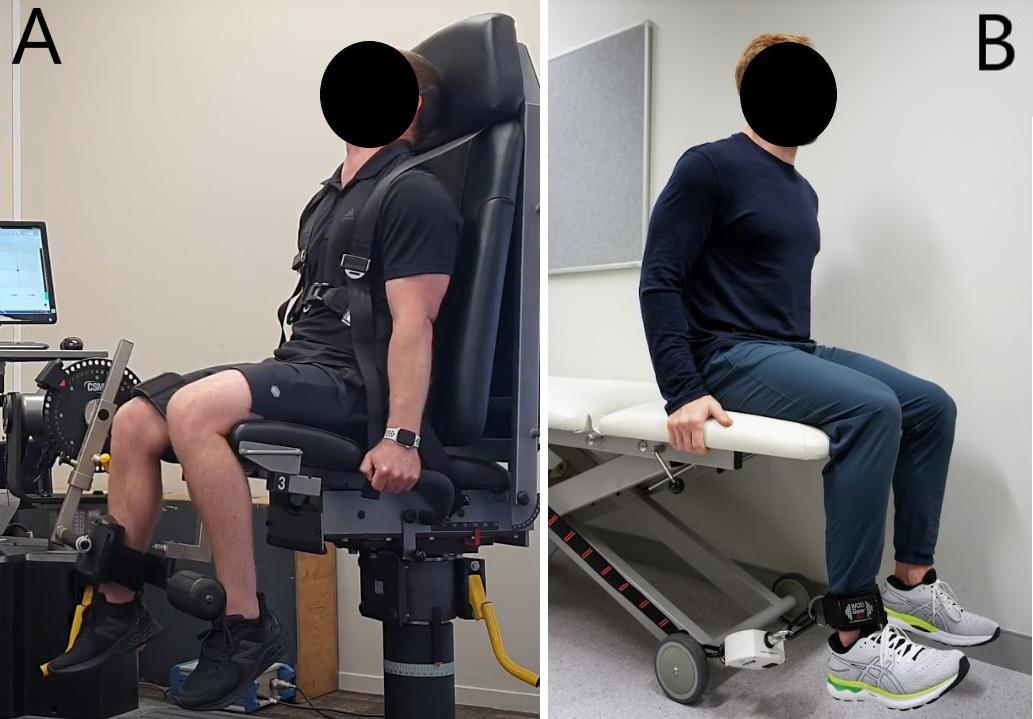
Protocol 1 (Figure 1A) had the subject seated upright in the chair of the isokinetic dynamometer at a hip angle of 85º, with shoulder, waist, and thigh constrained by straps to reduce body movement during contractions. This highly restricted method and the isokinetic dynamometer for collecting isometric force was considered the standard for comparison to the strain-gauge.2,5,15,17 The device was adjusted so the subject’s knee joint line was positioned at the center of dynamometer rotation and the ankle fixation pad approximately two centimeters superior to the lateral malleolus. The subject was instructed to place their nontesting limb behind the counterforce pad and use the handles on both sides for each trial.
PROTOCOL 2: TREATMENT PLINTH WITH STRAIN-GAUGE
Protocol 2 (Figure 1B) consisted of a clinical plinth (table) and strain-gauge with subject’s performing contractions at 90º of knee flexion. This protocol was designed for the implementation of portable strain-gauge technology in a practical setting, such as a physiotherapy clinic. The subject was seated on the edge of a plinth and allowed to selfselect a position while meeting the following criteria:
1) the subject must maintain this position throughout the trials; 2) the subject must hold the sides of the table; and 3) the subject must shift towards the side of the table being tested (the line of force must be in line to the fixation point which was located towards the side of the table). Once seated and comfortable, the subject was fixed to the table at 2 cm superior to the lateral malleolus using a low compliance steel chain. A towel was placed under the distal thigh between the thigh and the table to reduce discomfort during expressions of maximal force. The table height was adjusted to maintain a 90º line of force to the fixation angle. Throughout practice trials, the subject was allowed to move and change position. However, no further changes were permitted once the testing began, and the subject’s position was recorded for future testing sessions.
The testing angle of the knee joint was confirmed with goniometric measurement to account for tissue and padding deformation. Before any testing trials, the subject completed practice trials which included verbal instruc-
Figure 1. Experimental set-ups for the isokinetic dynamometer (A), and plinth + strain-gauge (B)
The Validity of a Portable Strain-Gauge Apparatus Versus a Commercial Isokinetic Dynamometer for Evalu… International Journal of Sports Physical Therapy
tions about the procedure and visual education about the pre-tension position on the computer monitor.
COLLECTION PROTOCOL
Participants warmed up by cycling at moderate resistance using a self-selected pace for five minutes. Familiarization using the plinth + strain-gauge protocol, regardless of testing order and included ascending isometric contractions, culminating with one MVIC. During these trials, the participants were given verbal and visual feedback regarding performance and education was implemented to avoid confusion or troubleshoot positioning. A visual target (120 N) was provided, and participants were instructed to reach and hold this target. The initial force target is implemented to prevent participants from using countermovement or excessive body movement to initiate the contraction, potentially altering rapid force expression measures.1,6 After familiarization, participants were given a five-minute rest before the data collection initiation. Participants were instructed to contract “fast and hard” The term ‘fast’ in “fast and hard” was consistently emphasized throughout all testing occasions.
After familiarization, participants were randomly placed into protocols via a random number generator Participants were told to achieve the pre-tension state and maintain this force for two seconds by slowly extending the knee into the strap while observing the force-time curve on the monitor For both devices, participants then performed three contractions at 30% of perceived MVIC, two contractions at 60% of perceived MVIC, one contraction at 90% of perceived MVIC, and one contraction at 100% of perceived MVIC. For the three maximal recorded trials, the participants were once again asked to slowly extend their knee to obtain a steady force curve before the primary researchers began a countdown of “3-2-1-Go-Go-Go-Go-Go-Stop” Participants were instructed to start the MVIC immediately after “1”.
Due to the brief contraction durations, the rest between repetitions was set from 10 to 30 seconds following the previous protocols.15 The output was visually inspected for large deviations in force production (>250 N from prior trials), notable countermovement in the output, or any inconsistencies in the pre-tension state, any false trials removed, and the subject ask to repeat the trial before progressing. Participants completed three trials of each protocol with the maximum values used for analyses. Rest was set at 10-30 seconds based on participant preference.15
DATA PROCESSING
Raw, unfiltered force-time data was exported for subsequent analysis in ‘ comma separated value’ format. Using a custom algorithm, the dominant leg data were imported and analyzed in MATLAB (MathWorks, Natick, MA). Each trial was trimmed in length to include a pre-tension period of at least 0.5 seconds, force onset, the isometric contraction for at least one second, and a force offset. The onset of force was defined as an increase in a force greater than three standard deviations (3 SD) of force calculated from
the 350 ms pre-tension window within one second before the contraction.1,17,18 Outputs were visually assessed for methodological outliers (e.g., extreme forces or spikes that were clearly not accurate representations of human capacity), which were removed from the analysis. Methodological outliers were removed on two, and four occasions for the isokinetic dynamometer and strain-gauge devices, respectively PF was determined as the absolute maximum force recorded during the two-second contraction. All other variables of interest were then determined from within the time interval created by the 20-80% peak force thresholds, as described by Cobian et al. (2017) and Dudley-Javoroski et al. (2008).18,19 RFD2080 was the average slope over the epoch (force/time), and IMP2080 was the area under the force-time curve during the 20-80% window PRFD was calculated using a 10 Hz, 4th order low-pass Butterworth filter
STATISTICAL ANALYSIS
Data cleaning was conducted using RStudio IDE (Version 1.4.869, RStudio, PBS). Outlier analysis was conducted using intrasession, intra-subject z-scores. Any values greater than 3 SD were removed from the analysis.
Jeffrey’s Amazing Statistics Program (JASP) software (version 0.16, Amsterdam, Netherlands) was used for statistical analysis. The statistical analysis explored the validity of the between the isokinetic dynamometer and straingauge protocols. Each subject’s trials for each protocol were averaged. Further, if the subject did not participate in all protocols, they were also removed from all analyses. The normality of averaged values was confirmed using the Shapiro-Wilks test for each protocol.
Normality was assessed using the Shapiro-Wilks test and visually assessed with Q-Q plots. A Wilcoxon signed-rank test was used to compare protocols (isokinetic dynamometer, plinth+strain-gauge) as normality was not confirmed for PRFD (p≤0.050) and RFD2080 (p≤0.020). Qualitative descriptors of standardized Cohen’s d effect sizes (ES) with 95% confidence intervals (95%CI) were assessed and reported using these criteria: trivial <0.20, small 0.20–0.49, moderate 0.50–0.79, large >0.80.20 Additionally, Pearson’s r correlation coefficients were determined and interpreted as: 0-0.10 trivial, 0.10-0.30 small, 0.30-0.50 moderate, 0.50-0.70 large, 0.70-0.90 very large, and >0.90 nearly perfect. 95%CIs were calculated for the correlational data by simulating 1000 bootstrapped samples. Finally, Bland-Altman analyses with 95%CI were used to further understand the difference between paired kinetic variables to the pair’s mean across different protocols. All statistical significance was established a priori at p<0.05. 95%CIs are reported in [square brackets] in-text.
RESULTS
The eight men were 30.2±6.8 years old, 173±3.2 cm tall, 84.4±10.9 kg in body mass, and had a shank length of 33.7±3.2 cm. The six females were 33.2±6.7 years old, 161±5.5 cm tall, 61.7±7.5 kg in body mass, and had a shank length of 34.2±1.3 cm. Summary (mean, standard deviation
International Journal of Sports Physical Therapy
The Validity of a Portable Strain-Gauge Apparatus Versus a Commercial Isokinetic Dynamometer for Evalu…
PF = peak force; PRFD = peak rate of force development; RFD = rate of force development; IMP = impulse. CI = confidence interval. Effect size = Cohen’s d Statistics are from Wilcoxon signed-rank tests.
[SD]) and Wilcoxon signed-rank test (standard error [SE], ES, p-values) can be observed in Table 1. All variables had higher mean and larger SDs when assessed with the isokinetic dynamometer versus the plinth and strain-gauge, however, these were not statistically significantly different.
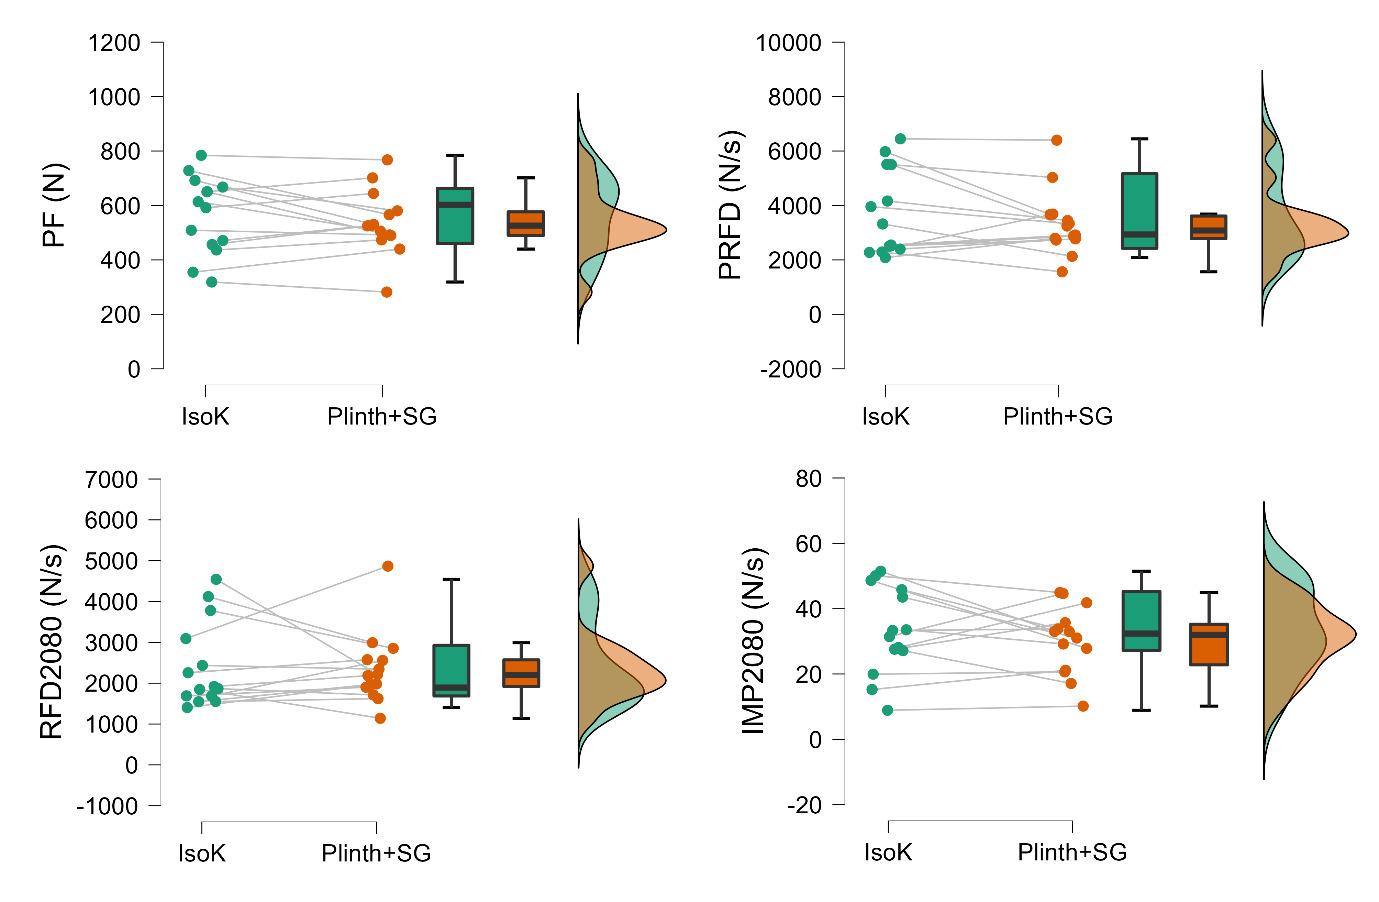
Raincloud plots for each kinetic variable collected with each protocol can be observed in Figure 2 No significant or meaningful differences between the protocols were detected for PF (ES=0.26 [-0.32, 0.70], p=0.426), PRFD (ES=0.29 [-0.22, 0.75], p=0.27), RFD2080 (ES=-0.03 [-0.55, 0.51], p=0.952), or IMP2080 (ES=0.29 [-0.37, 0.66], p=0.542).
Pearson’s r correlations (Figure 3) detected very large significant between-protocol correlations for PF (r=0.77 [0.40, 0.92], p=0.001) and PRFD (r=0.73 [0.34, 0.91],
p=0.003). Small and moderate non-significant correlations were found for RFD2080 (r=0.48 [0.23, 0.84], p=0.079) and IMP2080 (r=0.59 [-0.04, 0.85], p=0.060), respectively
Bland-Altman plots (Figure 4) show acceptable bias for all variables as no data points fell outside of the 95%CI. However, while PF or PRFD were found to have no obvious bias, RFD2080 and IMP2080 were found to have greater between-protocol differences in high-performing participants.
Variable Isokinetic dynamometer Plinth + strain-gauge Standard error [95% CI] Effect size [95% CI] p-value % Δ PF (N) 565 ± 143 537 ± 117 24 [-34.2, 88.8] 0.26 [-0.32, 0.70] 0.426 -5.0 PRFD (N/s) 3677 ± 1573 3327 ± 1192 286 [-341, 958] 0.35 [-0.22, 0.75] 0.268 -9.5 RFD2080 (N/s) 2410 ± 1047 2351 ± 878 264 [-435, 541] -0.03 [-0.55, 0.51] 0.952 -2.5 IMP2080 (N/s) 33.2 ± 13.3 30.3 ± 10.3 2.95 [-4.27, 9.77] 0.20 [-0.37, 0.66] 0.542 -8.7
Table 1. Mean and standard deviation for each kinetic variable for both protocols with standard error and 95% confidence intervals
Figure 2. Raincloud plots for peak force (PF); peak rate of force development (PRFD); rate of force development from 20-80% of onset to PF (RFD2080); and impulse from 20-80% of onset to PF (IMP2080). N=newtons, N/s=newton seconds.
The Validity of a Portable Strain-Gauge Apparatus Versus a Commercial Isokinetic Dynamometer for Evalu… International Journal of Sports Physical Therapy
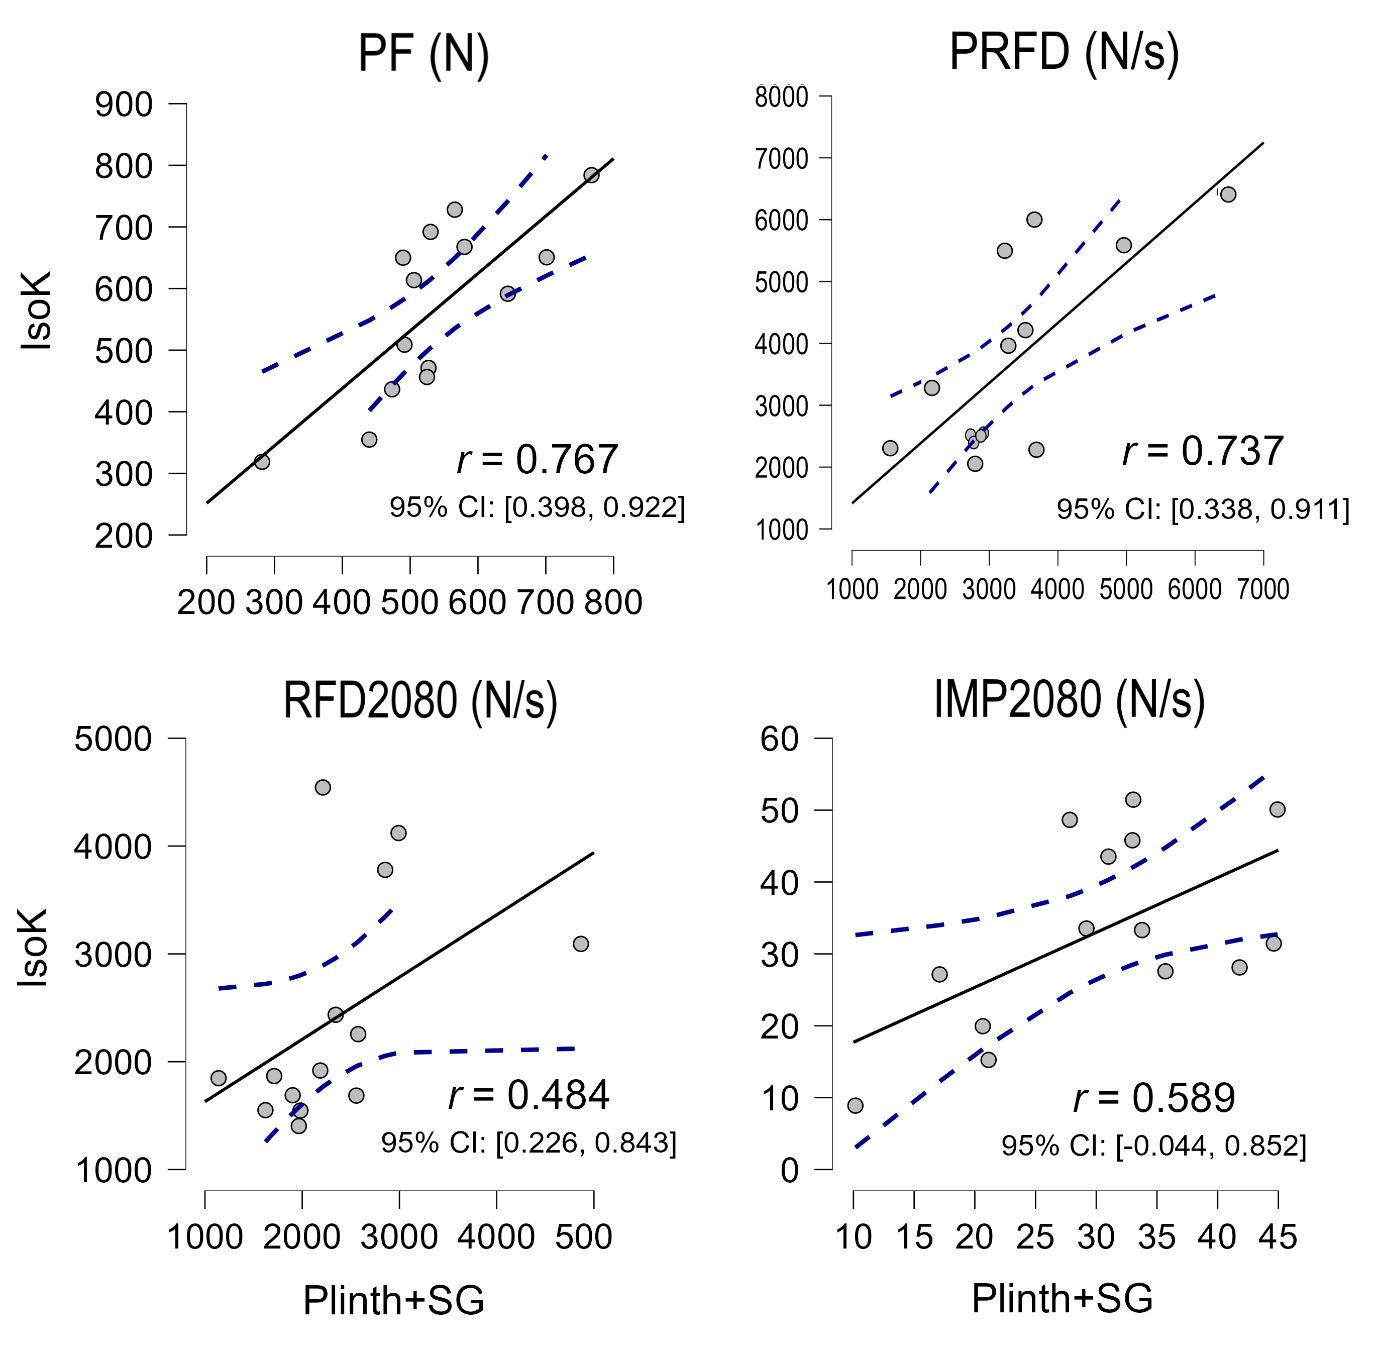
isokinetic dynamometer (IsoK) and treatment plinth with strain-gauge (Plinth+SG) for peak force (PF); peak rate of force development (PRFD); rate of force development from 20-80% of onset to PF (RFD2080); and impulse from 20-80% of onset to PF (IMP2080).
DISCUSSION
The aim of this study was to investigate the use of a straingauge as a clinically practical alternative to an isokinetic device in investigating knee extension kinetics. Typical (PF, PRFD) and novel (RFD2080, IMP2080) analyses were implemented. Findings included no significant or large differences between the commonly used isokinetic dynamometer and the commercial strain-gauge for any variable. Additionally, the data variability was smaller when utilizing the strain-gauge compared to the isokinetic dynamometer. Very large significant correlations were found between protocols for PF and PRFD, though correlations were small, moderate, and non-significant for the RFD2080 and IMP2080 Finally, no explicit biases were detected via BlandAltman analysis. Therefore, we suggest that the practical and affordable strain-gauge and treatment plinth set-up can be used instead of an isokinetic dynamometer for evaluating PF and PRFD in clinical, sports performance, and research settings.
No significant differences (all p≥0.268, ES≤0.35) were found between the two measurement devices across all four variables (PF, PRFD, RFD2080, and IMP2080) of interest. Although no statistically significant differences were found between devices for the variables of interest, these findings concerning mean and standard deviation and interquartile ranges were observed. Slightly greater kinetic outputs (PF=5.0% and PRFD=9.5%, RFD2080=2.4%, IMP2080=8.7%) were observed for the isokinetic dynamometer when compared to the strain-gauge. However, the clinical interpretation of these percentage differences is not certain. Also noteworthy was the greater variability (SD) for all four variables on the isokinetic dynamometer than the strain-gauge, which is also apparent when visually inspecting the distributions (Figure 2). This could be explained as the padding on the plinth table was more rigid than on the dynamometer, and the kicking strap was not padded to the degree of the isokinetic dynamometer. Therefore, participants may have felt more comfortable and willing to contract with full effort on the isokinetic dynamometer. However, the isoki-
Figure 3. Pearson’s r correlation coefficient scatter plots between the
International Journal of Sports Physical Therapy
The
Validity of a Portable Strain-Gauge Apparatus Versus a Commercial Isokinetic Dynamometer for Evalu…
netic device padding also potentially leads to greater variability in performance and output.
A correlational analysis was also performed to further compare device output and determine device interchangeability for practitioners who may desire switch devices without losing their current database. Very large betweendevice correlations were found for PF (r=0.77, p=0.001) and PRFD (r=0.73, p=0.003), suggesting practitioners could switch between isokinetic dynamometers and the straingauge device without losing their current data-set. However, RFD2080 (r=0.48, p=0.079), and IMP2080 (r=0.59, p=0.060) had lower and non-significant between-device correlations. Therefore, practitioners should not compare RFD2080 and IMP2080 results if switching devices. Additionally, while intra-session RFD2080 and IMP2080 measures collected with the present strain-gauge at 90° knee angles are moderately reliable intra-session (ICC=0.79-0.93, CV=11.4-22.1%),14 inter-session variability (ICC=0.48-0.88, CV=10-24.5%)13 demonstrating that relatively large changes must occur for practitioners to be confident that a real improvement (or decrement) has happened.
Finally, Bland-Altman plots were explored, and demonstrated no statistical increase or decrease in bias proportional to the mean values for all four variables. Therefore, high and lower performers can be assessed similarly using the isokinetic dynamometer and plinth with strain-gauge
protocols. However, RFD2080 and IMP2080 did have visually greater bias with high performers (Figure 4), which leads to the question whether statistical biases would occur with elite strength athletes or others with extraordinary kneeextension kinetics. Regardless, when viewed in combination with previous findings, RFD2080 and IMP2080 should be used with caution based on moderate to poor reliability14 and inter-session variability 13
LIMITATIONS
While the aims of the study were completed, the study is not without limitations. The first and most obvious is the relatively small sample size of a relatively homogenous population. Similarly, the sample size makes understanding the potential biases between high- (e.g., athletes), and low(e.g., clinical) performing populations difficult. Secondly, nuances in collecting rapid force variables are challenging to eliminate, once again exacerbated by the limited sample size. This study utilized a pre-tensioned state before contraction initiation, which can be difficult for some participants. The same contractions also analyzed maximal and rapid force production, increasing variability when compared to using separate rapid and ramping contractions to determine RFD and PF, respectively 1 Therefore, it may have been beneficial to utilize brief and ramping contrac-
Figure 4. Bland-Altman plots for peak force (PF); peak rate of force development (PRFD); rate of force development from 20-80% of onset to PF (RFD2080); and impulse from 20-80% of onset to PF (IMP2080).
Green band = 95% confidence intervals for the mean difference + 1.96 standard deviations; purple band = 95% confidence intervals for the mean difference; pink band = 95% confidence intervals for the mean difference –
1.96
standard deviations.
International Journal of Sports Physical Therapy
The
Validity of a Portable Strain-Gauge Apparatus Versus a Commercial Isokinetic Dynamometer for Evalu…
tions to assess rapid and maximum force production, respectively.1 Rest between maximal contractions were selfselected between 10-30 seconds. Therefore, it is plausible that some participants may have performed better or worse on each device based partially on fatigue or post-activation potentiation effects. However, this was likely minimal as participants would likely self-select similar rest periods for both devices. This study compared a single isokinetic dynamometer and a single strain-gauge, and therefore cannot conclusively determine that all dynamometer or straingauge manufacturers are similar. Finally, readers should be cognizant that single joint isometric testing, while primarily valuable in rehabilitation contexts, should likely progress to, or be used alongside dynamic multi-joint assessments.
CONCLUSION
The isokinetic dynamometer is often the standard in open chain force data capture in physical medicine. However, the
device’s cost and portability often limit its use in clinical settings. The results of the present study indicate that the treatment plinth and strain-gauge combination can be used to produce valid maximal and rapid force measurements at a reduced cost and improved practicality when compared to an isokinetic dynamometer. The study’s overall findings support using the strain-gauge as a suitable alternative to the isokinetic dynamometry for measuring PF and PRFD. However, strain-gauge testing of RFD2080, and IMP2080 should be used with caution.
CONFLICT OF INTEREST
The strain-gauge and software were developed, in part, by some of the authors of this manuscript with the end goal of commercialization.
Submitted: July 11, 2023 CST, Accepted: January 12, 2024 CST
© The Author(s)
This is an open-access article distributed under the terms of the Creative Commons Attribution 4.0 International License (CCBY-NC-4.0). View this license’s legal deed at https://creativecommons.org/licenses/by-nc/4.0 and legal code at https://creativecommons.org/licenses/by-nc/4.0/legalcode for more information.
International Journal of Sports Physical Therapy
The Validity of a Portable Strain-Gauge Apparatus Versus a Commercial Isokinetic Dynamometer for Evalu…
REFERENCES
1. Maffiuletti NA, Aagaard P, Blazevich AJ, Folland J, Tillin N, Duchateau J. Rate of force development: Physiological and methodological considerations. Eur J Appl Physiol 2016;116(6):1091-1116. doi:10.1007/s0 0421-016-3346-6
2. Oranchuk DJ, Nelson AR, Storey AG, Diewald SN, Cronin JB. Short-term neuromuscular, morphological, and architectural responses to eccentric quasiisometric muscle actions. Eur J Appl Physiol. 2021;121(1):141-158. doi:10.1007/s00421-020-0451 2-4
3. Beretić I, Burovic M, Okicik T, Dopsaj M. Relations between lower body isometric muscle force characteristics and start performance in elite male sprint swimmers. J Sports Sci Med. 2013;12(4):639-645.
4. Oranchuk DJ, Hopkins WG, Cronin JB, Storey AG, Nelson AR. The effects of regional quadriceps architecture on angle-specific rapid force expression. Appl Physiol Nutr Metab 2023;48(11):829-840. doi:1 0.1139/apnm-2023-0074
5. Çınar-Medeni Ö, Harput G, Baltaci G. Anglespecific knee muscle torques of ACL-reconstructed subjects and determinants of functional tests after reconstruction. J Sports Sci 2019;37(6):671-676. doi:1 0.1080/02640414.2018.1522701
6. Angelozzi M, Madama M, Corsica C, et al. Rate of force development as an adjunctive outcome measure for return-to-sport decisions after anterior cruciate ligament reconstruction. J Orthop Sports Phys Ther. 2012;42(9):772-780. doi:10.2519/jospt.2012.3780
7 Izquierdo M, Aguado X, Gonzalez R, López JL, Häkkinen K. Maximal and explosive force production capacity and balance performance in men of different ages. Eur J Appl Physiol 1999;79(3):260-267 doi:10.1 007/s004210050504
8. Suetta C, Aagaard P, Rosted A, et al. Traininginduced changes in muscle CSA, muscle strength, EMG, and rate of force development in elderly subjects after long-term unilateral disuse. J Appl Physiol 2004;97(5):1954-1961. doi:10.1152/japplphys iol.01307.2003
9. Muehlbauer T, Gollhofer A, Granacher U. Association of balance, strength, and power measures in young adults. J Strength Cond Res. 2013;27(3):582-589. doi:10.1519/jsc.0b013e31825c2b ab
10. McMahon G. No strain, no gain? The role of strain and load magnitude in human tendon responses and adaptation to loading. J Strength Cond Res. 2022;36(10):2950-2956. doi:10.1519/jsc.00000000000 04288
11. Hartmann A, Knols R, Murer K. Reproducibility of an isokinetic strength-testing protocol of the knee and ankle in older adults. Gerontology 2009;55(3):259-268. doi:10.1159/000172832
12. Neeter C, Gustavsson A, Thomeé P, Augustsson J, Thomeé R, Karlsson J. Development of a strength test battery for evaluating leg muscle power after anterior cruciate ligament injury and reconstruction. Knee Surg Sports Traumatol Arthrosc 2006;14(6):571-580. d oi:10.1007/s00167-006-0040-y
13. Juneau CM, Diewald SN, Neville J, Cronin JB, Oranchuk DJ. Intersession variability of knee extension kinetics using a strain gauge device with differing clinically practical physical constraints. J Sport Rehabil 2023;32(1):96-101. doi:10.1123/jsr.202 2-0152
14. Juneau CM, Oranchuk DJ, Cahill M, et al. Reliability and utility of load-cell derived force-time variables collected during a constrained and unconstrained isometric knee extension task on a plinth. J Sci Sport Exercise Published online February 22, 2023. doi:10.1007/s42978-022-00215-8
15. Oranchuk DJ, Storey AG, Nelson AR, Neville JG, Cronin JB. Variability of multiangle isometric forcetime characteristics in trained men. J Strength Cond Res 2022;36(1):284-288. doi:10.1519/jsc.0000000000 003405
16. Oranchuk DJ, Neville JG, Storey AG, Nelson AR, Cronin JB. Variability of concentric angle-specific isokinetic torque and impulse assessments of the knee extensors. Physiol Meas. 2020;41(1):01NT02. do i:10.1088/1361-6579/ab635e
17 de Ruiter CJ, Van Leeuwen D, Heijblom A, Bobbert MF, de Haan A. Fast unilateral isometric knee extension torque development and bilateral jump height. Med Sci Sports Exerc 2006;38(10):1843-1852. doi:10.1249/01.mss.0000227644.14102.50
18. Cobian DG, Koch CM, Amendola A, Williams GN. Knee extensor rate of torque development before and after arthroscopic partial meniscectomy, with analysis of neuromuscular mechanisms. J Orthop Sports Phys Ther 2017;47(12):945-956. doi:10.2519/jo spt.2017.7310
Evalu… International Journal of Sports Physical Therapy
The
Validity of a Portable Strain-Gauge Apparatus Versus a Commercial Isokinetic Dynamometer for
19. Dudley-Javoroski S, Littmann AE, Iguchi M, Shields RK. Doublet stimulation protocol to minimize musculoskeletal stress during paralyzed quadriceps muscle testing. J Appl Physiol. 2008;104(6):1574-1582. doi:10.1152/japplphysiol.008
92.2007
20. Fritz CO, Morris PE, Richler JJ. Effect size estimates: Current use, calculations, and interpretation. J Exp Psychol Gen 2012;141(1):2-18. d oi:10.1037/a0024338
International Journal of Sports Physical Therapy
The Validity of a Portable Strain-Gauge Apparatus Versus a Commercial Isokinetic Dynamometer for Evalu…
Original Research
The Validity of a Portable Strain-Gauge Apparatus Versus a Commercial Isokinetic Dynamometer for Evaluating Knee
Extension Kinetics
Dustin Oranchuk1a , Chris Juneau2 , Shelley Diewald3 , Jono Neville2 , John Cronin2
1 Department of Physical Medicine and Rehabilitation, University of Colorado Anschutz Medical Campus, 2 Sports Performance Research Institute
New Zealand, Auckland University of Technology, 3 Sports Performance Research Institute, Auckland University of Technology
Keywords: force, impulse, rate of force development, reliability, quadriceps
https://doi.org/10.26603/001c.92742
International Journal of Sports Physical Therapy
Background
Isokinetic dynamometers are widely used when assessing neuromuscular function including knee extension kinetics. However, these dynamometers are often prohibitively expensive and are not portable. Thus strain-gauge technology has grown in popularity
Purpose
The purpose of this study was to compare kinetic data captured via an isokinetic dynamometer against an affordable and portable strain-gauge with a treatment plinth during maximal isometric knee extensions.
Study Design
Cross-sectional study
Methods
Healthy participants (8 males and 6 females; age 30.2±7.1 years) volunteered and performed knee extensions at a 90° knee angle on a dynamometer and a treatment plinth with a portable strain-gauge. Peak force (PF), peak rate of force development (PRFD), rate of force development (RFD2080) and impulse (IMP2080) from 20-80% of onset to peak force were assessed using both strain-gauge and isokinetic dynamometer Between-device differences were evaluated by the Wilcoxon signed-rank test, Cohen’s d effect sizes (ES), Pearson’s correlation coefficients (r), and Bland-Altman plots.
Results
No significant or meaningful differences were identified between isokinetic and strain-gauge devices (all p≥0.268, ES≤0.35). However, slightly greater (2.5-9.5%) outputs were observed with the isokinetic dynamometer Very large significant between-device correlations were found for PF (r=0.77, p=0.001) and PRFD (r=0.73, p=0.003), while small and moderate non-significant between-device correlations were found for RFD2080 (r=0.48, p=0.079) and IMP2080 (r=0.59, p=0.060). Bland-Altman plots did not reveal apparent biases from high to low performers.
Conclusions
These results indicate that the strain-gauge device can produce valid maximal and rapid force expression measurements. Similar results, such as those quantified via an isokinetic device, can be obtained without extreme rigour and constraint. The study’s findings support using the practically relevant treatment plinth and strain-gauge combination as a suitable alternative to the isokinetic dynamometry for measuring PF and PRFD
Corresponding author: Dustin J. Oranchuk
+1-303-886-4056
Denver, Colorado, USA
dustinoranchuk@gmail.com
Oranchuk D, Juneau C, Diewald S, Neville J, Cronin J. The Validity of a Portable StrainGauge Apparatus Versus a Commercial Isokinetic Dynamometer for Evaluating Knee Extension Kinetics. IJSPT. Published online March 2, 2024:258-267. doi:10.26603/001c.92742
a
Therefore, more rehabilitation and sports performance practitioners can confidently assess knee extension kinetics.
Level of Evidence 3
INTRODUCTION
Rate of force development (RFD) and impulse (IMP) are valuable components of force production and neuromuscular capacity 1‑4 These metrics can translate into the ability of motor units to develop force quickly,1 which can enhance sporting performance,5,6 and is beneficial in activities that affect the quality of life.7 Additionally, RFD and IMP may better predict functional abilities than maximal strength or peak force (PF) assessments.6,8 Rapid force characteristics are also strongly associated with the prevention of falls, the maintenance of balance, stabilizing the body during reactive tasks,7,9 and providing valuable insight into the stiffness and physiology of the muscle-tendon unit10 and neural capacity 1
A primary consideration of rapid force assessment is related to the availability and practicality of the technology and equipment needed, including back-end analytics. Appreciating the expected variability in RFD and IMP data, a measurement device must contain sensitive, high-frequency components to accurately record this data. Isokinetic testing apparatus, often the standard in open chain joint and muscle-specific force testing,11,12 collects kinematic and kinetic data in a constrained and standardized manner and hence very little variability is associated with the assessed measures.11,12 However, research-grade isokinetic dynamometers are prohibitively expensive and nonportable, especially compared to other force assessment tools, such as strain-gauges.
Sports performance and rehabilitation staff often lack affordable, portable, and clinically useful tools to adequately measure and track kinetic force variables from joints such as the knee. While various testing mediums and tools are available, the strain-gauge can offer a lower financial price point, greater portability, and, therefore, higher utility for clinicians to assess neuromuscular function. While shown to be reliable in several contexts,13,14 limited data exist concerning the validity and transferability of data collected via strain-gauge compared to isokinetic dynamometers. Thus, established practices may be hesitant to transfer their collection protocols from isokinetic dynamometry to portable strain-gauge. Therefore, the purpose of this study was to compare kinetic data captured via an isokinetic dynamometer against an affordable and portable strain-gauge with a treatment plinth during maximal isometric knee extensions. The hypothesis was that there would be no difference in the kinetic data collected by the highly constrained, isokinetic dynamometer device versus those same variables collected on the strain-gauge device.
METHODS
STUDY DESIGN
A single-session cross-sectional study design was implemented, comparing various kinetic variables during the knee extensors’ maximal voluntary isometric contractions (MVIC) with an isokinetic dynamometer versus straingauge device. These two data collection tools were evaluated using three protocols where a range of kinetic variables were assessed. Participants completed three explosive MVICs of the knee extensors for each protocol. Testing was completed bilaterally for all participants. However, only the right leg was used for analysis. Testing order was randomized for each subject, and one rater with ~3 years of experience collected all data.
PARTICIPANTS
A total of fourteen participants volunteered and completed the study, including eight men and six women. Participants were recruited via posters placed throughout the university campus and by word of mouth; they were predominantly graduate students and university staff. All participants were healthy with no current health conditions limiting strenuous exercise or the ability to complete maximal knee extensions. Participants were excluded if they had a prior surgical intervention that would limit knee extension performance or reported any pain throughout the trials. All participants reported their right leg as dominant (kicking leg). Ethics approval for this study was obtained from the Auckland University of Technology Ethics Committee, and all participants provided written informed consent.
TESTING EQUIPMENT
The isokinetic device (Humac Norm; CSMi; Lumex, Ronkonkoma, NY) was used as the gold standard for data collection. The isokinetic dynamometer sampling rate was increased to 1000 Hz through custom software (LabView; National Instruments, New Zealand) to match the straingauge’s sampling frequency and improve the accuracy of RFD and IMP calculations as per previous research.15,16 The pre-tension threshold for this device was set at 40 Nm (torque), which was reported subjectively as being like the 120 N (force) used with the strain-gauge. The collection threshold for this protocol was 50 Nm.
The strain-gauge device was a wireless force measurement system that consisted of a strain-gauge, Bluetooth connectivity, and an internally designed software package (SPRINZ Laboratories, Auckland University of Technology) sampling at 1000 Hz. The computer, with software visible, was placed directly in front of the subject for practice trials, feedback, and the pre-tension threshold. Following pilot
International Journal of Sports Physical Therapy
The Validity of a Portable Strain-Gauge Apparatus Versus a Commercial Isokinetic Dynamometer for Evalu…
testing, the pre-tension mark was set to 120 Newtons (N), while the collection threshold was set to 160 N (i.e., the trial initiation was established once the force produced was above 160 N).13,14
PROCEDURE
Two data collection protocols were implemented. Each collection used either the isokinetic dynamometer or the portable strain-gauge with treatment plinth. Kinetic variables were collected at 90º of knee flexion.
PROTOCOL 1: ISOKINETIC DYNAMOMETER
Protocol 1 (Figure 1A) had the subject seated upright in the chair of the isokinetic dynamometer at a hip angle of 85º, with shoulder, waist, and thigh constrained by straps to reduce body movement during contractions. This highly restricted method and the isokinetic dynamometer for collecting isometric force was considered the standard for comparison to the strain-gauge.2,5,15,17 The device was adjusted so the subject’s knee joint line was positioned at the center of dynamometer rotation and the ankle fixation pad approximately two centimeters superior to the lateral malleolus. The subject was instructed to place their nontesting limb behind the counterforce pad and use the handles on both sides for each trial.
PROTOCOL 2: TREATMENT PLINTH WITH STRAIN-GAUGE
Protocol 2 (Figure 1B) consisted of a clinical plinth (table) and strain-gauge with subject’s performing contractions at 90º of knee flexion. This protocol was designed for the implementation of portable strain-gauge technology in a practical setting, such as a physiotherapy clinic. The subject was seated on the edge of a plinth and allowed to selfselect a position while meeting the following criteria:
1) the subject must maintain this position throughout the trials; 2) the subject must hold the sides of the table; and 3) the subject must shift towards the side of the table being tested (the line of force must be in line to the fixation point which was located towards the side of the table). Once seated and comfortable, the subject was fixed to the table at 2 cm superior to the lateral malleolus using a low compliance steel chain. A towel was placed under the distal thigh between the thigh and the table to reduce discomfort during expressions of maximal force. The table height was adjusted to maintain a 90º line of force to the fixation angle. Throughout practice trials, the subject was allowed to move and change position. However, no further changes were permitted once the testing began, and the subject’s position was recorded for future testing sessions.
The testing angle of the knee joint was confirmed with goniometric measurement to account for tissue and padding deformation. Before any testing trials, the subject completed practice trials which included verbal instruc-
Figure 1. Experimental set-ups for the isokinetic dynamometer (A), and plinth + strain-gauge (B)
The Validity of a Portable Strain-Gauge Apparatus Versus a Commercial Isokinetic Dynamometer for Evalu… International Journal of Sports Physical Therapy
tions about the procedure and visual education about the pre-tension position on the computer monitor.
COLLECTION PROTOCOL
Participants warmed up by cycling at moderate resistance using a self-selected pace for five minutes. Familiarization using the plinth + strain-gauge protocol, regardless of testing order and included ascending isometric contractions, culminating with one MVIC. During these trials, the participants were given verbal and visual feedback regarding performance and education was implemented to avoid confusion or troubleshoot positioning. A visual target (120 N) was provided, and participants were instructed to reach and hold this target. The initial force target is implemented to prevent participants from using countermovement or excessive body movement to initiate the contraction, potentially altering rapid force expression measures.1,6 After familiarization, participants were given a five-minute rest before the data collection initiation. Participants were instructed to contract “fast and hard” The term ‘fast’ in “fast and hard” was consistently emphasized throughout all testing occasions.
After familiarization, participants were randomly placed into protocols via a random number generator Participants were told to achieve the pre-tension state and maintain this force for two seconds by slowly extending the knee into the strap while observing the force-time curve on the monitor For both devices, participants then performed three contractions at 30% of perceived MVIC, two contractions at 60% of perceived MVIC, one contraction at 90% of perceived MVIC, and one contraction at 100% of perceived MVIC. For the three maximal recorded trials, the participants were once again asked to slowly extend their knee to obtain a steady force curve before the primary researchers began a countdown of “3-2-1-Go-Go-Go-Go-Go-Stop” Participants were instructed to start the MVIC immediately after “1”.
Due to the brief contraction durations, the rest between repetitions was set from 10 to 30 seconds following the previous protocols.15 The output was visually inspected for large deviations in force production (>250 N from prior trials), notable countermovement in the output, or any inconsistencies in the pre-tension state, any false trials removed, and the subject ask to repeat the trial before progressing. Participants completed three trials of each protocol with the maximum values used for analyses. Rest was set at 10-30 seconds based on participant preference.15
DATA PROCESSING
Raw, unfiltered force-time data was exported for subsequent analysis in ‘ comma separated value’ format. Using a custom algorithm, the dominant leg data were imported and analyzed in MATLAB (MathWorks, Natick, MA). Each trial was trimmed in length to include a pre-tension period of at least 0.5 seconds, force onset, the isometric contraction for at least one second, and a force offset. The onset of force was defined as an increase in a force greater than three standard deviations (3 SD) of force calculated from
the 350 ms pre-tension window within one second before the contraction.1,17,18 Outputs were visually assessed for methodological outliers (e.g., extreme forces or spikes that were clearly not accurate representations of human capacity), which were removed from the analysis. Methodological outliers were removed on two, and four occasions for the isokinetic dynamometer and strain-gauge devices, respectively PF was determined as the absolute maximum force recorded during the two-second contraction. All other variables of interest were then determined from within the time interval created by the 20-80% peak force thresholds, as described by Cobian et al. (2017) and Dudley-Javoroski et al. (2008).18,19 RFD2080 was the average slope over the epoch (force/time), and IMP2080 was the area under the force-time curve during the 20-80% window PRFD was calculated using a 10 Hz, 4th order low-pass Butterworth filter
STATISTICAL ANALYSIS
Data cleaning was conducted using RStudio IDE (Version 1.4.869, RStudio, PBS). Outlier analysis was conducted using intrasession, intra-subject z-scores. Any values greater than 3 SD were removed from the analysis.
Jeffrey’s Amazing Statistics Program (JASP) software (version 0.16, Amsterdam, Netherlands) was used for statistical analysis. The statistical analysis explored the validity of the between the isokinetic dynamometer and straingauge protocols. Each subject’s trials for each protocol were averaged. Further, if the subject did not participate in all protocols, they were also removed from all analyses. The normality of averaged values was confirmed using the Shapiro-Wilks test for each protocol.
Normality was assessed using the Shapiro-Wilks test and visually assessed with Q-Q plots. A Wilcoxon signed-rank test was used to compare protocols (isokinetic dynamometer, plinth+strain-gauge) as normality was not confirmed for PRFD (p≤0.050) and RFD2080 (p≤0.020). Qualitative descriptors of standardized Cohen’s d effect sizes (ES) with 95% confidence intervals (95%CI) were assessed and reported using these criteria: trivial <0.20, small 0.20–0.49, moderate 0.50–0.79, large >0.80.20 Additionally, Pearson’s r correlation coefficients were determined and interpreted as: 0-0.10 trivial, 0.10-0.30 small, 0.30-0.50 moderate, 0.50-0.70 large, 0.70-0.90 very large, and >0.90 nearly perfect. 95%CIs were calculated for the correlational data by simulating 1000 bootstrapped samples. Finally, Bland-Altman analyses with 95%CI were used to further understand the difference between paired kinetic variables to the pair’s mean across different protocols. All statistical significance was established a priori at p<0.05. 95%CIs are reported in [square brackets] in-text.
RESULTS
The eight men were 30.2±6.8 years old, 173±3.2 cm tall, 84.4±10.9 kg in body mass, and had a shank length of 33.7±3.2 cm. The six females were 33.2±6.7 years old, 161±5.5 cm tall, 61.7±7.5 kg in body mass, and had a shank length of 34.2±1.3 cm. Summary (mean, standard deviation
International Journal of Sports Physical Therapy
The Validity of a Portable Strain-Gauge Apparatus Versus a Commercial Isokinetic Dynamometer for Evalu…
PF = peak force; PRFD = peak rate of force development; RFD = rate of force development; IMP = impulse. CI = confidence interval. Effect size = Cohen’s d Statistics are from Wilcoxon signed-rank tests.
[SD]) and Wilcoxon signed-rank test (standard error [SE], ES, p-values) can be observed in Table 1. All variables had higher mean and larger SDs when assessed with the isokinetic dynamometer versus the plinth and strain-gauge, however, these were not statistically significantly different.
Raincloud plots for each kinetic variable collected with each protocol can be observed in Figure 2 No significant or meaningful differences between the protocols were detected for PF (ES=0.26 [-0.32, 0.70], p=0.426), PRFD (ES=0.29 [-0.22, 0.75], p=0.27), RFD2080 (ES=-0.03 [-0.55, 0.51], p=0.952), or IMP2080 (ES=0.29 [-0.37, 0.66], p=0.542).
Pearson’s r correlations (Figure 3) detected very large significant between-protocol correlations for PF (r=0.77 [0.40, 0.92], p=0.001) and PRFD (r=0.73 [0.34, 0.91],
p=0.003). Small and moderate non-significant correlations were found for RFD2080 (r=0.48 [0.23, 0.84], p=0.079) and IMP2080 (r=0.59 [-0.04, 0.85], p=0.060), respectively
Bland-Altman plots (Figure 4) show acceptable bias for all variables as no data points fell outside of the 95%CI. However, while PF or PRFD were found to have no obvious bias, RFD2080 and IMP2080 were found to have greater between-protocol differences in high-performing participants.
Variable Isokinetic dynamometer Plinth + strain-gauge Standard error [95% CI] Effect size [95% CI] p-value % Δ PF (N) 565 ± 143 537 ± 117 24 [-34.2, 88.8] 0.26 [-0.32, 0.70] 0.426 -5.0 PRFD (N/s) 3677 ± 1573 3327 ± 1192 286 [-341, 958] 0.35 [-0.22, 0.75] 0.268 -9.5 RFD2080 (N/s) 2410 ± 1047 2351 ± 878 264 [-435, 541] -0.03 [-0.55, 0.51] 0.952 -2.5 IMP2080 (N/s) 33.2 ± 13.3 30.3 ± 10.3 2.95 [-4.27, 9.77] 0.20 [-0.37, 0.66] 0.542 -8.7
Table 1. Mean and standard deviation for each kinetic variable for both protocols with standard error and 95% confidence intervals
Figure 2. Raincloud plots for peak force (PF); peak rate of force development (PRFD); rate of force development from 20-80% of onset to PF (RFD2080); and impulse from 20-80% of onset to PF (IMP2080). N=newtons, N/s=newton seconds.
The Validity of a Portable Strain-Gauge Apparatus Versus a Commercial Isokinetic Dynamometer for Evalu… International Journal of Sports Physical Therapy
isokinetic dynamometer (IsoK) and treatment plinth with strain-gauge (Plinth+SG) for peak force (PF); peak rate of force development (PRFD); rate of force development from 20-80% of onset to PF (RFD2080); and impulse from 20-80% of onset to PF (IMP2080).
DISCUSSION
The aim of this study was to investigate the use of a straingauge as a clinically practical alternative to an isokinetic device in investigating knee extension kinetics. Typical (PF, PRFD) and novel (RFD2080, IMP2080) analyses were implemented. Findings included no significant or large differences between the commonly used isokinetic dynamometer and the commercial strain-gauge for any variable. Additionally, the data variability was smaller when utilizing the strain-gauge compared to the isokinetic dynamometer. Very large significant correlations were found between protocols for PF and PRFD, though correlations were small, moderate, and non-significant for the RFD2080 and IMP2080 Finally, no explicit biases were detected via BlandAltman analysis. Therefore, we suggest that the practical and affordable strain-gauge and treatment plinth set-up can be used instead of an isokinetic dynamometer for evaluating PF and PRFD in clinical, sports performance, and research settings.
No significant differences (all p≥0.268, ES≤0.35) were found between the two measurement devices across all four variables (PF, PRFD, RFD2080, and IMP2080) of interest. Although no statistically significant differences were found between devices for the variables of interest, these findings concerning mean and standard deviation and interquartile ranges were observed. Slightly greater kinetic outputs (PF=5.0% and PRFD=9.5%, RFD2080=2.4%, IMP2080=8.7%) were observed for the isokinetic dynamometer when compared to the strain-gauge. However, the clinical interpretation of these percentage differences is not certain. Also noteworthy was the greater variability (SD) for all four variables on the isokinetic dynamometer than the strain-gauge, which is also apparent when visually inspecting the distributions (Figure 2). This could be explained as the padding on the plinth table was more rigid than on the dynamometer, and the kicking strap was not padded to the degree of the isokinetic dynamometer. Therefore, participants may have felt more comfortable and willing to contract with full effort on the isokinetic dynamometer. However, the isoki-
Figure 3. Pearson’s r correlation coefficient scatter plots between the
International Journal of Sports Physical Therapy
The
Validity of a Portable Strain-Gauge Apparatus Versus a Commercial Isokinetic Dynamometer for Evalu…
netic device padding also potentially leads to greater variability in performance and output.
A correlational analysis was also performed to further compare device output and determine device interchangeability for practitioners who may desire switch devices without losing their current database. Very large betweendevice correlations were found for PF (r=0.77, p=0.001) and PRFD (r=0.73, p=0.003), suggesting practitioners could switch between isokinetic dynamometers and the straingauge device without losing their current data-set. However, RFD2080 (r=0.48, p=0.079), and IMP2080 (r=0.59, p=0.060) had lower and non-significant between-device correlations. Therefore, practitioners should not compare RFD2080 and IMP2080 results if switching devices. Additionally, while intra-session RFD2080 and IMP2080 measures collected with the present strain-gauge at 90° knee angles are moderately reliable intra-session (ICC=0.79-0.93, CV=11.4-22.1%),14 inter-session variability (ICC=0.48-0.88, CV=10-24.5%)13 demonstrating that relatively large changes must occur for practitioners to be confident that a real improvement (or decrement) has happened.
Finally, Bland-Altman plots were explored, and demonstrated no statistical increase or decrease in bias proportional to the mean values for all four variables. Therefore, high and lower performers can be assessed similarly using the isokinetic dynamometer and plinth with strain-gauge
protocols. However, RFD2080 and IMP2080 did have visually greater bias with high performers (Figure 4), which leads to the question whether statistical biases would occur with elite strength athletes or others with extraordinary kneeextension kinetics. Regardless, when viewed in combination with previous findings, RFD2080 and IMP2080 should be used with caution based on moderate to poor reliability14 and inter-session variability 13
LIMITATIONS
While the aims of the study were completed, the study is not without limitations. The first and most obvious is the relatively small sample size of a relatively homogenous population. Similarly, the sample size makes understanding the potential biases between high- (e.g., athletes), and low(e.g., clinical) performing populations difficult. Secondly, nuances in collecting rapid force variables are challenging to eliminate, once again exacerbated by the limited sample size. This study utilized a pre-tensioned state before contraction initiation, which can be difficult for some participants. The same contractions also analyzed maximal and rapid force production, increasing variability when compared to using separate rapid and ramping contractions to determine RFD and PF, respectively 1 Therefore, it may have been beneficial to utilize brief and ramping contrac-
Figure 4. Bland-Altman plots for peak force (PF); peak rate of force development (PRFD); rate of force development from 20-80% of onset to PF (RFD2080); and impulse from 20-80% of onset to PF (IMP2080).
Green band = 95% confidence intervals for the mean difference + 1.96 standard deviations; purple band = 95% confidence intervals for the mean difference; pink band = 95% confidence intervals for the mean difference –
1.96
standard deviations.
International Journal of Sports Physical Therapy
The
Validity of a Portable Strain-Gauge Apparatus Versus a Commercial Isokinetic Dynamometer for Evalu…
tions to assess rapid and maximum force production, respectively.1 Rest between maximal contractions were selfselected between 10-30 seconds. Therefore, it is plausible that some participants may have performed better or worse on each device based partially on fatigue or post-activation potentiation effects. However, this was likely minimal as participants would likely self-select similar rest periods for both devices. This study compared a single isokinetic dynamometer and a single strain-gauge, and therefore cannot conclusively determine that all dynamometer or straingauge manufacturers are similar. Finally, readers should be cognizant that single joint isometric testing, while primarily valuable in rehabilitation contexts, should likely progress to, or be used alongside dynamic multi-joint assessments.
CONCLUSION
The isokinetic dynamometer is often the standard in open chain force data capture in physical medicine. However, the
device’s cost and portability often limit its use in clinical settings. The results of the present study indicate that the treatment plinth and strain-gauge combination can be used to produce valid maximal and rapid force measurements at a reduced cost and improved practicality when compared to an isokinetic dynamometer. The study’s overall findings support using the strain-gauge as a suitable alternative to the isokinetic dynamometry for measuring PF and PRFD. However, strain-gauge testing of RFD2080, and IMP2080 should be used with caution.
CONFLICT OF INTEREST
The strain-gauge and software were developed, in part, by some of the authors of this manuscript with the end goal of commercialization.
Submitted: July 11, 2023 CST, Accepted: January 12, 2024 CST
© The Author(s)
This is an open-access article distributed under the terms of the Creative Commons Attribution 4.0 International License (CCBY-NC-4.0). View this license’s legal deed at https://creativecommons.org/licenses/by-nc/4.0 and legal code at https://creativecommons.org/licenses/by-nc/4.0/legalcode for more information.
International Journal of Sports Physical Therapy
The Validity of a Portable Strain-Gauge Apparatus Versus a Commercial Isokinetic Dynamometer for Evalu…
REFERENCES
1. Maffiuletti NA, Aagaard P, Blazevich AJ, Folland J, Tillin N, Duchateau J. Rate of force development: Physiological and methodological considerations. Eur J Appl Physiol 2016;116(6):1091-1116. doi:10.1007/s0 0421-016-3346-6
2. Oranchuk DJ, Nelson AR, Storey AG, Diewald SN, Cronin JB. Short-term neuromuscular, morphological, and architectural responses to eccentric quasiisometric muscle actions. Eur J Appl Physiol. 2021;121(1):141-158. doi:10.1007/s00421-020-0451 2-4
3. Beretić I, Burovic M, Okicik T, Dopsaj M. Relations between lower body isometric muscle force characteristics and start performance in elite male sprint swimmers. J Sports Sci Med. 2013;12(4):639-645.
4. Oranchuk DJ, Hopkins WG, Cronin JB, Storey AG, Nelson AR. The effects of regional quadriceps architecture on angle-specific rapid force expression. Appl Physiol Nutr Metab 2023;48(11):829-840. doi:1 0.1139/apnm-2023-0074
5. Çınar-Medeni Ö, Harput G, Baltaci G. Anglespecific knee muscle torques of ACL-reconstructed subjects and determinants of functional tests after reconstruction. J Sports Sci 2019;37(6):671-676. doi:1 0.1080/02640414.2018.1522701
6. Angelozzi M, Madama M, Corsica C, et al. Rate of force development as an adjunctive outcome measure for return-to-sport decisions after anterior cruciate ligament reconstruction. J Orthop Sports Phys Ther. 2012;42(9):772-780. doi:10.2519/jospt.2012.3780
7 Izquierdo M, Aguado X, Gonzalez R, López JL, Häkkinen K. Maximal and explosive force production capacity and balance performance in men of different ages. Eur J Appl Physiol 1999;79(3):260-267 doi:10.1 007/s004210050504
8. Suetta C, Aagaard P, Rosted A, et al. Traininginduced changes in muscle CSA, muscle strength, EMG, and rate of force development in elderly subjects after long-term unilateral disuse. J Appl Physiol 2004;97(5):1954-1961. doi:10.1152/japplphys iol.01307.2003
9. Muehlbauer T, Gollhofer A, Granacher U. Association of balance, strength, and power measures in young adults. J Strength Cond Res. 2013;27(3):582-589. doi:10.1519/jsc.0b013e31825c2b ab
10. McMahon G. No strain, no gain? The role of strain and load magnitude in human tendon responses and adaptation to loading. J Strength Cond Res. 2022;36(10):2950-2956. doi:10.1519/jsc.00000000000 04288
11. Hartmann A, Knols R, Murer K. Reproducibility of an isokinetic strength-testing protocol of the knee and ankle in older adults. Gerontology 2009;55(3):259-268. doi:10.1159/000172832
12. Neeter C, Gustavsson A, Thomeé P, Augustsson J, Thomeé R, Karlsson J. Development of a strength test battery for evaluating leg muscle power after anterior cruciate ligament injury and reconstruction. Knee Surg Sports Traumatol Arthrosc 2006;14(6):571-580. d oi:10.1007/s00167-006-0040-y
13. Juneau CM, Diewald SN, Neville J, Cronin JB, Oranchuk DJ. Intersession variability of knee extension kinetics using a strain gauge device with differing clinically practical physical constraints. J Sport Rehabil 2023;32(1):96-101. doi:10.1123/jsr.202 2-0152
14. Juneau CM, Oranchuk DJ, Cahill M, et al. Reliability and utility of load-cell derived force-time variables collected during a constrained and unconstrained isometric knee extension task on a plinth. J Sci Sport Exercise Published online February 22, 2023. doi:10.1007/s42978-022-00215-8
15. Oranchuk DJ, Storey AG, Nelson AR, Neville JG, Cronin JB. Variability of multiangle isometric forcetime characteristics in trained men. J Strength Cond Res 2022;36(1):284-288. doi:10.1519/jsc.0000000000 003405
16. Oranchuk DJ, Neville JG, Storey AG, Nelson AR, Cronin JB. Variability of concentric angle-specific isokinetic torque and impulse assessments of the knee extensors. Physiol Meas. 2020;41(1):01NT02. do i:10.1088/1361-6579/ab635e
17 de Ruiter CJ, Van Leeuwen D, Heijblom A, Bobbert MF, de Haan A. Fast unilateral isometric knee extension torque development and bilateral jump height. Med Sci Sports Exerc 2006;38(10):1843-1852. doi:10.1249/01.mss.0000227644.14102.50
18. Cobian DG, Koch CM, Amendola A, Williams GN. Knee extensor rate of torque development before and after arthroscopic partial meniscectomy, with analysis of neuromuscular mechanisms. J Orthop Sports Phys Ther 2017;47(12):945-956. doi:10.2519/jo spt.2017.7310
Evalu… International Journal of Sports Physical Therapy
The
Validity of a Portable Strain-Gauge Apparatus Versus a Commercial Isokinetic Dynamometer for
19. Dudley-Javoroski S, Littmann AE, Iguchi M, Shields RK. Doublet stimulation protocol to minimize musculoskeletal stress during paralyzed quadriceps muscle testing. J Appl Physiol. 2008;104(6):1574-1582. doi:10.1152/japplphysiol.008
92.2007
20. Fritz CO, Morris PE, Richler JJ. Effect size estimates: Current use, calculations, and interpretation. J Exp Psychol Gen 2012;141(1):2-18. d oi:10.1037/a0024338
International Journal of Sports Physical Therapy
The Validity of a Portable Strain-Gauge Apparatus Versus a Commercial Isokinetic Dynamometer for Evalu…
Original Research
Reliability and Validity of the End Range Hamstring Strength Test with Handheld Dynamometry
Jakob Kristiansen1a , Christina Eddy1 , Stig Peter Magnusson1
1 Department of Physical and Occupational Therapy, Bispebjerg Hospital
Keywords: Reliability, Validity, Strength, Handheld dynamometry, Hamstring https://doi.org/10.26603/001c.94011
International Journal of Sports Physical Therapy
Background and Purpose
Hamstring strength testing is crucial in assessing this important muscle group during rehabilitation and injury prevention. The purpose of this study was to evaluate the reliability and validity of measuring strength in a maximally lengthened position using a handheld dynamometer (HHD) compared to isokinetic testing.
Methods
Twenty healthy and active participants were recruited, and isometric strength testing was performed both on the Biodex machine and isometric end-range hamstring testing with the HHD on two occasions.
Results
Significant strong correlations (r= 0.87, p < 0.0001) were found between strength testing on the Biodex machine and the HHD for both the right and left sides. Bland-Altman plots demonstrated agreement between the two measurements. Excellent intra-rater reliability (ICC= 0.91-0.93) and moderate to good inter-rater reliability (ICC = 0.71-0.83) for the HHD test was demonstrated.
Conclusions
The HHD provides a reliable and valid alternative to isokinetic testing for assessing hamstring strength in a maximally lengthened position. This assessment can be valuable in monitoring rehabilitation progress and detecting deficits before and after returning to play. The HHD is an accessible and cost-effective option for assessing hamstring strength at long lengths in a clinical setting.
Level of evidence
3
BACKGROUND
Hamstring injuries are frequent and occur in many different sports.1 Furthermore, relative to other injuries, hamstring injuries are the most common recurrent injury in football (soccer) and typically leads to longer absence from the sport than the initial injury.2 Injuries can range from acute tears of the hamstring muscle to overuse related injuries to the proximal and distal tendons. Several factors are thought to elevate the risk of hamstring injuries including high-
a
Corresponding author:
Jakob Bredahl Kristiansen, PT, Master in Medical Science
speed running, previous hamstring injury and lower muscle strength.3
A recent systematic review and meta-analysis indicated that isometric side-to-side strength deficits after an acute hamstring injury may settle within 20-50 days, but the isokinetic strength deficits can remain even after return to play.4 Of note, Tyler et al. have been shown that moderate side-to-side strength deficits in isometric peak torque may be muscle length dependent when they demonstrated that isometric strength deficit of the knee flexors were more
Department of Physical and Occupational Therapy, Bispebjerg Hospital Copenhagen, Denmark
Email: jakobbredahlkristiansen@gmail.com
Phone: 0045 23 44 58 15 Kristiansen J, Eddy C, Magnusson SP. Reliability and Validity of the End Range Hamstring Strength Test with Handheld Dynamometry. IJSPT. Published online March 1, 2024:268-274. doi:10.26603/001c.94011
evident at longer muscle lengths.5 Furthermore, the athletes who adhered to their specific program fully recovered their hamstring strength at long length and had no reinjuries after returning to high-speed sports compared to those who did not adhere. Collectively, these findings suggests that a strength deficit after hamstring strain at long muscle length should be addressed during rehabilitation.6 Similarly, athletes with hamstring tendinopathy may also benefit from knee flexion strengthening at lengths.7 Testing strength at longer muscle length may reflect the larger work of the hamstring at the late swing phase and initial contact with the ground during running.8
Evaluation of hamstring strength in research and clinical practice is important and has been extensively investigated.4 While isokinetic testing is considered the gold standard and has been shown to be a valid and reliable in testing method for hamstring strength, it is expensive and can be impractical.9 Hand-held dynamometry (HHD) is a relatively inexpensive and practical alternative to isokinetic strength testing. Moderate to high correlation between isokinetic testing values of the hamstring muscles and those obtained with HHD has been described.9 The testing position in the isokinetic machine in a lengthened position could be mimicked with a hand-held dynamometer as proposed by Schmitt, Tyler, and McHugh.10
METHODS PARTICIPANTS
Twenty healthy active participants were recruited at Bispebjerg Hospital in Copenhagen. They were recruited using convenience sampling, meaning participants were employed by departments of the hospital or were from local sporting clubs. The activity level of the participants ranged from recreational running to elite level track and field. Inclusion criteria: No pain in the hamstring, gluteal-, groinor gastrocnemius musculature in the prior three months. Likewise, no pain in the back, knee- or hip joint was allowed. Previous hamstring strain was not an exclusion criteria (beyond the three-month pain free criteria) as any strength deficits would theoretically have presented on all tests. All participants received written information prior to participation and gave written consent for participation before testing. All participants were measured in height and weight on test day one. Participant information is displayed in Table 1. No approval from the ethical committee of the Capitol Region in Denmark was necessary due the non-invasive nature of the testing procedure.
ISOMETRIC STRENGTH TESTING USING THE BIODEX
The participants performed a 10-minute warm up on a stationary bike at a self-selected intensity The Biodex was adjusted so the participants were seated with approximately 45 degrees of hip flexion (measured with a goniometer) above the horizontal plane and with an 85-degree upright back position. The participants were strapped to the machine across the torso and the hips, and the testing limb was fixated. The axis of rotation was aligned with the
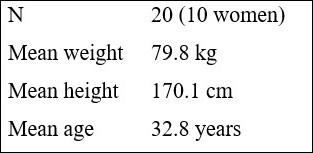
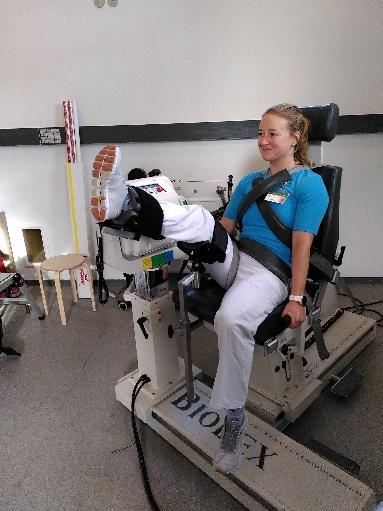
femoral condyle. The participant then maximally extended the knee, and the lever arm was fixed in this position (Figure 1). In this position the participants were allowed to do two familiarization attempts (75% subjective MVC) before the test began. Once the test procedure was initiated the participants executed three maximal knee flexion isometric contractions for 5 seconds with 30 seconds of rest in between contractions. This was repeated on both legs (starting with the right leg). The highest value of the three attempts was used for analysis and converted to newton using this equation ( ). The conversion was done to be able to compare the values with the HHD, which measured Force.
Table 1. Descriptive data for participants
Figure 1. Set up for isometric knee flexion strength testing on the Biodex. 90 degrees of trunk flexion and 45 degrees of hip flexion (horizontal from the horizontal plane).
Reliability and Validity of the End Range Hamstring Strength Test with Handheld Dynamometry International Journal of Sports Physical Therapy

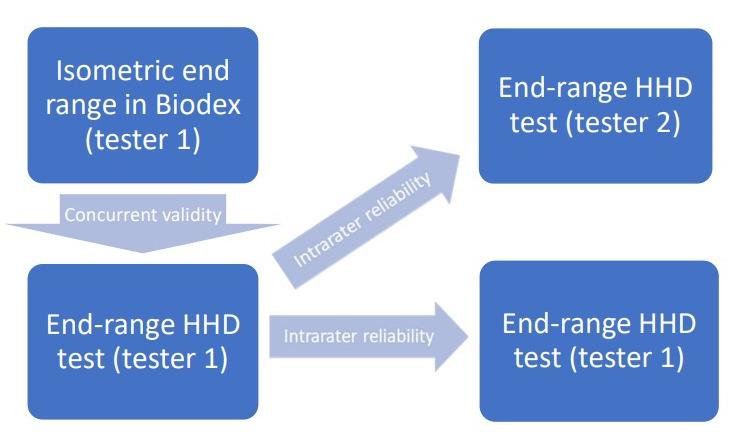
machine by Tester one after a 10-minute warmup on a stationary bike. Once the Biodex testing was completed, participants were allowed to rest for ten minutes. After the 10 minutes the isometric end-range hamstring test with HHD by Tester one was executed.
Seven to ten days later “Test Day 2” was scheduled. The time between testing was chosen from a convenience perspective, where both testers were able to attend at the same time. The participants again performed a 10-minute warm up on the stationary bike before the isometric end range hamstring test with HHD was performed by Tester two. Participant were once again allowed a 10-minute break before the test was repeated by Tester one in a different room.
ISOMETRIC END RANGE HAMSTRING TEST WITH HANDHELD DYNAMOMETER
To conduct this test, the participants were placed in supine and pulled the thigh of the tested leg into maximal hip flexion with their own hands. The contralateral leg was in a neutral position and fixed to the table via a belt strap as shown in Figure 2. The tester was positioned standing on the floor with one hand supporting and maintaining maximal hip flexion of the participant. One the arm that held the HHD, the elbow and arm was locked to the tester’s torso. This was done to ensure that the entire body, and not just the upper limb, withstood the force from the participant. The participant then actively extended the knee joint maximally and the tester placed the dynamometer (Lafeytte HHD, model 01165A) on the calcaneus and the subject performed an isometric knee flexion contraction which was held for three to five seconds. The participants were instructed to maximally bend the knee and the tester initiated the test by saying: "Ready, set, go" and provided encouragement by saying: “push, push, push and relax” This was repeated three times on each side with 30 seconds of rest in between contractions. The highest value of the three tests were used for analysis. Force in kg was multiplied by 9.81 to convert to Newton and compare with Biodex values.
TEST FLOWCHART
The participants were tested on “Test Day 1” and re-tested approximately 7-10 days later at “Test Day 2” (Figure 3). On “Test Day 1” the participants were tested in the Biodex
This setup enabled measurement of the intratester reliability between Day 1 and Day 2 with measurements taken by Tester one. The two testing sessions on Day 2 enabled measurement intertester reliability between Tester one and Tester two. Tester one was a male with extensive experience with the use of a handheld dynamometer whereas Tester two was female with little experience with HHD.
STATISTICAL ANALYSIS
Pearson product-moment correlation coefficient was used to determine the validity of the HHD test in comparison to the Biodex machine. Bland-Altman’s plots with limits of agreement (LOA) were used to visually address the potential systematic bias between the two testing methods. The between-session mean differences were investigated using a paired t-test, to assess the systematic bias between the two days of testing. The relative intra- and inter reliability was tested using an Intraclass correlation Coefficient (Twoway random, single score, consistency definition). Absolute intra- and inter reliability was calculated Standard Error of Measurement (SEM), which was expressed as: Standard Deviation_pooled x . This was also calculated as a percentage (SEM%): Level of significance was set at p < 0.05. All statistical analyses were performed in RStudio (4.2.2 version).
Figure 2. End range isometric knee flexion strength testing with HHD Patient lying and contralateral leg is strapped to the table. The test is conducted in maximal passive hip flexion and maximal active knee flexion.
Figure 3. Flowchart of testing procedure.
Reliability and Validity of the End Range Hamstring Strength Test with Handheld Dynamometry International Journal of Sports Physical Therapy
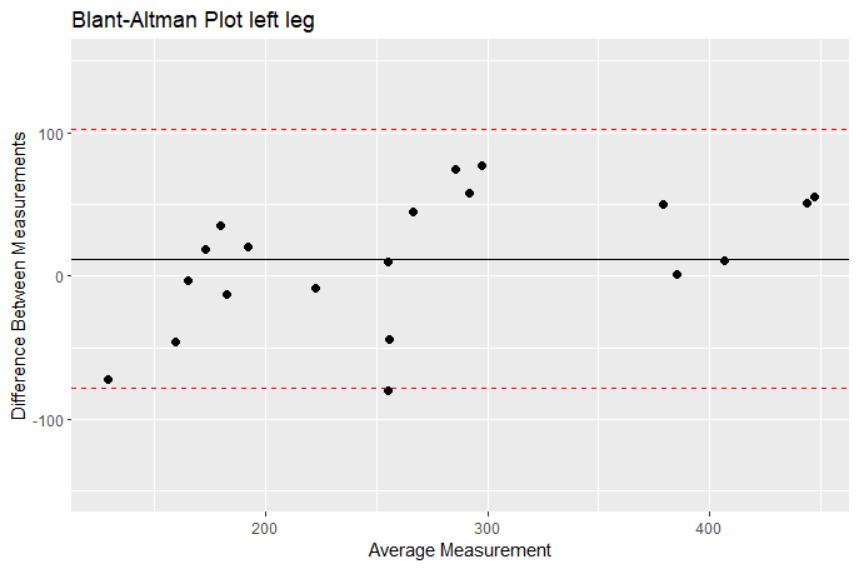
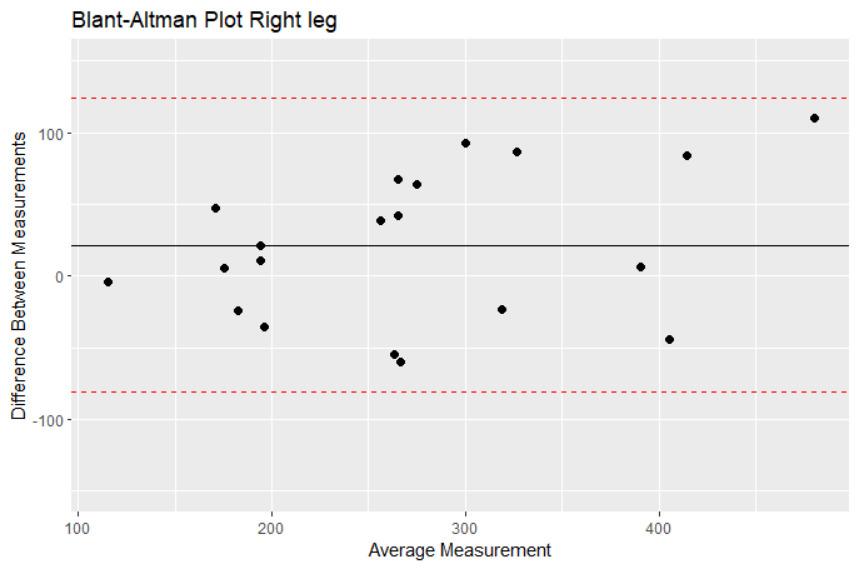
RESULTS
CONCURRENT VALIDITY
There was a significant strong correlation (Pearson’s product-moment) between strength testing in the Biodex machine and with the handheld dynamometer on both the right (r= 0.87, p < 0.0001) and left side (r= 0.911, p< 0.0001). The Bland-Altman plots (Figures 4 and 5) show that all the datapoints are within the levels of agreement and the mean difference between the two measurements lie between 12 N for the left leg and 22 N on the right leg, which clinically would be seen as a small difference between the two measurement instruments.
RELIABILITY
There was no systematic bias between any of the dynamometer tests, with respect to separate test days and testers. The relative intratester reliability between the two test days was excellent and the absolute reliability (SEM%) was 8.5 % for the right and 8.2 % for the left leg. Relative interrater reliability for the right leg showed good reliability (ICC=0.83), whereas reliability for the left leg only showed moderate reliability (ICC= 0.71). The absolute interrater reliability (SEM%) was 11.2 % and 16.1 % for right and left
leg respectively Inter- and intra-rater reliability results are shown in Table 2.
DISCUSSION
The main findings of this study were that a standardized end range hamstring muscle strength test with a hand-held dynamometer is a valid measurement compared to isokinetic testing. The data also show excellent intra-rater reliability (ICC > 0.9) and moderate to good inter-rater reliability (left ICC = 0.5-0.75, right ICC > 0.75). Furthermore, the absolute reliability, SEM < 10 % for intra-rater and SEM < 17.2 % for inter-rater shows that this simple test can be used to measure knee flexor strength with acceptable measurement error 11
The current study evaluated knee flexor strength in a lengthened position with the hip flexed at 45 degrees relative to the horizontal plane and the knee in maximal extension. This position places the knee flexors under considerably more tension than other commonly used positions for evaluating knee flexion strength, such as a seated isokinetic testing and prone position with 0 degrees of hip flexion and 15 degrees of knee flexion.4,12 Despite the potential instability of this position, the current study found excellent intra-rater reliability (ICC > 0.9) and moderate to good inter-rater reliability (left ICC = 0.5-0.75, right ICC > 0.75), with low standard error of measurement (SEM < 10 % for intra-rater and SEM < 16.1 % for inter-rater). The difference in ICC’s for the left and right leg may be due to the fact that tester 1 was a lefthanded male whereas tester 2 was a righthanded female. This means that tester 2 might have had difficulties maintaining the same level of force when testing the left leg compared to the right leg, thereby seeing poorer reliability.
The study suggests that the evaluation of isometric hamstring strength in this lengthened position can be reliably performed in clinical practice and research, particularly if the same person repeats the testing procedure.
The current study found excellent intra-rater reliability and moderate to good inter-rater reliability for the endrange hamstring strength test with a hand-held dynamometer This is consistent with previous studies that have used hand-held dynamometry to measure hamstring strength in a seated or prone position with 0-15 degrees of knee flexion. For example, van der Made et al. found good inter-tester reliability (ICC 0.80-0.87) when testing high-level rugby players in both prone and seated positions, while Larsson et al. found good intra-rater reliability in a prone position with 0 degrees of hip flexion and 90 degrees of knee flexion.12,13 The current study also showed moderate to good inter-rater reliability despite the testing position being considered less stable and the two testers being of different sex and presumably upper body strength. These findings suggest that the end-range hamstring strength test can be reliably performed by different testers in clinical practice and research.
The results of this study showed strong correlation (concurrent validity) between isometric hamstring strength testing with the HHD and Biodex in the lengthened po-
Figure 4. Bland-Altman plot, left leg
Figure 5. Bland-Altman plot, right leg
Reliability and Validity of the End Range Hamstring Strength Test with Handheld Dynamometry International Journal of Sports Physical Therapy
INTRA=intra-rater; INTER=inter-rater; ICC=Intraclass Correlation Coefficient; SD=standard deviation; SEM=standard error of measurement; MDD=minimal detectable difference
sition. This is consistant with Mentiplay et al. who also showed good reliability (ICC= 0.79-0.87) and strong correlation (r=0.66-0.76) when comparing HHD with isometric knee flexor strength using a KinCom isokinetic machine.14 The testing was done in seated position with 90 degrees of hip and knee flexion while the tester had the arm on the wall for support. Even though this would be considered a much more stable testing position for both the tester and participants, the current study shows good correlation and agreement between HHD and the Biodex in this lengthened and more difficult testing position. This implies that testing knee flexor strength in this lengthened position with HHD is valid and useful in clinical practice and in research.
The results of the current study suggest that assessing knee flexor strength in a lengthened position with handheld dynamometry can be a useful tool for monitoring rehabilitation in a more functionally relevant position. A recent systematic review by Manier et al. showed a normalization of knee flexor strength deficits at longer lengths before returning to play, while Nara et al. measured a decrease in isometric knee flexor strength after returning to play following hamstring strain.4,6 The first study analyzed strength at longer lengths at 0 degrees of hip flexion and 0-15 degrees of knee flexion. This is far from the length that was used by the later study (85 degrees of hip flexion and 30 degrees of knee flexion). Although a smaller study, Nara et al.6 may have measured knee flexion strengths at a more relevant position of the hamstrings during sprinting, which could be the reason for the detection of the strength deficit. The current study placed the knee flexors under considerably more tension than other commonly used positions for evaluating knee flexion strength, which could be an alternative way of measuring knee flexor strength and detecting deficits before and after returning to play This could be particularly useful for targeting rehabilitation with an emphasis on eccentric training at longer lengths, as suggested by Tyler et al.5 Others have shown that hamstring strength at longer lengths is more representative of rehabilitation progression than strength at mid-range (0 degrees of hip flexion and 30 degrees of knee flexion) and inner-range strength (0 degrees of hip flexion and 90 degrees of knee flexion).11 Given the fact that the lengthened testing position is valid and reliably measured with the HHD,
such a measure would also be more practical and less costly than isokinetic testing in a clinical setting.
LIMITATIONS
There are some limitations that deserve consideration. Firstly, the Bland-Altman plots revealed a potential for heteroscedasticity, indicating that there may be a tendency for larger differences between the HHD and the Biodex measurements in subjects with higher force production. This suggests that the agreement between the two methods may vary depending on the individual’s strength level. The decision was made not to use external fixation, such as a strap fixated to the wall, during the testing procedure. Pilot testing revealed that the lengthened testing position used in this study required more training for the testers compared to other commonly used positions for evaluating knee flexion strength. This may have introduced some variability in the measurements and could affect the reliability of the results. However, this makes the testing procedure much more practical than with the use of external fixation (for example to the wall). Hand dominance and tester strength were also not considered and may have added to the variability Additionally, there was no blinding between the results of the isokinetic testing and the subsequent HHD measurement on the first day of testing. Tester 1 conducted both tests, raising the possibility of result memorization from the Biodex affecting the HHD measurements. To minimize this potential bias, the authors took precautions by recording the results from the Biodex and the HHD on different measurement systems. The Biodex results were written down by hand on a piece of paper, while the HHD testing was carried out and the results were recorded on a different sheet. All the results were then entered into a spreadsheet for calculations. Although not formally blinded, it is unlikely that the tester could memorize and calculate the values, thus minimizing the impact on the HHD testing results. The decision not to blind the comparison between isokinetic testing and HHD on the first day of testing was made due to the unavailability of Tester 2, who could only attend the testing sessions on subsequent days.
Tester 1. Day 1 (N) Tester 2. Day 2 (N) Tester 1. Day2 (N) ∆ (N) T-test (p-value) ICC ICC (SD) SEM SEM (%) MDD (%) INTRA right 262 268 -6 0.4959 0.91 0.79-0.96 25.16 8.5 26.3 INTRA left 263 266 -3 0.5862 0.93 0.84-0.97 23.08 8.2 24.2 INTER right 262 249 13 0.8796 0.83 0.63-0.93 32.14 11.2 34.9 INTER left 263 225 37 0.3068 0.71 0.39-0.87 41.99 16.1 47.7
Table 2. Intratester and intertester reliability of the end range hamstring strength test with HHD in 20 healthy subjects.
Reliability and Validity of the End Range Hamstring Strength Test with Handheld Dynamometry International Journal of Sports Physical Therapy
CONCLUSION
The results of the current study indicate that assessing knee flexor strength in a lengthened position with handheld dynamometry can be done with excellent intra-rater reliability and moderate to good inter-rater reliability, with standard error of measurements below 10 % and 20 %, respectively This assessment shows strong correlation with isokinetic strength testing, considered the gold standard.
The end-range hamstring strength test can be utilized in research and clinical settings to determine knee flexor strength in a more functionally relevant position than usual test positions with HHD.
Submitted: November 10, 2023 CST, Accepted: January 19, 2024 CST
© The Author(s)
This is an open-access article distributed under the terms of the Creative Commons Attribution 4.0 International License (CCBY-NC-4.0). View this license’s legal deed at https://creativecommons.org/licenses/by-nc/4.0 and legal code at https://creativecommons.org/licenses/by-nc/4.0/legalcode for more information.
Reliability and Validity of the End Range Hamstring Strength Test with Handheld Dynamometry International Journal of Sports Physical Therapy
REFERENCES
1. Green B, Bourne MN, Pizzari T Isokinetic strength assessment offers limited predictive validity for detecting risk of future hamstring strain in sport: a systematic review and meta-analysis. Br J Sports Med 2018;52(5):329-336. doi:10.1136/bjsports-2017-09810
1
2. Ekstrand J, Krutsch W, Spreco A, et al. Time before return to play for the most common injuries in professional football: a 16-year follow-up of the UEFA Elite Club Injury Study Br J Sports Med 2020;54(7):421-426. doi:10.1136/bjsports-2019-1006
66
3. van Dyk N, Bahr R, Burnett AF, et al. A comprehensive strength testing protocol offers no clinical value in predicting risk of hamstring injury: a prospective cohort study of 413 professional football players. Br J Sports Med 2017;51(23):1695-1702. do i:10.1136/bjsports-2017-097754
4. Maniar N, Shield AJ, Williams MD, Timmins RG, Opar DA. Hamstring strength and flexibility after hamstring strain injury: a systematic review and meta-analysis. Br J Sports Med 2016;50(15):909-920. doi:10.1136/bjsports-2015-095311
5. Tyler TF, Schmitt BM, Nicholas SJ, McHugh MP. Rehabilitation after hamstring strain Injury emphasizing eccentric strengthening at long muscle lengths: Results of long-term follow-up. J Sport Rehabil 2017;26(2):131-140. doi:10.1123/jsr.2015-00 99
6. Nara G, Samukawa M, Oba K, et al. The deficits of isometric knee flexor strength in lengthened hamstring position after hamstring strain injury Phys Ther Sport. 2022;53:91-96. doi:10.1016/j.ptsp.2021.1 1.011
7 Beatty NR, Félix I, Hettler J, Moley PJ, Wyss JF. Rehabilitation and prevention of proximal hamstring tendinopathy Curr Sports Med Rep 2017;16(3):162-171. doi:10.1249/jsr.00000000000003
55
8. Sun Y, Wei S, Zhong Y, Fu W, Li L, Liu Y How joint torques affect hamstring injury risk in sprinting swing-stance transition. Med Sci Sports Exerc. 2015;47(2):373-380. doi:10.1249/mss.0000000000000
404
9. Ogborn DI, Bellemare A, Bruinooge B, Brown H, McRae S, Leiter J. Comparison of common methodologies for the determination of knee flexor muscle strength. Int J Sports Phys Ther. 2021;16(2):350-359. doi:10.26603/001c.21311
10. Schmitt B, Tyler T, McHugh M. Hamstring injury rehabilitation and prevention of reinjury using lengthened state eccentric training: a new concept. Int J Sports Phys Ther 2012;7(3):333-341.
11. Whiteley R, van Dyk N, Wangensteen A, Hansen C. Clinical implications from daily physiotherapy examination of 131 acute hamstring injuries and their association with running speed and rehabilitation progression. Br J Sports Med 2018;52(5):303-310. doi:10.1136/bjsports-2017-09761
6
12. van der Made AD, Paget LDA, Nienke Altink J, et al. Assessment of isometric knee flexor strength using hand-held dynamometry in high-level rugby players is intertester reliable. Clin J Sport Med 2021;31(5):e271-e276. doi:10.1097/jsm.00000000000 00793
13. Larson D, Lorenz D, Melton B. Can clinicianstabilization with hand-held dynamometry yield a reliable measure of knee flexion torque? Int J Sports Phys Ther 2022;17(6):1095-1103. doi:10.26603/001 c.37907
14. Mentiplay BF, Perraton LG, Bower KJ, et al. Assessment of lower limb muscle strength and power using hand-held and fixed dynamometry: A reliability and validity study. PLoS One. 2015;10(10):e0140822. doi:10.1371/journal.pone.0140822
and Validity
End
Hamstring Strength
Handheld Dynamometry International Journal of Sports Physical Therapy
Reliability
of the
Range
Test with
Keerasomboon
The Effect of Variations in Knee and Hip Angles on Electromyographic Activity of the Hamstrings and Related Muscles
During the Nordic Hamstring Exercise
Taspol Keerasomboon1 , Toshiaki Soga2,3,4 , Norikazu Hirose5a
1 College of Sports Science and Technology, Mahidol University, Thailand, 2 Graduate School of Sport Sciences, Waseda University, Japan, 3 Graduate School of Engineering and Science, Shibaura Institute of Technology, Japan, 4 Research Fellow of Japan Society for the Promotion of Science, Japan, 5 Faculty of Sport Sciences, Waseda University, Japan
Keywords: hamstring muscle, knee flexion, hip flexion, hamstring exercise, isometric contraction
https://doi.org/10.26603/001c.92745
International Journal of Sports Physical Therapy
Background
The benefit of performing the Nordic Hamstring Exercise (NHE) on an inclined board has been described, however, isometric hamstring activation in different knee and hip angles has not yet been thoroughly explored.
Purpose
This study investigated the effect of variations in knee and hip angles during the isometric performance of the NHE on electromyographic activity of the hamstring muscles.
Study design
Crossover study
Methods
Thirteen male volunteers performed isometric contractions during the NHE with the knee (30°, 50°, 60°) and the hip (0°, 30°, and 45°) in various angles of flexion on a leg support platform which was inclined at 30°. An electrical goniometer was used to monitor the knee and hip joint angles during 5-s isometric contractions. A multivariate analysis of variance with repeated measures was used to compare normalized electromyographic values of each muscle across different knee and hip angles, followed by pairwise comparisons.
Results
The electromyographic activity of the biceps femoris, semitendinosus, and semimembranosus at a knee angle of 30° and hip angle of 0° were significantly higher than those observed with a knee angle of 50° and hip angle of 0°, or a knee angle of 60° and hip angle of 0° (p<0.05). The electromyographic activity of the semimembranosus at a knee angle of 60° and hip angle of 45° was significantly higher than values obtained with knee and hip angles of 60° and 0°, respectively (p<0.05).
Conclusions
The results indicate that using a knee flexion of 30° and a hip flexion of 0°, while isometrically performing the NHE on a platform inclined at 30°, may optimize electromyographic activity of the hamstrings.
a
Corresponding author:
Dr. Norikazu Hirose
Waseda University 2-7-5 Higashifushimi, Nishitokyo city, Tokyo, 202-0021, Japan
Original Research
T,
T,
Variations in Knee
E-mail address: toitsu_hirose@waseda.jp Hip Angles on Electromyographic Activity of the Hamstrings and Related Muscles During the Nordic Hamstring Exercise. IJSPT. Published online March 1, 2024:275-283. doi:10.26603/001c.92745
Soga
Hirose N. The Effect of
and
INTRODUCTION
The Nordic hamstring exercise (NHE) which emphasizes eccentric contraction has been shown to decrease hamstring injuries by 51% in athletes1 by increasing strength and inducing positive architectural adaptations in the hamstrings by increasing fascicle length.2‑5 Timmins et al. found that soccer players with shorter biceps femoris long head (BFl) fascicle length and weaker eccentric knee flexors have a higher risk of hamstring strain injuries.6 However, several previous studies have pointed out the drawbacks of NHE.7‑9 For example, only strong athletes who can resist the downward motion of the trunk to a point at which their knees are nearly fully extended are able to derive the full benefits of this exercise.10,11 Thus, the majority of individuals are unable to take full advantage of the NHE. Recently, a number of studies have attempted to remove these drawbacks by having participants perform this exercise in an inclined position.9,10,12 In these studies, participants were able to achieve greater knee extension angles during the NHE without falling down (losing control of the trunk).9,10,12 Although the general advantage of performing the NHE on an inclined plane has been established, the effects of variations in knee and hip angles on hamstring muscular activation during this exercise have not yet been thoroughly examined.
Differences in knee and hip angles during the NHE affect hamstring muscle length.13 Knee extension results in lengthening of hamstring muscles, similar to what is observed during the late swing phase of sprinting, which is when hamstring strains are most likely to occur 9,14 Electromyography (EMG) has been used to study muscle activation during various hamstring exercises.4,5,7,15,16 During exercise, voluntary activation has been identified by EMG activity which indicates both firing rates and motor unit recruitment.5 For this reason, EMG has been used for identifying hamstring activation during various hamstring exercises. The results may provide practical information so that professionals can better prescribe appropriate exercises for injury prevention. A prior study examined the effect of changes in muscle length on the EMG activity of hamstring muscle.13 A decrease in EMG activity was observed in the semimembranosus (SM) at hip and knee angles of 0° and 90°, respectively, as well as the semitendinosus (ST) at a hip angle of 90° and knee angle of 0° compared to the other two flexed knee positions (45° and 90°).13 The results indicated that changing muscle length affects muscle activation of the hamstrings. In addition, trunk muscles attached to pelvis control length changes of hamstring muscle during NHE. A previous study showed that an isometric contraction of the erector spinae (ES) is necessary for maintaining an optimal standing position.17 Moreover, rectus abdominis (AD) and hip extensor muscles contribute to spinal stability by contributing to posterior pelvis tilting while back extensor and hip flexor muscles contribute to anterior pelvis tilting, which creates force
couples to affect spinal stability 18 Thus, coactivation of musculature in force couples is crucial to maintaining a neutral pelvis tilt and lumbar lordosis.19 Consequently, ES and AD muscles, involved in natural hamstring exercises (NHE), must activate alongside a displacement of the center of gravity These muscles, acting against the force of gravity through isometric contractions, play a crucial role in maintaining an upright posture.20 Furthermore, the gluteus maximus (Gmax) plays an important role in stabilizing the pelvis which helps to provide the proper conditions for optimal hamstring contraction.20,21 If there is a weakness of any of the related muscles acting on a joint, increased muscle activation of another synergist muscle may be induced, which may lead to muscle strain.20 Thus, it is important to examine the activity of Gmax, ES and AD during different knee and hip angles during NHE.
Whether isometric and eccentric exercises have differing effects on hamstring strengthening remains controversial.22 As the hamstrings exhibit a predominantly isometric action during the swing phase, isometric exercises may replicate activities that occur during high-speed running.22 In addition, some athletes position their trunk so far forwards during the NHE that they nearly contact the ground; the short-term maintenance of this position is attributed to isometric contraction.
While prior studies have reported a range of knee and hip angles for the activation of hamstring activity,9,10,12,23 the effects of specific variations in knee and hip angles during the NHE have not yet been investigated. Therefore, the purpose of this study was to investigate the effect of variations in knee and hip angles during the isometric performance of the NHE on EMG activity of the hamstring muscles.
METHODS
PARTICIPANTS
The sample size was determined using G*Power 3.1.3 software (Heinrich Heine University Dusseldorf, Dusseldorf, Germany) for a MANOVA repeated measure analysis of variance (ANOVA) with a significance level of 0.05 and a power of 0.9. As a result, it was confirmed that a sample size of 12 was required. Therefore, to account for potential dropouts, thirteen recreationally active male volunteers who performed aerobic activities at least twice a week were recruited to participate in this study. None of the subjects had previously experienced a hamstring strain injury or had a surgical history.
MEASURES
DESIGN AND PROCEDURES
Prior to EMG electrode placement, hair around the target site was shaved and the skin was disinfected with alcohol. The six target muscles (biceps femoris [BFl], ST, SM, gluteus
Level of Evidence 3
International Journal of Sports Physical Therapy
The Effect of Variations in Knee and Hip Angles on Electromyographic Activity of the Hamstrings and Relat…
maximus [GM], rectus abdominis [AD], and erector spinae [ES]) were evaluated with wireless EMG electrodes (DL-5000 with m-Biolog2, S&ME Inc., Tokyo, Japan) with a bar length of 10 mm, bar width of 1 mm, and distance of 1 cm between active recording sites. The EMG electrodes were pre-amplified (10X) and linked through the EMG mainframe, which provided further amplification (100X) to a total gain of 1,000X; signals were band-pass filtered (20–500 Hz). The EMG electrodes were placed on the dominant limb, targeting each muscle using following landmarks: midpoint between the ischial tuberosity and the lateral epicondyle of the tibia (BFl); midpoint of the line between the ischial tuberosity and the medial epicondyle of the tibia (ST); on the line between the medial condyle of the tibia and ischial tuberosity (SM); mid-point between the sacral vertebrae and the greater trochanter (GM); two finger-widths lateral from the spinous process of the L1 vertebra (ES); and two finger-widths lateral from the midline of the umbilicus (AD). Electrodes were placed parallel to the lines between these landmarks, as recommended by the SENIAM guidelines.24 To achieve accurate electrode placement on each target muscle, the examiner palpated the muscle bellies and tested them to confirm that clear EMG signals could be obtained during muscle contraction. This study reduced the root mean square (RMS) from the raw EMG data during the middle 2 sec of the 5 sec exercise for further analysis.
The participants then performed maximal voluntary isometric contractions (MVICs) of the hamstrings, in prone, at knee flexion angles of 30°, 45°, and 90° and hip 0°. The GM, ES, and AD were assessed during hip extension with the knee flexed at 90°, and trunk extension and trunk flexion in the supine position, respectively These MVIC positions have been used in previous studies that investigated the EMG activity of the hamstring muscles.23,25,26 Each MVIC protocol was performed for two bouts of 5 seconds. The EMG values were collected during each MVIC protocol. The maximum EMG value for each muscle was used to normalize EMG values recorded during the modified NHE exercises.
Following completion of the MVIC protocol, participants performed two rounds of the modified isometric NHE on a leg support platform inclined at 30°. The isometric NHE comprised different combinations of three different knee and hip flexion angles: knees at 30° with hips at 0°, 30°, and 45°; knees at 50° with hips at 0°, 30°, and 45°; and knees at 60° with hips at 0°, 30°, and 45°. An electrical goniometer was used to monitor knee and hip joint angles during the isometric NHE. Participants were strictly instructed to position their knees and hips at the aforementioned angles on the inclined leg support platform; their legs were subsequently stabilized by strapping them with a band attached to the platform. Participants were then instructed to maintain each of the set positions for 5 seconds.
STATISTICAL ANALYSIS
The average EMG value (± standard deviation) for each exercise was calculated. The RMS data were normalized as a percentage of the maximum isometric values (normalized
EMG [nEMG]). A multivariate analysis of variance with repeated measures was used to compare the nEMG of each muscle across different knee and hip joint angles. When a simple main effect was found, the Tukey post-hoc test was used to measure any differences. All statistical analyses were performed using SPSS for Windows (version 25.0; IBM Corp., Armonk, NY, USA). The statistical significance level was set at p<0.05.
RESULTS
Thirteen recreationally active male volunteers participated in this study (mean age, 25.1 ± 2.1 years; height, 1.72 ± 0.05 m; and body mass, 72.7 ± 11.9 kg).
EMG ACTIVITY IN THE HAMSTRING MUSCLES (BFL, ST, SM)
The nEMG values of the hamstring muscle group and other related muscles recorded during the isometric NHE are shown in Figure 2. There was a significant main effect of knee angle for the following muscles: BFl (knee, F[2,12]=125.43, p<0.05); ST (knee, F[2,12]=82.63, p<0.05), and SM (knee, F[2,12]=136.02, p<0.05). However, hip angle did not have a significant main effect for BFl (hip, F[2,12]=0.95, p=0.392), ST (hip, F[2,12]=0.27, p=0.766), or SM (hip, F[2,12]=1.93, p=0.153). The interaction effect between knee and angle was significant for BFl (interaction, F[4,12]=6.68, p<0.05), ST (interaction, F[4,12]=3.81, p<0.05), and SM (interaction, F[4,12]=7.12, p<0.05).
The nEMG values obtained with the hip at 0° and the BFl, ST, and SM at K30H0 were significantly higher than those observed with the knee at K50H0 and K60H0 (p=0.032). With the hip at 30°, the nEMG values of BFl and ES at K30H30 were significantly higher than those at K50H30 and K60H30; exceptions included nEMG values of ST and SM at K30H30, which were only significantly higher than the value obtained at K60H30 (p=0.01). With the hip at 45°, nEMG values of BF and SM at K30H45 were significantly higher than those at K60H45 (p=0.046).
EMG ACTIVITY IN THE RELATED MUSCLES (GM, ES, AD)
The knee angle had a significant main effect for ES (knee, F[2,12]=44.48, p<0.05), GM (knee, F[2,12]=28.47, p<0.05), and AD (knee, F[2,12]=20.14, p<0.05); however, there was no significant main effect of hip angle for ES (hip, F[2,12]=0.81, p=0.447), GM (hip, F[2,12]=0.04, p=0.960), or AD (hip, F[2,12]=1.27, p=0.286). The interaction effect between knee and angle was significant for ES (interaction, F[4,12]=1.82, p<0.05). However, there was no significant interaction effect for GM (interaction, F[4,12]=1.82, p= 0.134) or AD (interaction, F[4,12]=0.53, p=0.712).
The nEMG value of ES at K30H0 was significantly higher than that at K50H0 and K60H0 (p<0.001). With the hip at 30°, the nEMG value of ES at K30H30 was significantly higher than that at K50H30 and K60H30 (p=0.004).
The Effect of Variations in Knee and Hip Angles on Electromyographic Activity of the Hamstrings and Relat… International Journal of Sports Physical Therapy
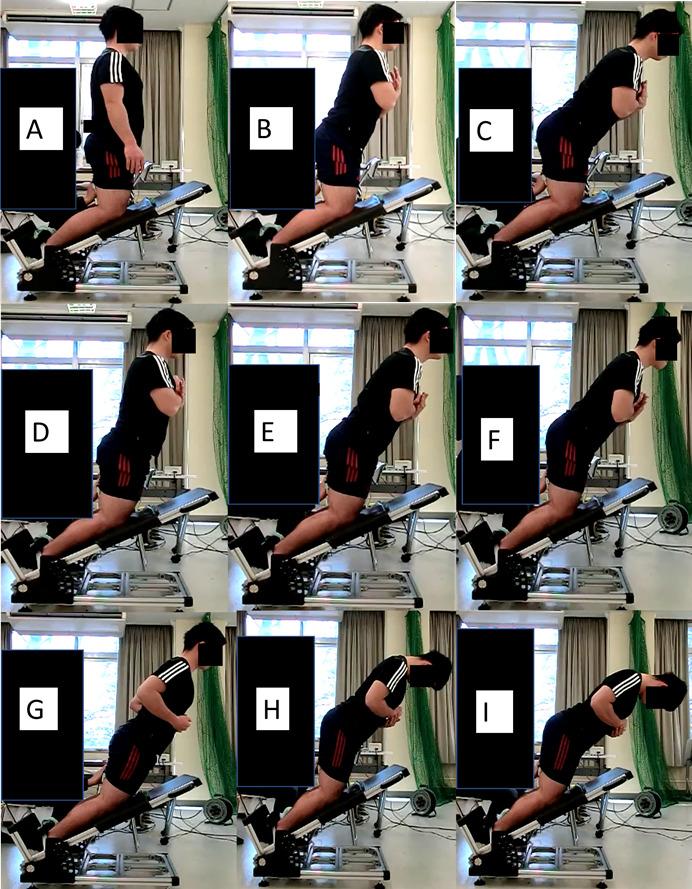
DISCUSSION
In this study, differences in the EMG activation of the hamstring muscles (BFl, ST, and SM) and related muscles (ES, GM, and AD) were investigated, using variations in knee and hip angles during the isometric NHE, which was performed on a support platform inclined at 30°. The results indicated that the EMG activities of the hamstrings and ES were greater at knee and hip flexions of 30° and 0°, respectively, compared to other positions. This is the first study to examine isometric contraction at various knee and hip angles, while performing the NHE on a support platform inclined at 30°. The current results are consistent with those that showed that an increase in the angle of the lower leg (from 0° to 20° and 40°) resulted in a higher hamstring EMG activity in the final descent phase of the NHE.10 This might be explained by the fact that when the knee is extended further, the spine angle relative to the horizontal increases. As a result, the force of gravity shifts away from the cen-
ter of rotation of the trunk, leading to an increase in the gravity force over the lever arm.11,12 Isometric contraction of the hamstrings and ES are required for joint stabilization, which counteracts the gravitational force and prevents flexion of trunk.20 In addition, the current results showed no difference in EMG activity between BFl and ST, which is consistent with the findings of Hirose et al. who found that BF and ST muscle activities were equivalent when a shallow knee flexion angle was used during the NHE on an inclined platform.12
While a decrease in hamstring EMG activity was observed when the hip angle was increased while keeping the knee angle constant at 30°, this did not reach a statistically significant difference. This may be attributed to a decrease in the hip angle when the hip is flexed, which shifts the center of gravity closer to the knee. In addition, EMG activity at a hip angle of 30° was higher than that at 45° when the knee angle was set at 50° or 60°. This is supported by the results of Mohamed et al. which reported decreases in the
Figure 1. Nordic hamstring exercise on a leg support platform inclined at 30° during isometric contractions: A) K60H0 B), K60H30, C) K60H45, D) K50H0, E) K50H30, F) K50H45, G) K30H0, H) K30H30, I) K30H45.
The Effect of Variations in Knee and Hip Angles on Electromyographic Activity of the Hamstrings and Relat… International Journal of Sports Physical Therapy
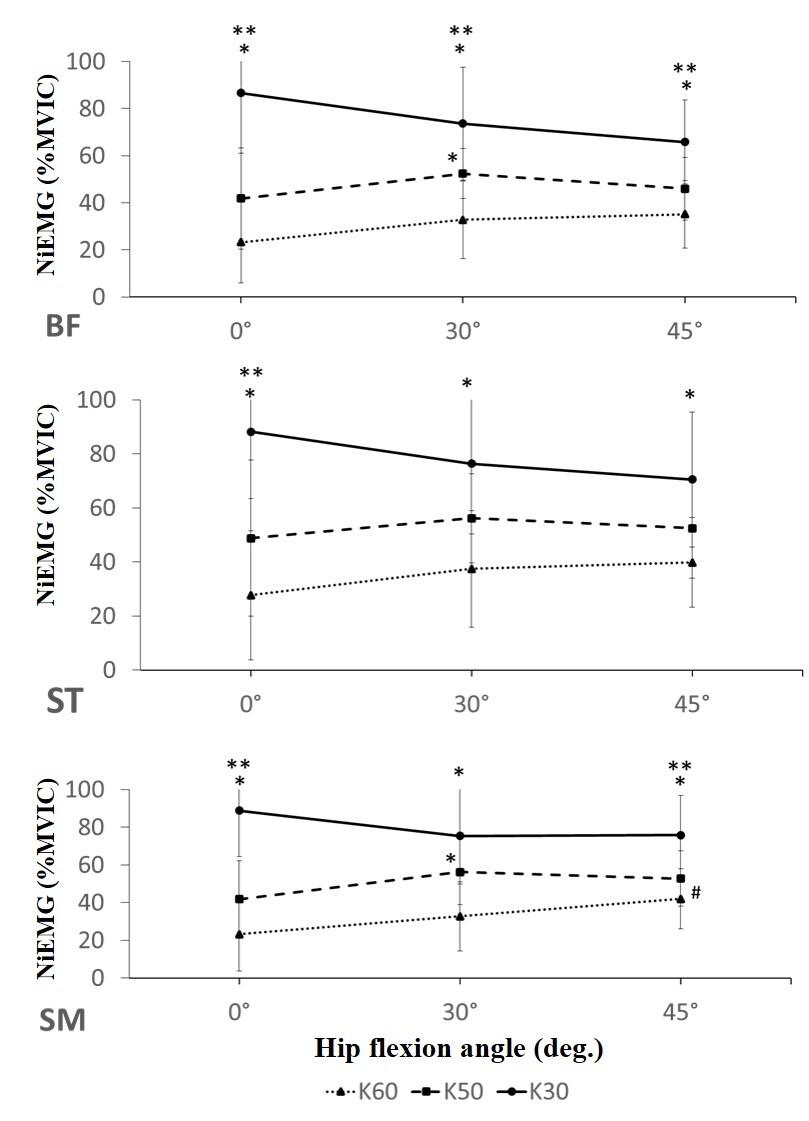
The Effect of Variations in Knee and Hip Angles on Electromyographic Activity of the Hamstrings and Relat… International Journal of Sports Physical Therapy
Figure 2. Differences in nEMG (%MVIC) activity (Y axis) during knee flexion (30°, 50°, 60°) and hip flexion on the X axis (0°, 30°, 45°) in the BF, ST, SM, muscles during isometric NHE on a leg support platform inclined at 30°. The symbol * indicates a statistically significant difference between 60° and other angles. The symbol ** indicates a statistically significant difference between 50° and other angles. The symbol # indicates a statistically significant difference between a hip angle of 0° and other angles BF=biceps femoris; ST=semitendinosus; SM=semimembranosus; ES=erector spinae; GM=gluteus maximus; AD= rectus abdominis; MVIC= maximal voluntary isometric contractions; NHE=Nordic hamstring exercise; nEMG=normalized electromyographic activity K30= knee flexed to 30°, K50= knee flexed to 50°, K60= knee flexed to 60°.
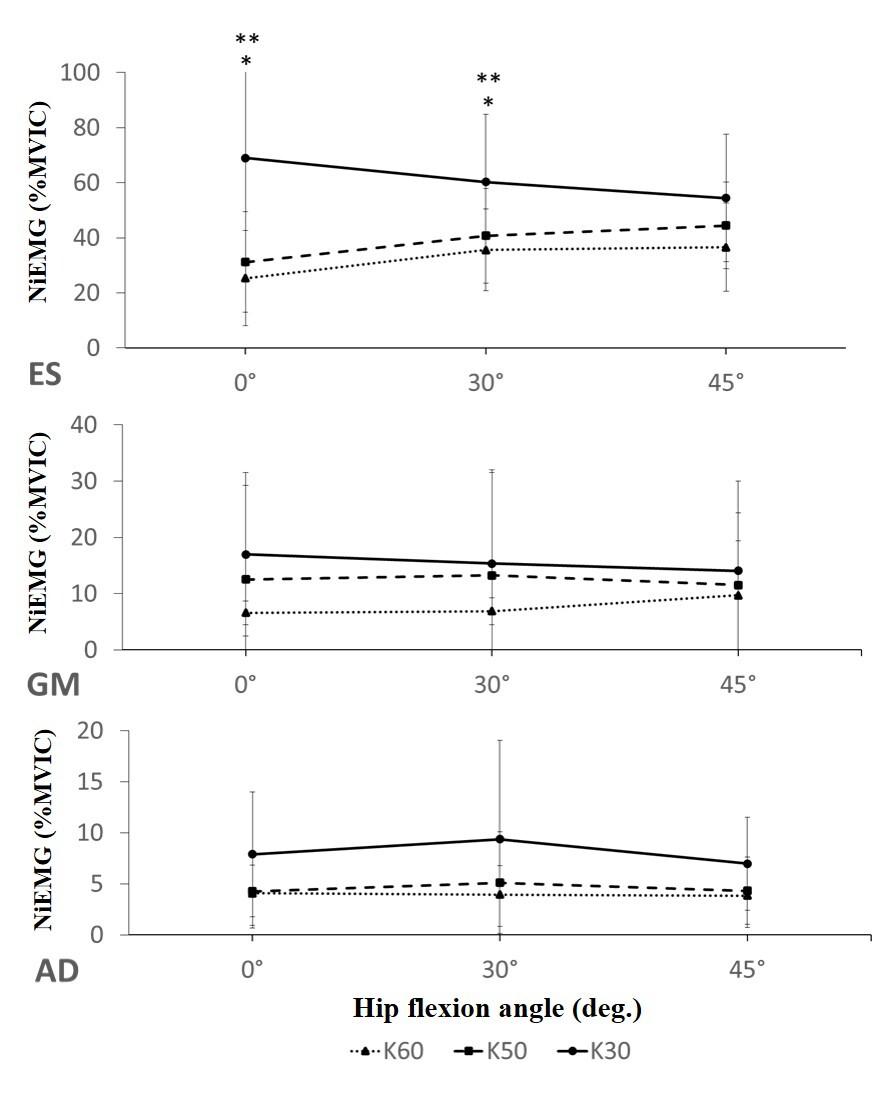
The Effect of Variations in Knee and Hip Angles on Electromyographic Activity of the Hamstrings and Relat… International Journal of Sports Physical Therapy
Figure 3. Differences in nEMG (%MVIC) activity during knee flexion (30°, 50°, 60°) and hip flexion (0°, 30°, 45°) in the ES, GM, and AD muscles during isometric NHE on a leg support platform inclined at 30° The symbol * indicates a statistically significant difference between 60° and other angles. The symbol ** indicates a statistically significant difference between 50° and other angles. The symbol # indicates a statistically significant difference between a hip angle of 0° and other angles BF=biceps femoris; ST=semitendinosus; SM=semimembranosus; ES=erector spinae; GM=gluteus maximus; AD= rectus abdominis; MVIC= maximal voluntary isometric contractions; NHE=Nordic hamstring exercise; nEMG=normalized electromyographic activity; K30= knee flexed to 30°, K50= knee flexed to 50°, K60= knee flexed to 60°.
activities of ST when subjects were in a sitting position (hip at 90°), with their knees at 0°; a decline in the EMG activity of SM was also observed when this muscle was at the most shortened position.13 These findings can be explained by the interaction between muscle length and the anatomical location of its tendon.13 When the knee is fully extended, the ST tendon lies very close to the axis of the knee joint, providing a poor lever arm for knee flexion. This suggests its ineffectiveness as a knee flexor; in addition, the muscle is elongated at both of the two joints it crosses. The interaction of these two factors may have caused the observed decline in EMG activity Another possible explanation is that the decrease in EMG activity was due to the movement of the recording electrodes may move away from the center of the muscle belly closer to its tendon.27 Prior studies have shown that intramuscular electrodes may move upon muscle contraction.28
In terms of the related muscles, the ES muscle activity was substantial when performing variations of NHE with the knee angle at 30°. This is consistent with the results of a previous study, which showed that despite the knee extension angle, ES activation was higher than GM and AD 20 This was attributed to a decrease in the hip extension torque which relative to Gmax activity, the ES makes a larger contribution towards counteracting of gravitational forces and the maintenance of an erect trunk position and hip extension torque. While isometric abdominal contractions help to maintain the erect position of the spine during the NHE, the posterior hip and trunk muscles are activated upon a shift in the center of gravity; thus, both are responsible for the maintenance of an erect posture during the NHE.
This study had several limitations. First, the NHE was examined on a board that was only inclined at 30°; boards inclined at other angles may have yielded different outcomes. Secondly, surface electrodes may have moved during contraction and between angles with respect to the
tendons and the innervation zones, which is a typical limitation of surface EMG. Potential cross-talk may also have existed between the hamstring muscles. This study only recruited and studied males, so results cannot be expected to be the same for females. Finally, the sample size, although having met power calculations is relatively small. Further studies are required to determine the effect of variations in the angle of the support board, and for female athletes.
CONCLUSION
Among the different tested combinations of knee and hip angles, the result of this study indicate that a knee extension of 30° and hip angle of 0° during isometric NHE on a platform inclined at 30° were associated with the highest nEMG activity values in the hamstring and ES muscles. Thus, the authors’ suggest using a knee flexion angle of 30° and hip flexion angle of 0° to optimize the training stimulus for the hamstring during the isometric NHE.
CONFLICTS OF INTEREST
The authors report no conflicts of interest regarding the material discussed in the manuscript.
ACKNOWLEDGEMENTS
The authors would like to acknowledge the facilities and the assistance of the Graduate School of Sport Science, Waseda University
Submitted: September 12, 2023 CST, Accepted: January 05, 2024 CST
© The Author(s)
This is an open-access article distributed under the terms of the Creative Commons Attribution 4.0 International License (CCBY-NC-4.0). View this license’s legal deed at https://creativecommons.org/licenses/by-nc/4.0 and legal code at https://creativecommons.org/licenses/by-nc/4.0/legalcode for more information.
Effect of Variations in Knee and Hip Angles on Electromyographic Activity of the Hamstrings and Relat… International Journal of Sports Physical Therapy
The
REFERENCES
1. van Dyk N, Behan FP, Whiteley R. Including the Nordic Hamstring Exercise in injury prevention programmes halves the rate of hamstring injuries: A systematic review and meta-analysis of 8459 athletes. Br J Sports Med 2019;53(21):1362-1370. doi:10.1136/ bjsports-2018-100045
2. Cuthbert M, Ripley N, McMahon JJ, Evans M, Haff GG, Comfort P The effect of Nordic Hamstring Exercise intervention volume on eccentric strength and muscle architecture adaptations: A systematic review and meta-analyses. Sports Med 2020;50(1):83-99. doi:10.1007/s40279-019-01178-7
3. Bourne MN, Williams MD, Opar DA, Al Najjar A, Kerr GK, Shield AJ. Impact of exercise selection on hamstring muscle activation. Br J Sports Med. 2017;51(13):1021-1028. doi:10.1136/bjsports-2015-0 95739
4. Bourne MN, Duhig SJ, Timmins RG, et al. Impact of the Nordic hamstring and hip extension exercises on hamstring architecture and morphology: implications for injury prevention [published correction appears in Br J Sports Med. 2019 Mar;53(6):e2]. Br J Sports Med 2017;51(5):469-477 doi:10.1136/bjsports-2016-09613 0
5. Bourne MN, Timmins RG, Opar DA, et al. An evidence-based framework for strengthening exercises to prevent hamstring injury. Sports Med. 2018;48(2):251-267 doi:10.1007/s40279-017-0796-x
6. Timmins RG, Bourne MN, Shield AJ, Williams MD, Lorenzen C, Opar DA. Short biceps femoris fascicles and eccentric knee flexor weakness increase the risk of hamstring injury in elite football (soccer): a prospective cohort study. Br J Sports Med. 2016;50(24):1524-1535. doi:10.1136/bjsports-2015-0 95362
7. Ditroilo M, De Vito G, Delahunt E. Kinematic and electromyographic analysis of the Nordic Hamstring Exercise. J Electromyogr Kinesiol 2013;23(5):1111-1118. doi:10.1016/j.jelekin.2013.05.0 08
8. Brughelli M, Cronin J. Altering the length-tension relationship with eccentric exercise: Implications for performance and injury Sports Med 2007;37(9):807-826. doi:10.2165/00007256-20073709 0-00004
9. Šarabon N, Marušič J, Marković G, Kozinc Ž. Kinematic and electromyographic analysis of variations in Nordic hamstring exercise. PloS one. 2019;14(10):e0223437 doi:10.1371/journal.pone.0223 437
10. Soga T, Nishiumi D, Furusho A, Akiyama K, Hirose N. Effect of Different slopes of the lower leg during the Nordic Hamstring Exercise on hamstring electromyography activity. J Sports Sci Med. 2021;20(2):216-221. doi:10.52082/jssm.2021.216
11. Keerasomboon T, Soga T, Hirose N. Influence of altered knee angle on electromyographic activity of hamstring muscles between Nordic Hamstring Exercise and Nordic Hamstring Exercise with incline slope lower leg board. Int J Sports Phys Ther. 2022;17(5):832-840.
12. Hirose N, Tsuruike M, Higashihara A. Biceps femoris muscle is activated by performing Nordic Hamstring Exercise at a shallow knee flexion angle. J Sports Sci Med 2021;20(2):275-283. doi:10.52082/jss m.2021.275
13. Mohamed O, Perry J, Hislop H. Relationship between wire EMG activity, muscle length, and torque of the hamstrings. Clin Biomech. 2002;17(8):569-579. doi:10.1016/s0268-0033(02)0007 0-0
14. Marušič J, Vatovec R, Marković G, Šarabon N. Effects of eccentric training at long-muscle length on architectural and functional characteristics of the hamstrings. Scand J Med Sci Sports. 2020;30(11):2130-2142. doi:10.1111/sms.13770
15. Ono T, Higashihara A, Fukubayashi T Hamstring functions during hip-extension exercise assessed with electromyography and magnetic resonance imaging. Res Sports Med 2011;19(1):42-52. doi:10.10 80/15438627.2011.535769
16. Ono T, Okuwaki T, Fukubayashi T. Differences in activation patterns of knee flexor muscles during concentric and eccentric exercises. Res Sports Med. 2010;18(3):188-198. doi:10.1080/15438627.2010.4901 85
17 Boucher JA, Normand MC, Descarreaux M. Trunk isometric force production parameters during erector spinae muscle vibration at different frequencies. J Neuroeng Rehabil. 2013;10(1):89. doi:10.1186/1743-00 03-10-89
Effect of Variations in Knee and Hip Angles on Electromyographic Activity of the Hamstrings and Relat… International Journal of Sports Physical Therapy
The
18. Sahrmann S, Azevedo DC, Dillen LV Diagnosis and treatment of movement system impairment syndromes. Braz J Phys Ther 2017;21(6):391-399. do i:10.1016/j.bjpt.2017.08.001
19. Granata KP, Marras WS. Cost-benefit of muscle cocontraction in protecting against spinal instability Spine 2000;25(11):1398-1404. doi:10.1097/0000763 2-200006010-00012
20. Narouei S, Imai A, Akuzawa H, Hasebe K, Kaneoka K. Hip and trunk muscles activity during nordic hamstring exercise. J Exerc Rehabil. 2018;14(2):231-238. doi:10.12965//jer.1835200.600
21. Kim YR, Yoo WG. Effects of trajectory exercise using a laser pointer on electromyographic activities of the gluteus maximus and erector spinae during bridging exercises. J Phys Ther Sci 2016;28(2):632-634. doi:10.1589/jpts.28.632
22. Van Hooren B, Bosch F. Is there really an eccentric action of the hamstrings during the swing phase of high-speed running? Part I: A critical review of the literature. J Sports Sci 2017;35(23):2313-2321. doi:10.1080/02640414.2016.1266018
23. Hirose N, Tsuruike M. Differences in the electromyographic activity of the hamstring, gluteus maximus, and erector spinae muscles in a variety of kinetic changes. J Strength Cond Res. 2018;32(12):3357-3363. doi:10.1519/jsc.00000000000 02747
24. Hermens HJ, Freriks B, Disselhorst-Klug C, Rau G. Development of recommendations for SEMG sensors and sensor placement procedures. J Electromyogr Kinesiol. 2000;10(5):361-374. doi:10.1016/s1050-641 1(00)00027-4
25. Ekstrom RA, Donatelli RA, Carp KC. Electromyographic analysis of core trunk, hip, and thigh muscles during 9 rehabilitation exercises. J Orthop Sports Phys Ther 2007;37(12):754-762. doi:1 0.2519/jospt.2007.2471
26. Onishi H, Yagi R, Oyama M, Akasaka K, Ihashi K, Handa Y EMG-angle relationship of the hamstring muscles during maximum knee flexion. J Electromyogr Kinesiol. 2002;12(5):399-406. doi:10.1016/s1050-641 1(02)00033-0
27 Zuniga EN, Truong XT, Simons DG. Effects of skin electrode position on averaged electromyographic potentials. Arch Phys Med Rehabil 1970;51(5):264-272.
28. Komi PV, Buskirk ER. Reproducibility of electromyographic measurements with inserted wire electrodes and surface electrodes. Electromyography 1970;10(4):357-367.
The Effect of Variations in Knee and Hip Angles on Electromyographic Activity of the Hamstrings and Relat… International Journal of Sports Physical Therapy
Original Research
Lehecka
Effects of Verbal and Tactile Cues on Gluteal Force Production and Broad Jump Distance
BJ Lehecka1a , Terra Daniels1 , Bryson Koester1 , Wyatt Kropp1 , Matthew Reeves1 , Ryan Waterson1
1 Physical Therapy, Wichita State University
Keywords: gluteals, strength, jump, cues
https://doi.org/10.26603/001c.92904
International Journal of Sports Physical Therapy
Background
Verbal and tactile cues can increase muscle activity, force production, and kinematics. Several studies demonstrate the effects of verbal and tactile cues on upper extremity muscles, while relatively few examined lower extremity muscles, specifically the gluteals. Studies that observed changes in gluteal function from verbal and tactile cues examined muscle activity via electromyography rather than force production or functional activities such as jumping.
Purpose
The purpose of this study was to measure the effects of verbal and tactile cues on gluteal force production and broad jump distance.
Study Design
Cross-Sectional cohort
Methods
Gluteus maximus force production and broad jump distance were tested in forty-two healthy male and female university students at baseline and after verbal and tactile cues given in random order. Gluteus maximus force was measured using handheld dynamometry and reported in kilograms. Verbal cues included “push, push, push” before both tests. The examiner provided tactile cues to the gluteus maximus before force production testing, and the participant provided tactile cues to both gluteus maximus muscles before performing the broad jump. Performance on the broad jump was measured in centimeters. Descriptive statistics and test-retest reliability via Pearson correlation coefficients were calculated, differences in performance between sexes were analyzed with an independent t-test, and changes in force production and jump distance from baseline were analyzed using a one-way ANOVA.
Results
Mean gluteus maximus force production following verbal cues significantly increased (p = 0.000) by 13.48% (3.83 kg) compared to the control condition, while gluteal force production following the tactile cues was not significantly different. Broad jump distance following the verbal cues significantly increased (p = 0.000) 3.99% (7.71 cm) compared to the control condition and significantly increased (p = 0.000) by 2.95% (5.71 cm) following the tactile cues. There were no significant differences in performances between males and females. The test-retest reliability of all measurements was 0.97-0.99.
a
Corresponding Author:
B.J. Lehecka, DPT, PhD
1845 Fairmount St. Wichita, KS 67260
Phone: 316-978-6156
B, Daniels T, Koester B, Kropp W, Reeves M, Waterson R. Effects of Verbal and
E-mail: bryan.lehecka@wichita.edu Cues on Gluteal Force Production and Broad Jump Distance. IJSPT. Published online March 1, 2024:284-289. doi:10.26603/001c.92904
Tactile
Conclusion
Verbal cues significantly increased gluteus maximus force production and broad jump distance. Tactile cues significantly increased broad jump distance but had no significant effect on gluteus maximus force. These results have implications for clinical testing and athletic performance when gluteus maximus force and jump distance are concerned.
Level of Evidence
3
INTRODUCTION
Verbal and tactile cues can influence muscle activity, muscle force, and kinematics. Verbal cues, also known as auditory cues, can take the form of internal cueing (e.g. singing) or external cueing (e.g. listening to music). Tactile cues such as tapping, sustained pressure, or the application of adhesive tape, for example, are considered external cueing. Multiple authors have demonstrated increased muscle activation using verbal cues, including triceps and pectoralis major activity during the bench press,1,2 and gluteus maximus activity during prone hip extension3 and bridging.4 Increased force production appears to increase with verbal cues but has primarily been studied in the upper extremity 5‑7 Moreover, muscle force production appears to increase with increases in verbal cue volume, but few studies report the volume of the verbal cues used.5
Tactile cues also demonstrate the ability to affect muscle activity and kinematics. In combination with verbal cues, tactile cues in one study increased gluteus maximus activation during bridging from 16.8% to 33.0% of maximal voluntary contraction (MVC).4 Similar research has been conducted on the effect of verbal and tactile cues during shoulder exercises.8 Tactile cues alone, such as manual pressure to trunk muscles, can decrease thoracic kyphosis and scapular winging.9 Manual pressure to hip muscles was also shown to alter cadence and other gait parameters.10
Although authors have demonstrated the ability of verbal and tactile cues to affect muscle activity, force production, and kinematics, no research exists on the ability of such cues to affect gluteus maximus force production or broad jump distance. This information could benefit clinicians when deciding how to cue a patient to achieve desired outcomes related to force and power Therefore, the purpose of this study was to measure the effects of verbal and tactile cues on gluteal force production and broad jump distance. It was hypothesized that tactile and verbal cues would increase gluteus maximus force production and broad jump distance compared to a condition without cueing.
METHODS
Healthy subjects were recruited from a local university for this cross-sectional study Participants completed a survey to confirm their eligibility before participation. Participants completed an informed consent form and health questionnaire approved by the study institution’s Internal Review Board (IRB) before testing. Participants were excluded if
they had lower extremity surgery within the prior year; had knee, hip, back, ankle, or foot pain; or were pregnant or trying to get pregnant. A single tester performed each intervention while blinded to the measurements of each outcome.
Before data collection, participants were familiarized with the testing procedures, and performed a stationary bicycle warm-up for three minutes near 60 rotations per minute at 60 Watts as a warm-up. Participants were randomized to perform prone hip extension dynamometry testing or standing broad jump testing first, underwent one familiarization trial for each test, and performed each activity with no cue, followed by a randomized verbal or tactile cue. Participants then repeated each test with the alternate cue.
Participants were shown how to perform the standing broad jump before their practice jumps. The standing broad jump test was measured with a tape measure stabilized to the floor with tape and a carpenter’s square. A solid line of tape was placed perpendicular to the start of the tape measure to indicate the starting line for jumping. Participants were instructed to stand and jump as far forward as possible without stumbling or deviating from their landing position. Participants were instructed to swing their arms at the beginning of the jump to propel themselves forward. Measurements were taken from the starting line position to the heel landing point closest to the starting line and measured with the carpenter’s square perpendicular to the tape measure. Measurements were not used if an additional step was taken upon landing, toes extended beyond the starting line before jumping, or hands contacted the floor to brace from falling. Participants performed another trial if one of those conditions was met.
Measurements included two trials each of no cue, verbal cue, and tactile cue for a total of six trials. After every measurement, the participant was given a 30-second rest before their next attempt. Attempt scores were recorded and averaged for each testing condition. The verbal cue was provided as the participants began each jumping motion. The tactile cue involved participants striking each gluteus maximus with ipsilateral palms at moderate intensity as demonstrated by a researcher and determined by the participant three times before the start of the broad jump. The intensity of striking was meant to be strong enough to be audible (although this was not intended as an auditory cue) and potentially increase blood flow without causing discomfort. The cues used are described in Table 1
The prone hip extension test measured hip extension force production with a handheld dynamometer (FEI Lafayette Manual Muscle Tester) for two trials for each cue
Effects of Verbal and Tactile Cues on Gluteal Force Production and Broad Jump Distance International Journal of Sports Physical Therapy
No Cue: “Start standing with your toes behind the line. Begin by raising your arms overhead at the shoulder, then quickly hinge at the hips, extend the arms at the shoulder, and jump forward by extending your hips as fast as you can.”
Verbal
Cue: “Start standing with your toes behind the line. Begin by raising your arms overhead at the shoulder, then quickly hinge at the hips, extend the arms at the shoulder, and jump forward by extending your hips as fast as you can. This round I will shout “Push, push, push” once your arms extend prior to your jump.”
Tactile
Cue: “Start standing with your toes behind the line. Begin by raising your arms overhead at the shoulder, then quickly hinge at the hips, extend the arms at the shoulder, and jump forward by extending your hips as fast as you can. This round I will have you slap your gluteals three times with your hands with moderate intensity before you start your jump (demonstrated by researcher).”
No
Cue: “Keeping the knee bent to 90 degrees, slowly start lifting your leg and then lift as hard as you can, trying to break the blue strap.”
Verbal
Cue: “Keeping the knee bent to 90 degrees, slowly start lifting your leg and then lift as hard as you can, trying to break the blue strap. For this trial, once you start lifting your leg, I will shout “Push, push, push.” This will be loud, and I want you to push as hard as you can.”
Tactile
Cue: “Keeping the knee bent to 90 degrees, slowly start lifting your leg and then lift as hard as you can, trying to break the blue strap. For this trial, I will tap your gluteal muscles prior to testing them. I want you to use these muscles to lift your leg.”
condition listed in Table 2 After every measurement, the participant was given a 30-second rest before their next attempt, allowing a 1:5 work-to-rest ratio which was deemed adequate based on similar research.11 Attempt scores were recorded and then averaged for each testing condition to enhance objectivity of the data as is the practice in some studies.12 Participants were positioned prone on the testing surface with the dominant knee flexed to 90 degrees with the handheld dynamometer placed over the distal femur (Figure 1). A strap was placed over the dynamometer to assist placement. The participant was instructed to start by extending the hip slowly and then as strongly as possible towards the ceiling. These instructions were given before every trial with no cues, verbal cues, or tactile cues. The nocue trial was conducted first for each participant with one trial attempt before they completed their two trials under each condition. The verbal cue was “push, push, push” at a decibel level near 0.90 decibels once the participant initiated hip extension. The tactile cue was applied by the index, middle, and ring fingers pushing on the dominant side gluteus maximus over clothing three times, asking the participant to use that muscle to extend the hip as strong as possible.
Statistical analysis was performed using a one-way ANOVA to compare group means, an independent t-test to examine sex differences, and Pearson correlation coefficients for test-retest reliability of measurements. Data were examined for normality and the Scheffe test was used for post hoc analysis.
RESULTS
Forty-two healthy subjects (20 female, 22 male) between 18 and 35 years of age (mean age = 23.07 ± 1.40 yrs; height = 173.81 ± 8.83 cm; weight = 75.67 ± 14.54 kg) participated.
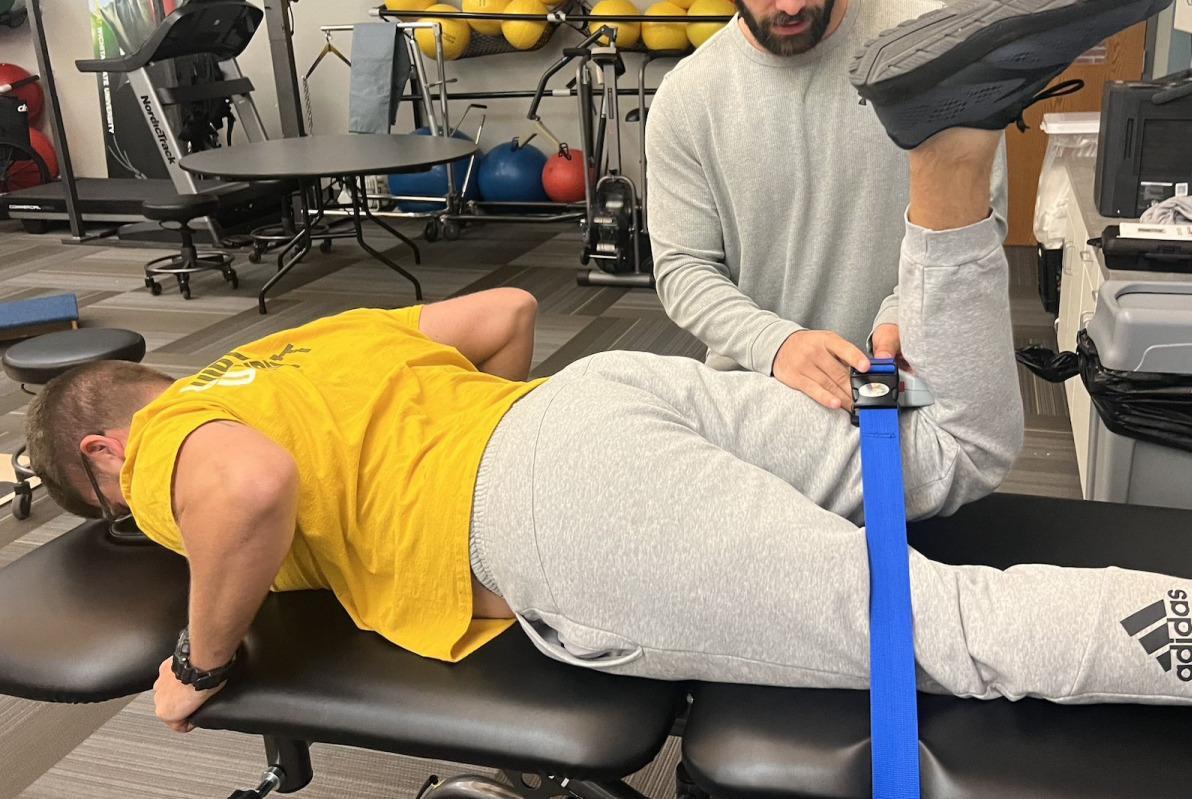
Table 3 shows participant demographics. Table 4 shows the mean results of two trials for no cue, verbal cue, and tactile cue conditions for all assessments. There was a statistically significant increase (p = 0.000) of 13.5% for verbal cues during prone hip extension compared to the no cue control condition, but no significant difference existed for tactile cues during prone hip extension. A statistically significant increase (p = 0.000) also existed among broad jump testing for verbal cues (4.0%) and tactile cues (3.0%) compared to the control condition, but not between verbal and tactile cue conditions. The significant differences in mean scores were not significantly different between males and females. The test-retest reliability for all measurements was 0.97-0.99.
Table 1. Cues for Standing Broad Jump Test
Table 2. Cues for Prone Hip Extension Test
Figure 1. Prone Hip Extension Test Position and setup
Effects of Verbal and Tactile Cues on Gluteal Force Production and Broad Jump Distance International Journal of Sports Physical Therapy
DISCUSSION
The primary purpose of this study was to determine if gluteus maximus force production and broad jump distance can be altered with verbal or tactile cueing. While authors have demonstrated the ability of verbal and tactile cues to alter muscle activity, force production, and kinematics effectively, no studies have examined the effect of such cues on gluteus maximus force production and broad jump distance.1‑10 This study’s results show that verbal and tactile cues can have statistically significantly improvements on performance. Performance, in this study, was defined by prone hip extension force production measurements and the distance of standing broad jumps. The magnitude of prone hip extension force increase seen following verbal cues (13.5%) appears both statistically and clinically relevant. However, the clinical relevance of the 3-4% increase in broad jump distance is arguably low Such an increase may be relevant to elite athletes, but that magnitude may only slightly extend beyond measurement error among recreational athletes or healthy adults. The intention was to examine common strength and power functions of the gluteus maximus. Females and males both significantly benefited from verbal cues during prone hip extension and the standing broad jump. Tactile cues significantly increased broad jump distance but did not significantly affect gluteus maximus strength. These results have implications for clinical testing of gluteus maximus force production and jump distance performance.
Multiple studies have demonstrated increased muscle activation using verbal cues, including gluteus maximus activity during prone hip extension and bridging. Lewis and Sahrmann3 concluded that cueing can alter muscle activation in healthy women during prone hip extension. Their
results demonstrated that muscle timing, activation amplitude, and movement can be affected by verbal cues. The same research suggests that using specific verbal cues to contract the gluteals or hamstrings can alter their firing pattern and improve biomechanical function. Hollman et al.4 found that gluteus maximus electromyography activity also significantly increased following verbal and tactile cueing for the supine bridge exercise. The current study focused on hip extension force production and contributions to power (as measured via the broad jump) as primary outcome measures. This measurement approach allowed the authors to examine the immediate relationship between verbal and tactile cues and the ability to generate force during hip extension and broad jump distance.
This information could benefit clinicians when deciding how to cue a patient to achieve desired outcomes related to force and power during testing or performance. Multiple studies demonstrate increased muscle activation using verbal cues, including triceps and pectoralis major activity during the bench press.13,14 In combination with verbal cues, tactile cues in one study increased gluteus maximus activation during bridging from 16.8% to 33.0% of MVC.4 The difference between muscle activation as measured in these studies, and force production as measured in the current study, is notable. An increase in muscle activation may or may not lead to a corresponding increase in force production.
Several interventions demonstrate the ability to increase broad jump distance in addition to verbal cues. Clinicians can use evidence-supported strategies from this study as well as previous research to impact an individual’s performance. The inclusion of arm motion, modification of takeoff angle, starting position of the feet, and holding light weights all appear to impact broad jump distance.15 Com-
Mean ± SD (females and males; n=42) Mean ± SD (females; n=20) Mean ± SD (males; n=22) Age (years) 23.07 ± 1.40 22.85 ± 0.99 23.27 ± 1.70 Height (cm) 173.81 ± 8.83 167.80 ± 7.79 179.27 ± 5.65 Weight (kg) 75.67 ± 14.54 64.75 ± 9.03 85.60 ± 11.06 cm = centimeters; kg = kilograms;
= standard deviation
Table 3. Participant Demographics
SD
Mean ± SD (females and males; n=42) Mean ± SD (females; n=20) Mean ± SD (males; n=22) Gluteal Strength No Cue (kg) 28.41 ± 23.67 21.19 ± 11.67 34.97 ± 22.58 Gluteal Strength Verbal Cue (kg) 32.24 ± 22.22* 25.27 ± 15.58* 38.59 ± 17.72* Gluteal Strength Tactile Cue (kg) 28.43 ± 22.61 21.69 ± 16.98 34.55 ± 18.32 Broad Jump No Cue (cm) 193.29 ± 16.22 161.18 ± 9.96 222.48 ± 11.54 Broad Jump Verbal Cue (cm) 201.00 ± 15.90* 168.23 ± 9.04* 230.79 ± 10.83* Broad Jump Tactile Cue (cm) 199.00 ± 15.72* 167.01 ± 9.13* 228.09 ± 10.89* cm = centimeters; kg = kilograms; SD = standard deviation; * = significantly different from the no cue condition at the p < 0.000 level
Table 4. Prone Hip Extension Strength and Broad Jump Distance with Verbal and Tactile Cues
Effects of Verbal and Tactile Cues on Gluteal Force Production and Broad Jump Distance International Journal of Sports Physical Therapy
pared to an average standing broad jump of 222.48 cm in the present study, another study consisting of 773 first-year police officers of similar ages demonstrated average values of 210 cm, suggesting this study’s sample may have had more jumping ability than others with the potential for a ceiling effect of the intervention.16
When looking at clinical and athletic populations, proper cueing to elicit the desired response of an athlete, patient, or client is an effective intervention to increase performance. Practical application of these cues can be used in everyday settings by providing tactile or verbal cues to increase performance or other outcomes. Improved performance followed by specific verbal instructions can be further explained by the “constrained action hypothesis.”17 The theory states that when an internal cue is used, it increases muscle activity In contrast, using an external cue increases neuromuscular coordination with decreased electromyographic activity. Therefore, appropriate cueing is important and dependent on the task. The use of tactile and external verbal cues proved effective for increasing performance in the present study An internal cue may be more suitable to increase specific muscle activity, while an external cue may be more appropriate when looking at task-oriented performance.
Fatigue was the main limitation seen in this research. Though rest periods were implemented to allow adequate recovery during testing, some participants showed signs of fatigue with testing, most notably following failed broad jump attempts. Further limitations include that only college-aged individuals were tested, the volume or exact decibel of the verbal cues was not identical during trials as they would be with the use of a recording (although re-
searchers attempted to maintain similar volume over trials), and the intensity of tactile cues was not measured and thus may have varied between trials and participants. Also, the study was designed only to analyze immediate effects of cueing; therefore, the lasting impact of such cues is unknown and may warrant future study.
CONCLUSION
The results of this study indicate that verbal and tactile cueing can improve gluteus maximus force production and broad jump distance compared to no cueing. Practitioners may be more effective in administering performance tests or delivering targeted interventions in the fields of sports medicine and physical therapy with the use of these cues. Further research into the effects of verbal and tactile cueing should include a broader population, additional outcome measures, and examining the effect on actual sports performance.
CONFLICT OF INTEREST
There are no potential conflicts of interests, including financial arrangements, organizational affiliations, or other relationships that may constitute a conflict of interest regarding the submitted work.
Submitted: June 20, 2023 CST, Accepted: January 12, 2024 CST
© The Author(s)
This is an open-access article distributed under the terms of the Creative Commons Attribution 4.0 International License (CCBY-NC-4.0). View this license’s legal deed at https://creativecommons.org/licenses/by-nc/4.0 and legal code at https://creativecommons.org/licenses/by-nc/4.0/legalcode for more information.
Effects of Verbal and Tactile Cues on Gluteal Force Production and Broad Jump Distance International Journal of Sports Physical Therapy
REFERENCES
1. Paoli A, Mancin L, Saoncella M, et al. Mind-muscle connection: effects of verbal instructions on muscle activity during bench press exercise. Eur J Transl Myol 2019;29(2). doi:10.4081/ejtm.2019.8250
2. Snyder BJ, Fry WR. Effect of verbal instruction on muscle activity during the bench press exercise. J Strength Cond Res 2012;26(9):2394-2400. doi:10.151 9/jsc.0b013e31823f8d11
3. Lewis CL, Sahrmann SA. Muscle activation and movement patterns during prone hip extension exercise in women. J Athl Train 2009;44(3):238-248. doi:10.4085/1062-6050-44.3.238
4. Hollman JH, Berling TA, Crum EO, Miller KM, Simmons BT, Youdas JW Do verbal and tactile cueing selectively alter gluteus maximus and hamstring recruitment during a supine bridging exercise in active females? A randomized controlled trial. J Sport Rehabil. 2018;27(2):138-143. doi:10.1123/jsr.2016-01 30
5. Johansson CA, Kent BE, Shepard KF. Relationship between verbal command volume and magnitude of muscle contraction. Phys Ther 1983;63(8):1260-1265. doi:10.1093/ptj/63.8.1260
6. McNair PJ, Depledge J, Brettkelly M, Stanley SN. Verbal encouragement: effects on maximum effort voluntary muscle: action. Br J Sports Med 1996;30(3):243-245. doi:10.1136/bjsm.30.3.243
7. Belkhiria C, De Marco G, Driss T. Effects of verbal encouragement on force and electromyographic activations during exercise. J Sports Med Phys Fitness 2018;58(5):750-757. doi:10.23736/s0022-4707.17.0728 2-6
8. Staker JL, Evans AJ, Jacobs LE, et al. The effect of tactile and verbal guidance during scapulothoracic exercises: An EMG and kinematic investigation. J Electromyogr Kinesiol 2022;62(102334):102334. doi:1 0.1016/j.jelekin.2019.07.004
9. Shin AR, Lee JH, Kim DE, Cynn HS. Tactile cues change trunk and scapular muscle activity, scapular winging, and thoracic kyphosis during knee push-up plus in subjects with scapular winging: The crosssectional study Medicine 2018;97(44):e12569. doi:1 0.1097/md.0000000000012569
10. Ploughman M, Shears J, Quinton S, et al. Therapists’ cues influence lower limb muscle activation and kinematics during gait training in subacute stroke. Disabil Rehabil 2017;40(26):3156-3163. doi:10.1080/09638288.2017.1 380720
11. Blazquez IN, Warren BL, O’Hanlon AM, Silvestri LR. An adequate interset rest period for strength recovery during a common isokinetic test. J Strength Cond Res 2013;27(7):1981-1987 doi:10.1519/jsc.0b01 3e3182764d70
12. Lee SY, Jo ME. Comparison of maximum voluntary isometric contraction of the biceps on various posture and respiration conditions for normalization of electromyography data. J Phys Ther Sci 2016;28(11):3007-3010. doi:10.1589/jpts.28.3007
13. Paoli A, Mancin L, Saoncella M, et al. Mindmuscle connection: effects of verbal instructions on muscle activity during bench press exercise. Eur J Transl Myol 2019;29(2). doi:10.4081/ejtm.2019.8250
14. Snyder BJ, Fry WR. Effect of verbal instruction on muscle activity during the bench press exercise. J Strength Cond Res 2012;26(9):2394-2400. doi:10.151 9/jsc.0b013e31823f8d11
15. Zhou H, Yu P, Thirupathi A, Liang M. How to improve the standing long jump performance? A mininarrative review. Appl Bionics Biomech. 2020;2020(8829036):1-5. doi:10.1155/2020/8829036
16. Štefan L, Kasović M, Culej M. Normative values for health-related physical fitness in first-year police officers. J Strength Cond Res. 2022;36(9):2530-2535. d oi:10.1519/jsc.0000000000003853
17 Wulf G, Dufek JS, Lozano L, Pettigrew C. Increased jump height and reduced EMG activity with an external focus. Hum Mov Sci 2010;29(3):440-448. do i:10.1016/j.humov.2009.11.008
Effects of Verbal and Tactile Cues on Gluteal Force Production and Broad Jump Distance International Journal of Sports Physical Therapy
Original Research
The Effect of Exercise-Induced Central Fatigue on Cervical Spine
Joint Position Error, Strength, and Endurance
Antonio Vintimilla1a , Troy Hooper, C. Roger James, Ho Cheng Lu, Karthick Natesan, Jeegisha Kapila, Phil Sizer 1 Rehabilitation Sciences, Texas Tech University Health Sciences Center
Keywords: concussion, neck pain, motor control, fatigue
https://doi.org/10.26603/001c.92703
International Journal of Sports Physical Therapy
Background
Fatigue is common in sports, impairing performance and increasing injury risk, yet little is known regarding fatigue and concussion. Impaired neck neuromuscular function may contribute to concussion at baseline, where central fatigue may further impair neck function resulting in increased concussion risk. These effects may be magnified in athletes with a history of concussion.
Purpose
To determine the effect of exercise induced central fatigue on neck joint position error, strength, and endurance in healthy subjects and those with a history of concussion. The investigators hypothesized that EICF would have a negative effect on all variables.
Study Design
Healthy subjects were examined using a single factor, within-subjects repeated measures design. Concussion history subjects were examined using a single-subject design.
Methods
Nineteen healthy subjects and five subjects with a history of concussion were recruited for the study. Cervical joint position error, muscle strength, and neck flexor endurance were tested before and after exercise induced fatigue.
Results
There was a significant increase in constant (p = 0.0027) and absolute joint position error (JPE) (p < 0.001); decrease in neck flexor endurance (p < 0.001); and decrease neck strength into cervical flexion (p = 0.01) in healthy subjects following fatigue. Among concussion history subjects, five demonstrated a significant increase in absolute and constant JPE (p < 0.05); four demonstrated a significant decrease in neck flexor endurance (p < 0.05); one in neck flexion muscle strength (p < 0.05); and three in neck extension and rotation muscle strength (p < 0.05) following fatigue.
Conclusions
Cervical neuromuscular function deteriorated following fatigue in healthy subjects. Resulting impairments may affect force alterations in cervical control, potentially increasing concussion risk. Concussion history subjects descriptively demonstrated similar results, however further research should examine formal comparisons involving subjects with and without concussion history.
Level of Evidence
3b
Corresponding author: Antonio Vintimilla, PT, DPT, PhD(c)
Mailing Address: 3601 4th St, Lubbock, TX, 79430
Email Address: antoniovintimilla94@gmail.com
Phone: (682) 561-7588
a
A,
T, James CR, et al. The Effect of Exercise-Induced Central Fatigue on Cervical Spine Joint Position Error, Strength, and Endurance. IJSPT. Published online March 1, 2024:290-300. doi:10.26603/001c.92703
Vintimilla
Hooper
INTRODUCTION
Fatigue is a complex physiological state that often results in impaired bodily function.1,2 Fatigue has various etiologies with one of the most common being physical exercise, otherwise known as exertion fatigue.2,3 There are two primary fatigue types which result from exertion: peripheral and central. Peripheral fatigue pertains to that involving the peripheral nervous system, particularly the neuromuscular junction, and the working skeletal muscle. It is thought to be isolated to working muscles with minimal distal effects, though it may put the involved tissue at increased injury risk.4
Central fatigue arises from the central nervous system with sustained exercise, potentially serving as protection from catastrophic homeostatic disruption.1,5 It is generally thought of as whole-body cardiovascular fatigue, also known as exercise-induced central fatigue (EICF). In a centrally fatigued state, there is a net reduction in spinal mediated reflexes, producing an increased difficulty activating motor neurons and a decline in motor unit firing rates. These changes are facilitated by presynaptic modulation and autogenic inhibition of muscle spindle, Golgi tendon organ, and small diameter muscle-afferent inputs.1,6 In athletes, these effects are accompanied by the concern of diminished (worse) athletic performance, as several authors have reported balance, landing, throwing, and running impairments in athletes in a fatigued state, among others.7‑9
Another major component of EICF is psychological, or mental fatigue. While not strictly exertion induced, mental fatigue plays a significant role in the physical impairments seen with EICF, including central components such as cognitive processing, contributing to mental fatigue onset with sustained exercise.2,10 Mental fatigue does not directly affect maximal voluntary muscle contraction. Instead, it appears to alter the individual’s perception of an expended effort, which may affect maximal voluntary muscle contraction.11,12 Ultimately, task failure with EICF is a complex multisystem phenomenon.
At the mercy of the previously described physiological and physical manifestations, EICF is accepted as an increased risk factor for numerous different injuries.13,14 However, the effect of EICF on the head and neck region is not well understood. This interaction is important due to potential implications for head injury, particularly concussion. In sport, concussion incidence tends to increase in the second half of the season and the second half of single sporting events, yet evidence explaining why this occurs is unavailable.15,16 A study performed on professional hockey players found that increased play time over a game correlated with increased concussion incidence, suggesting in-game fatigue may be a cause.17 However, the question remains, why would fatigue increase concussion incidence? One prospective explanation involves aspects of performance of the head and neck.
Impaired cervical spine (CS) proprioception, muscle strength, and endurance increase the risk of suffering a concussion.18‑20 Fatigue may further compromise the CS and increase concussion risk. Among available evidence,
central fatigue has been found to increase CS angle reproduction error in healthy adults.21 Fatigue may reveal these subclinical deficiencies that could contribute to undetected concussion risk, particularly in the head and neck, affecting athletes’ ability to sufficiently mitigate forces on structures within the region. This effect may be more pronounced in athletes with a history of concussions, as they may have long-lasting neurophysiological deficits.22‑24
Therefore, the purpose of this study was to determine the effect of exercise induced central fatigue on neck joint position error, strength, and endurance in healthy subjects and those with a history of concussion. The investigators hypothesized that EICF would have a negative effect on all variables. This analysis will inform understanding of head and neck functional abilities in a fatigued state, as well as the impact on concussion risk and injury prevention strategies.
METHODS
This study was conducted in two phases. Phase 1 involved CS performance testing in healthy subjects pre- and postfatigue. Phase 2 examined CS performance in a small sample of subjects with concussion history pre- and post-fatigue. Both groups read and signed an informed consent approved by the associated IRB prior to participation.
PHASE 1
EXPERIMENTAL DESIGN
Group testing was performed using a single factor, withinsubjects repeated measures design. Data were collected pre- and post-fatigue to determine differences in JPE, neck flexor endurance, and CS muscle strength.
SUBJECTS
Subjects were healthy males and females between 18 and 50 years of age. Exclusion criteria were adapted based on absolute contraindications outlined in American College of Sports Medicine Guidelines for Exercise Testing and Prescription as follows: (1) Pregnancy by self-report; (2) Physical disability with limited ability to participate in the testing; or (3) Any of the following conditions diagnosed by a health care provider and conveyed by subject self-report that would have prevented safe and adequate cardiovascular fatigue testing: (a) Hypertension; (b) Circulatory condition; (c) Cardiac condition; (d) Pulmonary condition; (e) Thyroid condition; or (f) History of cerebrovascular accident.25 Additional exclusion criteria included: (1) History of concussion within the prior year; (2) Current neck pain that required health care intervention or that significantly impaired daily functional activities; (3) Active headache or migraine that required health care intervention or that significantly impaired daily functional activities; or (4) History of head or neck surgery
Exercise-Induced Central
on Cervical Spine Joint Position Error, Strength, and Endura… International Journal of Sports Physical Therapy
The
Effect of
Fatigue
EXPERIMENTAL PROCEDURE
All testing was performed by the same investigator This investigator had previously demonstrated strong intra-rater reliability with all testing procedures. A second investigator recorded the data values, blinding the first investigator to the results. Testing began with JPE measurement in order to avoid the effects of neck muscle fatigue. The strength and endurance testing order was randomized to avoid an order effect.
Joint position error was tested by active rotation angle reproduction.26,27 Subjects were seated in a chair, wearing a disposable eye cover They were instructed to sit as upright as possible with their hands positioned in their lap. Their knees were placed at 90 degrees of flexion and their feet were positioned on specific markings on the ground. Subjects self-determined their neutral head position and were then passively moved to 20 degrees of cervical rotation to either side, so that this position would serve as a starting point for each rotation direction, respectively The compass app was “zeroed” at that 20-degree position. Subjects were instructed to memorize this position and replicate it following active movement into maximal cervical rotation in each direction. Subjects were asked to determine when they feel they had relocated the 20-degree angle position, and the actual position was recorded in degrees. Following familiarization, subjects performed one bilateral rotation practice trial and six bilateral testing trials.
Two different error scores were obtained from the raw JPE values: absolute error and constant error. Absolute error is defined as the mean of the total deviation from the starting point over the trials, ignoring positive (overshoot) and negative (undershoot) values. This value represents the overall magnitude of error among the trials without considering the direction. Constant error is defined as the mean of the raw error over the trials incorporating the positive and negative values in each trial. This value represents the average magnitude and, unlike absolute error, uses the direction of the error. Studies suggest that a combination of absolute and constant error is best suited for measuring JPE.28 These values are derived from the following equations:
Absolute Error = (absolute of raw error trial 1) + (trial 2)… + (trial 6)/6
Constant Error = (raw error trial 1) + (trial 2)… + (trial 6)/6
Neck endurance measurements were assessed via the neck flexor endurance test.29,30 For testing, subjects assumed a supine hook lying position with their hands on their abdomen. Subjects were then instructed to retract their chin and lift their head 2.5cm off the plinth while maintaining their chin retraction. The investigator drew a line across two adjacent skin folds on the subject’s anterolateral neck, then placed his index and middle fingers in a stacked position below the subject’s most posterior occiput. Subjects were asked to relax and rest their head on the investigator’s hand, and then maintain contact during the test procedure. Once they lifted the head high enough to unload the head’s weight from the investigator’s fingers while continuing to maintain light contact with the same
fingers, the investigator moved those fingers side to side to provide tactile cuing for optimal positioning. Subjects were instructed to maintain their lifted position as long as possible. The test was terminated when any one of the following occurred for more than one second: (1) the drawn line edges no longer approximated each other; (2) the subject’s head rested on the investigator’s fingers; (3) subjects raised their head enough to no longer contact the investigator’s fingers. Additionally, the test was terminated if subjects were unwilling to continue. Test duration was recorded in seconds. All subjects performed one practice trial followed by oneminute rest. Next, all subjects performed three recorded trials with one-minute rest between each trial.
Measurements for CS muscle strength were assessed via a hand-held dynamometer (HHD; MicroFet2, Hoggan Scientific, Inc; Salt Lake City, UT, USA).31 Subjects were seated and restrained at the trunk and shoulder levels to reduce accessory trunk movement. One test trial included a strength test into cervical flexion, extension, and bilateral rotation. The investigator placed the HHD at the subject’s forehead for flexion, occiput for extension and lower jaw for rotation. Subjects were instructed to clench their jaw during rotation. They were instructed to perform maximal voluntary isometric contractions into each movement direction and hold each contraction for 5 seconds. All subjects performed one practice trial followed by 10-seconds rest. Next, all subjects performed three recorded trials with 10-seconds rest in-between each trial. Mean values were used for statistical analysis.
FATIGUE PROTOCOL
Following baseline testing, subjects began a modified Bruce treadmill test to induce central fatigue. The protocol was conducted as outlined in the American College of Sports Medicine Guidelines for Exercise Testing and Prescription.25 Subjects were not tested for the purpose of cardiovascular assessment and therefore were not monitored via electrocardiogram. The test consisted of six 3-minute stages as follows:
1 – 1.7mph, 10 %GR
2 – 2.5mph, 12 %GR
3 – 3.4mph, 14 %GR
4 – 4.2mph, 16 %GR
5 – 5.0mph, 18 %GR
6 – 5.5mph, 20 %GR
Subjects were instructed to continue each test trial until they: (1) reached fatigue and could no longer continue; (2) reached 85% of their age predicated HRmax (whichever came first); or (3) desired to stop. Heart rate values were collected continuously using a chest monitor Blood pressure values were collected at baseline and following protocol completion. Subjects were assumed to be centrally fatigued following each protocol completion.
To establish central fatigue effects on sensorimotor control, post-fatigue JPE, neck flexor endurance, and CS muscle strength measurements were conducted using the previously described procedures. Following the first fatigue event, JPE testing was performed. Subjects then returned
The Effect of Exercise-Induced Central Fatigue on Cervical Spine Joint Position Error, Strength, and Endura… International Journal of Sports Physical Therapy
* Significant p < 0.05, all others p > 0.05
to the treadmill and began the Bruce treadmill test one level below the previously terminated level to avoid recovery. Following the second fatigue event, either endurance or strength testing was performed in the same random order as in the pre-fatigue protocol. Subsequently, subjects again returned to the treadmill and began the Bruce Treadmill test one level below the previously terminated level. Following the last fatigue event, subjects performed the remaining out of strength and endurance testing.
PHASE 2
EXPERIMENTAL DESIGN
Phase-2 data were not used to test statistical hypotheses. This exploratory component used a multiple single-subject design to examine how a small sample of subjects with concussion history individually responded to the same experimental parameters.
SUBJECTS
Inclusion and exclusion criteria for Phase-2 subjects were the same as Phase-1. However, Phase-2 subjects’ inclusion criteria required a history of at least three concussions within their lifetime. Subjects self-reported that they could participate in high-intensity exercise without symptoms, indicating that they had recovered from any previous concussion.
EXPERIMENTAL PROCEDURE
Preparatory procedures, baseline testing, the fatigue protocol, and post-fatigue testing were conducted in the same manner as group testing in Phase-1.
STATISTICAL ANALYSIS
Data were analyzed using R (R Core Team, 3.6.1, Vienna, Austria) and RStudio Team (2020, Boston, MA).
PHASE 1
Mean, median, standard deviation, 95%CI, skewness, and kurtosis were used to describe central tendency and dispersion. Shapiro Wilk test statistic and probability, density plotting, as well as skewness and kurtosis values were used to assess normality
A prospective power analysis estimated 19 subjects to obtain a desired power of 80% (1-β=0.80) at a significance level of α= .05 (G-Power 3.1.7.9, Kiel, Germany), and a moderate effect size (Cohen’s d = 0.5). A paired t-test was used to determine differences in values for JPE, neck flexor endurance, and CS muscle strength before and after the fatiguing protocol. All parametric assumptions were satisfied. Bonferroni correction was used for JPE and strength variables post-hoc to correct for multiple comparisons and reduce the likelihood of a Type-1 error 32 Cohens d effect sizes are also reported.
PHASE 2
Concussion history subjects’ data were analyzed using plots and mean, standard deviation, and percent change values. Analysis of mean differences was assessed using the two standard deviation band method. Two consecutive fatigue condition data points outside of the before fatigue conditions’ two standard deviation band was considered a statistically significant difference (p < 0.05).32
RESULTS
PHASE-1
The healthy group consisted of nine males and ten females with an average age of 32 years (SD = 8), average height of 1.7m (SD = 0.12), and average weight of 74.1kg (SD = 16.2). Mean values for the healthy group are summarized in Table 1.
JOINT POSITION ERROR
There was a significant increase in constant (p = 0.003, Cohen’s d = 0.35) and absolute (p < 0.001, Cohen’s d = 0.47) JPE with fatigue (Figure 1). Healthy subjects demonstrated a 20.7% and 21.8% increase in constant and absolute error with fatigue, respectively. Additionally, increased variance for constant JPE was observed post-fatigue, suggesting less accuracy and precision overall. This post-fatigue error was comprised of an increase in either under- or over-shooting for each subject, where overshooting occurred more frequently overall.
NECK FLEXOR ENDURANCE
There was a significant decrease in neck flexor endurance times with fatigue (p < 0.001, Cohen’s d = 0.95) (Figure
State Constant JPE Absolute JPE Neck Flexor Endurance CS Flexion strength CS Extension Strength CS Rotation Strength PreFatigue 7.3°±4.1* 8°±3.6* 35.5s±10.4* 141N±34* 209N±76 124N±27 PostFatigue 8.9°±4.5* 9.8°±3.9* 26.8s±7.6* 135N±28* 210N±88 119N±30
Table 1. Healthy group results
The Effect of Exercise-Induced Central Fatigue on Cervical Spine Joint Position Error, Strength, and Endura… International Journal of Sports Physical Therapy
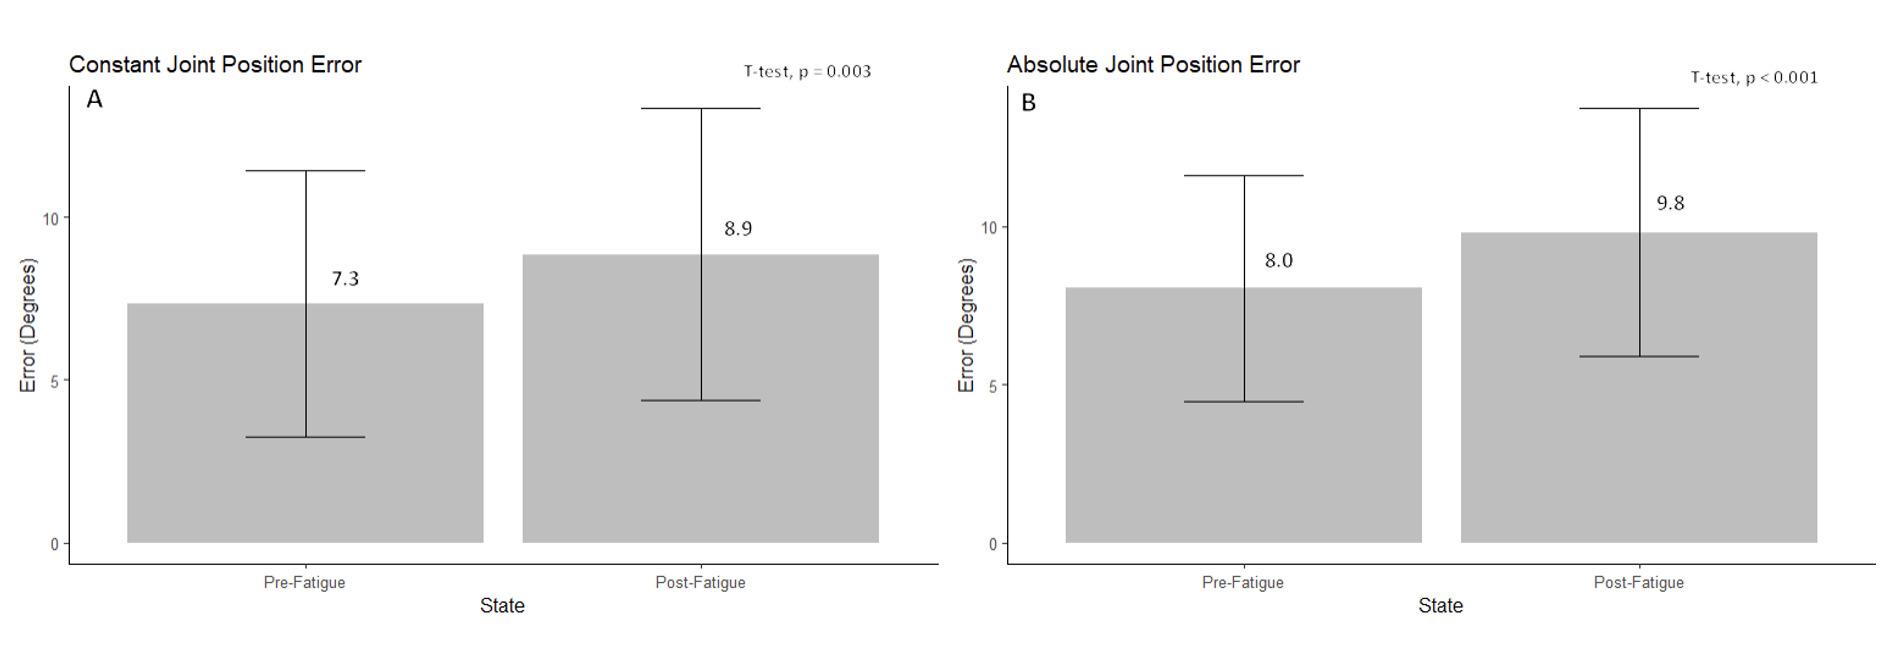
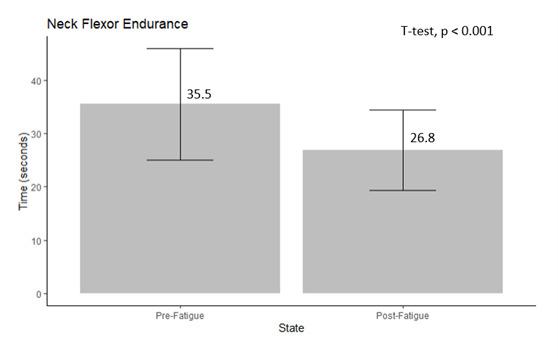
2). Subjects demonstrated a 24.5% decrease in endurance times with fatigue.
MUSCLE STRENGTH
There was a significant decrease in CS muscle strength into flexion (p = 0.01, Cohen’s d = 0.21) with fatigue. There was no significant strength difference into extension (p = 0.9) or rotation (p = 0.136) with fatigue (Figure 3). Subjects demonstrated a 4.7%, 0%, and 3.9% decrease in force production for flexion, extension, and rotation with fatigue, respectively
PHASE 2
Phase-2 consisted of five subjects with a history of at least three concussions within the lifetime. Subject demographics are summarized in Table 2.
JOINT POSITION ERROR
Post-fatigue error was amplified in subjects with concussion history There was a significant increase in constant JPE overall, where 4/5 subjects demonstrated a significant increase, while 1/5 subjects demonstrated a significant decrease in constant JPE with fatigue. Five of five subjects demonstrated a significant increase (p < 0.05) in absolute JPE with fatigue. Subjects with concussion history overall demonstrated a 30.2% and 50.2% increase in mean constant and absolute error, respectively Moreover, subjects with concussion history demonstrated even greater variance following fatigue. Undershooting was observed more often than in healthy subjects, however overshooting was still observed more often overall. All concussion history subjects JPE trials have been nested together along with their mean for visualization (Figure 4). Subjects were previously individually analyzed where two consecutive data points outside of the two-standard deviation band was considered statistically significant (p < 0.05).
Figure 1. Box plots representing mean constant JPE (A) and mean absolute JPE (B) in degrees, in healthy subjects pre- and post-fatigue.
Figure 2. Box plot representing mean neck flexor endurance times in seconds, in healthy subjects pre- and postfatigue.
The Effect of Exercise-Induced Central Fatigue on Cervical Spine Joint Position Error, Strength, and Endura… International Journal of Sports Physical Therapy
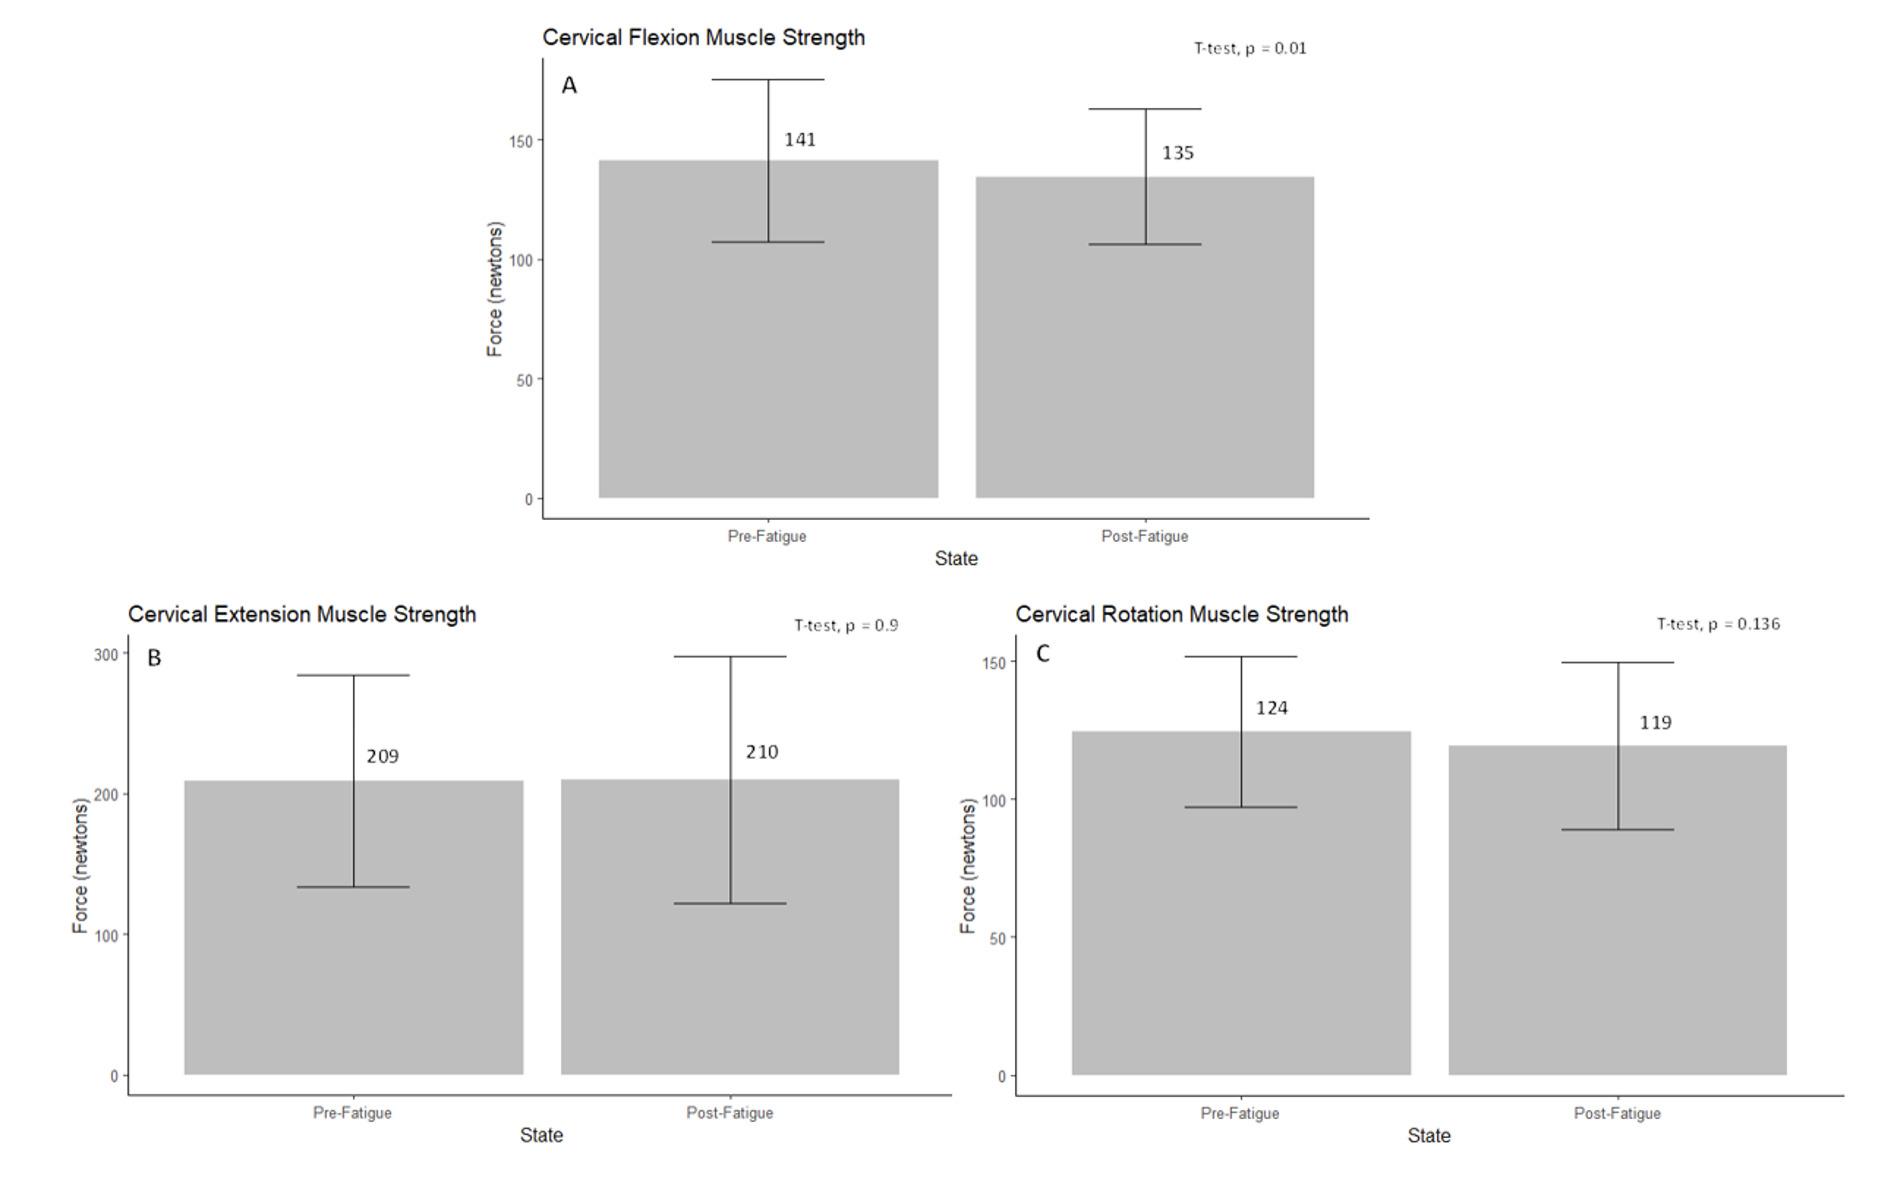
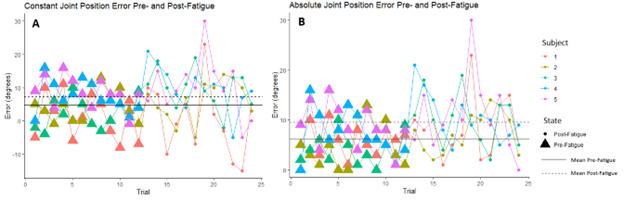 Figure 3. Box plots representing mean cervical flexion (A) extension (B), and rotation (C) muscle strength in Newtons, in healthy subjects pre- and post-fatigue.
Subject Age(years) Sex Height(m) Weight(kg) # concussions Date of last concussion 1 42 Male 1.85 88.5 12 July 2021 2 25 Male 1.83 94.8 7 February 2020 3 23 Female 1.5 58.9 6 2016 4 28 Male 1.78 86.6 8 2011 5 44 Male 1.57 65.3 3 2011
Table 2. Concussion History Subject Demographics
The Effect of Exercise-Induced Central Fatigue on Cervical Spine Joint Position Error, Strength, and Endura… International Journal of Sports Physical Therapy
Figure 4. Scatter plots representing all constant JPE (A) and absolute JPE (B) trials in degrees, in all concussion history subjects pre- and post-fatigue.
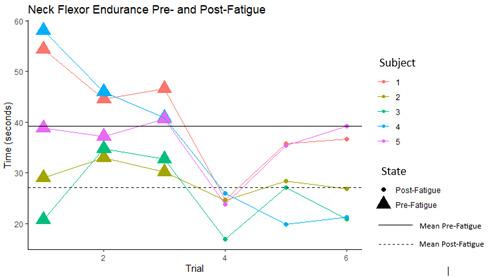
NECK FLEXOR ENDURANCE
Neck flexor endurance impairments were amplified in subjects with concussion history. Four of five subjects demonstrated a significant decrease (p < 0.05) in neck flexor endurance following fatigue. Subjects with concussion history overall demonstrated a 44% decrease in mean endurance time overall. All concussion history subjects neck flexor endurance test (NFET) trials have been nested together along with their mean for visualization (Figure 5). Subjects were previously individually analyzed where two consecutive data points outside of the two-standard deviation band is statistically significant (p < 0.05).
MUSCLE STRENGTH
Cervical muscle strength results were mixed in subjects with concussion history One of five subjects demonstrated a significant decrease in CS muscle strength into flexion with fatigue. Two of five subjects demonstrated a significant decrease, while 1/5 subjects demonstrated a significant increase in CS muscle strength into extension with fatigue. Three of five subjects demonstrated a significant decrease, while 1/5 subjects demonstrated a significant increase (p > 0.05) in CS muscle strength into rotation with fatigue. Subjects with concussion history overall demonstrated a 7.6%, 1.9% and 6.6% decrease in mean flexion, extension, and rotation force production, respectively All concussion history subjects strength trials for flexion, extension, and rotation have been nested together with their mean for visualization (Figure 6). Subjects were previously individually analyzed where two consecutive data points outside of the two-standard deviation band is statistically significant (p < 0.05).
DISCUSSION
The purpose of this study was to determine the effect of exercise-induced central fatigue on cervical joint position error, muscular strength, and neck flexor endurance in healthy subjects. Additionally, a multiple single-subject design was used to determine how a small sample of subjects with concussion history responded to the same experimental parameters. Subjects were tested before and after a centrally fatiguing protocol. Central fatigue arises from the central nervous system and, unlike peripheral fatigue, produces widespread physiological effects.1,2 Central fatigue effects on the head-and-neck however, are not well understood. This interaction is important due to potential implications in concussion incidence and recovery In a centrally fatigued state, systemic physiological functions are impaired, potentially compromising head-and-neck function and increasing concussion risk.1,2
Cervical spine proprioception, strength, and endurance have been previously examined with respect to their role in concussion and have been found as significant concussion predictors in males and females.18‑20 Increased CS muscle strength is associated with an attenuated kinematic response to external forces applied to the head. Eckner et al. proposed increased CS strength to be a positive and modifiable risk factor for concussion.18 Farley et al. concluded that for every 10% increase in gross cervical rotation error there was a 5% increase in concussion rate among professional rugby players.19 Baker et al.33 found that neck flexor endurance was not predictive of increased concussion injury risk. However, preseason neck flexor endurance test times were 2.9 seconds lower in athletes who ended up concussed than those who did not. Additionally, they found that neck flexor endurance times improved predictably with concussion recovery in concussed athletes.33
While there is no direct evidence linking central fatigue to increased concussion risk, it is possible that central fa-
Figure 5. Scatter plot representing all neck flexor endurance trial times in seconds, in all concussion history subjects pre- and post-fatigue.
Effect of Exercise-Induced Central Fatigue on Cervical Spine Joint Position Error, Strength, and Endura… International Journal of Sports Physical Therapy
The
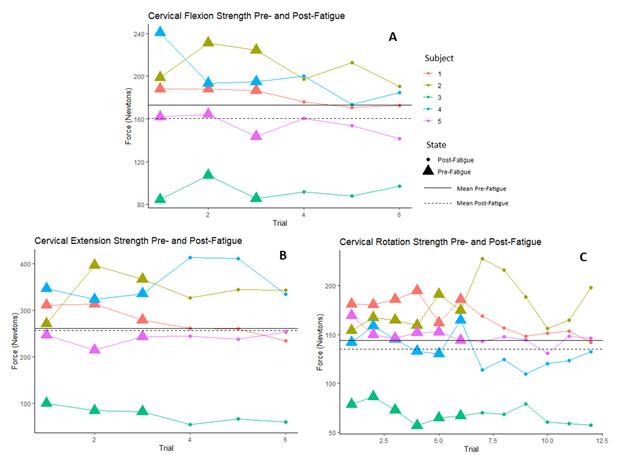
tigue could impair head-and-neck function and, therefore, an athlete’s ability to respond quickly and effectively to collisions or impacts, leading to a higher likelihood of suffering a concussion. As a preliminary measure that could inform a person’s risk, a Bruce Protocol was used to confidently achieve 85% of their age-predicted maximal cardiovascular output and measure the predetermined variables in the subjects before and during a centrally fatigued state.25
Healthy subjects demonstrated a significant increase in constant and absolute JPE and a significant decrease in neck flexor endurance following central fatigue. Following fatigue, mean constant JPE was 8.9 degrees and absolute JPE was 9.8 degrees, surpassing typical JPE values of 2-5 degrees reported in the literature.28 These results are consistent with Okhravi et al., who found that general fatigue increased repositioning error of the head and neck in healthy subjects.21 All subjects with concussion history individually demonstrated a significant increase in error, where mean constant (7.3 degrees) and absolute (9.6 degrees) JPE postfatigue surpassed typical JPE values reported in the literature as well.21
Despite an even distribution of males and females, the healthy group demonstrated an average pre-fatigue NFET time of 35.5 seconds, consistent with normative values for males reported in the literature (35.57±10.43 seconds).30 Following fatigue, the group mean fell to 26.8 seconds, below normative values for both males (35.57±10.43 seconds)
and females (31.86±8.53 seconds) reported in the literature.30 Subjects with concussion history demonstrated an average NFET time of 27.1 seconds post-fatigue, below normative values for females reported in the literature despite consisting of only one female. Future research should involve a full group of subjects with concussion history to allow for formal comparisons.
Subjects across both groups demonstrated variable strength testing results. In healthy subjects, only a significant decrease in CS flexion strength was observed, accompanied by minimal, nonsignificant decreased changes across all other directions. There is no published physiological mechanism that could explain why CS flexion strength would decrease without significant changes in extension or rotation. Concussion incidence typically involves rotational impact forces, however no directional preferences in strength have been documented.18,20 Additionally, there is minimal data specifically addressing the effects of central fatigue on neck strength outcomes. The observed differences could be explained by chance or undetected error in methodology Subjects with concussion history demonstrated minimal deficits overall. Subjects with a history of more frequent concussion incidence demonstrated significance across more test directions versus those with fewer concussions, however no conclusions can be drawn. Future research should further examine strength responses to EICF using more rigorous strength testing measures to better capture fatiguability
Figure 6. Scatter plot representing all cervical flexion (A), extension (B), and rotation (C) cervical muscle strength trials in Newtons, in all concussion history subjects pre- and post-fatigue.
The Effect of Exercise-Induced Central Fatigue on Cervical Spine Joint Position Error, Strength, and Endura… International Journal of Sports Physical Therapy
Due to drastic group differences inferential statistics were not conducted between healthy subjects and those who had sustained concussion. Percent change for both groups can be found in Table 3, however, comparisons cannot be made or result in any inferential conclusions. Among subjects with concussion history, concussion volume may affect fatigue responses, as subjects with a greater number of concussions demonstrated more statistically significant variables than those with fewer.
Previous authors have found impairments in gaze stability, sleep quality, and gait control long after concussion.34, 35 Additionally, residual cognitive and linguistic deficits have been reported.36,37 Other investigators have discovered that athletes with concussion history have greater risk of presenting with more varied symptoms and higher symptom severity scores upon subsequent concussion.38 Future research should investigate whether central fatigue amplifies these existing impairments in those with concussion history, potentially increasing injury risk. Moreover, future research should examine fatigue effects on head-and-neck kinematics in the same subject sample.
This study had several limitations. Subjects included healthy subjects and a preliminary sample of subjects with a history of concussion to explore whether the measured parameters were influenced by the fatigue protocol. However, a full concussion history cohort suitable for inferential analysis could incorporate mixed models and allow comparisons between and within the two groups would be ideal in the future. Furthermore, the HHD used for strength testing only recorded the highest value of force detected. This instrument would not provide information regarding muscle activation and motor control. During testing, it was observed that both groups experienced greater difficulty performing each contraction, despite minimal quantitative differences. These observations suggest that an alternate
tool, such as electromyography, may be well suited for further assessing muscle performance.39 Lastly, there was no head-and-neck kinematic assessment. Kinematic variables would provide a more in-depth functional assessment of fatigue effects on the head and neck and their implication in concussion.40
CONCLUSIONS
The current results suggest CS proprioception, strength, and endurance are impaired following central fatigue in healthy individuals. These effects may be more pronounced in those with a history of concussion, however further research is warranted. Athletes may be at an increased risk for injury occurrence and severity in a centrally fatigued state. Future studies should address the effect of exerciseinduced central fatigue on head-and-neck kinematics and sensorimotor control, comparing a cohort of both healthy and previously concussed individuals.
CONFLICTS OF INTEREST
The authors report no conflicts of interest.
For inquires including access to additional data, contact antoniovintimilla94@gmail.com
Submitted: October 09, 2023 CST, Accepted: January 05, 2024 CST
© The Author(s)
This is an open-access article distributed under the terms of the Creative Commons Attribution 4.0 International License (CCBY-NC-4.0). View this license’s legal deed at https://creativecommons.org/licenses/by-nc/4.0 and legal code at https://creativecommons.org/licenses/by-nc/4.0/legalcode for more information.
Variable %Change – Healthy %Change – Concussion History Constant Joint Position Error +21% +30% Absolute Joint Position Error +22% +50% Neck Flexor Endurance -24% -44% Flexion Strength -5% -8% Extension Strength 0% -2% Rotation Strength -4% -7%
Table 3. Healthy and concussion history subject percent changes
The Effect of Exercise-Induced Central Fatigue on Cervical Spine Joint Position Error, Strength, and Endura… International Journal of Sports Physical Therapy
REFERENCES
1. Gandevia SC. Spinal and supraspinal factors in human muscle fatigue. Physiol Rev 2001;81(4):1725-1789. doi:10.1152/physrev.2001.8 1.4.1725
2. Tornero-Aguilera JF, Jimenez-Morcillo J, RubioZarapuz A, Clemente-Suárez VJ. Central and peripheral fatigue in physical exercise explained: A narrative review Int J Env Res Public Health 2022;19(7):3909. doi:10.3390/ijerph19073909
3. Bestwick-Stevenson T, Toone R, Neupert E, Edwards K, Kluzek S. Assessment of fatigue and recovery in sport: narrative review. Int J Sports Med. 2022;43(14):1151-1162. doi:10.1055/a-1834-7177
4. Carriker CR. Components of fatigue: Mind and body. J Strength Condit Res. 2017;31(11):3170-3176. d oi:10.1519/jsc.0000000000002088
5. Wan J, Qin Z, Wang P, Sun Y, Liu X. Muscle fatigue: General understanding and treatment. Exp Mol Med 2017;49(10):e384. doi:10.1038/emm.2017.194
6. Carroll TJ, Taylor JL, Gandevia SC. Recovery of central and peripheral neuromuscular fatigue after exercise. J Appl Physiol. 2017;122(5):1068-1076. doi:1 0.1152/japplphysiol.00775.2016
7 Andrade MS, de Carvalho Koffes F, Benedito-Silva AA, da Silva AC, de Lira CAB. Effect of fatigue caused by a simulated handball game on ball throwing velocity, shoulder muscle strength and balance ratio: A prospective study. BMC Sports Sci Med Rehabil. 2016;8(1):13. doi:10.1186/s13102-016-0038-9
8. Kozinc Ž, Trajković N, Smajla D, Šarabon N. The effect of fatigue on single-leg postural sway and its transient characteristics in healthy young adults. Front Physiol 2021;12:720905. doi:10.3389/fphys.202 1.720905
9. Winter S, Gordon S, Watt K. Effects of fatigue on kinematics and kinetics during overground running: A systematic review. J Sports Med Phys Fitness. 2017;57(6). doi:10.23736/s0022-4707.16.06339-8
10. Simoneau M, Bégin F, Teasdale N. The effects of moderate fatigue on dynamic balance control and attentional demands. J NeuroEng Rehabil. 2006;3(1):22. doi:10.1186/1743-0003-3-22
11. Meeusen R, Van Cutsem J, Roelands B. Endurance exercise-induced and mental fatigue and the brain. Exper Physiol 2021;106(12):2294-2298. doi:10.1113/e p088186
12. Slimani M, Znazen H, Bragazzi N, Zguira M, Tod D The effect of mental fatigue on cognitive and aerobic performance in adolescent active endurance athletes: Insights from a randomized counterbalanced, cross-over trial. J Clin Med 2018;7(12):510. doi:10.3390/jcm7120510
13. García-Luna MA, Cortell-Tormo JM, García-Jaén M, Ortega-Navarro M, Tortosa-Martínez J. Acute effects of ACL injury-prevention warm-up and soccerspecific fatigue protocol on dynamic knee valgus in youth male soccer players. Int J Env Res Public Health 2020;17(15):5608. doi:10.3390/ijerph17155608
14. Liveris N, Tsarbou C, Tsimeas PD, Papgeorgiou G, Xergia SA, Tsiokanos A. Evaluating the effects of match-induced fatigue on landing ability; the case of the basketball game. Int J Exerc Sci 2021;14(6):768-778.
15. Mc Fie S, Brown J, Hendricks S, et al. Incidence and factors associated with concussion injuries at the 2011 to 2014 South African rugbyunion youth week tournaments. Clin J Sport Med. 2016;26(5):398-404. d oi:10.1097/jsm.0000000000000276
16. Teramoto M, Cushman DM, Cross CL, Curtiss HM, Willick SE. Game schedules and rate of concussions in the National Football League. Orthop J Sports Med 2017;5(11):2325967117740862. doi:10.1177/23259671 17740862
17. Stevens ST, Lassonde M, de Beaumont L, Paul Keenan J. In-game fatigue influences concussions in National Hockey League players. Res Sports Med. 2008;16(1):68-74. doi:10.1080/15438620701879020
18. Eckner JT, Oh YK, Joshi MS, Richardson JK, Ashton-Miller JA. Effect of neck muscle strength and anticipatory cervical muscle activation on the kinematic response of the head to impulsive loads. Am J Sports Med. 2014;42(3):566-576. doi:10.1177/03 63546513517869
19. Farley T, Barry E, Bester K, et al. Poor cervical proprioception as a risk factor for concussion in professional male rugby union players. Phys Ther Sport 2022;55:211-217 doi:10.1016/j.ptsp.2022.03.01 0
20. Streifer M, Brown AM, Porfido T, Anderson EZ, Buckman JF, Esopenko C. The potential role of the cervical spine in sports-related concussion: Clinical perspectives and considerations for risk reduction. J Orthop Sports Phys Ther 2019;49(3):202-208. doi:10.2 519/jospt.2019.8582
The Effect of Exercise-Induced Central Fatigue on Cervical Spine Joint Position Error, Strength, and Endura… International Journal of Sports Physical Therapy
21. Okhravi S, Zavveyeh M, Kalantari K, Baghban A, Karimi M. A study on the effects of general fatigue on head and neck proprioception in healthy young adults. Ortop Traumatol Rehabil. 2015;17(1):1-6. doi:1 0.5604/15093492.1143513
22. Buckley TA, Munkasy BA, Krazeise DA, Oldham JR, Evans KM, Clouse B. Differential effects of acute and multiple concussions on gait initiation performance. Arch Phys Med Rehabil 2020;101(8):1347-1354. doi:10.1016/j.apmr.2020.03.0 18
23. Murray NG, Szekely B, Moran R, et al. Concussion history associated with increased postural control deficits after subsequent injury. Physiol Meas. 2019;40(2):024001. doi:10.1088/1361-6579/aafcd8
24. Schmidt JD, Terry DP, Ko J, Newell KM, Miller LS. Balance regularity among former high school football players with or without a history of concussion. J Athl Train 2018;53(2):109-114. doi:10.4085/1062-6050-32 6-16
25. Pescatello LS. ACSM’s Guidelines for Exercise Testing and Prescription Wolters Kluwer/Lippincott Williams & Wilkins Health; 2014.
26. de Zoete RMJ, Osmotherly PG, Rivett DA, Farrell SF, Snodgrass SJ. Sensorimotor control in individuals with idiopathic neck pain and healthy individuals: A systematic review and meta-analysis. Arch Phys Med Rehabil 2017;98(6):1257-1271. doi:10.1016/j.apmr.20 16.09.121
27 Quartey J, Ernst M, Bello A, et al. Comparative joint position error in patients with non-specific neck disorders and asymptomatic age-matched individuals. S Afr J Physiother 2019;75(1). doi:10.410 2/sajp.v75i1.568
28. Hill R, Jensen P, Baardsen T, et al. Head repositioning accuracy to neutral: A comparative study of error calculation. Man Ther 2009;14(3):280-284. doi:10.1016/j.math.2008.01.011
29. Domenech MA, Sizer PS, Dedrick GS, McGalliard MK, Brismée JM. The deep neck flexor endurance test: Normative data scores in healthy adults. PM&R. 2011;3(2):105-110. doi:10.1016/j.pmrj.2010.10.023
30. Jarman NF, Brooks T, James CR, et al. Deep neck flexor endurance in the adolescent and young adult: Normative data and associated attributes. PM&R. 2017;9(10):969-975. doi:10.1016/j.pmrj.2017.02.002
31. Versteegh T, Beaudet D, Greenbaum M, Hellyer L, Tritton A, Walton D. Evaluating the reliability of a novel neck-strength assessment protocol for healthy adults using self-generated resistance with a handheld dynamometer Physiother Can 2015;67(1):58-64. doi:10.3138/ptc.2013-66
32. Portney LG, Watkins MP Foundations of Clinical Research: Applications to Practice. 3rd ed. Pearson/ Prentice Hall; 2015.
33. Baker M, Quesnele J, Baldisera T, Kenrick-Rochon S, Laurence M, Grenier S. Exploring the role of cervical spine endurance as a predictor of concussion risk and recovery following sports related concussion. Musculoskelet Sci Pract. 2019;42:193-197. doi:10.101 6/j.msksp.2019.04.002
34. Buckley TA, Munkasy BA, Krazeise DA, Oldham JR, Evans KM, Clouse B. Differential effects of acute and multiple concussions on gait initiation performance. Arch Phys Med Rehabil 2020;101(8):1347-1354. doi:10.1016/j.apmr.2020.03.0 18
35. D’Silva LJ, Siengsukon CF, Devos H. Gaze stability in young adults with previous concussion history. J Vestib Res Equilib Orientat 2020;30(4):259-266. doi:1 0.3233/ves-200706
36. Caffey AL, Dalecki M. Evidence of residual cognitive deficits in young adults with a concussion history from adolescence. Brain Res 2021;1768:147570. doi:10.1016/j.brainres.2021.14757 0
37 Stockbridge MD, Newman R. Enduring cognitive and linguistic deficits in individuals with a history of concussion. Am J Speech Lang Pathol 2019;28(4):1554-1570. doi:10.1044/2019_ajslp-18-01 96
38. Brown DA, Grant G, Evans K, Leung FT, Hides JA. The association of concussion history and symptom presentation in combat sport athletes. Phys Ther Sport 2021;48:101-108. doi:10.1016/j.ptsp.2020.12.0 19
39. Mills KR. The basics of electromyography. J Neurol Neurosurg Psychiatry 2005;76(Suppl_2):ii32-ii35.
40. Wofford KL, Grovola MR, Adewole DO, et al. Relationships between injury kinematics, neurological recovery, and pathology following concussion. Brain Commun 2021;3(4):fcab268. doi:1 0.1093/braincomms/fcab268
The Effect of Exercise-Induced Central Fatigue on Cervical Spine Joint Position Error, Strength, and Endura… International Journal of Sports Physical Therapy
Original Research
Development and Feasibility of an Adolescent Dancer Screen
Kynaston Schultz1a , Kathleen Sun Worrall, Zoe Tawa1 , Joanna Binney, Jessica Boyle, Laurel Daniels Abbruzzese1
1 Physical Therapy, Columbia University
Keywords: Adolescent, Dance, Feasibility, Injury, Screening https://doi.org/10.26603/001c.92902
International Journal of Sports Physical Therapy
Background
Adolescent dancers are at high risk for injuries due to the physical demands of dance training and the physiological changes that occur during adolescence. Though studies report high injury rates, there are few standardized screening tools available for adolescent dancers.
Hypothesis/Purpose
To develop and describe a standardized, feasible, evidence-based, and clinically relevant screen for adolescent dancers.
Study Design
Descriptive Epidemiology Study
Methods
Dancers at two suburban pre-professional dance studios, in two cohorts, participated in the Columbia Adolescent Dancer Screen (CADS) that includes dance injury history, health questionnaires (EAT-26, SF-36, DFOS), aerobic capacity, range of motion, strength, balance/orthopedic special tests, and dance technique. Participants were asked to complete a weekly injury surveillance questionnaire derived from the Dance-Specific Oslo Sports Trauma Research Centre Questionnaire on Health Problems for 14 weeks following the screening. Feasibility was assessed using process and content analysis in four areas: practicality, demand, implementation, and adaptation.
Results
Descriptive data were collected from 32 female dancers aged 11-17 with cohort one averaging 18.57 dance hours per week and cohort two averaging 10.6 dance hours per week. The screen was practical, able to screen seven to eight dancers per hour utilizing nine assessors and requiring a one-hour commitment from dancers. Cost and space requirements were considered and kept to a minimum while utilizing portable equipment. All screening slots were filled with all dancers agreeing to follow-up injury surveillance, indicating high demand. The screen was implemented with two cohorts with revisions to improve efficiency applied for the second cohort.
Corresponding Author:
Kynaston Schultz, PT, DPT
Board-Certified Orthopedic Clinical Specialist
Lecturer of Clinical Rehabilitation and Regenerative Medicine, Staff Physical Therapist
Faculty Practice of the Programs in Physical Therapy at Columbia University
710 W. 168th Street, Rm #524
New York, NY 10032
Ph: 801-556-3338
Email: ks3420@cumc.columbia.edu
a Schultz K, Sun
K,
Z, Binney J, Boyle J, Abbruzzese LD. Development and
an Adolescent
Screen. IJSPT. Published online March 1, 2024:301-315. doi:10.26603/001c.92902
Worrall
Tawa
Feasibility of
Dancer
Conclusion
The CADS is a feasible screening tool for adolescent dancers that overcomes barriers by being pragmatic, evidence-based, and efficient. Screening can be implemented to obtain baseline values, inform wellness recommendations, and establish relationships with medical professionals.
Level of Evidence
Level 3b
INTRODUCTION
In 1997, Physical Therapists and Athletic Trainers from the International Association for Dance Medicine and Science (IADMS) called for an injury surveillance screening protocol for the dance community 1,2 Similar to the process used in athletes in competitive sports, the surveillance program would include a preseason screen of dancers’ intrinsic and extrinsic risk factors and subsequent injury occurrence reports for each dancer.2 The purpose of preseason screening was not only to uncover injuries and health issues, but also to screen for factors that may predispose the individual to injury, assess physical maturation, determine physical fitness, and educate the dancer regarding injury prevention and proper nutrition. Additionally, the screening period can serve to establish a positive relationship between young dancers and physical therapists or other healthcare professionals to promote safe, healthy participation in dance.1‑5
Adolescent dancers could benefit greatly from pre and mid-season screening tools. This population - dancers between the ages of ten and nineteen6 - experience tremendous physical and psychological changes and risk of injury 7 Adolescents undergo rapid growth spurts that impact both their musculoskeletal and nervous systems.8‑15 Strength and flexibility can temporarily decrease, and the young dancer can experience a period of incoordination. These changes may be experienced as a temporary decline in technique.8,10‑12 This may lead dancers or dance teachers to push harder for an idealized aesthetic, instead of understanding the limitations of this temporary growth period, putting the young dancer at risk for overuse injury 11 Rates of injury in adolescent dancers range from .77 to 4.7 per thousand dance hours7,15,16 with overuse accounting for the majority of injuries.7,15
Faulty technique has also been cited as a contributor to dance injury.17‑19 A growing number of clinicians are including technique assessments in wellness screens. However, there is limited research confirming the reliability of dance technique screening in adolescent dancers.18,20‑22 The use of assessments that have not been validated or tested for reliability may undermine the effectiveness of conducting dancer screens. Before any measurement instruments or assessment tools can be used for research or clinical applications, their reliability should be established.23
The physical changes experienced by dancers can also lead to psychological hurdles. As their bodies change, some dancers feel as if their physique is shifting away from the ideal dancer’s body 11 This may cause dancers to consume
fewer calories to maintain a “ballet” body, putting them at increased risk for developing eating disorders, relative energy deficiency in sport syndrome (RED-S), (formerly female athlete triad) and injury 4,24‑26 These simultaneous physical and psychological changes make the adolescent dancer particularly susceptible to injury 9,10
In the last 20 years, there has been a substantial effort to build standardized preseason screens for professional dancers. Little has been done to produce standardized screens of the same caliber for adolescent dancers, though several screens for young dancers exist. Despite this, clinicians are actively engaged in screening adolescent dancers using a variety of methods. Even if a standardized screen were to exist for this population, there are often barriers to screening that contribute to the lack of consistency and utilization of screening including cost, time, and insufficient resources. Additionally, there is little to no research detailing the development and implementation of a screen to inform the process for other interested clinicians. Therefore, the primary purpose of this study was to develop and describe a standardized, feasible, evidence-based, clinically relevant screen and monitor injuries in adolescent pre-professional dancers. The secondary aim was to utilize the screen to identify impairments and make individualized wellness recommendations in an effort to reduce risk of injury and improve dance performance.
MATERIALS AND METHODS
DEVELOPMENT OF THE ADOLESCENT DANCER SCREEN
Experienced physical therapists currently conducting screens with adolescent dancers were identified through the Performing Arts Special Interest Group (PASIG) of the American Physical Therapy Association (APTA) Academy of Orthopaedic Physical Therapy (AOPT). Practitioners provided information regarding their screening methods including three published screens1,27,28 and eight non-published screens. The majority of screens included survey questions addressing dance history, personal demographics, health history, and current complaints. Fewer screens included extrinsic risks, lifestyle habits, health management and/or a psychological screen. The majority of the screens included physical measurements of lower extremity strength, orthopedic tests, functional capacity, range of motion, technique assessment, structure/alignment, flexibility, static balance, posture, core strength, and anthropometric measures. Less of the screens included aerobic fitness, standing “turnout,” gait analysis, joint laxity, pointe readiness, and/or disability severity. The Columbia Adoles-
International Journal of Sports Physical Therapy
Development and Feasibility of an Adolescent Dancer Screen
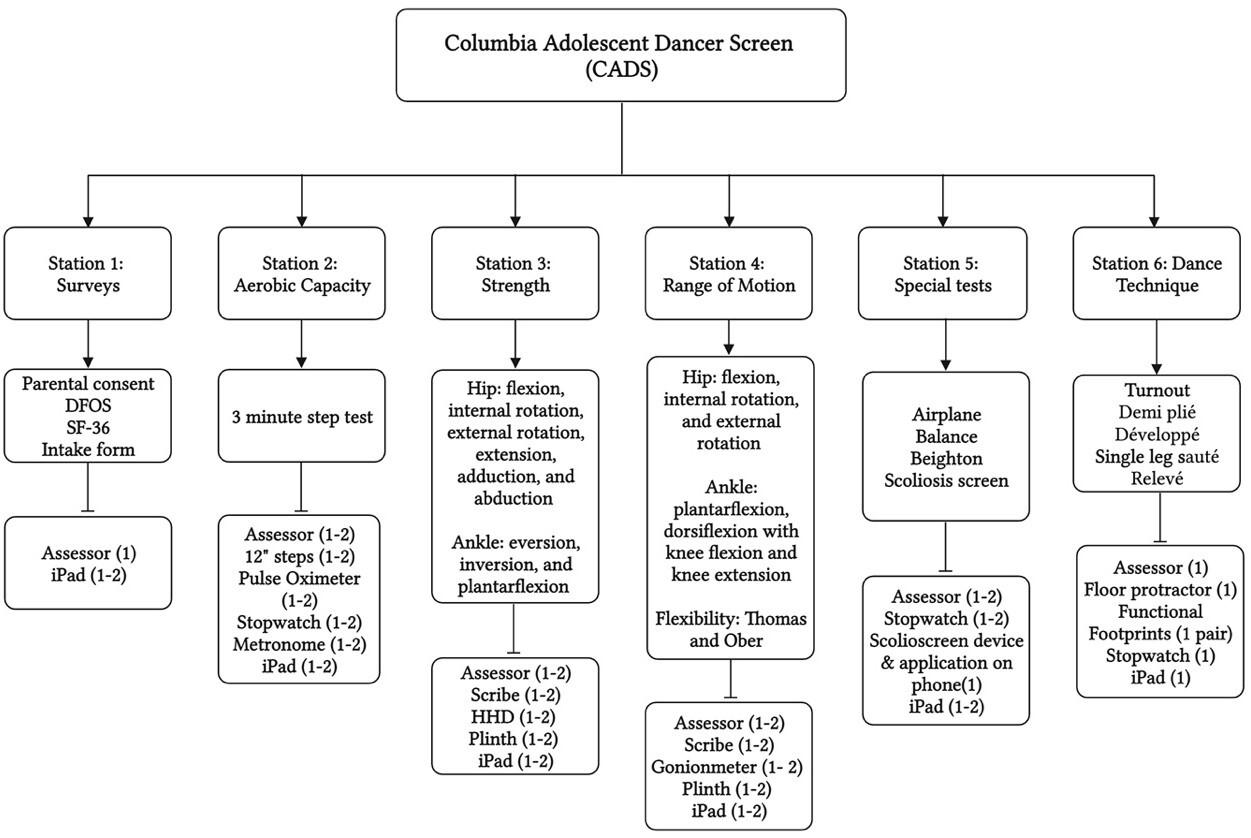
cent Dancer Screen (CADS) was developed by combining screening elements from the existing screens, augmenting each component with operational definitions and photos to help standardize the protocol. Every effort was made to include screening components with data on reliability and validity. Where there were gaps in the literature, efforts were made to determine reliability Screening was completed with two cohorts of adolescent dancers.
COLUMBIA ADOLESCENT DANCER SCREEN (CADS) COMPONENTS
The CADS included an intake form with three self-reported outcome measures along with five physical assessment stations. These stations included aerobic capacity, range of motion, strength testing with handheld dynamometry (HHD), orthopedic special tests, and dance technique assessment.
SURVEYS/OUTCOME MEASURES
A number of outcome measures were utilized to gather baseline data. Dancers completed an intake form with demographics including age, menstruation status, dance hours per week, and injury history. Dancers were surveyed about their eating habits including feelings regarding body image and weight via the Eating Attitudes Test (EAT-26), a self-report tool used to screen for characteristics and symp-
toms associated with eating disorders.29‑31 Guardians were contacted for referral for potential disordered eating in any participants with EAT-26 scores over 20. Participants completed the 36-Item Short-Form Health Survey (SF-36) as an indicator of quality-of-life and general health status.32 The Dance Functional Outcome Survey (DFOS) was also included, as it is a valid dance specific self-report questionnaire with excellent reliability in pediatric dancers that is sensitive to change in healthy and injured ballet and modern dancers.33(p20),34
AEROBIC CAPACITY
An adapted 3 Minute Step Test at 112 beats per minute was used to measure aerobic capacity, as it has been shown to be an acceptable measure for aerobic capacity in dancers.35, 36 Three heart rates (HR) were recorded: resting, peak, and recovery using a pulse oximeter Resting HR was recorded after sitting for two minutes. Peak HR was recorded after participants stepped onto a 12 inch step with alternating feet to the beat of a metronome (112 beats per minute) for three minutes. Recovery HR was recorded after one minute of seated rest.
STRENGTH TESTING WITH DYNAMOMETRY
Strength testing for lower extremity muscles was completed as described by Bohannon, Alfuth, and Richardson using
Figure 1. Infographic for Columbia Adolescent Dancer Screen (CADS)
Description of stations, tests, and measures in each station, and equipment list for each station.
Development and Feasibility of an Adolescent Dancer Screen International Journal of Sports Physical Therapy
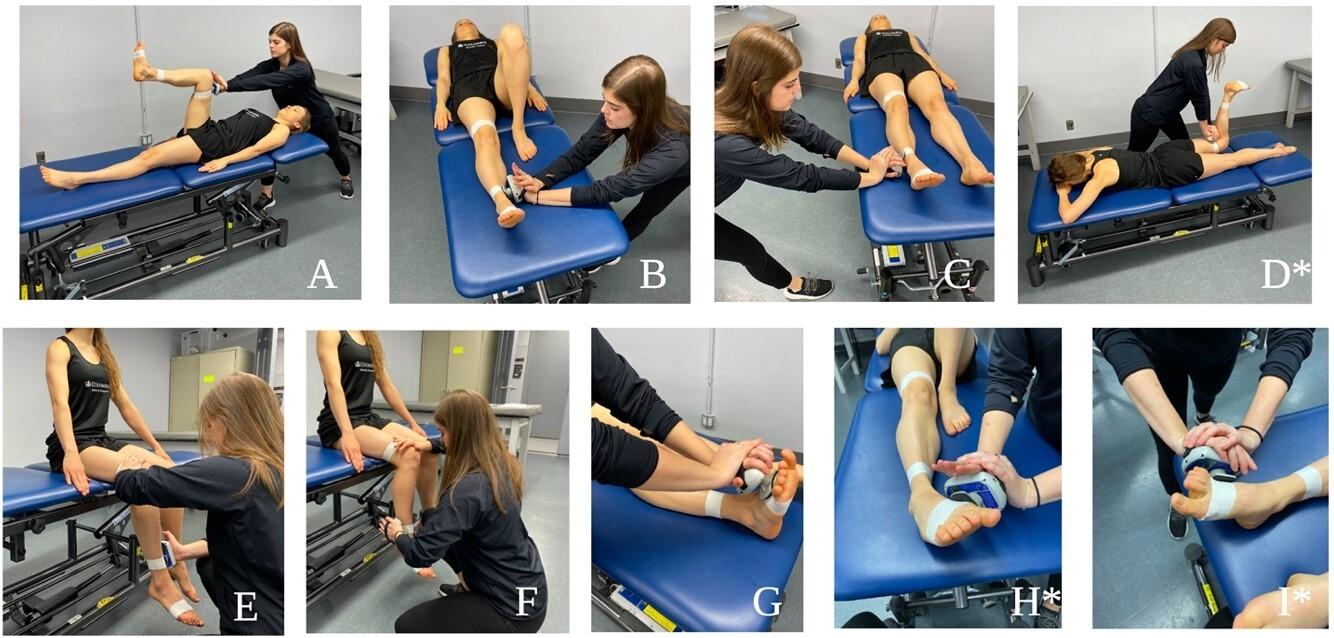
HHD with a single trial for each muscle group.37‑39 All data were recorded in pounds. In an effort to establish reliability of HHD in pre-professional dancers, an adjunct study was performed following the initial implementation of the screen; the results of which informed updates for future screen iterations.40
RANGE OF MOTION
Joint range of motion of the hip, knee, and ankle were measured using a goniometer, following protocols established by Norkin & White.41 A single measurement was taken and recorded bilaterally in degrees for hip flexion, hip internal and external rotation, ankle plantarflexion, and ankle dorsiflexion with the knee flexed and extended.
ORTHOPEDIC SPECIAL TESTS
A number of special tests were included to screen for flexibility, balance, motor control, joint hypermobility, and scoliosis. Both the Thomas and Ober tests were utilized for muscle flexibility The Thomas Test, described by Norkin and White,41 was administered to assess iliopsoas and rectus femoris muscle length. The Ober Test, described by Norkin and White,41 was administered to assess tensor fascia lata/iliotibial band length.
The dancers were screened for scoliosis using the scolioscreen device and smartphone application.42 Dancers were positioned in standing with feet parallel and hip-width apart. They were instructed to perform trunk forward flexion by tucking the chin. The scolioscreen device was centered over the spinous processes as close as possible to the base of the spine. The examiner moved the device up the spine keeping it centered over the spinous processes and
recorded the largest angle found. This process was repeated and the average of the two largest angles was recorded.
The airplane test39 was administered to assess motor control and coordination. Dancers were instructed to hinge from the hips so the trunk is near parallel to the ground, and to extend one leg back so it is also parallel to the ground. Dancers were required to maintain parallel with both legs (no internal or external rotation). To pass the airplane test, the dancer must complete four out of five pliés while bringing the arms together to touch fingertips to the ground without loss of balance or technical fault (knee over the center of the foot, maintenance of level pelvis with the foot, back, and head in one line, and no foot pronation).
Joint laxity and hypermobility were assessed by the Beighton nine point scale.43,44 A higher score indicated an increase in laxity, with six out of nine being the cut-off recommended for consideration of generalized joint hypermobility 43 Balance was evaluated by a thirty second, eyes open and closed, single leg stance test for both sides.
DANCE TECHNIQUE
Five dance technique items were simultaneously screened by three independent raters in the first cohort in an effort to determine inter-rater reliability. Training consisted of reviewing a manual detailing the scoring items and what constituted a pass/fail or violation of appropriate technique as well as a video practice session. Only one rater was used in the second cohort but the procedures for scoring, viewing, and number of repetitions for each technique assessment were updated following a preliminary investigation of inter-rater reliability for the screen. Each dancer was instructed to “maintain your best technique.” Turnout was measured in degrees with dancers standing in first position on a floor protractor,45 which was then compared to
Figure 2. HHD Strength Testing Positions
A hip flexion, B hip adduction, C hip abduction, D hip extension, E hip external rotation, F hip internal rotation, G ankle dorsiflexion, H ankle inversion, I ankle eversion *position updated from cohort 1 to cohort 2, cohort 2 position shown
and
Adolescent
Screen International Journal of Sports Physical Therapy
Development
Feasibility of an
Dancer
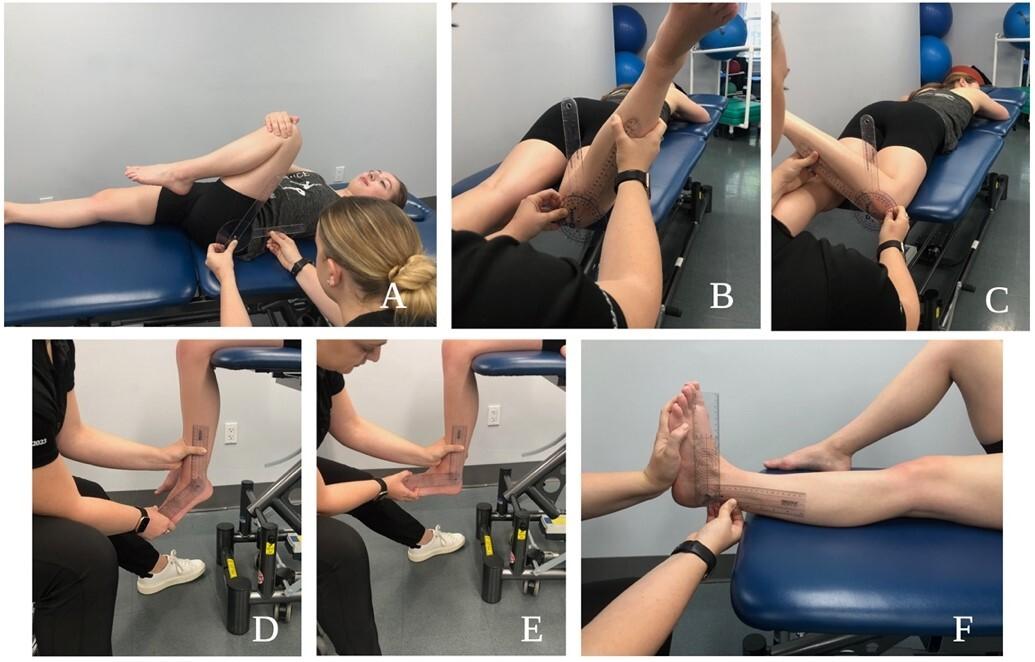
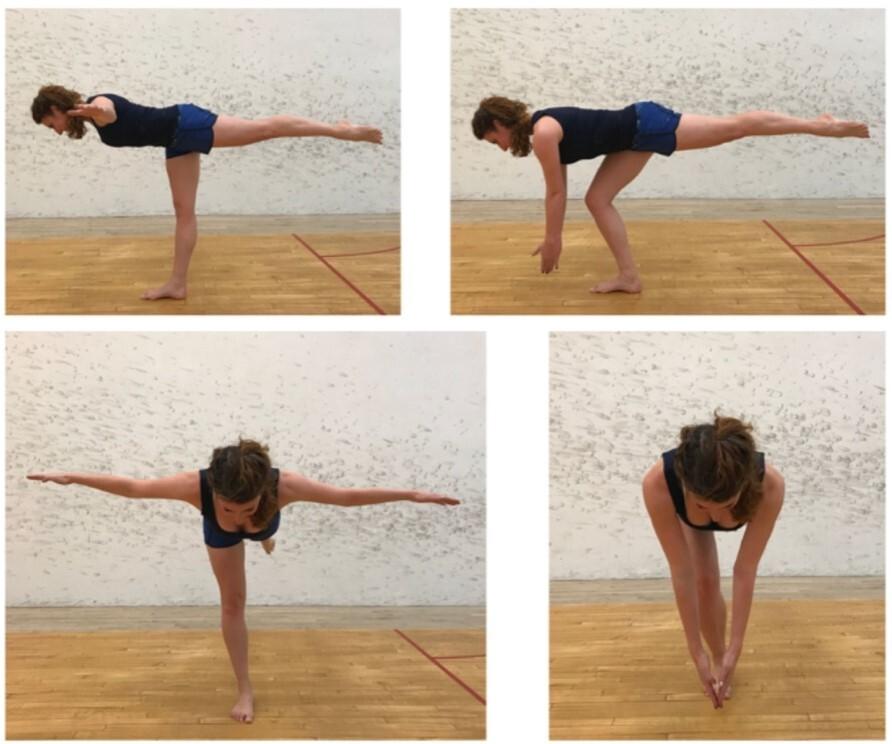
technically correct turnout measured in degrees using functional footprints. The other technique items were demi plié in first position, développé a la seconde, single leg sauté test,39 and relevé in retiré. Each had five to seven criteria for proper alignment of the pelvis, trunk, and lower extremities that were evaluated and recorded.
INDIVIDUALIZED WELLNESS RECOMMENDATIONS
After dancers completed the screen, their results were reviewed for any flagged criteria by the SPTs on the dance research team with oversight by licensed clinicians to provide targeted exercises and stretches to address potential
deficits found during the screen. All the guidelines included patient education materials sourced from IADMS and the American Ballet Theatre website.
IMPLEMENTING THE ADOLESCENT DANCER SCREEN TRAINING
In order to implement the screen, it was necessary to create a training manual and orient team members to screening items. A brief team meeting oriented team members to the screen. Technique assessors did an extra one hour training with videos and discussion. This was followed by an hourlong practice session for student physical therapists (SPTs) participating in the screen, SPTs with volunteers that allowed team members to practice performing their station assessment three to five times.
PARTICIPANTS
Participants included two cohorts of 32 female adolescent dancers, mean age of 14 (range 11-17), from two different dance studios’ pre-professional programs surveyed a year apart. All participants gave informed consent, and the study was approved by the institutional review board. The participants had to be between the ages of 10 and 19, taking a minimum of two ballet classes per week. Dancers were recruited via flyers at both studios and all dancers assented to study participation with verbal and written consent. As the majority of dancers were minors, verbal and written consent were also secured from parents/guardians prior to screening. Screenings took place at the dance studios.
Figure 3. ROM Testing Positions
A hip flexion, B hip internal rotation, C hip external rotation, D ankle plantarflexion, E ankle dorsiflexion knee flexed, F ankle dorsiflexion knee extended
Figure 4. Airplane Test
International Journal of Sports Physical Therapy
Development and Feasibility of an Adolescent Dancer Screen
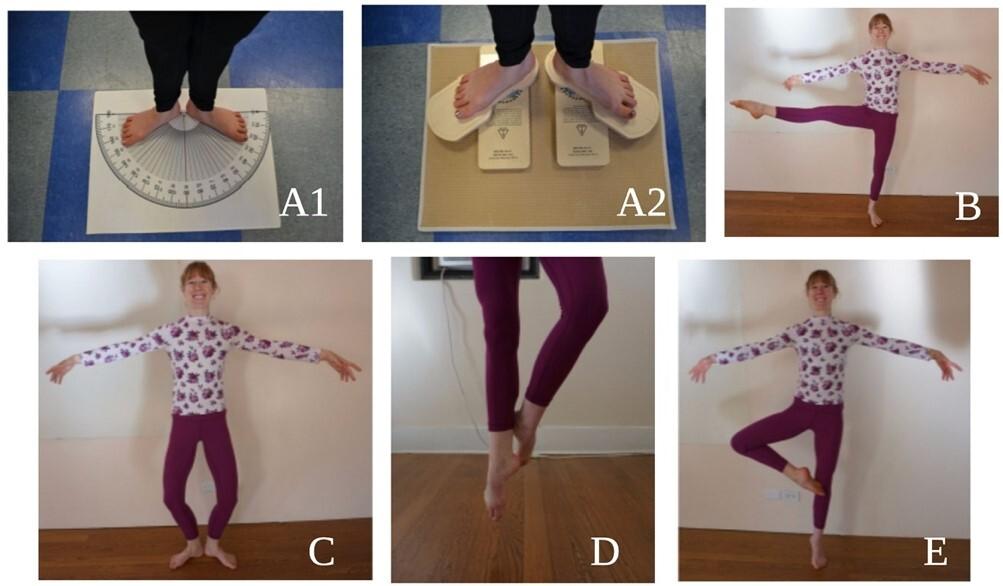
SCREENING DAY
Dancers signed up to participate in advance of the screening day for both cohorts. For cohort one, dancers were told to come in between rehearsals while dancers in cohort two were given a scheduled time to arrive with four dancers scheduled every 30 minutes. Ten minutes were allocated to each of the six screening stations - five physical assessment stations and one paperwork station. Prior to screening, folders and participant numbers were created for each dancer that included intake paperwork as well as a form to record results of each station. This was done electronically with iPads for cohort two.
In cohort one, the six station set-up for the CADS included nine assessors with two additional raters at the technique station to evaluate reliability. A single dance studio (~30’ x 25’) was able to accommodate all stations with assessors and up to six dancers at a time. The studio was reserved for three hours (including setup) to screen a maximum of 20 dancers. The results were collected via paper and pencil on a clipboard that each participant carried with them from station to station.
In cohort two, a small studio (~20’ x 30’) was used. Nine assessors were again present with one additional team member operating in capacity as a coordinator to oversee the process, direct dancers, and remedy any consent issues. Only one assessor was present at the technique station, but assessors were utilized as scribes for both the range of motion and strength testing stations.
POST SCREENING
Following screening, each dancer was contacted via email for 14 weeks to fill out a survey on injury surveillance that could be completed in ten minutes or less. The surveys were sent using REDCap, a HIPAA compliant database and data collection system. The online survey (modified Oslo Sports Trauma Research Centre’s Questionnaire on Health Problems) used three definitions for dance-related injuries: (1) time loss (an inability to complete one or more classes, rehearsals, or performances for one or more days beyond onset), (2) medical attention, and (3) any complaint.46 Additionally, the SPTs with clinician oversight provided each dancer with an individualized wellness recommendation packet based on their screening findings.
RESULTS
Two screening days were completed with two cohorts, one of 17 and one of 15 dancers. Data collected from both cohorts is reported in Table 2 Data from cohort one technique inter-rater reliability is reported in Table 3 Screen feasibility was assessed in four categories: practicality, demand, implementation, and adaption.47
PRACTICALITY: EFFICIENCY AND COST
As a measure of efficiency, the team was able to streamline screening from five to six dancers per hour (cohort one) to seven to eight dancers per hour (cohort two). The cost of screening can be evaluated in personnel, time, and equipment. Nine assessors administered the screen to each cohort, although as few as six would be able to run the screen.
Figure 5. Dance Technique
A1 Functional turnout, A2 Technically correct turnout, B Développé, C Demi-plié in 1st position, D Single leg sauté test, E Relevé in retiré
Development and Feasibility of an Adolescent Dancer Screen International Journal of Sports Physical Therapy
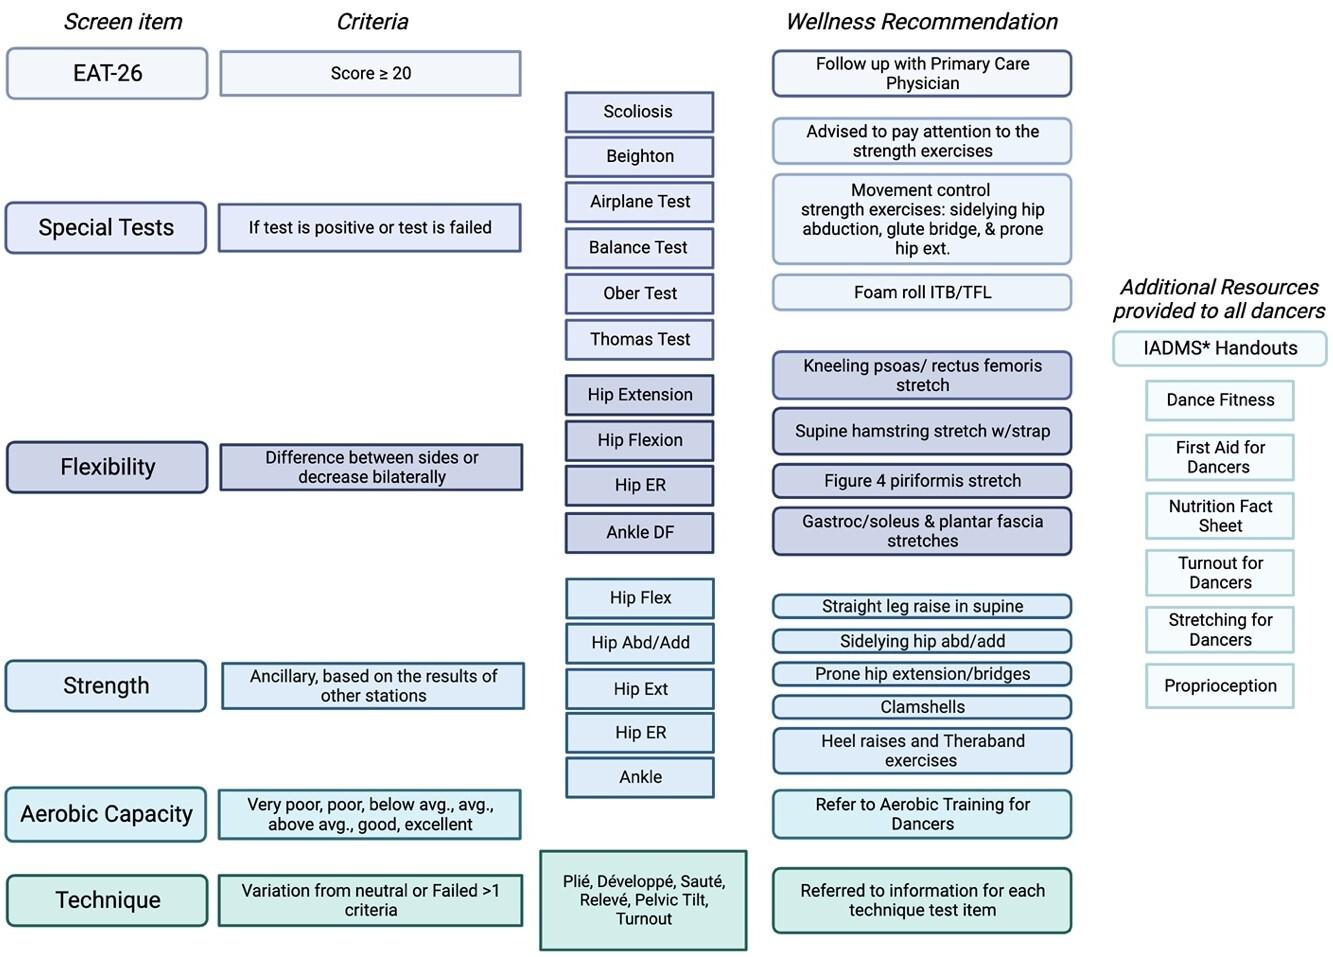
* International Association for Dance Medicine and Science
The time commitment of an hour from each dancer was accurate and sufficient to allow for screen completion. A time commitment of 3-4.5 hours was necessary from SPT assessors, although licensed physical therapists were able to run stations without a practice session and just a 30-minute orientation, lessening their time commitment to 2-3.5 hours. Equipment costs were kept to a minimum where possible and portable, space-efficient equipment was prioritized. The hand-held dynamometer, approximately 800 dollars, was the largest expense; two were utilized to improve efficiency. The remaining equipment items could be
purchased for roughly 500 dollars (for the full list of equipment refer to Figure 1).
DEMAND: SCREENING UTILIZATION
All available screening slots for both cohorts were filled with all dancers agreeing to be subsequently surveyed for injury, indicating high demand for screening in the sample populations.
Figure 6. Wellness Recommendation Algorithm
Demographics Results Cohort 1 (mean (SD, range) Results cohort 2 (mean (SD), range) Number of participants 17 15 Age (years) 13.7 (1.8), 11-17 14.73 (1.58), 12-17 Height (inches) 63.36 (3.07), 59-68 62.77 (1.54), 60-66 Weight (lbs) 106.65 (12.82), 87-125 115.86 (19.17), 92-150 BMI 18.55 (2.3), 14.9-23 20.47 (3.15), 17.2-25.7 Age started dancing (years) 3.33 (.82), 2-5 3.57 (1.15), 2-6 Total hours of dance per week 18.57 (6.55), 9-30 10.60 (3.36), 11-14
Table 1. Participant Demographics
Development and Feasibility of an Adolescent Dancer Screen International Journal of Sports Physical Therapy
Hip Ext
Hip ER
Hip IR
Ankle Eversion
Ankle Inversion
Ankle Dorsiflexion
24.33 (5.05), 17.9-33.8 22.92 (6.87), 10.6-39.2
16.91 (3.62), 9.5-25.2 17.39 (4.66), 6.9-26.9
16.55 (5.19), 5.7-26.8 16.64 (4.87), 7-25.6
24.21 (3.94), 16.8-31.0 23.27 (5.63), 8.30-30.0
(4.30), 18.7-32.3
(6.58), 16.9-42.9
(4.46),
(8.4), 14.4 -47.9
22.83 (6.93), 9.90-33.50
18.85 (6.45), 5.70-27.70
19.69 (7.05), 6-26.50
15.19 (7.33), 3.60-23.60
(8.86), 4.80-33.50
(12.66), 9.20-44.30
(9.47), 9.40-36.60
22.65 (8.14), 8.70 -35.60
18.61 (6.27), 6.0-26.50
19.83 (7.70), 5.4-33.70
14.86 (8.41), 3.20-29.40
(7.88), 4.50 -32.50
(10.38),
ADS Outcome measures Cohort 1 Results (mean (SD), range) Cohort 2 Results (mean (SD), range) EAT 26 7.25 (9.11), 0-27 13.87 (15.5), 0-54 Aerobic Capacity (BPM) Resting HR 79.71 (11.98), 66-112 94 (10.88), 77-112 Max HR 110.35 (10.06), 90 -124 145.73 (18.08), 111-173 HR post 1 min recovery 83.76 (13.07), 64-110 98.53 (13.13), 75-129 Right Left Right Left Strength (lbs) Hip Flex 30.79 (5.86), 23.5-40.9 30.16 (6.01), 21.4-41.2 23.98 (7.08), 13.20-33.50 24.87 (8.48), 10,90-36.90
Add 38.68 (9.8), 22.1-55.3 37.2 (10.98) 18.1-57.6 24.89 (9.67), 9.40-42.40 28.47 (11.78), 10.60-47.0
Abd 42.79 (9.11), 19.2-55.9 42.02
21.9-59.4 24.85
10-39.90 24.63
Table 2. Outcome Results Data
Hip
Hip
(9.88),
(8.86),
24.07
23.91
19.87
13.6-30.8
19.25
31.16
33.5
29.91
29.23
12.50-40.9 Unilateral Ankle PF repetitions 20 (0), 20-20 20 (0), 20-20 19.93 (.26), 19-20 20 (0), 20 –20 Range of Motion (ROM) Hip Flex 132.27 (6.81), 116-144 133 (6.21), 120-143 139 (5.55), 130-148 138.33 (5.25), 128-146 Hip IR 34.73 (4.2), 27-42 37.3 (3.29), 31-43 35.33 (7.35), 26-50 39.87 (8.97), 24-51 Hip ER 41.93 (2.99), 36-48 40.87 (3.87), 30-46 33.87 (5.54), 25-45 32.67 (5.91), 24-40 Ankle PF 69.73 (4.79), 60-80 79.60 (5.18), 60-77 78 (9.56), 60-90 78 (8.25), 66-90 Ankle DF knee flexed 16.27 (4.3), 10-25 14.27 (5.09), 725 15.07 (6.41) 0-22 16.13 (7.35), 8-28 Ankle DF knee ext 9.86 (3.46), 5-15 9.60 (4.67), 5-20 3.27 (6.03), -8-14 6.53 (5.48), -8.0-12.0 Technique (total score) Demi Plié 3.67 (.81), 2-4.67 1.5 (.64), 0-2 Développé 3.00 (.51), 2.33-4 2.6 (1.35), 1-5 Sauté 2.67 (1.14), .67-4.33 2.5 (.99), 1-4 Releve in Retiré 4.00 (1.02), 1.33-4.67 2.5 (1.25), 0-5 Functional Turnout 131.67 (11.25), 114.67-165.00 94.80 (11.24), 77-117 Technically Correct Turnout 108.67 (14.30), 90.67-138.67 100.47 (16.94), 70-135 Compensated Turnout 20.76 (15.40), -7 -45 -5.67 (11.37), -25 –7 Total Technique Score 13.00 (2.45), 7.33-15.67 9 (2.62), 6-15 Orthopedic special tests (% + test/pass) Ober 25% 0% Thomas 75% 53% Airplane Test 62.5% 60% Beighton Score 4.56 (2.48), 1-9 3.94 (1.98), 1-7 Scoliosis 66.6% 33% Balance (sec) Right Left Right Left Eyes Open 28.27 (6.91), 2.37-30 29.20 (3.2), 17.19 -30 29.39 (2.04) 22.08-30 30 (0), 30 Eyes Closed 16.97 (11.30), 2.77-30 17.21 (11.43), 2.37-30 12.93 (10.64) 2.5-30 13.79 (10.35) 4.27-30 Development and Feasibility of an Adolescent Dancer Screen International Journal of Sports Physical Therapy
IMPLEMENTATION: FACTORS, SUCCESSES, AND FAILURES
A number of factors affected implementation, including the need for parental consent with an adolescent population. Another factor associated with implementation was adequately training SPTs to perform the screening. With a robust training manual, orientation, and practice session, all team members were able to successfully conduct the screen regardless of dance experience. Some failures experienced in cohort one included dancers missing stations, bottlenecks that slowed dancers progress through stations, and having to manually enter data from paper to an electronic format introducing opportunities for error and decreased efficiency
ADAPTATION: PERFORMING THE SCREEN ON A SECOND COHORT
In cohort one, 17 dancers were assessed in a three-hour block with two dancers missing station one and one dancer missing a portion of the technique station due to scheduling conflicts and bottlenecks at the warm up and special tests stations. Changes and updates for cohort two allowed all dancers to complete all the stations and increased the number of dancers screened per hour
DISCUSSION
The CADS was developed and successfully implemented across two cohorts of 32 adolescent dancers. The screen is feasible, practical, and satisfies demand. The screenings collected baseline measures, informed wellness recommendations, and established positive contact between dancers and medical professionals. The purpose of this investigation was twofold, involving both development and implementation.
SCREEN DEVELOPMENT
A combination of personal contact with authors of current professional dancer screens and literature reviews was conducted to find the most efficacious, valid, and reliable screening items. There are few studies that include normative data for dancers, although this is starting to change.48 It is also difficult to find screens that solely rely on measures with proven reliability Questions around screening validity and reliability prompted thoughtful consideration
of what to include in the screen. Ancillary studies were conducted in three areas where data on reliability and validity were missing: HHD in the dancer population,40 inter-rater reliability of the technique screen,20 and the relationship of compensated turnout with injury.49,50 Subsequent studies have shown a similar technique screen and turnout measurement to be valid and reliable in an adult dancer population.51,52
Substantial time and effort were invested in creating a thorough training manual, a database of questionnaires and forms, and developing wellness recommendations based on screening results. Limited normative data and literature on risk factors associated with injury prompted inquiry into how to identify criteria for prescriptive wellness recommendations. In a population just starting to develop normative data,48 what thresholds should be utilized to signal a need for attention? Furthermore, questions were raised about the necessity of collecting multiple data points on a large number of individual muscle groups when cardinal muscle groups could potentially be used to streamline the process.53 Ultimately wellness recommendations were given for large asymmetries in strength or flexibility, positive orthopedic special tests, and for multiple errors on technique screening items. These individualized recommendations were sent in the weeks following the screening. While the recommendations were meaningful to the dancers and helped incentivize screening participation, providing more immediate results may elicit greater response rates for follow up injury surveillance surveys in the future.54
The importance of building a pool of normative data along with the continued study of links between injury risk factors and screening continue to be a priority. Since developing the CADS, Critchley et al.48 developed and conducted a preseason screen and subsequent weekly survey for over 450 pre-professional dancers over a 5-year period. Their screen included many of the same mobility and strength assessments as CADS, and their survey yielded a 91.4% response rate. Results identified dynamic balance assessments and years of training as potential protective factors against self-reported injury 48 Critchley et. al. support the feasibility of a screen like CADS, but it also underlines the importance of including a valid, population-specific assessment of movement quality.48
Technique Measure Single ICC (95% CI) Average ICC (95% CI) Functional Turnout 0.982 (0.960-0.993) 0.994 (0.986-0.998) Technically Correct Turnout 0.950 (0.893-0.980) 0.983 (0.961-0.993) Demi Plié Technique Score (0-7) 0.444 (0.146-0.719) 0.706 (0.338-0.885) Développé Technique Score (0-5) 0.179 (-0.097-0.518) 0.395 (-0.360-0.763) Sauté Technique Score (0-5) 0.496 (0.201-0.752) 0.747 (0.431-0.901) Retiré Technique Score (0-5) 0.594 (0.317-0.809) 0.814 (0.582-0.927)
Table 3. Technique Screen Inter-rater Reliability Intraclass Correlation Coefficient (ICC) Values
International Journal of Sports Physical Therapy
Development and Feasibility of an Adolescent Dancer Screen
SCREEN IMPLEMENTATION
The team found it was efficacious to partner with local studios to use their space and schedule screenings when dancers were already at the studio. In the adolescent population, special consideration is needed as the dancers depend on their parents for transportation, scheduling, and consent, which involves a more proactive approach. In the team’s experience, obtaining parental consent was best achieved by someone who already had a relationship with the studio. Alternately, where a relationship needed to be created, hosting a wellness workshop to engage dancers in the importance of injury prevention prior to the screening day helped establish a relationship and gave dancers/parents a chance to sign up to be screened.
With the initial cohort, the team found inefficiencies and opportunities for improvement that were streamlined for the second screening. In cohort one, the largest bottleneck was at the warm up station, as that station had to be completed first. To remedy this, another aerobic step station was added for cohort two. The other congestion point was at the orthopedic special tests station. Delays were removed by moving the two orthopedic special tests that required a plinth (Thomas and Ober) to the ROM station. The most time consuming station was HHD; in cohort two an additional plinth and assessor were added to this station which improved efficiency. Another cumbersome and time consuming aspect of the initial cohort was the need for stabilization belts. Subsequently HHD has been shown to be reliable in a dancer population without the need for stabilization belts,40 therefore, they were not utilized in the second cohort, which decreased time required for testing. Through experience with the ancillary HHD study,40 the use of printed photos of positions at the station helped decrease errors of HHD placement and cognitive effort required by the assessor, also improving efficiency In the original cohort, there were three testers at the technique station in order to obtain data on reliability, as none existed at the time. The second cohort required only one tester, which allowed for personnel to be utilized as scribes for the flexibility and HHD stations, again improving efficiency.
Following assessment of inter-rater reliability of the technique screen, additional training was added for the second cohort in an effort to increase reliability, including an additional one hour practice session with videos and discussion to become familiar with the screening tool and common errors. Procedures for scoring, viewing, and number of repetitions were updated in an effort to improve reliability, although the results of these updates have yet to be analyzed.
With cohort one, the dancers carried paper documents from station to station for assessors to fill out, which required the data to later be transitioned from paper to computer format. In the second cohort, the use of iPads helped to improve efficiency for concurrent data entry at each station, decreasing error potential. While most dancers were dressed in leotards and tights, it became apparent after cohort one that dress code instructions were needed to avoid instances of clothing hindering accurate assessment
of lower extremity positions and alignment. Because cohort one had dancers that failed to complete all stations, adding a floating assessor who could oversee operations, act as another assessor if needed, and check each participant’s electronic record to ensure all stations were completed worked well; every dancer in cohort two completed every station. Finally, as part of post-screening injury surveillance data was collected with preliminary data showing heterogenity and requiring a larger “n” to draw meaningful conclusions. However, as this was not a primary purpose of this study, results of the injury surveillance are not reported in this paper
LIMITATIONS
The CADS has been piloted with two cohorts with less than twenty dancers in each cohort and has not been tested in larger cohorts, however, the authors’ anticipate carryover in larger groups. The CADS follow-up injury surveillance was also limited to 14 weeks with analysis of that data ongoing. Although efforts were made to include reliable screening elements or to establish reliability, validity and predictive capabilities also need to be established. In this iteration, the main purpose of screening was to identify impairments from screen results to inform wellness recommendations in an effort to reduce injury risk and improve performance. While reliability for HHD has been shown for the lower extremity in dancers,40 the CADS technique station reliability ranged from poor to excellent20 and efforts to improve reliability still need to be evaluated statistically In addition, the two cohorts were demographically similar but differed in hours danced per week, which indicates variation in training levels. While this did not change the contents of the screen or how it was administered, literature has shown increased dance hours to be associated with injury 16,55 This makes positive association with healthcare professionals, a secondary benefit of screening, even more important.
CONCLUSION
Adolescent dancers are a population that frequently experience injury and have a real need for injury surveillance and screening. There are a number of potential barriers to screening, however the results of this study indicate that the CADS is a feasible screen that overcomes barriers by being pragmatic, evidence-based, and efficient. Screening can be used to establish dancer baseline data, provide the dancer with informed wellness recommendations, and serve as a positive introduction for adolescent dancers to medical professionals.
CONFLICTS OF INTEREST
The authors report no conflicts of interest. All figures were created with BioRender.com
Development and Feasibility of an Adolescent Dancer Screen International Journal of Sports Physical Therapy
Development
ACKNOWLEDGEMENTS
Nunnbetter Dance Theater & Dance for Joy
Sunny Bjaanes, Marissa Schaeffer, Sarah Edery-Altas, & Demetri Dimitriadis
Hilary Busick, Aimee Fries, Allison Ventola, Margaret Bryant, & Shalomit Mikhaylov
Lindsay Backiev, Mandy Blackmon, Shaw Bronner, Maribeth Crupi, Erin Hayden, Tessa Kasmar, Michelina Cassella Kulak, Marijeanne Liederbach, Tiffany Marulli, Duane Scotti, & Jennifer Stoskus
Submitted: October 27, 2023 CST, Accepted: January 05, 2024 CST
© The Author(s)
This is an open-access article distributed under the terms of the Creative Commons Attribution 4.0 International License (CCBY-NC-4.0). View this license’s legal deed at https://creativecommons.org/licenses/by-nc/4.0 and legal code at https://creativecommons.org/licenses/by-nc/4.0/legalcode for more information. and Feasibility of an Adolescent Dancer Screen International Journal of Sports Physical Therapy
REFERENCES
1. Liederbach M. Screening for functional capacity in dancers designing standardized, dance-specific injury prevention screening tools. J Dance Med Sci. 1997;1(3):93-106. doi:10.1177/1089313x9700100304
2. Bronner S, Ojofeitimi S, Mayers L. Comprehensive surveillance of dance injuries a proposal for uniform reporting guidelines for professional companies. J Dance Med Sci 2006;10(3-4):69-80. doi:10.1177/1089 313x06010003-401
3. Potter K, Kimmerle M, Grossman G, et al. Resource paper: screening in a dance wellness program. International Association for Dance Medicine and Science. Published 2008. Accessed June 15, 2017 http s://iadms.org/research-publications/resources-paper/
4. Mainwaring L, Aujla I. Psychological wellness. In: Wilmerding MV, Krasnow DH, eds. Dancer Wellness Human Kinetics; 2017:71-82. doi:10.5040/978171821 2756.ch-005
5. Kinney S, McCrystal T, Owen M, Stracciolini A, Meehan WP The effect of physical therapist involvement in the diagnosis and treatment of youth and adolescent dancers’ injuries. J Dance Med Sci 2018;22(2):81-83. doi:10.12678/1089-313x.22.2.81
6. Csikszentmihalyi M. Adolescence. In: Encyclopædia Britannica. ; 2019. https://www.britannica.com/scienc e/adolescence
7 Gamboa JM, Roberts LA, Maring J, Fergus A. Injury patterns in elite preprofessional ballet dancers and the utility of screening programs to identify risk characteristics. J Orthop Sports Phys Ther 2008;38(3):126-136. doi:10.2519/jospt.2008.2390
8. Stacey JM. The physiological development of the adolescent dancer J Dance Med Sci 1999;3(2):59-65. doi:10.1177/1089313x9900300204
9. Phillips C. Strength training of dancers during the adolescent growth spurt. J Dance Med Sci 1999;3(2):66-72. doi:10.1177/1089313x9900300205
10. Daniels K, Rist R, Rijven M, Phillips C, Shenton J, Posey E. The challenge of the adolescent dancer J Dance Med Sci. 2001;5(3):94-95. doi:10.1177/1089313 x0100500305
11. Poggini L, Losasso S, Iannone S. Injuries during the dancer’s growth spurt: etiology, prevention, and treatment. J Dance Med Sci. 1999;3(2):73-79. doi:10.1 177/1089313x9900300206
12. Hamilton LH. A psychological profile of the adolescent dancer J Dance Med Sci 1999;3(2):48-50. doi:10.1177/1089313x9900300202
13. Caine D, Bergeron G, Goodwin BJ, et al. A survey of injuries affecting pre-professional ballet dancers. J Dance Med Sci. 2016;20(3):115-126. doi:10.12678/108 9-313x.20.3.115
14. Caine D, Goodwin BJ, Caine CG, Bergeron G. Epidemiological review of injury in pre-professional ballet dancers. J Dance Med Sci 2015;19(4):140-148. d oi:10.12678/1089-313x.19.4.140
15. Ekegren CL, Quested R, Brodrick A. Injuries in pre-professional ballet dancers: incidence, characteristics and consequences. J Sci Med Sport 2014;17(3):271-275. doi:10.1016/j.jsams.2013.07.013
16. Kenny SJ, Whittaker JL, Emery CA. Risk factors for musculoskeletal injury in preprofessional dancers: a systematic review Br J Sports Med 2016;50(16):997-1003. doi:10.1136/bjsports-2015-095 121
17 Russell JA. Preventing dance injuries: current perspectives. Open Access J Sports Med. 2013;4:199-210. doi:10.2147/oajsm.s36529
18. Bronner S, Bauer NG. Risk factors for musculoskeletal injury in elite pre-professional modern dancers: a prospective cohort prognostic study Phys Ther Sport 2018;31:42-51. doi:10.1016/j.p tsp.2018.01.008
19. L Biernacki J, Stracciolini A, Fraser J, J Micheli L, Sugimoto D Risk factors for lower-extremity injuries in female ballet dancers: A systematic review. Clin J Sport Med 2021;31(2):e64-e79. doi:10.1097/jsm.0000 000000000707
20. Worrall K, Schaeffer M, Schultz K, Tawa Z, Abbruzzese LD. Inter-rater reliability of technique assessment methods in an adolescent dancer screen. Poster presentation presented at: APTA Combined Sections Meeting; January 26, 2019; Washington, D C.
21. Watson T, Graning J, McPherson S, et al. Dance, balance, and core muscle performance measures are improved following a 9-week core stabilization training program among competitive collegiate dancers. Int J Sports Phys Ther 2017;12(1):25-41.
Development and Feasibility of an Adolescent Dancer Screen International Journal of Sports Physical Therapy
22. Kenny SJ, Palacios-Derflingher L, Shi Q, Whittaker JL, Emery CA. Association between previous injury and risk factors for future injury in preprofessional ballet and contemporary dancers. Clin J Sport Med 2019;29(3):209-217 doi:10.1097/js m.0000000000000513
23. Daly LE, Bourke GJ. Interpretation and Use of Medical Statistics. 5th ed. Blackwell Science Ltd
24. Yannakoulia M, Sitara M, Matalas AL. Reported eating behavior and attitudes improvement after a nutrition intervention program in a group of young female dancers. Int J Sport Nutr Exerc Metab 2002;12(1):24-32. doi:10.1123/ijsnem.12.1.24
25. Doyle-Lucas AF, Davy BM. Development and evaluation of an educational intervention program for pre-professional adolescent ballet dancers: nutrition for optimal performance. J Dance Med Sci. 2011;15(2):65-75. doi:10.1177/1089313x1101500203
26. Mountjoy M, Sundgot-Borgen JK, Burke LM, et al. IOC consensus statement on relative energy deficiency in sport (RED-S): 2018 update. Br J Sports Med 2018;52(11):687-697 doi:10.1136/bjsports-201 8-099193
27 Molnar M, Esterson J. Screening students in a preprofessional ballet school. J Dance Med Sci 1997;1(3):118-121. doi:10.1177/1089313x9700100307
28. Southwick H, Cassella M. Boston ballet student screening clinic: an aid to injury prevention. Orthop Pract. 2002;14(2):14-16.
29. Garner DM, Olmsted MP, Bohr Y, Garfinkel PE. The eating attitudes test: psychometric features and clinical correlates. Psychol Med 1982;12(4):871-878. doi:10.1017/s0033291700049163
30. Lee S, Kwok K, Liau C, Leung T Screening Chinese patients with eating disorders using the eating attitudes test in Hong Kong. Int J Eat Disord. 2002;32(1):91-97 doi:10.1002/eat.10064
31. Mintz LB, O’Halloran MS. The Eating Attitudes Test: validation with DSM-IV eating disorder criteria. J Pers Assess 2000;74(3):489-503. doi:10.1207/s15327 752jpa7403_11
32. Ware J, MA K, Keller SD. SF-36 Physical and mental health summary scales: a user’s manual. 1993;8:23-28.
33. Bronner S, Chodock E, Urbano IER, Smith T Psychometric properties of the dance functional outcome survey (DFOS): reliability, validity, and responsiveness. J Orthop Sports Phys Ther. 2019;49(2):64-79. doi:10.2519/jospt.2019.8247
34. Smith T, Filipa A, Riveron S, Strzelinski M, Paterno M, Bronner S. The dance functional outcome survey (DFOS) is reliable, valid, and responsive in pediatric dancers. J Dance Med Sci. 2021;25(1):9-17. d oi:10.12678/1089-313x.031521b
35. Bronner S, Rakov S. An accelerated step test to assess dancer pre-season aerobic fitness. J Dance Med Sci. 2014;18(1):12-21. doi:10.12678/1089-313x.18.1.1 2
36. Bronner S, Codman E, Hash-Campbell D, Ojofeitimi S. Differences in preseason aerobic fitness screening in professional and pre-professional modern dancers. J Dance Med Sci 2016;20(1):11-22. d oi:10.12678/1089-313x.20.1.11
37 Bohannon RW Test-retest reliability of hand-held dynamometry during a single session of strength assessment. Phys Ther. 1986;66(2):206-209. doi:10.10 93/ptj/66.2.206
38. Alfuth M, Hahm MM. Reliability, comparability, and validity of foot inversion and eversion strength measurements using a hand-held dynamometer Int J Sports Phys Ther 2016;11(1):72-84.
39. Richardson M, Liederbach M, Sandow E. Functional criteria for assessing pointe-readiness. J Dance Med Sci 2010;14(3):82-88. doi:10.1177/108931 3x1001400302
40. Schaeffer M, Abbruzzese LD, Tawa Z, et al. Interand intra-rater reliability of handheld dynamometry for lower extremity strength testing in preprofessional dancers. J Dance Med Sci 2021;25(2):86-95. doi:10.12678/1089-313x.061521c
41. Norkin CC, White DJ. Measurement of Joint Motion: A Guide to Goniometry. 4th ed. F.A. Davis Company; 2009.
42. Driscoll M, Fortier-Tougas C, Labelle H, Parent S, Mac-Thiong JM. Evaluation of an apparatus to be combined with a smartphone for the early detection of spinal deformities. Scoliosis 2014;9:10. doi:10.118 6/1748-7161-9-10
43. Juul-Kristensen B, Schmedling K, Rombaut L, Lund H, Engelbert RHH. Measurement properties of clinical assessment methods for classifying generalized joint hypermobility A systematic review Am J Med Genet C Semin Med Genet 2017;175(1):116-147. doi:10.1002/ajmg.c.31540
44. Smits-Engelsman B, Klerks M, Kirby A. Beighton score: a valid measure for generalized hypermobility in children. J Pediatr. 2011;158(1):119-123.e1234. do i:10.1016/j.jpeds.2010.07.021
Development and Feasibility of an Adolescent Dancer Screen International Journal of Sports Physical Therapy
45. Harmon-Matthews LE, Davis-Coen JH, Nierman M, Willigenburg NW, Hewett TE. Examining standing turnout with two measurement methods during dance wellness screening. J Dance Med Sci. 2016;20(3):109-114. doi:10.12678/1089-313x.20.3.10 9
46. Clarsen B, Rønsen O, Myklebust G, Flørenes TW, Bahr R. The Oslo Sports Trauma Research Center questionnaire on health problems: a new approach to prospective monitoring of illness and injury in elite athletes. Br J Sports Med 2014;48(9):754-760. doi:1 0.1136/bjsports-2012-092087
47 Bowen DJ, Kreuter M, Spring B, et al. How we design feasibility studies. Am J Prev Med. 2009;36(5):452-457 doi:10.1016/j.amepre.2009.02.00 2
48. Critchley ML, Bonfield S, Ferber R, Pasanen K, Kenny SJ. Relationships between common preseason screening measures and dance-related injuries in preprofessional ballet dancers. J Orthop Sports Phys Ther 2023;53(11):703-711. doi:10.2519/jospt.2023.11 835
49. Busick H, Ventola A, Fries A, et al. Compensated turnout can predict injuries in adolescent dancers: a prospective pilot study Poster presentation presented at: APTA CSM 2021; January 2021; Virtual Conference.
50. Armstrong R, Relph N. Screening Tools as a predictor of injury in dance: systematic literature review and meta-analysis. Sports Med Open 2018;4(1):33. doi:10.1186/s40798-018-0146-z
51. Bronner S, Lassey I, Lesar JR, Shaver ZG, Turner C. Intra- and inter-rater reliability of a ballet-based dance technique screening instrument. Med Probl Perform Art. 2020;35(1):28-34. doi:10.21091/mppa.20 20.1004
52. Greene A, Lasner A, Deu R, Oliphant S, Johnson K. Inter-rater and intra-rater reliability of a clinical protocol for measuring turnout in collegiate dancers. Physiother Theory Pract 2019;35(1):94-99. doi:10.108 0/09593985.2018.1434708
53. McKay MJ, Baldwin JN, Ferreira P, et al. Normative reference values for strength and flexibility of 1,000 children and adults. Neurology. 2017;88(1):36-43. doi:10.1212/wnl.000000000000346
6
54. Edwards PJ, Roberts I, Clarke MJ, et al. Methods to increase response to postal and electronic questionnaires. Cochrane Database Syst Rev 2009;2009(3):MR000008. doi:10.1002/14651858.mr00 0008.pub4
55. Kenny SJ, Critchley ML, Whittaker JL, Kodalore Vijayan VW, Emery CA. Association between preparticipation characteristics and risk of injury amongst pre-professional dancers. Phys Ther Sport 2021;52:239-247. doi:10.1016/j.ptsp.2021.10.003
Development and Feasibility of an Adolescent Dancer Screen International Journal of Sports Physical Therapy
“I Feel Like I Have Lost Part Of My Identity” - A Qualitative Study
Exploring The Impact Of Chronic Ankle Instability
Anders Mohrsen1a , Thomas Sørensen1 , Henrik Lund1 , Steven Zartov Rasmussen1 , Asger Jensen1 , Katrine Bruun Skov1 , Michael Skovdal Rathleff1
1 Department of Health Science and Technology, Aalborg University
Keywords: Chronic ankle instability, Psychological impact, Social impact, Patient expectations, Loss of identity, Musculoskeletal pain, Biopsychosocial https://doi.org/10.26603/001c.92908
International Journal of Sports Physical Therapy
Introduction
Lateral ankle sprain is the most common ankle injury and up to 40% of those who sustain a lateral ankle sprain will develop chronic ankle instability (CAI). The aim of this study was to explore the thoughts and expectations of CAI-patients concerning their condition and expectations of care in an orthopedic setting.
Study Design
Qualitative study
Methods
Nine semi-structured one-to-one interviews were conducted with CAI-patients who were referred to an orthopedic setting. Interviews were recorded, transcribed, and analyzed using systematic text condensation with an inductive goal free approach.
Results
Seven themes emerged. The themes were Injury history and symptoms (Lateral ankle sprain during sport, pain and instability), Information from health professional (conflicting information about management and prognosis), Management (mental and physical challenges), Expectation and hope (explanation of symptoms, prognosis and imaging to provide clarification of condition), Activity and participation (restriction in sport and daily life and feelings of uncertainty), Support (support from family/friends) and Identity (low ability to participate in sport and social life result in loss of identity).
Conclusion
The impact of CAI exceeds an experience of pain and instability. Patients experienced loss of identity, having to manage uncertainty regarding their diagnosis and prognosis and had hopes of being able to explain their condition.
Level of Evidence
Not applicable
INTRODUCTION
Lateral ankle sprain (LAS) is the most common ankle injury in sports and nearly one in two individuals sustaining LAS will seek medical care.1,2 It is estimated that up to 40% will develop chronic ankle instability (CAI) after a LAS.3,4
Corresponding Author:
Anders Mohrsen BPT, M.Sc
Department of Health Science and Technology, Aalborg University, Selma Lagerlöfs Vej 249, 9260 Gistrup, Denmark, Telephone: +4528721213, E-mail: anders-mohr@hotmail.com
CAI has been defined as: 1) A history of at least one significant ankle sprain and 2) A history of the previously injured ankle joint “giving way” and/or recurrent sprain and/ or “feeling of instability”.5 Furthermore, CAI has been defined as mechanical and functional instability.6 However, in 2019, Hertel and Corbett updated this model. The updated
Concept Review
Clinical Commentary/Current
a Mohrsen A, Sørensen T, Lund H, et al. “I Feel Like I Have Lost Part Of My Identity” - A Qualitative Study Exploring The Impact Of Chronic Ankle Instability. IJSPT. Published online March 1, 2024:316-325. doi:10.26603/001c.92908
Table 1.
Inclusion
A history of at least one significant ankle sprain
Feeling of looseness and instability *
AND/OR
Episodes of “giving way” **
AND/OR
Repeated (+2) sprains of the same ankle
Exclusion
Foot/ankle fracture within 6 weeks
*Feeling of ankle instability: “Situations where daily activity and sports activities give the patient a feeling of an unstable ankle and will typically be associated with fear of reinjury of the ligament”
**Giving way: “Frequent occurrence of uncontrolled and unpredictable episodes of excessive inversion of the ankle, not resulting in an acute lateral ankle sprain”
model of CAI consists of eight primary components: (1) primary tissue injury, (2) pathomechanical impairments, (3) sensory-perceptual impairments, (4) motor-behavioral impairments, (5) personal factors, (6) environmental factors, (7) component interactions, and (8) the spectrum of clinical outcomes. This model highlights the multifactorial aspects of CAI.7
Management of CAI has traditionally focused on biomechanical and physiological impairments with little focus on psychological aspects of living with this chronic condition.8 The evidence for including a psychosocial aspect in the management of CAI is poor and there is a significant gap in the current understanding of this condition.7 Previous authors propose that the fear of using the affected ankle can affect individuals with CAI.9,10 Patients with CAI may experience a reduced quality of life and limited social participation compared to those who have fully recovered from LAS.11 However, these assertions remain largely anecdotal without supporting data.
Contemporary models of persistent pain have identified the importance of thinking beyond muscles and joints.12 These findings may in some cases lead to better treatments and improved patients’ outcomes.13 Therefore, the focal point of this investigation was the patient’s experience of how CAI manifests in their lives. The aim of this study was to explore the thoughts and expectations of CAI-patients concerning their condition and expectations of care in an orthopedic setting.
This involved a thorough examination of the thoughts, experiences, and emotions that arise as a direct consequence of their life with CAI in hopes of addressing this knowledge gap by generating new insights and achieving a more profound understanding of the intricate psychosocial facets of CAI, which have thus far been inadequately explored.
METHOD DESIGN
A qualitative method was used to explore the psychological and social impact of CAI identifying themes within patients’ expectations and thoughts about care concerning their condition. The study utilized semi-structured one-toone interviews with nine patients who had been screened and diagnosed with CAI. The thematic analysis of the data
followed Malterud’s guidelines,14 employing systematic text condensation. This method is a descriptive and exploratory approach for conducting thematic cross-case analysis on various forms of qualitative data. Furthermore, the study adhered to the reporting guidelines outlined in the COREQ checklist,15 which is designed to enhance the transparency and quality of reporting in qualitative research.
This study set out to improve the understanding of those living with CAI. Interviews were conducted with inspiration from a phenomenological approach. A phenomenological approach enables the exploration of individual motivation and meaning, as it is grounded in the epistemological position that emphasizes the interconnectedness of meaning, lived experience, and language.16,17 The interviews in the project were conducted by five members of the project group (AM, HL, SZR, TS, AEJ).
RECRUITMENT
After being diagnosed with CAI, nine patients referred to conservative treatment were recruited through a secondary care orthopedic setting at Aalborg University Hospital from September 2021 – October 2021. Based on previous qualitative studies in other musculoskeletal conditions, it was estimated that a sample size of 8-10 participants would be sufficient.18,19 The goal was to enroll enough patients to attain data saturation, which was defined as the point in the data analysis where no new themes emerged. The study used purposive sampling to intentionally select patients diagnosed with CAI.20 Initially, the patients were seen for preliminary examination and subsequently referred to a physiotherapist (KBS) according to the inclusion and exclusion criteria in Table 1. KBS works as an extended scope practitioner with extensive experience in managing patients with ankle conditions at Aalborg University Hospital. The inclusion and exclusion criteria were derived from Delahunt et al. 2010, which is the selected criteria from the international ankle consortium in research in CAI.21
INTERVIEW DESIGN
The Foot and Ankle Outcome Score (FAOS) has been utilized as a self-reported measure of disability.22 This served as a guide in structuring “Main part 1” of the interviews, which covered themes related to “Symptoms,” “Pain,”
“I Feel Like I Have Lost Part Of My Identity” - A Qualitative Study Exploring The Impact Of Chronic Ankle International Journal of Sports Physical Therapy
“Function in daily life,” “Function, free time, and sport,” and "Quality of life.22 Additionally, “Main part 2” of the interview guide included themes such as “Injury history,” “Expectations,” and “Thoughts,” with the aim of incorporating psychosocial aspects into the interview discussions.23 Throughout the interviews, efforts were made to maintain consistency and uniformity, and to facilitate this, the researchers employed the interview guide (Appendix 1) as a reference for structuring the conversations. The interview guide was designed by the researchers and pilot tested on fellow researchers. Each patient was interviewed individually, and a second researcher assisted the interviewer in a comprehensive coverage of the interview guide. Prior to the interviews, all patients were provided written consent and verbal consent was also obtained before interviewing began.
DATA COLLECTION
All interviews were conducted in October 2021 by researchers AM, HL, SZR, TS, and AEJ. To ensure a comprehensive exploration of the participants’ experiences, semistructured interviews were chosen, allowing for specific topics to be covered while also providing patients with the opportunity to introduce new themes.24 The interviewers employed open-ended and in-depth questions, summarizing the patients’ responses to ensure valid interpretations of their statements.24 All interviews were recorded to ensure thorough transcriptions for analysis.
DATA ANALYSIS
Systemic text condensation was used as it allows for the creation of themes and codes inductively, capturing meaning and content without predetermined preconceptions, thus providing flexibility to generate a comprehensive and detailed account of the data.14 Audio files were listened to several times to check for accuracy, and transcriptions were read and re-read several times. All recordings underwent transcription using the slightly modified verbatim transcription method14 in Microsoft Word. To ensure a credible transcription, only wordings like “ah” and “ehm,” were corrected or removed as well as repetitions and mispronunciations. Anonymity of the patients was achieved by referring to them as “P” Furthermore, place names were omitted or replaced. The transcription style was used to ensure readability and reproduce the interview reliably 14,25
To process the transcribed interviews, Malterud’s systematic four-step analysis method was used.14 The data analysis had an inductive approach as the text condensation was prepared without the aim of identification of any specific themes.26 Data coding then identified and coded pertinent features of the data giving equal priority over the dataset. Each interview was processed individually, after which the material from all interviews was recontextualized and summarized in the fourth step. These steps were independently conducted by three researchers (AM, HL and SZR) who met to compare codes and develop agreement on the grouping of codes into themes. The generated themes were reviewed and refined, ensuring they explained
40-49 50-59
Ankle Right Left
Primary ankle distortion
12 months
12-24 months
24 months +
(55,6)
0 (0)
1 (11,1)
1 (11,1)
7 (77,8)
2 (22,2)
3 (33,3)
4 (44,4)
2 (22,2)
the identified themes in relation to the coded data and the dataset. After nine interviews, it was determined by the researchers that data saturation had occurred as no new themes or concepts were generated.
RESULTS
Patients’ ages ranged from 15-51 years of age with a duration of CAI from five months to five years. Table 2 presents patient demographics and characteristics. The interview duration ranged from 23 minutes to 42 minutes.
Seven major themes emerged from the data were: “Injury history and symptoms”, “Information from health professional”, “Management”, “Expectation and hope”, “Activity and participation”, “Identity” and “Support” The seven themes were subdivided into 14 subthemes (Table 3).
THEME 1: INJURY HISTORY AND SYMPTOMS
INJURY HISTORY
Participants reported that their primary injury was sportsrelated, including non-contact or contact injuries, often resulting from running, stopping, changing direction, landing, tackles, feints, or stumbling while walking on uneven ground. Among the participants, most injuries occurred during soccer or handball. Non-contact related injuries often happened on uneven terrain or were related to a lack of attention. Contact injuries were often linked to the intensity of the game. Many participants frequently experienced delayed pain from the sprain.
P1: “The first time I twisted my ankle it was during a feint and the second time I just ran straight out. No one was touching me or anything. I just twisted my ankle because I lack stability in my ankle.”
SYMPTOMS
The participants experienced varying symptoms including stiffness, locking, looseness, instability, pain with or with-
Patients (N=9) Frequency (%) Gender Female Male 7 (77,8) 2 (22,2)
Table 2. Patient demographics
Age (years)
10-19 20-29 30-39
2 (22,2) 5
“I Feel Like I Have Lost Part Of My Identity” - A Qualitative Study Exploring The Impact Of Chronic Ankle International Journal of Sports Physical Therapy
Themes
Injury history and symptoms
Information from health professional
Management
Expectation and hope
Activity and participation
Identity
Sub-themes
Symptoms
Injury history
Rehabilitation and treatment
Patient understanding and information from healthcare professionals
Mentally
Physically
Examination, information, and treatment
Free of symptoms
Image diagnostics
Limitations
Uncertainty
Identity
Exclusion
Fear
Support Support
out loading. Uneven ground, stairs, and normal walking were challenging for many patients. Additionally, most individuals also noted the presence of swelling and discoloration. For some, even ordinary walking could be quite taxing, underscoring the significant impact of the ankle injury on their daily quality of life.
P2: “There is pain in certain situations, such as climbing stairs and running. Sometimes it comes if I walk too far.”
THEME 2: INFORMATION FROM HEALTH PROFESSIONAL REHABILITATION AND TREATMENT
The treatments varied and included brochures, sports websites with rehabilitation instructions, and supervised exercise with a physiotherapist. Exercise on a balance board was common, and some received individualized rehabilitation while others received generalized training or “standard exercise programs” they felt did not suit their situation giving a sensation of receiving the same ‘standard exercises’ without any individualized creativity Some patients lost motivation in rehabilitation and stopped or prioritized other activities. Many were informed to quit their sport or find a new sport.
P7: “I feel like I am told the same thing every time. ‘Do some more exercises and it will get better’ 2-3 months pass and then I come back and get some new exercises.”
PATIENT UNDERSTANDING AND INFORMATION FROM HEALTHCARE PROFESSIONALS
Participants experienced conflicting information from healthcare professionals, leading to confusion and frustration. Several were told that LAS take a few weeks to heal, but they experienced a much longer process. Many found comfort in receiving a specific diagnosis, plan, prognosis,
and explanation, but others lacked answers and investigation. The patients emphasized the importance of word choice in their perception of the process, with terms like “looseness”, “hypermobile”, and “weak ankles” affecting their understanding. Some were told to live with the symptoms, while others were given support splints or surgery referrals.
P3: " I was told in the emergency room by the physiotherapist: ‘Normally this type of injury will go away within a few weeks’
THEME 3: MANAGEMENT MENTALLY
Some participants managed their ankle problems by adopting a positive mindset and shifting their focus. Participants described how it became easier for them to remain positive after some time had passed. Furthermore, several participants highlighted how their previous injury experiences influenced how their decided to manage their current problem. Dwelling on negative limitations negatively affected mood and prevented meaningful activities for some patients.
P6: “Yes, my ankle affects my mood. If I’m in pain, I get mad and irritated and sad. Whereas if it doesn’t hurt, I kind of forget about it and then I’m just happy ”
PHYSICALLY
Some managed their ankle problems by recognizing limitations and finding alternative activities. They adjusted their daily routines to participate in social life and work. Coping strategies included rest and ankle elevation, as well as avoiding aggravating situations. Few used pain medications. Conflicting information from healthcare profession-
Table 3. Themes and sub-themes identified during data analysis
“I Feel Like I Have Lost Part Of My Identity” - A Qualitative Study Exploring The Impact Of Chronic Ankle International Journal of Sports Physical Therapy
als often led to exercise avoidance. Patients preferred rehabilitation that was accessible and easy to incorporate into their daily routines.
P3: “When I sit at home, I always sit with my legs up and sometimes I have to take some painkillers for it, but that’s not what I want, so sometimes I just ignore the pain.”
THEME 4: EXPECTATION AND HOPE
EXAMINATION, INFORMATION, AND TREATMENT
Some hoped that the ankle was broken because they expected that would result in an easier detection and faster healing, while others had no expectations due to the selfresolving nature of sprains. Nonetheless, patients shared a common expectation for a comprehensive examination, clear explanation, and rehabilitation. Some patients desired targeted ankle exercises, while others hoped for supervised training to avoid errors. Overall, patients hoped that something could be done for them to return to normal life and sought prompt referral, investigation, and treatment from their doctor
P6: “I just came with an expectation and a hope that I could get an answer to what I can and can’t do. What will happen and answers to what it is and all that.”
FREE OF SYMPTOMS
Patients generally hoped and expected to improve following their injury. Some aimed for higher function than their current state, while others aimed to return to their preinjury level. Those with prior experience of self-resolving symptoms were more optimistic. Symptoms impacted patients differently, with some seeking pain relief and others seeking increased stability to prevent further injury Patients understood that additional sprains would damage ankle ligaments and require restarting rehabilitation.
P2: “I hope I can participate in everything I usually domatches and training without it being overloaded. I expect and hope that at least.”
IMAGE DIAGNOSTICS
Patients expected that diagnostic imaging would clarify their symptoms. X-rays were deemed insufficient for sprains, and an MRI was preferred. Some patients received an X-ray or MRI and desired follow-up scans to monitor progress. Frustration arose from discrepancies between persistent symptoms despite rehabilitation and the absence of pathology on images.
P7: “ when you are told that they cannot see anything on the scans, you think it must be positive - but why am I still in pain? even after following rehabilitation programs.”
THEME 5: ACTIVITY AND PARTICIPATION
LIMITATIONS
Patients experienced limitations in their sports, physical activities and social life preventing them from following their dreams. Many felt limitations when comparing to their peers and pain led to avoiding exposure. Some continued gym training but avoided leg exercises. Simple activities like walking were limited and required more concentration.
P6: “I wouldn’t dare to join in if my friends are out playing paddle-tennis, or something else where my foot would be more in the risk zone.”
UNCERTAINTY
Some experienced high levels of uncertainty regarding prognosis, diagnosis, and guidelines. Some felt frustrated by their inability to provide employers and coaches a timeframe for return, which for some led to feelings of exclusion. The uncertainty surrounding diagnosis and guidelines caused confusion and fear of doing something wrong, leading to abstaining from activity Conflicting information further contributed to confusion and uncertainty
P6: “The physiotherapist said that I could train, but I had just been told that I could not train, so I was just a bit uncertain about what I could and could not do. So, I just listened to myself and it felt like I shouldn’t do anything because of pain.”
THEME 6: IDENTITY
IDENTITY
Most of the patients found it mentally tough and unfair to be in their situation. Sports-active patients felt limited by having to stop or reduce their sport, which was part of their identity. Some experienced a sense of personal weakness and frustration from not being able to become who they desired to be. Stopping the sport, you’ve dedicated your entire life to was experienced as particularly challenging, as it felt like losing a part of yourself.
P1: “The thing about when you usually do as much sport as I do, you feel a bit like you’re losing a part of yourself, as you can’t participate like you usually do.”
EXCLUSION
Not participating in activities was experienced as a feeling of exclusion from their community, causing them to miss out on social interactions with friends and teammates. Sports-active patients experienced being left out during matches and had to exclude themselves from the sports they loved.
P1: “We had a party the other day All the others walked to the party, which was approximately 3 km. I had to say that I could not go that far, and instead was driven by my
“I Feel Like I Have Lost Part Of My Identity” - A Qualitative Study Exploring The Impact Of Chronic Ankle International Journal of Sports Physical Therapy
parents. Sometimes you miss out on common things you want.”
FEAR
Many feared re-spraining their ankle during activities and making the injury worse or permanent. This fear led to avoidance of certain activities. There were doubts about the adequacy of their medical examination, because of ongoing problems which resulted in a fear of serious pathology For some, this fear created negative thoughts about the future.
P2: “I’m afraid there is something there that shouldn’t be, something that might not have been discovered.”
THEME 7: SUPPORT
SUPPORT
Patients experienced practical and emotional support from their family and friends. Some patients found hope for recovery through their social network, which facilitated a sense of normality despite their injury. Friends and family served as a motivation for patients to stay active. However, some patients found it challenging to communicate their situation to their social circle, and it often took time for them to understand the severity of the issue.
P2: “I think people think that you are being dramatic at first, but then they find out that it is serious when you stop participating.”
DISCUSSION
MAIN FINDINGS
This is the first qualitative inquiry to investigate the experience of individuals with CAI. Interviews and subsequent analysis explored participants thoughts about their current condition as well as expectations for their consultations in a secondary care orthopedic setting.
FEAR
Several of the patients expressed fear of re-spraining the ankle and making their condition worse. This fear meant less use of the ankle daily as well as during training. These findings can provide a deeper understanding about why previous research has found that a high degree of avoidance behavior is seen in patients with CAI.9,10,27 It was discovered that the interpretation of given information is heavily influenced by the way it is delivered. Patients experienced that the information leaflet given to patients with LAS illustrate that walking on uneven ground must be avoided to avoid chronic damage and pain after LAS. This may lead to a fear of using the symptomatic ankle as well as thoughts of disaster for the future if later sprain should occur. This suggests a need to adjust communication approaches with patients, placing emphasis on presenting information in a non-threatening manner when appropriate.
INFORMATION
Information from healthcare professionals also seemed to be important in terms of explaining the condition and prognosis. Several of the patients experienced frustration from not being able to give a timeframe for return to work or sport. In patients with CAI, it can be difficult to give a specific prognosis, as it varies greatly from patient to patient.28 One way of rectifying this could be by setting sport or work specific sub-goals, which must be met before the patient can return to the main goal.29,30 This way the patient has something specific to give to the employer or coach.
IMPORTANCE
The hopes and expectations for improvement are related to pain, function, and specific goals. An alignment of expectations between the patient and the healthcare professional early on seems to be important, to avoid discrepancy between the effects of the treatment and the expectations.31 It is important to involve the patient in setting realistic goals.32 Several patients experienced being told that they had to learn to live with their symptoms without further explanation. If an explanation of symptoms and a realistic alignment of expectations is given to the patient at the start of the process, it may be possible to avoid misunderstanding.33
IDENTITY
Patients with CAI have a reduced quality of life compared to healthy individuals,11 which is consistent with several patients’ statements. An experience of losing a part of their identity due to the lack of physical activity was described. This has also been seen in patients with anterior cruciate ligament injuries.29,34 Patients experience a feeling of being excluded from the community due to low participation in their sport or social contexts. These statements could possibly be a main reason the low quality of life and an should be an important focus area for the healthcare profession. The aim is to keep the patient in important activities and relationships, as this may lead to a sense of normality and preservation of identity 35 A large proportion of the participants in this study were young individuals, and the impact of being unable to engage in sports may be more significant among them due to the significant role social activities play in sports participation.
BIO-PSYCHOSOCIAL
Several patients expressed a high degree of frustration and uncertainty based on symptoms lasting longer than they had been told. They expressed that imaging (e.g., MRI) could make them more aware of their symptoms, which can enhance a biomedical understanding. In addition, some patients reported that they were afraid of whether their injury had been adequately investigated, as they were still in pain. Within musculoskeletal problems, it is generally important for patients to understand their symptoms.36 Healthcare professionals may need to focus on returning the patient to
“I Feel Like I Have Lost Part Of My Identity” - A Qualitative Study Exploring The Impact Of Chronic Ankle International Journal of Sports Physical Therapy
meaningful activities through sub-goals and also assist in changing the patient’s view of their condition. This is supported by the fact that a connection is not necessarily seen between the initial trauma and the development of CAI, which highlights the importance of other factors.37
STUDY LIMITATIONS AND STRENGTHS
Three authors coded all transcripts, and this study employed a clear, transparent, and reproducible methodological approach to data analysis. The authors all have clinical and research backgrounds firmly rooted in the biopsychosocial framework, which could have influenced the manner in which the interviews were conducted. However, the authors maintain the belief that adhering transparently and rigorously to the described methods has limited impact on the findings.
The main limitation of this study is that for pragmatic reasons, a convenience sampling technique was used. It is possible that this sample may differ from other samples within Denmark (or elsewhere in the world), and how representative these findings are to the greater population of individuals with CAI is unknown. The patients included in this study were all referred to a specialized hospital unit that managed foot and ankle issues. They may not represent the average CAI patients managed in primary care. A purposive sampling technique may have better represented sociodemographic groups or targeted identifiable subgroups. It is worth noting however, that the interview guide was prepared with utilizing the themes of FAOS and psychological factors. This was done to ensure that themes would be uncovered which have previously been shown to be relevant for this patient group. The challenge was, however, that the interviews risked being too narrow, limiting the emergence of new themes.
Another potential limitation of the study is the variance in interviewing styles among the five interviewers who conducted the interviews. Efforts were made to standardize the process through collaborative development of the interview guide and pilot interviews. However, individual interviewer
styles may have uncovered the complex phenomenon from various angles.
CONCLUSION
These findings offer an insight into the experience of individuals living with CAI that far exceed mechanical and functional issues related to the ankle. Patients experienced a loss of identity, having to manage uncertainty regarding their diagnosis and prognosis, and had hopes of being able to explain their condition. Furthermore, individuals may experience a loss of physical and functional abilities, confusion related to pain, and difficulty in making sense of their pain, accompanied by pain-related fear The current findings suggest that future research is warranted into biopsychosocial targeted interventions to understand the impact and interpretation of medical terminology in patients with CAI.
CONFLICTS OF INTEREST
The authors report no conflicts of interest.
DATA SHARING STATEMENT
Quotations and further details are available from Anders Mohrsen: anders-mohr@hotmail.com
Henrik Lund: henriklund91@hotmail.com
Steven Zartov Rasmussen: steven_z_r@hotmail.com
Thomas Sørensen: Thomas.Soerensen1@rsyd.dk
Asger Jensen: asger.jensen94@gmail.com
Submitted: November 04, 2023 CST, Accepted: January 15, 2024 CST
© The Author(s)
This is an open-access article distributed under the terms of the Creative Commons Attribution 4.0 International License (CCBY-NC-4.0). View this license’s legal deed at https://creativecommons.org/licenses/by-nc/4.0 and legal code at https://creativecommons.org/licenses/by-nc/4.0/legalcode for more information.
“I Feel Like I Have Lost Part Of My Identity” - A Qualitative Study Exploring The Impact Of Chronic Ankle International Journal of Sports Physical Therapy
REFERENCES
1. Gribble PA, Bleakley CM, Caulfield BM, et al. Evidence review for the 2016 International Ankle Consortium consensus statement on the prevalence, impact and long-term consequences of lateral ankle sprains. Br J Sports Med 2016;50(24):1496-1505. do i:10.1136/bjsports-2016-096189
2. Fong DTP, Hong Y, Chan LK, Yung PSH, Chan KM. A systematic review on ankle injury and ankle sprain in sports. Sports Med. 2007;37(1):73-94. doi:10.2165/ 00007256-200737010-00006
3. Gerber JP, Williams GN, Scoville CR, Arciero RA, Taylor DC. Persistent disability associated with ankle sprains: a prospective examination of an athletic population. Foot Ankle Int 1998;19(10):653-660. do i:10.1177/107110079801901002
4. Konradsen L, Bech L, Ehrenbjerg M, Nickelsen T Seven years follow-up after ankle inversion trauma. Scand J Med Sci Sports. 2002;12(3):129-135. doi:10.10 34/j.1600-0838.2002.02104.x
5. Gribble PA, Delahunt E, Bleakley CM, et al. Selection criteria for patients with chronic ankle instability in controlled research: a position statement of the International Ankle Consortium. J Athl Train. 2014;49(1):121-127. doi:10.4085/1062-605 0-49.1.14
6. Hertel J. Functional anatomy, pathomechanics, and pathophysiology of lateral ankle instability. J Athl Train. 2002;37(4):364-375.
7 Hertel J, Corbett RO An updated model of chronic ankle instability J Athl Train 2019;54(6):572-588. do i:10.4085/1062-6050-344-18
8. McKeon PO, Donovan L. A perceptual framework for conservative treatment and rehabilitation of ankle sprains: An evidence-based paradigm shift. J Athl Train 2019;54(6):628-638. doi:10.4085/1062-6050-47 4-17
9. Suttmiller AMB, McCann RS. Injury-related fear in individuals with and without chronic ankle instability: A systematic review J Sport Rehabil 2021;30(8):1203-1212. doi:10.1123/jsr.2021-0015
10. Fukano M, Mineta S, Hirose N. Fear avoidance beliefs in college athletes with a history of ankle sprain. Int J Sports Med. 2020;41(2):128-133. doi:10.1 055/a-1065-1940
11. Kosik KB, Johnson NF, Terada M, ThomasFenwick AC, Mattacola CG, Gribble PA. Healthrelated quality of life among middle-aged adults with chronic ankle instability, copers, and uninjured controls. J Athl Train 2020;55(7):733-738. doi:10.408 5/1062-6050-190-19
12. Nijs J, Roussel N, Paul van Wilgen C, Köke A, Smeets R. Thinking beyond muscles and joints: therapists’ and patients’ attitudes and beliefs regarding chronic musculoskeletal pain are key to applying effective treatment. Man Ther 2013;18(2):96-102. doi:10.1016/j.math.2012.11.001
13. Kent P, Haines T, O’Sullivan P, et al. Cognitive functional therapy with or without movement sensor biofeedback versus usual care for chronic, disabling low back pain (RESTORE): a randomised, controlled, three-arm, parallel group, phase 3, clinical trial. Lancet. 2023;401(10391):1866-1877. doi:10.1016/s014 0-6736(23)00441-5
14. Malterud K. Kvalitative metoder i medisinsk forskning en innføring, 2.utg. Nord J Nurs Res. 2003;23(2):50-50. doi:10.1177/010740830302300212
15. Tong A, Sainsbury P, Craig J. Consolidated criteria for reporting qualitative research (COREQ): a 32-item checklist for interviews and focus groups. Int J Qual Health Care 2007;19(6):349-357 doi:10.1093/intqhc/ mzm042
16. Appleton JV, King L. Journeying from the philosophical contemplation of constructivism to the methodological pragmatics of health services research. J Adv Nurs 2002;40(6):641-648. doi:10.104 6/j.1365-2648.2002.02424.x
17. Davidsen AS. Phenomenological approaches in psychology and health sciences. Qual Res Psychol. 2013;10(3):318-339. doi:10.1080/14780887.2011.6084 66
18. Jones S, Hanchard N, Hamilton S, Rangan A. A qualitative study of patients’ perceptions and priorities when living with primary frozen shoulder. BMJ Open. 2013;3(9):e003452. doi:10.1136/bmjope n-2013-003452
19. Mc Auliffe S, Synott A, Casey H, Mc Creesh K, Purtill H, O’Sullivan K. Beyond the tendon: Experiences and perceptions of people with persistent Achilles tendinopathy. Musculoskelet Sci Pract. 2017;29:108-114. doi:10.1016/j.msksp.2017.0 3.009
“I Feel Like I Have Lost Part Of My Identity” - A Qualitative Study Exploring The Impact Of Chronic Ankle International Journal of Sports Physical Therapy
20. Etikan I. Comparison of convenience sampling and purposive sampling. Am J Theor Appl Stat. 2016;5:1. doi:10.11648/j.ajtas.20160501.11
21. Delahunt E, Coughlan GF, Caulfield B, Nightingale EJ, Lin CWC, Hiller CE. Inclusion criteria when investigating insufficiencies in chronic ankle instability Med Sci Sports Exerc 2010;42(11):2106-2121. doi:10.1249/mss.0b013e3181 de7a8a
22. Golightly YM, Devellis RF, Nelson AE, et al. Psychometric properties of the foot and ankle outcome score in a community-based study of adults with and without osteoarthritis. Arthritis Care Res 2014;66(3):395-403. doi:10.1002/acr.22162
23. O’Sullivan PB, Caneiro JP, O’Keeffe M, et al. Cognitive functional therapy: An integrated behavioral approach for the targeted management of disabling low back pain. Phys Ther 2018;98(5):408-423. doi:10.1093/ptj/pzy022
24. Kvale S, Brinkmann S. Interview: det kvalitative forskningsinterview som håndværk 3rd ed. Hans Reitzel; 2015.
25. Krefting L. Rigor in qualitative research: the assessment of trustworthiness. Am J Occup Ther 1991;45(3):214-222. doi:10.5014/ajot.45.3.214
26. Lindahl M, Juhl C. Den sundhedsvidenskabelige opgave: vejledning og værktøjskasse. 3rd ed. Munksgaard; 2016.
27 Houston MN, Hoch JM, Hoch MC. College athletes with ankle sprain history exhibit greater fearavoidance beliefs. J Sport Rehabil 2018;27(5):419-423. doi:10.1123/jsr.2017-0075
28. Ferreira JN, Vide J, Mendes D, Protásio J, Viegas R, Sousa MR. Prognostic factors in ankle sprains: a review EFORT Open Rev 2020;5(6):334-338. doi:10.1 302/2058-5241.5.200019
29. Ohji S, Aizawa J, Hirohata K, et al. Athletic identity and sport commitment in athletes after anterior cruciate ligament reconstruction who have returned to sports at their pre-injury level of competition. BMC Sports Sci Med Rehabil 2021;13(1):37. doi:10.1186/s13102-021-00264-6
30. Smith MD, Vicenzino B, Bahr R, et al. Return to sport decisions after an acute lateral ankle sprain injury: introducing the PAASS framework-an international multidisciplinary consensus. Br J Sports Med 2021;55(22):1270-1276. doi:10.1136/bjsports-20 21-104087
31. Bialosky JE, Bishop MD, Cleland JA. Individual expectation: an overlooked, but pertinent, factor in the treatment of individuals experiencing musculoskeletal pain. Phys Ther. 2010;90(9):1345-1355. doi:10.2522/ptj.20090306
32. Spink A, Wagner I, Orrock P Common reported barriers and facilitators for self-management in adults with chronic musculoskeletal pain: A systematic review of qualitative studies. Musculoskelet Sci Pract. 2021;56:102433. doi:10.1016/ j.msksp.2021.102433
33. Carlson H, Carlson N. An overview of the management of persistent musculoskeletal pain. Ther Adv Musculoskelet Dis. 2011;3(2):91-99. doi:10.1177/1 759720x11398742
34. Brewer BW, Cornelius AE. Self-protective changes in athletic identity following anterior cruciate ligament reconstruction. Psychol Sport Exerc 2010;11(1):1-5. doi:10.1016/j.psychsport.2009.09.005
35. Stern BZ, Njelesani J, Howe TH. Transitioning from hurting to healing: self-management after distal radius fracture. Disabil Rehabil 2022;44(21):6277-6286. doi:10.1080/09638288.2021.1 962990
36. Toye F, Seers K, Allcock N, et al. Patients’ experiences of chronic non-malignant musculoskeletal pain: a qualitative systematic review Br J Gen Pract 2013;63(617):e829-e841. doi:10.3399/ bjgp13x675412
37 Briet JP, Houwert RM, Hageman MGJS, Hietbrink F, Ring DC, Verleisdonk EJJM. Factors associated with pain intensity and physical limitations after lateral ankle sprains. Injury 2016;47(11):2565-2569. doi:10.1 016/j.injury.2016.09.016
“I Feel Like I Have Lost Part Of My Identity” - A Qualitative Study Exploring The Impact Of Chronic Ankle International Journal of Sports Physical Therapy
SUPPLEMENTARY MATERIALS
Appendix
Download: https://ijspt.scholasticahq.com/article/92908-i-feel-like-i-have-lost-part-of-my-identity-a-qualitativestudy-exploring-the-impact-of-chronic-ankle-instability/attachment/194357.docx?auth_token=6tq9e34VcT7YgWOsLrQ
“I Feel Like I Have Lost Part Of My Identity” - A Qualitative Study Exploring The Impact Of Chronic Ankle International Journal of Sports Physical Therapy
Original Research
An Interval Throwing Program for Baseball Pitchers Based upon
Workload Data
Michael M. Reinold1,2a , Brittany Dowling3 , Glenn S. Fleisig4 , Leonard C. Macrina2 , Kevin E. Wilk4 , John T. Streepy5 , James R. Andrews4
1 Chicago White Sox, 2 Champion PT and Performance, 3 Midwest Orthopedics at Rush, 4 American Sports Medicine Institute, 5 Rush University Medical College
Keywords: elbow torque, baseball, long-toss, pitching, rehabilitation, workload management, UCL, Tommy John https://doi.org/10.26603/001c.94146
International Journal of Sports Physical Therapy
Background
Interval throwing programs (ITP) have been used for decades to enable baseball pitchers to return to competition after injury or surgery by gradually applying load to the throwing arm. Past programs have been based on personal experience; however, advances in our understanding of the biomechanics and workloads of throwing allow for a more modern data-based program to be developed.
Hypothesis/Purpose
To 1) develop a updated ITP for rehabilitation of modern baseball pitchers based upon biomechanical and throwing workload data, and 2) compare the updated program with a past program to determine differences in chronic workload and acute:chronic workload ratios (ACWR).
Study Design
Cross-sectional study
Methods
Workloads (i.e. daily, acute, chronic, and ACWR) for the original ITP were built from the prescribed throwing schedule. Elbow varus torque per throw was calculated based upon a relationship between elbow varus torque and throwing distance. Throw counts, daily/ chronic/acute workloads, and ACWR were calculated and plotted over time. A new ITP was built to model current pitcher’s throwing schedules and gradually increased ACWR over time.
Results
The original ITP had a throwing schedule of 136 days, final chronic workload 15.0, and the ACWR above or below the “safe” range (i.e. 0.7 – 1.3) for 18% of the program with a peak of 1.61. The updated ITP was built to consist of a 217-day schedule, final chronic workload of 10.8, and deviated from the safe range for 9% of the program, with a peak of 1.33.
Conclusion
The newly created ITP is more familiar to modern baseball pitchers while exhibiting a more gradual buildup of chronic workload than traditional ITP programs. This ITP may be used to return baseball pitchers back to competition as safely and efficiently as possible, and potentially with less risk of setbacks or reinjury The ITP may be used following common injuries or surgeries to the throwing shoulder and elbow, such as
a
Corresponding Author:
Michael M. Reinold, PT, DPT, ATC, CSCS, Champion PT and Performance, 110 Clematis Ave Suite 2, Waltham, MA 02453, mikereinold@champ.pt
Twitter: @mikereinold Reinold MM, Dowling B, Fleisig GS, et al. An Interval Throwing Program for Baseball Pitchers Based upon Workload Data. IJSPT. Published online March 1, 2024. doi:10.26603/001c.94146
Tommy John surgery, while also serving as a basis for future development of shorter duration ITPs.
Level of Evidence 2c
INTRODUCTION
Injuries to the upper extremity in baseball pitchers continue to rise across all levels of play.1‑4 Many shoulder and elbow injuries - such as injuries to the ulnar collateral ligament (UCL), rotator cuff, and glenohumeral capsulolabral complex - often require surgical intervention and an extensive period of rehabilitation. As pitchers prepare to return to competition after these injuries, interval throwing programs (ITP) are used to progressively apply load to the healing tissue. Several ITPs have been published,5‑10 with a wide variety of recommendations regarding the distances, intensities, frequency, and volume between programs.
The most widely used program in the baseball community comes from Reinold et al,10 which was published over 20 years ago. While historically this ITP has been used successfully to rehabilitate thousands of players and in a variety of published outcome studies,11‑14 the development was based upon expert opinion and limited knowledge of throwing biomechanics at that time. Since its original publication, we have seen advances in our understanding of the biomechanics of throwing, as well as a better understanding of training workloads and correlation to injury risk.15 In addition, the game of baseball has evolved over the last 20 years, specifically how pitchers prepare for competition. Pitchers at all levels of play are throwing with more velocity and less downtime in an attempt to better prepare themselves throughout the season.
The concept of monitoring chronic workload and acute:chronic workload ratio (ACWR) have been popularized by Gabbett and his colleagues.16‑18 ACWR is the ratio between the average daily workload over the previous 7-day bucket compared to the workload of the previous 28 days. Studies in field sports and lower extremity injuries have shown that athletes have a higher chance of injury when ACWR exceeds 1.3.19‑23 In baseball, pitchers who had an ACWR of 1.27 or greater had a 14.9% higher chance of injury 23 Thus, it is important to build an ITP that progressively builds an appropriate amount of chronic workload to prepare the athlete for competition, while assuring a gradual progression of ACWR.
With a better understanding of the biomechanics of throwing, the different components of an ITP, and how to quantify training loads as throwing programs progress, a modern version of an ITP that incorporates this with the current state of baseball training is needed. It is important that an ITP reflects the needs and common practices of the modern baseball player. Therefore, the primary purpose of this paper was to create an updated ITP based on our current understanding of the biomechanics of throwing, healing of soft tissue of throwing related injuries, and the authors’ clinical experience working within baseball. This updated ITP will assure a gradual buildup of chronic
workload to a desired level while staying within acceptable ACWR. The secondary purpose was to compare throwing days, chronic workload, and ACWR to projected workloads of the original ITP by Reinold et al.10 We hypothesize that the updated ITP will have a more gradual chronic workload progression while spending a larger percentage of the program within the desirable ACWR.
METHODS
Elbow varus torque and workload for the throws in the original ITP10 were calculated using the methods and models described by Dowling et al.9 In order to determine elbow varus torque for each prescribed throw, data were mined from Motus Global’s MotusBaseball sensor (now Driveline Pulse; Driveline Baseball, Kent, WA) database. A total of 238,611 anonymized flat-ground throws were extracted from one NCAA-Division 1 team using only healthy players (n=34, 186 ± 7 cm, 89.4 ± 10.8 kg). Of these, 111,196 flatground throws were tagged with as ‘long-toss’ with a distance ranging from 30 ft and 300 ft. Distances with over 1,000 throws were used in the model. A 2nd order polynomial regression was created to classify a relationship between throwing distance (x in ft) and peak elbow varus torque (Nm) (Figure 1).
DEVELOPMENT OF THE UPDATED INTERVAL THROWING PROGRAM
An updated program was created with the goal of the program to create a safe increase in workload but also mimic a more familiar baseball throwing progression for the modern pitcher See supplemental file for Table 1 - Long Toss ITP and Table 2 - Mound ITP Trends in baseball training and throwing programs have progressed over the years. We wanted to make the updated program more similar to typical throwing programs being used within baseball by healthy players, and clearer by providing an exact throwing schedule with exact distances and throw counts each day. The original ITP listed ‘Phases’ and instructed pitchers to complete each phase twice before moving on, meaning the pitcher throws the exact same count and distance twice at each phase. We created the updated program to list each specific throwing day, also termed ‘Steps’, with changes in throw counts, distance, and intensity every day (or step). We also removed throw count ranges to eliminate ambiguity and varying workload.
Daily workload was the accumulation of the torque from every throw in a given day Acute workload was calculated as a 7-day rolling average of daily load and chronic workload was calculated as a 28-day rolling average of daily load.9 Similar to Dowling et al,9 the updated program was developed to maintain an optimal ACWR while increasing
An Interval Throwing Program for Baseball Pitchers Based upon Workload Data International Journal of Sports Physical Therapy
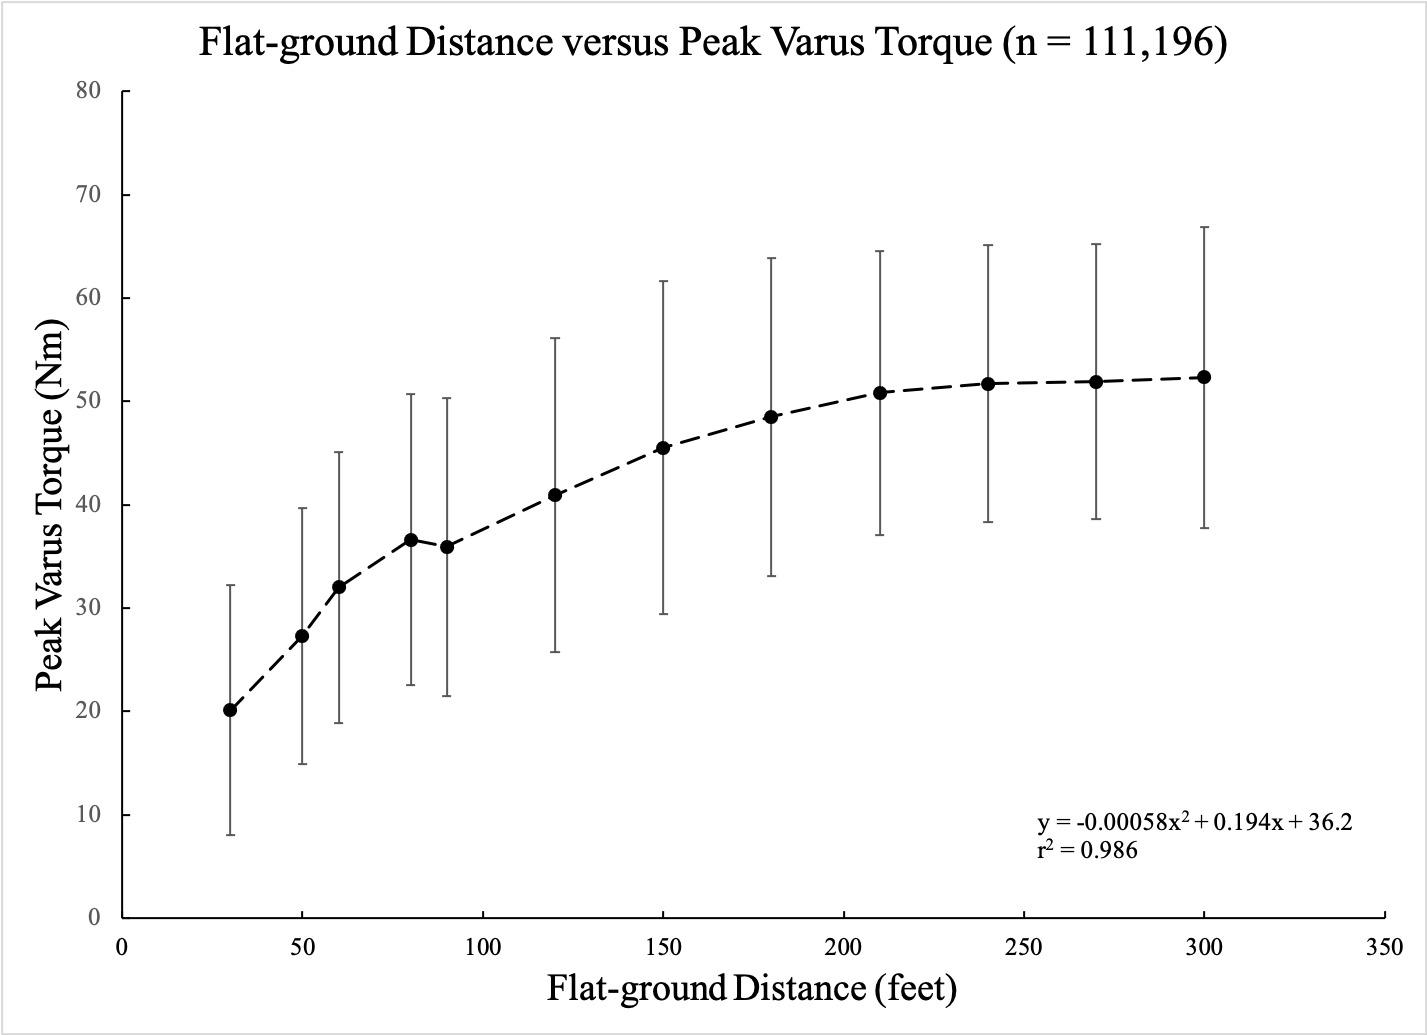
the chronic workload throughout the program. The updated program started off gradually, with a pitcher throwing 30 ft. This was done to allow for a pitcher to become more confident with throwing after an injury and to slowly build chronic workload. Throwing was scheduled for 3 times a week, until Week 22. Throwing every other day with 2 days off in the these first 22 weeks has shown to keep the ACWR in check without large oscillations as seen in the original program.9 Throwing volume and throwing distance were gradually increased until 120 ft was achieved (Week 11-12). Long toss throwing included throwing with a step and an arc to allow distance to dictate the intensity, and progress to throwing on a line. Pitchers were then instructed to pitch from the flat-ground for two weeks to get reaccustomed to the pitching motion from a stationary position before progressing to the mound (Week 16).
The mound progression consisted of light and heavy flat-ground days, bullpen sessions, and light catch. Heavy load long toss days include pulldowns, with the athlete instructed to take a shuffle step and then throw with intent on a line. Fastball pitches started at 50% effort and increased to 75%, 90%, and 100%. Pitchers were allowed to start throwing change-ups in Week 19 and breaking balls in Week 23. Because the elbow varus torque observed between different pitch types has not been found to be significantly different,24‑26 the percentage of different pitch types was not specifically allocated for in the program. This allowed each pitcher to individualize the program based on the types of pitches thrown.
The updated program also incorporated in ‘deload’ weeks multiple times throughout the course of the program. These weeks were programmed in at 4 spaced out times, at Weeks 7, 14, 22, and 29. Deload weeks consisted
of light throwing only and each deload week was different throughout the program in order to keep the ACWR near the low end of the desired range.
WORKLOADS FOR THE ORIGINAL ITP
Workloads (i.e. daily, acute, chronic, and ACWR) for the original ITP were built from the prescribed throwing schedule. The original ITP instructed pitchers to throw every other day and perform each phase 2 times before advancing to the next phase. Warm-up throws were prescribed at 30-45 ft and then to progress to the designated distance. To account for this, warm-up throws were codified with 5 throws at each distance starting at 30 ft and progressing 15 ft (45 ft distance) and then 30 ft after that to the prescribed throwing distance for that day The original ITP had specific throw counts for each distance until 75 ft, and then provided ranges at each distance after that (i.e. 75 ft 20-25 times). To standardize the throw counts for distances when ranges were given, the median throw of the range was used (i.e. range was 20-25, 23 throws was used in the code).
For the mound progression, the throws were prescribed with various intensities (e.g. 15 throws at 50%). Previous research has shown that asking pitchers to throw at decreased intensity, there was not a proportionate decrease in ball velocity or elbow varus torque.15,27 Therefore, we used Dowling et al’s9 linear regression model of prescribed intensity and resulting torque.
Stage 3 of the original ITP allowed for players to start pitching breaking ball pitches. These were instructed to throw with decreased intensity compared to the fastball pitches. Biomechanical studies have shown that resultant loads in the throwing arm are similar for the fastball and
Figure 1. 2nd order polynomial regression model of long-toss distance and elbow valgus torque in 111,196 throws.
An Interval Throwing Program for Baseball Pitchers Based upon Workload Data International Journal of Sports Physical Therapy
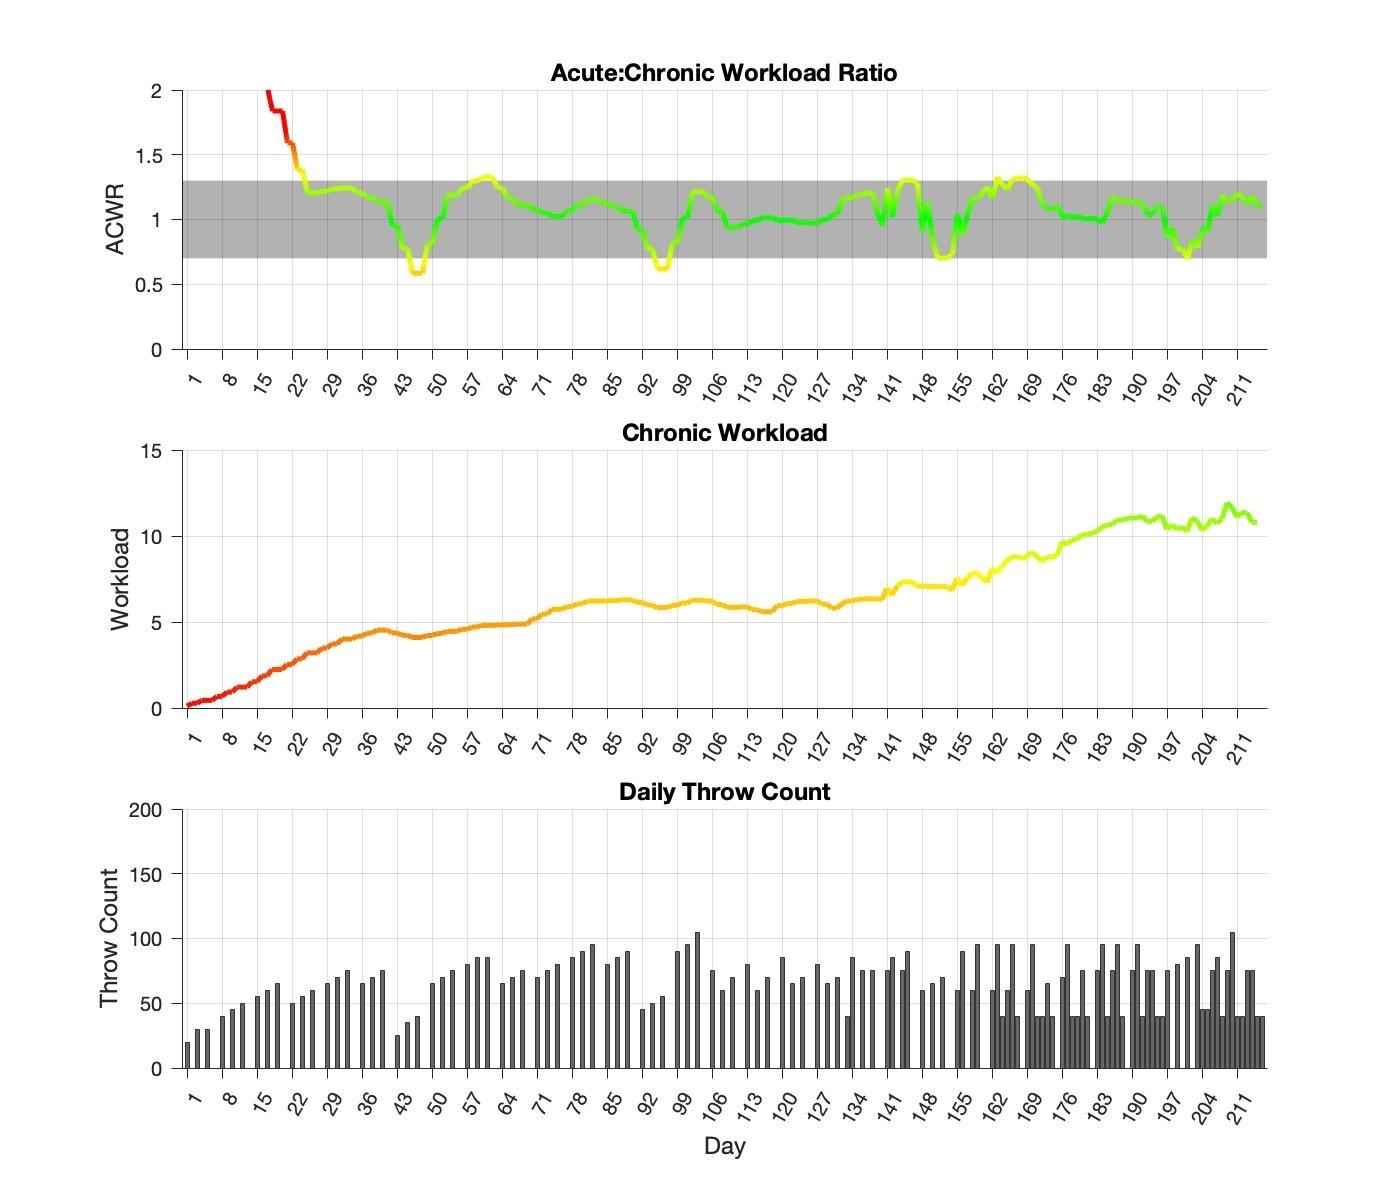
(A)
curveball in pitchers.24‑26 Thus, pitch types were not differentiated and fastball elbow varus torque was used for the workload calculations. However, we delineated between intensity when identified in the original program.
RESULTS
The updated program was comprised of a 217-day schedule (Figure 2). The flat-ground progression was a total of 105 days with 45 of them being throwing days. The mound progression consisted of 112 days with 75 of them were throwing days. The program finished with a chronic workload of 10.8. After the initial 28 days, the updated program’s ACWR exceeded 1.3 eleven times, and below 0.7 seven times. ACWR stayed within the safe range (0.7 - 1.3) for 91% of the program, peaking at 1.33, or 2% over the desired range.
The original program consisted of a 136-day throwing schedule with the first 72 days in the flat-ground progression and 64 days in the mound progression (Figure 3). Actual days throwing were 24 and 22 for the flat-ground and mound progressions, respectively The original program finished with a chronic workload of 15.0. During the original program, the ACWR deviated above the safe-threshold of 0.7-1.3, two and seventeen times, respectively. ACWR fell within the safe range for 82% of the program and peaked at 1.61, or 24% higher than the desired range.
DISCUSSION
The original ITP developed by Reinold et al10 has been utilized for decades without significant updates to the program. This program was designed based on the clinical experience of the authors and with limited biomechanical
Figure 2. Throwing workload characteristics of the Updated ITP.
Acute:Chronic workload ratio over the 216-day program; (B) Calculated chronic throwing workload; (C) Daily number of throws performed in ITP The colors on the graphs represent deviations away from the optimal chronic workload of 15.0 (green), ± 1 standard deviation (yellow), ± 2 standard deviation (orange), and ± 3 standard deviation (red). The grey band on figure A represents the ACWR safe’ range of 0.7-1.3.
An Interval Throwing Program for Baseball Pitchers Based upon Workload Data International Journal of Sports Physical Therapy
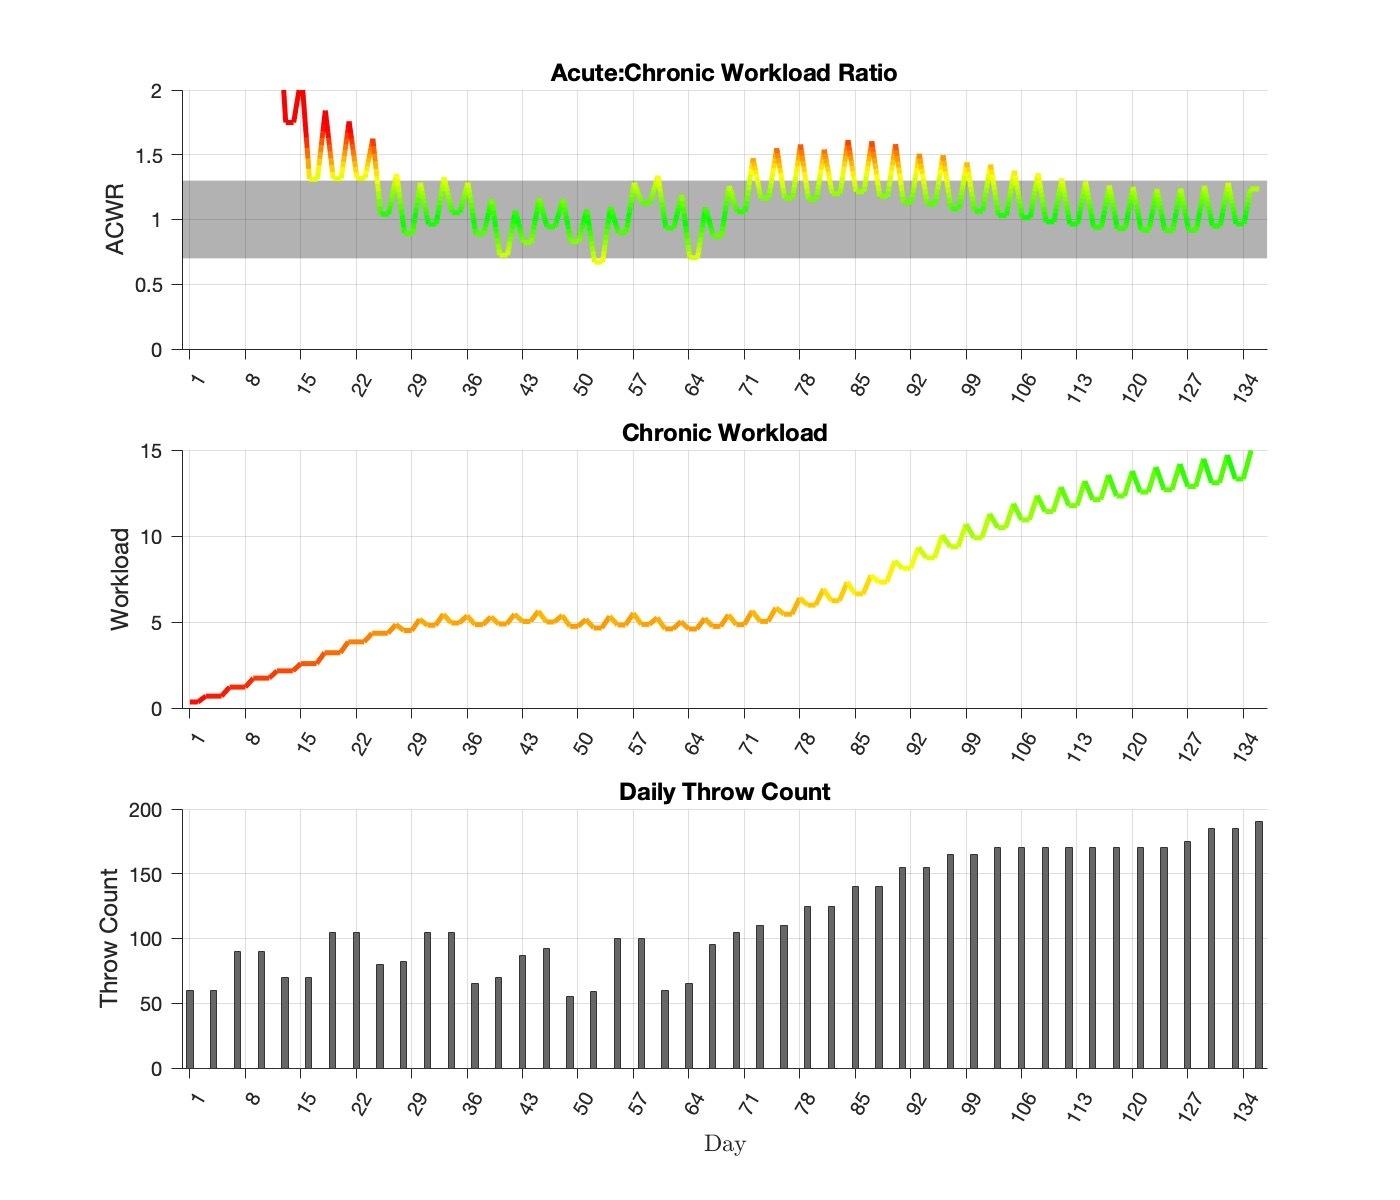
(A)
evidence. However, our understanding of the biomechanics of ITPs and workload implications have evolved significantly since its publication. Anecdotally, traditional ITPs have come under recent criticism by baseball coaches and players as not meeting the needs of the modern baseball pitcher. Therefore, an updated program was designed that considers a modern approach to baseball throwing programs. This ITP was designed to represent a modern throwing program that is commonly performed and familiar to baseball pitchers. It eliminates some of the variables of the original program such as sets and repetitions of throws, breaks during a throwing session, and repeating steps several times without progressing.
The updated ITP did an excellent job at progressing chronic workload and ACWR. This program builds to a final chronic workload of 10.8 over a 7-month period. In comparison to the original program, that finished with a final
chronic workload of 15.0 in a much shorter amount of time. This longer and more gradual progression in the updated ITP may be beneficial to the healing tissues and may be more tolerable as modern pitchers are throwing with higher velocity and load to the arm.
In a study on baseball pitching workloads, Mehta et al28 reported that higher chronic workloads were associated with an increased risk of injury. In-season chronic workloads have been observed to be between 12-15 in high school,28 as well as in college and professional baseball pitchers (Motus Global unpublished). Since the purpose of the ITP is to return an injured pitcher back to competition, the chronic workload at the conclusion of the ITP should approach, not meet, the maximum chronic workloads observed during a normal season. Rather, it should allow room to increase as the pitcher finishes their rehab assignment (i.e. throwing live at-bats, simulated games, incre-
Figure 3. Throwing workload characteristics of original ITP.
Acute:Chronic workload ratio over the 136-day program; (B) Calculated chronic throwing workload; (C) Daily number of throws performed in ITP The colors on the graphs represent deviations away from the optimal chronic workload of 15.0 (green), ± 1 standard deviation (yellow), ± 2 standard deviation (orange), and ± 3 standard deviation (red). The grey band on figure A represents the ACWR safe’ range of 0.7-1.3.
An Interval Throwing Program for Baseball Pitchers Based upon Workload Data International Journal of Sports Physical Therapy
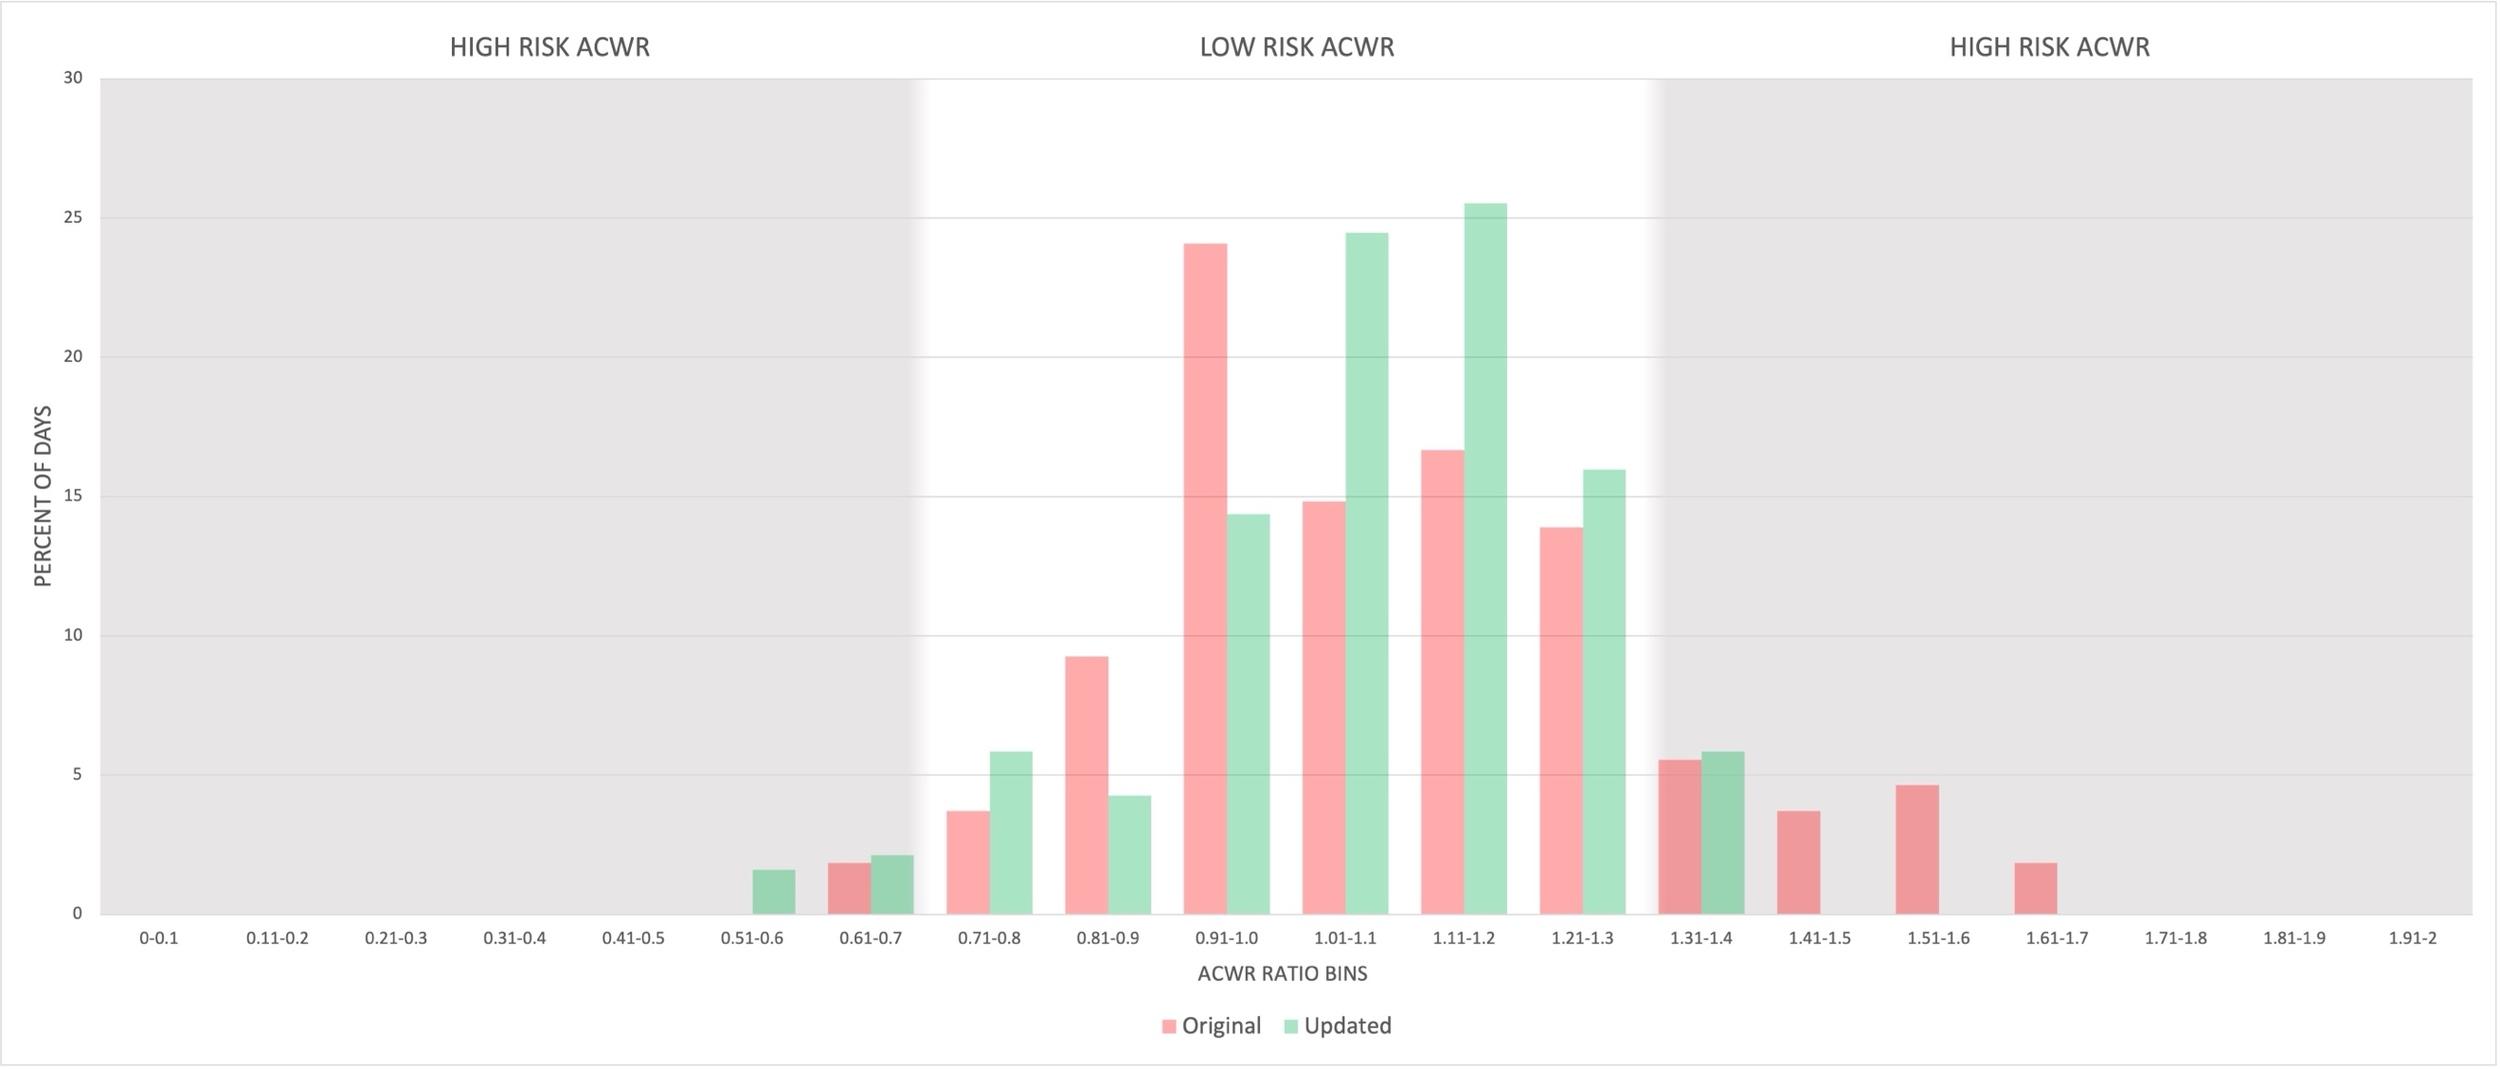
menting innings, etc.) and returns to full competition. This would allow workload to continue to build within a normal range over the course of the subsequent competitive season and not exceed commonly observed chronic workload levels. The original ITP reached a chronic workload level equivalent to midseason workload levels by the end of the ITP Anecdotally, this may be why it is common for pitchers to return following surgery with reports of fatigue and decreased velocity the first year back, and then a return to normal or improvement in year two.29,30
There has been a reported correlation between increased ACWR and injury risk.19‑23 Mehta23 reported in a cohort of 18 high school pitchers that a greater chance of throwing-related injuries occurred in pitchers whose ACWR exceed 1.27 Pitchers whose workload exceeded this ACWR exhibited a 15 times increased chance of injury compared to pitchers below this ACWR threshold. ACWR during the updated ITP was shown to fall within the desired range of 0.7 and 1.3 more often than the original ITP. The original program was in the desired range for 82% of the program in comparison to 91% for the updated program. Furthermore, the peak workloads in the original program were higher, up to 1.61 ACWR or 24% higher, for approximately 10% of the program, The updated program that just barely dips below and rises above the desired range (Figure 4). This may result in a more tolerable progression for athletes and avoid periods of excessive fatigue, discomfort or even setbacks all while increasing capacity and readiness.
Both the original and updated ITP programs begin with a high ACWR in the first 28 days because there is no chronic workload in the days preceding the program. Both ITPs assume that the pitcher has not thrown during rehabilitation and would be starting with a chronic workload of 0. However, recent shifts in rehabilitation have emphasized pitchers using the throwing motion drills prior, such as towel drills, sock drills, and 1-arm plyometrics, to initiating a formal ITP, which theoretically could build workload. Rehabil-
itation protocols have emphasized using plyometric exercises before the pitcher is allowed to start throwing which could build workload as well.31,32 Additionally, the load on the throwing arm at such short distances at the beginning of the ITP is so low that we do not feel this high ACWR initially is clinically concerning.
Distance was used as the variable to progress flat-ground intensity and load to the throwing arm. Some authors have recently suggested the use of radar guns to monitor intensity during ITP as they are unable to adequately match effort and actual throwing arm load.33 However, studies have shown that throwing velocity does not correlate with elbow torque and varies per pitcher,34‑36 making the use of a radar gun less accurate for an ITP Coaches and clinicians use a radar gun to help determine and regulate a pitcher’s effort, but many experts agree that using a radar gun shifts the emphasis to velocity of a throw rather than focusing on proper mechanics.8 The correlation between distance and torque is shown in Figure 1, and allows a more reliable and gradual progression in stress than using velocity
In regards to perceived effort of throwing off the mound, it is known that perceived intensity does not correlate to throwing velocity or elbow varus torque. Pitching at 50% effort corresponds to 80%-85% of maximum ball velocity and 75% of maximum elbow varus torque.15,27 Pitching with 75% effort corresponds to 85%-90% ball velocity and about 80% - 90% elbow varus torque.15,27 The relationship between percent effort and elbow torque was built into our throwing workload model.
The updated ITP was designed for long-term rehabilitation programs for shoulder and elbow injuries. The authors recommend that this ITP typically begin 20 weeks after most surgical procedures, such as Tommy John reconstruction. However, many factors can influence the beginning of an ITP such as the surgery performed, pitcher’s age, level of competition, time of season, surgeon’s preference, and successful progression through the rehabilitation process. Be-
Figure 4. Comparison of percentage of days thrown spent within the desired acute:chronic workload range (0.7 –1.3) between the original (red) and updated (green) programs.
An Interval Throwing Program for Baseball Pitchers Based upon Workload Data International Journal of Sports Physical Therapy
cause the updated program is 217 days, if a pitcher starts 20 weeks after surgery, successful completion and to return to competition would be around the 12-month mark after surgery. However, after the pitcher finishes the ITP there is still a gradual build-up of live at-bats, simulated games, and full-intensity innings before the pitcher is allowed to 100% return to competition.
It should be noted that long toss past 120 feet and weighted ball programs were intentionally not included in this updated rehabilitation ITP Both have been shown to potentially produce more load to the throwing arm than pitching a regulation ball off a mound, making it difficult to control the gradual workload buildup.15,37‑40 All ITPs are designed to gradually increase throwing arm load to effectively prepare a pitcher for stress involved with competitive pitching. As the player transitions to the competitive season, the inclusion of extreme long toss and weighted balls can be individualized for each pitcher. The risks and rewards of extreme long-toss and weighted balls in performance and maintenance programs for active pitchers are beyond the scope of this study investigating rehabilitation throwing programs.
The updated ITP detailed the inclusion of deload weeks at four different points, spaced out during the program. The concept of deloading has been popularized in strength and conditioning and theorized to allow the body a brief period of recovery when going through a long duration of linear loading. Anecdotally, pitchers often report periods of fatigue and generalized soreness over the course of the ITP The deload period allows the body to recover before continuing to the next, and often with increased intensity, phases of the program. The inclusion of deload weeks in the updated ITP required a strategic plan when returning to the throwing progression to assure appropriate ACWR was maintained. The inclusion of the deload weeks arguably had a negative effect on the buildup of chronic workload and drop in ACWR below the safe range of 0.7 We believe
the benefit of giving the athlete a physical and mental break from the long rehabilitation process is ultimately more advantageous in the long run, as long as the ACWR is accounted for appropriately after the deload period.
There are a few limitations to the current study that should be mentioned. The data used to analyze the ITP workloads was determined using data for healthy high school and collegiate pitchers reported by Melugin et al27 and Dowling et al.9 The relationships between elbow torque and workload with types of throws may vary for pitchers of different age, height, weight, and throwing mechanics. The individual needs of each player must always be addressed when designing any ITP. The optimal ITP may vary for different pitching injuries. Our computational model of throwing workload was predicated on biomechanical studies of elbow varus torque and may therefore be most applicable to pitchers recovering from surgical treatment of UCL injuries. Variations of this program should be designed that take into consideration shorter or longer durations based on the specific athlete and injury.
CONCLUSION
We have introduced an updated ITP based upon our current understanding of the biomechanics of throwing programs and built to represent the needs of the modern baseball pitcher. The proposed ITP has a more gradual and consistent workload progression than past ITPs, as measure by chronic workload and ACWR. This program can be used to return pitchers back to baseball pitching during long-term rehabilitation programs for shoulder and elbow injuries.
Submitted: January 29, 2024 CST, Accepted: February 19, 2024 CST
© The Author(s)
This is an open-access article distributed under the terms of the Creative Commons Attribution 4.0 International License (CCBY-NC-4.0). View this license’s legal deed at https://creativecommons.org/licenses/by-nc/4.0 and legal code at https://creativecommons.org/licenses/by-nc/4.0/legalcode for more information.
An Interval Throwing Program for Baseball Pitchers Based upon Workload Data International Journal of Sports Physical Therapy
REFERENCES
1. Carr JB II, McElheny KD, Corrigan A, Rowe D, Ma K, Curriero FC. The Most Common Type, Severity, and Expected Frequency of Injuries Vary by Defensive Position in Professional Baseball Players. Am J Sports Med 2022;50(9):2534-2541. doi:10.1177/0363546522
1104490
2. Conte S, Camp CL, Dines JS. Injury Trends in Major League Baseball Over 18 Seasons: 1998-2015. Am J Orthop (Belle Mead NJ). 2016;45(3):116-123.
3. Shanley E, Thigpen CA, Boes N, et al. Arm injury in youth baseball players: a 10-year cohort study J Shoulder Elbow Surg. 2023;32(6S):S106-S111. doi:10.1 016/j.jse.2023.02.009
4. Vargas L, Charen D, Huang HH, Poeran J, Colvin A. Analysis of common shoulder injuries in collegiate baseball players. Phys Sportsmed 2022;50(5):394-399. doi:10.1080/00913847.2021.1934910
5. Axe MJ, Snyder-Mackler L, Konin JG, Strube MJ. Development of a distance-based interval throwing program for Little League-aged athletes. Am J Sports Med. 1996;24(5):594-602. doi:10.1177/036354659602
400506
6. Axe MJ, Wickham R, Snyder-Mackler L. Data-Based interval throwing programs for little league, high school, college, and professional baseball pitchers. Sports Med Arthrosc 2001;9(1):24-34. doi:10.1097/00 132585-200101000-00003
7. Axe MJ, Windley TC, Snyder-Mackler L. Data-Based Interval Throwing Programs for Collegiate Softball Players. J Athl Train 2002;37(2):194-203.
8. Cisco S, Miller Semon M, Moraski P, Smith J, Thorndike C. Distance-Based Throwing Programs for Baseball Players From Little League to High School. Pediatric Physical Therapy. 2019;31(3):297-300. doi:1 0.1097/pep.0000000000000625
9. Dowling B, Brusalis CM, Streepy JT, et al. Workload Comparison of Contemporary Interval Throwing Programs and a Novel Optimized Program for Baseball Pitchers. Int J Sports Phys Ther 2024;19(2). d oi:10.26603/001c.92016
10. Reinold MM, Wilk KE, Reed J, Crenshaw K, Andrews JR. Interval sport programs: guidelines for baseball, tennis, and golf. J Orthop Sports Phys Ther. 2002;32(6):293-298. doi:10.2519/jospt.2002.32.6.293
11. Andrews JR, Venkateswaran V, Christensen KD, et al. Outcomes After Ulnar Collateral Ligament Revision Reconstruction in Baseball Players. Am J Sports Med 2020;48(13):3359-3364. doi:10.1177/0363 546520951529
12. Osbahr DC, Cain EL Jr, Raines BT, Fortenbaugh D, Dugas JR, Andrews JR. Long-term Outcomes After Ulnar Collateral Ligament Reconstruction in Competitive Baseball Players: Minimum 10-Year Follow-up. Am J Sports Med 2014;42(6):1333-1342. d oi:10.1177/0363546514528870
13. Petty DH, Andrews JR, Fleisig GS, Cain EL. Ulnar collateral ligament reconstruction in high school baseball players: clinical results and injury risk factors. Am J Sports Med. 2004;32(5):1158-1164. doi:1 0.1177/0363546503262166
14. Saper M, Shung J, Pearce S, Bompadre V, Andrews JR. Outcomes and Return to Sport After Ulnar Collateral Ligament Reconstruction in Adolescent Baseball Players. Orthop J Sports Med 2018;6(4):2325967118769328. doi:10.1177/232596711 8769328
15. Dias T, Lerch BG, Slowik JS, et al. Biomechanical Basis of Interval Throwing Programs for Baseball Pitchers: A Systematic Review Int J Sports Phys Ther 2023;18(5):1036-1053. doi:10.26603/001c.87811
16. Gabbett T, Sancho I, Dingenen B, Willy RW. When progressing training loads, what are the considerations for healthy and injured athletes? Br J Sports Med. 2021;55(17):947-948. doi:10.1136/bjsport s-2020-103769
17 Gabbett TJ, Domrow N. Relationships between training load, injury, and fitness in sub-elite collision sport athletes. J Sports Sci. 2007;25(13):1507-1519. do i:10.1080/02640410701215066
18. Windt J, Gabbett TJ. How do training and competition workloads relate to injury? The workload—injury aetiology model. Br J Sports Med 2017;51(5):428-435. doi:10.1136/bjsports-2016-0960 40
19. Blanch P, Gabbett TJ. Has the athlete trained enough to return to play safely? The acute:chronic workload ratio permits clinicians to quantify a player’s risk of subsequent injury Br J Sports Med 2016;50(8):471-475. doi:10.1136/bjsports-2015-0954 45
An Interval Throwing Program for Baseball Pitchers Based upon Workload Data International Journal of Sports Physical Therapy
20. Carey DL, Blanch P, Ong KL, Crossley KM, Crow J, Morris ME. Training loads and injury risk in Australian football—differing acute: chronic workload ratios influence match injury risk. Br J Sports Med 2017;51(16):1215-1220. doi:10.1136/bjsp orts-2016-096309
21. Hulin BT, Gabbett TJ, Lawson DW, Caputi P, Sampson JA. The acute:chronic workload ratio predicts injury: high chronic workload may decrease injury risk in elite rugby league players. Br J Sports Med 2016;50(4):231-236. doi:10.1136/bjsports-201 5-094817
22. Malone S, Owen A, Newton M, Mendes B, Collins KD, Gabbett TJ. The acute:chonic workload ratio in relation to injury risk in professional soccer J Sci Med Sport. 2017;20(6):561-565. doi:10.1016/j.jsams.2016.1 0.014
23. Mehta S. Relationship between workload and throwing injury in varsity baseball players. Phys Ther Sport. 2019;40:66-70. doi:10.1016/j.ptsp.2019.08.001
24. Escamilla RF, Fleisig GS, Groeschner D, Akizuki K. Biomechanical comparisons among fastball, slider, curveball, and changeup pitch types and between balls and strikes in professional baseball pitchers. Am J Sports Med 2017;45(14):3358-3367 doi:10.1177/036 3546517730052
25. Fleisig GS, Kingsley DS, Loftice JW, et al. Kinetic comparison among the fastball, curveball, change-up, and slider in collegiate baseball pitchers. Am J Sports Med 2006;34(3):423-430. doi:10.1177/036354650528 0431
26. Fleisig GS, Laughlin WA, Aune KT, Cain EL, Dugas JR, Andrews JR. Differences among fastball, curveball, and change-up pitching biomechanics across various levels of baseball. Sports Biomech. 2016;15(2):128-138. doi:10.1080/14763141.2016.1159
319
27. Melugin HP, Larson DR, Fleisig GS, et al. Baseball pitchers’ perceived effort does not match actual measured effort during a structured long-toss throwing program. Am J Sports Med. 2019;47(8):1949-1954. doi:10.1177/036354651985056
0
28. Mehta S, Tang S, Rajapakse C, Juzwak S, Dowling B. Chronic Workload, Subjective Arm Health, and Throwing Injury in High School Baseball Players: 3-Year Retrospective Pilot Study. Sports Health. 2022;14(1):119-126. doi:10.1177/19417381211055142
29. Cinque ME, LaPrade CM, Abrams GD, Sherman SL, Safran MR, Freehill MT. Ulnar Collateral Ligament Reconstruction Does Not Decrease Spin Rate or Performance in Major League Pitchers. Am J Sports Med 2022;50(8):2190-2197 doi:10.1177/0363546522 1097421
30. Marshall NE, Keller RA, Lynch JR, Bey MJ, Moutzouros V. Pitching performance and longevity after revision ulnar collateral ligament reconstruction in Major League Baseball pitchers. Am J Sports Med. 2015;43(5):1051-1056. doi:10.1177/036354651557963 6
31. Oak SR, Klein B, Verma NN, et al. Rehabilitation and Return to Play of the Athlete after an Upper Extremity Injury Arthroscopy, Sports Medicine, and Rehabilitation. 2022;4(1):e163-e173. doi:10.1016/j.as mr.2021.09.033
32. Reinold MM, Gill TJ, Wilk KE, Andrews JR. Current concepts in the evaluation and treatment of the shoulder in overhead throwing athletes, part 2: injury prevention and treatment. Sports Health 2010;2(2):101-115. doi:10.1177/1941738110362518
33. Lizzio VA, Smith DG, Jildeh TR, et al. Importance of radar gun inclusion during return-to-throwing rehabilitation following ulnar collateral ligament reconstruction in baseball pitchers: a simulation study J Shoulder Elbow Surg 2020;29(3):587-592. do i:10.1016/j.jse.2019.08.014
34. Leafblad ND, Larson DR, Fleisig GS, et al. Variability in Baseball Throwing Metrics During a Structured Long-Toss Program: Does One Size Fit All or Should Programs Be Individualized? Sports Health. 2019;11(6):535-542. doi:10.1177/1941738119869945
35. Manzi JE, Estrada JA, Dowling B, Ruzbarsky JJ, Dines JS. Intra- versus inter-pitcher comparisons: Associations of ball velocity with throwing-arm kinetics in professional baseball pitchers. J Shoulder Elbow Surg. 2021;30(11):2596-2603. doi:10.1016/j.js e.2021.04.017
36. Slowik JS, Aune KT, Diffendaffer AZ, Cain EL, Dugas JR, Fleisig GS. Fastball velocity and elbowvarus torque in professional baseball pitchers. J Athl Train 2019;54(3):296-301. doi:10.4085/1062-6050-55 8-17
37 Dowling B, McNally MP, Laughlin WA, Onate JA. Changes in throwing arm mechanics at increased throwing distances during structured long-toss. Am J Sports Med 2018;46(12):3002-3006. doi:10.1177/0363 546518795892
An Interval Throwing Program for Baseball Pitchers Based upon Workload Data International Journal of Sports Physical Therapy
38. Fleisig GS, Bolt B, Fortenbaugh D, Wilk KE, Andrews JR. Biomechanical comparison of baseball pitching and long-toss: Iimplications for training and rehabilitation. J Orthop Sports Phys Ther. 2011;41(5):296-303. doi:10.2519/jospt.2011.3568
39. Fleisig GS, Diffendaffer AZ, Aune KT, Ivey B, Laughlin WA. Biomechanical Analysis of WeightedBall Exercises for Baseball Pitchers. Sports Health. 2017;9(3):210-215. doi:10.1177/1941738116679816
40. Reinold MM, Macrina LC, Fleisig GS, Aune K, Andrews JR. Effect of a 6-week weighted baseball throwing program on pitch velocity, pitching arm biomechanics, passive range of motion, and injury rates. Sports Health 2018;10(4):327-333. doi:10.1177/ 1941738118779909
An Interval Throwing Program for Baseball Pitchers Based upon Workload Data International Journal of Sports Physical Therapy
SUPPLEMENTARY MATERIALS
Table 1 - Long Toss
Download: https://ijspt.scholasticahq.com/article/94146-an-interval-throwing-program-for-baseball-pitchers-basedupon-workload-data/attachment/197892.pdf?auth_token=uC0S8tZZoJHMGWfxR1Zj
Table 2 - Mound
Download: https://ijspt.scholasticahq.com/article/94146-an-interval-throwing-program-for-baseball-pitchers-basedupon-workload-data/attachment/197893.pdf?auth_token=uC0S8tZZoJHMGWfxR1Zj
An Interval Throwing Program for Baseball Pitchers Based upon Workload Data International Journal of Sports Physical Therapy
Hypertrophy Training Following A Total Hip Replacement: A Literature Review
Tyson Bull1 , Andrew Erzen1 , John O'Donnell2 , Michael Rafla3 , David Georgy3 , Mia Bailey1 , Amir Takla2,4,5 a 1 Swinburne University of Technology, 2 Hip Arthroscopy Australia , 3 Australian Sports Physiotherapy , 4 Department of Health professions, Swinburne University of Technology, 5 Australian Sports Physiotherapy
Keywords: Hypertrophy, hip replacement, hip arthroplasty, strength training, knee replacement, knee arthroplasty
https://doi.org/10.26603/001c.93075
International Journal of Sports Physical Therapy
Hip OA is becoming more common, with a greater number of younger individuals undergoing total hip arthroplasty (THA). These individuals have the desire to return to considerable loading and in some instances return to sport. The purpose of this review was to investigate the current guidelines and/or protocols for hypertrophy or strengthening in individuals who have undergone total hip arthroplasty. A total of 16 papers were identified, some of which also addressed total knee arthroplasty. There is no consensus for the best practice for a hypertrophy program following THA especially regarding when a direct anterior approach was used during hip arthroplasty. Further research is needed as this is a growing area in rehabilitation. This review aims to bridge the gap by offering a comprehensive synthesis of the available literature on postoperative rehabilitation after THA, with a specific emphasis on identifying the most effective muscular strengthening and hypertrophy training programs for patients undergoing anterior approach hip surgery.
INTRODUCTION
Hip osteoarthritis (OA) is becoming increasingly prevalent, with a total increase of 115.40% for the global incidence of hip OA from 1990 to 2019.1 OA is a chronic degenerative joint disorder and is the most common reason for total hip arthroplasty (THA) surgery in Australia.2 Due to its debilitating effects and impact on quality of life, OA is the world’s fourth leading cause of disability.3 THA has been shown to be a beneficial treatment as it offers relief from pain, improves function, and subsequently improves quality of life.4 The number of THAs being performed every year is increasing with a forecasted increase of 208% from 2013-2030. By 2030, THAs are expected to cost Australia $953 million.5
Many types of THA surgical techniques exist and there is much debate over which technique is most effective. The direct anterior approach has been associated with numerous claimed benefits such as reduced hospitalization periods, diminished risk of dislocation, reduced blood loss, and reduction of postoperative pain. As a result, it is a preferred method due to its minimized muscle disruption, smaller incision, and fewer post-surgical precautions in comparison to alternative approaches.6 As this technique facili-
tates faster recovery, a heightened emphasis is being placed on post-operative hypertrophy muscular training to enable prompt return to work or sports. Hypertrophy muscular training is a form of strength training that concentrates on increasing muscle size and mass. This objective is achieved by applying controlled stress and resistance to the muscles, prompting the increase in size and number of muscle fibers resulting in an increase in muscle size alongside strength development. This is important as the size or mass of muscles play a large role in the rate of force development and muscle power.1 Current research highlights the postoperative decrease in cross-section of the surrounding musculature of the hip joint,7 indicating that a carefully structured exercise regimen designed to stimulate the enlargement and growth of muscle tissue surrounding the hip joint may be beneficial subsequent to THA.
While THA is not a relatively new procedure, it is apparent that there is little to no available research on the role of muscular strengthening/hypertrophy in the recovery from THA using the direct anterior approach with individuals seeking to return to physically demanding activities such as sports, manual labour and weight training. Hence, comparisons of muscle strength between anterior minimally invasive surgery (AMIS) procedures and the traditional THA ap-
a
Corresponding author:
Amir Takla
Address: 73 Upper Heidelberg Road, Ivanhoe 3079, Melbourne, Vic Australia
Phone:+61412224407 ( Private ) Clinic : +61 1300651256
Systematic Review/Meta-Analysis
Email: amir@australiansportsphysio.com Bull T, Erzen A, O’Donnell J, et al. Hypertrophy Training Following A Total Hip Replacement: A Literature Review. IJSPT. Published online March 1, 2024:337-350. doi:10.26603/001c.93075
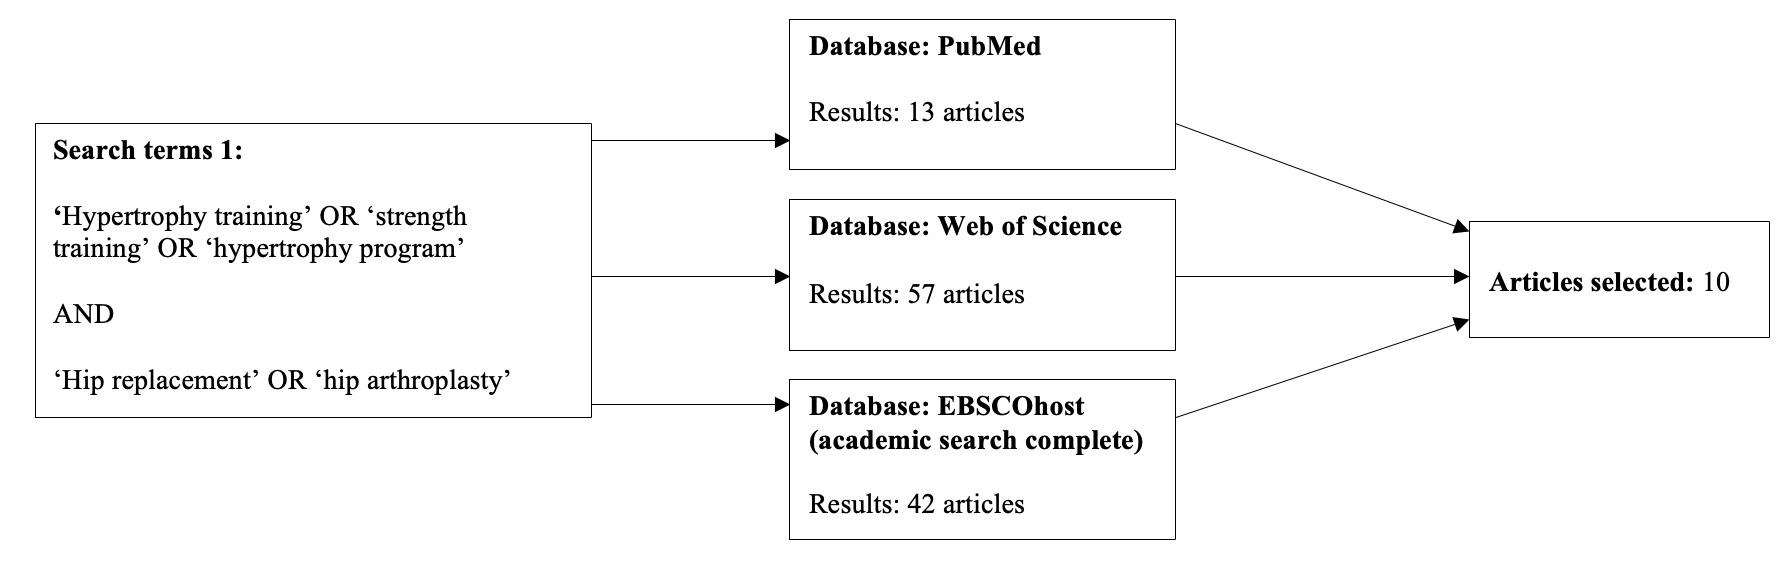
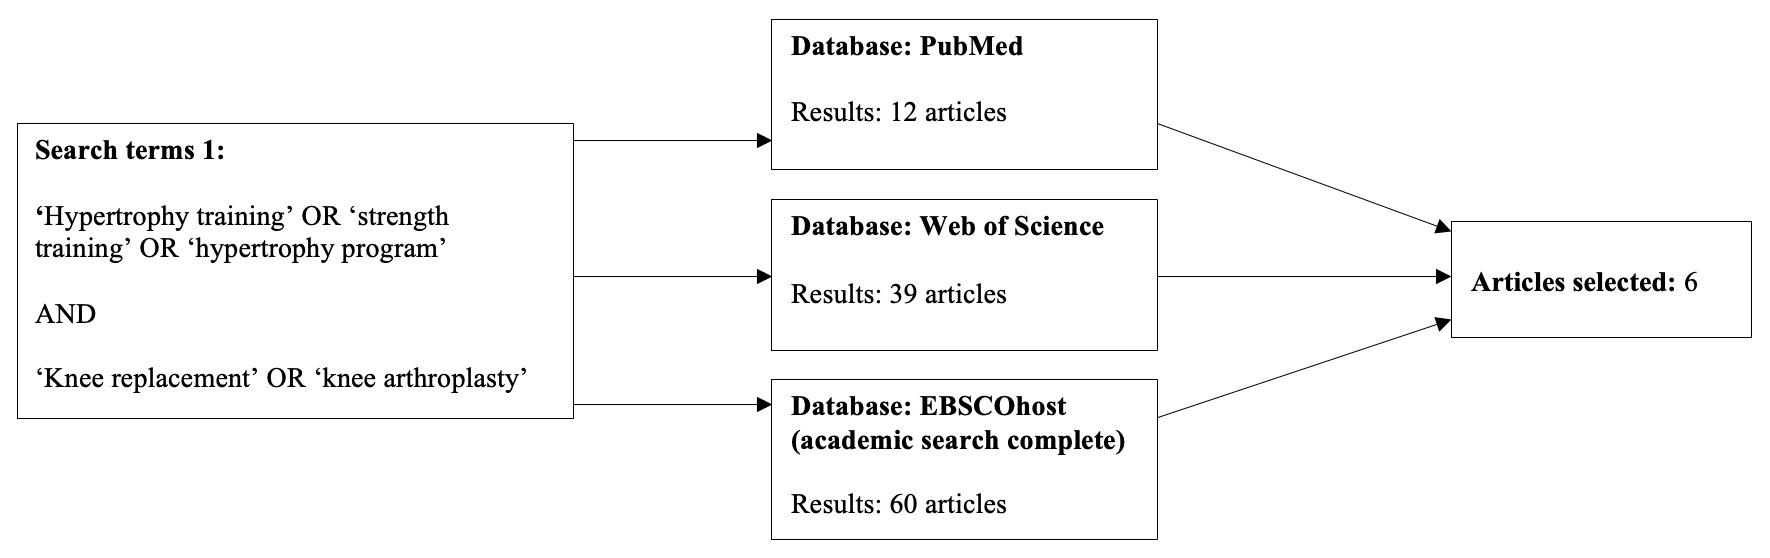
proach remain speculative. The reported strength losses for various muscle groups in the operated leg following THA further contribute to this speculation.8 Holstege’s study indicates strength losses in hip abduction, adduction, flexion and extension as well as knee extension and flexion exist both pre- and post-operatively 9 These measures were taken after the out-patient rehabilitation period, for which documentation and quality of strengthening exercises is reliant on patient reporting and motivation. While the anterior approach and minimally invasive procedures reduce the level of soft tissue damage there is still very little research on the pattern of recovery of these muscles and even less on the rehabilitation process. Thus, the purpose of this review was to investigate the current guidelines and/or protocols for hypertrophy or strengthening in individuals who have undergone total hip arthroplasty
METHODS
This search was conducted for relevant articles published in Pubmed, Web of Science and EBSCOhost, Original search terms included total hip replacement or arthroplasty, and terms for rehabilitation, such as strength or hypertrophy training (Figure 1a). To further expand the scope of this literature search, hypertrophy training and total knee re-
placement (TKA) surgery were also included (Figure 1b). TKA studies were added as the knee joint provides uniplanar angular motions in one direction within the sagittal plane. Similarly, the hip joint also provides an identical motion within the sagittal plane. As both joints impact the kinematics of the lower limb through compound movements such as squatting, and bridging, recent research into post-surgical joint arthroplasty rehabilitation has presented similarities among exercise prescription of both joint groups.10 Thus, to gain further insight and overcome the research gap in post-surgical hypertrophy protocols for the hip, the authors decided to include post-surgical TKA hypertrophy protocols into the search. Compound movements such as the leg press and hip abduction in seating have been shown to be effective in both hip and knee hypertrophy protocols thus providing grounds to take these studies into consideration.
The inclusion criteria were articles published since the year 2000, including randomised controlled trials, cohort designs, and case control design. To narrow down further, hypertrophy protocols had to be of high quality whereby program duration, chosen exercises and dosage was detailed. Articles were excluded if they were published earlier than 2000, published in a language other than English, or articles that were meta-analyses, systematic or literature reviews. See Appendix 1 for the full search strategy.
Figure 1a. First search, focusing on THA hypertrophy studies.
Figure 1b. Second search, incorporating TKA studies
Hypertrophy Training Following A Total Hip Replacement: A Literature Review International Journal of Sports Physical Therapy
RESULTS
A total of 1112 results were obtained through this search across three databases, upon evaluation, 16 relevant, but diverse hypertrophy programs were selected across varied time frames, dosages, exercise prescriptions, and levels of supervision. 10 THA studies and 6 TKA were identified that incorporated hypertrophy-based strengthening programs. Of note, only one of the ten studies, targeted hypertrophy in the context of returning to sport.11 Throughout this literature review, there was no program consensus amongst all the studies and programs to target THA post op muscle atrophy As such there were also no consistent outcome measures to provide comparison between different programs and suggest one over another
Table 1 provides the full results.
Among the 16 studies reviewed, four concluded no significant increase in strength compared to that of their control or standard post-surgical protocol. Although training duration and dosage varied within either the hip and knee studies, a significant increase in either strength and or functional performance was achieved within 13 of these studies.
MUSCLE STRENGTH
Among the 16 studies encompassing both the hip and knee arthroplasty, 13 of the 16 studies exhibited a substantial enhancement in muscular strength, while the remaining three studies indicated no statistically significant differences. A common trend within these studies was the utilization of a one-repetition maximum (1RM) assessment. This assessment method seemed to guide clinicians in determining optimal loads for individual patients by establishing a baseline for subsequent strengthening.
EXERCISE PROTOCOL
A diverse range of exercises were prescribed within each hypertrophy protocol. Similarities were found among numerous protocols within each of the hip or knee categories which can be found within Table 2.
The exercises with the highest prevalence among hip rehabilitation protocols included leg press, hip abduction, and hip extension in a standing position. In knee extension protocols, leg press and knee open kinetic chain extension were the most commonly used.
DISCUSSION
A search through the available literature surrounding the rehabilitation process of THA reveals a high amount of variability in programming, outcomes, durations, and level of supervision with regards to resistance training and muscle hypertrophy Similar outcomes are seen in the TKA literature.
Many of the studies lacked specificity in their exercise intensity prescriptions neglecting any kind of 1RM testing. Without accurate measures of intensity, hypertrophy adap-
tations may be diminished as well as limit the reproducibility of the exercise parameters. Commonality was found in studies whose programs revolved around hip abduction and leg press as their key exercises.8,9,12,13 Logical movements targeting hypertrophy of gluteal musculature are required due to this muscle group being most affected by currently utilized surgical approaches.14 While the populations, methods, and durations of the selected studies naturally vary depending on individual research aims, outcome measures, and interventions, what became clear is that there is no consensus rehabilitation protocol to be adapted to or followed for patient hypertrophy following THA.
Husby15,16 implemented hip abduction and leg press strength-based programs from one week post op to weeks four and five post op in two studies. Both utilized 1RM testing to inform individual exercise prescription intensities, thus maximizing the benefits of resistance training without overexerting. Collectively these RCT’s indicated that early maximal strength training combined with conventional rehabilitation showed improvements in patients’ muscular strength, work efficiency, and in particular, rate of force development (RFD) which improved by 74% 12 months post op compared to control/conventional rehab.16 However, further long-term studies are needed to investigate this type of training model with younger patients returning to vigorous physical activities, sports, and manual labour post op.
Conversely Madara11 and Mikkleson17 both conducted longer-term studies studying supervised versus unsupervised rehabilitation. Mickleson reported improvements in patient satisfaction and strength outcomes in the intervention group who used home resistance training versus conventional rehab, but concluded that even the more strenuous program resulted in insufficient strength gains on the operated side versus non operated side. Results were limited by suitability of exercises for all participants. Madara’s feasibility study involved participants going unsupervised with a home program for the first six weeks and then PT supervised rehabilitation for the last 10 weeks tailored to the patients’ goals and potential return to sport desires. The experimental group recorded statistically significant increases in 6MWT, rehab satisfaction, and improvements in between-limb force symmetry during sit to stand tasks. While these studies individually have limited statistical power, when considered together they may suggest that a robust, supervised, resistance training based protocol may provide the most benefit to THA patients to minimize post op strength deficits, return to sport, and achieve patientcentred goals.
Two exploratory studies examined the impacts of progressive overload using 1RM testing, the first13 focusing on pain and progression after TKA and THA during early-initiated modified strength training and the second18 examining the impact of leg press, hip abduction/knee extension resistance training on postural sway in THA patients. In the first study both TKA and THA patient’s pain levels were not beyond moderate levels with increased early load progression post op, albeit TKA predictably higher than THA. Both groups statistically significantly increased loads each week
Hypertrophy Training Following A Total Hip Replacement: A Literature Review International Journal of Sports Physical Therapy
Hsu et al. 2019
RCT
Husby et al. 2009
RCT
29 females 68-73 yrs old
TKA 24 Weeks
Phase 1: 1-4wks
Phase 2: 5-8wks
Phase 3 9-24wks
24 participants 48-64 yrs old
Husby et al. 2010
RCT
24 participants <70yrs old
THA 4 Weeks
Beginning 1/52 post-op
5 sessions/week
THA 4 Weeks
Beginning 1/52 post-op
5 sessions/week
Program:
Weeks 1-4 (60% of 1RM, 12 reps/set x 3 sets)
5-8 weeks (70% of 1RM, 12 reps / sets x 3 sets, 3 days a week)
9-24 weeks (80% 1RM, 12 reps / sets x 3 sets, 3 days a week)
Program:
Program completed in addition to conventional program
Warm up: 10min bike erg (roughly 50%VO2 max).
Strength Training Program: (5RM = 85% of 1RM),
(When patient attains 6 RM, load increased by 5kg),
(When patient attains 6 RM, load increased by 1kg).
Rest: 2mins rest between sets. Supervised physio 3-5/7 for 4/52.
Program:
Completed on top of conventional program
Warm up: 10min bike erg (roughly 50%VO2 max)
Strength Training Program: (5RM = 85% of 1RM), (When patient attains 6 RM, load increased by 5kg),
(When patient attains 6 RM, load increased by 1kg).
Rest: 2mins rest between sets
Supervised physio 3-5/7 for 4/52.
Resistance training group had greater lower extremity muscle strength (knee ext and flexors)
Improved functional mobility in 6MWT and 30sec CST
Abduction strength, peak force and work efficiency improved in strength training program
No differences in gait patterns were revealed post intervention.
Small sample size.
Female Only.
No long term follow up post 12 months.
Work efficiency significantly improved in the STG by 29% (P 0.034) compared with the CRG in the test after 6 mos.
No significant increase in muscle strength
Rate of force development (RFD) improved by 74% 12mos. Post op compared to control.
Small sample size.
Insufficient time period for optimal muscle adaptations
Group allocation not concealed.
No baseline comparability
Assessors, therapists and subjects not blinded.
Small sample size.
Short training period (Wks).
Husby et al. 2018
RCT
41 participants 45-73 yrs
TKA 8 Weeks
Beginning day 8 post op
Program:
Maximal strength training: Warm up: 10 mins walking or cycling
MST group muscle strength 37% increase in Leg press and 43% knee extension compared to pre op
Amount and intensity of physical activity among patients was not
Population Procedure Program duration and frequency Hypertrophy protocol Outcome Limitations
Table 1. results table Article/ Study design
International Journal of Sports Physical Therapy
Hypertrophy
Training Following A Total Hip Replacement: A Literature Review
Jakobsen et al. 2014
RCT
old 3 sessions/week
30min/session
Madara et al. 2019
RCT
82 patients
56-73 yrs old
20 participants
Mean age 66yrs
TKA
6 Weeks
Beginning 7 days post-op
2 sessions/week
Duration of session
45-50min
Performed at 80-90% 1RM.
Load: 4 x 5reps (high velocity concentric). When able to perform 6RM, load was increased by 5 kg for leg presses and by 0.5-1 kg for knee extensions.
Rest: 1-2min between sets
Program:
Warm up: 5 mins unilateral cycling (Borg intensity 7-10/20)
Progressed to bilateral cycling when able to flex knee to 95deg
no statistical difference in 6MWT recorded between 6-12 months.
Small sample size
No statistically significant difference.
THA
16 Weeks
18 sessions of PT
3 session/week
• Week 1: 12RM
• Weeks 2-5: 10RM
• Weeks 6-7: 8RM
Progressive strength training (15 mins): 2 sets x 2 sec isometric, 3sec concentric & eccentric Rest: 60-180sec between sets
Program: Weeks 1-6:
prescribed home exercise program (HEP) → HEP progressed at each PT visit
Using pedometer - increase PA increments by 20% by-weekly 70% 8RM with 3 sets x 8 reps.
Load: 3 sets x 8 reps, once presenting with minimal fatigue, increase to 3 sets x 10 reps once presenting with minimal fatigue, re-assess 8RM and add resistance accordingly; start back at 3 sets x 8 reps with added resistance.
Weeks 7-12:
Load: same as weeks 1-6 (progressively increasing)
Weeks 13-16:
Individualised exercises tailored to patient goals including return to sport
Load: same as previous weeks (progressively
(mean difference between groups: −11.3 meters [95% CI −45.4, 22.7]; ANOVA P = 0.51) or adjusted baseline scores (−16.1 meters [95% CI −48.6, 16.4]; ANCOVA P = 0.33).
No 1RM assessed. Training commenced seven days postoperatively
IG 6MWT distance 23.4% increase vs control: 9.4% (p=0.01) increase
HOOS Jr IG: (p=0.034) 103% increase
CG: 60% increase
Non-surgical side hip abduction strength (p=0.01) IG increased hip strength (0.04 kg/BW, 26% increase) CG decreased (-0.02 kg/BW, 11% decrease).
Small sample size. Individualised programs elicit individual results and therefore hard to generalise.
Low Specificity of exercise programs used.
Initial home exercise program relies on patient motivation, accurate reporting and program adherence.
Study enrollment not randomised.
design Population Procedure Program duration and frequency
protocol Outcome Limitations
Article/ Study
Hypertrophy
International Journal of Sports Physical Therapy
Hypertrophy Training Following A Total Hip Replacement: A Literature Review
Madsen et al. 2013
RCT
Matheis and Stöggl 2018
RCT
80 participants 58-75 yrs old
TKA 6 Weeks
2 sessions/week
Mikkelson et al. 2012
RCT
39 participants 44-87yrs old
THA (minimally invasive anterolateral)
6 days
increasing)
44 participants
Mean age: 67yrs
THA 12 Weeks
Follow up at 4 and 12 weeks
Program:
Warm up: 5 min exercise bike + 5-10 BW squats
Load:
Session 2: 1 set x 10-12 reps.
Session 3-4: 2 sets x 10-12 reps.
Session 5-7: 3 sets x 10-12 reps.
Session 8-10: 2 sets x 6-8 reps.
Session 11-12: 3 sets x 6-8 reps.
Program:
Day 1 (20 mins): Instructions, mobilisation with crutches
Day 2: PROM/AROM of the hip & gait instructions
Day 3-5: PROM/AROM of hip & training therapy (30 mins)
Day 6: Post test
Weight shifting – 1 min
Step sequence. up/down x10 e/s.
Abduction 3 x 1080% intensity.
standing extension 3 x1080% intensity Cross walker 2min each.
Rest: 1 min rest for all strength exercises
Program:
Consisted of Supine, Sitting, and Standing exercises.
Load: 10 reps x 2/daily
Progression 4/52 post op No supine exercises
Medium resistance band Step exercise(15-20cm height)
Knee bend with back against wall One legged stance
3-6 month follow up.
IG walked faster (p=0.01)
Increased LEP values- (p=0.04)
IG exceeded CG in five-times sit to stand @ 6 month follow up (p=0.045)
Significant age gap between control and experimental group.
No description for rest periods.
No 1RM assessed. No precise mean age of participants was documented.
Increased hip flexion ROM
Increased hip extension and abduction
Faster 6MWT
No 1RM assessed.
Small sample size.
Mobility program rather than hypertrophy
No weight-based strength trainingonly body weight or isometric contractions.
Lack of exercise specificity
Intensified program effective in terms of pain, adherence, and compliance
Persistent hip abductor strength deficiencies in both groups post study.
Recommend more intensive early rehab protocol.
Exercises not suitable for all Pt’s
Short follow up
Measurement errors and limited test battery
Article/ Study design Population Procedure Program duration and frequency Hypertrophy protocol Outcome
Limitations
Training Following A
Hip
Literature Review International Journal of Sports Physical Therapy
Hypertrophy
Total
Replacement: A
Mikkelsen et al. 2017
RCT
Min Ji Suh et al. 2017
RCT
34 patients (15 female / 19 male)
Mean age: 65 yrs old
THA
10 Weeks
Beginning 1/52 post-op
2 sessions/week
30-40min/ session
program:
Warm up: 5-10 mins stationary bike
Exercises:
Load: 10-12RM week1 → increased progressively to 8RM, 3 sets per exercise
Rest: 1 min rest between sets
34 participants 77yrs or younger
Petterson et al. 2009
RCT
200 participants 50-85yrs old
TKA
2 Weeks
30min/session
TKA 6 Weeks
Beginning 3-4 Weeks post-op
2-3 sessions/ week
NMES: 1 hour/ day
Suetta et al. 2004
RCT
36 participants 60-86yrs old
THA 12 Weeks
Beginning day 7 post op
3 sessions/week
Program:
ECC-CON group (n=16)
Concentric knee extension 30% 1RM 3x15. Concentric Leg curl 40-60% 1RM @ 3 x 8-10.
Extension 60-80% 1RM 3-5reps.
Curl 60-80% 1RM 3-5reps - 3min rest.
Extension - 1RM
Curl - 1RM
ECC-CON group
only knee extension - eccentric contractions.
Program: Specifically target quadriceps femoris muscle group.
Load: 2 sets of 10 reps (weights were increased to maintain 10 rep max).
NMES (neuromuscular electrical stimulation) component to program: 10 electrically elicited contractions of quads muscle.
Program:
Warmup: 10-minute warm-up on a stationary bicycle.
Training intensity was progressively increased:
Weeks 1-6: 3-5 sets of 10 reps
Weeks 6-12: 3-5 sets of 8 reps
Winther et 42 patients 26 THA 10 Weeks Program:
Progressive resistance training can be implemented shortly post op with substantial load progression and no overall exacerbation of postoperative pain.
Small sample size.
No 1RM assessed.
Significant improvement in post op knee ext strength, increased endurance, and gait speed of surgical knee.
Small sample size.
Insufficient training program duration (2 wks)
Hypertrophy group was significantly stronger P=0.007 at 12mos.
Mean NMVIC was 21%less in standard care.
Worse functional performance at 12/ 12 in standard care.
High dropout rate No 1RM assessed.
Increase in functional performance in RT (30%) and (37%) reduction in LOS.
RT increased muscle mass, muscle strength, and functional performance.
RT program augmented CSA 12% 12 weeks after surgery
Limited number of patients (results cannot be generalized to a wider population)
No 1RM assessed.
Significant progressive load increase Explorative study:
Population Procedure Program duration and frequency Hypertrophy protocol Outcome Limitations
Article/ Study design
Training Following A Total Hip Replacement: A Literature Review International Journal of Sports Physical Therapy
Hypertrophy
al. 2020 (pain and load progression)
Exploratory study
16 TKA
35-76yrs old
Winther et al. 2020 (postural sway)
unpublished data from a prospective
RCT
54 patients
Mean age: 63 yrs old
THA (posterior approach)
Beginning day
15 post op
3 sessions/week
12 Weeks
3 sessions/week
Follow up at 3, 6 and 12 months
Warmup: 10-min warm-up; walking or ergometer cycling.
Load:
• 4 sets of 5 reps
• 85-90% of 1RM
• High velocity concentric phase
→ Load increased when patient could perform > 5RM
Rest: 1-2 min between sets
Program:
Warm-up: cycling, step, and treadmill walking.
Load:
• 4–5 reps × 4 sets
• Load equal to 85%–95% of 1RM
Other workouts used were aquatic exercises, balance training, range-of-motion exercises, massage, and sling exercises.
in leg press and hip abduction until final intervention week (p<0.01)
small sample size, low power
Program started two weeks after surgery.
IG patients 25%–50% stronger leg press and hip abduction than the CG patients 3 and 6 months postoperatively (p ≤ 0.002).
3-month follow up; Decreased postural sway in IG patients
Failed to measure preoperative gait data in order to make comparisons with postoperative data.
Reduced sample size due to high drop out rate
Explorative design.
Winther et al. 2020
RCT
26 patients
35-76 yrs old
THA
10 Weeks
3 session/week
Program: Warmup: cycling
Load:
• 5 reps, 4 sets
• 85-90% of 1RM
• emphasis on concentric part of movement
• load increased following 6RM
Rest: 1-2 min rest intervals
Leg press + hip abduction strength stronger than control at 3 and 6 months post op.
No significant differences at 12 months post op.
Patients' level of exercise not recorded from 6-12 months post op.
Small sample size.
Population Procedure Program duration and frequency Hypertrophy protocol Outcome
Article/ Study design
Limitations
International Journal of Sports Physical Therapy
Hypertrophy Training Following A Total Hip Replacement: A Literature Review
until the second to last week (TKA) and last week (THA) of the study resulting in a 120-130% increase in leg press training load by week eight. While study power was limited by small sample sizes and incomplete pain medication reporting, the indications are strongly in favor of a targeted resistance program to limit strength deficiencies post op. The second study18 found maximal strength training led to improved muscle strength and reduced postural sway in THA patients during activities of daily living. While limited by an insufficiently powered sample size and the absence of preoperative gait data, notable statistical differences in postural sway were detected in favor of the intervention group immediately post study.
Another study17 examined progressive strengthening of the quadriceps in a six-week TKA post-surgical hypertrophy protocol which included exercises that targeted the hip abductors, hip flexors, hamstrings, and gastrocnemius. Significant increases in strength occurred within those six weeks. A second study19 examined an eight week post-surgical TKA hypertrophy protocol whereby muscle strength within the intervention group significantly increased leg press (37%), and knee extension (43%) strength.
Atrophic musculature is a common occurrence following THA. Nankaku et al.20 measured hip abductor and knee extensor strengths prior to undergoing unilateral THA and found a correlation between preoperative weakness of the gluteus medius and postoperative limping during gait. The gluteal musculature, in particular, the gluteus medius has been shown to be the primary hip stabiliser during single legged functional movements such as gait.21 Through this analysis of the literature pertaining to atrophic musculature surrounding the hip, it can be concluded that hip abductor and knee extensor strengthening are integral parts of early exercise following THA as they assist to provide stabilization of the hips during gait and enhance stability of the pelvis during standing.22
A typical hypertrophy protocol consists of a combination of mechanical and metabolic stresses with dosage ranging between 3-6 sets of 8-12 repetitions with short rest intervals of 60 seconds or less. The intensity should be of moderate effort at 60-80% of 1RM with subsequent increases in training volume each week. Research has shown that a standard hypertrophy training program ranges from 4-12 weeks depending on an individual’s goals. Hypertrophy is the most effective method to strengthen and increase the cross-sectional area (CSA) of the musculature.23
The conclusions of this review were limited by the availability of research specifically on anterior approach THA, hypertrophy training post THA, and the diversity of interventions, durations, age of participants, intervention specificity and wide variety of outcomes utilized across the selected studies. This ultimately results in a lack of clarity regarding the ability to compare among rehab programs to determine effectiveness or the optimal program.
CONCLUSION
This review of the available literature of post operative THA and TKA protocols indicates that there are some incon-
sistencies that provide grounds to direct further research into postoperative THA muscular hypertrophy training programs. There is no consensus for the best practice regarding a hypertrophy program following THA. This is especially true for anterior direct anterior techniques in conjunction with hypertrophy protocols in which this search found zero results. To address the apparent gaps in the literature, there is a need for well conducted studies that address rehabilitation specifically for hypertrophy in the contexts of anterior hip surgery, THA in younger populations, and return to sport following THA. It will also be important to discern if utilizing standardized intervention protocols and outcome measures benefit those wishing to return to high level activities after THA. The literature that was reviewed suggests that interventions post TKA and THA are both safe and effective in achieving strength outcomes necessary to combat strength asymmetries and deficiencies.
Submitted: January 29, 2023 CST, Accepted: December 04, 2023 CST
© The Author(s)
Hypertrophy Training Following A Total Hip Replacement: A Literature Review International Journal of Sports Physical Therapy
THA Hypertrophy Protocol
Study
Suetta et al. 2004
Husby et al. 2009
Mikkelson et al. 2012
Husby et al. 2010
Mikkelsen et al.,2017
Matheis and Stöggl, 2018
Madara et al. 2019
Key Exercises
• Seated knee extensions
• Leg presses
• Leg press
• Hip abduction machine
• Supine
◦ Gluteal sets
◦ Pelvic tilt
◦ Hip abduction
◦ Hip flexor stretch
• Sitting
◦ Knee extension sitting on chair with rubber band around ankles
• Standing
◦ Hip extension(low resistance)
◦ Hip abduction(low resistance)
◦ Hip flexion(low resistance)
◦ Step exercise(step height 6-10cm
• Leg press
• Hip abduction machine
• Hip flexion
• Hip abduction
• Hip extension
• Knee extension
• Leg press
• Cross walker
• Treadmill
• Weight shifting
• Step seq. (unstable surface)
• Single leg stance + hip extension and abduction exercises
• Early phase 1 (week 1-6)
◦ Quad set SAQ SLR
◦ gluteal sets supine
◦ Standing hip extension step ups
◦ Supine abduction heel slide
◦ Weight shift SL balance
◦ Standing hip abduction
◦ Bilateral heel raise
◦ STS walking
◦ stairs
• Mid phase 2 (weeks 7-12)
◦ LAQ resisted knee extension (theraband)
◦ Mini wall squat advanced bridges (resistance band, single band)
◦ Step ups onto raised boxes
◦ Step out in clamshells
◦ SL balance (no hands)
◦ Bilateral 4 way hip SL hip abduction 4 way
◦ Bilateral heel raise (single lower: eccentric)
◦ Walking
◦ STS no hands
• Late phase 3 (weeks 13-16)
◦ Wall squats
◦ Squats heel touch off a step 6’’
◦ Resisted side step
◦ Single leg stance
◦ Raise limb push into wall (stork)
◦ Single heel raises
◦ 30 mins stationary bike or walking
◦ Sports specific activities
Table 2. Hypertrophy protocols
Hypertrophy Training Following A Total Hip Replacement: A Literature Review International Journal of Sports Physical Therapy
Winther et al. 2020
Winther et al. 2020 (pain and load progression)
Winther et al. 2020 (postural sway)
Petterson et al. 2009
Jakobsen et al. 2014
Madsen et al. 2013
Min Ji Suh et al. 2017
Husby et al. 2018
Hsu et al. 2019
• Leg press
• Hip abduction machine
• Leg press
• Hip abduction machine
• Knee extension machine
• Leg press
• Hip abduction machine
TKA Hypertrophy Protocol
Muscle groups specified rather than specific exercises
• Hamstrings, Gastrocnemius, Soleus, Hip abductors, Hip flexors
• NMES (neuromuscular electrical quad stimulation)
• Knee extension
• Leg press
• Squat
• Leg press
• Knee extension
• Seated curls
• Back extension
• Sit up bench
• Lat pulley
• Triceps vertical machine
• Knee extension
• Hamstring curl
• Leg press
• Knee extensions
• Leg press
• Knee extension machine
• Seat curl machine
• Hip adductor machine
This is an open-access article distributed under the terms of the Creative Commons Attribution 4.0 International License (CCBY-NC-4.0). View this license’s legal deed at https://creativecommons.org/licenses/by-nc/4.0 and legal code at https://creativecommons.org/licenses/by-nc/4.0/legalcode for more information.
Hypertrophy Training Following A Total Hip Replacement: A Literature Review International Journal of Sports Physical Therapy
REFERENCES
1. Fu M, Zhou H, Li Y, Jin H, Liu X. Global, regional, and national burdens of hip osteoarthritis from 1990 to 2019: estimates from the 2019 Global Burden of Disease Study Arthritis Res Ther 2022;24(1):1. doi:1 0.1186/s13075-021-02705-6
2. Chechik O, Khashan M, Lador R, Salai M, Amar E. Surgical approach and prosthesis fixation in hip arthroplasty world wide. Arch Orthop Trauma Surg 2013;133(11):1595-1600. doi:10.1007/s00402-013-18 28-0
3. Gouttebarge V, Inklaar H, Backx F, Kerkhoffs G. Prevalence of osteoarthritis in former elite athletes: a systematic overview of the recent literature. Rheumatol Int 2015;35(3):405-418. doi:10.1007/s002 96-014-3093-0
4. Higgins BT, Barlow DR, Heagerty NE, Lin TJ. Anterior vs. posterior approach for total hip arthroplasty: a systematic review and meta-analysis. J Arthroplasty 2015;30(3):419-434. doi:10.1016/j.art h.2014.10.020
5. Ackerman IN, Bohensky MA, Zomer E, et al. The projected burden of primary total knee and hip replacement for osteoarthritis in Australia to the year 2030. BMC Musculoskelet Disord. 2019;20(1):90. doi:1 0.1186/s12891-019-2411-9
6. Moreau P Minimally invasive total hip arthroplasty using Hueter’s direct anterior approach. Eur J Orthop Surg Traumatol. 2018;28(5):771-779. doi:10.1007/s00 590-018-2158-2
7 Mak D, Chisholm C, Davies AM, Botchu R, James SL. Psoas muscle atrophy following unilateral hip arthroplasty Skeletal Radiol 2020;49(10):1539-1545. doi:10.1007/s00256-020-03447-3
8. Holm B, Thorborg K, Husted H, Kehlet H, Bandholm T Surgery-induced changes and early recovery of hip-muscle strength, leg-press power, and functional performance after fast-track total hip arthroplasty: A prospective cohort study PLoS One 2013;8(4):e62109. doi:10.1371/journal.pone.0062109
9. Holstege MS, Lindeboom R, Lucas C. Preoperative quadriceps strength as a predictor for short-term functional outcome after total hip replacement. Arch Phys Med Rehabil. 2011;92(2):236-241. doi:10.1016/j.a pmr.2010.10.015
10. Brander V, Stulberg SD Rehabilitation after hipand knee-joint replacement: An experience- and evidence-based approach to care. Am J Phys Med Rehabil 2006;85(11):S98-S118. doi:10.1097/01.phm.0 000245569.70723.9d
11. Madara KC, Marmon A, Aljehani M, HunterGiordano A, Zeni J, Raisis L. Progressive rehabilitation after total hip arthroplasty: A pilot and feasibility study. Int J Sports Phys Ther. 2019;14(4):564-581.
12. Meermans G, Konan S, Das R, Volpin A, Haddad FS. The direct anterior approach in total hip arthroplasty: a systematic review of the literature. Bone Joint J 2017;99(6):732-740.
13. Winther SB, Foss OA, Klaksvik J, Husby VS. Pain and load progression following an early maximal strength training program in total hip- and knee arthroplasty patients. J Orthop Surg. 2020;28(2):230949902091639. doi:10.1177/230949902 0916392
14. Robinson J, Bas M, Deyer T, et al. Muscle recovery after total hip arthroplasty: Prospective MRI comparison of anterior and posterior approaches. HIP Int. 2022;33(4):611-619. doi:10.1177/1120700022111 4456
15. Husby VS, Helgerud J, Bjørgen S, Husby OS, Benum P, Hoff J. Early maximal strength training is an efficient treatment for patients operated with total hip arthroplasty Arch Phys Med Rehabil 2009;90(10):1658-1667. doi:10.1016/j.apmr.2009.04.0 18
16. Husby VS, Helgerud J, Bjørgen S, Husby OS, Benum P, Hoff J. Early postoperative maximal strength training improves work efficiency 6–12 months after osteoarthritis-induced total hip arthroplasty in patients younger than 60 years. Am J Phys Med Rehabil 2010;89(4):304-314.
17 Petterson SC, Mizner RL, Stevens JE, et al. Improved function from progressive strengthening interventions after total knee arthroplasty: A randomized clinical trial with an imbedded prospective cohort. Arthritis Rheum. 2009;61(2):174-183. doi:10.1002/art.24167
18. Winther SB, Foss OA, Klaksvik J, Husby VS. Increased muscle strength limits postural sway during daily living activities in total hip arthroplasty patients. Am J Phys Med Rehabil 2020;99(7):608-612. doi:10.1097/phm.0000000000001382
Hypertrophy Training Following A Total Hip Replacement: A Literature Review International Journal of Sports Physical Therapy
19. Husby VS, Foss OA, Husby OS, Winther SB. Randomized controlled trial of maximal strength training vs. standard rehabilitation following total knee arthroplasty. Eur J Phys Rehabil Med. 2018;54(3):371-379. doi:10.23736/s1973-9087.17.047 12-8
20. Nankaku M, Tsuboyama T, Aoyama T, Kuroda Y, Ikeguchi R, Matsuda S. Preoperative gluteus medius muscle atrophy as a predictor of walking ability after total hip arthroplasty. Phys Ther Res. 2016;19(1):8-12. doi:10.1298/ptr.e9884
21. Neumann DA. Kinesiology of the hip: A focus on muscular actions. J Orthop Sports Phys Ther 2010;40(2):82-94. doi:10.2519/jospt.2010.3025
22. Munin MC, Kwoh CK, Glynn N, Crossett L, Rubash HE. Predicting discharge outcome after elective hip and knee arthroplasty Am J Phys Med Rehabil 1995;74(4):294-301. doi:10.1097/00002060-19950700 0-00006
23. Krzysztofik M, Wilk M, Wojdała G, Gołaś A. Maximizing muscle hypertrophy: A systematic review of advanced resistance training techniques and methods. Int J Environ Res Public Health 2019;16(24):4897. doi:10.3390/ijerph16244897
Hypertrophy Training Following A Total Hip Replacement: A Literature Review International Journal of Sports Physical Therapy
SUPPLEMENTARY MATERIALS
appendix 1
Download: https://ijspt.scholasticahq.com/article/93075-hypertrophy-training-following-a-total-hip-replacement-aliterature-review/attachment/194942.docx?auth_token=qu_8fYPOSZziwj4tNeER
Hypertrophy Training Following A Total Hip Replacement: A Literature Review International Journal of Sports Physical Therapy
Suggestions and Considerations for Application of Movement Screens to Clinical Practice
Andrew Skibski1 , James Onate2 , L. Colby Mangum1a
1 Kinesiology and Rehabilitation Sciences, University of Central Florida, 2 Health and Rehabilitation Sciences, The Ohio State University
Keywords: athlete assessment, pre-participation examination, standardization, warm-up https://doi.org/10.26603/001c.92906
International Journal of Sports Physical Therapy
Pre-participation and return to activity functional assessments are commonly used in clinical practice to assess movement quality and identify athletes’ limitations. While there are slight differences between each specific test battery, general guidelines suggest that the tests be completed without a warm-up. This has been suggested because dynamic stretching may improve range of motion and athletic performance. However, athletes typically warm up prior to participating in sport. Therefore, researchers should investigate the acute effects of dynamic stretching on functional tests and movement screens and evaluate other factors that may influence performance on these test batteries. Scientific evidence for standardized implementation of various movement screens is lacking, and future research should aim to identify gaps in the literature to allow clinicians to properly implement evidence-based practice functional assessments. The purpose of this commentary is to discuss various considerations for implementing movement screens and assessment tools into clinical practice.
LEVEL OF EVIDENCE
5
THE PROBLEM
Clinicians (e.g., physical therapists, athletic trainers, and strength coaches) often implement movement screens or functional assessments into their practice. These screens and assessments can be used as clinical tools to examine athletes’ or patients’ physical capabilities including strength, flexibility, coordination, and endurance. Examples of common tools used with athletes include the Functional Movement Screen™ (FMS™)1,2 and Athletic Ability Assessment (AAA)3 along with numerous return to activity assessments to gauge readiness for sport or job demands. Sport-specific and population-specific movement screens also exist, such as the Titleist Performance Institute (TPI) screen,4 Gymnastics Functional Measurement Tool,5 and military fitness screening.6
While the specific components of these evaluations may vary, there are some common aspects. Typical screens require minimal equipment and can be quickly performed in a clinical setting to test aspects of fitness and/or movement important to individuals’ sport, occupation, or daily life. Generally, the clinician demonstrates and verbally explains the test or movement prior to the individual’s attempt, and
tests are scored on an ordinal scale based on the ability to properly complete a movement without compensations or pain. Composite scores are created from the sum of individual tests within the screen, with some research suggesting cutoff scores for injury risk in certain populations. For example, a score at or below 14 on the FMS™ has been linked to increased injury rates,7 while other authors have disputed the utility of this cutoff score.8 The overhead squat is frequently included in movement screens, and is a component of the FMS™, AAA, and TPI screen. Overhead squat performance has been linked to composite FMS™ scores, suggesting this test may be of particular value.9
A common thread between these tools is the lack of a designated or specified warm-up. The FMS™ and TPI screen both instruct clinicians to avoid allowing participants to stretch or warm up prior to the test. Their creators suggest that athletes should be able to properly complete the test components without stretching or specifically preparing their bodies for movement, and a designated warm-up would likely improve test scores. While this reasoning has merit, clinicians and researchers should contemplate the opposing view. Consider an individual who presents with limited shoulder mobility on the FMS™ with-
Corresponding Author: L. Colby Mangum, PhD, ATC; 4364 Scorpius Street, HS II Room 235, Orlando, FL, 32816; 407-823-2795 (office); 407-823-2596 (fax); lauren.mangum@ucf.edu
Clinical Commentary/Current Concept Review
a Skibski A, Onate J, Mangum LC. Suggestions and Considerations for Application of Movement Screens to Clinical Practice. IJSPT. Published online March 1, 2024:351-354. doi:10.26603/001c.92906
out a warm-up. The clinician may believe this is an area needing intervention. However, individuals often complete some form of a warm-up routine prior to participating in their activity. If the athlete performs a dynamic stretch which increases their short-term flexibility and they no longer present with an apparent mobility restriction, they likely are not impaired by this restriction during their sport. Increasing range of motion when it is not necessary not only wastes time for the athlete and clinician, but it may also hinder performance. A rehabilitation program focused on increasing shoulder flexibility in an athlete without a need for more range of motion could eventually progress into shoulder hypermobility, which may increase injury risk.10
Aside from warm-up status, other factors may impact scoring on movement screens and test batteries, such as fatigue, rater training, reliability, and variability of verbal cues provided to athletes. Some of these factors have been studied extensively, while other areas are lacking evidence, but all should be contemplated. The purpose of this commentary is to discuss various considerations for implementing movement screens and assessment tools into clinical practice.
THE SOLUTION
Since dynamic stretching or warm-up routines are commonly completed prior to exercise or sport participation and may lead to acute gains in range of motion, in the authors’ opinions, clinicians should mirror real-world scenarios when assessing their athletes or patients. In the above scenario with a baseball player presenting with limited range of motion on the shoulder mobility tests of the FMS™, a simple warm-up prior to the performance of the FMS™ could reveal the athlete does not have an impairment in the tested movement. Screening tests are often done before practice or on off days and mimicking their practice or game warm-up may provide a more realistic understanding of an athlete’s capabilities.
Substantial evidence has examined the effects of various stretching and warm-up routines on athletic performance and physical abilities. Dynamic stretching can increase joint range of motion, reduce muscle stiffness, and increase force production when compared to static and ballistic stretches, with both acute and chronic adaptations possible.11 Dynamic stretches can be brief activities completed prior to exercise, can mimic the specific demands of their sport, and do not have a substantial time burden. A single set of stretches for major muscle groups can be sufficient to improve performance.11
Since current practice according to FMS™ and TPI guidelines instructs avoiding a warm-up prior to testing, future studies should compare the acute effects of dynamic stretching on these screening systems. If findings suggest no difference in scores, clinicians can continue to use their preference or follow the movement screen’s instructions. However, if a difference does exist, expanded research may be indicated on this topic which could ultimately add to the evidence regarding these screening tools.
In the meantime, while research expands on this topic, practitioners should strive for consistency. If evidence is inconclusive whether a warm-up should be used prior to assessing athletes, studies should explicitly report whether this component was included. Also, the specifics of the warm-up (i.e., exact exercises, sets, repetitions, and rest periods) should be reported, as most past research vaguely explains the warm-up protocol followed, if at all. It is difficult for clinicians to implement evidence-based practice if the procedures are not specific.
DISCUSSION
Existing evidence comparing the effects of warm-ups on movement screens and assessment tools indicates that sport-specific warm-ups may be more impactful than a general warm-up.12 In youth male soccer players, the FIFA 11+ protocol led to improvements in sport performance and FMS™ subtests, while a general warm-up showed improvements on sport assessments compared to before a warmup.12 However, to the authors’ knowledge, this is the only published study directly testing the effects of warm-ups on athletic capabilities. Future research is needed to examine this topic in different athletic populations and with different test batteries.
While few studies have directly examined the effects of a warm-up on movement screens, other factors such as fatigue have been investigated more thoroughly One study compared FMS™ scores before and after a simulated soccer match. They reported worse FMS™ scores following the match, suggesting that fatigue may decrease athletic capabilities and should also be considered.13 Similarly, a study of youth baseball pitchers found changes in joint kinematics in the first and last innings of a simulated game.14 This indicates fatigue alters not only performance on assessment tools, but also influences in-game capabilities. Future research should expand upon this topic in various sports and different lengths of competition. For example, examining pre-match, halftime, and post-match FMS™ scores may provide greater insight into how fatigue impacts athletes’ ability to execute specific movement tasks.
The warm-up is an important aspect to consider when using screening tools such as the FMS™, TPI screen, or AAA, but there are other factors deserving attention. Intertester and intra-tester reliability, learning effects, and specific instructions provided may all influence the patient’s score and should therefore be considered. Although there is evidence supporting FMS™ reliability,15 clinicians should determine their own reliability before tracking changes in their athletes’ movement competency over time. The lack of reliability evidence for other movement screens does not mean these tests are not reliable, but clinicians should use their best judgement until sufficient evidence exists. Additionally, studies have not directly investigated the effect of verbal cues or instructions provided during movement screens or assessment tools. The specific cues provided by a clinician may impact an athlete’s performance, especially with tasks that are scored with multiple criteria. For example, the overhead squat in the AAA is scored based on
Suggestions and Considerations for Application of Movement Screens to Clinical Practice International Journal of Sports Physical Therapy
bar positioning, lower extremity alignment, and depth.3 For example, if an athlete is cued at their first assessment to squat to a “maximum depth”, this may lead to different interpretation than if they were instructed to squat to a “ comfortable depth” To ensure consistent testing, the authors recommend that clinicians should use a script to maintain consistent verbal cueing. Researchers should continue to identify and pursue these gaps in this literature to help guide evidence-based clinical practice.
FUNDING
The authors received no financial support for the research, authorship, and/or publication of this article.
CONFLICTS OF INTEREST
The authors report no conflicts of interest.
© The Author(s) Submitted: July 10, 2023 CST, Accepted: January 12, 2024 CST
This is an open-access article distributed under the terms of the Creative Commons Attribution 4.0 International License (CCBY-NC-4.0). View this license’s legal deed at https://creativecommons.org/licenses/by-nc/4.0 and legal code at https://creativecommons.org/licenses/by-nc/4.0/legalcode for more information.
Suggestions and Considerations for Application of Movement Screens to Clinical Practice International Journal of Sports Physical Therapy
REFERENCES
1. Cook G, Burton L, Hoogenboom B. Preparticipation screening: the use of fundamental movements as an assessment of function - part 1. N Am J Sports Phys Ther 2006;1(2):62-72.
2. Cook G, Burton L, Hoogenboom B. Preparticipation screening: the use of fundamental movements as an assessment of function - part 2. N Am J Sports Phys Ther 2006;1(3):132-139.
3. McKeown I, Taylor-McKeown K, Woods C, Ball N. Athletic ability assessment: A movement assessment protocol for athletes. Int J Sports Phys Ther 2014;9(7):862-873.
4. Rose G, Phillips D. TPI level 1 manual. Published online 2021.
5. Sleeper MD, Kenyon LK, Casey E. Measuring fitness in female gymnasts: The Gymnastics Functional Measurement Tool. Int J Sports Phys Ther 2012;7(2):124-138.
6. Zeno SA, Purvis D, Crawford C, Lee C, Lisman P, Deuster PA. Warm-ups for military fitness testing: Rapid evidence assessment of the literature. Medicine & Science in Sports & Exercise. 2013;45(7):1369-1376. doi:10.1249/mss.0b013e318285c1b9
7 Zarei M, Soltanirad S, Kazemi A, Hoogenboom BJ, Hosseinzadeh M. Composite functional movement screen score predicts injuries in youth volleyball players: a prospective cohort study Sci Rep 2022;12:20207. doi:10.1038/s41598-022-24508-8
8. Bardenett SM, Micca JJ, DeNoyelles JT, Miller SD, Jenk DT, Brooks GS. Functional movement screen normative values and validity in high school athletes: Can the FMS be used as a predictor of injury? Int J Sports Phys Ther 2015;10(3):303-308.
9. Clifton DR, Grooms DR, Onate JA. Overhead deep squat performance predicts functional movement screen score. Int J Sports Phys Ther. 2015;10(5):622-627
10. Liaghat B, Pedersen JR, Young JJ, Thorlund JB, Juul-Kristensen B, Juhl CB. Joint hypermobility in athletes is associated with shoulder injuries: a systematic review and meta-analysis. BMC Musculoskelet Disord. 2021;22(1):389. doi:10.1186/s12 891-021-04249-x
11. Opplert J, Babault N. Acute effects of dynamic stretching on muscle flexibility and performance: An analysis of the current literature. Sports Med 2018;48(2):299-325. doi:10.1007/s40279-017-0797-9
12. Gök U, Aka H, Aktuğ ZB, Ibiş S. Comparison of the effects of general warm-up and FIFA 11+ warm-up programs on Functional Movement Screen test scores and athletic performance. Turk J Sports Med. 2023;58(1):15-20. doi:10.47447/tjsm.0709
13. Kocak UZ, Unver B. Are functional movement screen tests performed at the right time, if it is an injury risk predictor? Journal of Sport Rehabilitation 2021;30(1):85-89. doi:10.1123/jsr.2019-0435
14. Oliver GD, Weimar W Hip range of motion and scapula position in youth baseball pitching pre and post simulated game. Journal of Sports Sciences 2015;33(14):1447-1453. doi:10.1080/02640414.2014.9 90493
15. Teyhen DS, Shaffer SW, Lorenson CL, et al. The functional movement screen: a reliability study J Orthop Sports Phys Ther. 2012;42(6):530-540. doi:10.2 519/jospt.2012.3838
Suggestions and Considerations for Application of Movement Screens to Clinical Practice International Journal of Sports Physical Therapy
Implementing Velocity-Based Training to Optimize Return to Sprint
After Anterior Cruciate Ligament Reconstruction in Soccer Players: A Clinical Commentary
Florian FORELLI1,2,3a , Jérôme RIERA4,5 , Patrice MARINE1 , Maxime GASPAR6 , Geoffrey MEMAIN6 , Nicholas MIRAGLIA7 , Mathias NIELSEN – LE ROUX1 , Ismail BOUZEKRAOUI ALAOUI8,9 , Georgios KAKAVAS10,11 , Timothy E HEWETT12 , Enda KING13 , Alexandre JM RAMBAUD3,14
1 Orthosport Rehab Center, Domont, France, 2 Clinic of Domont, Orthopedic Surgery Department, Ramsay Healthcare, Domont, France, 3 SFMKS-Lab, Société Française des Masseurs-kinésithérapeutes du Sport, Pierrefitte/Seine, France, 4 University Jean Monnet Saint-Etienne, Lyon 1, University Savoie Mont-Blanc, Laboratoire Interuniversitaire de Biologie de la Motricité, EA 7424, F-42023, Saint-Etienne, France, 5 University of Bordeaux, College of Health Sciences, IUSR, 33000, Bordeaux, France, 6 Clairefontaine Medical Center, French Football Federation, France, 7 Miraglia Private Clinic, Triest, Italy, 8 Mohammed VI Faculty of Nursing and Allied Health Professions, Mohammed VI University of Sciences and Health, Casablanca, Morocco, 9 Research Unit, Mohammed VI Center for Research and Innovation, Rabat, Morocco, 10 Fysiotek Spine & Sports Lab, Athens, Greece, 11 Department of Physical Education and Sport Science, University of Thessaly, @ErgoMechLab, Trikala,Greece, 12 Department of Orthopaedic Surgery, Marshall University, Huntington, West Virginia, 13 Rehabilitation Department, Aspetar Orthopaedic and Sports Medicine Hospital, Doha, Qatar, 14 Department of Clinical and Exercise Physiology, Sports Medicine Unity, University Hospital of Saint Etienne, Faculty of medicine, SaintEtienne. France
Keywords: anterior cruciate ligament reconstruction, return to sprint, soccer player, force-velocity-power profile, velocity-based training https://doi.org/10.26603/001c.92704
International Journal of Sports Physical Therapy
After anterior cruciate ligament reconstruction (ACLR), return to sprint is poorly documented in the literature. In soccer, return to sprint is an essential component of return to play and performance after ACLR. The characteristics of running in soccer are specific (velocity differences, nonlinear, intensity). It is important to address these particularities, such as curvilinear running, acceleration, deceleration, changes of direction, and variations in velocity, in the patient’s rehabilitation program. Force, velocity, and acceleration capacities are key elements to sprint performance. Velocity-based training (VBT) has gained much interest in recent years and may have a role to play in optimizing return to play and return to sprint after ACLR. Force, velocity, and acceleration can be assessed using force-velocity-power and acceleration-speed profiles, which should inform rehabilitation. The purpose of this commentary is to describe a velocity-based return to sprint program which can be used during ACLR rehabilitation.
INTRODUCTION
Anterior cruciate ligament (ACL) tear is a severe injury for soccer players with both physical and socio-psychological impacts. Most athletes who sustain this injury go through a surgical reconstruction of the ligament, an ACL reconstruction (ACLR).1 ACLR has many consequences: the player will be away from competition for a long period of time (usually between 8 and 12 months), only 55% of athletes will return to competition, and re-injury rates can be as high as 20-40%.2 The physical impacts of the ACL tear and reconstruction on the injured limb including joint degeneration, neuromuscular and sensorimotor deficits are potential reasons for athletes not being able to return to their previous level of performance.3 These adverse effects may be addressed through an appropriate rehabilitation and re-
turn to sport program to enable the athlete to return to performance while limiting the impact on future knee health. Looking at the increase in research in the field of return to sport after ACLR over the last ten years, velocity-based training (VBT) has gained a substantial interest. Muscle strengthening is important for return to sport, but often the strengthening methods used are not sufficient in view of the muscle persistent strength deficits reported at six months and one and two years postoperatively.4 VBT may help to overcome some of the suboptimal effects of more traditional strength training and address the physiological capacities required for sprint performance.
For soccer players, sport performance results from a combination of physical, physiological, psychological, technical, tactical, and nutritional parameters.5 Among physical and physiological parameters, a player’s ability to sprint repeatedly with short periods of recovery is crucial.
Corresponding Author: Florian FORELLI, 16 rue de Paris, 95330 Domont, France, fforelli@capio.fr, +33769495275 a
Clinical Commentary/Current Concept Review
.
2024:355-365. doi:10.26603/001c.92704
FORELLI F, RIERA J, MARINE P, et al. Implementing Velocity-Based Training to Optimize Return to Sprint After Anterior Cruciate Ligament Reconstruction in Soccer Players: A Clinical Commentary. IJSPT
Published online March 1,
Four percent of the total distances covered by field players during a game are executed in sprint runs (above 23 km/ h).6 These very high intensity runs represent 10 to 15% of the effective playing time and are fundamental efforts that can lead to goal actions.7,8 However, the details regarding the introduction of sprint and its management during post ACLR rehabilitation in soccer players has rarely been explored.
The purpose of this commentary is to describe a velocity-based return to sprint program which can be used during ACLR rehabilitation. Several concepts will be presented in this paper: the specificity of sprint in soccer after ACL reconstruction, the use of VBT in the return to sport continuum after ACLR, the relationship between force-velocity-power and acceleration-speed and how to assess them to individualize/optimize rehabilitation. Finally, the importance of sprint work progression will be discussed.
REQUIREMENTS FOR SPRINT PERFORMANCE IN SOCCER
Soccer players play in a complex environment with multiple stimuli that requires numerous athletic and cognitive abilities.9 Multi-directional speed ability is an important skill, defined as the proficiency and ability of an individual to accelerate, decelerate and rapidly change direction (side-cutting), while maintaining high speed in all directions within a specific sport scenario.10 For instance, a striker may have to overcome an opponent to create an advantage for the team. Acceleration, deceleration and top speed have been defined as key performance indicators.11
Acceleration is thought to have a strong metabolic demand, compared to deceleration, which elicits a higher mechanical demand especially at the knee joint (higher loading rates and greater Ground Reaction Forces [GRFs]).12,13 On the other hand, deceleration (braking) plays a central role in sport performance: being skilled in braking allows an athlete to rapidly reduce the momentum of the entire body mass and redirect it in the necessary direction.14 In soccer, decelerations and re-accelerations are more frequent than accelerations.15 Great technical skill is required to optimize the braking phase by attenuation of loading forces as efficiently as possible. It is accomplished by manipulation of the body’s center of mass and allowing braking forces to be produced by muscle and other connective tissues.16
The ability to sprint efficiently is paramount for soccer players.17 Variation of as little as 0.04s over a 20m sprint time resulted in a variation in distance covered of almost 30cm.18 Sprint time is not the only determinant of running performance in soccer.18 Acceleration abilities are also crucial and related to athletes’ horizontal net force production capacities. Multiple acceleration patterns exist in soccer 19 Players accelerate from a range of different speeds, including a standing start to sub-maximal speeds.17 It is not possible to reach the same level of acceleration at all speeds: peak acceleration decreases as the speed increases until it reaches zero at maximum speed.19
Another characteristic of sprint in soccer, the curvilinear sprint, is not often described in the literature. While linear
sprint demonstrates similar mechanical behavior (kinematic, kinetic and spatio-temporal) in both legs, in curvilinear sprint each leg has a different role.20 The inside leg plays a fundamental role of stabilizer in the frontal plane (with an eversion-adduction strategy) as well as in propulsion. It also has significantly longer ground contact times than the outside leg. The outside leg plays a greater role in control of movement in the horizontal plane.21 During the curvilinear sprint, lateral forces are constantly redirected to the body which requires the body to be in a constantly inclined position, with the hip of the inside leg in adduction and internal rotation and the ankle in eversion, and a considerable mechanical impact on the knee.21
FORCE-VELOCITY AND ACCELERATION-SPEED PROFILES
In muscle physiology, the force-velocity (F-V) relationship indicates that the slower a skeletal muscle shortens, the greater the force it can generate, and vice versa. This relationship is a fundamental principle of skeletal muscle physiology that was based on Hill’s ground-breaking studies in isolated frog muscles22 and originally used to develop theories of skeletal muscle contraction mechanisms.23 This work was a precursor and undoubtedly laid the foundations for current research into the force-velocity profile. The force-velocity profile provides a complete and meaningful understanding of the individual mechanical determinants of linear sprint performance.
Power can be considered, from a mechanical point of view, as the product of force and velocity In sprint, the power developed to move forward is the product of horizontal force and running speed. There is a close relationship between these two components, which are oriented in opposite directions at maximum acceleration. This is represented by the F-V relationship. The athlete’s F-V profile is represented by a slope. (Figure 1) This slope indicates the relative importance of strength and speed in determining maximum power (Pmax). The F-V profile gives an indication of the athlete’s ability to generate and apply high levels of ground reaction force in the horizontal direction as a function of running speed.
In the process of return to sprint after an ACL injury, assessing the athlete’s force-velocity capacity is important, especially if a pre-injury evaluation has been carried out (during pre-season for example). This would allow stakeholders to see if the athlete has regained his or her ability to produce force and to compare them with athletes playing in the same position. An accessible and inexpensive approach to obtain the F-V profile during a linear sprint test on the field has been proposed.24 This method only requires measuring the athlete’s velocity during a sprint (using split time, laser timing, or radar guns). The F-V profile provides valuable information about the mechanical limits of the player’s neuromuscular system, allowing the creation of tailored programs to optimize sprint performance.25
Monitoring soccer players acceleration qualities should only be done relative to the starting speed. A method to evaluate the individual limits of specific acceleration capac-
Implementing Velocity-Based Training to Optimize Return to Sprint After Anterior Cruciate Ligament Reco… International Journal of Sports Physical Therapy
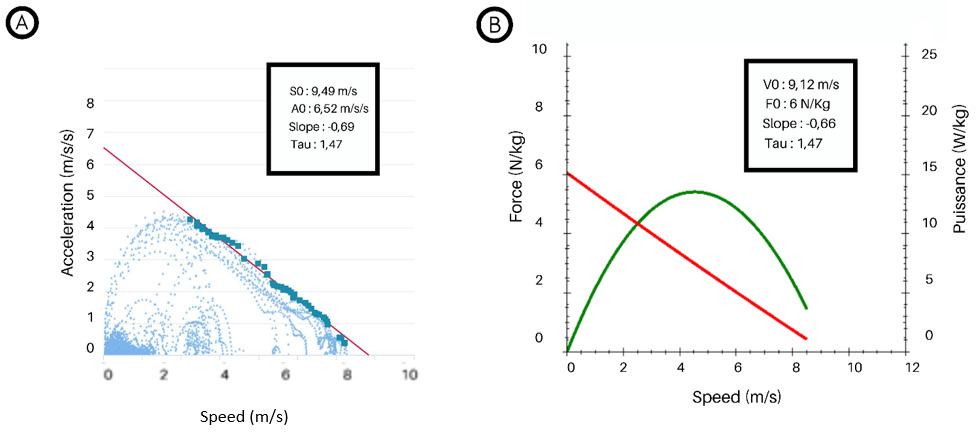
S0 : Maximal theoretical speed, A0: Maximal theoretical acceleration,V0: maximal theoretical velocity, F0 : maximal theoretical force, Tau: time constant computed by S0/A0 or V0/F0
ities, over all the speed ranges between 3m/s and an athlete’s maximum speed, has been tested using Global Positioning System (GPS) data.26 There is a quasi-linear and individual relationship between maximal acceleration for a given speed. This relationship has been described as the player’s acceleration-speed profile. It is done by recording time, speed, and acceleration data; collected by a GPS (Vector Pro©, Catapult, Melbourne, Australia ; GPEXE©, Exelio SLR , Reana del Rojale, Italy; Apex Athele Series©, Statsport, Newry, United Kingdom) worn by the soccer player 26 In order to cover the whole speed spectrum of the player, the data collection must be done over several training sessions.26 The modelling of the acceleration-velocity profile can be achieved either by using a software specific to the GPS used or by importing the raw spatio-temporal data into a dedicated spreadsheet.26 This method allows to record data while the player is in an ecological environment and not in a laboratory controlled test situation. The variables obtained are the theoretical maximum acceleration peak (A0), the theoretical maximum speed (S0), the profile slope (AS) and the time constant (Tau). The individual acceleration-velocity profile of fourteen elite soccer players was studied from pre-season to the end of the season.27 Some stability in the team average values was observed, while the individual A0 values underwent changes in contrast to the S0 values.27 These findings indicate that, from a performance and injury perspective, it may be appropriate to make frequent assessments of players’ acceleration-velocity profiles to monitor changes in sprint performance throughout the season as well as to establish pre-injury reference values.
Figure 1 compares the acceleration-velocity profile (A) and the force-velocity profile (B) of the same player, measured with a GPS unit (GPEXE©, Exelio SLR, Italy). Data were collected during a single outdoor training session con-
sisting of a sequence of exercises including ball games and changes of direction with and without the ball and 5 linear sprints of 30m. The instruction given for the assessment of the force-velocity profile was: “Accelerate as hard and as long as possible” While the instruction for the rest of the session was: “Play as usual”. Profile A was modelled by the application published by GPEXE© (Exelio SLR , Reana del Rojale, Italy), while profile B was modelled by the software Mookystalker© (version 3.0.15, MTraining, Ecole-Valentin, France). The two profiles modelled as a result of this single session are close and in line with the conceptual equivalence described by Morin et al.26
With regard to return to sprint after ACLR clinicians and strength and conditioning staff can tailor their interventions using force-velocity-power and acceleration-velocity profiles. These profiles allow them to target specific deficits within mechanical determinants of sprint performance during the rehabilitation process. Different training methods can address some of those deficits. Velocity based training is one of them.
VELOCITY-BASED TRAINING
To accelerate, the player must be able to produce high levels of horizontal force over distances that are typically between 5 and 20m.28,29 For the soccer player, it is a necessity to regain explosive force production capabilities after ACLR. Resistance training is effective to recover a neuromuscular phenotype that is compatible with this objective.30 The Percentage Based Training (PBT) method leads the individual to muscle failure.31 PBT simply relates to the weight the person can lift in a given exercise in relation to their maximum capacity For example – if a person is performing bench press with 100kg, and his known 1RM (1 rep maximum) is 110kg, then the percentage is 90%. This results in
Figure 1. Comparison of acceleration-velocity (A) and force-velocity-power (B) profiles achieved during a single sprint field rehabilitation session.
Implementing Velocity-Based Training to Optimize Return to Sprint After Anterior Cruciate Ligament Reco… International Journal of Sports Physical Therapy
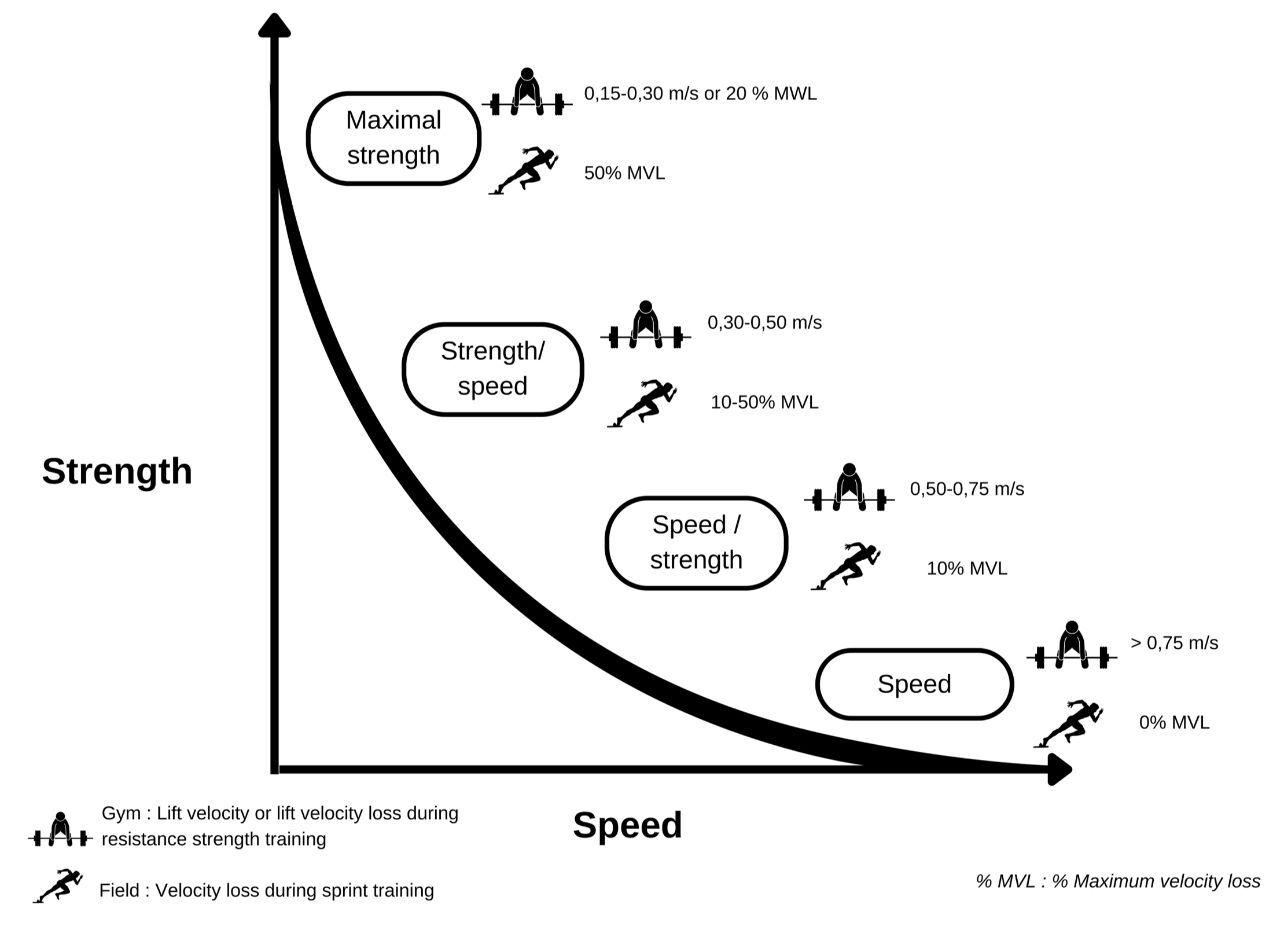
a significant reduction in the fast type IIx fibers that are essential for explosive force production.32,33
Alternative training methods that may avoid these problems exist. Velocity-based training (VBT) is one method to consider. It involves measuring the movement velocity for a specific load during each repetition (Figure 2).34 The heavier the load to be moved, the lower the velocity, until velocity becomes minimal when the 1-RM is reached.35 The movement velocity of a barbell can be measured when performing non-specific sprint strength training exercises. The inertial load of a whole system (player mass + additional load) can also be measured in the case of specific sprint exercises. In either case, the maximum voluntary velocity is of paramount importance (Table 1).36
VELOCITY-BASED TRAINING AND DEVELOPMENT OF SPRINT-SPECIFIC STRENGTH QUALITIES
When a player is coming back from an ACLR and is able to sprint, it is crucial to incorporate sprint specific training, such as sled resisted sprint or uphill sprint in sessions.37 Several authors have shown that the capacity to produce horizontal force is diminished when returning to sport, so an appropriate stimulus must be offered to correct this deficit.38‑40 With VBT, similar to PBT training, intensity needs to be individualized.41 This can be achieved by practitioners using a “sprint velocity based training” in order to
offer a training intensity that corresponds to the player’s real needs.25 The basic idea is to select a specific additional load that leads to a specific reduction in maximum speed, which differs according to the desired adaptations (e.g : technical competency, speed–strength, power and strength–speed) (Figure 3)42 This can be done by establishing a load-velocity profile. Creating the profile requires knowing the coefficient of friction between the sled and the ground,42 the maximum speed of the player with no additional load and then with four additional loads. Morin et al. has created a spreadsheet to calculate the profile from this data (Appendix 1; https://jbmorin.net/downloads����/).37 The acceleration intention must be maximal in each trial in order to obtain a linear regression coefficient that is close to one.37 The profile created makes it possible to know the load ranges that correspond to the specific training zones and allows practitioners to define the appropriate load to achieve the targeted adaptations (Figure 4).42 It has been shown that resisted sprint sessions increase the theoretical maximal force production (F0) and ground force application efficiency (RFmax) more than conventional sprint sessions,37 without altering sprint kinematics.25 F0 and RFmax are strongly correlated with a player’s acceleration capabilities.43,44 The ideal load for optimizing the development of the maximum propulsive qualities is that which reduces the maximum speed by 50%.25
Figure 2. Specific strength development relative to speed of movement.
Implementing Velocity-Based Training to Optimize Return to Sprint After Anterior Cruciate Ligament Reco… International Journal of Sports Physical Therapy
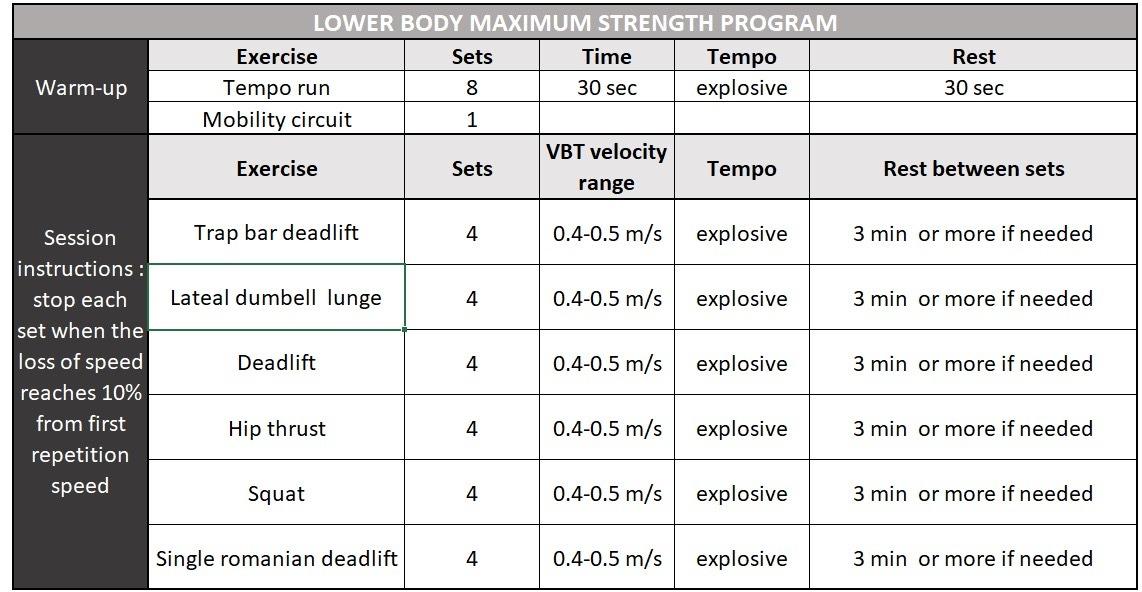
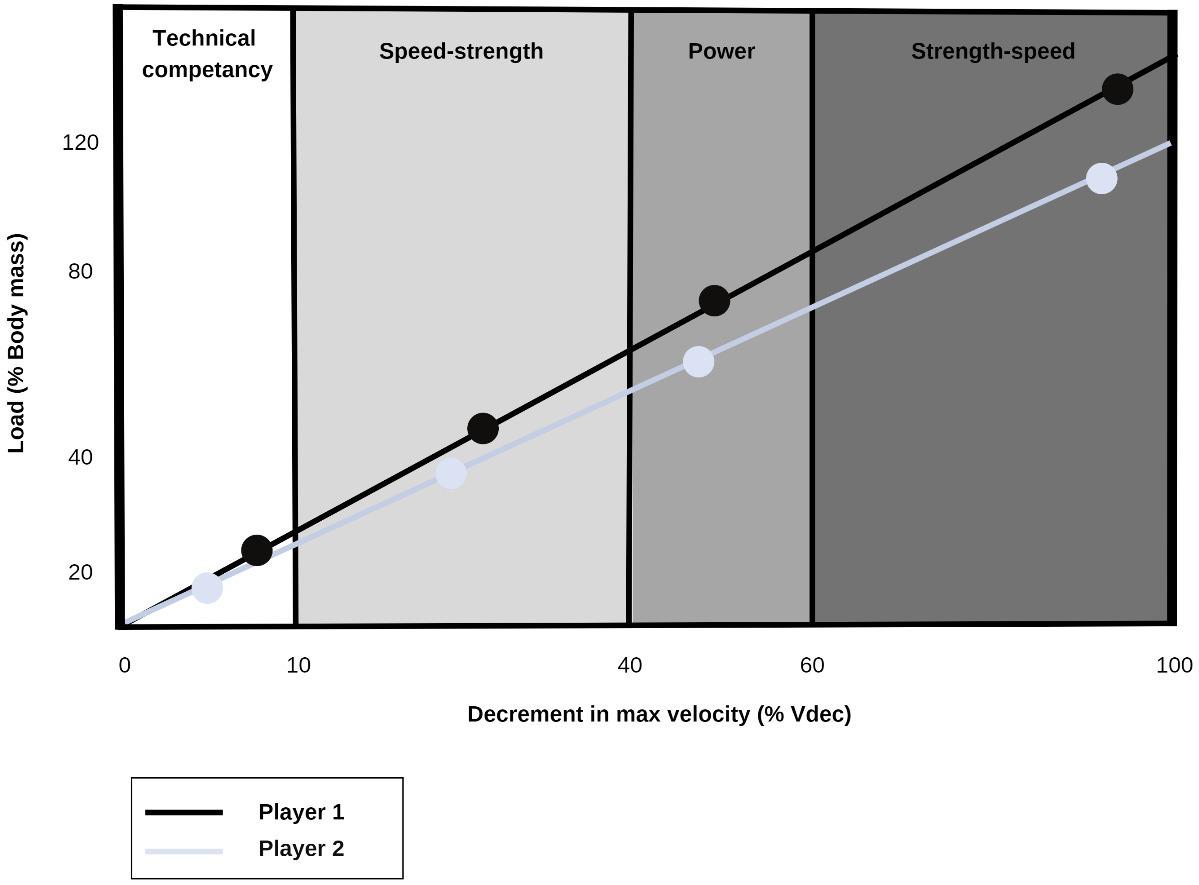 Table 1. Velocity-based strength program training m/s; meter per second, s; second, min; minutes.
Implementing Velocity-Based Training to Optimize Return to Sprint After Anterior Cruciate Ligament Reco… International Journal of Sports Physical Therapy
Figure 3. Example of individual load velocity profile of two different players and corresponding specific training zones.42
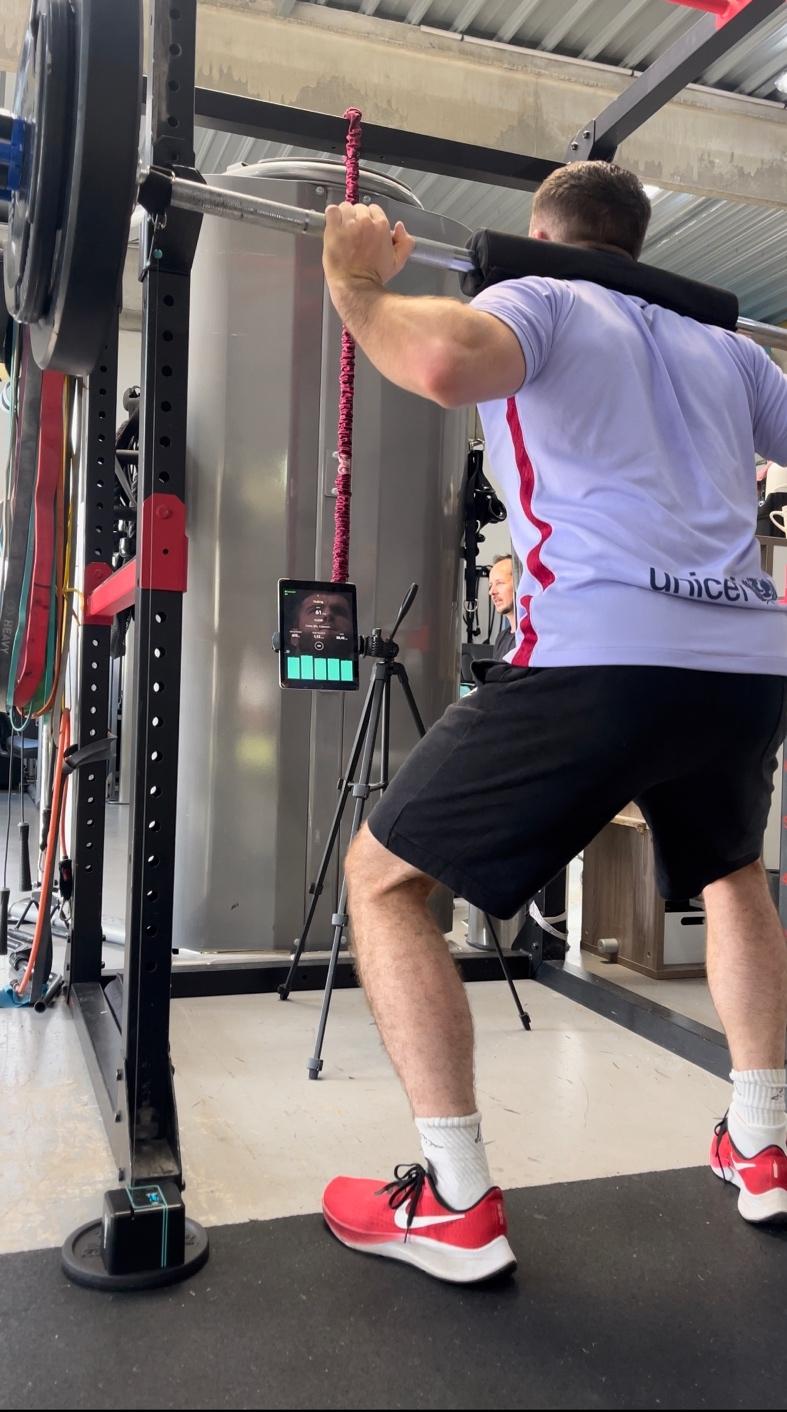
PROGRESSION FROM HIGH INTENSITY RUNNING TO REINTRODUCTION OF SPRINT IN REHABILITATION.
The reintroduction of sprint is an important step in the final phase of ACLR rehabilitation. Sprint re-introduction must be preceded by a purposive progression in intensity of running activities. The literature highlights proposed three-stage evolution starting from the beginning of return to running.45,46 These three stages are described Table 1. Each stage requires an increase in force capacities. The first stage sets a speed between 50 and 70% of the player’s maximum speed (MS) corresponding to high-speed running. This requires muscular and functional capacities greater than 70% of quadriceps and hamstring limb symmetry index (LSI).45,46 The second stage consists of increasing to 75% or 85% MS.45,46 This is described as very high speed running. To get there, capacities higher than 85% LSI are recommended. The last stage is the re-introduction of
above 90% MS which requires capacities close to 100% LSI (Table 2).45,46
For return-to-sprint process, it is essential to focus on the work:rest ratio. It should be low at the beginning to guarantee quality work at each introduction of a higher intensity level, work : rest ratio of 1:4 seems to be a good pace to start, generating a high level of energy resynthesis, so that the cardiovascular aspect is not a limiting factor in the quality of high-intensity work.47 An intensity plateau and volume is set up during a minimum of seven field sessions per each stage. This is accomplished by increasing the volume of running at the targeted intensity as well as using interval training, with temporal parameters depending on the intensity required, from a 2:1 ratio of work time over rest time at small intensities, up to a 1:2 ratio at high intensities.45,47The duration and number of rehabilitation sessions per phase will depend on the athlete’s ability to adapt and the rapidity of improvement. The total running volume, the distances suggested for each repetition and the work/recovery ratio will vary depending on the level of the athlete and the sport.45,47 For example (Figure 5), for elite soccer players values shoulg be higher than: 4500m for total distance, 800m for high speed running (between 20-25km/ h), 300m for sprint and 300m acceleration and deceleration (higher than 3m/s/s).48
Welling et al. have studied sprint performance post ACLR.47 A strong correlation exists between peak speed, performance in repeated sprint and return to play rate. Return to sprint and repeated sprint performance are essential steps towards return to performance in soccer 45 Only one on-field test that assesses sprint performance after ACLR is described in the literature.47,49 It consists of 12 sprint of 40 m with maximal acceleration.50 However, there are obstacles to the use of this test in clinical practice. Indeed, the muscular and articular demands of this test require several progressive sessions (volume and intensity) of maximum-intensity rehabilitation prior to its first performance to avoid the risk of muscular damage during the test. A simpler test to objectify sprint performance and monitor athletes during the return to performance process may needed.
CONCLUSION
After ACL reconstruction, muscular and physical abilities must be developed to allow return to play to be optimized. Return to play involves the development of strength, speed and acceleration capacities while taking into account the demands of soccer including acceleration, deceleration, changes of direction, and velocity of running (sprinting). Velocity-based training may be proven efficient in redeveloping sprint skills following ACLR and this commentary provides some recommendations by the authors on how it may be used and further investigated. Velocity-based training methods may help clinicians to improve sprint performance after ACLR in soccer players. Return to sprinting should be gradually carried out and tailored to the athlete’s assessed capacity (force-velocity and force-acceleration profiles) in order to avoid overload that may jeopardize the return to play.
Figure 4. Velocity based specific training zone with Vitruve Linear Encoder© (Vitruve, Madrid, Spain) Device during squatting
Implementing Velocity-Based Training to Optimize Return to Sprint After Anterior Cruciate Ligament Reco… International Journal of Sports Physical Therapy
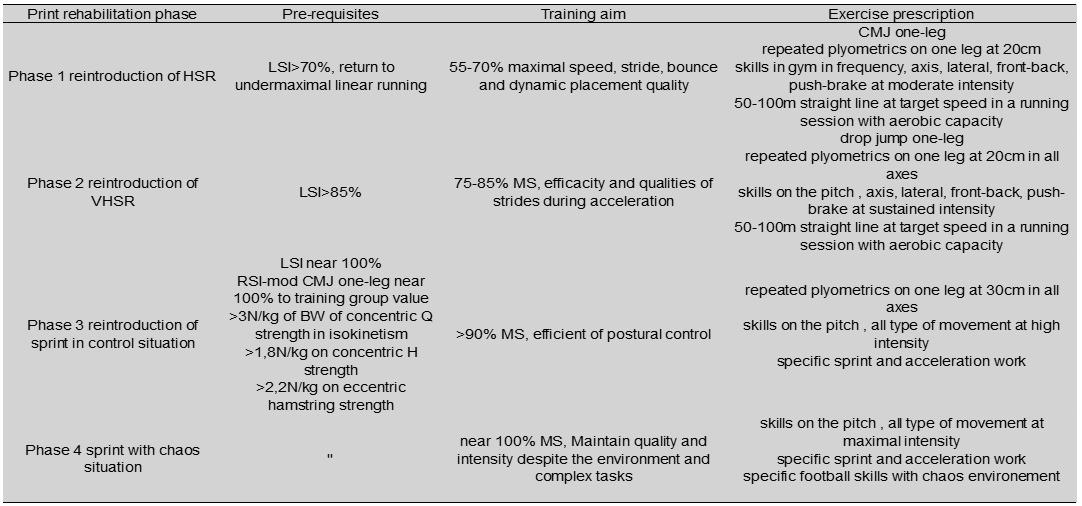
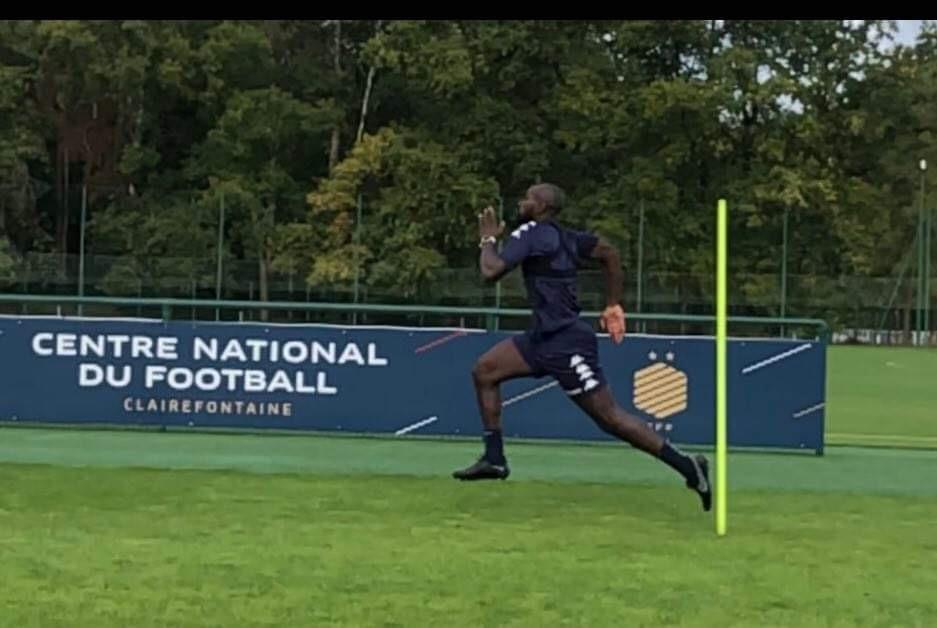
COI STATEMENT
The authors declare no conflict of interest
Submitted: September 20, 2023 CST, Accepted: January 02, 2024 CST
© The Author(s)
This is an open-access article distributed under the terms of the Creative Commons Attribution 4.0 International License (CCBY-NC-4.0). View this license’s legal deed at https://creativecommons.org/licenses/by-nc/4.0 and legal code at https://creativecommons.org/licenses/by-nc/4.0/legalcode for more information.
Table 2. Progression sprint recovery during rehabilitation after ACLR46 LSI; Limb Symmetry Index, MS; maximal speed, HSR; high speed running, VSHR; very high-speed running, BW; body weight, Q; quadriceps, H; hamstring, RSI-mod; reactive strength index – modified.
Figure 5. Specific high-speed running (between 20-25km/h) training with an elite soccer player after ACLR
Implementing Velocity-Based Training to Optimize Return to Sprint After Anterior Cruciate Ligament Reco… International Journal of Sports Physical Therapy
REFERENCES
1. Dunn KL, Lam KC, Valovich McLeod TC. Early operative versus delayed or nonoperative treatment of anterior cruciate ligament injuries in pediatric patients. J Athl Train 2016;51(5):425-427 doi:10.408 5/1062-6050.51.5.11
2. Wiggins AJ, Grandhi RK, Schneider DK, Stanfield D, Webster KE, Myer GD Risk of secondary injury in younger athletes after anterior cruciate ligament reconstruction: A systematic review and metaanalysis. Am J Sports Med 2016;44(7):1861-1876. do i:10.1177/0363546515621554
3. Lohmander LS, Englund PM, Dahl LL, Roos EM. The long-term consequence of anterior cruciate ligament and meniscus injuries: Osteoarthritis. Am J Sports Med. 2007;35(10):1756-1769. doi:10.1177/0363 546507307396
4. Ithurburn MP, Altenburger AR, Thomas S, Hewett TE, Paterno MV, Schmitt LC. Young athletes after ACL reconstruction with quadriceps strength asymmetry at the time of return-to-sport demonstrate decreased knee function 1 year later. Knee Surg Sports Traumatol Arthrosc 2018;26(2):426-433. doi:10.1007/s00167-017-4678-4
5. Nikolaidis PT. Evaluation of fatigue in semiprofessional football players: association between overtraining and physical fitness. Biomed Hum Kinet 2014;6(1). doi:10.2478/bhk-2014-0009
6. Di Salvo V, Baron R, Tschan H, Calderon Montero F, Bachl N, Pigozzi F. Performance characteristics according to playing position in elite soccer. Int J Sports Med 2007;28(3):222-227 doi:10.1055/s-200 6-924294
7. Dellal A, Chamari K, Pintus A, Girard O, Cotte T, Keller D. Heart rate responses during small-sided games and short intermittent running training in elite soccer players: A comparative study. J Strength Cond Res 2008;22(5):1449-1457 doi:10.1519/jsc.0b01 3e31817398c6
8. Faude O, Koch T, Meyer T. Straight sprinting is the most frequent action in goal situations in professional football. J Sports Sci 2012;30(7):625-631. doi:10.1080/02640414.2012.6659 40
9. Alesi M, Bianco A, Padulo J, et al. Motor and cognitive growth following a Football Training Program. Front Psychol. 2015;6. doi:10.3389/fpsyg.201 5.01627
10. McBurnie AJ, Parr J, Kelly DM, Dos’Santos T Multidirectional speed in youth soccer players: Programming considerations and practical applications. Strength Cond J 2022;44(2):10-32. doi:1 0.1519/ssc.0000000000000657
11. Barnes C, Archer D, Hogg B, Bush M, Bradley P. The evolution of physical and technical performance parameters in the English Premier League. Int J Sports Med. 2014;35(13):1095-1100. doi:10.1055/s-00 34-1375695
12. McBurnie AJ, Harper DJ, Jones PA, Dos’Santos T Deceleration training in team sports: Another potential ‘vaccine’ for sports-related injury? Sports Med 2022;52(1):1-12. doi:10.1007/s40279-021-0158 3-x
13. Dalen T, Jørgen I, Gertjan E, Geir Havard H, Ulrik W Player load, acceleration, and deceleration during forty-five competitive matches of elite soccer. J Strength Cond Res 2016;30(2):351-359. doi:10.1519/js c.0000000000001063
14. Dos’Santos T, Thomas C, Comfort P, Jones PA. The effect of angle and velocity on change of direction biomechanics: An angle-velocity trade-off Sports Med. 2018;48(10):2235-2253. doi:10.1007/s402 79-018-0968-3
15. Harper DJ, Carling C, Kiely J. High-intensity acceleration and deceleration demands in elite team sports competitive match play: A systematic review and meta-analysis of observational studies. Sports Med. 2019;49(12):1923-1947. doi:10.1007/s40279-01 9-01170-1
16. Dos’Santos T, Thomas C, Comfort P, Jones PA. Role of the penultimate foot contact during change of direction: Implications on performance and risk of injury Strength Cond J 2019;41(1):87-104. doi:10.151 9/ssc.0000000000000395
17. Haugen TA, Tønnessen E, Hisdal J, Seiler S. The role and development of sprinting speed in soccer Int J Sports Physiol Perform. 2014;9(3):432-441. doi:10.11 23/ijspp.2013-0121
18. Haugen T, Buchheit M. Sprint running performance monitoring: Methodological and practical considerations. Sports Med. 2016;46(5):641-656. doi:10.1007/s40279-015-0446-0
Implementing Velocity-Based Training to Optimize Return to Sprint After Anterior Cruciate Ligament Reco… International Journal of Sports Physical Therapy
19. Sonderegger K, Tschopp M, Taube W The challenge of evaluating the intensity of short actions in soccer: A new methodological approach using percentage acceleration. Lucía A, ed. PLOS ONE. 2016;11(11):e0166534. doi:10.1371/journal.pone.016 6534
20. Filter A, Olivares-Jabalera J, Santalla A, et al. Curve sprinting in soccer: Kinematic and neuromuscular analysis. Int J Sports Med Published online June 3, 2020. doi:10.1055/a-1144-3175
21. Alt T, Heinrich K, Funken J, Potthast W. Lower extremity kinematics of athletics curve sprinting. J Sports Sci 2015;33(6):552-560. doi:10.1080/0264041 4.2014.960881
22. The heat of shortening and the dynamic constants of muscle. Proc R Soc Lond Ser B - Biol Sci 1938;126(843):136-195. doi:10.1098/rspb.1938.0050
23. Huxley AF. Muscle structure and theories of contraction. Prog Biophys Biophys Chem 1957;7:255-318. doi:10.1016/s0096-4174(18)30128-8
24. Samozino P. A simple method for measuring force, velocity and power capabilities and mechanical effectiveness during sprint running. In: Morin JB, Samozino P, eds. Biomechanics of Training and Testing: Innovative Concepts and Simple Field Methods Springer International Publishing; 2018:237-267. do i:10.1007/978-3-319-05633-3_11
25. Lahti J, Huuhka T, Romero V, Bezodis I, Morin JB, Häkkinen K. Changes in sprint performance and sagittal plane kinematics after heavy resisted sprint training in professional soccer players. PeerJ 2020;8:e10507. doi:10.7717/peerj.10507
26. Morin JB, Le Mat Y, Osgnach C, et al. Individual acceleration-speed profile in-situ: A proof of concept in professional football players. J Biomech. 2021;123:110524. doi:10.1016/j.jbiomech.2021.11052 4
27 López-Sagarra A, Baena-Raya A, Casimiro-Artés MÁ, Granero-Gil P, Rodríguez-Pérez MA. Seasonal changes in the acceleration–speed profile of elite soccer players: A longitudinal study. Appl Sci. 2022;12(24):12987 doi:10.3390/app122412987
28. Hunter JP, Marshall RN, McNair PJ. Relationships between ground reaction force impulse and kinematics of sprint-running acceleration. J Appl Biomech 2005;21(1):31-43. doi:10.1123/jab.21.1.31
29. Bradley PS, Sheldon W, Wooster B, Olsen P, Boanas P, Krustrup P. High-intensity running in English FA Premier League soccer matches. J Sports Sci 2009;27(2):159-168. doi:10.1080/0264041080251 2775
30. Suchomel TJ, Nimphius S, Stone MH. The importance of muscular strength in athletic performance. Sports Med 2016;46(10):1419-1449. do i:10.1007/s40279-016-0486-0
31. Davies T, Orr R, Halaki M, Hackett D. Effect of training leading to repetition failure on muscular strength: A systematic review and meta-analysis. Sports Med. 2016;46(4):487-502. doi:10.1007/s4027 9-015-0451-3
32. Allen D, Lannergren J, Westerblad H. Muscle cell function during prolonged activity: cellular mechanisms of fatigue. Exp Physiol 1995;80(4):497-527 doi:10.1113/expphysiol.1995.sp0 03864
33. Pareja-Blanco F, Rodríguez-Rosell D, SánchezMedina L, et al. Effects of velocity loss during resistance training on athletic performance, strength gains and muscle adaptations. Scand J Med Sci Sports 2017;27(7):724-735. doi:10.1111/sms.12678
34. Balsalobre-Fernández C, Torres-Ronda L. The implementation of velocity-based training paradigm for team sports: Framework, technologies, practical recommendations and challenges. Sports. 2021;9(4):47 doi:10.3390/sports9040047
35. Weakley J, Mann B, Banyard H, McLaren S, Scott T, Garcia-Ramos A. Velocity-based training: From theory to application. Strength Cond J 2021;43(2):31-49. doi:10.1519/ssc.0000000000000560
36. Cormie P, McGuigan MR, Newton RU. Developing maximal neuromuscular power: part 2 - training considerations for improving maximal power production. Sports Med. 2011;41(2):125-146. doi:10.2 165/11538500-000000000-00000
37 Morin JB, Petrakos G, Jiménez-Reyes P, Brown SR, Samozino P, Cross MR. Very-heavy sled training for improving horizontal-force output in soccer players. Int J Sports Physiol Perform 2017;12(6):840-844. doi:1 0.1123/ijspp.2016-0444
38. Edouard P, Lahti J, Nagahara R, et al. Low horizontal force production capacity during sprinting as a potential risk factor of hamstring injury in football. Int J Environ Res Public Health 2021;18(15):7827 doi:10.3390/ijerph18157827
39. Mendiguchia J, Samozino P, Martinez-Ruiz E, et al. Progression of mechanical properties during onfield sprint running after returning to sports from a hamstring muscle injury in soccer players. Int J Sports Med 2014;35(8):690-695. doi:10.1055/s-0033-136319 2
Implementing Velocity-Based Training to Optimize Return to Sprint After Anterior Cruciate Ligament Reco… International Journal of Sports Physical Therapy
40. Mendiguchia J, Edouard P, Samozino P, et al. Field monitoring of sprinting power–force–velocity profile before, during and after hamstring injury: two case reports. J Sports Sci. 2016;34(6):535-541. doi:10.1080/ 02640414.2015.1122207
41. Cross MR, Brughelli M, Samozino P, Brown SR, Morin JB. Optimal loading for maximizing power during sled-resisted sprinting. Int J Sports Physiol Perform 2017;12(8):1069-1077 doi:10.1123/ijspp.201 6-0362
42. Cahill MJ, Oliver JL, Cronin JB, Clark KP, Cross MR, Lloyd RS. Sled-pull load–velocity profiling and implications for sprint training prescription in young male athletes. Sports. 2019;7(5):119. doi:10.3390/spor ts7050119
43. Haugen TA, Breitschädel F, Seiler S. Sprint mechanical variables in elite athletes: Are forcevelocity profiles sport specific or individual? PeyréTartaruga LA, ed. PLOS ONE 2019;14(7):e0215551. d oi:10.1371/journal.pone.0215551
44. Morin JB, Edouard P, Samozino P Technical ability of force application as a determinant factor of sprint performance. Med Sci Sports Exerc. 2011;43(9):1680-1688. doi:10.1249/mss.0b013e31821 6ea37
45. Taberner M, Allen T, Cohen DD. Progressing rehabilitation after injury: consider the ‘controlchaos continuum.’ Br J Sports Med 2019;53(18):1132-1136. doi:10.1136/bjsports-2018-1 00157
46. Lorenz D, Domzalski S. Criteria-based return to sprinting progression following lower extremity injury Int J Sports Phys Ther 2020;15(2):326-332. do i:10.26603/ijspt20200326
47. Welling W, Frik L. On-field tests for patients after anterior cruciate ligament reconstruction: A scoping review Orthop J Sports Med 2022;10(1):232596712110554. doi:10.1177/232596712 11055481
48. Eryılmaz SK, Kaynak K. Relationship between repeated sprint ability and aerobic fitness in college volleyball players. Univers J Educ Res 2019;7(5):1198-1204. doi:10.13189/ujer.2019.070505
49. Welling W, Benjaminse A, Lemmink K, Gokeler A. Passing return to sports tests after ACL reconstruction is associated with greater likelihood for return to sport but fail to identify second injury risk. The Knee 2020;27(3):949-957 doi:10.1016/j.kne e.2020.03.007
50. Buchheit M, Simpson BM, Peltola E, MendezVillanueva A. Assessing maximal sprinting speed in highly trained young soccer players. Int J Sports Physiol Perform. 2012;7(1):76-78. doi:10.1123/ijsp p.7.1.76
Implementing Velocity-Based Training to Optimize Return to Sprint After Anterior Cruciate Ligament Reco… International Journal of Sports Physical Therapy
SUPPLEMENTARY MATERIALS
Appendix 1
Download: https://ijspt.scholasticahq.com/article/92704-implementing-velocity-based-training-to-optimize-return-tosprint-after-anterior-cruciate-ligament-reconstruction-in-soccer-players-a-clinical-commen/attachment/ 193644.docx?auth_token=lrlaL2EezJLpgrdPTtiR
Implementing Velocity-Based Training to Optimize Return to Sprint After Anterior Cruciate Ligament Reco… International Journal of Sports Physical Therapy
MSK ULTRASOUND:
A
POWERFUL TOOL FOR EVALUATING AND DIAGNOSING PECTORALIS
MAJOR INJURIES IN HEALTHCARE PRACTICE.
Robert C. Manske, PT, DPT, MEd, SCS, ATC, CSCS, FAPTA
Chris Wolfe, PT, DPT, OCS, Cert MDT
Phil Page, PT, PhD, ATC, CSCS, FACSM
Michael Voight, PT, DHSC, SCS, OCS, ATC, CSCS, FAPTA
Abstract
Accurately diagnosing pectoralis major injuries, particularly in athletes, often presents a challenge for healthcare practitioners. Although pectoralis muscle injuries are relatively uncommon, the diagnosis of a tear may be overlooked without careful screening by a thorough physical examination of both the injured and uninjured sides. While magnetic resonance imaging (MRI) has traditionally held the gold standard, musculoskeletal ultrasound (MSKUS) has emerged as a viable alternative. This article delves into the power of MSKUS in evaluating and diagnosing pectoralis major injuries, highlighting its dynamic capabilities, real-time visualization, and costeffectiveness in comparison to MRI. By equipping healthcare professionals with a thorough understanding of MSKUS’s potential, this article aims to empower them to confidently diagnose and manage pectoralis major injuries, ultimately improving patient outcomes and facilitating a faster return to function.
Introduction
The pectoralis major is at risk during any activity in which the arm is extended and externally rotated while under maximal contraction.1 The pectoralis major muscle, a powerhouse of the chest wall responsible for adduction, flexion, and internal rotation of the arm, is frequently exposed to high tensile forces during athletic activities. This vulnerability makes it susceptible to a spectrum of injuries, ranging from mild muscle strains to complete muscle or tendon ruptures. Accurate and timely diagnosis is crucial for guiding appropriate treatment and ensuring optimal recovery. Traditionally, magnetic resonance imaging (MRI) has held the position of the gold standard for diagnosing pectoralis major injuries.2-3 However, its limitations, including high cost, limited availability, and static imaging, have paved the way for the emergence of musculoskeletal ultrasound (MSKUS) as a compelling alternative.4-6 This article aims to provide rehabilitation professionals with an understanding of MSKUS in the context of pectoralis major injuries.
Pectoralis major muscle injuries usually occur secondary to weightlifting in nearly 50% of cases.13,15 The bench press is a common culprit due to the excessive tension put on an
eccentrically contracted muscle as the bar is lowered to the chest. Less commonly, injuries occur after direct trauma causing forced abduction and external rotation of the upper extremity.6,7 Tendon tears occur almost exclusively in males between 20 and 40 years old and are heavily associated with anabolic androgenic steroid use.7-9 From a historical perspective, the first case of this injury was described in 1822 by Patissier in Paris involving a butcher boy who tore his pectoralis major in an attempt to lift a large piece of beef from a hook.4 The next several reported cases all involved men’s arms/shoulders being run over by horse-drawn carts.5 As athletic activities, particularly weightlifting and the bench press, increased in popularity toward the latter half of the 20th century, sports-related injuries began to outnumber job-related injuries and now account for the majority of all reported pectoralis major ruptures.5 The ability to detect and treat a pectoralis major rupture is important for both the clinician and the patient and is aided with knowledge of anatomy, the physical examination, and results of imaging studies. MRI has the ability to differentiate the site, grade, and chronicity of injury, it is expensive, time-consuming, while its availability is often limited to the hospital and/or emergency room setting.10 In contrast, point-of-care ultrasound (POCUS) is commonly available and can be used to help confirm the diagnosis and hasten disposition.2
Anatomy
The pectoralis major is a complex, fan-shaped muscle comprised of a clavicular head, originating from the medial half of the clavicle, and a sternocostal head, originating from the anterior sternum, costal cartilages of ribs 1-7, and the aponeurosis of the external oblique.2,11 The two heads come together and form a common tendon and insert into the intertubercular sulcus of the humerus.2,11 Rupture occurs most commonly in patients with a history of weightlifting, causing disruption of the distal humeral enthesis.12,13
Imaging
A variety of imaging techniques can be utilized in the assessment and management of pectoralis major ruptures. While these supplementary imaging modalities can aid in
MSK ULTRASOUND BITES: TIPS AND TRICKS
detecting a pectoralis major rupture, it is imperative to acknowledge that a physical examination is paramount in the identification of such tears, as imaging results can often be inconclusive or inconsistent. It is noteworthy that cases where imaging explicitly indicates a rupture are invariably corroborated by a physical examination. Consequently, although imaging studies contribute to the diagnostic process, the clinical examination should be considered the cornerstone of diagnosis.
MSK ultrasound offers a unique window into the intricate world of muscle and tendon pathology. By interpreting the characteristic features on ultrasound images, healthcare practitioners can accurately diagnose various pectoralis major injuries. In the context of pectoralis major ruptures, ultrasound has emerged as an efficacious and cost-effective diagnostic tool.16-17 It is advocated for its potential to expedite surgical intervention when a rupture is suspected.17 In practice, comparing ultrasound images of the uninjured side with the injured side can be particularly informative. An intact pectoralis major appears on ultrasound as a hypoechoic area, representing the muscle tissue, bordered by parallel echogenic lines indicative of the perimysium. The epimysium is discernible as a densely echoic layer anterior to the muscle. Any deviation from this pattern may suggest a rupture. Tears manifest as hypoechoic (darker) areas within the muscle belly, at the myotendinous junction, or at the humeral insertion. The disruption of the normal muscle fiber pattern is a telltale sign. Tendon abnormalities are characterized by thickening, disruption, or retraction of the pectoralis major tendon visualized on ultrasound suggest tendinitis, partial tears, or complete ruptures. Furthermore, ultrasounds are adept at identifying hematomas, which typically present as large, hypoechoic, well-defined entities within the muscle tissue itself. Therefore, ultrasound serves as a cost-effective and valuable alternative to MRI for the evaluation of pectoralis major ruptures.
Advantages of MSK Ultrasound
1. Real-Time Dynamic Assessment: MSKUS allows for the evaluation of muscle and tendon movements in real-time, crucial for assessing the pectoralis major.
2. High-Resolution Imaging: Enhanced image resolution aids in identifying subtle pathological changes within the muscle fibers and tendinous attachments.
3. Non-Invasive and Patient-Friendly: Unlike MRI, MSKUS is non-invasive, does not require exposure to radiation, and is generally more accessible and cost-effective.
Ultrasound Techniques for Pectoralis Major Evaluation
1. Transducer Positioning and Scanning Techniques: The article describes optimal transducer placement and scanning protocols for comprehensive visualization of the pectoralis major.
2. Identifying Pathologies: Techniques for identifying common injuries such as muscle strains, tears, and tendon avulsions.
3. Comparative Analysis: Emphasis on comparing the injured side with the uninjured side to identify discrepancies in muscle morphology and dynamics.
Integration into Rehabilitation Practice
1. Tailoring Rehabilitation Protocols: Utilizing ultrasound findings to customize rehabilitation strategies based on the specific nature and extent of the injury.
2. Monitoring Progress: The role of follow-up ultrasound examinations in monitoring the healing process and adjusting rehabilitation plans accordingly.
3. Patient Education and Engagement: Enhancing patient understanding and involvement in their rehabilitation journey through visual feedback from ultrasound imaging.
Conclusion
Prompt evaluation, radiographic confirmation, and surgical intervention are key in ensuring positive outcomes in active patients with pectoralis major tears. Diagnostic MSKUS represents a significant advancement in the evaluation of pectoralis major injuries. Its real-time, non-invasive nature makes it an invaluable tool for rehabilitation providers. However, its efficacy is dependent on the skill of the operator and should be seen as a complementary tool to a comprehensive clinical assessment.
REFERENCES
1. Manske RC, Prohaska D. Pectoralis major tendon repair post-surgical rehabilitation. N Am J Sports Med. 2007;2(1):22-33.
2. Franks N, Gress J. Joseph R. Point-of-care ultrasound for suspected pectoralis major rupture: A case report. Clin Practice Cases Emerg Med. 2021;5(1):93-96.
3. Rehman A, Robinson P: Sonographic evaluation of injuries to the pectoralis muscles. Am J Roentgenol. 2005;184:1205-1211.
4. Lee, YK, Skalski RM, White EA, et al. US and MR imaging of pectoralis major injuries. Radiographics. 2017;37:176-189.
5. Lee SJ, Jacobson JA, Kim SM, et al. Distal pectoralis major tears: sonographic characterization and potential diagnostic pitfalls. J Ultrasound Med. 2013;32:2075-2081.
6. Chadwick N, Weaver JS, Shultz C, et al. Highresolution ultrasound and MRI in the evaluation of pectoralis major injuries. J Ultrasound. 2023;e202-e213.
7. Provencher MT, Handfield K, Boniquit NT, et al. Injuries to the pectoralis major muscle: Diagnosis and management. Am J Sports Med. 2010;38(9):1693-1704.
8. Aciero OC, Cruser DL. Pectoralis major rupture with simultaneous anterior dislocation of the shoulder. J Shoulder Elbow Surg. 1997;6(3):318-320
9. Haley CA, Zacchilli MA. Pectoralis major injuries: evaluation and treatment. Clin Sports Med. 2005;33(4): 739-756.
10. Bak K, Cameron EA, Henderson IJ. Rupture of the pectoralis major: A meta-analysis of 112 cases. Knee Surg Sports Traumatol Arthrosc.. 2000;8(2):113-119.
11. Kanayama G, DeLuca J, Meehan WP. Ruptured tendons in anabolic-androgenic steroid users: A crosssectional cohort study. Am J Sports Med. 2015;43(11): 2638-2644.
12. Connell DA, Potter HG, Sherman MF. Injuries to the pectoralis major muscle: Evaluation with MR imaging. Radiology. 1999;10(3):785-791.
13. Moore KL, Dalley AF, Agur A. Clinically Oriented Anatomy. Wolters Kluwer, Baltimore, MD. 2014.
14. ElMaraghy AW, Devereaux MW. A systematic review and comprehensive classification of pectoralis major tears. J Shoulder Elbow Surg. 2012;21(3):412-422.
15. Wolfe SW, Wickiewicz TL, Cavanaugh JT. Ruptures of the pectoralis major muscle: An anatomic and clinical analysis. Am J Sports Med. 1992;20(5):587-593.
16. Beloosesky Y, Grinblat J, Hendel D, et al Pectoralis major rupture in elderly patients: Clinical and sonographic findings. Clin Imaging. 2003;27(4):261-264.
17. Pavlik A, Csepai D, Berkes I: Surgical treatment of pectoralis major rupture in athletes. Knee Surg Sports Ttraumatol Arthrosc. 1998;6(2):129-133.
18. Lin TY, Chang TY, Wu TY, et al. Right arm pain after strength training: Ultrasound imaging for pectoralis major tendon strain. J Yeungnam Med Sci. 2003;40(1):109–111.
PECTORALIS MAJOR
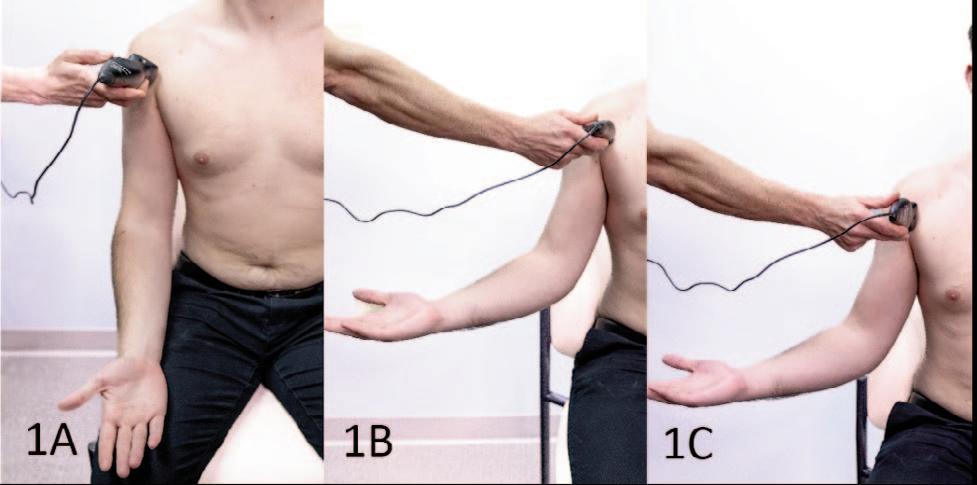
Short Axis (SAX):
The patient may assume either a seated or supine position. The shoulder should initially be maintained at 0 degrees of abduction, accompanied by a flexed elbow and supinated forearm. Following the initial scan in this relaxed posture, the subject's arm can be externally rotated and slightly abducted, introducing heightened tension across the pectoralis tendon for further evaluation.
Figure 1B: Short Axis (SAX) Transducer Placement:
The transducer is strategically placed in a transverse orientation on the proximal anterior aspect of the shoulder. It is precisely focused on the long head of the biceps tendon within the bicipital groove and then moved progressively downward to cover the insertion point of the pectoralis tendon. During this process, the subject's arm can be externally rotated and slightly abducted, creating increased tension on the pectoralis tendon, facilitating a more thorough evaluation.
Figure 1C: Long Axis (LAX) Transducer Placement:
The transducer is positioned in the long-axis plane, running parallel to the biceps tendon to guarantee it is perpendicular to the fibers of the pectoralis tendon. During this imaging procedure, the subject's arm can be externally rotated and slightly abducted, generating increased tension across the pectoralis tendon, thereby enabling a more detailed evaluation.
Figures 1A: Patient Position and Initial Transducer Placement in
NORMAL VIEW IN SHORT AXIS (SAX):
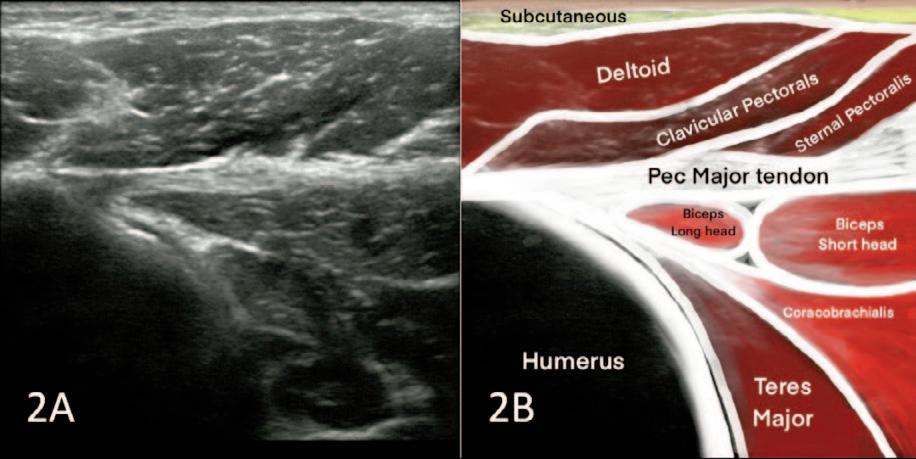
onto the humerus, there is seen a fused portion of the tendon where the clavicular and sternal portions of the pectoralis tendon have come together. This fused tendon covers primarily the long head of the biceps
and
covers the biceps tendon short head and coracobrachialis. Special attention is directed towards the distal part, ensuring thorough coverage. During this short axis view, the examiner should initially locate the long head of the biceps tendon and superior to this can begin to note the direction of the pectoralis tendon fibers. The fibers coursing in an inferolateral direction contribute to the anterior tendon layer. The superolateral directed fibers contribute to the posterior layer.
NORMAL VIEW IN LONG AXIS (LAX):
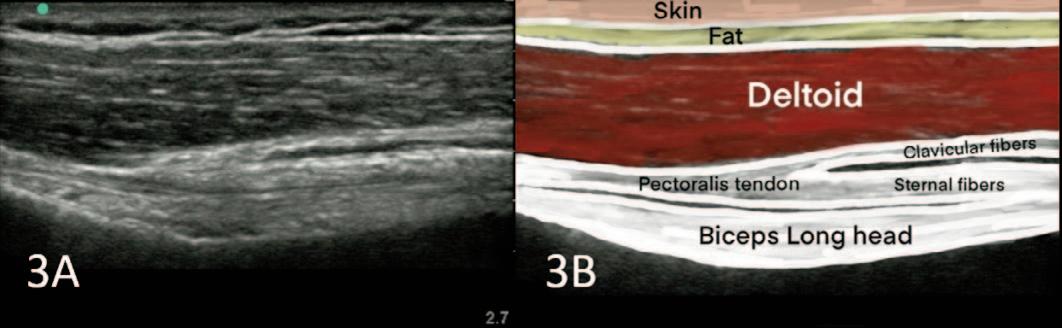 Figures 2A and 2B Short Axis View: In the tendon attachment
tendon
somewhat
Figures 3A and 3B Long Axis View: In the Long Axis view, evaluate the sternal and clavicular insertions thoroughly. This perspective offers insight into the long axis of the biceps brachii long head tendon and reveals the fused layers of the sternal and clavicular segments of the pectoralis muscle, presenting as a cohesive tendon. The sternal myotendon may exhibit slight undulations, while the clavicular portion typically appears superior to the sternal segment.
Figures 2A and 2B Short Axis View: In the tendon attachment
tendon
somewhat
Figures 3A and 3B Long Axis View: In the Long Axis view, evaluate the sternal and clavicular insertions thoroughly. This perspective offers insight into the long axis of the biceps brachii long head tendon and reveals the fused layers of the sternal and clavicular segments of the pectoralis muscle, presenting as a cohesive tendon. The sternal myotendon may exhibit slight undulations, while the clavicular portion typically appears superior to the sternal segment.
PARTIAL TEAR IN SHORT AXIS (SAX):
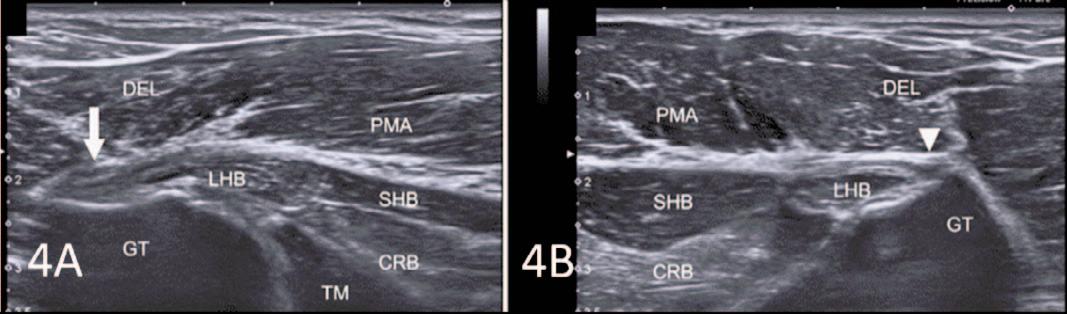
Figures 4A and 4B: In image 4A of the right proximal region, there is a noticeable loss of the fibrillar pattern and an increased thickness in the pectoralis major tendon (indicated by arrow) near its insertion on the humerus. On the unaffected side, as shown in image 4B, the pectoralis major tendon (indicated by arrowhead) exhibits a normal thickness and fibrillar pattern. The labeled structures include CRB (coracobrachialis muscle), DEL (deltoid muscle), GT (greater tubercle), LHB (long head of the biceps muscle), SHB (short head of the biceps muscle), TM (teres major muscle), and PMA (pectoralis major muscle).
Digital Health Corner by Genie Health Gaining Ground
Deon Bührsa
Keywords: digital health, RTM, south africa https://doi.org/10.26603/001c.94017
International Journal of Sports Physical Therapy
Deon Bührs, Managing Director of Genie Health SA, on launching a hybrid healthcare delivery model in South Africa
In the realm of sports medicine, the pursuit of optimal performance and rapid recovery is paramount. Much the same can be said of the desire for recovery after surgery, and where there’s a need there’s a way Such is the case for hybrid healthcare models that combine the best of both worlds – a human face-to-face professional interface with that of modern technology – to help patients recover optimally, and in many cases, by up to 60% fasterwith a 50% reduction in pain.1
Such is the demand and exponential growth of digital solutions in healthcare, both in South Africa and abroad, with the HealthTech sector now one of the fastest growing industry categories today This is not only driven by our digital evolution as a species but by an increase in demand for better ways to live and be healthy, and adoption of the ‘ prevention is better than cure’ proven ethos.
The rapid adoption of technology-based or enhanced solutions has, in the main, been met with open arms, however, there are still those practitioners who are hesitant to change and who look on technological applications as a threat.
Rather than a threat, I subscribe to the mindset that they are an opportunity, such as in the case of introducing a hybrid healthcare model like the one we introduced into South Africa towards the end of last year, that is now successful in providing the expertise of a multi-disciplinary clinical MSK (musculoskeletal) team at the tip of a patient’s finger.
For clarity, a hybrid model is a blend of in-person and virtual care, where virtual care can even be seen as the first contact point for the patient, and where required, is referred to in-person care, as well as being the perfect complement to practitioner-led programmes. Virtual care is also the glue holding it all together, between in-person sessions, to ensure continuity of care, compliance, and maintenance of momentum through the recovery period.
Virtual physical recovery programmes, present a transformative solution to overburdened public and private healthcare systems battling with an expanding population and diminishing resources. In South Africa, 80% of the population is currently reliant on a very stressed public healthcare systems with the balance having access to private sector care. And with the National Health Insurance (NHI) on the horizon, the country is going to need to look at healthcare delivery and quality through new lenses if it is to ever be efficient and practical.
Overburdened healthcare systems are true of most developed and developing countries around the world. But hybrid models in South Africa have the potential to alleviate this with the result being the necessary comprehensive care that patients deserve and that practitioners want to and can deliver
South Africa also has the added challenge of access to healthcare. This is not only physical access, but financial. With a population of more than 61 million,2 many of whom are based in remote and rural areas and who have limited access to any form of healthcare, this challenge is real. In my opinion, the adoption of virtual care models and systems offers a promising avenue to enhance access, elevate the standard and quality of care as well as the expertise on offer and at the same time, provide an affordable means for healthcare and self-empowerment.
Patients themselves, are also requiring a more modern approach to their healthcare needs, that gives them the advantages of in-person consultation and intervention where needed, with the convenience of choosing where and when to do home exercises for example. Hybrid systems encourage patients to re-calibrate how they receive healthcare, especially physiotherapy and biokinetic services, where hands-off is often of greater benefit to the patient, promoting self-empowerment, less dependency, and more ownership of their healthcare conditions, as statistics show that in the traditional approach, only 20% - 30% of patients
Corresponding Author:
Email: dbuhrs@geniesa.health
Genie Health 2024 The
current population of South Africa is 60,781,080 as of Thursday, February 8, 2024, based on Worldometer elaboration of the latest United Nations data a 1 2 Bührs D. Gaining Ground. IJSPT. Published online March 1, 2024:372-373. doi:10.26603/001c.94017
complete their home exercise programme, negatively impacting their recovery.
For practitioners, the adoption of hybrid healthcare is entering an exciting time and space. We can work collaboratively in a hybrid model, where the ‘app’ or ‘platform’ becomes an extension of our in-person practice, with the added benefit of objective outcomes measures of the patient’s activities in a home environment through recorded detailed tracking and measurement, repeated pain scales and many other assessments as required.
The imperative for a hybrid model in South Africa is multifaceted.
In short, hybrid care facilitates the integration of specialised expertise into the primary care settings with personalised and real-time adjusted treatment plans, while empowering greater autonomy in patients managing their own health and recovery By embracing a modern approach that combines virtual consultations with in-person interventions, individuals can reclaim agency over their well-being while minimising dependency on expensive traditional healthcare systems. This convergence of resources will not only optimise patient outcomes but will also enhance the professional development of practitioners while reducing the burden on the existing and strained healthcare system.
With hybrid models addressing the availability of professional healthcare in the physical recovery and rehabilitation sectors in South Africa, and across the African continent, where there are too few practitioners to the number of patients, we can strive to reach more patients and manage them optimally 3 The ratio in South Africa, is currently around 0.15 Physiotherapists per 100,000 population overall,4 while in the private sector this climbs to 0.6 Physiotherapists per 100,000 population (similar to that of the USA). It is clear that there is a crisis of accessibility to care in the public sector, servicing a population of more than 50 million at a ratio of as low as 0.04 (close to that of Turkey)!
Navigating the operating model in South Africa requires a nuanced understanding of local dynamics. While parallels exist with global trends, contextual factors such as socioe-
conomic disparities and cultural norms, healthcare regulation and the context of the NHI, necessitate tailored strategies. By aligning with the priorities of funders and empowering patients to play an active role in their healthcare journey, practitioners can navigate the evolving landscape with confidence and efficacy.
In the short to medium term, the trajectory of hybrid health in South Africa and the broader African context is poised for significant growth. As awareness spreads and infrastructure improves, we can anticipate the proliferation of innovative care delivery models tailored to the unique needs of diverse populations. While challenges remain, the momentum toward integration and collaboration signals a promising future for healthcare on the continent.
There will also naturally be a resistance to change in some quarters in adopting more AI-driven interventions, but good change is also hard, and something we recognise at Genie Health. Those who adopt AI and leverage technology as an enabler will certainly out-compete those who don’t, as ultimately, the old school way of doing things will be enhanced and eventually replaced as the world moves ever deeper into the 4th industrial revolution and the digital realm.
It will not mean, however, that we will lose our humanity. That’s up to us.

© The Author(s)
This is an open-access article distributed under the terms of the Creative Commons Attribution 4.0 International License (CCBY-NC-4.0). View this license’s legal deed at https://creativecommons.org/licenses/by-nc/4.0 and legal code at https://creativecommons.org/licenses/by-nc/4.0/legalcode for more information.
4
https://www.theglobaleconomy.com/rankings/physiotherapists_per_1000_people/ https://www.saphysio.co.za/media/181281/history-of-the-sasp.pdf
3
Gaining Ground International Journal of Sports Physical Therapy
