VULNERABILITY ASSESMENT STUDY OF URBAN INFORMAL SETTLEMENTS
Ranchi, Jharkhand
Vulnerability assessment & mapping by Integrated Design (INDÉ) in collaboration with Mahila Housing SEWA Trust (MHT)

April 2021
1. INTRODUCTION
There is rising awareness of the vulnerability of urban systems, economies and infrastructure to climate change induced threats. The cataclysmic losses of life and property caused by the interaction of erratic and unprecedented climate patterns with degraded and deficient city infrastructure and systems, has led to growing consensus on the need to centralize questions of resilience and sustainability within urban planning frameworks.
Engaging with this project in the Global South will require cognisance of the complex, conflicted and dynamic nature of urbanization in these contexts. UN predictions estimate that by 2050 70% of the world population will be urban, with 90% of that growth to be concentrated in Asia and Africa. The inability of local urban planning and governance frameworks tomatch this unprecedented scale and pace of urban growth has resulted in the exacerbation of climate change vulnerabilities. A significant portionof the human cost of extreme weather events in urban centresin low- and middle-income nations comes not from the hazard or disaster event but from inadequacies in provisions to protect urban populations. This is especially true for the urban poor who are seen to disproportionately bear the costs and risks associated with climate change and environmental degradation. This relates both to the inter-linkage of their livelihood systems with natural resources as well as the inadequate housing, basic and social infrastructure they have access to. The city-wide infrastructural and institutional incapacities not-withstanding, the exacerbated vulnerabilities that the urban poor face have been linked to their antagonistic positioning within formal urban planning frameworks.
Addressing the question of climate change vulnerability in the urban South will therefore require framing it in relation with questions of urban poverty and inequality. It will require foregrounding the context-specific manifestation of climate change induced threats and institutionalizing frameworks that elicit,
collate and leverage these insights into formal planning frameworks. Such a grounded exploration is critical, especially for the urban poor, for whom climate change vulnerabilities are an accumulated risk deriving from pervasive and persistent marginalization within urban planning frameworks.
2. OBJECTIVES
The present project, funded by DFID with Mahila Housing Trust as the lead partner and Integrated Design as the technical partner, aims to undertake climate change vulnerability assessment and mapping of three hamlets in three informal settlements in Ranchi, Jharkhand to understand the risks and vulnerabilities faced by the slum dwellers. Occurring in the context of the COVID 19 pandemic and the momentum it provides for re-thinking urban planning paradigms, it seeks to assess climate change vulnerability to relation to questions of housing condition, basic infrastructure provision, livelihood opportunities and social infrastructureprovision for urban poor settlements. Specifically, it assesses the following five climate change related vulnerabilities in each of the settlements:
1. Heat Stress Vulnerability
2. Water Scarcity Vulnerability
3. Water Logging Vulnerability
4. Vector Borne Diseases Vulnerability
5.
Health Vulnerability
The findings from this assessment are oriented towards two ends. Firstly, it serves as an informational base to guide interventions at settlement or city level that synergistically address the agendas of climate change adaptation and urban poverty reduction.Secondly, it serves as a pilot case revealing the challenges and opportunities associated with recognizing, eliciting and collating bottom-up perspectives related to multi-scalar challenges such as climate change vulnerability into urban planning frameworks. A project report titled
Vulnerability Assessment & Mapping 2
‘Vulnerability Assessment of Urban Informal Settlements in Ranchi’ prepared by MHT and Integrated Design dominantly engaged with the former objective highlighting the context-specific manifestation of climate change vulnerabilities (as derived from FGDs, social mapping, geo-spatial mapping and HH surveys). The project report shall build on those insights while explicitly focussing on the latter objective of deriving processes for bottom-up data collection and their integration into planning frameworks.
3. CONCEPTUAL FRAMEWORK
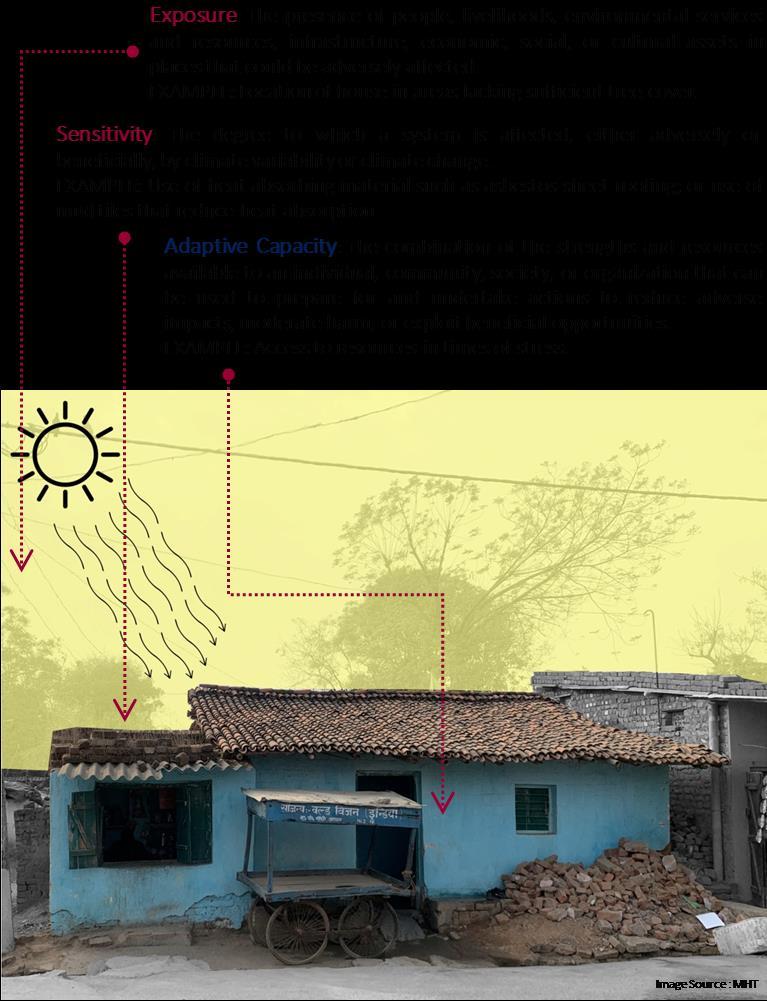
The Intergovernmental Panel on Climate Changecalls vulnerability a function of the character,magnitude, and rate of climate variation to which a system is exposed, its sensitivity, andits adaptive capacity. That is, vulnerability constitutes the interaction between an external dimension, which is represented by the ‘exposure’ of a system to climate variations, as well as an internal dimension, which comprisesits ‘sensitivity’ and its ‘adaptive capacity’. An operational definition of these terms is given below (Sensing Local, 2017):
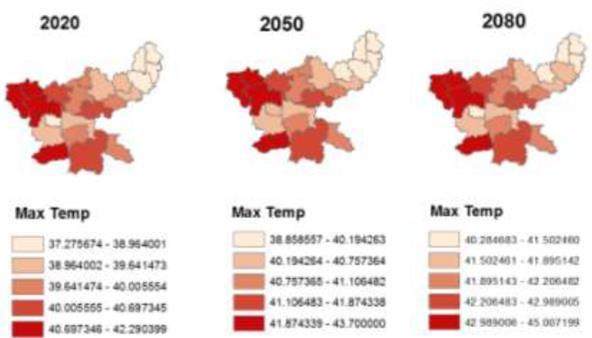
Image: Maximum Temperature (°C) in Jharkhand under A2b scenario of IPCC assessment report. The summer temperature will go up by a max of 2.30-3.00 between 2020-2080
Source: Jharkhand Action Plan on Climate Change
Vulnerability Assessment & Mapping 3
4. APPROACH AND METHODOLOGY
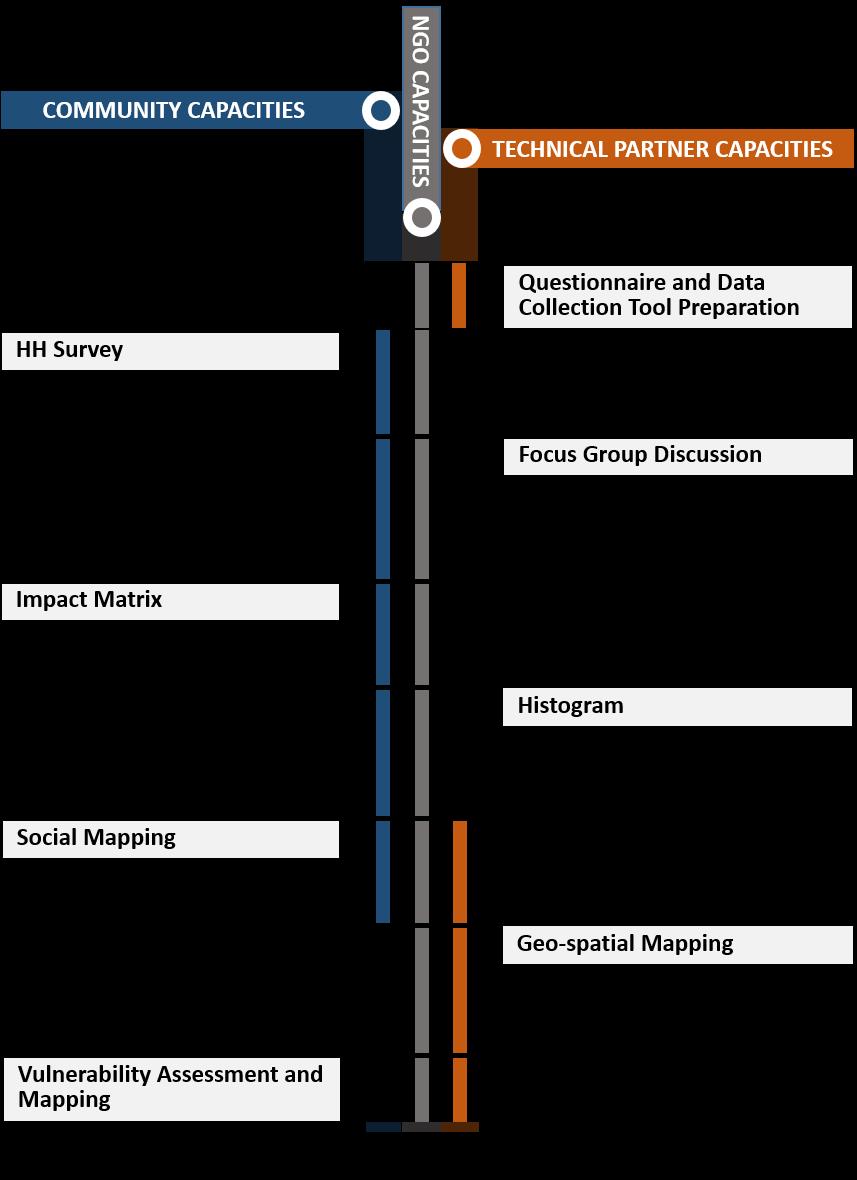
The project employed a collaborative and participatory approach that brought together the capacities of the technical partner (Integrated Design), the NGO partner (Mahila Housing Trust) and the community.
Vulnerability Assessment & Mapping 4
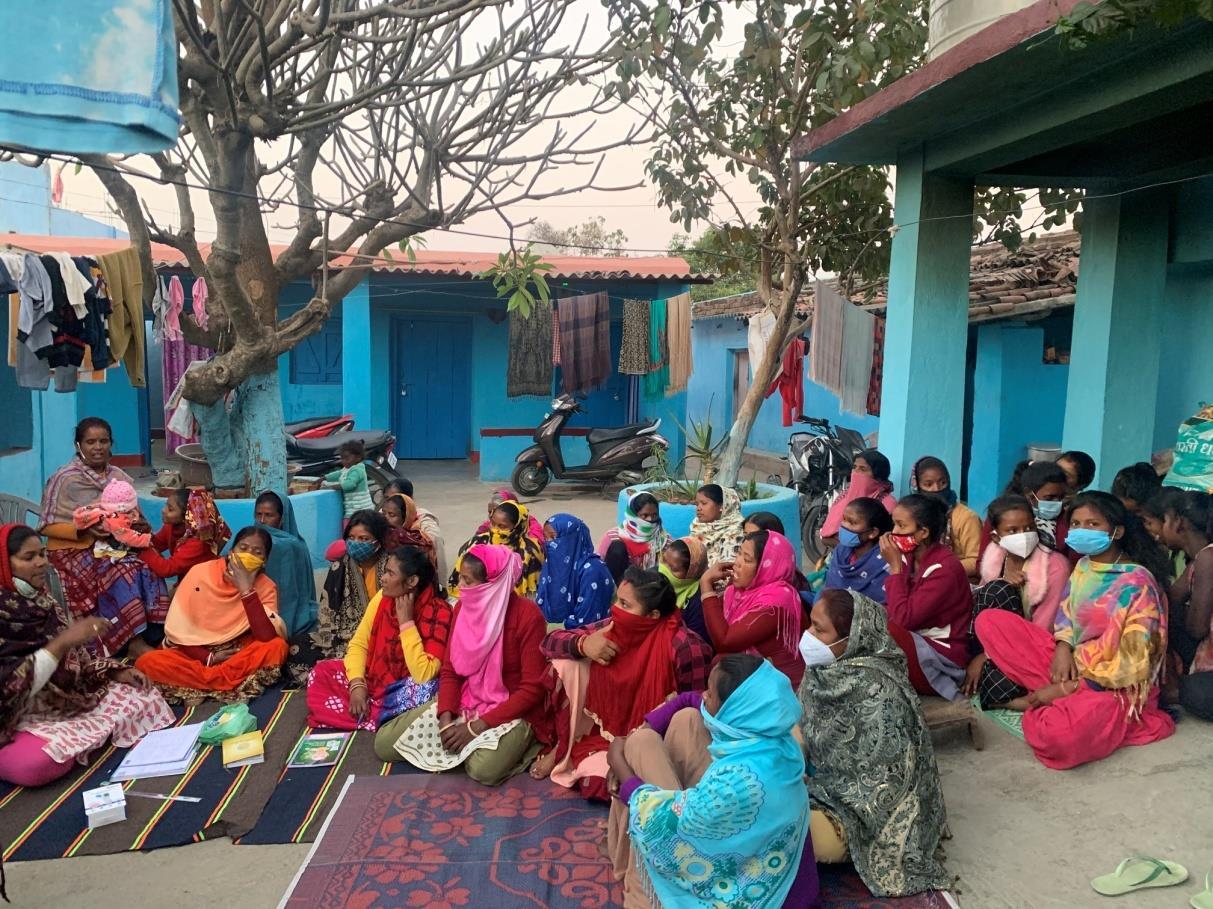
Image source: MHT
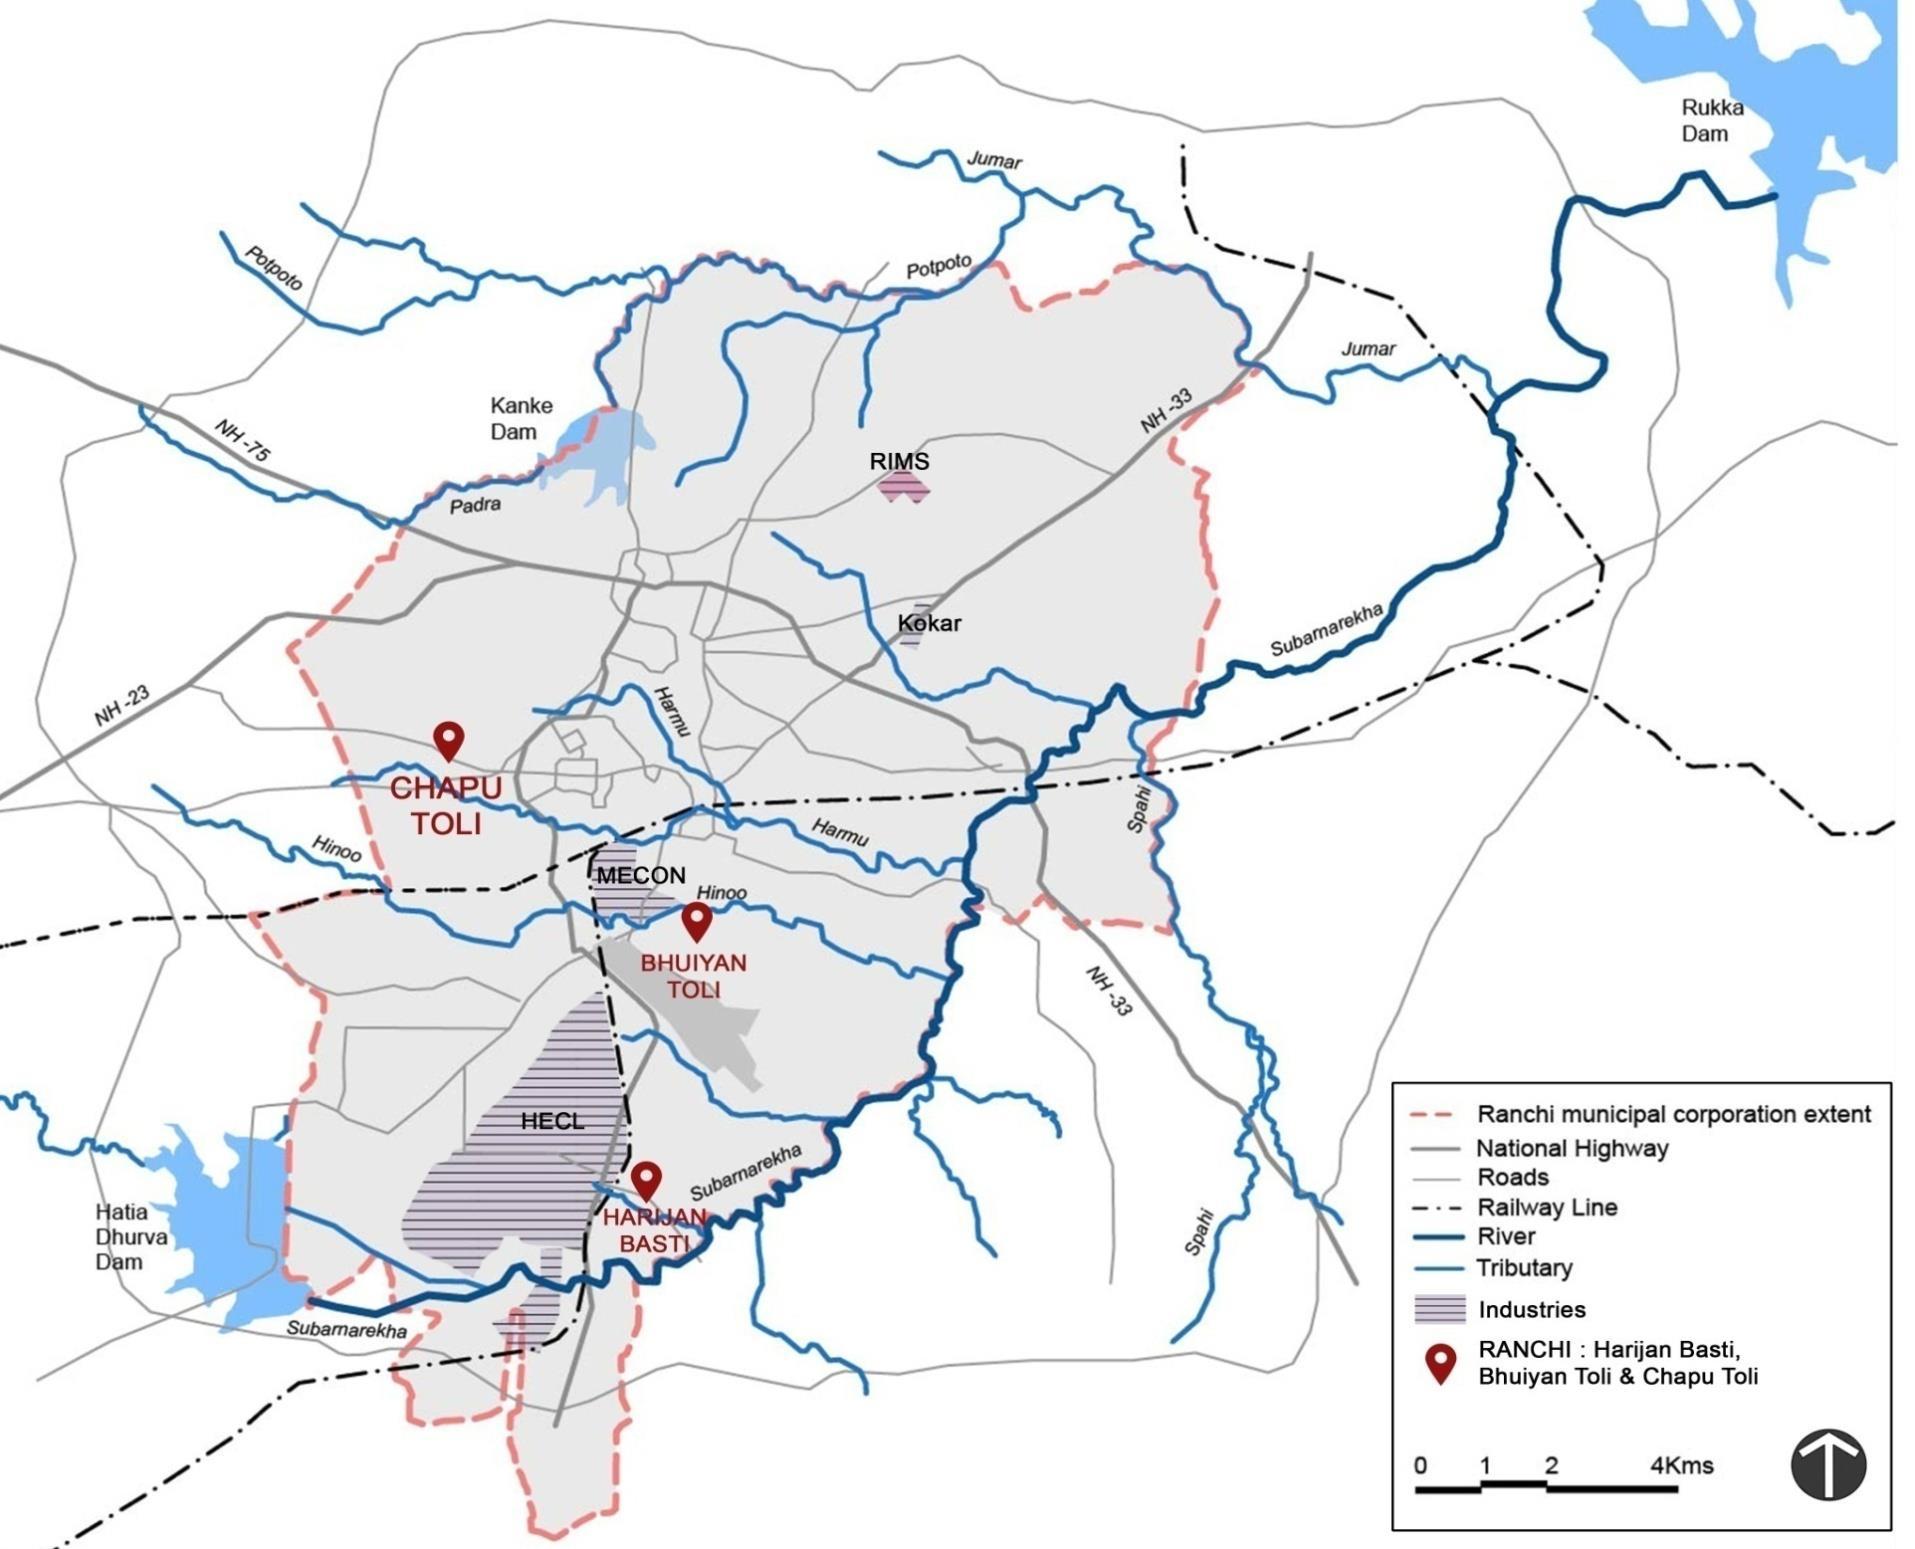
5. CITY PROFILE AND OVERVIEW OF SLUMS
Once a settlement of Munda and Oraon tribes, the city of Ranchi is an emerging industrial metropolis of 1.07 million.While being one of the fastest growing urban areas with anindustrially propelledeconomy the city lacks basic services and stands environmentally compromised. Officially, Ranchi city has 254 slums supporting 30 % of the city’s population. These are largely erstwhile tribal villages that were gradually engulfed by the city, creating city pockets that maintain village-like character. Their classification as ‘slums’exacerbates their vulnerabilities. They are accorded the least priority in formal planning, governance institutions especially with regards to service provision.
Map 1. Map of Ranchi city highlighting three settlements chosen for study.
Vulnerability Assessment & Mapping 5
Vulnerability Assessment & Mapping 6
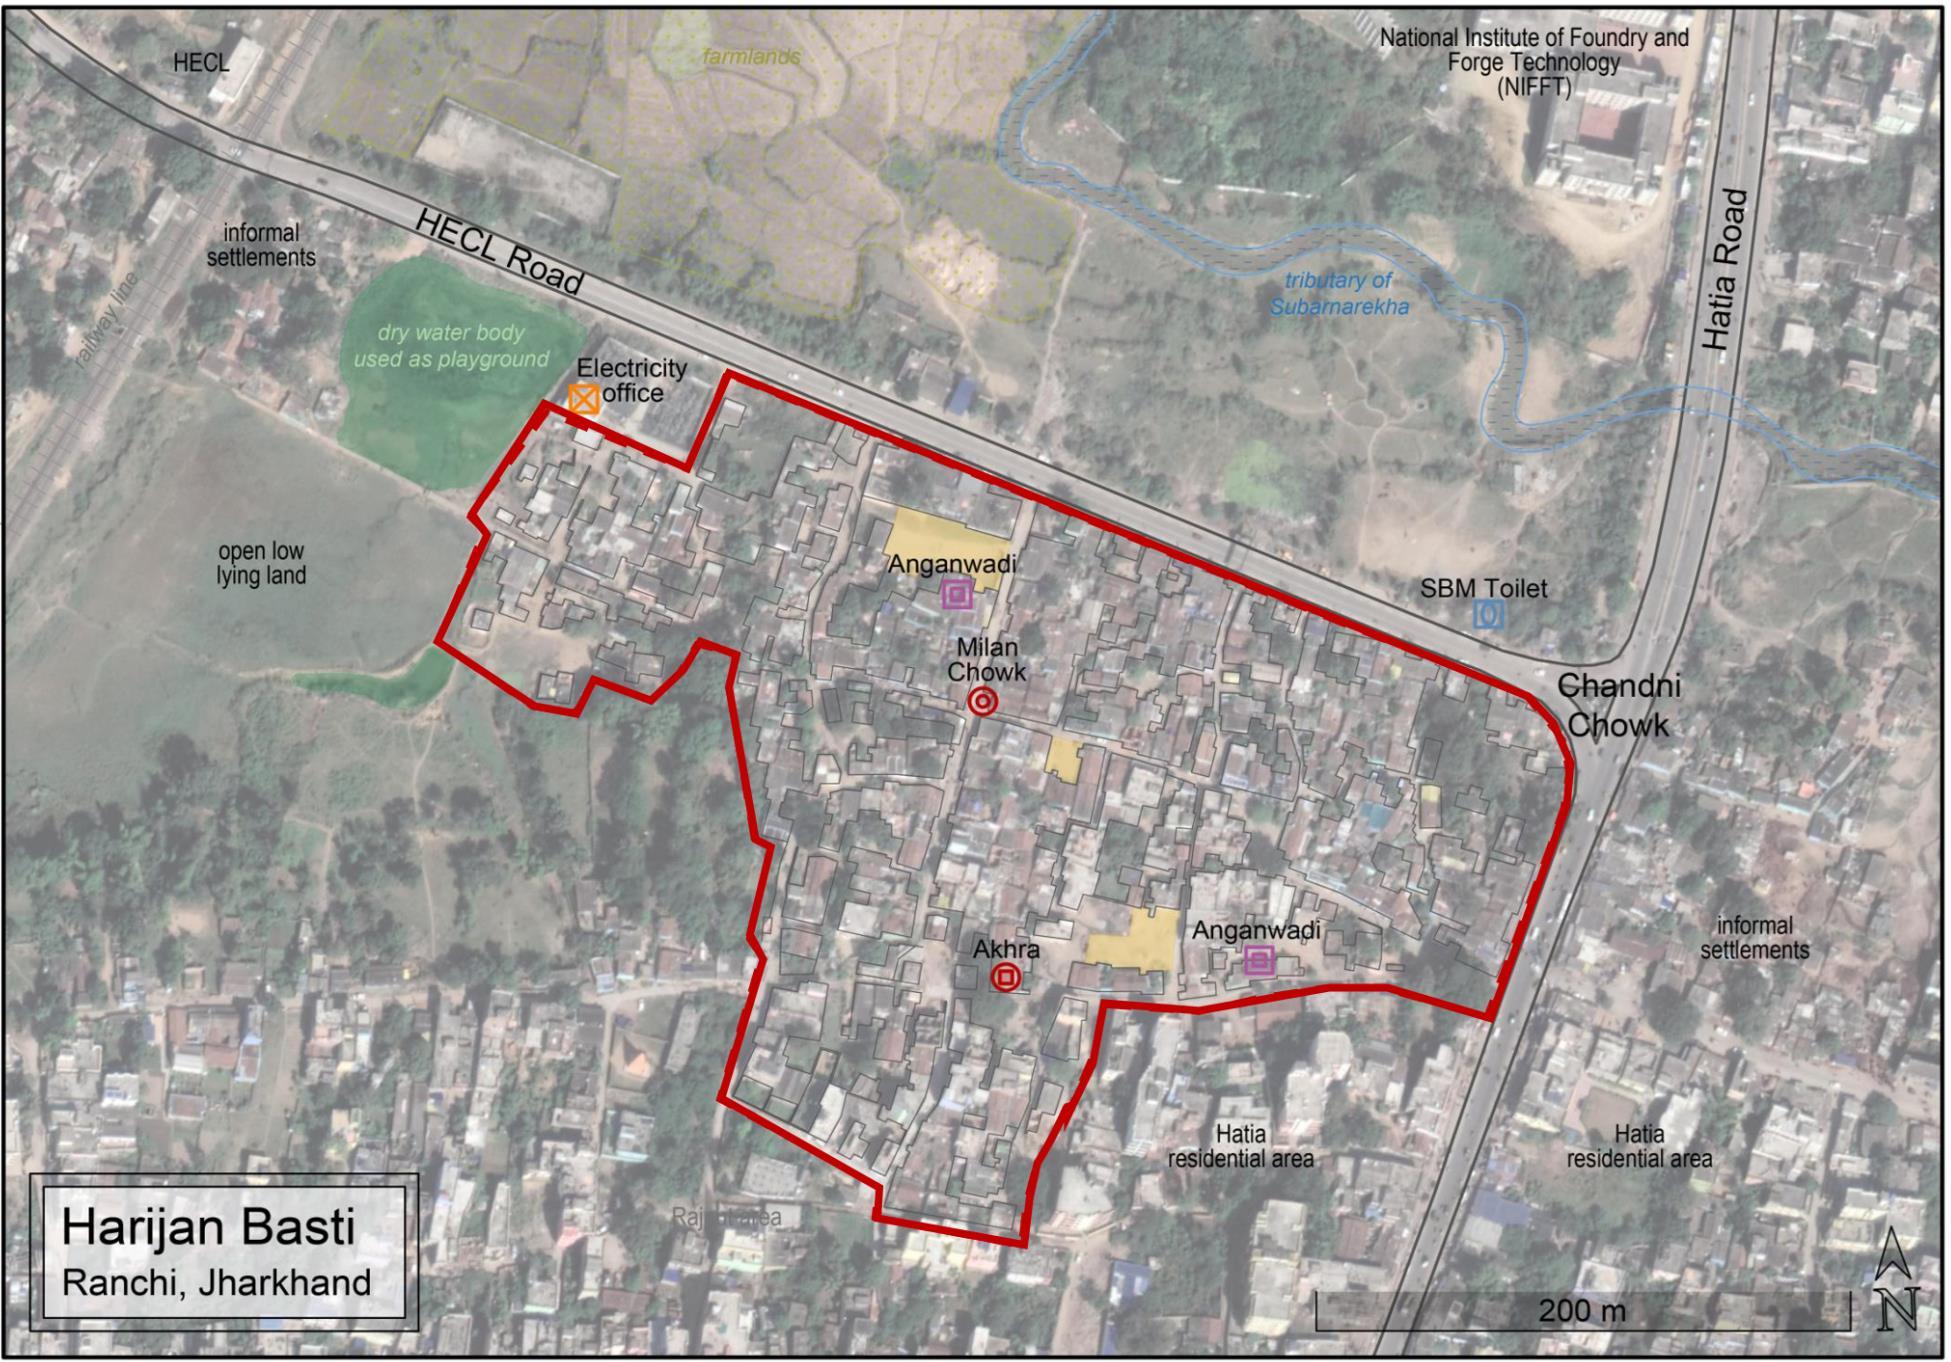
SETTLEMENT 01: HARIJAN BASTI
Image source: MHT
Map 2.
Image source: Google Earth
6. VULNERABILITY ASSESMENT OF HARIJAN
BASTI
The slum Harijan Basti is located in the Ward no. 22 of Ranchi Municipal Corporation and is connected by NH 75, Chandni Chowk Main Road and HEC Road. As per the household listing survey, recently conducted in August 2020, Harijan Basti houses nearly 1400 people, covering an area of about 7.3 hectares. The slum is more than 40 years old and nearly 3 generations of the families have been living here. The settlement has experienced a shift from agricultural to informal sector livelihood owing to the urbanization and industrialization propelled degradation of natural resources and disruption of ecological relationships.
Vulnerability Assessment & Mapping 7
Sattelite Image of Harijan Basti with key landmarks.
6.1. Social Profile
6.1.1. Demographics
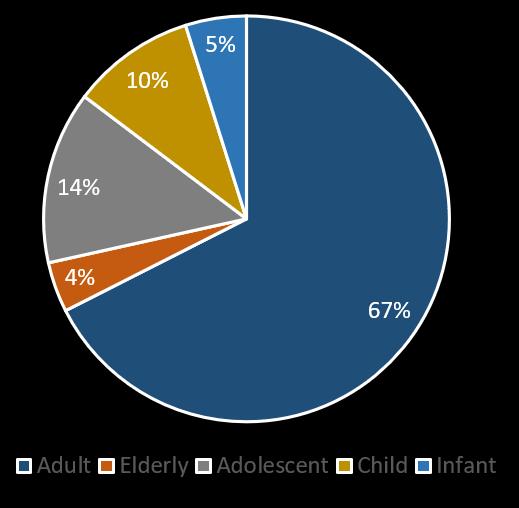
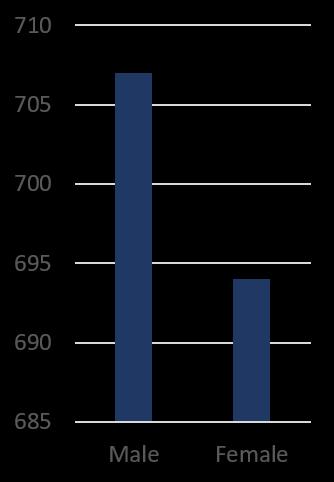
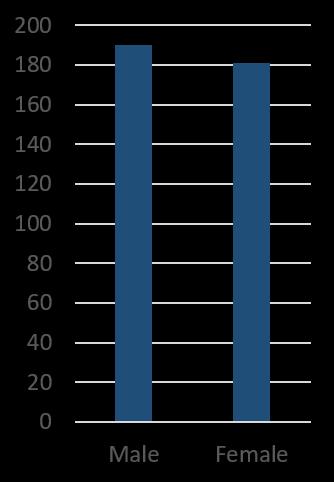
Harijan Basti has a total population of 1401 out of which 707 are males and 694 are females. In terms of age distribution 68% of the population (946 people) fall under the age-group of 18-60 years and 14% of the population (193) are adolescents falling under the age group of 11-17 years.
6.1.2. Livelihood
The general occupations that the residents of Harijan Basti are engaged in are construction work, domestic work, sweeper/solid waste collection worker, helper in factories, street vending. While the SC community reported average monthly income to be 10,000 to 15,000, ST community reported average monthly incomes to be 7000-8000. In 80% of the households, both the males and females work to run the house.
Change in livelihood pattern: There has been a shift from agriculture-based livelihoods to informal sector livelihoods. The residents who were engaged in farming experienced problems with irrigation after the river stream started shrinking and getting polluted by industrial effluents. This decreasedfarming incomesand triggered a switch to service sector. Many of the residents, in the past, were engaged with Heavy Engineering Corporation Ltd (HECL) that was established in Ranchi as one of the biggest integrated engineering complexes in India in 1958. But, according to the respondents, the company closed down many of its departments after it experienced losses which led to people joining the tertiary sector. Currently, only 2 families in the slum are engaged infarming and they use more than 80% of the produce for household consumption.
Impact of Covid-19: The residents couldn’t get work during the lockdown apart from the few who were engaged with government offices or health care institutions. Domestic workers were only allowed to work if they stayed at their workplace. Post the COVID-19 lockdown, as the markets have opened, the residents resumed back their work, however, the amount of work andincomes have reduced for certain occupations like domestic work and construction work. The no. of houses that a domestic worker used to work in has reduced. The prices of commodities/groceries and transportation costs have also increased post COVID-19. None of the residents have changed the occupations post COVID19 considering the limited skills that they possess.
Vulnerability Assessment & Mapping 8
1: Gender Composition Graphic 2: Age Distribution
Graphic

Vulnerability Assessment & Mapping 9
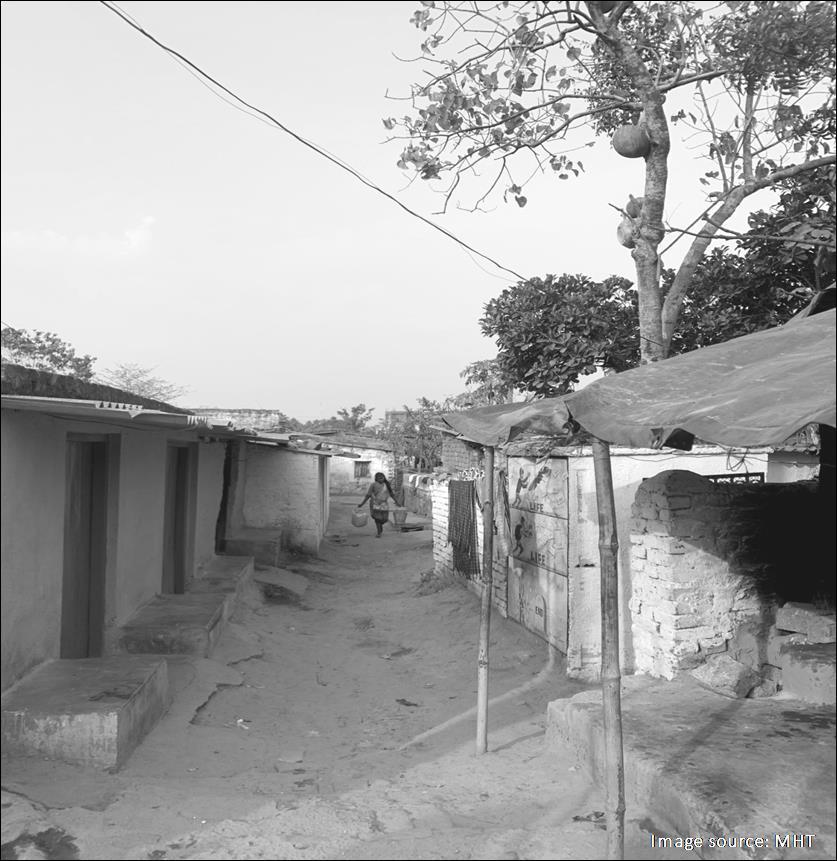
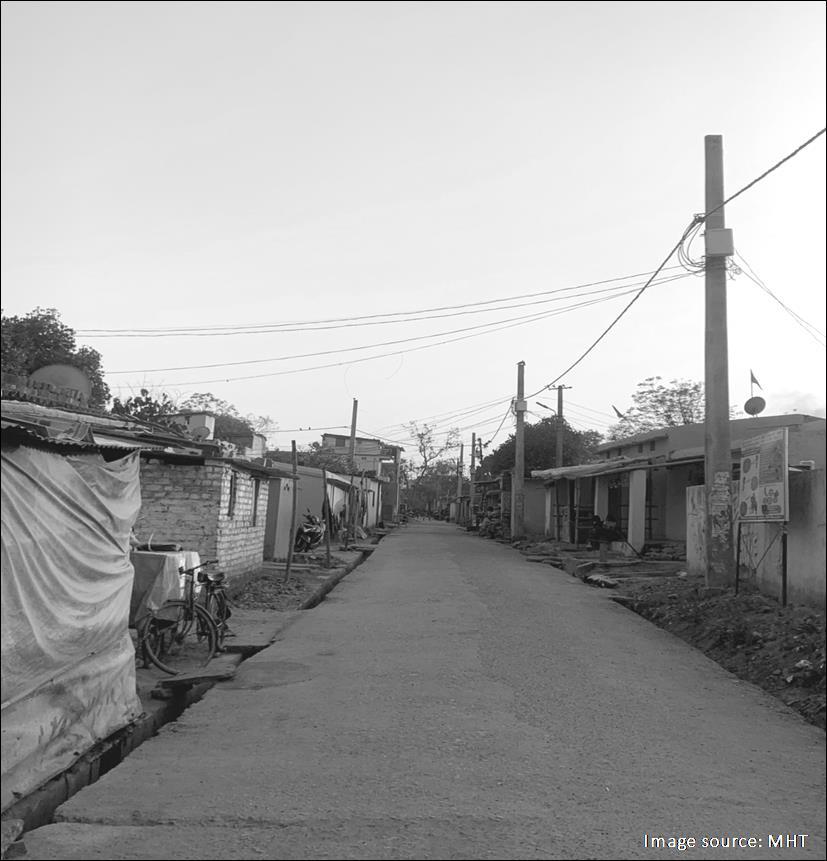
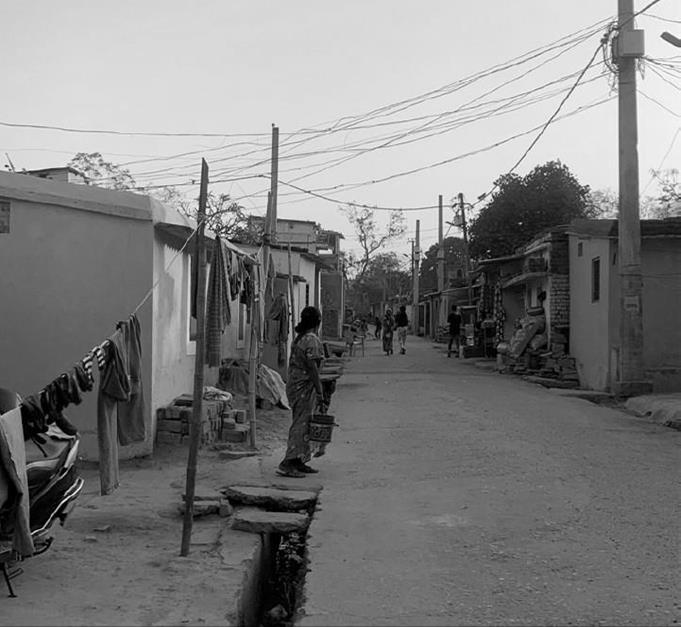
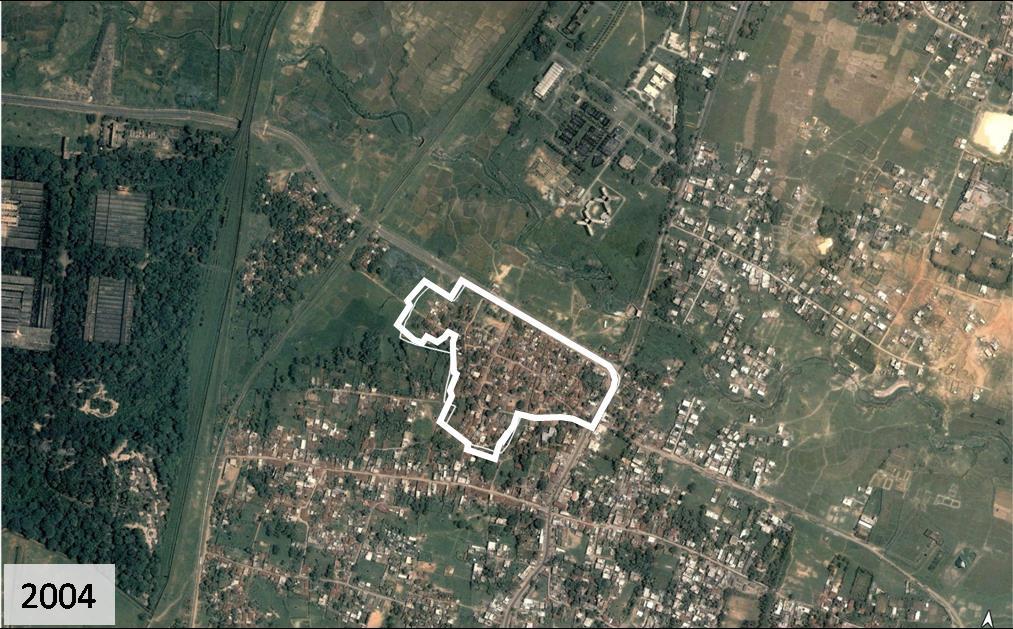
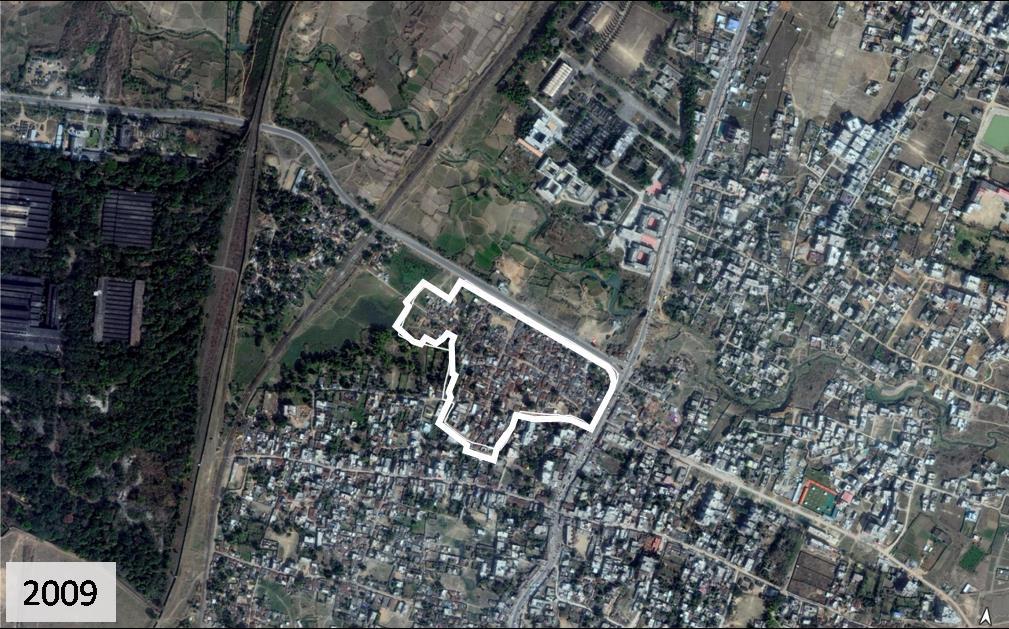
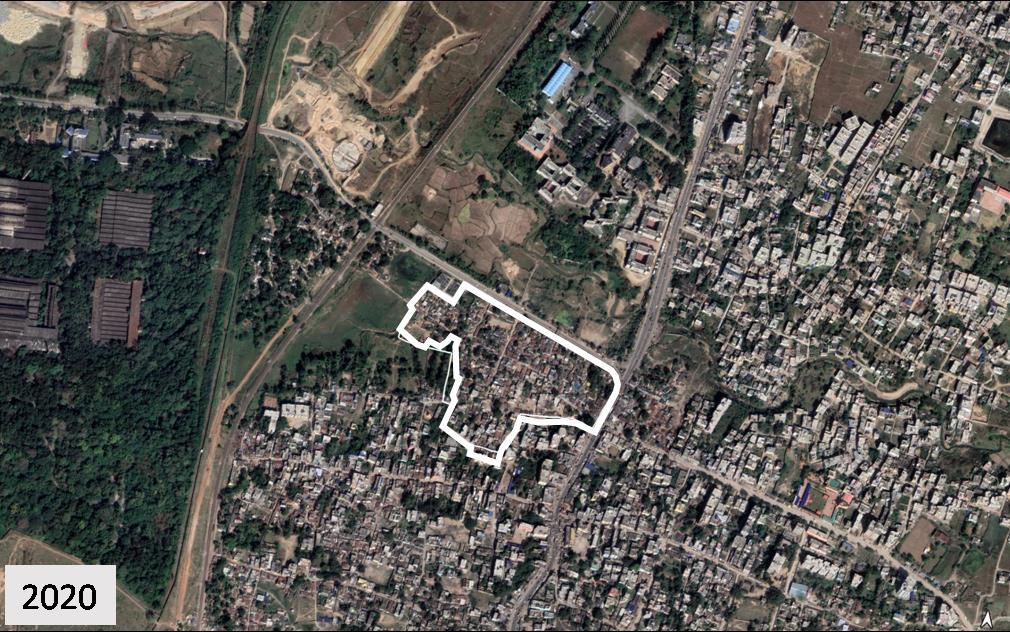
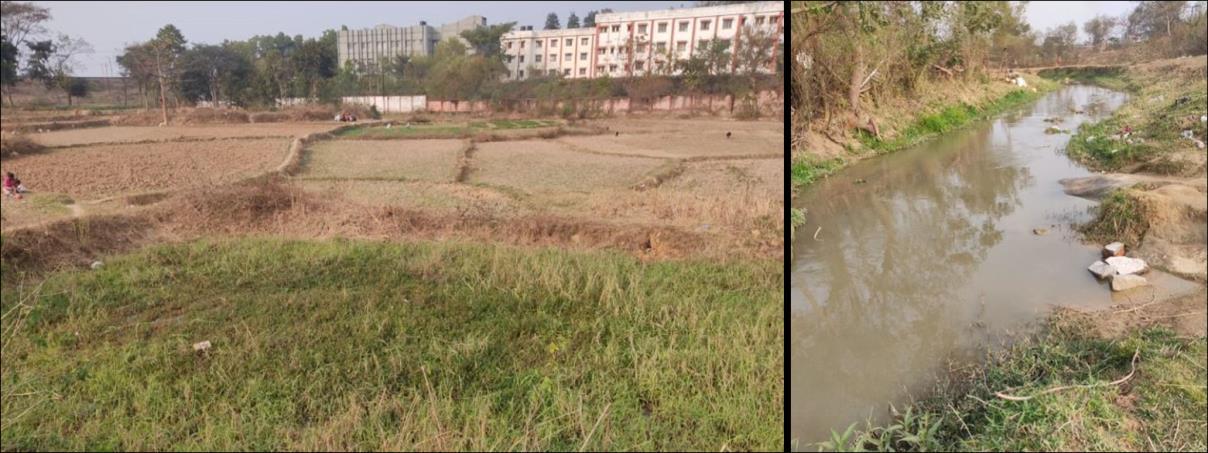
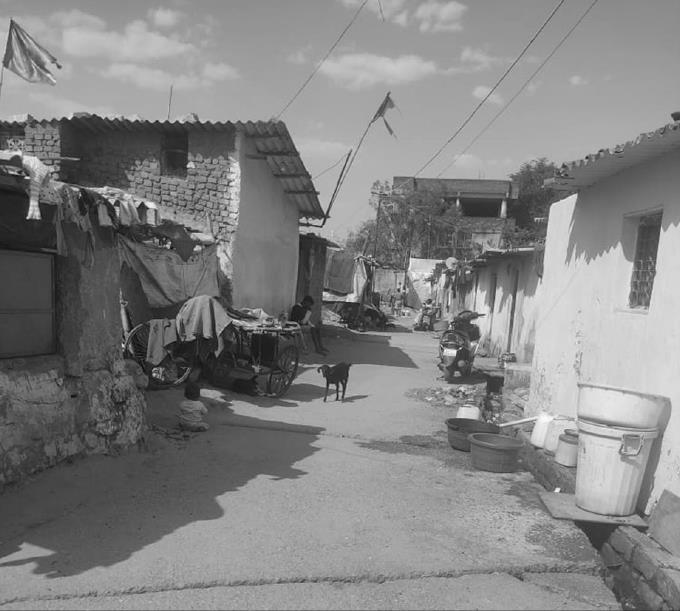
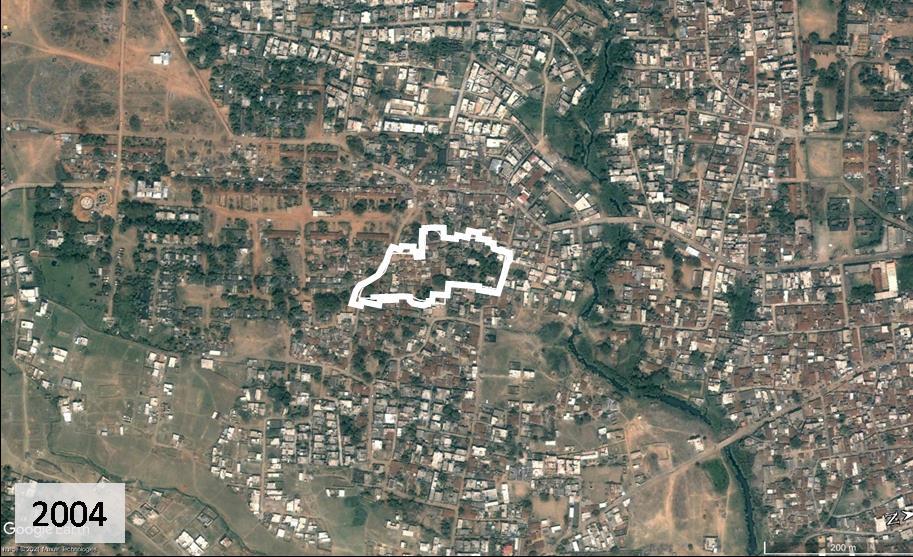
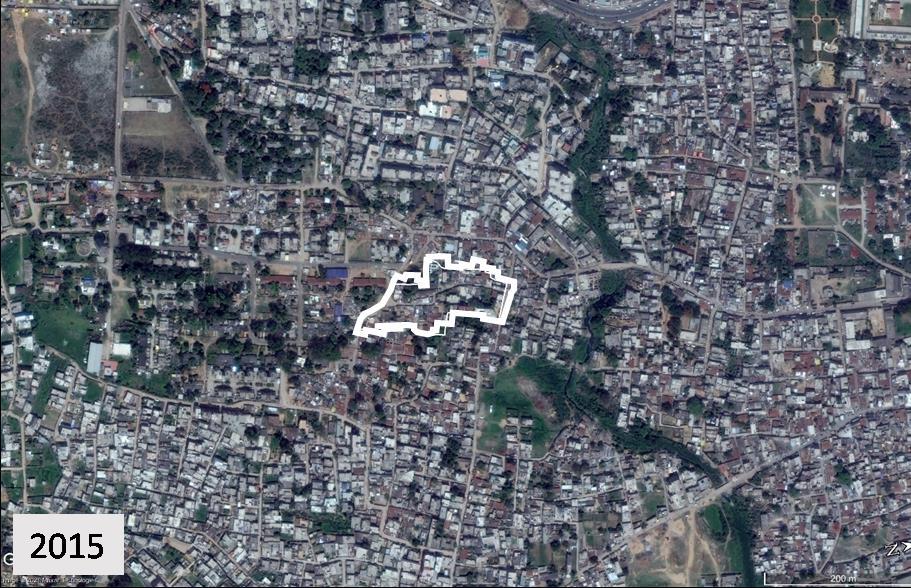
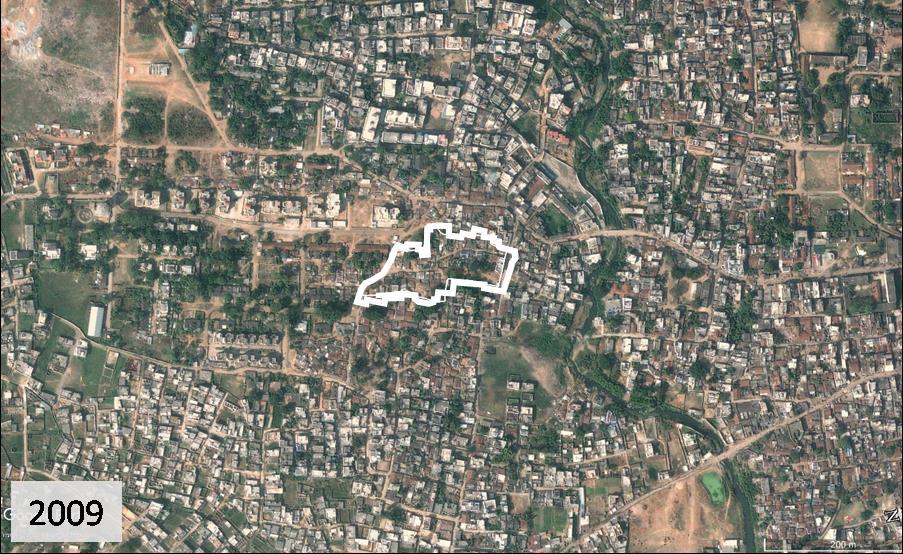
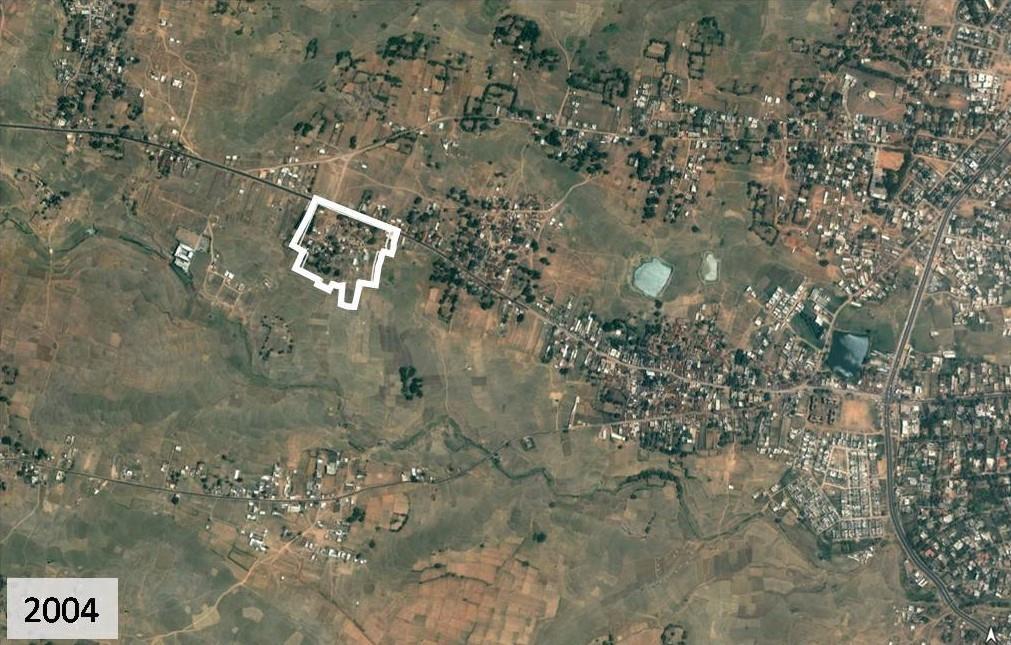
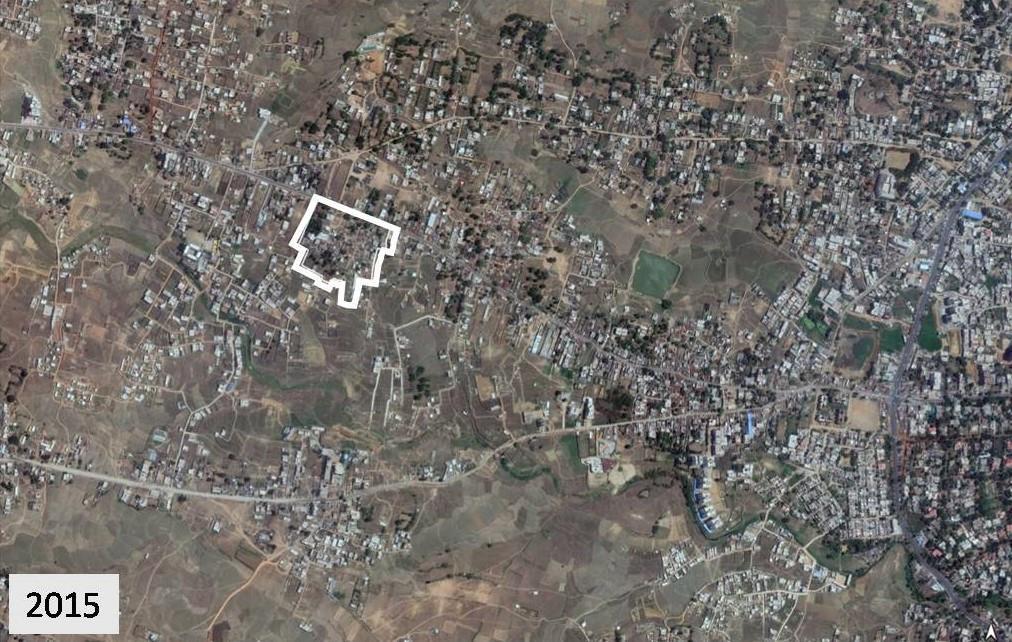
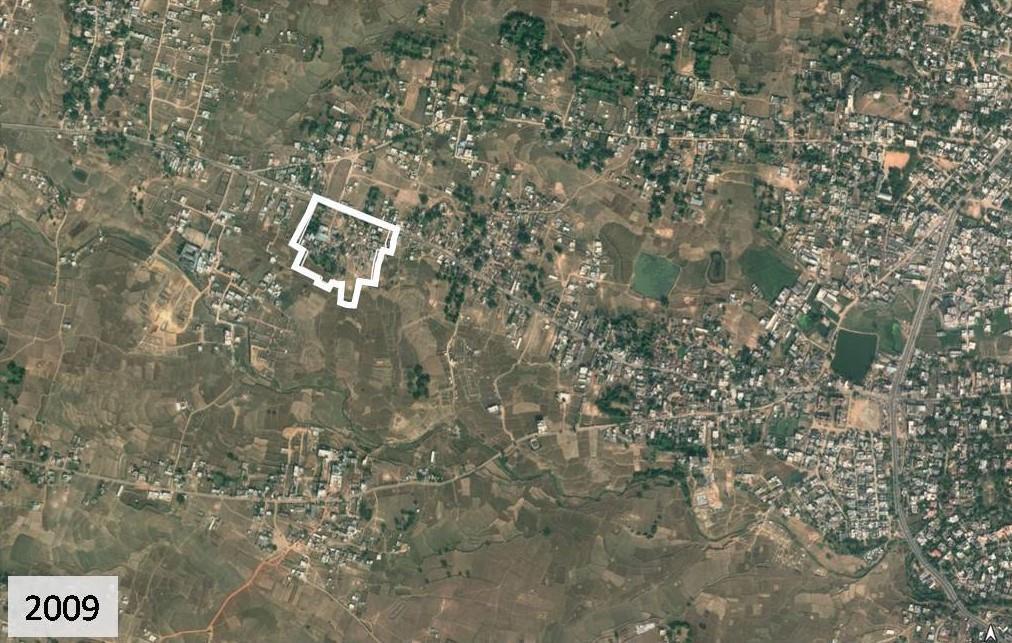
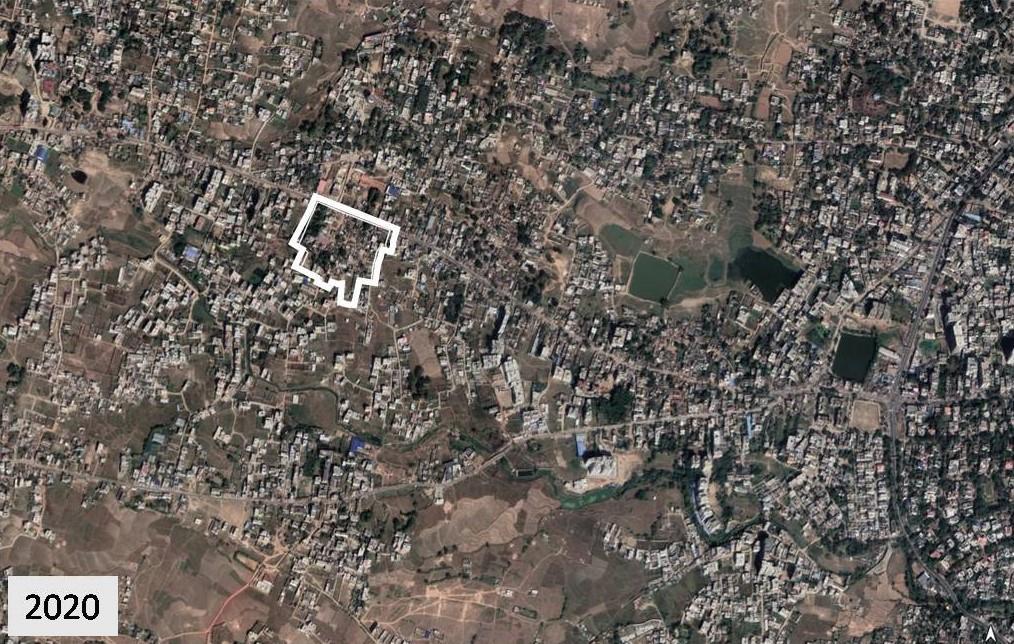
6.1.3. Change Over Years
As is visible in the pictures, the region has undergone exponential urban growth especially in the last decade. Agricultural lands have been converted to residential, commercial and institutional. The emergence of dense built fabric in the region has affected natural drainage patterns that feed into the tributary of Subarnarekha. The settlement fabric stands in sharp contrast to the high-rise, low density fabric of the surrounding areas.
6.1.4. Caste and Ownership
From the 252 households who live there, 51.59% households belong to Scheduled Tribes (ST) namely Sarna, Urav and Lohra, 35.32% households belong to Scheduled Castes (SC) namely Harijans, Nayak and Ghasi.
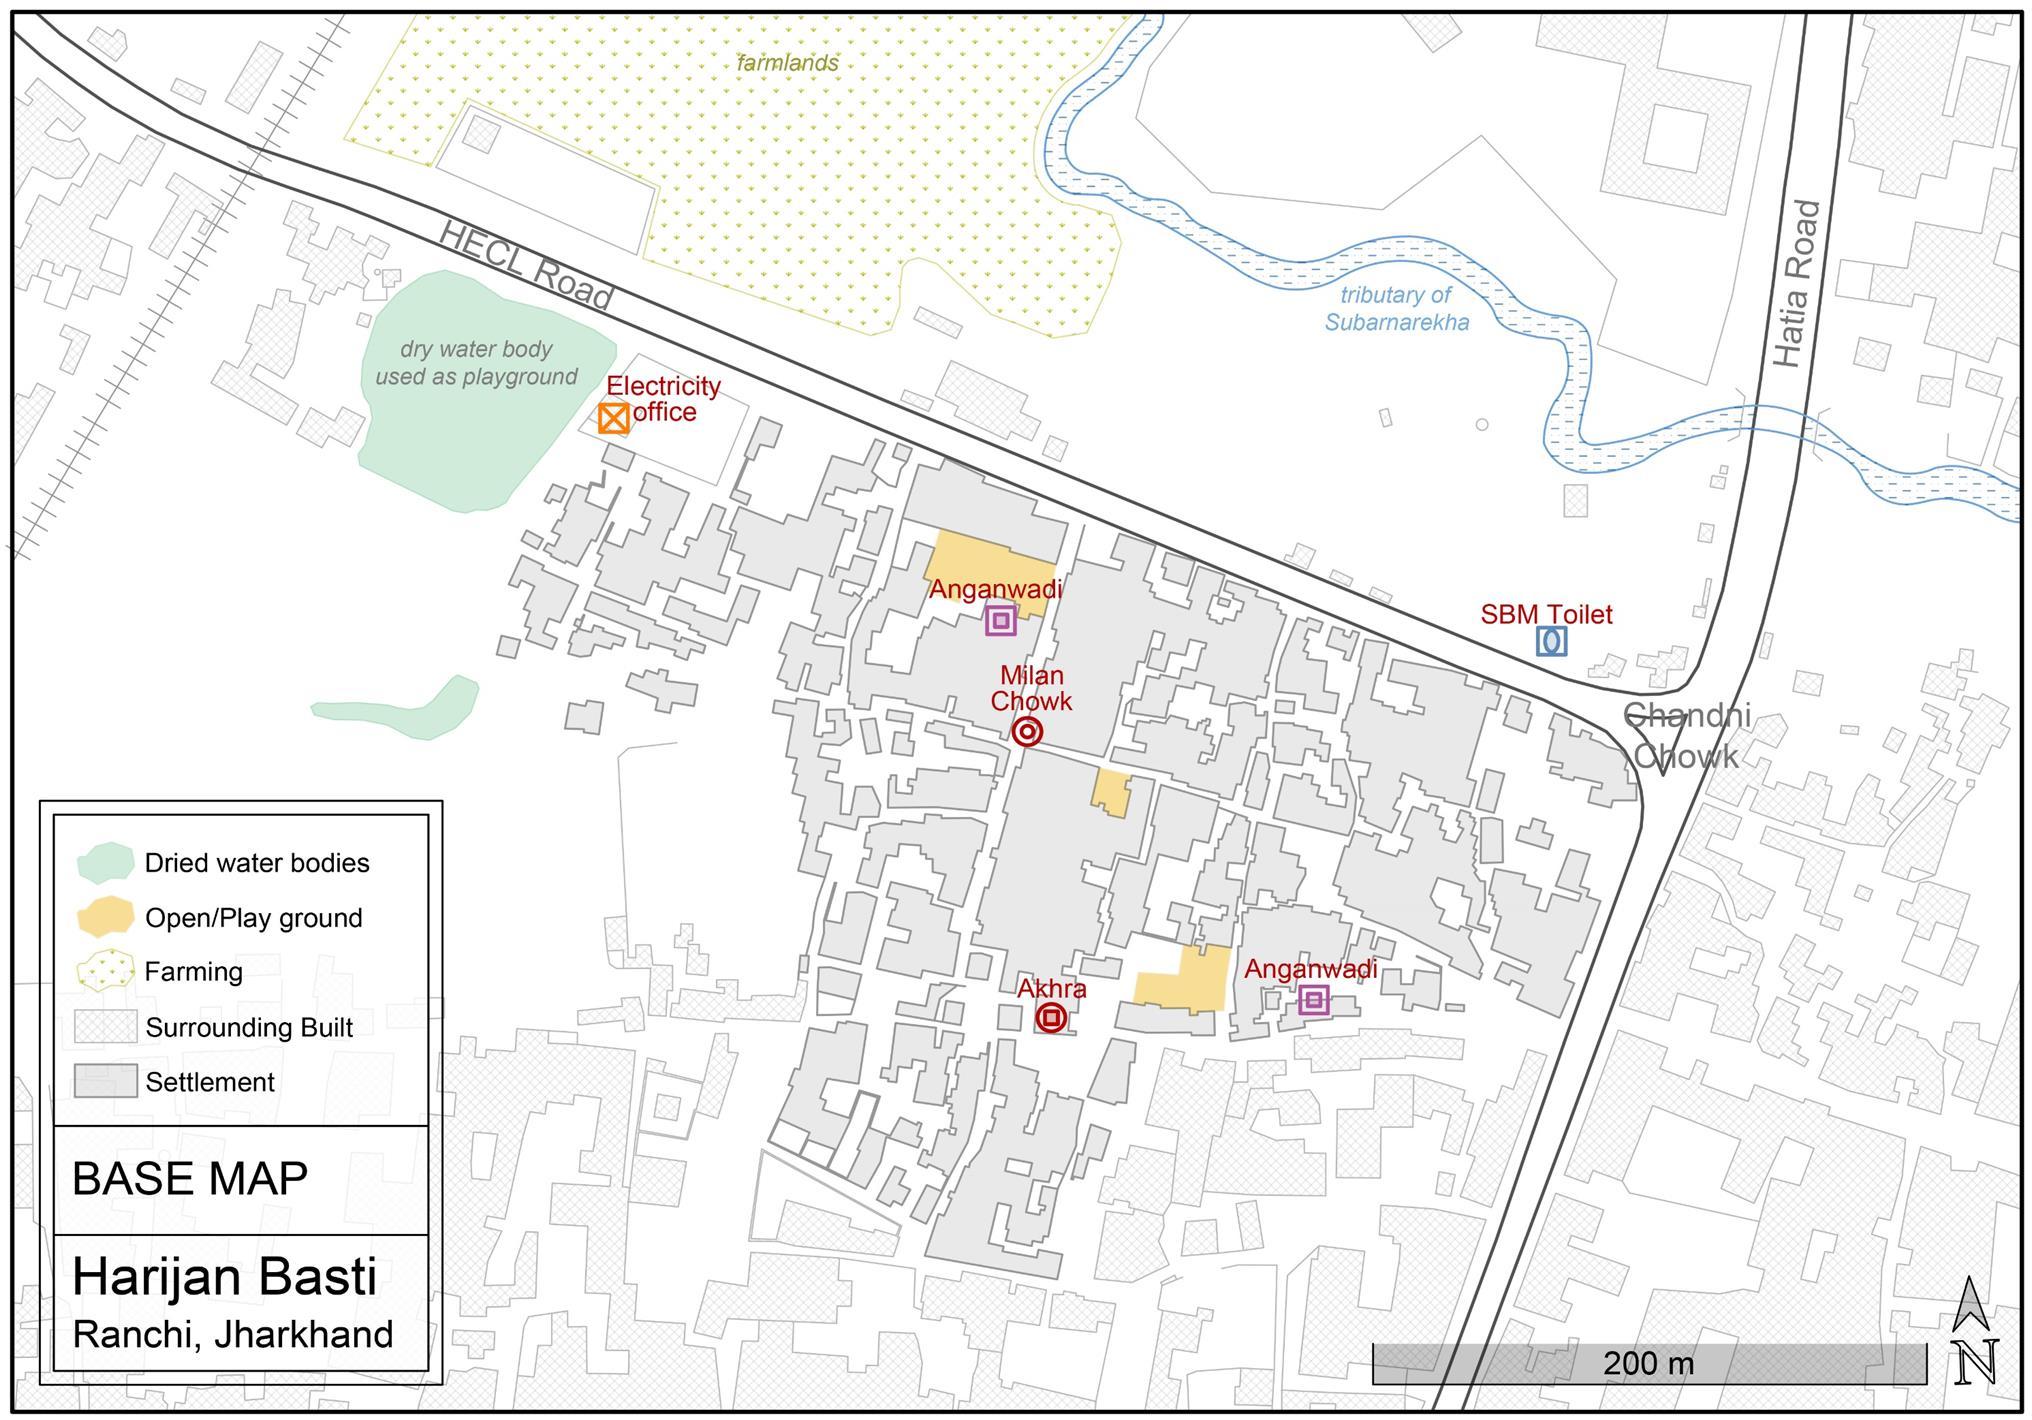
Map 3. Base Map for futher analysis
Satellite image source: Google Earth
Vulnerability Assessment & Mapping 10
Map 4. Caste Distribution
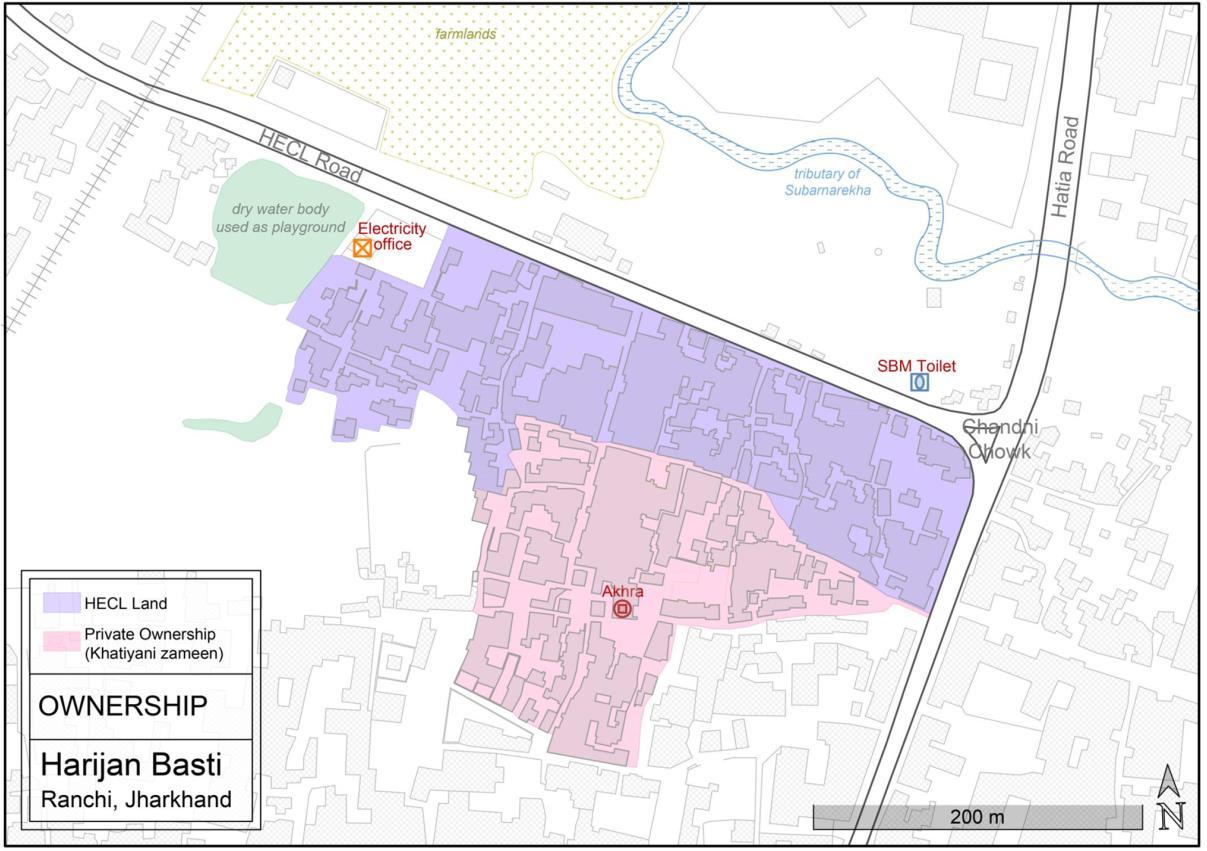
The rest households either belong to OBCs/General. As per the FGDs, approximately 60% of the slum area lies on private land (referred to as Khatiyanizameen by the local residents) owned by the residents, while 40% of the land is owned by Heavy Engineering Corporation Ltd. Approximately 75-80 houses are situated on this land. Though there is a possibility of eviction, the residents have a sense of ownership as they have been residing here for more than 30-40 years now. All the houses pay Holding Tax to Ranchi Municipal Corporation (RMC) because of which they are entitled to receive basic services and amenities.
6.1.5. Social Capital and Governance
There is a Community Based Organization (CBO) which comprises of all the adult -members of the slum and a Community Action Group (CAG) which consists of 11
Map 5. Ownership

women, 1 woman from poorest of poor family and 3 adolescent girls. There is lack of social unity in the settlement with most people working towards personal gains. However, in case of difficult situations or emergencies, people come together and collectively try to resolve the issue.
6.2. Physical Infrastructure
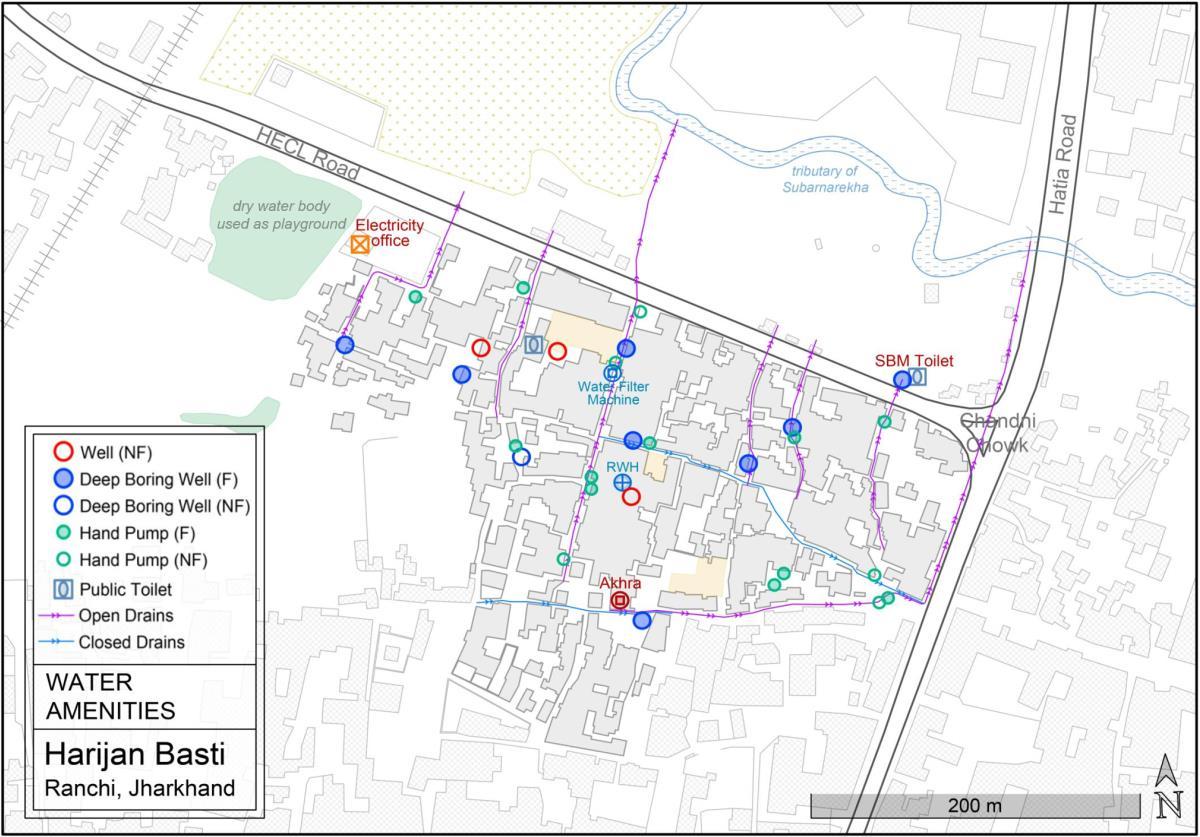
6.2.1. Water Supply and Drainage
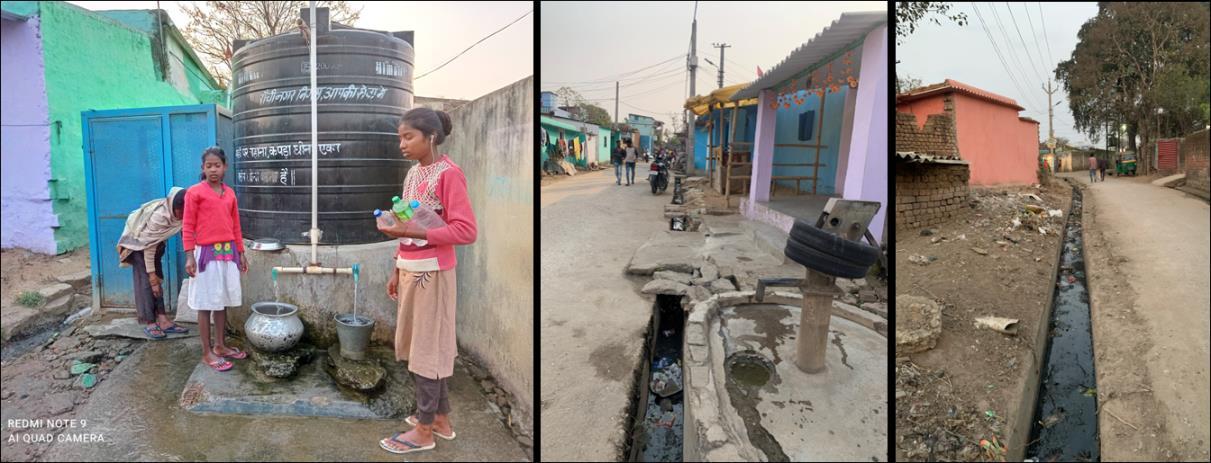
The slum dwellers rely on hand pumps and deep boring wells for water supply. The residents spend 25-30 minutes in a day in collecting water for drinking and
Vulnerability Assessment & Mapping 11
household purposes. Water quality is compromised as the hand pumps are slight red in colour due to rusting, thus making water it unfit for drinking purpose.
in contacting the Nagar Nigam officials and other service providers for getting the issues of basic services or government schemes resolved.
Map 6. Water amenities
Though RMC has laid down a water pipeline in the main street of the slum it is not functional as individual household connections have not been given. The slum does not have closed sewerage network, and has only open drains which are not connected to the city’s network. Residents face a lot of issues due to overflowing and waste accumulation in drains.
6.2.2. Public Amenities
The Ranchi Nagar Nigam has made provisions for deep boring wells, anganwadis, street lights and public and individual toilets. However, the residents face issues
Map 7. Public amenities
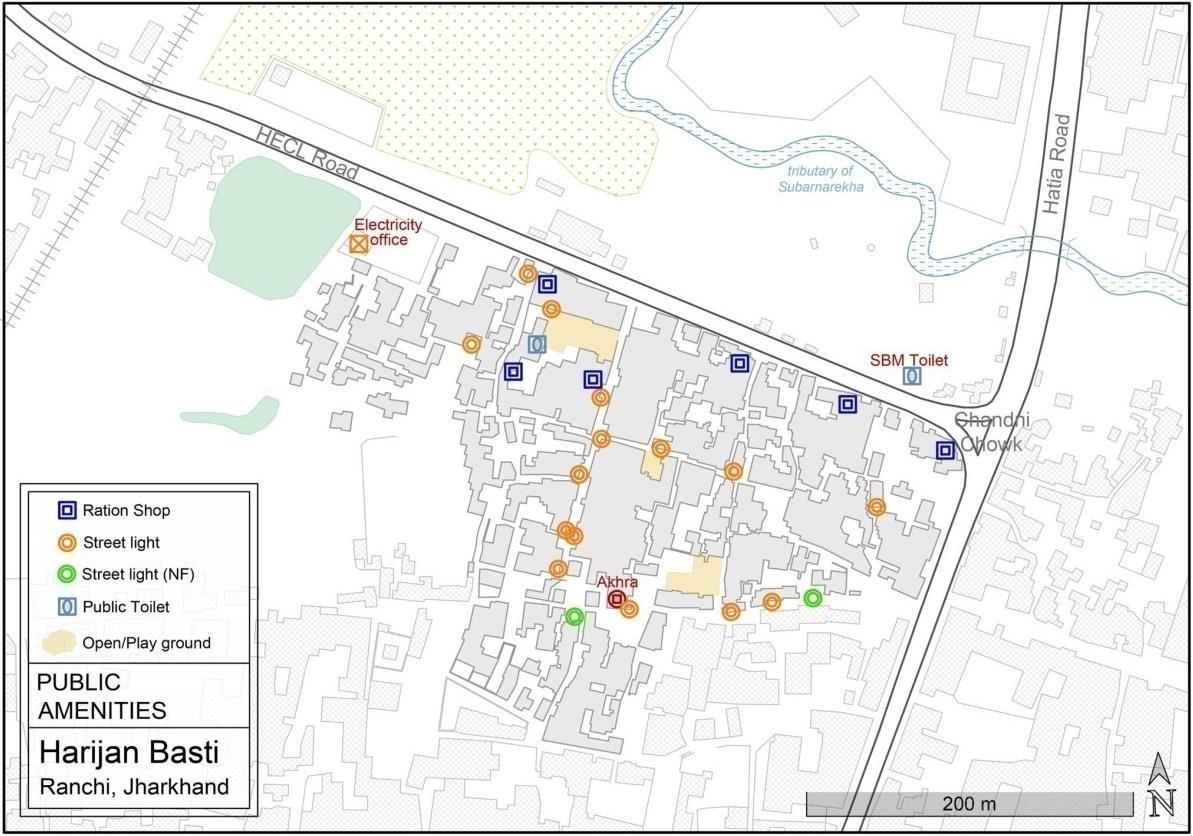
Presently, street lights are only present on the main streets of the settlement. The street lights in the slum are inadequate in number and people who reside in internal areas face mobility issues during night time. Lack of street lights exposes people to vulnerabilities related to safety.
As per the household level survey, 84% households have individual toilets while 16% households do not have an individual HH-level toilet. There is one community toilet inside the slum maintained by RMC and used by the residents. There is one public toilet outside the slum also, on the opposite side of the HEC Road, which is used mostly by the houses and shops adjacent to the road.
Vulnerability
& Mapping
Assessment
12
Climate Change Induced Vulnerabilities
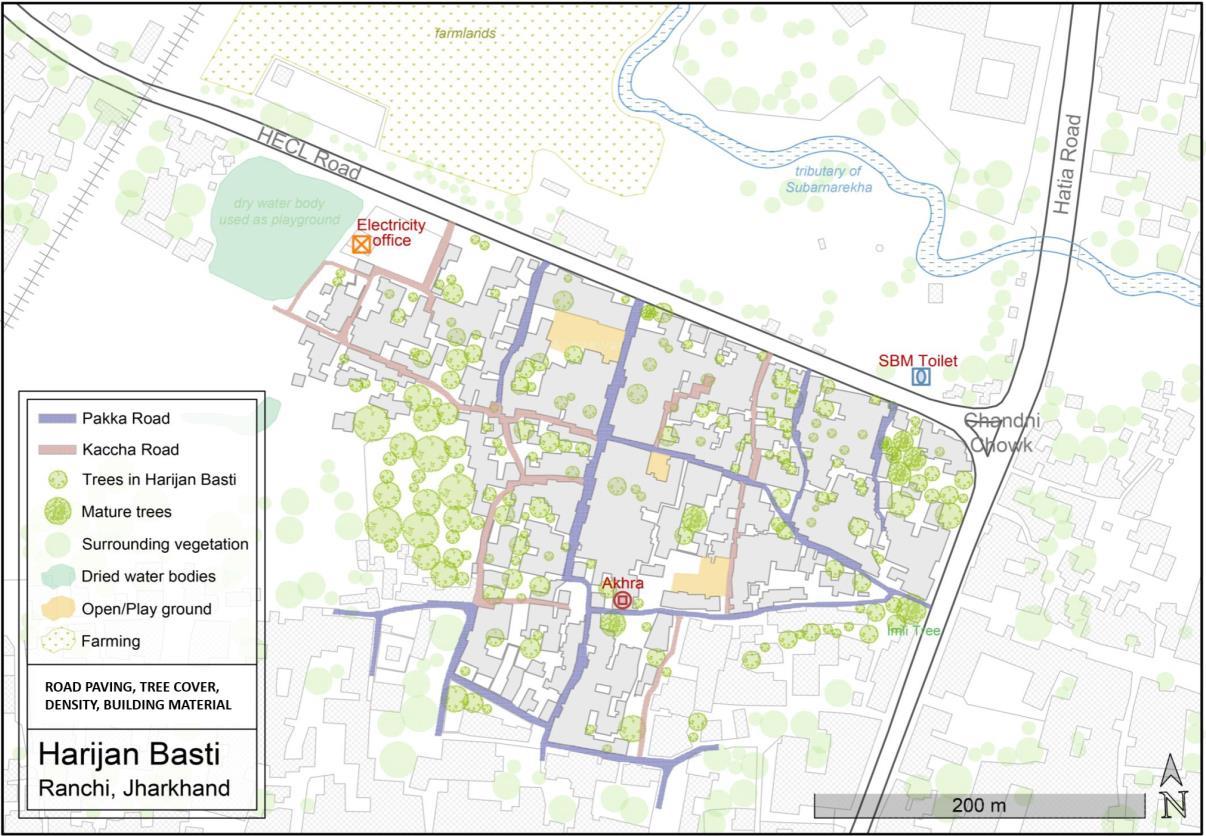
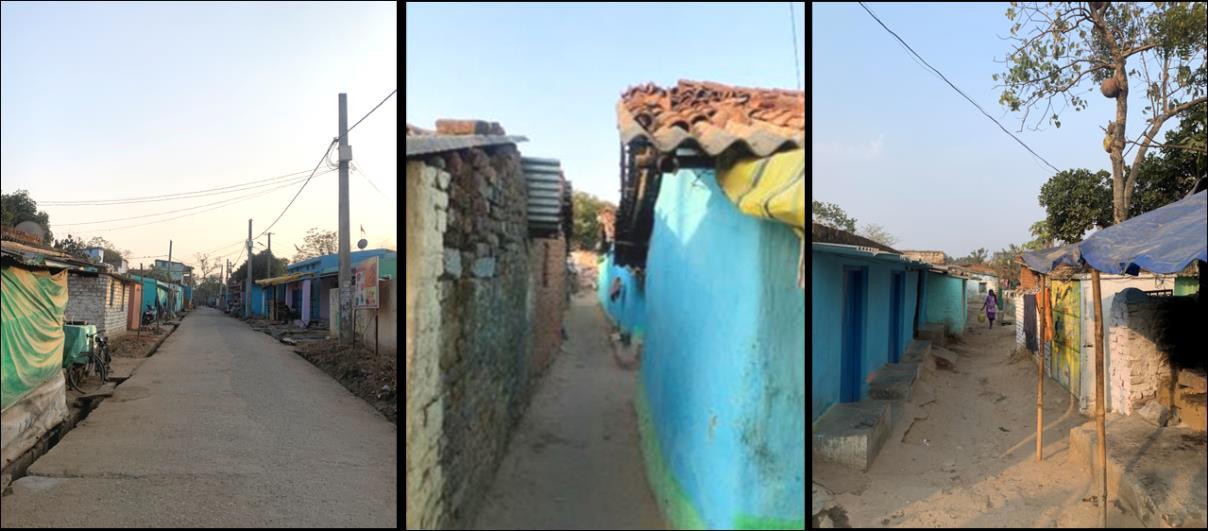
Map 8. Road Typlogy & Tree Cover
6.3.1. Heat Stress Vulnerability
Spatial Factors Overlaid for assessing Heat Stress 1. Highway, Pakka/Katcha Roads 2. Tree Cover
EXPOSURE: Heat Stress was higher earlier due roofing type (tin sheet), and low height and lack of ventilation in houses. There was also a predominant use of chulha for cooking. It was reported as lesser now due to the availability of
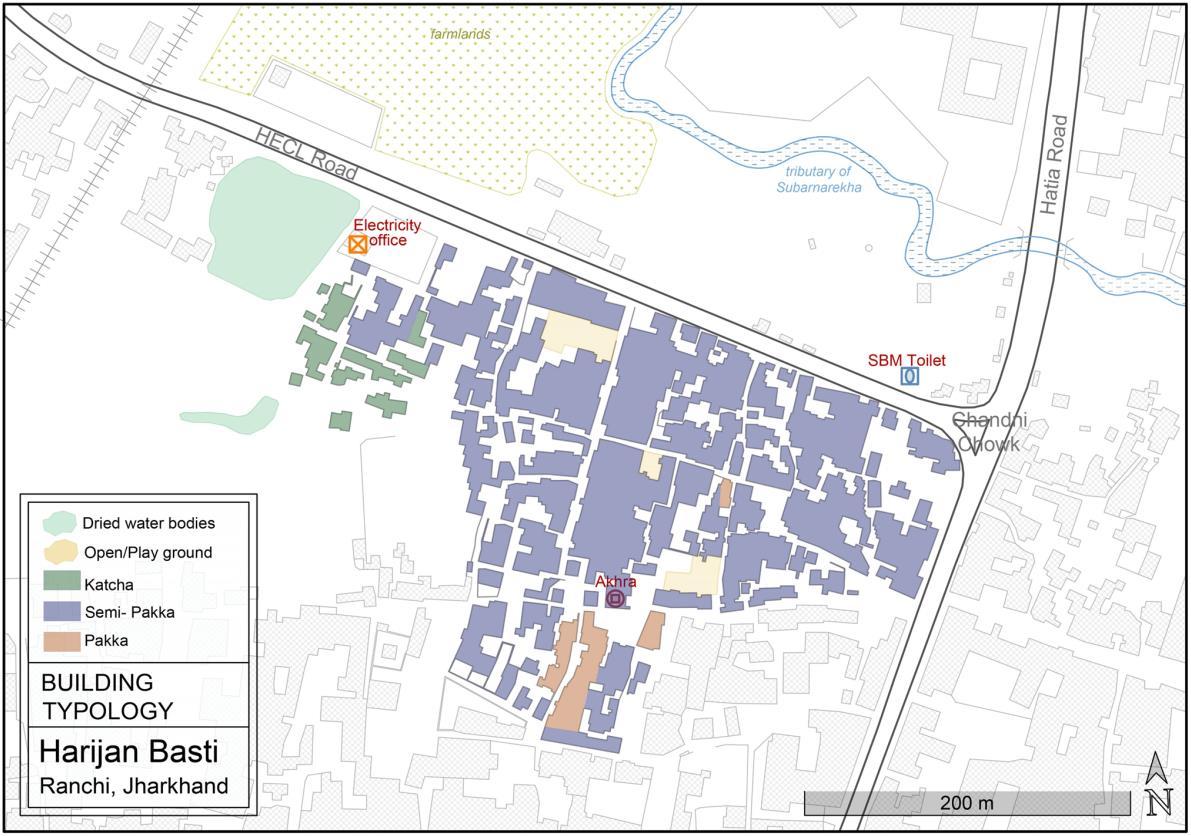
Map 9. Building Typology
electricity and use of fans and coolers.
SENSITIVITY: During summer the temperature goes as high as 42-47 degree Celsius. Livelihoods such as street vending, construction work, domestic work most affected by the high temperatures.
ADAPTIVE CAPACITY: To counteract the impact of heat radiating asbestos sheet, residents use a material called kapra(made of mitti/mud) on top of asbestos sheets. Invertors are used during power cuts. Further people have a practice of sitting in verandahs,otlas,pindhas adjoining the house during power cuts.
Vulnerability Assessment & Mapping 13
6.3.
3. Ground cover 4. Built Density
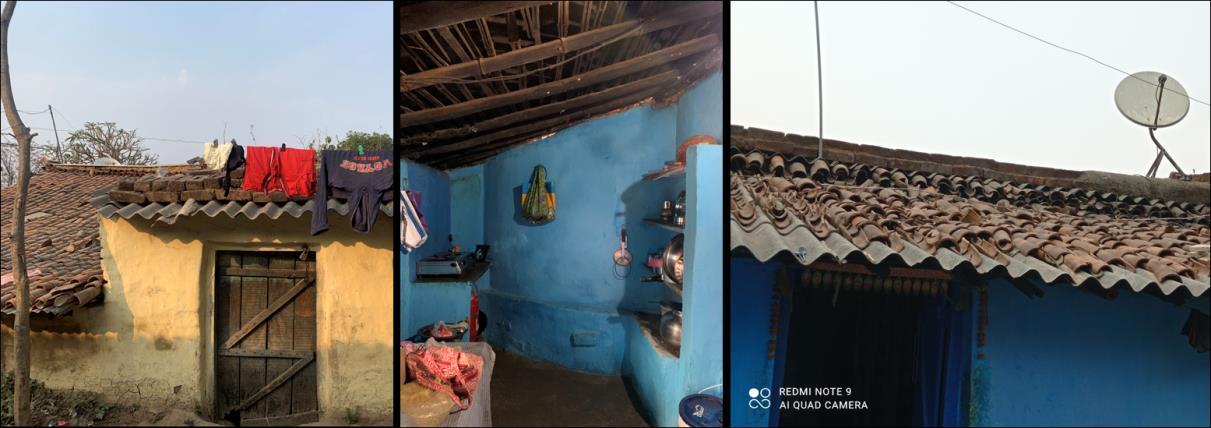
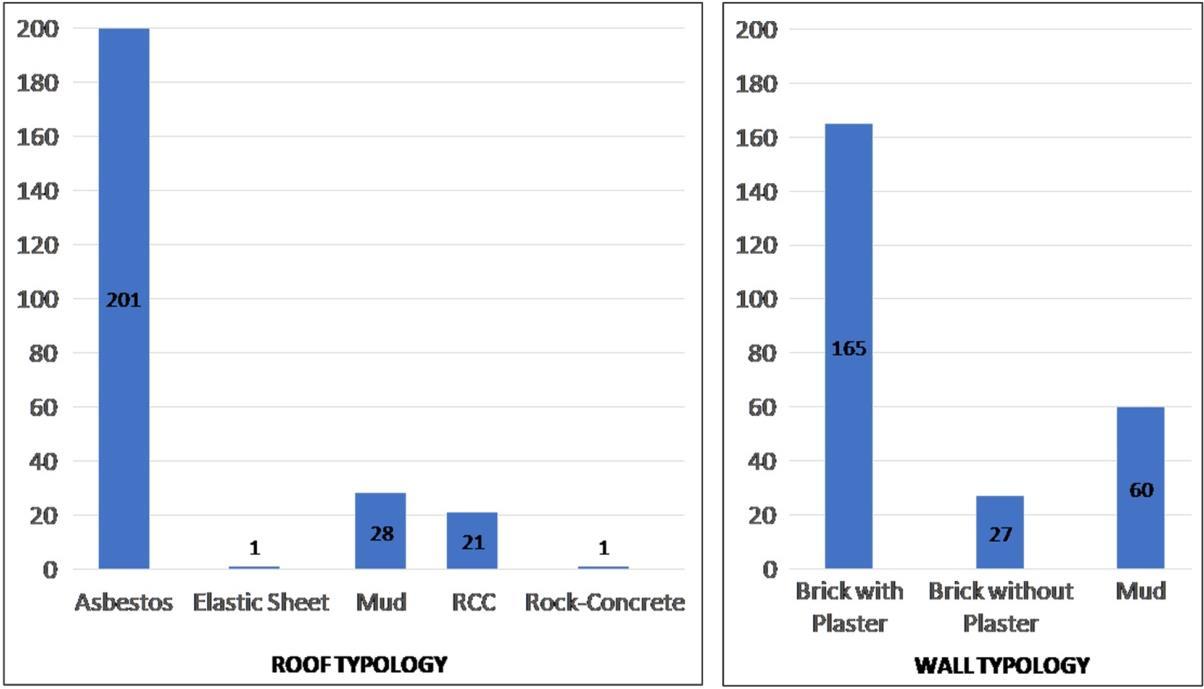
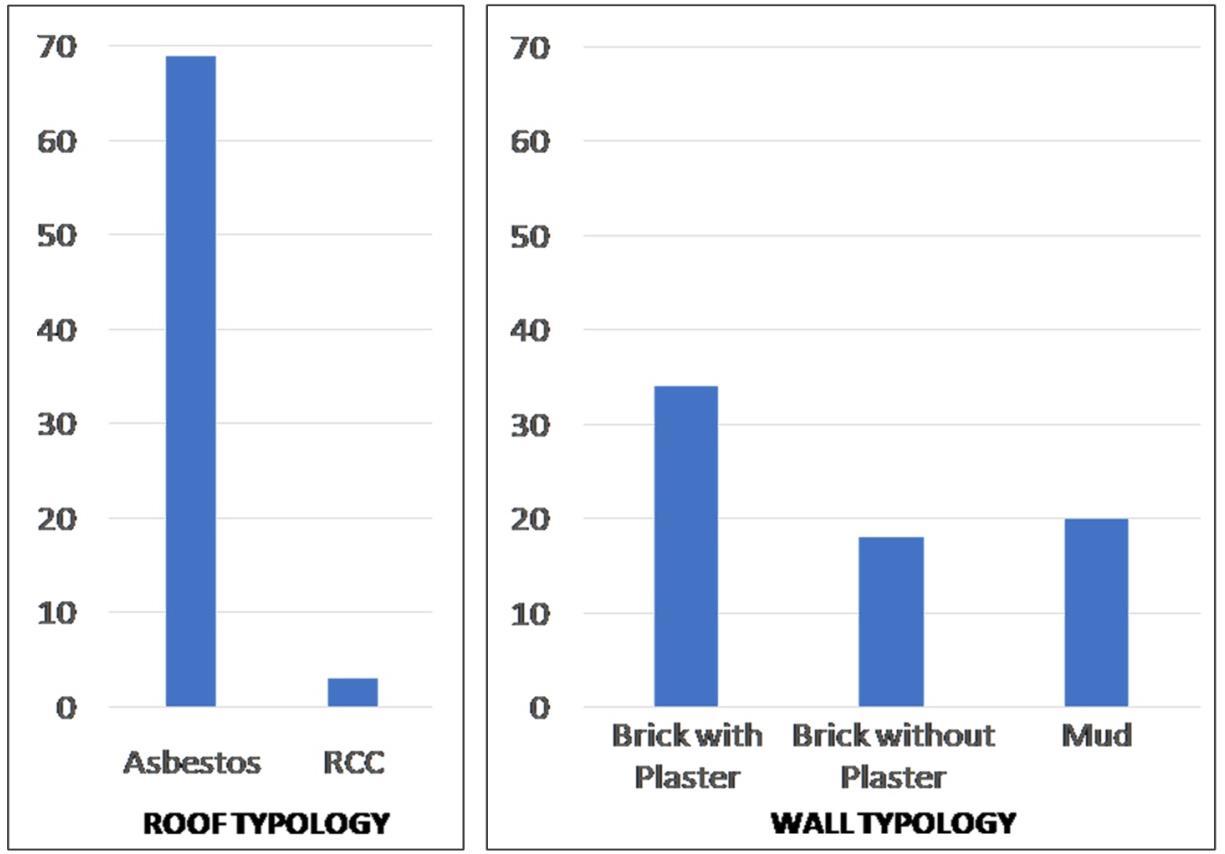
Presently, majority of the families in the slum (91%) have houses which are semipukka in nature with roof made of asbestos sheet. Close to 80% of the houseshave asbestos as roofing material, while only 8.3% houses have RCC/Concrete roofs. 65% of the households have walls made of brick with plaster. Bricks as well as asbestos have high heat retention capacity which disturbs the thermal comfort in the houses. The tree cover in the slum is also low, except for the west side of the slum which has bamboo trees
Vulnerability Assessment & Mapping 14
Image: Roof& Wall Typology Source: MHT
Image: Water amenities and Drainage Source: MHT
Image: Agriculture fields and tributary on the northern side Source: MHT
HIGH VULNERABILITY ZONE: Along large paved reflecting surfaces, such as the adjoining highways.Heat is also reflected from Pakka roads within the settlement
HIGH VULNERABILITY ZONE: Large open areas with no green cover and high reflectance.
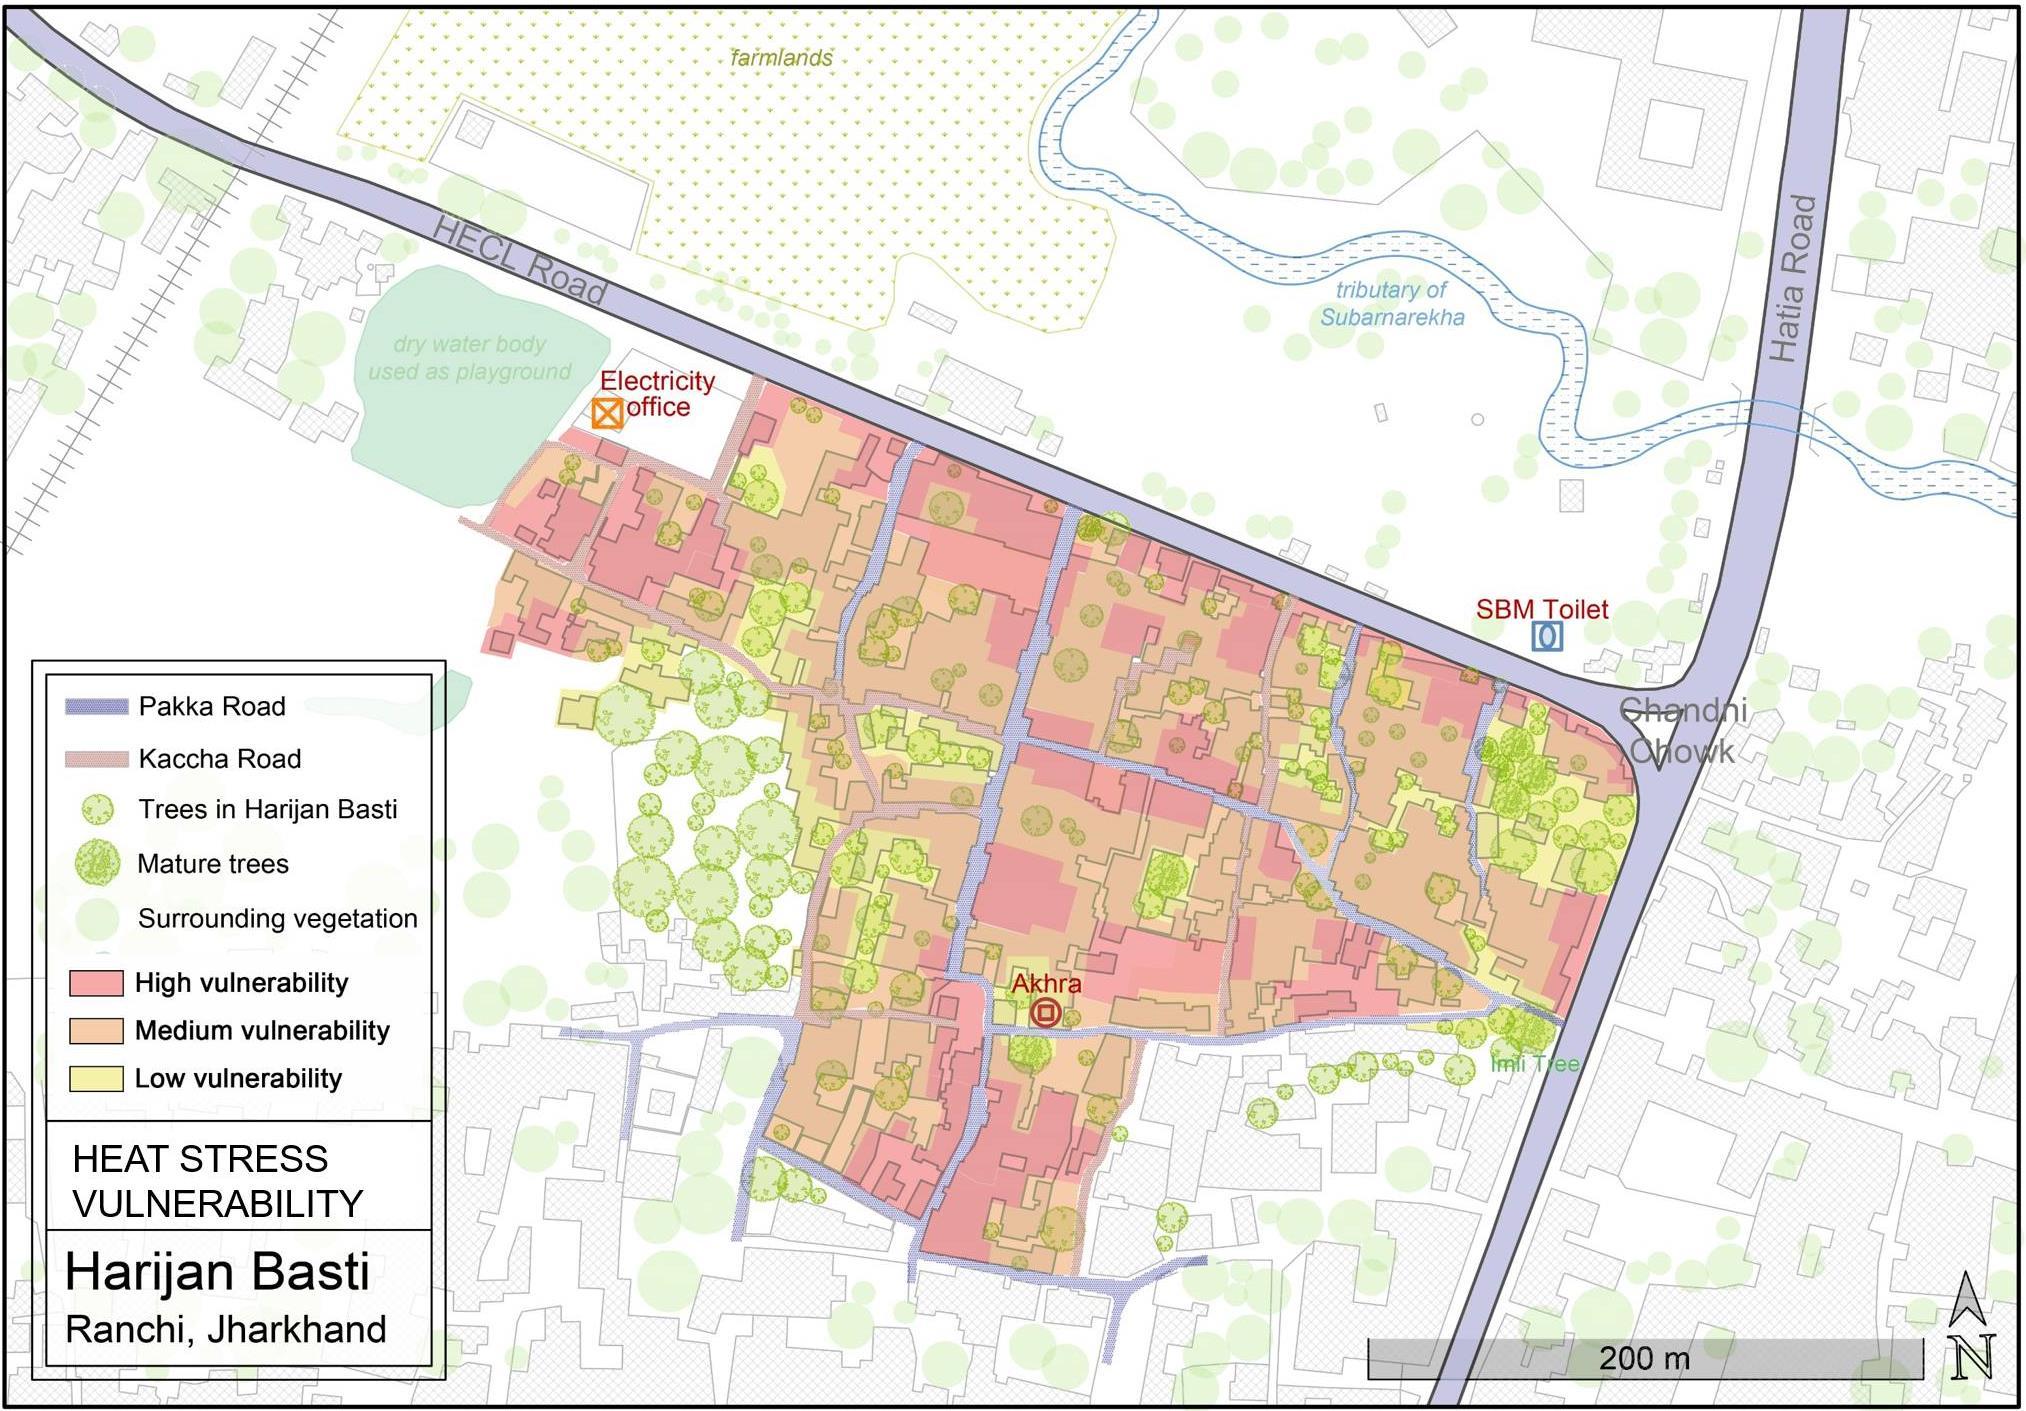
MEDIUM VULNERABILITY AREA: Areas with sparse tree cover and zones adjoining kutcha roads.
LOW VULNERABILITY AREA: Areas with dense tree coverand areas with porous ground cover.
LOW VULNERABILITY AREA: Mutually shaded built zones
Vulnerability Assessment & Mapping 15
10. Heat
Map
stress vulnerability
Map 11. Water logging
6.3.2. Water Logging Vulnerability
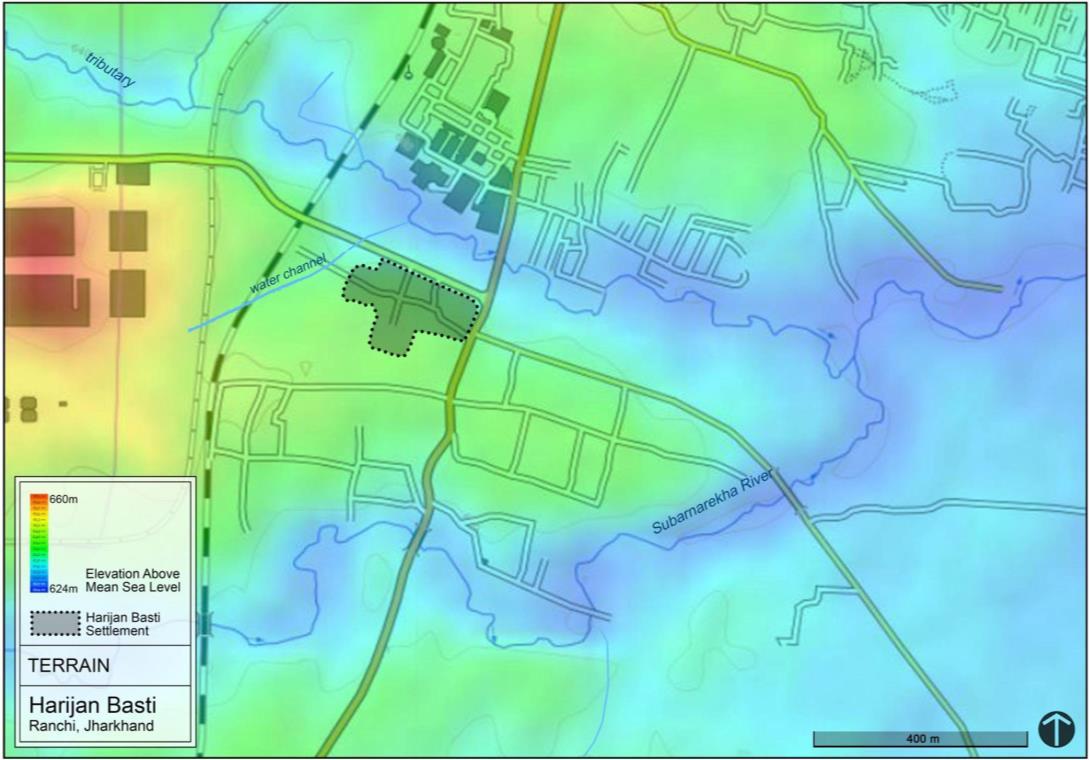
Spatial Factors Overlaid for assessing Water Logging 1. Topography
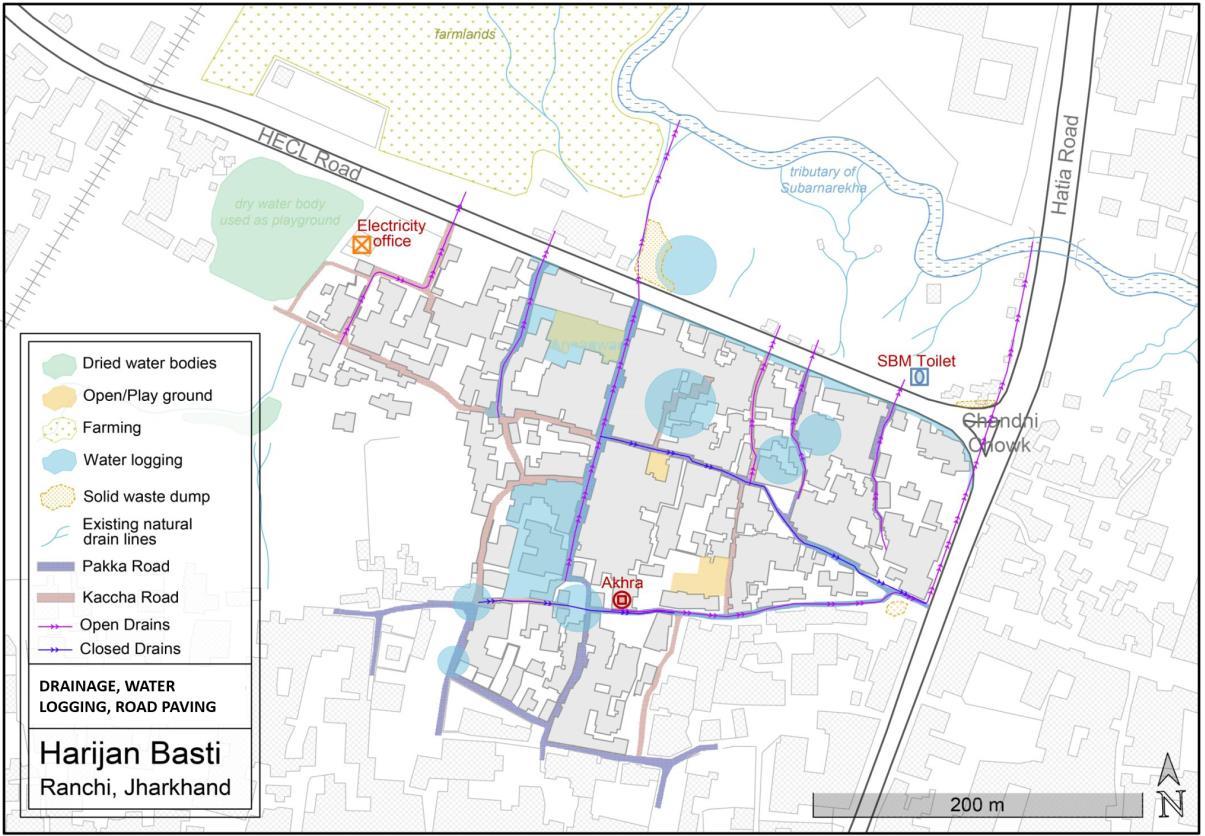
Drainage Lines
Kaccha/Pakka Roads
Permeable ground
Water Collection areas (as reported in social mapping)
EXPOSURE: Earlier the fact that roads were not paved contributed most to water logging problem, but with roads being paved 7-8 years back, the situation has improved. Water logging in gadhas in the front yards of houses was also a problem but with housing renovation that has also improved.However now the
Map 12. Terrain
problem of water logging is seen mostly due to the overflowing of drains in monsoon. Coupled with a low frequency of waste collection, waste is dumped in certain sites and in the drains leading to spread of water borne diseases.
SENSITIVITY: Earlier the eastern side of the settlement used to get flooded the most. Now people along the main road are most affected by water logging. The water logging problem impacts livelihoods by making travel to work difficult.
ADAPTIVE CAPACITY: Residents along with local councillors organize to clean drains during rainy season.The municipality also arranges for sprinkling bleaching powder in open drains & pest control drives. Further, the use of agarbathis, mosquito nets and repellents are also seen in the community.
Vulnerability Assessment & Mapping 16
2.
3.
4.
5.
HIGH VULNERABILITY ZONE: Lowest lying area of settlement, bounded by drainage paths
HIGH VULNERABILITY AREA: Open Drain, Paved Road, Low Lying
HIGH VULNERABILITY AREA: Water collection spots
HIGH VULNERABILITY AREA: No Drainage, Unpaved Road, Low lying area
LOW VULNERABILITY AREA: Closed Drain, Paved Road, Low lying area
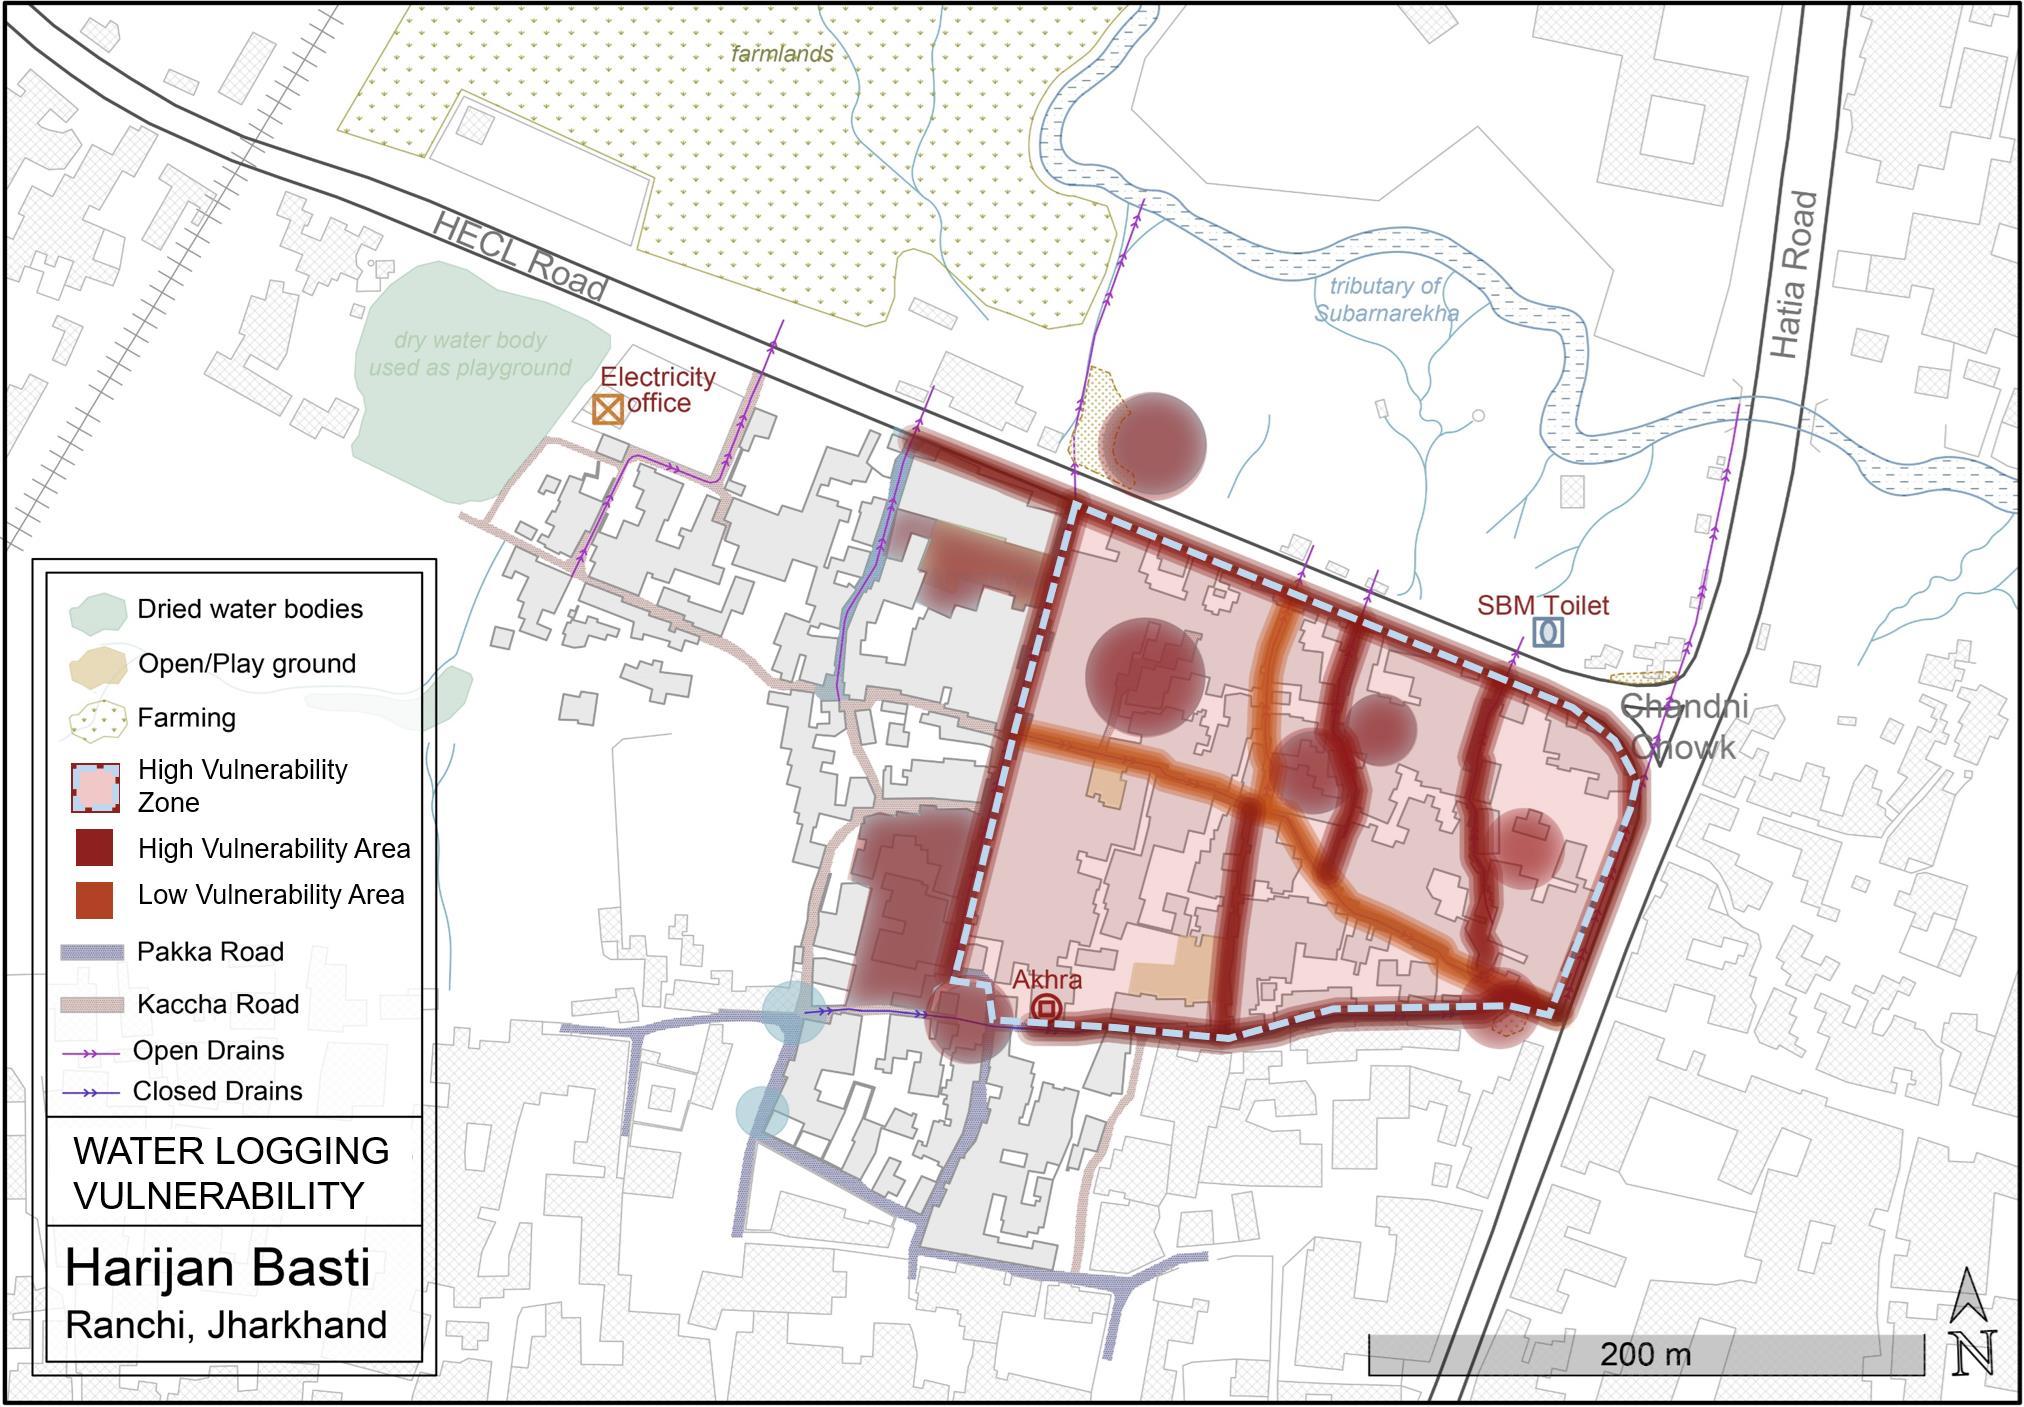
Vulnerability Assessment & Mapping 17 Map 13.
Water logging vulnerability
6.3.3. Vector BorneDisease Vulnerability
Vector borne disease vulnerability has not improved much as mosquitoes still breed near open drains and near solid waste dumps. Exposure to mosquitoes makes the residents vulnerable to illnesses which can indirectly lead to loss of productive hours/wages and increase in the health expenditure.
HIGH VULNERABILITY AREA
Areas where water logging and major pollution sources overlap.
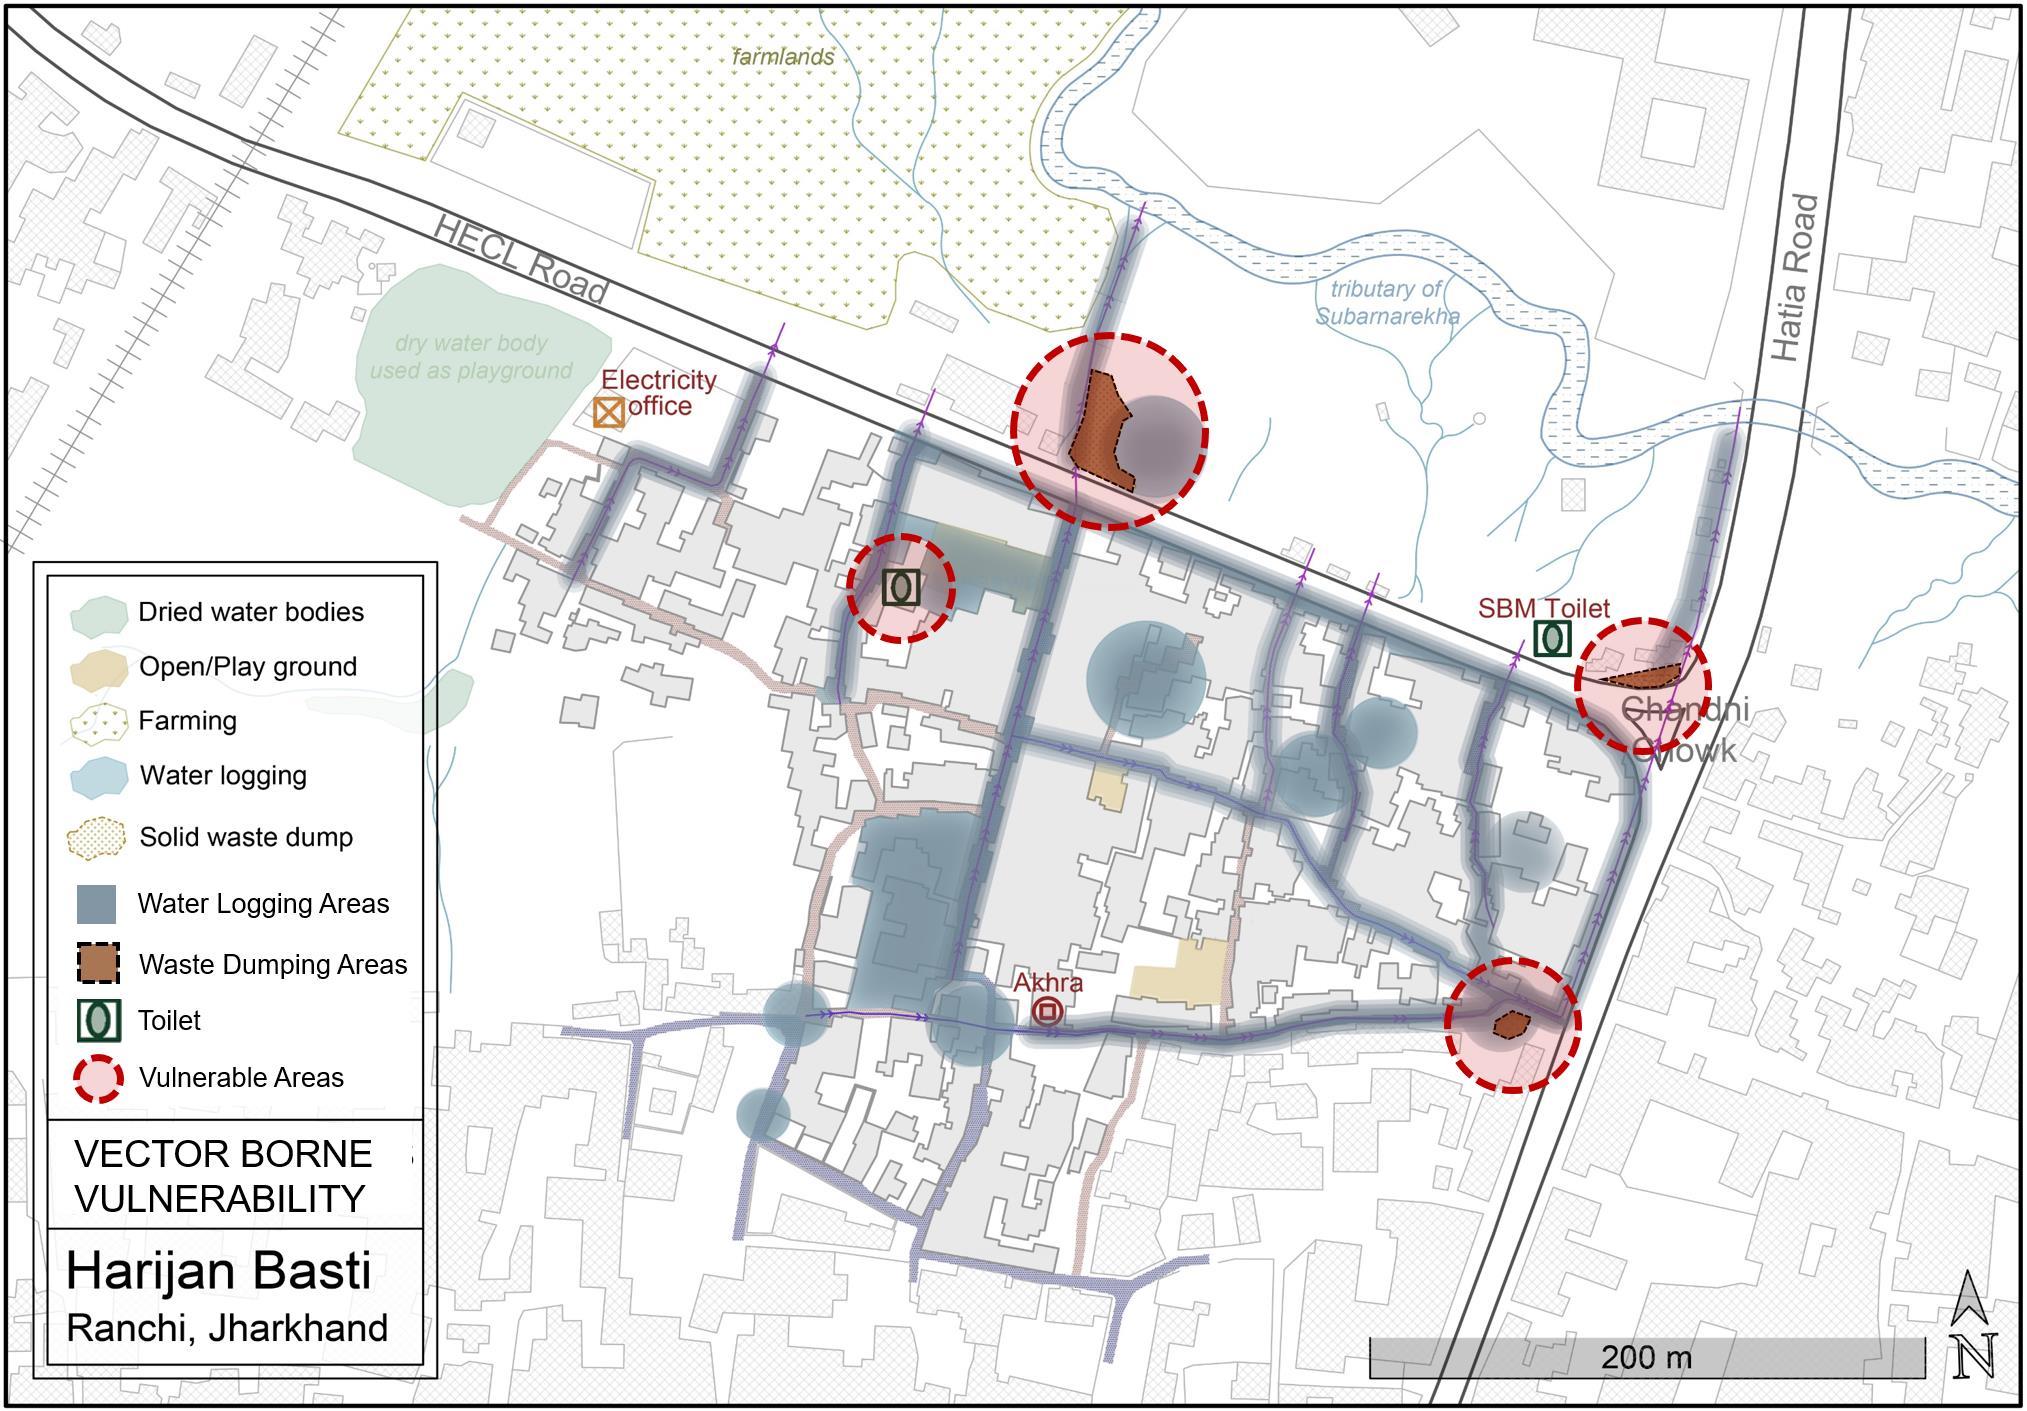
HIGH VULNERABILITY AREA
Areas where water logging and major pollution sources overlap along with households in close proximity. Other water logging areas are also prone to spread of vector borne diseases.
Vulnerability Assessment & Mapping 18
Map 14. Vector Borne disease vulnerability
6.3.4. Water Scarcity Vulnerability
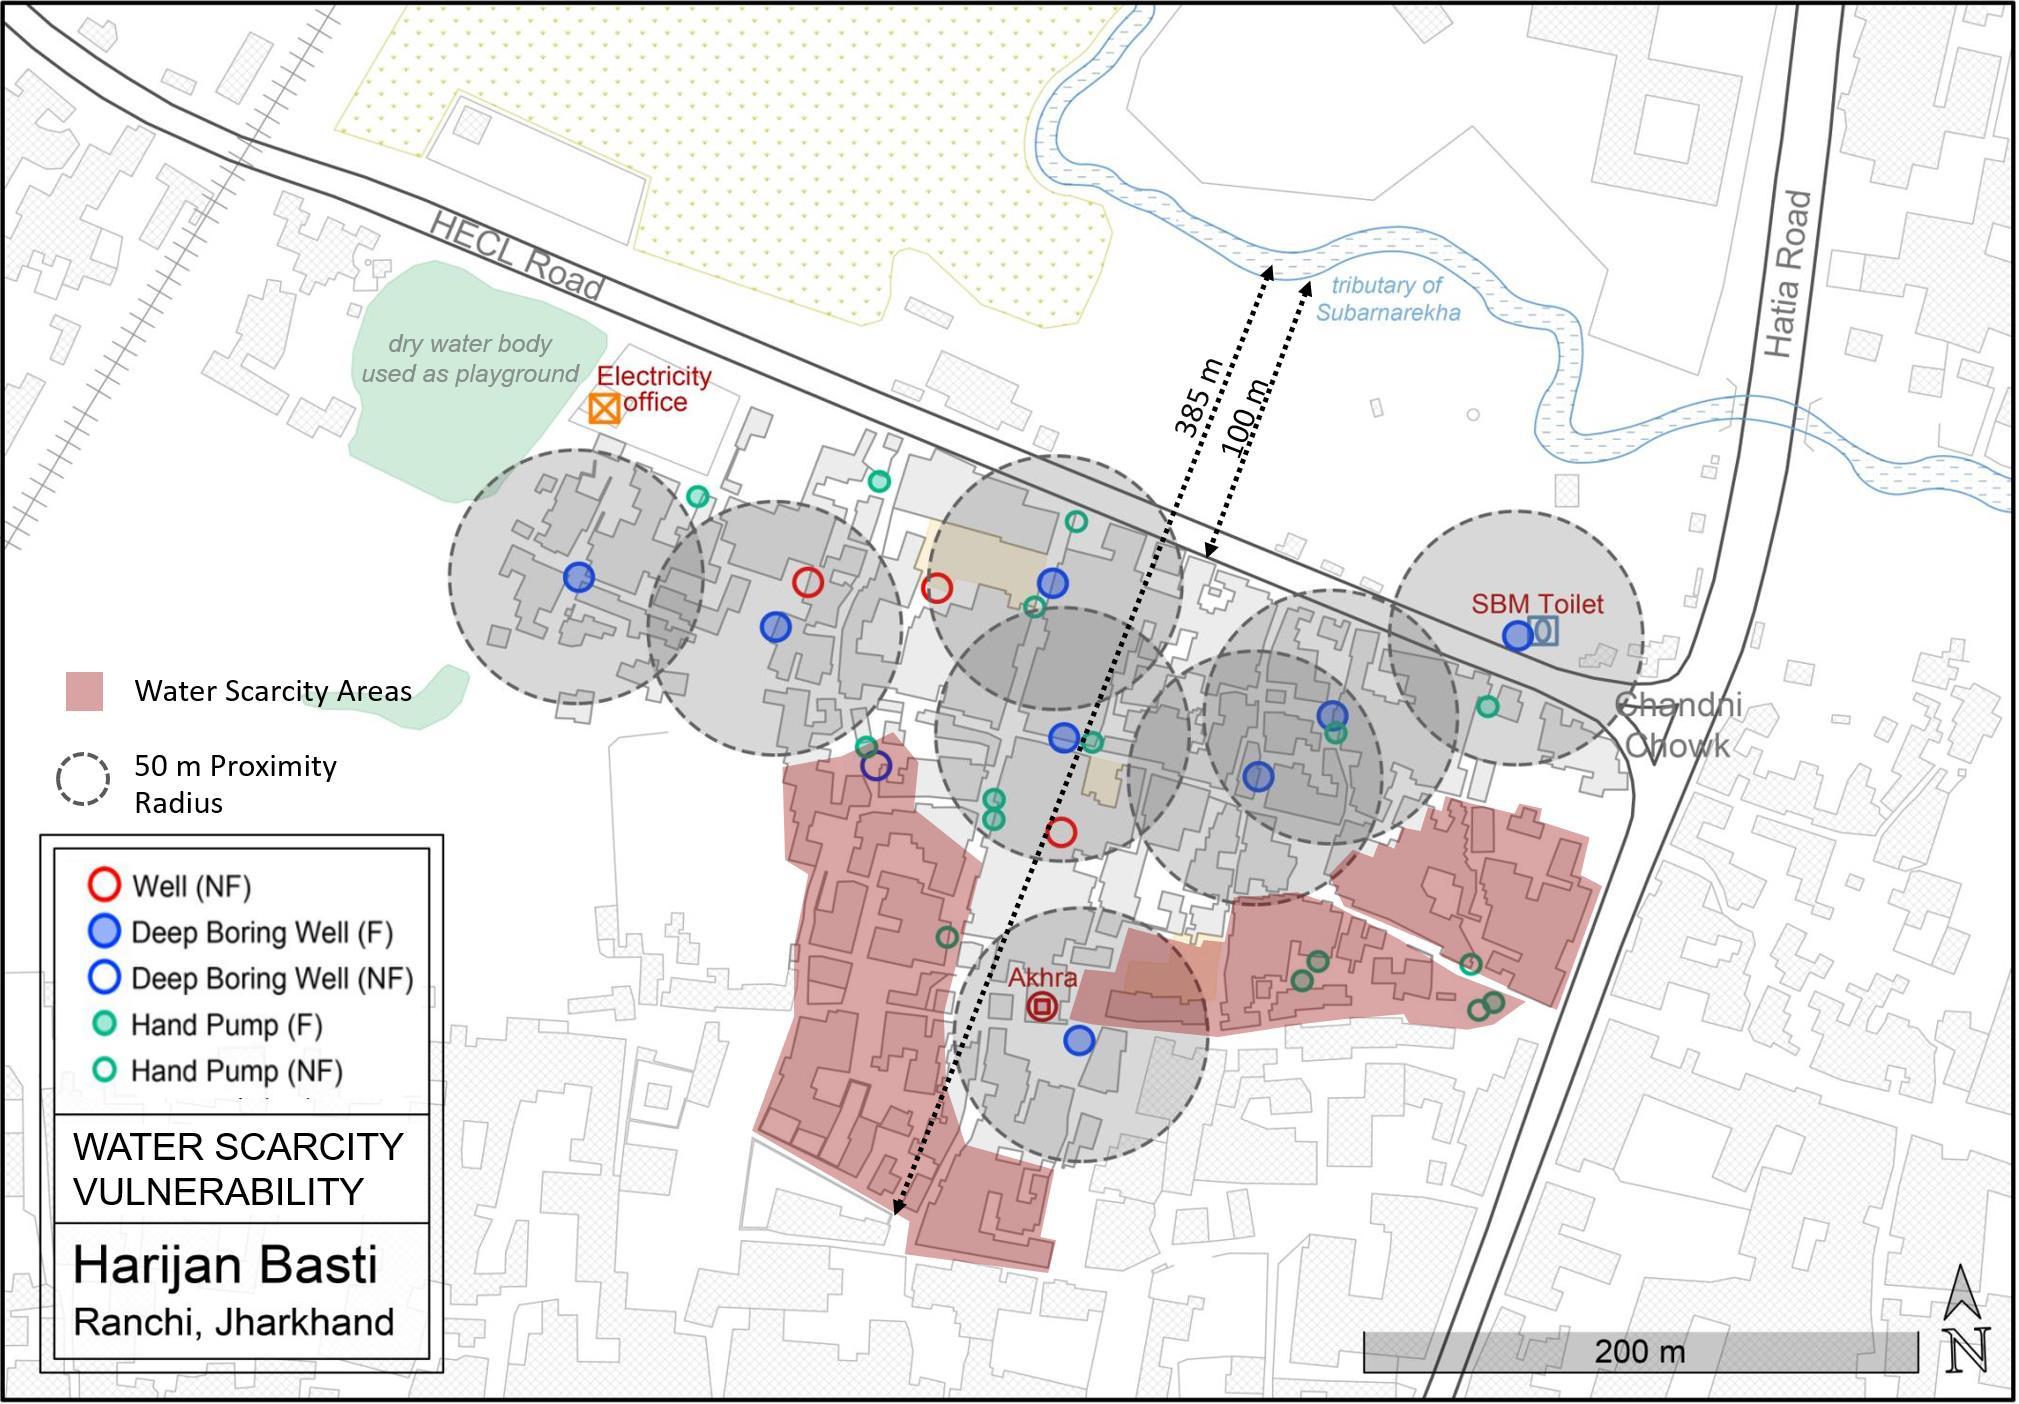
EXPOSURE: Earlier the problem of water scarcity was higher, and residentsused to tap illegally into HEC line on the other side of the road. With provision of borewells and handpumps water scarcity has reduced. The stream is used for bathing and washing since their homes do not have sufficient space.
SENSITIVITY: Nayak Toli and Lohra Basti continue to have water scarcity problem due to insufficient number of borewells in the area.Wells in the area have dried up and water in the stream is reported as polluted due to HEC industrial discharge.
ADAPTIVE CAPACITY: Children in the community organize to clean the tank above the borewell every 3-4 months. RMC has installed a water line under ‘Nall se Jal Yojana’, which passes through MilanChowk road.
Vulnerability Assessment & Mapping 19 Map 15.
Water Stress Vulnerability
6.3.5. Access to Health Facilities - Vulnerability
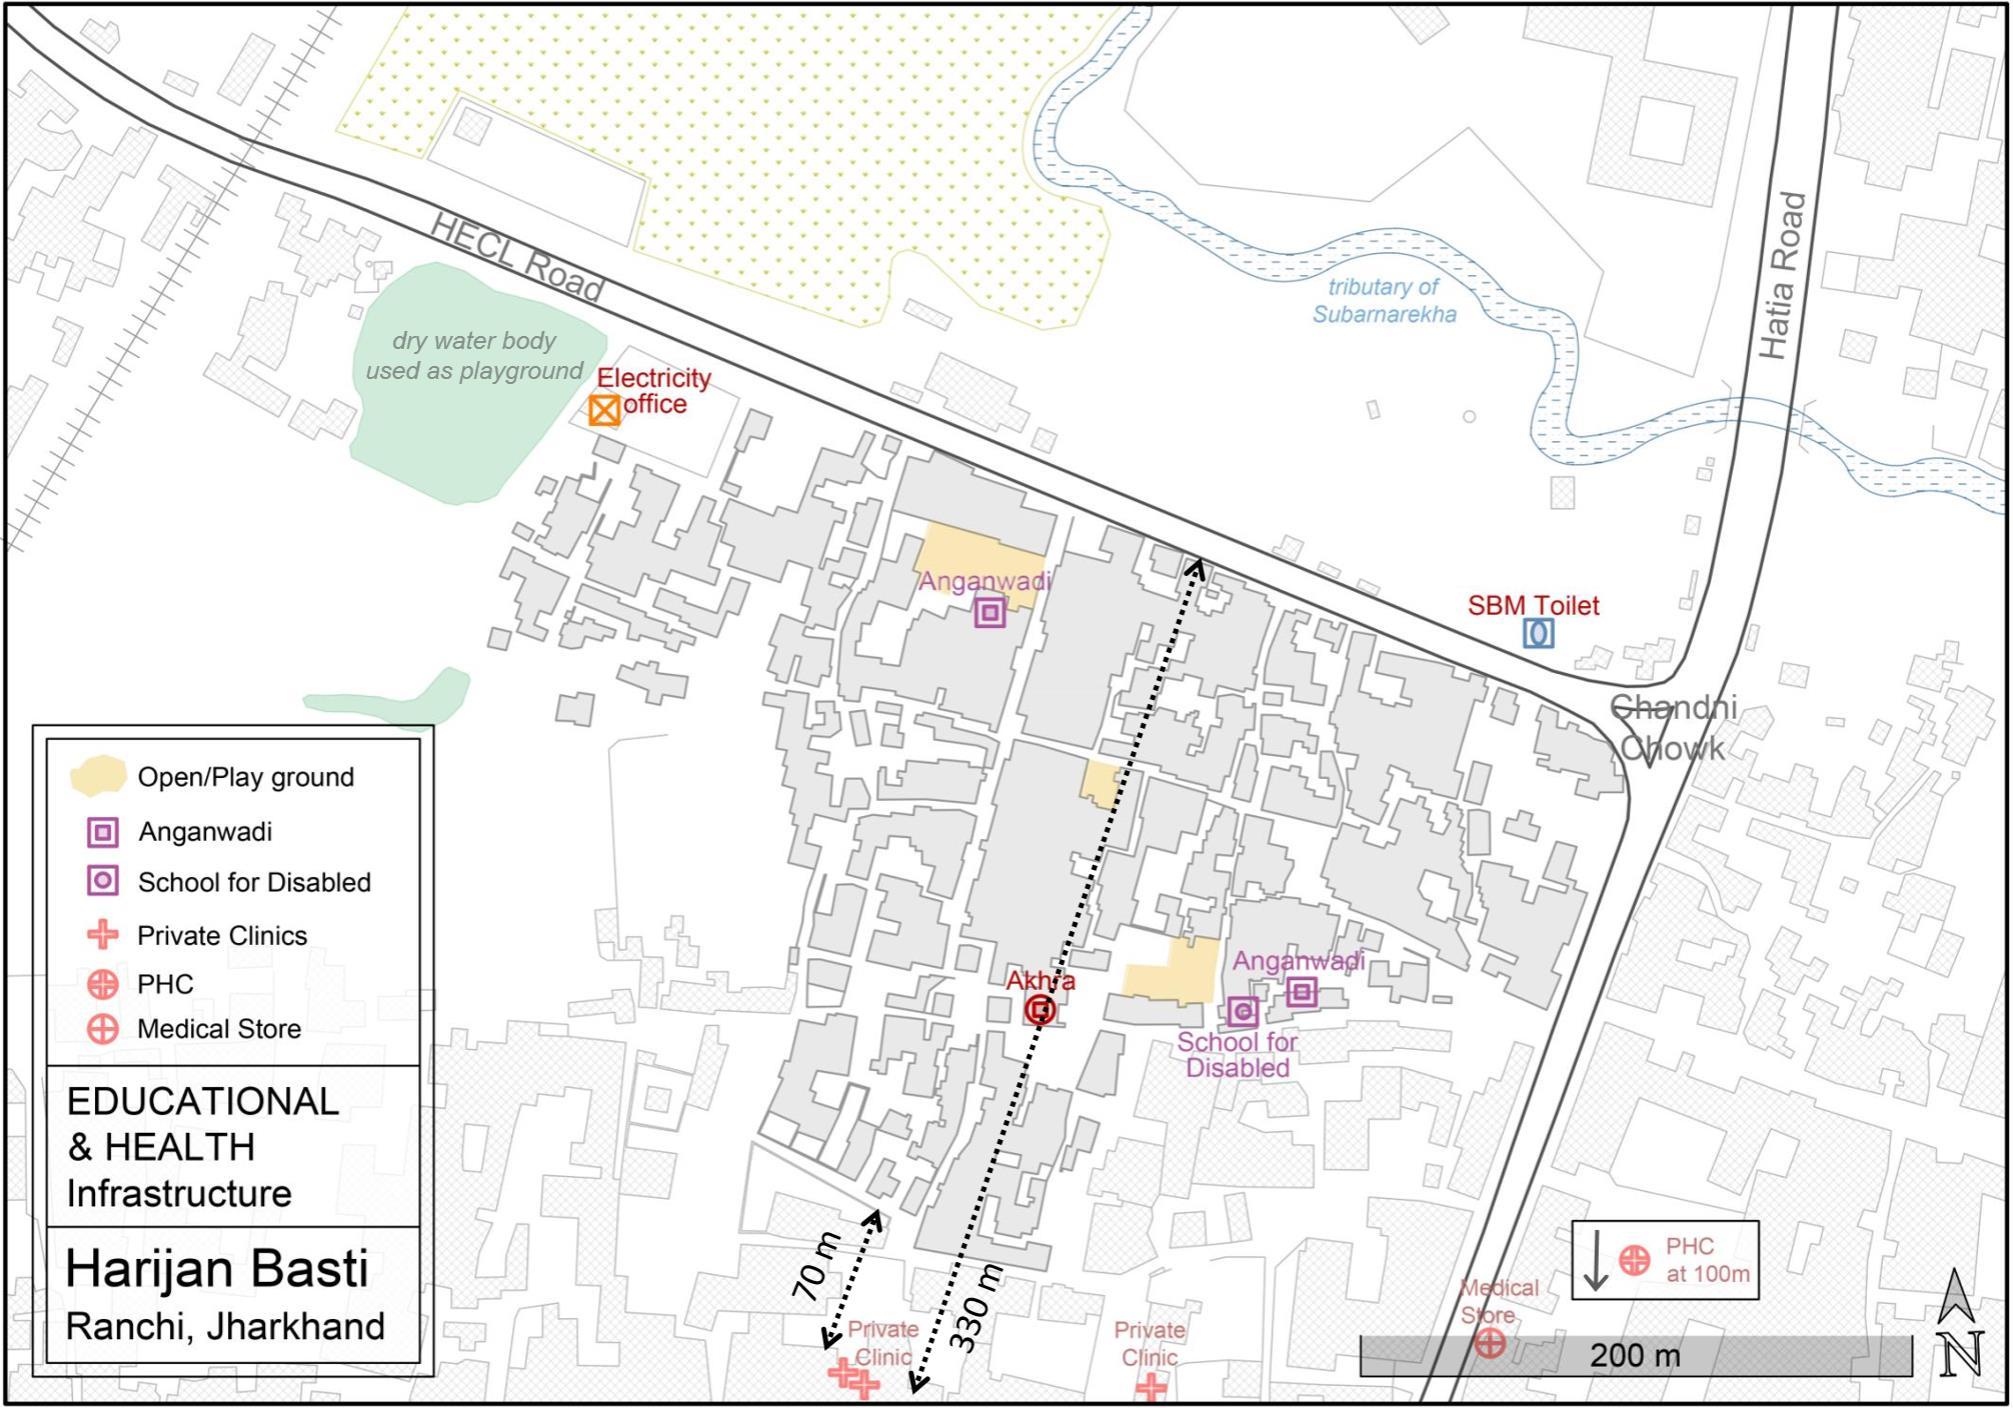
Within the settlement there are 3 private clinics Dr Jagamath, Dr
Vinod and Dr Vijay where Rs 200 is charged per consultation. Aanganwadis also act as health infrastructure with ASHA workers using the space for immunization and check-ups on pregnant women.
The nearest PHC is Hatia PHC located 1.5 km away. People reach it by walking/auto. The facility only has an ANM and no doctor. Serious cases are therefore referred to hospitals.
Facilities like Summer Hospital (2km), Bhubaneshwari Hospital (2 km), Narayani Nursing Home (4km), Sardar & RIMS Hospital (18 km) are depended on.
More than proximity, the problem of access to health amenities is more salient.
Vulnerability Assessment & Mapping 20
Map 16. Access to Health facilities
Map 17. Access to Health facilities - Regional Scale
Satellite image source: Google Earth
PROXIMITY: As per URDPFI and NHM standards, average population served by:
• Intermediate Hospital (80 beds)- 1,00,000
• Primary Health Centre –30,000
Considering a population density of 192 persons per hectare, the approximate radius served by the facilities will be
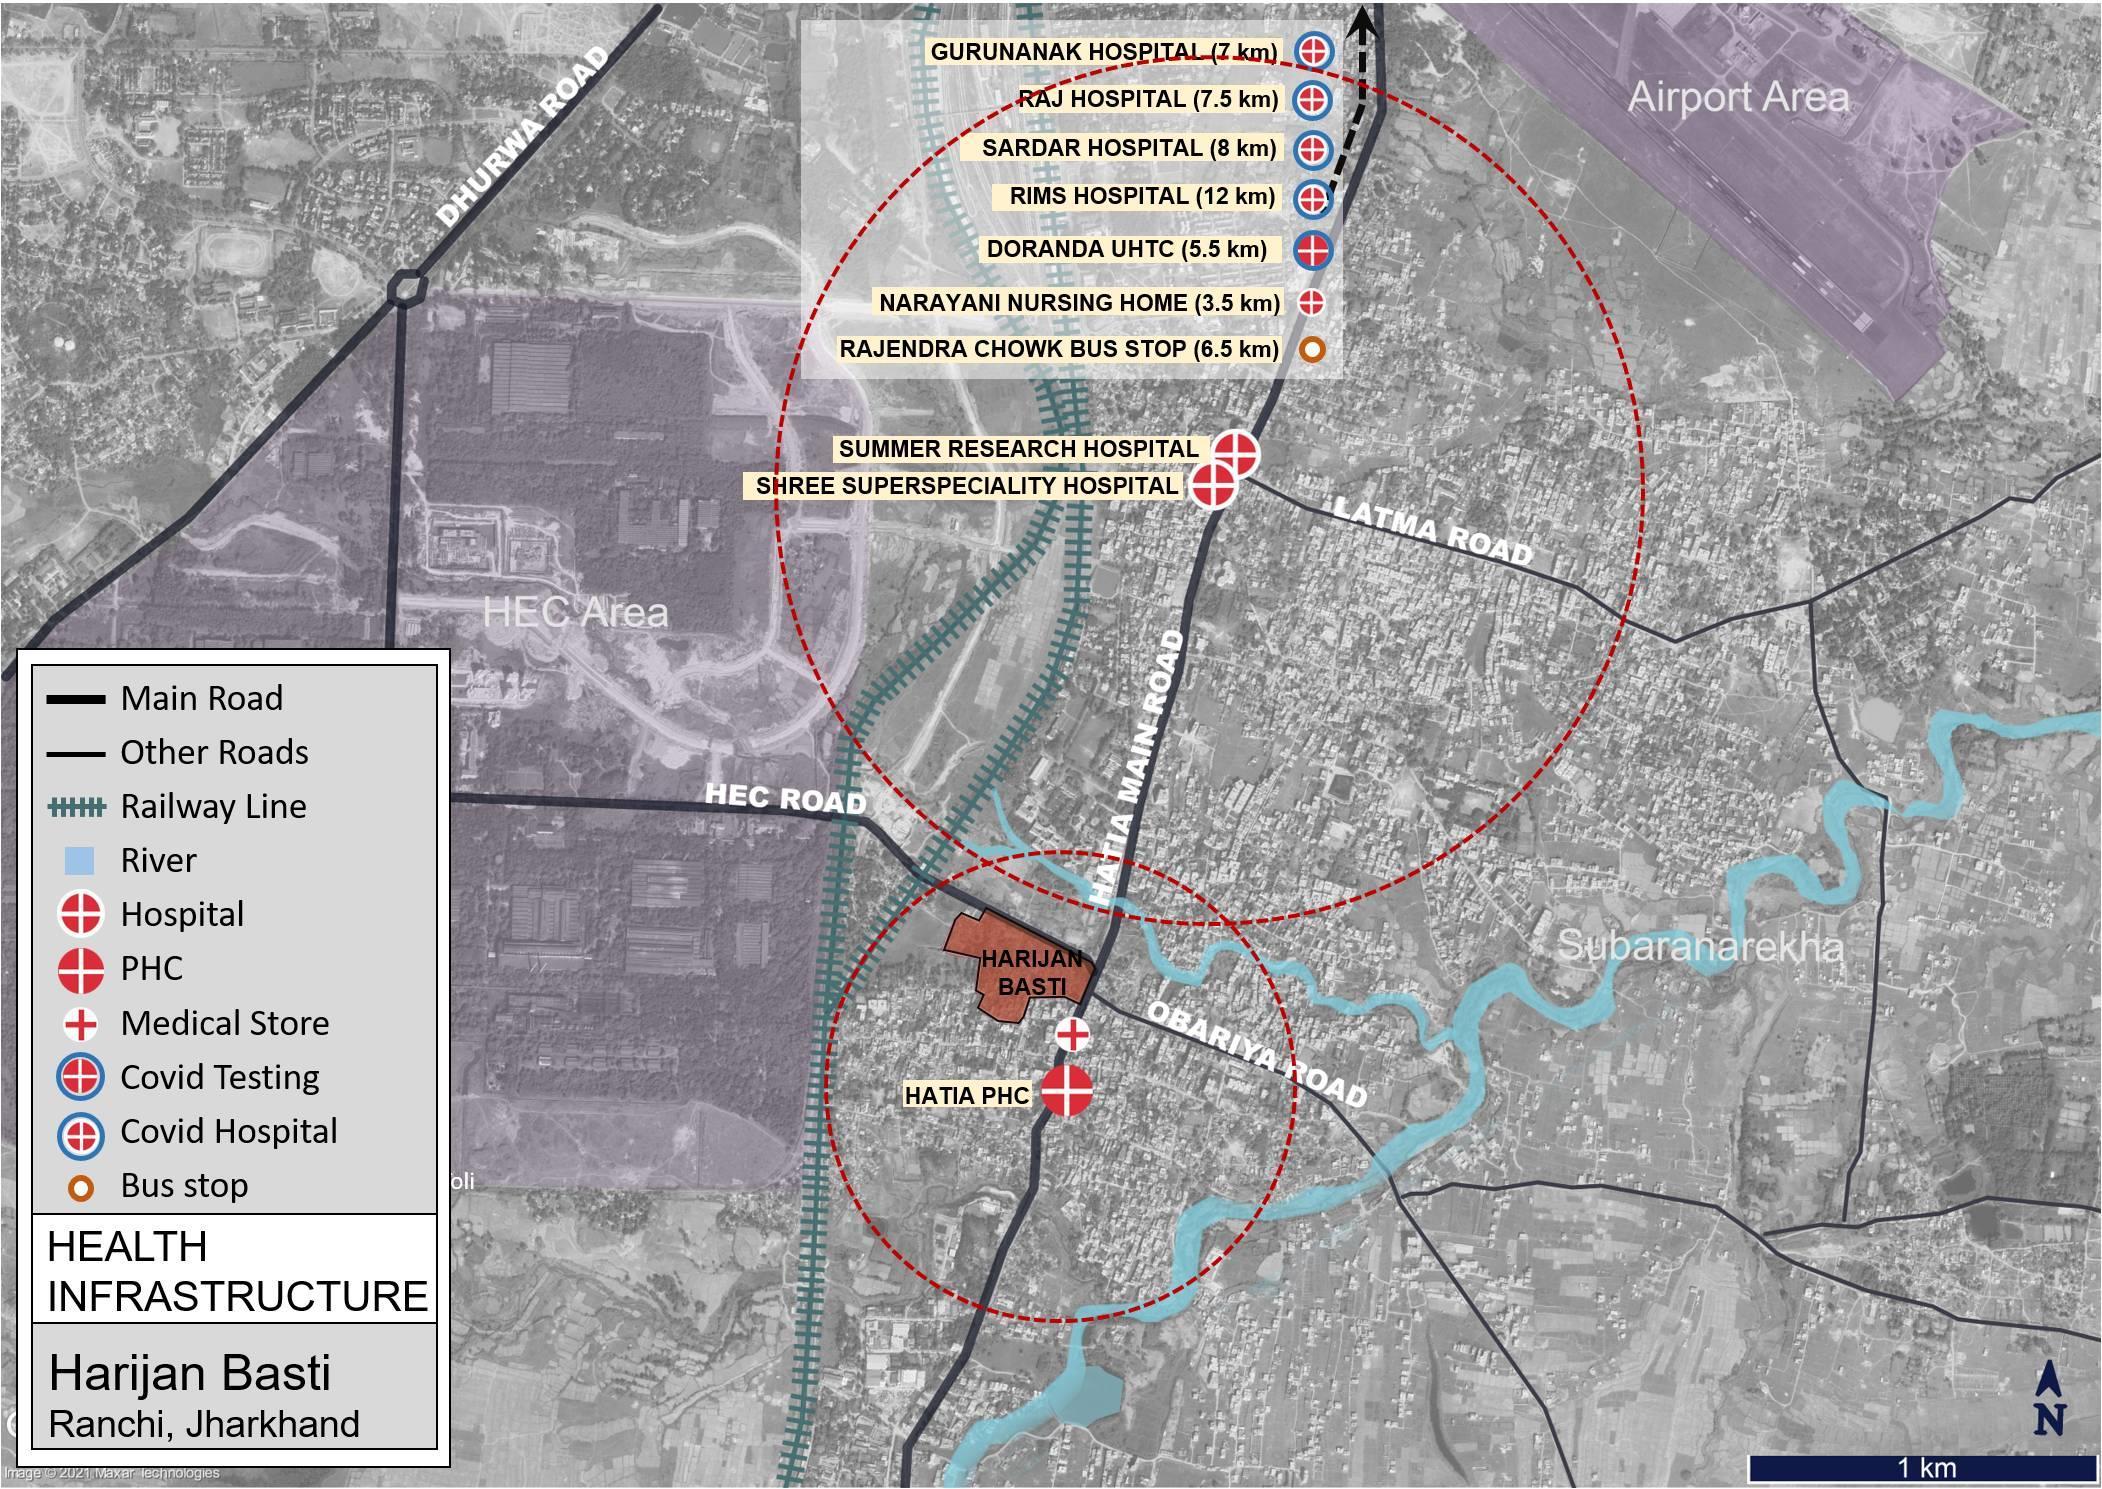
• Intermediate Hospital (80 beds)- 1.2 km
• Primary Health Centre –700 m
Therefore, in terms of proximity to health services the settlement is adequately provided for.
ACCESS: However, accessibility to health facilities is severely curtailed due to lack of bus services. The nearest bus stop to the settlement is 6.5 km away.Without bus services, residents depend on autos or private vehicle.
Vulnerability Assessment & Mapping 21
Vulnerability Assessment & Mapping 22
SETTLEMENT 02: BHUIYAN TOLI
Image source: MHT
7. VULNERABILITY ASSESMENT OF BHUIYAN TOLI
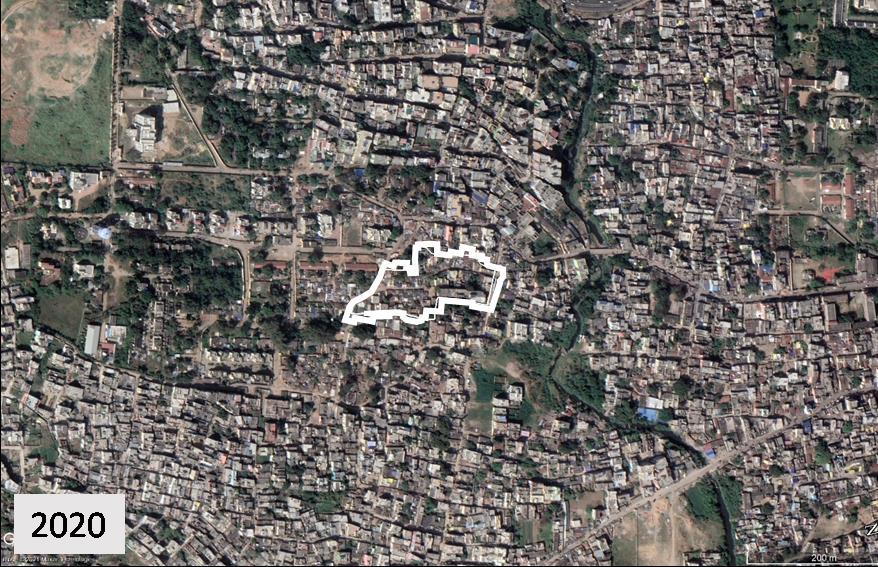
The slum Bhuiyan Toli is located in the Ward no. 49 of Ranchi Municipal Corporation and is connected by Kali Mandir Road, Pathar Road and Hinoo Main Road. As per the household listing survey, recently conducted in October 2020, Bhuiyan Toli houses nearly 370 people, covering an area of about 1 hectare.The slum is more than 50 years old and nearly 3 generations of the families have been living here and it is populated by the Bhuiyan community. It is surrounded by slums like Mani Tola,KathalKocha, PokharToli, Muslim Basti and private buildings/societies.
Map 18. Sattelite Image Bhuiyan Toli with key landmarks.
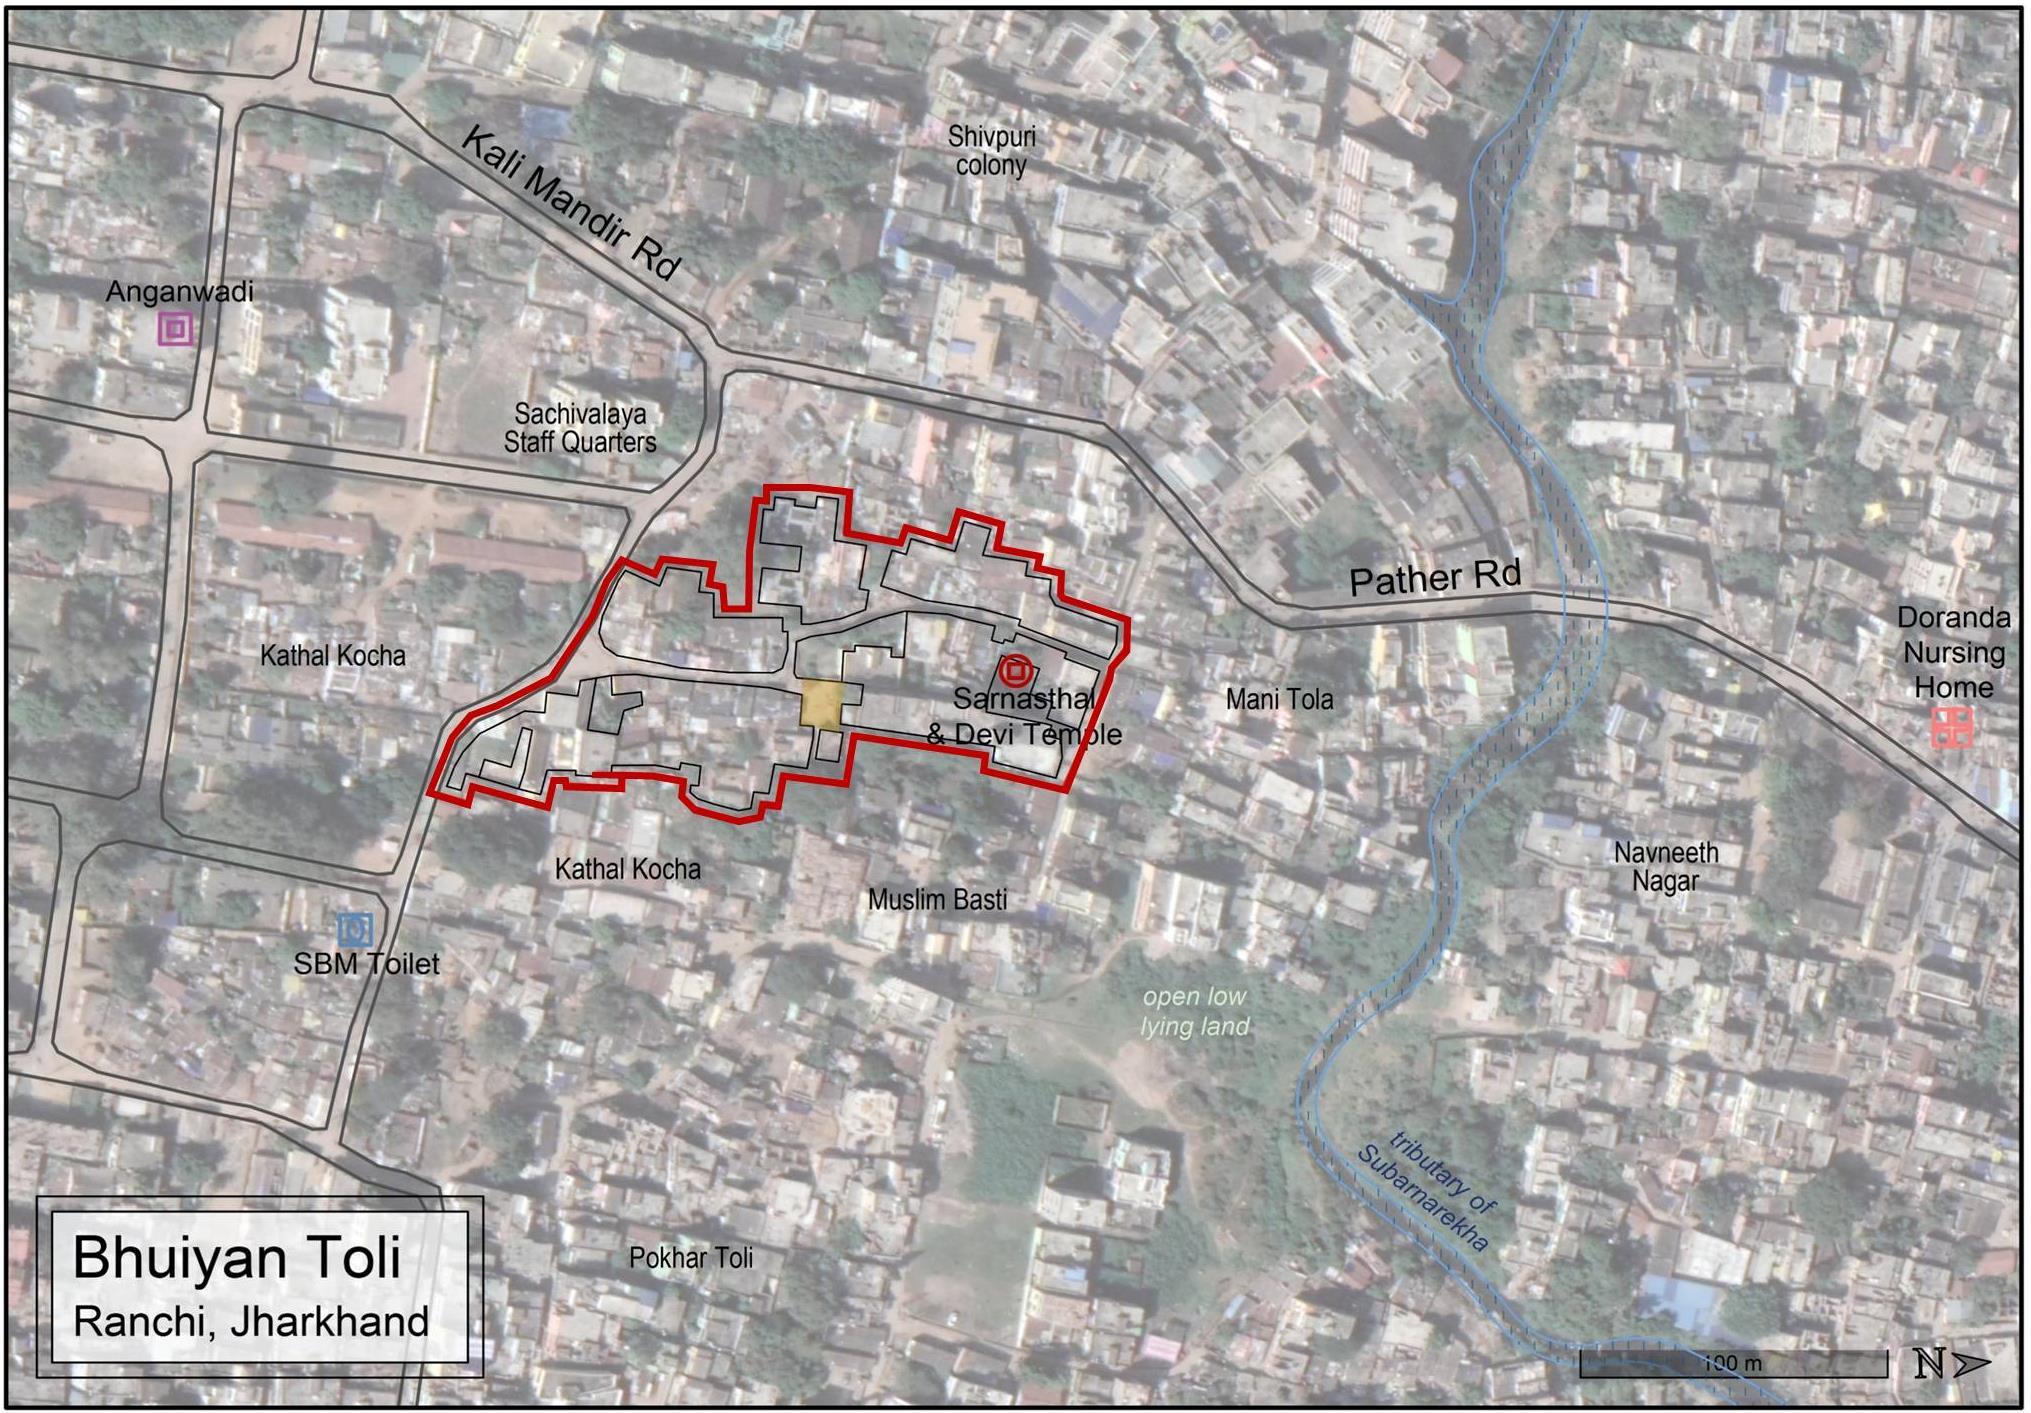
Image source: Google Earth
Vulnerability Assessment & Mapping 23
7.1. Social Profile
7.1.1. Demographics
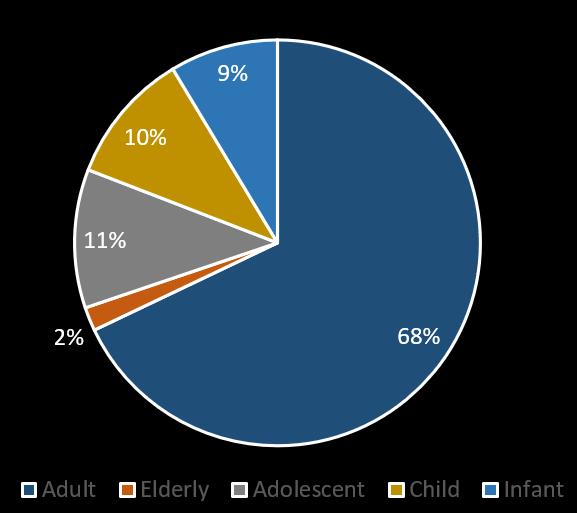
Bhuiyan Toli has a total population of 371 out of which 190 are males and 181 are females. In terms of age distribution 68% of the population (252 people) fall under the age-group of 18-60 years and 11% of the population (41) are adolescents falling under the age group of 11-17 years.
7.1.2. Livelihood
The general occupations that the residents of Bhuiyan Toli are engaged in are sweeper/solid waste collection worker, construction work, domestic work, street vending.Men are usually engaged as sweepers with RMC, skilled construction worker, driver, street vendors, etc while 80% of the women are engaged as domestic workers. Average monthly family income ranges between INR 10,000 –12,000. There a is a prevalent alcoholism problem among the men due to which they have frequent run-ins with the police.
Change in Livelihood: There has been no significant change in the livelihood patterns as the residents of Bhuiyan Toli have been engaged in service sector ever since they settled here 50 years back. Agriculture wasn’t prevalent in that area in the past as the land parcels were very small. The females used to work as domestic helpers in government quarters situated near the slum and the males used to work as construction labourers or as other service providers such as loaders,salesman, helpers at hotels, etc.
Impact of COVID 19: During the lockdown most men and women did not get work. The domestic workers whose work places were nearby also couldn’t work due to denial from their employers. However, some of these domestic workers got cash support (INR 1000-2000) from their employers to help them run their families.After the lockdown incomes have reduced. Domestic workers have begun getting work but at lesser number of homes and for lesser wages. Women who refused to work at such low wages have been replaced by other women willing to work at these rates which has caused rifts within the community.
Livelihoods have shifted since the lockdown. Women doing domestic work have shifted to activities like tea stall, egg stall, sewing work, paper bag making etc. Few auto drivers, who weren’t able to drive the vehicles, took up small jobs at hotels, shops, etc.
Vulnerability Assessment & Mapping 24
Graphic 3: Gender Composition Graphic 4: Age Distribution
Vulnerability Assessment & Mapping 25
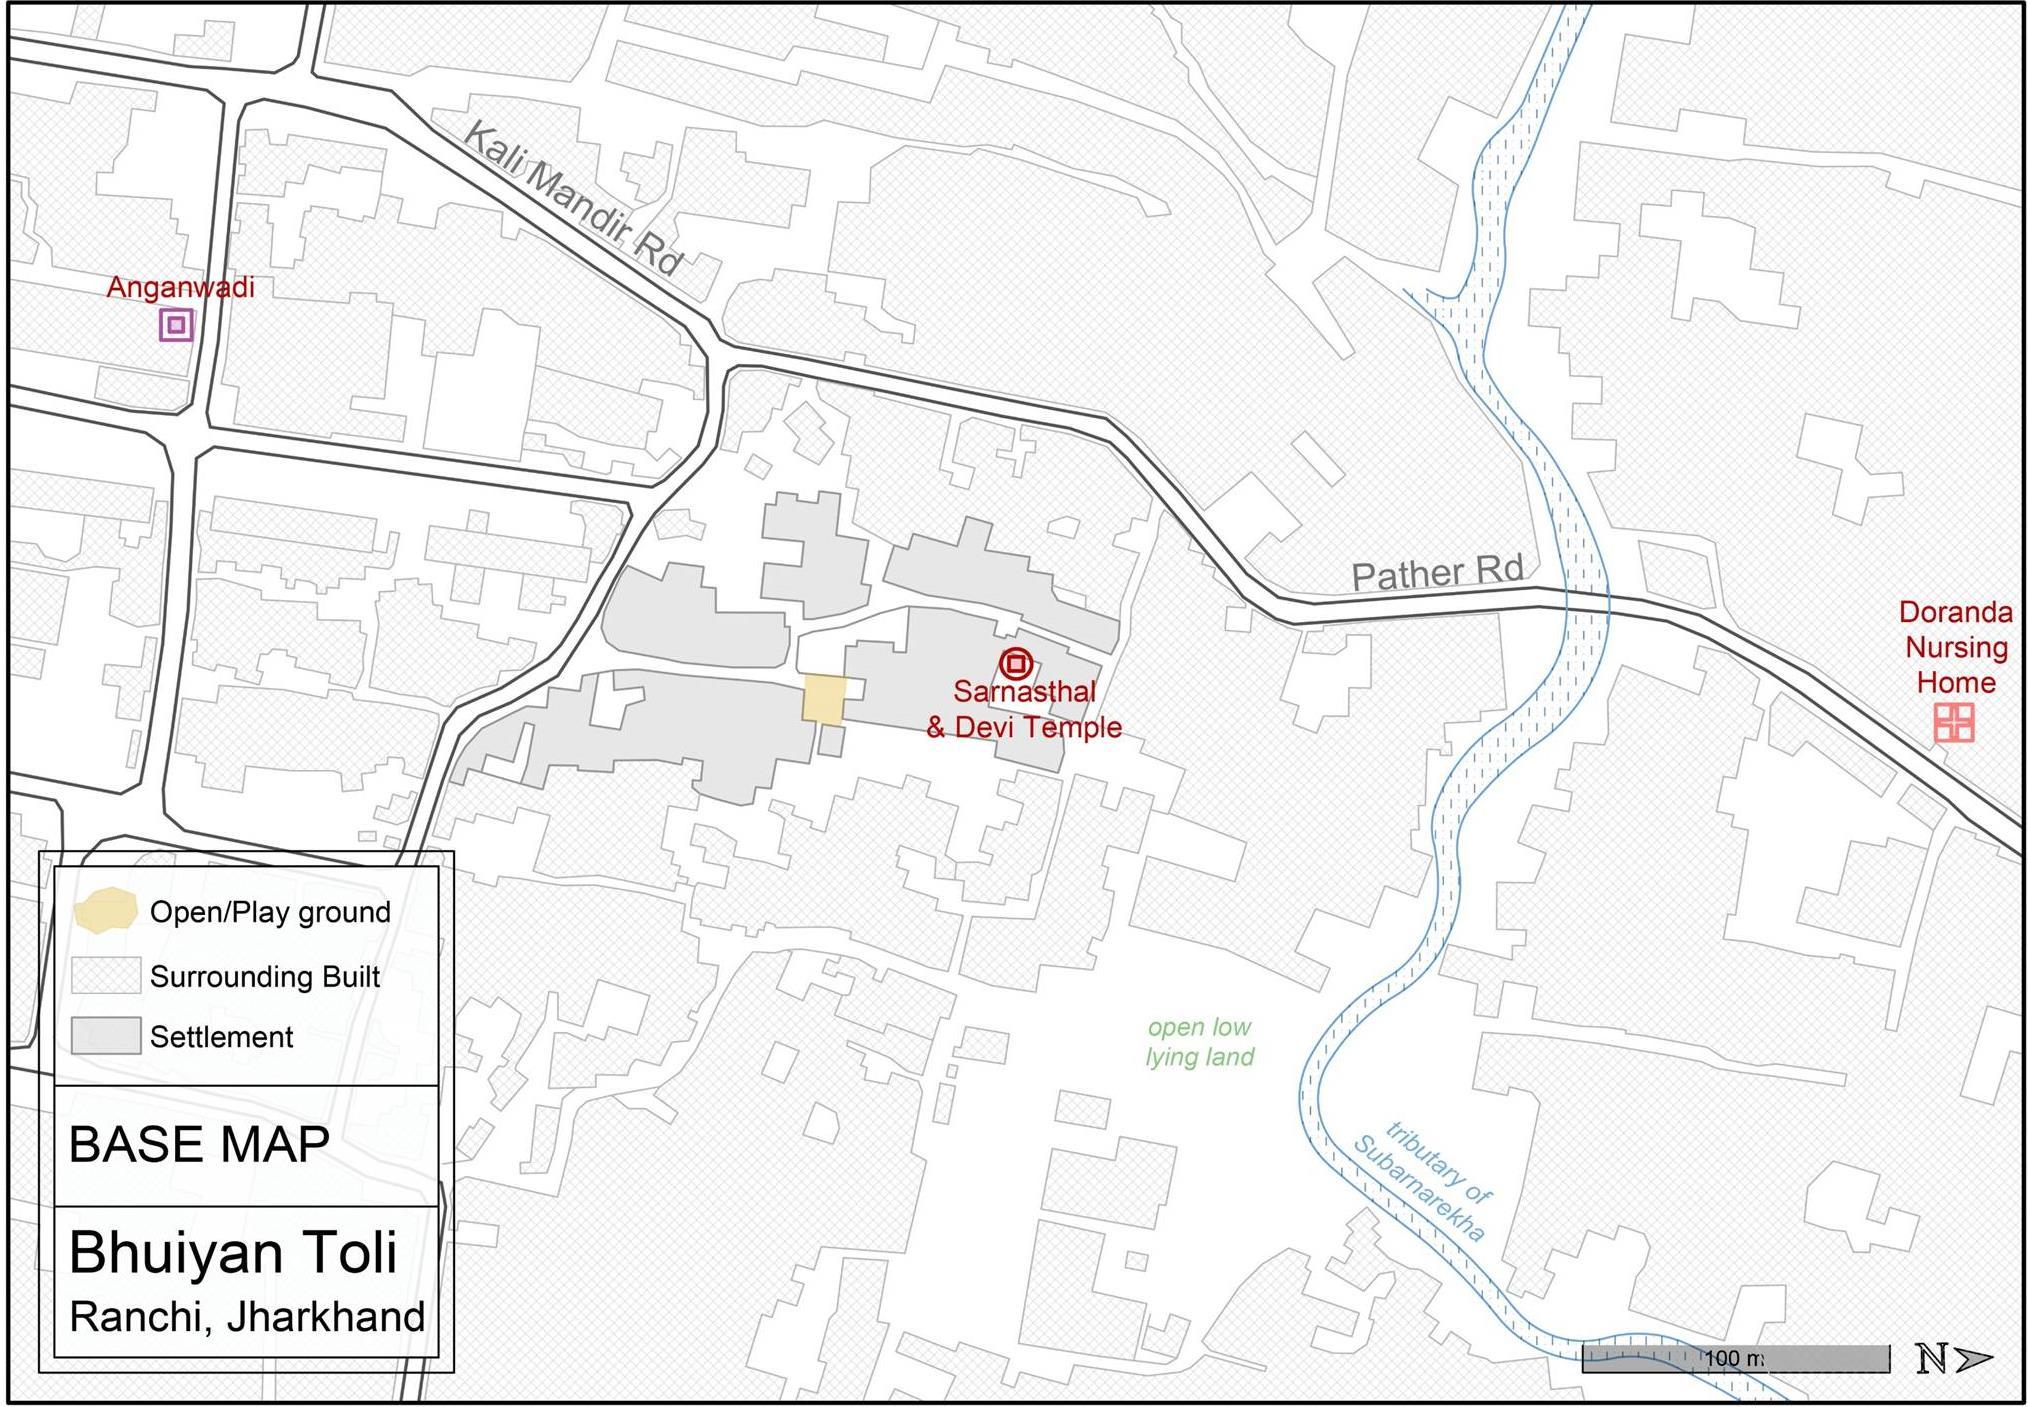
Map 19. Base map
Satellite image source: Google Earth
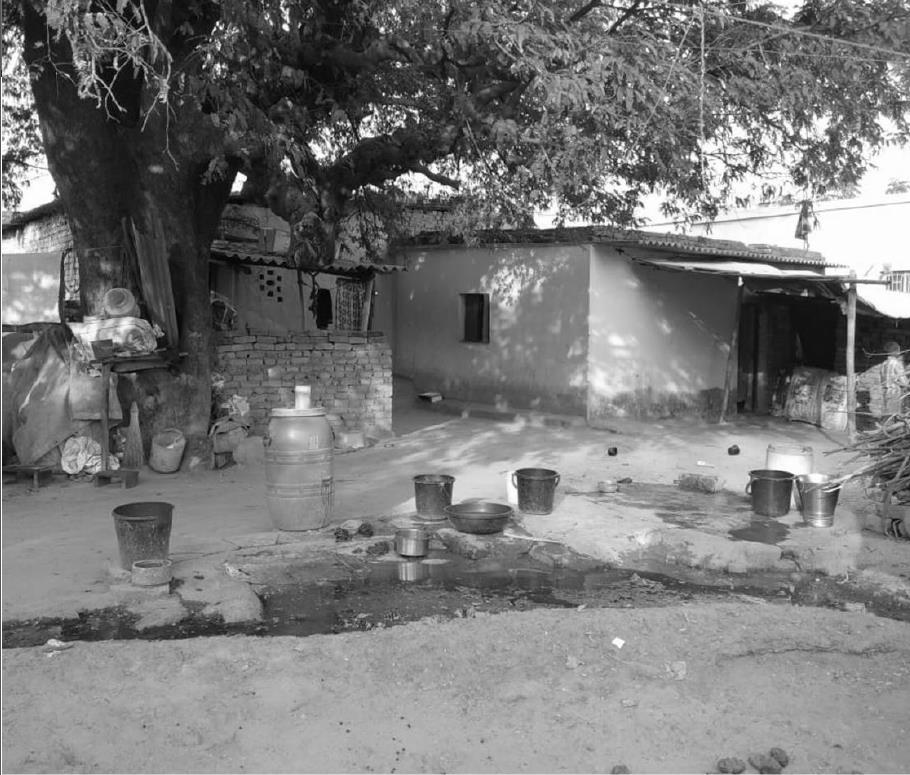
7.1.3. Change Over Years
As is visible in the pictures, the build density in the area had undergone substantial increase especially in the last decade. Located close to the Subarnarekha tributary this has implications on the drainage patterns of the area and on the city as a whole. The high-density low-rise built fabric is seen to be extending to the surrounding areas of the settlement.
7.1.4. Caste and Ownership
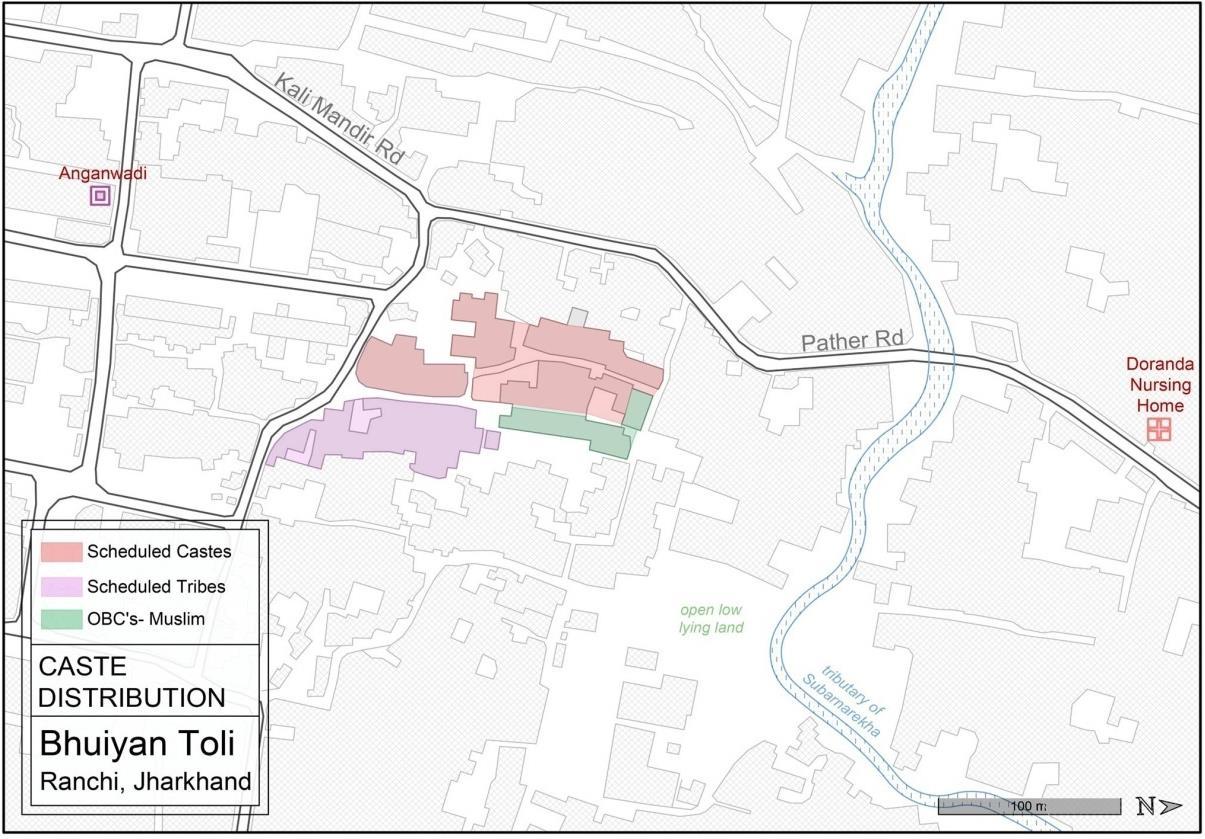
From the 72 households who live there, 30.56% households belong to Scheduled Tribes (ST) namely Sarna, UravandLohra, 58.33% households belong to Scheduled Castes (SC) namely Bhuiyan and the rest 11.11% households belong to OBCs. The SCs, mostly belonging to Bhuiyan community lives in the eastern portion of the slum, while STs &
Vulnerability Assessment & Mapping 26
Map
20. Caste Distribution
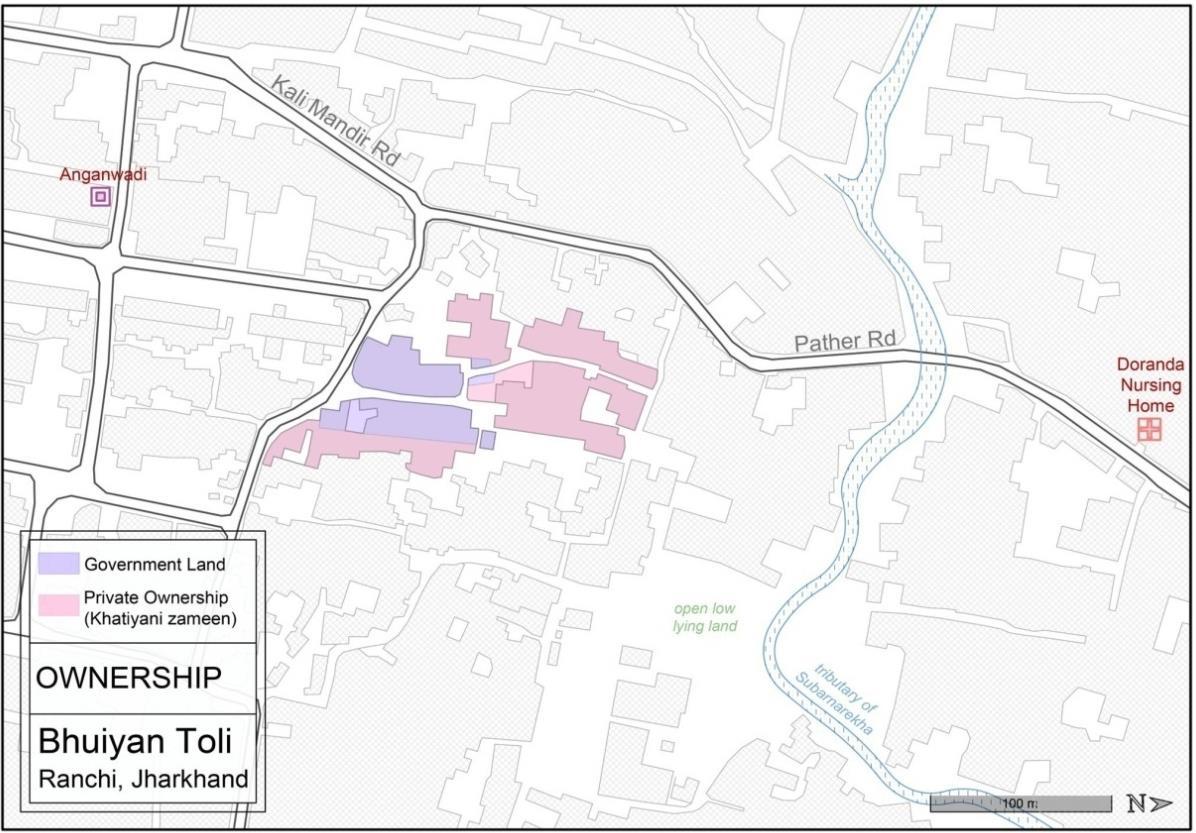
OBCs stay on the western part of the slum.As per the FGDs conducted, 35% of the land is Government land, housing nearly 25 households and 65% of the land is privately owned (Khatiyanizameen).Though they have been residing in the slum for more than 40 years now, residents are aware of the risk of eviction hence they resist in investing in their house (improvements, incremental housing, etc.). All thehouses pay Holding Tax to RMC because of which they are entitled to receive basic services and amenities.
7.1.5. Social Capital and Governance
The community works together with social unity when it comes to emergency situations or tackling community development issues.The Ward Councillor is active and is available over phone.He has taken a lot of efforts inimprovingthe
Map 21.
Ownership
living conditions by renovating public toilet, constructing the community hall. Ranchi Municipal Corporation (RMC) charges Holding Tax from the households in the slum, on the basis of which the residents are provided with facilities of water, sewerage, electricity and road. However, the residents face issues in contacting the Nagar Nigam officials and very often, their issues are not heard/resolved by the government officials even after visiting the concerned offices frequently.
7.2. Physical Infrastructure
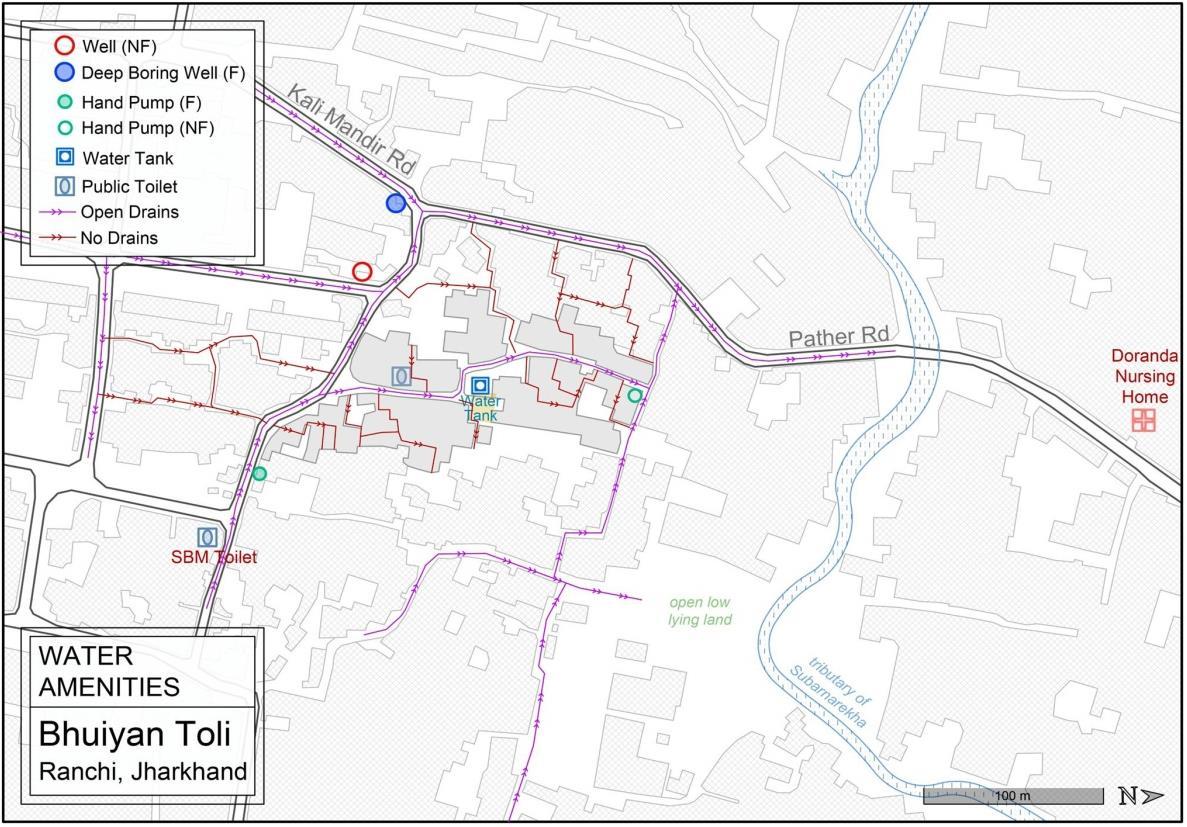
7.2.1.
Water Supply and Drainage
There are currently four sources of water: water pipeline, hand pumps, deep boring well and well, of which only the deep bores and pipeline have potable
Vulnerability Assessment & Mapping 27
Map 22. Water amenities
water. 20% households have legitimate water connections while 80% have illegally tapped water connections from the main pipeline on the main road of the slum. The pipeline had got laid down nearly 40 years back for serving the government quarters situated on the government land of the slum.
The slum does not have closed sewerage network, and has only open drains which merges with the tributary of River Subarnarekha in the north. Residents face a lot of issues associated to open drains which includes overflowing, foul smell, breeding of mosquitoes and dumping of solid waste in the drains.
7.2.2. Public Amenities
Presently, the street lightsare only present on the main streets. There are 7
Map 23. Other public amenities
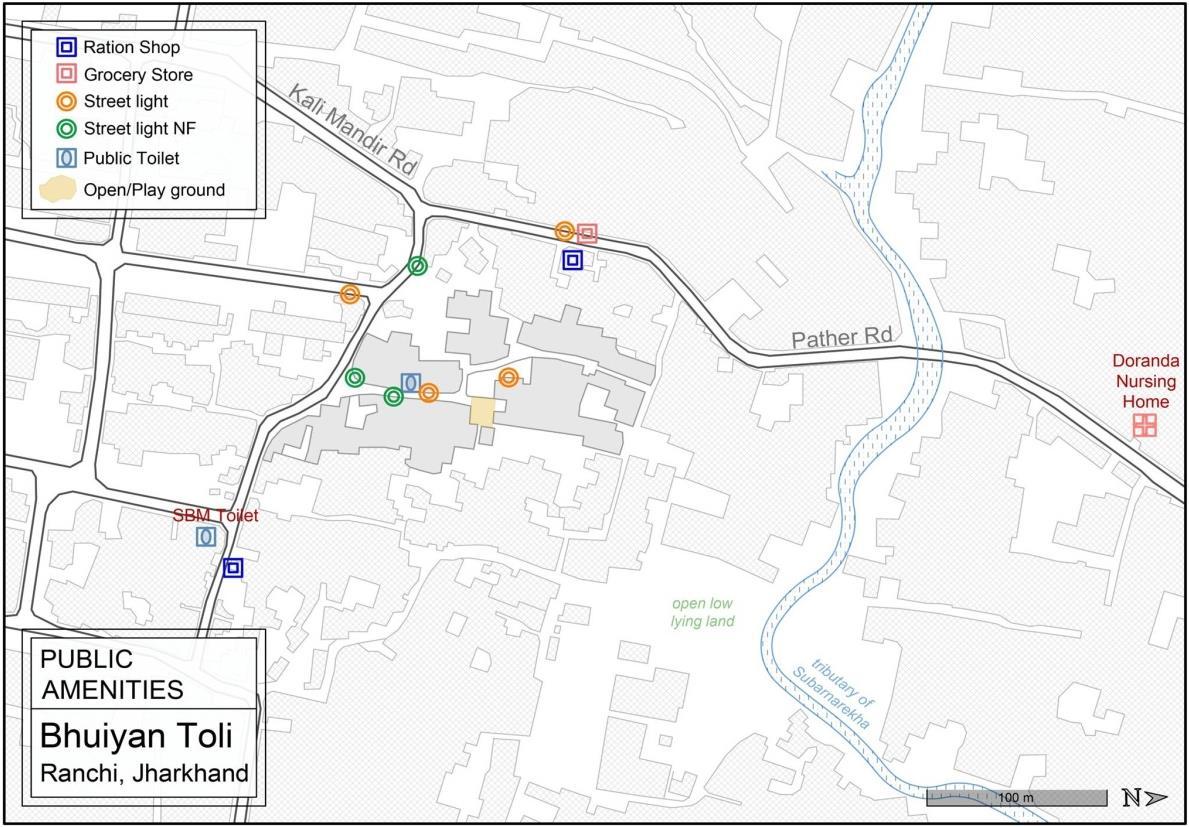
streetlights, of which 4 streetlights are within the slum and the rest are located outside the slum. 3 of the streetlights are dysfunctional. The street lights in the slum are inadequate in number and therefore people who reside in internal areas face mobility issues during night time.
As per the FGDs, only 20% of the households have access to individual toilets while the rest 80% of the households use public toilets. There are two community toilets, one inside the slum and one outside the slum. Due to low coverage of HH-level toilets, small children aged up to 5 years old defecate in the open ground near the waste dumping area.
Vulnerability Assessment & Mapping 28
7.3. Climate Change Induced Vulnerabilities
Map 24. Road Typology & Tree Cover
7.3.1. Heat Stress Vulnerability
Spatial Factors Overlaid for assessing Heat Stress 1. Highway, Pakka/Katcha Roads 2. Tree Cover 3. Ground cover 4. Built Density
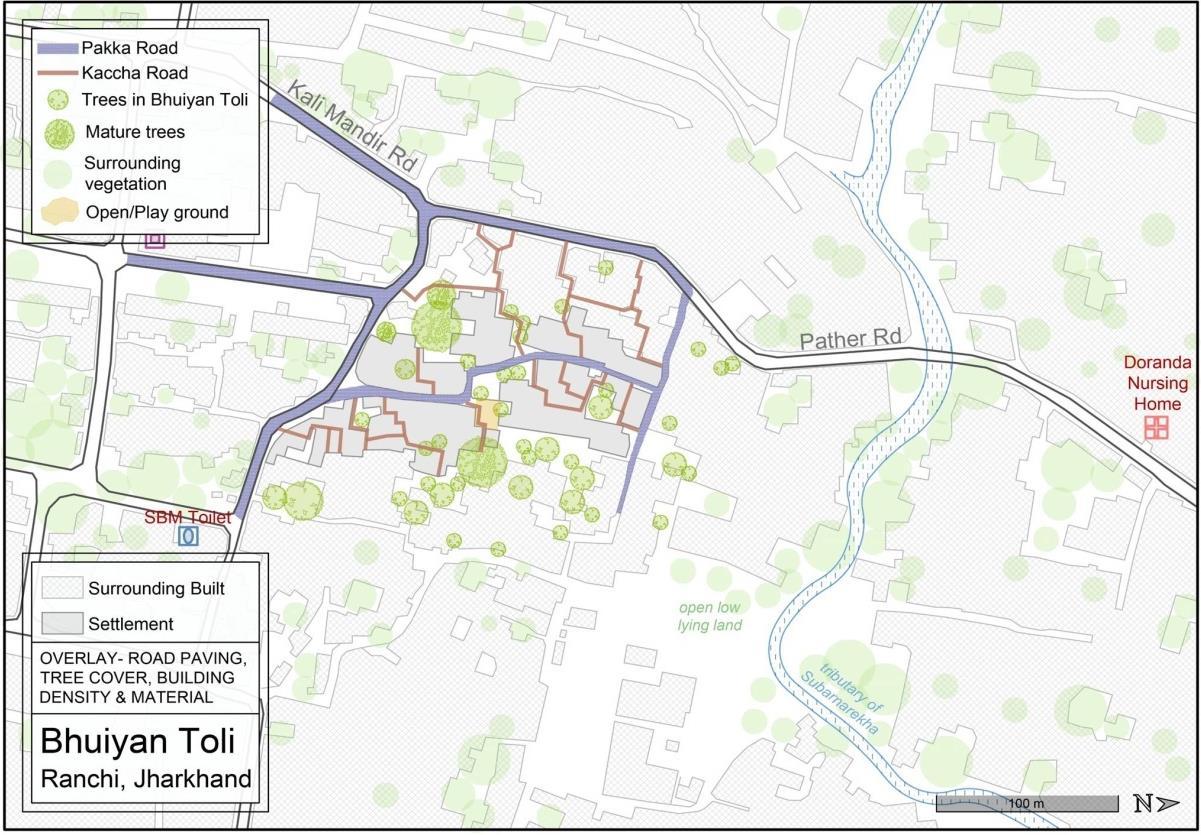
EXPOSURE: Heat stress has increased in the past decade due to increase in built up area around the settlement. Having greater building heights than the settlement, this increased built up area is not only heat generatingbut alsoaffects wind flow patterns. The settlement generally has poor quality housing.
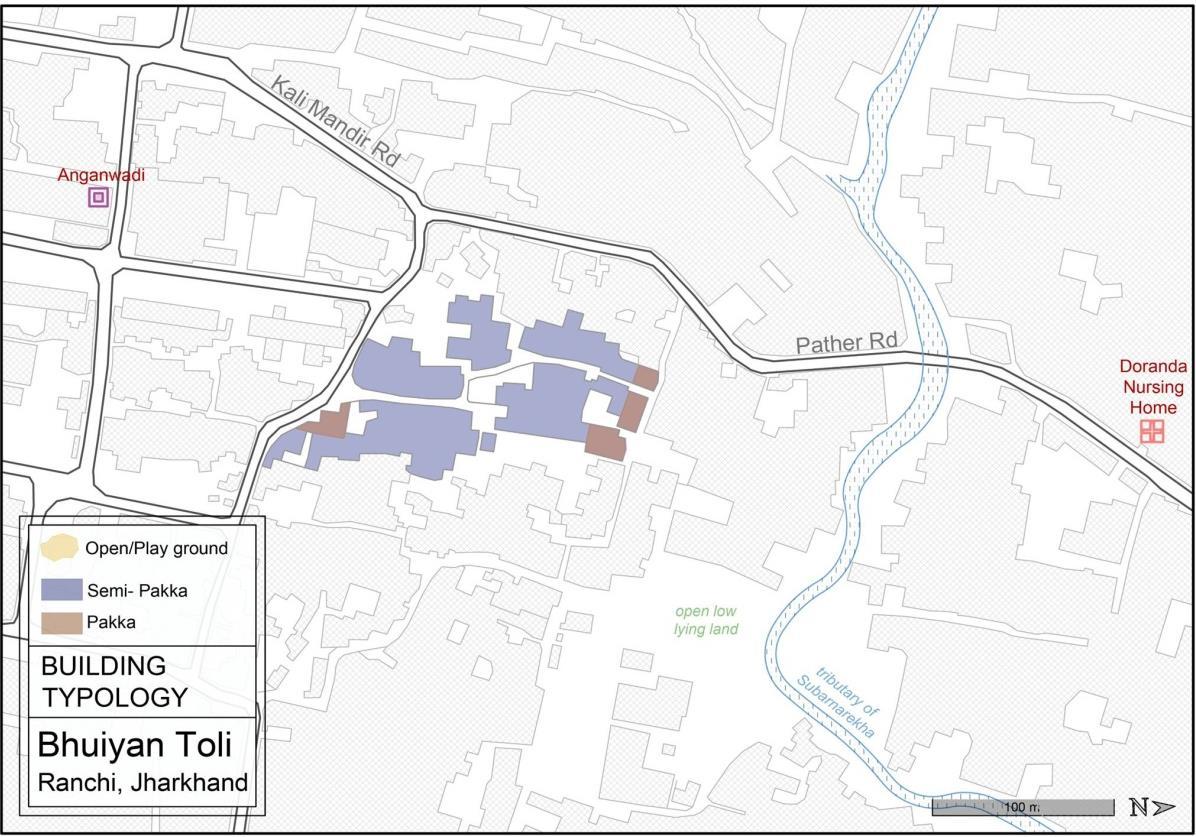
Map 25. Buildiing Typology
Houses are close together and do not have enough light and ventilation.Most of the houses have heat reflecting asbestos roofing.
SENSITIVITY: During summer the temperature goes as high as 42-42 degree Celsius. Productivity is affected especially in the case of livelihoods such as domestic work, municipality cleaners, vegetable vendors who are unable to get to work on time.
ADAPTIVE CAPACITY: Most of the houses have electricity but very few houses have appliances like fridge, cooler, inverter etc. During power cuts people sit on the verandas of houses.
Vulnerability
& Mapping 29
Assessment
Image: Roof& Wall Typology Source: MHT
Majority of the families in the slum (98%) have houses which are semi-pukka in nature and are situated very close to each other. Close to 96% of the houses have asbestos as roofing material while only 4% houses have RCC/concrete roofs. 47% of the households have walls made of brick with plaster.
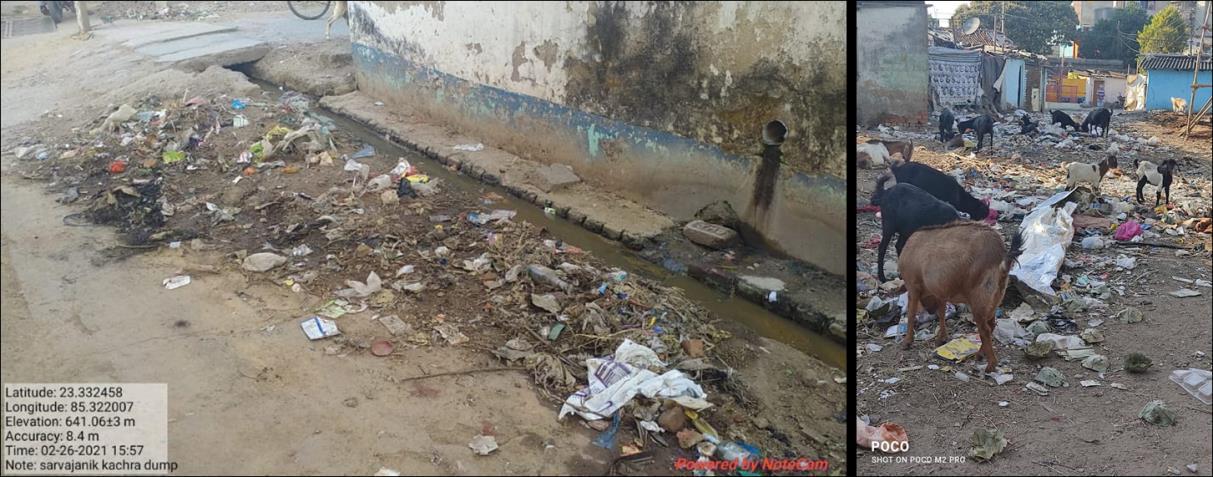
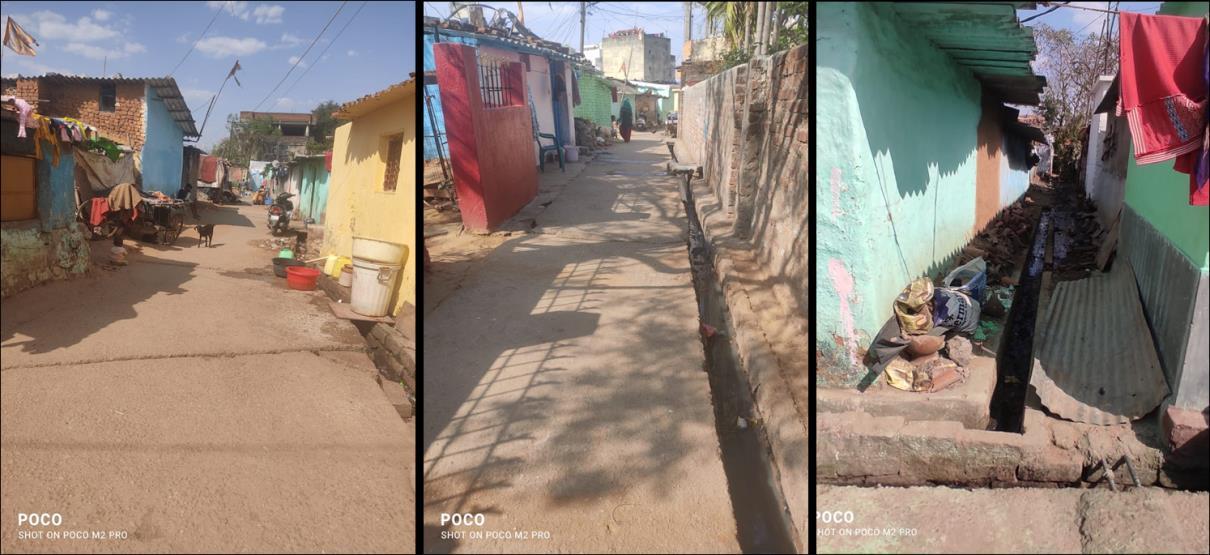
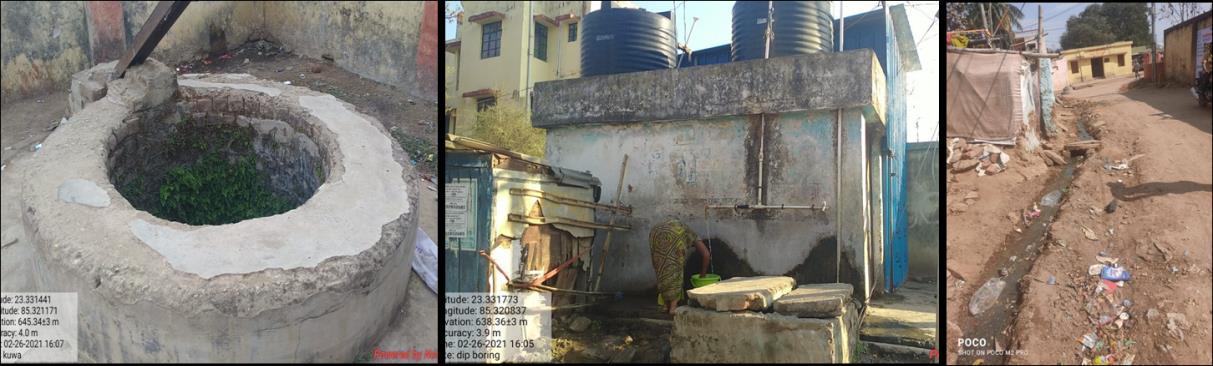
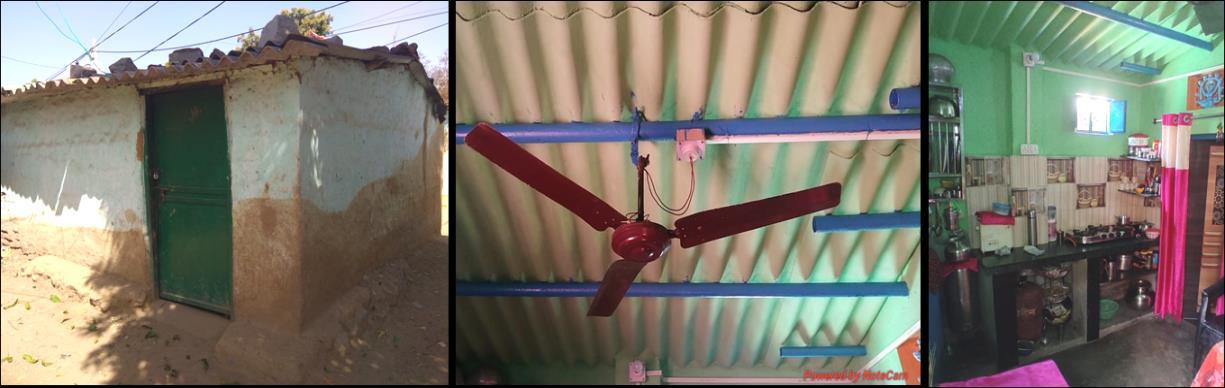
Image: Water amenities and Drainage Source: MHT
Image: Street Typology Source: MHT
Image: Solid waste disposal Source: MHT
Vulnerability Assessment & Mapping 30
HIGH VULNERABILITY ZONE:
Most of the settlement experiences a high vulnerability to heat stresses as the area has high built density and with materials that reflect heat.
HIGH VULNERABILITY ZONE
The surrounding high-rise apartments block the wind flow into the settlement area.
MEDIUM VULNERABILITY AREA
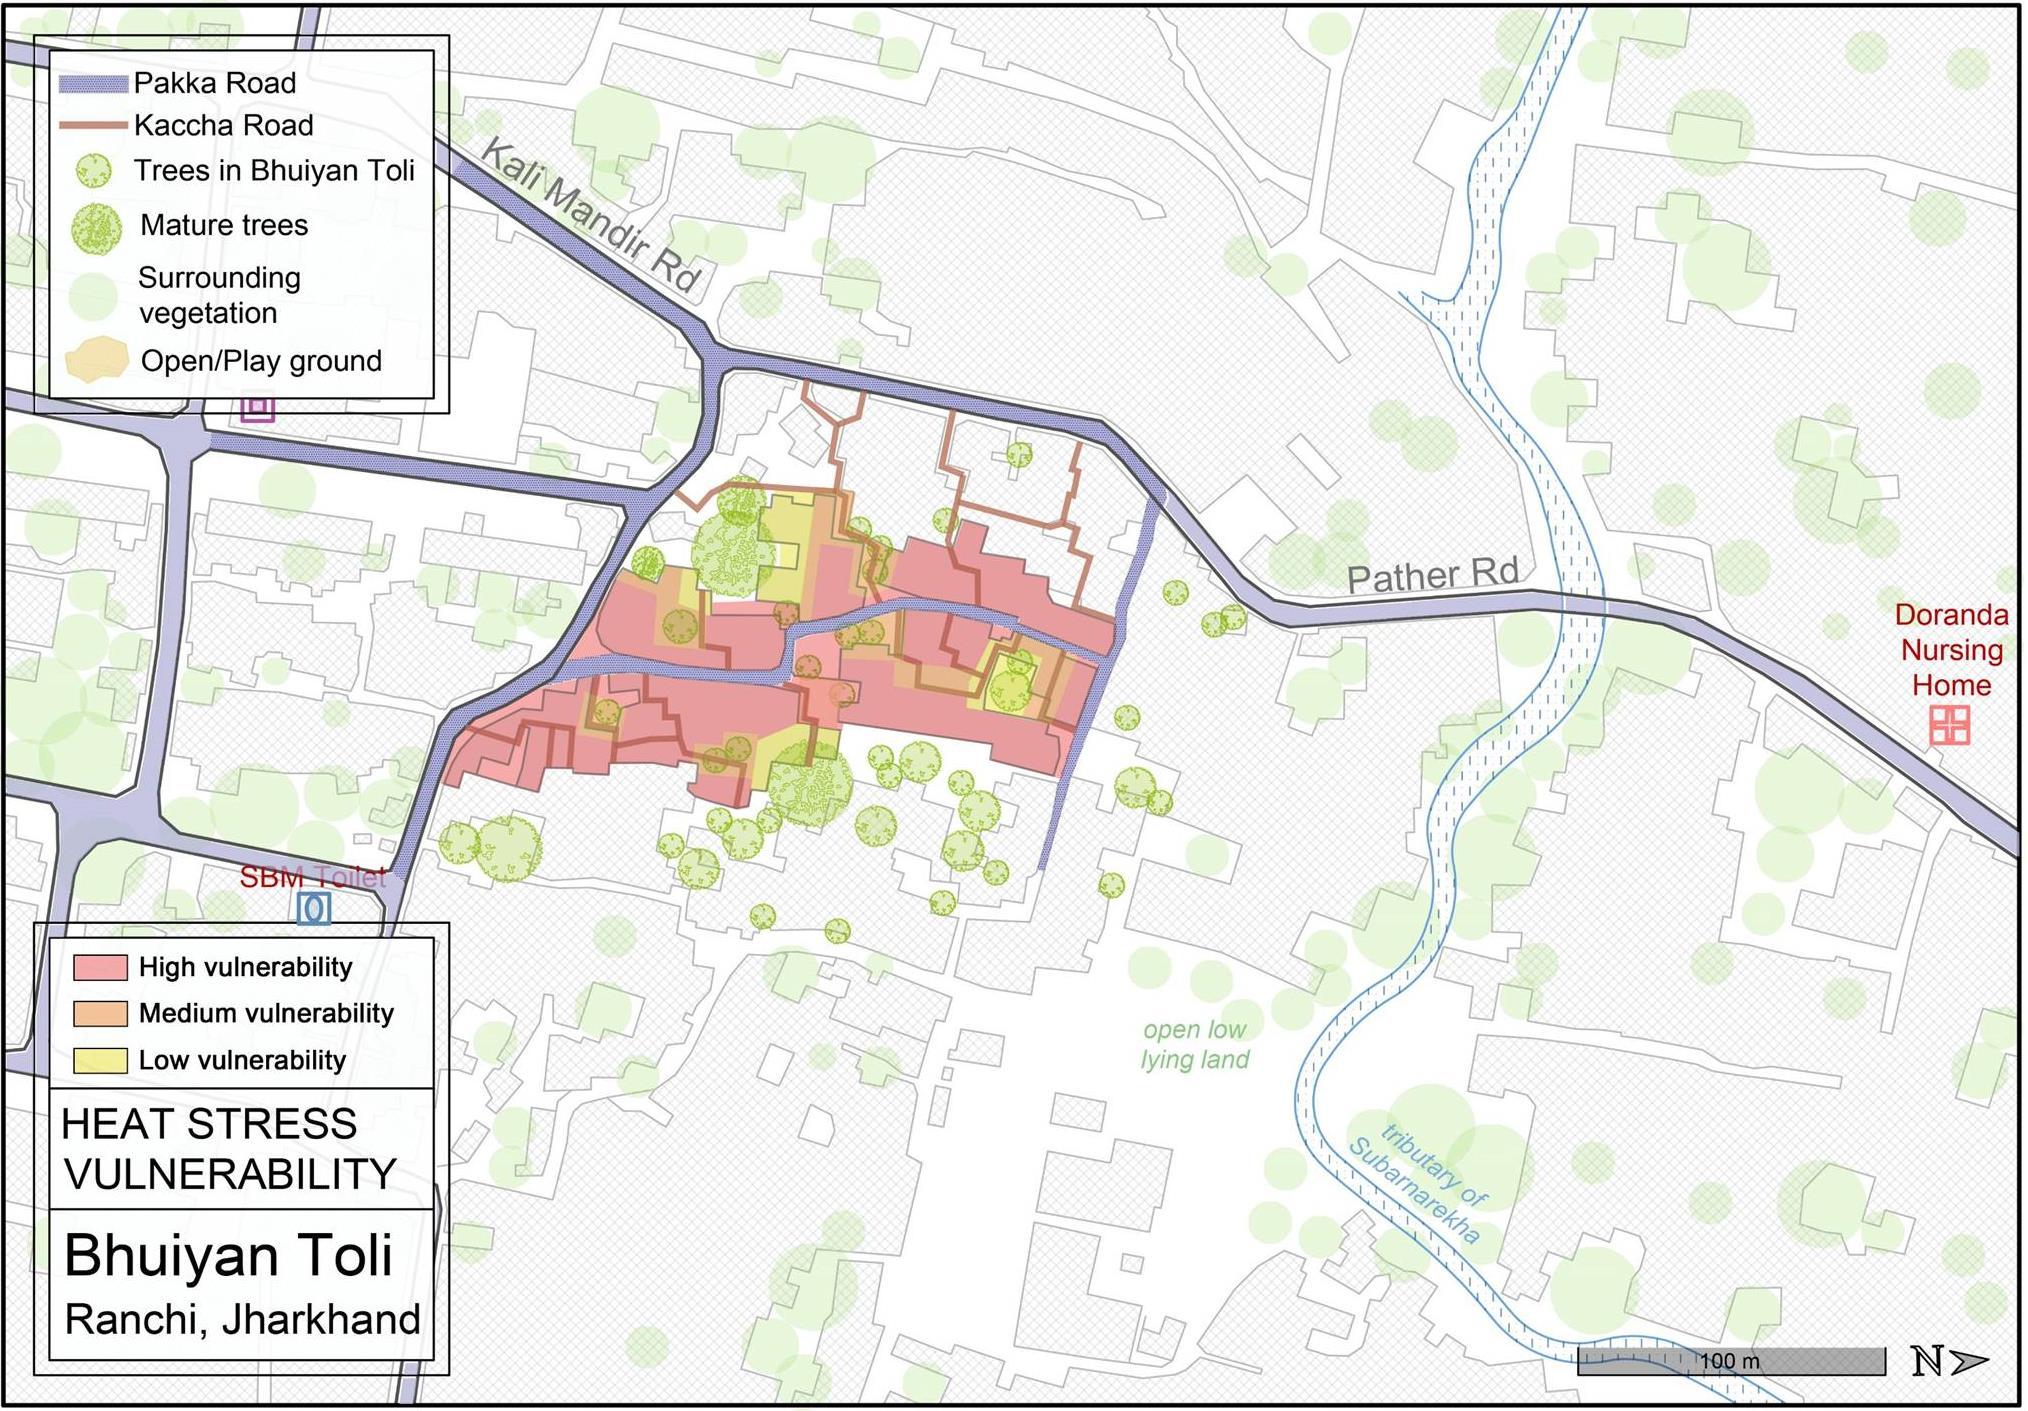
Sparse tree cover areas. Mutually shaded built zones.
LOW VULNERABILITY AREA
Area with dense tree cover. Areas with Porous ground cover.
Vulnerability Assessment & Mapping 31
Map 26. Heat stress vulnerability
Map 27. Water Logging
7.3.2. Water Logging Vulnerability
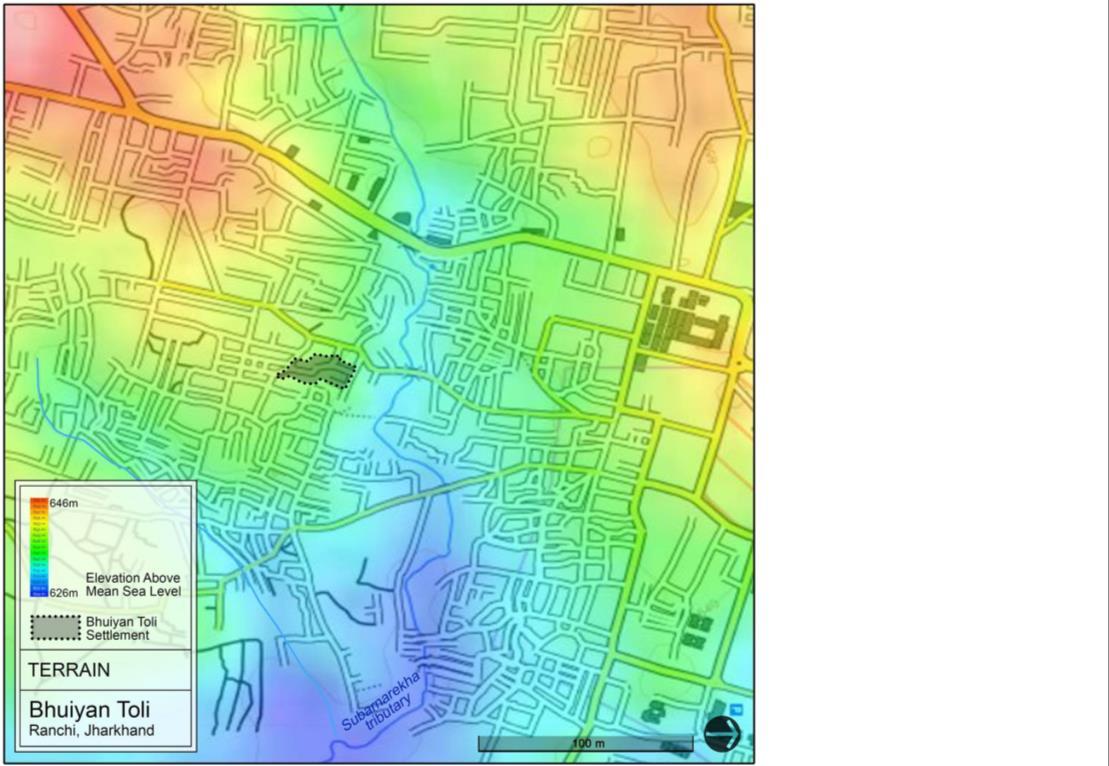
Spatial Factors Overlaid for assessing Water Logging 1. Topography
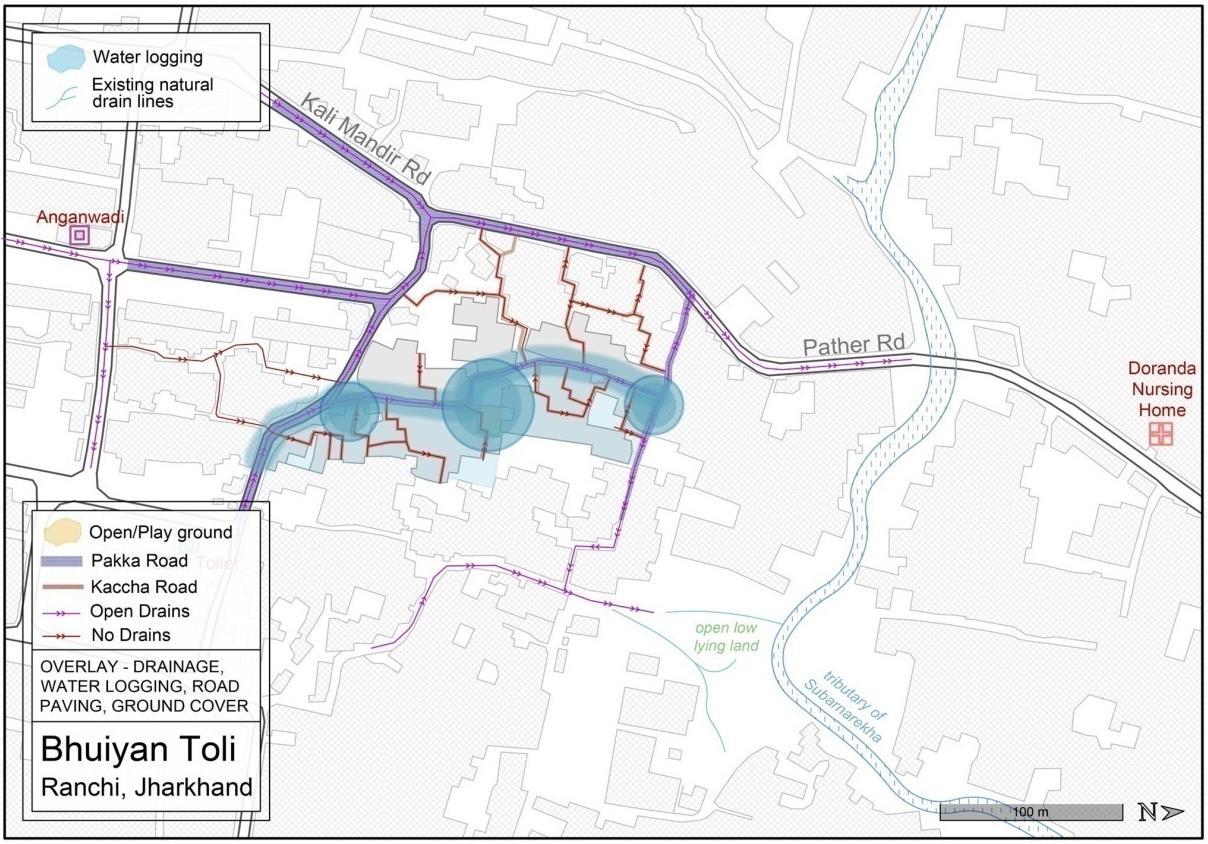
Drainage Lines
Kaccha/Pakka Roads
Permeable ground
Water Collection areas (as reported in social mapping)
EXPOSURE: Water logging has been reported as a major problem not only during rainy season but throughout the year. The problem of water logging has increased from previous years due to the increase in built fabric surrounding the settlement which disrupts the natural drainage flows. The roads are unpaved except for the main road which has open drains.
Map 28. Terrain
The water from these drains frequently enters houses because there is no gutter line for the water to flow out. This increases susceptibility to vector borne diseases such as malaria, dengue, typhoid, diarrhoea and jaundice
SENSITIVITY: Due to the location of the settlement close to the tributary it receives run-off from a larger catchment area. Water logging affects access to workplaces and schools.
ADAPTIVE CAPACITY: The municipality cleans the nalla once in 15 days and sprinkles bleaching powder. Residents also organize to clean the nalla from time to time. However, awareness on vector borne diseases is less.
Vulnerability Assessment & Mapping 32
3.
4.
5.
2.
HIGH VULNERABILITY ZONE
Settlement area that frequently reports water logging problem
HIGH VULNERABILITY AREA
Paved Road, Open drain, Exceeded Capacity
HIGH VULNERABILITY AREA
No adequate outlet for water from the drains to flow out
HIGH VULNERABILITY AREA
Open spaces affected by overflow of drains
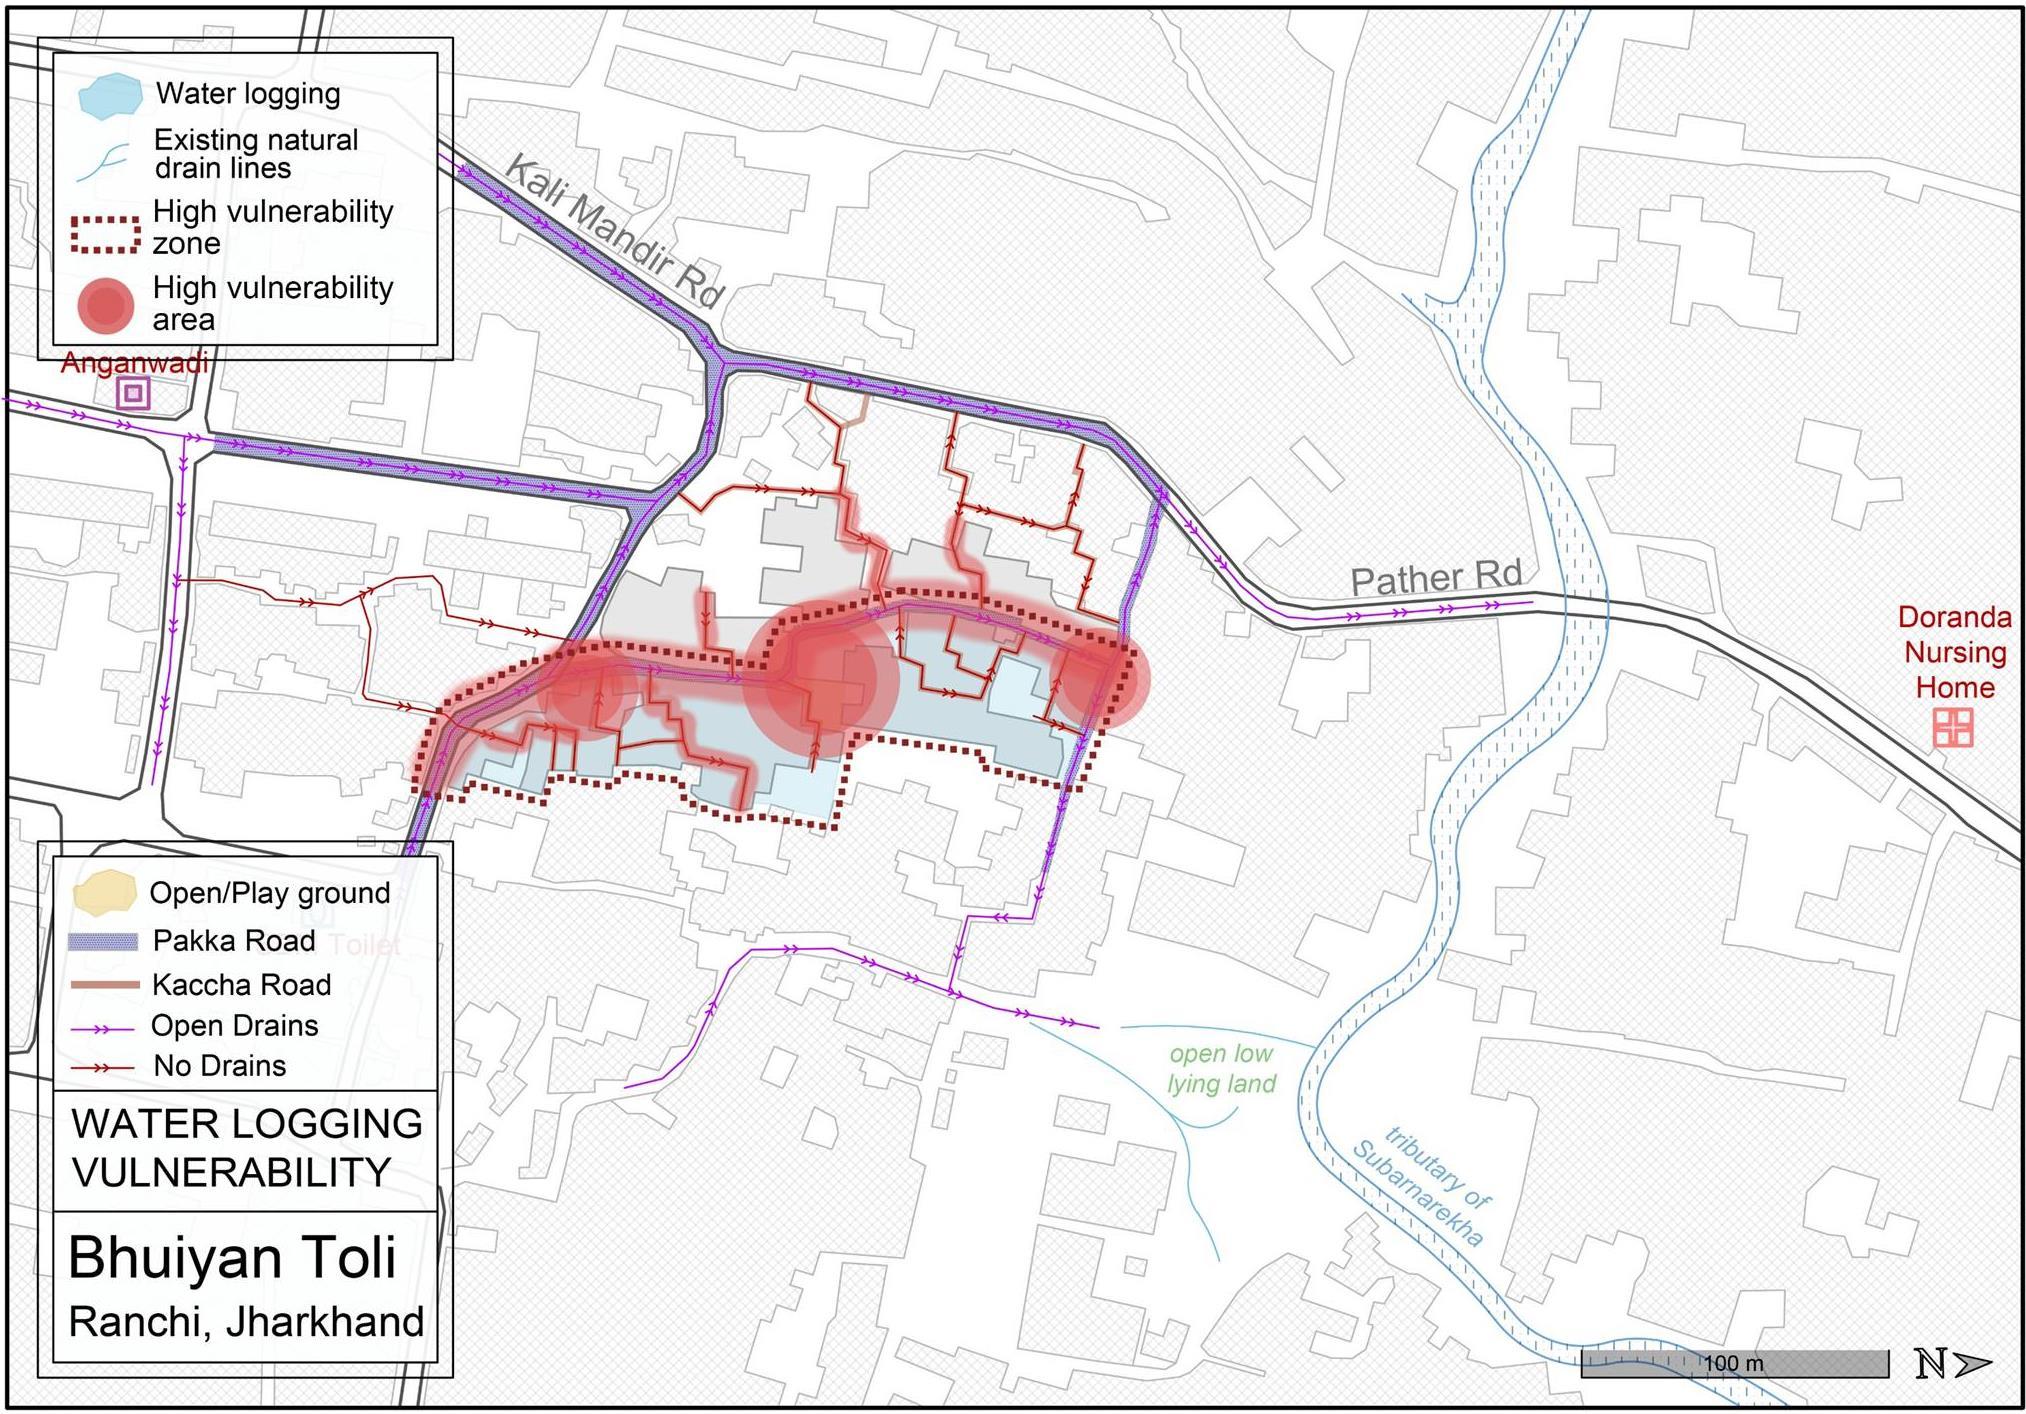
HIGH VULNERABILITY AREA
Water flow path without drain provision
Vulnerability Assessment & Mapping 33
Map 29. Water logging vulnerability
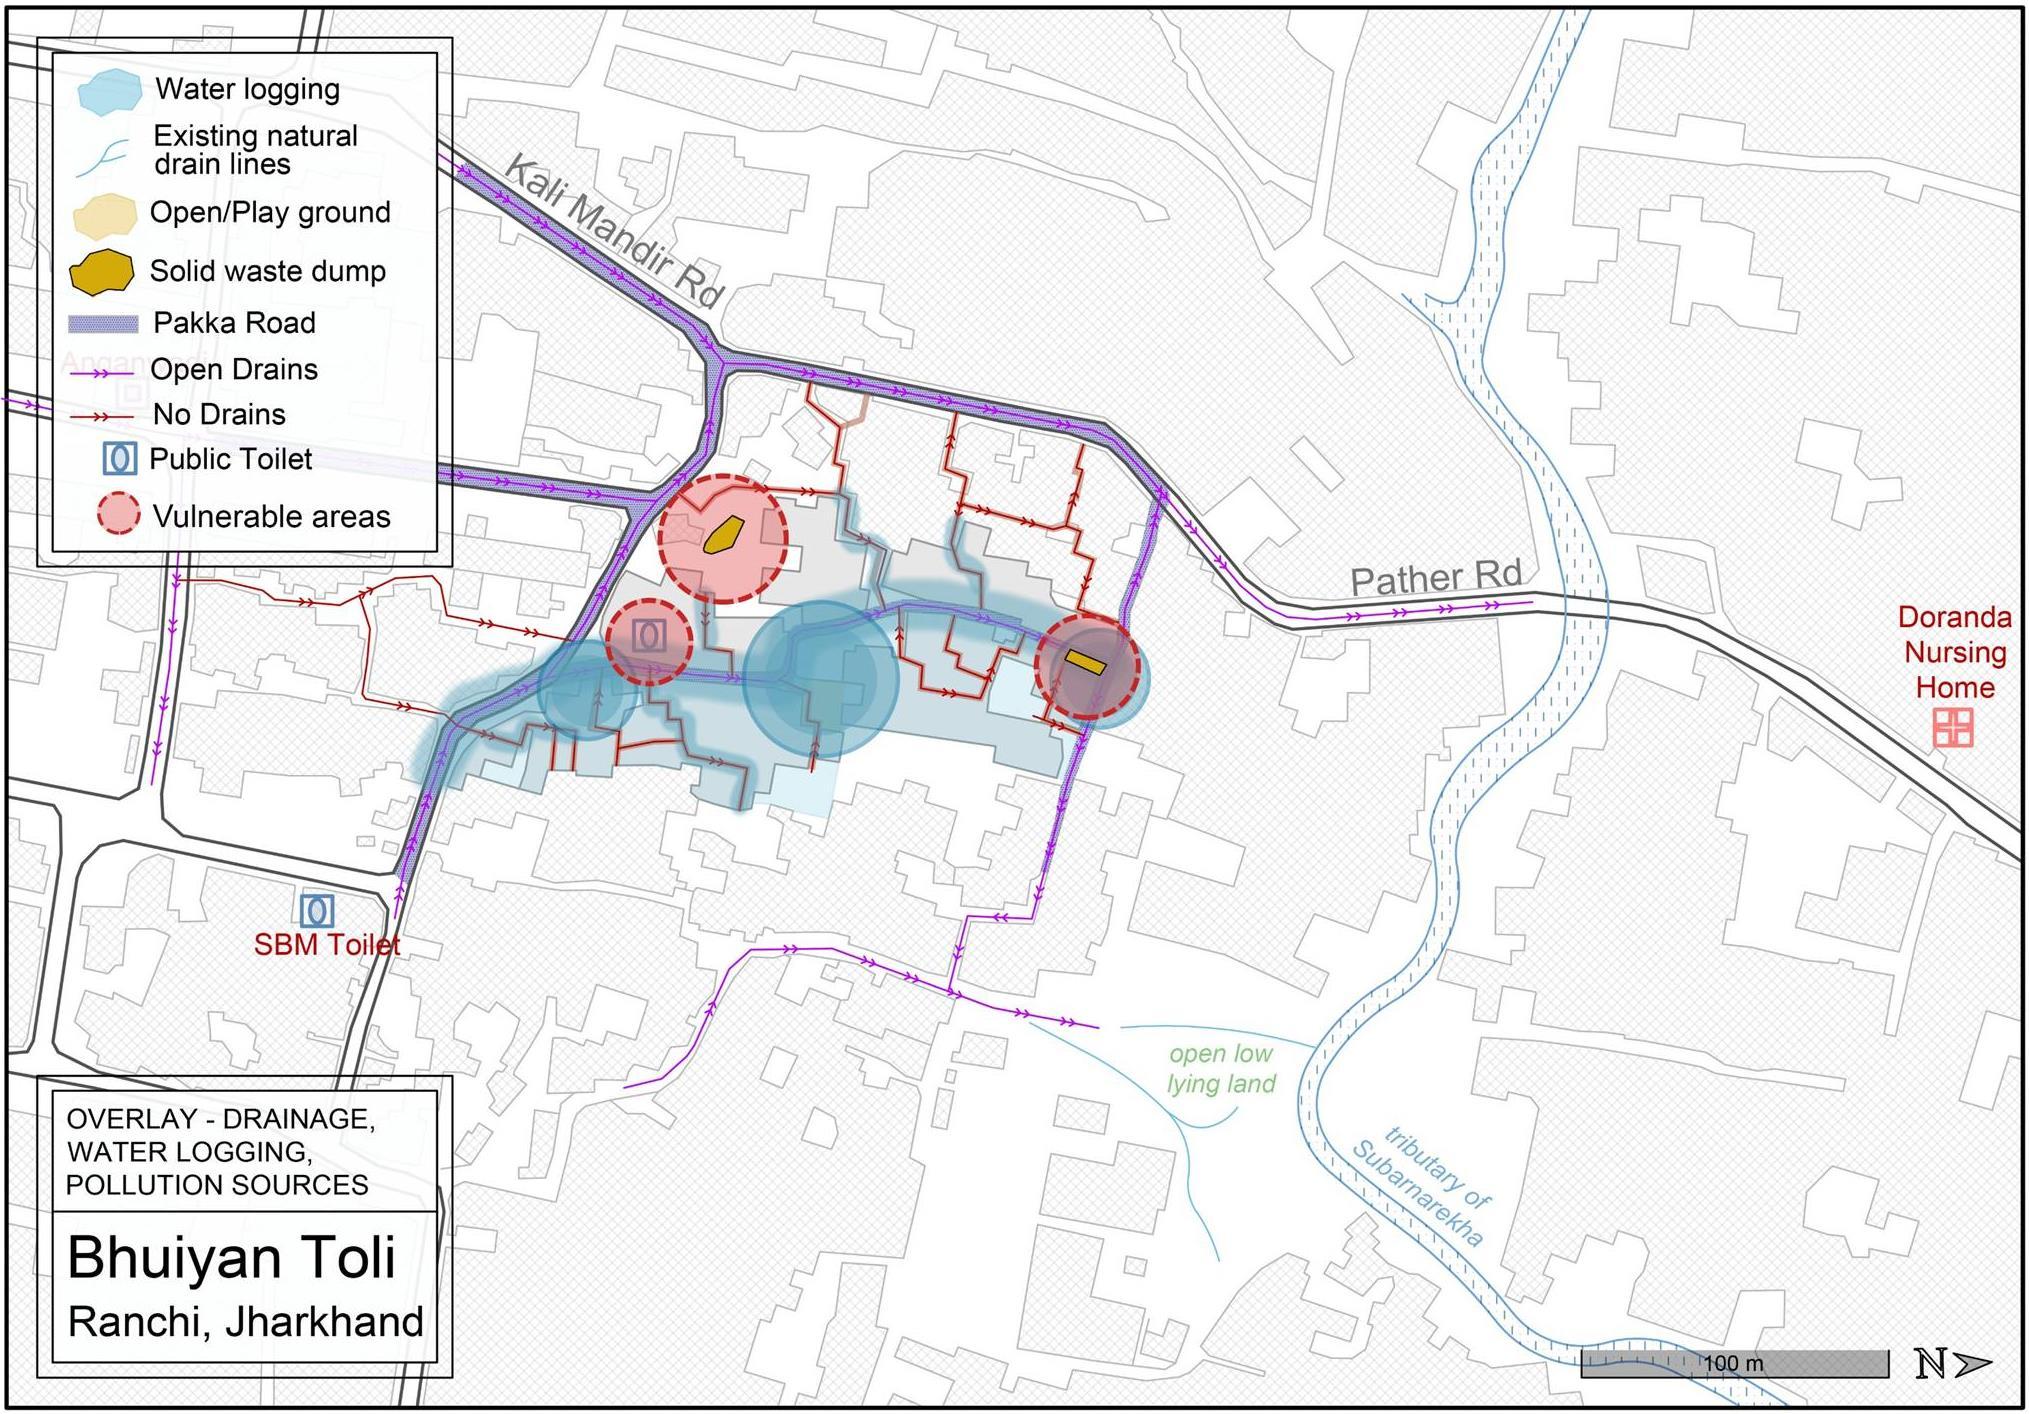
7.3.3. Vector Born Disease Vulnerability
In the past, the residents of Bhuiyan Toli faced a lot of difficulties due to breeding of mosquitoes in the slum, reasons being frequent incidences of water logging, absence of solid waste collection mechanism and prevalence of open defecation in the slum. However, now RMC has been taking steps to minimizemosquitobreeding by cleaning the open drains once in month.
HIGH VULNERABILITY AREA
Areas where water logging and major pollution sources overlap.
HIGH VULNERABILITY AREA
Areas where water logging and major pollution sources overlap along with households in close proximity.
Other water logging areas are also prone to spread of vector borne diseases.
Vulnerability Assessment & Mapping 34
Map 30. Vector Borne disease vulnerability
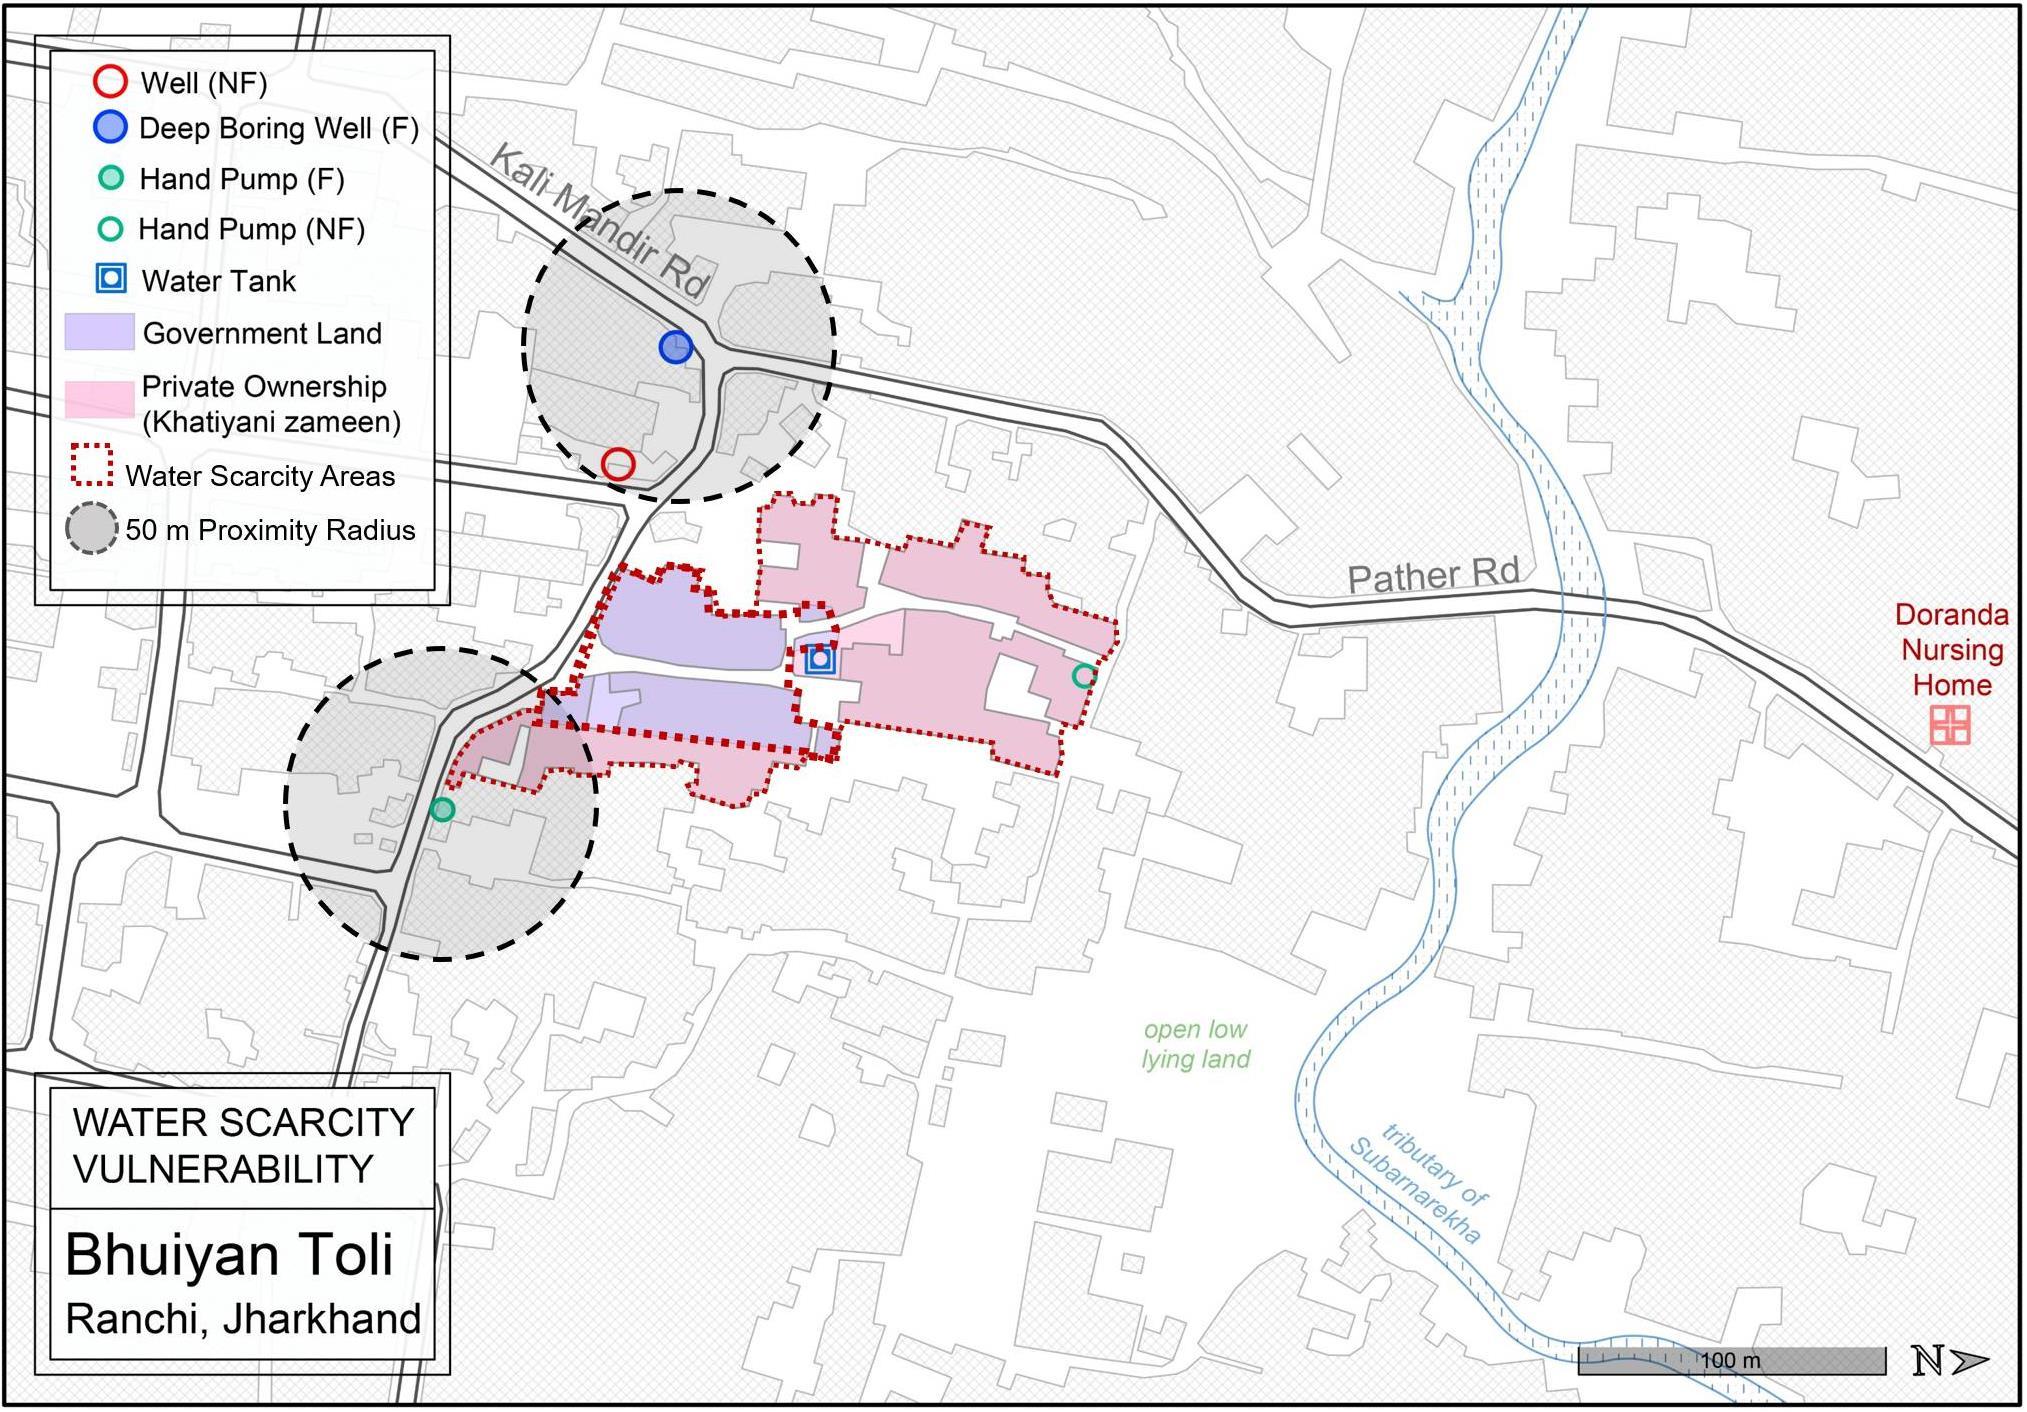
7.3.4. Water Scarcity Vulnerability
EXPOSURE: Water scarcity problem has been persisting in the slum for a long time. HHs mostly depend on illegal water connections. During summer, handpumps and borewells located outside the settlement are depended on.
SENSITIVITY: Residents are afraid of the Nagar Nigam finding out about the illegal connections. There are social problems in accessing water sources like handpumps and borewells in surrounding areas, due to existing discrimination against the community based on caste and economic identity
ADAPTIVE CAPACITY: For people staying on government land, since they pay holding tax, they are provided water services on a holding basis. Further, 30% HH are in the process of getting their connections legalized.
Vulnerability Assessment & Mapping 35 Map 31.
Water Stress vulnerability
7.3.5. Access to Health Facilities - Vulnerability
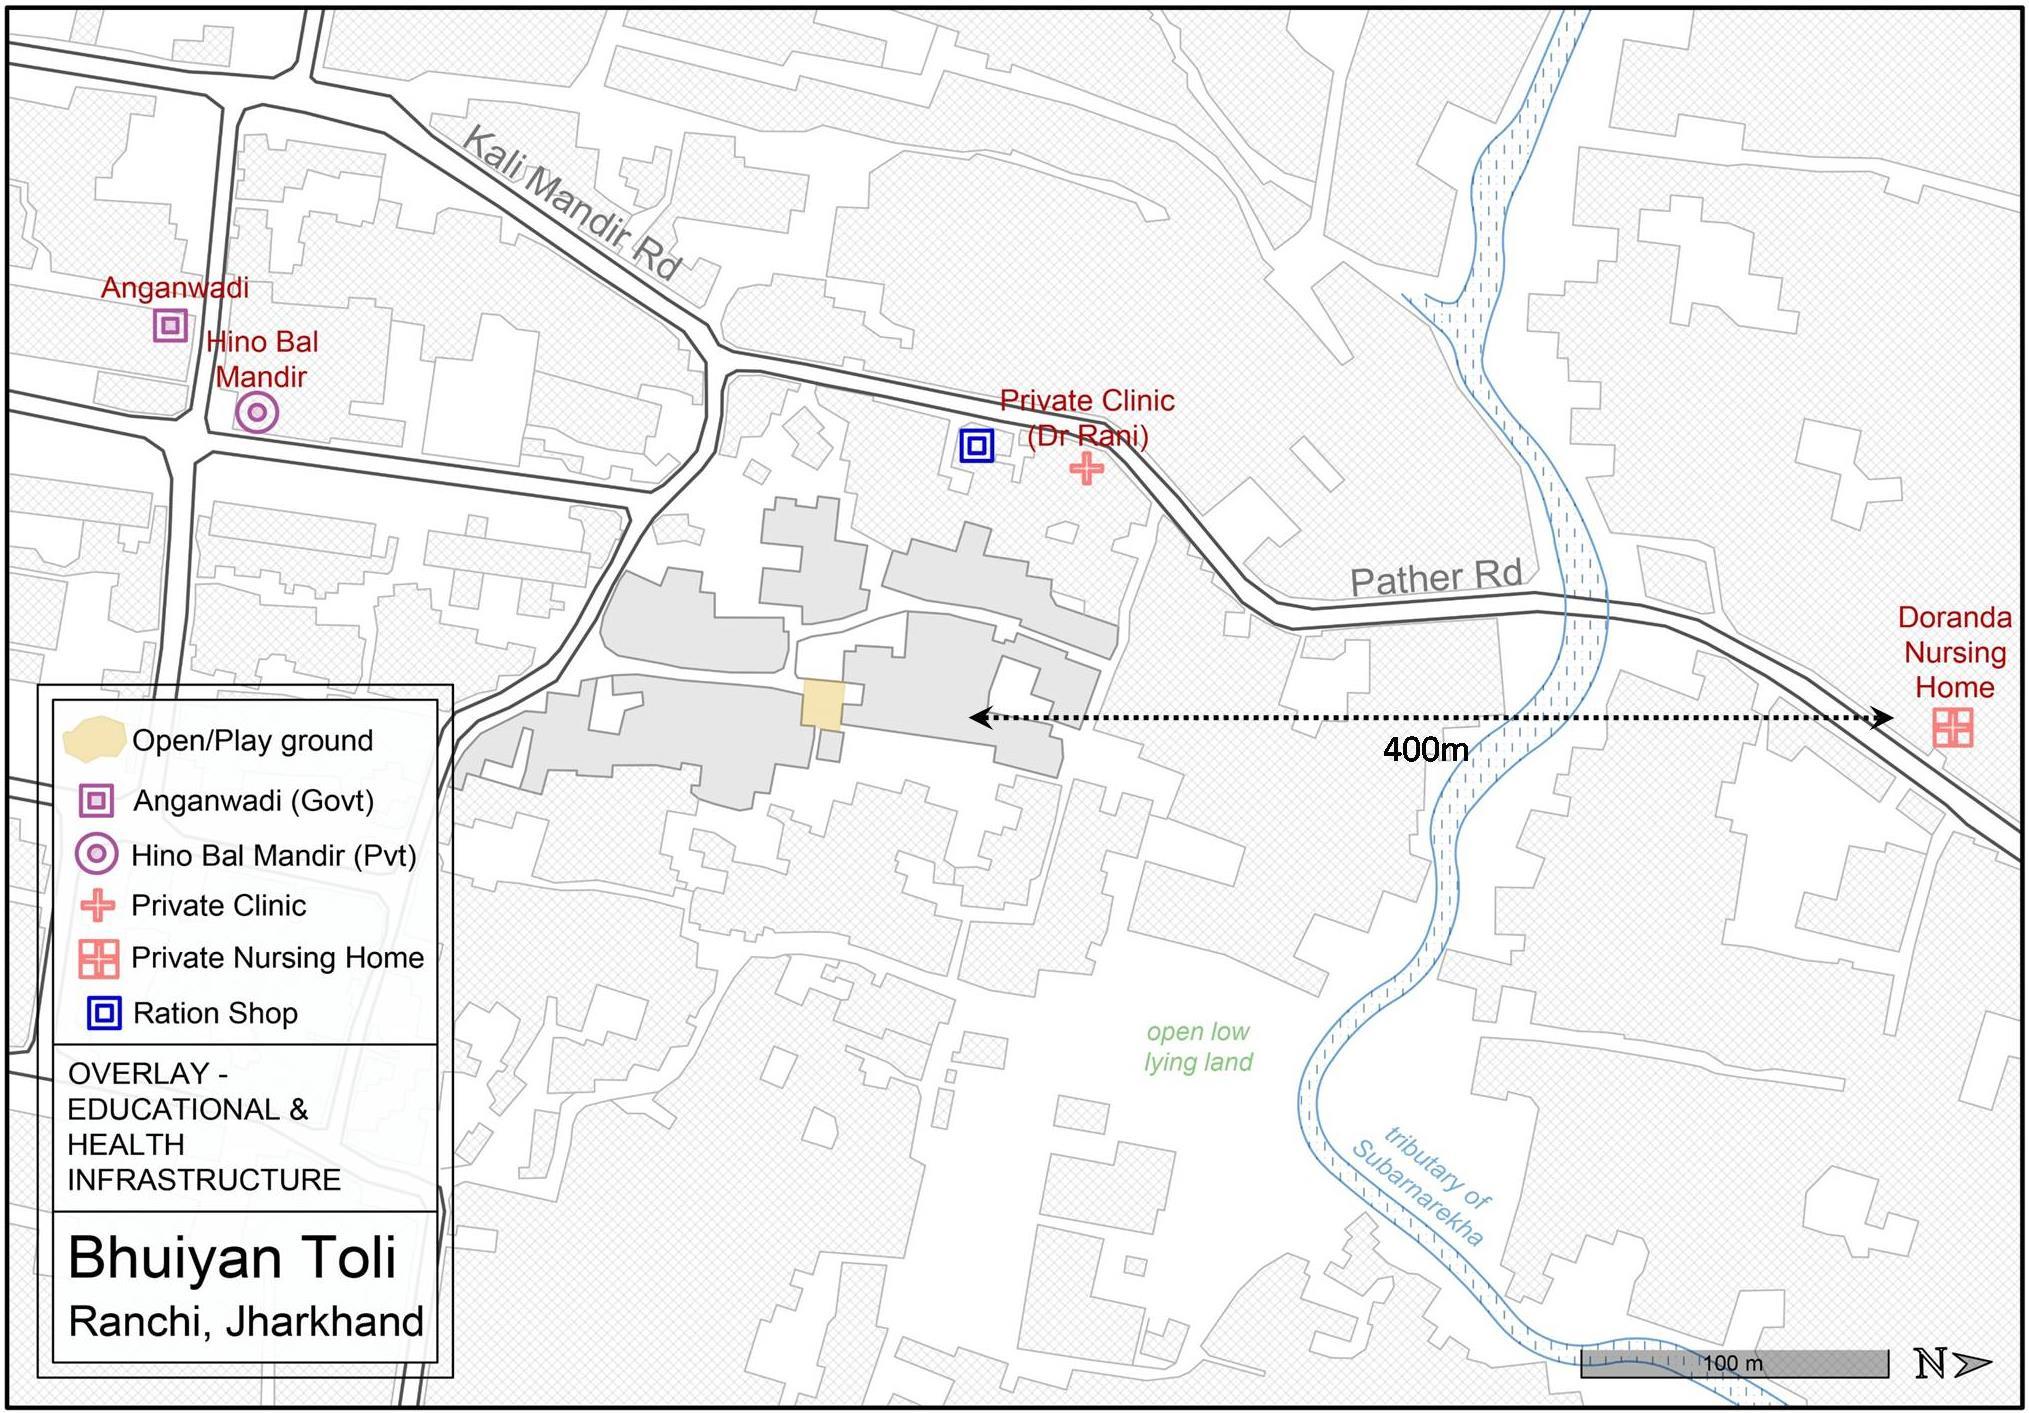
Within the settlement aganwadis act as health infrastructure with ASHA workers using the space for immunization and check-ups on pregnant women. The ration shops in the settlement also sell medicines often without prescription. More than proximity, the problem of access to health amenities is more salient. Access to health facilities is through walking, auto or private vehicle since there is no bus service available. The aganwadi is 5mins away which is difficult for pregnant mothers, mothers with new-born children to access. Further, there are social barriers to access, due to underlying discrimination based on their economic and social identity.
Vulnerability Assessment & Mapping 36 Map 32. Access to Health
facilities
Map 33. Access to Health facilities - Regional scale
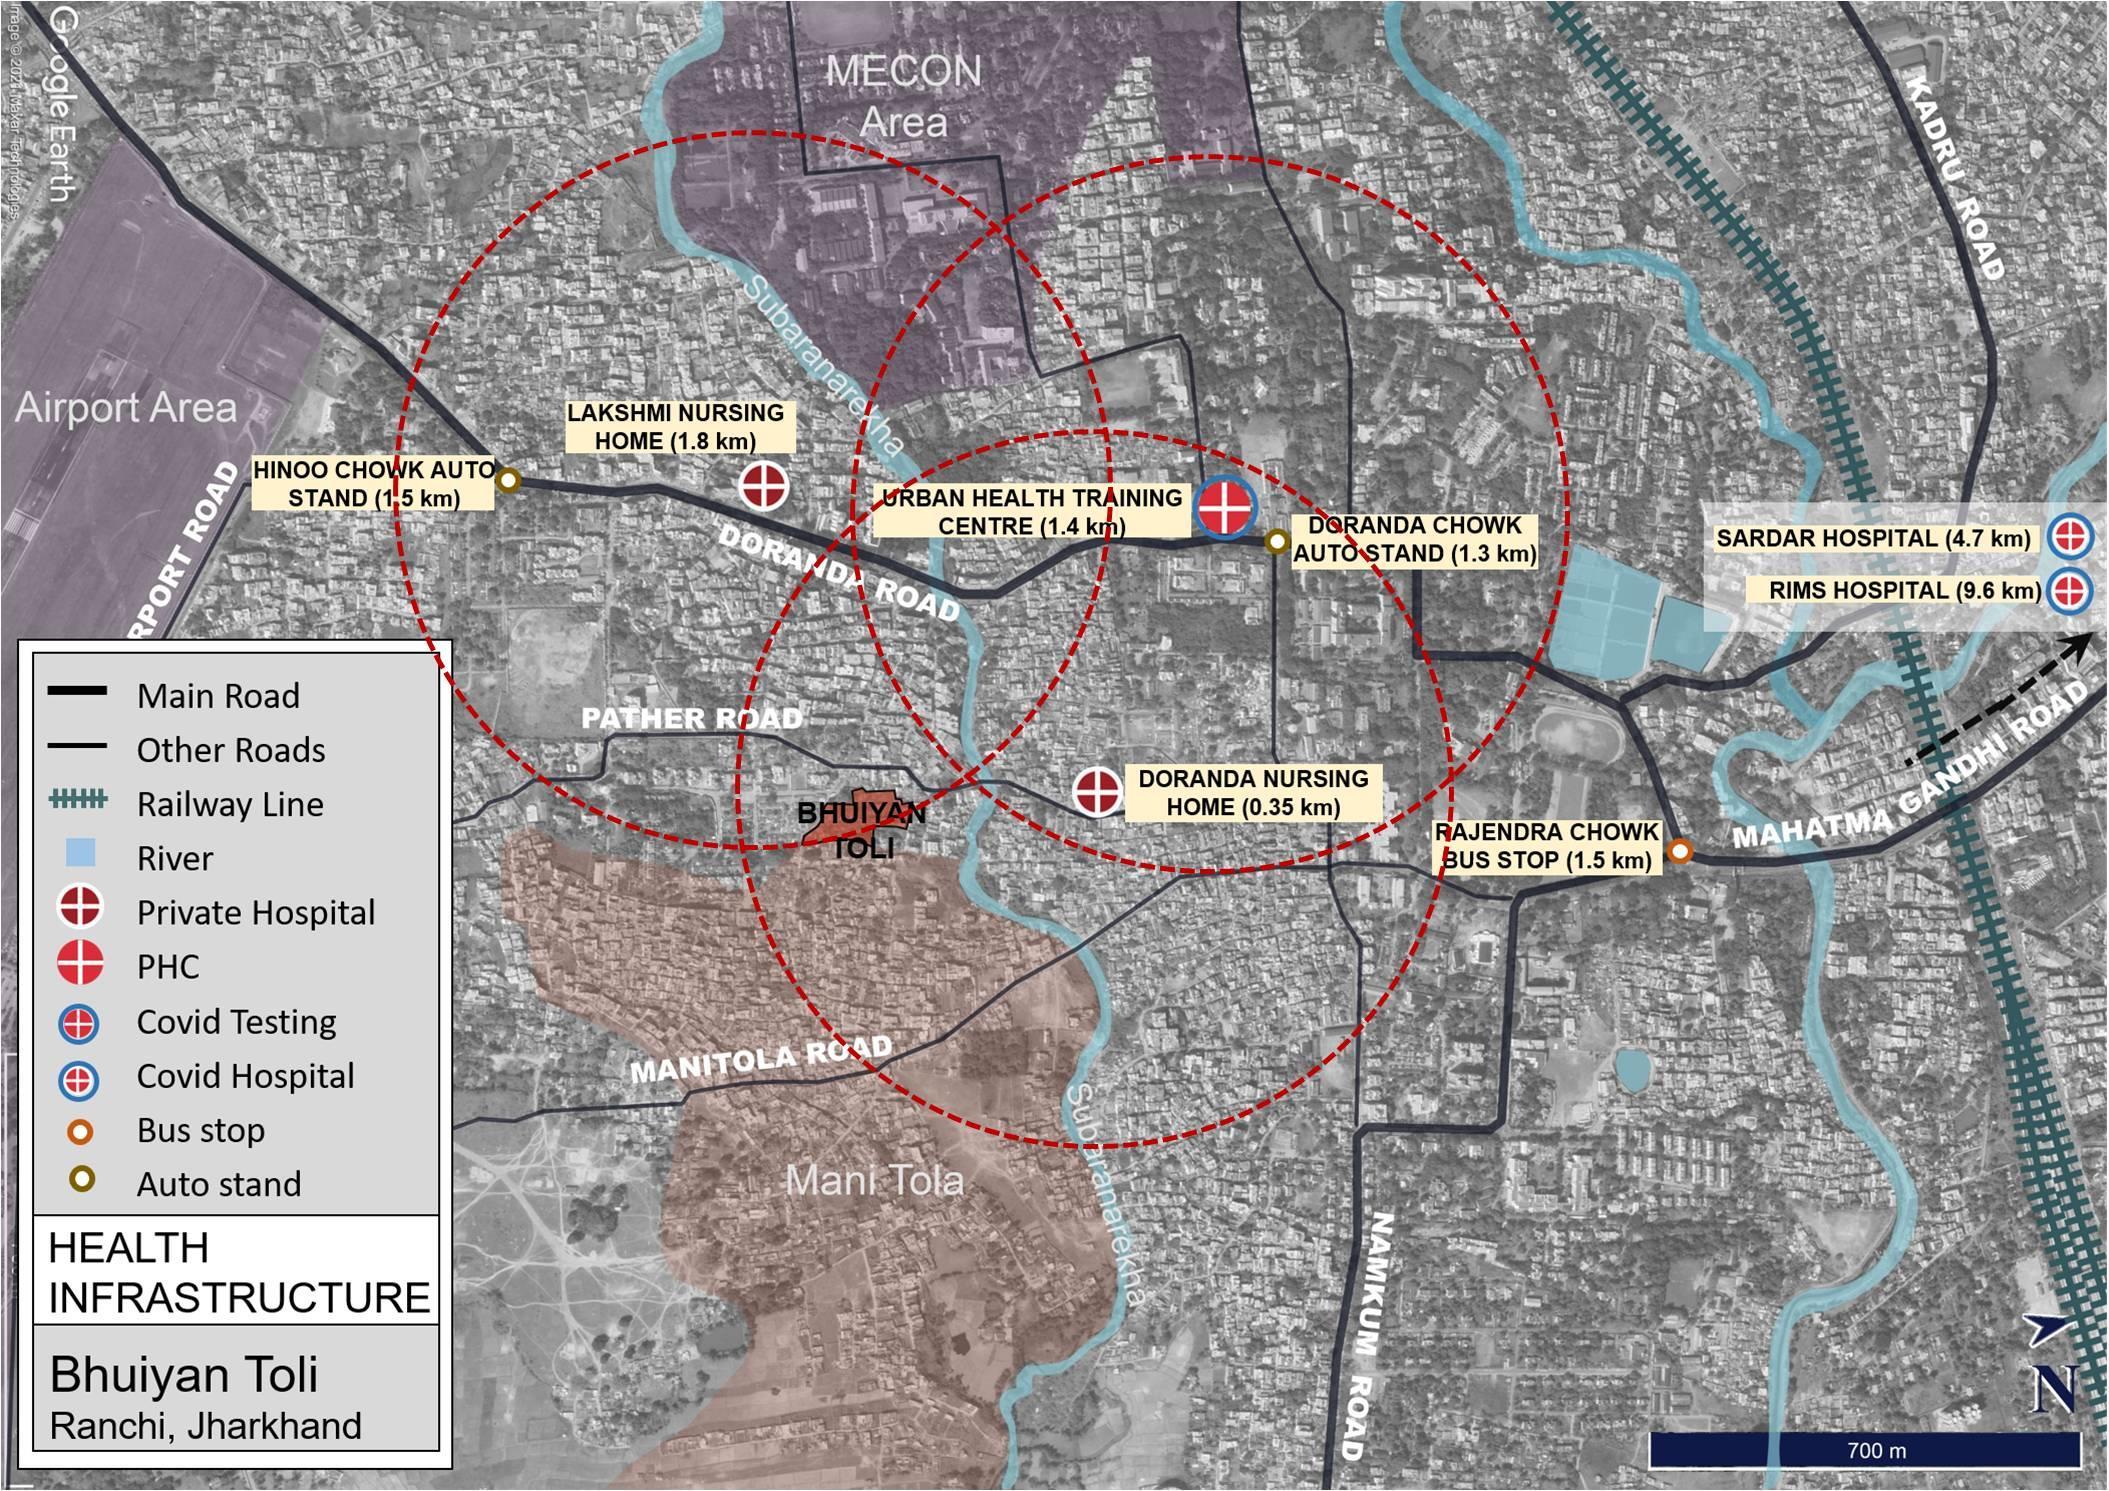
Satellite image source: Google Earth
PROXIMITY: As per URDPFI and NHM standards, average population served by:
• Nursing Home (25-30 beds)- 45,000
• Primary Health Centre –30,000
Considering a population density of 373 persons per hectare the approx. radius served by the facilities will be
• Nursing Home (25-30 beds)- 0.6 km
• Primary Health Centre –0.5 km
Therefore, in terms of proximity to health services the settlement is adequately provided for.
ACCESS: However, accessibility to health facilities is severely curtailed due to lack of bus services. The nearest bus stop to the settlement is 1.5 km away and the nearest auto stand is 0.75 km away.
Vulnerability Assessment & Mapping 37
Vulnerability Assessment & Mapping 38 Image source: MHT SETTLEMENT 03: CHAPU
TOLI
Map 34. Sattelite Image of Chapu Toli with key landmarks.
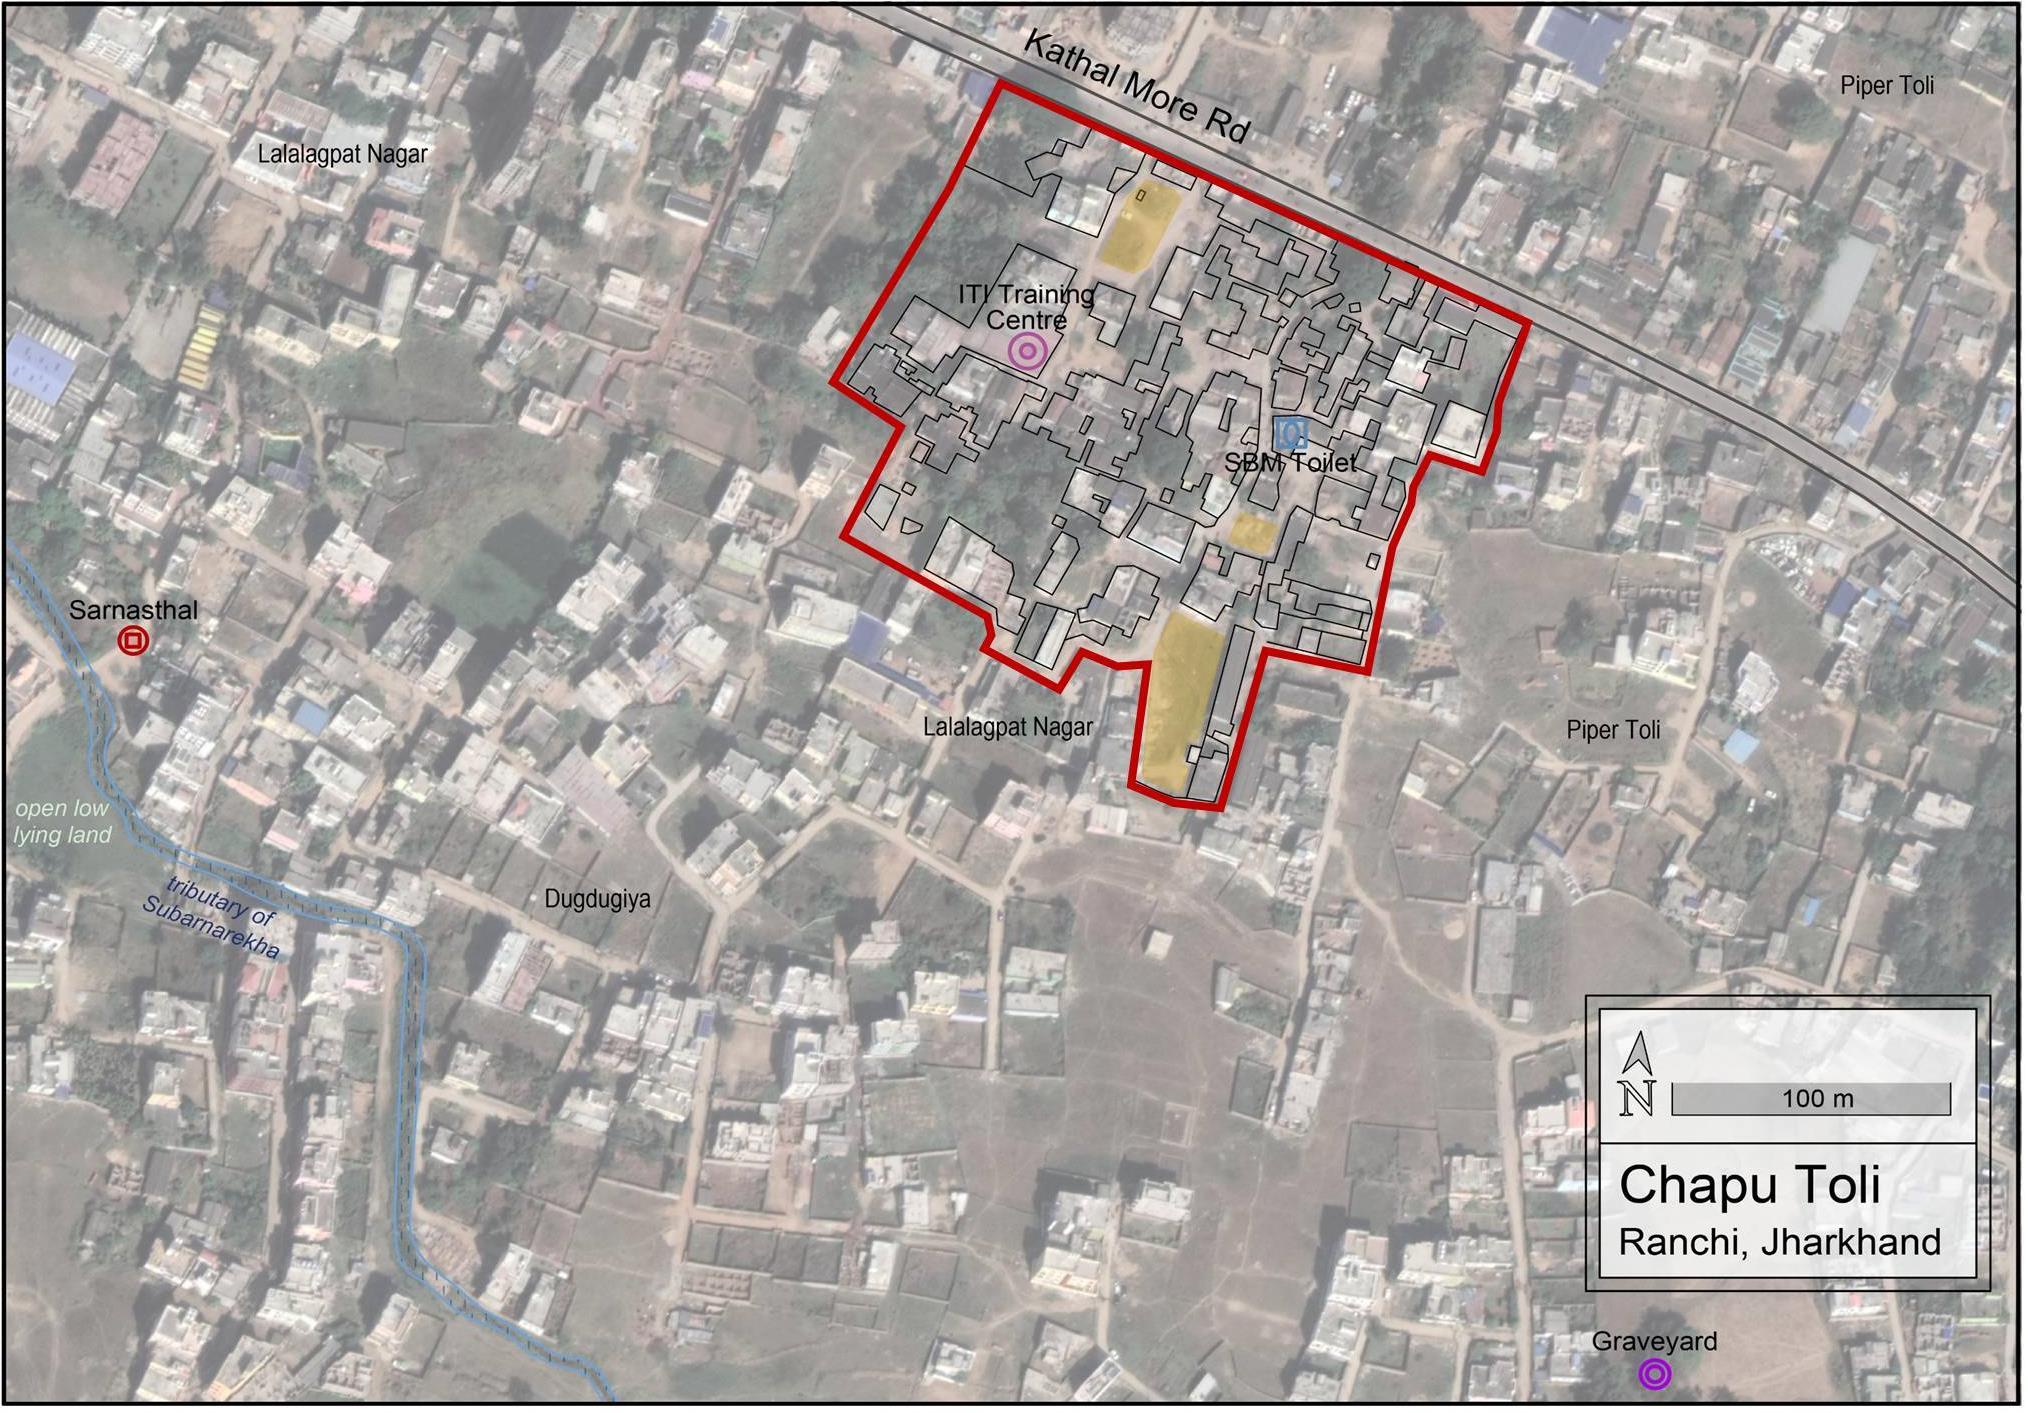
Satellite image source: Google Earth
8.
VULNERABILITY ASSESMENT OF
CHAPU TOLI
The slum ChapuToli is located in the Ward no. 36 of Ranchi Municipal Corporation and is connected by Kathal More Road.As per the household listing survey, ChapuToli houses 371 people, covering an area of about 3.7 hectares. The slum is around 50 years old and is surrounded by slums like DugdugiyaToli and Pipartoli.There is also an Industrial Training Institute(ITI) located in the slum which offers trade courses related to Electrical, Fitter and Mechanical work.The general occupations that residents of this slum are engaged in are construction workers, domestic workers, and street vendors.
Vulnerability Assessment & Mapping 39
8.1. Social Profile
8.1.1. Demographics
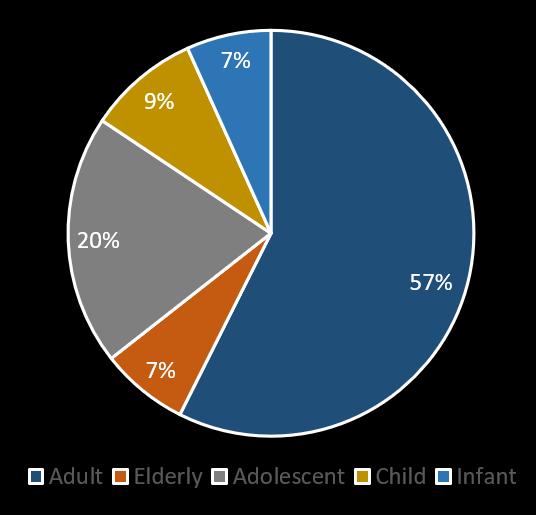
ChapuToli has a total population of 371 out of which 196 are males and 175 are females. In terms of age distribution 57% of the population (213 people) fall under the age-group of 18-60 years and nearly 20% of the population (74) are adolescents falling under the age group of 11-17 years.Average family size is 5.9.
8.1.2. Livelihood
The general occupations that the residents of ChapuToli are engaged in are construction work, domestic work and street vending. The men are usually engaged as skilled construction worker, driver, street vending, small shop owners, etc. Average monthly family income, considering incomes of all earning members ranges between INR 7000 – 10,000.
Change in Livelihood Patterns: The occupations in the slum have shifted from primary sector in the past to the tertiary sector now. A considerable proportion of families (35-40%) were engaged in farming in the past. However, they gradually shifted out from it due to lack of irrigation facilities and due to shrinking of the river tributary. This resulted in incomes getting lower and the residents were unable to run their houses comfortably, which is why they started selling off lands and getting engaged in manual labour such as construction labourers, domestic helpers, etc.
Impact of COVID- 19: Most of the residents did not get work during the lockdown. Some of the domestic workers were allowed to work. Due to loss of incomes, the residents had to struggle to fulfil even the basic necessities.After the lockdown, as the markets have opened, residents have resumedtheir work. However, the amounts of work and incomes have reduced for certain occupations such as domestic work, construction work, street vending, etc.As the people have stopped preferring outside food, street vendors have also witnessed reduction in demand. The average household monthly income of the residents has reduced to INR 6000-8000 post COVID-19.The prices of commodities/groceries and transportation costs have also increased post COVID19. 4-5 elderly females, who were engaged in domestic work or construction work became unemployed as the employers were well aware that they are at a higher risk of COVID-19. None of the residents changed their occupations post COVID-19 owing to the low literacy and limited skills that they possess.

Vulnerability Assessment & Mapping 40
5: Gender Composition Graphic 6: Age Distribution
Graphic
Vulnerability Assessment & Mapping 41
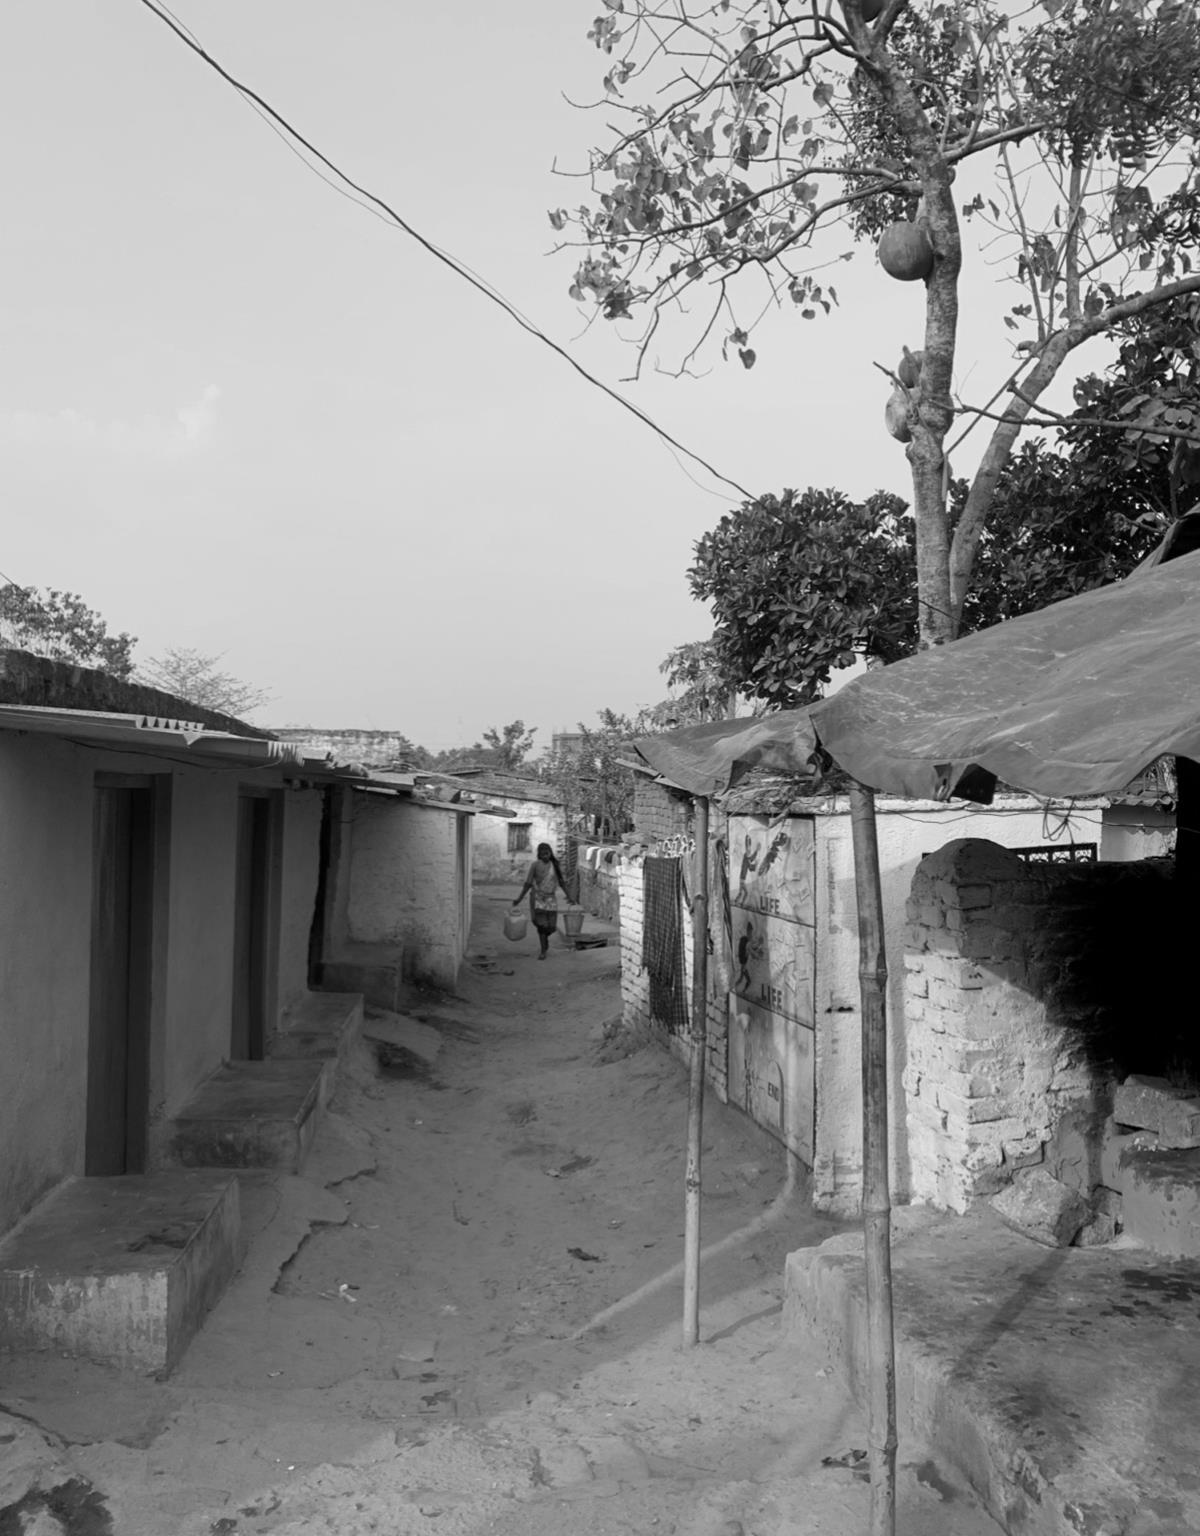
8.1.3. Change Over Years
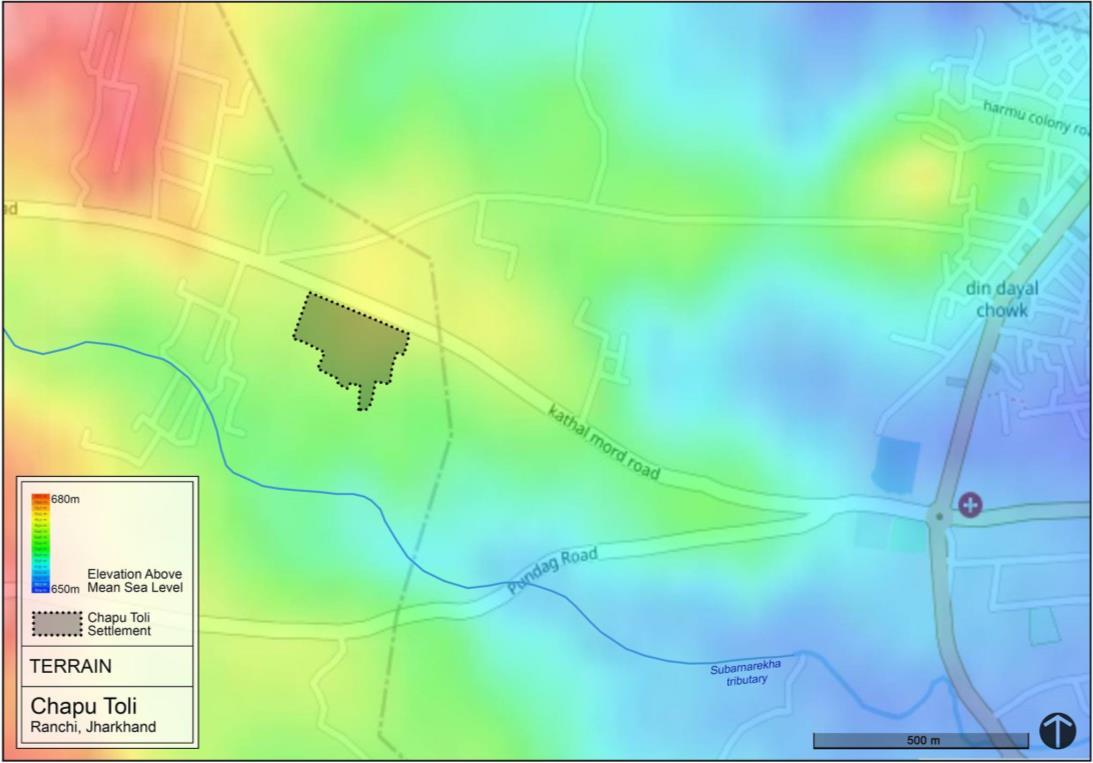
As is visible in the pictures, the region has witnessed substantial conversion of agricultural land into plotted residential development. Since the area is close to the Subarnarekha tributary this has implication for water drainage patterns of the settlement and the city as a whole. The surrounding built fabric is marked by its high-rise, low density character.
8.1.4. Caste and Ownership
75.64% households belong to Scheduled Tribes (ST), 20.50%, households belong to General Category, 1.28% households belong to Scheduled Castes (SC) and 2.56% HHs belong to OBCs. As seen in the map, ST HHs are distributed in the central areas of the settlement and General HHs in the edges.
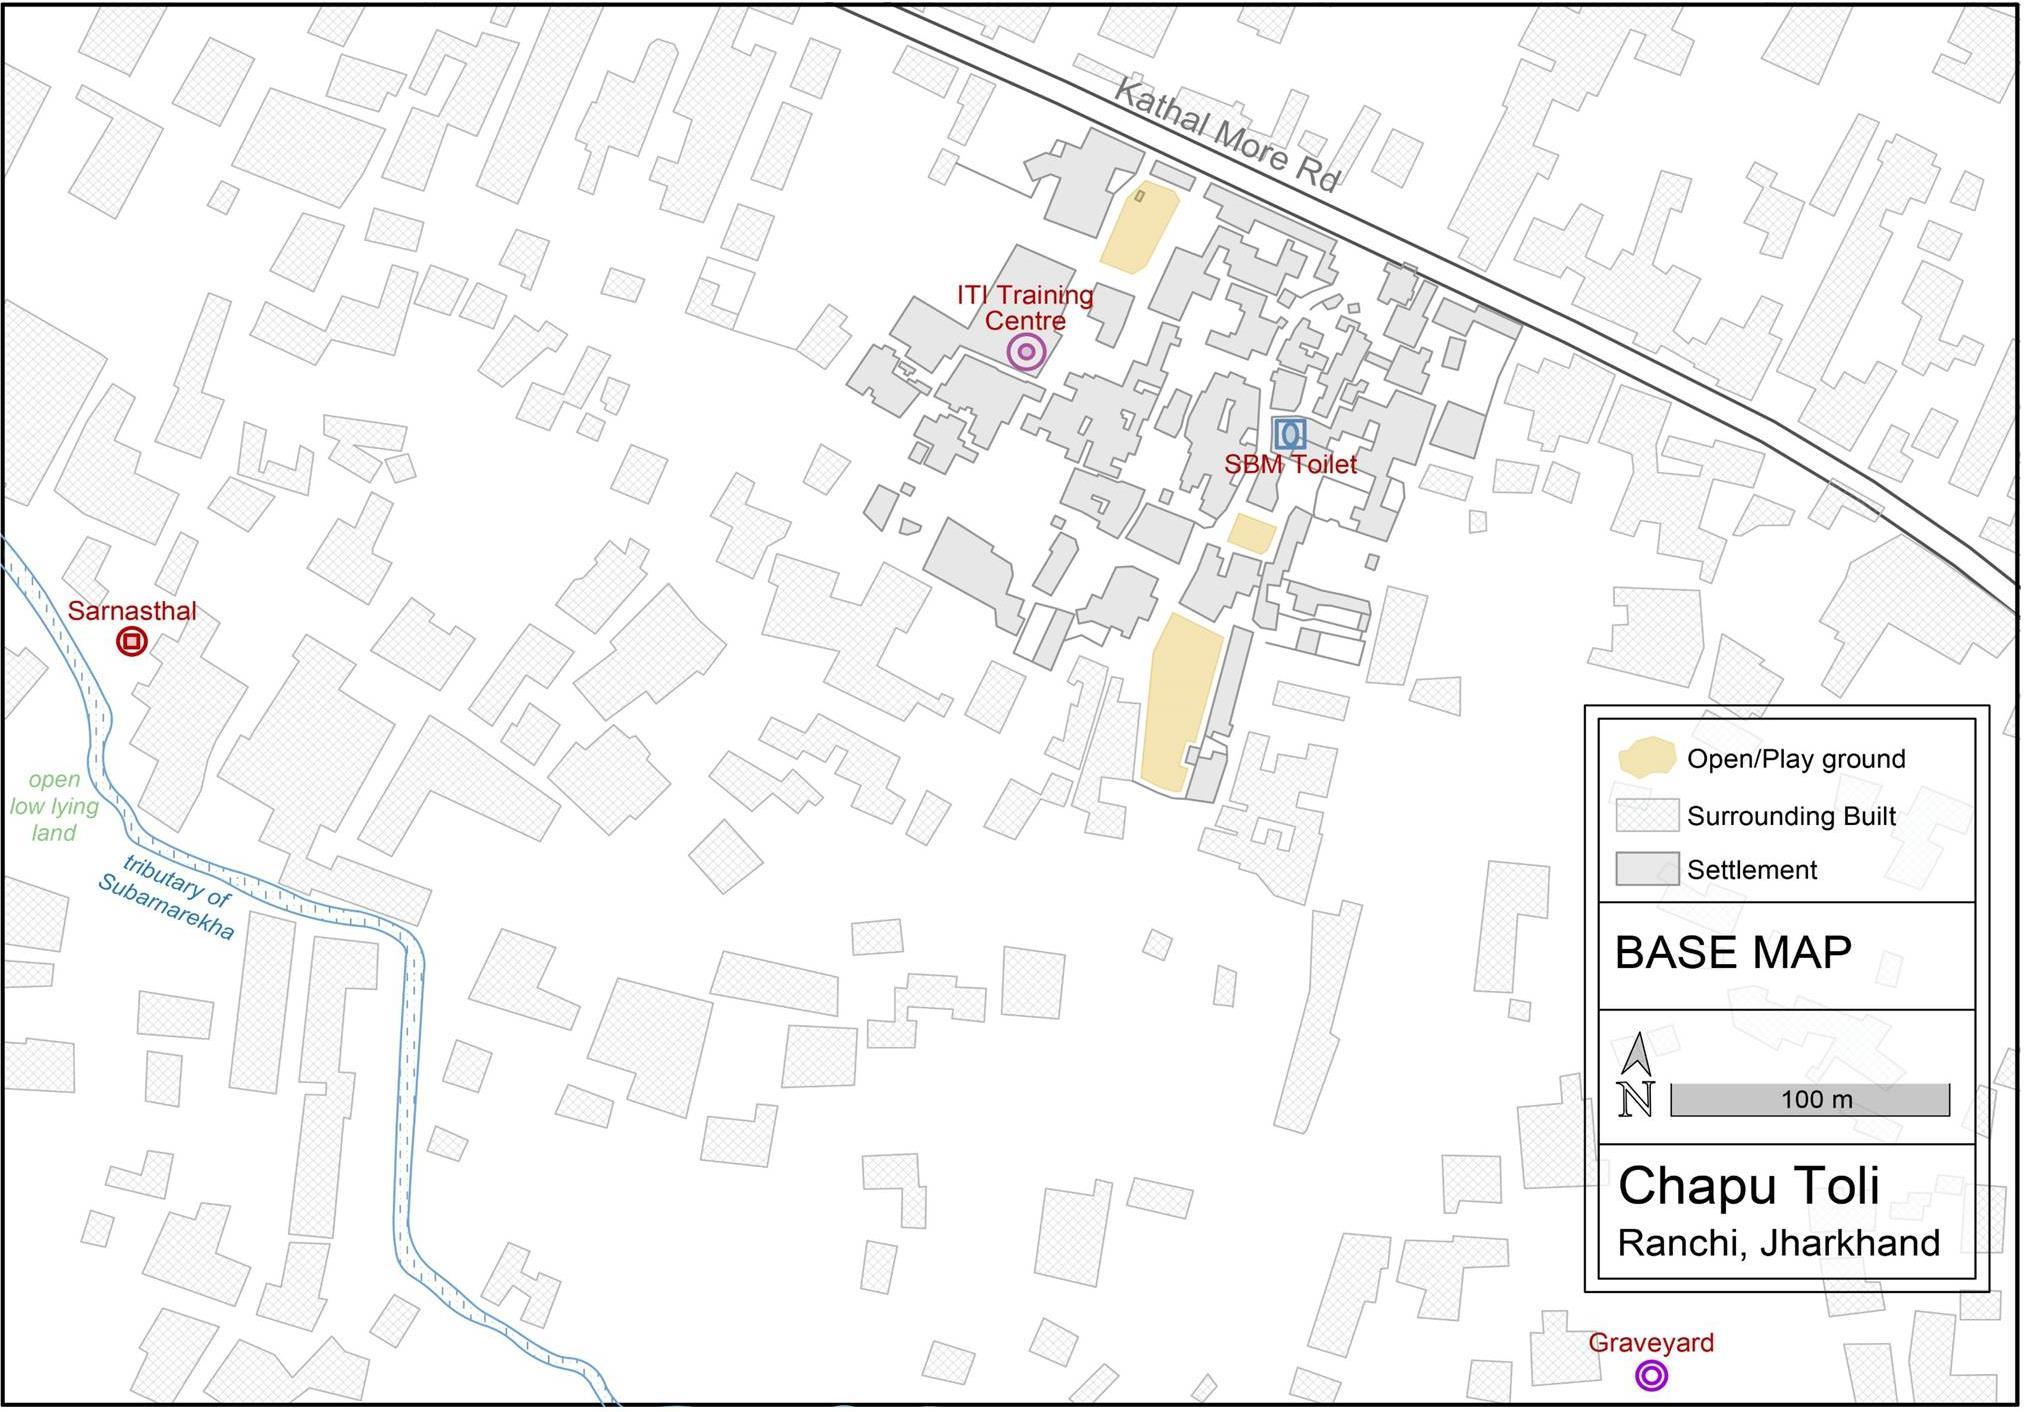
Map 35. Base Map for futher analysis
Satellite image source: Google Earth
Vulnerability Assessment & Mapping 42
Map 36. Caste Distribution
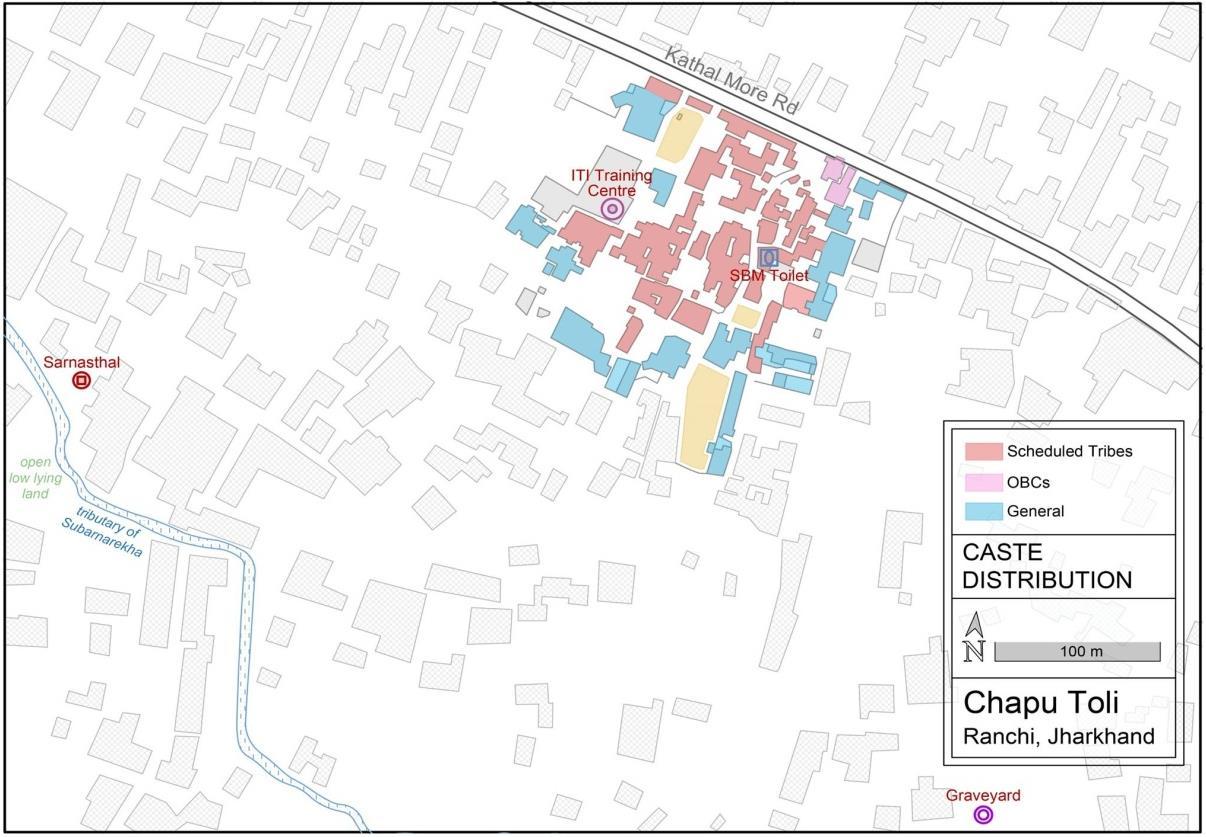
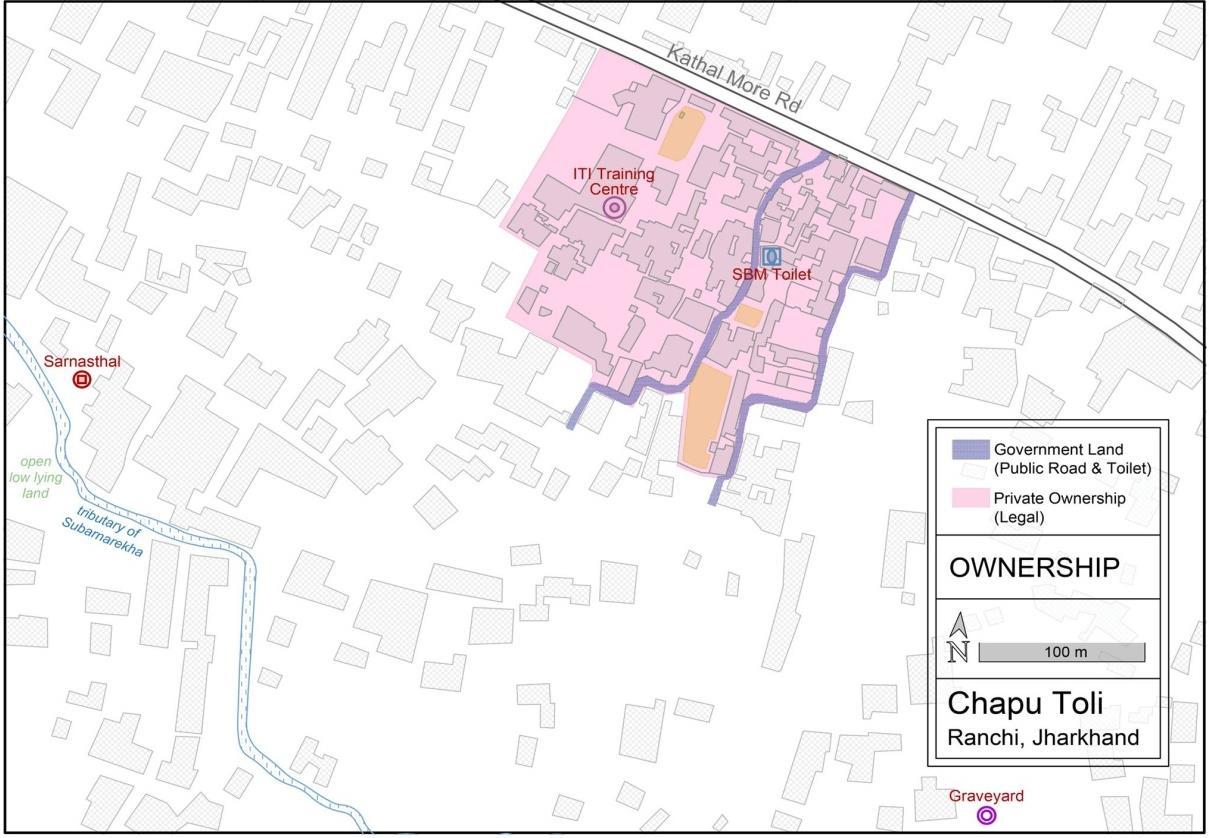
The FGD revealed that the slum is situated on KhatiyaniZameen (private lands). 96.77% of the households own the houses they live in while 3.23% households are living on rent. All the households are legal and are paying taxes to the local government.Only the main street of settlement and the public toilet is located on public/government land. In government records, ChapuToli has been declared as a notified slum which implies that the government can extend basic services and other amenities to the slum. However, RMC hasn’t yet made provisions for basic services in slum.
8.1.5. Social Capital and Governance
There is lack of social unity in the settlement as quarrels often comes up owing to alcohol consumption among men. It is only in case of difficult situationsor
Map 37. Ownership
emergencies, that people come together and collectively try to resolve the issue. The Ward Councillor is not active and has not taken any actions or efforts to improve the living condition of the slum.
The residents also approached the councillor 2-3 times regarding the installation of motor in the deep boring well and were also willing to pay contribution for the same. However, the councillor was not supportive and the residents had to install the pump on their expenses.
The residents face issues in contacting the Nagar Nigam officials as they are not aware about the local government departments and welfare schemes. Further RMC officials often do not respond to their complaints.
Vulnerability Assessment & Mapping 43
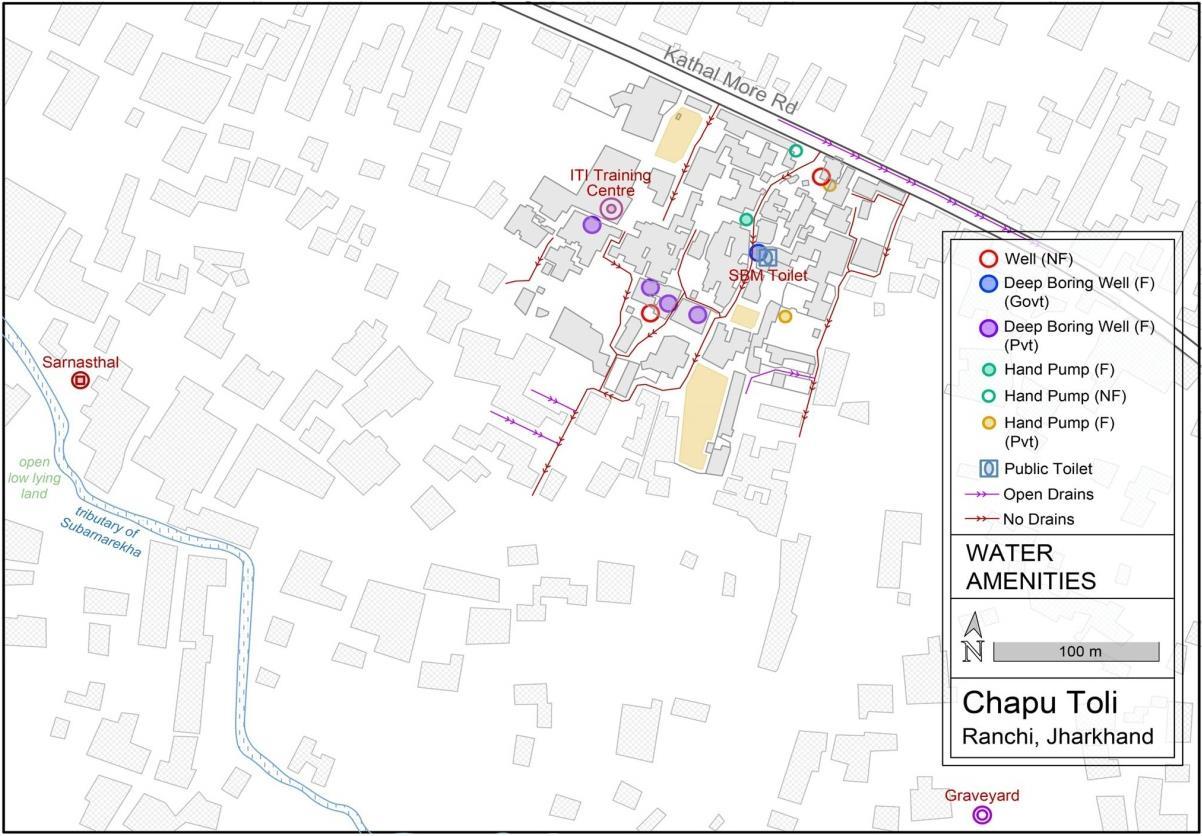
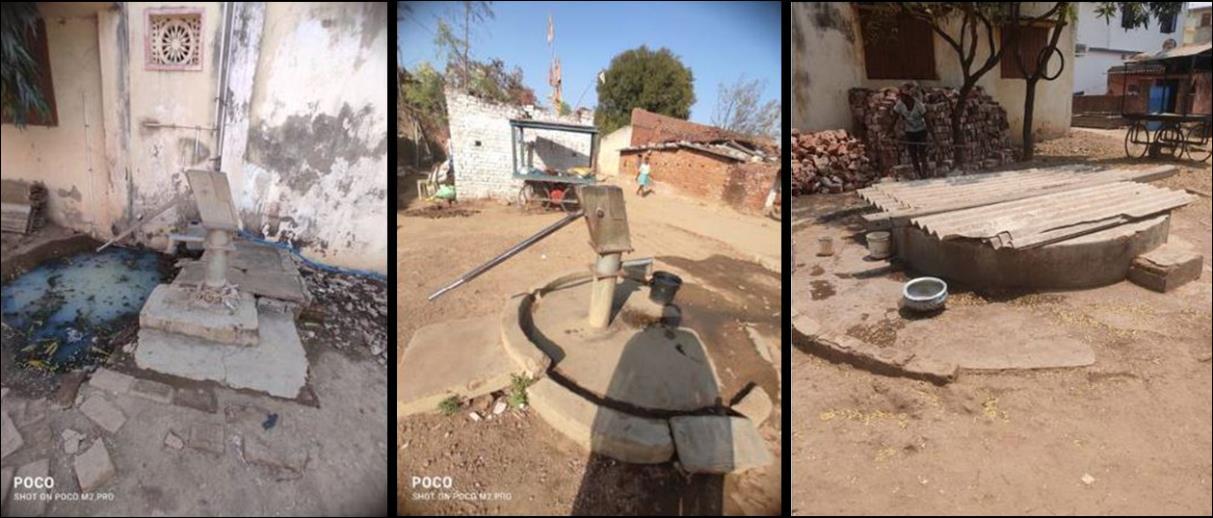
Map 38. Water amenities
8.2. Physical Infrastructure
8.2.1. Water Supply and Drainage
Only one of the two hand pumps installed by RMC 10 years backis currently functional. A few families in the slum have installed private hand pumps and deep boring wells in their houses. RMC had started the installation of a deep boring well in 4 years back, however, they did not install any pump and so residents had to bear the expenses of putting in a pump.
There is absence of a sewerage network in the slum. The residents have themselves created small passages on the edges of the streets for discharge of waste water. Only a single stretch in the entire slum has open drain channel which they have constructed on their own expenses.
Map 39. Public amenities
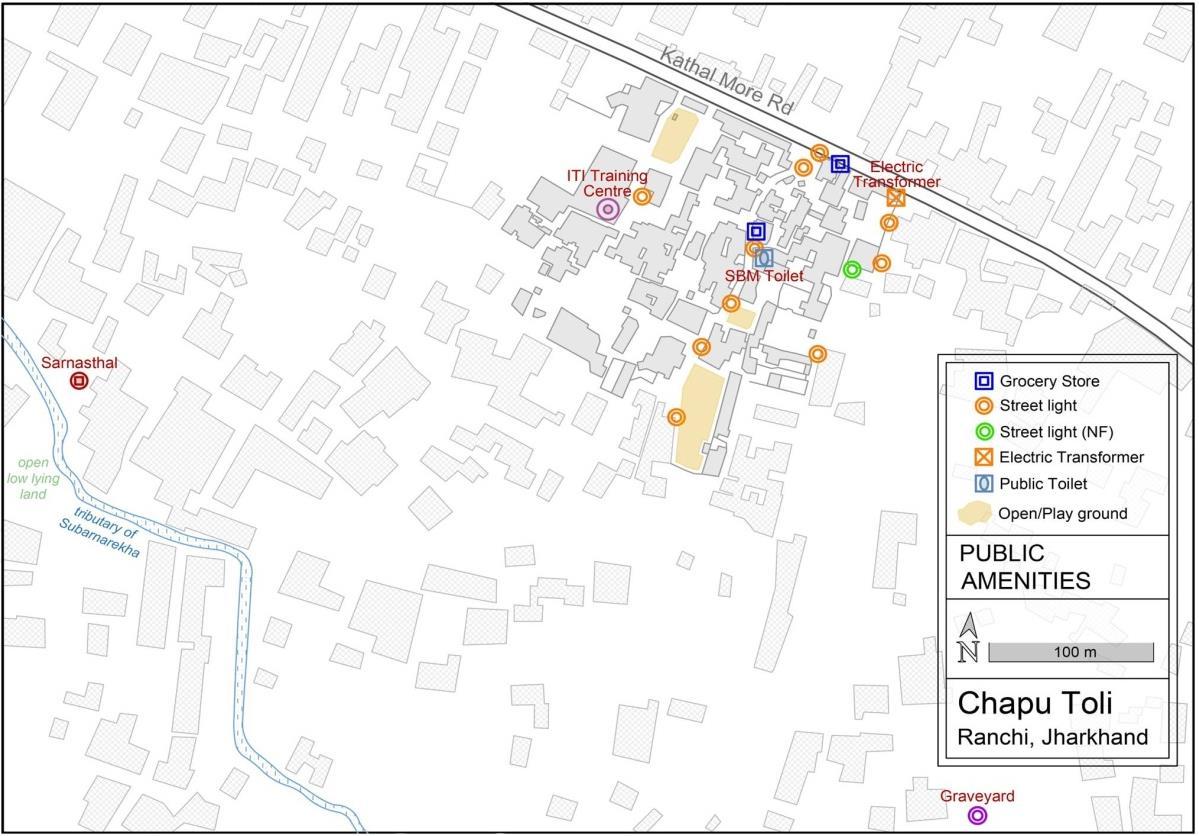
8.2.2.
Public Amenities
Currently, there are 11 street lights present across the slum, of which 10 street lights are operational. The FGD revealed that the residents do not face any issues with respect to lighting or mobility issues at night.
As per the latest household level survey conducted in November, nearly 70% of the households have individual toilets while 30% households do not have an individual HH-level toilet.The households that do not possess an individual toilet use a public toiletlocated within the slum constructed by the MLA, and maintained by the community itself. Due to low coverage of HH-level toilets and small size of the public toilet (2 seats), children below 5 years of age practice open defecation in the open grounds of the slum.
Vulnerability Assessment & Mapping 44
8.3. Climate Change Induced Vulnerabilities
Map 40. Road Typlogy & Tree Cover
8.3.1. Heat Stress Vulnerability
Spatial Factors Overlaid for assessing Heat Stress
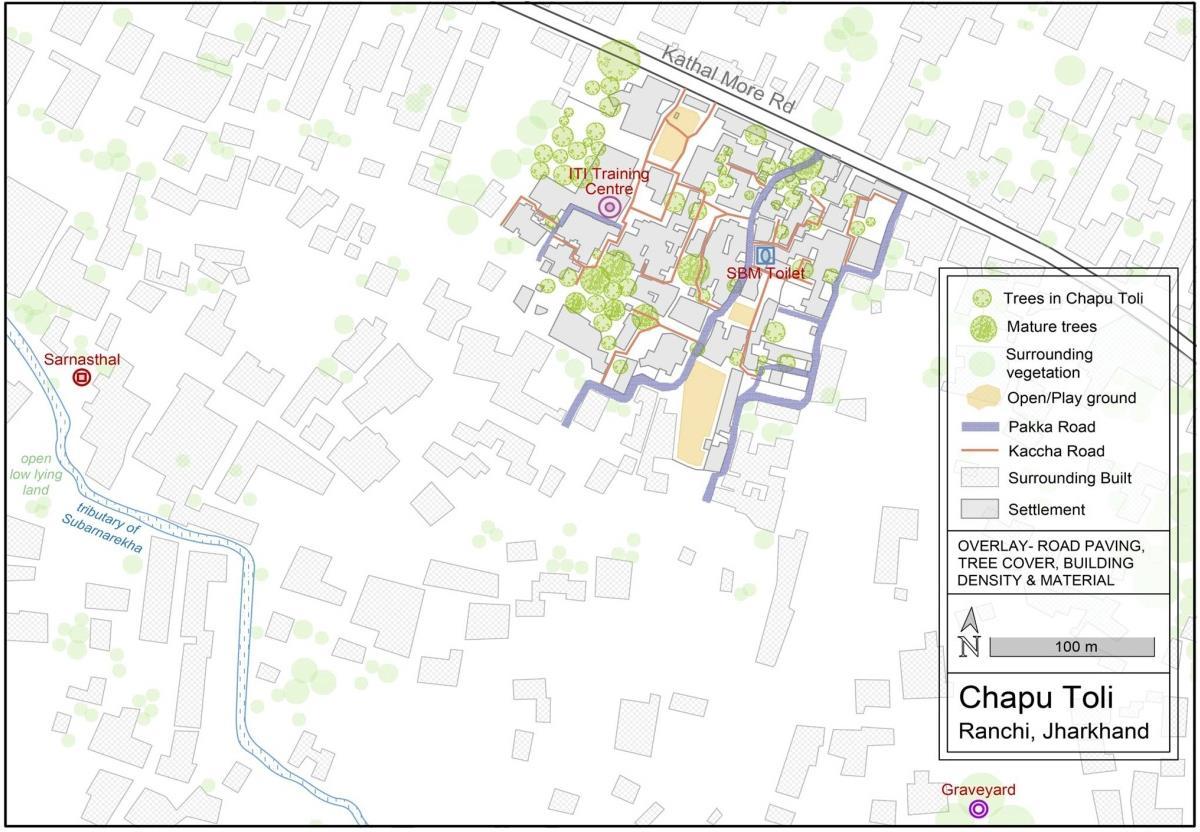
1. Highway, Pakka/Katcha Roads 2. Tree Cover 3. Ground cover 4. Built Density
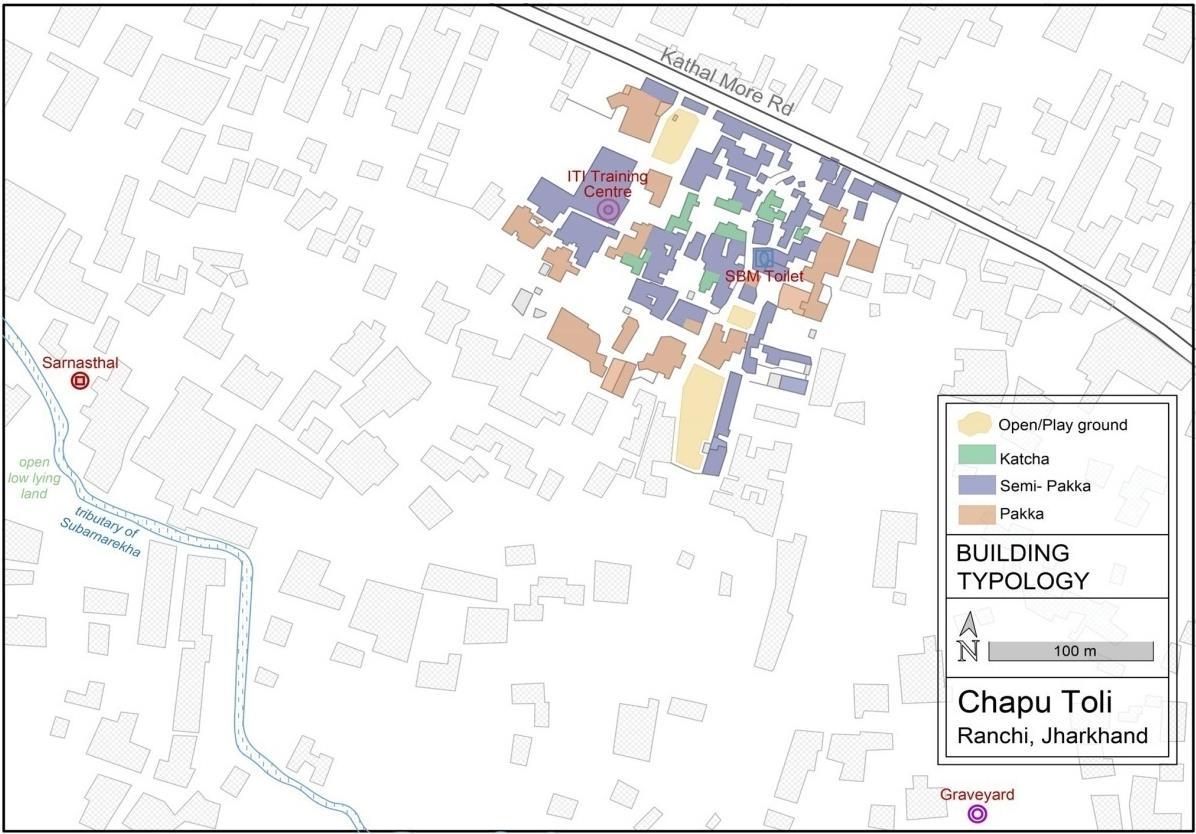
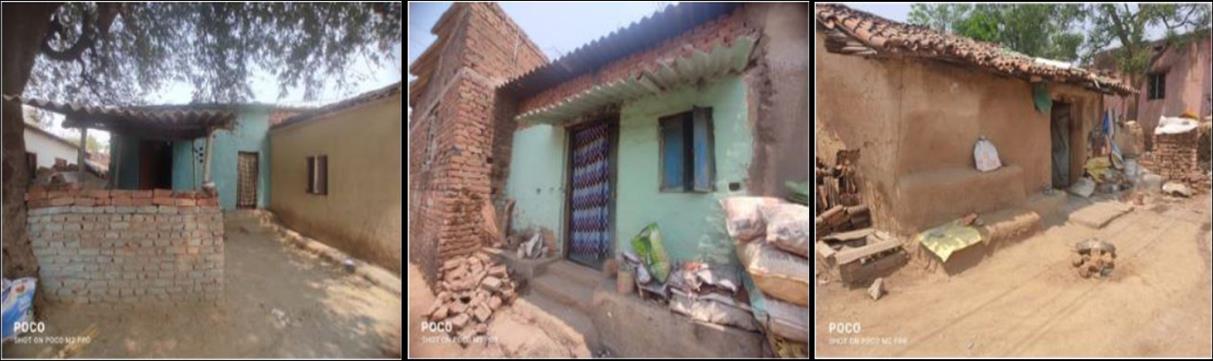
EXPOSURE: Heat stress has increased in the last 10 years ago since agricultural land has been converted for residential use and tree cover has reduced. Housing condition is poor with 80% of the houses being largely of the semi-pakka type. 80% houses have heat reflecting asbestos roofing.
Map 41. Building Typology
Further the houses are close together and have poor ventilation provision.Access to electricity within the settlement is poor. Half of the HHs reported having illegal connection while the other half reported not having electricity connection
SENSITIVITY: Productivity is affected especially in the case of livelihoods such as domestic work, municipality cleaners, and vegetable vendors.
ADAPTIVE CAPACITY: Traditional building material such as Khanare is put on top of asbestos sheet roofing to reduce heat impacts.
Vulnerability
&
45
Assessment
Mapping
Image: Roof & Wall Typology Source: MHT
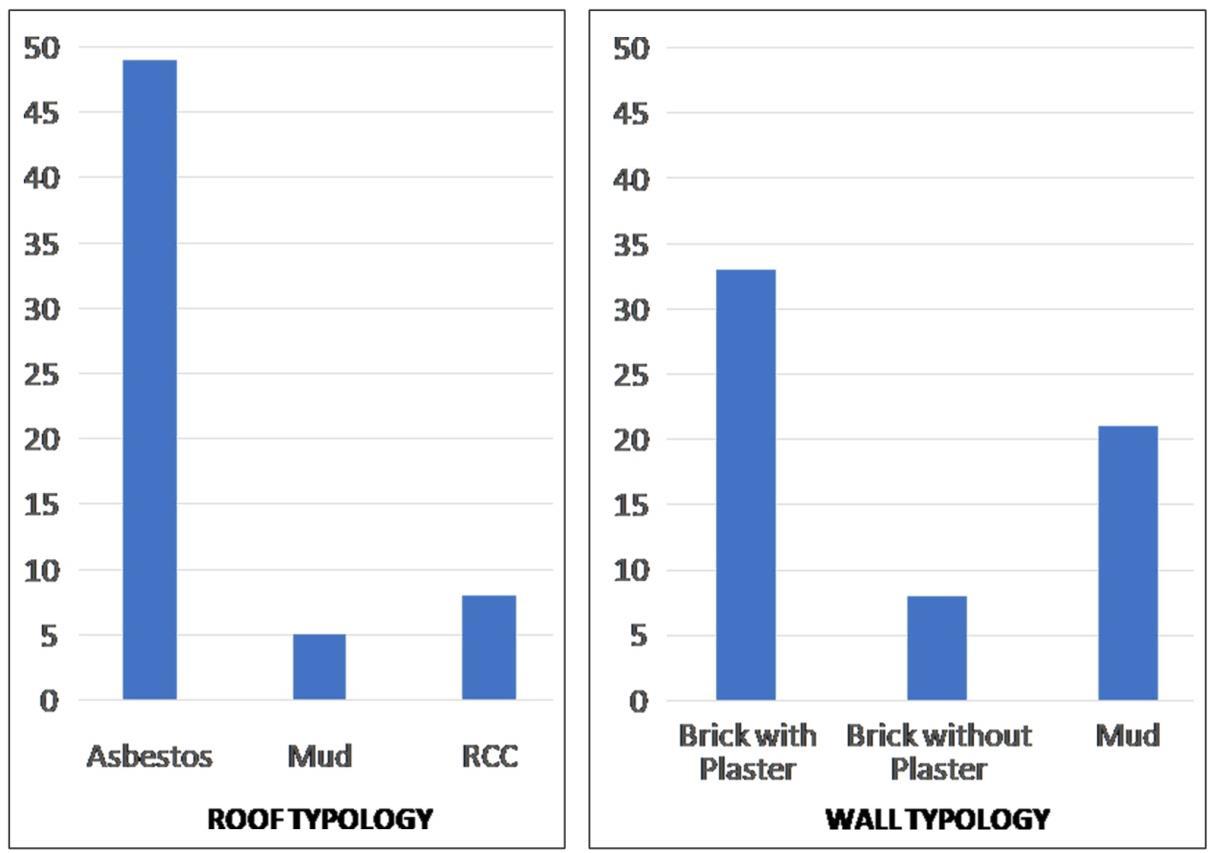
Presently, majority of the families in the slum (80%) have houses which are semipukka in nature. Close to 80% of the houses have asbestos as roofing material, while only 8.3% houses have RCC/Concrete roofs. 53% of the households have walls made of brick with plaster.
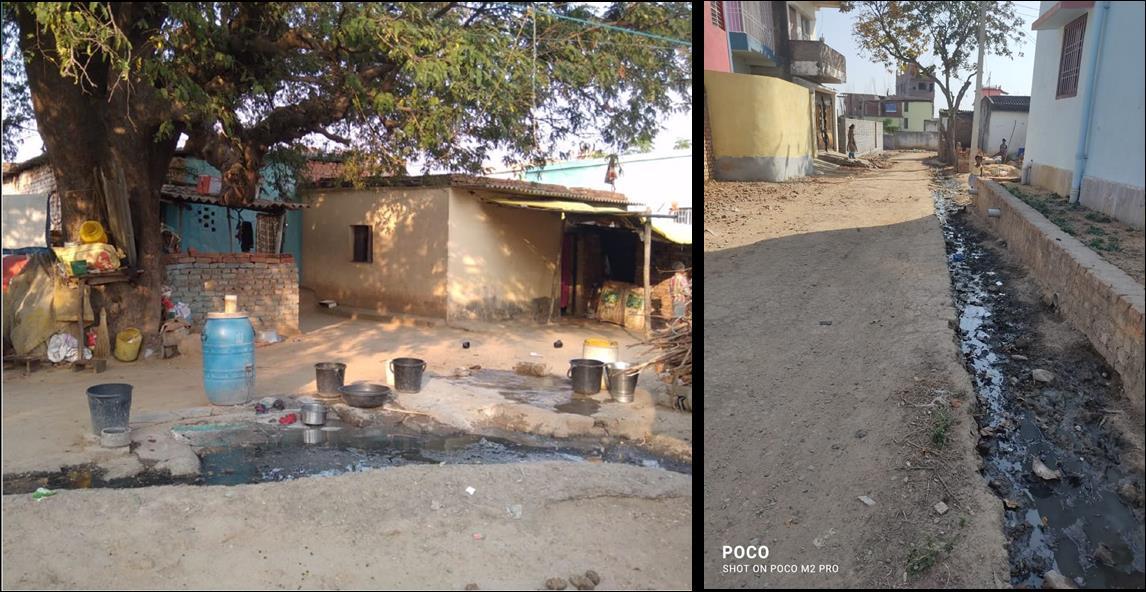
Image: Street Typology Source: MHT
Bricks as well as asbestos have high heat retention capacity which disturbs the thermal comfort in the houses. The tree cover in the slum has reduced, as a result of urbanization and the agricultural lands has been converted for residential/commercial uses.
Vulnerability Assessment & Mapping 46
Image: Water amenities and Drainage Source: MHT
HIGH VULNERABILITY ZONE
HHs along the highway are impacted by the heat generated by the highway.
HIGH VULNERABILITY
ZONE
Open grounds without sufficient grass cover also reflect a lot of heat.
MEDIUM VULNERABILITY AREA
Density in the settlement is not too high. However, some areas do not have adequate tree cover.
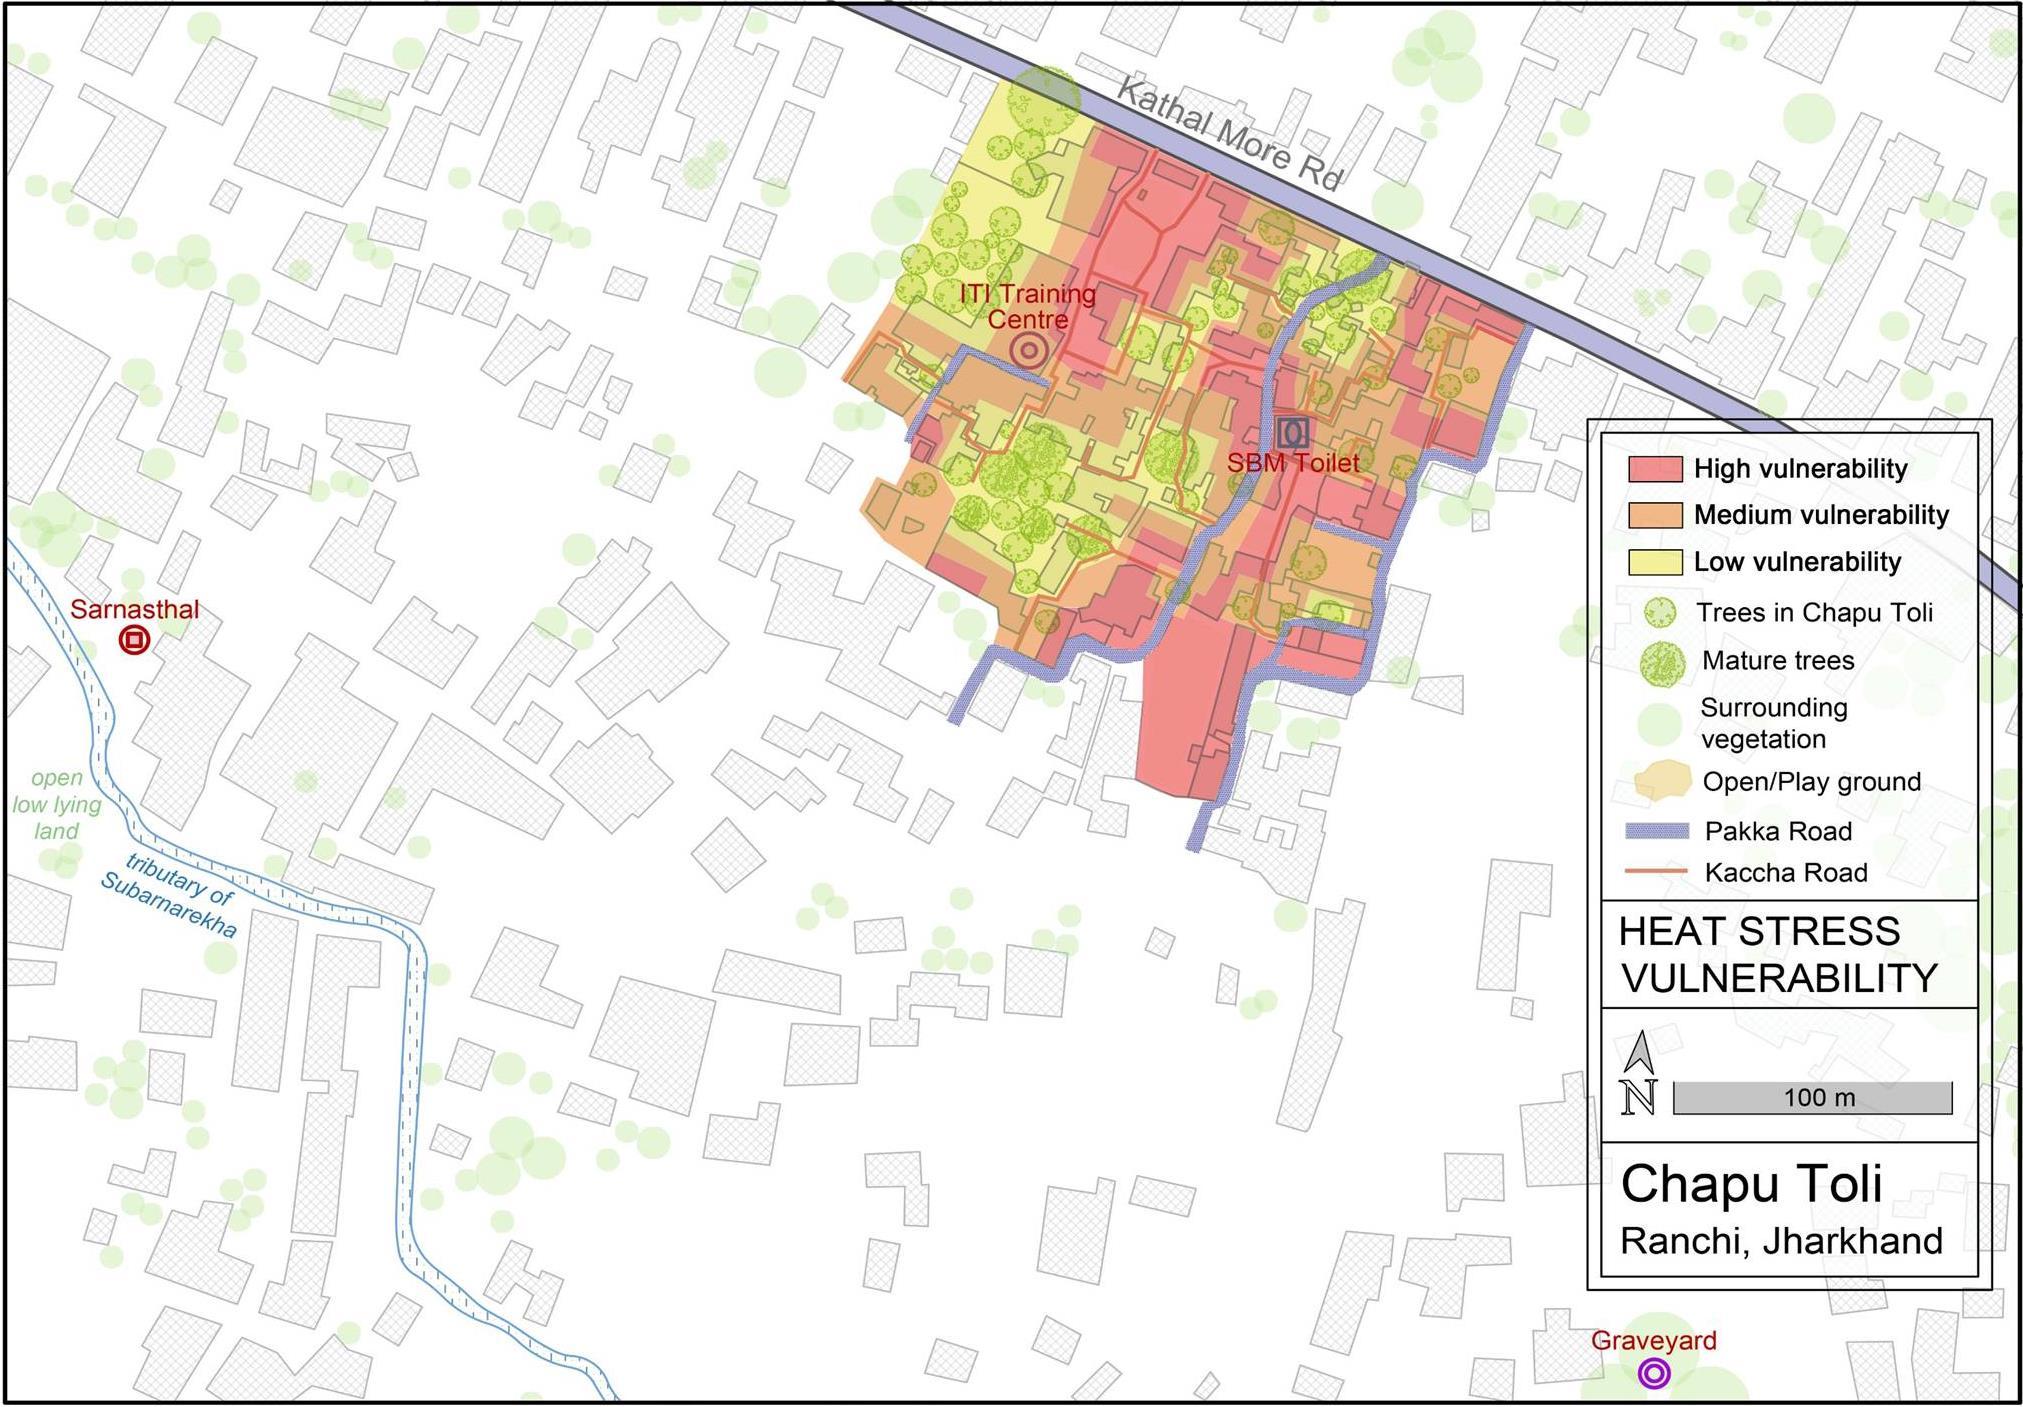
LOW VULNERABILITY AREA
Households around mature tree grove experience low heat stress. It also has porous ground cover.
Vulnerability Assessment & Mapping 47
Map 42. Heat stress vulnerability
Map 43. Terrain
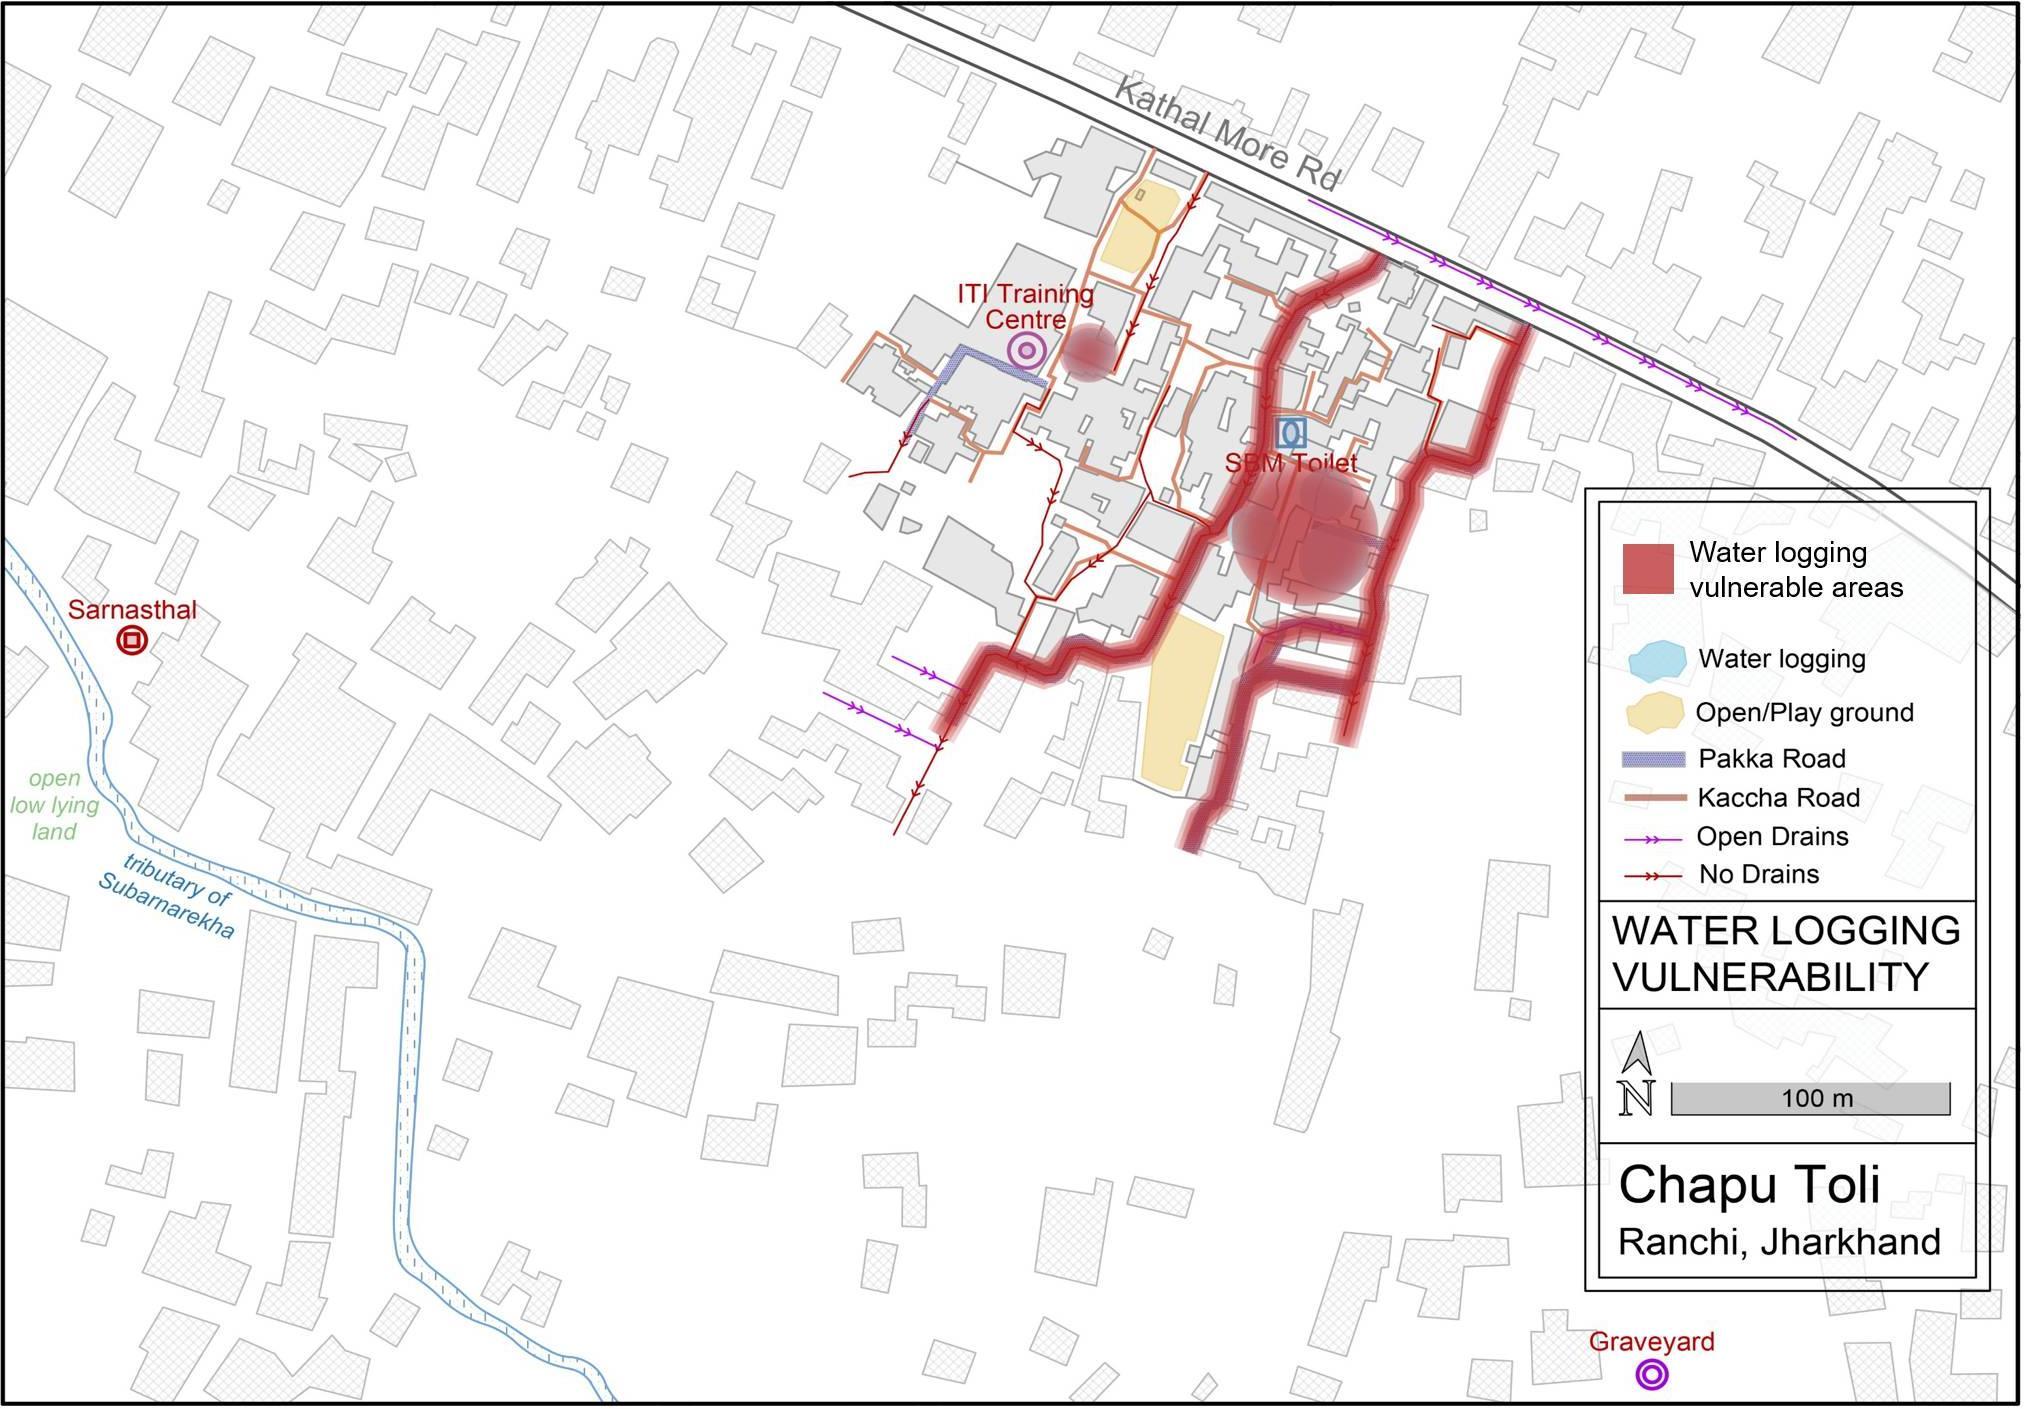
8.3.2. Water Logging Vulnerability
Spatial Factors Overlaid for assessing Water Logging
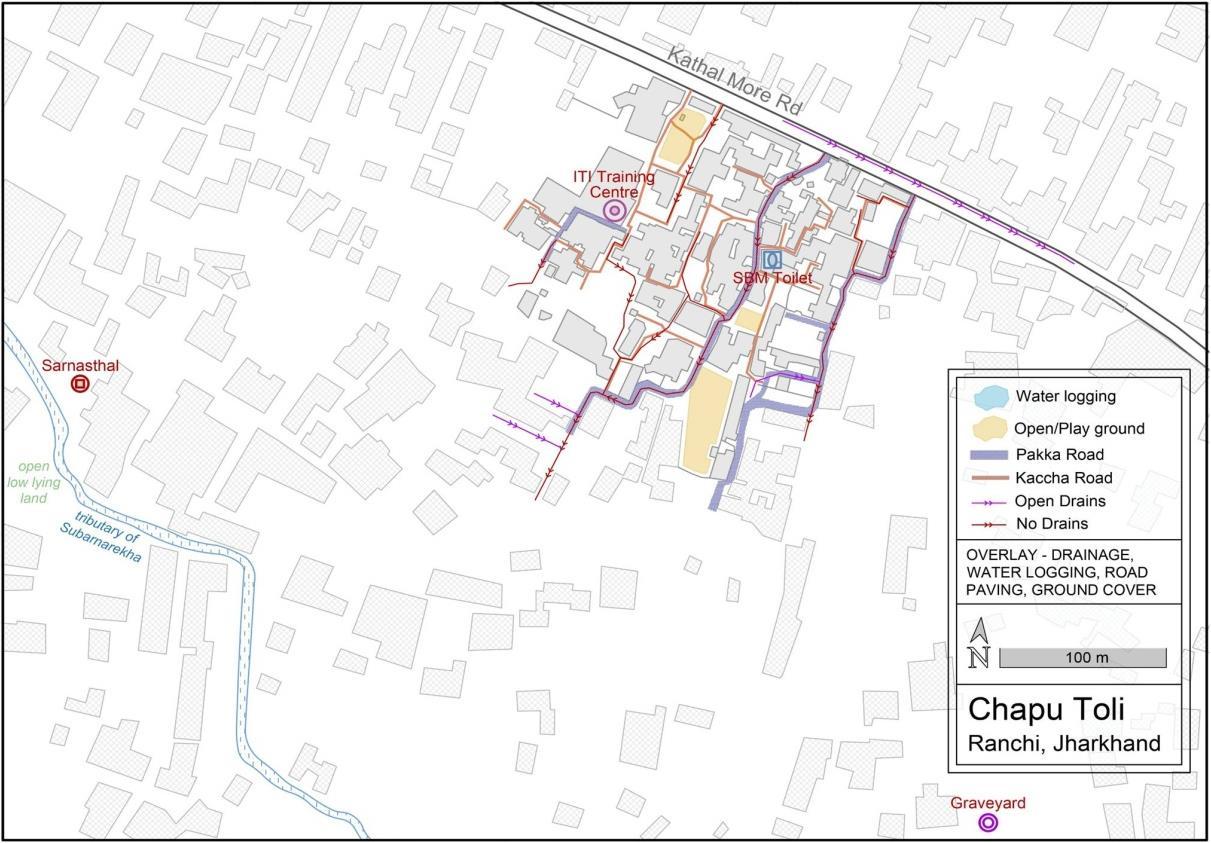
Drainage Lines
Kaccha/Pakka Roads
Water Collection areas (as reported in social mapping)
EXPOSURE: Water logging problem has increased since past years. Earlier there was more open space so water could flow out or permeate. However, infrastructure provision has not kept up with increase in built area. Except for one pakka road most of the roads are in bad condition. Drains are not provided, except for open drains in some stretches. Further, the houses are mostly at lower
Map 44. Water logging levels than the roads causing water to enter the houses.The water logging along with pollution causes vector borne diseases like malaria, typhoid, dengue. Due to the lack of SWM collection by the municipality, waste dumps are seen in multiple places.Further with majority of the houses lacking individual toilets, open defecation is practised causing serious health vulnerabilities
SENSITIVITY: Due to the location of the settlement close to the tributary it receives run-off from a larger catchment area.
ADAPTIVE CAPACITY: People frequent the nearby clinic in case of health problems. They use measures like coils and nets to prevent spread of vector borne diseases. The municipality’s pest control vehicle comes once in a while.
Vulnerability Assessment & Mapping 48
2.
3.
4.
5.
1. Topography
Permeable ground
HIGH VULNERABILITY AREA
Paved Road, Open drain, Exceeded Capacity
HIGH VULNERABILITY AREA
Water logging spots affected by overflow from roads
HIGH VULNERABILITY AREA Paved roads, No drains
Water flow path without drain provision
Map 45. Water logging vulnerability
Vulnerability Assessment & Mapping 49
8.3.3. Vector Borne Disease Vulnerability
The vector-borne disease vulnerability has not improved much in the last 10 years. Due to the lack of SWM collection by the municipality, waste dumps are seen in multiple places. Mosquito growth also happens in the open drains.Further, open defecation is also practised in the slum causing serious health vulnerabilities.
HIGH VULNERABILITY AREA: Areas where major pollution sources such as open defecation and waste dumping overlap.
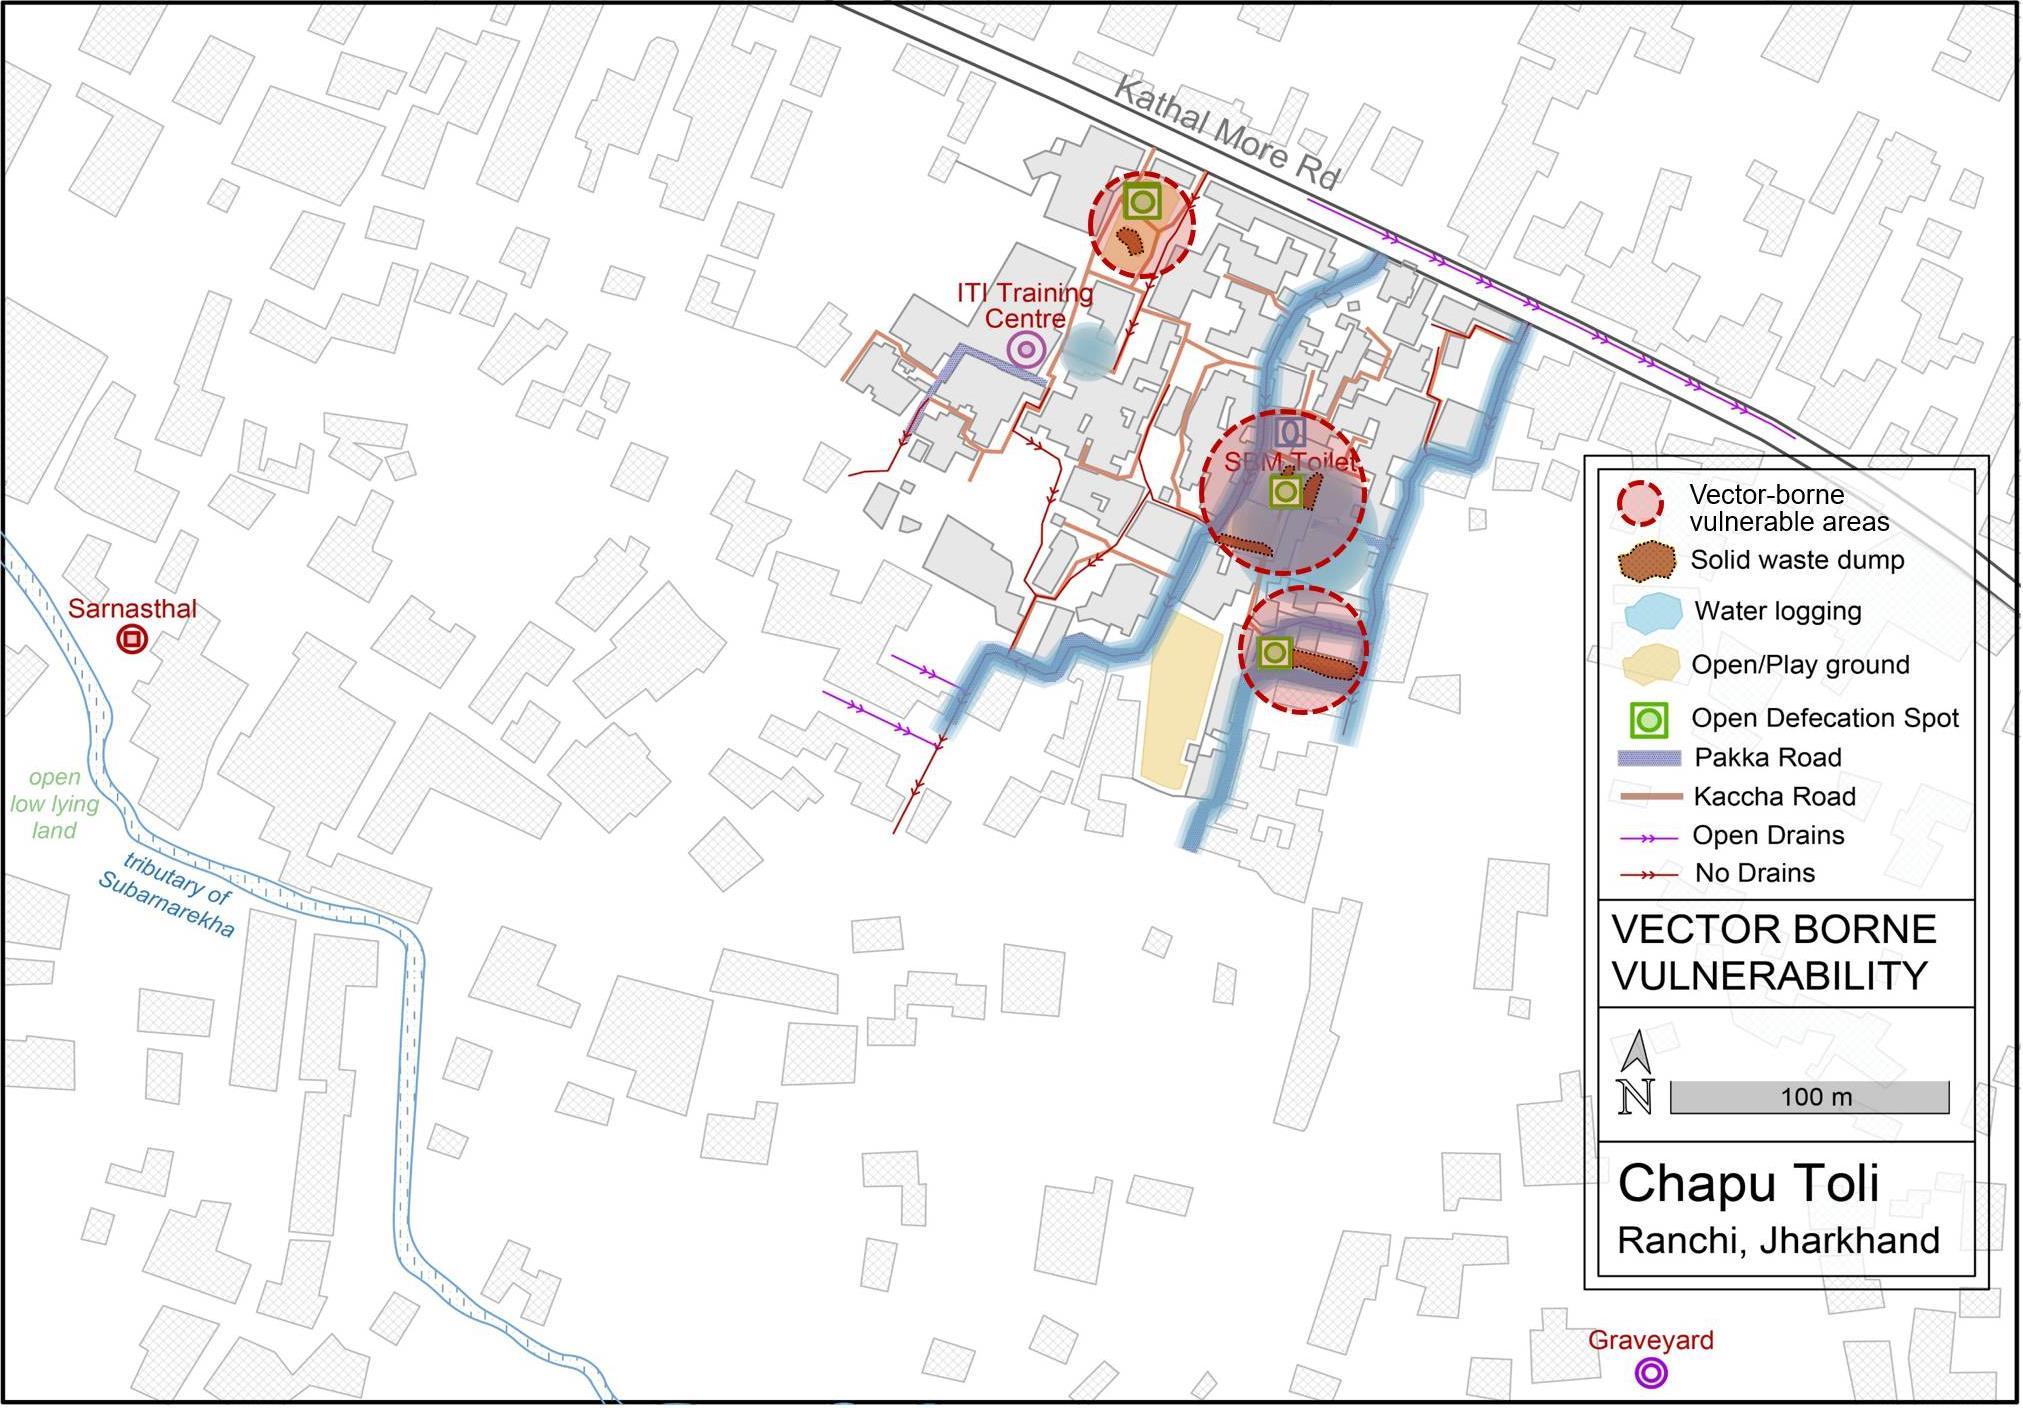
HIGH VULNERABILITY AREA: Areas where water logging and major pollution sources such as open defecation and waste dumping overlap.
Other water logging areas are also prone to spread of vector borne diseases.
Vulnerability Assessment & Mapping 50
Map 46. Vector Borne disease vulnerability
8.3.4. Water Stress Vulnerability
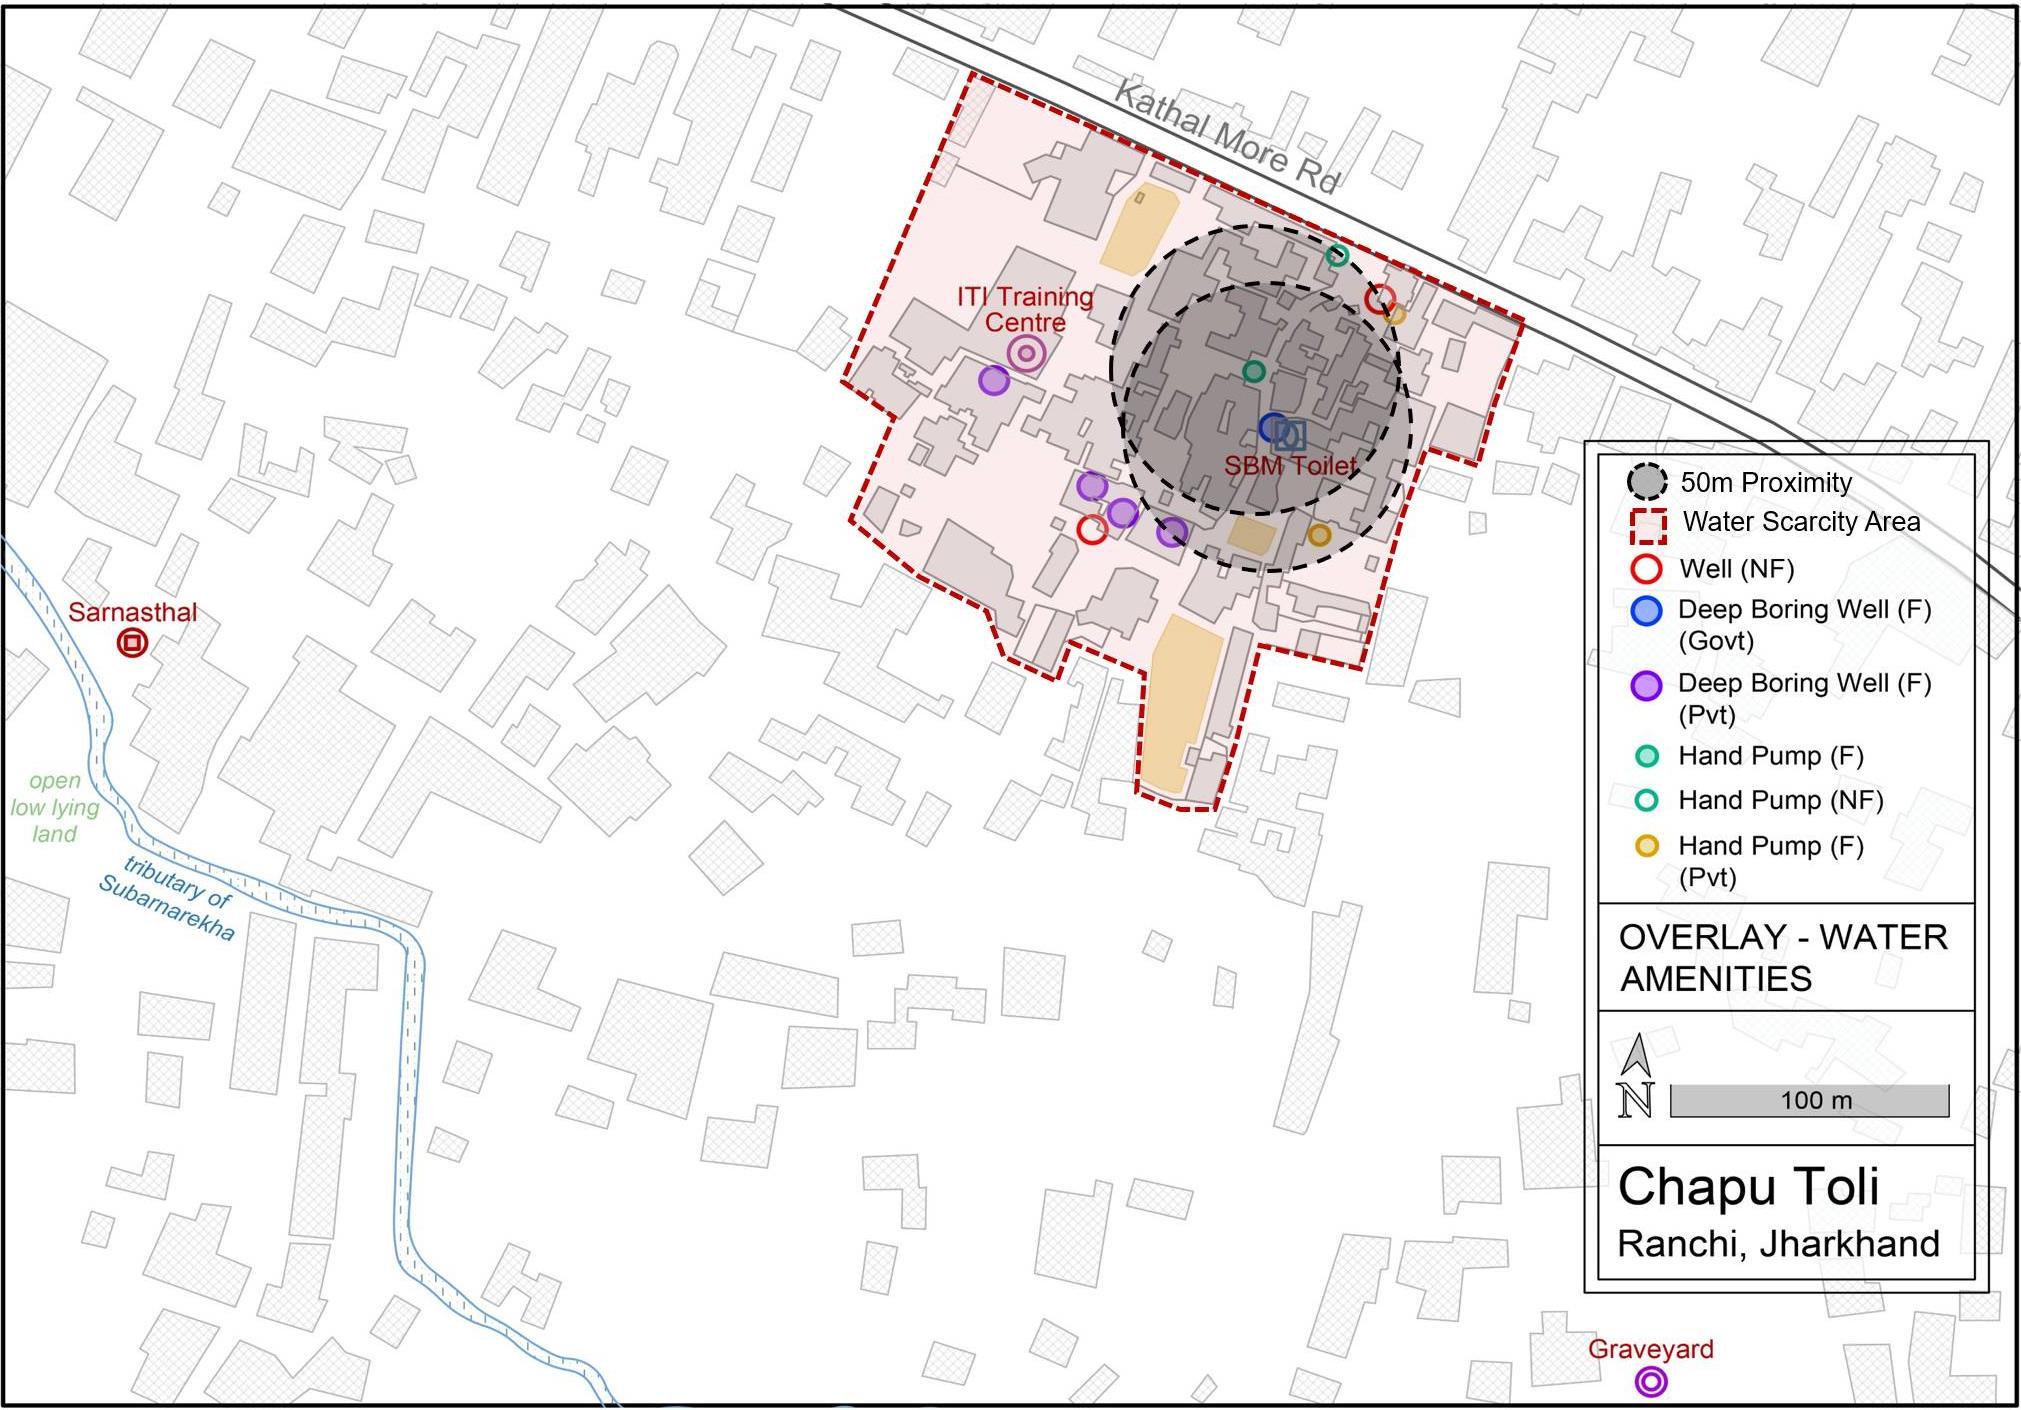
EXPOSURE: Water scarcity problem has not improved much since the past 10 years.None of the houses have water connection. There is only 1 hand pump in the area which runs from 4 am to 10 pm. Water from this source is also drying up now.During summers, people have to depend on tanker supply. There are 2 wells in the settlement which used to be used 10 years back. But, due to lack of maintenance they have now fallen into disuse.
SENSITIVITY: During Covid-19 it was difficult for the residents to get water and they had to depend on their neighbours who had borewells.
ADAPTIVE CAPACITY: To adapt to water scarcity, people reuse water twice or thrice especially for washing dishes.
Vulnerability Assessment & Mapping 51 Map
47. Water Stress vulnerability
8.3.5. Access to Health Facilities - Vulnerability
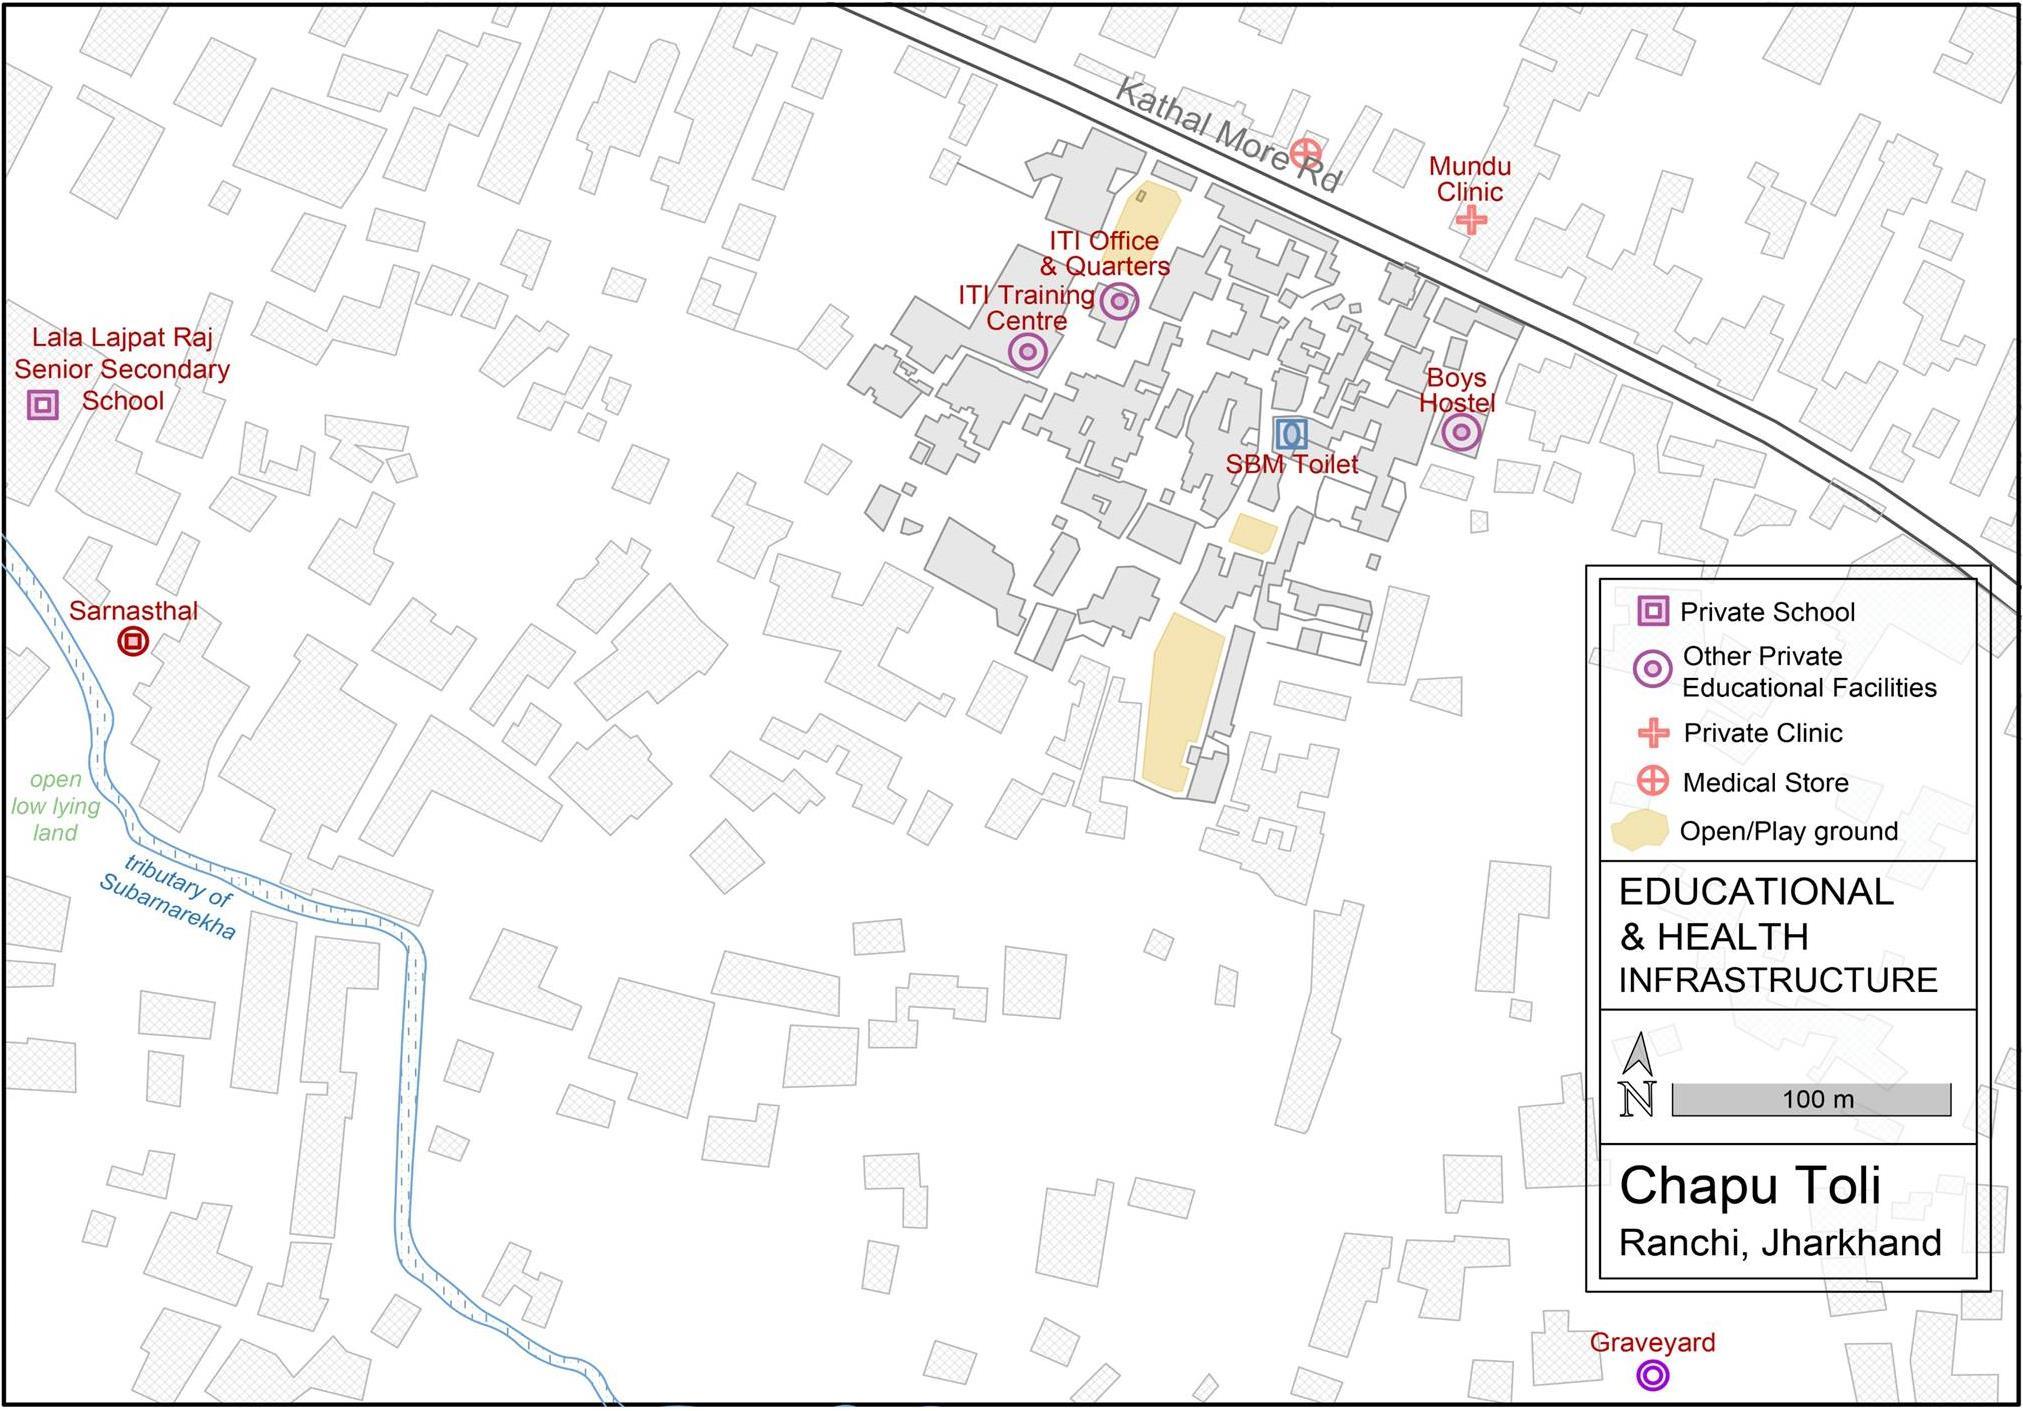
There is no aaganwadi within the settlement. The nearest aanganwadi is in Pundag (5 km). This causes a lot of problem for the community especially for mothers and children. The doctor from Mundu Nursing Home, which is 5 km away, lives in the settlement. People go to her for emergencies. Both proximity and access to health amenities is a problem in the settlement. Access to health facilities is through walking, auto, private vehicle since there is no bus service available. Since auto stands are not nearby, they often have to book autos which cost 500-1000 Rs. Since there are no PHCs nearby, pregnant mothers are referred to RathuPHC for deliveries.
Vulnerability Assessment & Mapping 52
Map 48. Access to Health facilities
Map 49. Access to Health facilities - Regional scale
Satellite image source: Google Earth
PROXIMITY: As per URDPFI standards, average population served by:
• Nursing Home (25-30 beds)45,000
• General Hospital (500 beds)– 2,50,000
Considering a population density of 99 persons per hectare, the approximate radius served by the facilities will be
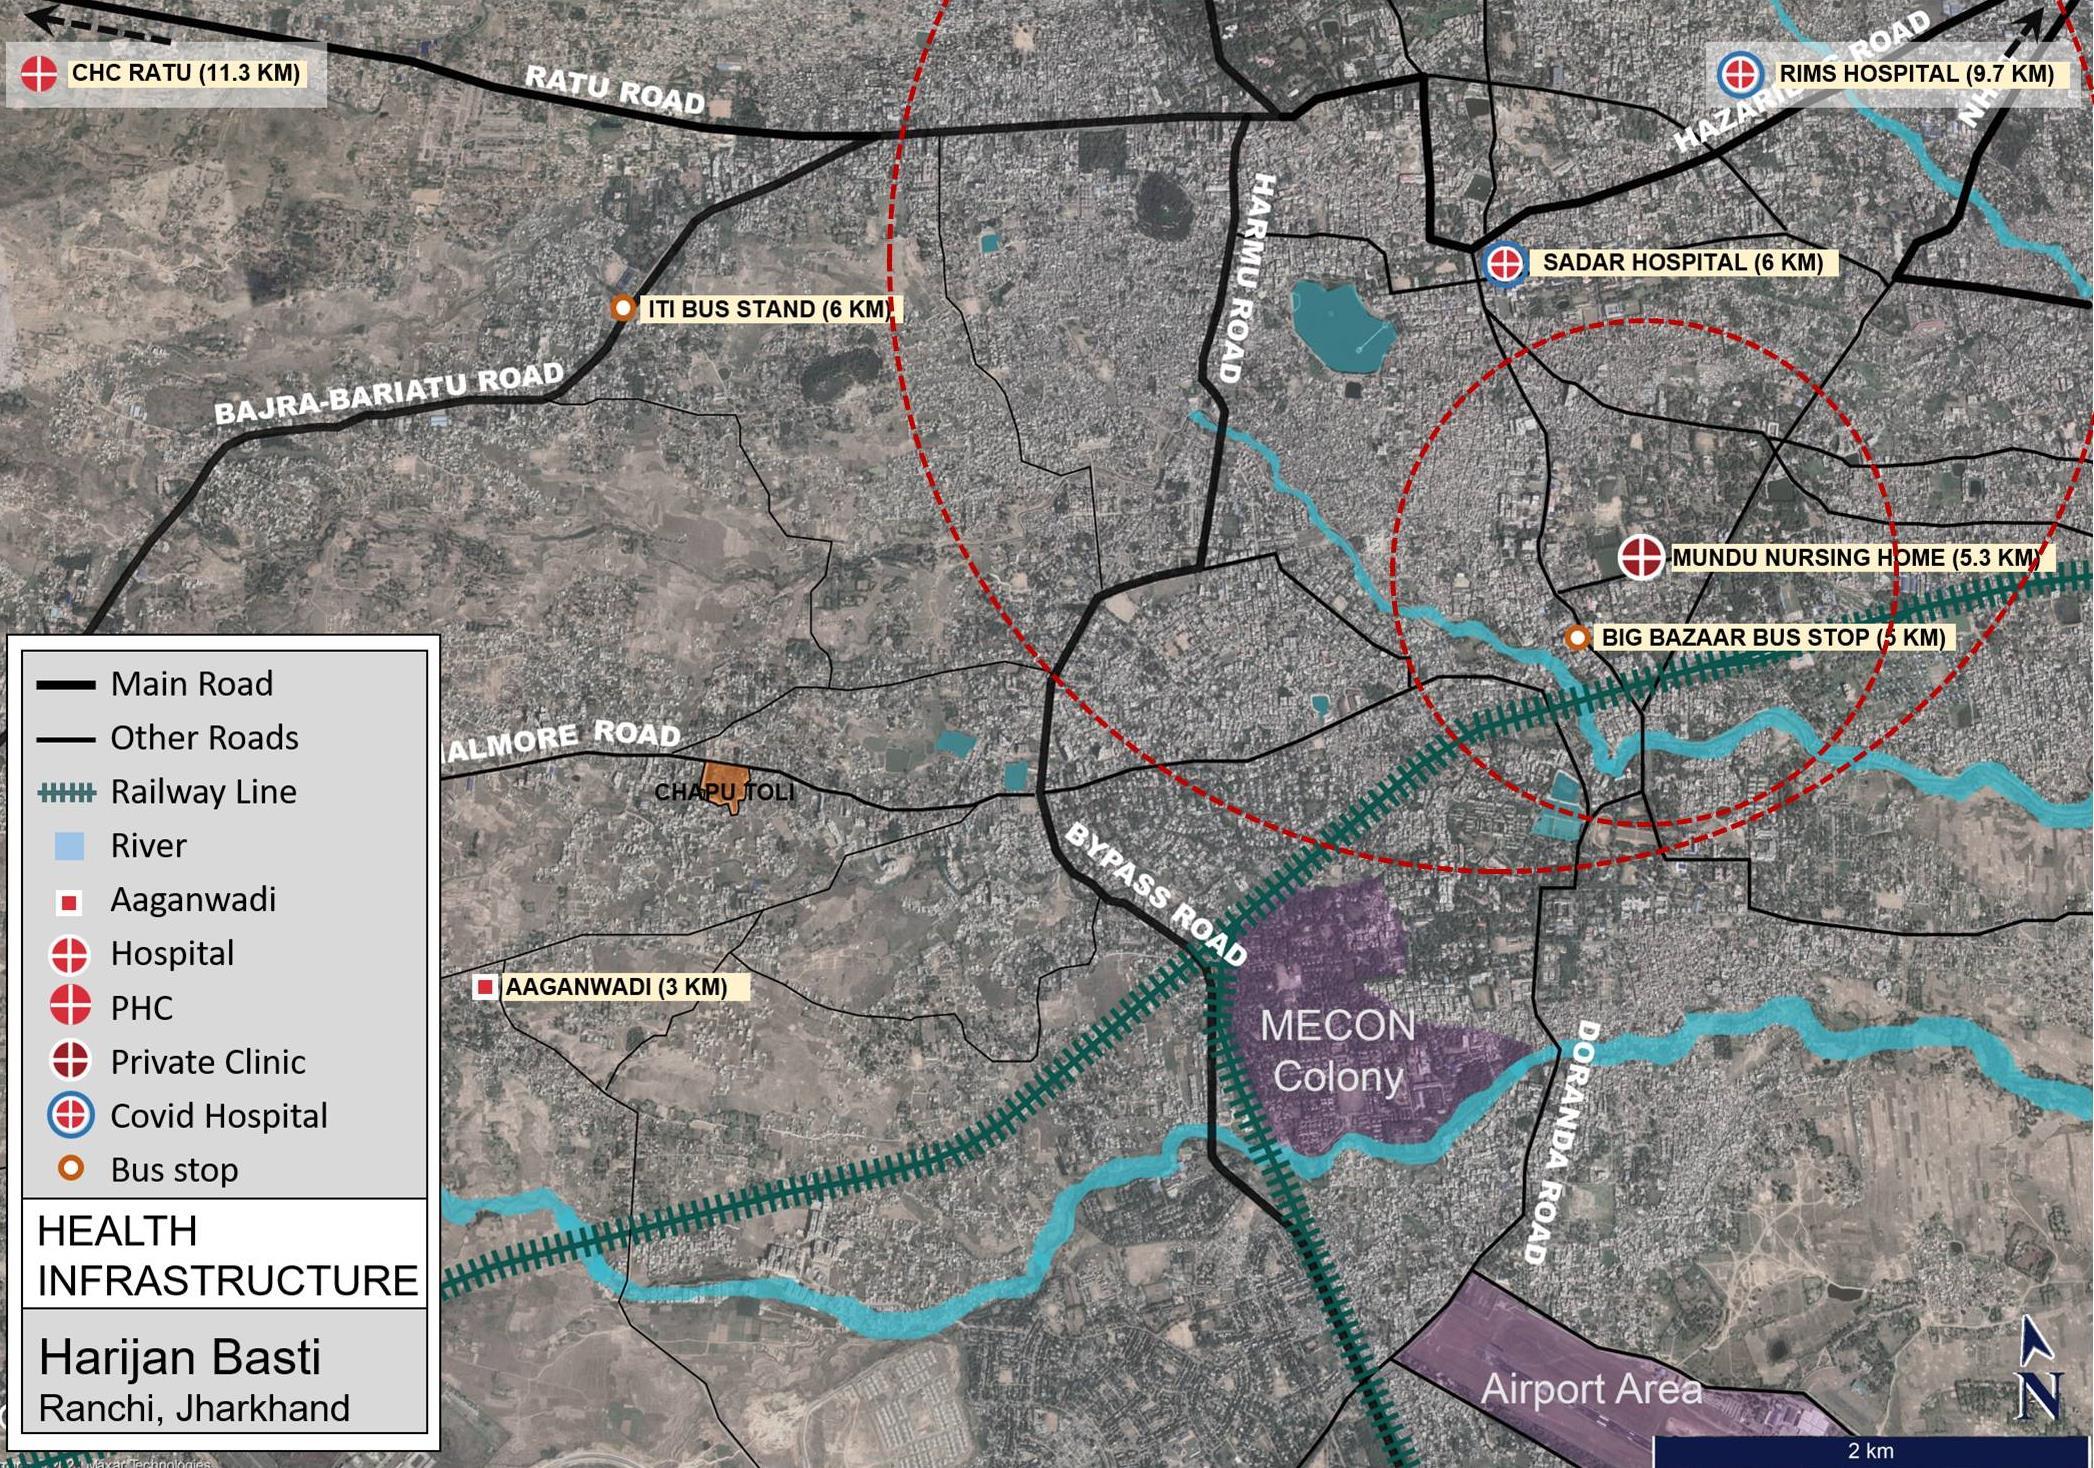
• Nursing Home (25-30 beds)1.2 km
• General Hospital (500 beds)– 2.8 km
Further aanganwadis are required for every 1000 population. Therefore, in terms of proximity to health services the settlement is inadequately provided for.
ACCESS: Further, accessibility to health facilities is severely curtailed due to lack of bus services.The nearest bus stops are 6-5 km away.
Vulnerability Assessment & Mapping 53
9. PROCESSES FOR BUILDING BOTTOM-UP
PERSPECTIVE ON CLIMATE CHANGE
VULNERABILITIES
Awareness that tackling the ‘wicked problems’ such as climate change vulnerability characterized by their pluralistic, subjective and interlinked natures will require integration of local scale perspectives, knowledge and capacities has resulted in the call for decentralization gaining traction. While, the need for inclusive, context-specific and multi-tiered policy frameworks is well established, the questions that remain unanswered are how and which bottom-up data collection and collation processes can be instituted or garnered to inform and ensure policy formulation is appropriately and meaningfully contextualized. Further, what are the challenges with respecting to eliciting, interpreting and collating this data, especially in the context of socio-spatial geographies such as slums, urban villages and other ‘informal’ spaces that are usually overlooked by formal planning processes. The collaborative project ‘Climate Change Induced Vulnerability Mapping for Urban Poor Settlements in Ranchi’ presents a typical motif to explore the epistemological, technical and social challenges that arise during bottom-up data collection processes.
The data collection tools employed included a combination of geospatial mapping, social mapping, histograms, transect walks, HH surveys and Focus Group Discussions, apart from secondary data. The overlap of data from these multiple tools and sources allowed to triangulate, qualify and validate findings. The challenges that emerged during this recursive process of questionnaire formulation, data collection, collation, mapping and analysis revealed both the potential and limitations of the process. In addition, the exercise presents clues towards answering questions of how such grounded data sets and processes for eliciting them can be configured, scaled and integrated within larger planning frameworks. The next sections explore the challenges, limitations as well as the
potentials of eliciting and collating ground-up data in an attempt to garner the tacit knowledge.
9.1. Language
Underpinning the question of language is the differing epistemologies that characterize grounded community knowledge systems and institutionalized techno-managerial knowledge systems. One of the primary challenges that need to be overcome in the process is translating scientific or technical knowledge to context-specific terms and vice versa. It is essential in this process of translation that extremes of both over-simplification as well as over-complication are mitigated against. For instance, while translating the concept of heat stress for community understanding, in the initial iteration it got reduced to ‘experience of heat’ and accordingly social maps were developed marking out areas where heat was felt. However, this produced a flattened and uni-dimensional understanding that masked an understanding of the complexity involved in generating heat stresses and its varied manifestation. Nonetheless, it constituted a critical experiential data-set that triggered the search for and exploration of other evidences, while also allowing triangulation. To render this data-set meaningful and insightful, it was essential that the concept of heat stress, as a climate change induced threat was translated to the communities. What this entailed was the foregrounding of the interaction of variables such as housing and environmental conditions, access to basic services and health infrastructure, all of which are critical to determining vulnerability. These need to be established and explained to the community prior to the mapping process. Breaking down the scientific concepts to its context-specific manifestation and dimensions allowed for overcoming the information asymmetry between the technical partners and the community. Social maps premised on this baseline understanding notonly generated congruent data,butalso clarifiedthe
Vulnerability Assessment & Mapping 54
influence of overlooked factors such as surrounding building heights and traditional building materials in determining heat stress vulnerability and adaptive capacity.
Just as important as facilitating this translation of scientific language for community understanding, is the process of translating concepts embedded in to community understanding to scientific or technical language. An instance that evidenced this was with respect to the various tenure systems prevalent in the community. For example, some of the settlements included gair majua land which while currently been classified as government land, continue to be influenced by usage and access patterns remnant from the zamindari system that it originated in. Unpacking these extant socio-spatial orders is especially important in the context of urban villages marked by their conflicted induction into urban planning frameworks since they often play a critical explanatory role in understanding urban identities and relations, often more than the discrete socio-spatial categories of the state.
9.2. Boundaries
A second challenge is that of translating experiential boundaries into spatial boundaries. For example, while assessing vulnerabilities related to water logging or water scarcity, it was essential that spatial demarcation of the vulnerable areas was not interpreted as static zones but as fluid lines subject to the influence of temporal variations and socio-ecological conditions. While a particular area can appear as water-logged, this is subject to change and it does not preclude the possible vulnerability of currently non-vulnerable areas to water logging so long as the fundamental insufficiencies in drainage infrastructure remain unresolved. Incorporating an experiential understanding of physical distance also emerged as critical while understanding access to social and physical infrastructure. A distance of 1 km between a hospital and the settlement can be variedly interpreted as adequate or inadequate, depending on
access to public transport, road infrastructure and vehicle ownership. In addition, mapping experiential boundaries also brought to the fore questions of appropriate scale for data collection and attendant investigation. In some cases, these experiential boundaries allowed for pragmatic generalizations that refined problem framing. For example, considering the traditional hamlets or ‘tolas’ within the slum area, allowed for pragmatic generalizations about building typology which in turn helped develop a nuanced understanding of heat stress vulnerability. Yet, limiting data collection to these ‘tolas’ emerged insufficient. For instance, in understanding water logging vulnerability, addressing water challenges that are experienced locally requires an understanding of city and regional scale determinants and inhibitors as water is a regional infrastructure. Thus, while there are certain local experiences, an explanation and framing of these experiences necessitates data generation at higher scales. Thus, the criticality of scale and associated data sets.
9.3. Contrary Evidence and Triangulation
Intrinsically linked to the challenges associated with language and boundary is that of contrary evidence. One of the primary challenges that emerged was resolving contrary evidence. With data being generated from multiple stakeholders and through multiple tools there were often instances of variant social realities deriving from diverse perspectives being reported. For example, within a particular settlement, enquiries regarding public space access produced divergent reports in two iterations of the FGD exercise. On a later investigation it was found that this divergence was because the majority of the participants in the first FGD were from the SC community in the settlement who had exclusive access to a community hall and thereby reported public space access as adequate. Whereas, the second FGD had larger representation of the ST community in the settlement who did not have access to any exclusive built infrastructure for meeting and depended on traditional open spaces such as
Vulnerability
&
Assessment
Mapping 55
sarnasthal and jathre for their purposes. The existence of this contrary evidence was in itself an indicator of the multiple social realities that overlapped in context. In interpreting this contrary evidence, it was essential to consider the underlying socio-political identities and hierarchies that determined how various phenomenon manifested in context. With marginalization based on sociopolitical identities emerging as an important factor in exacerbating vulnerability, the need to elicit the diversity of urban experiences from various stakeholders in context emerged as an aim in itself.
9.4. Fluid Manifestation of a Siloed Approach
Related to challenges of content is the need to think beyond technical and sectoral silos. Urban phenomenon is characterized by and results from a highly complex network of causational and consequential links mediated by sociocultural relations. These inter-linkages need to be appreciated both in problem framing and solution formulation. Acknowledging these cross-sectoral interlinkages helps in appreciating the determining impact that certain fundamental social characteristics such as governance and community relations can potentially have on the distribution and exacerbation of various vulnerabilities. For example, in one of the settlements, discrimination based on social identity limited their access to vital social and physical infrastructure in spite of being within a relatively well serviced area and was a critical factor in rendering them vulnerable to various climate change induced threats.
9.5. New Data Points
Attempts to resolve the aforesaid challenges of contrary evidence and sectoral silos, often give rise to an additional challenge of incorporating new data categories. Especially in the context of relatively unexplored social phenomenon and contexts, the recursive data collection and analysis process helps identify new data categories with explanatory potential. To illustrate, while assessing
water logging, the mapping process initially focused on two factors, road conditions and drain typology. However, with FGD reports indicating that drainage infrastructure minimally covered the settlement, the need to identify the water flow channels self-constructed by community in response to settlement level terrain variation and drainage infrastructure discontinuities was critical. As such a new data category ‘No drain’ was included in the mapping process to identify community constructed water flow channels.
10. CONCLUSION
In navigating the above challenges, it is important to remember that the argument for bottom-up processes should not be construed as an either-or stance. Recognizing, eliciting and collating the experiential, context-specific, insider knowledge through bottom-up data collection processes should not be at the cost of severing its linkage and transmutability to institutionalized technical knowledge streams. It vital to acknowledge the complementary nature of community and technical knowledge streams and this understanding should be the deciding factor in choosing scales of investigation appropriate to project or policy objective. Especially within the Global South context, characterized by complex and conflicting socio-cultural fabrics, eliciting and integrating these diverse knowledge streams is a herculean task. Achieving it will require enshrining the spirit of collaboration that acknowledges complementary capacities. As the project described above revealed, bringing together the community mobilization capacities of the field partner MHT, the experiential knowledge capacities of the community members and the environmental planning capacities of the technical partners, allowed for the investigation to take on a strong action-oriented stance. Collaboration based on acknowledgement of complementary capacities and knowledge systems, allowed the project to emerge as a step in the direction of addressing the longperpetuated absence of bottom-up perspectives.
Vulnerability
& Mapping 56
Assessment
Acknowledgements
This report focuses primarily on the spatialisation of the data that emerged from a detailed primary engagement conducted by Mahila Housing SEWA Trust (MHT) in the three settlements of Ranchi. Integrated Design acknowledges the efforts of the MHT teams at Ahmedabad and Ranchi in facilitating the extensive field work without which the assessment and mapping of vulnerabilities would not have been possible. We also acknowledge the participation and corporation of the communities in Harijan Basti, Bhuiyan Toli and Chapu Toli in facilitating our study.
April 2021
