68 minute read
Impact Evaluation of Education Quality Improvement Programme in Tanzania: Endline Quantitative Technical Report, Volume II
3. Selection of control schools: PSM was used to match eligible control schools to the sample of treatment schools.
4. Selection of pupils within schools: pupils were sampled within schools using systematic random sampling. The within-school sampling was assisted by selection tables automatically generated within the computer assisted survey instruments. Information on the detailed procedure followed by enumerators to select the 15 pupils is in Box 1 Selection of teachers within schools: at baseline, simple random sampling was used to draw a sample of Standards 1-3 teachers to be interviewed and to fill in a teacher development needs assessment (TDNA). At midline, instead of sampling Standards 1-3 teachers all of them were selected for interview, but the baseline sampling strategy remained for the TDNA. Simple random sampling was also used to select a sample of Standards 4-7 maths teachers to fill in a TDNA. At endline, all Standards 1-3 teachers were selected for interview. The TDNAs were not administered at endline (see Section 3.2.4 below for reasons).
Box 1 Detailed procedure for within-school pupil sampling
Enumerators were trained to use the following procedure for sampling Standard 3 pupils: Collect the Standard 3 attendance registers for all streams, and check that they are filled in for ‘today’, then follow this sampling procedure:
1. Use a pencil. Have a rubber available.
2. Starting at 1, write a sequential series of numbers beside the names of all pupils who are present today.
3. If there is more than one stream in Standard 3, continue the number series on to the next registers.
4. The final number in your pencil number series is the number of pupils present today in Standard 3. Enter this number into the cell in the computer assisted personal interviewing (CAPI) instrument.
5. The CAPI instrument will automatically produce 15 pupil selection numbers in red font.1
6. Look again at the pencil number series you marked on the register/s. Find the pupil name which corresponds to the first selection number. Write the pupil’s name into the sampled pupils table.
7. Repeat the step above for the other 14 selection numbers. You will need to scroll in the table to see the spaces to enter all of the sampled pupils.2
Source: OPM (Midline Fieldwork Manual, April 2016). Notes: 1) The CAPI instrument automatically generates a random set of 15 different numbers of maximum value equal to the number in Step 4. 2) There is also a procedure for replacement in the event that any of the 15 pupils cannot take the test for a valid reason, for example being ill.
Table 1 shows the endline survey respondents, sampling and instruments. Two of the instruments lesson observation and the small group teacher interview (a newly introduced instrument at endline) were only conducted in treatment schools, because the information generated could not be used in the impact modelling and so collecting information in control schools was not necessary. More details are provided on the instruments in Section 3.2.4.
Overall, the sampling strategy yields a panel of schools (same schools visited during each round), and a repeated cross-section of Standard 3 pupils and Standards 1-3 teachers.
At baseline five out of 200 schools had to be replaced during fieldwork using a carefully controlled reserve list. Replacement was not necessary at midline or endline, and all schools that were interviewed at baseline were revisited and interviewed at midline and endline (see Annex D for endline fieldwork details).
Impact Evaluation of Education Quality Improvement Programme in Tanzania: Endline Quantitative Technical Report, Volume II
Table 1 Endline survey respondents, school-level sampling, and instruments Respondent School-level
sample
Instrument
Adapted Early Grade Reading Assessment (EGRA)
Standard 3 pupils
Parents of tested Standard 3 pupils
Standards 1 to 3 Kiswahili and maths teachers
In-service co-ordinator (INCO) together with some teachers that received in-service training
Head teacher
Enumerator observation of Standard 2 lessons
Enumerator observation
Sample (15 pupils present on the day)
Adapted Early Grade Maths Assessment (EGMA)
Pupil background
Sample (15 parents) Poverty score card
No sample1 Interview
No sample2 –Treatment schools only
Small group interview
No sample Interview, School records
Convenience sample3 –Treatment schools only
No sample
Lesson observation
Head count (of teacher and pupil attendance)
Source: OPM EL survey. Note: (1) At baseline, a sample of Standards 1 to 3 teachers were interviewed. (2) The enumerator invited all teachers that have attended EQUIP-T in-service training away from school since baseline to join the group interview. (3) Enumerators selected Standard 2 3Rs lessons on the basis of opportunity to observe given the time the survey team were in the school.
3.2.2 Sample size
The theoretical justification for the choice of target sample sizes for each unit is explained in the baseline report volume II p8. Table 2 contains the endline survey’s actual and intended sample sizes.
Table 2 Endline survey actual and intended sample sizes
Source: Evaluation endline survey. Notes: (1) The school instruments are: head teacher interview, data collection from school records, and head count of teacher and pupil attendance. (2) The samples include 16 head teachers (treatment) and 25 (control) who teach Kiswahili or maths to Stds. 1–3. All 7 teachers who were not interviewed were unavailable (absent on the day and could not be reached over the phone later). Some 11% of teachers were interviewed over the phone because they were absent on the day of the survey. (3) 95 maths (arithmetic) lessons and 101 Kiswahili lessons (either reading or writing) were observed. Some of these subjects were taught consecutively (without a break) in one class period. 138 separate class periods were observed.
Response rates are very high in the endline survey (Table 2). Actual sample sizes are close to target sample sizes for pupils, their parents and teachers The lowest response rate is 95% for maths lesson observations. These response rates are similar to those obtained at baseline and midline and slightly higher in most cases. Of the Standards 1-3 teachers due to be interviewed at endline, 11% were unavailable on the day of the survey but were later interviewed by phone this share is similar to the 9% of teachers interviewed by phone at midline.
3.2.3 Survey weights
In order to obtain indicator estimates that are representative of the EQUIP-T programme areas (more specifically, the 17 districts that comprise the impact evaluation sample), to feed into the descriptive trends that support the analysis of the theory of change, estimates were weighted using survey weights. The survey weights are computed as the normalised values of the inverse probabilities of selection into the sample for each unit of observation. The formulae for computing the weights for different units (schools, pupils and teachers) are in the baseline impact evaluation report volume II (p11). At baseline there were two sets of teacher weights, one for sampled teachers (those who were interviewed or took TDNAs) and one for roster teachers (for indicators which use data on all teachers in a school). At midline this was extended to three sets of teachers weights because all Standards 1-3 teachers were interviewed rather than a sample. At endline only two sets of teacher weights were needed: one for roster teachers (all teachers in a school), and another for Standards 1-3 teachers (all were interviewed).
The survey weights were applied within a survey set up in Stata (the statistical programme used to analyse the data) that takes into account clustered sampling, stratification and finite population corrections.
3.2.4 Survey instruments
The endline survey uses a set of instruments that retain most of the midline questions, but with some additions (and removals) to take into account changes in programme context and design. The content of the survey instruments used at midline are summarised in Table 3 below. The enumerators administered all of the instruments on tablets using Computer Assisted Personal Interviewing (CAPI).
Table 3 Quantitative survey instruments from midline
Description of content
1. Standard 3 pupil Kiswahili test (same pupils tested in both Kiswahili and mathematics)
Kiswahili literacy pupil test based on standard 1 and 2 curriculum requirements
2. Standard 3 pupil mathematics test
Mathematics pupil test based on standard 1 and 2 curriculum requirements
3. Standard 3 pupil background interview
Pupil background
Pupil’s school experience
4 Parents of Standard 3 tested pupil interview
Set of household characteristics (that can be used to convert scores into poverty likelihoods based on a pre-existing instrument)
Pupil background
Home support for schooling
5. Standards 1-3 teacher interview
Background information: gender, age, years of teaching, qualifications
Early Grade Reading Assessment (EGRA)
Early Grade Mathematics Assessment (EGMA)
Short pupil interview
Poverty score card
Teacher interview
Description of content
Frequency/type of in-service training received
Classroom teaching and pupil assessment practices
Support for teaching: lesson planning, observation, meetings, PTPs
Morale and other conditions of service
6. Teacher development needs assessment Kiswahili and mathematics
Teacher Kiswahili and mathematics subject knowledge assessment based on the primary school curriculum (standards 1-7 with limited materials from standards 1 and 2)
7. Standard 2 Kiswahili and mathematics lesson observations
Inclusive behaviour of teachers with respect to gender and spatial location of pupils
Key teacher behaviours in the classroom
Pupils’ reading and teacher support
Availability of lesson plan
Availability of desks, textbooks, exercise books, pencils, supplementary reading books during the lesson
8. Head teacher interview, data collection from school records and headcount
Background information on head teacher: gender, age, years of experience, qualifications
In-service training on school leadership and management
School background information: teachers, physical facilities, school timetable, number of days school open
Teacher management
School development plan, school information, school committee, parent-teacher partnerships, community engagement
School resources: cash (including capitation grants) and in-kind
External support for school leadership and management
Morale and other conditions of service
Teacher punctuality and attendance (by records and by headcount on the day)
Pupil attendance (by records and by headcount on the day)
Source: OPM 2018, p.27-28
Teacher Development Needs Assessment (TDNA)
Classroom mapping
Lesson observation
It is critical that the core information collected over multiple rounds remains the same so that estimates of key indicators can be reliably tracked over time. The midline instruments were not changed substantially for use at endline. Nonetheless, as the programme design and context has evolved since midline, additional information needed to be captured to inform the analysis of change, and some information became less relevant. Also, there were problems with some questions at midline, such as ambiguous wording, which only became apparent at the analysis stage and it made sense to address these issues in a set of revised instruments. There were two overarching changes to the suite of instruments, compared to the midline set, as follows:
TDNA instruments dropped: These were designed to measure teachers’ Kiswahili and maths subject knowledge, and were introduced at baseline because one of the original objectives of the early-grade teachers’ in-service training intervention was to strengthen subject knowledge. Teachers scored about 60% on average in both subjects at baseline, and the results did not change significantly by midline. This lack of change following programme implementation was not unexpected, as the final design of EQUIP-T’s in-service training chose not to focus on subject knowledge. At endline it made more sense to direct data collection efforts on instruments that are more directly relevant to the programme’s interventions, and so the decision was taken to drop the TDNA.
New small-group interview with teachers (focused on in-service training): The early-grade teacher in-service training is central to the programme’s theory of change, and has absorbed a large share of the programme’s spending. For this reason, it merits particular focus in the impact evaluation. Attendance at in-service training is already captured in early-grade teacher interviews, but given the high level of teacher turnover that was found at midline, getting a picture of the
Impact Evaluation of Education Quality Improvement Programme in Tanzania: Endline Quantitative Technical Report, Volume II delivery of in-service training at a school level over the duration of the programme is useful complementary data. By gathering a small group of teachers that have attended the different types of in-service training (3Rs curriculum, Kiswahili, maths and gender-responsive pedagogy), as well as the in-service training coordinator (INCO, typically the academic teacher), this instrument captures the delivery of the various residential in-service training courses, as well as the schoolbased in-service training sessions. Where possible, participants were encouraged to refer to records to provide information. This instrument required skilled facilitation, to help the respondents to reach consensus on the answers (in cases where there are no records), and to ensure that the interview was not dominated by one or two individuals. This approach to data gathering is commonly used at the community-level.
Apart from these two changes to the group of instruments, these are the main changes that have been made to the other midline instruments:
Parents of tested standard 3 pupils interview (score card): addition of questions on their child’s pre-school attendance (including school readiness programme (SRP)); communication with the school; awareness of the parent-teachers partnership (PTP); and corporal punishment.
Standards 1-3 teacher interview: addition of specific questions on EQUIP-T in-service training modules completed since baseline; attendance at ward cluster reflection meetings and school performance management meetings (SPMMs); outstanding non-salary claims; removal of questions on receipt of salary.
Standard 2 lesson observation: addition of observations related to gender-responsive pedagogy; use of maths learning materials (not textbooks); display of positive and safe learning campaignrelated materials.
Head teacher interview and school records: addition of questions related to initiatives to support pupil welfare (e.g. health, hygiene, safety and child protection); initiatives to support marginalised groups of pupils (girls, children with disabilities, pupils with learning difficulties, pupils that are vulnerable for other socio-economic reasons); new EQUIP-T interventions since midline (tablet-based SIS, business plans and income-generating activities (IGA), SPMMs, JUU clubs, pupil suggestion boxes); PTP grant spending patterns; more detail on head teacher’s attendance at in-service training; outstanding non-salary claims; removal of questions on receipt of salary, missing ages of baseline pupils, and information for sampling teachers for TDNA.
The revisions to the midline instruments were trialled during a pre-test held in February 2018 (see Annex D for details).
The original development of the instruments, and their contents, is described in detail in the evaluation baseline report volume II (pp13-18). Given the importance of the measurement of pupil learning to the impact evaluation (improving learning achievement is the main goal of the programme), it is worth briefly summarising the test design process. The OPM design team worked with a national team of specialists comprising Kiswahili and maths specialists from the University of Dar es Salaam, primary school teachers and a Tanzanian test design specialist, to develop the two pupil tests. The team developed new items adapted from an existing Early Grade Reading Assessment (EGRA) and an Early Grade Maths Assessment (EGMA) that was being used to monitor the Government’s BRN-Ed programme. Three pre-tests with purposive sampling were carried out to check item difficulty and discrimination, clarity of wording, protocols for accurate measurement, and child-friendliness. The test items are kept secure so that they can be re-administered each round.
3.3 Fieldwork timing and model
The endline fieldwork took place during the same months, April/May, as the baseline and midline fieldwork. Planning the endline fieldwork was made easier by the national adoption of standard dates for the mid-term break holiday just prior to fieldwork. At both baseline and midline, these dates varied by region, giving less flexibility in planning. There were no changes to the fieldwork model or protocols compared with midline, apart from for the new small-group teacher interview.
Teams of five or six enumerators visited schools over one day. Most of the data collection took place at school level, with the exception of the parent interview where enumerators went to parents’ households to interview them. As at midline, the key risk of using a one day model is that head teachers and early-grade teachers may be absent for interview. This risk was mitigated by using revisits in some cases, and by using phone interviews. This worked well, and the overall response rate for teacher interviews was 99% (Table 2). The pupil sampling is not affected by a one-day fieldwork model as the sample is drawn from those present on the day of the visit.
3.4 Quantitative analysis
3.4.1 Impact estimation
The quasi-experimental design relies on a propensity score matching (PSM) with difference-indifferences (DID) technique to estimate programme impact on a small set of impact and outcome indicators (see list below). As explained in detail in the midline evaluation report volume II (OPM 2017b, p34), this is an innovative approach that brings together PSM and DID in the specific context of the EQUIP-T evaluation, which is based on a panel of schools but repeated cross-sections of pupils and teachers. It is important to note that in a PSM estimation, outcome indicators from treatment units (i.e. programme school teachers and pupils) are compared to outcome indicators from specific control units based on the propensity score. This implies that the estimated average treatment effect will be valid for the group of treatment observations only, which, in turn, means that PSM produces an estimate of the Average Treatment Effect on the Treated (ATT). Extrapolating this estimate beyond the population for which the treatment sample is representative is not valid
Programme impact has been estimated on the following indicators, which are grouped under the relevant level of the results chain from the programme’s theory of change.
EQUIP-T impact: Improved learning outcomes, especially for girls
Proportion of Standard 3 pupils in the bottom Kiswahili performance band (%)
Proportion of Standard 3 pupils in the top Kiswahili performance band (%)
Proportion of Standard 3 pupils in the bottom mathematics performance band (%)
Proportion of Standard 3 pupils in the top mathematics performance band (%)
Mean pupil test score in Kiswahii (scaled as Rasch scores in logits)
Mean pupil test score in maths (scaled as Rasch scores in logits)
These indicators have also been disaggregated by gender in a separate descriptive analysis to assess how learning gaps have changed between baseline and endline.
EQUIP-T intermediate outcomes 1 and 2: Improved teacher performance, and enhanced SLM
Teacher school absenteeism (%)
Teacher classroom absenteeism (%)
Proportion of Standards 1-3 teachers who report participation in performance appraisal (%)
Chapter 4 contains further technical details on the impact estimation methods, including the use of a main identification strategy supported by a complementary strategy to ensure robust results. This chapter also contains supplementary results from the impact analysis.
3.4.2 Descriptive analysis of change in programme schools
A descriptive analysis of trends in the many quantitative indicators that were measured at baseline, midline and endline is used to help understand whether changes have happened or not in programme schools, as anticipated in the programme theory of change. This in turn helps to explain the results from the impact analysis. The descriptive analysis is guided by the Endline Evaluation Matrix Part I (provided in Annex C in Volume I) which contains the endline evaluation questions, linked to the theory of change that can be answered using quantitative evidence.
Note that this report does not contain descriptive trends for the control group of schools because directly comparing results from programme (treatment) and control schools, teachers and pupils would be misleading because of the way the control group was sampled (see Box 2 for further explanation).
Box 2 Reasons for not reporting descriptive trends from control schools, teachers or pupils
Given the quasi-experimental nature of the evaluation design, pupils, teachers and schools belonging to treatment and control groups are not immediately comparable. A number of modelling and analytical techniques are needed to ensure that selection bias is controlled for and the two groups can be compared for the measurement of programme impact (see Chapter 4 for details of the PSM and DID methods applied). This is also the reason why it is not advisable to present descriptive statistics pertaining to the control group only or any analysis that simplycompares descriptive statistics in the treatment and control groups. Whilst the treatment group school sample is representative of EQUIP-T schools in the districts covered by the evaluation, the control group school sample has been purposefully matched to the treatment group; it is not, in itself, representative of any underlying population since it has not been selected through probabilitysampling. In other words, the control group descriptive statistics cannot be weighted based on their probability of selection and would therefore not be representative of anymeaningful population. Similarly, juxtaposing treatment and control descriptive patterns and trends either separately at baseline, midline and endline or over time, would not be informative and would in fact be misleading. The only way in which treatment and control schools, teachers and pupils are comparable is through the impact estimation approach based on the PSM with DID analysis.
3.4.3 Quality assurance
The impact estimation analysis was reviewed internally by OPM’s statistical methods team, and then by a UK-based academic researcher, familiar with these methods and their application in education. Two other reviewers (a senior Tanzanian academic and an ex-World Bank Senior Education Specialist for Tanzania), provided comments and feedback on the descriptive analysis and interpretation. This same external reviewing team provided feedback on the draft baseline and midline evaluation reports. Annex B provides further details on the overall quality assurance processes applied in this study.
3.5 Risks and limitations
3.5.1 Contamination risk from other programmes
As the baseline report volume II (p26) highlights, the most common risk in longitudinal surveys is potential contamination of the selected impact study areas by third party interventions that may affect the outcomes of interest to the evaluation.
In this case, the risk of contamination comes from several large-scale primary education development programmes that have been working to improve the quality of primary education under the Government’s Education Sector Development Plan (ESDP) during the period that EQUIP-T has been operating. The impact evaluation identified these programmes and this risk from the outset, and have continued to monitor their main activities and geographical coverage, as well as collecting relevant information in the evaluation surveys, in order to assess the risk and understand its implications for the impact estimates produced in this study.
The three large-scale primary education programmes which potentially pose a contamination risk are: the Literacy and Numeracy Education Support Programme (LANES); the Education Program for Results (EPforR), formerly Big Results Now-Education (BRN-Ed); and Tusome Pamoja (let’s read together) a programme which started after the midline evaluation of EQUIP-T (see Box 3).
Box 3 Large scale primary education development programmes, apart from EQUIP-T
LANES: this runs from 2014/15 to 2018/19, funded by the Global Partnership for Education, with a budget of US$95m. It has national coverage (26 mainland regions) except for a few activities.
EPforR formerly BRN-Ed: this runs from 2014/15 to 2020/21 funded byWorld Bank, SIDA, DFID and GOT, with a budget of US$416m. It has national coverage, except for a few of the earlier activities under BRNEd.
Tusome Pamoja (let’s read together): this runs from 2016 to 2021, funded by USAID. Its covers four mainland regions (Iringa, Morogoro, Mtwara and Ruvuma) and all districts in Zanzibar.
Source: OPM 2018
The main activities conducted by these programmes in some of the impact evaluation study areas (mainly in the study control districts) that are most closely related to improving early-grade pupil learning outcomes are training activities for teachers, and TLM distribution. Annex H contains tables which summarise LANES, EPforR/BRN-Ed and Tusome Pamoja programme implementation between the baseline and midline evaluation (2014 and 2015); and between the midline and endline evaluation (2016 and 2017).
7 These tables set out programme activities and their geographical coverage in relation to the EQUIP-T regions/districts. This information, together with data collected in the evaluation surveys, particularly from teachers on the receipt of in-service training by provider (see Table 4 and Table 5 below) has been used to assess the contamination risks, as follows.
Table 4: In-service training received by teachers in treatment schools in the previous two years (trends in programme areas)
Impact Evaluation of Education Quality Improvement Programme in Tanzania: Endline Quantitative Technical Report, Volume II
Attended in-service training over the last two years provided by: (% Stds 1-3 teachers)
Sources: Evaluation baseline, midline and endline surveys (teacher interview).
Notes: (1) Weighted estimates. (2) This is for all interviewed teachers who teach maths or Kiswahili to Standards 1-3. (3) The relevant period for BL is 2012-2013, for ML 2014-2015 and for EL 2016-2017.
Table 5: In-service training received by teachers in control schools in the previous two years1 (trends in control areas)
Attended in-service training over the last two years provided by (% Stds 1-3 teachers)
Sources: Evaluation baseline, midline and endline surveys (teacher interview).
Notes: (1) Unweighted estimates. (2) This is for all interviewed teachers who teach maths or Kiswahili to Standards 1-3. (3) The relevant period for BL is 2012-2013, for ML 2014-2015 and for EL 2016-2017.
Contamination risk: baseline to midline
Between baseline and midline, the only programme identified as a contamination risk is LANES. It carried out a sub-set of activities in the study control districts: one-off in-service curriculum orientation training for Standards 1 and 2 teachers on the new Standards 1 and 2 curriculum, and one-off SLM training for head teachers and WEOs. The midline impact evaluation survey confirmed that teachers and head teachers in the study control areas had received this training.
Table 5 shows that about 50% of early grade teachers in control schools reported receiving training from LANES at midline. Both of the LANES training activities were one-off events in the case of the teachers, this was a 10 day residential training held in Dodoma with no follow-up school-based training. The likely contamination risk from these LANES activities was discussed at the evaluation’s baseline reference group meeting, which included representatives from government ministries, departments and agencies responsible for education in Tanzania. The view from that meeting was that these initial LANES interventions were unlikely to pose a serious contamination risk, as the likely impact on pupil learning would be minimal (too dilute) prior to the midline round of the impact evaluation, without further inputs (OPM 2017b).
Contamination risk: midline to endline
Between midline and endline, the vast majority of LANES activities have affected all schools across the country, and hence the likely contamination risk is low (since any effects are likely to be similar in treatment and control schools). This includes curriculum orientation training for teachers on the new Standards 3 and 4 curriculum. The endline evaluation survey confirms that early grade teachers in both treatment schools (Table 4) and control schools (Table 5) received LANES training. The main
Impact Evaluation of Education Quality Improvement Programme in Tanzania: Endline Quantitative Technical Report, Volume II exceptions are one-off training for WEOs with financial support for school visits, and one-off training for school committees.
By contrast, Tusome Pamoja is likely to have contaminated the EQUIP-T impact estimates to some extent. This programme operates in Ruvuma, which contains one of the impact evaluation’s control districts. Tusome Pamoja’s interventions include a sub-set of similar activities to the EQUIP-T programme, notably in-service training for Standard 1 and 2 teachers on the new 3Rs curriculum, and provision of reading books for pupils. The endline survey confirms that about 7% of early grade teachers in control areas received training from Tusome Pamoja ( Table 5) and in fact this is confined to Ruvuma where 86% of early grade teachers reported being trained by Tusome Pamoja.
In assessing the extent of contamination from Tusome Pamoja in the impact estimates, it is important to bear in mind that by endline EQUIP-T had been operating for close to four years, while Tusome Pamoja had only been implementing at school level for about one and a half years. In addition, EQUIP-T has delivered a broader and more intensive set of interventions at school level than Tusome Pamoja had by endline. These factors suggest that the impact of EQUIP-T on pupil learning by endline is highly likely to outweigh any initial impact of Tusome Pamoja on pupil learning.
The EPforR programme is a national programme. It operates via a results-based financing mechanism whereby a group of development partners (DFID, World Bank and SIDA) reward the Government for achieving a set of disbursement-linked results on an annual basis. The targets relate to strengthening the overall education system, and, as such, do not pose a particular contamination risk for the EQUIPT evaluation. However, the precursor to this programme, BRN-Ed, had school-level components which were implemented in a selection of districts. Indeed the sampling strategy for the EQUIP-T evaluation took care to exclude districts with known BRN-Ed school activities (see Section 3.2). This did not prevent contamination entirely however, perhaps partly due to teacher transfers. Early grade teachers in both treatment and control schools report receiving training from BRN-Ed or STEP (which was a teacher training programme under BRN-Ed) see Table 4 and Table 5. While the prevalence of BRN-Ed or STEP training among the surveyed early grade teachers is very low at both baseline and midline, by endline 4% of treatment teachers reported receiving BRNEd compared with 3% of control teachers; while 13% of treatment teachers said they were trained by STEP compared with 6% of control teachers. This suggests that BRN-Ed and STEP activities have affected both treatment and control schools, to a roughly similar degree. Assuming therefore that any effects on pupil learning from these programmes are roughly similar in the treatment and control areas, the likely contamination is fairly minimal.
The main implication of the contamination risks identified above is on the interpretation of the EQUIPT impact estimates. This is discussed next.
Implications of contamination for interpretation of the impact estimates
The discussion on contamination risks above suggests that LANES (baseline to midline) and Tusome Pamoja (midline to endline) are likely to have contaminated the EQUIP-T impact estimates to some extent because of their operations in the impact evaluation control districts. This has implications for the interpretation of the impact estimates presented in this report. Specifically, the impact identified by the analysis represents the effect that EQUIP-T as a package has had on outcome indicators, compared to a counterfactual situation where, in the same schools, the alternative LANES and Tusome Pamoja training and materials have been delivered. In other words, the analysis measures the added impact of all EQUIP-T-related interventions over and above the potential effect of the other LANES and Tusome Pamoja initiatives. If certain assumptions hold (Box 4) then the full impact of EQUIP-T may in reality be slightly higher than the estimates in this study.
Box 4: Assumptions related to the interpretation of the impact estimates
Although there are reasons to assume that the extent of contamination from LANES and Tusome Pamoja in the evaluation’s control districts is fairly minimal, it is also reasonable to assume that if these interventions have had any effect on the outcomes being measured in this study (such as pupil literacy and numeracy levels), it is likely to have been positive. Under this assumption, outcome levels in the control group schools are, on average, higher than they would have been in a pure counterfactual situation (with no contamination). This in turn means that the impact of EQUIP-T, which is estimated by comparing treatment schools and control schools over time, is potentially a slight underestimation of the full impact of EQUIP-T as a whole. This ignores the possibility that the effects of the BRN-Ed/STEP training which took place to a limited extent in both treatment and control areas, had a greater positive effect on pupil learning in treatment areas than in control areas. If in fact the latter is true, then this would reduce any potential overestimation of EQUIP-T impact due to LANES or Tusome Pamoja contamination of the control areas.
3.5.2 Confounding theory of change failure with implementation failure
This is the risk that the programme does not have the expected effect because it is not implemented as intended, rather than because its underlying design and theory of change is flawed. For example, key activities don’t happen or happen too slowly or that different activities happen. The design of the impact evaluation aims to address this by using the theory of change to frame the analysis (see, Endline Evaluation Matrix (Part I) in Volume I Annex C) in order to understand if changes have happened as anticipated or not, and to explain why. It is important to note, however, that the impact evaluation does not include a process evaluation, so its focus is on how effective the programme has been in meeting its objectives, rather than on the details of receipt of inputs and timing of activities, although the survey does collect basic information on implementation. The impact evaluation relies on information from the EQUIP-T MA in its annual reports on the status of implementation. This documentation gives an overview of the implementation of different components overall each year, and notes any major adjustments to programme design (which in turn has been used by the evaluation team in designing each round of research) The EQUIP-T annual reports have become less detailed over time, however, and the evaluation team have increasingly relied on interviews and email correspondence with EQUIP-T MA staff to fill in gaps related to the nature of interventions and their intended timing and volume. School- ward- or district-level implementation data is not readily available on component activities, and so a detailed analysis of the status of implementation in the areas under evaluation is not possible.
3.5.3 Limitations to the quantitative component
Some of the general limitations of the quantitative component are set out in Table 6 together with explanations of how these limitations have been addressed in the endline design and analysis. Some of the specific limitations to the endline quantitative analysis include:
Head teacher absence on day of survey: In 40 of the 200 schools (20%), the head teacher was absent from school on the day of the survey. This meant that the assistant head teacher or another teacher at the school who is knowledgeable about school records and practices answered all school-related questions in the head teacher interview. Phone interviews were conducted with 38 of these 40 absent head teachers to collect the remaining information such as head teachers’ training attendance, teacher management, morale and perceptions of the usefulness of school committee support, community support, and WEO support. At midline in 36 out of the 200 schools (18%) head teachers were absent on the day of the survey.
Teacher interviews conducted over the phone: 11% of teacher interviews were conducted over the phone because these teachers were absent from school or unavailable to be interviewed on the day of the survey. This could have implications for the quality of the data as 30 to 40 minutes is considered a long period for a phone interview and also there are certain modules such as in- service training attendance that rely on effective probing from enumerators in order to elicit accurate responses from the respondent. Additionally, it was not possible to ask these teachers the questions which required them to show written records (examples of pupil assessment, feedback on lesson observation and lesson plans). A similar share of phone interviews were conducted with teachers at midline (9%).
Pupils administered the scorecard questionnaire: 8% of scorecard interviews were conducted with the pupils themselves as opposed to with their parents, guardians or other adult household members, as the latter were not available even after more than one visit attempt. This had two implications. Firstly, pupils were only asked the questions relating to the household characteristics, and as a result there was high item non-response rates on the other information relating to the education support pupils receive at home and to households’ awareness of school noticeboards and PTPs. Secondly, this could have implications on the quality of the data collected as answers from the pupils will be less reliable than answers from adult household members. A similar share of pupils were administered the scorecard questions at midline (7%).
Recall bias with the data from the in-service training teacher group questionnaire: The in-service training group questionnaire collects information on all of the EQUIP-T residential and schoolbased training sessions that teachers from the school had attended since 2014. The survey finds that only 27% of all school-based training sessions in a school had a record available. This means that the majority of information collected in this interview relies on the memory of respondents. This includes information on the date of the sessions, the topics and participants. In order to reduce the recall bias, the interview was not administered individually to the INCO but rather was conducted as a group interview with the INCO and a small group of other teachers who were knowledgeable about the training activities that had taken place and who themselves had attended the majority of the sessions. During the endline pre-test, this strategy was found to refresh the memory of participants and to improve the accuracy of the collected data.
Problems with comparing baseline and endline estimates of certain SLM indicators because of changes in administration:
Teachers were asked to show written examples of their own pupil assessments, written feedback on their lesson plans, and written feedback on a lesson observed by the head teacher. At baseline, these examples were sought during the interview. At midline and endline these questions were asked at the end of the interview, because during the midline pre-test it was observed that requesting these examples during the interview was very disruptive. There is some suggestion from field feedback that some teachers were reluctant to look for evidence at the end of the interview because they wanted the interview to be finished. This may also have affected how they answered the previous questions on whether these actions had taken place (for example, answering ‘Did you receive feedback from the head teacher on your lesson plans in the last 30 days?). It is difficult to unpick the possible effect of this change in administration, but it means that baseline and endline results are not strictly comparable.
There was also some ambiguity in the meaning of the terms ‘lesson observation’ and ‘written feedback’ between baseline and midline. Although the wording of the related questions did not change between these rounds, the training of enumerators at midline emphasised more precise definitions of these terms, and that they needed to probe respondents to ensure that they captured the information accurately. This may have compromised the comparison between baseline and midline for indicators of lesson observation and written feedback to some extent. Between midline and endline, the training of enumerators on these terms was the same, and in addition the terms were defined in the questions. The most reliable estimates are likely to be those captured at endline, and the trends need to be interpreted with some caution.
Table 6: Limitations to the quantitative component of the impact evaluation and mitigating factors
Possible limitation Why is this limiting and what mitigating factors were taken?
EQUIP-T regions and districts were purposively selected to target those performing weakly on selected education indicators
Language spoken at home is not the language of instruction
Not possible to substantially change survey instruments after the baseline
An RCT design was not possible for the impact evaluation due to purposively selected treatment regions and districts. A quasi-experimental PSM-DID approach was chosen instead to establish an appropriate counterfactual to assess EQUIP-T impact. This relies on the assumptions of PSM to mimic the experimental approach. A key assumption of PSM is that the information on observables is sufficient to match the control and treatment groups for the purposes of the evaluation. If the groups are matched on observables, but differ on unobservable and time-variant characteristics that affect the impact indicators, the estimate of impact will not be robust. See Chapter 4 for further explanation of ways this risk has been minimised.
Pupils that do not speak Kiswahili at home (as a main language) may be systematically disadvantaged by pupil tests conducted in Kiswahili. Diagnostic tests on the endline pupil test data did not find any substantial differential item functioning related to home language.1
If there are substantial changes to the EQUIP-T programme design after the baseline the instruments may not be able to measure this. The indicators included have been carefully considered to ensure they capture key EQUIP-T outcomes and outputs as per the original design.
The endline survey was adjusted to accommodate some of the key changes and additions in the EQUIP-T programme design such as the introduction of the new 4B component, COL for teachers and head teachers and school information system. However, there are limits. For example, trend analysis of indicators related to component 4B is not possible and there are also other design features of the programme that could not be assessed such as the School Readiness Programme (although this was included to some extent in the midline qualitative research).
The number of teachers per school is small in the control and treatment districts
Inaccurate identification of EQUIP-T interventions by respondents
The total sample of teachers was smaller than originally anticipated with implications for the power of detection of impact. A larger school sample size would have been required to address this issue but was not deemed possible by DFID for cost reasons. See baseline evaluation report volume II (OPM 2015b, p19) for notes on this risk. See midline evaluation report volume II (OPM 2016b) for explanation of how the small sample sizes affect the impact estimation.
Respondents do not always know the official name of programme interventions or that they come from EQUIP-T. Multiple names for the same intervention may be in use, and there is the possibility of respondents mixing up EQUIP-T interventions with other similar development interventions.
The instruments were carefully pre-tested at midline and endline, and some questions were adjusted to deal with naming confusion which arose at this design stage. Similarly during enumerator training and piloting many school visits took place to practice the survey protocols and to review data collected. Daily debriefs were held, and changes to the instruments and training manual were made as appropriate. Enumerators were also trained on the specifications of the most common trainings that had taken place in the impact evaluation regions such as EQUIP-T, LANES and Tusome Pamoja, in order to be able to effectively probe during the interview. This included information on where and when the training took place, and who delivered the training. The latter was important as some respondents reported the name of the training by the organisation or agency that delivered the training such as ADEM as opposed to the provider of the training.
Notes: (1) The differential item functioning tests were carried out as part of a Rasch analysis of the pupil test data (see Annex E for information on measurement of pupil learning using the Rasch model of item response).
Impact Evaluation of Education Quality Improvement Programme in Tanzania: Endline Quantitative Technical Report, Volume II
Part E Supplementary evidence
4 Impact estimates
This Chapter explains the measurement approach taken to impact estimation and presents the detailed results.
4.1 Impact identification strategy
A rigorous identification of programme impact in quantitative studies relies on the idea that such impact can be defined as the difference in the outcomes measured among individuals that participate in a programme compared to the outcomes measured among the same individuals in a theoretical state of the world where the programme is not implemented but where everything else, except the programme, stays the same. This is normally referred to as the counterfactual and, because it is purely hypothetical, they key challenge that impact evaluations face is to find alternative observed counterfactual measures that can credibly be used to approximate this hypothetical counterfactual as closely as possible and thus infer programme impact.
A Randomised Controlled Trial (RCT), whereby subjects are randomly assigned to a treatment and control group, is commonly considered as one of the most robust designs to deal with the problem of the counterfactual. Because treatment assignment is implemented randomly in these trials, individuals from control and treatment groups are, on average, the same. This means that after the implementation of the programme, averages of outcomes measured among participants and nonparticipants can be compared directly and differences can be attributed to the programme, rather than any other confounding factors. Sometimes, however, implementing an RCT is not feasible or not appropriate. Alternative identification strategies use econometric modelling techniques to try to come as close as possible to replicating the situation of such an experimental design.
This was the case in the present evaluation, where an RCT was not feasible and schools were assigned to participate in the programme based on programme management decisions and some predefined characteristics. Control schools were selected to match those characteristics.8 Specifically, the quantitative impact identification methodology used in this study, both at midline and endline, follows a quasi-experimental design that combines two approaches: Propensity Score Matching (PSM) and Difference in Difference (DID) analysis. This is applied in the context of an evaluation design based on a panel of schools and on repeated cross-sections of pupils and teachers. Combining PSM and DID takes advantage of the strengths of both of these methods in order to robustly estimate the difference in key impact indicators across treatment and control schools that can be attributed with statistical confidence to EQUIP-T. The following sections describe how PSM and DID were combined in the current endline evaluation to obtain our impact estimates. Please refer to Sections 6.2 and 6.3 of the midline impact evaluation volume II (OPM 2017b) for a detailed discussion of the assumptions behind PSM and DID as well as a detailed explanation of the approach used to implement the estimation models.
4.2 Combining DID and PSM
In this study, two different strategies have been used to combine PSM with DID:
1. Directly comparing ATT estimates at endline and baseline across time.
2. Matching treatment observations across time to construct a pseudo panel9 of treatment observations and to construct an overall ATT estimate using this pseudo panel only.
8 Note that the term ‘control group’ is used throughout this document to refer to the quasi-experimental comparison group. 9 We refer to this as a ‘pseudo’ panel since it is constructed by matching repeated cross-sections of pupils and teachers.
ATT refers to the Average Treatment Effect on the Treated. In a PSM estimation, outcome indicators from treatment units (that is, programme school teachers and pupils) are compared to outcome indicators from specific control units based on the propensity score, which is a metric of similarity of treatment and control units. This implies that the estimated average treatment effect is valid for the group of treatment observations only, which, in turn, means that the ATT obtained with PSM cannot be extrapolated to observations (i.e. pupils and teachers) outside the sample
The first strategy was to take a direct difference of baseline and endline estimations of ATTs derived from PSM at baseline and endline. Essentially, this amounts to comparing two estimated treatment coefficients with each other. In theory, ATT estimates at baseline should be close to zero – because EQUIP-T had not started at that time yet. However, this was not always the case, despite good balancing performance of models at baseline. This means that the overall impact of EQUIP-T is defined as the difference that EQUIP-T made in the estimated ATT at endline, compared to the baseline estimate:
Of course, the main goal is to see whether the overall ATT estimate is different from zero or not. Test statistics for the estimate defined in (1) are calculated using the formula for comparing coefficient estimates presented in Paternoster et al. (1998). Using this test statistic, this study then calculates whether the estimated ATT is significantly different from zero or not from a statistical point of view. Note that all standard errors for the endline and baseline ATT used are based on bootstrapping procedures for PSM estimates. (See section 4.4 on why standard errors for PSM are bootstrapped.)
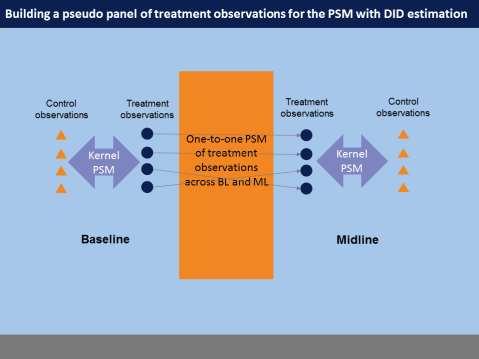
The second strategy is a robustness check where additional matching is used to create a ‘pseudo panel’ of treatment observations (that is, teachers and pupils in EQUIP-T schools) across time, given that these have not been panelled and were surveyed as repeated cross-sections. Figure 1 depicts this process graphically.
In a first step, treatment observations from teacher and pupil samples are uniquely matched across the two time periods10. This is done using a Nearest Neighbour PSM approach without replacement. This means that for each treatment observation at baseline a unique comparator is found at endline. In this way an artificial panel of teachers and pupils is constructed, as each individual teacher and pupil at baseline is associated with a single matched teacher and pupil at endline
For this ‘pseudo panel’ of treatment observations, values obtained for their respective matched comparisons at baseline and endline are then used to calculate differences between estimated control group and treatment group individuals at baseline and at endline separately, using the same PSM models as in the main estimations. Note that kernel matching at baseline and endline provides, for each treatment observation, an appropriate estimated counterfactual value based on the PSM estimation. This value is used to calculate the first difference between treatment observations and counterfactuals, as part of the double differencing approach underpinning the DID analysis.
In a final step, those differences are then compared across baseline and endline for the ‘pseudo panel’. The average of this double difference for the pseudo panel is the estimated overall ATT. By implementing this approach, this study follows a suggestion by Blundell and Costa Dias (2000, p. 451). This study is likely to represent the first practical application of this PSM with DID procedure for
10 For more detailed information on how relevant teacher and pupil characteristics were selected to match treatment and control groups (in both the first and second strategy) please refer to Section 6.2 of the midline impact evaluation volume II (OPM 2017b) a repeated cross-section, in an education evaluation of teachers and pupils. It was developed at midline and it is replicated here at endline.
The key difference to the first strategy is that this double differencing is implemented only across treatment observations that are similar to each other, as they have been matched one-to-one in the first step. One potentially adverse effect of this strategy is that the sample size used in the impact estimation can be reduced due to the common support requirements of the additional matching (that is, bad treatment matches are dropped from the sample).
4.3 How results are presented in Volume I
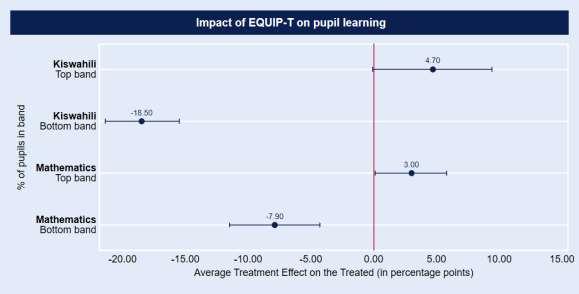
In Volume I, headline results are presented in a visual form, with an explanation underneath each graph. These headline results are the results of the first PSM DID combination strategy. See Figure 2 below for an example. Each graph shows point estimates for treatment effects (ATT) on outcome indicators and 95% confidence intervals for these effects. This means that the probability for the true treatment estimate to fall within this area is 95%.
Outcome indicators used in this evaluation are mostly proportions. When that is the case, estimates of treatment effects are given in percentage point changes of these proportions. For example, if the ATT estimate on the proportion of pupils in the bottom performance band of Kiswahili in treatment schools is -0.183, this means that EQUIP-T has reduced this proportion by approximately 18 percentage points, compared to a counterfactual of no EQUIP-T package and some alternative teacher training. Equivalently, this can be expressed as a decrease of 18 percentage points in the probability of pupils from treatment schools to fall in this bottom performance band. The only exception is represented by the impact estimates on the Kiswahili and maths test score (scaled as Rasch scores see Annex E for details on the measurement of pupil learning outcomes using an interval scale). In that case, estimates of treatment effects are given in logits. For example, if the ATT estimate on the pupil Kiswahili Rasch score is 0.574, this means that EQUIP-T has increased pupils’ average maths Rasch score by 0.574 logits, compared to a counterfactual of no EQUIP-T package and some alternative teacher training. When confidence intervals of such estimates do not overlap with zero, then this is an indication that this treatment effect is truly different from zero. This zero value is indicated using a red line in the graphs.
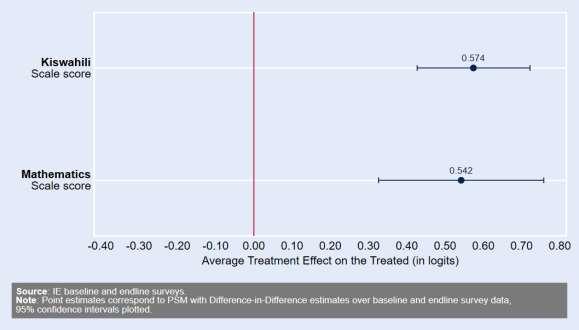
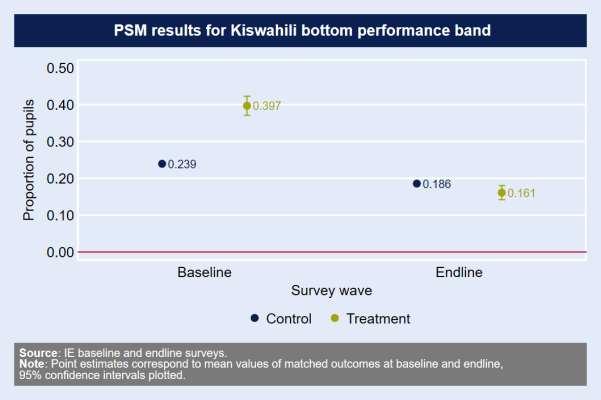
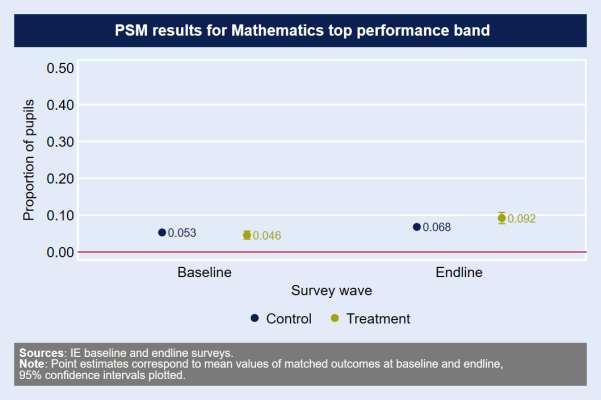
As explained above, the ATT estimates shown here are the results of the first strategy to implement PSM DID estimations, and thus take into account information both from the baseline and the endline data. Comparing Figure 2 to Figure 3 can help to understand this. Figure 3 below shows estimates of averages of the treatment group and of matched counterfactuals at baseline and at endline. Note that the control estimates are not simple descriptive statistics – they are the averages of counterfactual observations constructed using PSM. The PSM DID estimates presented in Figure 2 correspond to the double difference of the averages presented below. The first difference at endline is 0.161 - 0.186 =0.025. The same difference at baseline is 0.397 - 0.239 = 0.158. The double difference estimate is0.025 -0.158 = -0.183. This corresponds to the ATT estimate presented in Figure 2 (rounding off decimals). When looking at the graph below, one can see that the difference between EQUIP-T and control schools has effectively decreased over time – this decrease in difference is the ATT estimate and is attributable to EQUIP-T.
4.4 Caveats - Addressing weaknesses in the analysis
Four key caveats related to the present estimation strategy need to be mentioned here. First, PSM only controls for observable characteristics that cause selection bias. This is a problem for any impact identification strategy that relies on controlling only for factors (variables) that can be observed in the data, not only PSM. PSM helps addressing this by allowing for extensive balancing checks after matching, which can provide substantial evidence for the fact that balance is achieved across a large variety of characteristics and, by implication, is likely to also extent to unobservables. In this study, such extensive balancing checks were implemented. Results are presented in Section 4.5 below. In addition, the DID strategy implemented in the present case helps to control for remaining imbalances that may be due to time-invariant unobservable variables.
Second, DID helps to deal with time-invariant imbalances, but not time variant ones. This means that only time-invariant imbalances that remain after PSM would be controlled for, in contrast to imbalances that vary over time. In the present case, this is addressed by extensive balancing tests, which show little remaining covariate imbalance in general after PSM, by showing that results are robust to a variety of different PSM specifications, and by showing that results are robust to two separate DID strategies used. Together, this evidence implies that results are robust, remaining imbalances are small, and results are unlikely to be sensitive to or to be driven by such imbalances, even if they were time variant.
Third, as already discussed in Section 3.5.1 on contamination risks in Chapter 3, over the course of the evaluation period in-service teacher training and SLM training for head teachers (as well as some other initiatives to improve education quality) have been implemented not only in EQUIP-T schools,
Impact Evaluation of Education Quality Improvement Programme in Tanzania: Endline Quantitative Technical Report, Volume II but also in control schools. In the two years following the midline analysis (2016 and 2017), the LANES programme has continued and a new large-scale programme, Tusome Pamoja, has begun. It seems reasonable to assume that additional contamination risk from LANES activities that have taken place since the midline impact evaluation is minimal, because the vast majority of activities have affected all schools, including EQUIP-T schools and schools in the control group. However, Tusome Pamoja’s interventions include a sub-set of similar activities to the EQUIP-T and the new programme operates in Ruvuma, which contains one of the impact evaluation’s control districts. One of the main reasons for conducting the quantitative survey part of the impact in 2018, rather than waiting until 2019, was to try to minimise any contamination effects of Tusome Pamoja In any case, the presence of these competing initiatives in the evaluation areas means that the impact identified is the effect that EQUIP-T as a package has had on the outcome indicators compared to a counterfactual situation where in the same schools the alternative training from control schools would have been implemented. The PSM DID approach still ensures that the treatment and control groups are comparable and allows identification of the marginal impact attributed to EQUIP-T and thus its added value. Box 4 in Section 3.5.1 (Chapter 3) explains more about the assumptions under-pinning the interpretation of the impact estimates in light of the contamination from other programmes.
Finally, calculating standard errors of estimated treatment effects using PSM methods is not straightforward. As Caliendo and Kopeinig (2005, p. 18) put it, ‘The problem is that the estimated variance of the treatment effect should also include the variance due to the estimation of the propensity score, the imputation of the common support, and possibly also the order in which treated individuals are matched’. These estimations increase the variation of the treatment effect estimates over and above normal sampling variation. In the literature, there is no consensus on how to take this into account.
A popular approach to solve this problem is to bootstrap standard errors for the estimated treatment effect (see Lechner 2002). Each bootstrap draw re-estimates both the first and second stages of the estimation. This produces N bootstrap samples for which the ATT is estimated. The distribution of these means approximates the true samp ling distribution, and therefore the standard errors of the population mean (Caliendo and Kopeinig 2005, p.18). This study followed this approach both at midline and at endline and implemented bootstrapping, using 200 repetitions, to estimate the standard errors of the estimated treatment effects. Note that, for the sake of completeness, this report shows both the bootstrapped and the non-bootstrapped standard errors below.
It is also important to note that there is no clear direction in which estimated standard errors should change due to bootstrapping. On the one hand, the additional variation taken into account should increase standard errors. On the other, bootstrapping generally makes estimates more precise, which tends to decrease standard errors. Overall, the direction of the change is not uniform. In fact, the results show that, with bootstrapping, standard errors in some instances are smaller and in some larger than without bootstrapping.
4.5 Results
This section presents the results obtained from applying PSM to EQUIP-T baseline and endline data. In the following paragraphs, the balancing results, the ATT estimates and the PSM-DID estimates described for all impact indicators for the main strategy and the robustness check11 . The following indicators were analysed in the context of this evaluation:
11 It is important to highlight the fact that a large range of results where produced in the course of the analysis across a range of different models, including varying levels of trimming and bandwidth size for the kernel matching algorithm. This extensive investigation of alternative specifications provided the opportunity to select the most appropriate and robust estimation
Impact Evaluation of Education Quality Improvement Programme in Tanzania: Endline Quantitative Technical Report, Volume II
Table 7: Impact indicators for PSM-DID estimation
Impact area
Impact indicators
Proportion of pupils in the top performance band of the interval scale1 for Kiswahili
Proportion of pupils in the bottom performance band of the interval scale for Kiswahili
Sample for the impact evaluation
Pupil learning
Proportion of pupils in the top performance band of the interval scale for Mathematics
Proportion of pupils in the bottom performance band of the interval scale for Mathematics
Rasch Scores for Kiswahili
Rasch Scores for Mathematics
Proportion of teachers who were absent on the day of the survey
Standard 3 pupils who were assessed
Teacher absenteeism
Proportion of teachers present on the day of the survey, timetabled to teach before lunch and absent from the classroom
All teachers (from roster)
School leadership and management
Proportion of teachers who report participation in performance appraisals
Interviewed teachers of Standards 1-3
Note: (1) Annex E explains how the scales for Kiswahli skills and maths skills were developed. The method applies the Rasch model of item response (the simplest item response theory model) to the pupil test data, and generates estimates of pupil ability (performance) and item difficulty on a common interval scale (under assumptions that the data satisfies the key properties of the model).
For each of the outcome variables, this study implemented two PSM DID strategies, one main strategy and a robustness check outlined in Section 4.2
Presentation of results
For each outcome variable, three sets of results are presented in this volume:
the second stage results;
the propensity score matched outcomes at baseline and endline; and
the PSM-DID estimates.
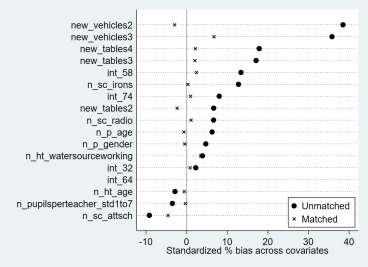
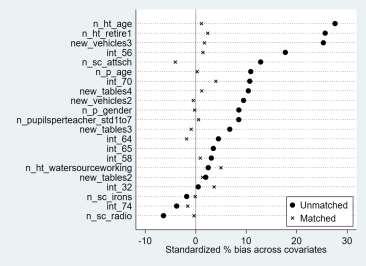
The following paragraphs use the example of Figure 13 to explain the interpretation of the results in detail. The rest of the results are then presented in graphical form.
First, the second stage results for the main strategy are presented, as illustrated in Figure 13 for the indicator on top performance band for Kiswahili. The figure is divided into two panels; the top panel and the bottom panel show baseline and endline results respectively. The format for each panel is as follows: strategies for which results are presented in this report. At the same time, consistency or inconsistency in the direction and significance of results emerging from this range of models help determine whether any findings on impact (or lack of thereof) can be considered conclusive or yet inconclusive.
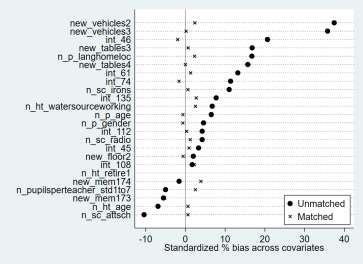
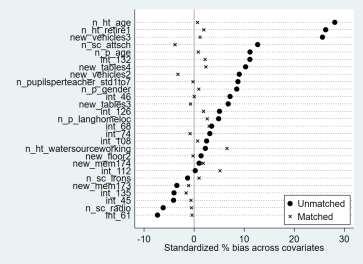
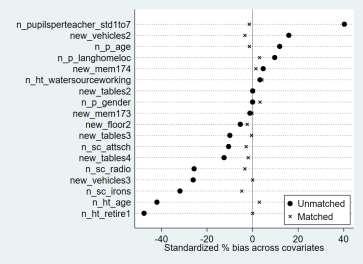
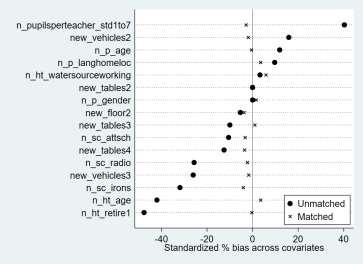
The first graph on the left-hand side indicates how individual variables balance before and after matching. The x-axis displays the standardised bias, which is the percentage difference of the sample means in the treated and non-treated (unmatched or matched) subsamples as a percentage of the square root of the average of the sample variances in the treated and nontreated groups (Rosenbaum and Rubin, 1985). In Figure 13 below, for example, the unmatched samples display large imbalances with standardised bias being present across many of the covariates of interest. However, once matching takes place, the standardised imbalances are diminished.
The second graph, on the right-hand side, shows the distribution of propensity scores across treatment and control groups. This graph visually confirms that, after dropping observations that are off common support, both treatment and control groups contain observations with propensity scores across the full range of the distribution, which is an indication for overall balance. Although the distributions of propensity scores across treatment and control groups would ideally be symmetric, the presence of some level of skewness does not put at risk the estimation procedure, as indicated by the balance achieved for each covariate and the values of Rubin’s R and B, which are tests on the overall balance achieved between treatment and control groups, after matching.
The remaining rows on the right-hand side display information related to the PSM model. The bandwidth and level of trimming for the optimal PSM model can be found in the first two rows. For example, the optimal model has a bandwidth of 2 and a trimming value of 3 for the baseline sample in Figure 13. This is then followed by the number of observations on common support in the next row, and then the Rubin’s R and Rubin’s B values both before and after matching. Generally, a Rubin’s B score under 25 after matching is desirable, whilst a Rubin’s R score between 0.8 and 1.25 is the preferred range after matching (Rubin 2001). The unmatched samples are particularly unbalanced; for instance, the Rubin’s B for the baseline sample and the endline sample is 67.97 and 74.06 respectively. However, the Rubin’s B scores after matching, which are all below 25, show how matching removes the previous imbalances.
Finally, the remaining rows on the left-hand side indicate the ATT for each corresponding survey wave and the associated standard errors. Given that it is not definitively clear how to produce standard errors for PSM, both bootstrapped and non-bootstrapped standard errors are presented for robustness purposes. (See Section 4.4 for more detail on this.)
Impact Evaluation of Education Quality Improvement Programme in Tanzania: Endline Quantitative Technical Report, Volume II
Proportion of pupils in the top performance band for Kiswahili
Figure 4: Kiswahili top band: Second stage results (Main strategy)
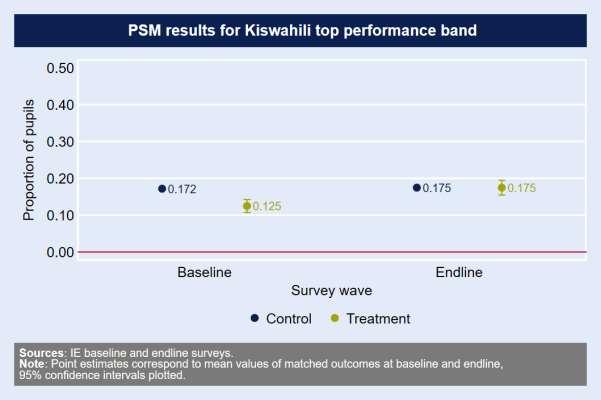
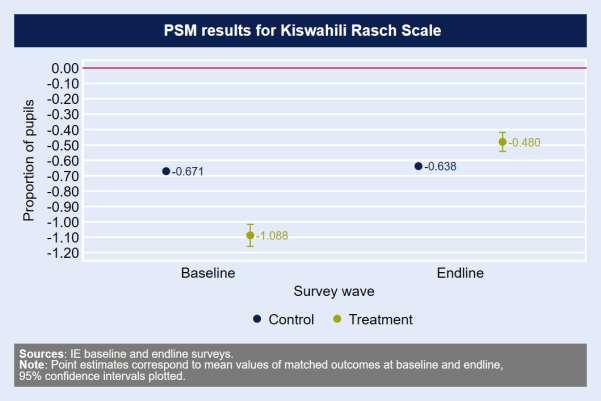
Second, the mean values of the matched outcome and associated confidence intervals at baseline and endline for the treatment group and the control group are plotted. An example can be seen in
Impact Evaluation of Education Quality Improvement Programme in Tanzania: Endline Quantitative Technical Report, Volume II
Finally, the PSM DID estimates for both the first and second strategies are presented, along with the associated bootstrapped and non-bootstrapped p-values. See Table 8 below as an example of how the overall impact results should be interpreted across the two strategies. In that table, the PSM DID estimate for strategy one shows a statistically significant positive marginal impact of EQUIP-T (that is, the proportion of pupils in the Kiswahili top performance band increases by around five percentage points due to EQUIP-T). The PSM DID estimate from strategy two (robustness check) confirms the positive impact of EQUIP-T, showing a slightly larger and more significant increase in the proportion of pupils in the top band.
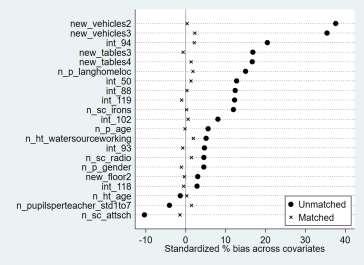
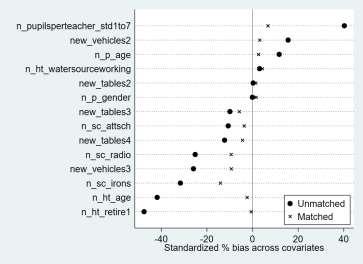
The balancing results for strategy two, whereby treatment observations across the two survey waves are matched (Treatment vs treatment), are also summarized at the end for each outcome indicator, as illustrated in Figure 6 below. This figure shows that the balancing properties for this matching process concerning this particular indicator were ideal, note that Rubin’s B moves from 81.21 to 9.61. This robustness check strengthens the finding from our main strategy, which drives our impact narrative, that EQUIP-T has a significant impact on this outcome indicator.
6: Kiswahili top band- Second stage results (Strategy 2)
Figure 6 above also shows that the number of treatment pupils on common support (that is, pupils for which an equivalent match was found and can therefore be used in the impact estimation) after applying strategy two is considerably lower than for strategy one. The 1,956 treatment pupils on common support represent the sum of 978 baseline pupils and 978 endline pupils matched one-toone. This is equivalent to 31.51% of pupils being off support at endline for this indicator. Similar proportions of pupils off support are recorded across all other pupil indicators for strategy two. For strategy one, the proportion of pupils on common support is always over 90%, thus not problematic.
However, given the sizeable proportion of off common support for strategy two (treatment-to-treatment matching), we have undertaken an additional sensitivity analysis to compare the characteristics of treatment pupils on support with those of treatment pupils off support. We have specifically focused on the socioeconomic characteristics of the pupils in the two categories. All results from strategy two across pupil indicators reinforce (from a magnitude as well as significance perspective) the results from strategy one. The aim of the additional sensitivity analysis is to determine whether this is due to the fact that pupils on common support are systematically less poor than those off common support.
When controlling for other variables, including those used for matching, we find no statistically significant correlation between poverty (as measured by poverty score) and common support status for the indicator in Figure 6 Generally, no strong correlation is found between poverty and common support status across any of the other pupil indicators either. We only detect some weak correlation (10% significance) for the maths bottom band indicator sample at baseline and for the Kiswahili bottom band indicator sample at endline. In both cases, pupils on common support are found to be slightly poorer than those off support. However, these are weak correlations in statistical terms.
It seems reasonable to conclude from these results that the positive impact of EQUIP-T is not driven by the socioeconomic conditions of the pupils analysed. On the one hand, socioeconomic variables are used for matching and so controlled for in the estimation of programme impact; on the other hand, pupils on common support used as part of the analysis for strategy two, which tends to reinforce the positive estimates of impact emerging from strategy one, are not found to be systematically wealthier than those off support. The more detailed findings of this sensitivity analysis are available on request.
Impact Evaluation of Education Quality Improvement Programme in Tanzania: Endline Quantitative Technical Report, Volume II
Proportion of pupils in the bottom performance band for Kiswahili
Impact Evaluation of Education Quality Improvement Programme in Tanzania: Endline Quantitative Technical Report, Volume II
Figure 8 above shows that the PSM analyses at baseline and endline point to a decreasing gap between treatment and comparison schools in terms of pupils who are in the bottom performance band of Kiswahili. Indeed the gap is inverted over time, as the proportion of pupils in the bottom performance band in programme schools becomes smaller than the proportion in control schools at endline. This means that the overall PSM DID analysis finds strong evidence that EQUIP-T has reduced the proportion of pupils in the bottom performance band for Kiswahili in programme schools. See Table 9 below for this. These results remain strong and highly significant across both the strategies.
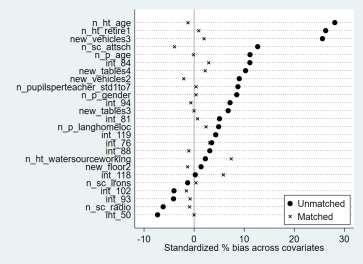
The balancing results for the robustness check matching across time for treatment observations, presented below, show that for this outcome indicator balancing after matching performs very well This further strengthens the findings presented above, that EQUIP-T has significantly reduced the proportion of pupils in the bottom performance band for Kiswahili in treatment schools, compared to a counterfactual situation without EQUIP-T.

Impact Evaluation of Education Quality Improvement Programme in Tanzania: Endline Quantitative Technical Report, Volume II
Impact Evaluation of Education Quality Improvement Programme in Tanzania: Endline Quantitative Technical Report, Volume II
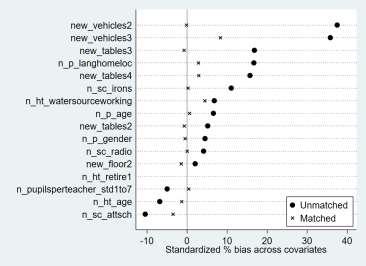
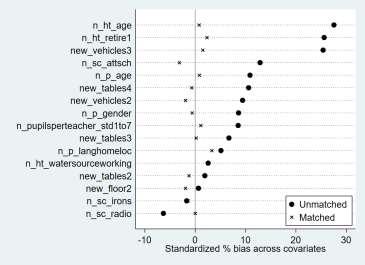
Kiswahili Rasch Scale
Figure 10: Kiswahili Rasch scale: Second stage results (Strategy 1)
Impact Evaluation of Education Quality Improvement Programme in Tanzania: Endline Quantitative Technical Report, Volume II
Figure 11 above confirms the Kiswahili top and bottom band findings. There is a statistically significant increase in the average Kiswahili Rasch scores between baseline and endline in programme schools that is attributable to the marginal impact of EQUIP-T. As can be seen in Table 10 below, both the strategies consistently point towards this result.
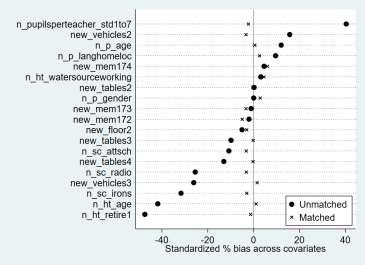
Figure 12 below presents the results on the balancing properties of strategy two. The model performs well, and confirms results obtained through strategy one
Impact Evaluation of Education Quality Improvement Programme in Tanzania: Endline Quantitative Technical Report, Volume II
Impact Evaluation of Education Quality Improvement Programme in Tanzania: Endline Quantitative Technical Report, Volume II
Proportion of pupils in the top performance band for Mathematics
Figure 13: Mathematics top band: Second stage results (Strategy 1)
Impact Evaluation of Education Quality Improvement Programme in Tanzania: Endline Quantitative Technical Report, Volume II
Both strategy one and strategy two show a positive and statistically significant change in the proportion of pupils in the top performance band for maths. The analysis, which achieves optimal balance, is thus able to provide a positive assessment of the impact of EQUIP-T on this indicator. As shown in Table 11 below, the proportion of pupils in the maths top performance band increases by three percentage points due to EQUIP-T. The PSM DID estimate from strategy two (robustness check) confirms the positive impact of EQUIP-T, showing a slightly larger and more significant increase in the proportion of pupils in the top band
Impact Evaluation of Education Quality Improvement Programme in Tanzania: Endline Quantitative Technical Report, Volume II
Impact Evaluation of Education Quality Improvement Programme in Tanzania: Endline Quantitative Technical Report, Volume II
Proportion of pupils in the bottom performance band for Mathematics

Figure 16: Mathematics bottom band: Second stage results (Strategy 1)
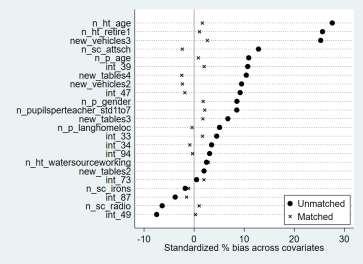
Impact Evaluation of Education Quality Improvement Programme in Tanzania: Endline Quantitative Technical Report, Volume II
Figure 17 above shows that the PSM estimates point to an overall decrease in the proportion of pupils in the bottom performance band for Mathematics, but also indicates a difference in this trend across treatment and comparison schools. There seems to be an overall increase in the proportion of pupils in the bottom performance band in control schools between baseline and endline.
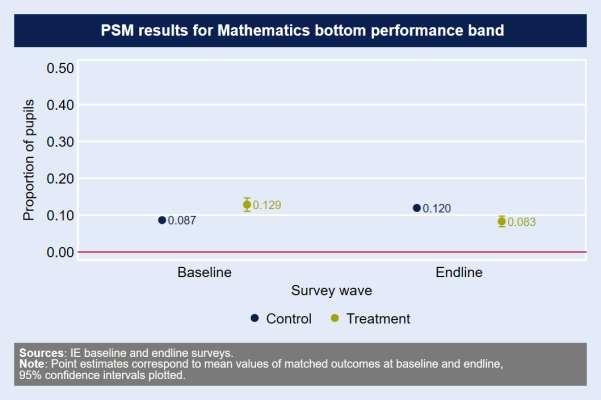
As can be seen in Table 12 below, this means that the study finds evidence of a statistically significant impact of EQUIP-T (over and above the potential effects of the other training initiatives) on the proportion of pupils in the bottom performance band for Mathematics. Both the strategies are consistent with each other with regards to this assessment.
Figure 18 below shows results on the balancing properties of the robustness check strategy. As can be seen in the ‘after matching’ row, balancing performs very well also for treatment-to-treatment observations across time.
Impact Evaluation of Education Quality Improvement Programme in Tanzania: Endline Quantitative Technical Report, Volume II
Figure 18: Mathematics bottom band- Second stage results (Strategy 2)
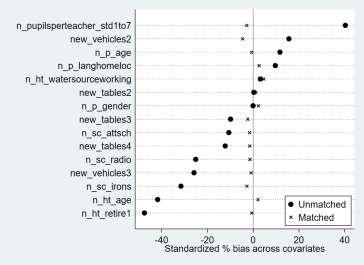
Impact Evaluation of Education Quality Improvement Programme in Tanzania: Endline Quantitative Technical Report, Volume II
Mathematics Rasch Scale
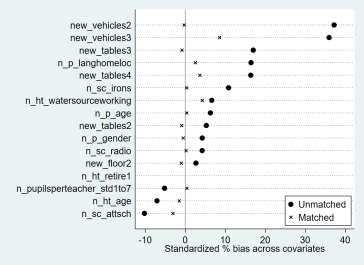
Figure 19: Mathematics Rasch scale: Second stage results (Strategy 1)
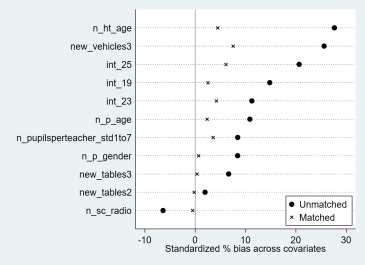
Impact Evaluation of Education Quality Improvement Programme in Tanzania: Endline Quantitative Technical Report, Volume II
Figure 20 above confirms the Mathematics top and bottom band findings. There is a statistically significant improvement in the Rasch scores between baseline and endline that is attributable to the marginal impact of EQUIP-T. This points to an overall positive picture of the impact of the programme on maths skills. As can be seen in Table 13 below, the two strategies are consistent with each other with regards to this assessment in terms of direction and statistical significance, with strategy two showing a slightly larger impact.
Figure 21 below presents results on the balancing properties of the robustness check strategy. Also in this case, balancing is ideal for treatment observations across time.
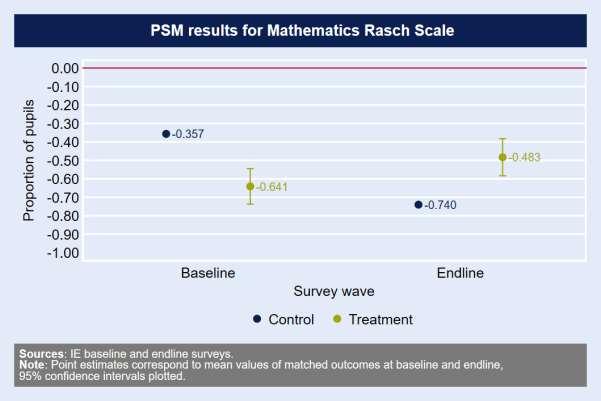
Impact Evaluation of Education Quality Improvement Programme in Tanzania: Endline Quantitative Technical Report, Volume II
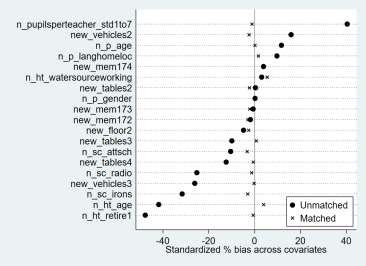
Impact Evaluation of Education Quality Improvement Programme in Tanzania: Endline Quantitative Technical Report, Volume II
Teacher school absenteeism
Figure 22: Teacher school absenteeism: Second stage results (Strategy 1)
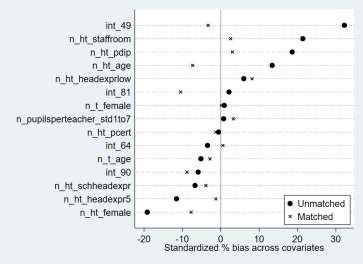
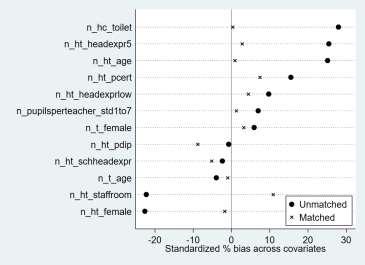
Impact Evaluation of Education Quality Improvement Programme in Tanzania: Endline Quantitative Technical Report, Volume II
The analysis does not find strong evidence of a programme impact in terms of the proportion of teachers who are absent from school on the day of the survey. As shown in Table 14, both models display positive trends on this indicator, but the results are weakly significant in the main strategy. The impact estimate is more significant in the robustness check result However, as shown in Figure 24 below, the balancing properties of strategy two are not ideal (that is, drastic reduction of analytical sample on common support and disproportionately low Rubin’s R value) and its indications are not as reliable. Therefore, these results indicate that the evidence of programme impact on school absenteeism cannot be considered strong.
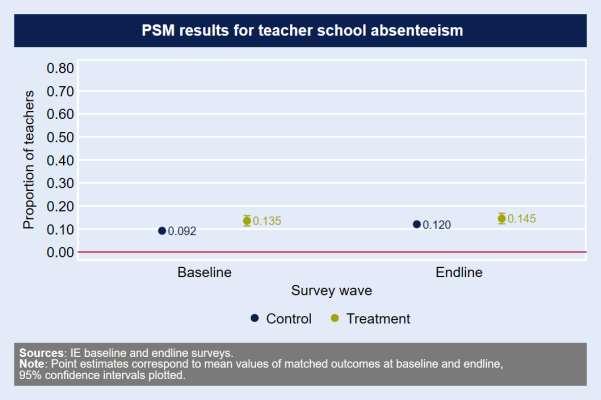
Impact Evaluation of Education Quality Improvement Programme in Tanzania: Endline Quantitative Technical Report, Volume II
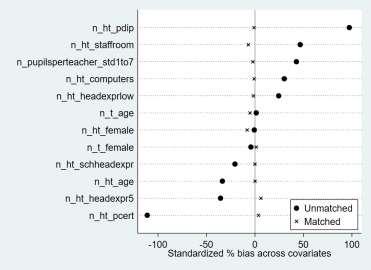
Impact Evaluation of Education Quality Improvement Programme in Tanzania: Endline Quantitative Technical Report, Volume II
Teacher classroom absenteeism
Figure 25: Teacher classroom absenteeism: Second stage results (Strategy 1)
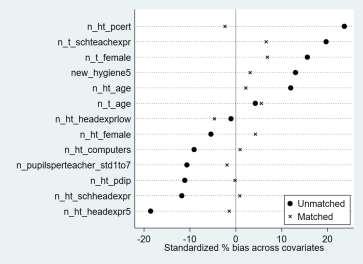
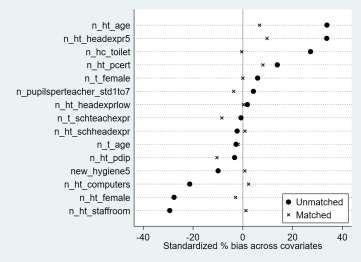
As shown in Figure 26 above, the PSM analyses indicate that at baseline the proportion of teachers that were absent from classes was marginally higher in treatment schools than in comparison schools, whereas the opposite was true at endline. Consequently, the PSM DID strategy one estimates indicates a reduction in the proportion of teachers absent from classes they are timetabled to teach before lunch as a result of EQUIP-T. As shown in Table 15 below, these results are, however, weak from a statistical significance point of view and are not at all confirmed by our second strategy robustness check, which shows a statistically insignificant result (though the magnitude of the estimate is in line with strategy one). Also in this case, the evidence of programme impact on this indicator cannot be considered strong.
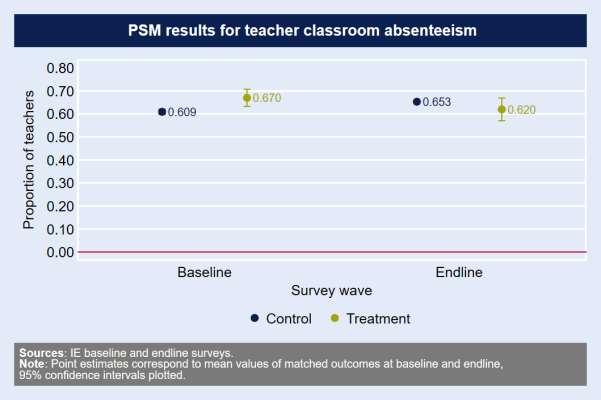
Impact Evaluation of Education Quality Improvement Programme in Tanzania: Endline Quantitative Technical Report, Volume II
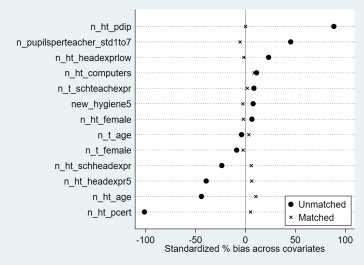
Impact Evaluation of Education Quality Improvement Programme in Tanzania: Endline Quantitative Technical Report, Volume II
Proportion of teachers who report participation in performance appraisal
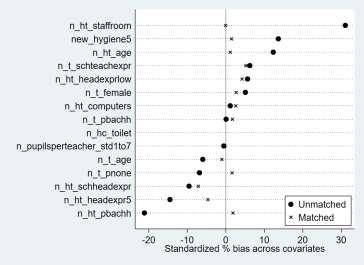
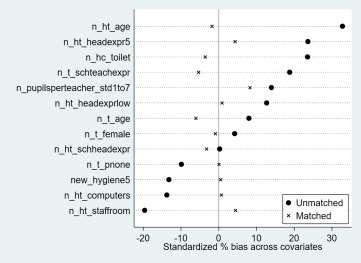
Figure 28: Teacher performance appraisal: Second stage results (Strategy 1)
Impact Evaluation of Education Quality Improvement Programme in Tanzania: Endline Quantitative Technical Report, Volume II
As shown by Figure 28 and Figure 30, the balance achieved by the matching protocols for both strategy one and strategy two is acceptable, even if the sample of teachers is small. Neither strategy one nor strategy two find any statistically significant estimate of impact on teacher participation in performance appraisal, as reported in Table 16 below. Hence, there is strong evidence that the EQUIP-T programme has had no impact on this indicator.
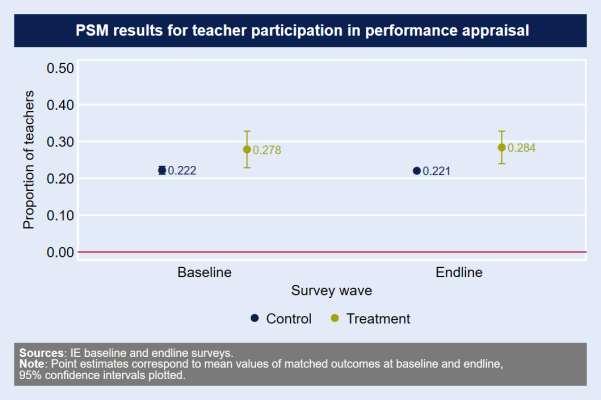
Impact Evaluation of Education Quality Improvement Programme in Tanzania: Endline Quantitative Technical Report, Volume II
4.6 Comment on effect size
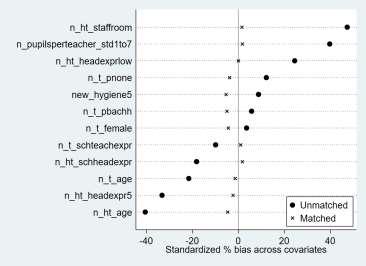
A logical question which flows from the analysis of programme impact on early grade learning discussed above, is whether a 0.5 SD impact on Kiswahili scale scores, and a 0.3 SD impact on maths scale scores over four years, can be considered a low, moderate or large impact? It is very common in the education impact literature to cite impact sizes in SD units and to compare these across different impact evaluations. Hence, one approach is to apply one of the commonly used rulesof-thumb to put the EQUIP-T impact into context. For example, Hattie (2009) synthesised findings from a large range of analyses into what works to improve student achievement and found that the average effect size was 0.4 SD he proposed this as a useful comparator point for judging the success of other interventions.12 JPAL (2014) describes an effect size of 0.5 SD or more on student learning as ‘very large’.
Another approach is to be more specific, and to find comparators from impact evaluations of programmes that are targeting early grade literacy and numeracy in similar contexts. Gove et al (2017) summarise the impact of a number of recent early learning programmes in Africa. Cluster randomised control trials were used to assess two of the early primary grade learning programmes covered in the paper, and so these studies had counterfactuals for estimating impact. The impact estimate for Liberia’s Teacher Training Program II (operating in 6 out of 15 counties, targeted at grades 1 to 3 pupils, assessed after 2 years), on oral reading fluency13 was 0.3 SD. Uganda’s School Health and Reading Program (operating in 30 out of 111 districts, targeted at grades 1 to 4 pupils, assessed after 3 or 4 years) had an estimated impact on oral reading fluency of between 0.2 SD and 1.2 SD for
12 Hattie’s more recent review from 2017 is based on an even larger number of studies but his conclusions remain similar: see https://visible-learning.org/hattie-ranking-influences-effect-sizes-learning-achievement/ 13 Number of correct words read per minute.
Impact Evaluation of Education Quality Improvement Programme in Tanzania: Endline Quantitative Technical Report, Volume II different districts. Put in this context, the EQUIP-T impact results for Kiswahili are not dissimilar. But there is a question of how valid such comparisons are.
Singh (2015a) highlighted a number of flaws with using SDs to compare effect sizes across impact evaluations in education. One key problem is that a SD is a measure of dispersion, and this is not the same in different samples. Singh cites the example of the PISA maths assessment where the SD of test scores for the same age group was 75% lower in one country compared with another. In this situation, an intervention which delivers the same absolute gain in learning in both countries will look less effective (i.e. have a lower effect size in SDs) in the country with the high spread of test scores. Singh also argues that differences in test design, scoring, and analysis methods can also greatly affect the level of impact expressed in SD units. One illustration cited by Singh of the difference that analysis methods can make to effect sizes in SD is based on English test scores for a sample of private school students in India one method yielded an effect size of 0.28 SD while the other method, using the same data, gave a result of more than 0.6 SD (Singh, 2015b). In short, comparing effect sizes in SDs across different studies is not a very reliable approach.
The impact of EQUIP-T is perhaps best understood by reflecting on the local context, on the increased share of pupils that are achieving at higher band levels as a result of EQUIP-T, and the estimated additional number of children that are reaching the required curriculum standards.
Impact Evaluation of Education Quality Improvement Programme in Tanzania: Endline Quantitative Technical Report, Volume II
5 Supplementary descriptive trends in programme areas
This chapter provides supplementary descriptive trend analysis of indicators of pupil learning (Section 5.1), teacher performance (Section 5.2), SLM (Section 5.3), and turnover of staff in education posts (Section 5.4) in programme treatment schools. Staff turnover is discussed in a cross-cutting section, as it covers teachers, INCOs, head teachers and WEOs, and thus gives some insight into the combined effects of high turnover on schools These support the findings presented in Chapters 3, 4 and 5 in Volume I. For ease of reference, the SLM section in this chapter also includes the box which summarises the impact estimates on teachers’ participation in performance appraisal, as this was not included in Volume I.
5.1 Pupil learning and background characteristics
There are three main types of supplementary descriptive analysis of pupil learning discussed in this section.
The first two subsections (5.1.1 and 5.1.2) show trends in raw score indicators of pupil learning achievement in Kiswahili (literacy) skills and maths (numeracy) skills between baseline, midline and endline. Similar types of raw score based indicators are reported in the monitoring reports of other large-scale education quality improvement programmes in Tanzania (see, for example, RTI, 2016). These include indicators such as ‘number of words correctly read per minute’ and ‘percentage of addition questions answered correctly’.
The next three sub-sections (5.1.3, 5.1.4 and 5.1.5) focus on learning trends for different subpopulations of Standard 3 pupils. In Volume I Chapter 3, trends in learning disparities by gender, pupils’ home language and poverty status are discussed, while in this section the focus is on changes in levels of learning outcomes for each beneficiary group separately. In addition, this section reports the prevalence of disabilities among Standard 3 pupils (based on pupil self-reporting), as well as changes in learning outcomes for pupils with and without physical disabilities between midline and endline
The final sub-section (5.1.6) presents estimates of trends in the absolute number of pupils achieving at the level of the different curriculum-linked performance bands, in the 17 districts represented by the evaluation survey sample.
5.1.1 Pupil Kiswahili raw test score indicators
Pupil’s Kiswahili skills: There have been large improvements in reading speeds, reading and listening comprehension and writing skills between baseline and endline (Table 17, Table 18 and
Table 19). On average, pupils read significantly faster at endline than at baseline, and this holds across the four different subtests of syllables, familiar words, invented words and a story passage. The size of the change in each case is fairly large for example, pupils read a story passage at 21 words per minute at baseline and this increased by 9 words per minute to reach 30 words per minute by endline However, the skills improvement happened between baseline and midline (see Annex G for results of significance tests between baseline and midline), while there was no significant change between midline and endline in reading speed on any of the subtests (Table 17).
Impact Evaluation of Education Quality Improvement Programme in Tanzania: Endline Quantitative Technical Report, Volume II
Table 17: Pupils’ oral reading speed at baseline, midline and endline in programme schools (trends in programme areas)
Source: Evaluation baseline, midline and endline surveys (Standard 3 pupil Kiswahili test). Note: (1) Asterisks indicate statistical significance levels ***p<0.01, **p<0.05, *p<0.1
Pupils’ reading and listening comprehension have also improved significantly on average between baseline and endline (Table 18), and the gains in average comprehension scores are large. For reading comprehension, the significant improvement happened between baseline and midline (Annex G), but for listening comprehension there was significant improvement between baseline and midline, and between midline and endline (Table 18).
Table 18: Pupils’ reading and listening comprehension skills at baseline, midline and endline in programme schools (trends in programme areas)
Source: Evaluation baseline, midline and endline surveys (Standard 3 pupil Kiswahili test). Note: (1) Asterisks indicate statistical significance levels ***p<0.01, **p<0.05, *p<0.1 (2) One of the five listening comprehension questions was changed between baseline and midline because the baseline question had not been translated correctly. Hence the baseline and midline test scores cannot be strictly compared.
Writing skills have also improved significantly between baseline and endline Error! Not a valid bookmark self-reference.), with the average scores on spelling and punctuation rising by about 50% over this period. For spelling the improvement happened between baseline and midline (Annex G), but for punctuation there was significant improvement between baseline and midline, and between midline and endline (Error! Not a valid bookmark self-reference.).
Impact Evaluation of Education Quality Improvement Programme in Tanzania: Endline Quantitative Technical Report, Volume II
Table 19 Pupils’ writing skills at baseline, midline and endline in programme schools (trends in programme areas)
Source: Evaluation baseline, midline and endline surveys (Standard 3 pupil Kiswahili test).
Note: (1) Asterisks indicate statistical significance levels ***p<0.01, **p<0.05, *p<0.1
5.1.2 Pupil maths raw test score indicators
Pupils’ maths skills: On the simplest mathematical task on the test, number comparison, pupils’ skills have not changed significantly between baseline and endline, whereas skills in filling missing numbers in sequences, a more complex task, have improved significantly over the same period on average (Table 20)
Table 20: Pupils’ skills in number comparison and missing numbers at baseline, midline and endline in programme schools (trends in programme areas)
Source: Evaluation baseline, midline and endline surveys (Standard 3 pupil maths test). Note: (1) Asterisks indicate statistical significance levels ***p<0.01, **p<0.05, *p<0.1
Pupils’ skills in addition and subtraction have improved significantly on average between baseline and endline, with the exception of the harder (level 2) addition questions where average scores did not change significantly over this period (Table 21). For the other addition and subtraction subtests where skills improved on average, this happened between baseline and midline (see Annex G), and there was no significant change in average scores between midline and endline (Table 21). The share of pupils who scored zero on the harder (level 2) addition and subtraction questions has fallen significantly between baseline and endline, while there was no significant change in the share of pupils achieving over 80% on the same questions. This suggests that pupils with weaker skills have been supported to strengthen their skills over the period.
Impact Evaluation of Education Quality Improvement Programme in Tanzania: Endline Quantitative Technical Report, Volume II
Table 21: Pupils’ skills in addition and subtraction at baseline, midline and endline in programme schools (trends in programme areas)
Source: Evaluation baseline, midline and endline surveys (Standard 3 pupil maths test). Note: (1) Asterisks indicate statistical significance levels ***p<0.01, **p<0.05, *p<0.1
There have also been significant gains in the skills required to solve word problems between baseline and endline (Table 22). These problems require pupils to apply maths to real life scenarios. There has been persistent improvement in these skills on average, as shown by the significant gain in average score between baseline and midline (Annex G), and between midline and endline (Table 22).
Pupils’ average score on multiplication problems fell significantly from 19% at baseline to 16% at endline, and there was a marked and significant fall between midline and endline (Table 22). This weakening of multiplication skills is likely to be related to changes in the Standards 1 and 2 curriculum which took place in 2015 (for more details, see Annex E).
Table 22: Pupils’ skills in multiplication and word problems at baseline, midline and endline in programme schools (trends in programme areas)
Source: Evaluation baseline, midline and endline surveys (Standard 3 pupil maths test). Note: (1) Asterisks indicate statistical significance levels ***p<0.01, **p<0.05, *p<0.1
5.1.3 Pupils’ background characteristics, including disability
Standard 3 pupils’ background characteristics, including gender, home language, poverty and disability status, are set out in Table 23 There is near even balance between boys and girls among the pupils and this has not changed significantly over time. Also largely unchanged over time, is the share of pupils whose main language at home is not Kiswahili at endline 81% of pupils come from this linguistic background compared to 77% at baseline which is not a significant difference. There
Impact Evaluation of Education Quality Improvement Programme in Tanzania: Endline Quantitative Technical Report, Volume II has, however, been some change in pupils’ economic circumstances since baseline. The share of pupils who live in households that fall below the poverty line increased by 6%, from 33% at baseline (a weakly significant change).
Turning to pupils’ self-reported disability status which was captured at midline and endline only (see notes under Table 23 for measurement details). About 5-6% of pupils reported separately having difficulties with seeing and hearing at both midline and endline. The prevalence of pupils with movement difficulties was also 5% at midline, but this dropped significantly to 3% at endline. Taking these physical impairments together, 13% of pupils reported having either seeing or hearing or movement difficulties at midline and this fell to 10% at endline, although the change is only weakly significant. A much larger and significant drop of 11 percentage points occurred in the share of pupils saying that they have difficulties concentrating (from 18% to 7% between midline and endline). This is an unexpectedly large change and may reflect difficulties in measuring this type of disability (poor concentration related to a health problem), particularly using pupil self-reporting, rather than a real change.14 For this reason, learning outcome results are disaggregated by physical disability only in the subsections which follow.
Source: Evaluation baseline, midline and endline surveys (Standard 3 pupil background questions).
Note: (1) Asterisks indicate statistical significance levels ***p<0.01, **p<0.05, *p<0.1. (2) Pupils self-reported their disability status by answering four of the Washington Group’s short set of questions on disability: ‘Do you have difficulties seeing, even if wearing glasses?’; ‘Do you have difficulties hearing, even if using a hearing aid?’; ‘Do you have difficulties walking or climbing steps’; ‘Do you have difficulties remembering or concentrating?’. These questions were taken from DFID’s guide to disaggregating programme data by disability (undated) that was shared with the evaluation team in early 2016, just prior to the midline survey.
14 Pupils are required to identify if they have serious concentration difficulties that are related to a health problem rather than typical concentration problems most children experience in their learning. It may be very difficult for young children to make this distinction.
5.1.4 Pupil Kiswahili scale scores for different subpopulations15
Standard 3 pupils’ Kiswahili skills improved significantly on average between baseline and endline for each of the subpopulations of pupils shown in Table 24. Average Kiswahili scale scores increased by 1.0 logit (0.8 SD) for boys over the four years, while the gain was 1.3 logits (1.1 SD) for girls. For both genders the largest improvement happened between baseline and midline, while in the final two years, average scale scores only improved significantly for girls not for boys.
For pupils whose mother tongue is not Kiswahili, average Kiswahili scale scores went up significantly by 1.2 logits (1.0 SD) between baseline and endline, outstripping the gain of 0.9 logits (1.0 SD) for the group of pupils who come from Kiswahili speaking homes Indeed, the pupils whose home language is not Kiswahili continued to improve their Kiswahili skills on average between midline and endline, while for the Kiswahili home language group there was no significant change over the same period.
The improvement between baseline and endline in average Kiswahili scale scores for pupils from both poorer and from richer homes is very similar: 1.1 logit (0.9 SD) for pupils from poorer homes, and 1.1 logit (1.0 SD) for pupils from richer homes.
For pupils with physical disabilities, there was no significant change in average Kiswahili scale scores between midline and endline, while for pupils without seeing, hearing or movement impairments there was a modest, but only weakly significant, improvement in scale scores of 0.2 logits (0.2 SD).
Source: Evaluation baseline, midline and endline surveys (Standard 3 pupil maths test). Note: (1) Asterisks indicate statistical significance levels ***p<0.01, **p<0.05, *p<0.1
5.1.5 Pupil maths scale scores for different subpopulations16
Standard 3 pupils’ maths skills improved significantly on average between baseline and endline for almost all of the subpopulations of pupils shown in Table 25. This strengthening of maths skills
15 Changes in average scale scores are expressed in logits and in SD units. The basis of the SD units are the endline distributions of pupil Kiswahili scale scores for each subpopulation. For example, the change in average Kiswahili scale score for girls in logits is expressed in SD units based on the SD of the endline distribution of girls’ Kiswahili scale scores.
16 Changes in average scale scores are expressed in logits and in SD units. The basis of the SD units are the endline distributions of pupil maths scale scores for each subpopulation. For example, the change in average maths scale score for girls in logits is expressed in SD units based on the SD of the endline distribution of girls’ maths scale scores.
Impact Evaluation of Education Quality Improvement Programme in Tanzania: Endline Quantitative Technical Report, Volume II occurred between baseline and midline, while in the final two years there was no significant change in skills level for any of the subpopulations.
Average maths scale scores increased by 0 4 logits (0.2 SD) for boys over the four years, while the gain was 0.5 logits (0.3 SD) for girls. Improvements in maths skills of a similar magnitude (0.4 to 0.6 logits) took place for pupils from poorer homes (0.2 SD) and from richer backgrounds (0.3 SD), and for pupils whose home language is not Kiswahili (0.3 SD) over the four years. Average maths scale scores improved by 0.4 logits (0.2 SD) for pupils who speak Kiswahili at home over the same period, but this change is not significant.
In line with midline to endline trends for the other subpopulations, pupils with (and without) physical disabilities showed no significant change in average maths scale scores over this two year period.
Source: Evaluation baseline, midline and endline surveys (Standard 3 pupil maths test). Note: (1) Asterisks indicate statistical significance levels ***p<0.01, **p<0.05, *p<0.1
5.1.6 Trends in absolute numbers of pupils achieving at different performance bands in 17 programme districts
Between the baseline and the endline, there was a positive shift in the distribution of Standard 3 pupils in treatment schools achieving at different performance bands in both Kiswahili and maths the share of pupils achieving in the top two bands increased, while the share of pupils falling into the bottom two bands decreased (Table 26 and Table 27). Over the same period, the dramatic growth in Standard 3 enrolment (nationally and in the treatment areas) means that the change in the absolute number of pupils achieving at higher band levels in treatment areas is even starker.
Table 26 and Table 27 present estimates of the absolute number of Standard 3 pupils in each of the Kiswahili and maths performance bands alongside the share of Standard 3 pupils in each performance band. The former was calculated by multiplying the proportion of Standard 3 pupils in each performance band (estimated from the evaluation’s baseline, midline and endline samples of Standard
Impact Evaluation of Education Quality Improvement Programme in Tanzania: Endline Quantitative Technical Report, Volume II
3 pupils) with the total number of Standard 3 pupils enrolled in government primary schools in the 17 programme districts that are covered by the impact evaluation (obtained from secondary sources).17
Table 26: Distribution and estimates (in absolute terms) of Standard 3 pupils by Kiswahili performance band in treatment areas, baseline, midline, and endline (trends in programme areas)
Sources: Evaluation baseline, midline, and endline surveys (pupil test) for the distributions; EMIS data uploaded on to the Government of Tanzania’s open data website (http://opendata.go.tz/group/education-group) for enrolment of Standard 3 pupils in 2016 and 2018; and EMIS data for 2014 (access database shared by the EQUIP-T MA in January 2015)
Notes: (1) The distribution of Standard 3 pupils by performance band was estimated from the evaluation’s baseline, midline, and endline samples. (2) The total Standard 3 enrolment is equal to the number of Standard 3 pupils enrolled in government primary schools in the 17 programme districts that are covered by the impact evaluation. This is the pool of which the evaluation’s sample of Standard 3 pupils is representative of.
Table 27: Distribution and estimates (in absolute terms) of Standard 3 pupils by maths performance band in treatment areas, baseline, midline, and endline (trends in programme areas)
Sources: Evaluation baseline, midline, and endline surveys (pupil test) for the distributions; EMIS data uploaded on to the Government of Tanzania’s open data website (http://opendata.go.tz/group/education-group) for enrolment of Standard 3 pupils in 2016 and 2018; and EMIS data for 2014 (access database shared by the EQUIP-T MA in January 2015).
17 Annex A in this Volume lists the 17 programme districts (located in the five regions where EQUIP-T implementation started in 2014) that are covered by the impact evaluation.


