The Simulation-based Approach to the Development of Energy-Efficient Building
Silent Study RoominLearningHub
Module Title Dissertation
Module Code 3DDM008
Student Name DiongJayHuey
Student ID
21423628
Supervisors Riham Ahmed Vicki Thomas
Acknowledgement
A sincere thank you to my supervisor, Riham Admed, for providing guidance in the research and Vicky Thomas for her assistance with the writing issue and coordination. An appreciation is extended to the estate manager Victoria Blacke and the Energy Officer Danielle Bird, as well as the students who participated in the interview.
Abstract
This thesis presents a comprehensive appraisal to the study building. A number of scenarios are discussed in this study, along with potential strategies for reducing energy consumption for a more sustainable future. It is aimed to inform methods of reductive carbon emissions with a focus on educational buildings. Building simulation will be used to suggest strategies. By analysing the results of simulated output, it can instruct the implementation of a sustainable strategy that considers enhancement to well-being of its end users and local internal environment. The simulation is to be of a room in an educational building to establish options for the possibility of reducing carbon emissions in public study spaces. This is enforced by considering the energy-saving and thermal comfort performance of various passive building measures which are used to improve the performance of the case building. The results will be discussed, from a variety of scenarios and from these, the strategies for improving the energy efficiency of these rooms will be proposed. To achieve multiple benefits, the most favourable situation must be determined. It is vital to meet the objective of energy efficiency in the present climate.
Table of Contents 1. Introduction ........................................................................................................................... 6 1.1 Background .......................................................................................................................... 6 1.2 Research Questions and Objective ............................................................................... 8 1.2.1 Research Methods ........................................................................................................... 9 1.3 Literature Review ............................................................................................................. 10 1.3.1 Green Guidance .......................................................................................................... 10 1.3.2 Passive Strategies Design ....................................................................................... 10 1.3.3 Building Simulation ..................................................................................................... 11 1.3.4 Health and Wellbeing in educational spaces ...................................................... 12 2. Case study building description ...................................................................................... 13 2.1 Case Study: Silent Study Room-5th Floor ................................................................... 13 3. Methodology ....................................................................................................................... 15 3.1 Simulation, Baseline and Scenarios .............................................................................. 15 3.2 Building Site, Location and Climate ............................................................................. 18 3.3 Building Geometry and Orientation 20 3.4 Baseline building 3.4.1 Description of the Base Model-Silent Study Room ............................................ 23 3.4.2 Construction Summary of Baseline Model ............................................................ 26 3.5 Scenarios Study Methodologies .................................................................................. 27 3.5.1 Scenarios A : Free Run without Ventilation using Base Model ..................... 29 3.5.2 Scenarios B Mechanical Ventilation...................................................................... 31 3.5.3 Scenarios C Natural Ventilation ...........................................................................33 3.5.4 Scenarios D Temperature setting point for heating and cooling ................. 38 3.5.5 Scenarios E Alterations to the construction and U-Value .............................. 42 3.5.5 Scenarios F Shading devices of different designs ............................................ 48 4. Results Analysis and Discussion: .................................................................................... 53 5. Conclusion ........................................................................................................................... 56 6. Recommendation .............................................................................................................. 58 7. Future Works 61 8. Appendices 64 9. Glossary 69 10. Bibliography 70 11. References 72
1. Introduction
1.1 Background
As a result of the burning of fossil fuels, greenhouse gasses such as carbon dioxide are released into the atmosphere, causing climate change. 40 percent of greenhouse gases are generated by energy used in building. As part of its efforts to mitigate climate change, the UN aims to reduce greenhouse gas emissions by 80% compared with 1990 levels by 2050. By 2030, a reduction in annual emissions of 13 GtCO2e will be required to meet the 2°C Paris Agreement target. Besides the commitments made in the updated unconditional NDCs, it is estimated that the world will need to reduce its annual emissions by 28 gigatons of carbon dioxide equivalent (GtCO2e) by 2030 in order to limit global warming to 1.5 degrees Celsius. (United Nations Environment Programme)
This is set to be followed by a reduction of at least 34% by 2020. In 2008, the UK enacted the Climate Change Act, which creates a legally binding framework for addressing climate change. (ccc) Approximately 45% of the carbon emissions in the UK are attributed to the built environment (27% to domestic buildings and 18% to non-domestic buildings). (UKGBC) As a result, the built environment plays a crucial role in the UK's energy efficiency efforts. A Net Zero Carbon Building was introduced in the United Kingdom as a means of reducing carbon emissions. Buildings that are energy-efficient have become increasingly important in response to the need to offset carbon emissions. In other words, energy is saved by providing the same services with less energy. To achieve net zero carbon emissions, how can operating energy be reduced to reduce carbon emissions? Heat and building emissions are expected to be reduced by 47-62% by 2035 from 1990. In order to accomplish this goal, low carbon heating will need to be adopted in a significant amount until 2035, when all new installations will be net zero compatible. (Net Zero Strategy) Therefore, Improved energy efficiency is a key component of any heat pathway. Investment in fabric and improved product standards are vital to reducing the overall amount of energy used and the cost associated with it. The use of advanced smart meters will allow consumers and businesses to obtain information about their energy consumption and encourage them to conserve energy.
Boosting energy efficiency is one of the most cost-effective methods for businesses to reduce their energy bills, while reducing their carbon footprint at
the same time. The government announced the Energy Performance Certificates Action Plan in September 2020, which outlined a plan to improve the EPC system. As part of the Action Plan, ways will be explored to improve the quality of EPCs, build consumer trust, and increase engagement with the building stock in an effort to increase energy efficiency. (Energy White Paper,104)
1.2 Research Questions and Objective
The objective of this research is to identify a low carbon building with improved energy efficiency. Using the energy simulation Using simulations supported by computation, the study seeks to inform methods for reducing carbon emissions, with a focus on educational buildings. The following research questions have been formulated to gain a better understanding of the sustainable goal.
Research Question 1 (RQ1): In order to improve the energy demand of a building, what variables should be considered during the initial stages of design?
Research Question 2 (RQ3): What potential design strategies can be used to reduce energy consumption at the beginning of the architectural design process?
Research Question 3(RQ3): What is the air quality and thermal comfort with the design strategy implemented?
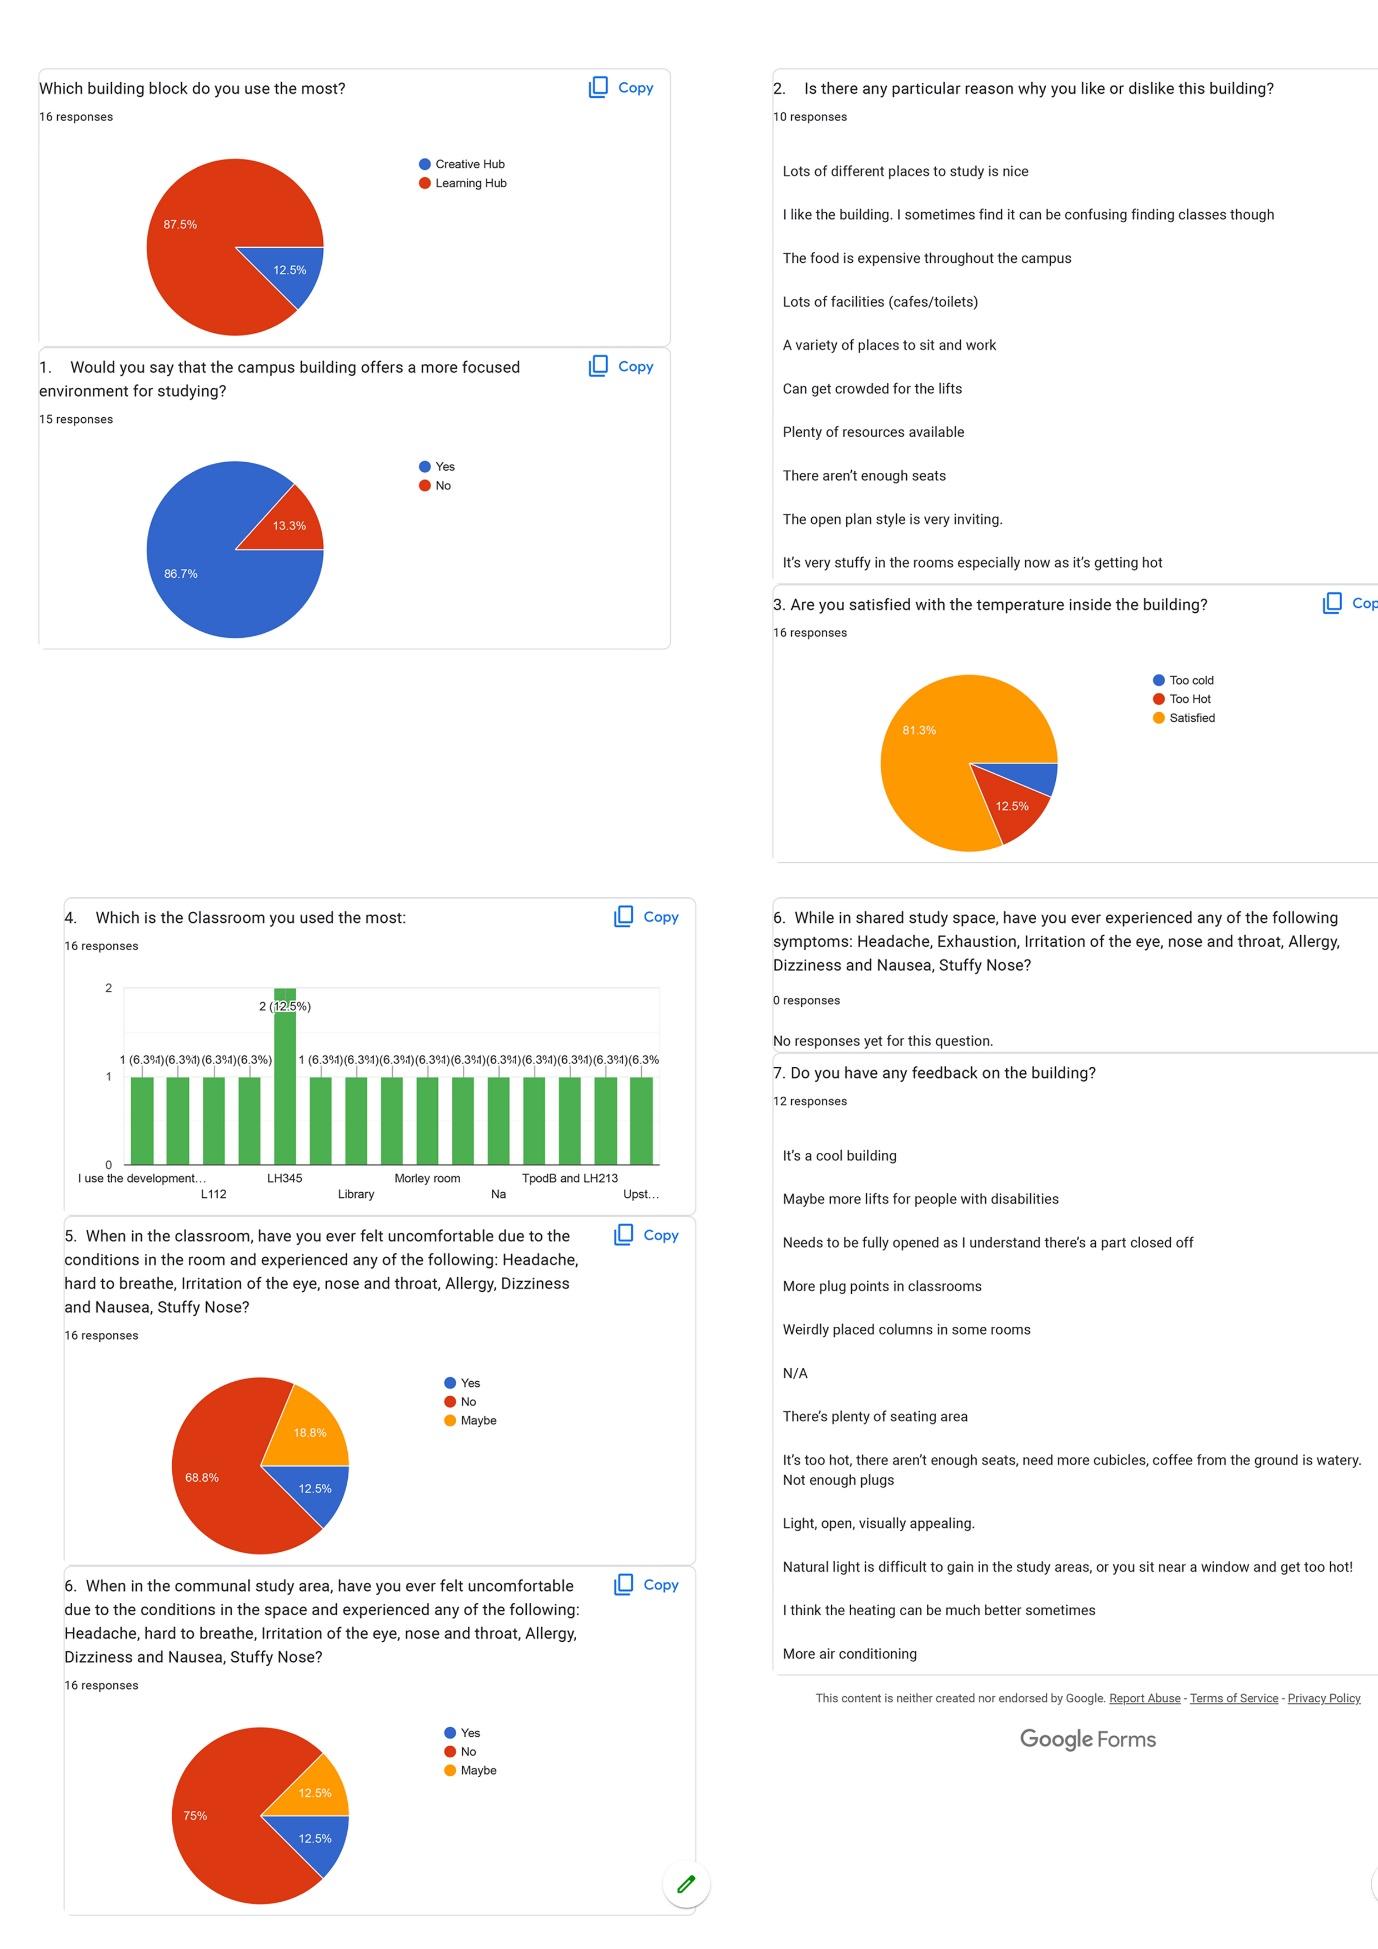
In the beginning of the research, a survey was taken on campus and 16 students responded. In the survey, some issues were raised regarding the thermal comfort of the study area, however no specific study area was provided, and some respondents felt uncomfortable during certain discussions. Most students still feel satisfied with the temperature most of the time. It was asked in the survey that when in a communal study area, have you ever felt uncomfortable because of the conditions in the space and experienced any of the following symptoms: headache, difficulty breathing, irritation of the eyes, nose or throat, allergy, dizziness, nausea, and a stuffy nose. According to the survey, 25% of respondents indicate that they may or may not feel comfortable and have the symptoms described. It is not clear, however, whether it is a personal matter. As a result of this survey, additional research was conducted in the study area regarding thermal comfort and air quality. (appendix 3)
1.2.1 Research Methods
Literature Review
Background Study of the Learning Hub and Selection of the model.
Net Zero Carbon
Improve Building Performance
Passive Design Strategies
Building Simulation
Survey
Chart 1.1 Research Pathway
1.3 Literature Review
1.3.1 Green Guidance
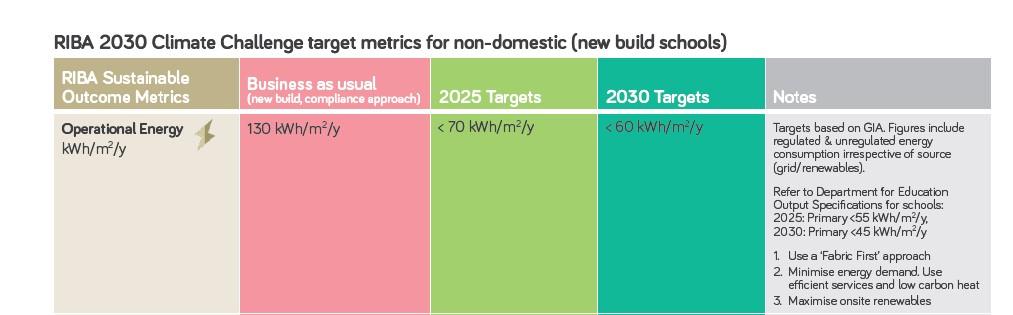
In the framework for net zero carbon buildings, energy efficiency requirements are called for for different types of buildings, namely energy intensity (EUI) and thermal energy demand intensity (TEDI). (NZCB) In addition to reducing greenhouse gas emissions, achieving energy efficiency can also reduce capital and operating costs as well as fuel consumption for individuals and organizations. (Part L) According to the RIBA Climate 2030 Challenge, the target metrics for nondomestic buildings are 75 kWh/m2/year by 2030 and 55 kWh/m2/year by 2050; on the other hand, the Department for Education specifies: 2025: schools are expected to achieve 55 kWh/m2/y by 2030, and 2030: schools are expected to achieve 45 kWh/m2/y by 2050.(RIBA). Another guidance has to develop energy use intensity targets based on the target baseline of achieving a DEC B (40) rating and/or an EUI of equal or less than: 65 kWh/m2/yr (GIA) for schools (Net Zero Targets). Several regulations must be adhered to, including Part L, EPCs, DECs, and ESOS energy audits. The Building Regulations include Part L, which regulates the efficiency of buildings. As a result, it became a guideline for energy-efficient construction. According to Approved Document L, a hypothetical building of similar size, shape, and type must not have a carbon emission rate greater than the Target Emission Rate (TER) Hence the energy usage intensity would be used for the educational space study and the Part L will be used as a guidance for building envelope-U value.
1.3.2 Passive Strategies Design
One of the methods to reduce the carbon with reduction of energy use is bby having the passive design of the building. Passive design strategies are important for ensuring that a low-energy building is constructed. To improve the performance of the building, different strategies can be implemented during the design process. In the process of designing a building, many aspects must be taken into consideration, such as building geometry, solar gain, solar shading design, thermal insulation and air tightness, insulation, thermal mass, natural daylight, and ventilation. To optimize energy efficiency in the room, a number of passive design measures are integrated in order to optimize different measures, such as altering the thickness of walls, roof insulation, external wall insulation,
window orientation, window–wall ratio, glazing type, and sunroom depth/overhang depth. Optimisation of the shape in accordance with the requirements of sun position is important. The careful siting of the solar array and its orientation toward the sun. As a result of optimisation, the study has demonstrated that passive design can significantly reduce the thermal load of buildings. (Kah, Oliver Additionally, it can reduce levels of energy consumption and environmental impacts, such as greenhouse gas emissions. In recent years, passive design has gained popularity as part of the movement towards sustainable architecture. A well-designed envelope maximizes the flow of air during the summer and excludes the sun. There are a number of passive strategies that can be recommended depending on the climate. The proper placement of windows and the use of daylight can reduce the need for mechanical cooling systems. ). As well as maintaining a comfortable indoor temperature, passive design can prevent heat from escaping the building. The passive approach must take into account thermal comfort, indoor air quality, and making the building a more comfortable place to live or work when implementing a passive strategy.
1.3.3 Building Simulation
A thermal simulation model will be developed using an IESVE (Integrated Environment Solutions Virtual Environment). IESVE is a well-established dynamic thermal simulation tool that is widely used to analyze the dynamic response of buildings to changing weather conditions on a regular basis. To minimize energy consumption, reduce summer discomfort, and maximize daylight illumination in the cold climate region of the United Kingdom, optimization research using software such as the IESVE program was conducted considering various parameters, as these are more likely to produce results that can be applied in the real world. (IESVE) The reliability of the interoperability process was assessed by identifying all the necessary data that was collected during the interoperability process, followed by benchmarking against actual energy consumption, including location and weather files, geometry, construction materials, thermal zones, occupancy operating schedules, and HVAC systems. Since building geometry, envelope, and many building systems interact, it is necessary to optimize the buildings as a whole rather than just the individual systems. It was necessary to consider several basic parameters, such as typologies, orientations, widths, window-to-wall ratios, glazing materials, and shading types. To maximize daylight production and thermal comfort, a variety
of indoor set-point temperatures, shading systems, pre-ventilation systems, and heat recovery facilities can be utilized. Cloud-based simulation enables designers to break free from the limitations of in-house hardware by modernizing traditional workflows. Cloud technology enables architects and engineers to collaborate in real-time and iterate quickly, allowing sustainable choices to be made earlier in the design process. Despite the effects of wind, sun, severe weather, and even other structures, buildings must contend with a dynamic environment. (Jankovic, Lyubomir)
1.3.4 Health and Wellbeing in educational spaces
Nearly 38,000 students at UK universities have recently responded to a survey revealing deteriorating mental health and an alarming level of psychological distress. Additionally, 33.9% of the students surveyed reported experiencing serious psychological problems that required professional assistance (Agg and Khimji). Research findings (Healthwatch Shropshire Research Grant) indicate that energy efficiency measures can have a positive impact on health and well-being: improved comfort, especially in the winter, fewer colds/coughs and other flu-like symptoms, reduced sickness, and lower energy bills. In educational facilities, the temperature and air quality in classrooms are often of primary concern due to their potential impact on students' health and performance. In a classroom with poor indoor air quality (IAQ) and high indoor air temperatures, students will be less able to learn and focus. Especially when windows are kept closed to avoid external noise and weather, or to prevent drafts, this condition can become worse if ventilation rates are insufficient to remove excessive heat or pollutants.
A number of studies have shown that the air quality inside schools and is poor, and adequate ventilation is challenging due to the high occupancy rates, as well as the large quantities of air required, which can quickly result in draughts. Educational buildings should be kept in mind when it comes to the air quality.
An additional challenge is the draught-free introduction of outdoor air. In the winter, this is primarily a matter of the temperature of the supply air. Natural ventilation concepts can be enhanced using suitable heating surfaces positioned appropriately. Furthermore, maximum flow velocities should not be exceeded due to the fluctuating nature of natural motive forces. The typical example of the fully enclosed building would exhibits poor energy performance as well as low comfort levels, making it difficult to meet the UK government's target for the decarbonization of building
2. Case study building description
2.1 Case Study: Silent Study Room-5th Floor
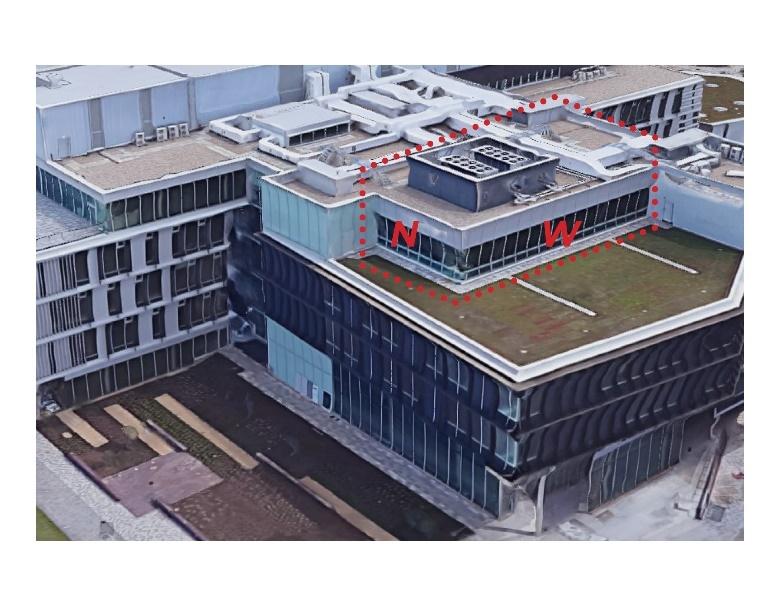
The learning hub is one of the main building blocks of the university of Northampton, which integrates the various programs and incorporates the library and classrooms into one block. The block offers multiple opportunities for students to study, including group study tables, study facing the view, and open study areas. The Learning Hub has a silent study room on the fifth floor that has been selected for this research. Most of the space in this brand-new university building is covered with curtain wall facades, especially in the main block. Large glass allows for natural lighting, which is advantageous to students' learning and study. As well as this, the light has an automatic on/off feature that makes it possible to use it whenever necessary. So, it is believed that there has been good progress in reducing lighting energy, but the concern would be the amount of heating energy required.
There may be multiple energy meters in schools, possibly with different suppliers, making it difficult to obtain a comprehensive picture of school energy consumption. The campus has signed up for green grids, which may also use non-renewable energy even if an appropriate green price has been paid. It is possible to incur hidden fees when switching tariffs and this campus has signed up for green grids that may also use non-renewable energy. The natural light that is infused into building through the massive window and the automatic
Figure 3.3 View of North & West of the Silent Study Room (Source: Google Map)
N: North W : West
controls, including occupancy sensors and dimmers has been used in saving the energy and reduce maintenance costs.
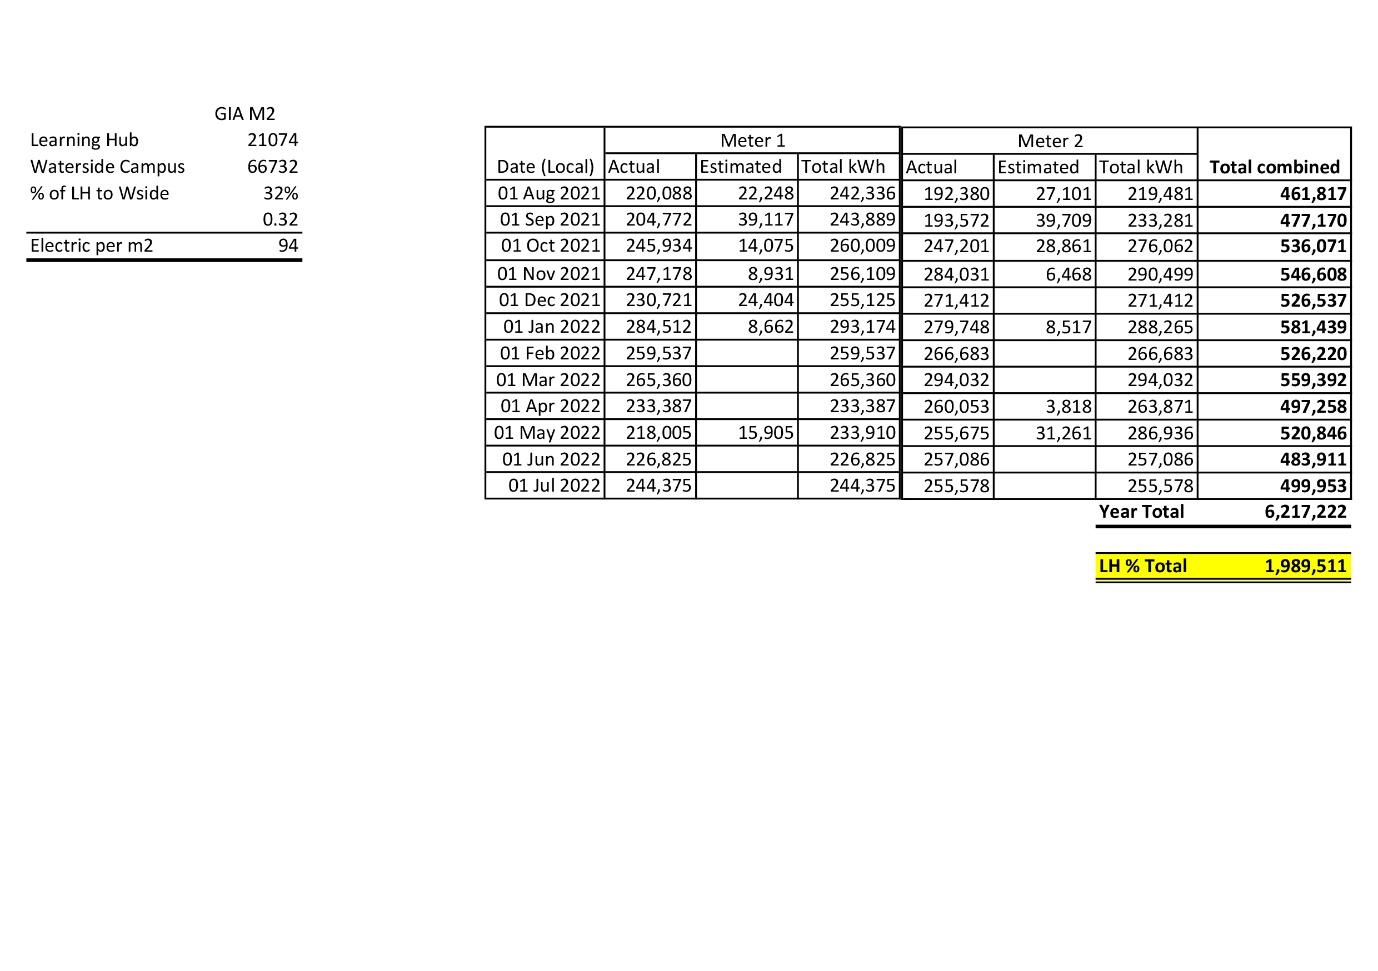
Approximately 94 kWh / m2 per year is the average electricity consumption of the university campus. To predict power consumption for a university campus, it is determined according to the results of a plan and expansion. Presently, the Learning Hub consumes 1989522 kw of energy annually, thus it has an energy usage intensity of 94, which is 30% less than the target for 2025. (Appendix 2)
The reason why we are focusing on the study area is that it requires adequate lighting and temperature for effective work to take place. Other areas which are open to other activities, such as the chilling area, may benefit from natural lighting and a lower temperature, or even ventilation during the summer months. This building has a building management system to control the usage of of electricity by monitor, target, and assess sustainability from a central location. It was determined that there is a relationship between the number of members or the total gross floor area and power consumption. As a result, it resulted in a mutual linear proportional relationship
In view of the differences in how schools and offices are used, it would be more appropriate to normalize the energy consumption of office buildings by the number of occupants, for this reason the presented results and charts are given in kW/m2 or W/m2. However, the IT equipment and occupancy will both be considered in the process of building simulation with the assumption of all the occupancy is the study room is using it to do the coursework with computer.
3. Methodology
In this study, it is important demonstrate how they have adapted simulation interfaces at an early stage of the design process. As part of the case study, a simulation exercise will be conducted. The purpose of this analysis was to determine whether a proposed building design would comply with Approved Document L’s Carbon Emission Calculation Method and the Energy Usage Intensity set by the target. The question posed is how can building operational energy be reduced in order to achieve net zero carbon emissions; the answer is to implement a sustainable strategy that takes into account the health and wellbeing of the building's occupants by analysing the results of building simulation software. This study aims to examine the energy efficiency specific to study space within an educational setting and to look into existing passive energy management strategies.
3.1 Simulation, Baseline and Scenarios
The study employed a mixed methodology and reviewed the literature, conducted interviews and surveys, compiled data from reports, while using a simulation-based approach as one of its main investigation methods. Literature review discusses sustainability strategies, carbon offsetting targets, and energy consumption requirements in education buildings, as well as Part L guidance for achieving energy efficiency.
Simulations of the energy performance of a study room are conducted using the IESVE energy modeling software. Furthermore, solar shading performance is assessed using the sun cast analysis and windrose diagram to determine the direction of the wind. A simulation of the thermal performance is carried out using Apache simulation, and data is collected using Vista Pro with graphs. The data collected includes information regarding energy consumption, heating and cooling loads, carbon dioxide concentrations, etc.
Whenever attempting to determine the performance of a model, it is necessary to establish a base model first. A base model was developed using CAD
drawings taken from the planning drawings which also provides information about mechanical ventilation. Surveys are conducted to determine the number of lights and furniture. On the basis of observations of the occupancy rate of the study rooms in the learning hub during the study period, it is assumed that more than 50% of the seats were taken, however in this study, the occupancy rate was assumed to be 50%.
The process of the study should be Characterization of the building envelope and systems. Hence this will help us in obtaining the baseline building energy consumption for the baseline scenario and establishing the baseline model and occupancy profile A variety of scenarios was developed to determine what was the best strategy for obtaining the best outcome from the passive strategy. These scenarios should not be viewed as predictions of the future, but rather as counterfactual constructions that can be used to highlight the number of output likely to occur.
Establishing technical variants for assessing energy performance and determining the most optimal combinations. Lastly, it need to have a study of indoor thermal comfort based on selected optimal combinations for summer and winter.
Plan drawn in AutoCAD/ Modelling in IESve
Weather Data File based on the closest Location Solar Studies
Construction Materials of the Building Envelope
IESVE Apache Simulation
Different Scenarios for building simulation Results
Passive Design Strategies
Chart 3.1 Building Simulation Methodology
3.2 Building Site, Location and Climate
Located just south of the downtown area of Northampton, the Waterside campus is located along the River Nene in Northamptonshire, a county in the South Midlands in United Kingdom. Similarly, to other parts of the United Kingdom, the summers in Northampton are short, pleasant, and partly cloudy, while the winters are long, very cold, windy, and mostly cloudy. During the course of the year, the temperature usually ranges between 2°C and 21°C with temperatures rarely falling below -3°C or exceeding 27°C. Nevertheless, global warming is contributing to a warmer climate during the summer (Weather Spark) Also, UK has a predominantly wet climate.
During the summer, this glass-enclosed building is exposed to a great deal of heat without any shade provided by other buildings. In contrast to Northampton town center, which is around 50 to 60 meters above sea level, this site is situated at an elevation of around 130 meters (Wiki) Therefore, it should not be considered a true representation of Northampton as a whole. A hilltop location reduces the pooling of cold air on calm, clear nights, and lower temperatures during the summer as a result.
Because the weather file is not available for Northampton, the weather file of Birmingham (as the nearest site) was selected in the simulation purpose.
Wind Rose Diagram of the Site
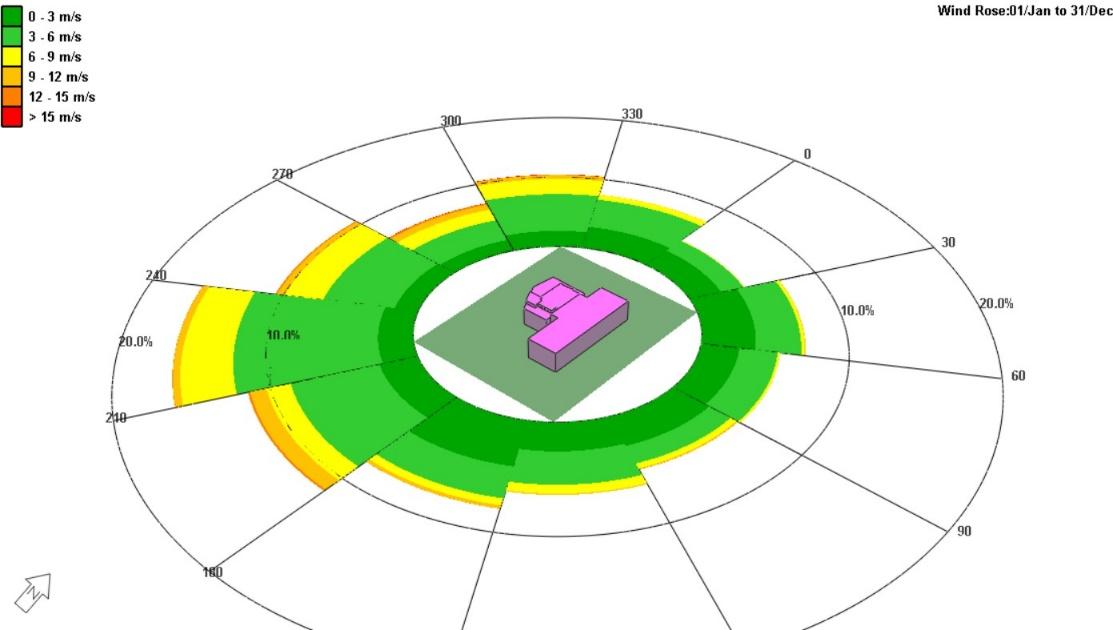 Figure 3.1
The annual wind rose diagram generated by IESVE shows the wind mostly from the south west direction.
Figure 3.1
The annual wind rose diagram generated by IESVE shows the wind mostly from the south west direction.
3.3 Building Geometry and Orientation
This study room located at the fourth floor of the Learning Hub as show in Image 1. It is an open plan space that encompasses a surface area of 689 square meters and a volume of 2066 square meters. There are three sides of the building that face the outside; one side is the long side, which faces west, and the other two
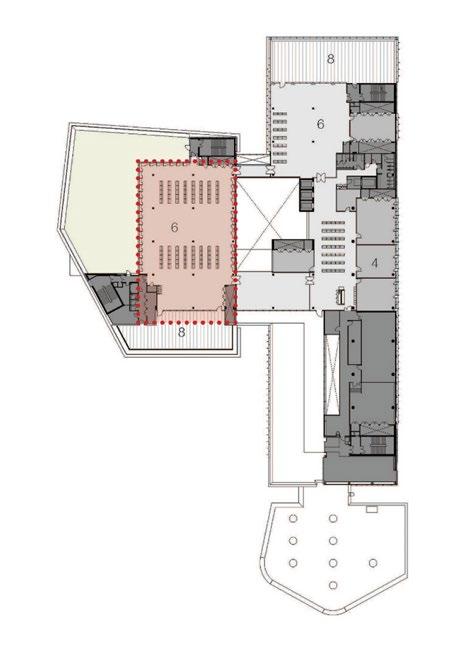 Figure 3.2 Plan of Fourth Floor of Learning Hub, UON (Source: MCW Architects)
Figure 3.2 illustrates the baseline geometry plan for the floor. Drawings are first generated in AutoCAD and then imported into the IESVE simulation software, as shown in Image 3.
Figure 3.2 Plan of Fourth Floor of Learning Hub, UON (Source: MCW Architects)
Figure 3.2 illustrates the baseline geometry plan for the floor. Drawings are first generated in AutoCAD and then imported into the IESVE simulation software, as shown in Image 3.
are the short sides which face north and south. On the north side of the building, there is an outdoor terrace, and on the west side, there is a green space (which is not open to the public). The east-facing side of the room faces the interior of the building.
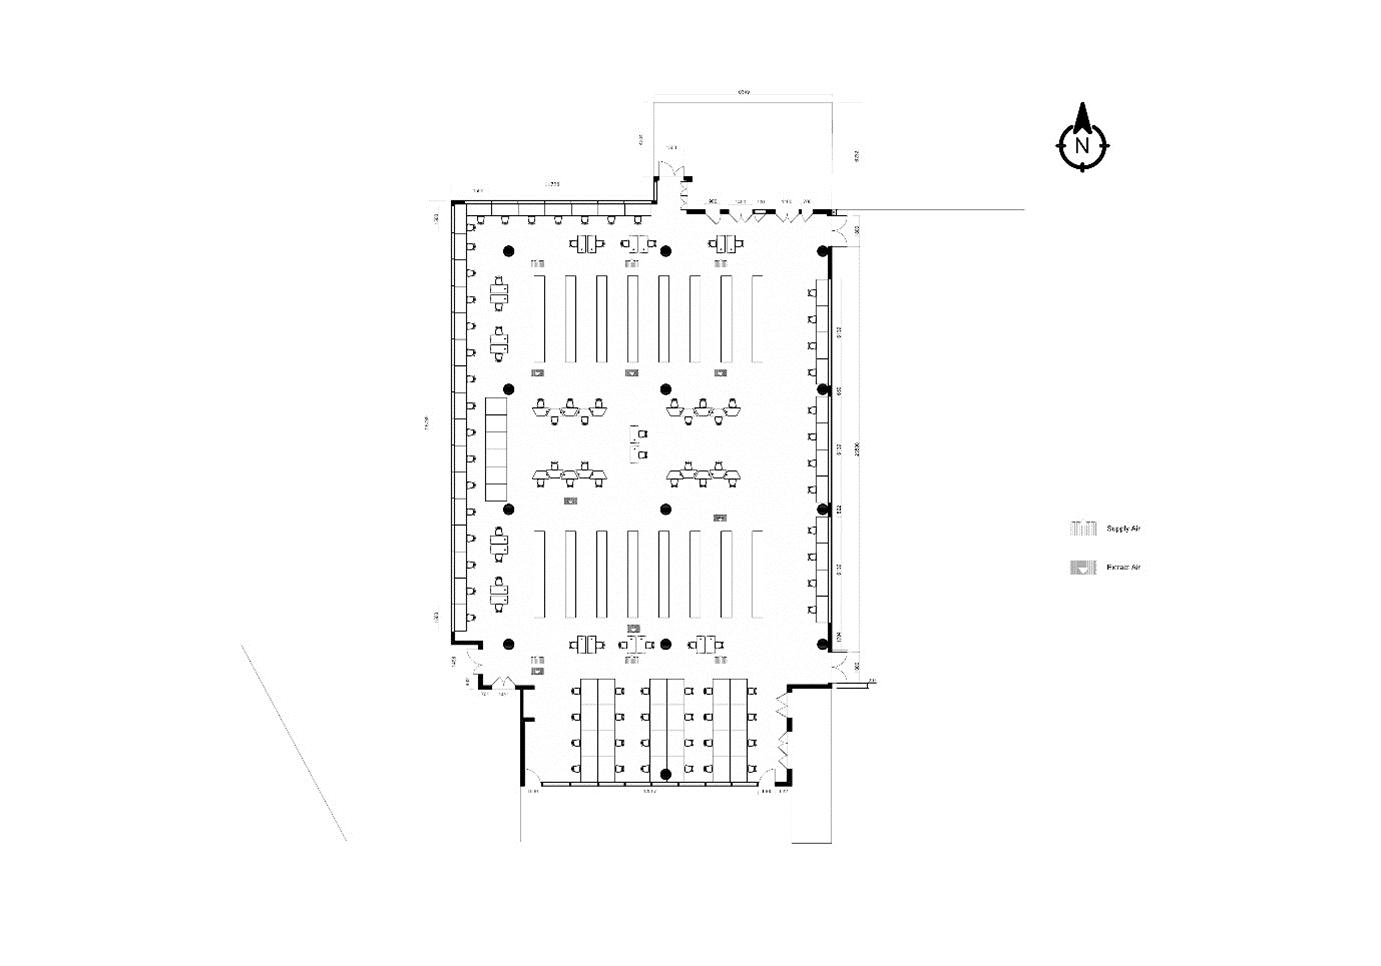 Figure 3.4 Plan of Silent Study Room, Learning Hub
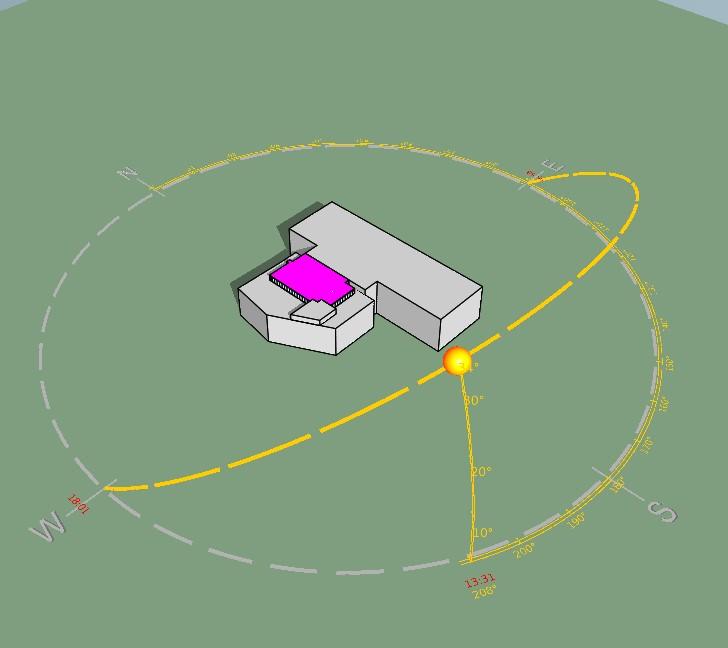
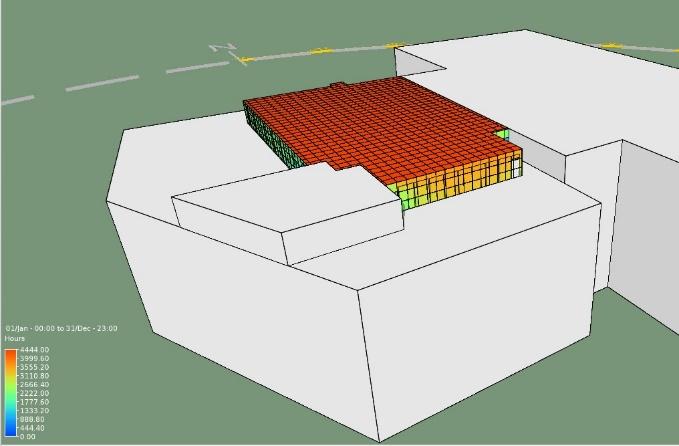
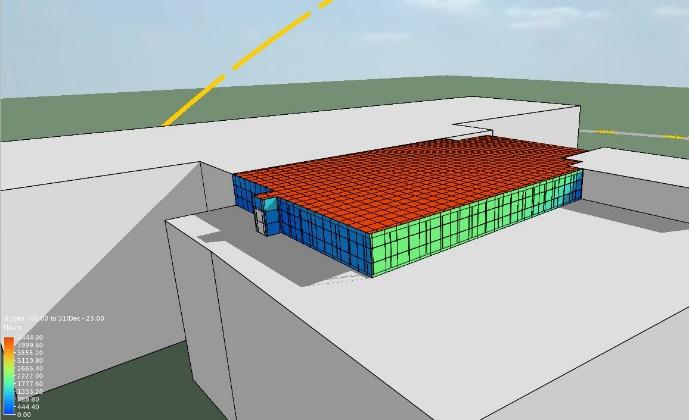 Figure 3.5 IESVE Model
Figure 3.6 Solar Analysis of South & East Façade
Figure 3.7 Solar Analysis of North & East Facade
Figure 3.5 IESVE Model
Figure 3.6 Solar Analysis of South & East Façade
Figure 3.7 Solar Analysis of North & East Facade
3.4 Baseline building
To determine the performance of a model, a base model as shown in figure 3.5 must always be established. Figure 3.6 and Figure 3.7 has shown the solar analysis of the study model. In this study, the base model used is the silent study room in learning hub, which was constructed between 2016 and 2020. It was specified in accordance with the Part L 2013 standard. The purpose of this study is to compare the performance of the system and determine whether it can be upgraded in order to meet our zero-carbon emission target.
3.4.1 Description of the Base Model-Silent Study Room
A room with the capacity to accommodate up to 100 people is assumed to be occupied by 50% of the occupants. Hours of occupancy are 9:00 a.m. to 17:00 p.m. from Monday to Friday. Despite being open on Saturday and Sunday, the study room is less crowded and there are no specific numbers to show, therefore it was not included in the parameters of this study. Additionally, the heating system in the room is controlled by a building management system (BMS) with set point as indicated in the table. The guidance contained in CIBSE TM23 indicates that this permeability typically results in an air infiltration rate of about 0.25 ach. Accordingly, infiltration rates were set at 0.25 ach for all scenarios.
In the profile, it has been specified that LED lights and task lighting are remain on throughout the working day. Several electricity appliances were taken into consideration since they contribute to the internal heat gain. The appliances include: 50 laptop computers, which correspond to the number of people in the building, one photocopier machine, and a few chargers.
Type Library and study room Area (m2) 689m2 Volume (m3) 2066m3 Window area (m2) 118.4 m2 Wall area (m2) 212 m2 Occupancy 50 Computer 50 Printer/photocopier 1 Lights Fluorescent Light (720w) Task Light (160W) Other Chargers
Table 3.1 Description of the base model
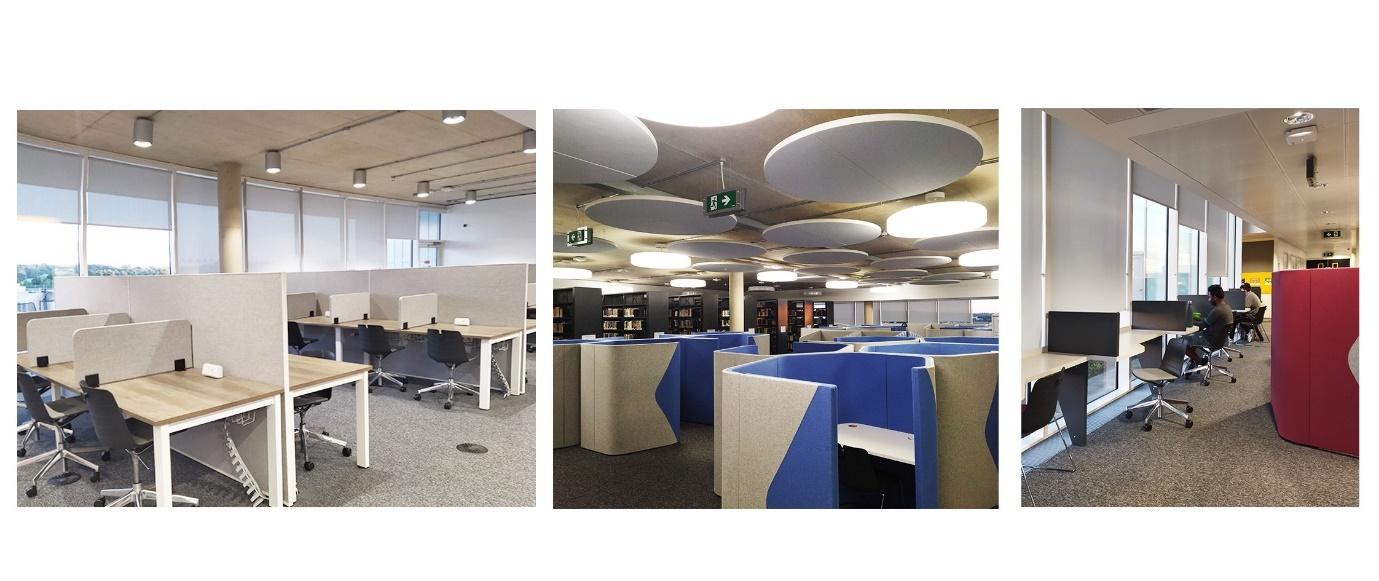
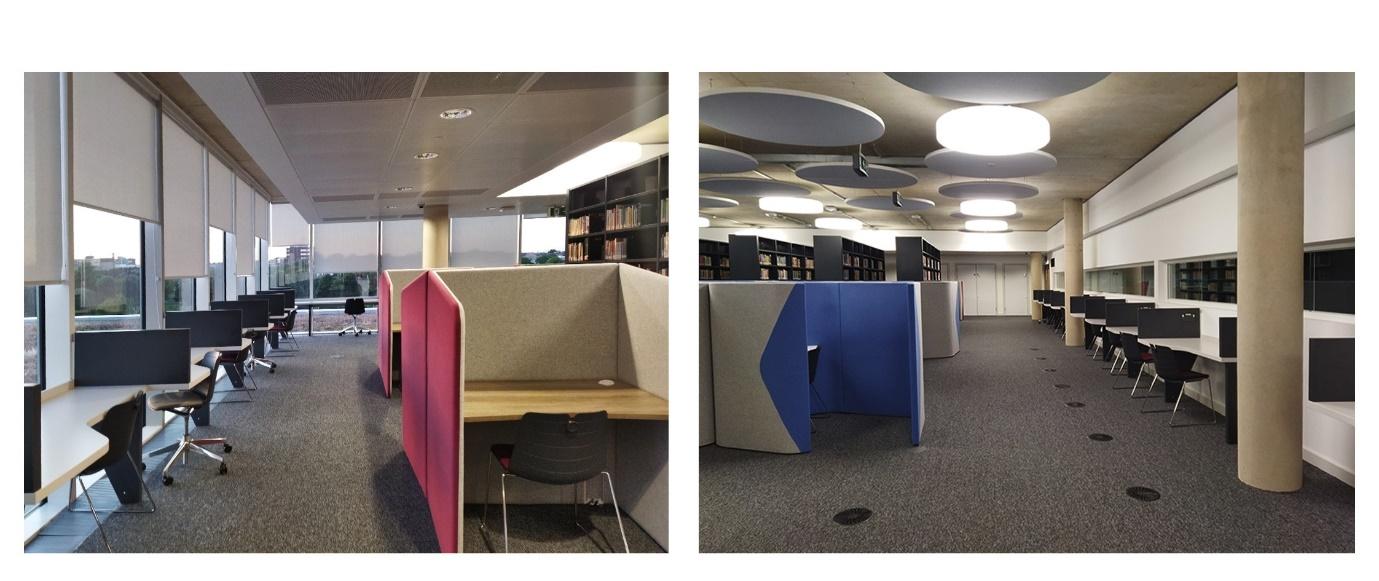 a. South side of the room
b. Centre of the room
c. North Side of the room
d. West Side of the room
e. East Side of the room
Figure 3.8 Photos of the Silent study room
a. South side of the room
b. Centre of the room
c. North Side of the room
d. West Side of the room
e. East Side of the room
Figure 3.8 Photos of the Silent study room
3.4.2 Construction Summary of Baseline Model
The building specification is developed during the period based on the planning application filed in 2013 and the construction schedules shown in 2016. As this campus is committed to sustainability, it is assumed that the materials will comply with Part L 2013 standards. Using the information collected from the drawings, building construction materials were developed for the base model. There is a curtain wall called Fibre Cement Rainscreen Cladding covering most of the room and it is assumed that it is a double-glazed glass panel. The warm roof with exposed concrete can be seen from the photo and the flooring is based on the observation is the specification of floor from REHAU’s Thermally Activated Building Structures specifications
Construction Description Transmittance U (W/m2 ·K) Curtain Wall/ Windows Double glazed UPVC with internal argon filling 1.86 Roof Waterproof membrane, 50mm cavity, 100mm Concrete Deck 0.18 Floor 20 mm carpet/underlay, 60 mm screed, 100mm Insulation, 260 mm cast concrete 0.21 External Wall 102.5mm brick, 100 mm airspace, 102.5 mm brick ,25 mm lightweight plaster (bothside) 0.29
Table 3.2 Construction and U-value of the base model
3.5 Scenarios Study Methodologies
A series of different scenarios must be developed to explore different energy assumptions and thermal comfort conditions in the room, and the results will be compared. It may be necessary to analyse a variety of scenarios and explore additional options with possibility to determine the most effective strategy to achieve a low energy consumption and high thermal comfort in a room. The results such as the air temperature, dry bulb temperature, Heating Plant Sensible Load, Cooling Plant Sensible Load, Total energy consumption, Concentration of carbon dioxide and comfort level will be study. The Chart 3.2 demonstrates how scenarios were developed through the model. Based on the results of the simulation, a potential passive strategy could be identified.
1. Free Run without Ventilation
2. Input of Mechanical Ventilation
Temperature
3. Different Shading devices to be test
4. Set Temperature setting point for heating and cooling
Concentration of carbon Dioxide
5. Alterations to the construction and U-Value
6 Different Shading devices to be test
Heating and cooling Load
Chart 3 2 The development of scenarios
3.5.1 Scenarios A : Free Run without Ventilation using Base Model
The first scenario involves studying the base model without the ventilation or heating system operational. This is to determine whether the room could be operated without consuming any energy Based on the results of figure 3.9, the temperature needs to be increased during the winter months of October to February. To achieve the desired temperature of the room, the heating system must be turned on. There is a possibility that the room will be at an adequate temperature between April and June, as well as from October to November.
In fact, most schools are free running during the heating season as most of the course/class is not occurring. The graph indicates that in the summer there is a possibility of overheating. School bulletin 101 states that the operative temperature during the heating season is between 20°C and 25°C. (Bulettin 101) This means that cooling energy must be applied, or ventilation must be used to cool down the room. Based on the results of the study, it can be concluded that only the Winter period will still require heating. In the summer, cooling is necessary in the absence of ventilation.
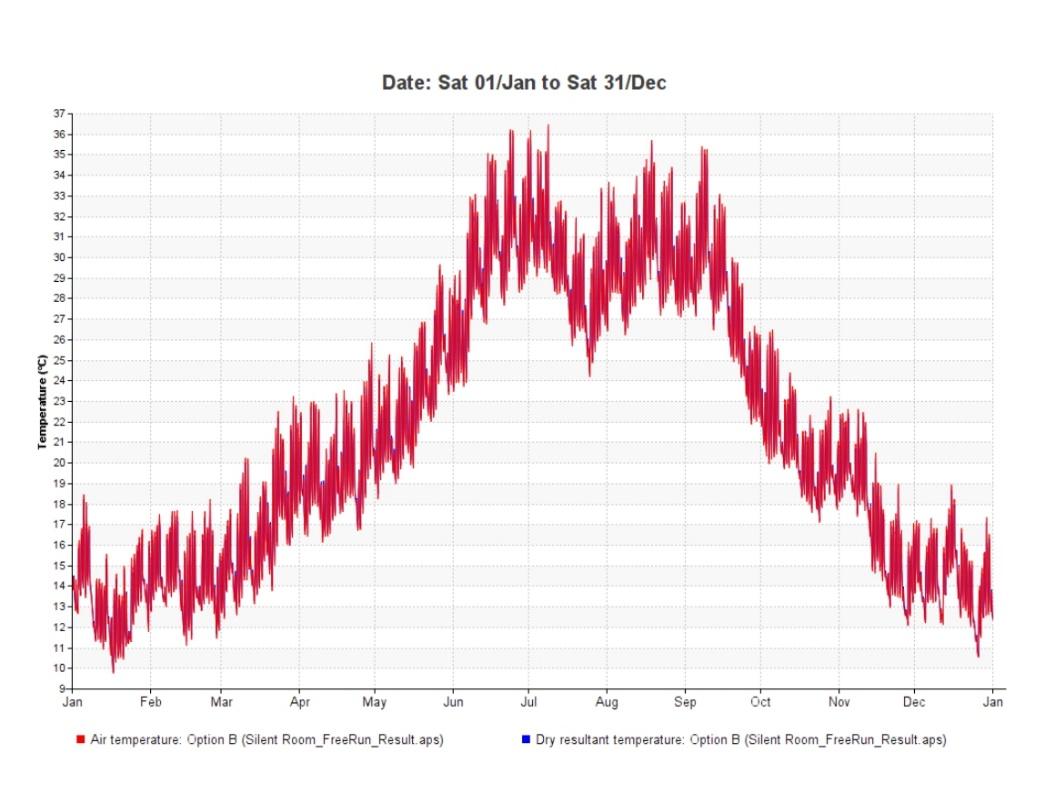 Figure 3.9 Air Temperature and Resultant Temperature of the Free Running of Base Model
Numerous studies have shown that the concentration of carbon dioxide can affect the mental and physical health of the human. It also can have some effect on the concentration of the people on studies. Following the recent covic epidemic, concerns have been raised regarding the ventilation of buildings and the quality of air inside. Figure3.10 illustrates the concentration of carbon dioxide in the room. During the occupancy hours, the concentration of carbon dioxide would exceeding 2000 PPM, which is above the safety threshold. There would be no safety for people to stay indoors without any form of ventilation, whether natural or mechanical. According to the CIBSE TM40: Health Issues in Building Services, approximately 1000 ppm is a lower limiting value. Having an occupancy rate of 50%, it has already exceeded the required standard by twofold. It will therefore not be possible to use the facility if there is an occupancy rate of more than 50% in the absent of ventilation.
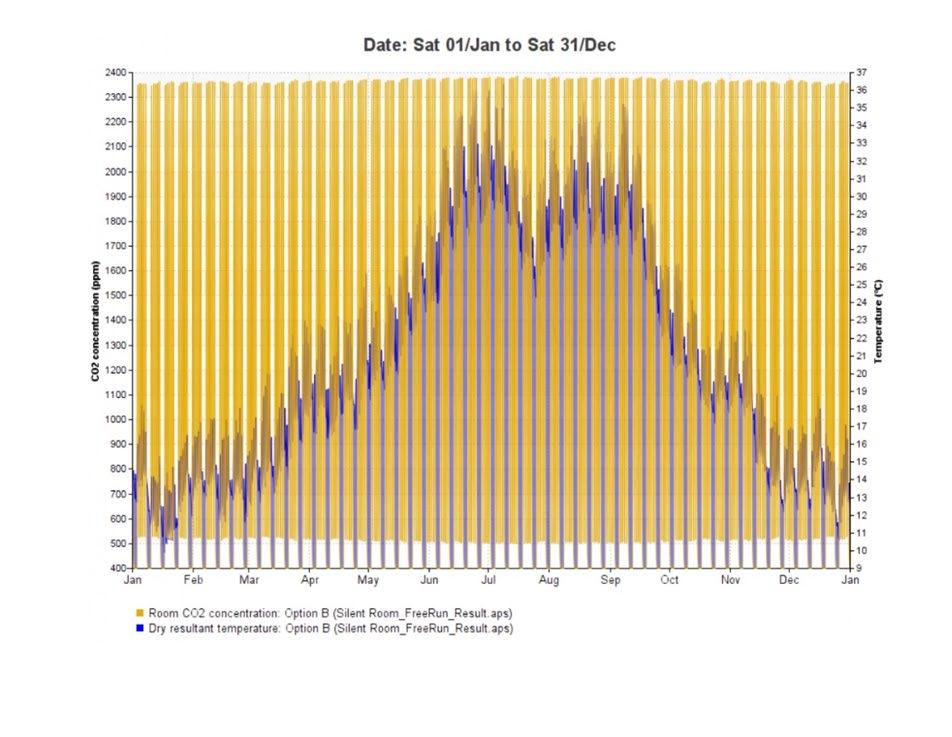 Figure 3.10 Temperature and Room Carbon Dioxide of the Free Running of Base Model
3.5.2 Scenarios B Mechanical Ventilation
Building Bulletin 101 specifies a minimum air movement rate of 3 l/s per person, a daily average of 5 l/s per person, and a maximum air movement rate of 8 l/s per person while the building is occupied (Bulletion 101) An occupancy periodspecific profile is created and used based on the potential study period. In this scenario, the air movement of 5 l/s per person was turned on with study period profile. In the graph 3 the redline is showing the temperature of the room with ventilation. As shown in the graph, the temperature could be lowered a few degrees by mechanical ventilation. The lower temperatures in the summer make it more suitable for rooms. In the winter, if the temperature was lowered a few degrees, more energy would be required to heat the building.
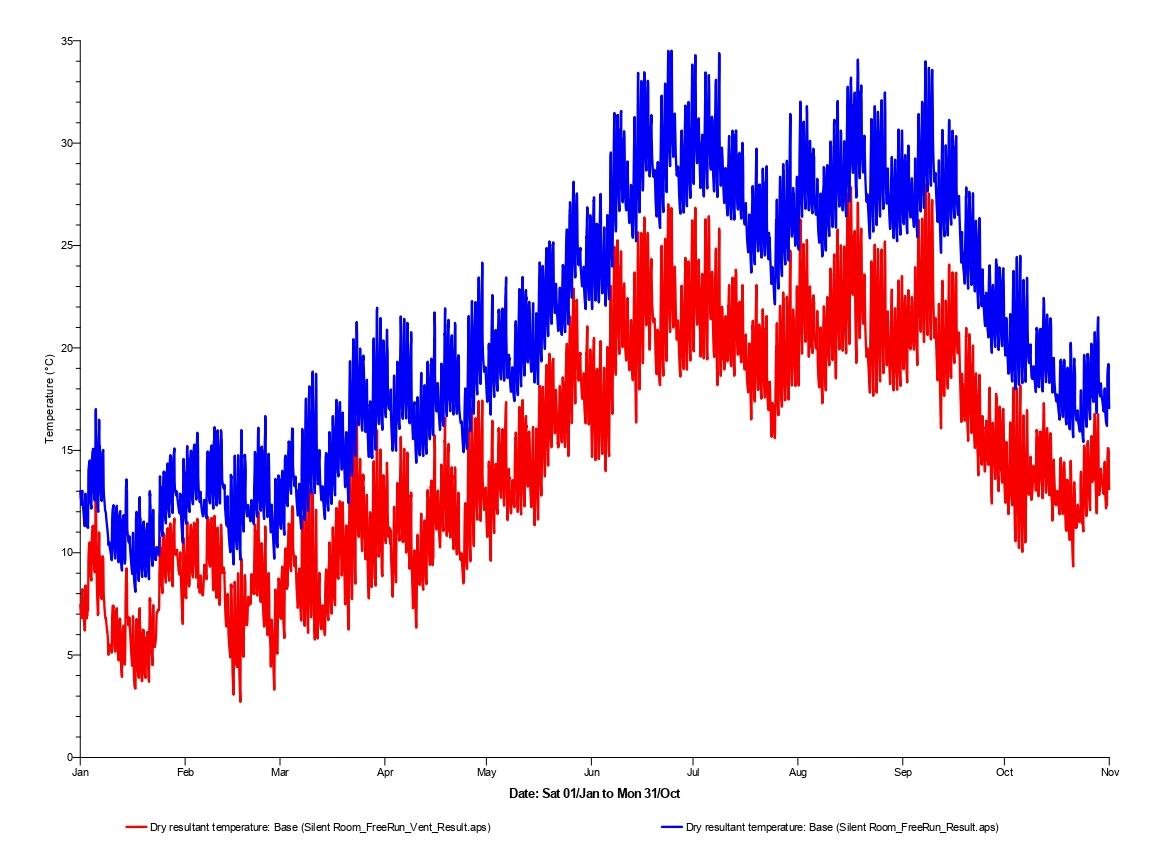 Figure 3.11 Operative Temperature Base Model and Mechanical Ventilated Model
Figure 3.12, carbon dioxide concentrations during occupied hours are shown for the entire year. The room appears to achieve less than 850 parts per million, which is the acceptable range. Despite this, this appears to be based on an occupancy rate of 50 people. If the room is fully occupied by 100 individuals, the concentration of carbon dioxide is expected to rise, and additional ventilation will be required. To meet the demand, a mechanical ventilation unit with a higher power rating is required. Considering that the room is primarily covered by a curtain that is not operable, it will rely only on its five doors to be opened. In the south facing side of the room, there are only two doors that open directly to the terrace. These doors can be opened when the room is too stuffy or when the concentration of carbon dioxide is too high.
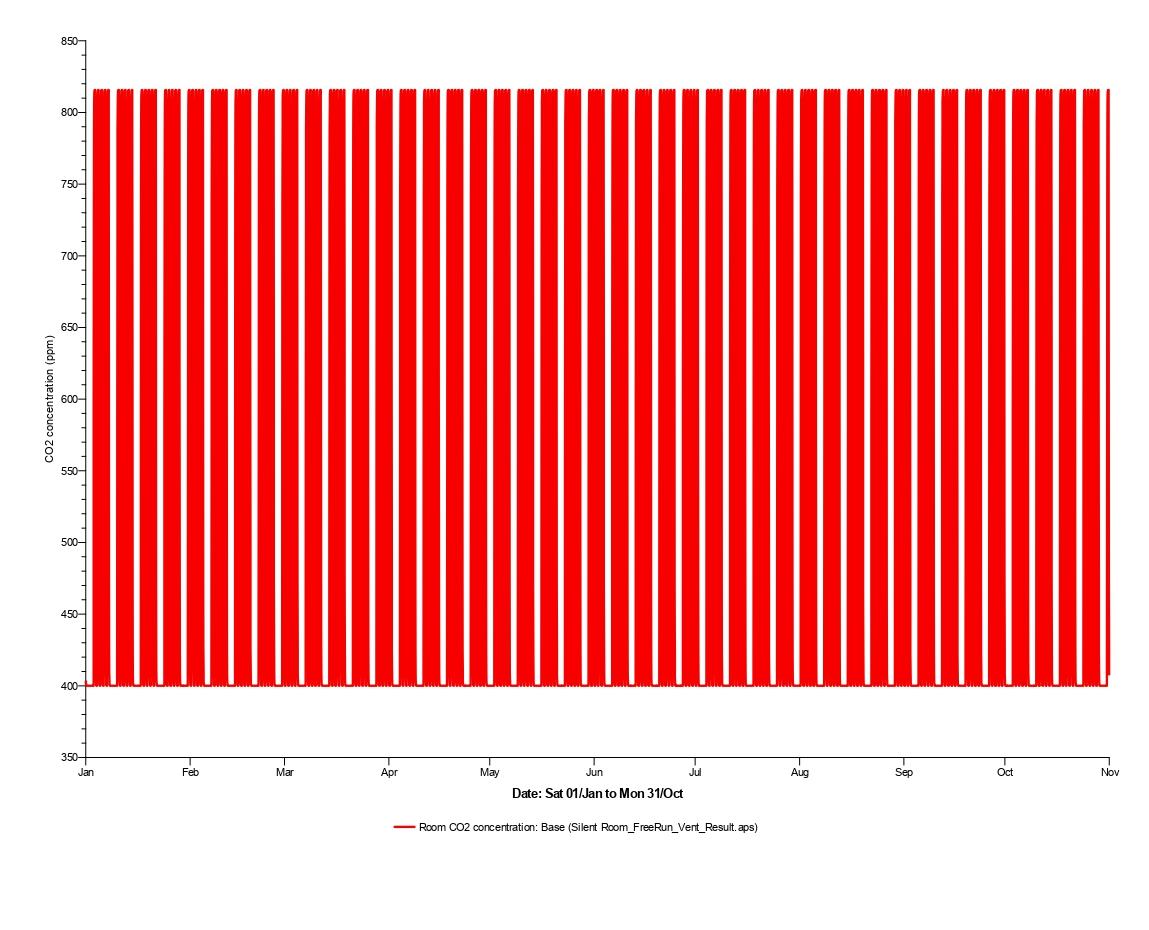 Figure 3 12 Concentration of carbon dioxide in Mechanical Ventilated Model
3.5.3 Scenarios C Natural Ventilation
The following scenario provides a number of options. Generally, the base model has a fixed window, and the door remains intact. Option two is the base model setting with the door open as part of the natural ventilation system, and it is referred as Base Model-DO. A second model that opens 50% of the window with a 30% angle is referred to as Model V1. Another model that provides stack ventilation is known as the model V2 as shown in Figure 3.13,, which has a skylight that can be operated mechanically to direct light into the centre of the room.
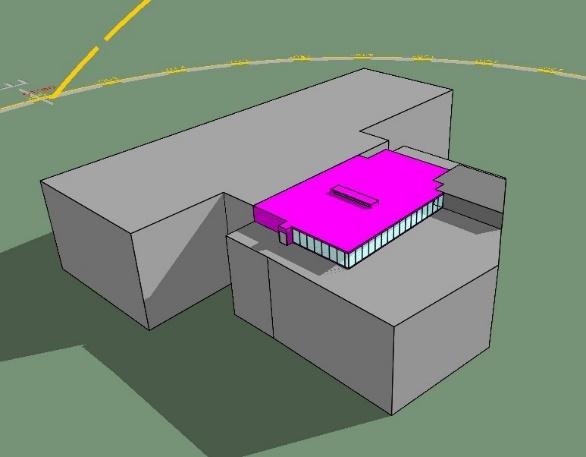 Figure 3.13 Model V2
The graph of Figure 3.14 has shown the highest temperature belong to the Base Model while the lowest temperature is Model V1. This is predictable as the more ventilated it is the lowest temperature will it be. The green line which belongs to model V2 show the very close temperature to model V1. The temperature in Model-DO is higher than both model V1 and model V2 but much lower than the base model. This can contribute to the more heating energy. In this case, we should determine the weather cooling energy required for Base model-VO, and it show majority of the temperature is lower than 30 degrees However, the model V2 might lead to a more comfortable temperature during summer
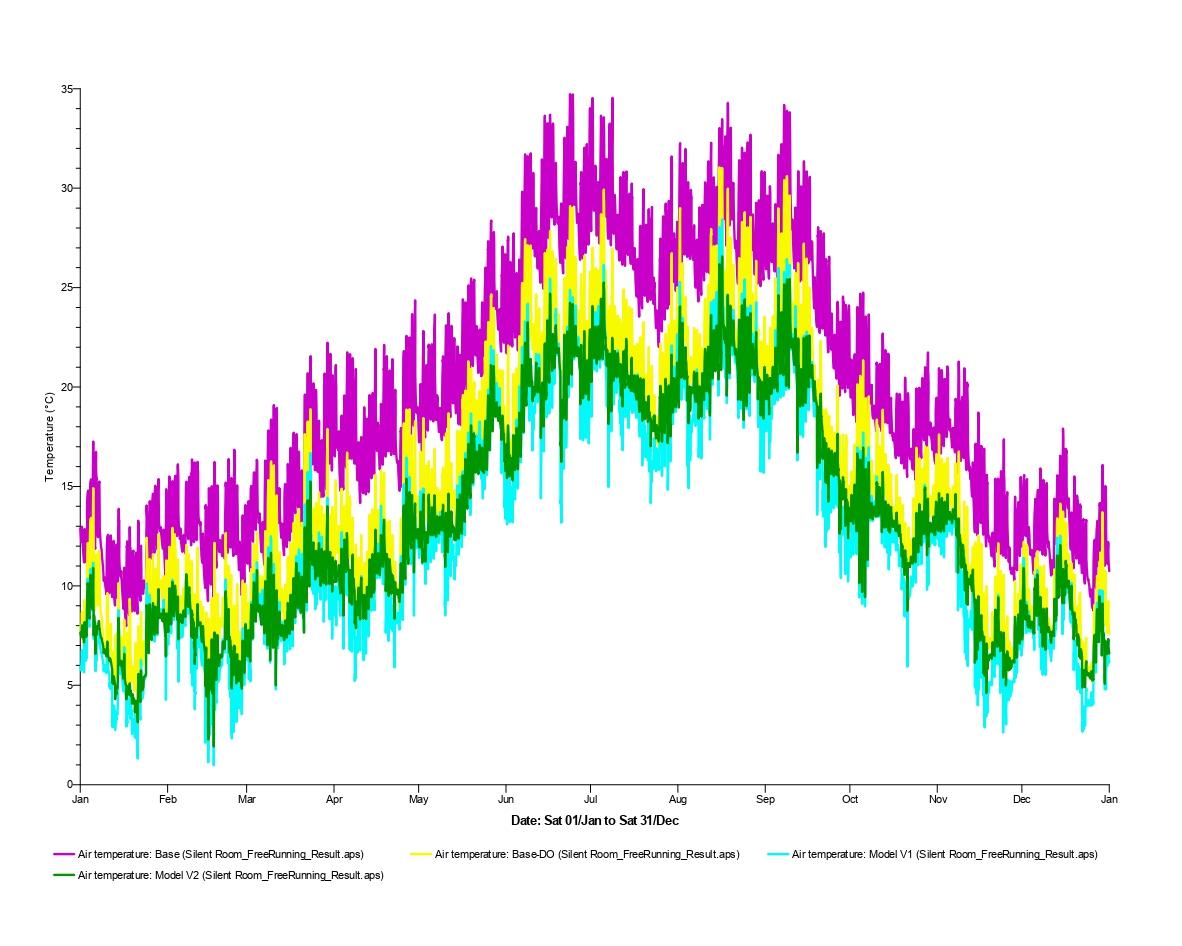 Figure 3.14 Temperature of Base Model, Base Model-DO, Model V1 and Model V2
As can be seen from both the graphs in Figure 3.15 and Figure 3.16,, the heating sensible plant load and the cooling sensible plant load are separately shown. The purple bar on the bar chart 1 shows the highest required energy for Model V1 followed by the green bar showing the highest required energy for Model V2. As a result of the continuous opening of the windows for natural ventilation, a high amount of energy would be required for heating. As opposed to the summer, the natural ventilation could be the most beneficial in the winter because it would not need any energy to provide cooling. There was, however,
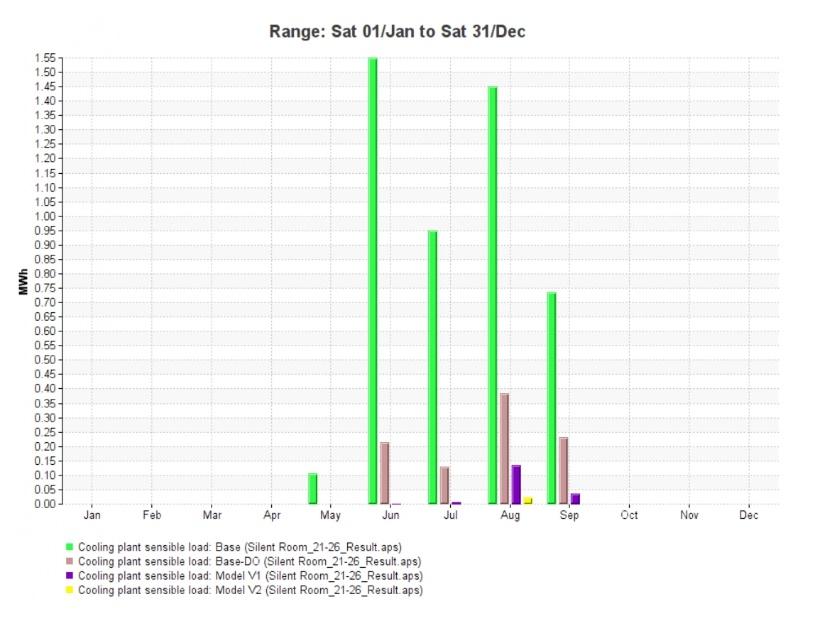
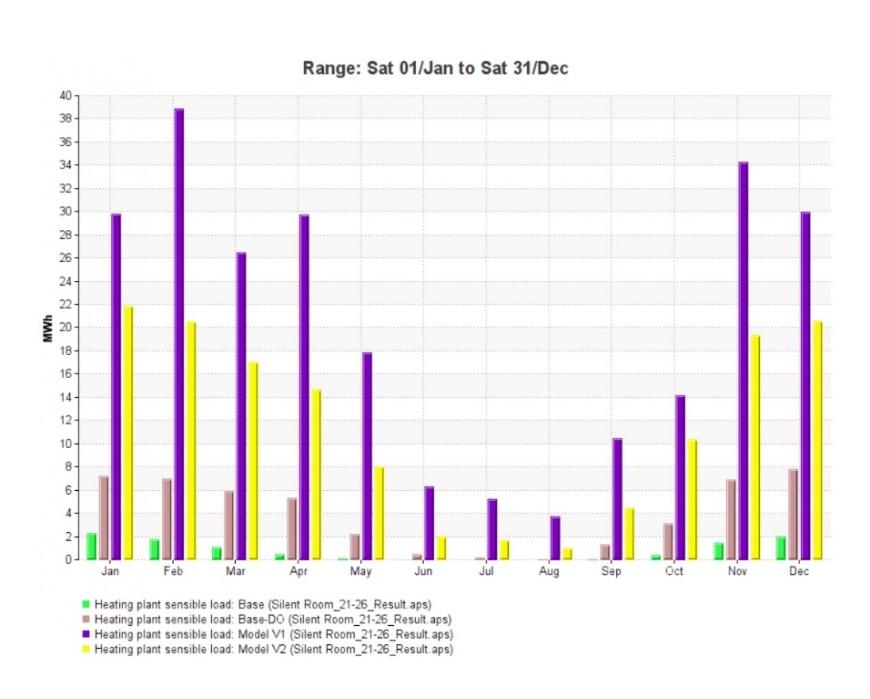 Figure 3.15 Heating Sensible Plant Load of Base Model, Base Model-DO, Model V1 andModel V2
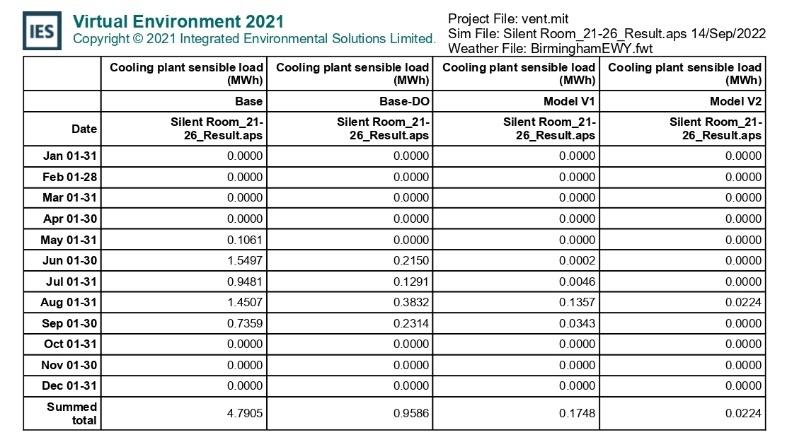
Figure 3.16 Cooling Sensible Plant Load of Base Model, Base Model-DO, Model V1 and Model V2
Figure 3.15 Heating Sensible Plant Load of Base Model, Base Model-DO, Model V1 andModel V2
Figure 3.16 Cooling Sensible Plant Load of Base Model, Base Model-DO, Model V1 and Model V2
a problem with the base model in terms of its cooling energy consumption during the summer months.
In Figure 3.17,The total energy for the base model remained the lowest and the model V1 is the highest with the model V2 following closely behind them in terms of energy use. However, due to the current profile of continuously opening windows for ventilation to keep rooms ventilated, there might be no advantage to switching to a natural ventilation strategy if we take into account the effect it might have on our energy bills. It would be beneficial if the unit could be enclosed during the winter months since the model V2 has the lowest cooling energy. In case the door is left open continuously, the energy bills of the base model do are five times higher than if the door is left shut continuously. As such, it may be necessary to consider keeping the door and window intact as much as possible in order to ensure that they remain intact. Compared to the base model, the base model has a reasonable result in saving energy when it comes to cooling and heating.
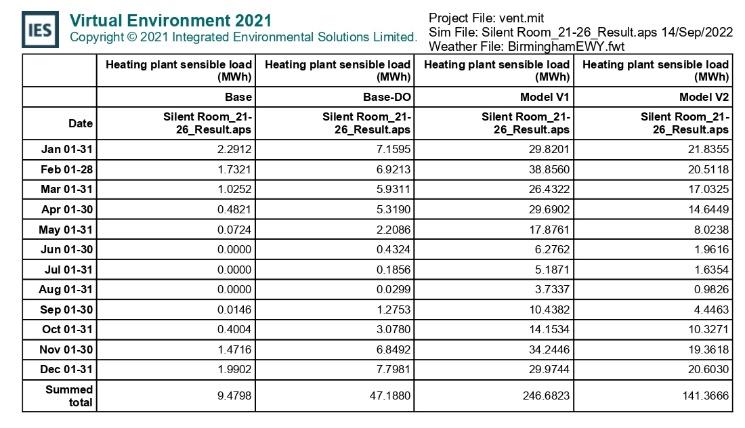
Base Base-DO V1 V2 Total Heat &Cooling Energy : 14.2 48.1 246.9 141.4
Figure 3.17 Total Heat &Cooling Energy
Figure 3.18, shows that carbon dioxide levels have exceeded those of the ideal level, in keeping with the data from scenario 1. The concentration of carbon dioxide in all other models has been below 600ppm, which is the most comfortable level of the study space. As a result of the continuous ventilation, carbon dioxide concentrations are relatively low and fresh air is sufficient. Moreover, the graph shows how the two openings of the door managed to reduce the concentration of carbon dioxide below the acceptable level. Model V2 is the yellow line with the lowest concentration of carbon dioxide, which means that opening the ventilation system could result in a drastic reduction in carbon dioxide concentrations. The comfort index for the base model is the highest, indicating the most uncomfortable model, while the comfort index for the model V2 is the lowest, indicating the most comfortable model. Model V1 appears to be slightly more comfortable than the base model-DO, although the model-DO is very close to each other.
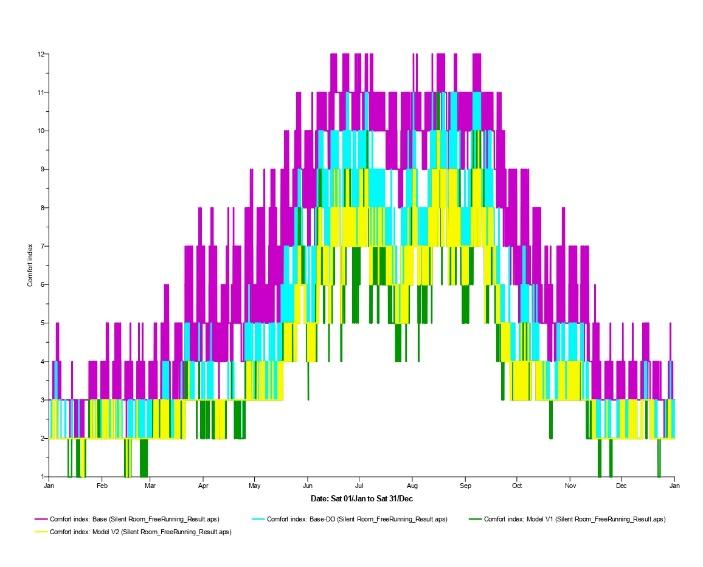
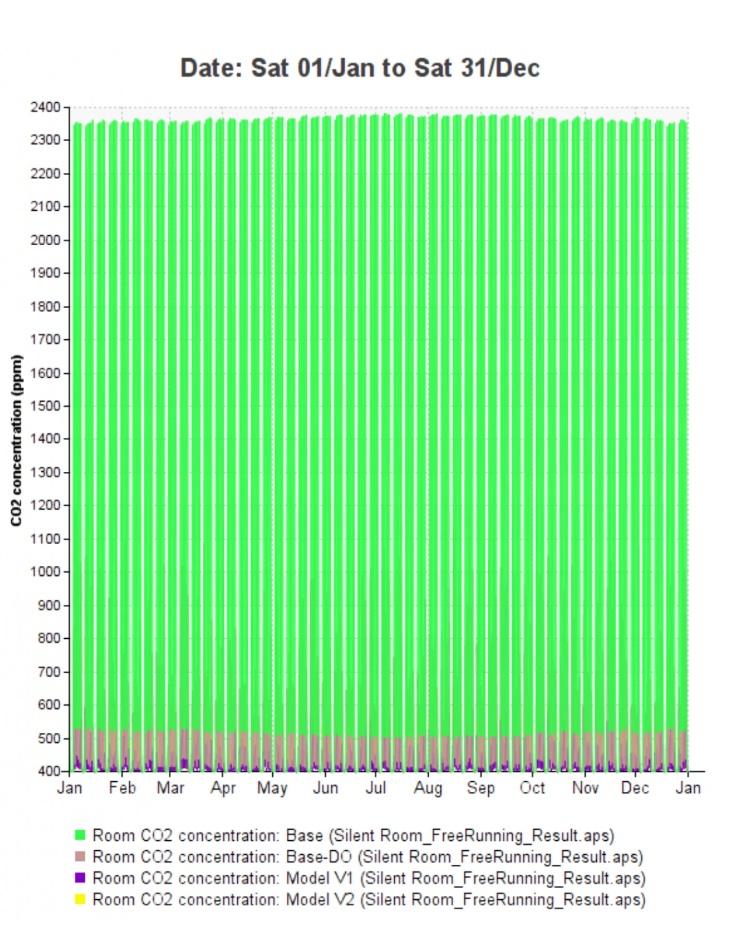 Figure 3.18 Concentration of CO2 of Base Model, Base Model-DO, Model V1 and Model V2
Figure 3.19 Comfort Index of Base Model, Base Model-DO, Model V1 and Model V2
Figure 3.18 Concentration of CO2 of Base Model, Base Model-DO, Model V1 and Model V2
Figure 3.19 Comfort Index of Base Model, Base Model-DO, Model V1 and Model V2
3.5.4 Scenarios D Temperature setting point for heating and cooling
In accordance with the Approved Code of Practice, a workplace should normally maintain a temperature of at least 16 ºC (HSE) Unfortunately, there is no maximum temperature that workers should be exposed to. Although it is based on the circumstances of the working world, the study of education may differ; however, it can be used as a guide. Some research in the field of indoor comfort suggests that lower winter temperatures (20°C) and higher summer temperatures (up to 25°C) can maintain comfort levels acceptable to the majority of occupants, depending on the other characteristics of the building, relative humidity, and tolerance of occupants. It may be possible to negotiate more flexible or 'floating' set points between tenants.
To compare the heating and cooling load demands, two sets of temperature set points are used. The first temperature set point for heating is 21°C, and the second temperature set point for cooling is 26°C. Another set of temperature is 2°C different which is 19°C for heating set point and 28°C for cooling set point.
Temperature set point for heating: 21°C
Temperature set point for heating: 26°C
Temperature set point for heating: 19°C
Temperature set point for heating: 28°C
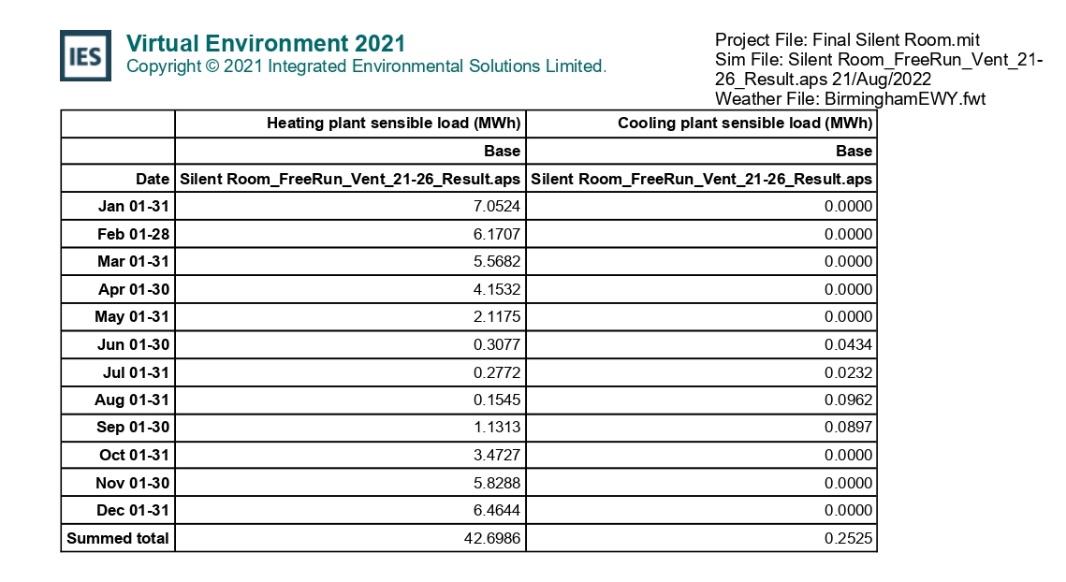
Figure 3.20 Heating and Cooling Plant Loads of the Set Point 21°C-26°C
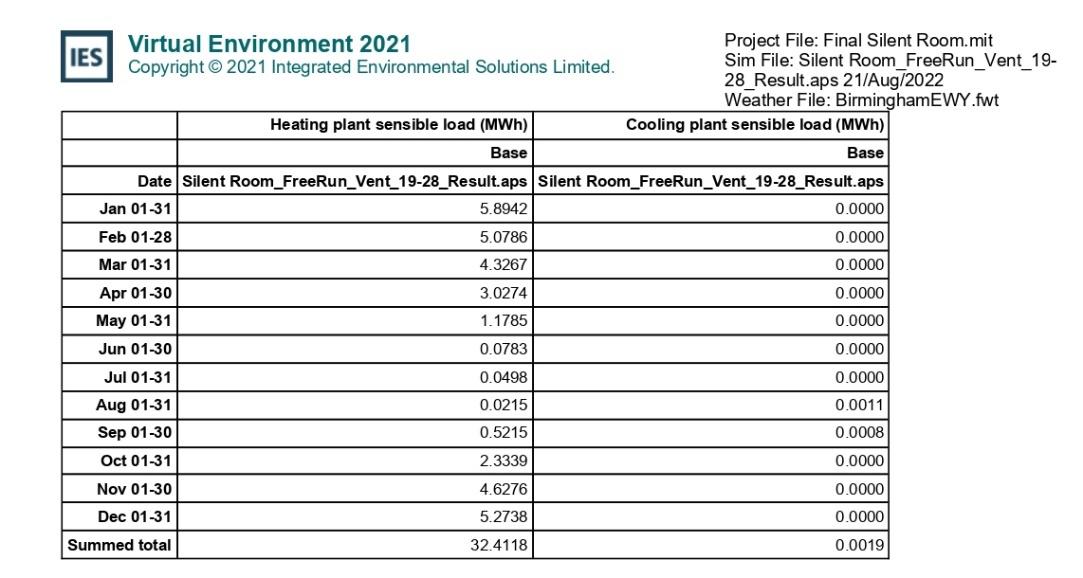
Figure 3.21 Heating and Cooling Plant Loads of the Set Point 19°C-28°C
Figure 3.20 and Figure 3.21, show different heating and cooling plants with different set points. For the heating load, the set point of 19°C which is only 2°Clower is drastically reduced by 23.8%. The set point for cooling of 28°C almost mean the no cooling load required.
During the summer, when there may not be much occupancy, there may not be a need for air cooling. Considering that the heating load constitutes the majority of the energy in a room, determining how to keep the room warm is an important concern. As the heating load will not be needed during the summer months, the result of the calculation should not include the summer months. However, with the global warming, it means temperature is increasing high during summer months. As it is located in the main building on campus, it may also be used for summer education training, making it still in use in summer.
In the winter, the lower temperature outside and the lack of solar gain will result in a lower temperature in the building. As shown in the table, the peak cooling demand will occur between November and February. As a result, the cooling load increases by five to seven times during the winter months compared to the autumn and spring period.
The difference in temperature of 2°C might affect the comfortability of the occupants to some extent. Adaptive behaviour has been found to be beneficial in response to a wide variety of temperature and climate conditions in some studies. It is therefore possible that the campus with students from various countries will need to adapt to wearing warmer clothing in the wintertime. According to Rijal et al., thermal comfort can be significantly affected by adaptation behaviour (e.g., opening windows, changing clothing, adjusting air conditioning and heating equipment, etc.). As a result of experiencing thermal discomfort, people tend to react to restore comfort
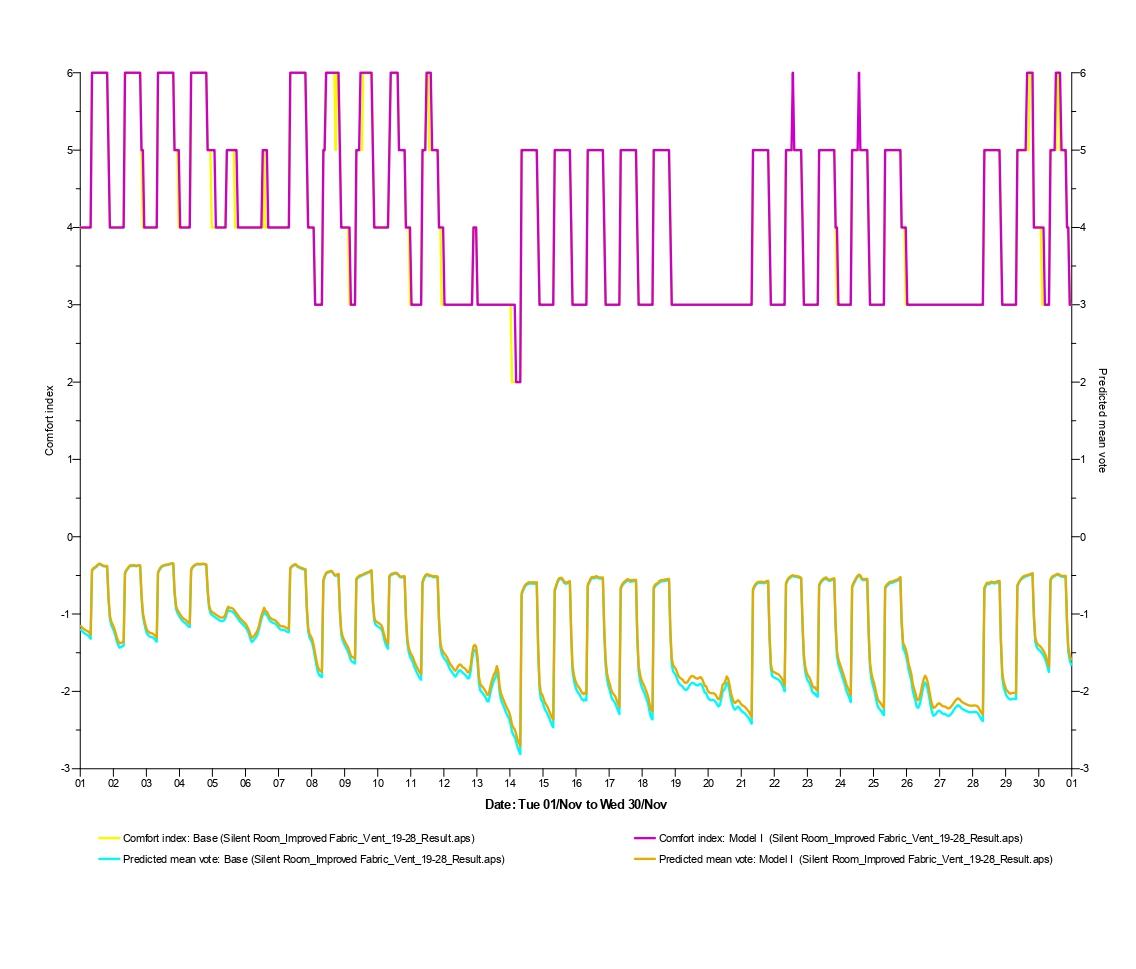
Figure 3.22 Predicted Mean Vote and Comfort Index of Base Model
The figure 3.25 show that the thermal comfort is slightly disappointed as it is slightly cool in the room. The yellow and green line show the PMV of the room is under minus which is slightly cool. The recommended thermal limit for compliance with ASHRAE 55 is between -0.5 and 0.5.
3.5.5 Scenarios E Alterations to the construction and U-Value
U-Value of New Model (to meet Part L 2022)
The construction specifications for the base model have been designed according to the previous part L standard in 2013 As shown in table 3.2, In 2022, Part L has made several changes, which have resulted in a decrease in the U value for walls from 0.28 to 0.26, the U value for flooring from 0.22 to 0.18, and the U value for windows from 1.8 to 1.6. In this study, the new model with a new input of construction material is referred to as Model I and the construction details is shown in table 3.2 The table 3.3 has shown the U value of the Part L in 2013 and Part L 2020. There are a variety of insulation materials available today that can reduce the U value such as the triple glazed window. In terms of construction complexity and economics, it is more viable when improving a building.
Construction Description Transmittance U (W/m2 ·K) Curtain Wall/ Windows Triple glazed UPVC with internal argon filling 0.91 Roof 154mm Insulation, 50mm cavity, 100mm Concrete Deck 0.135 Floor 20 mm carpet/underlay, 60 mm screed, 100mm Insulation, 260 mm cast concrete 0.18 External Wall 102.5mm brick, 100 mm airspace, 50mm Polyurethane board 102.5 mm brick ,25 mm lightweight plaster (bothside) 0.25
Table 3.2 Construction and U-value of the Model
Element Type Part L 2022 Part L 2013 Roof (flat) 0.18 W/(m²·K) 0.18 W/(m²·K) Roof (pitched) 0.16 W/(m²·K) 0.16 W/(m²·K) Wall 0.26 W/(m²·K) 0.28 W/(m²·K) Floor 0.18 W/(m²·K) 0.22 W/(m²·K) Window 1.6 W/(m²·K) 1.8 W/(m²·K)
Table 3.3 Comparison of Part L 2020 and Part L 2013 (Source: Part L archived)
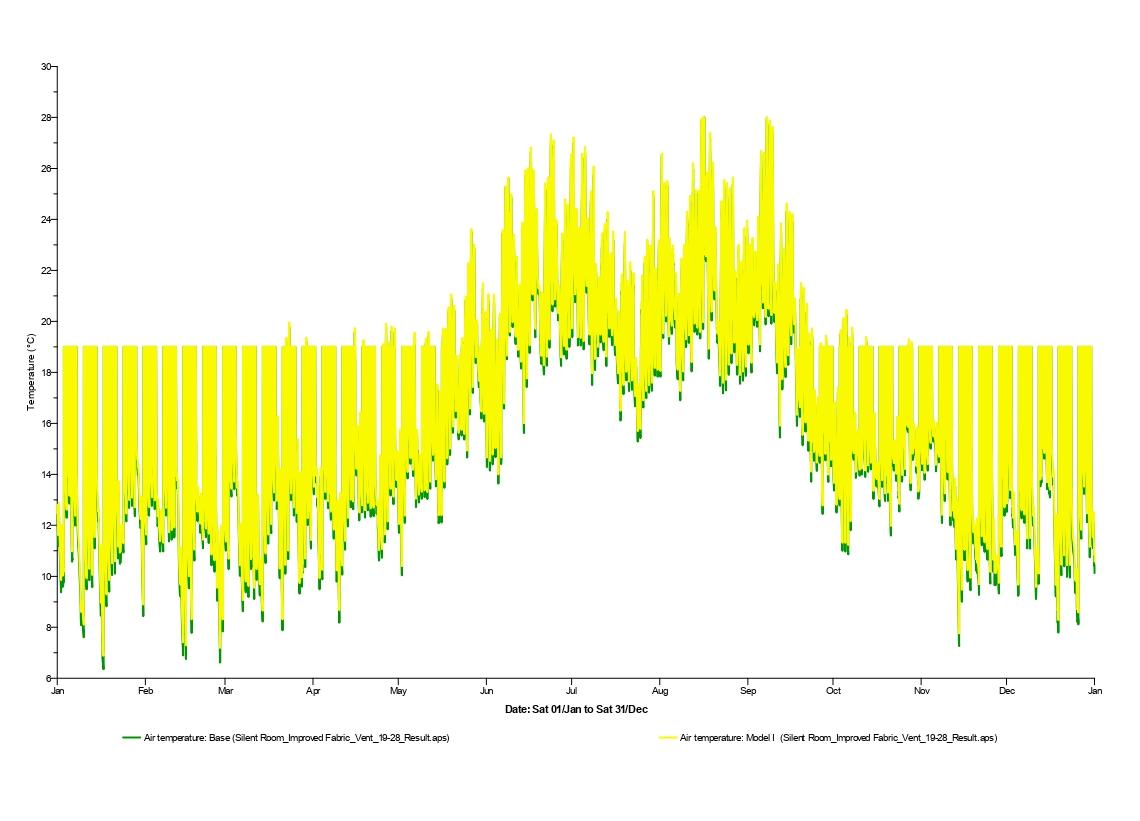
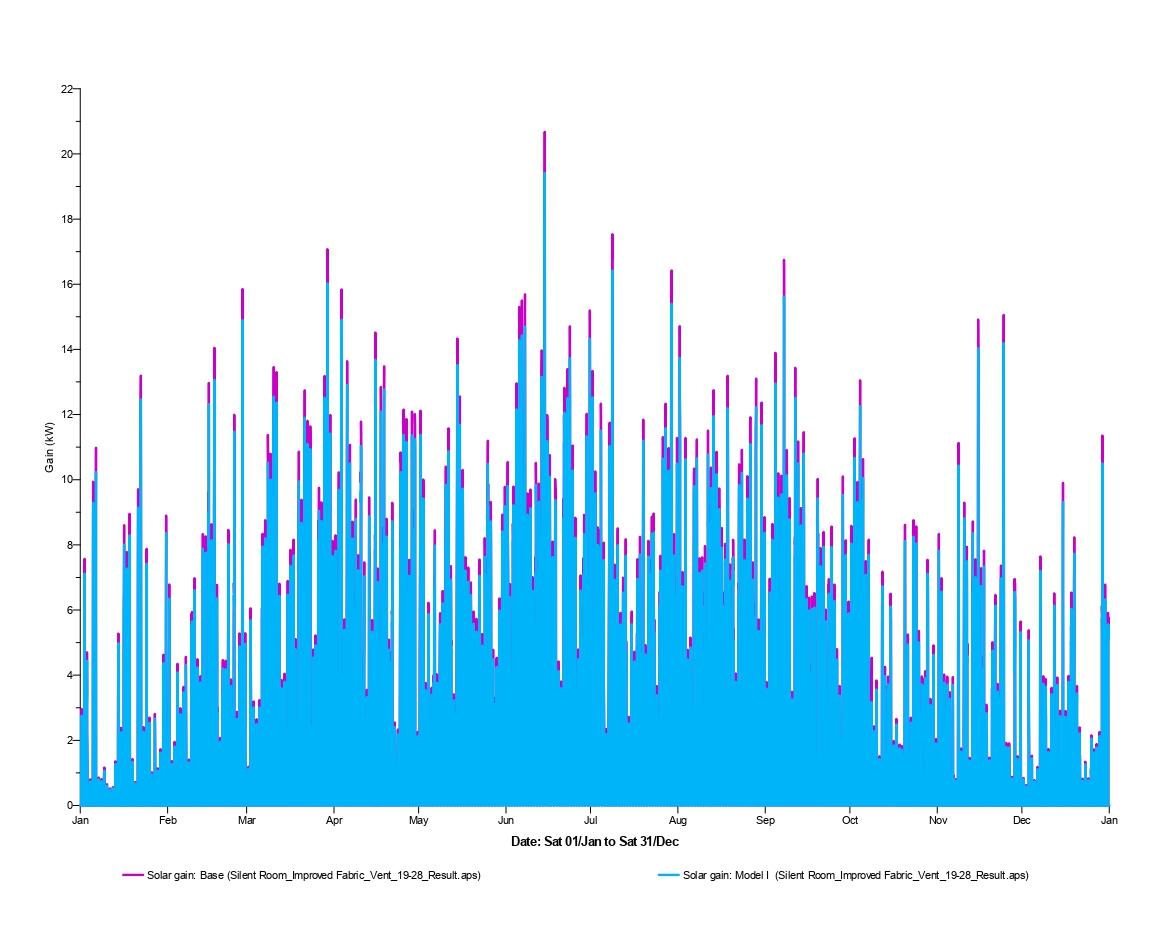 Figure 3.23 Air Temperature of the Base Model vs Model I
Figure 3.24 Solar Gain of Base Model vs Model I
Figure 3.23 Air Temperature of the Base Model vs Model I
Figure 3.24 Solar Gain of Base Model vs Model I
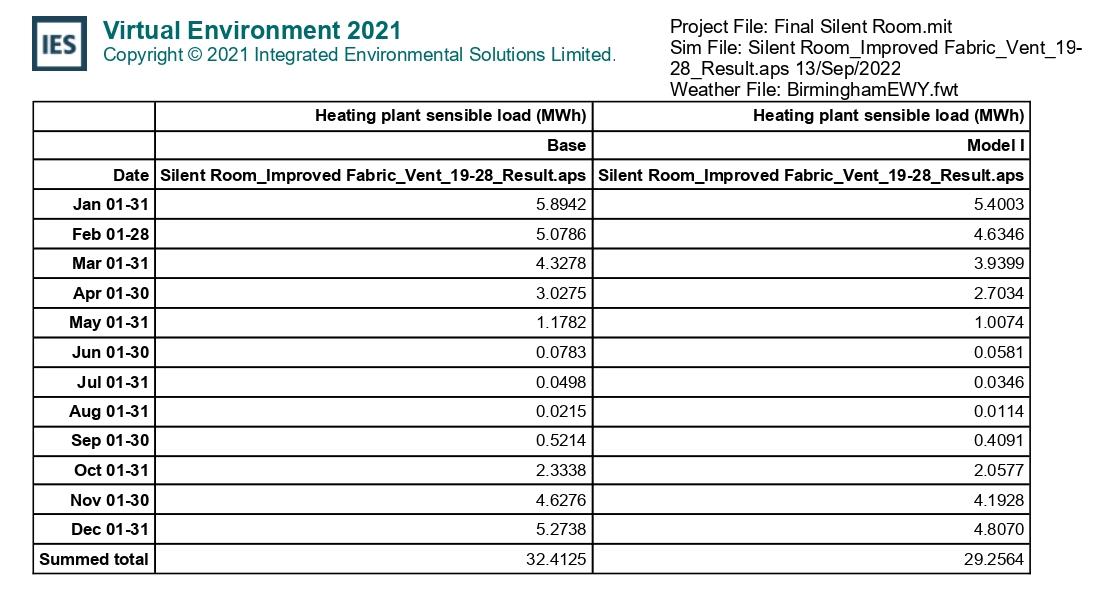
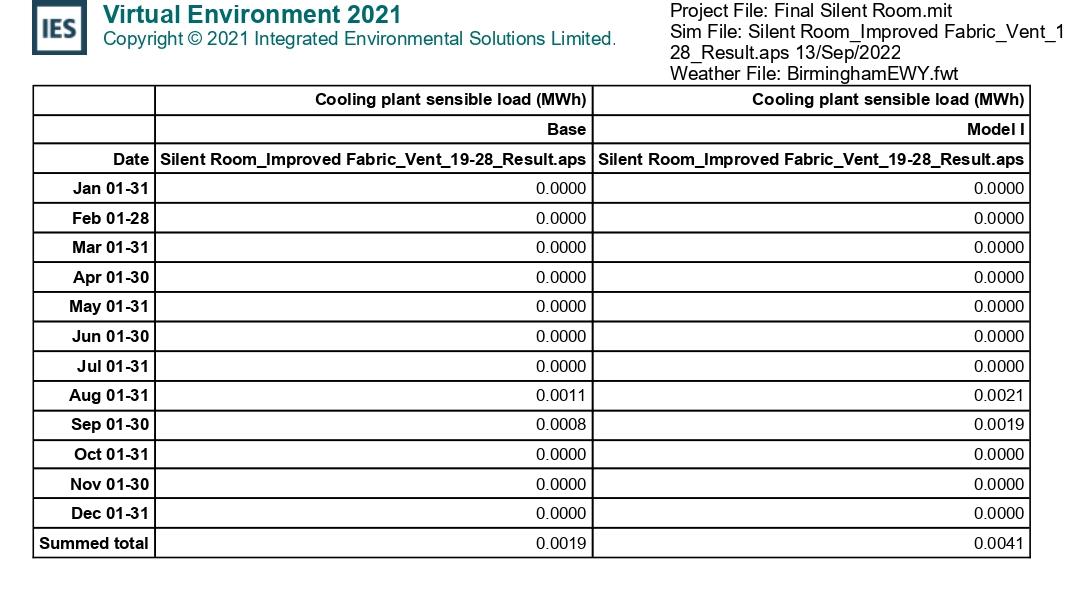 Figure 3.25 Heating Plant Sensible Load
Figure 3.26 Cooing Plant Sensible Load
Figure 3.25 Heating Plant Sensible Load
Figure 3.26 Cooing Plant Sensible Load
Based on Figure 3.23, Model I has a higher air temperature than Model II due to its increased insulation. The solar gain of the Model I, however, is lower than that of the base model. This is since triple glazing does not enhance the solar gain performance of the window, and the better insulated a product is, the lower its solar gain will be.
According to Figure 3.25, there is an approximate 10% decrease in the heating plant's sensible load in Model 1, which means that 10% of the heating plant's energy is conserved by using the improved fabric. In the other side, the Figure 3.25 shows the increase in cooling load for model I. However, the amount of energy required for cooling is relatively small and the difference is not significant. The primary concern remains the cost of heating.
From the result shown the only disadvantage of improved fabric only for the temperature during summer. It has increased the temperature of the room especially summer As shown in the graph below, the temperature of Model I during summer is too high for occupancy, which may require a significant amount of energy for cooling when the mechanical ventilation is turned off. The difference will only be apparent if the daylighting has been drastically reduced, which is not the case in this instance. Triple-glazed glass may reduce solar gain, but it will still provide sufficient daylight to the occupants. This is a better alternative than replacing it with high insulated solid walls in this case.
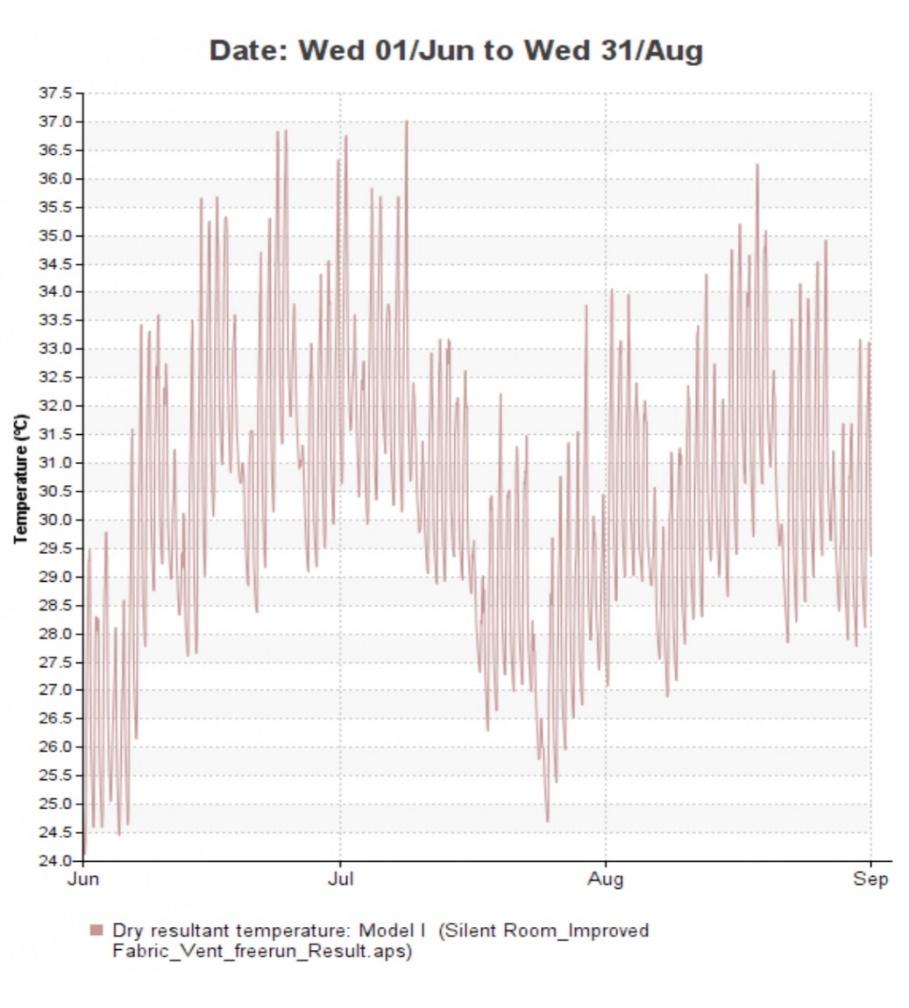 Figure 3.27 Operative temperature Model I
3.5.5 Scenarios F Shading devices of different designs
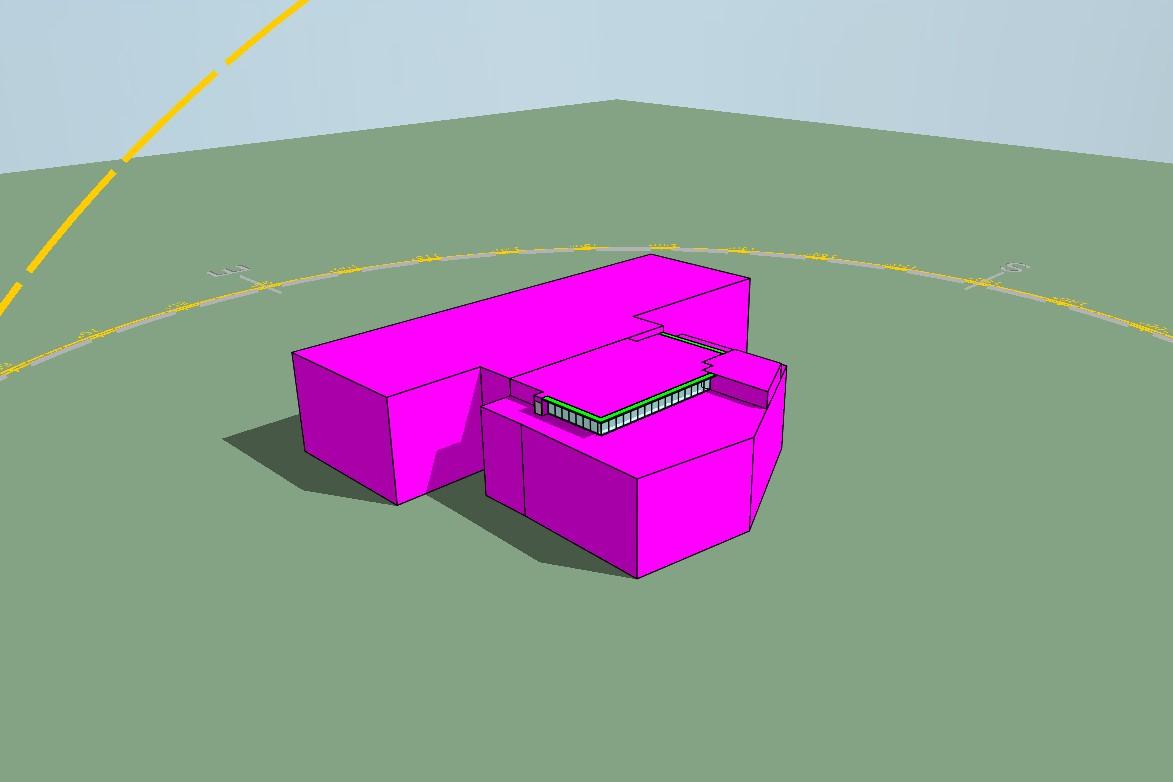
Option 1 : Horinzontal shading device
Option 2: Vertical shading device
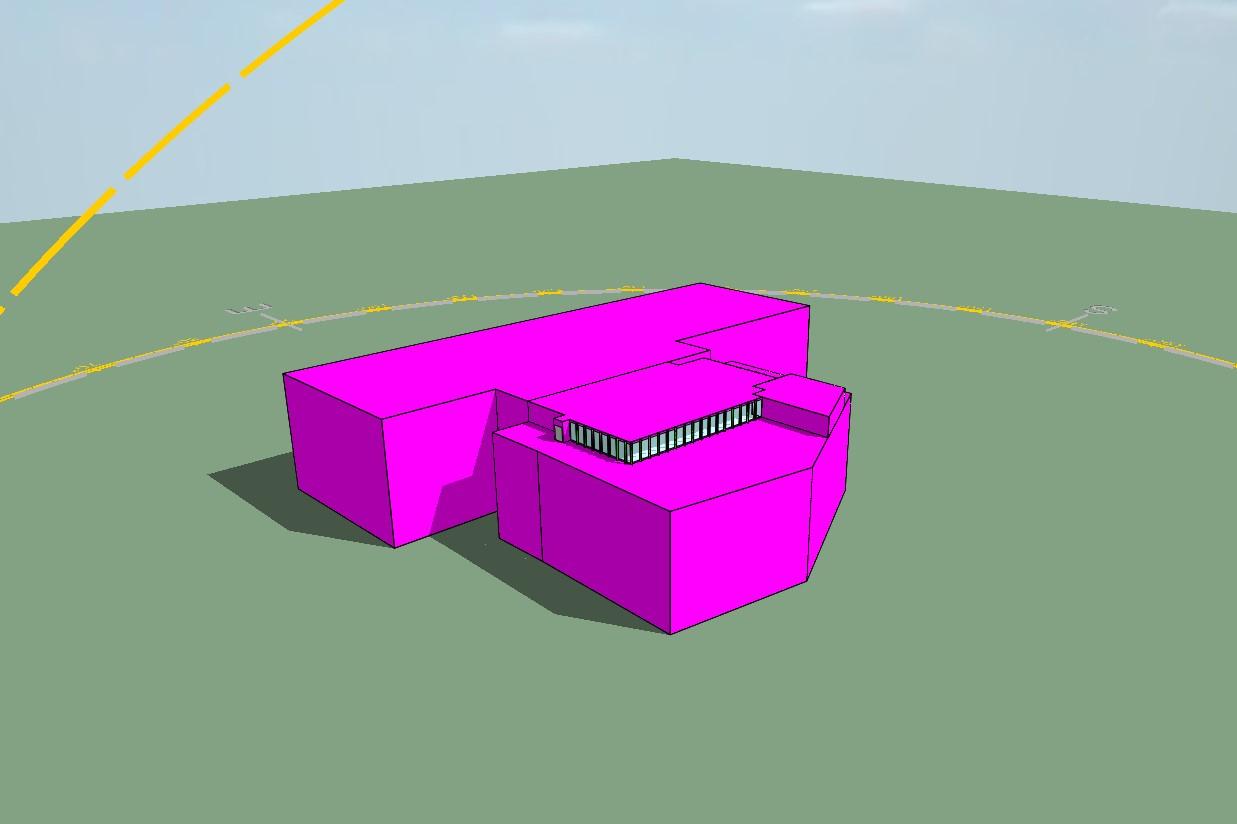 Figure 3.28
Figure 3.29
Figure 3.28
Figure 3.29
(Option1=Option A; Option 2= Option B)
According to Figure 3.30, the highest solar gain occurs when there is no solar shading. Nevertheless, there would be more solar gain in the summer while there would be less solar gain in the winter.
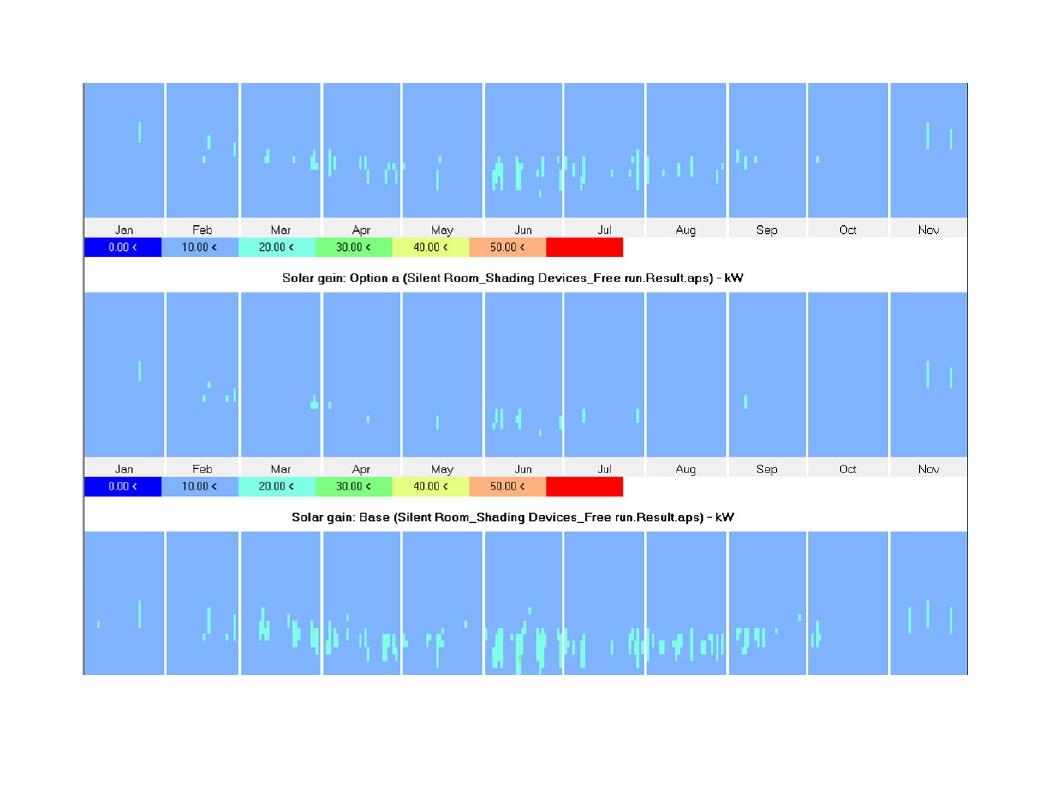 Figure 3.30 Solar gain of Base Model, Option 1 and Option 2
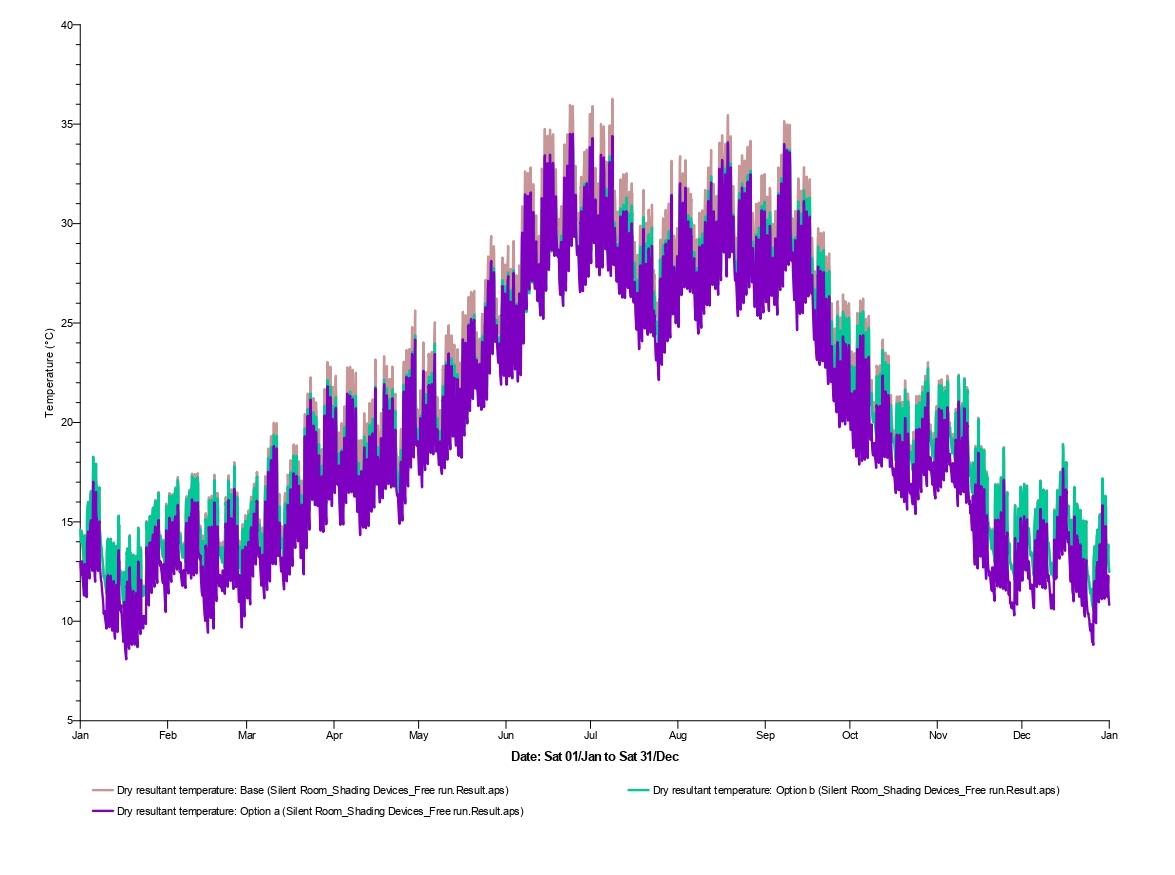
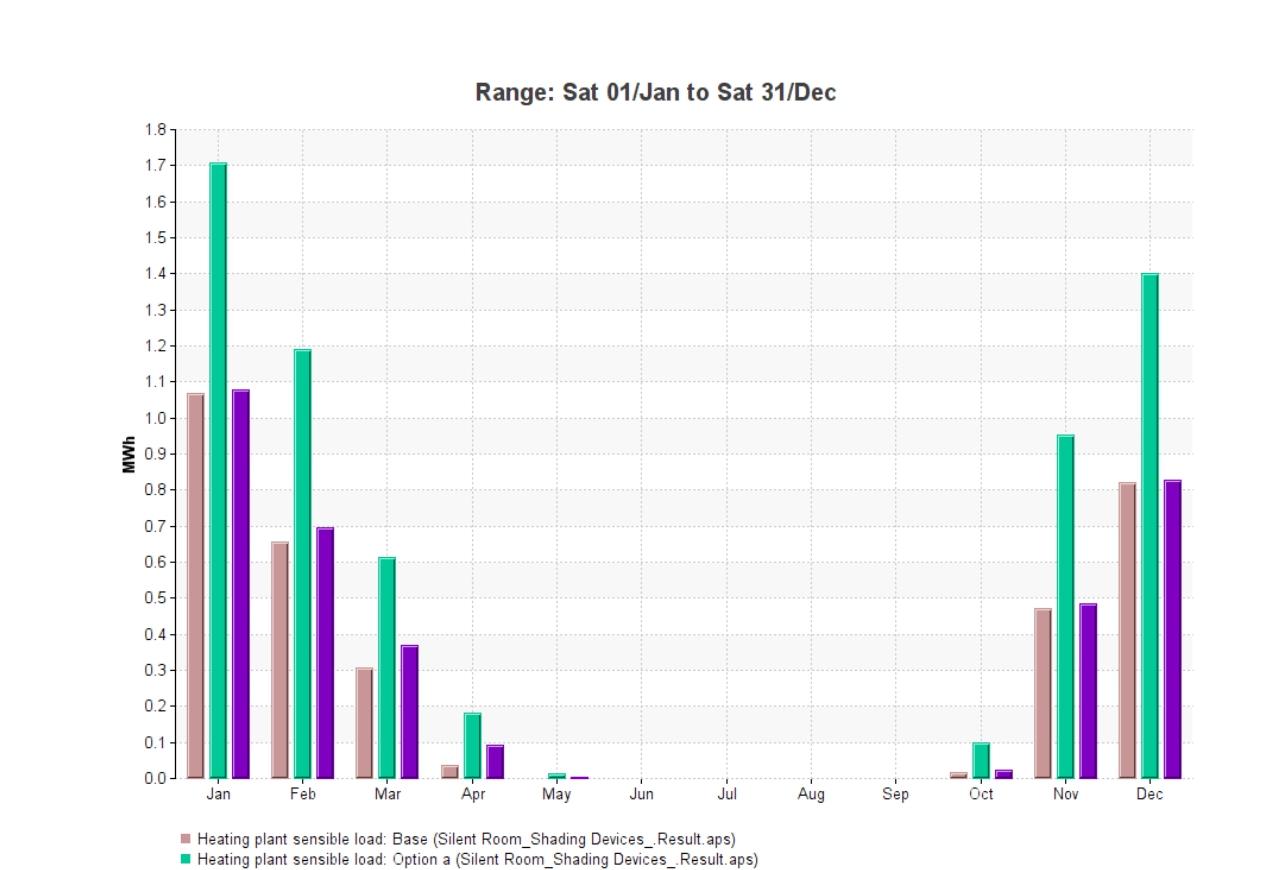 Figure 3.31 Temperature of Base Model, Option A and Option B
Figure
3.32 Heating Loads of Base Model , Option 1 and Option 2
Figure 3.31 Temperature of Base Model, Option A and Option B
Figure
3.32 Heating Loads of Base Model , Option 1 and Option 2
The Figure 3.31 illustrates that the base model has the highest temperature, while the option 1 (Model with horizontal devices) has the lowest temperature. As shown in Figure3.3, the base model has the greatest solar gain, therefore it is undoubtedly the highest temperature. In Figure 3.32, the heating loads were compared, with the base model requiring the least amount of energy, while option 1 requires the highest amount. However, during the summer months, Option 1 required the lowest cooling energy. There is no doubt that horizontal shading, like option 1 is beneficial during the summer, especially in light of the concern regarding overheating in buildings today. While a shading device is in place, it is still necessary to use cooling energy or another form of ventilation in order to lower the temperature according to the temperature shown in Figure 3.31. Option 2 has a slightly higher heating energy, but it is not too much higher, while option 3 has a much lower cooling energy. In the case of passive design, vertical shading, such as in option 2, might be an important consideration.
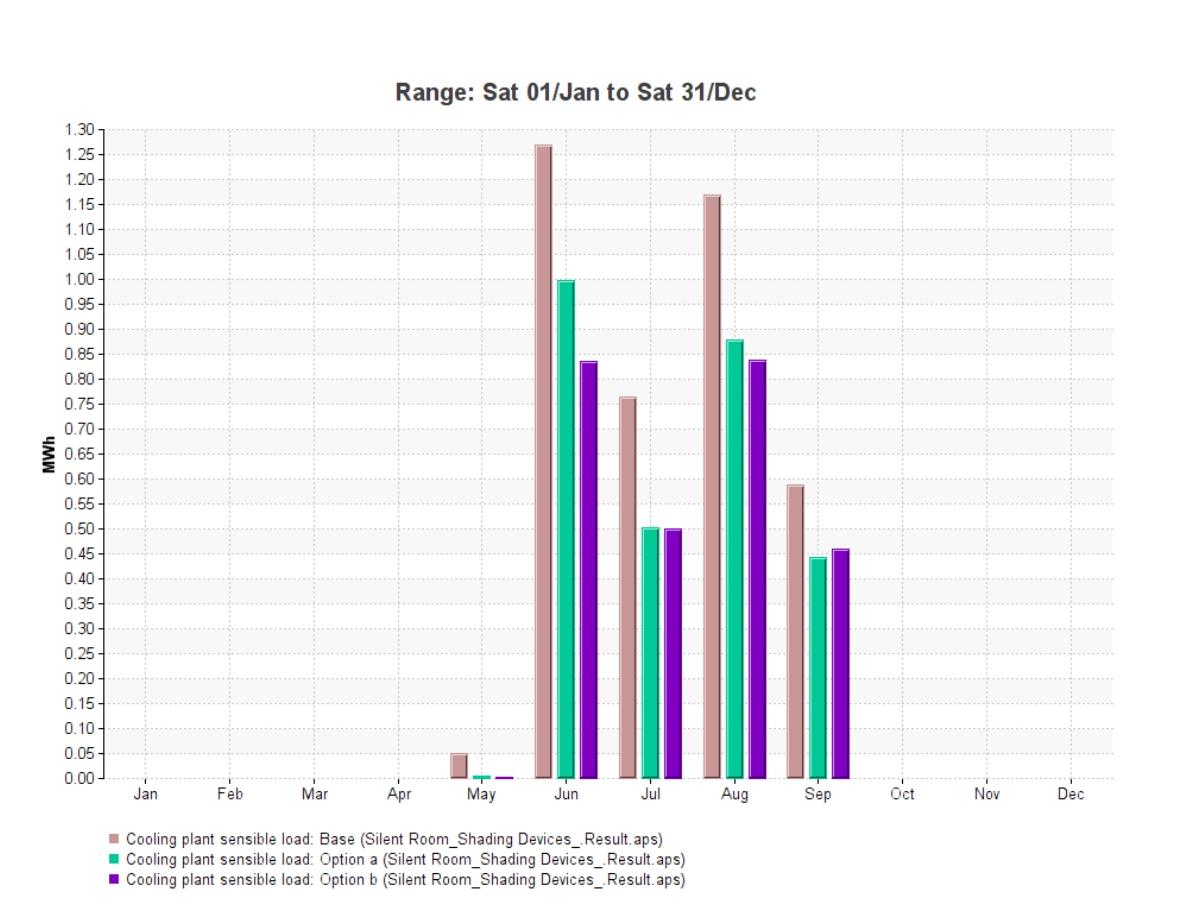 Figure 3.33 Cooling Loads of Base Model , Option 1 and Option 2
A summer day is shown in Figure 3.34, which shows the indoor temperature throughout the day on 13th of June. Despite the shading devices shown in option A and option B, it is slightly hotter than ideal between the hours of 3 p.m. and 8 p.m. However, the temperature before 3 p.m. in both option 1 and option 2 is still relatively comfortable. By 3pm, the summer could be free of energy if shaded conditions were in place.
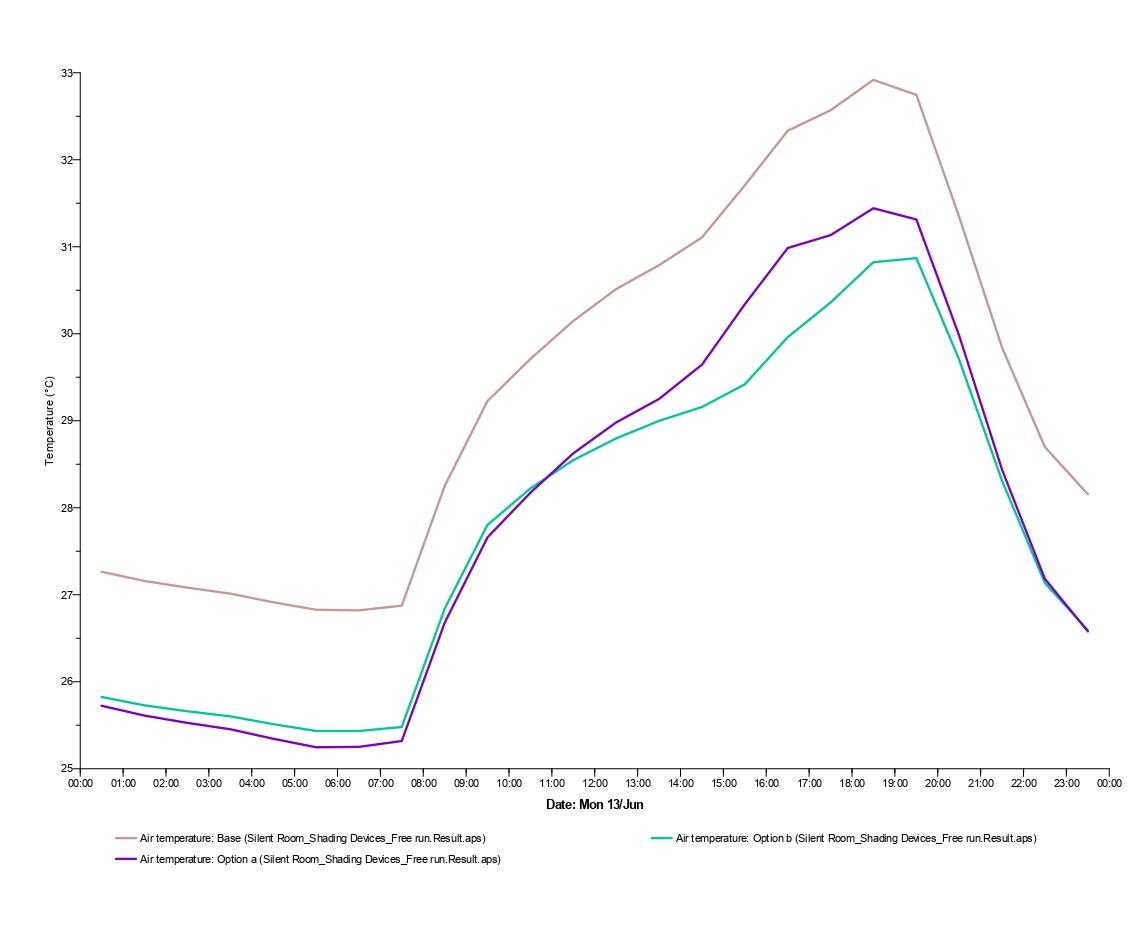 Figure 3.34 Day Temperature of Base Model, Option 1 and Option 2
4. Results Analysis and Discussion:
Based on the scenarios, it was determined that the energy bills could be reduced by improving the building's performance. The highest consumption occurs during the coolest time in winter. Section 3 has shown the comparisons of result including: operative temperature, energy consumptions, Concentration of carbon dioxide, comfort level for the scenarios together with the baseline scenario. The air quality is determined by the concentration of the carbon dioxide while the comfort level mainly based on PMV. The scenarios are presented: free run without any appliances running, fabric changes that improve U value, natural ventilation and mechanical ventilation, and shading devices. The free running has shown that the temperature in this temperature country, it is possible to off the electricity in certain period in the room. Nevertheless, there is still a concern regarding the air quality when the room is fully closed. Recent construction is often based on improved airtightness; hence the fixed glass is promoted than operable window, but may result in lower air quality. As can be seen from the free running case, there is a dangerous level of carbon dioxide in the atmosphere.
Scenario B shows the operation of mechanical ventilation has improved air quality of the room without increasing the heating energy bills. Since the mechanical energy would be much lower than heating energy, it would be ideal to use mechanical ventilation during the month with high consumption of space heating such as the October to February of the year. The mechanical ventilation of the room however might cause noise if the higher power required. Mechanical systems have a maximum driving force that is dependent only on the fan speed and is unaffected by wind effects, stack effects, or buoyancy effects. Mechanical ventilation appears to be a good option since it does not require excessive amounts of heating energy and there is also a heat recovery ventilation system in use normally. Natural ventilation prepares the best air quality for a given room, but if the natural ventilation is on continuously, the heating energy would be excessive. The data has shown a high number of the heating energy required with natural ventilation especially cross ventilation Most of the time, the wind comes from the southwest direction, contributing to the cooling effect and reducing the room's temperature. In view of the fact that the west side faces the internal part of the room, and the south side faces the incoming wind, it is recommended that the main source of cool air come into the room through the south facade in Model V1 are in the south direction, it is possible that the air will
be cooled by the wind. The base model-DO has only the two openings of the door, it has shown to be supply a good air quality to accommodate 50 individuals. However, that would be possible the door opening located in the south façade able, it is possible to allow cool air to enter the room and ventilated the room naturally. Aside, the model V2 in Scenario 3 provides a very good option as it offers significant improvements in air quality and consumes less energy when compared with model V1. It should be noted that fresh air can be distributed evenly throughout a building by providing adequate openings According to the study, model V2 has better stack ventilation and improve the air quality significantly and a higher solar gain than the other model, resulting in greater natural lighting at the centre of the room. Natural and mechanical ventilation are necessary to maintain the quality of air in the room. Because all windows are fixed, the base model does not include a hybrid system. The hybrid ventilation system is much more variable throughout the year due to the changing weather conditions.
Scenario D has the most significant impact on the reduction of energy The figure 3.2 shows that the annual heating energy consumption has been reduced by 20%, which is in line with the energy saving target when heating represents most of the energy consumption A 2-degree difference in the setting point of the temperature results in a significant difference in energy consumption. It is common for the required temperature to vary based on the needs of different users. There may be difficulties in establishing a point due to the diversity of backgrounds and countries. Adapting to the temperature may require people to wear warm clothing, drink hot water, or move around to stay warm. There are special study pods in the study room that are used to keep the occupants warm.
A scenario E is the improvement of fabric which is encouraged by the government in order to utilize fabric as the primary input into the design. Fabric improvement appears to be one of the effective strategy since it can reduce heating energy consumption by 10%. The improvements in the fabric may be able to reduce solar gain, hence can reduce the heat gain in summer Although large glazing is essential to provide natural daylighting, which reduces the amount of electricity used by classroom lighting, it is easier to lose heat during the winter than a solid wall. The triple glazing with a low U value, solar gain is reduced and the amount of heat that escapes from the room is reduced. In the case study building, the glazing play a major role, hence the triple glazing with 0.91 is used. According to the targets, it was aimed that the implementation of passive design parameters can reduce energy consumption by 20% by 2030
As a result of part L, a higher standard has been set for the construction materials, particularly the flooring. The reason for the large change in U value of the flooring is unknown. It may have to do with the economic factor, since it is easier to install or improve. Often, the roof is a major concern when it comes to improving the fabric. This may be since the largest surface as well as the floor are exposed to the outdoors. Climate will have a significant impact on this surface, and the material of the roof will always play a significant role. The more layers of the roof, the better. With the good fabric, the space heating might not be needed in the summer period due to the ventilation either mechanical or natural can easily bring the temperature to ideal state. Energy savings are primarily due to a reduction in the utilisation factor of free heat, as well as a reduction in heat losses. The high number of people which contribute to the heat gain in the room adversely contribute more carbon dioxide as well. Maybe the reduction in heat losses will be a more primary attempt
In the scenario F It appears that the shading devices reduce the room's temperature. Vertical and horizontal shading have been important in reducing temperatures in the summer. Nevertheless, the significant impact it has on the heating energy makes it a less likely choice for the design. According to results, the amount of heating demand reduction is harder to achieve while the free energy is possible in summer. Due to the most energy consumption in this building occurring during the winter, permanent shading devices may not be a feasible design option.
As a result of the analysis of these exercises, we may be able to conclude that thermal insulation and temperature setting points would significantly reduce a building's thermal performance and may assist the building in achieving its carbon reduction objective. The shading devices are the least favourable. A natural ventilation system is important for maintaining a high level of air quality, however it consumes a significant amount of heating energy. Hybrid systems are promoted as they utilize natural ventilation primarily during the summer months and mechanical ventilation during the winter months. As a result of the base case, thermal comfort was only achieved for a few weeks during the summer and fall seasons. All of the strategies mentioned above have been incorporated into the base case model, explaining why the shift has taken place. The influence of one strategy alone on thermal comfort was not significant except for the effects of a thermal insulation. Passive design involves utilizing all main building components that resist or block solar heat gain in order to maintain the building's temperature during the hot summer months. As a result, passive
design should be designed in accordance with the local climate. A passive building is often the basis for an energy-efficient, cost-effective construction project, however it is not the case for this building. Through the analysis of the simulation results, it was demonstrated that passive strategies were capable of reducing energy consumption and providing optimal thermal comfort.
5. Conclusion
In order to optimize the performance of a building, the optimum measures must be examined in terms of their potential for energy conservation as well as their thermal comfort in order to enhance the building's long-term efficiency. With the understanding of guidelines such as Part L, and references, this research will help them refine their energy decarbonization strategies and improve the energy efficiency of their property portfolios to reduce fuel poverty, improve occupancy comfort, and contribute to UK net zero goals by 2050. Based on the results of this study, other areas in the design proposal can be improved in terms of energy efficiency and thermal comfort. As a result of adopting the passive strategy for existing buildings on campus, the impact of increased heating demand may be less significant than in the case study presented in this study. By identifying the most effective passive parameters, it is possible to create a more efficient thermal environment in indoor spaces. Energy consumption and thermal comfort can be improved by implementing passive and active designs. To measure energy savings and, therefore, money savings, it is necessary to consider the initial costs associated with the proposed methods. Due to this parameter variation, it is not possible to make a general conclusion about the entire learning hub. A greater number of cases should be targeted in future studies to obtain a more accurate representation of the conditions.
There is no doubt that study space is an important space that should be utilized most of the time by students. Since it is a communal study area, everyone is able to concentrate on their studies. It is very important to ensure the quality of learning by providing a decent learning environment with sufficient daylight and thermal comfort to ensure the health of the student. Studies of energy reduction strategies utilizing various methods should be conducted along with an examination of indoor air quality and thermal comfort. Building simulation tools would be able to meet this criteria. In order to address the research question presented in the introduction, we will use the results and discussion presented
in Section 2 and 3 and the literature review. A major objective of this study was to determine in detail how to reduce energy consumption through improving building performance. It has been found that a fabric first approach is the most effective method. Some cases have the potential to provide optimal thermal comfort and reduce energy consumption because of the study.
A comprehensive assessment of three passive parameters was conducted using IESve assessment software, namely shading devices, natural ventilation, and thermal insulation. Software is available for assessing the energy consumption, air quality and comfort level. There are more features that allow more answers to other questions. There may be an opportunity to reduce the electricity load by examining the effect of the mixed strategies of passive design on the thermal performance and energy consumption of a building. A number of variables have been taken into consideration, including the temperature setting, the construction materials, the occupancy rate, the heat gain, the type of opening, ventilation, and solar gain. This software simulation identifies possible outcomes to achieve a conducive study environment and minimize energy consumption through the best performance of the building. Typically, fabric is the primary material used in this building. Several factors contribute to thermal comfort, and thermal comfort would be considered regardless of the building's energy efficiency. In order to achieve multiple benefits, the most favourable situation must be determined. It is vital to meet the objective of energy efficiency in the present climate.
6. Recommendation
To reduce energy consumption, passive and active design should work together. Passive strategies may be effective during certain seasons but not during others. There needs to be a combination of strategies based on different periods of time and the behaviour of the occupants. A deep study of how the occupancy rate is controlled, and how the operation hours are controlled, is required. While using passive design means utilizing free, renewable energy sources such as the sun and wind to provide cooling, ventilation, and lighting for the building. The more the building faces the sun, the more sunlight can enter the building. More sunlight should be entering the building. Therefore, skylights are considered a good strategy. It is crucial to select the right glazing for windows and skylights. In general, the lower the U value, the better the insulation. As well as reducing solar gain in the summer, it also reduces the amount of heat that is absorbed into the building. When heat gains are being avoided, the percentage of glass facing south is the proper size for shading the glass. So, it needs to be careful the amount of heat loss would occur in this strategy. Space heating is the most common form of energy consumption in the United Kingdom, and an airtight envelope is necessary to achieve a warmer room. Airtightness and adequate ventilation are essential for the comfort of the occupant. As a result of the operating based on the requirement of thermal comfort, heat and cooling load demands within the building were minimized and potential energy savings could be achieved. Operational strategy was determined to maximize the use of natural ventilation in summer, considering the impact on the microclimate of the central buffer zone, as well as other parts of the building
In cold climates, mixed-mode ventilation units are recommended when adopting passive measures. It would also be beneficial to conduct a study to examine the impact of climatic conditions on the selection of energy-efficient strategies for buildings. A controlled ventilation system with heat recovery is an ideal solution for schools. Controlled ventilation systems provide sufficient outdoor air while heat recovery systems prevent the supply air from becoming excessively cold. However, the efficient heat recovery would lead to an increase in cooling demand in rooms with a high occupancy rate.
Passive design requires the use of insulation throughout the building envelope in order to reduce heat loss or gain. Insulation prevents heat loss in the winter and reduces heat gain in the summer by acting as a barrier to heat flow. Inadequate insulation and air leakage would be the main causes of heat loss in
buildings. To achieve this, it is necessary to use insulation in the walls, ceilings, and floors of the building. It may be appropriate and cost-effective to provide a significantly greater level of thermal protection, particularly on the roof. Green roofing has demonstrated its potential for providing effective roof insulation. Thermal bridges should be as thermally insulated as possible. It is possible to reduce the amount of heat in a room by reducing the number of openings. Passive design strategies include reducing overall heat transmittance.
It has been reported that actual energy consumption in buildings may be two to five times greater than predicted over the past two decades. When there is a performance gap between what was expected and what occurred, it is called a performance gap. There may be a variety of factors contributing to discrepancies, including intentionally unanticipated changes (resulting from value engineering and change orders), variations in material properties and dimensions, physical coefficients, occupant behaviour, control settings, weather conditions, and degradation of system performance. Finally, errors during construction would be a major concern. It is therefore necessary to consider the technical aspects of construction in the simulation in order to avoid the massive discrepancies.
Adaptive behaviour has been mentioned and is probably one of the best efforts. The temperature set point should be flexible. BMS could be set up based on the schedule and occupancy rate. The lower the temperature for heating, the more energy is saved. In addition, the air monitoring tool can be implemented in conjunction with the control of the opening of a door or window to allow ventilation. As a result of monitoring CO2, the ventilation rate can be tailored to the occupancy level in each room in order to ensure that the proper number of air exchanges is achieved. It is controlled by a CO2 monitor so that classroom levels remain below 1500 parts per million. Air quality can be monitored in real time with carbon dioxide sensors and ventilation can be controlled on a demand basis. In order to analyse the collected data, an analysis program can be used, which produce output files and profiles for the use of BMS control. It is believed that through the use of a Building Management System, sustainability can be monitored, targeted, and assessed from a central location.
Due to the limited time, only one study space is used for various scenarios. It may differ depending on the location and circumstances of the room. This simulation tool provides a good way to gather potential energy consumption data and other information. An analysis can be conducted on each zone, and a
yearly average profile and four seasonally average profiles can be produced for integration into the building simulation system.
In order to facilitate the implementation of strategies on campus, various passive strategies should be assessed for ease of implementation and familiarity among campus users for a period of time. Different technologies can be explored with a variety of technical approaches in conjunction with the examination of simulations. In addition to improving their sustainable design, compliance with regulations, and other aspects, designers can use new simulation modules in conjunction with a framework.
7. Future Works
Future analysis will be used to determine a) whether seasonal trends exist between the schools, b) how energy consumption varies between each month, c) how peak energy consumption varies throughout the year (highlighting school holidays) and d) whether the schools are used during the weekends, and whether energy is wasted. In addition, the analysis will be extended to the different categories of students. As well as normalizing by the total floor area and by the number of pupils (although normalizing by the number of pupils may not be of any additional benefit), the data will need to be corrected for a more recent weather profile. In order to determine where and when energy is being consumed in schools, a study of user behaviour or interaction will be carried out in order to determine where and when energy is being consumed. The number of occupancies in this room can only be obtained at this time by obtaining basic information about the occupancy in the room. The accuracy of the measurement, recording, and normalization of pupil behaviour for each of the schools studied is unknown at the moment in this study. Based on the work discussed in this paper, key outputs, trends, and conclusions are being established as the data analysis stage nears completion. Several key stages of the methodology, as well as data collection and normalization, have been used in a haka-designed analysis program to analyze the results of an initial analysis of one category of schools and one average profile. It was also discussed in this paper how assumptions may lead to different outcomes as well as the concept of "generic" profiles. In order to gain a better understanding of non-domestic energy consumption, it will be possible to utilize the data base for further research and analysis For generic profiles to be used effectively, one must recognize their limitations in order to make the most of them. A generic profile can be generated by taking into account key information such as peak demand, school type, opening hours, after-school use, standby load, and construction materials. A different approach would be to average the school profile data for each category of school and produce a single profile. The challenge, however, arises from atypical profiles, such as those for schools. People's behaviour and their use of study spaces may also be affected by the post-pandemic period. As more students return to the campus, it is expected that future movements will be affected once the campus is fully occupied.
There is potential for further exploration of the satisfaction of students and the concept of this room. There may be some incorrect assumptions made
regarding the employee's ability to adapt and expectations if students are not closely surveyed within a year with different seasons. It would be beneficial to investigate further the possibility of adjusting working hours according to the season.
Apart from the fact that the electric metering is not specific to the room, it is not possible to determine an accurate energy consumption currently. As it is unknown what the intensity of the energy usage is, it is difficult to determine how it can be improved to reach the target. The energy meter data has to be more specific to different zone in order to get a data to understand how far we are from the target. However, it also can be presume through a higher target to be achieved.
Aside from the main topic of our energy performance, embodied carbon and life cycle analysis can be tested since they are relevant, and the purpose of energy performance is to reduce carbon emissions. It might not be worth to implement the measure if more carbon was to be used in the installation process. In order to take into account embodied carbon in addition to the operation energy used during operation, analysis can be done in the IESVE software with the material data available.
8. Appendices
1. RIBA 2030 Climate Challenge Target
2. Energy Usage and EUI
3. Survey from 16 students from University of Northampton
Report
4. Energy
5. Model Report
9. Glossary
Air Change Rates The rate at which air is exchanged is an important property for the purposes of ventilation design and heat loss calculations and is expressed in ‘air changes per hour’ (ach).
Baseline: The state against which changes are measured. In the context of climate change transformation pathways, the term ‘baseline scenarios’ refers to scenarios based on the assumption that mitigation policies or measures will not be implemented in excess of those already in force and/or legislated or planned to be implemented.
Cooling Plant Sensible Load Cooling energy of the room
Free Running building is not heated or cooled actively and may have either natural or mechanical ventilation
Heating Plant Sensible Load It equivalent to the heating energy
Mechanical ventilation involves the supply of fresh air and/or the removal of stale air by means of a fan.
Mixed mode and hybrid ventilation involve the use of natural ventilation and/or cooling systems in conjunction with mechanical ventilation and/or cooling systems
Natural ventilation occurs when fresh air is supplied and stale air is removed by buoyancy or wind.
Operative temperature refers to the mean radiant temperature of the surfaces in the room and the air temperature in the room.
PPD is the percentage of people who are dissatisfied, which is used in comfort criteria.
PMV stands for Predicted Mean Vote and is also used in comfort criteria.
Overheating refers to excessive or prolonged high temperatures, caused by internal or external heat gain, which may negatively affect comfort, health, or learning.
PPM - or parts per million, measures the ratio of one gas to another.
Notional building ‘A hypothetical building of the same size, shape, orientation and shading as the actual building, with the same activities, zoning and system types and exposed to the same weather data, but with pre-defined specified properties for the building fabric, fittings and services. The notional building is concurrent with the national building regulations for Wales 2014, Northern Ireland 2012 and England 2013
10. Bibliography
Jankovic, Ljubomir. Designing Zero Carbon Buildings Using Dynamic Simulation Methods.New York, Routledge, 2017
As Built Testing , Part L Update 2022, www.asbuilttesting.co.uk
Kilpatrick, Richard, and Phillip Banfill. Energy Consumption in Non-Domestic Buildings: A Review of Schools. May 2011.
Lee, Wen-Shing. “Benchmarking the Energy Performance for Cooling Purposes in Buildings Using a Novel Index-Total Performance of Energy for Cooling Purposes.” Energy, vol. 35, no. 1, Jan. 2010, pp. 50–54, 10.1016/j.energy.2009.08.026
Pan, Yiqun, et al. “Whole Building Energy Simulation and Energy Saving Potential Analysis of a Large Public Building.” Journal of Building Performance Simulation, vol. 4, no. 1, Mar. 2011, pp. 37–47, 10.1080/19401491003721301.
Cousins, Stephen. “Building Regs What’s Changed: Part L, F and Introducing Part 0 on Ventilation.” Www.ribaj.com, www.ribaj.com/intelligence/changes-to-part-l-part-f-part-ofuture-buildings-standard.
University of Northampton, Waterside Camus, Learning Hub, Architecture MCW architects. “MCW Architects.” MCW Architects, 2014, mcwarchitects.com/university-ofnorthampton-learning-hub
Zhou, Dongmei, and Sung Hong Park. “Simulation-Assisted Management and Control over Building Energy Efficiency – a Case Study.” Energy Procedia, vol. 14, 2012, pp. 592–600, 10.1016/j.egypro.2011.12.980.
UON. “Sustainable Development Goals.” University of Northampton, www.northampton.ac.uk/about-us/governance-andmanagement/management/sustainability/sustainable-development-goals
Lewry, Andy, et al. Bridging the Performance Gap : Understanding Predicted and Actual Energy Use of Buildings. Garston, Watford, Ihs Bre Press, 2015.
EUROSTAT. “Sustainable Development Goals (SDGs) and Me - 2020 Edition.” Sustainable Development Goals (SDGs) and Me
Energy estimating and modeling methods,” ASHRAE Handbook - Fundamentals, vol. Chapter 32, 2005.
“Northampton.” Wikipedia, 13 Mar. 2022, en.wikipedia.org/wiki/Northampton.
“Average Weather in Northampton, United Kingdom, Year Round - Weather Spark.” Weatherspark.com, 2020, weatherspark.com
“Air Change Rates in Typical Rooms and Buildings.” Engineeringtoolbox.com, 2020
TM57, Integrated School Design, 2015, ISBN 978 1 906846 5 34, Guidance on how to approach the environmental design of educational buildings.
AM10, Natural ventilation in non-domestic buildings, 2005, ISBN 9781903287569
KS17, Indoor Air Quality and Ventilation (CIBSE Knowledge Series 17), 2011, ISBN 978 1 906846 19 0.
ANSI/ASHRAE Standard 55 - 2013 Thermal Environmental Conditions for Human Occupancy.
ANSI/ASHRAE Standard 62.1 – 2013 Ventilation for Acceptable Indoor Air Quality
Education and Skills Funding Agency. Guidelines on Ventilation, Thermal Comfort and Indoor Air Quality in Schools. 11 Mar. 2014, pp. 13–18.
“UKNZC | UK Net Zero Carbon Buildings Standard.”, May 2022. www.nzcbuildings.co.uk/.
“Indoor Comfort and Temperature Set-Points.” CitySwitch, cityswitch.net.au/ResourcesArchive/CitySwitch-Resources/Heating-andcooling/Heatingand-cooling-article/indoor-comfort-and-temperature-set-points.
Nicol, J.F., and M.A. Humphreys. “Adaptive Thermal Comfort and Sustainable Thermal Standards for Buildings.” Energy and Buildings, vol. 34, no. 6, July 2002, pp. 563–572, 10.1016/s0378-7788(02)00006-3.
Rijal, Hom B, et al. “Study on Behavioural Adaptation for the Thermal Comfort and Energy Saving in Japanese Offices.” Journal of the Institute of Engineering, vol. 15, no. 3, 16 Oct. 2020, pp. 292–299
Ingy El-Darwis. “Elsevier Enhanced Reader.” Reader.elsevier.com, May 2015
Syed, Ashraf T., and Adel A. Abdou. “A MODEL of a NEAR-ZERO ENERGY HOME (Nzeh) USING PASSIVE DESIGN STRATEGIES and PV TECHNOLOGY in HOT CLIMATES.” Journal of Green Building, vol. 11, no. 1, Mar. 2016, pp. 38–70, 10.3992/jgb.11.1.38.1.
Crawley, Jenny, et al. “The Relationship between Airtightness and Ventilation in New UK Dwellings.” Building Services Engineering Research and Technology, vol. 40, no. 3, 22 Dec. 2018, pp. 274–289.
11. References
Jankovic, Ljubomir. Designing Zero Carbon Buildings Using Dynamic Simulation Methods. New York, Routledge, 2017.
United Nations. “Net Zero Coalition.” United Nations, 2021, www.un.org/en/climatechange/net-zero-coalition.
Agg, Chloe, and Samana Khimji. “Perception of Wellbeing in Educational Spaces.” Building Services Engineering Research and Technology, 23 Apr. 2021, p. 014362442110098, Gov, HM. Implementing the Climate Change Act 2008: The Government’s Proposal for Setting the Fourth Carbon Budget Policy Statement. 2011.
UKGBC. “Climate Change.” UKGBC - UK Green Building Council, 2021, www.ukgbc.org/climate-change-2
HMGov, “Energy White Paper: Powering Our Net Zero Future.” GOV.UK, 2020, www.gov.uk/government/publications/energy-white-paper-powering-our-net-zero-future
HM Government. “Net Zero Strategy: Build Back Greener.” Oct. 2021.
HM, GOV. “Guidelines on Ventilation, Thermal Comfort, and Indoor Air Quality in Schools.” Building Bulletin 101, 2018.
HM Government .“Approved Document L2B: Conservation of Fuel and Power in Existing Buildings Other than Dwellings - Part L - Conservation of Fuel and Power - Planning Portal.” Planningportal.co.uk, 2013, www.planningportal.co.uk/applications/building-controlapplications
Marches Energy Agency. Evaluating the Impacts of Energy Efficiency Improvements on Health and Wellbeing
Kah, Oliver. Handbook for Energy-Efficient Educational-Use Buildings. Passive House Institute, July 2010.
“IES Virtual Environment,” CIBSE Heat Loss & Heat Gain (ApacheCalc), no. 6.4.
“IES <Virtual Environment>,” Tutorial Apache Sim, vol. Version 6.0.
RIBA. “RIBA 2030 Climate Challenge.” RIBA, 2021, www.architecture.com/about/policy/climate-action.
“HSE – Temperature- Minimum workplace temperature.” Www.hse.gov.uk, www.hse.gov.uk/temperature/law.htm.
