
Adopted December 2023

Adopted December 2023
City of Moreno Valley City Council
Ulises Cabrera, Mayor
Elena Baca-Santa Cruz, Councilmember, District 1
Edward Delgado, Mayor Pro Tem, District 2
David Marquez, Councilmember, District 3
Cheylynda Barnard, Councilmember, District 4
City of Moreno Valley Parks, Community Services and Trails Committee
Rylee Peak , Chairperson
Omar Gonzalez, Jr., Vice Chairperson
Alejandra Herrera
Dora Capolino
Francisco Lopez
James Baker
City of Moreno Valley Parks and Community Services Department
Jeremy Bubnick, Parks & Community Services Director
Patty Yhuit, Division Manager - Administration and Financial Services
Dan Monto, Division Manager - Parks and Landscape Services
Claudia Torres, Division Manager - Special Events and Facilities
Nikki Hendricks, Division Manager - Community Services
KTUA
Joe Punsalan, Principal
Jacob Leon, Project Manager, Senior Associate
Nicole Rogge, Assistant Project Manager, Senior Planner
Kolbe Stets, GIS Analyst
Marina Varano, Senior Planner
Mariella Delfino, Planner and Designer
Isabel Perez, Planner
Matrix
Alan Pennington, Principal Analyst
Chas Jordan, Senior Analyst
Khushboo Ingle, Senior Manager
RRC
Kailyn Haskovec, Associate


Figure
Figure
Figure
Figure
Figure
Figure 3-1: Please rate how important the following recreation facilities and services are to your household. (On a scale of 1 to 5, with 5 being “Very Important”) 82
Figure 3-2: Please identify your household’s priorities for recreation facilities, parks, programs, and special events to be added, expanded, or improved upon in Moreno Valley in the next 5 years. (On a scale of 1 to 5, with 5 being
Figure 3-3: What are the top priorities for improvement within our trail system? (Select Top 3)
Figure 3-4: What are the most important items that, if addressed by the City of Moreno Valley, would increase your use of
Figure 3-5: What will increase your household’s use of
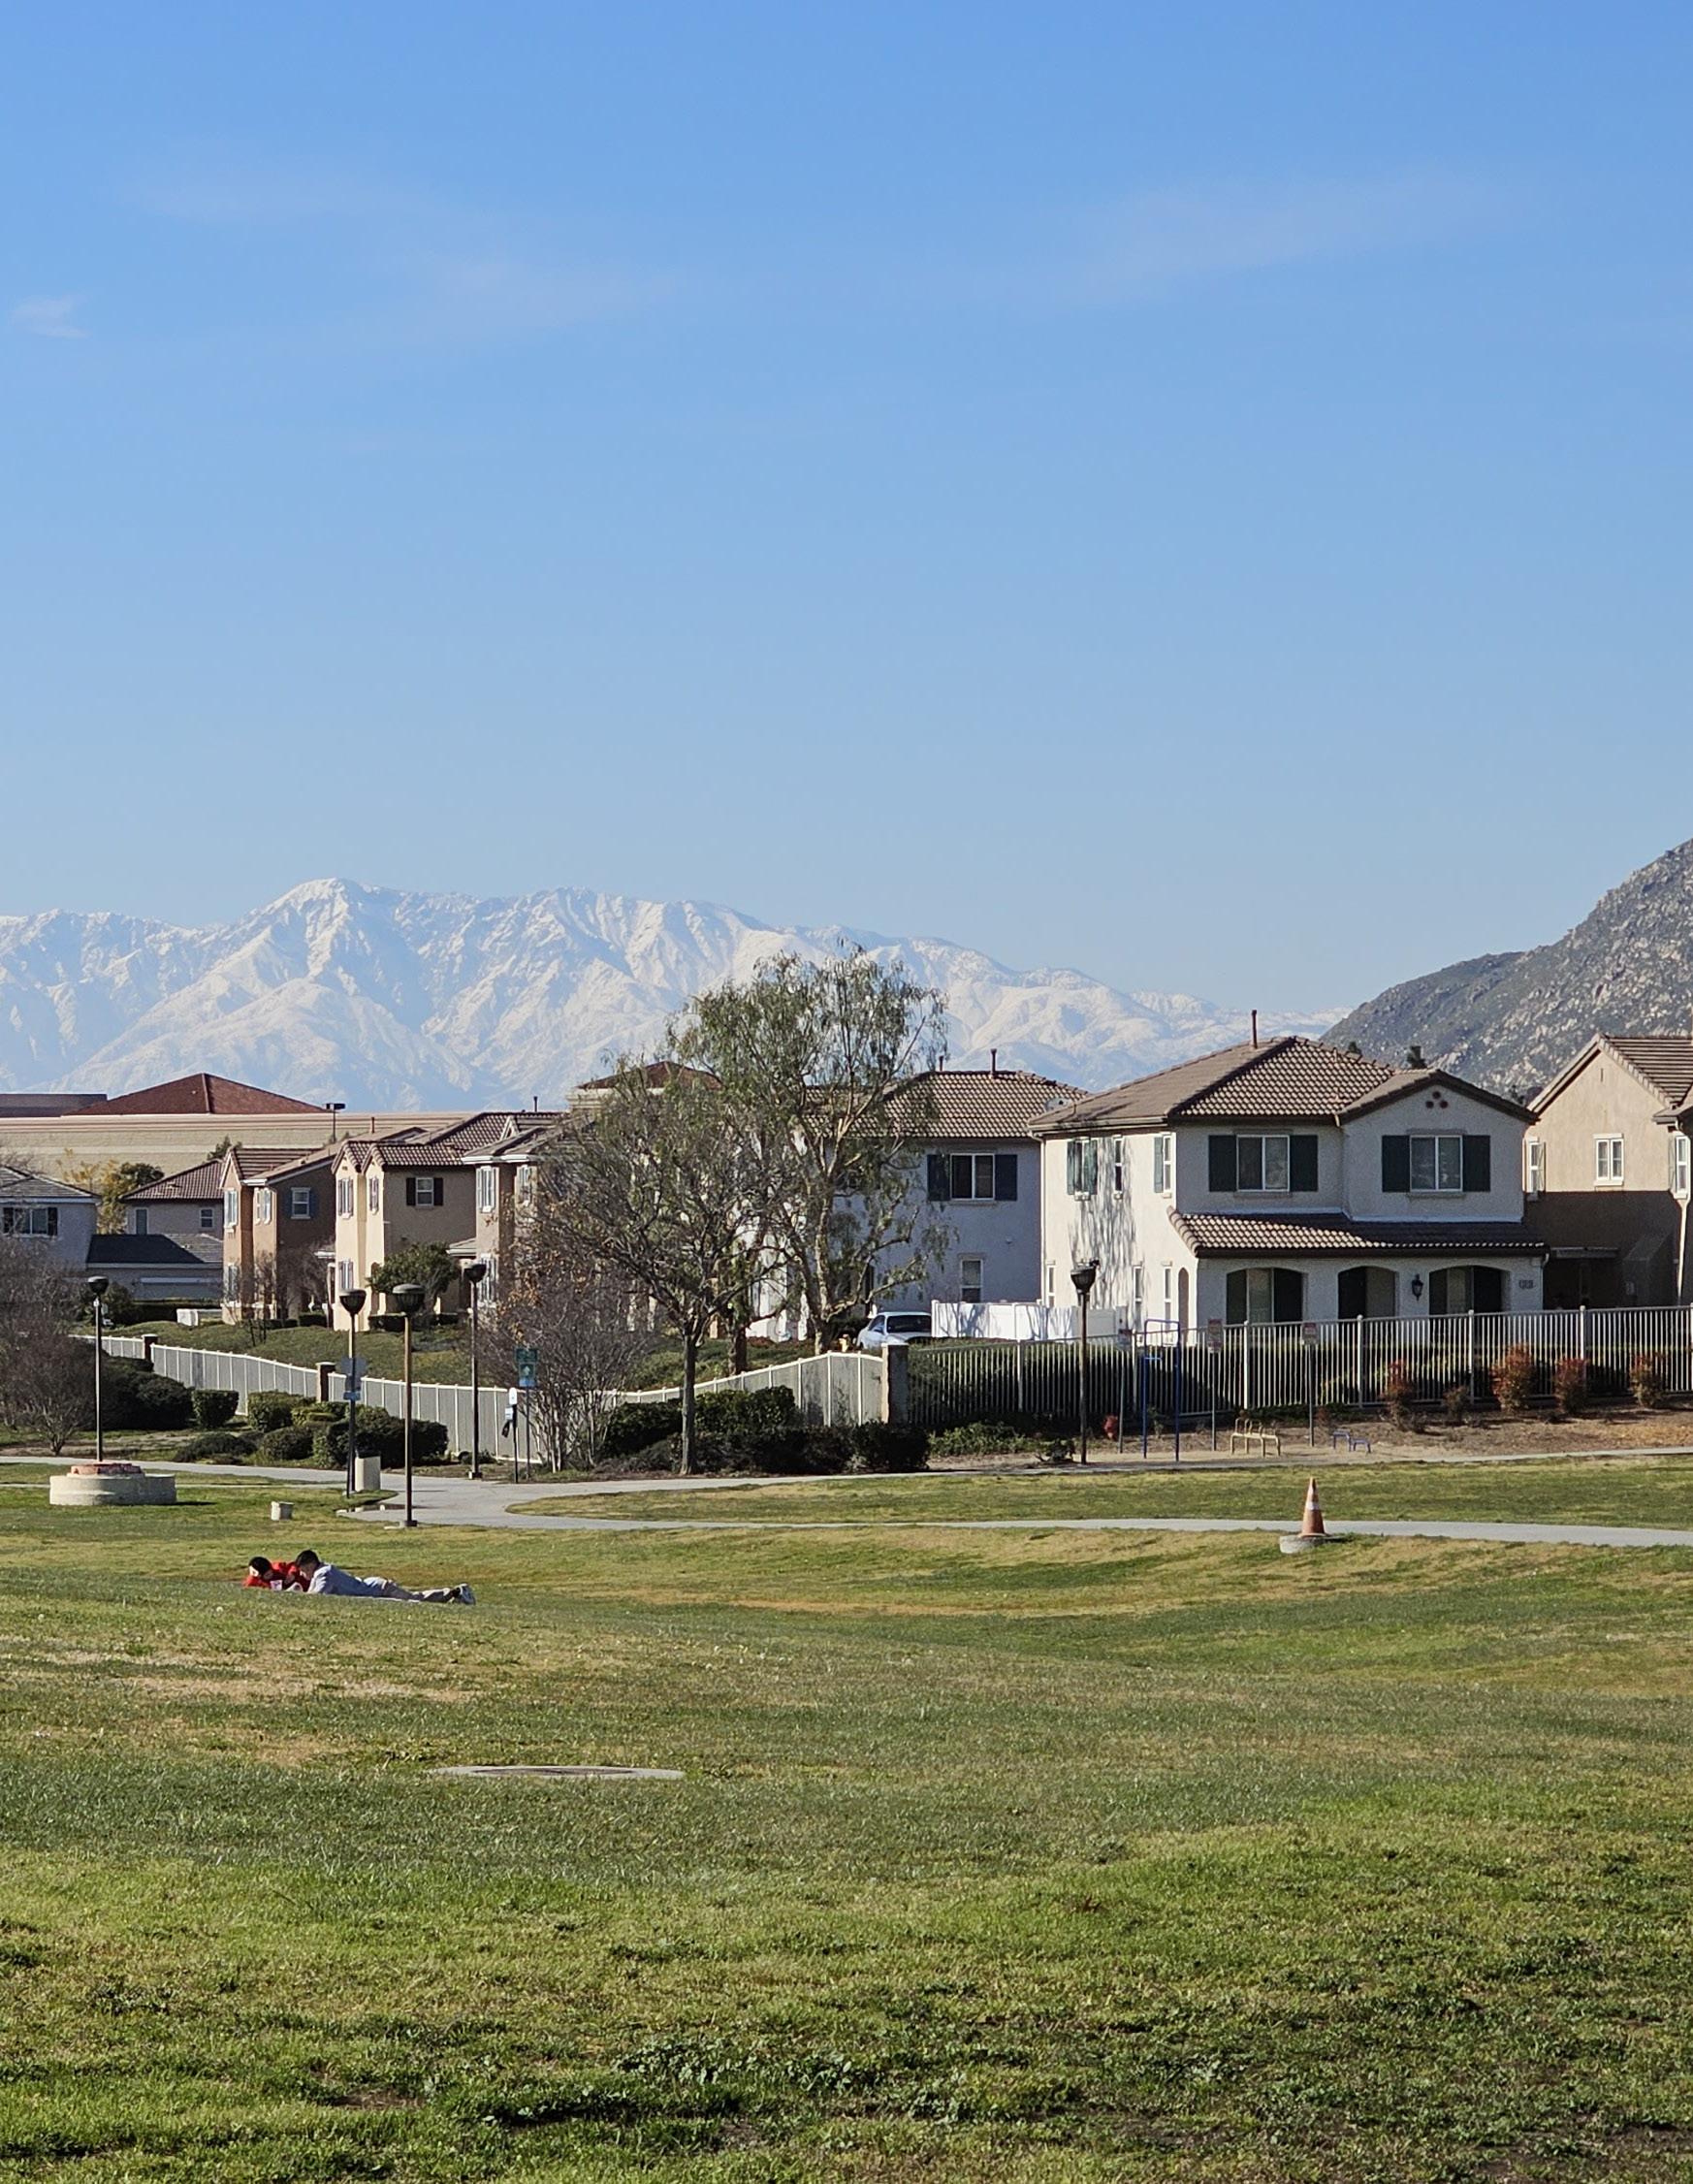
The Moreno Valley Parks, Community Services, and Trails Master Plan (Plan) is designed to guide the future of parks, community services, and trails in Moreno Valley. This Plan was developed over a year-long planning process consisting of surveys, community workshops, stakeholder meetings, park visits, and an analysis of the usage of parks, community services, and trails in Moreno Valley. An in-depth assessment of the current state of parks, open space, and community services was conducted to determine opportunities for improvement, expansion, and new development. Extensive community feedback was used alongside the analysis to ensure the Plan prioritizes community-identified issues, solutions, and priorities for Moreno Valley. To adequately serve Moreno Valley’s growing population, this Plan provides recommendations to meet the City’s park, community services, and trail needs over the next 10 to 20 years.
Parks, community services, and trails play a critical role in maintaining a healthy, high quality of life in Moreno Valley. Not only do parks, recreation facilities, and programming promote physical health, they also serve a special role in bringing people together to build positive memories, experiences, and relationships. This Plan recognizes the importance of an accessible, well-maintained, and diverse parks and recreation system.
The Plan is intended to help the City achieve the short, mid, and longterm visions and projects identified in the recommendations chapter. Although the Plan does not include conceptual design plans for parks and recreation facilities, there is enough information to help City staff, elected officials, and other stakeholders make informed decisions.
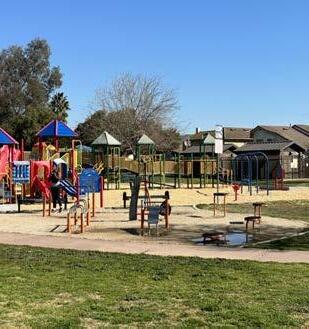
The City’s Parks and Community Services Department (Department) is responsible for the operation and maintenance of over 400 acres of parks, over 20 miles of trails, and five public recreation facilities. The Department is also responsible for hosting annual special events, sports programs, and a variety of other recreation programs for youth, adults, and seniors. Other activities and programs the Department assists with include:
» Beautify MoVal Parks and Trails Program
» Healthy MoVal
» Public art programs
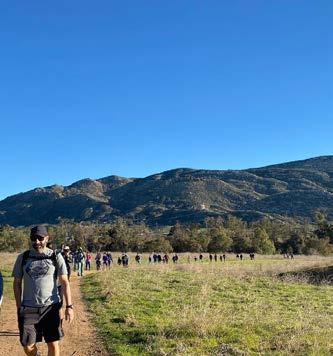
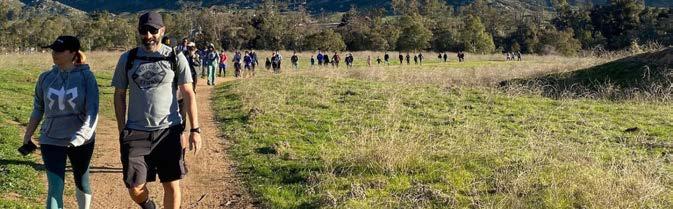
» Annual hikes
» Community demonstration garden
The Parks, Community Services, & Trails Master Plan includes the following components:
A thorough physical assessment of the quantity and condition of park facilities and amenities
» An analysis of geographic and demographic data to better understand gaps and underserved populations throughout Moreno Valley
An extensive review of recreation and staffing resource data from the last five years to assess future opportunities
» A comprehensive community and stakeholder outreach program comprised of meetings, workshops, surveys, online tools, and more
Recommendations based on feedback collected from residents, stakeholders, staff, and elected officials
» A set of implementable short, mid, and long-term projects to inform the City’s annual Capital Improvement Program over the next 10 years
A table of federal, state, and regional funding sources for parks and recreation projects and programming
There are several City-adopted planning documents and programs that govern the present and future of Moreno Valley’s parks, community services, and trails. An extensive review of relevant plans was conducted to ensure this Plan is both consistent with and helps to advance policies and programs. An overview of the most pertinent plans and programs is provided below for reference.
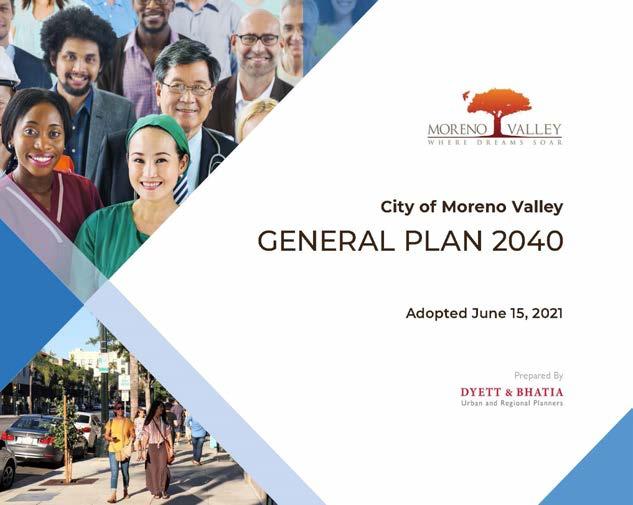
The City of Moreno Valley General Plan (2021) is a comprehensive, long-term planning document that assesses the City’s current conditions and plans for how Moreno Valley will grow in the future. The General Plan provides a path for Moreno Valley to achieve its aspirations for growth while maintaining its reputation as a family-friendly community for generations to come. The General Plan is guided by four overarching themes: Dynamic Economy, Vibrant Gathering Places, Community Identity, and Livable Neighborhoods. Under these themes are a number of guiding principles, many of which are relevant to parks, community services, and trails, including, but not limited to:
Dynamic Economy
» Promote tourism and attract visitors, leveraging natural assets like Lake Perris.
Vibrant Gathering Places
» Create inviting gateways into Moreno Valley from freeways and major roadways.
» Provide sports, recreation, and cultural facilities that provide a range of options for youth, families, and seniors and attract visitors to Moreno Valley.
Community Identity
» Design and program public spaces that reflect Moreno Valley’s cultural diversity.
» Make Moreno Valley a destination city with a modern, innovative brand and become a model community where people choose to live, work, and play.
» Provide activities for youth and families to build community bonds.
Livable Neighborhoods
» Create opportunities for neighborhood interaction.
» Prioritize safety on roads, near schools, in public places, and in neighborhoods.
» Promote active lifestyles with trail connections, parcourse courses, and other recreational amenities.
» Prioritize clean air, water, fresh food, and community health.
Within the General Plan is the Parks & Public Services Element, which includes specific goals, policies, and actions for parks and recreation. This Element establishes a park service standard of three acres of parkland per 1,000 residents. The Element also guides the expansion of its multi-use trail system and envisions a 56mile network expansion. The four goals of the Element are to:
1. Provide and maintain a comprehensive system of quality parks, multi-use trails, and recreational facilities to meet the needs of Moreno Valley’s current and future population.
2. Locate, design, and program public facilities as contributors to neighborhood quality of life.
3. Provide for responsive police and fire services that ensure a safe and secure environment for people and property.
4. Provide utilities and infrastructure to deliver safe, reliable services for current and future residents and businesses.
These goals, along with their supporting policies and actions, were considered throughout the planning process and integrated into the Plan’s recommendations, where applicable.
The General Plan also includes an Environmental Justice Element, which sets goals to prioritize a healthy and safe environment by reducing exposure to pollution; providing safe and sanitary housing; expanding access to healthy foods; and encouraging active engagement in civic life. There are many ways for the Environmental Justice Element goals to be advanced through parks and recreation, including but not limited to the provision of safe outdoor gathering spaces, recreational programming, and opportunities to grow healthy food at community gardens.
The City of Moreno Valley Climate Action Plan guides the City’s commitment to the reduction of greenhouse gas (GHG) emissions, as well as its compliance with the State’s GHG emission reduction standards. The plan establishes a community-wide strategy for reducing Moreno Valley’s GHG emissions and will be used as a tool for policymakers, businesses, and community members for years to come. This document also advances the City’s General Plan (2021) goal to “prioritize clean air, water, fresh food, and community health.”
Momentum MoVal is a Strategic Plan adopted in 2016 as an effort to bring forward a comprehensive vision to help Moreno Valley thrive as it experiences population and economic growth. This plan initiated a vision for the transformation of a young city into a mature community by creating goals for economic development, public safety, library, infrastructure, beautification, community engagement, quality of life, and youth programming.
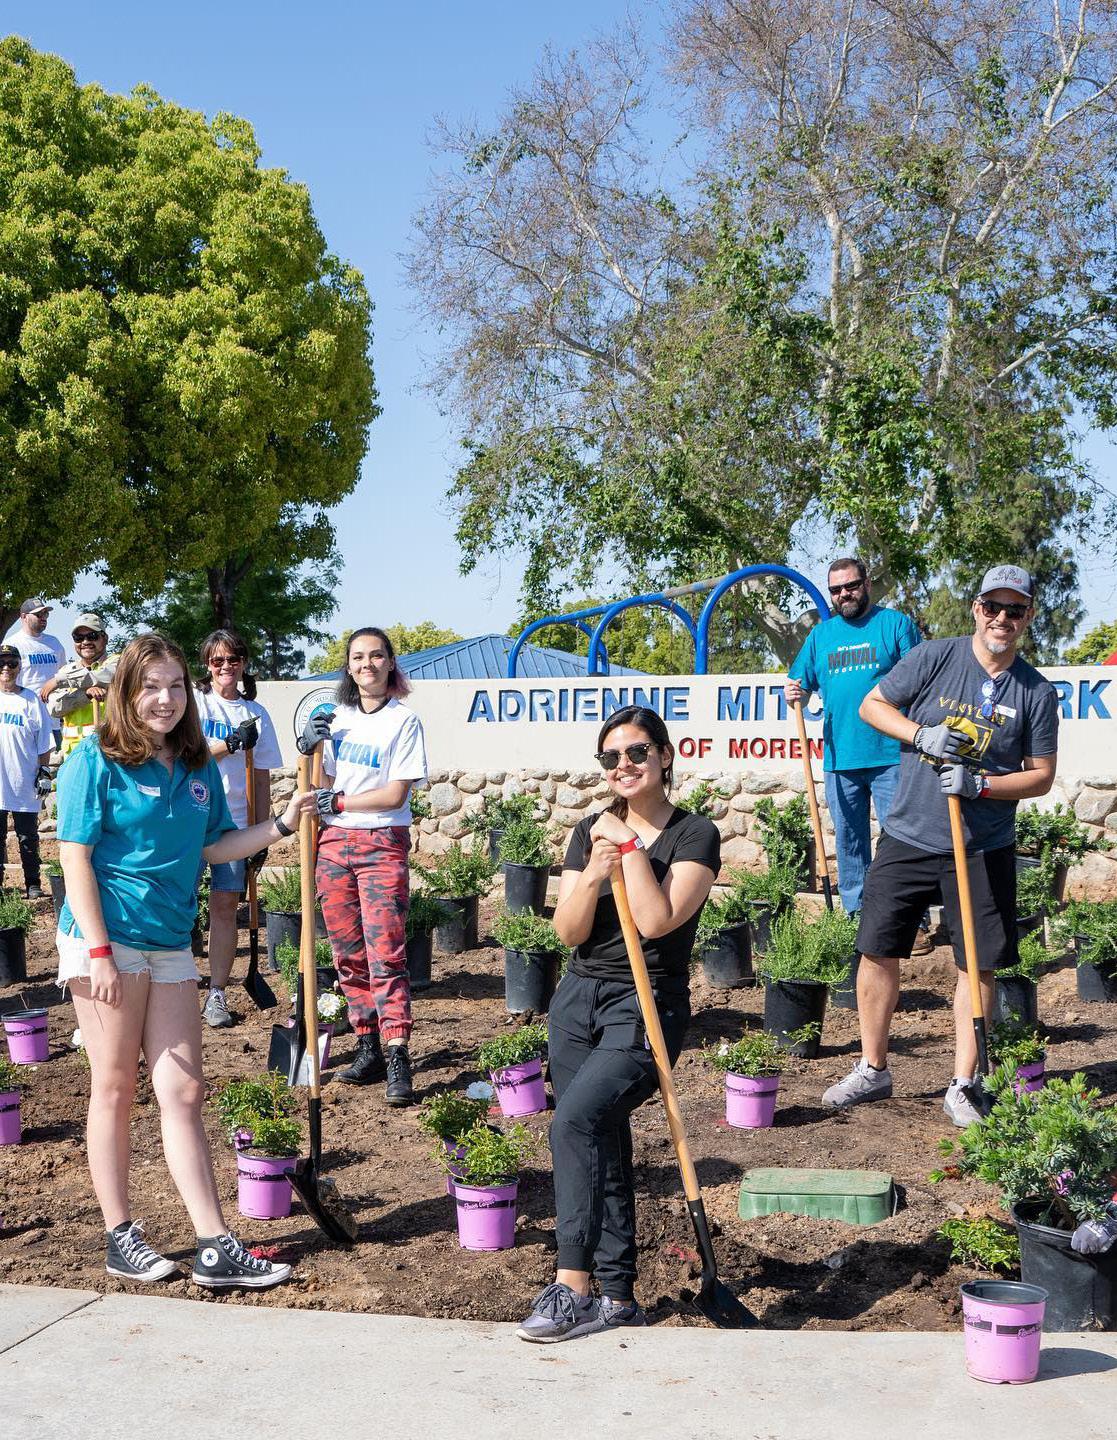
Keep MoVal Beautiful is a volunteer and donation program dedicated to the beautification of MoVal’s parks, trails, and streets. The program organizes community volunteer events, such as tree plantings, trash cleanups, fence painting, and more.
34
City Parks

11 City Trails
5 Indoor Recreation Facilities

51.51
208,371
Residents in 2021
32.3
Median Age

93 °
Average yearly high temperature
65 °
Average yearly low temperature
Median Household Income
$79,840 55,532
Housing Units
A demographic profile for Moreno Valley was completed using the most current data available from the U.S. Census Bureau. According to the U.S. Census Bureau, Moreno Valley has a population of 208,371 residents and 55,532 housing units. The racial and ethnic makeup is 28.7 percent white, 17.9 percent African American, 5.3 percent Asian, and 9.5 percent of people identify as two or more races. About 60.4 percent of the population identifies as Hispanic or Latino.
Key demographic comparisons with other state and national statistics include:
» The estimated median age in Moreno Valley is 32.3, which is slightly lower than the median age of California (37.6) and the United States (38.8).
» The estimated median household income is $79,840, which is lower than California ($84,907) and higher than the United States ($62,843).
» The population of Moreno Valley is almost evenly split between the sexes with 49.7 percent of the population identifying as male and 50.2 percent as female. The populations of California and the United States are also roughly evenly divided between the sexes.
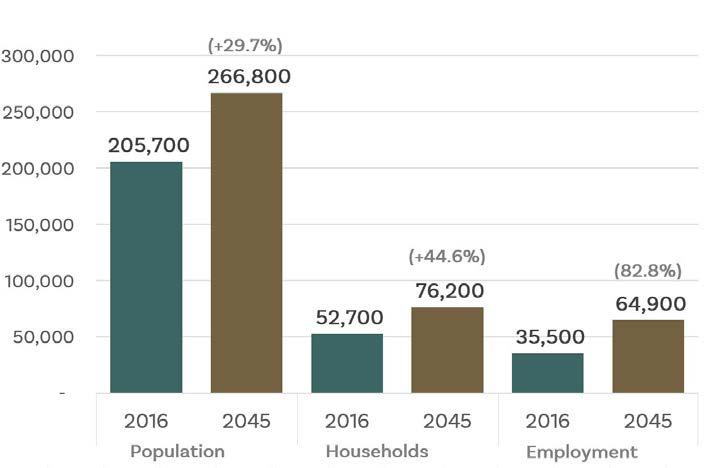
The Southern California Association of Governments (SCAG) projects that the population will increase by 29.7 percent from 2016 to a total of 266,800 residents by the year 2045. The number of households is projected to increase by 44.6 percent from 2016 to 76,200 in 2045 and the total employment in Moreno Valley will increase by 82.8 percent to a total of 64,900 by the year 2045. The projected population estimates are displayed in Figure 2-1. Several factors that contribute to the projected population increase include new commercial/industrial development along State Route 60 and new housing projects in undeveloped areas of the Moreno Valley. (+

The Plan classifies the City’s parks into five categories: Mini Parks, Neighborhood Parks, Community Parks, Linear Parks, and Special Use Parks, as shown in Table 2-1. Each park type provides standard and unique recreation opportunities.
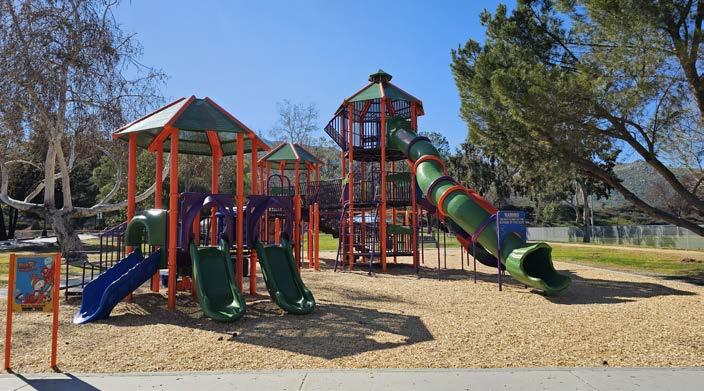
Mini parks are generally smaller parks that provide both passive and limited active recreation. Although they focus on passive recreation, they play an important role in providing outdoor access to greenspace. These parks are typically less than two acres and serve residents within a halfmile walking distance. Small picnic areas, outdoor exercise areas, and playgrounds are typical park amenities. Other park features may include open grassy areas, benches, landscaped gardens, and small shade structures. Mini parks typically do not include active recreation amenities such as court sports and fields.
Neighborhood parks are generally smaller parks that provide both passive and some active recreation. Although they tend to focus more on passive recreation, they sometimes include a few active recreation amenities such as sports courts. Neighborhood parks play an important role in providing outdoor park access for neighborhoods. These parks are typically less than eight acres and serve residents within a half-mile walking distance. Playgrounds, picnic areas, restrooms, walking paths, and sports courts are typical park amenities.
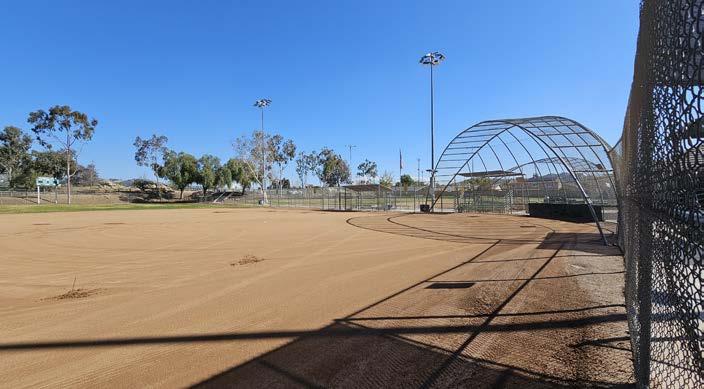
Community parks serve the daily recreational needs of the local neighborhood they are located in, as well as the broader community at large. They are generally between eight and thirty acres in size. They consist of larger park facilities such as sports fields, pools, and multiple-court sports, as well as playgrounds, larger group picnic areas, and walking paths. Community parks serve both residents within a half-mile walking distance and residents within a two-mile driving distance.
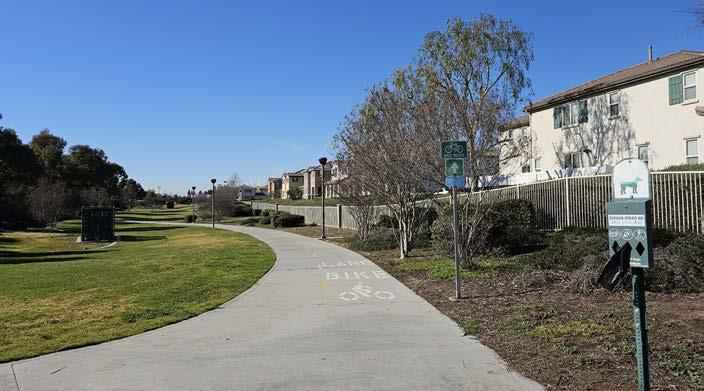
Linear parks are narrow, passive park areas that typically have limited amenities. Recreation opportunities are usually designed for walking, jogging, biking, or equestrian uses. Common amenities include benches, picnic tables, outdoor exercise areas, or interpretive signage. For the purposes of calculating level of service (LOS), 25 percent of the total linear park acreage was calculated because the uses within the park space are limited to walking, biking, or other forms of micro mobility.
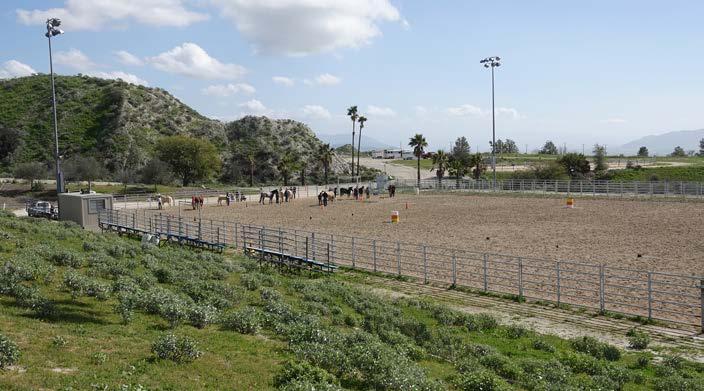
Special-use facilities are park areas that provide unique recreation opportunities. They are usually limited to a single-use recreation experience such as a dog park, community center, pool, or equestrian center. Special-use facilities serve both residents within a half-mile walking distance and residents within a two-mile driving distance.


28

14


1 15

14

Playgrounds (ages 6-12) Tennis Courts Splashpad

1 Recreation Center Community Centers Tot Lots (ages 2-5) Pickleball Courts


1

10


14 1 11
Center

3

2
36

1
2 1 43

3 1

411 Parks & Park Acres Facilities
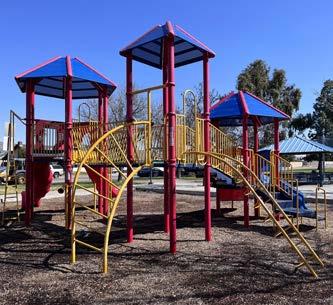
Adrienne Mitchell Memorial Park - 4.4 acres
Adrienne Mitchell Memorial Park is located on the west side of the city along Adrienne Avenue and Pan Am Boulevard. Its amenities include four lighted basketball half-courts, a shaded picnic area with barbecues, a horseshoe play area with two pits, a walking path, and a green grassy area surrounded by trees.
Bay Side Park - 2 acres
Bay Side Park is located on the northwest side of the city along Bay Avenue. It is a neighborhood park with a playground area, horseshoe, one basketball half-court, a picnic area, and an open grassy area with a walking path.
Bethune Park - 6 acres
Bethune Park is a neighborhood park located at the southern corner of Moreno Valley next to Bethune Elementary School. It has a snack bar, a playground, two tennis courts, shaded picnic areas, a barbecue, and a splash pad area. The City also has a joint-use agreement with Mary McLeod Bethune Elementary School for the use of the two baseball/ softball fields next to the park.
Celebration Park - 6.7 acres
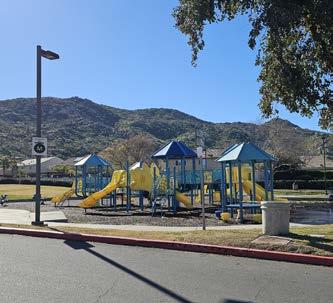
Celebration Park is located on the east side of Moreno Valley. It is a neighborhood park that offers several amenities including shaded picnic areas, a playground area, one basketball half-court, a walking path, a splash pad, and a large grassy open space. There are several picnic tables and seating areas along the walking path.
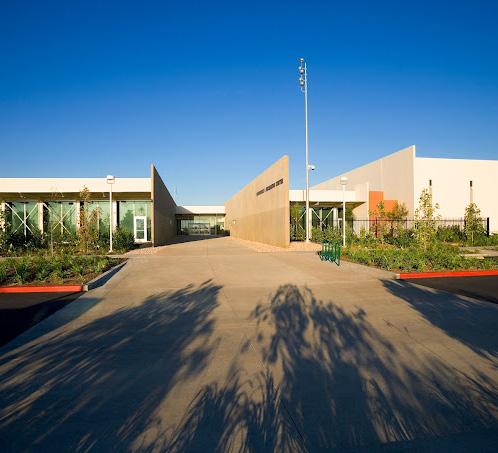
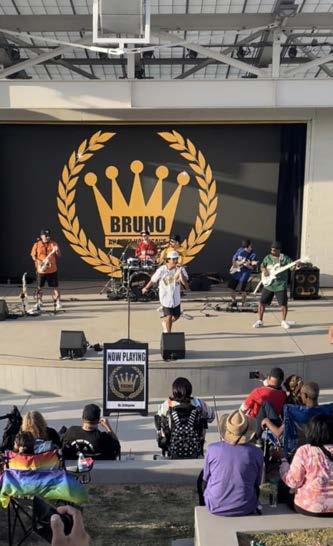
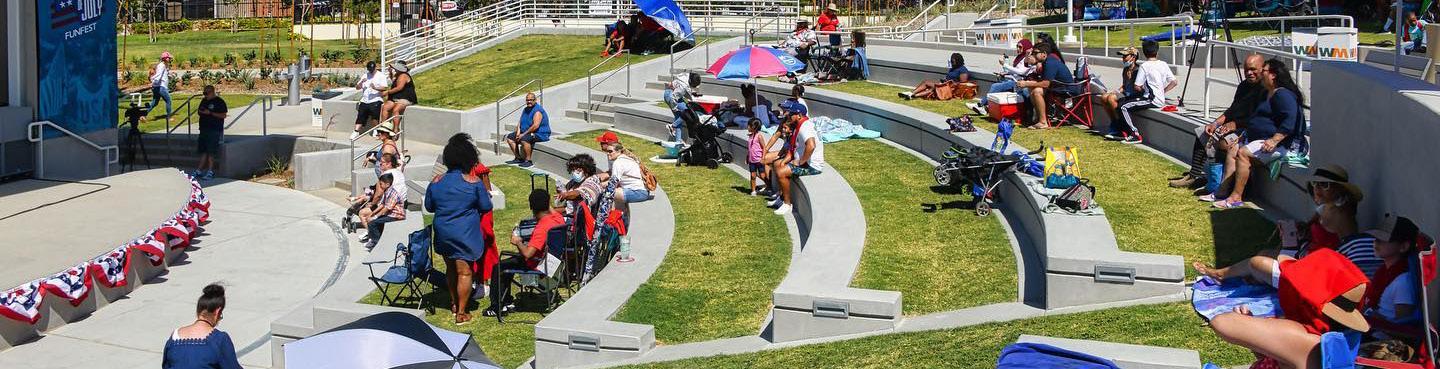
The Civic Center Amphitheater and Park is located off Alessandro Boulevard and Frederick Street. The site contains several facilities, including the Demonstration Garden, 600-seat amphitheater, and the Moreno Valley Conference and Recreation Center (CRC). The Conference and Recreation Center provides access to indoor sports, meeting spaces, and restrooms. The Amphitheater hosts several City events throughout the year including Juneteenth, Fourth of July, MoVal Rocks, Movies, and more.
The Veteran’s Memorial can also be found here. It is a space honoring United States Veterans. It is located in front of the Moreno Valley CRC.
College Park is located on the east side of Moreno Valley on Lasselle Street, adjacent to Moreno Valley Community College. It is a 25-acre community park that provides access to a playground and large, flat, grassy spaces for sports such as soccer.
El Portero Park is located south end of the city on Lasselle Street. This 15-acre community park is divided into two areas. A bridge that passes over a flood control channel connects both sides of the park. The large, open, grassy areas provide access to four multi-purpose athletic fields, a soccer field, picnic tables, barbecues, and fitness equipment. A playground and restroom are also located on the east side of the park.
Fairway Park is located on the east side of the city along on John F. Kennedy Drive. It is a neighborhood park with a multi-purpose field commonly used for soccer tournaments and practices. Other amenities include a restroom, a playground, and volleyball court.
Gateway Park is a located on the north side of the city along Heacock Street. Amenities at this park include a large, grassy open space, a playground, restroom, several picnic tables, and a parking lot. This park also provides direct access to Sunnymead Linear Park, greatly increasing park access to the surrounding neighborhoods.
Hidden Springs Passive Nature Park is located on the northwest end of the city along Greenridge Drive. Although this passive park has limited amenities, residents enjoy access to multi-use trails as well as picnic tables near the trailhead.
Hidden Springs Park - 7 acres
Hidden Springs Park is a neighborhood park located on the northwest end of the city along Hidden Springs Drive. The park shares its southern boundary with Hidden Springs Elementary School. The park contains a playground, a shaded picnic area with a barbecue, and an open grassy area with baseball backstops.
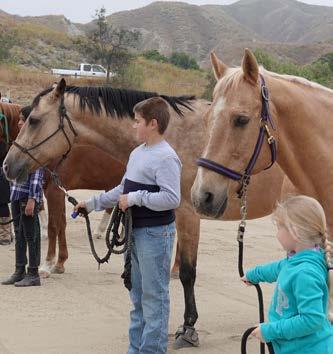
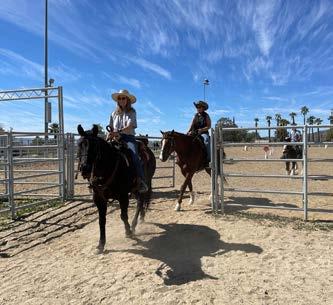
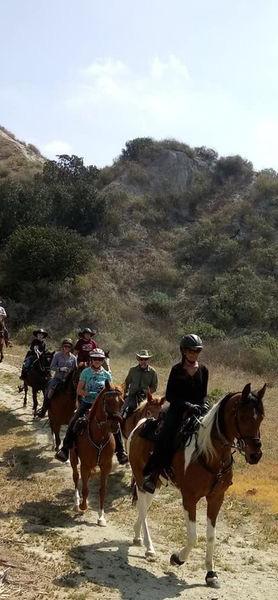
Moreno Valley Equestrian Park and Nature Center- 45 acres
Moreno Valley Equestrian Park and Nature Center is a 45-acre special-use facility located in the northeast area of the city. The Equestrian Park contains a large arena, a handful of holding pens, hiking trails, and vehicular parking. The Moreno Valley Trailseekers, a 501(c)(3) non-profit organization “dedicated to supporting and promoting the rural lifestyle”, conducts various programs at this park. The City’s sole dog park (Hound Town Dog Park) is also located within the Equestrian Park. The dog park is 0.25 acres and has a small parking lot, seating areas, and portable restrooms.
John F. Kennedy Memorial Park - 7.7 acres
John F. Kennedy Memorial Park is a neighborhood park located in the central-west area of the city along John F. Kennedy Drive and Indian Street. Amenities include an adult baseball/softball field with lights, open grassy areas, a playground area, an outdoor exercise area, shaded picnic tables, and four lighted tennis courts. The Riverside County Fire Station is also located within the park’s boundary.
Lasselle Sports Park - 12.8 acres
Lasselle Sports Park is a community park located on the south end of Moreno Valley. The park has three lighted multi-use fields, a large shaded picnic area, a snack bar, a walking path around the fields, and a playground area. This park is also located south of El Potrero Park.
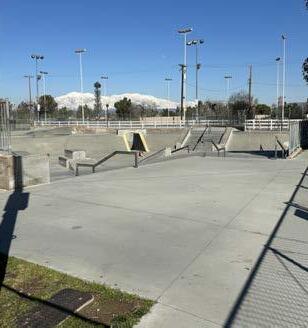
March Field Park and Valley Skate Park - 93.3 acres
March Field Park and Valley Skate Park is a community park that is located on the west side of Moreno Valley. This park includes a lighted and gated skatepark, a snack bar, two softball/baseball fields, a soccer arena, and picnic tables.
Moreno Valley Community Park - 15.6 acres
Moreno Valley Community Park is a community park located on the northeast side of the city, adjacent to Moreno Valley High School. This park offers four lighted soccer fields, a playground, picnic tables, a walking path, a skatepark, and a large parking lot.
Morrison Park is a community park located in the central-east area of the city that mostly serves as a baseball park. It has four lighted baseball fields, restrooms, a snack bar, and picnic tables with barbecues. It is located across Dracaea Avenue from Mountain View Middle School.
Parque Amistad is a neighborhood park located at the southeast corner of Moreno Valley. It is a passive park offering basic amenities that include a playground, a picnic area, two basketball half-courts, and a softball/baseball backstop. Amenities are surrounded by grassy tree-shaded areas.
Patriot Park is a mini park located on the south side of the city along Perris Boulevard and Filaree Avenue. Its amenities include a walking path and a playground area.
Pedrorena Park - 5.5 acres
Pedrorena Park is a neighborhood park located in the southeast area of the city along Iris Avenue and Ranch Del Lago. It contains several active recreational amenities, such as a full-size basketball court, four tennis courts, a playground area, and an open grassy area with a baseball/softball backstop. It also has two picnic areas.
Ridge Crest Park - 5 acres
Ridge Crest Park is located on the east side of the city along John F. Kennedy Drive. It is a neighborhood park next to Ridge Crest Elementary School. It has a playground, restrooms, picnic areas with barbecues, and an open grassy area with a baseball/softball backstop.
Rock Ridge Park - 1.9 acres
Rock Ridge Park is a neighborhood park located on the northeast side of Moreno Valley. Its amenities include a playground, picnic areas, and a walking path connecting the south and north sides of the park. This park has access to a short hiking trail that leads people to the top of a hill, providing nice views of the surrounding neighborhood.
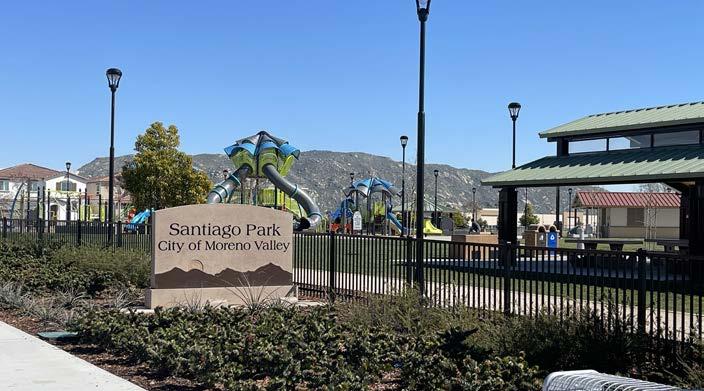
Santiago Park - 2.8 acres
Santiago Park is a newer neighborhood park located on the southwest side of the city. Its amenities include an outdoor exercise area, a playground area, picnic areas with barbecues, two basketball half-courts, a open grassy area, and a walking path.
Shadow Mountain Park - 10 acres
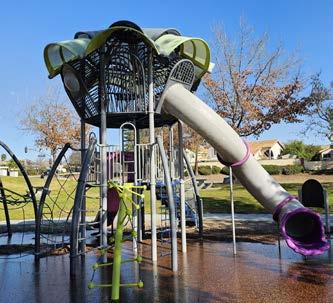
Shadow Mountain Park is located on the north side of Moreno Valley. It is a community park with a large, open grassy space. Its amenities include two youth softball/baseball fields, a soccer field that is used during softball/baseball off-season, a large playground area that includes a zip line, shaded picnic areas with barbecues, a restroom, and a walking path.
Sunnymead Park - 15.5 acres
Sunnymead Park is a large community park located in the central-north area of Moreno Valley along Perris Boulevard and Fir Avenue. The park is known for the four lighted diamond fields (one baseball field and three softball fields). The park also has a playground, picnic areas with barbecues, concession stands, restrooms, and two parking lots.
TownGate Memorial Park and TownGate II Park - 17 acres
TownGate Memorial Park and TownGate II Park are jointly located on the northwest side of the city. These two community parks contain a community center building, two separate playground areas, softball/ baseball fields, a multi-purpose field, picnic areas with barbecues, and a walking path. The Juan Bautista De Anza Trail passes through the park’s boundary and can be accessed from these parks.
Victoriano Park - 5 acres
Victoriano Park is located in the southeast side of the city next to Victoriano Elementary School. It is a passive neighborhood park with amenities that include a restroom and a multi-purpose field. Improvements to the park were under construction during the development of this Plan.
Vista Lomas Park - 4 acres
Vista Lomas Park is located on the east side of the city along Iris Avenue. It is a neighborhood park that contains two basketball halfcourts, a playground area, a shaded picnic area, and open grassy areas with backstops.
Westbluff Park - 5 acres
Westbluff Park is located in the north side of the city between Vista Heights Middle School and Canyon Springs High School. It is a small neighborhood park with a large playground, picnic areas with barbecues, and a walking path.
Weston Park - 4.1 acres
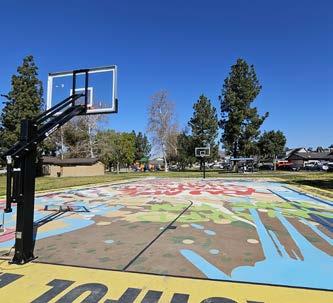
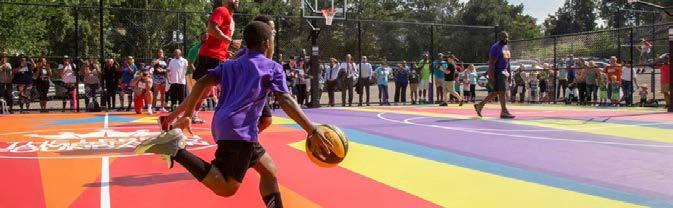
Weston Park is located on the northeast side of the city along Lasselle Street. This neighborhood park contains several amenities such as a restroom, a playground area, picnic tables, a full-size basketball court, and a multi-use trail. NBA All-Star Kawhi Leonard partnered with the City and other stakeholders to help build the existing basketball court and design the mural on the court’s surface.
Woodland Park - 9.1 acres
Woodland Park is a community park located in central Moreno Valley along Cactus Avenue. It contains several amenities, including a restroom, two playground areas, a lighted softball field, four tennis courts with, pickleball courts overlaid on the tennis courts, four basketball half-courts, walking paths, and a play area with chess tables.
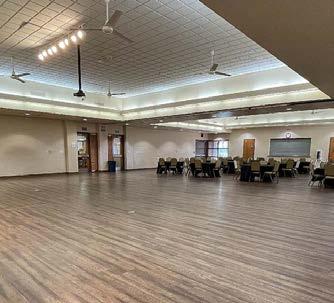
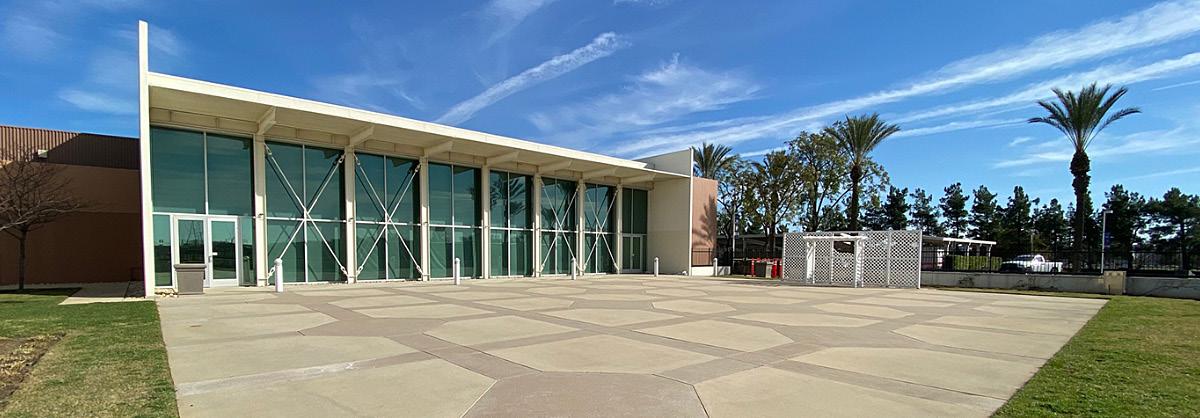
The Moreno Valley Conference and Recreation Center is the city’s premiere indoor facility. It is located in the central-west area of the city on the corner of Frederick Street and Alessandro Boulevard. This facility offers residents access to several spaces, such as the 8,200-square foot ballroom that has a full kitchen, stage, dressing rooms, and AV technology. The Center also has two meeting rooms, an outdoor banquet patio, a large gymnasium, aerobics studio, a Teen Center, and several activity rooms for recreation programs.
The TownGate Community Center is located on Arbor Park Lane within TownGate II Park. The amenities in this facility include a 2,000-square foot ballroom that can be used for events and a covered courtyard overlooking the park. The Community Center also contains several activity rooms for classes and programs.
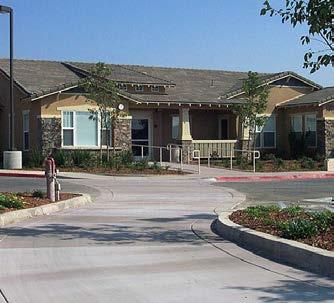
The Senior Community Center is located on Fir Avenue. Its amenities include a 3,500-square foot ballroom with a full kitchen, tables, and chairs. There are two additional meeting rooms with tables and chairs that are used for senior classes and programs.
The Cottonwood Golf Center and Banquet Room is located on Frederick Street. This facility offers a banquet room, a spacious lobby, and a separate activity room.
The Moreno Valley Public Library has three branches that serve the city. The main library is located on Alessandro Boulevard while the other two locations can be found in the Moreno Valley Mall on Town Circle and in the Iris Plaza on Perris Boulevard. Moreno Valley residents have access to books, public computers, and free Wi-Fi at the three library branches.
The park amenity inventory included an assessment of the overall condition of each major amenity. The project team counted and inspected each amenity and gave it one of four grades: Excellent, Good, Fair, or Poor. The team was not evaluating individual pieces of a park amenity. For example, the nuts and bolts of a playground slide were not inspected one by one. Instead, the team assessed the overall playground structure condition based on the team’s design and construction expertise. If interested in a greater level of detail and precision, the City can perform an asset evaluation of all park facilities and amenities.
“Excellent” means that the amenity is in near-perfect condition and has many years left in its life cycle. “Good” means that the amenity is not quite brand new, it may have some minor signs of wear and tear but it is functioning as it should. “Fair” means that the amenity is functioning, but it is showing some major signs of wear and tear and will be in need of replacement or repair in the near future. “Poor” means that the amenity is not functioning for its intended use and needs to be replaced as soon as possible. The condition of each amenity at each park was averaged to determine the overall condition of the park.
Table 2-2 shows the average conditions of each amenity at each park. Lasselle Sports Park and Santiago Park were the only two parks to receive an excellent overall condition rating, while March Field Park and Valley Skate Park was the only park to receive a poor overall condition rating. Table 2-2 helps to determines which parks will require the allocation of additional resources to replace amenities in the future.
Adrienne Mitchell Memorial Park Good Bay Side Park Fair
Bethune Park Good
Celebration Park Good
College Park Fair
El Portrero Park Fair
Fairway Park Fair
Gateway Park Good
Hidden Springs Park Fair
Hound Town Dog Park
John F. Kennedy Memorial Park Fair
Lasselle Sports Park Excellent
March Field Park & Valley Skate Park Fair
Moreno Valley Community Park Fair
Moreno Valley Equestrian Park Fair
Morrison Park Good
Parque Amistad Fair
Patriot Park Fair
Pedrorena Park Good
Ridge Crest Park Fair
Rock Ridge Park
Santiago Park
Shadow Mountain Park
Sunnymead Park
TownGate Memorial Park Fair
Victoriano Park Good
Vista Lomas Park Fair
Westbluff Park Fair
Weston Park Fair
Woodland Park
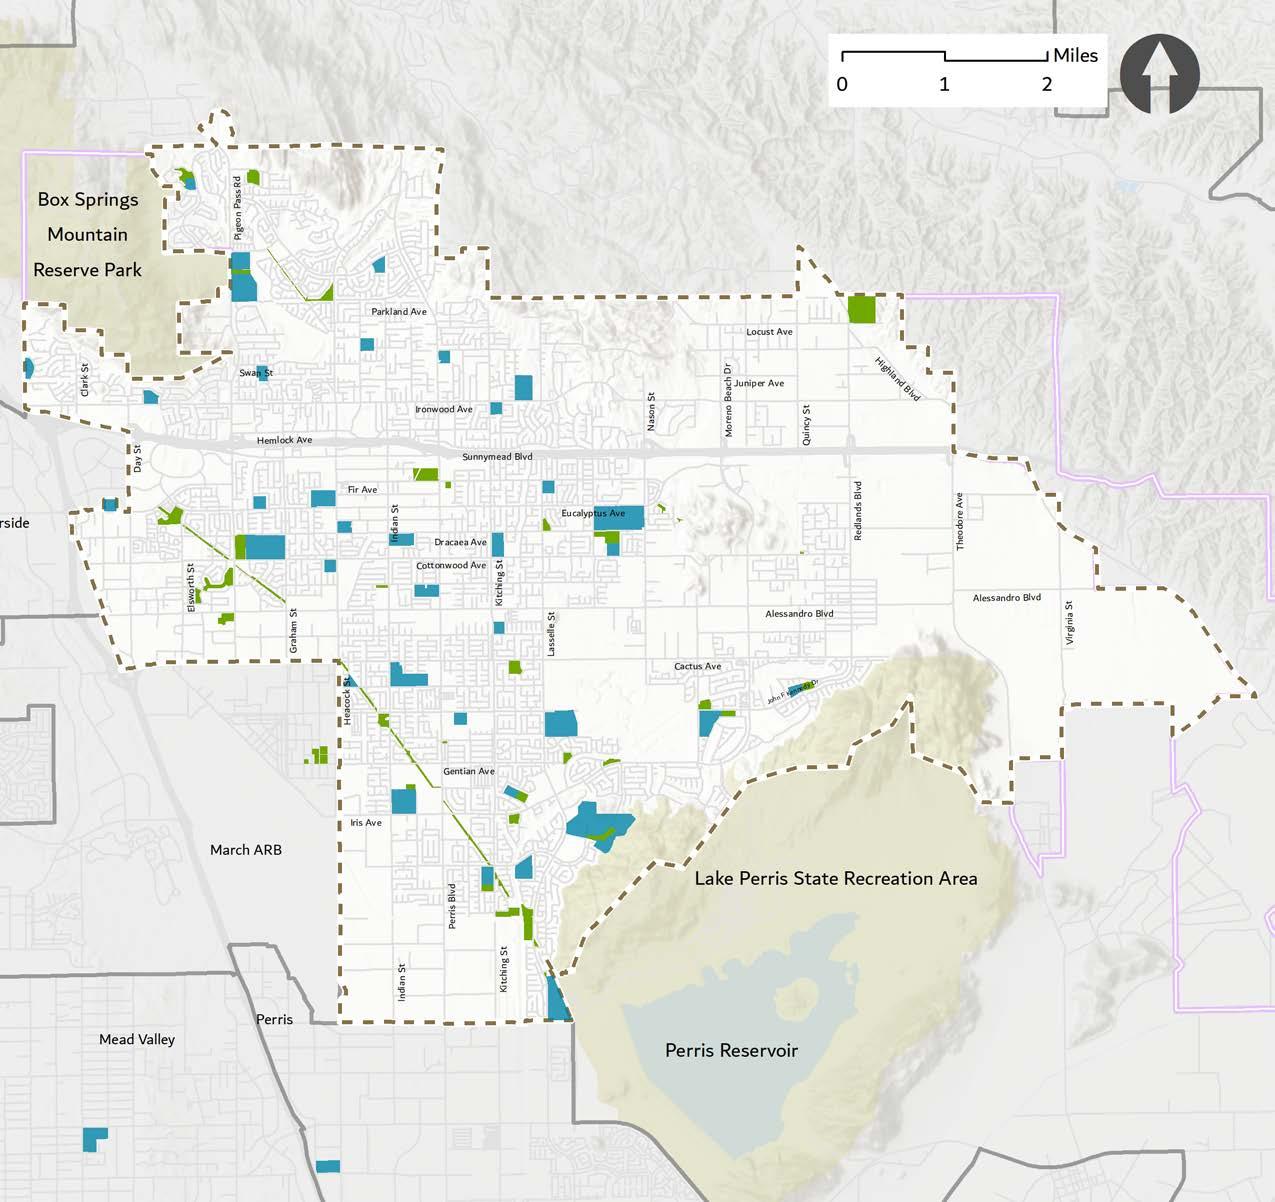
Figure 2-3 displays the two parks and recreation facilities located adjacent to Moreno Valley.
Lake Perris State Recreation Area
The Lake Perris State Recreation Area is operated by California State Parks and is located on the southeast side of the city. The reservoir lake provides many opportunities for recreation use, such as fishing, boating, swimming, and water sports. The areas surrounding the lake provide opportunities for camping, hiking, bicycling, wildlife viewing, and hunting. The recreation area also hosts events, like music festivals, throughout the year. There is an entry fee for visitors that varies by activity type.
Box Springs Mountain Reserve Park
Box Springs Mountain Reserve Park is a 3,400-acre park operated by Riverside County Parks. It overlooks the cities of Riverside and Moreno Valley. This mountain reserve is located on the northwest border of the city. This reserve has several miles of multi-use trails and pathways that vary in difficulty. Locals enjoy these trails for hiking and wildlife viewing. The mountain range peak elevation is approximately 3,000 feet. There are also picnic tables and restrooms located at the two parking areas.
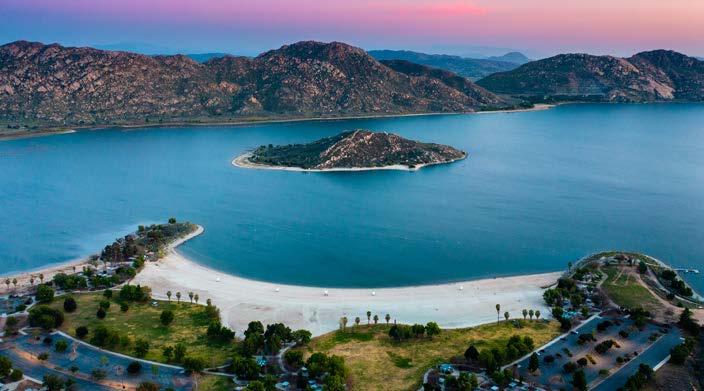
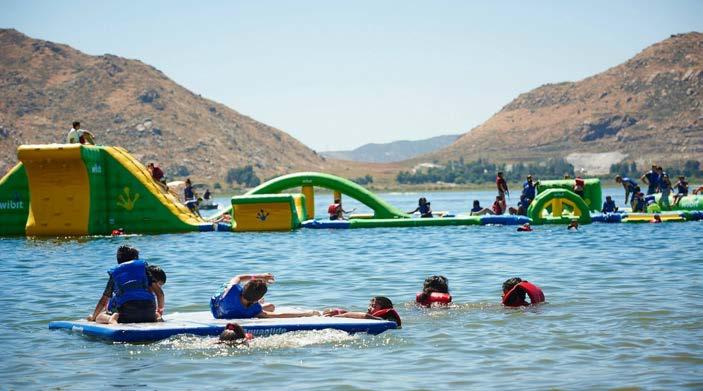
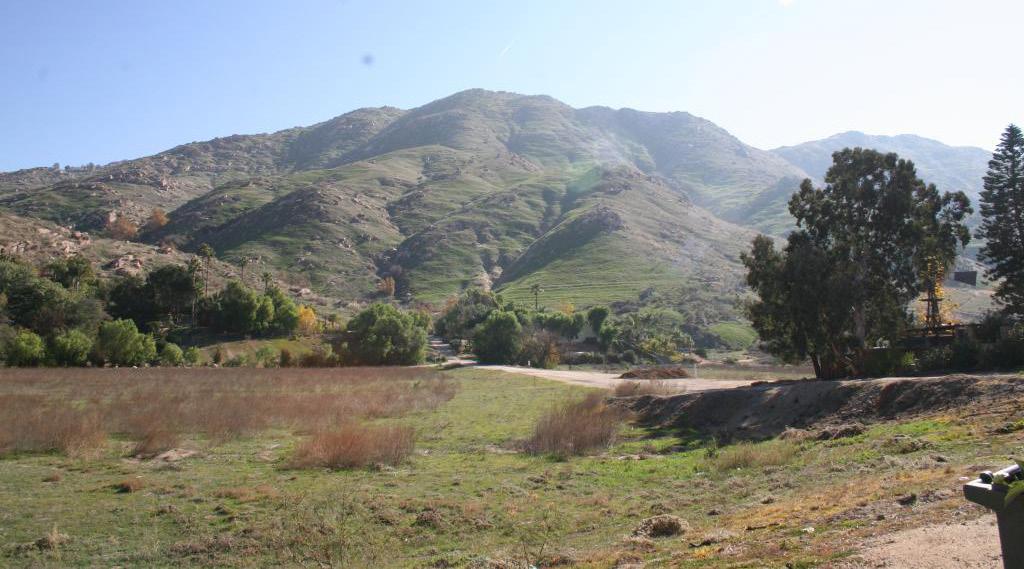
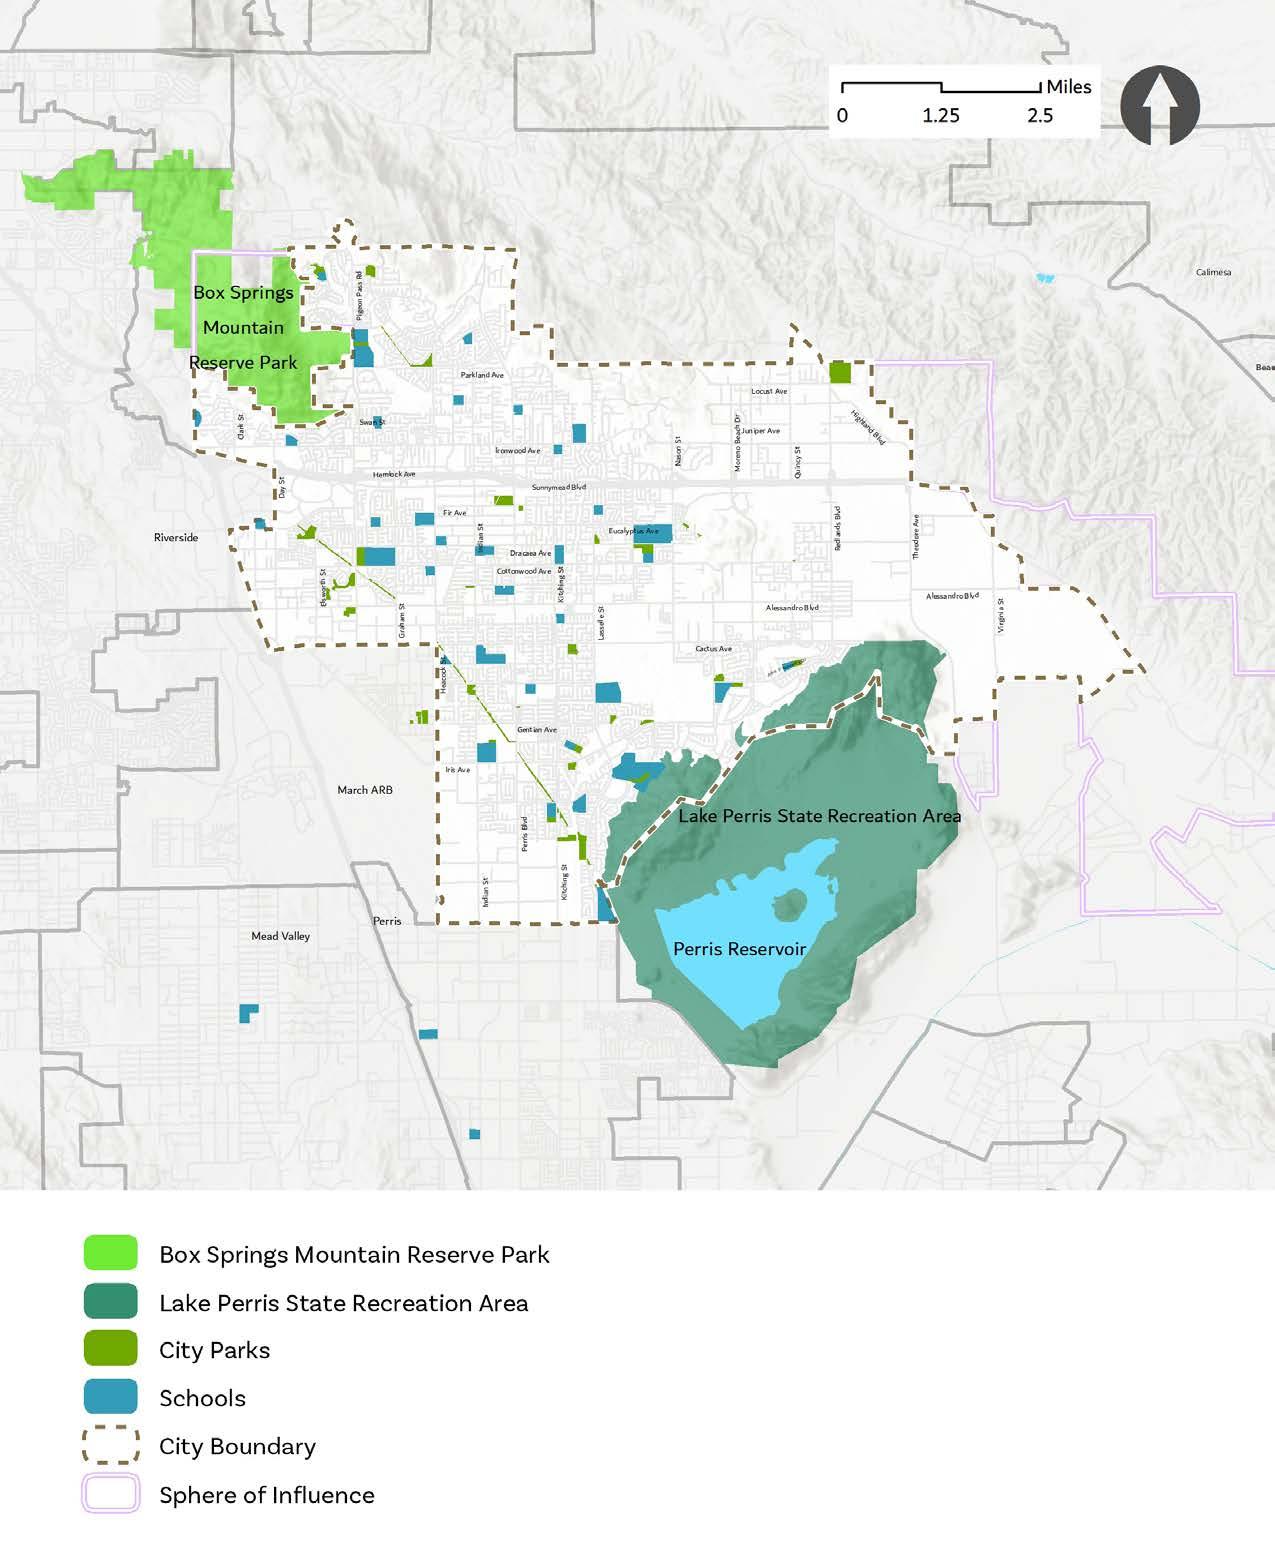
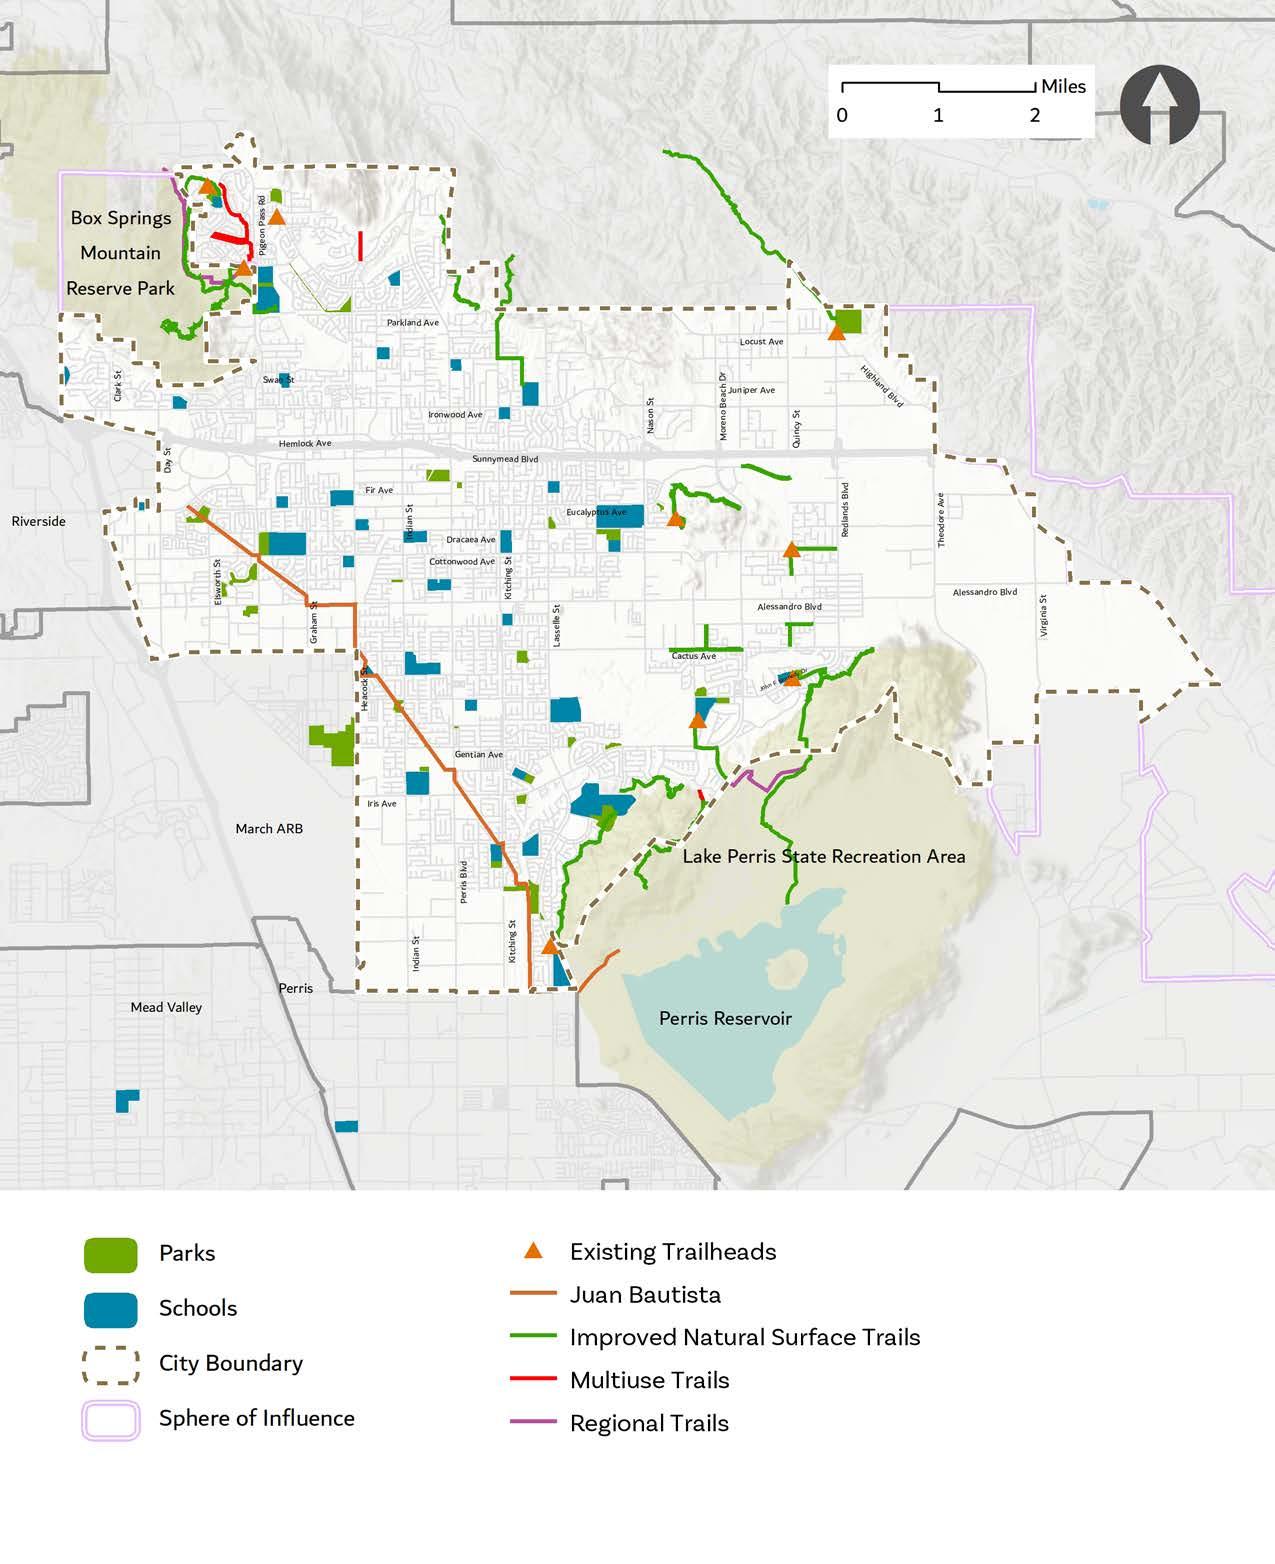
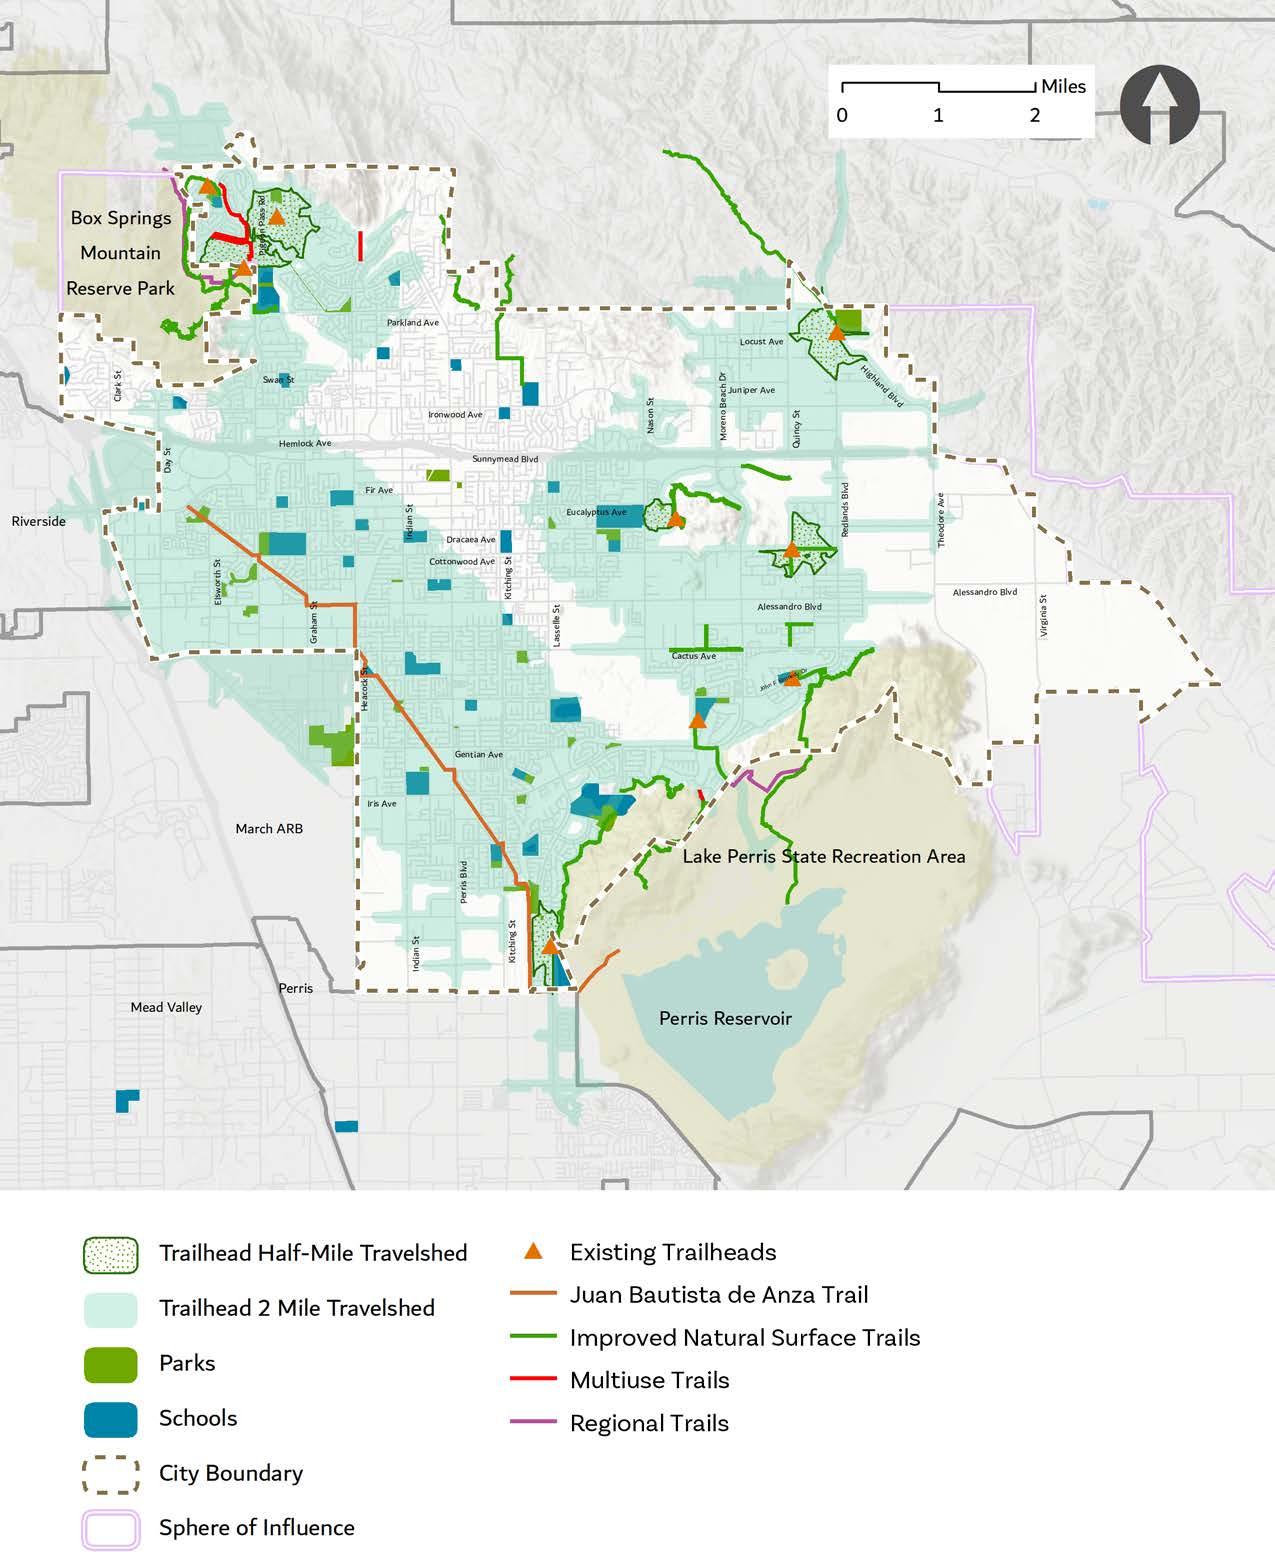
Figure 2-4 displays existing and previously proposed trails in Moreno Valley, including the following three popular trails:
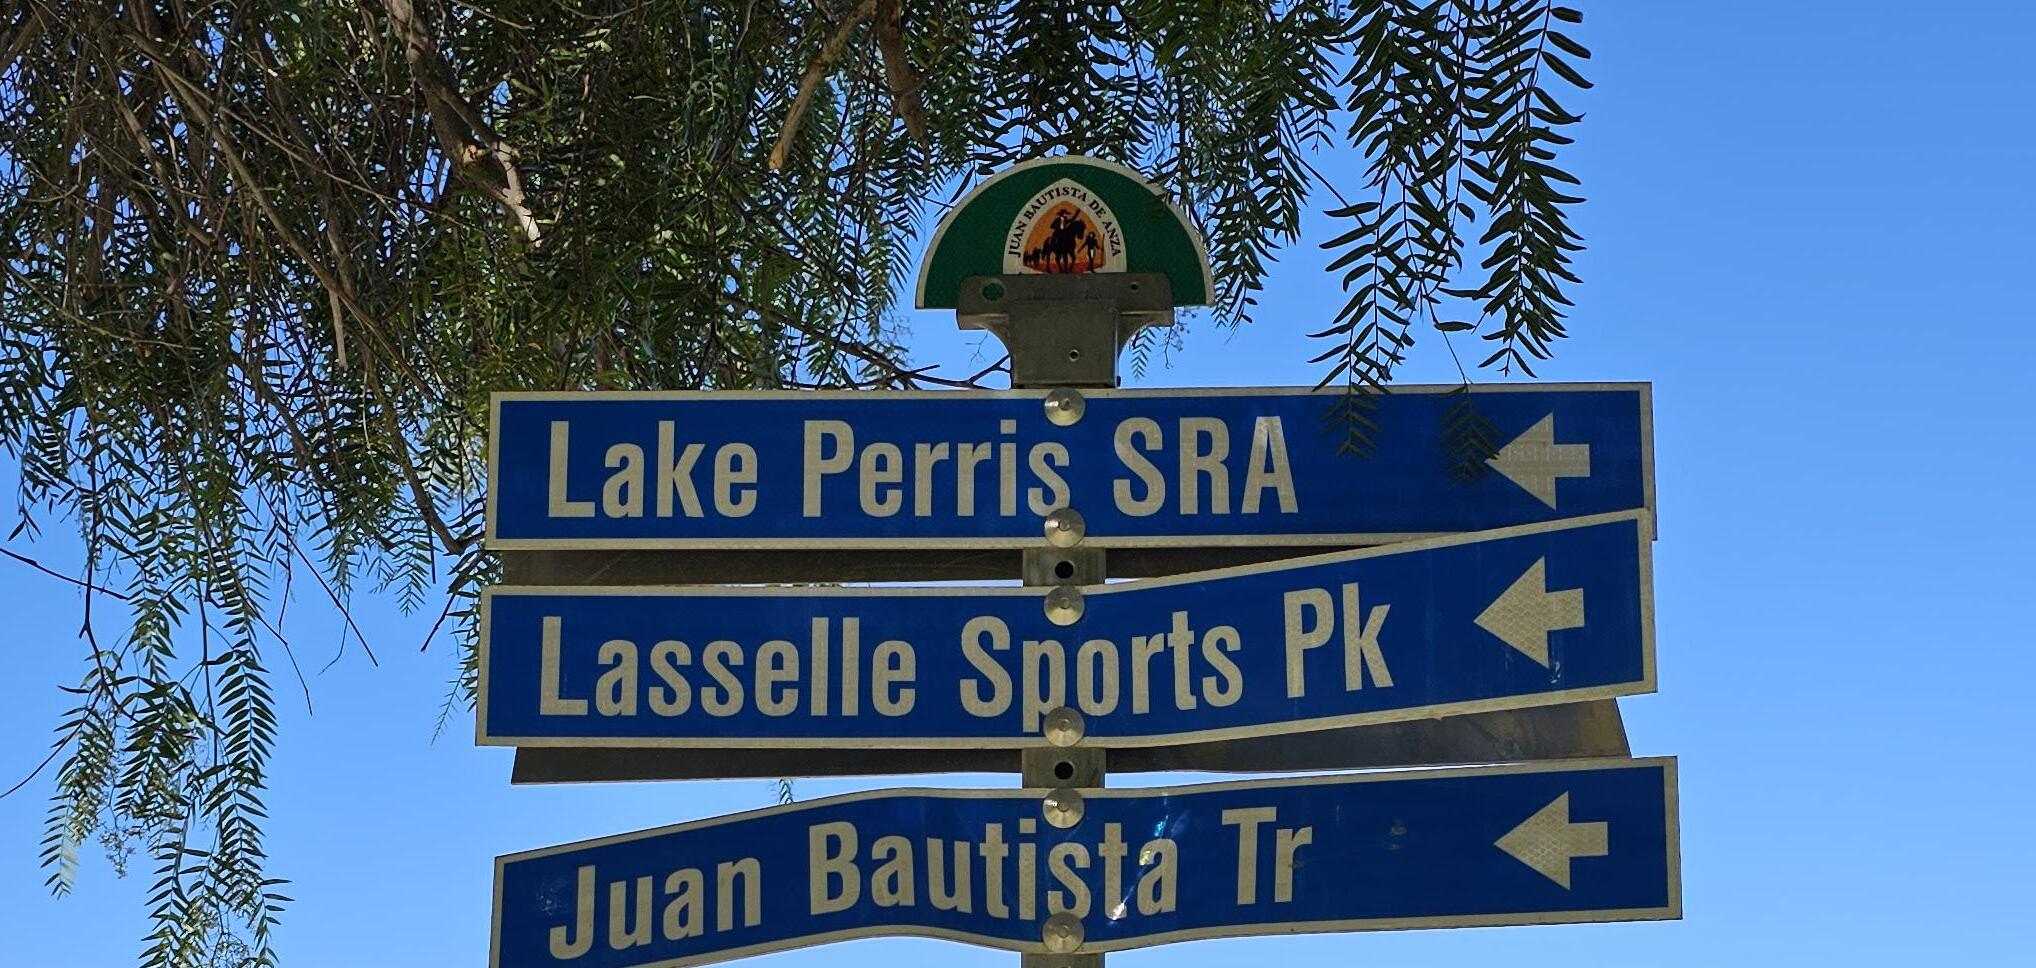
Juan Bautista de Anza Trail
The Juan Bautista de Anza Trail is a 1,210-mile historic route that runs from the U.S.-Mexico border to San Francisco and includes a segment through Moreno Valley. An eight-mile segment of the trail runs diagonally through the city from TownGate Park to Lake Perris. The trail is mostly a multiuse path except for a small segment of Class II bike lanes along Alessandro Boulevard and Heacock Street. In 2022, the City commemorated the addition of a new two-mile trail segment that stretches from El Potrero Park to Lake Perris.
Sunnymead Trail is a multi-use trail located on Sunnymead Ranch Parkway and Via Del Norte on the north side of Moreno Valley. The trail traverses across streets before it follows a path behind residential homes, which creates a more enclosed and shaded trail until it reaches a mountain.
Cold Creek Trail is a multi-use trail located east of Moreno Valley. It is a 2.5-mile out-andback trail that leads to a small mountaintop and typically takes about an hour to complete.
Level of Service (LOS) within the context of park planning is a measurement to evaluate how parks, open spaces, and facilities serve the Moreno Valley community. For this Plan, three different types of park LOS analysis were used to determine park LOS.
1. Population-based LOS analysis
2. Amenity LOS analysis
3. Geographic distribution LOS analysis
These three LOS analysis methods allow the project team to determine how well the existing park system is serving the community from an analytical perspective.
Population-based service analysis uses the most recent population data and existing park acres to determine LOS. The amenity LOS analysis uses existing park amenity numbers and existing population data and compares them to national averages set by the National Recreation and Park Association (NRPA) to determine amenity surpluses and deficits. The geographic distribution level of service analysis determines the actual geographic coverage that each park serves based on the road network by creating park “travelsheds”.
The City’s General Plan (2021) established a goal to have three park acres per every 1,000 residents. Table 2-3 shows that the City is very close to reaching this goal and needs to add additional park acres to achieve it. The City’s existing park system has 411.16 acres of parkland (1.97 park acres per 1,000 people) and will require an additional 213.96 acres of parkland to provide three acres of parkland for every 1,000 residents.
TAbLE 2-3: Population-based Level of Service
A thorough analysis of each park was completed as a part of the existing conditions analysis of this Plan. This included field surveys to inventory park and recreation amenities at each park and recreation facility in Moreno Valley. Through this process, a detailed catalog of park amenities was produced. Total amenity inventory counts for Moreno Valley were compared to national averages of city-wide park and recreation system amenities derived from the NRPA guideline service level and recommended benchmarks averages from 2008 to 2022. The calculations are based on the latest population estimates for Moreno Valley (208,371) according to the 2021 Census American Community Survey (ACS) 5-Year estimates. The results of this analysis are shown in Table 2-4.
According to the NRPA national benchmark averages, the City is currently meeting the needs of several amenities including multi-use courts (tennis/pickleball), equestrian staging areas, and golf centers. However, the City is currently not meeting the needs for many amenities highlighted in Table 2-4, some of the largest amenities deficits include court sports like basketball, volleyball, tennis, and pickleball, as well as recreation centers, group picnic areas, rectangular soccer fields, multi-purpose fields, splashpads/spraygrounds, community gardens, and walking loops. The full list of amenities with inventory deficits is shown on Table 2-4.
While the amenity LOS serves as a valuable indicator for identifying general surpluses and deficits, it should not be the only indicator for identifying shortcomings of amenities in the existing parks and recreation system. It is important to cater to the unique needs of the Moreno Valley community as well as national and regional trends in parks and recreation specific to southern California. Trends like handball, birdwatching, hiking, and adventure sports like rock climbing, bouldering, obstacle courses, and adventure playgrounds are all currently trending and growing in popularity. These activities are not adequately reflected in the NRPA national survey data. Therefore, it is important to have an additional lens that captures the needs and priorities of the ever-evolving community. This approach, coupled with the population-based LOS, can provide a comprehensive understanding of the future park needs. Detailed analysis regarding these needs will be discussed in the following sections and chapters of this Plan.


RECTANGULAR SOCCER FIELDS

MULTI-PURPOSE FIELDS
* Indicated total count of youth and adult fields
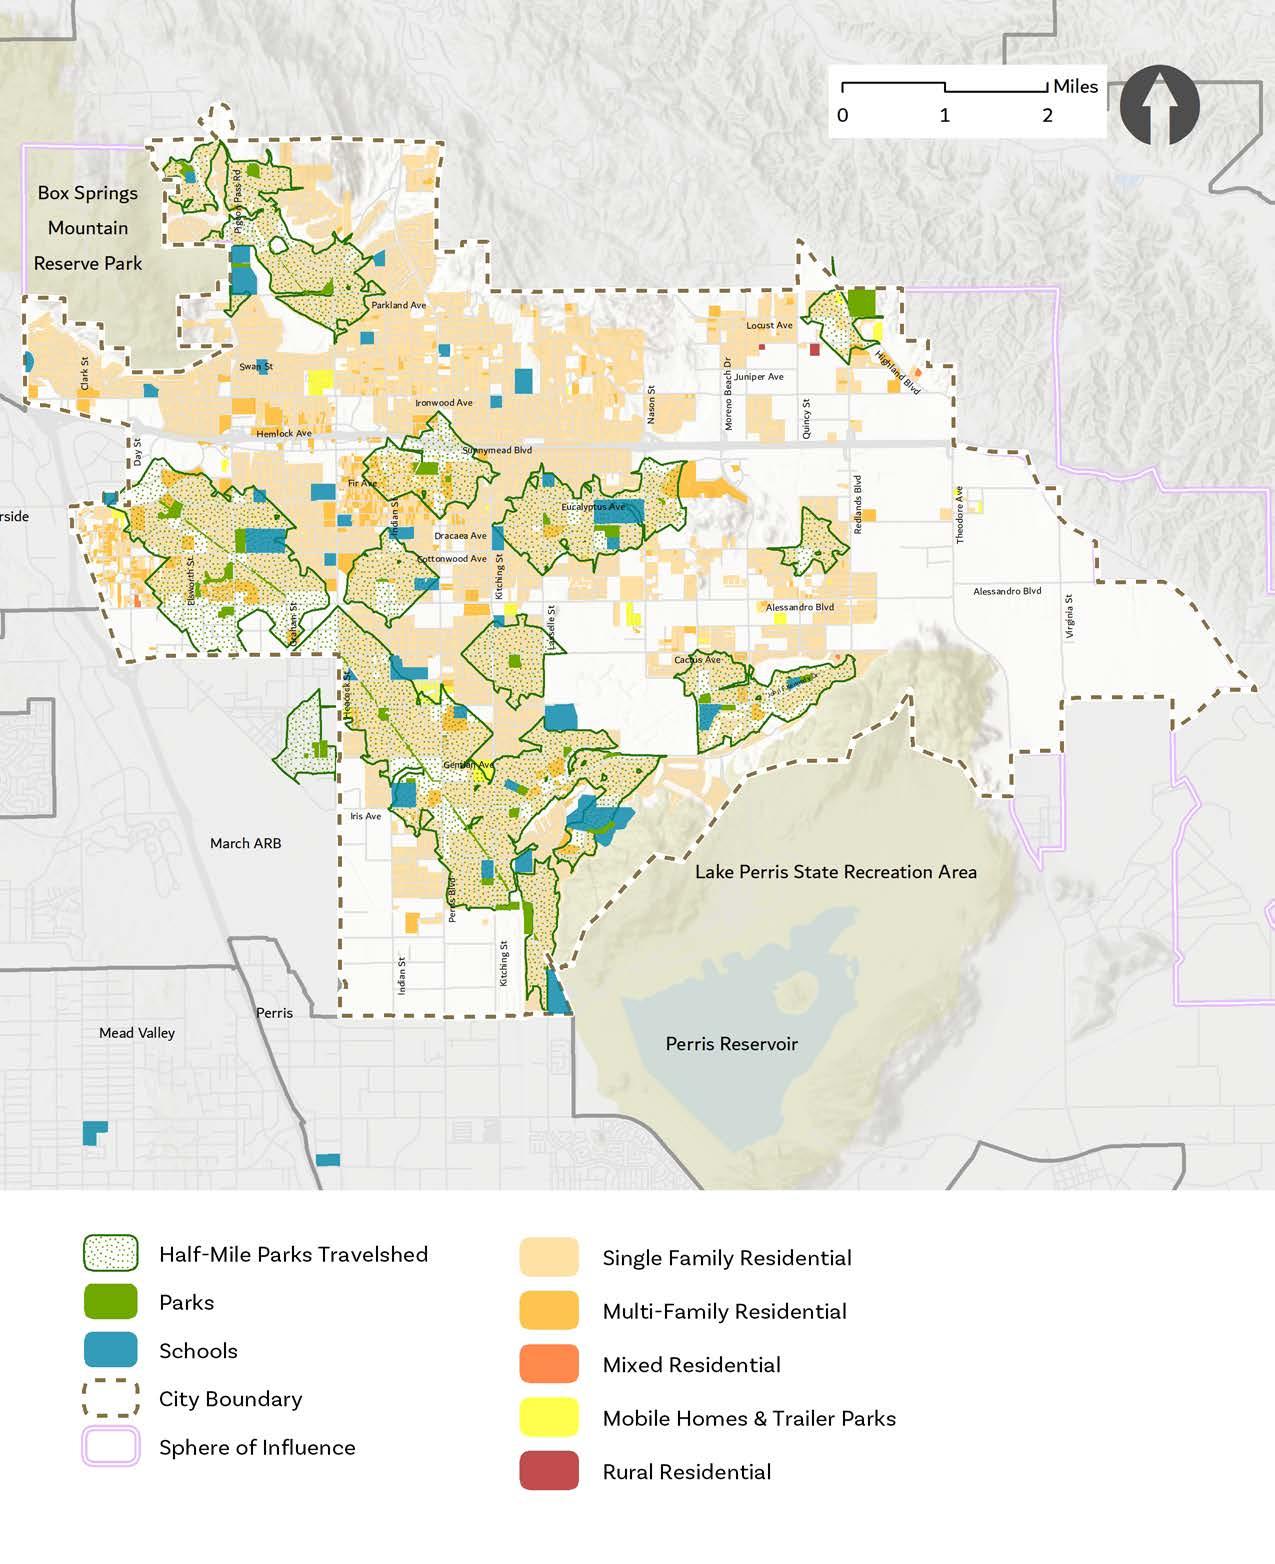
A Geographic Distribution Analysis (GDA) was performed at all of the City parks. A GDA examines the walktime and drivetime to these parks and facilities based on a Geographical Information System (GIS)-based travelshed analysis. Results from this analysis are displayed in Figure 2-5.
A park travelshed is the result produced from the GDA. Instead of showing a simple radius of the area surrounding a park, the GDA creates a polygon around each park that represents a distance of the actual road network from each of the park’s access points. The travelshed polygons represent the walking distance or driving distance around the park.
A travelshed analysis for each park in Moreno Valley was completed to determine the geographic service area for the park system. The analysis generated polygons representing a halfmile travelshed or 15-minute walk, given a walking speed of 2.5 mph (slowed to 2 mph to take into account street crossings, some with signals). The half-mile travelshed polygons were superimposed on the city base map with residential land uses to see which regions were well covered by park access. The results of this analysis are displayed on Figure 2-5.
The park’s GDA analysis takes into account the percentage of the population served by mini/ pocket parks, neighborhood, community, and special-use parks. The method used takes into account walking or driving distances that consider walking, biking, and driving routes that someone would use to get to these parks. By using the actual road network, this analysis calls attention to the need to improve the local sidewalk, bike, and road
network to improve access to parks and facilities. The GDA is important because it highlights the neighborhoods that do not fall within these park travelshed areas, which indicates that these areas currently lack easy access to parks.
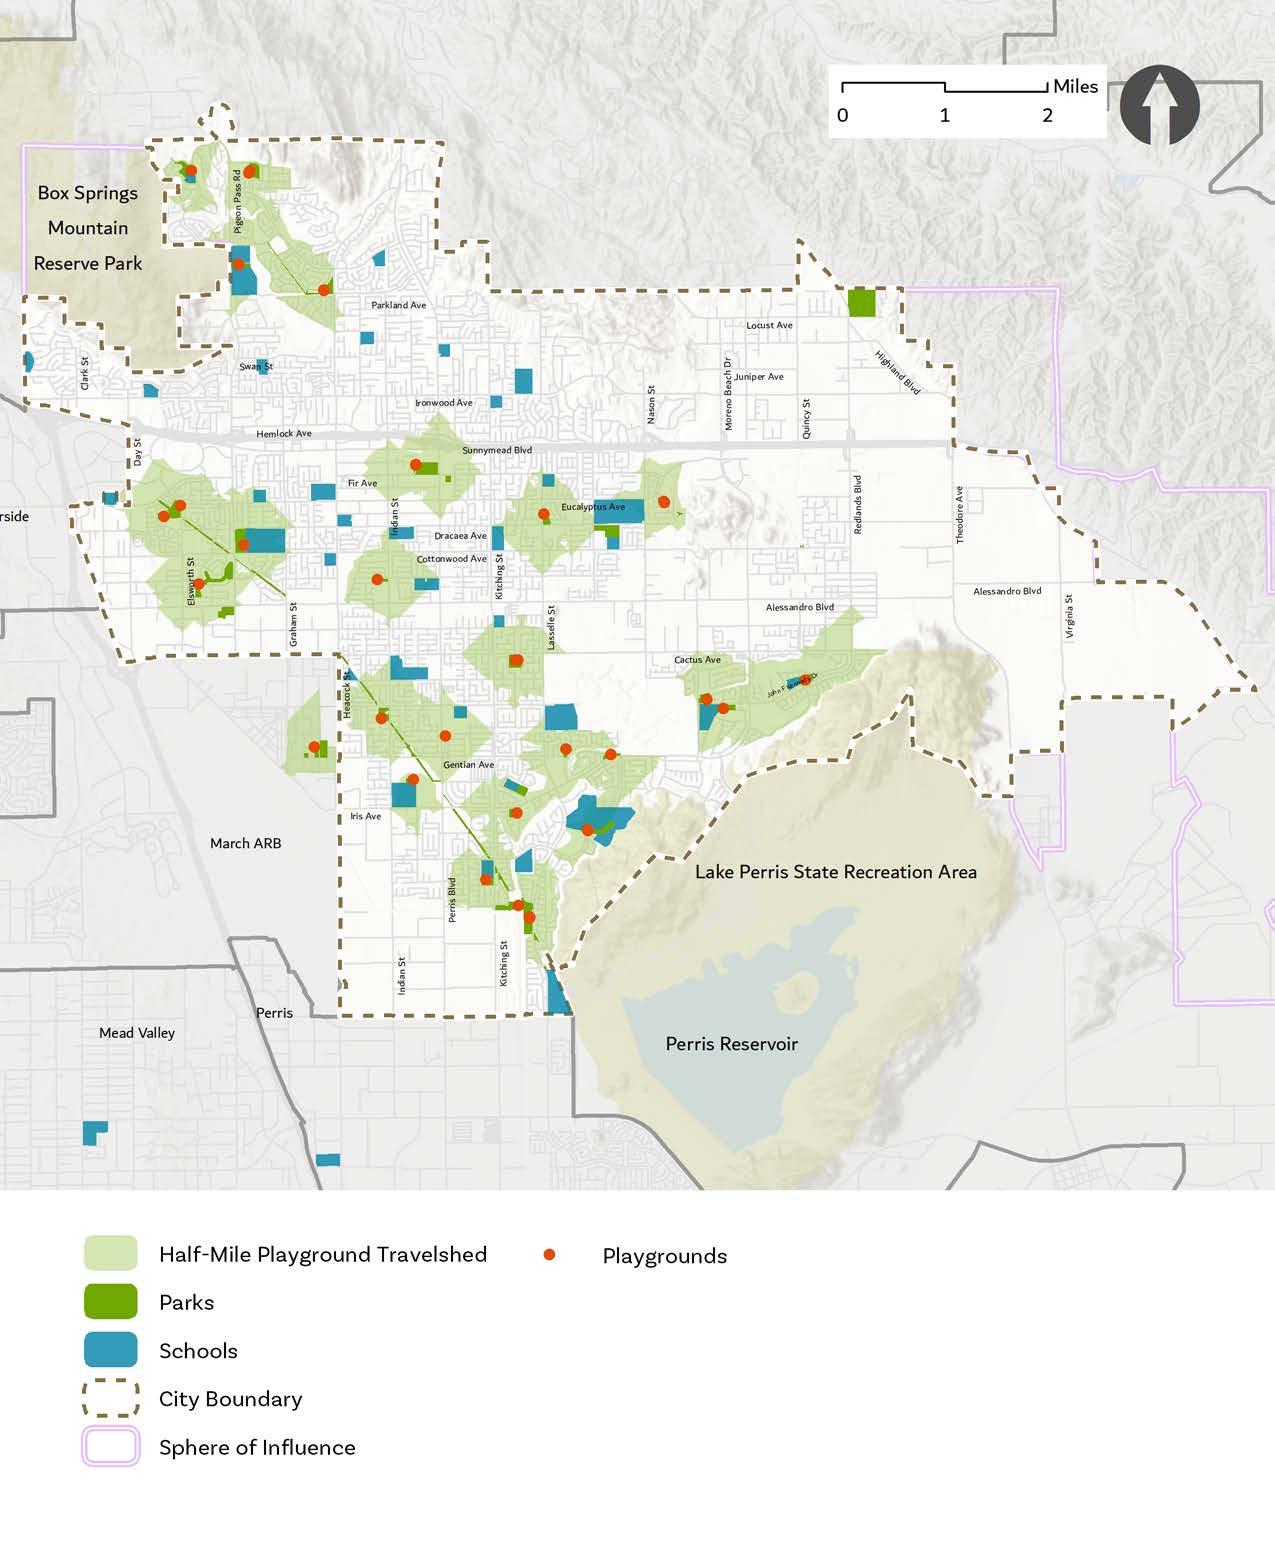
The following series of maps feature park travelsheds that contain specific amenities. These maps illustrate the geographic distribution of amenities across the city.
Figure 2-6 displays the half-mile travelshed of parks with playgrounds. Figure 2-6 illustrates that most parks in the city contain playgrounds and the geographic playground coverage is relatively the same as the park travelshed coverage shown in Figure 2-5. Significant playground gaps exist all throughout the city.
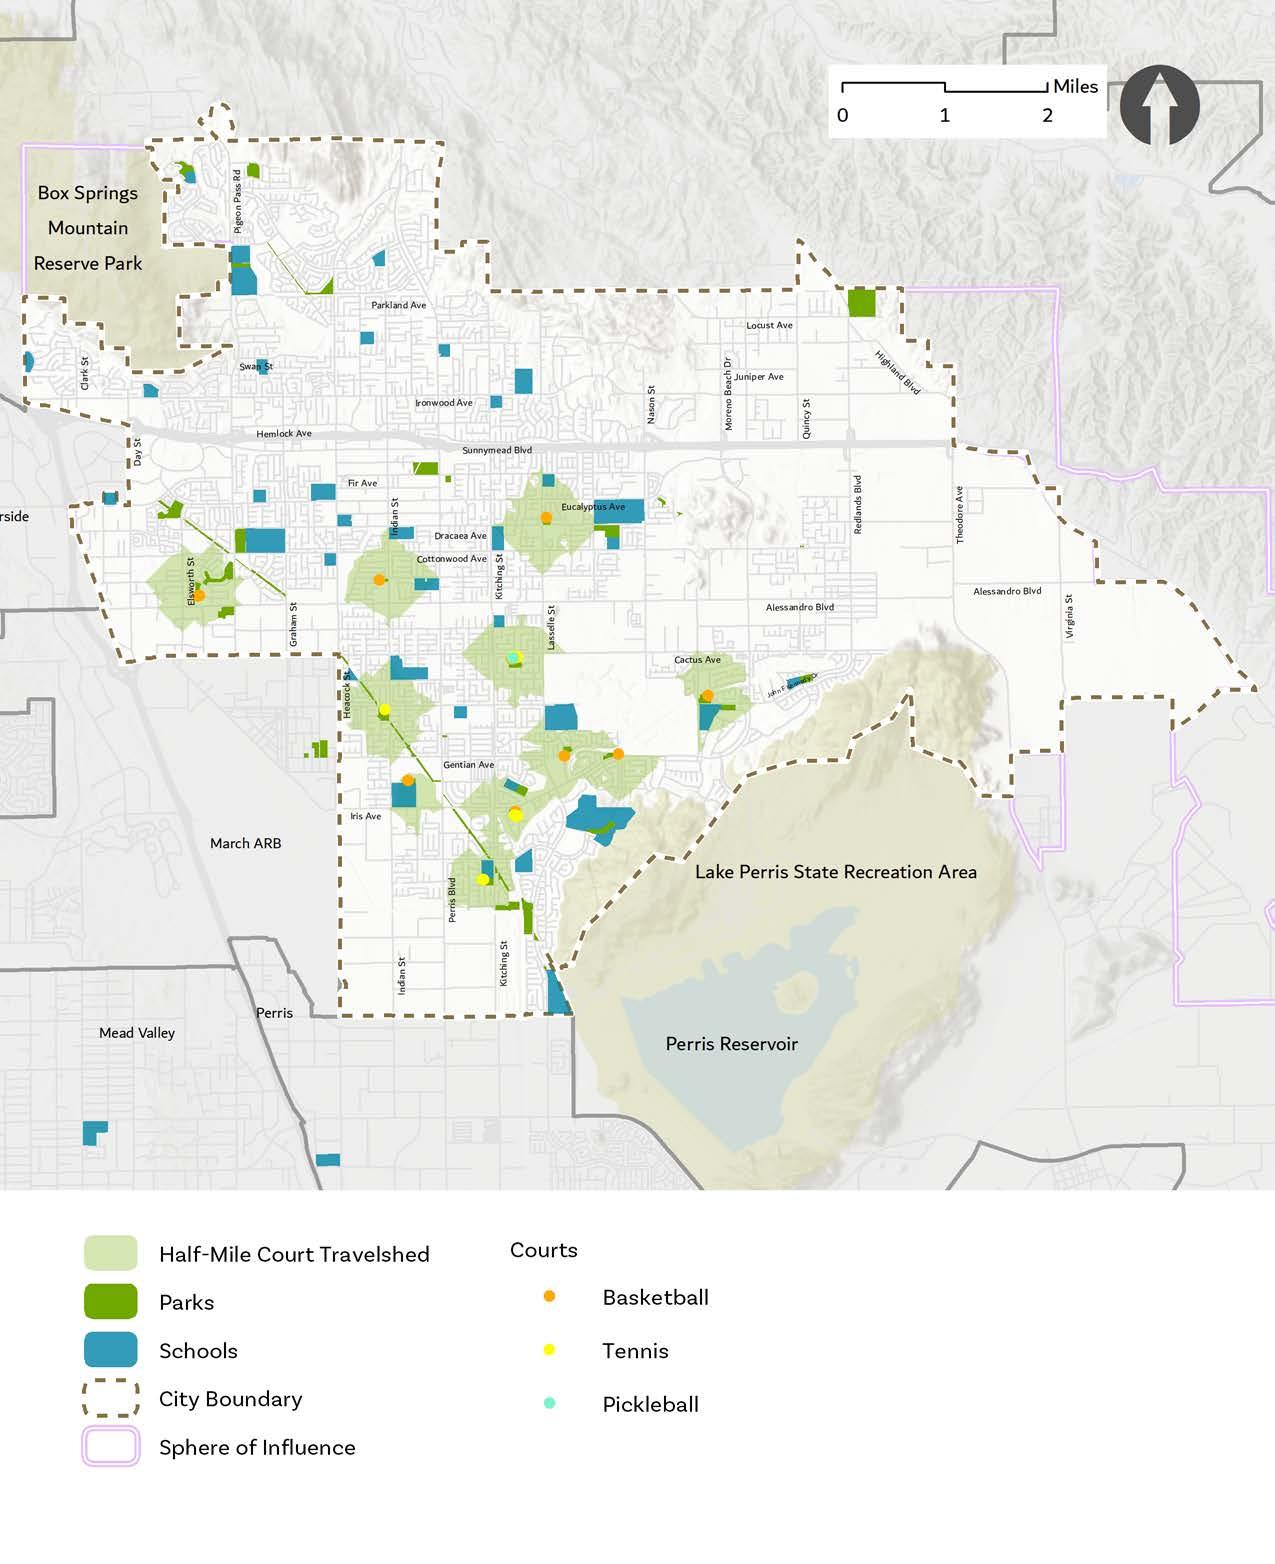
Figure 2-7 shows the half-mile travelshed of parks that contain sport courts. There are many residential areas within the city that do not have sport courts within a half-mile walk. There are gaps all throughout the city, with the most significant gaps north of SR 60 and in the eastern areas of the city.
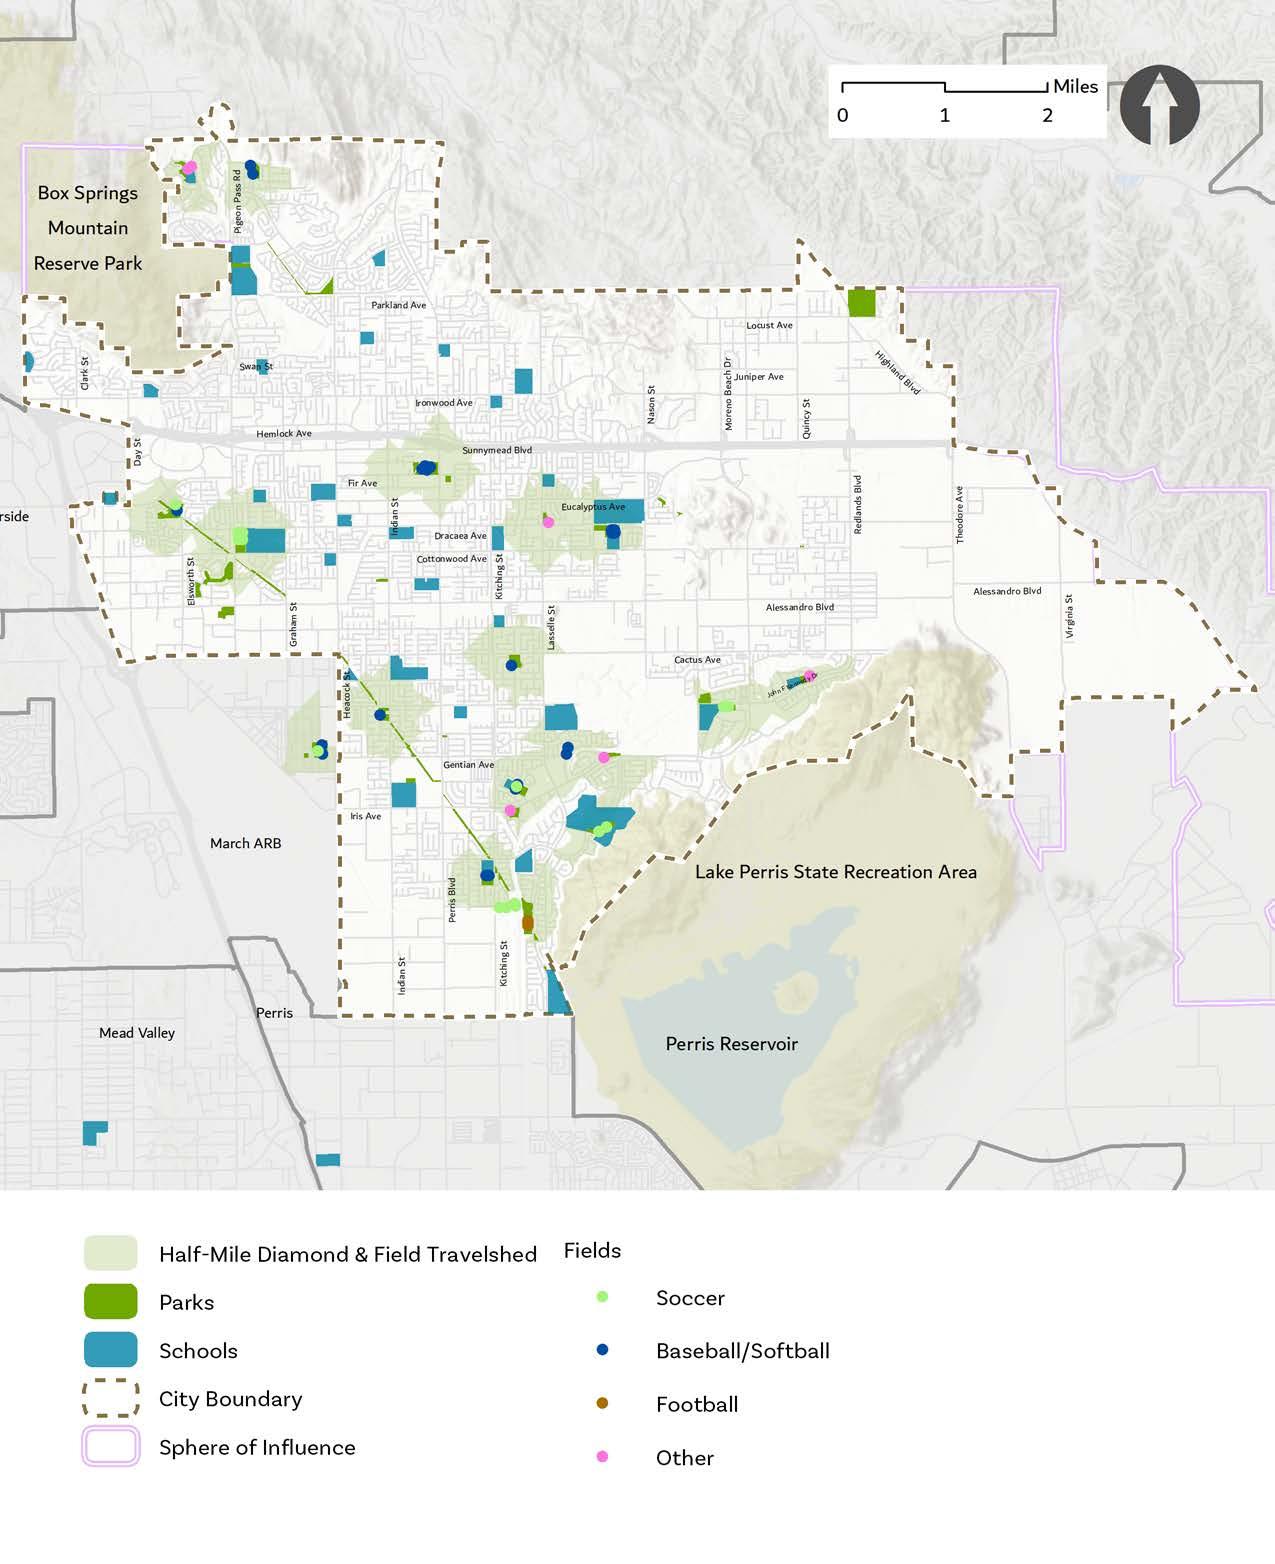
Figure 2-8 shows the half-mile travelshed of parks with sport fields. Figure 2-8 illustrates that there are significant field sport gaps throughout the city, with significant gaps existing in the northern and eastern areas of the city.
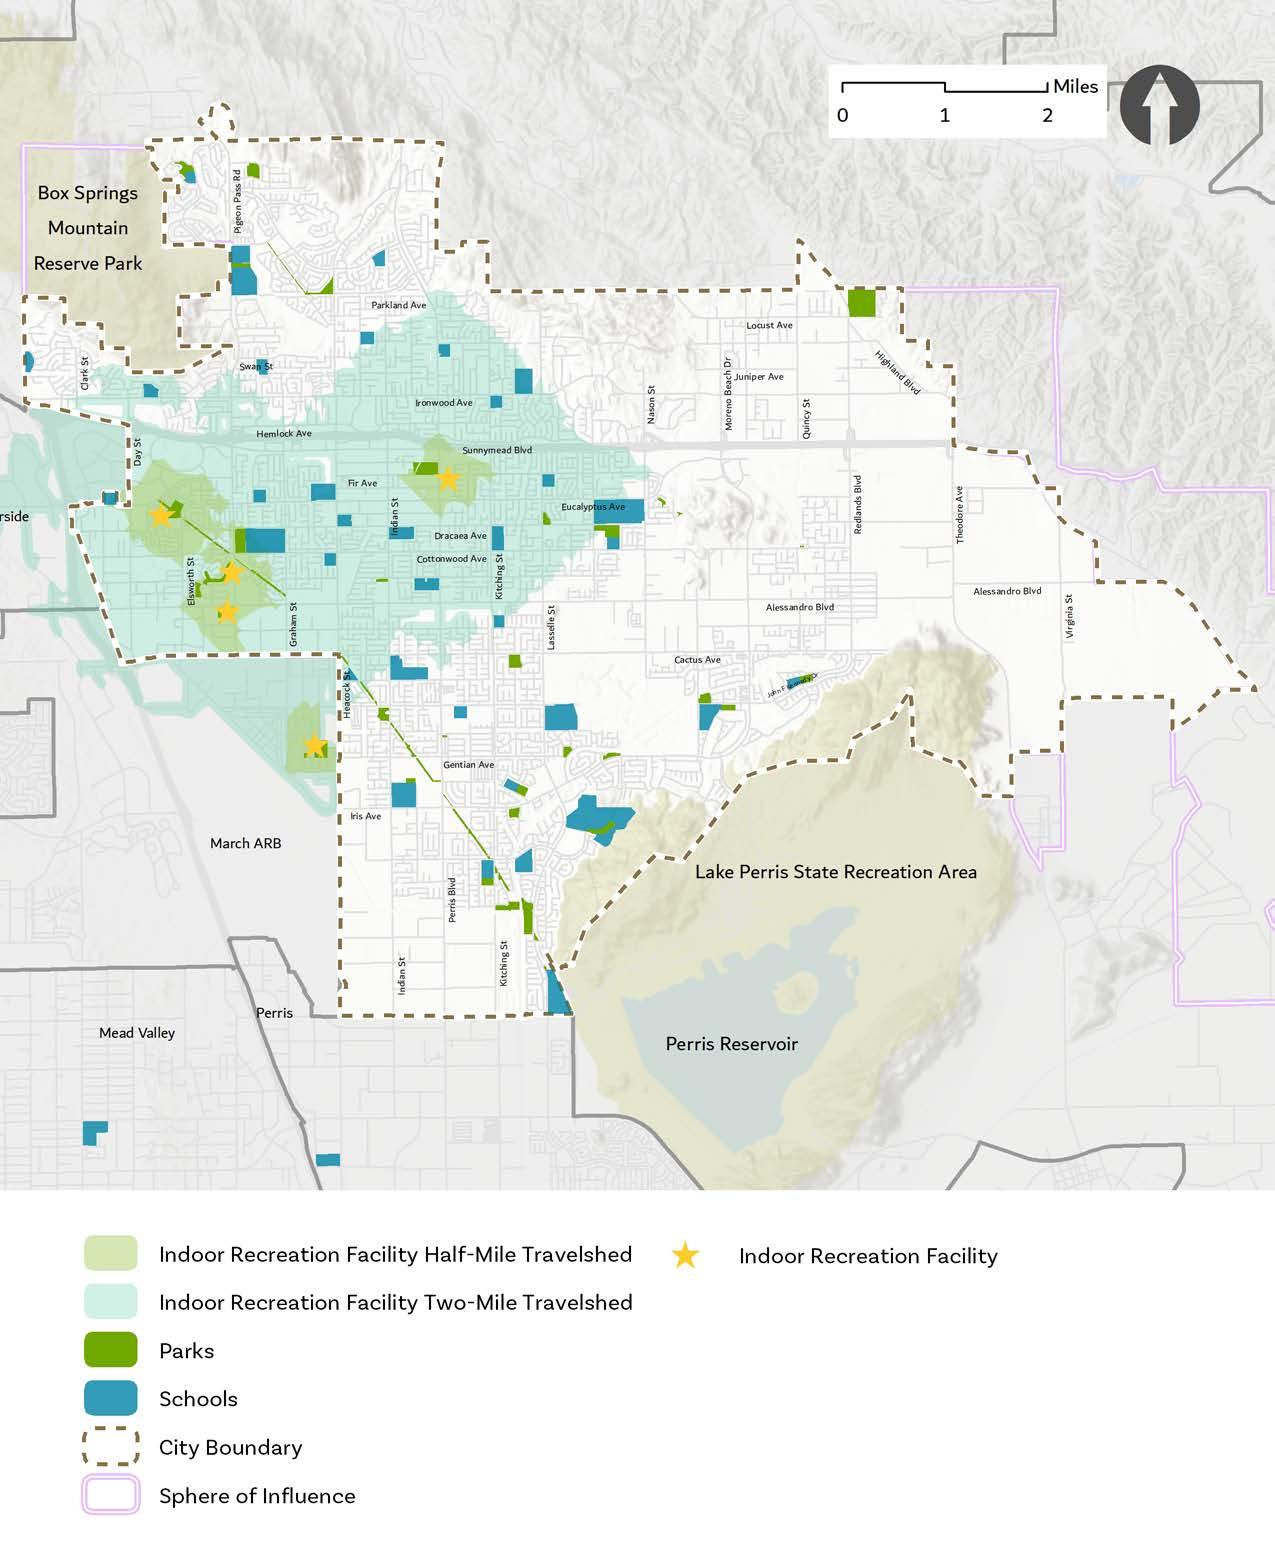
Figure 2-9 shows both half-mile travelsheds and two-mile travelsheds of indoor recreation facilities in the city. Since residents are likely to drive to larger community facilities like a recreation center, two-mile travelsheds were used in this analysis in combination with half-mile travelsheds. Gaps exist in the northern, southern, and eastern areas of the city.
Figure 2-10 shows half-mile and two-mile travelsheds of the trails in the city. Gaps exist in the north-central and eastern areas of the city.
Analyzing how the existing park system is serving the current population is important because it can help determine priority areas within the existing travelshed for new parks or park renovations in the future. It is assumed that these areas of high deficit will continue to worsen in the future as additional development and population growth occurs and no new parks are added to the park system.
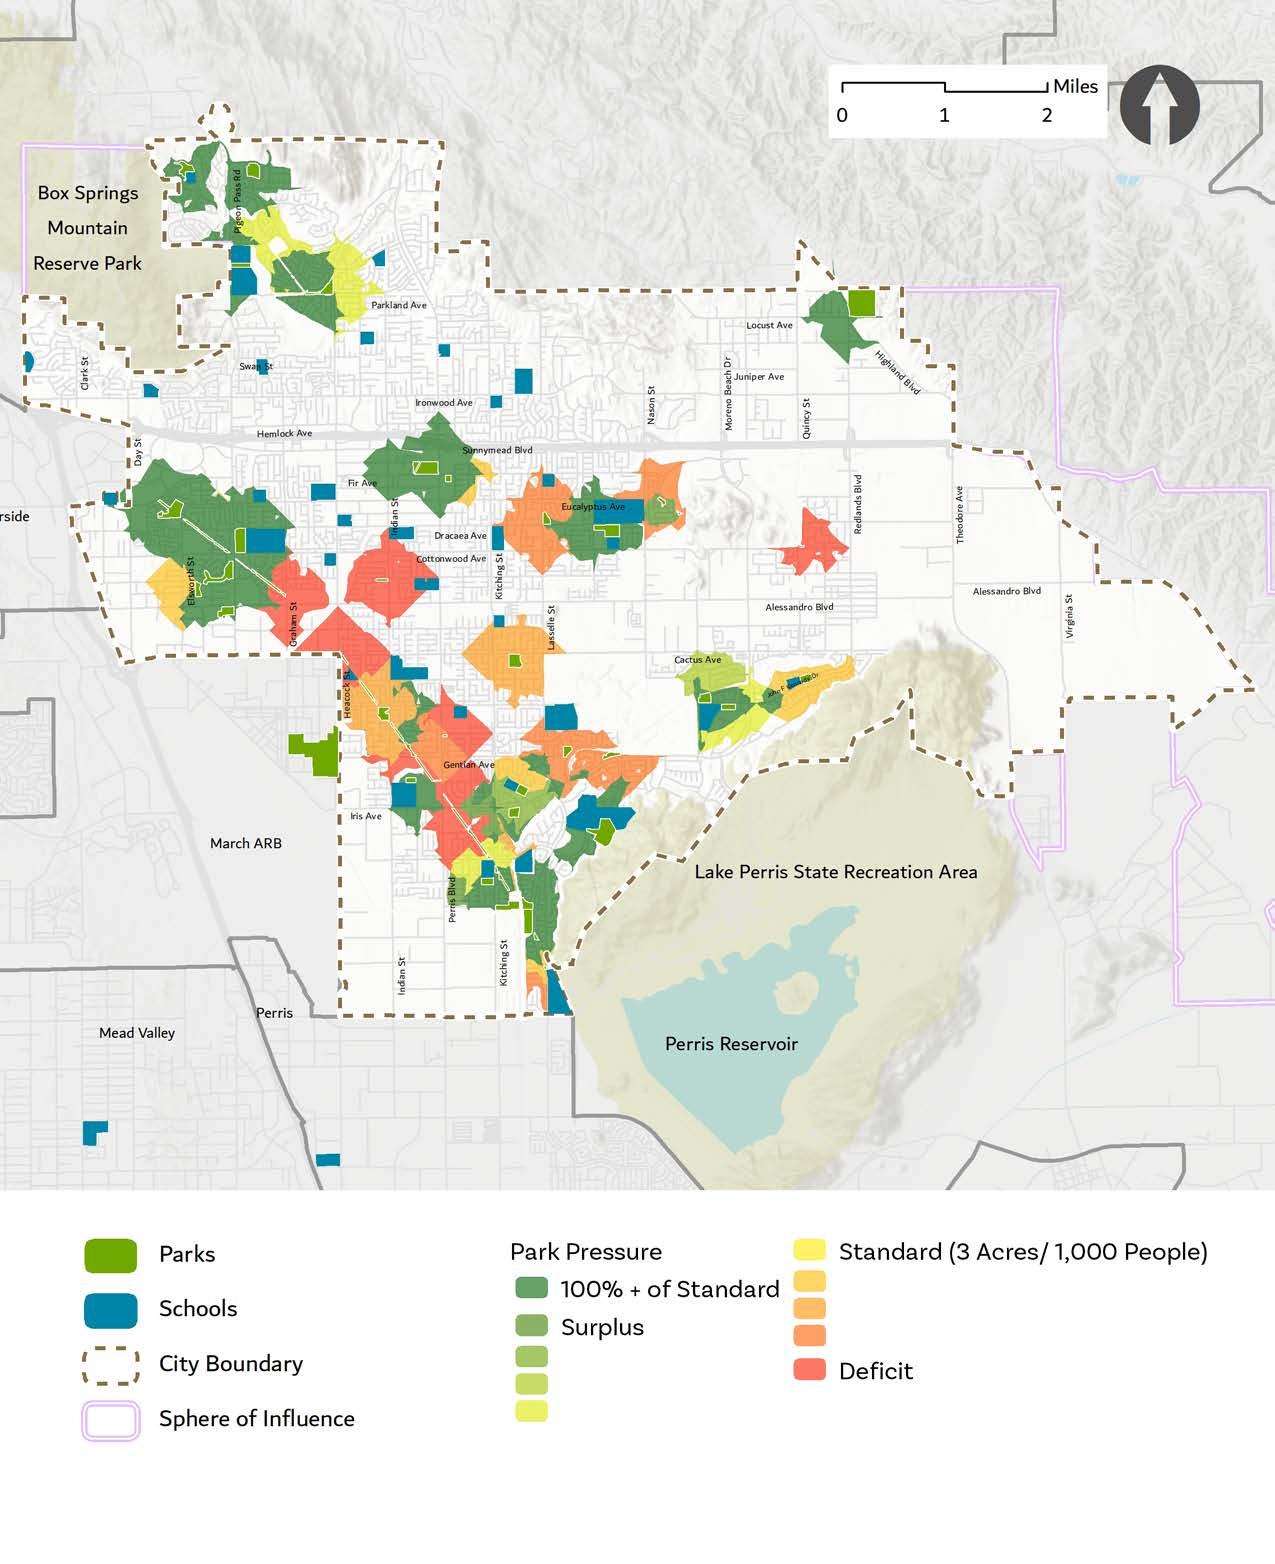
Park pressure is a modeled analysis of park size and accessibility to demonstrate how park usage or “pressure” varies in different parts of the city. Park pressure is based on the residential population density within the half-mile travelsheds of each park. This process assumes that residents use the park that is closest to their home.
Each park centered in a travelshed offers a unique amount of acres per the number of residents in the covered travelshed. The estimated number of potential park users within each travelshed is based on population data from the U.S. Census Bureau. The acreage of each park was used to calculate the number of park acres available per 1,000 residents within the travelshed. The City’s established goal of three park acres per 1,000 residents was used as the basis of the park pressure model, shown in Figure 2-11. Areas may have a surplus of acres per 1,000 residents or a deficit based on the residential density around each park.
1/2-Mile Travelshed of Existing and Planned Parks
2-11: Park Pressure Model Existing Population Density
Standard (3 Acres/1,000 Residents)
Figure 2-12 shows that many park travelsheds in the city fall within the deficit category because they have a large number of residents with fewer park acres available to them. These are shown as the red, orange, and yellow colors. Areas around Bay Side Park, Weston Park, Patriot Park, and Parque Amistad have greater park pressure due to the higher density of residents living nearby. These parks are more likely to experience
heavier demand and use due to the lack of park acres relative to the number of residents living nearby.
The dark to light green areas represent where pressure on the parks is lighter because the parks have a greater acre-to-resident ratio. In other words, bigger parks with fewer residents in close proximity experience less park pressure. Areas around the Juan Bautista Trail, Equestrian and Dog Park, Westbluff Park, Celebration Park, and Fairway Park have less park pressure.
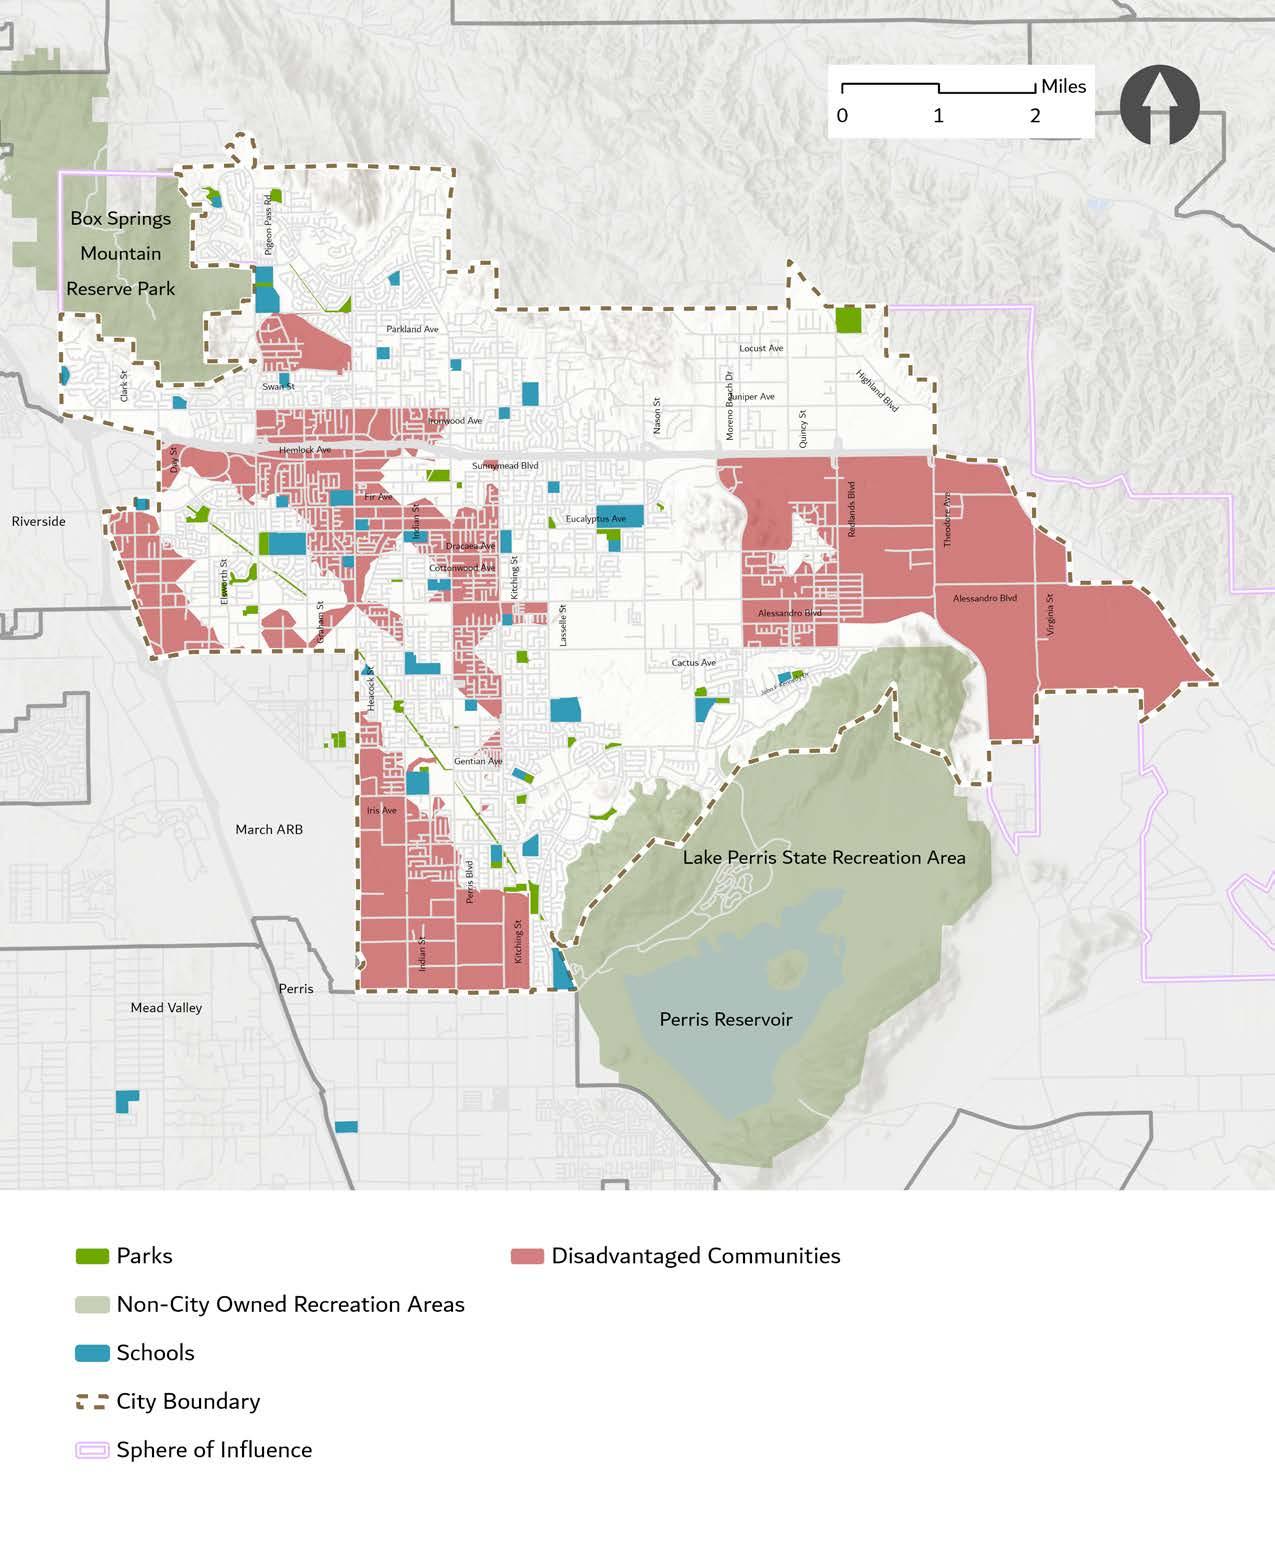
Despite the widespread and well-documented benefits of parks and open spaces to health and well-being, in many cities across the United States, these benefits are not distributed equitably. Studies show that racial and socio-economic factors play a role in the provision, distribution, and quality of parks in many cities across the nation. In 2021, The Trust for Public Land reported that neighborhoods where residents predominantly identify as people of color have access to an average of 44 percent less park acreage than predominantly white neighborhoods, and low-income neighborhoods average 42 percent less park acreage per person than high-income neighborhoods. The Trust for Public Land also revealed that parks in communities of color are, on average, five times more likely to be crowded and half the size of parks that serve white populations. Similarly, parks that primarily serve low-income households are, on average, four times smaller than parks that serve a majority of high-income households. Studies have also shown that in addition to having access to less park acreage, low-income communities and communities of color tend to have access to poorer-quality park spaces with less recreational programming. 1
Recognizing systemic inequities in park access and quality is integral to creating an equitable park and recreation system for Moreno Valley. The City’s General Plan (2021) established goals for addressing community-wide injustices and determined that the City should target investments in public infrastruc-
ture, including recreational facilities and programming to benefit disadvantaged communities in Moreno Valley. Disadvantaged Communities refer to State-identified communities that experience combined high levels of economic, health, and environmental burdens. As displayed in Figure 2-13, Disadvantaged Communities in Moreno Valley are generally concentrated in the more densely populated areas in the western areas of the city, close to the freeways and major transportation corridors.
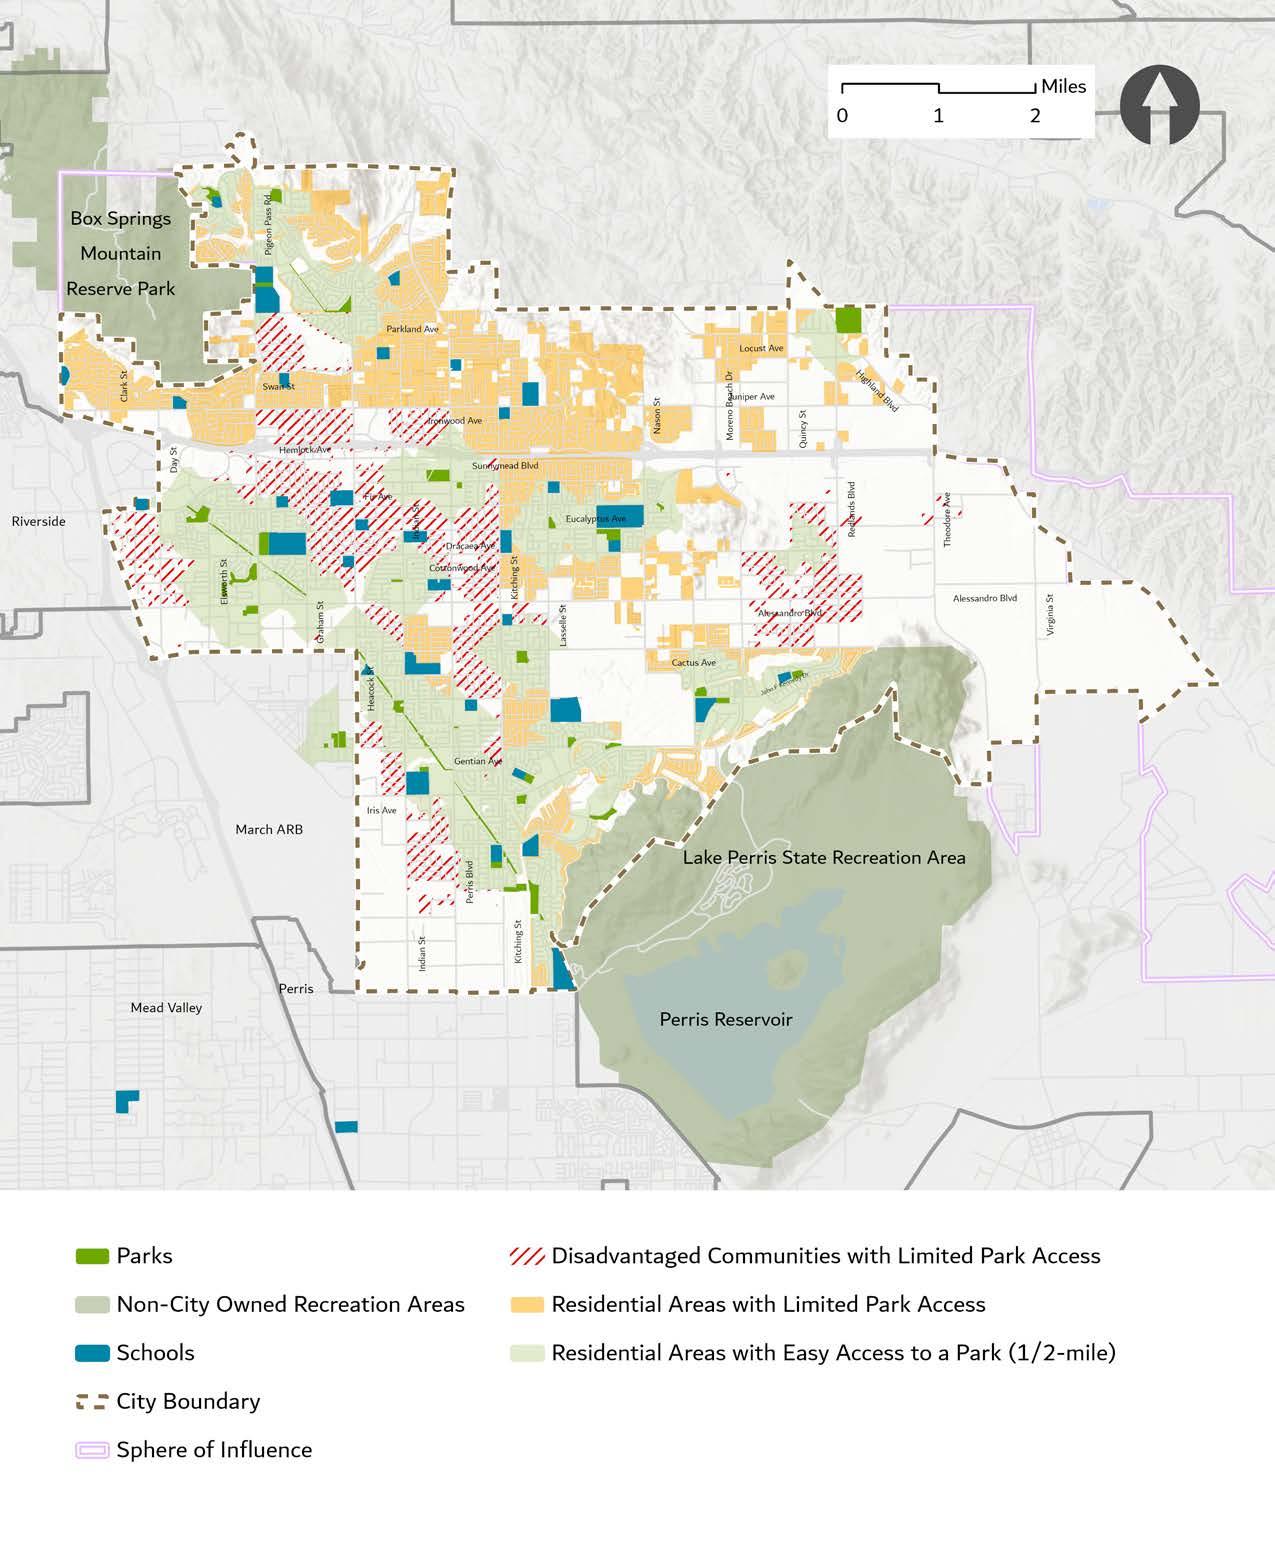
Figure 2-14 highlights areas where residential areas with limited park access overlap with disadvantaged communities. The yellow areas in Figure 2-14 show residential neighborhoods that are not within a half-mile (or walking distance) of a park to demonstrate areas with limited park access. The areas outlined in red show residential neighborhoods with limited park access that are also designated as disadvantaged communities. Figure 2-14 shows that the majority of disadvantaged communities also experience limited park access, indicating that park deficiencies disproportionately affect underserved neighborhoods. To address systemic injustices, invest in Moreno Valley’s disadvantaged communities, and advance City-adopted policies in the General Plan, the areas featured in Figure 2-13 and Figure 2-14 should be prioritized for any park improvement, enhancement, or development projects.
1 PolicyLink. (2021). Advancing Park Equity in California. https://www.policylink.org/sites/default/ files/pl_brief_ca-parks-equity.pdf
The City provides recreational programming through its Parks and Community Services Department in the various recreational facilities and parks it owns. Funding to support programming is primarily from special taxes paid by property owners through the Community Services District, which is one of several established special financing districts in Moreno Valley. The City is one of the largest municipalities in the area and provides a robust recreation program with multiple programming options for residents.
As described earlier in the Chapter, the City has many parks and facilities. Most recreational programming is hosted at one of the four community facilities: Cottonwood Golf Center, Moreno Valley Senior Center, Moreno Valley Conference and Recreation Center, and TownGate Community Center.
Moreno Valley CRC is the primary meeting facility in the City and provides over 42,000 square feet of flexible event and reception space for the community to use. Most non-outdoorsports and non-senior program-
ming is held in the CRC. The CRC is located at the Civic Center in the “downtown” or central government services area of Moreno Valley. The Cottonwood Golf Center, the TownGate Community Center, and the Senior Center are additional recreational facilities used to provide specialized programming for specific demographics or areas. However, due to the large size of Moreno Valley and the limited number of recreational facilities, it is challenging for the City to offer programming close to where many residents live.

The City currently offers various services and programs for youth, adults, families, and seniors, as well as several annual special events. Recreation programs offered by Moreno Valley include:
» After-School Activities (Educational Workshops, Homework Assistance, etc.)
» Time for Tots (Skill Building, Dual Language Learning)
» Online Classes (Art, Coding, Game Design, Guitar, Keyboard)
» Esports
» Dance Classes (Ballet, Folkloric, Hip Hop, Cheerleading, Hula)
» Basketball (Clinics, Open Play, Leagues)
» Day Camp
» Fitness (Adaptive Zumba)
» Martial Arts (Tae Kwon Do, Aikido, Vovinam, etc.)
» Pickleball
» Tennis
» Soccer (Coming in 2024)
» Snow Day Youth Sledding
» Teen Tutoring
» Volleyball
» Basketball (Open Play, League Play)
» Culinary Arts (Cooking with the Trendy)
» Dance Classes (Folkloric, Salsa, Line)
» Fitness (Zumba, Pilates)
» Garden Workshops
» Martial Arts (Karate)
» Pickleball
» Skills and Education (Social Club for Development)
» Volleyball
» Arts & Crafts (Creative Writing, Crochet, Scrapping, Quilting)
» Clubs (Art, Weight Loss Support)
» Dance (Ballet, Dancercise, Line Dancing)
» Fitness (Aerobics, Tai Chi, Yoga, Zumba)
» Game (Bingo, Billiards, etc.)
» Music (Guitar)
» Skills Improvement (CPR, Driving, Notary Services)
» Social Services (Counseling, Housing Assistance, Meals, Transportation)
» Special Events (International Day, Birthday Celebrations, Veterans Day, etc.)
» Adult Flashlight Egg Scramble
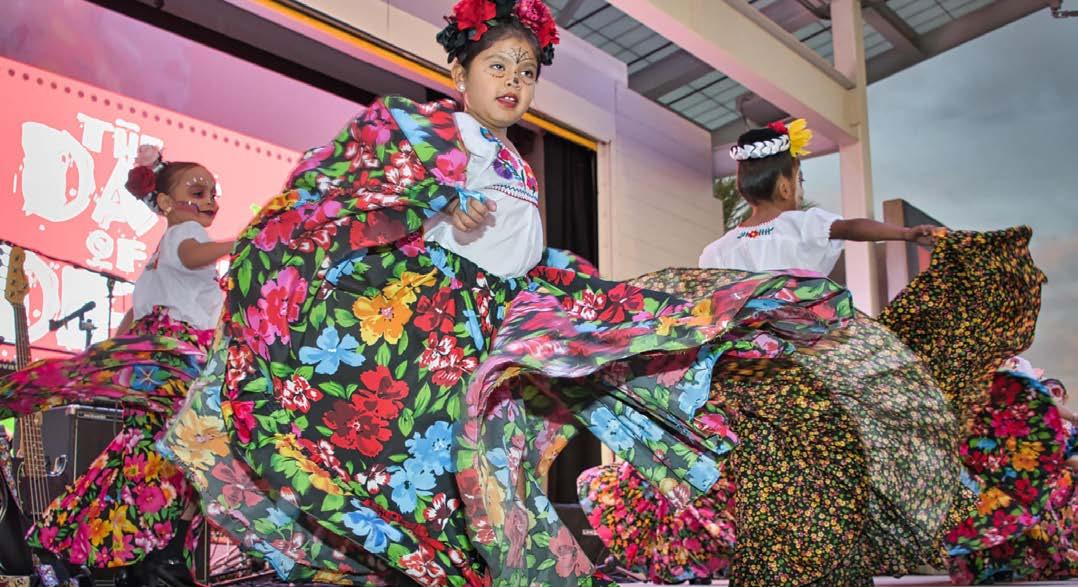
» Day of the Dead
» Earth Day and Tree Giveaway
» El Grito Festival
» Fun Color Run
» Holiday Tree Lighting
» Independence Day
» Juneteenth
» MoVal Movies
» MoVal Rocks!
» Multicultural Festival
» Public Safety Expo
» Snow Day
» Springtastic
» Veterans Day Ceremony and Art Contest
Tracking the most popular recreation programs currently offered by the City provides critical insights into program successes and areas for improvement. Table 2-5 displays the top 15 recreation programs based on registration totals for 2022. In 2022, the most popular programs were: Winter Youth and Teen Basketball Leagues, Shito-Ryu Youth Karate, and Time for Tots.
Program registrations were also analyzed to determine which programs met or exceeded registration capacity. This analysis evaluates program success based on the desired number of attendees compared to the actual number registered. In recreation, the ideal number of program participants varies by program type, such as a summer camp with hundreds of participants, or an art class with 10 to 20 participants. As such, a percentage fill rate is a more insightful method to evaluate program success because it is based on more than total registration numbers alone.
Table 2-6 lists the programs that, on average, had a registration percentage that exceeded the expected capacity in 2022. Programs over 100 percent capacity are highly anticipated and enjoyed by the community. Top programs include dance programs, youth and teen basketball, day camps, cheerleading programs, and art programs. To meet community demand, the City should continue offering and consider adding more sessions of programs that continually meet or exceed capacity.
TAbLE 2-6: Recreation Programs Over 100% of Capacity in 2022
*Note: Some programs are offered multiple times per year and have different registration totals each season. These programs are shown per program offering rather than as an aggregate of all offerings of the same program and may be listed in Tables 2-5 through 2-7 multiple times.
Table 2-7 displays programs with registrations between 75 and 100 percent of the program capacity. While the programs listed in Table 2-7 did not exceed full capacity, they are still achieving high levels of success and should continue to be provided, but do not require expansion at this time. Programs in this category included preschool programs, dance, martial arts, food rallies, day camps, and basketball clinics.
PROGRAM
Time 4 Tots - CRC AM - February
Dance Exploration - November
Youth Shito-Ryu Karate
Youth Art Expression
Springtastic Food Vendor
Valley Day Camp - June (ages 11-14)
Valley Day Camp - July (ages 7-8)
Valley Day Camp - June (ages 9-10)
Youth Shito-Ryu Karate - October
Junior Basketball Clinic
Pee Wee Basketball Clinic
Pee Wee Basketball League
Ballet/Acro - September
2 Person, 2 Club, Partner
Time 4 Tots - CRC AM - March
Winter Youth and Teen Basketball Clinic - Nov
Cheerleading
Youth and Teen
Valley Day Camp - July (ages 11-14)
Valley Day Camp - June (ages 7-8 year)
Valley Day Camp - July (ages 9-10)
Ballet/Acro - October
Soccer (Pee Wee T/TH)
CYSC All Stars Cheer 93%
Youth Shito-Ryu Karate – November 93%
Youth Shito-Ryu Karate – December 93%
Valley Day Camp - July (ages 5-6)*
Winter Youth and Teen Basketball Clinic (Dec-Feb)
Cooking with the Trendy
CYSC All Stars Cheer
Valley Day Camp - June (ages 11-14)*
Valley Day Camp - August (ages 11-14) 90%
Valley Day Camp - June (ages 11-14)* 90%
Valley Day Camp - July (ages 7-8) 90%
Time 4 Tots - CRC AM - January
Summer Youth and Teen Basketball
Valley Day Camp - July (ages 7-8) 85%
Summer Time 4 Tots 85%
Beginning Ballet for Kids - June 85%
Valley Day Camp - July (ages 5-6) 83%
Winter Youth and Teen 83% Dance Exploration - March 82% Day of the Dead - Food 82%
Valley Day Camp - July (ages 5-6)* 80%
Valley Day Camp - July (ages 7-8) 80%
Valley Day Camp - July (ages 9-10) 80%
Valley Day Camp - August (ages 9-10) 80%
Ballet/Acro - August 80%
Summer Time 4 Tots 80%
Beginning Ballet for Kids - May 80% Day of the Dead Retail 80%
Soccer (Junior M/W) 78%
Time 4 Tots - CRC AM 77%
Time 4 Tots - TownGate 77%
Beginning Ballet for Kids - August 75%
Ballet/Acro - July 75%
Public Safety Expo Food 75%
Summer Time 4 Tots 75%
Beginning Ballet for Kids - July 75%
Art Expression 75%
*Note: Program listed twice because this program is offered at multiple weeks during the month
Based on an analysis of recreational programming data for Moreno Valley in 2022, the programs with the highest interest and participation from community members are:
» Youth sports (specifically basketball and cheerleading)
» Dance classes (Ballet and Exploration Classes)
» Youth camps (Day Camps and Summer Camps)
» Toddler programs
» Martial arts (Shito-Ryu Karate)
» Special events
Currently, these programs are the most successful and should continue to be provided to the community and considered for future expansion, as needed. Additionally, community feedback indicates that there is high interest in expanding sports, teen, and gardening programs in Moreno Valley.
The City offers several youth and adult recreational sports leagues. These include basketball, t-ball, soccer, and softball for various age groups. These leagues are all included in the City’s programming options for the year, and as previously shown, are typically some of the largest attended programs provided by the City. Beginning in Fall 2023, the City will also be offering youth golf classes, which will teach participants the basics of the sport.
There is an interest in expanding the City’s teen programs to increase interest and participation. The City already provides many teen programs and is actively working to attract more participants. However, because most of these programs are hosted in the CRC, they are hard for many teens to access due to transportation barriers. Providing additional satellite locations for teen programming and/or offering transportation options would make programs more accessible to teens and boost participation.
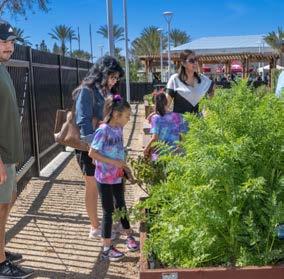
The City’s Community Demonstration Garden hosts programs that teach gardening skills and best practices. Community feedback indicates a growing interest in broadening the programming provided at the Community Demonstration Garden and expanding the types of gardening practiced on site to and creating additional demonstration gardens to other areas in Moreno Valley.
The NRPA has published an Agency Performance Review that documents programming offered by parks and recreation agencies across the country. The results of the review included the percentage of agencies that perform specific types of programs. The examples provided show various programs that fall under each category. The data includes agencies of all sizes in various regions to illustrate that the City is providing elements of programming that are popular in agencies across the country. With the exception of aquatics and safety training, the City offers all of the program categories to Moreno Valley residents.
» Themed special events (offered by 90 percent of comparable agencies)
» Earth Day, Flag Day Parade
» Social recreation events (offered by 88 percent of comparable agencies)
» Card games, dances
» Team sports (offered by 87 percent of comparable agencies)
» Basketball, Soccer, and Cheerleading Camps
» Fitness enhancement classes (offered by 82 percent of comparable agencies)
» Yoga, Zumba
» Health and wellness education (offered by 80 percent of comparable agencies)
» Nutrition classes, mental health classes
» Individual sports (offered by 76 percent of comparable agencies)
» Karate, gymnastics
» Safety training (offered by 72 percent of comparable agencies)
» CPR, pedestrian safety
» Racquet sports (offered by 71 percent of comparable agencies)
» Tennis, pickleball
» Aquatics (offered by 70 percent of comparable agencies)
» Learn to swim programs, aquatic fitness
A review and analysis of the City’s recreation programming and staffing was conducted to compare the City to nationwide data collected in the NRPA Agency Performance Review.
» Nationwide Programming Assessment: The City’s recreation programming was compared to nationwide recreation programming data to assess if major programming areas commonly provided across the nation are offered in Moreno Valley.
» The general programming analysis compares general programming areas, such as team sports, special events, and aquatics, based on a set of variables, designed through NRPA’s research, to compare communities of similar size. These variables are park acres, number of parks, population, and region. This assessment allows an ‘apples to apples’ comparison between Moreno Valley and similarly sized communities.
» The specific programming analysis is very similar to the general programming analysis, but with a deeper dive into types of programming. This table compares specific types of programming, such as Science, Technology, Engineering, and Mathematics (STEM), summer camps, and specific senior programming.
» Regional Programming Comparison: In addition to a nationwide programming assessment, a regional programming comparison was conducted to compare the City’s program offerings to local agencies in the same region.
An assessment was conducted using NRPA Agency Performance Data to compare Moreno Valley’s general and specific program offerings to the offerings provided by other parks and recreation agencies. To facilitate a fair comparison, the agencies included in the assessment have a similar number of parks, park acreage, and population as Moreno Valley.
Table 2-8 lists the general programming types included in the NRPA Agency Performance Review and shows which programs are provided by the City alongside the percentage of comparable communities that provide the same program and is broken down by several variables. The general programming analysis shows that the City compares favorably to most entities with similar circumstances. However, the City does not currently provide aquatics or safety training programs, like some other comparable agencies. Aquatics programs are not provided due to a lack of aquatic facilities owned or utilized by the City. Aquatics programs require specialized facilities, such as a pool or aquatic center, which the City currently does not have, or strategic partnerships with an entity that does. The City can consider finding qualified instructors to provide safety training programs for the community.
Table 2-9 displays an analysis that compares specific programming provided by the City to comparable national entities. The analysis shows that the City provides the majority of specific programs geared towards youth, adults, and seniors, including summer camps, which are one of the most popular programs provided across the nation. The only specific program not provided by the City is full daycare, which is rarely provided by agencies with similar circumstances to the City.
Table 2-8 & Table 2-9
Look at the row for “Themed Special Events” as an example. Themed special events are provided by 92 percent of communities with similar park acreage, 93 percent of communities with a similar population size, 93 percent of communities with a similar number of parks, and 94 percent of communities in the same region as Moreno Valley. 90 percent is the average percentage of these four variables and provides a comprehensive look at the percentage of communities similar to Moreno Valley that provide themed special events. The check mark under Moreno Valley indicates that the City provides themed special events.
TAbLE 2-8: General Programming Analysis based on NRPA Agency Performance Data
TAbLE 2-9: Specific Programming Analysis based on NRPA Agency Performance Data
Table 2-10 summarizes the types of classes or programs provided by the City compared to similar local agencies. This listing is based on a review of current recreation program guides. Additional programs listed outside of each agency’s recreation program guides may be offered, but are not captured in this analysis.
In comparison to similar communities nearby, the City provides a diverse offering of programming activities that compares well to the types of programs offered in neighboring jurisdictions. For example, Moreno Valley offers programming that is not provided by most neighboring jurisdictions, such as adaptive and inclusive programs for persons with disabilities and virtual programs that can be attended remotely or from home.
As mentioned previously, one area that the City could improve is the provision of aquatics programming, which would require the construction of a new specialized facility or a partnership with another entity with an aquatic facility. An aquatic facility would require a feasibility study to determine community interest and desire for an aquatics facility, and if community demand is high enough, a decision to invest in the development.
The City currently has 74 fulltime equivalent (FTE) staff in the Parks and Community Services Department. This includes divisions for Parks and Landscape Maintenance, Community Services (recreation), Special Events and Facilities (including sports), and Administration and Financial Services. For the purposes of programming, there are 28 FTEs with a focus on programming in the Community Services and Special Events Division.
In the analysis of programming for the City’s parks and recre-
ation program, staffing levels were reviewed to determine if current program staffing meets established industry standards. The NRPA Agency Performance Review was used as the basis for the analysis. This analysis reviews parks and recreation agencies nationally and provides data sets based on qualifiers such as population and park acreage. This dataset is based on staffing percentages and total staffing in parks and recreation departments in a geographic region.
Using this data, comparable cities have between 42.78 (lowest quartile of agencies) and 144.15 (highest quartile of agencies)
FTE staff in their parks and recreation departments. Within this same dataset, there are between 14 (lowest quartile of agencies) and 47 (highest quartile of agencies) FTE staff dedicated to programming activities. Specific staffing levels are primarily dictated by the type and number of programs offered and must be continually adjusted to address programming modifications. The current programming staffing is within average staffing requirements for programming of similar parks and recreation agencies.
The City has budgeted approximately $10.5 million for recreational activities, which translates to $50.40 per capita. The City’s primary sources of revenue for Parks and Recreation are:
» User Fees: These are fees charged by the Department for specific classes, programs, camps, and rentals offered within Moreno Valley. These generally help to fund employees, contract instructors, and basic program materials and supplies.
» Special Financing Districts: The City has several special financing districts, including Community Services Districts (CSDs) and Community Facilities Districts (CFDs). CSDs and CFDs are specialized limited funding sources that help pay for initial and ongoing costs for recreation and maintenance needs based upon a specific assessment amount. These districts are specifically assessed to residents of a specific geographic area and are only applicable to parks and recreation needs within that geographic area.
» Tax Revenue: This refers to property and sales tax revenue that is used to supplement funding that is not covered by the items aforementioned. It can be used for operations, staffing, and infrastructure as needed.
» Grants, Sponsorships, and Donations: This refers to grant funding, sponsorships, or direct donations provided to the Department to help fund specific programs or activities. These are not consistent annual streams, but typically more program or activity-generated revenue streams.
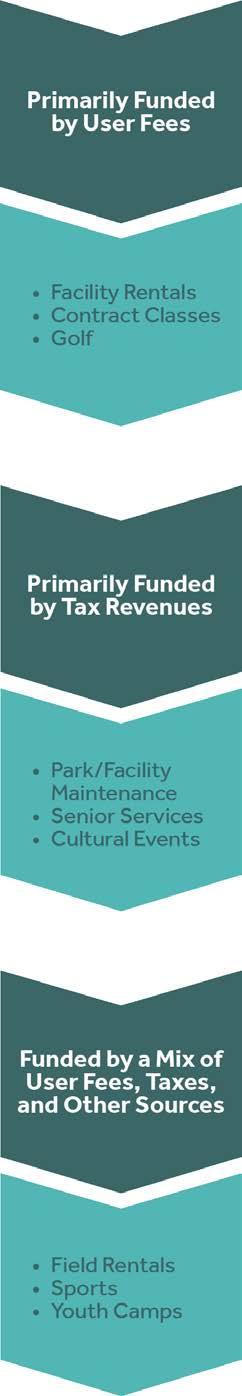
Together these revenue streams help fund the Department. The Department charges fees for a variety of services – youth sports, adult sports, golf, senior activities, and facility rentals. Figure 2-15 shows the types of revenue streams by major service areas that can help fund various services and programs.
As shown in Figure 2-15, more specific functional areas, such as contracted classes or facility rentals, can generally be user fee funded, whereas more community service-based programs, such as sports activities or youth camps, are funded by a mix of sources. While other services, such as cultural events or senior services, are primarily funded by tax revenues.
As the City continues to offer different programs, programming revenues should be evaluated on a program-by-program basis. Table 2-11 displays total revenues, expenditures, differences between revenues and expenditures, and the cost recovery percentages for each major spending category.
Overall, the City is only recovering approximately 18 percent of its costs or, in other words, under-recovering its costs by approximately $8.7 million. Cost recovery and deficit vary by program area. For example, some areas have a higher cost recovery, such as Golf at 41 percent and Sports Programs at 78 percent, while other areas have low-cost recovery such as Community Events at 2 percent and Community Services at 3 percent. Maintenance activities typically are very low-cost recovery because revenues are not related to services provided.
The City has a detailed fee schedule and structure based on resident and non-resident rates, as well as extensive rental rates. While the City updated its fees in 2023, it should regularly review the fee structure to ensure that fees reflect the current program and rental facility popularity.
In addition to annual operating needs, the Department has a robust capital program dedicated to building new facilities and expanding and improving existing facilities. Capital projects are funded through CFDs, which are more project or geographic-specific. CFDs can help pay for both initial infrastructure costs, as well as the ongoing maintenance and operations of those facilities within the area.
Taxes and grants, along with sponsorships and donations, help fill the funding gaps needed for both operations and capital projects. While tax revenue is typically not restricted, grants and sponsorships, along with donations can be specific to programs and/or specific activity types. The City has done its best to utilize grant funding and donations to help offer programs. The City should continue to explore these opportunities and utilize alternative funding sources as appropriate.
Recreation program trends can vary over time and may be influenced by changes in societal preferences, technology, and other factors. While the City already offers a diverse range of recreation programming, as trends continue to change over time, the City should continue to remain open to new concepts and adapt recreation programming to meet evolving community desires.
The 2023 Sports, Fitness, and Leisure Activities Topline Participation Report from the Sports and Fitness Industry Association (SFIA) highlights national recreation trends. The report indicates that participation in recreational activities in the U.S. has increased for the fifth consecutive year, rising 9.2 percent from 2017 and 1.9 percent from 2021. During 2022, 77.6 percent (236.9 million people) of United States residents participated in at least one recreational activity, roughly 20 million more people than in 2017. Now more than ever, people are prioritizing recreational activity and bouncing back from all-time lows recorded before the COVID-19 pandemic.
The number of totally inactive people decreased for the fourth consecutive year with 22.4 percent (68.6 million people) of United States residents being inactive. Inactivity in every single age group decreased, except for 18 to 24-year-olds and 25 to 34-year-olds, likely due to life changes brought on by the COVID-19 pandemic, like enrolling in college and having children. Similarly, inactivity rates
for every income level decreased by more than 3 percent in 2022, indicating that people are investing more in physical activity more than in previous years.
» Pickleball continued to be the fastest-growing sport in America with participation almost doubling in 2022.
» Trail running and day hiking participation increased for the fifth consecutive year.
» Every racquet sport increased its participation from the previous year for the first time since 2015.
» Golf and tennis continue to maintain momentum with 9.7 and 4.3 percent participation increases in 2022, respectively. Both sports have grown over 20 percent since 2019.
» Basketball, soccer (outdoor), football (flag), and football (tackle) all saw three-year total participation increases of over 4.5 percent with basketball seeing the highest threeyear increase of 13.0 percent.
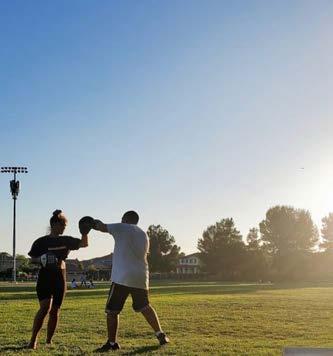
» Personal combat sports like martial arts, boxing for fitness, MMA for competition, MMA for fitness, and wrestling all posted participation increases in 2022.
» Barre and Pilates showed solid participation increases in 2022, while yoga decreased for the first time in the last decade. All have strong threeyear participation increases with yoga and Pilates increasing over 10 percent in the last three years.
» Camping, fishing, and bicycling activities recovered to 2020 participation levels after showing slight decreases in 2021.
» Group fitness-based activities continued to struggle, but showed some signs of recovery with boot camp style training, cardio kickboxing, and stationary cycling (group) experiencing participation increases in 2022.
» Health club-based activities continued to struggle. Elliptical motion/cross-trainer, stair-climbing machine, stationary cycling (recumbent/ upright), and weight resistance machines all had participation decreases last year, and are down over 10 percent compared to 2019 numbers.
» Most team sports displayed a significant decrease in regular/consistent participants while seeing significant increases in casual participation. Outdoor soccer was the only team sport that saw a participation increase in regular/consistent and casual participants.
See Table 2-12 to Table 2-17 for a closer look at national trends in the following areas:
» Fitness Sports Trends
» Team Sports Trends
» Individual Sports Trends
» Racquet Sport Trends
» Outdoor Activity Trends
» Winter Sports Trends
Activity participation and preferences tend to vary based on several demographic factors, but can also differ based on generational preferences. Figure 2-16 displays three-year participation categories across different generations. Overall, the top two most participated activity categories for every generation were fitness and outdoor sports.
At the peak of their careers and raising families, Gen X had the biggest participation increases in racquet, water, and team sports. Programming additional sports leagues would bring benefits to this age group.
Gen Z is a tech-savvy generation with diverse interests. Gen Z participation increased the most in water and racquet sports, while overall participation in team sports is higher than all other generations.
Enjoying retirement, they are looking for opportunities in fitness, sports, outdoor activities, cultural events, and other activities that suit their lifestyles. In particular, Baby Boomers lead all other generations in increased participation in racquet sports.
Millennials are a social and driven group with an interest in balancing wealth, work, and play. Similar to Gen X, Millennial participation increased the most in water, racquet, and team sports.
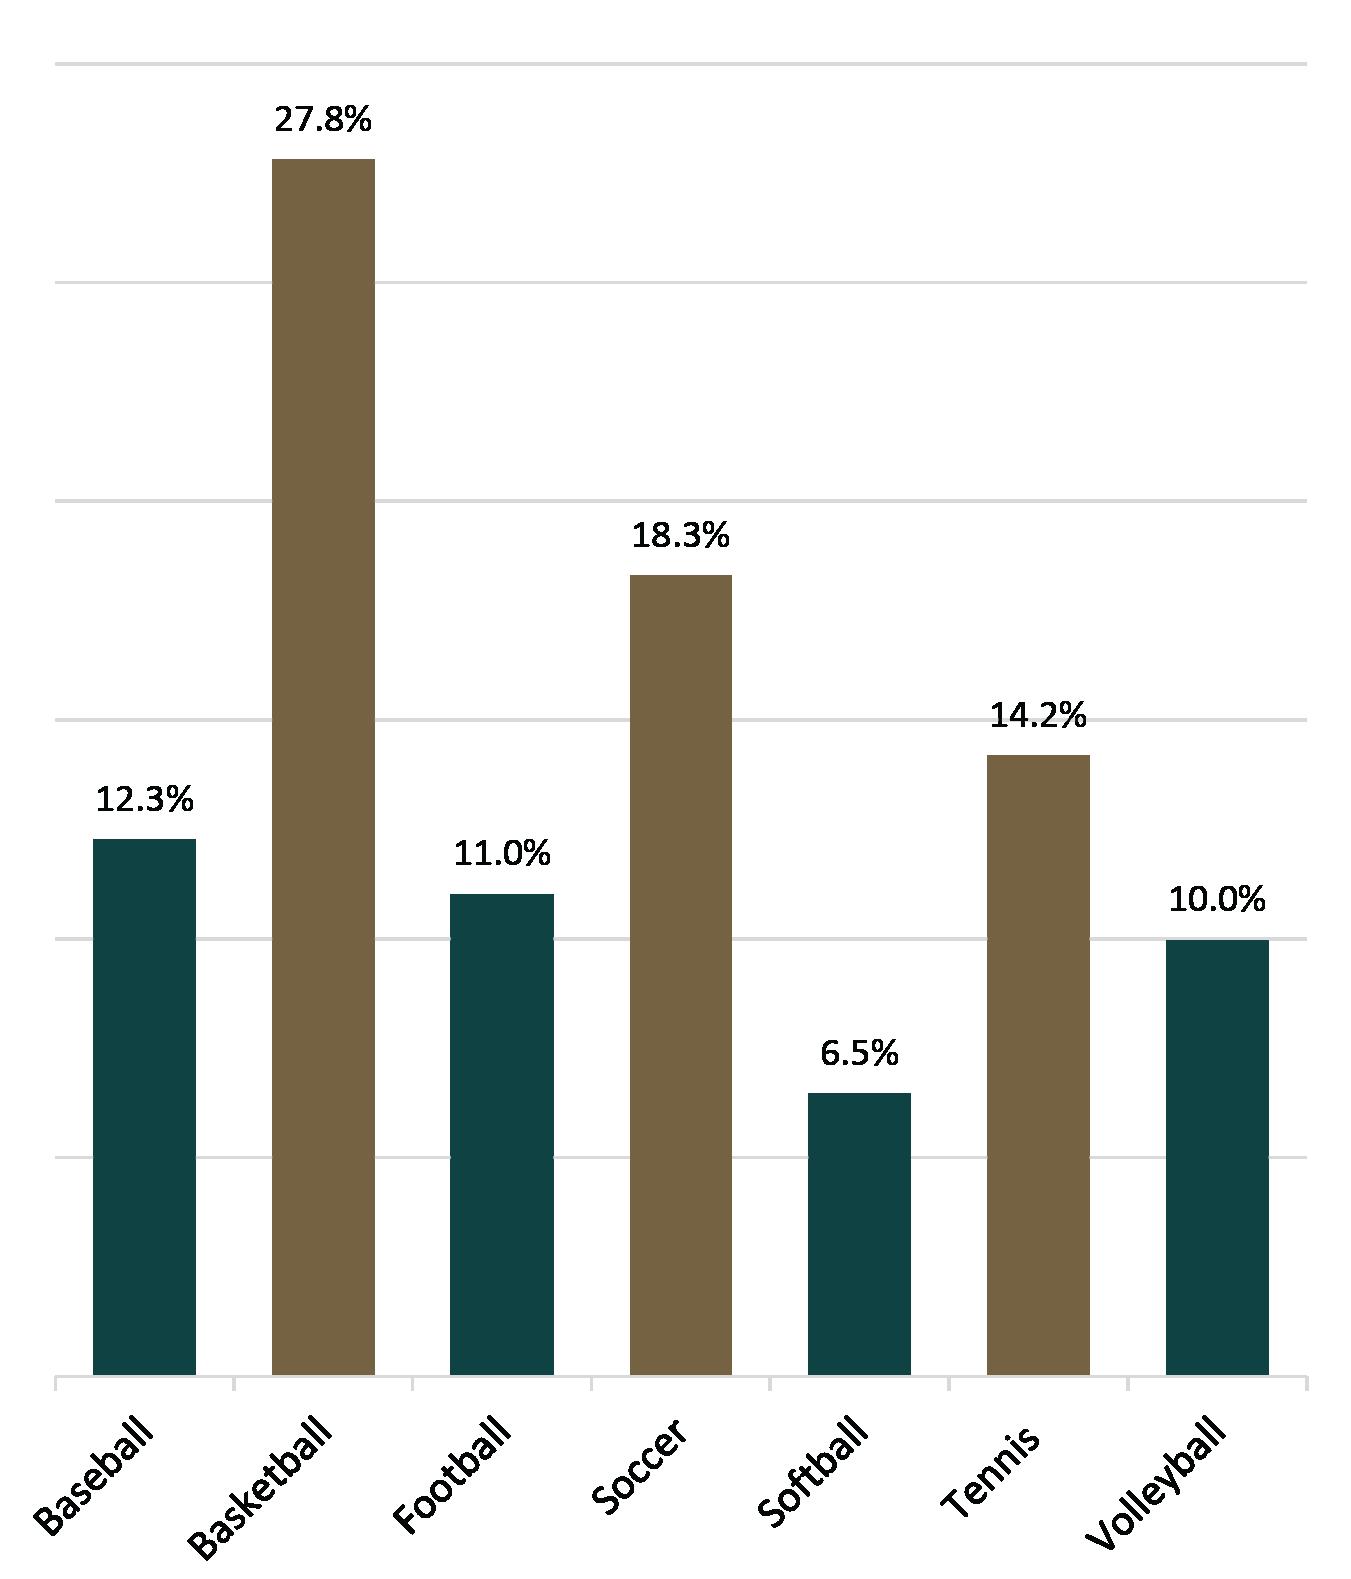
Figure 2-17 displays estimated sports participation in Moreno Valley based on data from ESRI Business Analyst. This data uses national propensities applied to local demographic composition to estimate the relative likelihood of adults and households in the specified trade area to exhibit certain consumer behavior. According to ESRI Business Analyst data, it is estimated that 27.8 percent of all sports participants in Moreno Valley participate in basketball, followed by 18.3 percent participating in soccer, and 14.2 percent participating in tennis. The top team sports played in Moreno Valley are similar to national trends. The SFIA report shows that nationally, basketball and soccer are two of the top five team sports based on participation numbers. Additionally, the two sports had the highest increases in participation over the last three years out of all team sports (13.0 and 9.3 percent, respectively), indicating that interest in these sports continues to grow nationally, as well as locally.
Source: ESRI Business Analyst
Figure 2-17 shows recreational activity participation in Moreno Valley based on data from ESRI Business Analyst. Walking for exercise is by far the most popular activity in Moreno Valley, followed by hiking, weight lifting, swimming, and jogging/running. Other recreational activities that ranked highly in Moreno Valley include road bicycling, yoga, and aerobics. Recreational activity trends in Moreno Valley indicate a high interest in physical fitness, which aligns with national trends. The SFIA report shows that the majority of active individuals in the U.S. participate in fitness sports (>65%), compared to lower participation rates in individual, outdoor, racquet, team, water, and winter sports. The City can accommodate community interest in these recreational activities by increasing related amenities, such as trails, bicycle lanes, and outdoor exercise equipment, as well as related programming like fitness classes, guided hikes, group runs, and bicycle rides.
FIGURE 2-18: Estimated Recreational Activity Participation in Moreno Valley
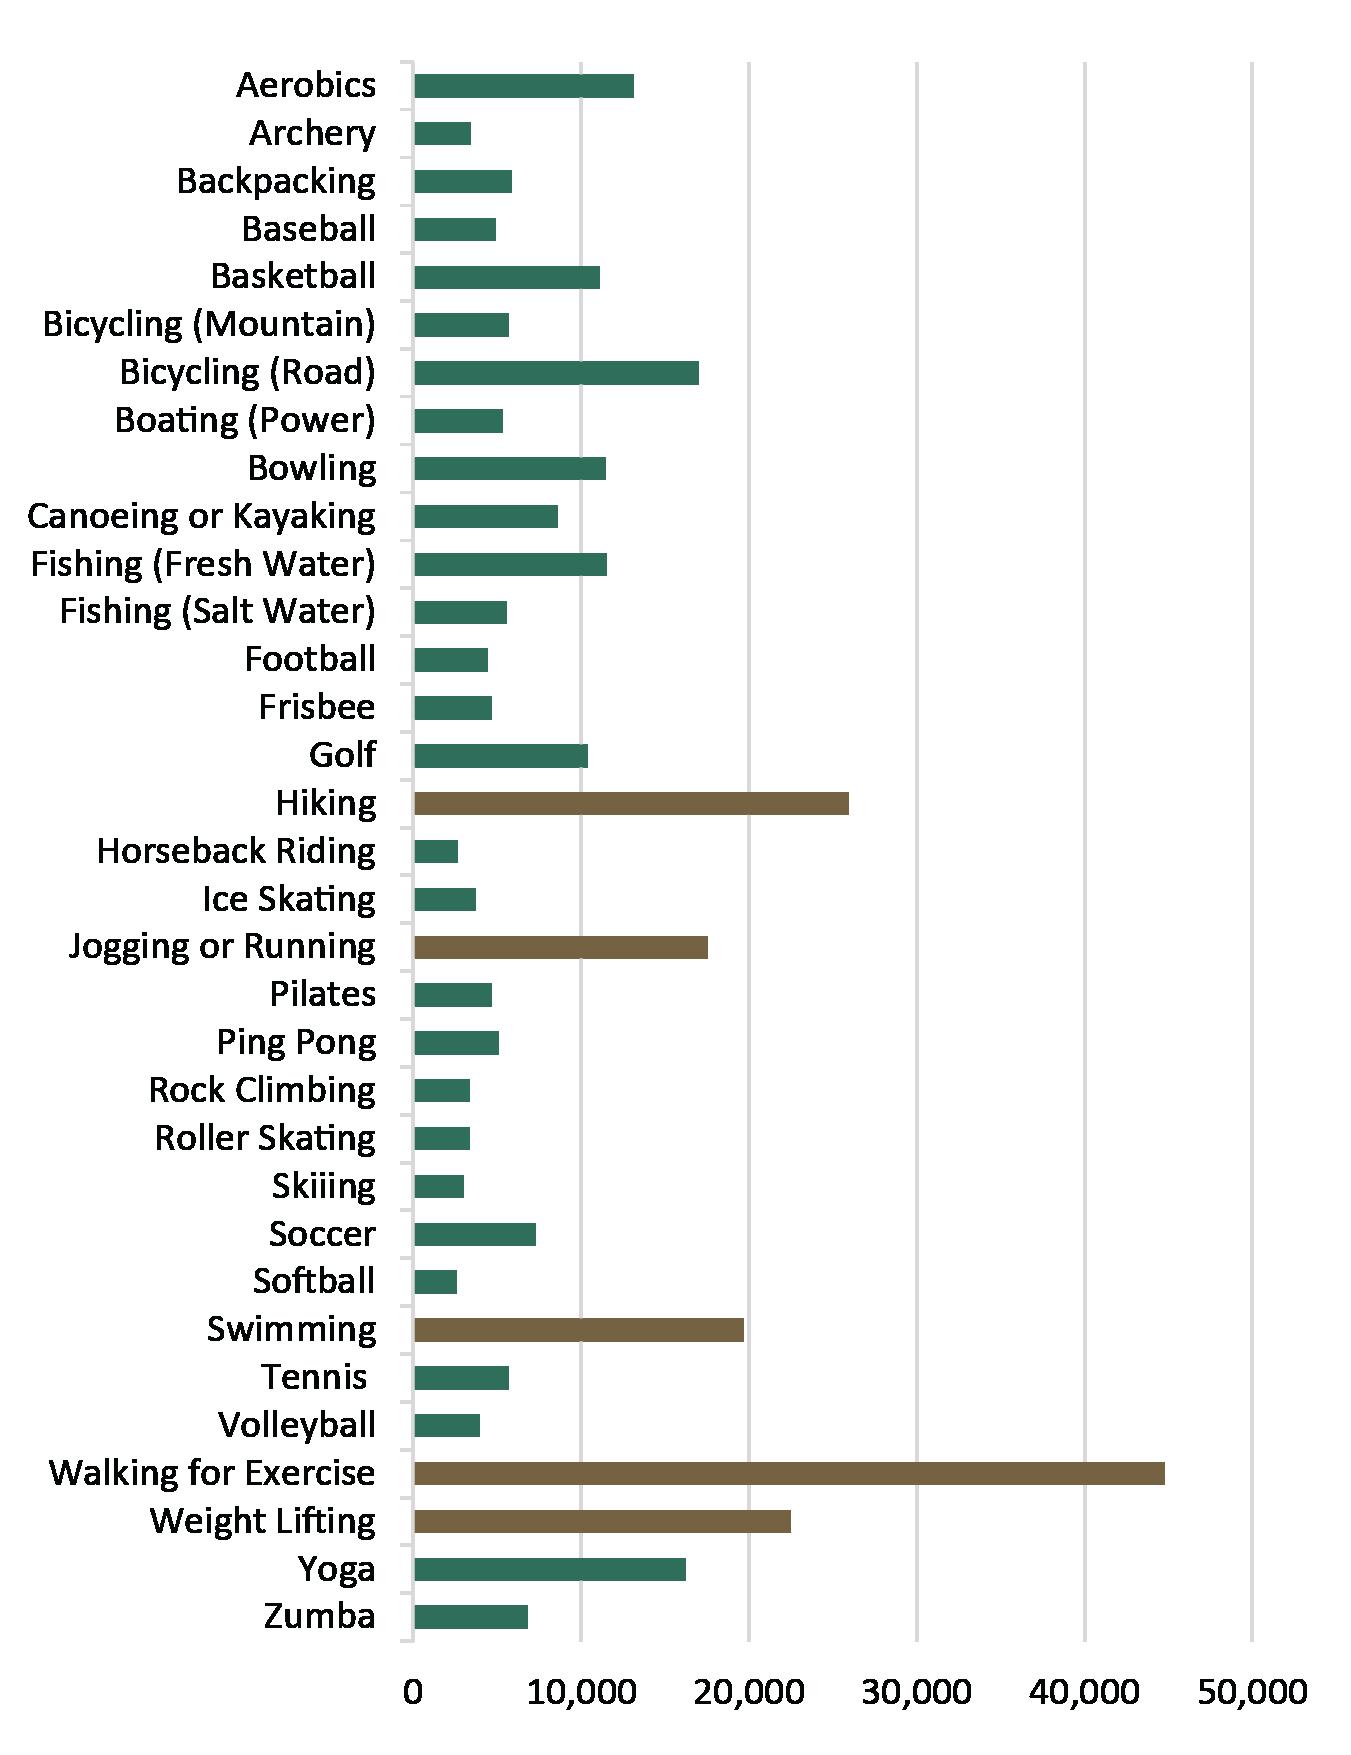
Source: ESRI Business Analyst
Source: SFIA Topline Report 2023
TAbLE 2-14: SFIA National Individual Sports Trends Participants
TAbLE 2-15: SFIA Racquet Sports Trends Participants
Source: SFIA Topline Report 2023 2022 Top 5 Sports Based on Participation Numbers

Source: SFIA Topline Report 2023 2022
5 Activities Based on Participation Numbers
Engaging Moreno Valley community members in the planning process was critical to the development of a Plan that accurately reflects community needs and desires. A comprehensive community engagement strategy was developed to facilitate a collaborative planning process and gather meaningful input from residents, stakeholders, and City staff. Outreach methods used to collect community input included community workshops, stakeholder meetings, a statistically valid survey, social media promotions, and online engagement through the City’s website.
The target audience of community engagement efforts was anyone who lives, works, or plays within in Moreno Valley. Additional emphasis was placed on under-served communities that disproportionately lack easy and comfortable access to parks, open spaces, and other recreation facilities.
The primary outreach methods used to engage Moreno Valley community members were:
» Project branding
» City website
» Social media
» Statistically-valid survey
» Three community workshops
» Six focus group meetings with key stakeholders
COMMUNITY ENGAGEMENT TIMELINE
Stakeholder Focus Group Meetings June 13, 2023
Statistically Valid Survey Opened June 2023
City Management Focus Group Meeting June 14, 2023
Statistically Valid Survey Closed September 2023
Community Workshop #2 September 26, 2023
Community Workshop #1 May 3, 2023
Community Workshop #2 November 9, 2023
Responses
Community Workshops Focus Group Meetings
3.2.1
Distinct branding was developed for the Plan to promote project familiarity throughout the planning process. A unique project logo and color palette was used for all outreach materials and presentations. The project branding was designed to maintain consistency with City branding, while also distinguishing the project as a new planning endeavor.
3.2.2
Social media was used throughout the development of the Plan to share information and invite community members to participate in a collaborative planning process. Regular social media posts were made to publicize the Plan, promote events and feedback opportunities, and share project updates.
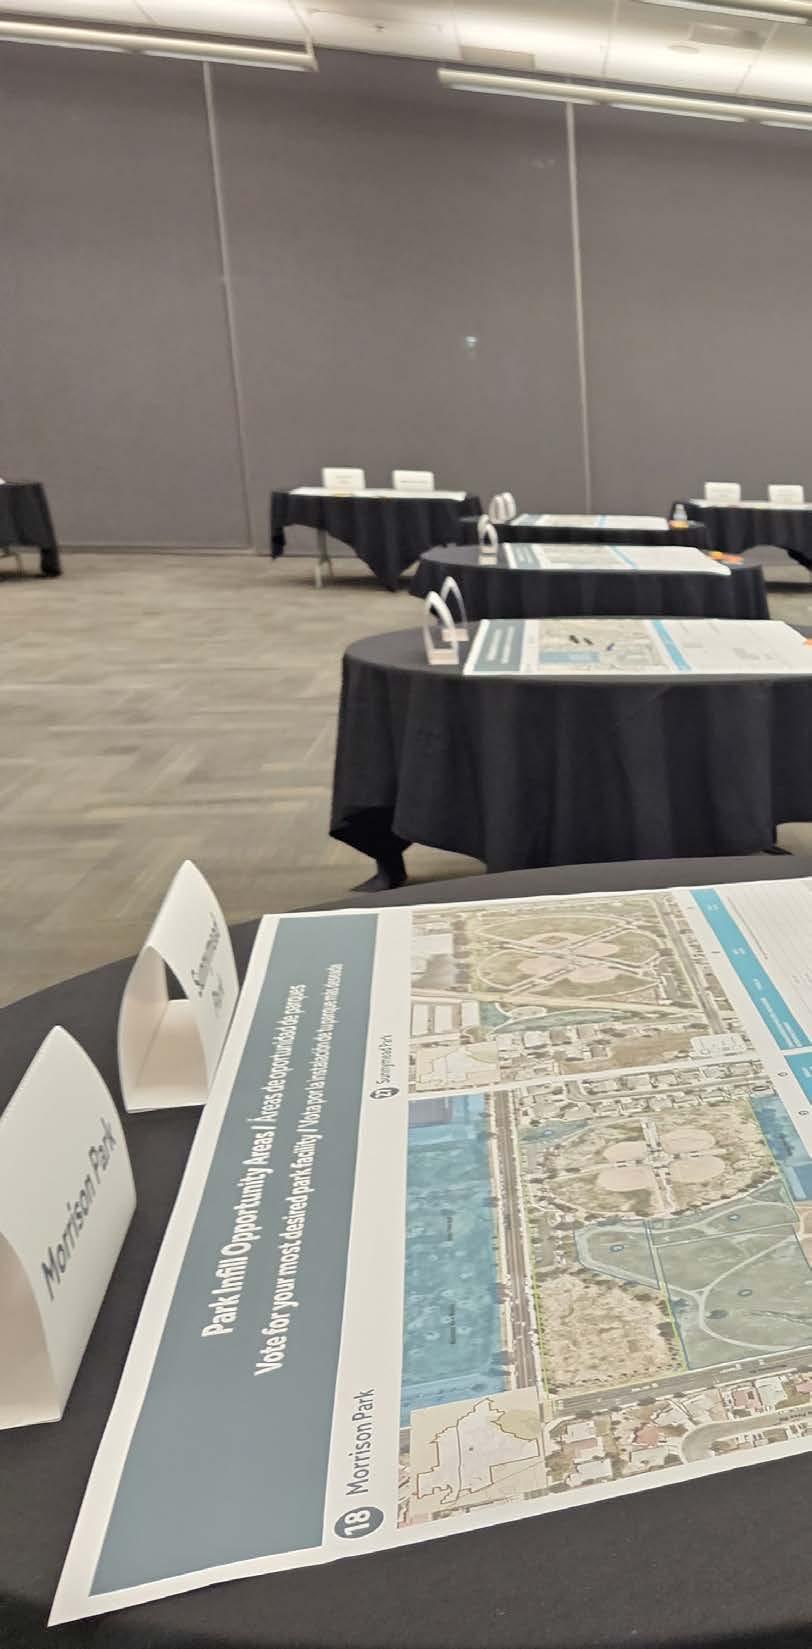
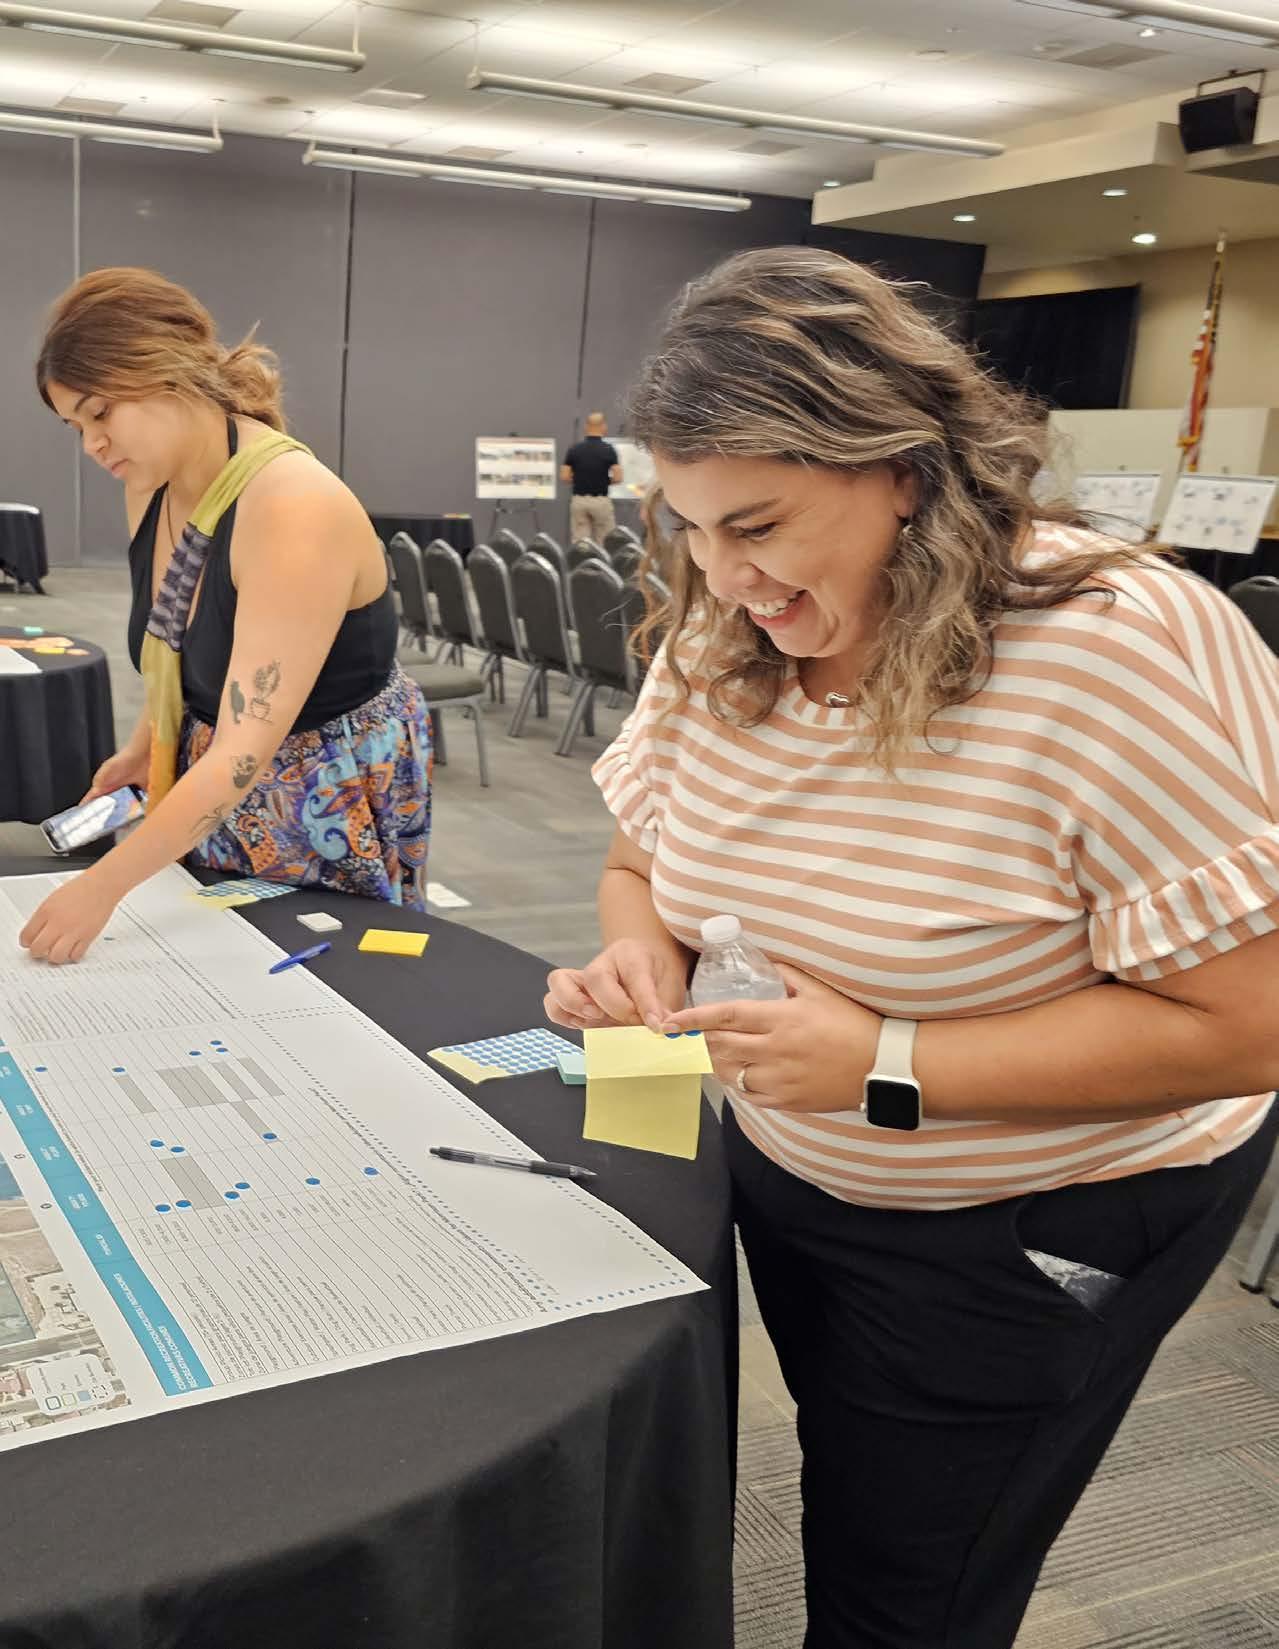
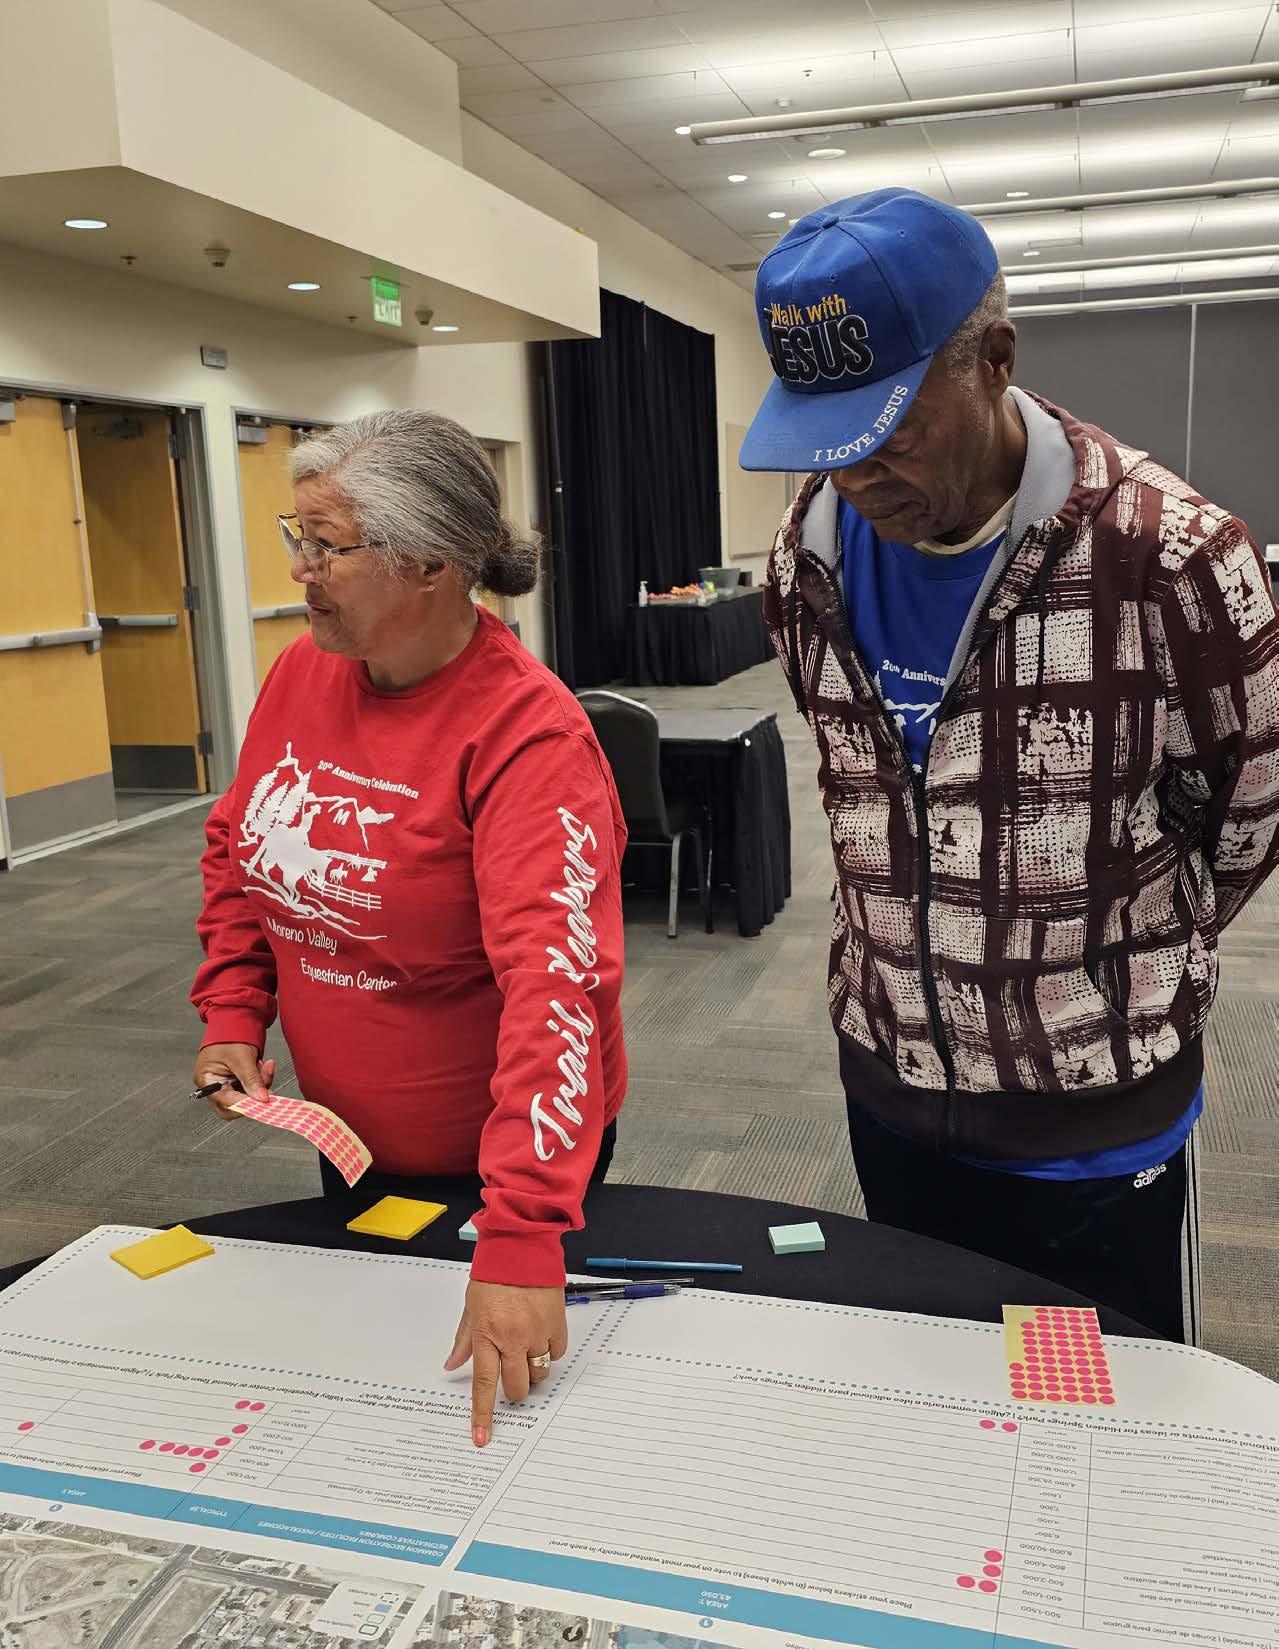
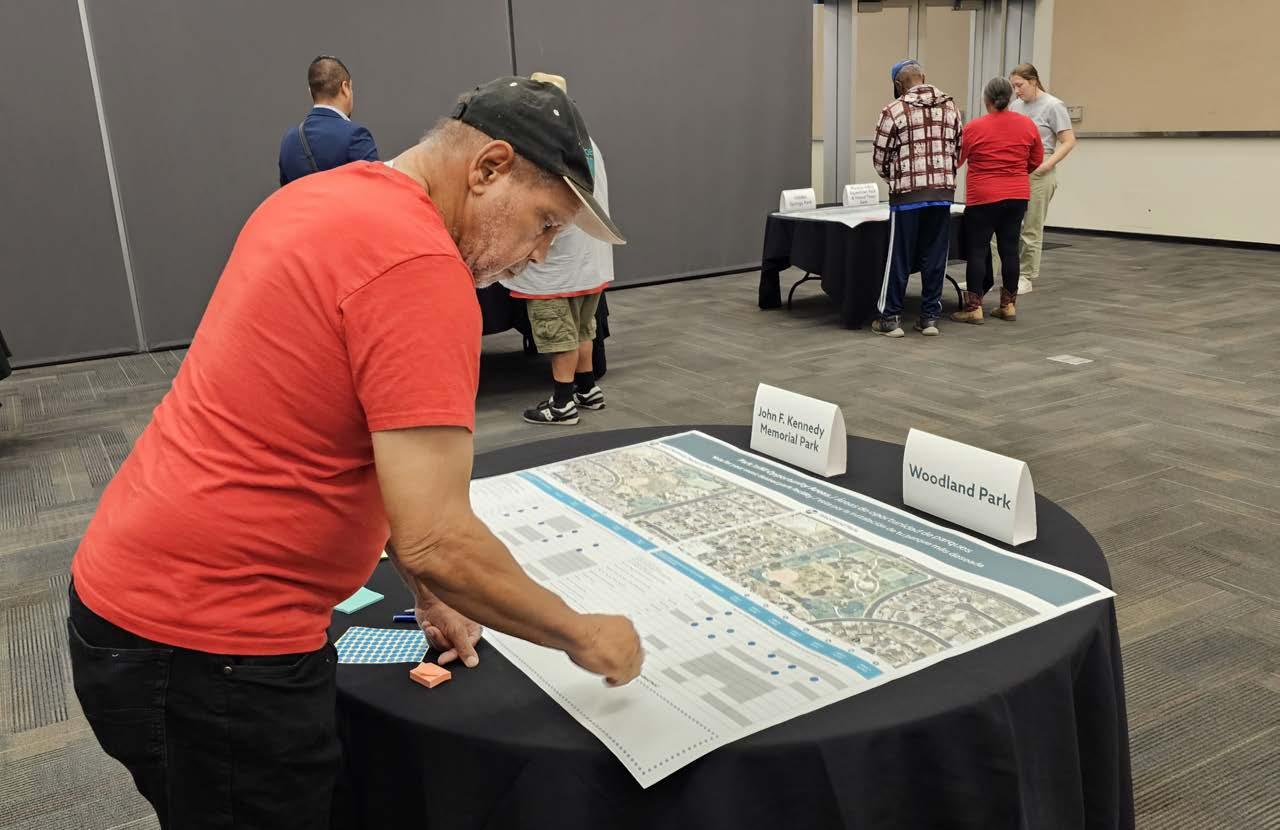
Three community workshops were held between May 2023 and November 2023 to engage community members in a participatory planning process for the Plan. The workshops enabled community members to engage in the planning process and provide direct input on current and future park needs. Some items mentioned by participants in the workshops had not been captured by other forms of community engagement, which reinforces the importance of in-person participatory planning opportunities in reaching different audiences.
The first workshop was held on May 3, 2023, at the Moreno Valley Conference and Recreation Center. The workshop served as an official kick-off for the Plan. The planning team presented an overview of the planning process and initial findings from the citywide park inventory.
After the presentation, participants split into small groups to discuss the following topics:
» Current usage of existing parks
» General conditions of existing parks
» Overall satisfaction with current park experience
» Value placed on parks and recreation amenities
» Collective vision of the future park system
The most common comments from participants were related to the following topics:
1. Park Lighting and Safety
2. Park Connectivity and Safe Access
3. Nature and Open Space
4. Community Centers and Programming
5. Equestrian Facilities
6. Arts, Culture, and History
7. Park Maintenance
8. Additional Park Amenities
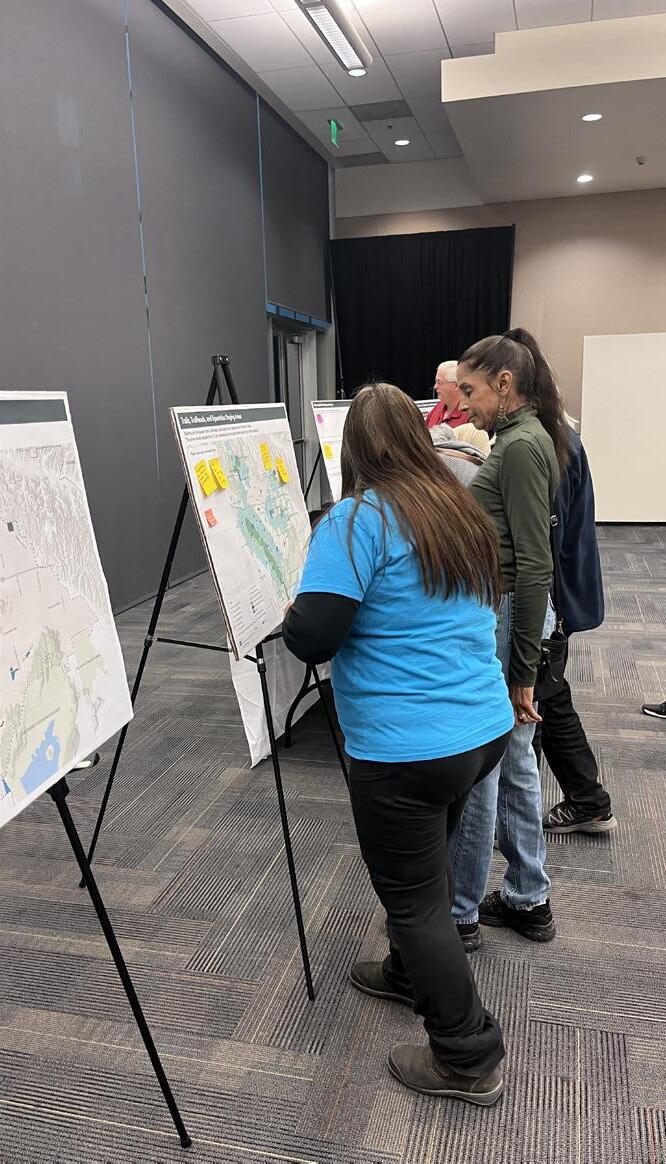
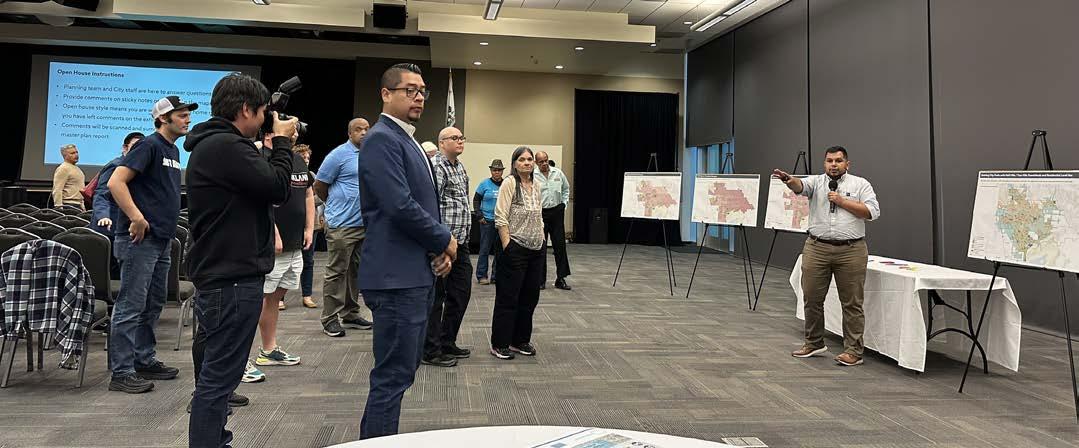
The second workshop was held on September 26, 2023, at the Moreno Valley Conference and Recreation Center. The workshop began with a presentation of the results from the project’s existing conditions analysis and the community survey. After the presentation, attendees participated in an interactive activity to collect input on desired parks and recreation facilities, amenities, and programming in Moreno Valley.
The top five amenities participants wanted to see at Moreno Valley parks were:
1. Community Gardens
2. Splashpad / Water Features
3. Outdoor Exercise Areas
4. New and Upgraded Playgrounds
5. Skate Parks
The top four amenities participants wanted to see at Moreno Valley trails were:
1. Signalized Intersections with Equestrian Push Buttons
2. Animal Crossing Signs
3. Fencing
4. Nature Center or Community Garden
The third and final workshop was held on November 9, 2023, at the Moreno Valley Conference and Recreation Center. The planning team presented draft recommendations to the workshop participants in a public workshop setting. The team shared a summary of findings from the previous workshop activities and existing conditions analysis and then presented the draft recommendations. Participants were then given opportunities to provide feedback on and potential revisions to the draft recommendations through a series of open-house activities.
Workshop participants expressed the most interest in addressing the following four categories within the draft recommendations:
» Improvements to Equestrian Center
» Additional and Improved Trail Connections
» Interest in All-Inclusive Programming and Events
» Additional Facilities
Feedback related to improvements to the equestrian center includes the addition of intersections with light signals, a nature center, an outdoor stage/amphitheater, fencing, picnic areas, a community garden, a tot-lot near a dog park, natural trails, and designated maintenance staff.
Additional and improved trail connections were requested through comments that consisted of the desire for improved trails with pas-
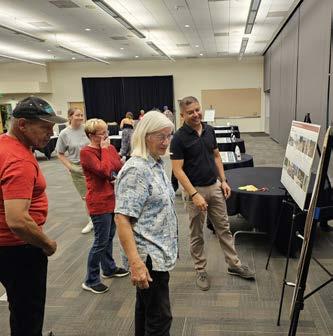
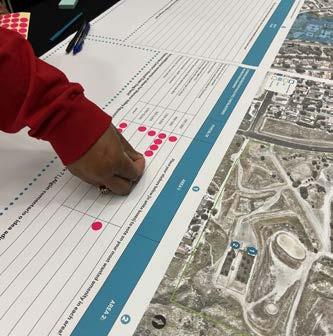
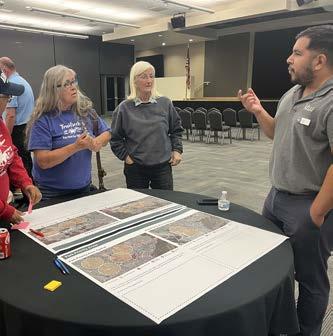
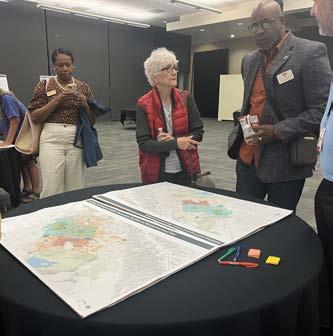
sive parks, east-west trail connections in northern Moreno Valley, a greenway trail network around the city, SR-60 multi-use trail crossings, and north-south trail connections to link Lake Perris to the Moreno Valley Equestrian Center.
The interest in all-inclusive programming and events includes desires for an international film festival, new youth/teen programs, programs for people of all ability levels, and a community health/wellness center.
Lastly, community members expressed the need for additional facilities, such as a new library in the central-east area, a museum, a small-scale amphitheater, and a performing arts center.
Focus group meetings with key stakeholders were conducted during the summer of 2023. The goal of these meetings was to gather input on the needs and desires of target community groups. This input, in combination with other community feedback from the survey and workshops, was used to guide the recommendations provided in Chapter 4. A series of questions were asked during each of the stakeholder meetings and some of the collective themes and responses are summarized on the following page.
Six focus groups were convened to gather information from a broad cross-section of community members:


Arts and Library Commissions: Members of the City of Moreno Valley Arts Commission and City of Moreno Valley Library Commission.
City Leadership: Department heads and directors from the following City departments: City Manager’s Office, Community Development, Economic Development, Fire, Parks and Community Services, and Public Works.
Parks and Community Services Department Staff: Staff from the City Parks and Community Services Department.
Parks, Community Services, and Trails Committee and Emerging Leaders Council: Members of the City of Moreno Valley Emerging Leaders Council and members of the City of Moreno Valley Parks, Community, and Trails Committee.
Senior Citizens’ Advisory Board: Members of the City of Moreno Valley Senior Citizens’ Advisory Board.
Youth Sports: Representatives from youth football, soccer, baseball, and softball leagues.
1. Are there any current unmet needs in park facilities, civic facilities (libraries), or amenities?
» Sports fields and facilities need lighting, more regular maintenance, and additional parking.
» There is a lack of public indoor gathering spaces to host meetings, programs, and classes.
» Parks need additional and improved restrooms with cleaner facilities and more lighting.
» The existing library, senior center, and recreation centers are too small and lack sufficient amenities and meeting spaces.
2. What kind of facility needs do you anticipate in the future?
» Stakeholders expressed an overwhelming need for a new library, senior center, teen center, and multi-purpose recreation center to provide much-needed community spaces to host meetings, programs, and classes.
» Sports-related needs include a large sports complex, an aquatic facility, additional sports fields, and lighted fields.
» Other top needs include dog parks, splash pads, safe walking and bicycling routes to and from parks, larger and cleaner restrooms, and diverse park amenities to meet different community needs.
3. Are there underserved areas of Moreno Valley where the City should focus on park improvements/construction?
» The east and northeast portions of Moreno Valley are currently underserved and lack parks, sports fields, and open spaces.
4. Are there enough facilities and amenities for the diverse community in the City?
» Facilities and amenities are lacking for Moreno Valley teens, seniors, and community members with special needs.
5. Are there any trails or trailheads that the City should prioritize?
» Multi-use trails that provide safe connections to parks for pedestrians and bicyclists should be prioritized.
» Opportunities to create a connected trail system, particularly to the Juan Bautista de Anza Trail, should also be prioritized.
6. What are your top park/trail project recommendations?
» Top park and trail recommendations for new facilities include a large central library, large recreation center, large sports complex, large senior center, multi-purpose fields, an aquatic facility, dog parks, splash pads, and community gardens.
» Top park and trail recommendations for existing facilities include the addition of shade structures, picnic areas, BBQs, lighting, and restrooms to existing parks, as well as the remodeling of playgrounds to meet safety standards.
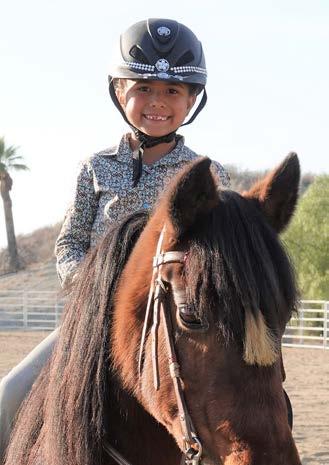
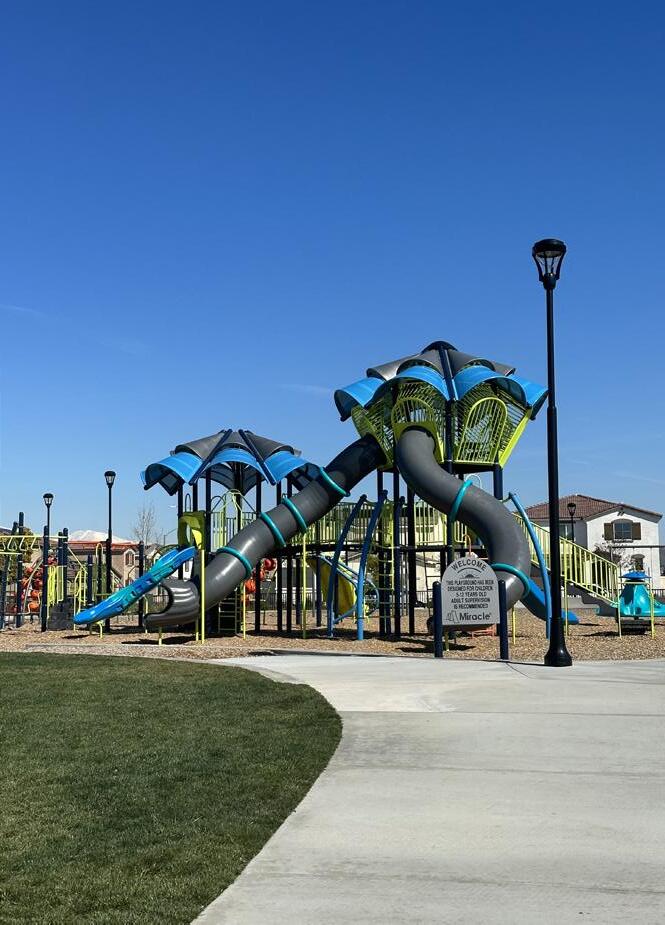
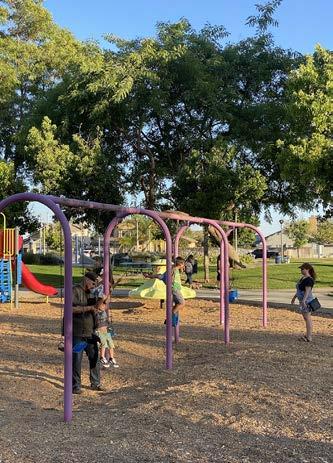
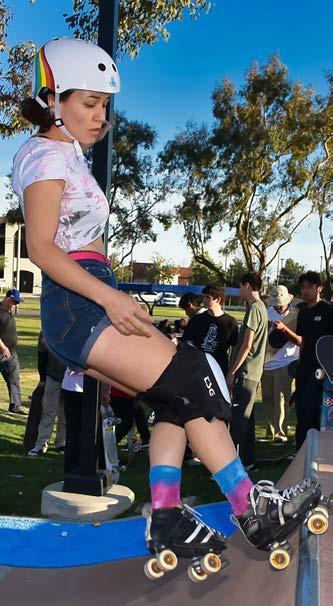
1. Are there any current unmet needs in recreation/library programming?
» More programming and meeting spaces are needed for teens, young adults, seniors, and community members with special needs.
» Childcare programs are often full and are too expensive for some community members.
2. What programs would best service your family’s future needs?
» The following programs are desired: childcare, tutoring, adult literacy programs, multi-generational programs, pottery classes, van service for teens, and programs specifically for teens and seniors.
3. Are there any partnerships between the City and the community that can be created or strengthened?
» The City’s relationship with the Moreno Valley Unified School District could be strengthened to improve and add more JointUse Agreements.
Several common themes were repeated across focus groups, demonstrating consensus on a number of key desires and needs for Moreno Valley:
Surveys were used to collect community input from residents and other park users on City parks, recreation facilities, amenities, future planning, communication, and more. The survey was designed to yield results that could assist the City in developing a plan that accurately reflects the needs, wants, and desires of the entire community. The survey results were analyzed and incorporated into the development of this Plan.
Two samples were collected in the survey effort:
» Statistically Valid Invite Sample (259): Paper surveys were mailed to a random sample of 4,500 residential households in Moreno Valley with instructions for how to complete the survey through a password-protected web link. An additional 4,000 reminder postcards were also sent to encourage residents to take the survey. Out of the 4,500 paper surveys mailed to Moreno Valley households, 259 surveys were completed.
» Open Link Sample (218): An online survey was shared widely through social media, City newsletters, and other promotional activities with the intent to reach as many Moreno Valley residents as possible, as well as non-residents who may use Moreno Valley parks and recreation facilities. 218 Open Link surveys were completed online.
Together, the two samples provide a useful source of community input on Moreno Valley’s existing parks and recreation facilities and programming, as well as the need for future improvements.
Figure 3-1 to Figure 3-5 present a snapshot of survey results as a comparison of responses from both the Statistically Valid Invite (Invite) sample and the Open Link sample. In general, responses from the Invite sample are similar to those from the Open Link sample, which indicates a general consensus in the community on various park and recreation-related topics and ideas. Complete survey results are provided in Chapter 5.
Figure 3-1: Please rate how important the following recreation facilities and services are to your household. (On a scale of 1 to 5, with 5 being “Very Important”)
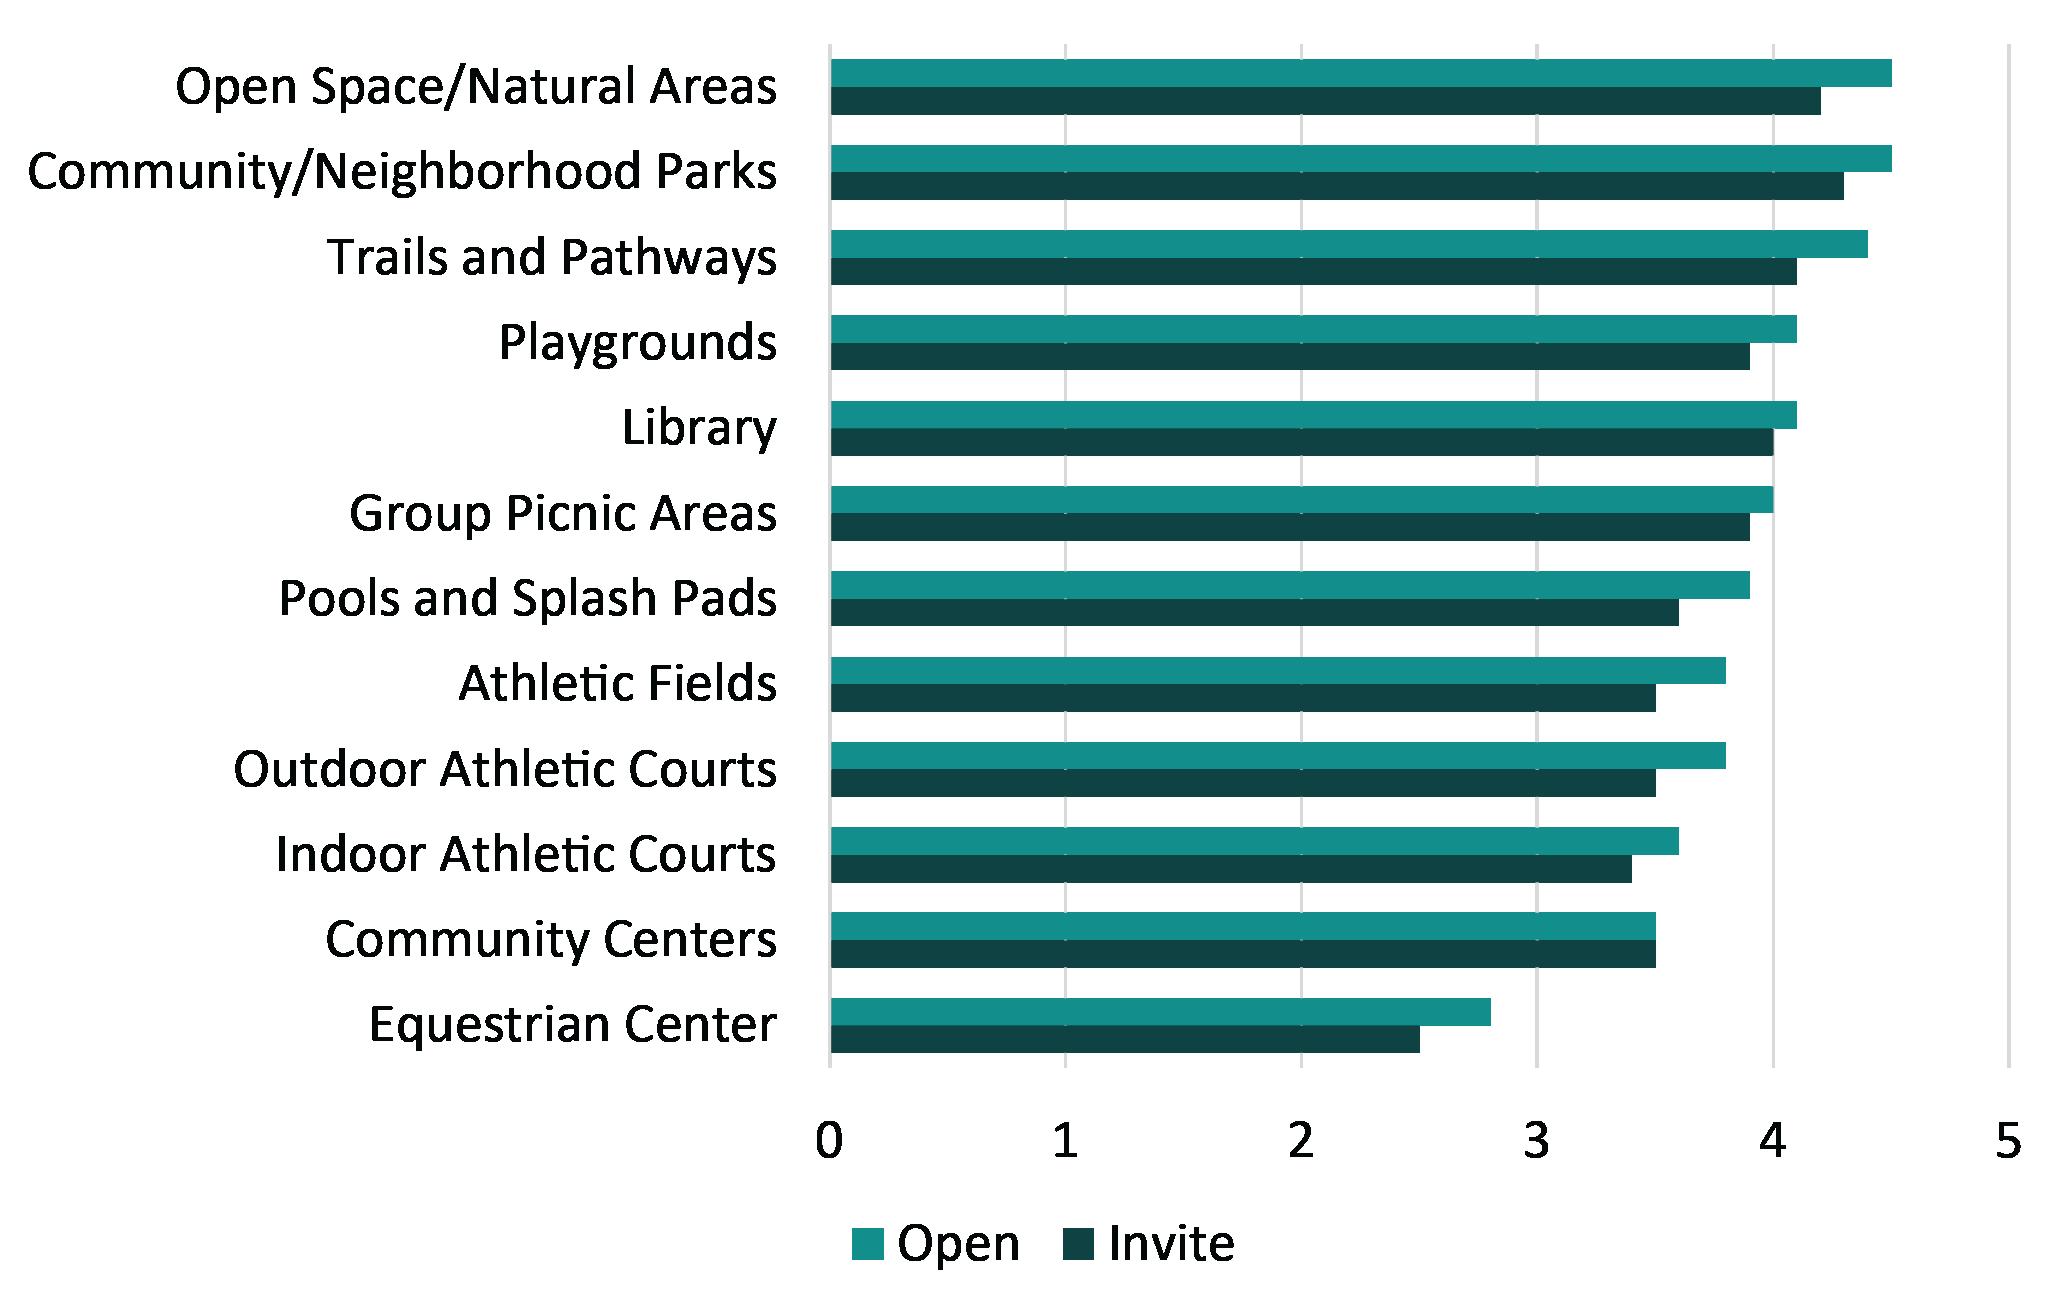
Figure 3-2: Please identify your household’s priorities for recreation facilities, parks, programs, and special events to be added, expanded, or improved upon in Moreno Valley in the next 5 years. (On a scale of 1 to 5, with 5 being “A Very High Priority”)
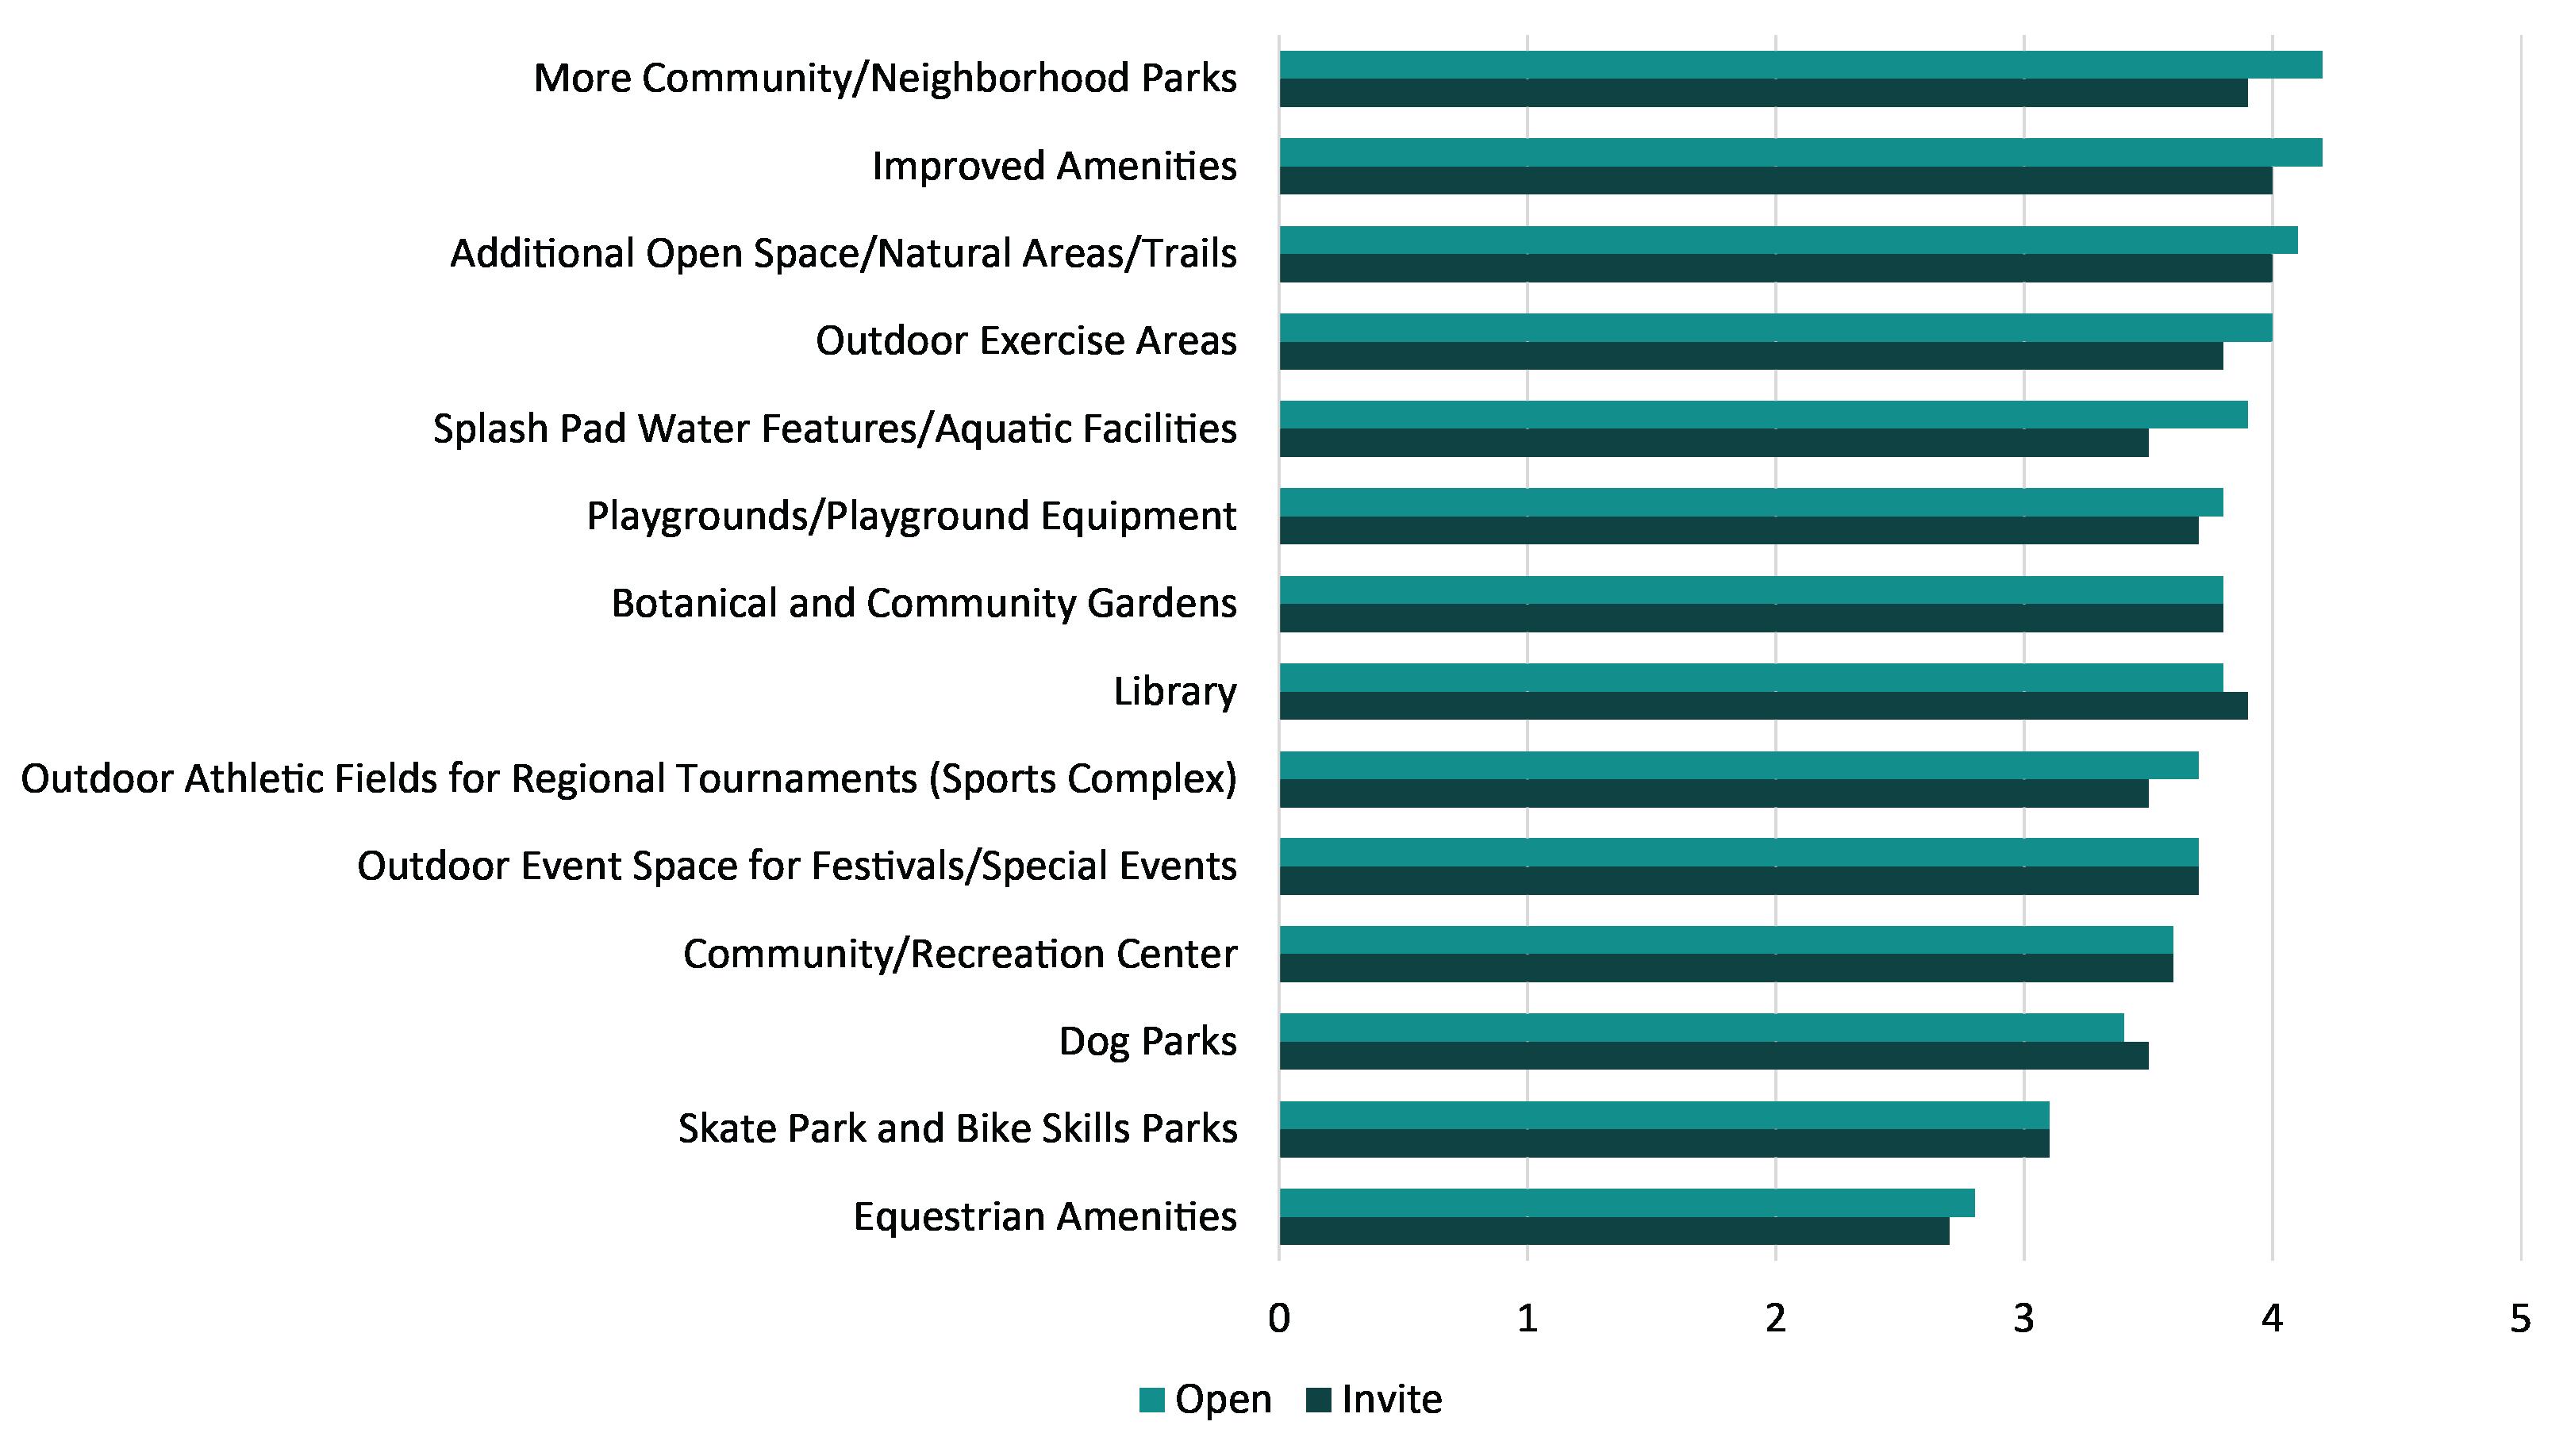
3-3: What are the top priorities for improvement within our trail system? (Select Top 3)
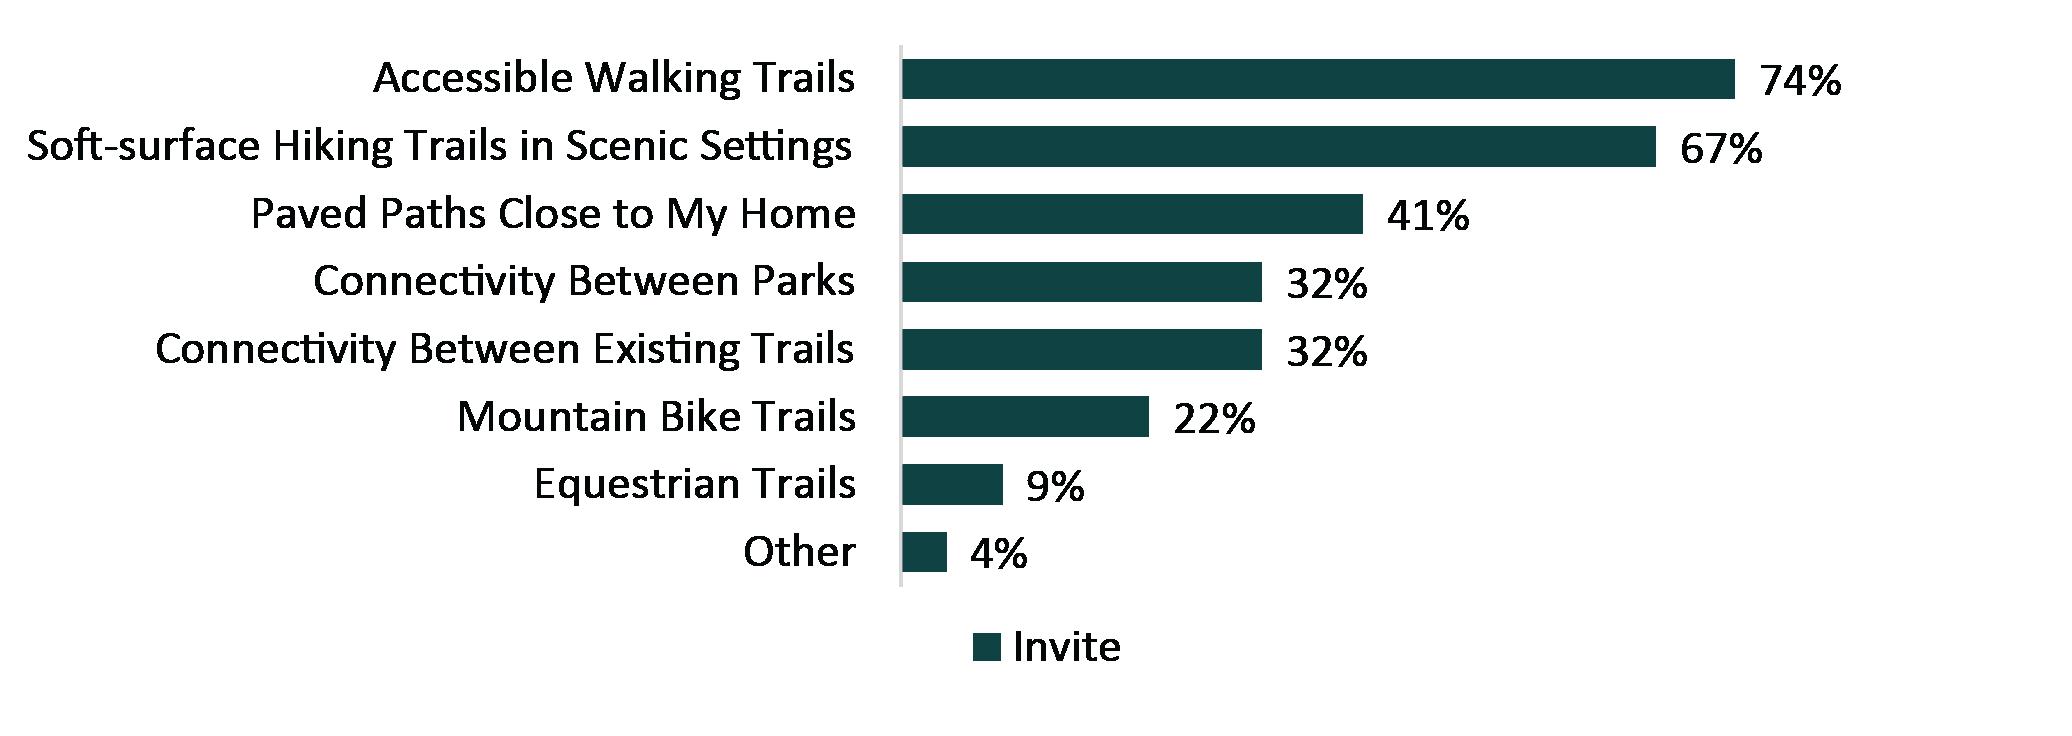
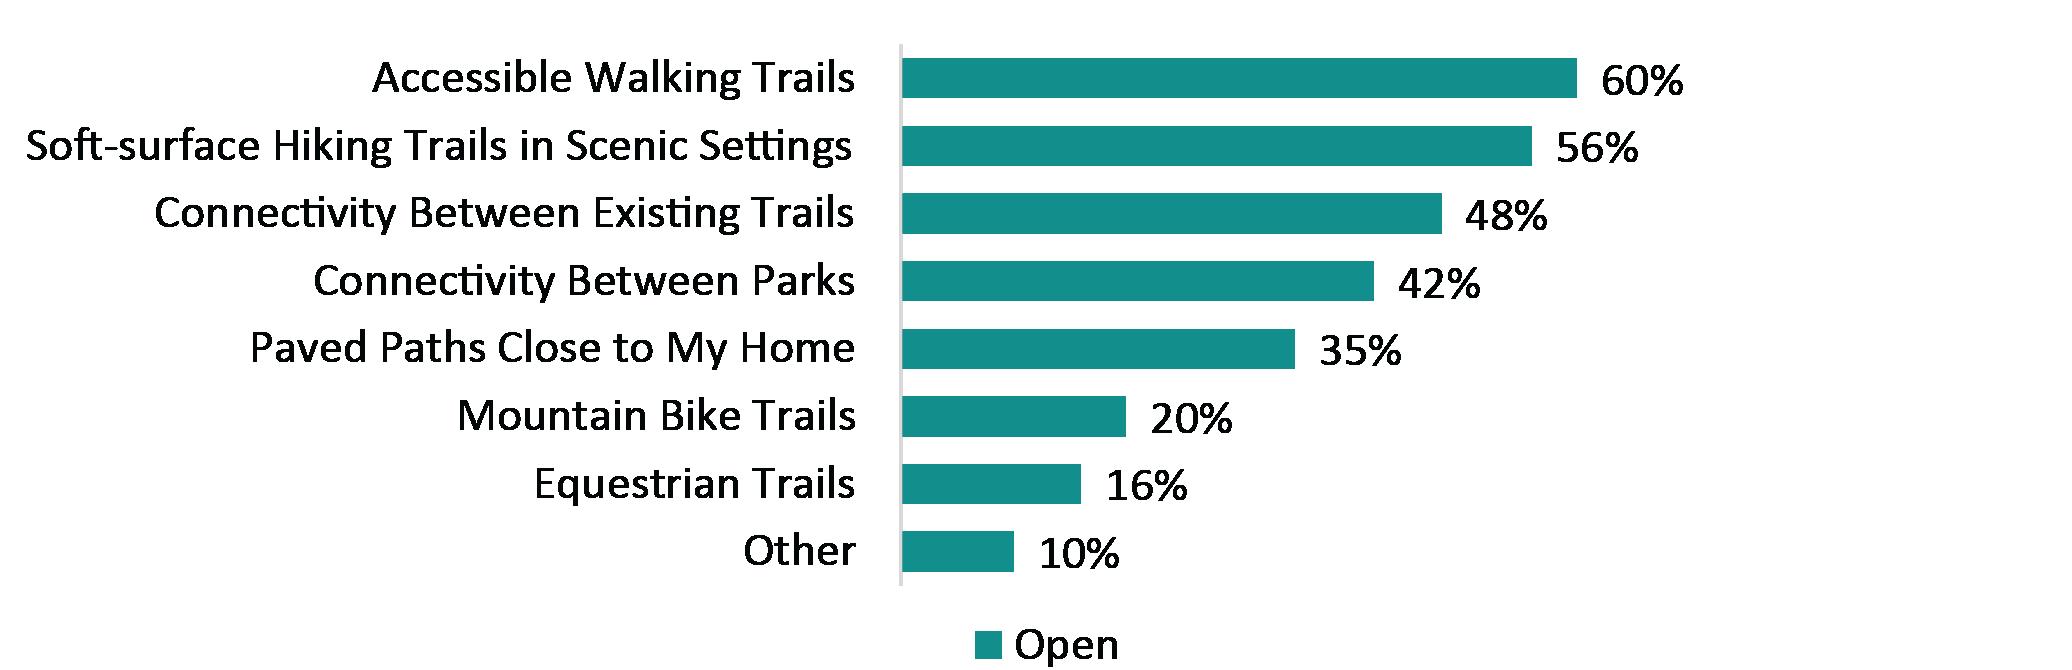
Figure 3-4: What are the most important items that, if addressed by the City of Moreno Valley, would increase your use of parks and recreation facilities?
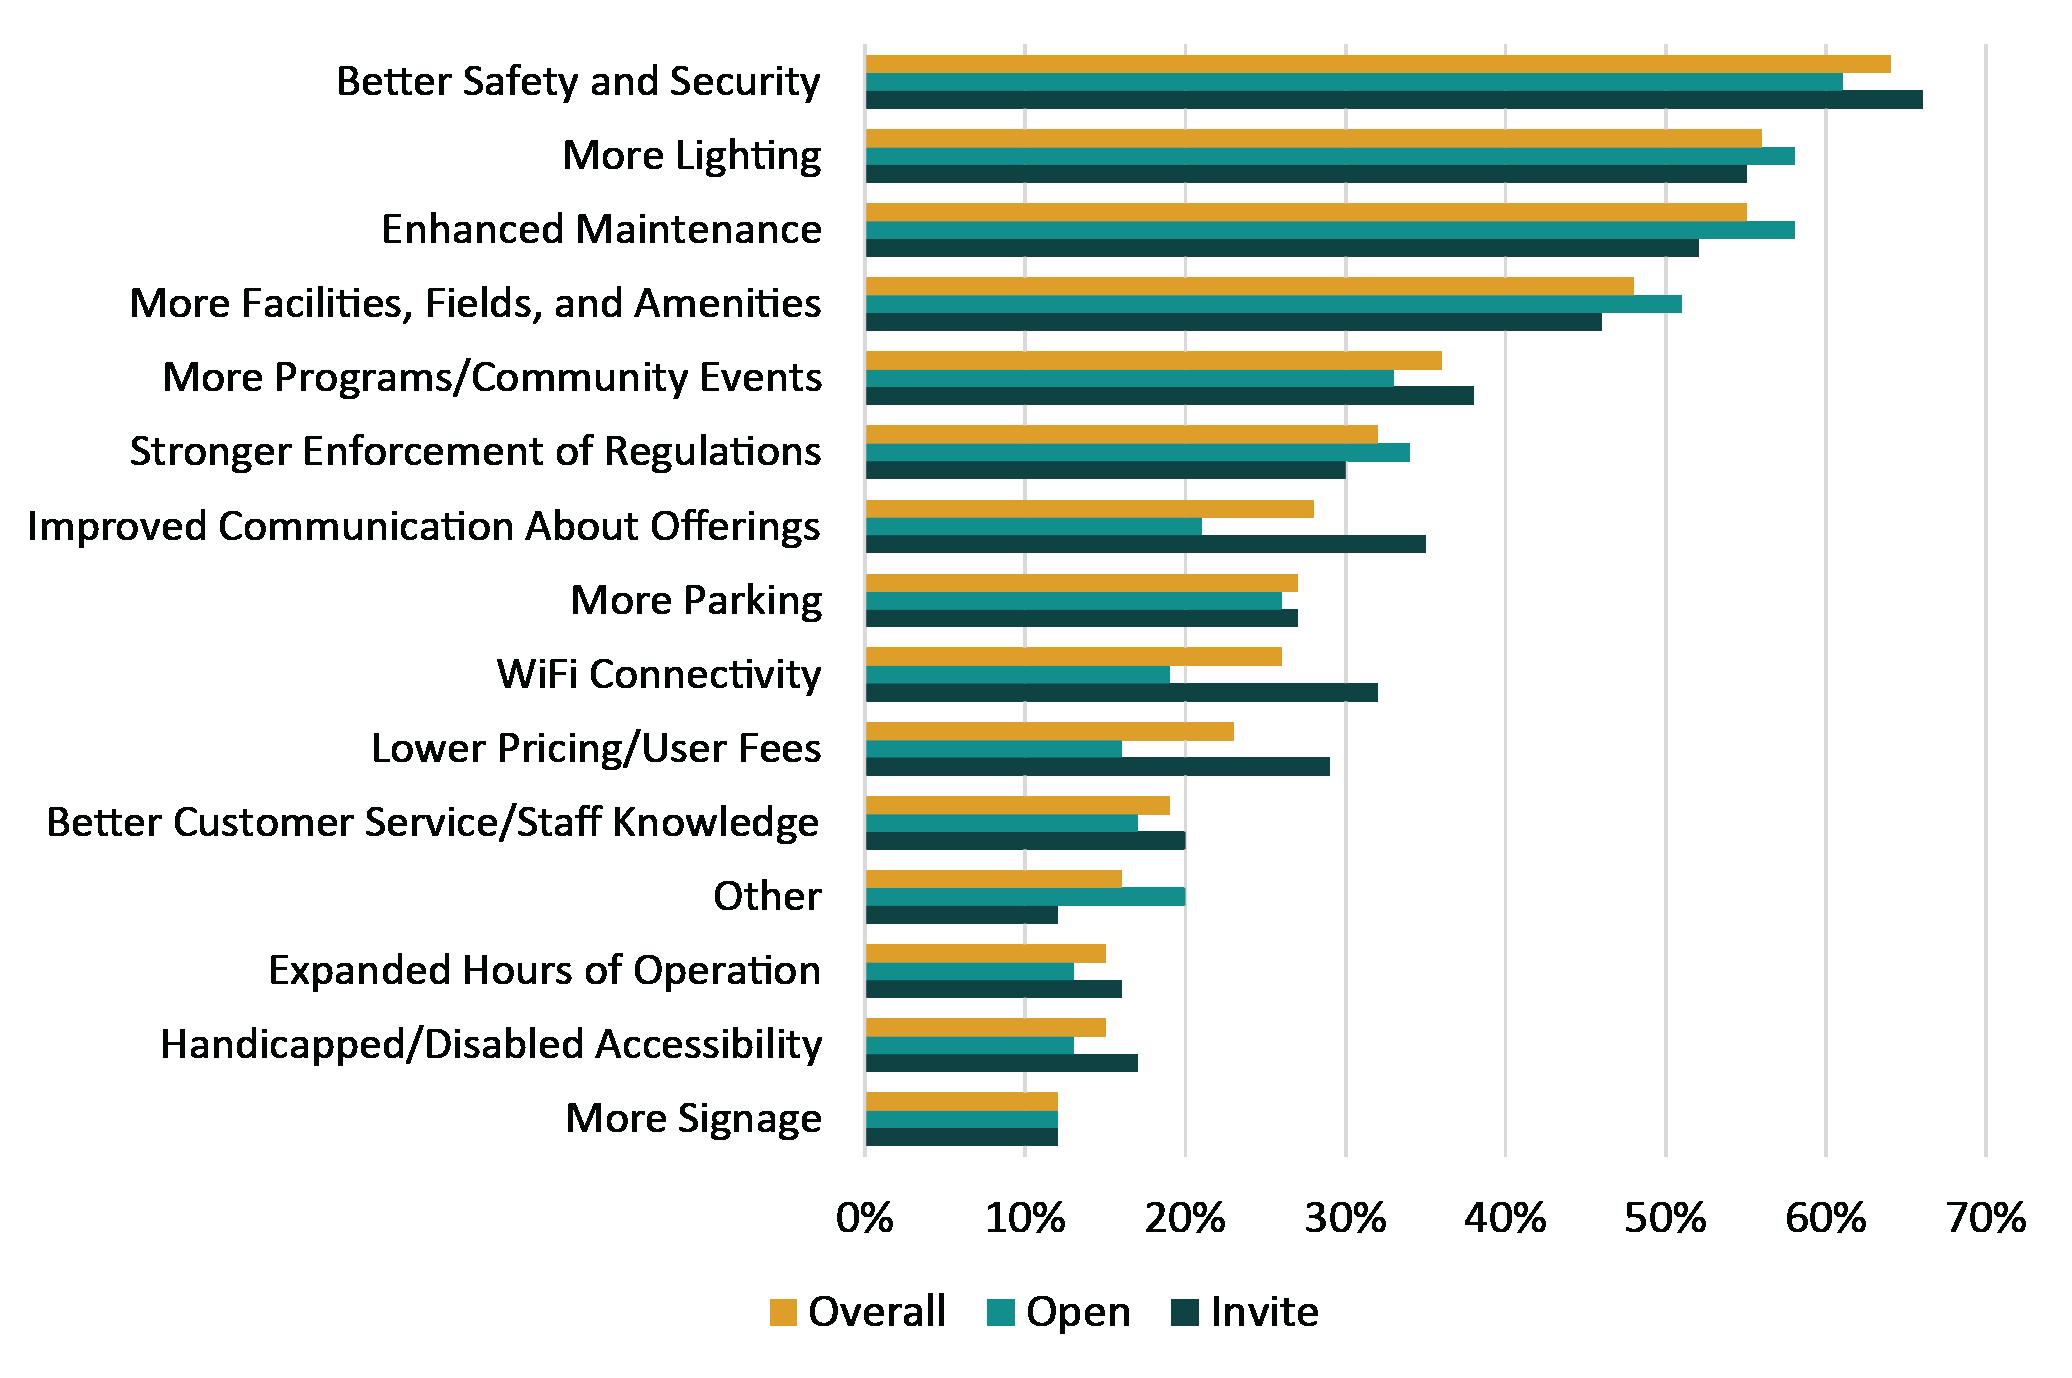
Figure 3-5: What will increase your household’s use of Moreno Valley Parks and Community Services programs?
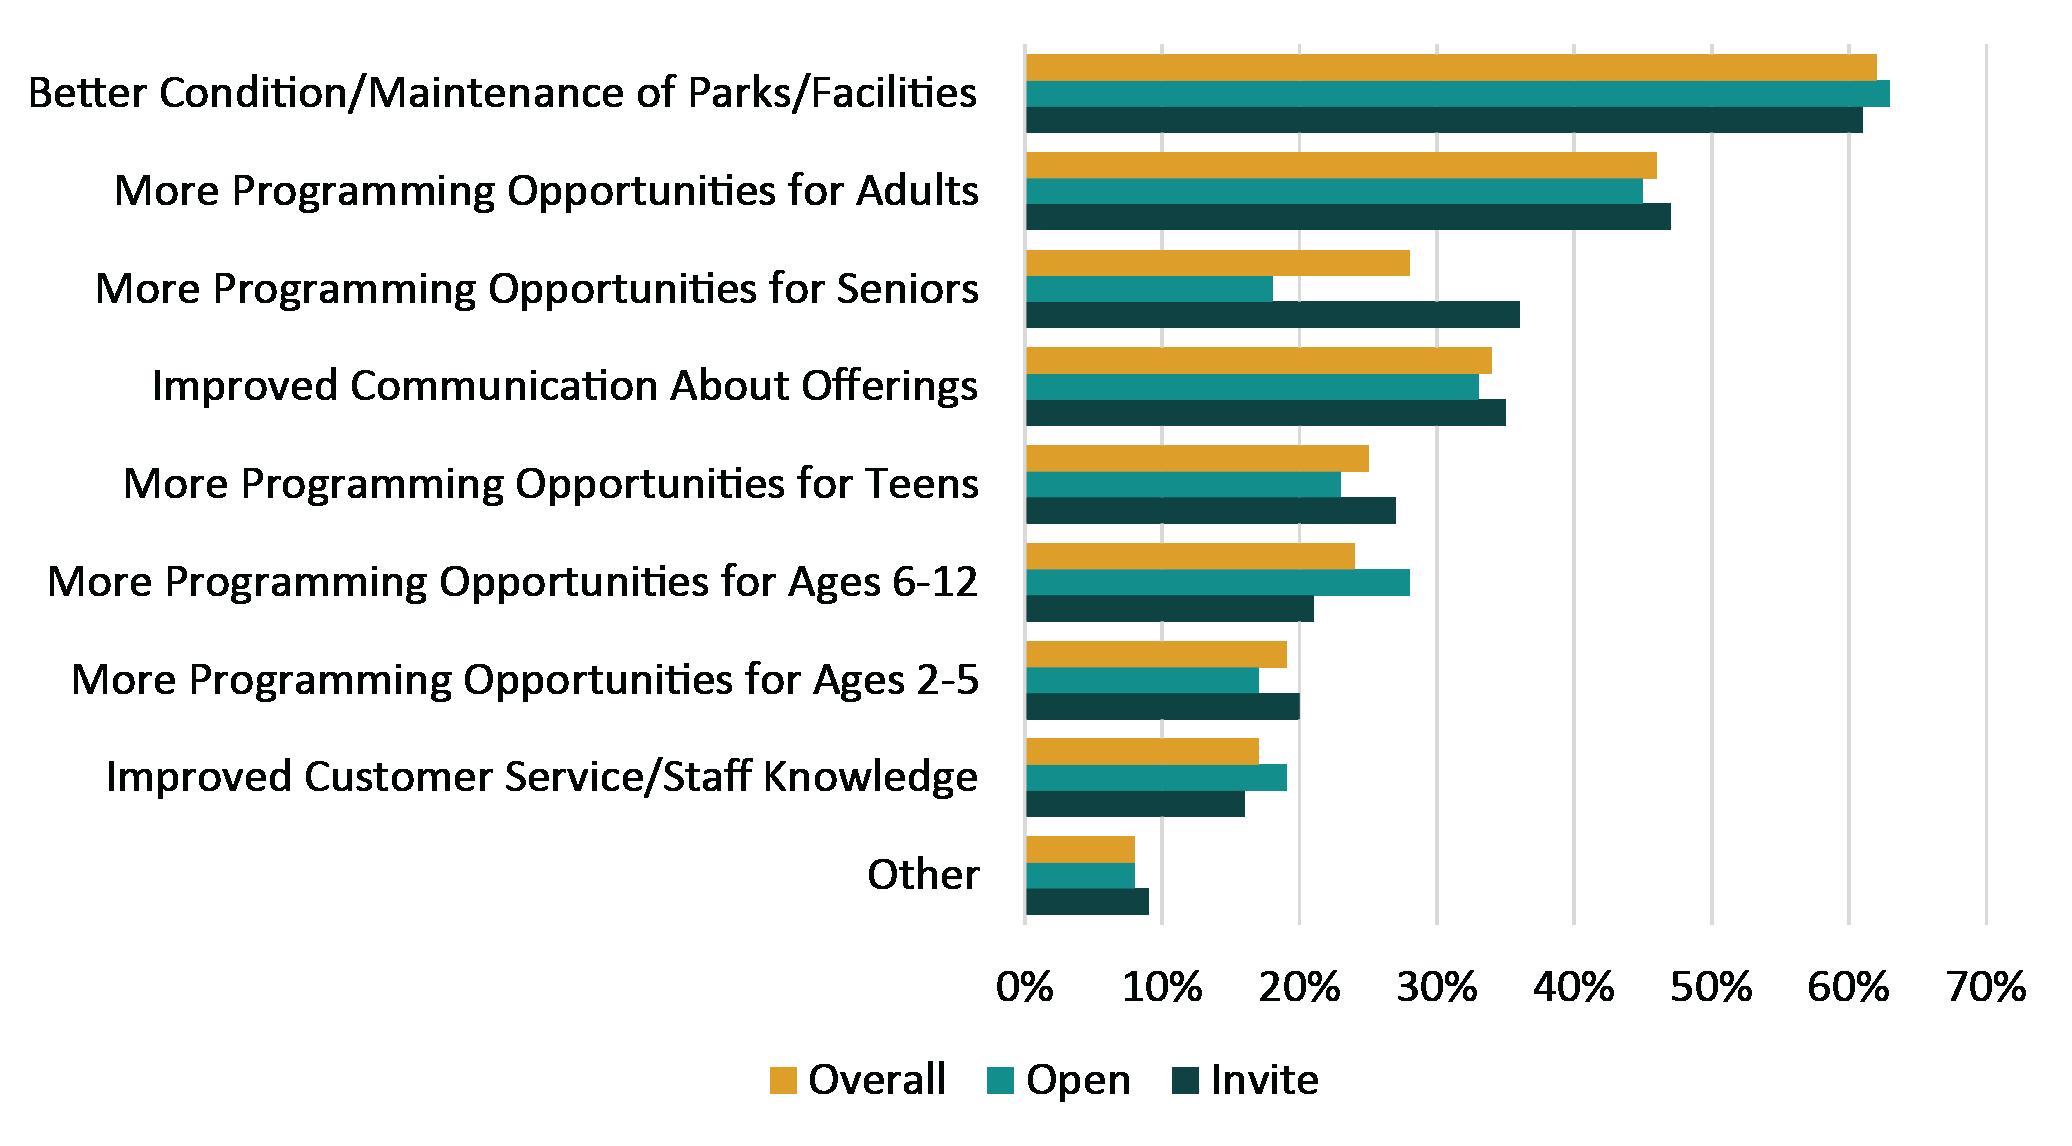


Satisfaction: There are high ratings of satisfaction for the overall quality of Moreno Valley parks, facilities, recreation programs, and services. In particular, the Library and Special Events received average ratings of 3.7 and above on a scale of 1-5, with 5 being “very satisfied.”
Proximity: Most respondents live close to their most visited park. A total of 81 percent of the Invite sample and 68% of the Open Link sample say it takes less than 10 minutes to get to a park from their home.
Mode of Transportation: Most respondents drive a motor vehicle to get to the park they most frequently visit. However, 21 percent of the Invite sample report walking/running or rolling.
Most Used Facilities: Parks, trails and pathways, and the Recreation Center are the most frequently used facilities provided by the City.
Most Important Facilities: Community/neighborhood parks and open space/natural areas are the most important recreation facilities and services to both samples. However, their rating for meeting the needs of the community is lower than other facilities.
Top Ways to Increase Park Usage: The top three ways to help increase the usage of parks and recreation facilities are to improve safety and security, add more lighting, and enhance and maintain existing parks and facilities.
Future Priorities: The top future priorities for both samples are improved amenities, additional open space/natural areas/trails, and more community/neighborhood parks. When given a choice between natural resource preservation/protection and active recreation, respondents generally would prefer Moreno Valley pursue natural resource preservation/protection.
Trail System Priorities: Accessible walking trails and soft-surface hiking trails are the most important priorities for improvement within the City’s trail system.
Program Participation: About a quarter (25 percent) of Invite respondents had participated in Moreno Valley Parks & Community Services-led programs in the past 12 months. The top reason for participation in facility location.
Top Ways to Increase Program Participation: To help increase the use of Moreno Valley Parks & Community Services programs, respondents prefer better condition/maintenance of parks or facilities and more programming opportunities that appeal to adults.
Communication: Respondents rated the communication efforts from Moreno Valley as moderately effective. The most preferred forms of communication for the Invite sample include the City’s newsletters, Soaring Activity Guide, and emails.
A permanent restroom building is strongly desired, as well as more amenities like picnic areas, outdoor fitness equipment, campsite, and community gardens.
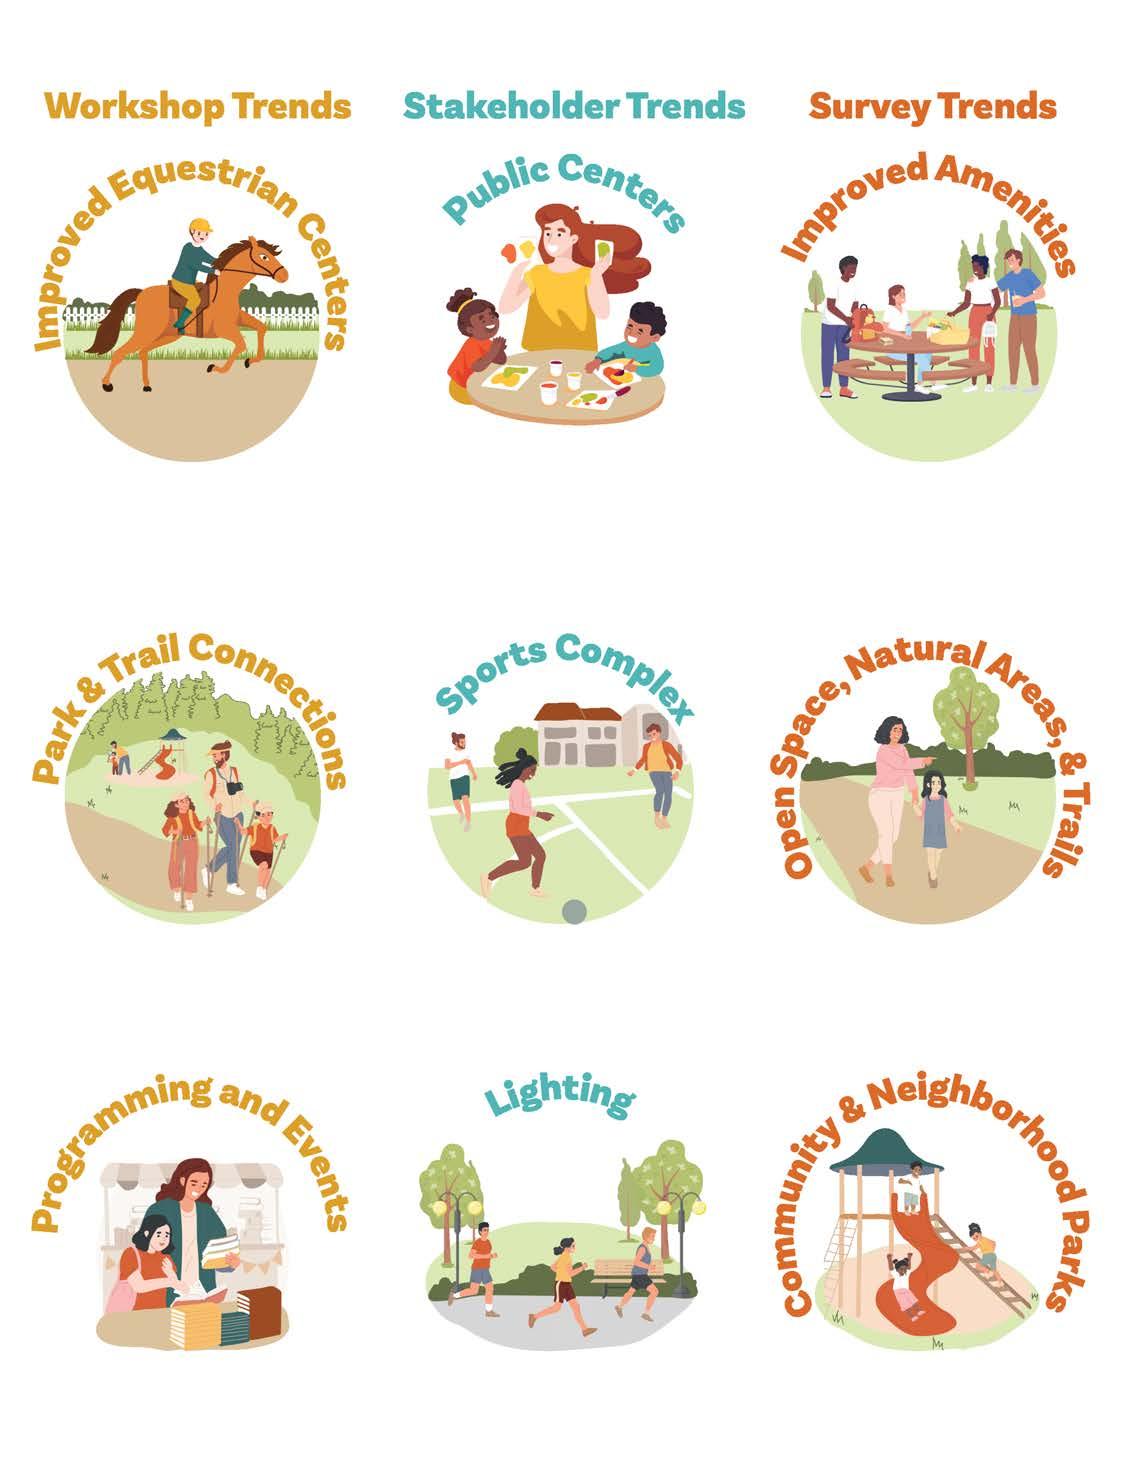
Better trail connections are strongly desired, especially in the northwestern part and eastern parts of Moreno Valley, with a focus on connections to Lake Perris.
New public centers like recreation centers, community centers, new senior centers are all desired.
Many survey respondents have a desire to improve the existing amenities at parks.
Stakeholders would like to see a large sports complex to hold regional tournaments.
More access to open spaces, natural areas, and trails is strongly desired.
More programs for teens, seniors, and adults, as well as new special events are desired.
Lighting and additional safety features are wanted at parks and facilities.
Additional community and neighborhood parks are desired.
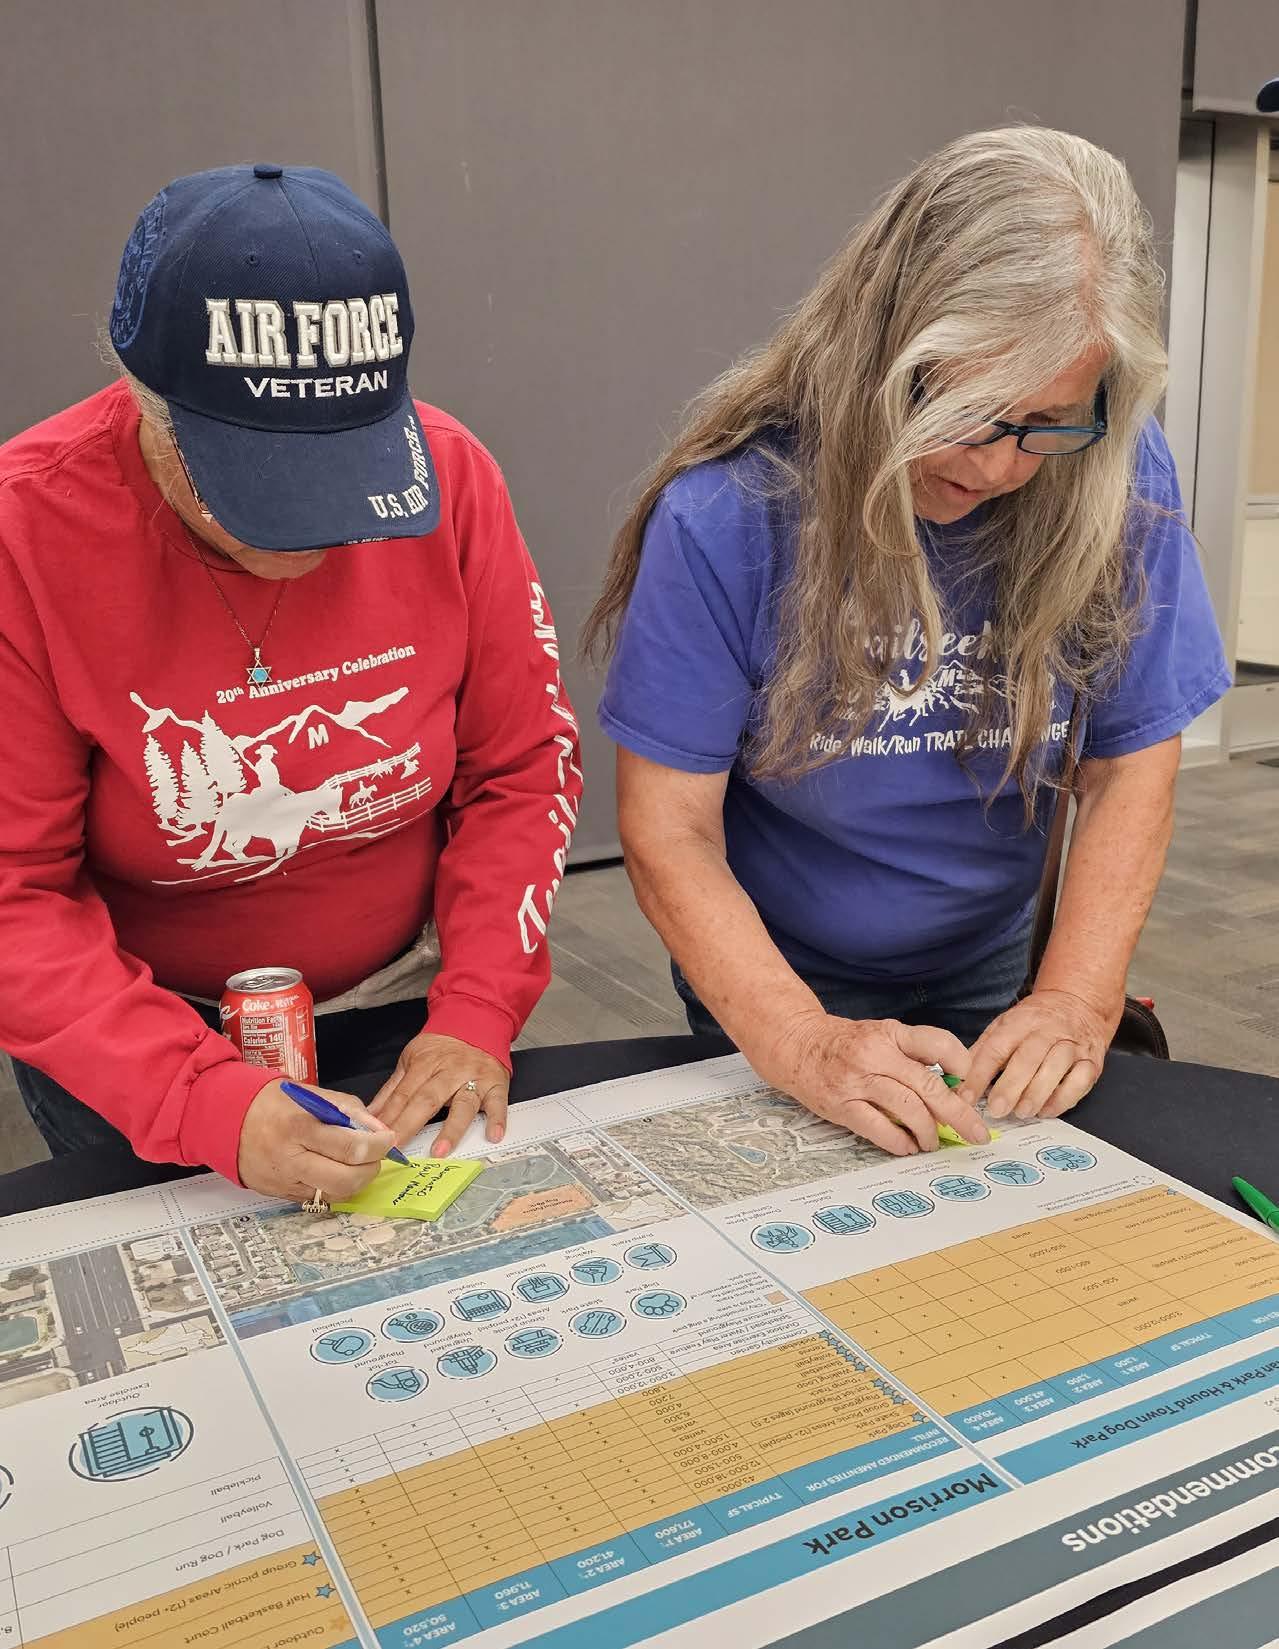
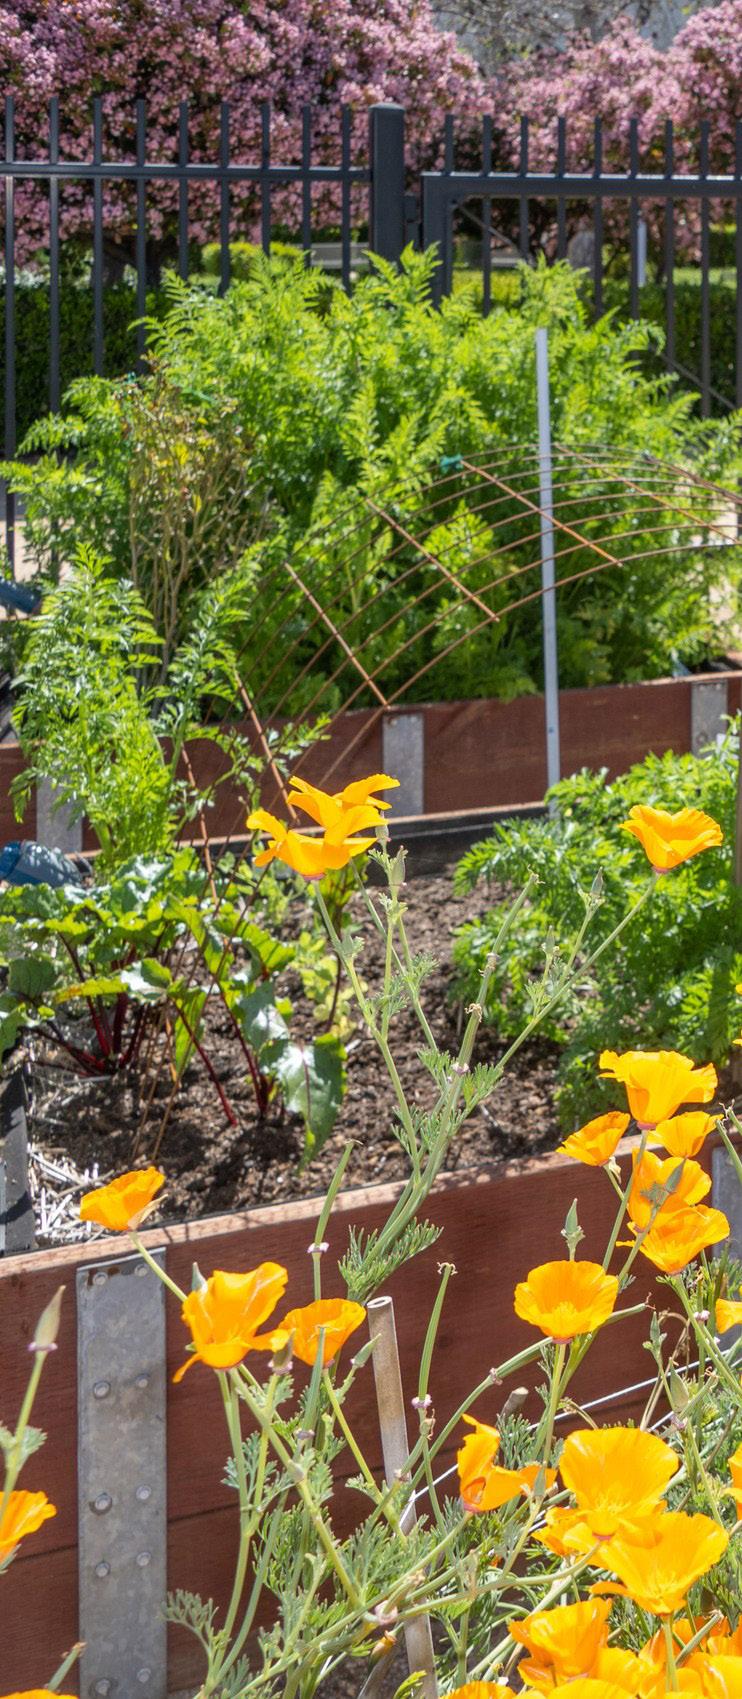
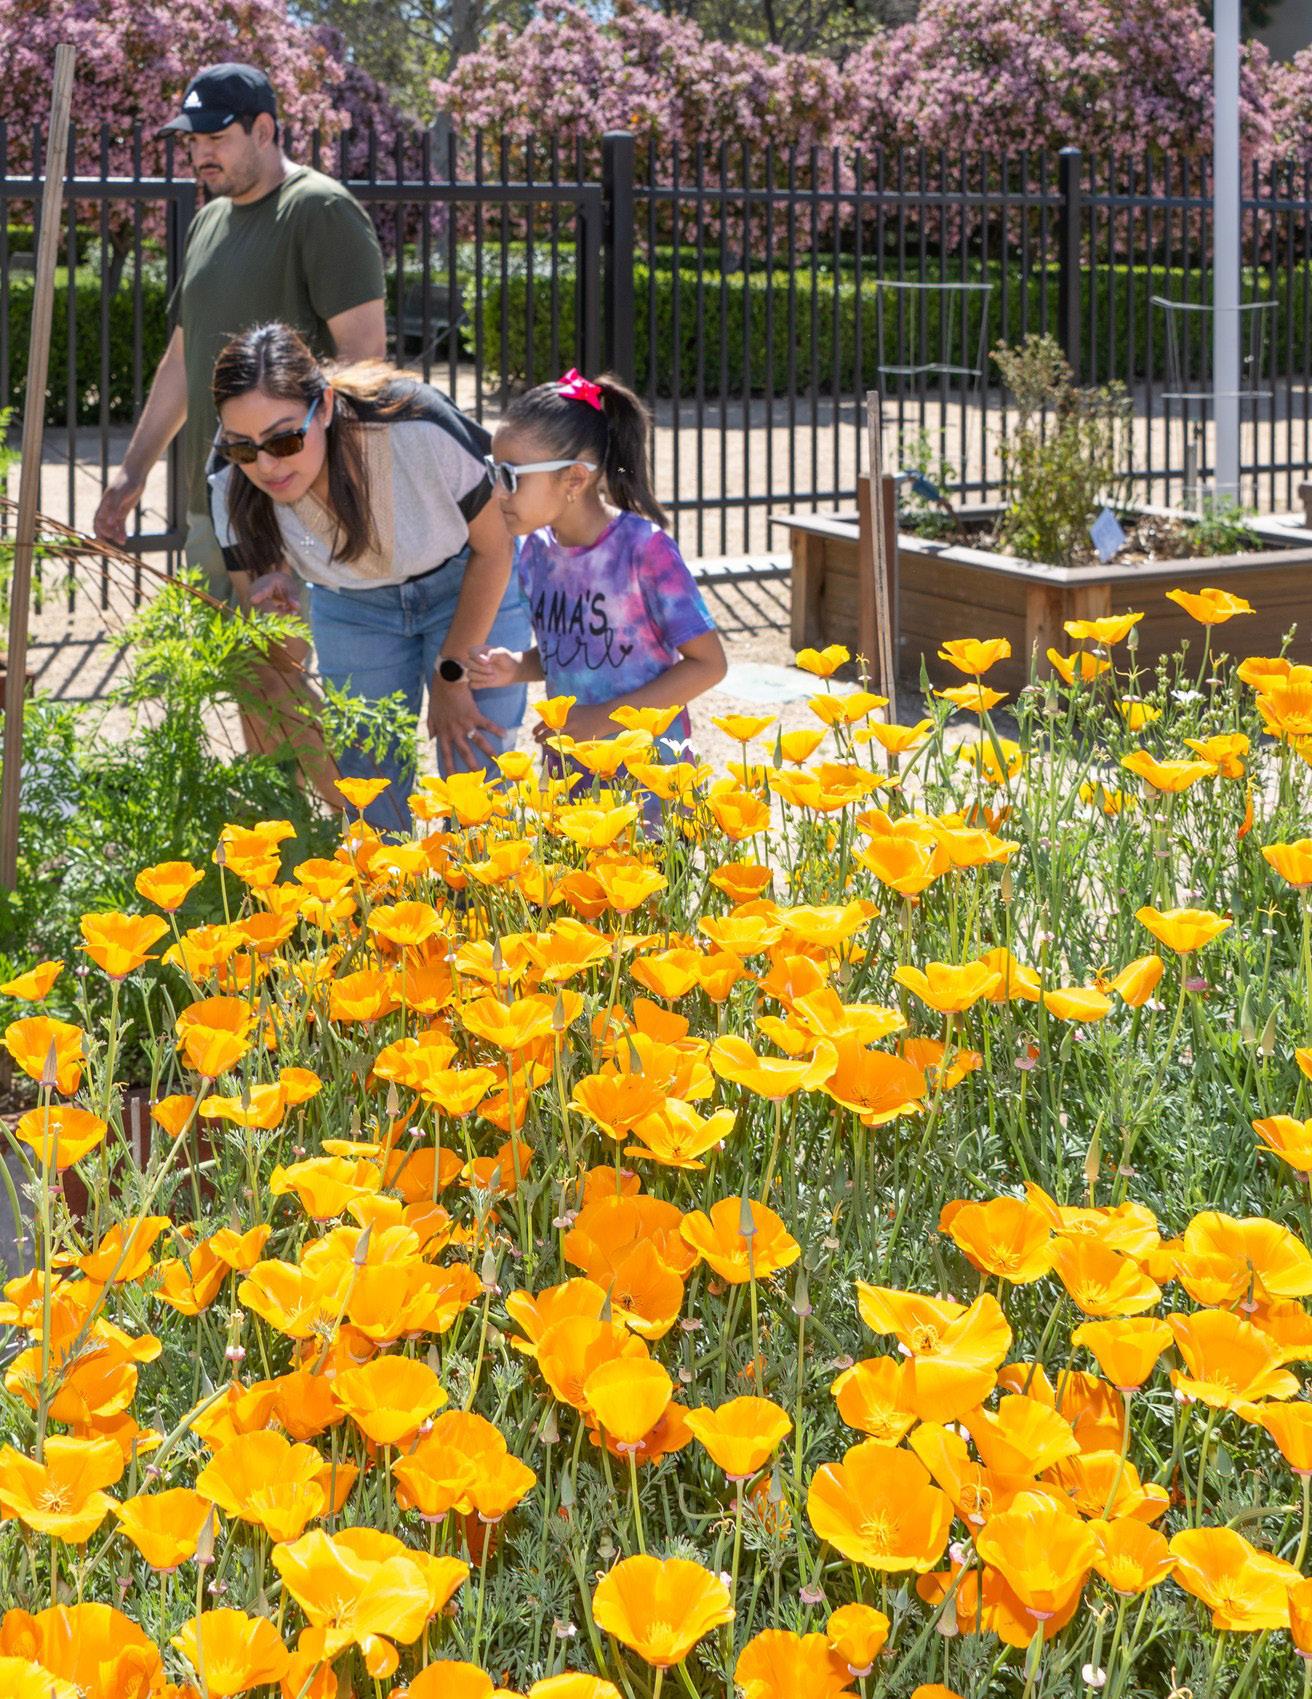
The future of Moreno Valley’s parks and recreation system will depend on actions that combine infrastructure, programming, and financial elements. This recommendations chapter begins with eight overarching initiatives that are intended to guide the City’s efforts over the next ten years. Each initiative is supported by various objectives and actions that can assist with implementation.
The remaining recommendations in this Chapter are based on the findings from the existing conditions analysis, community engagement, and the comparative analyses described in the previous chapters of this Plan. These recommendations are also intended to be consistent with the Moreno Valley General Plan (2021).
INITIATIVE
Initiatives represents an overarching topic related to parks and recreation.
Objectives provide direction to help create the positive change the City envisions.
ACTION
Actions are well-defined steps needed to achieve objectives.
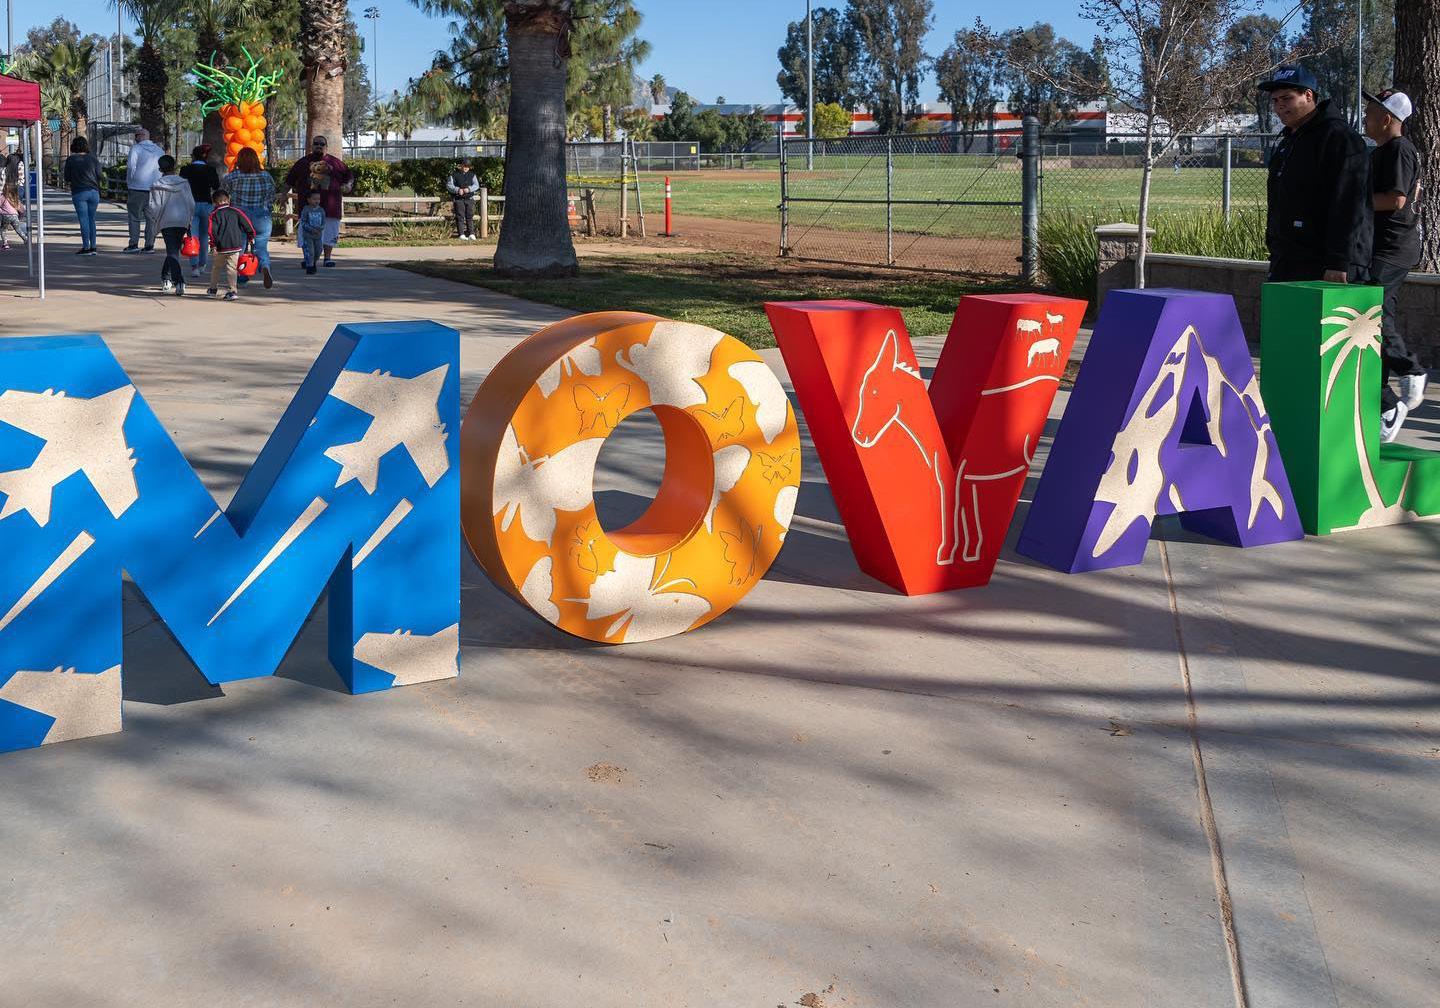
The Plan recommendations provide a clear set of goals for how Moreno Valley can continue to grow, plan, design, and implement park projects and programs into its park and recreation system. The eight initiatives are defined below.
MAINTENANCE


Parks and recreation facilities are the foundation of Moreno Valley’s Parks & Community Services Department. Parks and recreation facilities are the physical locations that enhance the quality of life of residents. Although Moreno Valley is already home to a large number of parks, the City is encouraged to explore additional ways to maintain and enhance their park system. The City’s demographics will continue to evolve and so will the recreation needs. The following objectives can help guide and prioritize physical infrastructure improvements throughout the City.
ObjECTIvE 1: Explore the improvement and equitable distribution of existing and future parks.
ACTION 1.1: Aim to maintain a standard/goal of three acres of parkland per 1,000 residents.
ACTION 1.2: Increase the acreage of parks in Moreno Valley to serve the needs of the growing and diverse population.
ACTION 1.3: Improve the planning process of developer-built parks to include park amenities with the highest deficits.
ACTION 1.4: Encourage public participation in the park planning process for amenities, facilities, and programming.
ACTION 1.5: Locate new neighborhood parks and open spaces along accessible bicycle and pedestrian routes.
ACTION 1.6: Prioritize new parks and open spaces in underserved neighborhoods.
ACTION 1.7: Coordinate with youth sports leagues, such as football and baseball, to improve or expand fields for tournaments to spurn participation and economic growth and return.
ObjECTIvE 2: Expand existing and develop new parks and recreation facilities.
ACTION 2.1: Explore incorporating community gardens within parks to promote the production of local foods.
ACTION 2.2: Evaluate locations for the development of splash pads and other amenities for youth.
ACTION 2.3: Develop outdoor fitness spaces that would encourage activity and wellness among adults.
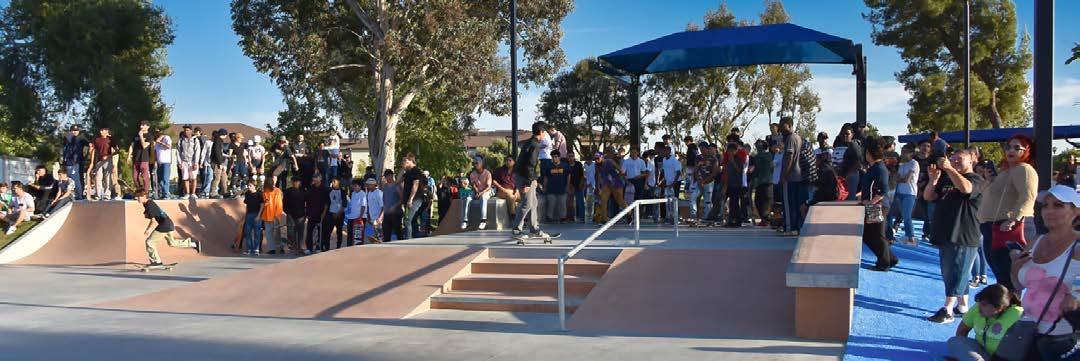
ACTION 2.4: Expand existing and develop new walking trails and recreational areas that promote outdoor fitness.
ACTION 2.5: Develop strategically placed open spaces to provide additional opportunities for community members to utilize Moreno Valley’s outdoor areas.
ObjECTIvE 3: Improve the current offering of indoor facilities, recreation, and community centers.
ACTION 3.1: Identify underutilized areas within Moreno Valley’s priority and underserved areas for the addition of new indoor facilities.
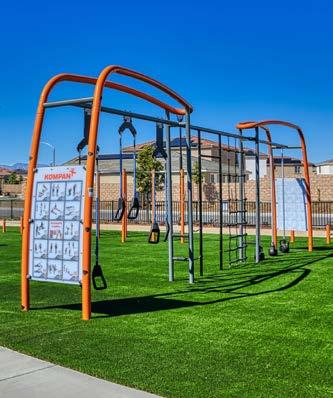
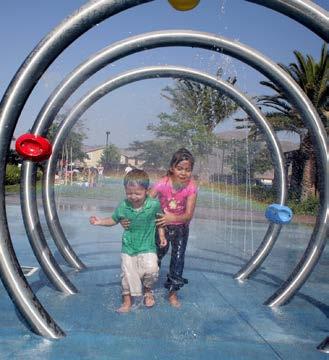
ObjECTIvE 4: Improve park maintenance for higher-quality parks.
ACTION 4.1: Encourage partnerships, such as “Beautify MoVal”, for existing and future efforts to maintain and improve parks.
ACTION 4.2: Conduct a detailed facility conditions assessment to ensure each park includes features such as lighting, seating, and restrooms.
ACTION 4.3: Maintain an appropriate number of park maintenance staff to ensure clean and safe parks as much as possible.
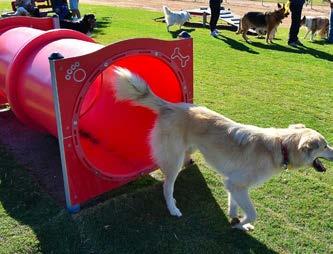
ObjECTIvE 5:
Integrate parks with new development projects.
ACTION 5.1: Integrate parks, trails, and public spaces into new residential developments to contribute to the livability of neighborhoods.
ACTION 5.2: New parks should be developed outside of the 65 decibel noise contour and require noise buffering if located near sensitive land uses.
ACTION 5.3: Parks, recreational facilities, and public spaces should be designed for future ease of maintenance.
ACTION 5.4: Landscape and site design measures help ensure the integration of safe parks and open spaces into adjacent development.
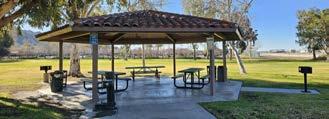
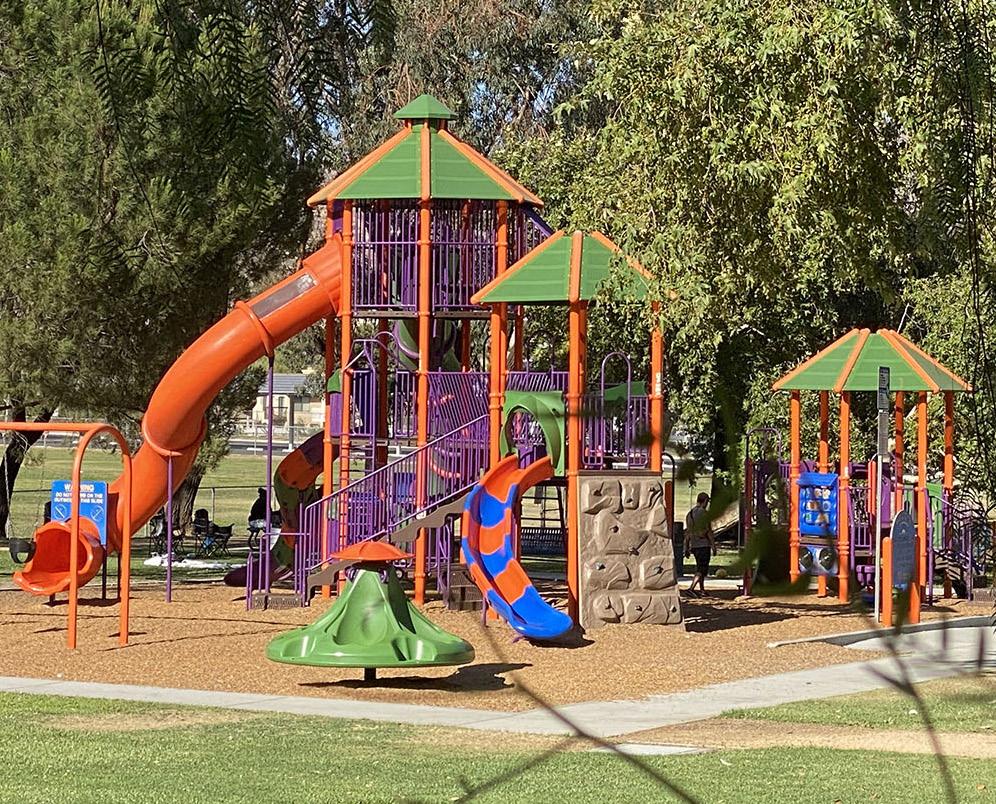
While physical park infrastructure is the foundation of a modern, robust, and diverse park system, programs and services are what bring parks to life. Programs allow community members to engage in fun and diverse physical and mental activities, learn new skills, socialize, and become involved members of the community. The Programs and Services Initiative aims to provide Moreno Valley with additional programs to meet the needs of the growing and evolving community.
ObjECTIvE 1: Provide recreation programs to accommodate the diverse interests, needs, ages, and cultural backgrounds of Moreno valley residents.
ACTION 1.1: Develop additional programming for adults, such as sports activities and non-sport programs (yoga, meditation, arts and crafts, ballet classes, board games, etc.).
ACTION 1.2: Develop additional programming for teens like additional sports programs (ultimate frisbee, lacrosse, rugby, etc.) and non-sports programs (i.e., arts and crafts, field trips, BMX, etc.)
ACTION 1.3: Continue to implement non-traditional programs such as CPR, personal safety, and martial arts classes, with an emphasis on programs for adults and seniors.
ACTION 1.4: Expand indoor programming to provide alternative recreational options (board games, video games, karaoke, cultural workshops, arts and crafts, additional fitness classes, etc.).
ACTION 1.5: Engage with residents and stakeholders to identify additional programs that respond to growing or changing interests.
ObjECTIvE 2: Promote community health and wellness through programs, services, and events.
ACTION 2.1: Continue to promote community health and active living through City-sponsored initiatives, events, and activities (i.e., Healthy MoVal, Community Demonstration Garden).
ACTION 2.2: Expand community education programs on healthy eating habits and lifestyles, including topics such as nutrition, physical activity, and vegetable gardening.
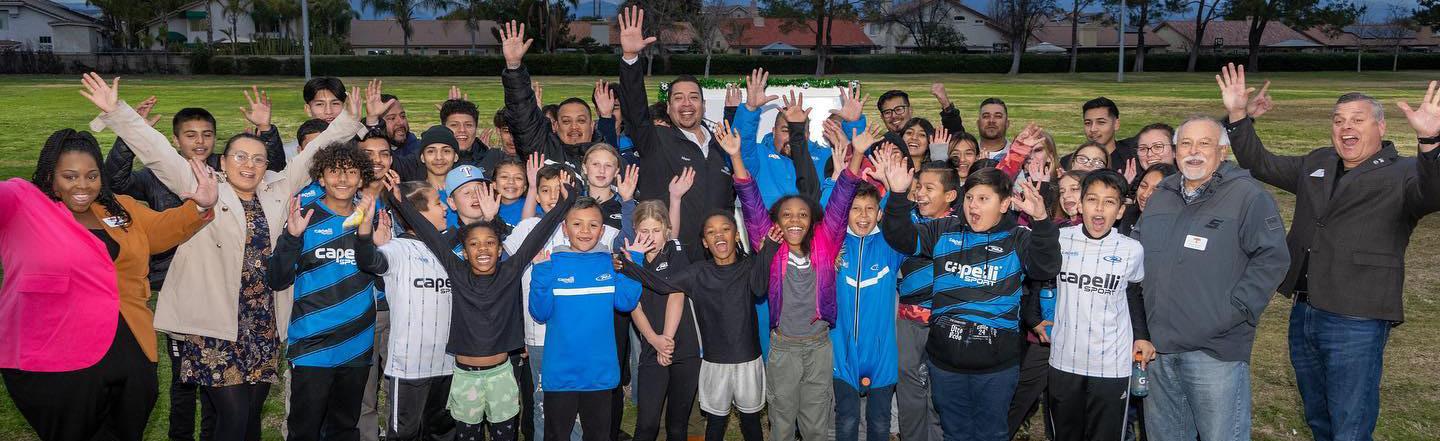
ACTION 2.3: Communicate through the libraries, Senior Community Center, and Teen SPOT (Support, Programs, Opportunities & Technology) to provide informational resources about health.
ACTION 2.4: Collaborate with local health officials, nonprofit organizations, hospitals, health clinics, and community groups to provide programs and host events that promote health and wellness.
ObjECTIvE 3: Raise awareness of parks and recreation programs offered by the City.
ACTION 3.1: Promote broad awareness of the recreation opportunities offered in Moreno Valley through social media campaigns, email and mailed newsletters, word-of-mouth, posted flyers, paid advertisements, and other forms of targeted outreach.
ACTION 3.2: Provide recreation programs in a variety of locations to make participation convenient and accessible.
ACTION 3.3: Increase public awareness of youth programs in Moreno Valley through the development, maintenance, and promotion of a central directory of programs serving Moreno Valley youth.
ACTION 3.4: Increase youth program participation by expanding the number of Teen SPOT’s available to low-income youth.
ObjECTIvE 4: Partner with public and private entities to provide programs and services that support families and meet the diverse needs of community members of all ages, backgrounds, and interests.
ACTION 4.1: Continue partnerships to provide access to aquatics programs, such as swim lessons and water aerobics classes.
ACTION 4.2: Develop partnerships with businesses, community organizations, and non-profits to supplement and sponsor City programs and events.
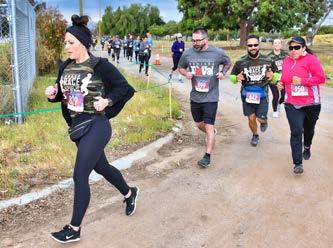
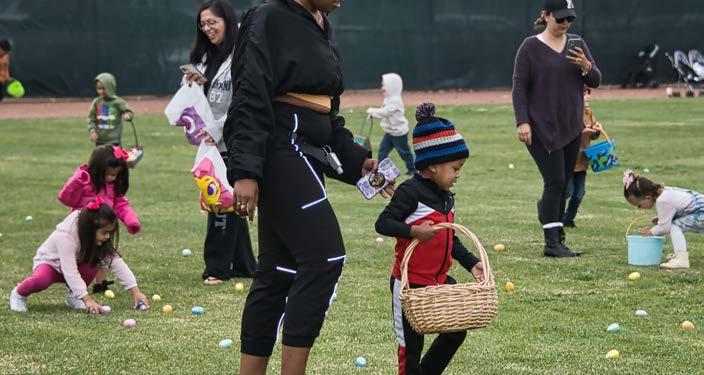
Placemaking is a collaborative process that takes place between the government and community members to create public spaces that the community loves and feels connected to. Healthy placemaking ensures that the context of the local environment shines through the design and intent of the park or public space. The Placemaking Initiative encourages the celebration of community diversity, culture, local context, and history at parks and recreation facilities in Moreno Valley.
ObjECTIvE 1: Foster the use of arts and culture in the parks and trail systems.
ACTION 1.1: Encourage public art that represents the history, heritage, culture, and identity of Moreno Valley.
ACTION 1.2: Continue to collaborate and support local artists and students to create local art.
ACTION 1.3: Continue to utilize the Public Art Development Impact Fees to add art to public property throughout the city.
ACTION 1.4: Gather public and private resources for future funding that can support visual and performing arts, as well as cultural development goals and activities.
ACTION 1.5: Locate areas at City parks and trails for opportunities for art installations.
a unique sense of place and pride in Moreno valley parks and trails.
ACTION 2.1: Create design guidelines for streetscape design, signage, lighting, and building materials.
ACTION 2.2: Design unique architectural elements or entry towers for key intersections, gateways, or park/trail entrances.
ACTION 2.3: Incorporate unique traits of Moreno Valley into park and trail identity.
ACTION 2.4: Integrate social gathering places such as plazas and amphitheaters into new and existing parks.
ACTION 2.5: Ensure new park amenities or features reflect the surrounding neighborhood character.
Celebrate the history of Moreno valley.
ACTION 3.1: Recognize historic structures and sites in the city as historic places.
ACTION 3.2: Use historic artifacts as inspiration for placemaking items or themes at parks.
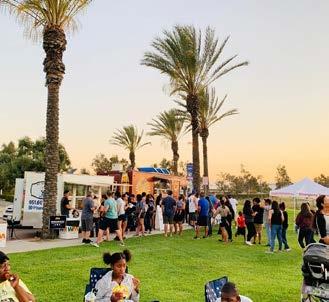
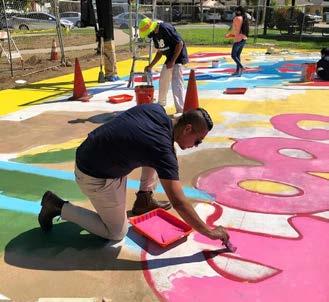
It is not possible to achieve a high-quality park and recreation system without a team of passionate maintenance staff and an efficient maintenance system. Regularly maintained parks increase park use and overall community satisfaction. The Maintenance Initiative aims to increase the efficiency and skills of the park and recreation maintenance staff to increase the overall quality of parks.
Maintain high-quality parks and recreation facilities through better park maintenance and operations.
ACTION 1.1: The City should develop minimum service levels and standards for park maintenance and develop a program to document them.
ACTION 1.2: Contracts for services should use the minimum service levels as specifications for work.
in City parks by investing in City maintenance staff.
ACTION 2.1: Add a parks maintenance inspector for daily documentation and review of maintenance contract performance and to monitor maintenance needs throughout the city.
ACTION 2.2: Invest time for staff training on maintenance standards and specialty maintenance areas, such as irrigation management and playground inspection, to increase capacity and skillsets and provide cross-coverage for maintenance operations.
ACTION 2.3: Add an additional parks maintenance staff member to assist in diamond field maintenance.
ACTION 2.4: Additional support through contracted services or an additional staff position (minimum 0.5 FTE) is necessary to maintain the potential seven new parks recommended in the following sections.
modern technology to increase maintenance efficiency.
ACTION 3.1: Using City GIS data, procure and implement a computerized maintenance and asset management system to manage and regulate work and document coverage.
ACTION 3.2: Integrate contracted and in-house maintenance operations into this system to document needs and guide the City’s Parks Rehabilitation & Refurbishment Program in the future.
Providing a safe, comfortable, and convenient trails network between parks, schools, and residential areas is the key to making parks and facilities more accessible to the community. Residents are more likely to walk, bike, or ride their horses to these community facilities when there is a safe and pleasant route to do so. The Trails and Connectivity Initiative aims to give the City the means to create infrastructure to better connect residents to parks, improve the trail system in Moreno Valley, and promote active transportation.
ObjECTIvE 1: Explore opportunities to increase equestrian trails and amenities.
ACTION 1.1: Ensure existing and future staging areas can accommodate quality amenities (restrooms, parking, interactive kiosks, security cameras, wayfinding, etc.).
ACTION 1.2: Provide sufficient resources for the maintenance of trails and staging areas through a combination of grant funding, City resources, and volunteer efforts.
ACTION 1.3: Work with community members to plan and develop trail infrastructure, such as enhanced crossings, closing gaps, lighting, and wayfinding.
ACTION 1.4: Explore installing a traffic signal at Redlands Boulevard and Locust Avenue for safer pedestrian and equestrian crossing.
ACTION 1.5: Coordinate with Riverside County to connect trails through Reche Canyon between the Sunnymead Ranch Staging Area and the Moreno Valley Equestrian Staging Area.
ACTION 1.6: Coordinate with public and private entities to link regional open spaces with a network of paths and trails, including connections to Moreno Valley’s multi-use trail system.
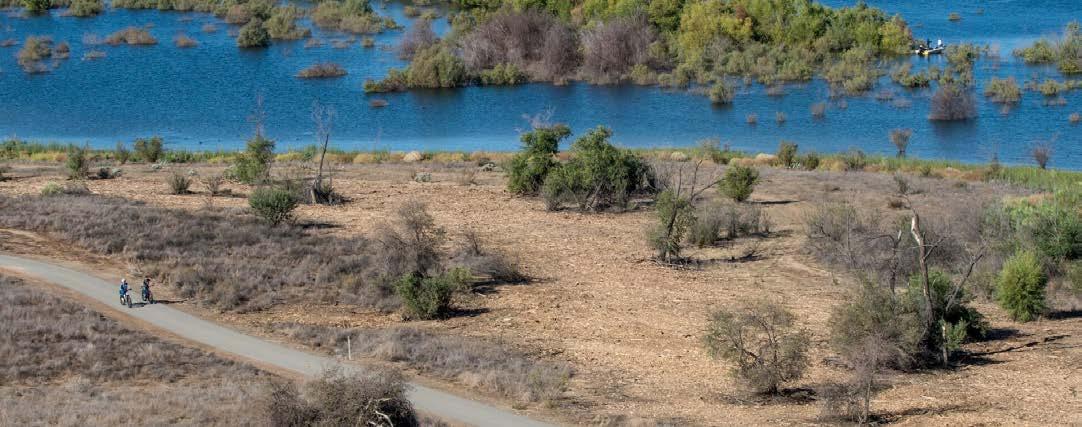
ObjECTIvE 2: Enhance connections and entry points into parks, trails, and open spaces.
ACTION 2.1: Explore installing curb ramps and closing gaps along sidewalks within a quarter mile of parks, trails, and open spaces.
ACTION 2.2: Improve or create new access points to trails from neighborhoods, where appropriate.
ACTION 2.3: Expand Moreno Valley’s network of multi-use trails and provide connections from residential and commercial areas.
ACTION 2.4: Incorporate wayfinding, entry monuments, security cameras, signage, and educational kiosks at trail entry points and staging areas to encourage trail use.
ACTION 2.5: Explore programs that connect equestrian riders to future multi-purpose trails within Moreno Valley.
ACTION 2.6: Consider adding ADA-accessible trails.
ObjECTIvE 3: Create walkable and bike-friendly networks that lead to parks and trails.
ACTION 3.1: Provide more walking trails and enhance the existing trails to promote health and wellness.
ACTION 3.2: Implement traffic calming elements on streets that create a bicycle and pedestrian-friendly environment to trails and parks.
ACTION 3.3: Explore the potential for off-street trails and non-motorized connections between parks and Moreno Valley’s existing multi-use trail system.
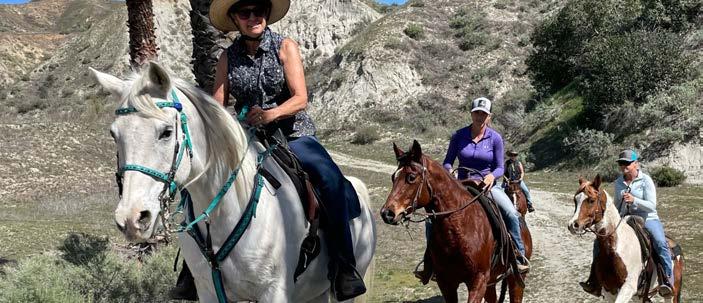
ACTION 3.4: Create a network so that all residents of the future Downtown Center are within a half-mile walk of parks, trails, and open spaces.
ACTION 3.5: Work with interested community members and organizations to plan and develop an exercise circuit that takes advantage of existing parks, trails, and other pedestrian infrastructure. The course should be clearly marked, and contain simple stations and diagrams for self-guided training.
ACTION 3.6: Implement the multi-use trail recommendations from the City’s Bicycle Master Plan.
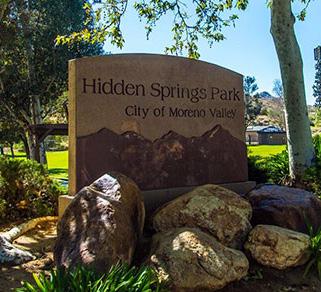
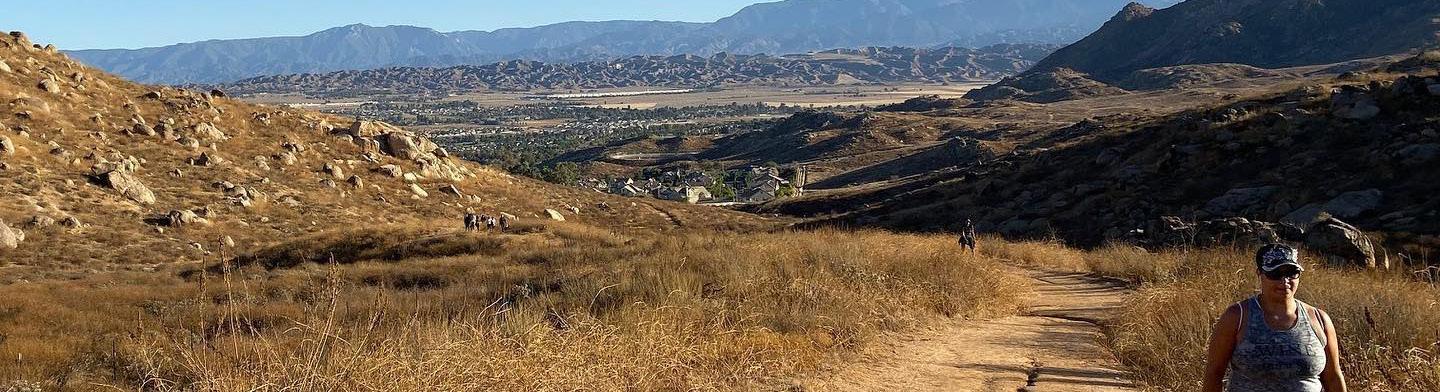
Passionate, innovative, and efficient City staff provide the park system with the tools it needs to be successful. City staff perform essential administrative tasks that determine the success of programs, special events, parks, and facilities. The Administrative Initiative is intended to improve the effectiveness and efficiency of the City’s Parks and Community Services Department to better serve the needs of the growing community.
ObjECTIvE 1: Increase overall community satisfaction with the parks and recreation system.
ACTION 1.1: Conduct park user and program participant satisfaction surveys quarterly or semi-annually to address issues and highlight successes promptly.
ObjECTIvE 2: Enhance the park user experience by considering infrastructure enhancements.
ACTION 2.1: Increase facility usage by installing lighting to allow for park use beyond daylight hours.
ACTION 2.2: Continue to improve the overall maintenance program. This will allow for continuous improvement of equipment, maintenance, and park cleanliness (i.e., establish janitorial and maintenance plans to address issues promptly and consistently).
ObjECTIvE 3: Develop partnerships to improve and expand access to parks and recreation facilities.
ACTION 3.1: Work with Moreno Valley Unified School District and Val Verde Unified School District to expand the shared use of parks and recreational facilities.
ACTION 3.2: Develop relationships with local businesses, clubs, and organizations to seek funding, volunteers, and marketing support to expand programs and facilities.
ACTION 3.3: Recruit volunteers to help operate and run programs.
ACTION 3.4: Review current contacts with partners and seek out new public/private partnerships to enhance amenities.
ACTION 3.5: Identify partnerships with other organizations that can provide additional programming space where needed.
ACTION 3.6: Update and expand joint-use agreements with local school districts.
ACTION 3.7: Generate partnerships with organizations that can help with park maintenance and clean-up.
ACTION 3.8: Evaluate land for potential purchase and re-purposing as parkland.
ObjECTIvE 4: Staff appropriately to meet current demand and maintain established quality service.
ACTION 4.1: Align staffing levels with future park, facility, and programming enhancements.
ACTION 4.2: Identify current performance standards.
ACTION 4.3: Assess the need for additional maintenance staff, program staff, and resources at the seven potential new parks and other upgraded facilities.
The sustainable management of financial resources is critical to maintaining existing parks and facilities and developing new infrastructure. A healthy and well-balanced budget is the foundation of a well-operated and well-maintained park and recreation system and enables opportunities for future growth. The Financial Initiative provides the City with a set of actions to support long-term financial sustainability, as well as the expansion of Moreno Valley’s parks, facilities, and programs.
ObjECTIvE 1: Increase funding for parks and recreation facilities and programs.
ACTION 1.1: Leverage City funds to access grants for the construction and maintenance of parks and facilities from federal or state governments, philanthropic organizations, or private partners.
ACTION 1.2: Consider increasing program user fees that coincide with the development of expanded programming.
ACTION 1.3: Investigate the feasibility of new park financing strategies, such as impact bonds or public-private partnerships that make strategic use of public investment for community benefit.
ACTION 1.4: Utilize impact fees and CFDs to help fund existing park and facility renovations and new parks and facilities.
ACTION 1.5: Expand the use of grants and sponsorships to subsidize and offset costs of community benefit programs.
ACTION 1.6: Evaluate the use of additional contracted services for Cottonwood Golf Center and other programs to allow for more cost-effective use of city resources.
ACTION 1.7: Continue tracking NRPA, CRNA, OGALS, LWCF, CRPS, American Trails, and Education in Arts for grants.
ACTION 1.8: Utilize NRPA’s Foundation Center for links to thousands of grant opportunities, grant education, and training.
Assess existing funding sources and structures to identify opportunities for improvement.
ACTION 2.1: Periodically assess in-lieu parkland dedication fees, park improvement impact fees, and other fees and charges to ensure they are adequately providing for community need and are competitive within the region.
ACTION 2.2: Consider dedicating additional City funds to the maintenance of parks.
ACTION 2.3: Consider allocating additional City funds towards community events and programming to encourage more community members to use the park system.
ACTION 2.4: Develop targeted cost recovery policies based on program areas (rentals 80-100%, youth sports 20-50%, etc.)
ACTION 2.5: Continue to evaluate existing fee levels on an annual basis to allow for increased cost recovery.
ACTION 2.6: Capture indirect costs when setting fees to allow for full cost recovery on programs.
ACTION 2.7: Consider creating a parks and recreation-specific Impact fee applicable to residential projects to allow for a dedicated capital funding source.
ACTION 2.8: Explore the creation of CFD(s) for new park facilities being proposed to help offset general fund costs.
Developing the use of more technological resources at parks and facilities can help improve the overall park and recreation system. The Safety and Technology Initiative’s goal is to provide the City with actions to address park safety concerns through the utilization of technology and park design best practices.
ObjECTIvE 1: Develop and use technology within parks and recreation facilities and programs.
ACTION 1.1: Offer video crime reporting services that allow residents to contact the Moreno Valley Police Department and interact with officers in real time.
ACTION 1.2: Facilitate installment of advanced technology infrastructure for high-speed internet access and solar energy at parks.
ACTION 1.3: Continue the implementation of Wi-Fi technology, or Wi-Fi gardens, at all Moreno Valley parks.
ACTION 1.4: Increase the use of security cameras at parks and trailheads where safety concerns and other issues have been mentioned.
ACTION 1.5: Utilize blue light emergency phone towers at parks and trails that can provide communication in times of emergencies.
ACTION 1.6: Develop digital methods to reach community members and increase awareness of City programs and events (smartphone app, push notifications, etc.).
ObjECTIvE 2: Promote safety and security at Moreno valley parks and recreation facilities.
ACTION 2.1: Collaborate with the Police Department to invest in strategically placed cameras to better promote a sense of security throughout the parks.
ACTION 2.2: Coordinate with the Police Department to increase the police presence throughout the parks, especially in areas where incidents and crime have been reported.
ACTION 2.3: Install time-controlled or automatic lighting for better visibility and easily accessible emergency phones throughout parks and open spaces to increase safety.
Implement safety and accessibility design guidelines for parks and services.
ACTION 3.1: Design new parks with natural surveillance features, such as strategically placing physical features and activities to maximize the visibility of surrounding activity.
ACTION 3.2: Incorporate ADA accessibility at all parks and facilities.
ACTION 3.3: Establish and integrate safe and highly visible crosswalks, playgrounds, and bicycle access away from main streets.
ACTION 3.4: Incorporate vegetation and fencing as a buffer zone from vehicles.
4: Use park features to increase park safety.
ACTION 4.1: Increase lighting in all Moreno Valley Parks, paths, and low visibility areas.
ACTION 4.2: Maintain all park restroom facilities and install self-locking doors to reduce unauthorized use after hours.
5: Offer opportunities for virtual programs, events, and activities.
ACTION 5.1: Explore additional programs and activities that can be supported through virtual classes such as those in the City’s CLIC (Community Learning Internet Connectivity) initiative.
ACTION 5.2: Assess if any existing recreational programs can additionally be held as virtual classes to reach a broader audience.
Continue developing Moreno valley’s GIS databases.
ACTION 6.1: Continue to build the City’s GIS database for all of the City’s mapped parks, park amenities, and trails data.
ACTION 6.2: Continue working with the Police Department to collect and map crime data to monitor safety issues.
The population of Moreno Valley is projected to grow significantly by the year 2045 due to expected economic growth and development, bringing physical and demographic changes to the city. The population is expected to grow by 29.7 percent to a total of about 266,800 and the number of employment opportunities is expected to nearly double, increasing from 35,500 to about 65,000. These changes will bring new needs to the City’s parks and recreation system. It is assumed that the new population will use the City’s existing parks and facilities, which will add demand to the existing park system. This section analyzes how the projected growth will impact the City’s parks and recreation system and identify where park acreage and amenity deficits are expected to increase.
The projected population growth will also bring changes to the population LOS by the year 2045. If no new parks were to be added to the City’s park and recreation system by the year 2045, the park acres per 1,000 residents would decrease to -1.46 park acres per 1,000 residents, leaving the City 389 park acres short of reaching its goal of 3 park acres for every 1,000 residents (Table 4-1). The City will require additional parkland to address its current park deficit and to prepare for future population growth.
Table 4-1: Future Population LOS
Table 4-2 uses the 2045 population projection to determine future amenity surpluses and deficits in the overall park system. Using the future population projections, all of the amenity deficits increase. Table 4-2 assumes that the City does not add additional park amenities between now and 2045. Every amenity will be in a deficit by the year 2045 if the City does not add new amenities. This analysis highlights the need for additional park amenities at existing parks and for new parks to be more highly-amenitized for more efficient use of space at parks.
Section 4.13 of this chapter identifies potential opportunity areas at each park and recommended amenities for each existing park site.
LEVEL OF SERVICE FOR BOTH 2021 AND 2045 POPULATION (208,371 EST. POP. CENSUS 2021, 266,800 EST. POP. 2045 SCAG)
Many areas throughout Moreno Valley are undeveloped, a unique and advantageous scenario for a city of this size. The following section identifies seven potential sites that can be developed into future parks. These sites are located on City-owned vacant properties or on properties slated for redevelopment. The sites vary in size, from 7 acres to 43 acres, but they have the opportunity to offer residents a variety of park amenities that can address the existing park access and amenity deficits discussed in Chapter 2.
The City will need to develop individual park master plans to properly identify the challenges and opportunities each site offers. Through this process, the City will be able to design community-driven park master plans that reflect the unique character of the neighborhood, address missing park amenities, recognize the importance of maintaining open space, and assess unique challenges such as the protection of wildlife, sensitive habitats, or historical resources.
Park A - Markborough Property - 43.2 acres
This park site is located in the northernregionofthecityoffPerris Boulevard. This park site was previously identifiedintheMoreno Valley General Plan (2021) and could potentially add up to 43.2 acres to the existing park system. The terrain at this site varies but provides a great opportunity to design a large, passive park that has amenities and features such astrails,picnicareas,playgrounds, gardens, outdoor exercise equipment,educationalspaces,orhabitatrestorationareas.
ParkB - MorenoValleyMall Redevelopment Park- 5.52 acres
The existing Moreno Valley Mall is slated to undergo redevelopment in the future. This is an opportunity to design a park space that is approximately 5 acres in size. A new park in this locationwouldprovideresidents and shopping mall visitors a fun and unique recreation opportunity. Park amenities such as playgrounds, splash pads, picnic areas,or educational spaces can be incorporated. Redesigning shopping malls to include park elements has been a strategy manycities and developers have
used in the past decade. This strategy has resulted in positive outcomes for both the owner of the site and the residents that get to spend time in these spaces.
This site is located off Davis Street, just south of Ironwood Avenue. This 12.8-acre site could potentially provide a variety of new park amenities that would benefit the surrounding neighborhood and the City at large. The terrain is relatively flat which allows for an easier approach to designing amenities such as sports courts and fields, playgrounds, picnic areas, walking paths, a restroom building, and outdoor exercise equipment.
Park D - Alessandro Blvd and Day St / Edgemont - 8.2 acres
This City-owned vacant land is located off Alessandro Boulevard and Day Street. The surrounding neighborhood is one of the oldest in the City and residents currently do not have access to a park that is within a half-mile. A new park in this neighborhood would provide residents access to amenities such as a playground, picnic areas, court sports, walking path, splash pad, or outdoor exercise equipment.
Park E - Cottonwood Ave and Perris Blvd - 9.24 acres
This park site is located off Cottonwood Avenue, just east of Perris Boulevard. This 9.24-acre site can provide residents from the surrounding neighborhood access to a variety of park amenities such as a playground, picnic areas, court sports, walking path, a couple of youth-sized sports fields, or outdoor exercise equipment.
Park F - Morrison Park Expansion - 7.0 acres
Developing the open land located southwest of Morrison Park will help expand access to new amenities. Specific recommendations are identified in Section 4.13.13 of this chapter.
Park G - Redlands Blvd and Brodiaea Ave - 8.19 acres
This site is located off Redlands Boulevard and Brodiaea Avenue. This 8.19-acre site is relatively-flat, open space that would allow the City to design amenities such as sports courts, a couple of youth-sized fields, a playground, picnic areas, walking paths, a restroom building, and outdoor exercise equipment. Wayfinding and interpretive signage would also help residents learn about the surrounding open space and trail opportunities.
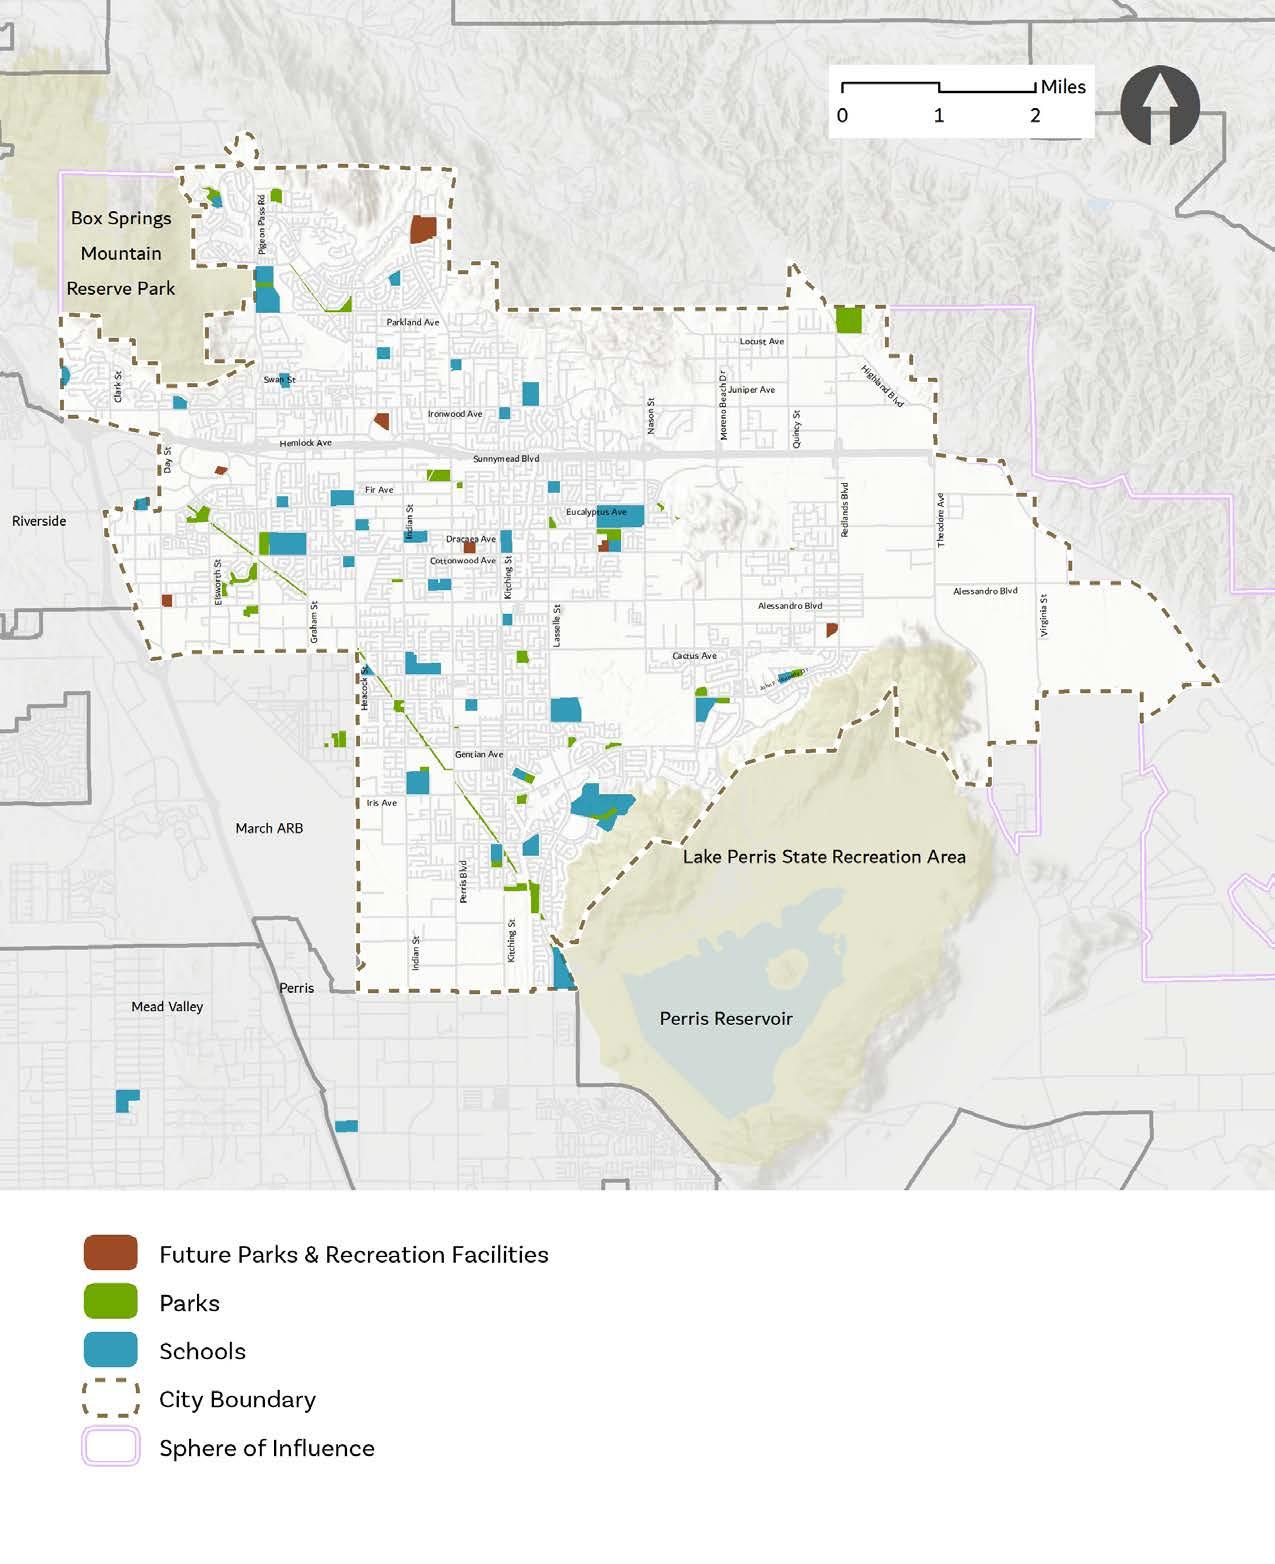
The trails shown in Figure 4-2 are the proposed multi-use trails that build upon the City’s Bicycle Master Plan (BMP) (2014), MoVal 2040 General Plan, Master Plan of Trails (2018), and World Logistics Center Specific Plan (2014). Many of these proposed trails connect to existing parks and open space, providing additional forms of transportation and helping close gaps in the existing trails network.
The proposed trails are either paved Class 1 multi-use trails, such as the Juan Bautista de Anza, or natural surface trails that can be used by bicyclists, pedestrians and equestrians. Many of these trails are located near the perimeter of the City’s boundary and connect to regional destinations such as Box
Springs Mountain Reserve, Lake Perris Recreation Area, Riverside County open space, and the San Jacinto Wildlife Area.
The recommended multi-use trails are meant to connect to other existing trails, such as the Juan Bautista de Anza trail, and to close gaps such as between Rancho Verde High School and Moreno Valley College along the perimeter of Lake Perris Recreation Area. These types of trails could provide both recreational and commuting forms of travel for residents to enjoy.
The City and the surrounding area are home to unique resources and trails to these open spaces can showcase the local geology, landform, and habitats. For example, Box Springs Mountain Reserve provides incredible views of the region while Lake Perris provides access aquatic recreation.
It is important to note a large open space area that is located in the northern area of the city. Donkeyland Rescue is a nonprofit organization that is dedicated to protecting wild burros and their habitats. Their private property creates a large east-towest barrier for those wishing to connect to City destinations via trails. There have been previous attempts to develop nature trails through this property that strike a balance between providing access to open space areas in Riverside County while protecting the goals of Donkeyland Rescue. The City is encouraged to continue conversations with Donkeyland Rescue to determine the best strategies to develop trails that respect each others’ initiatives.
The community engagement process allowed residents to identify trail-related priorities:
» Increase warning signage and traffic calming for burro crossings
» Implement the trails identified in the World Logistics Center Specific Plan
» Connect trails from the northwest Moreno Valley into County open space
» Develop a trail wayfinding program
» Analyze adding a traffic signal at Redlands Boulevard and Locust Avenue
» Analyze adding signalized equestrian crossings
» Explore adding nature center or community garden in the northeast quadrant of the city
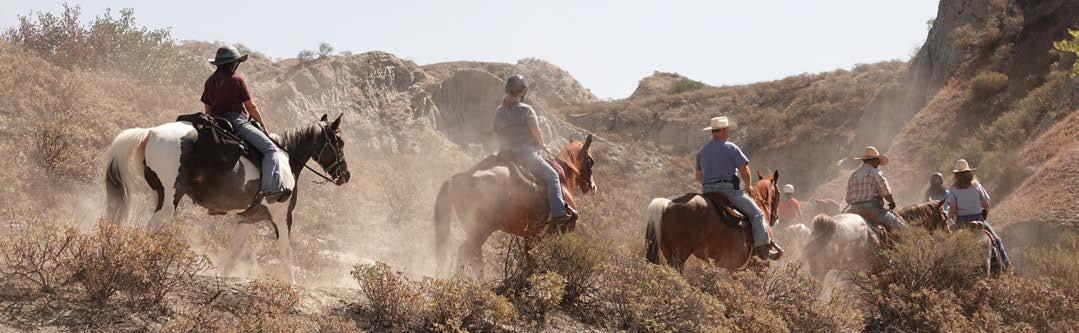

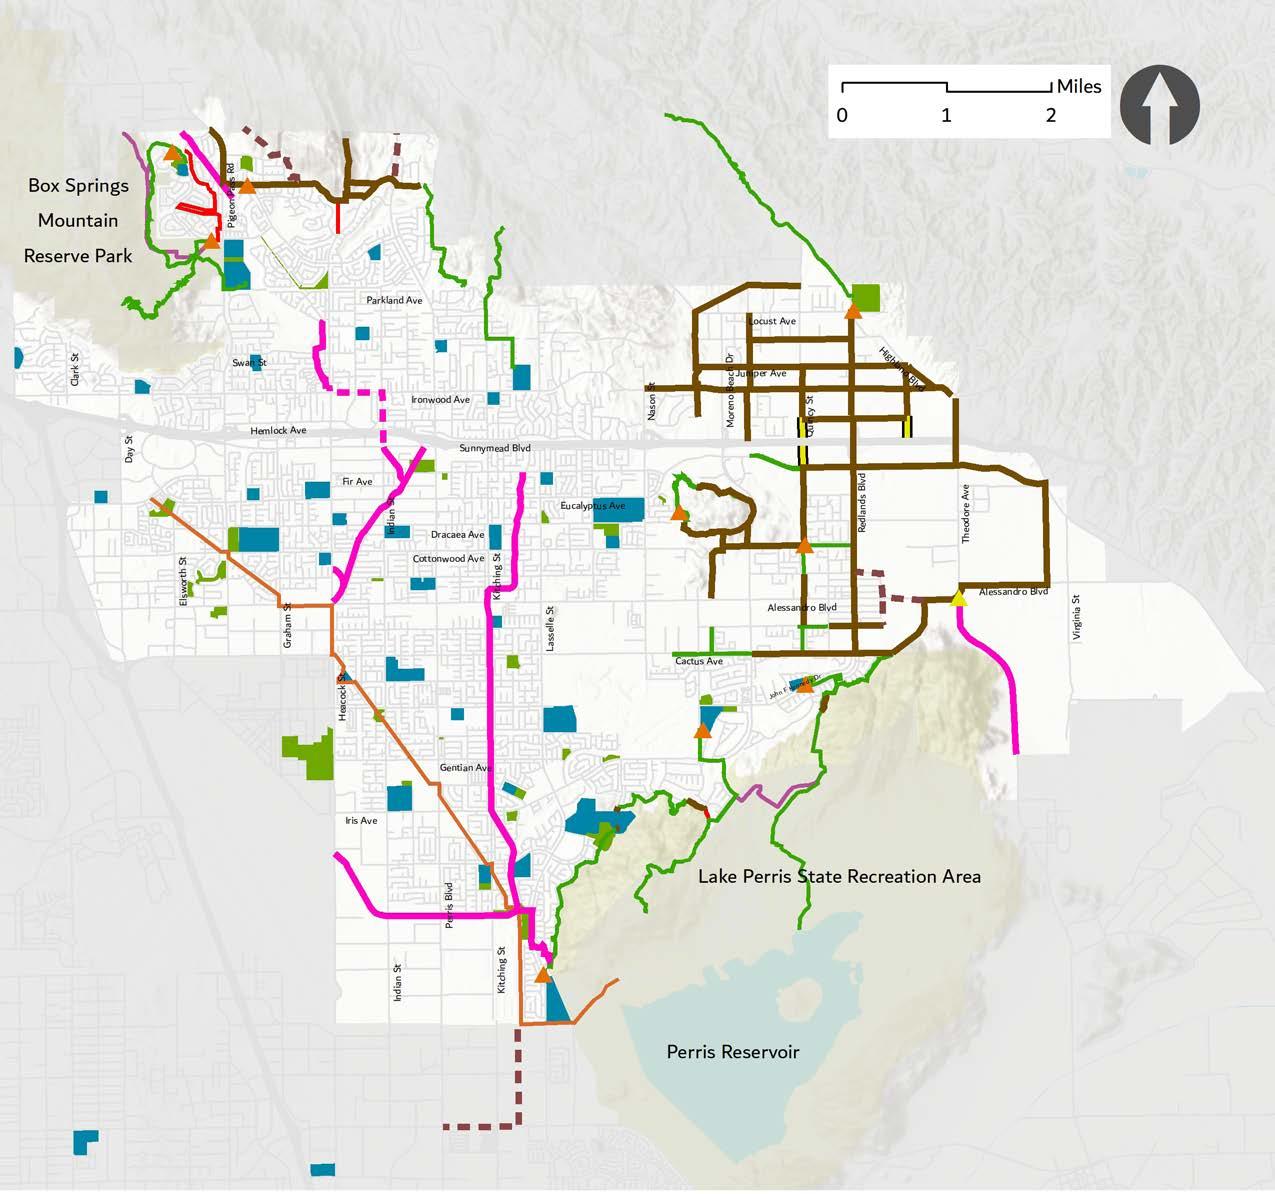


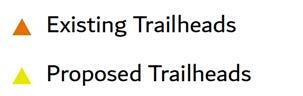
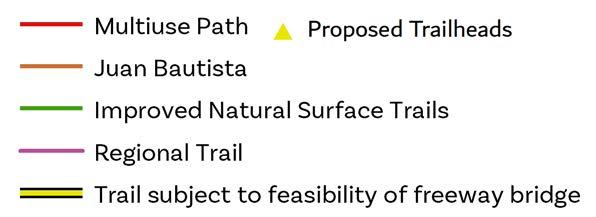
Trail Recommendations


Previously Proposed Trails
Proposed Trails
Previously Proposed Multiuse Paths (from BMP)
Multi-use Paths (from BMP)
Proposed Multiuse Paths
Pedestrian Crossings
Equestrian Crossing
Animal Crossing
Traffic Light
Potential Area for Nature Center
Making efficient use of existing park space is incredibly important when designing or redesigning parks. This section identifies underutilized park areas within existing parks and suggests recommended amenities for these infill areas. If these recommendations were to be implemented, the City could help address amenity deficits identified in Chapter 2 and help fulfill additional needs identified by the community.
The opportunity area analysis determines undeveloped or underutilized areas within a park and suggests park amenities that can potentially fit based on the square footage of the area. Each park with an opportunity area is shown alongside a table of potential amenities, supporting text, and a key map highlighting potential recommendations. The table identifies what kinds of amenities can approximately fit in the opportunity areas based on square footage and dimensions.
The amenities with an “X” indicate a need based on park amenity deficits and geographic distribution of park amenities identified in Chapter 2. The amenities listed at the top of each table (highlighted with a star) are based on community input and the analysis completed in chapter two of this Plan. The City is encouraged to explore the best options for each park and is expected to use this section of the Plan as a guide to determine which amenities to design and construct over the next ten years.
Parks with no opportunity areas and therefore not included in this analysis are Civic Center Amphitheater and Park, Fairway Park, Hidden Springs Passive Nature Park, Lasselle Sports Park, March Field Park, and Santiago Park.
Giving residents an opportunity to share their ideas for potential new park amenities at these opportunity areas was a priority during the community engagement process. Participants at the second workshop were given the opportunity to vote on their most desired amenities. These votes were tallied and integrated into the final amenity recommendations for each opportunity area.
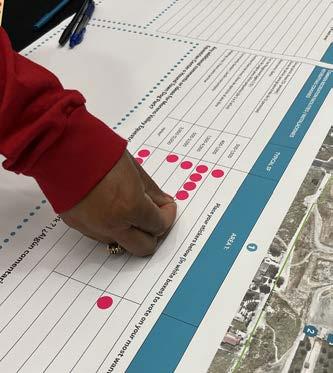
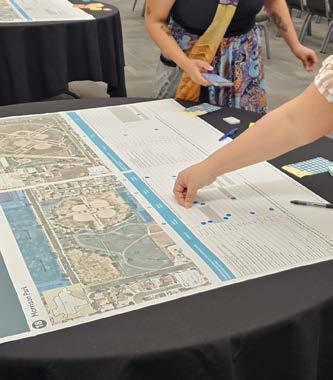
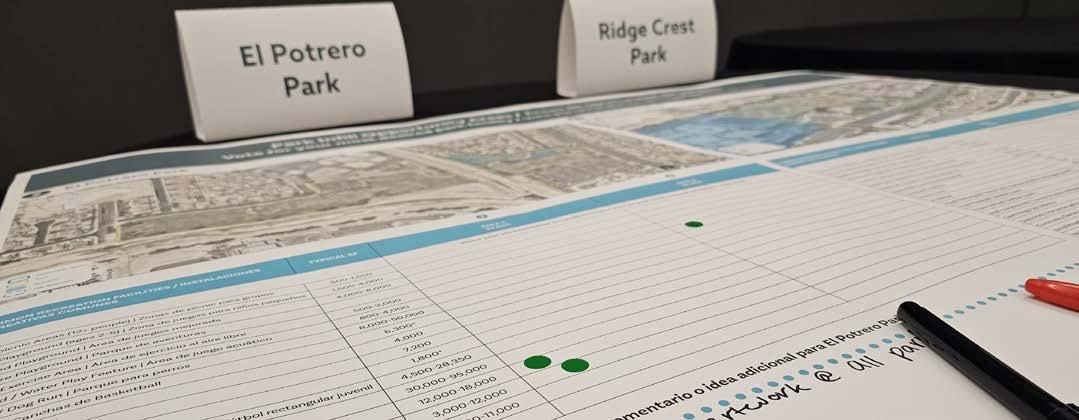
Adrienne Mitchell Memorial Park is a neighborhood park located in the eastern area of the city. The existing amenities include a playground, tot-lot, basketball half-court, walking loop, group picnic area, and horseshoe pit. Although this park has several amenities already, there are spaces for additional amenities.
There are three opportunity areas at this park: a large grassy area in the center of the park and two other areas on the southeast corner of the park. According to votes at the second community workshop, the top five park amenities recommended at this park are restrooms, community garden, youth rectangular soccer field, outdoor exercise stations along the walking path, and a skate park.
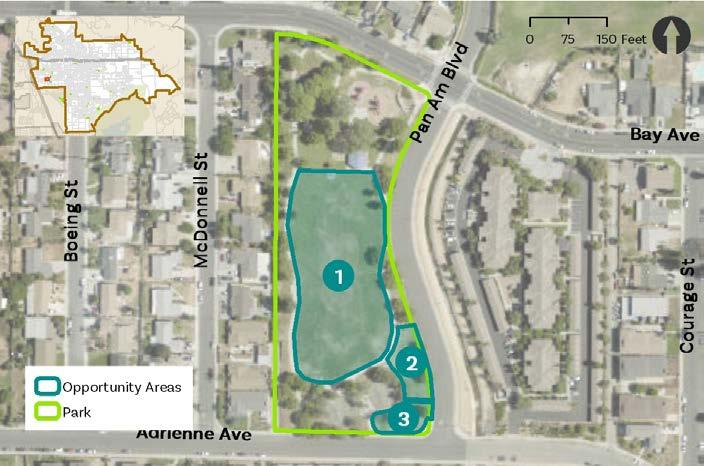


Bay Side Park is adjacent to a grocery market and a residential neighborhood. It is a large rectangular park in the northwestern part of Moreno Valley. Existing amenities in the park include a playground, basketball halfcourt, a walking trail through the park, a shaded picnic area, and an open grass area.
Three opportunity areas at this park were identified: one in the western portion and two additional areas in the eastern and central portions of the park. The top five amenities recommended for the park are an upgrade to the existing playground, a tot-lot playground, larger group picnic areas, a community garden, and splashpads/water play features.
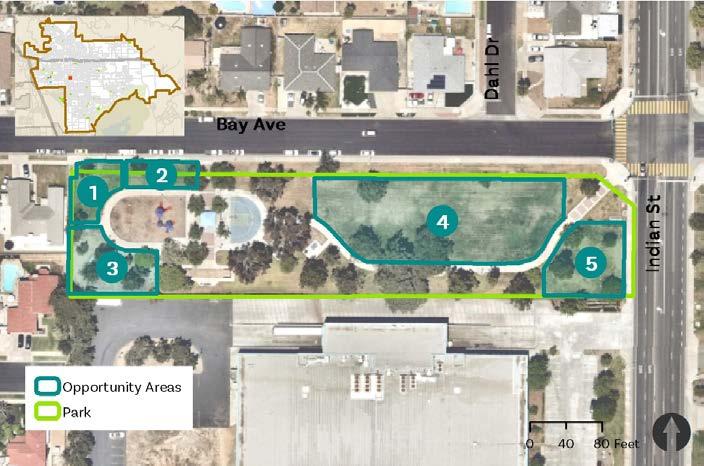
Existing playground recommended to be renovated & expanded with separate playground (ages 6-12) and tot-lot play area


Table 4-4: Bay Side Park Recommended Infill Amenities


Bethune Park is located in the southern edge of Moreno Valley within a residential area and adjacent to Mary McLeod Bethune Elementary. Included within the boundaries of the park are a snack bar, a playground, two tennis courts, a shaded picnic area, a barbecue station, and a splash pad area. A joint-use agreement exists between the City and the Elementary School that allows public use of two baseball/softball fields adjacent to and separated from the park by a gate and a fence.
The opportunity areas of the park are in its southernmost eastern and western portions. Based on community feedback, the four recommended amenities are a multi-purpose field, basketball half-court or full-sized court, outdoor exercise area, and youth rectangular soccer field.
4-5: Bethune Park Opportunity Areas
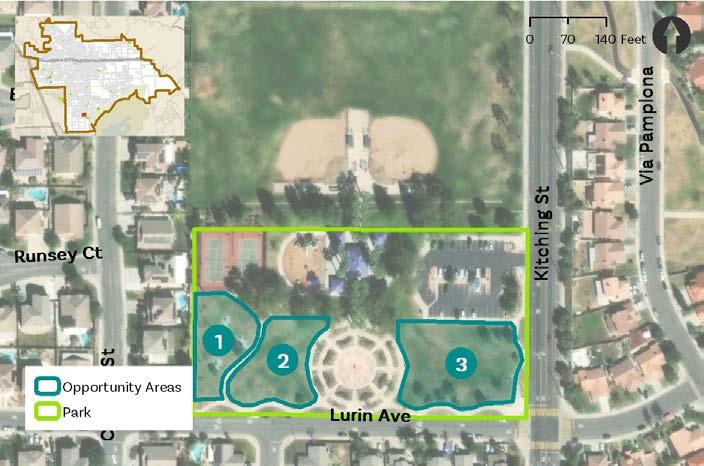

Field Basketball


Table 4-5: Bethune Park Recommended Infill Amenities
Located in the eastern side of Moreno Valley next to Landmark Middle School, Celebration Park offers amenities such as shaded picnic areas, a playground area, a basketball half-court, a splash pad, a large grassy open space, and a walking loop with picnic tables and seating areas.
Four opportunity areas identified exist within the walking loop of the park. According to community workshop feedback, the most desired amenities are a pickleball court, outdoor exercise area, full-sized basketball court, and community garden.
4-6: Celebration Park Opportunity Areas
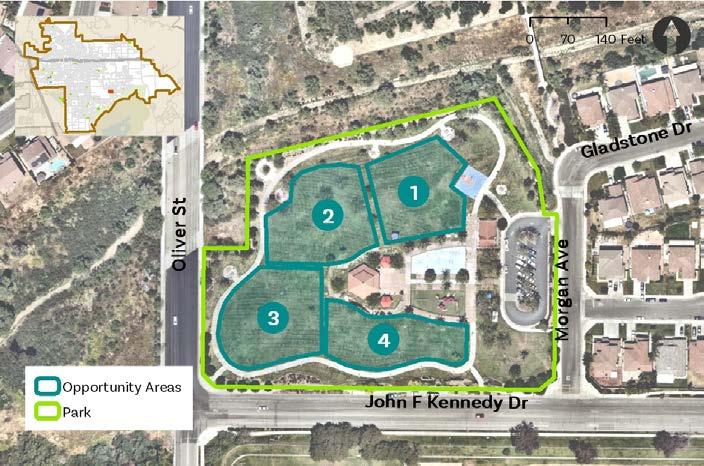
*Note: Pickleball is highly recommended at Celebration Park at Infill Area 3 due to its far proximity from residential areas, reducing the likelihood for noise complaints from residents. Additional parking may be necessary.


Table 4-6: Celebration Park Recommended Infill Amenities
College Park is located on the east side of Moreno Valley, directly next to Moreno Valley Community College. It is a 25acre community park that offers a playground and a large grassy open space with two soccer fields. A segment of a natural surface multi-use trail also passes along the southeast edge of the park.
Three opportunity areas were identified between existing amenities. Recommended amenities for College Park include an amphitheater/outdoor stage, restrooms, an upgraded playground, and a parking lot since it currently lacks parking.
4-7: College Park Opportunity Areas
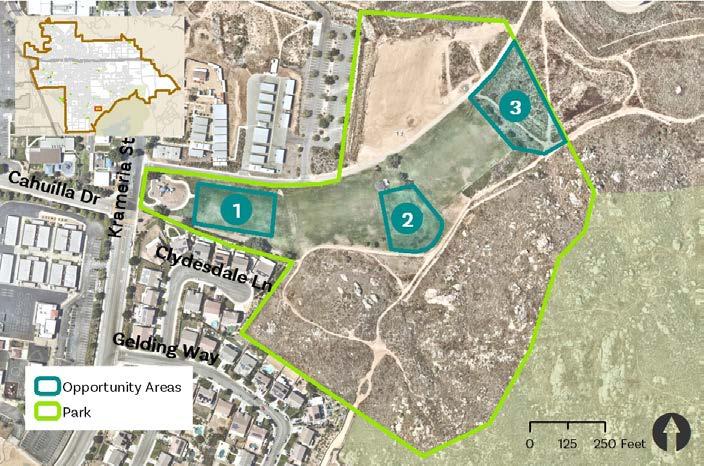


Table 4-7: College Park Recommended Infill Amenities
El Potrero Park is a 15-acre community park located in the south end of the city near El Potrero Elementary and Bethune Park. The park is bisected by a canal but connected by a bridge that is part of the park’s existing walking path. Amenities at the park include four multi-purpose athletic fields, a soccer field, a playground, picnic tables with barbecues, fitness equipment, restrooms, and a walking path.
Two opportunity areas were identified in the northeastern side of the park facing a residential area. The top amenities identified with the help of the community are an upgraded playground, group picnic areas, walking loop, basketball court, tennis court, pickleball court, and additional outdoor exercise stations.
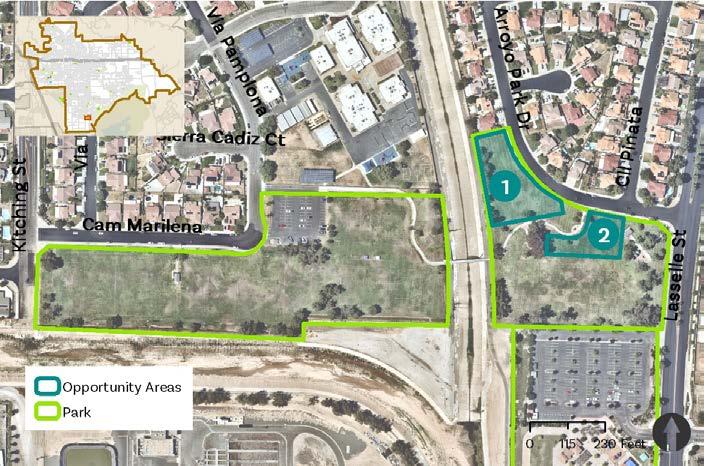


Gateway Park is located in a residential neighborhood on the north end of the city. The park connects the neighborhood to Sunnymead Linear Park at the center of the city. Existing amenities include a playground, large grassy open space lined with trees, restroom, and picnic tables.
Four opportunity areas were identified in the center and south side of the park. Recommended amenities from public feedback are a dog park, basketball court, tennis court, community garden, skate park, and outdoor exercise area.
Figure 4-9: Gateway Park Opportunity Areas
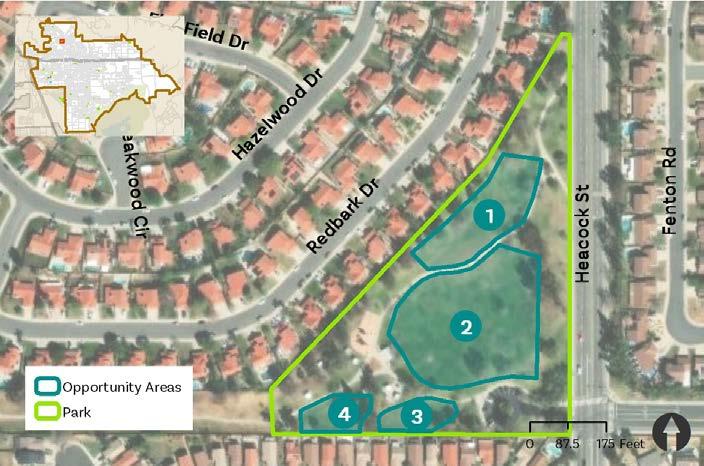


Table 4-9: Gateway Park Recommended Infill Amenities
Hidden Springs Park is in a residential neighborhood on the northern edge of the city, adjacent to Hidden Springs Elementary School. The park has a small grassy open space with two youth-sized backstops, a playground that is to be renovated, and access to nearby trails.
One opportunity area was identified close to the Hidden Springs Elementary School boundary. The recommended amenities desired by the community are a walking loop, group picnic areas, a restroom building, tennis courts, pickleball courts, and an outdoor exercise area.
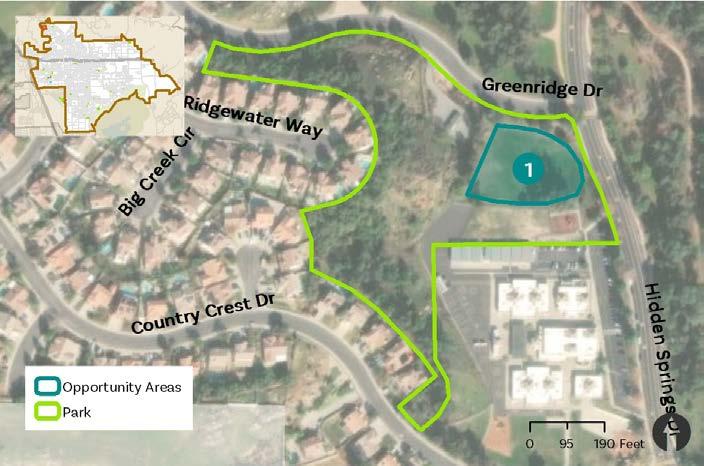

John F. Kennedy Memorial Park is a neighborhood park in the southern-central area of the city at the intersection of Indian Street and John F. Kennedy Drive. The Riverside County Fire Station is located within the park. Park amenities include an adult baseball/softball field with lighting, open grassy areas, a playground area, an outdoor exercise area, shaded picnic tables, and four illuminated tennis courts.
Four opportunity areas were identified at the park with two areas along John F. Kennedy Drive and two along Indian Street. The amenities most desired by community members are a basketball court, pickleball courts, and an updated playground.
4-11: John F. Kennedy Memorial Park Opportunity Areas
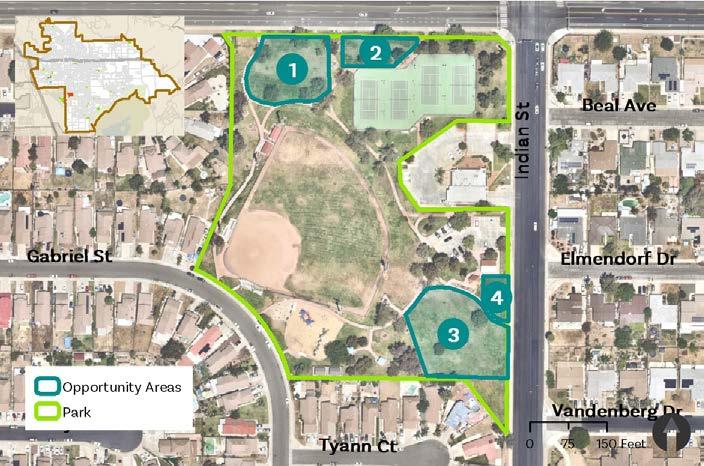

Table 4-11: John F. Kennedy Memorial Park Recommended Infill Amenities
Moreno Valley Community Park is a community park found on the central-west area of the city adjacent to Moreno Valley High School. The park currently has four lighted soccer fields, a playground, picnic tables, a walking path, shaded picnic areas, and a skate park.
Four opportunity areas were identified in the southern portion of the park. Amenities desired by community members include a group picnic area, an upgraded playground, a tot-lot playground, a splashpad/water play feature, outdoor exercise areas, pickleball courts, tennis courts, basketball courts, and volleyball courts.
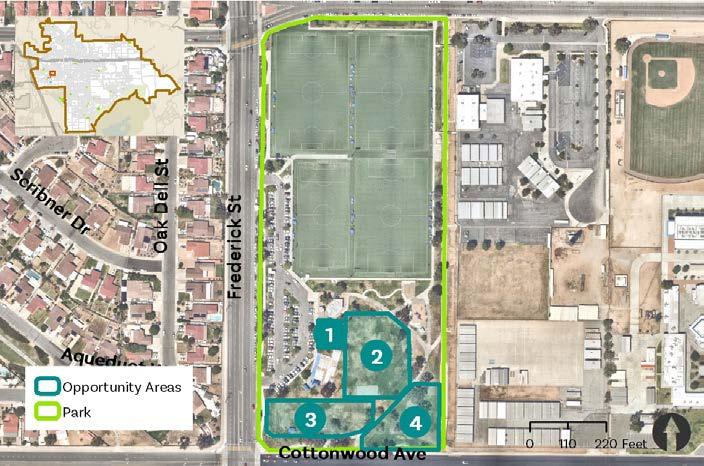


Moreno Valley Equestrian Park and Nature Center is a 45-acre special use facility located in the northeast corner of the city. The equestrian park within the park contains an arena and pens. The park also includes Hound Dog Park, which contains a dog park with separated areas for small and larger dogs, as well as some agility equipment.
Four opportunity areas exist in the park. Recommended amenities include equestrian trails and connections to outside trails, group picnic areas, restrooms, outdoor exercise areas, and an overnight horse camping area for visitors traveling to Moreno Valley for events at the equestrian park. The City is also encouraged to explore adding a nature center building as suggested in previous planning efforts.
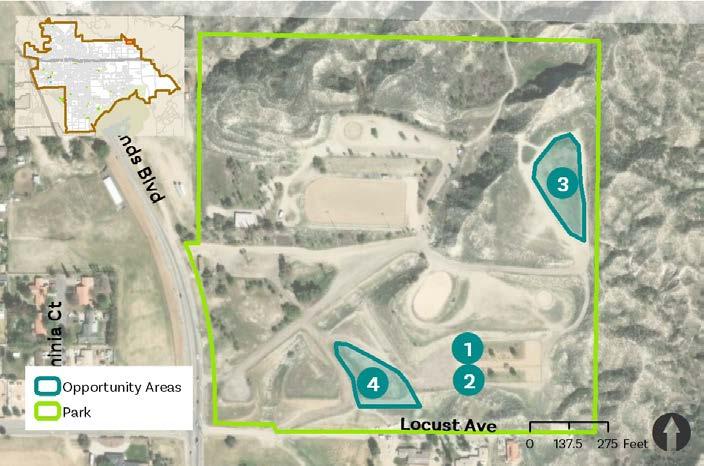
Morrison Park is at the heart of Moreno Valley and along the same street as Mountain View Middle School and Valley View High School. The park’s primary use is as a baseball/softball park as it offers baseball/softball fields, restrooms, a snack bar, picnic tables with barbecues, and a large grassy area next to the fields.
Four opportunity areas were identified at the park. Community feedback was used to develop the following recommended amenities: a dog park (being considered by the City), a skate park, a group picnic area, a playground, a tot-lot playground, a pump track, a walking loop, a basketball court, a volleyball court, a tennis court, and a pickleball court. Areas one, two, and four offer great potential for a pump track due to their varied terrain.
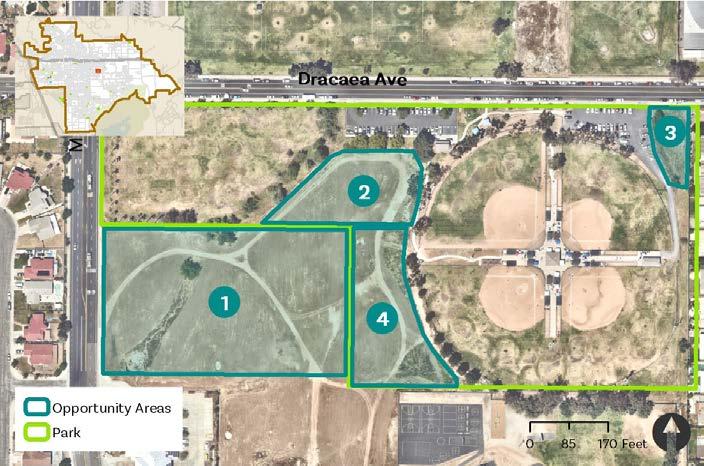
*City considering a dog park in this is area Note: Pump track being planned for southern expansion of this park.


Table 4-14: Morrison Park Recommended Infill Amenities
Patriot Park is a mini park located on the south side of the city. Amenities include a walking path around the perimeter of the park and a playground area.
The infill opportunity area analysis helped pinpoint an opportunity area on the west half of the park. Community feedback indicated that the top three desired are an outdoor exercise area, a basketball half-court, and a group picnic area. The infill opportunity area is fairly small, but offers a great opportunity to reduce the city’s basketball amenity deficit and geographic gap by adding one at this park.
4-15: Patriot Park Opportunity Areas
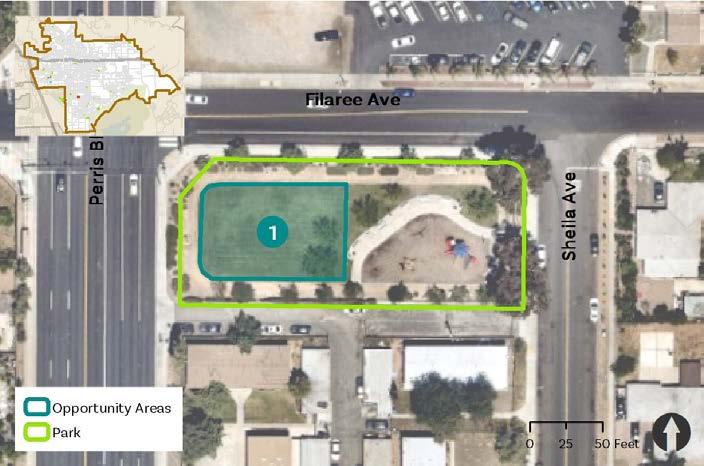
Table 4-15: Patriot Park Recommended Infill Amenities
Parque Amistad is a passive neighborhood park with basic amenities located in the southeast area of Moreno Valley. Existing amenities include a playground, a picnic area, two basketball half-courts, and a softball/baseball backstop.
One opportunity area was identified on the west side of the park along Caballo Road. Recommended amenities include a tennis court, a pickleball court, an outdoor exercise area, group picnic areas, and a basketball court.
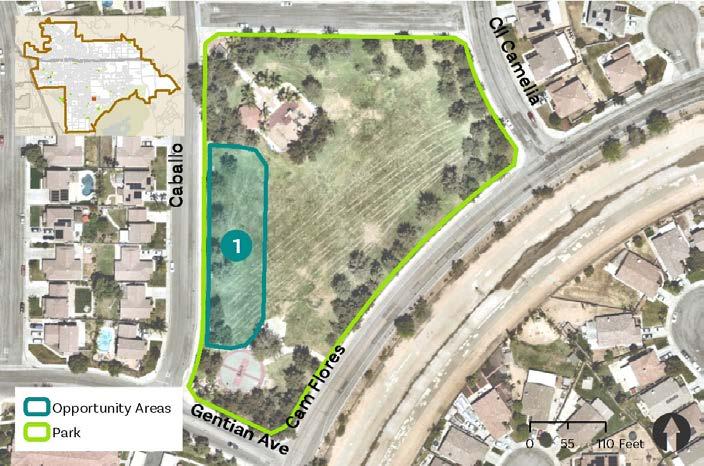

Table 4-16: Parque Amistad Recommended Infill Amenities
Pedrorena Park is located in the southeast part of the city and contains active and passive recreational amenities. Active recreational amenities include a basketball court, four tennis courts, a playground area, and an open grassy area with a baseball/softball backstop. Passive amenities include two picnic areas with barbecue grills.
Three opportunity areas were identified in the north and southwestern areas of the park. The amenities most desired by workshop participants are an upgraded playground, a tot-lot playground, splashpad/water play feature, a dog park/dog run, a skate park, a volleyball court, a youth rectangular soccer field, a multi-purpose field, and a pickleball court.
4-17: Pedrorena Park Opportunity Areas
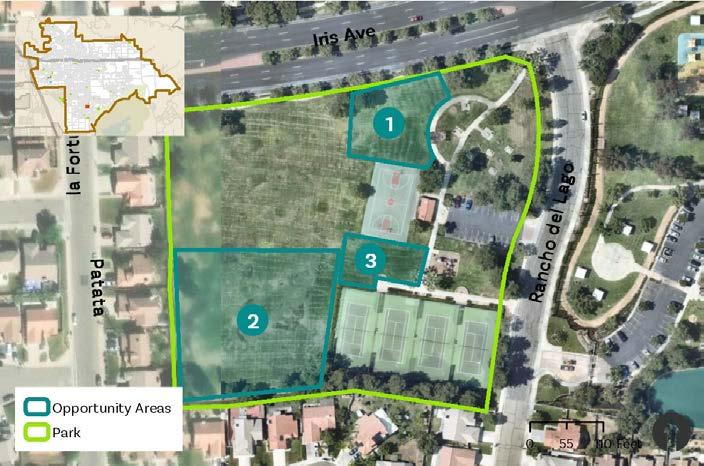

Table 4-17: Pedrorena Park Recommended Infill Amenities
Ridge Crest Park is a neighborhood park located on the east side of the city next to Ridge Crest Elementary School. Existing amenities include a playground, restrooms, picnic areas with barbecues, and an open grassy area with a baseball/softball backstop.
Two opportunity areas were identified. One is adjacent to Ridge Crest Elementary School and the other is along John F. Kennedy Drive. Recommended amenities include a multi-purpose field, a basketball court, group picnic areas, a volleyball court, a tennis court, a pickleball court, a community garden, and an outdoor exercise area.
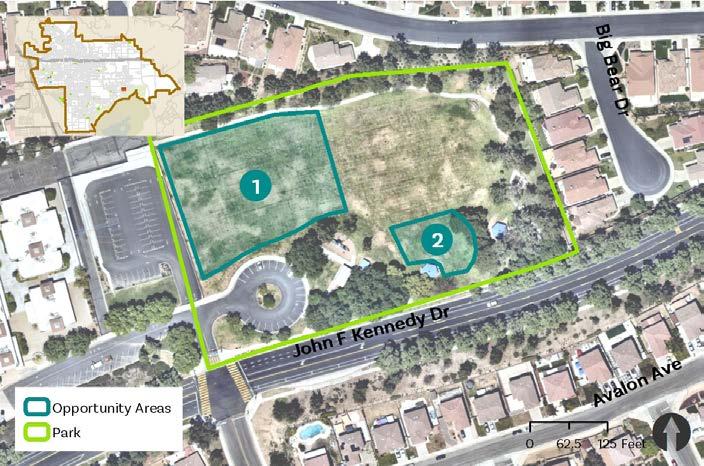
Table 4-18: Ridge Crest Park Recommended Infill Amenities
Rock Ridge Park is located in a residential neighborhood on the northeastern side of Moreno Valley. Park amenities include a playground area, two shaded picnic areas, one non-shaded picnic area, and a walking trail that connects the south and north portions of the park. This park also provides an entrance to the Cold Creek Trail, which leads to the neighborhood hilltop.
The opportunity areas identified are located in four quadrants of the park in existing grassy open-areas. This park is fairly new and existing amenities are in great condition. As a result, only a few amenity recommendations were identified. Recommended amenities include a splashpad/water play feature and an outdoor exercise area.
4-19: Rock Ridge Park Opportunity Areas
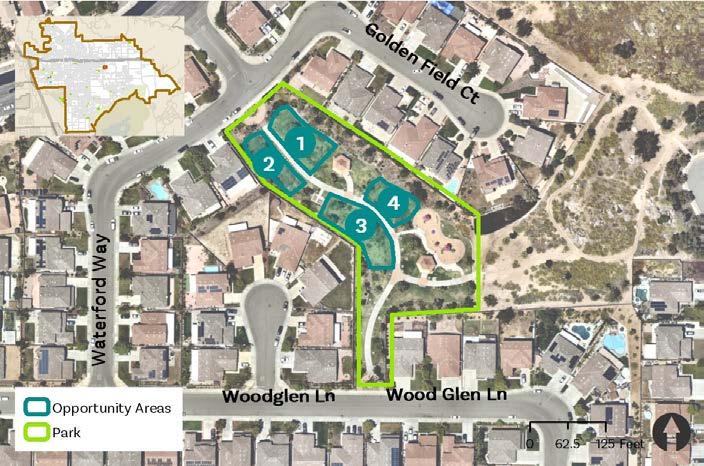
Table 4-19: Rock Ridge Park Recommended Infill Amenities
Shadow Mountain Park is a community park located on the northern boundary of the city. Park amenities include two youth softball fields with lights, a baseball/softball field that is converted for soccer use during the off-season, a large playground with a zip line area, and a tot-lot. Other amenities include a shaded picnic area with barbecues, a restroom, and a long walking loop along the perimeter of the park.
Since the park already has a great variety of amenities, just one opportunity area was identified. Future amenities to consider in this area include an outdoor exercise area, a group picnic area, and a splashpad/ water play feature.
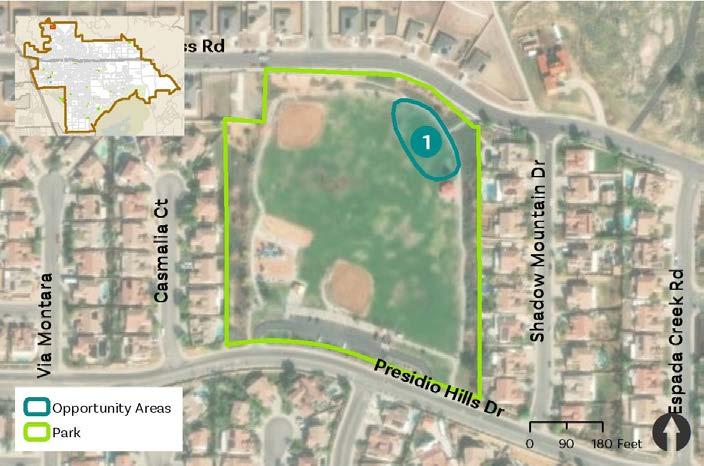
Sunnymead Park is a community park located near the center of the city. The park is bisected by a flood control channel, but connected by a pedestrian bridge. Even though the park is mostly used for its four lighted baseball fields, the park has other amenities, including a playground, picnic areas with barbecues, concession stands, and restrooms.
Two opportunity areas were identified at the northwest side of the park. Amenities to be considered include a community garden, an outdoor exercise area, group picnic areas, and a basketball court. Community gardens are recommended here due to community need and proximity to multi-family housing where residents may not have access to private outdoor space for a garden. Moreno Valley currently lacks basketball courts, which is why one is recommended here.
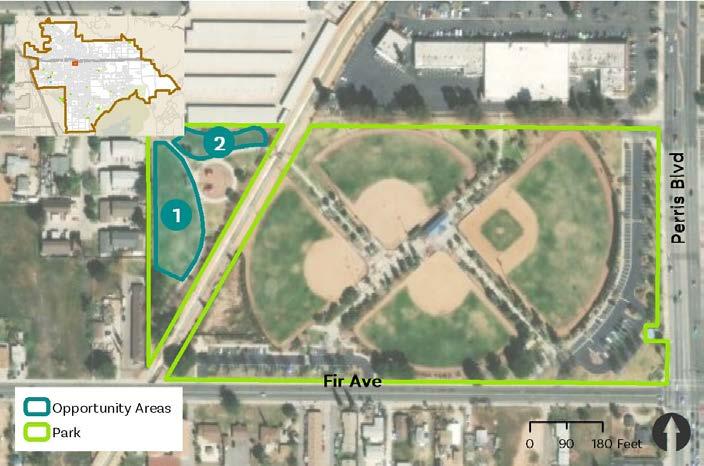

Table 4-21: Sunnymead Park Recommended Infill Amenities
TownGate Memorial Park and TownGate II Park are combined to form a community park on the northwest side of the city. Park amenities include a community center, two playground areas, softball/baseball fields, soccer fields converted for softball/baseball use during the off-season, picnic areas with barbecues, and a walking loop. The park also has a walking and biking path that connects to the Juan Bautista de Anza Trail.
Five opportunity areas were identified in the northeast, southeast, and southwest areas of the park. Desired amenities include a dog park (being considered by the City), a splashpad/ water play feature, a basketball court, a volleyball court, a tennis court, additional group picnic areas, and a pickleball court.
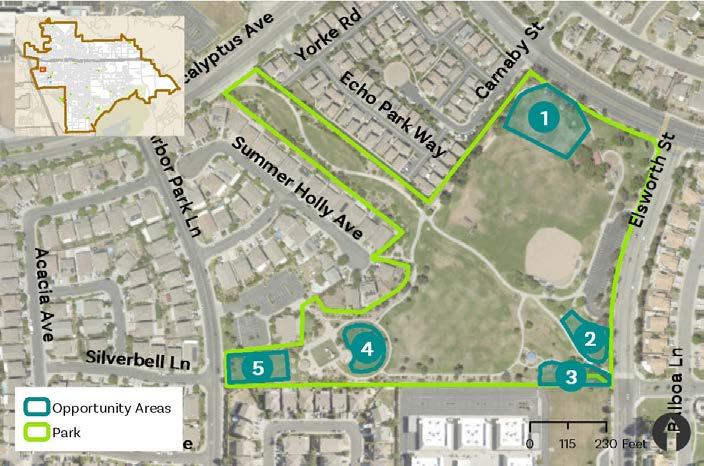
*City considering a dog park in this is area


Victoriano Park is a passive neighborhood park in the southeast side of Moreno Valley next to Victoriano Elementary School. The only amenities at this park are a multi-purpose field and restrooms.
Two opportunity areas were identified near the center of the park. Based on feedback from community members, the most desired amenities include a basketball court, a playground, a tot-lot playground, group picnic areas, and an outdoor exercise area.
4-23: Victoriano Park Opportunity Areas
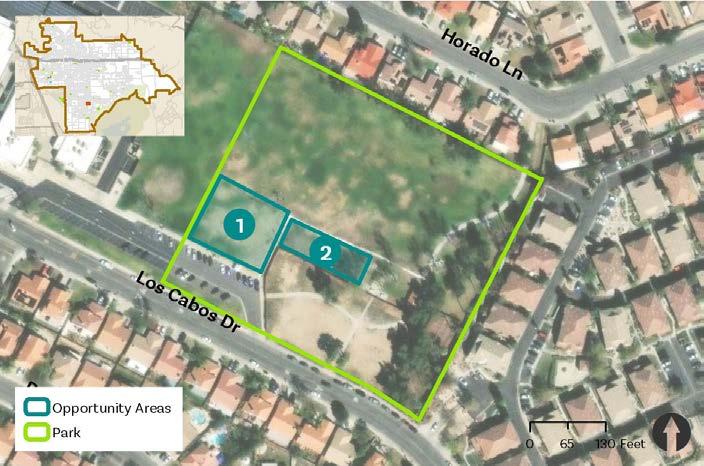
Table 4-23: Victoriano Park Recommended Infill Amenities
Vista Lomas Park is neighborhood park on the east side of the city. The park has two basketball half-courts, a playground area for ages 2-5 and 5-12 years old, and an open grassy area with backstops.
Two opportunity areas were identified along Iris Avenue. Recommended amenities include a walking loop, an outdoor exercise area, group picnic areas, a pickleball court, and a youth rectangular soccer field.
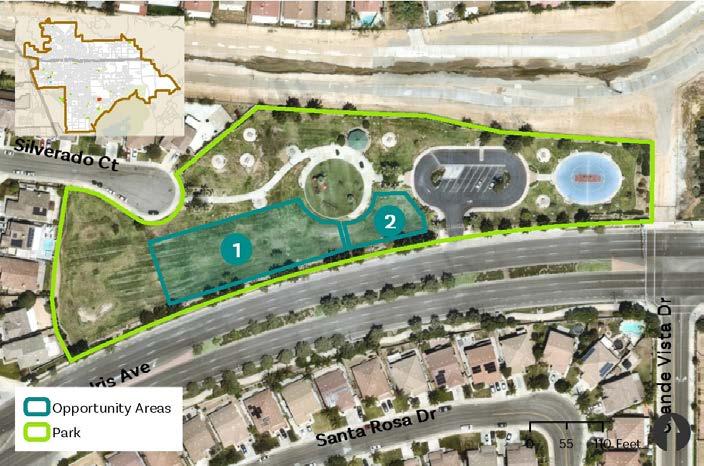
Table 4-24: Vista Lomas Park Recommended Infill Amenities
Westbluff Park is a small neighborhood park located in the north part of the city between Vista Heights Middle School and Canyon Springs High School. The park contains a playground, picnic areas with barbecues, and a walking path.
Two opportunity areas were identified are on the east and west sides of the park. The amenities desired by the community members through the planning process are a skate park (being considered by the City), a pickleball court, a volleyball court, a basketball court, and an outdoor exercise area.
4-25: Westbluff Park Opportunity Areas
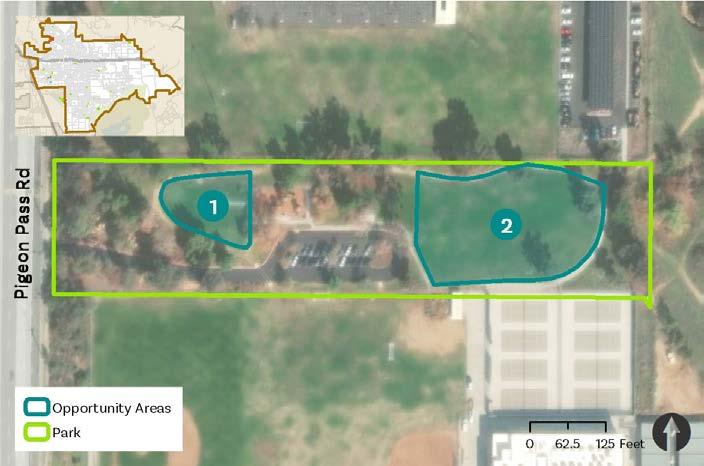
Table 4-25: Westbluff Park Recommended Infill Amenities
Weston Park is a neighborhood park located on the northeast side of the city and is near Bear Valley Elementary School, Butterfield Language Academy, Valley View High School, and Moreno Elementary School. The park offers a large variety of amenities, including a full basketball court, a playground area, a picnic area, a walking path, and restrooms.
Two opportunity areas were identified as having the potential to further enhance the park. The top recommended amenities include an upgrade to the existing playground, a tot-lot playground, a dog park, a skate park, a community garden, a youth rectangular soccer field, a multi-purpose field, and a group picnic area.
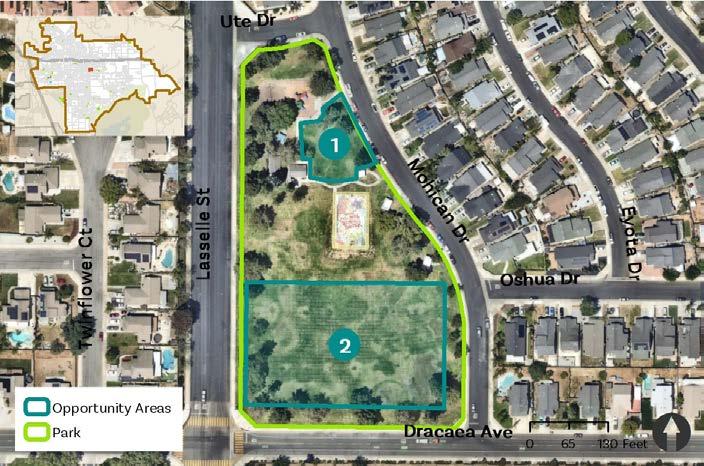
4-26: Weston Park Recommended Infill Amenities
Woodland Park is a community park found in the center of Moreno Valley. Park amenities include two separate playground areas for people of ages 2-5 and 5-12 years old, a lighted softball field, four tennis courts with pickleball courts overlaid on the tennis courts, four basketball half-courts, a walking path, an area with chess tables, and restrooms.
Seven opportunity areas were identified around the perimeter of the park. While the park already offers a variety of amenities, it still has potential to add more to meet community needs. The most desired amenities include group picnic areas, a full-sized basketball court, an outdoor exercise area, a community garden, volleyball courts, and pickleball courts.
4-27: Woodland Park Opportunity Areas
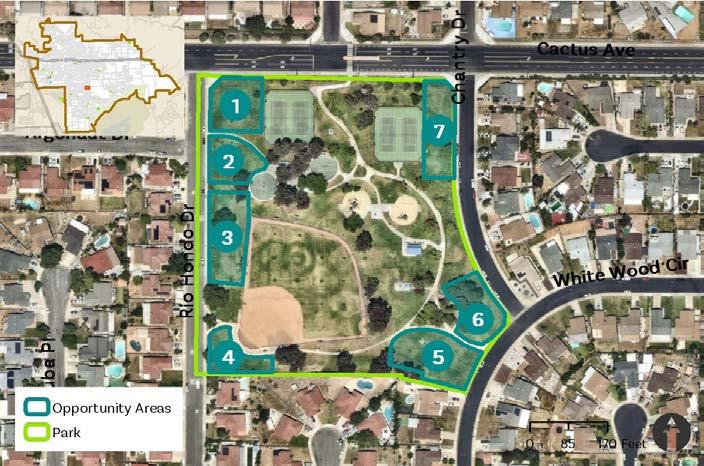


Table 4-27: Woodland Park Recommended Infill Amenities


It is important to evaluate how the potential new park sites can affect the level of service analysis described in Chapter 2. The following section analyzes the improvements to both the population-based level of service and the geographic level of service for the projected 2045 population. Although these improvements do not completely fulfill the park level of service goals previously outlined, they do have the potential to make a significant impact to the City’s parks and recreation system.
The proposed seven park sites would bring an additional 94 acres which would help decrease the projected park acre deficit in 2045 from 389 acres to 296 acres. This would also bring the City to a 1.89 park acres for every 1,000 residents status, as shown in Table 4-3.
Table 4-28: Future Population LOS with Recommended Park Projects
Figure 4-28 displays the seven potential new parks, the existing park system, and the half-mile travelsheds for both the existing and potential future parks. This map shows that the seven potential new parks will help fill several geographic travelshed gaps in the western, northern, eastern, and central areas of Moreno Valley. The potential new park travelsheds are displayed as an orange shade and the existing travelsheds are displayed as light green shade on the map. Although the seven new parks do make a positive impact, there are several more geographic gaps that the City will need to continue to focus on. The City is encouraged to pursue purchasing additional land for new parks in these gap areas.
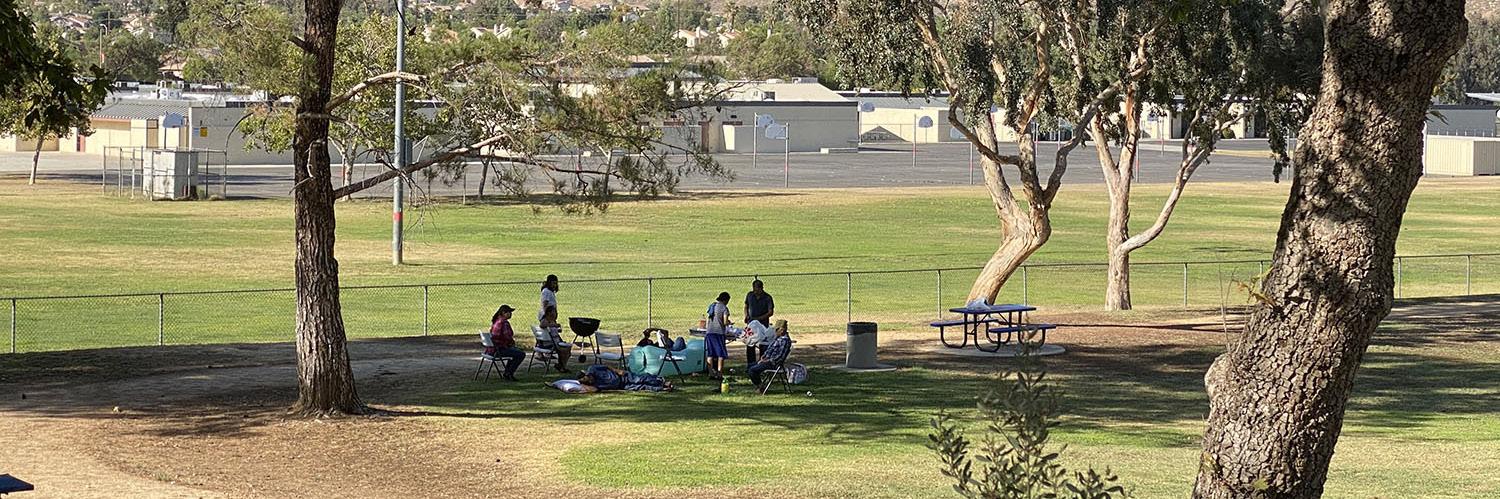
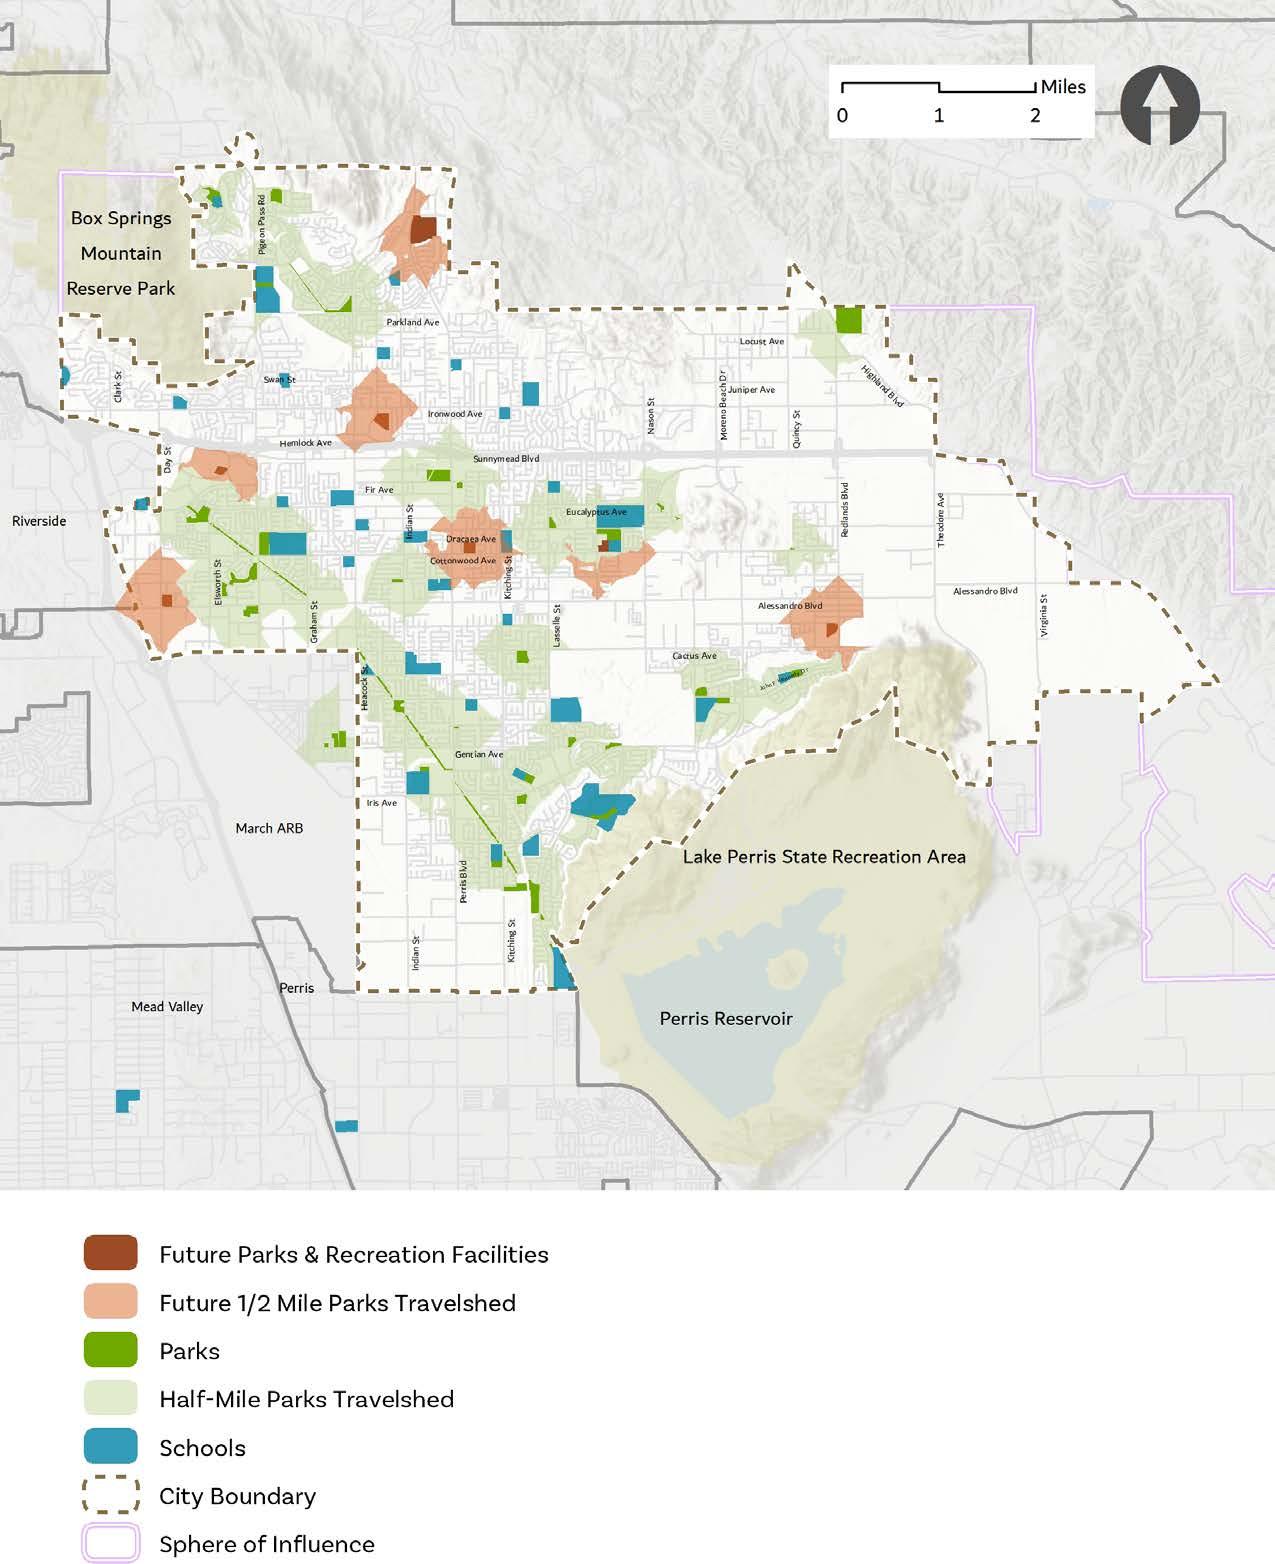
The following section describes Park Priority Areas throughout the city. These areas are located within the remaining geographic level of service gaps that require the City to do more detailed analyses. The maps represented in Figure 4-29 through Figure 4-32 highlight the general location of undeveloped sites that the City would need to evaluate further.
Community members at the third public workshop were asked what types of park facilities they would like to see added in these priority areas and if there were any specific properties they would like the City to develop into a park.
Figure 4-29: Park Priority Area: Northeast
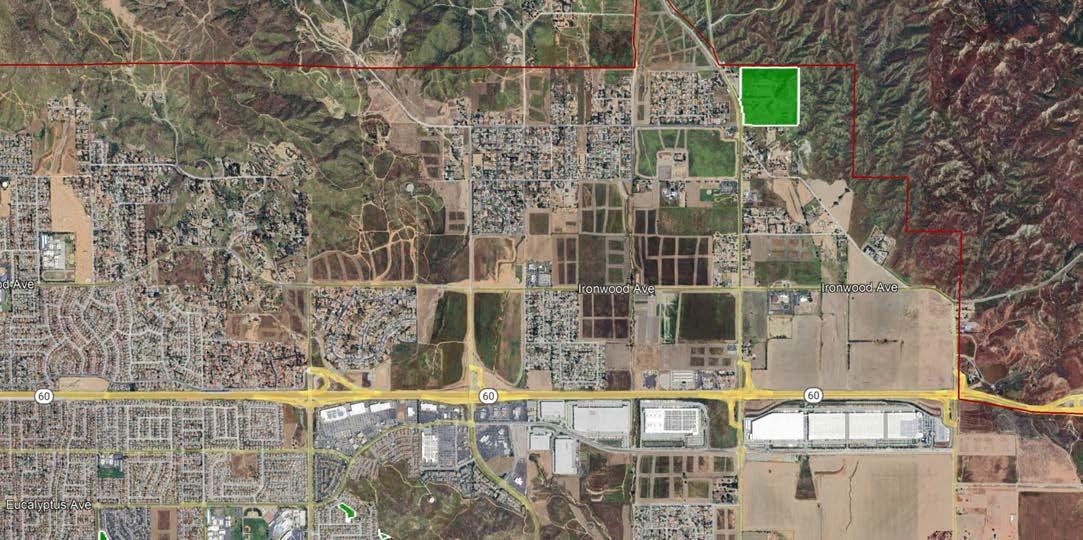
Figure 4-30: Park Priority Area: Central-east
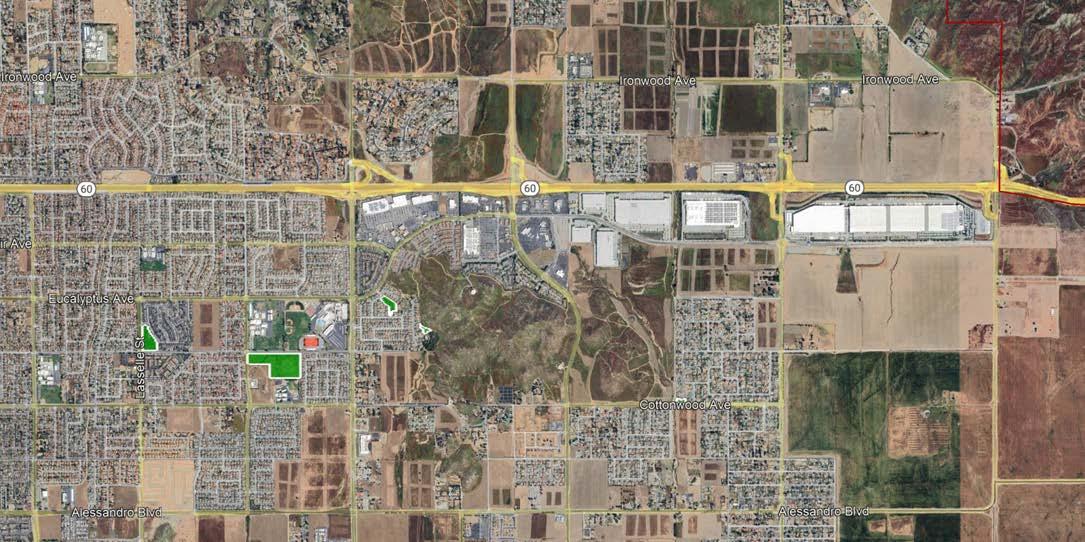
Community feedback included the desire for additional facilities such as a new library, performing arts center, amphitheaters, a museum as well as park spaces such as a wilderness park, a nature center, passive park spaces, and trails with outdoor fitness areas. The City is encouraged to continue to search for new park and facility opportunities in these priority areas. The City may consider purchasing vacant land from private owners or creating partnerships / joint-use agreements to bring new park access to the residents.
Figure 4-31: Park Priority Area: Central

Figure 4-32: Park Priority Area: Southwest
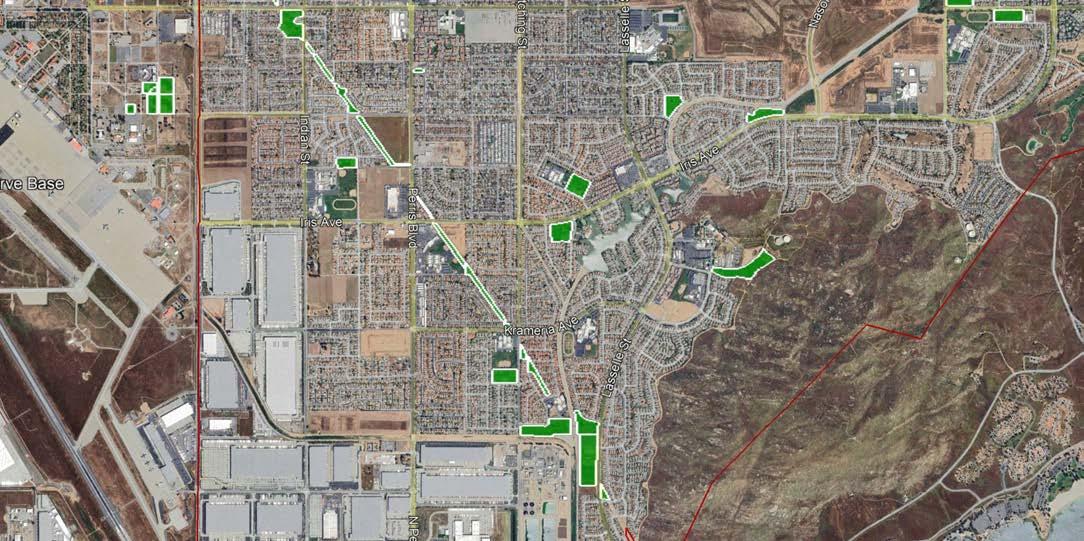
The following section outlines short, mid, and long-term goals the City can explore to improve the parks and recreation system. They are based on the feedback collected from the community as well as the initiatives discussed earlier in this chapter.
Short-term project goals are those that can typically be implemented within a one to two-year time frame.
» Improve park safety and security by adding items such as lighting, new fencing, or security cameras.
» Replace play equipment that has been identified in poor condition.
» Identify all sports fields maintenance needs and implement low to mid-cost renovations such as fencing, seating areas, or small areas of surface replacements (sod or decomposed granite).
» Identify and add low-cost passive park amenities such as picnic tables, bench seating, community gardens, or small walking paths.
» Conduct a study to analyze intersection improvements for trails and equestrian users as well as where to add animal crossing signage.
» Identify four locations for new dog parks (no less than 1-acre in size)
» Offer additional recreation programs and classes that surpass 100% registrations such as: Dance Exploration, Summer Youth and Teen Basketball, Valley Day Camp (11-14), CYSC All Stars Cheer, Valley Day Camp (7-8), Ballet/Acro, Winter Youth and Teen Basketball, and Art Expression.
Mid-term project goals are those that can typically be implemented within a two to five-year time frame.
» Develop individual park master plans to help identify low to mid-cost park amenities (i.e. picnic areas, playgrounds and playground surfacing, or shade over existing playgrounds).
» Identify and add shade (trees or structure) to key amenities such as playgrounds, picnic areas, and grouped exercise stations.
» Identify all sports fields maintenance needs and implement mid to high-cost renovations such as lighting, large seating areas (bleachers) or large areas of sod/artificial turf enhancements.
» Design and install basketball, volleyball, tennis, and pickleball courts to help address the City’s deficits identified in Chapter 2.
» Develop an aquatics center master plan to identify the location and amenities a large aquatics center can offer.
» Design and construct up to four new dog parks.
» Design and install multi-use trails that help close gaps between existing trailheads or provide direct access between destinations such as schools, parks, and commercial centers.
» Perform a detailed facility and asset conditions assessment to determine deferred maintenance.
» Conduct a feasibility study to identify private sites that can be purchased and converted to park land.


Long -term project goals are those that can typically be implemented within a five to ten-year time frame.
» Purchase private land to construct new park sites identified earlier in this Chapter.
» Construct a new multi-purpose recreation/teen center that offers spaces such as a large gymnasium for indoor basketball/volleyball/ pickleball, community rooms, rentable banquet spaces, exercise equipment rooms, quiet rooms for school work, and passive outdoor spaces such as picnic areas and gardens.
» Construct a new senior center that offers spaces such as game rooms, lounges, cafeteria, recreation rooms, and other multi-purpose rooms.
» Construct an aquatics center to help meet community demands of pool programs.
» Construct a large sports complex that includes baseball, softball, and multi-purpose rectangular fields to help address the City’s deficits identified in Chapter 2.
» Construct a wilderness park that focuses on passive park amenities and experiences such as trails, picnic areas, nature playgrounds, gardens, habitat restoration areas, small amphitheaters, interpretive signage, and a small multi-purpose building that contains community rooms for people to gather.
» Continue making improvements to the Equestrian Center such as trails, restrooms, or a nature center building that houses community meeting spaces.
» Coordinate with the Library Services Department to identify a location for a new larger library that offers a variety of indoor spaces that can supplement recreation programming needs.


The following section describes potential federal, state, regional, and local funding sources that can be pursued to advance the recommendations in the Plan. The funding sources vary in purpose and scope, but are intended to help an agency implement parks, recreation, and trails projects and programming. Table 4-29 includes information on the funding sources, a general description of the program, funding cycle, and project examples.
Table 4-29: Potential Funding Sources
FUNDING PROGRAM
1 Highway Safety Improvement Program Federal Highway Administration /Caltrans
The Highway Safety Improvement Program funds work on any public road or publicly owned bicycle or pedestrian pathway or trail, or on tribal lands for general use of tribal members, that improves the safety for its users.
Every 1 to 2 years X X
2 Reconnecting Communities and Neighborhoods Grant Program U.S. Department of Transportation
The Reconnecting Communities and Neighborhoods Program provides grant opportunities to redress the legacy of harm from transportation infrastructure including: construction-related displacement, environmental degradation, limited access to goods and services, degraded public health due to air and noise pollution, limited opportunities for physical activity, and hampered economic vitality of the surrounding community.
Annual (through 2026) X X X
• Install hybrid pedestrian signals at trail crossings
• Install RRFBs at locations adjacent to parks, trails, and schools
• Study for the removal, retrofit or mitigation of a transportation facility that acts as a barrier to community connectivity • Replacement or mitigation of a transportation barrier with a linear park and trail
3 Boat Launching Facilities Grant Program California Department of Parks and Recreation
The Boat Launching Facility Grant Program provides funding to local government agencies for the construction or improvement of boat launching facilities. Grants can be used for costs associated with engineering, construction, inspections, and permits.
Annual X
Construction or improvement of:
• Boat launching ramps
• Restrooms
• Boarding floats
• Shore protection
• Parking lots * INF - Infrastructure PLN - Planning and Design PGM - Programming
4 Coastal Conservancy Grant Program
5 Habitat Conservation Fund Program
State of California Coastal Conservancy
The Coastal Conservancy funds a wide variety of projects along the California coast, San Francisco Bay, and in coastal watersheds to increase availability of beaches, parks and trails for the public, protect and restore natural lands and wildlife habitat, preserve working lands, and increase community resilience to the impacts of climate change.
Ongoing X X X X
• Provide coastal experiences for communities who face barriers to coastal access
• Build a regional trail increasing coastal access
• Enhance coastal recreational amenities, such as restrooms, parking, picnic areas, interpretive centers, shade structures, etc.
6 Land and Water Conservation Fund
California Department of Parks and Recreation
The Habitat Conservation Fund provides funding to protect fish, wildlife, and native plant resources; to acquire or develop wildlife corridors and trails; and to provide for nature interpretation programs and other programs which bring urban residents into park and wildlife areas.
National Park Service/ California Department of Parks and Recreation
The Land and Water Conservation is a federal National Park Service grant program administered by the California Department of Parks and Recreation. The program provides funding for the acquisition or development of land to conserve irreplaceable lands and to create new outdoor recreation opportunities for the health and wellness of Californians.
Annual X X X
7 NonMotorized Boat Launching Facility Grant Program
California Department of Parks and Recreation
The Statewide Non-Motorized Boat Launching Facility Grant Program provides funding to create or improve public non-motorized boating access. Grants can be used for costs associated with engineering, construction, inspections, and permits.
Annual X X
• Build new trails
• Rehabilitate existing trails
• Install interpretive trail elements
• Install seating or lighting along trails
• Develop educational or interpretive activities or trips
• Land acquisition for a new park, an existing park expansion, a wildlife corridor with public viewing and outdoor recreational use, and/or a recreational/active transportation corridor
• Development of recreation features and amenities for outdoor recreation
Construction or impovement of:
Annual X
• Small, handlaunched boat ramps
• Small parking lots
• Restrooms
8 Outdoor Equity Grants Program California Department of Parks and Recreation
The Outdoor Equity Grants Program provides funding to improve the health and wellness of Californians through new educational and recreational activities, service learning, career pathways, and leadership opportunities that strengthen a connection to the natural world. The program funds the creation, operation, and transportation costs of outdoor programs in underserved communities.
Annual X
• Programs must include both community activities AND trips to natural areas.
• Community activities can include environmental education, nature discovery walks, and more.
• Natural area trips can include traveling to a regional, state, national park, tribal land, river or lake, beach, forest, mountain, or desert area for day or overnight trips within California.
9 Outdoor Recreation Legacy Partnership Program
National Park Service/ California Department of Parks and Recreation
The Outdoor Recreation Legacy Partnership Program is a federal National Park Service grant program administered by the California Department of Parks and Recreation. The program focuses on communities with little to no access to publicly available, close-by, outdoor recreation opportunities in urban areas. The program funds the acquisition or development of new parks, or substantial renovations to parks in economically disadvantaged cities or towns of at least 30,000 people.
Annual X X
• Land acquisition for outdoor recreation
• Development of recreation features and amenities for outdoor recreation
10 Ramp Repair and Modification Grant Program California Department of Parks and Recreation
The Statewide Ramp Repair and Modification Grant Program provides funding to quickly restore safe and convenient public boating access by correcting public health and safety issues caused by unexpected damage due to flood, accidents, wildfires or by extending existing boat ramps as needed due to drought conditions at DBW-funded boat launching facilities.
11 Recreational Trails Program U.S. Department of Transportation Federal Highway Administration /California Department of Parks and Recreation
The Recreational Trails Program is a federal U.S. Department of Transportation grant program administered by the California Department of Parks and Recreation. The program provides funding to develop and maintain recreational trails and trail-related facilities for both non-motorized and motorized recreational trail uses.
Annual X
12 Statewide Park Development and Community Revitalization Program California Department of Parks and Recreation
The Statewide Park Program provides funding to create new parks and recreation opportunities in critically underserved communities across California. Project selection is based on several criteria, including need-based criteria, such as critical lack of park space, significant poverty, community challenges, and more.
Annual X X
• Restore boating access and launching facilities
• Address health or safety issues
Annual X X
• Land acquisition
• Development/ rehabilitation of trails, trailheads, and trail amenities
• Construction of new trails
• Maintenance of existing trails
• Land acquisition
• Rehabilitation of existing or development of new recreation features, such as, an aquatic center, athletic fields, amphitheater, community gardens, dog parks, open space, trails, skate parks, public art, picnic areas, etc.
13 Wildlife Conservation Board Grants Wildlife Conservation Board
The Wildlife Conservation Board provides funding for habitat acquisition, conservation, and restoration, as well as development of compatible public access facilities. Project benefits should include one or more of the following: protected biodiversity, increased climate resilience, enhanced public access, conserved/ enhanced working landscapes, conserved/enhanced waterrelated projects, and/or support of the State Wildlife Action Plan.
Ongoing X X X
• Open-space corridors or trail linkages
• Publicly accessible hunting, fishing, wildlife viewing, and other wildlifedependent recreational opportunities
• Climate adaptation and resilience projects
• Habitat restoration
14 Energize the Environment Grant Program Quadratec
Quadratec offers small onetime grants for projects that promote environmental connection, responsibility, and/ or stewardship.
15 Fruit Trees For Your Community
The Fruit Tree Planting Foundation
The Fruit Tree Planting Foundation donates fruit orchards where the harvest will best serve communities for generations, at places such as community gardens, public schools, city/state parks, lowincome neighborhoods, Native American reservations, and other high impact areas.
Annual X
Ongoing X
• Trail building or restoration projects
• Park beautification events
• Environmental education projects
• Youth educational engagement events
• Planting of highquality fruit-trees and shrubs at a local park
16 Hometown Grants T-Mobile
17 Humanities Projects Grants National Endowment for Humanities
Hometown Grants fund shovelready projects in rural towns (with populations <50,000) that foster local connections, including technology upgrades, outdoor spaces, the arts, and community centers.
The National Endowment for Humanities offers a range of different grant programs on an ongoing basis. Different grant programs provide funding for a variety of outputs, including but not limited to infrastructure, equipment, programming, curriculum, research, media, and more.
Quarterly X X
18 PeopleForBikes Community Grant Program PeopleForBikes
The PeopleForBikes Community Grant Program supports bicycle infrastructure projects and targeted initiatives that make it easier and safer for people of all ages and abilities to ride.
Ongoing X X X
• Improvements to outdoor parks or trails
• Adaptive uses of older buildings into community centers
• Art or science exhibitions
• Community discussions
• Films and documentaries
• Climate adaptation planning
• Cultural preservation and resilience
• Trainings and workshops
• Bike paths, lanes, trails and bridges
• Mountain bike facilities
• Bike parks and pump tracks
Annual X X
• BMX facilities
• End-of-trip facilities such as bike racks, bike parking, bike repair stations and bike storage
19 Outdoor Access Initiative Yamaha
Yamaha provides funding to non-profit or tax exempt groups (clubs & associations), public riding areas (local, state and federal), outdoor enthusiast associations and land conservation organizations, and communities with an interest in protecting, improving, expanding and/or maintaining access for safe, responsible, and sustainable use by motorized off-road vehicles.
20 Rails to Trails Grant Program Rails to Trails
Rails to Trails provides funding to organizations and local agencies that are working to develop and connect equitable trail networks.
Quarterly X X
• Trail development
• Trail signage
• Trail mapping/ map production
• Wildlife and habitat management
• Establishing public access to land for outdoor recreation
• Rail-trail
• Greenway
Annual X X X
21 The Skatepark Project Grants The Skatepark Project
22 The Soccer Fund U.S. Soccer Foundation
The Skatepark Project offers grants to help underserved communities create safe and inclusive public skateparks for youth.
Annual X
• Multi-use trail
• Shared-use path
• New Skatepark Construction
• New Skate Spot Construction
• Skateable Art Sculptures
• Active City Space Conversion (legalizing skateboarding in shared spaces)
• Accessibility Improvements/ Repairs
23 USTA Facility Funding Grant Program United States Tennis Association
The Soccer Fund provides funding for mini-pitch and sports lighting projects. Minipitches are ideal for urban areas and other communities where finding a safe place to play can be difficult. These small, customized, hard-court surfaces are perfectly suited for organized soccer programs and pick-up games.
The United States Tennis Association offers grants to upgrade existing and build new tennis facilities.
Ongoing X
• Mini-pitch project
• Soccer lighting project
Ongoing X
* INF - Infrastructure PLN - Planning and Design PGM - Programming TRL - Trails
• Construction of new tennis facility
• Resurfacing of existing tennis court
• Tennis court amenity improvements
24 Youth Development Foundation
MLB/MLBPA
MLB-MLBPA Youth Development Foundation (YDF) is a joint initiative by MLB and MLBPA to support efforts that focus on improving the caliber, effectiveness and availability of amateur baseball and softball programs across the United States and internationally.
Ongoing X X
• Field lighting, renovations, and construction
• Equipment and/or fees for baseball and softball programs
• Programs to promote baseball and softball
In addition to the funding programs provided in the previous tables, there are also a number of traditional funding and financing tools available to local governments that may be used to advance parks and recreation projects.
These funding and financing tools include, but are not limited to:
» Community Facilities District
» Easement Agreements/Rules
» Equipment Rental Fees
» Facilities Benefit Assessment District
» Facility Use Permit Fees
» Recreation Service Fees
» Food and Beverage Tax
» General Fund
» General Obligation Bonds
» Infrastructure Financing District
» In-Lieu Fees
» Intergovernmental Agreements
» Lease Revenues
» Mello Roos District
» Park Impact Fees
» Pouring Rights Agreements
» Private Development Agreements
» Residential Park Improvement Fees
» Revenue Bond Revenues
» Sales Tax Revenues
» Surplus Real Estate Sale Revenues
» Traffic Impact Fees
» Transient Occupancy Tax Revenues
» Utility Taxes
» Wastewater Fund Reserves
» Business Improvement District
» Maintenance Assessment District
» Property Based Improvement District
» Landscape Maintenance District
» Targeted Fundraising Activities
» Special Habitat Conservation Programs
» Special Parks and Recreation Bond Revenues