Open Spaces & Urban Greening Master Plan December 2019 Final City of Placentia
Acknowledgements
City of Placentia

Sandra Gonzalez, Director of Community Services
Veronica Ortiz, Community Services Supervisor, Project Manager
Luis Estevez, Director of Public Works
Marshe Samuel, Office Assistant
KTUA
Mike Singleton, Principal
Brooke Whalen, Associate Principal, Project Manager
Jacob Leon, Associate, Assistant Project Manager
Alex Samarin, GIS Manager
Silvia Fang, GIS Analyst
Juan Alberto Bonilla, Senior Planner
Jorge Nozot, Planner
Southern California Association of Governments

PLACENTIA OPEN SPACES AND URBAN GREENING MASTER PLAN DRAFT II
TABLE OF CONTENTS III 01 02 03 04 05 Table of Contents Introduction ............................................................... 1 Purpose ............................................................................................. 2 Study Area: City of Placentia .............................................................. 2 Ongoing and Past Guiding Plans ........................................................ 5 Primary Guidance for Street and Citywide Park Design ....................... 7 Applicable Initiatives and Legislation ................................................. 10 Existing Conditions & Analyses .......................... 15 Existing Conditions ........................................................................... 16 Analysis 36 Community Engagement ....................................... 47 Community Engagement Overview 48 Recommendations .................................................. 57 Park Recommendations 58 Green Street Toolbox ...................................................................... 114 Recommended Programs and Partnerships ..................................... 122 Evolving State of Mobility ................................................................ 126 Funding .................................................................. 127 Potential Funding Sources ............................................................... 128
List of Figures
PLACENTIA OPEN SPACES AND URBAN GREENING MASTER PLAN DRAFT IV
Figure 1-1: City of Placentia Study Area ........................................... 3 Figure 2-1: Land Use 19 Figure 2-2: Parks and Open Space 21 Figure 2-3: Tree Canopy 27 Figure 2-4: Public Easements and Utility Corridor Opportunities 29 Figure 2-5: Street Classifications 31 Figure 2-6: Transit Routes ............................................................. 33 Figure 2-7: Existing and Previously Proposed Bike Facilities ........... 35 Figure 2-8: Existing Parks Level of Service ..................................... 37 Figure 2-9: School Joint-Use Agreements Parks Level of Service ... 38 Figure 2-10: Expanded Parks Level of Service ................................ 39 Figure 2-11: Bicyclist and Pedestrian Collision Analysis .................. 41 Figure 2-12: Health and Equity Index ............................................. 43 Figure 2-13: Park Connections Model ............................................ 45 Figure 4-1: Bradford Park Infill/Expansion Potential........................ 60 Figure 4-2: Bradford Park Travelshed ............................................. 61 Figure 4-3: Goldenrod Park Infill/Expansion Potential .................... 62 Figure 4-4: Goldenrod Park Travelshed ......................................... 63 Figure 4-5: Jaycee Parkette Infill/Expansion Potential 64 Figure 4-6: Jaycee Parkette Travelshed 65 Figure 4-7: Koch Park Infill/Expansion Potential 66 Figure 4-8: Goldenrod Park Travelshed 67 Figure 4-9: Kraemer Park Infill/Expansion Potential 68 Figure 4-10: Kraemer Park Travelshed ........................................... 69 Figure 4-11: La Placita Parkette Infill/Expansion Potential............... 70 Figure 4-12: La Placita Parkette Travelshed .................................... 71 Figure 4-13: McFadden Park Infill/Expansion Potential ................... 72 Figure 4-14: McFadden Park Travelshed ........................................ 73 Figure 4-15: Parque de los Ninos Infill/Expansion Potential 74 Figure 4-16: Parque de los Ninos Travelshed 75 Figure 4-17: Parque de los Vaqueros Infill/Expansion Potential 76 Figure 4-18: Parque de los Vaqueros Travelshed 77 Figure 4-19: Parque del Arroyo Verde Infill/Expansion Potential 78 Figure 4-20: Parque del Arroyo Verde Travelshed........................... 79 Figure 4-21: Champions Sports Complex Infill/Expansion Potential 80 Figure 4-22: Placentia Champions Sports Complex Travelshed ...... 81 Figure 4-23: Richard R. Samp Park Infill/Expansion Potential .......... 82 Figure 4-24: Richard R. Samp Park Travelshed ............................... 83 Figure 4-25: Santa Fe Park Infill/Expansion Potential...................... 84 Figure 4-26: Santa Fe Park Travelshed ........................................... 85 Figure 4-27: Tuffree Park Infill/Expansion Potential ........................ 86 Figure 4-28: Tuffree Park Travelshed ............................................. 87 Figure 4-29: Park Infill/Expansion – Wagner Park ........................... 88 Figure 4-30: Wagner Park Travelshed ............................................ 89 Figure 4-31: Tri-City Park Infill/Expansion Potential ........................ 90 Figure 4-32: Tri-City Park Travelshed 91 Figure 4-33: Jaycee Parkette Concept Plan 94 Figure 4-34: McFadden Park Concept Plan 95 Figure 4-35: La Placita Parkette Concept Plan 96 Figure 4-36: Kraemer Park Concept Plan 97 Figure 4-37: Santa Fe Park Concept Plan ....................................... 98 Figure 4-38: Linear Park and Multi-Use Path Opportunities ......... 103 Figure 4-39: Typical 14 Foot Class 1 multi-use path ..................... 106 Figure 4-40: Typical 30-35 Foot Class 1 multi-use path ................ 107
List of Tables
TABLE OF CONTENTS V
Table 4-1: Park Infill/Expansion – Bradford Park ............................ 60 Table 4-2: Park Infill/Expansion – Goldenrod Park 62 Table 4-3: Park Infill/Expansion – Jaycee Parkette 64 Table 4-4: Park Infill/Expansion – Koch Park 66 Table 4-5: Park Infill/Expansion – Kraemer Park 68 Table 4-6: Park Infill/Expansion – La Placita Parkette 70 Table 4-7: Park Infill/Expansion – McFadden Park ......................... 72 Table 4-8: Park Infill/Expansion – Parque de los Ninos .................. 74 Table 4-9: Park Infill/Expansion – Parque del Arroyo Verde ............ 78 Table 4-10: Park Infill/Expansion – Champions Sports Complex .... 80 Table 4-11: Park Infill/Expansion – Richard R. Samp Park ............... 82 Table 4-12: Park Infill/Expansion – Santa Fe Park........................... 84 Table 4-13: Park Infill/Expansion – Wagner Park ............................ 88 Table 4-14: Park Prioritization ...................................................... 92 Table 4-15: Tree Pallette ............................................................ 110 Table 5-1: Potential Funding Sources ......................................... 129

01
Introduction
Purpose
The mission statement of Placentia is to keep the City a pleasant place by providing a safe family atmosphere, superior public services, and policies that promote the highest standards of community life. With this mission in mind, the primary purpose of this study is to take a fresh look at what Placentia has in terms of park and open spaces assets and how alternative and non-motorized transportation amenities can get people to these locations. Another goal is to provide potential future expansion of the urban forest within future parks and open space areas.
Placentia’s history is rooted in agriculture, but the population since its start in 1837 continues to grow, especially booming during the 1970s. Today, the community of 52,294 residents that occupy the City are finding that the available land for parks and open space is quickly disappearing with new development.
Based on the ever-growing population, equivalences will be an essential tool for expanding recreation in non-traditional ways. This includes non-standard parks, linear parks, pocket parks and other non-traditional public realm spaces. In addition, land and policies dedicated to allowing for networks of walkways, pedestrian paths, bike facilities, and public transportation services will be important for future growth in providing healthy access to recreation and in meeting the sustainability goals of reducing VMT and GHG levels.
In April 2016, the Southern California Association of Governments (SCAG) adopted the 2016-2040 Regional Transportation PlanSustainable Communities Strategy (RTO/SCS), which is used to guide regional planning policy through the integration of land use planning and transportation investment decision-making aimed at local sustainability and active transportation assistance for bicycle and pedestrian planning efforts. The Sustainability Planning Grant (SPG) is a key SCAG initiative for implementing the RTP/SCS. It focuses on meeting local needs of the residents to help implement the RTP/SCS, reducing greenhouse gas (GHG) emissions, and provides a range of local and regional benefits.
The City of Placentia received funding for one of the approximately 65 projects that were part of SCAG’s Sustainability Planning grant program. The City of Placentia’s Open Spaces and Urban Greening Master Plan (Plan) outlines a sustainability strategy to preserve and improve existing parks and open space, recapture future parks and open space, increase the urban forest, and implement urban greening strategies to reduce Vehicle Miles Travelled/Greenhouse Gas (VMT/GHG) emissions.
As part of the urban greening strategies, the Plan will create new non-motorized transportation options that connect people to open spaces, public transit, Old Town Placentia, the Orange County Loop (OC Loop), and the future Metrolink Station. The Plan will identify optimal locations for bike and pedestrian paths that will encourage residents to cycle and/or walk to the City’s open spaces, parks, and the OC Loop, 66 miles of seamless connections and an opportunity for people to bike, walk and connect to some of Southern California’s most scenic beaches and inland recreation areas.
Study Area: City of Placentia
This plan examines the network of open space and parks through the entire City and how people access the parks, including active and mass transportation.
Placentia is located within the County of Orange, totalling an area of 6.6 square miles. State Route (SR) 91 runs south of the City and the SR 57 runs through the southwest section of Placentia. The origin of Placentia as it was incorporated in 1926 is rooted in rail transit and citrus. The Santa Fe Railroad was rerouted through the area to support the local citrus industry and packing houses to distribute avocados, grapes, walnuts, and citrus fruit. The Valencia Orange Growing and Packing became the center of the City and supported much of the growth at that time. Today, Placentia is known for its quiet neighborhoods and historic downtown, and has a population of 52,294.
PLACENTIA OPEN SPACES AND URBAN GREENING MASTER PLAN 2

CHAPTER 1 | INTRODUCTION 3
Figure 1-1: City of Placentia Study Area
Brea
Yorba Linda
Anaheim
Fullerton
Placentia Open Space for Recreation
The City of Placentia currently has 100.9 acres of park land which includes parklettes, neighborhood parks, community parks, and a portion of special use (golf courses and sports complexes) and sub regional parks (County of Orange Tri-City Park). The Community Services Department operates 15 parks within the City.
Placentia Bikeways
The City of Placentia currently includes Class I, II, and III bike facilities. These bikeways provide access to schools, transit, parks, and other open space within the City, but also function as a recreational opportunity within the City. It is the City’s goal to include bikeways into new development of street networks and as part of implementing Complete Streets concepts, but also as a way to connect to neighboring cities and counties within the region.

Placentia Walkways
The walkway system within the City of Placentia includes sidewalks along road networks and multi-use paths set off roadways. Throughout the City, there is a need to improve connectivity by replacing or repairing damaged walks or incorporating new walks where there is a gap, and installing pedestrian ramps and facilities at road intersections where they are missing. Similar to bikeways, walkways provide access to transit, schools, parks, and open space, and it is the City’s goal to enhance the network to provide more opportunities to walk to and from various destinations.
PLACENTIA OPEN SPACES AND URBAN GREENING MASTER PLAN
Ongoing and Past Guiding Plans
The following plans were reviewed for relevance to the Plan and to ensure that all planning efforts are aligned and integrated. The plans consist of ongoing studies such as the General Plan update and its corresponding elements, as well as completed studies.
City of Placentia General Plan
The Placentia General Plan is the primary city-wide comprehensive plan that guides future growth. The City of Placentia is currently undergoing an update to the General Plan. Within the plan, the Open Space and Recreation Element and the Circulation Element addresses goals and policies related to open space and access to recreational opportunities.
Open Space and Recreation Element
The Open Space and Recreation Element provides strategies and actions to preserve and enhance open space areas to meet the recreational needs of its residents. The document quantifies different types of open space and recreational facilities in an attempt to meet the City’s park development goal of providing 4 acres per 1,000 residents for a total goal of 202 acres.
The element identifies recreational needs with an assessment of its residents through participant/user surveys and staff, instructor, participant, and citizen input at community meetings. Needs include a skate park, dog park, gymnasium, senior/community center, performing arts center, and an aquatics complex based on the City of Placentia Parks and Facilities Development Study completed in February 2007.
Mobility Element
The Mobility Element of the General Plan provides the City’s overall transportation management for streets, highways, rail lines, active transportation, and all other modes of transportation. The Mobility Element also recognizes the City’s commitment towards advancing innovation in transportation and long term sustainability as outlined in SB 375, AB 1358, and SB 1000.
This element also acknowledges the important relationship between land use and transportation. The goals and polices outlined go hand-in-hand with both the transportation system and the people and goods it must service.
Complete Parks Placentia Research and Analysis
The Complete Parks document identifies current policies and goals within the City related to parks. Through the process of community outreach, the following were identified as areas for improvements for the park system.
• Increase maintenance, vigilance, and lighting;
• Improved programming opportunities for all age groups including adults, free programming, and cultural events;
• Provide well maintained plantings including increased tree canopies and water efficient landscape;
• Increase funding for parks; and
• Improve comfort levels for walking and biking to parks.
Old Town Placentia Revitalization Plan
The Old Town Placentia Revitalization Plan recognizes the importance of the safety and improved character of the public realm. By incorporating infrastructure for bicycling, and creating streets, sidewalks, paseos, and parks that encourage walking, the Old Town area provides an opportunity to increase walking and biking to park, open space, and transit, and to expand the tree canopy.
CHAPTER 1 | INTRODUCTION 5
Systematic Safety Analysis Report
As a part of the Caltrans funded Systemic Safety Analysis Report Program (SSARP), a citywide assessment of collisions was completed to propose modifications in traffic controls and safety improvement projects to address elevated collision rates along roadways and at intersections throughout Placentia. A total of 46 project recommendations were made and broken into groups based on the improvements required and funding capabilities.
The first project will upgrade traffic signal equipment and provide left-turn arrows at the following five intersections:
• Bastanchury Road at Valencia Avenue
• Yorba Linda Boulevard at Kraemer Boulevard

• Yorba Linda Boulevard at Palm Drive
• Kraemer Boulevard at Madison Avenue
• Chapman Avenue at Bradford Avenue
The second group of 19 projects, roadway segment improvements, include elements such as restricting left turns, installing new traffic signals, improving sight distances, installing medians and curb extensions, and striping modifications. The third group of 22 projects, intersection improvements, include elements such as new flashing yellow arrows for left-turns, installing new left-turn lanes, updating traffic signal timing, and reconfiguring traffic signal operations.
The Orange County Loop
The Orange County (OC) Loop is a vision for 66 miles of seamless connections and an opportunity for people to bike, walk, and connect to some of California’s most scenic beaches and inland reaches. About 80 percent of the OC Loop is already in place and currently covers nearly 54 miles. OCTA has been working closely with Placentia to close the gaps that currently exist within the City.
OCTA ATP Master Plan
Orange County Transportation Authority (OCTA) is working to develop Orange County’s Bike and Pedestrian Plan to improve active transportation county-wide in order to make active transportation a more reliable mode of transportation within Orange County.
Project goals include:
• Advance a strategic walking and biking network;
• Enhance walking and biking access to transit;
• Improve high-need pedestrian areas;
• Reduce pedestrian and bicyclist collisions;
• Strengthen stakeholder partnerships;
• Incorporate diverse community perspectives; and
• Leverage funding opportunities.
PLACENTIA OPEN SPACES AND URBAN
PLAN
GREENING MASTER
Primary Guidance for Street and Citywide Park Design
Providing safe, convenient, and comfortable access for all users is the primary goal of comprehensive street design. This report recommends using Complete Streets standards as the basis for new roadway design, construction, and renovation. Assembly Bill 1358 codifies Complete Streets into law by requiring that general plan circulation element updates: “identify how the jurisdiction will provide for the routine accommodation of all users of the roadway including drivers, pedestrians, cyclists, individuals with disabilities, seniors, and public transit users.” Placentia has addressed complete street concepts in the 2019 general plan & mobility element update & has indicated a strong commitment to expanding active transportation opportunities to the community. While pedestrians have benefited from “routine accommodation,” with features such as sidewalks, curb ramps, crosswalks, dedicated crosswalk signals, etc., these infrastructural improvements are still not universally applied. This results in a walking environment often perceived as unsafe and uncomfortable, which therefore discourages people from walking. Pedestrian accommodation is being re-evaluated in the context of improving the overall street environment through the implementation of additional enhancements that make walking more comfortable, and therefore to encourage more people to do so.
Bicycle infrastructure state of practice in the United States has undergone a significant transformation in the last decade. Much of this may be attributed to bicycling’s changing role in the overall transportation system. Once viewed as an “alternative” mode, it is increasingly viewed as a legitimate transportation mode and one that should be actively promoted as a means of achieving environmental, social, and economic goals.
While connectivity and convenience remain essential quality indicators, much recent research indicates that the increased acceptance and practice of daily bicycling, in particular, will require “low-stress” bicycle infrastructure. Specific types and design
interventions intended to encourage ridership among the “interested, but concerned” demographic tend to be those that separate bicyclists from high volume and high speed vehicular traffic.
Just as the state of practice of bicycle and pedestrian infrastructure has evolved, so has technical guidance. While bikeway design guidance in California has traditionally come from the state, especially Caltrans and the California Manual on Uniform Traffic Control Devices (CA MUTCD), cities are increasingly turning to national organizations for guidance on best practices. These are primarily the American Association of State Highway and Transportation Officials (AASHTO), the National Association of City Transportation Officials (NACTO), and the Federal Highway Administration (FHWA).
Fortunately for California cities, there is increased flexibility in design guidance offered by both Caltrans and the FHWA. In 2014, Caltrans officially endorsed the NACTO Urban Street Design Guide and Urban Bikeway Design Guide as valuable toolkits for designing and constructing safe, attractive streets for all users. California cities may also apply for experimental designation from the FHWA for projects not in conformance with the CA MUTCD.
The creation of more Complete Streets is supported by these manuals’ guidance, as well as by several pieces of important legislation. The following section provides a review of the state of practice for walking and bicycling infrastructure, particularly the AASHTO and NACTO guides. It also includes a discussion on Routine Accommodation, as well as summaries of relevant legislation at the local, regional, state, and national levels.
Infrastructure design improvement recommendations described later in this report borrow heavily from the AASHTO Guide to Bicycle Facilities and the NACTO Urban Bikeway and Urban Street Design Guides, particularly for guidance on “innovative” infrastructure. The FHWA supports using these resources to further develop bicycling and walking transportation networks, particularly in urban areas. Compliance with applicable guidelines and standards is also required by California Street and Highways Code Section 891.2 and most grant programs.
CHAPTER 1 | INTRODUCTION 7
NACTO Urban Bikeway/Urban Street Design Guides


The NACTO guides represent the industry standard for innovative bicycle and walking infrastructure and treatments in the United States. In 2014, Caltrans followed AASHTO and officially endorsed the NACTO Urban Street Design Guide and Urban Bikeway Design Guide as valuable toolkits for designing and constructing safe and attractive streets. At the time, Caltrans was only the third State Department of Transportation to officially endorse the guides. It is important to note that virtually all of the bikeway guide’s design treatments (with two exceptions) are permitted under the Federal MUTCD. The NACTO Urban Street Design Guide is the more generalized of the two guides and organized into six sections. Each section is further subdivided, depending on topic. The NACTO Urban Bikeway Design Guide is also organized into six sections, but its information is bicycle-specific. For each section, it offers three levels of guidance: Required Features, Recommended Features, and Optional Features.
NACTO Transit Street Design Guide

As transit starts to gain a more prominent role in cities, more people are using buses, streetcars, and light rail than ever before. As a result, street design is shifting to give transit the space it deserves. The NACTO Transit Street Design Guide provides guidance for the development of transit infrastructure on streets, as well as for
prioritizing transit, improving its service quality, and to support other related goals. The majority of design elements included in this guide are consistent with MUTCD standards, including signage, markings, and signal elements that have received interim approval. These guidelines were developed using other design guidance as a basis, along with city case studies, best practices, research, and evaluation of existing designs, and professional consensus.
NACTO Urban Street Stormwater Guide

The NACTO Urban Street Stormwater Guide provides guidance on how to create resilient cities that are better prepared for climate change, while creating public spaces that deliver social and economic value. This guide focuses on green infrastructure within urban streets, including the design and engineering of stormwater management practices that support and improve mobility. It also intends to reduce the impacts of runoff and human activity on natural ecological processes.
One of the main goals of this guide is to encourage interdepartmental partnerships around sustainable infrastructure, which includes communicating the benefits of such projects. However, this guide does not address stormwater management strategies on private property, nor does it address drainage and infiltration around controlled-access highways.
PLACENTIA OPEN SPACES AND URBAN GREENING MASTER PLAN 8
Caltrans Highway Design Manual - Chapter 1000 –
Bikeway Planning and Design
This reference has long been the official resource for bikeway planning and design in California, but now largely represents the minimum standards required for specific bikeway infrastructure types. Senate Bill 1 (Road Repair and Accountability Act) includes a provision for Caltrans to update the Highway Design Manual to incorporate “Complete Streets” design concepts.
AASHTO Guide to Bikeway Facilities
This memorandum expresses FHWA support for taking a flexible approach to bicycle and pedestrian infrastructure design. The AASHTO bicycle and pedestrian design guides are the primary national resources for planning, designing, and operating bicycle and pedestrian infrastructure. The NACTO Urban Bikeway Design Guide and the Institute of Transportation Engineers (ITE) Designing Urban Walkable Thoroughfares guide builds upon the flexibilities provided in the AASHTO guides, which can help communities plan and design safe and convenient walking and riding infrastructure.
Recreation, Park, and Open Space Guidelines
For several years, the accepted standard for measuring and assessing needs within a city’s park and recreation standards has been population and geographic area using recommendations from the National Recreation and Parks Association (NRPA). As a guiding principle, this is a good start for minimum standards, however, no two cities are the same and further investigation into the demographics, density of development, financial constraints, and user priorities should also be considered. A study completed by NRPA, 2016 NPRA Field Report Park and Recreation Agency Performance Benchmarks, was developed to highlight average standards different recreation and park agencies are currently meeting across the nation. Within this document, it notes that typical park and recreation agencies have 9.5 acres of park land per 1,000 residents and that there is one park for every 2,277 residents. It also identifies various amenities that are found in outdoor facilities with a majority of the park and recreation agencies having playgrounds as an asset.
Applicable Initiatives and Legislation
The following section describes state and local legislations, bonds, and initiatives that are related to parks, urban forestry, and active transportation. This background information helps inform some of the overarching goals of the Plan.
NRPA Parks and Recreation Inclusion Report
While not currently part of any required legislation, the National Recreation and Parks Association (NRPA) encourages cities to develop their own formal inclusion policy. This policy would ensure every member of their community has access to the benefits that parks and recreation offer regardless of race, ethnicity, age, income level, physical ability, sexual orientation, gender, or religion. To support this cause, NRPA’s Parks for Inclusion initiative aims to improve access to health and wellness activities in parks and works at a framework for individual cities to create and implement inclusive policies in local parks and recreation.
Excel Beyond the Bell (EBB Program)
NRPA has been advocating alongside key out-of-school-time partners, including the Afterschool Alliance, Boys & Girls Clubs of America and the National 4-H Council, to raise the profile of quality summer and afterschool programs as a critical strategy in combatting the nation’s substance abuse epidemic. EBB aims to keep young people healthy, productive, and connected during out-of-school time. With a proven track record for increasing resilience, supporting positive youth development, and preventing substance use, EBB has shown how investing in afterschool and summer learning programs is a cost-effective way for Congress to help build and enhance an integrated trauma-informed system that supports children, youth, and families impacted by the substance misuse crisis in this country.
Let’s Move!
Past President Obama, along with Past First Lady Michelle Obama, established the Let’s Move Campaign in an effort to help solve the problem of childhood obesity. Strategies included updating child nutrition policies in a way that addresses the best available scientific information, ensuring access to healthy, affordable food in schools and communities, as well as increasing physical activity and empowering parents and caregivers with the information and tools they need to make good choices for themselves and their families.
California Children’s Outdoor Bill of Rights (COBR)
The California Children’s Outdoor Bill of Rights (COBR) identifies ten outdoor activities that the California Roundtable on Recreation, Parks and Tourism believes are the basic outdoor needs for healthy childhood development. The California Children’s Outdoor Bill of Rights states that every child should have the opportunity to:
• Play in a safe place
• Explore nature
• Learn to swim
• Go fishing
• Follow a trail
• Camp under the stars
• Ride a bike
• Go boating
• Connect with the past
• Plant a seed
CA Proposition 68 (2018)
Proposition 68 passed in June 2018 as the largest bond investment in natural resources and under-served communities in California’s history. Available funds are aimed at enhancing local or regional park infrastructure as well as creating new parks and new recreation opportunities in under-served communities across California.
Over $250 million dollars will be awarded through the State-wide Park Program (SPP) through a competitive grant process.
PLACENTIA OPEN SPACES AND URBAN GREENING MASTER PLAN 10
City of Placentia Measure U
Measure U, a local one-cent sales tax measure, was approved by local voters during the November 6, 2018 ballot. Measure U will provide local funds for Placentia’s 911 emergencies and essential city services. The measure will fund public safety services such as street paving and keeping public areas such as parks and community centers clean and free of graffiti.
State Legislation
AB-32 California Global Warming Solutions (2006)
This bill calls for the reduction of greenhouse gas emissions and codifies the 2020 emissions reduction goal. This act also directs the California Air Resources Board to develop specific early actions to reduce greenhouse gases while also preparing a scoping plan to identify how best to reach the 2020 limit.
AB-390 Pedestrian Crossing Signals (2017)
AB-390 was signed by the governor in October 2017. Under the previous state law, it was illegal to step into a crosswalk if the countdown timer was counting down—even if the person crossing the street had enough time to make it to the other side before the traffic light changed. The new bill allows a pedestrian facing a flashing “DON’T WALK” or “WAIT” or approved “Upraised hand” symbol with a “countdown” signal to proceed so long as a pedestrian completes the crossing before the display of the steady “Don’t Walk” or “Wait” or “upraised hand” symbol when the countdown ends.
AB-902 Traffic Violations and Diversion Programs (2015)
Existing law provides that a local authority may not allow a person who has committed a traffic violation under the Vehicle Code to participate in a driver awareness or education program as an alternative to the imposition of those penalties and procedures, unless the program is a diversion program for a minor who commits an infraction not involving a motor vehicle and for which no fee is charged.
This bill allows any person of any age who commits an infraction not involving a motor vehicle to participate in a diversion program that is sanctioned by local law enforcement. The bill eliminates the requirement that such a program charge no fee.
AB-1096 Electric Bicycles as Vehicles (2015)
This bill clarifies electric bicycle (e-bike) status in California as those with fully operable pedals and an electric motor of less than 750 watts. It establishes three classes of electric bicycles based on their motor speed and level of electric assist:
Class 1 e-bike, or low-speed pedal-assisted electric bicycle, is equipped with a motor that provides assistance only when the rider is pedaling and that stops providing assistance when the bicycle reaches 20 mph.
Class 2 e-bike, or low-speed throttle-assisted electric bicycle, is equipped with a motor that can exclusively propel the bicycle and that cannot provide assistance above 20 mph.
Class 3 e-bike, or speed pedal-assisted electric bicycle, is equipped with a motor that provides assistance only when the rider is pedaling and stops providing assistance when the bicycle reaches 28 mph.
E-bike operators do not need a driver’s license, registration or license plate, but must abide by existing traffic laws. While Classes 1 and 2 are considered legal on streets and trails, Class 3 e-bikes are prohibited from paths, lanes, and trails unless specifically authorized by a local ordinance. Class 3 e-bikes operators must be 16 or older and wear a helmet.
AB-1193 Bikeways (2014)
This bills amends various code sections, all relating to bikeways in general, specifically by recognizing a fourth class of bicycle infrastructure, cycle tracks. However, the following may be even more significant to future bikeway development:
Existing law requires Caltrans, in cooperation with county and city governments, to establish minimum safety design criteria for the planning and construction of bikeways, and requires the
CHAPTER 1 | INTRODUCTION 11
department to establish uniform specifications and symbols regarding bicycle travel and traffic related matters. Existing law also requires all city, county, regional, and other local agencies responsible for the development or operation of bikeways or roadways to utilize all of those minimum safety design criteria and uniform specifications and symbols.
This bill revised these provisions to require Caltrans to establish minimum safety design criteria for each type of bikeway and also authorized local agencies to utilize different minimum safety criteria if adopted by resolution at a public meeting.
AB-1218 California Environmental Quality Act Exemption: Bicycle Transportation Plans (2017)
According to the Civil Code, Section 15262, Feasibility and Planning Studies:
“A project involving only feasibility or planning studies for possible future actions which the agency, board, or commission has not approved, adopted, or funded does not require the preparation of an EIR or Negative Declaration, but does require consideration of environmental factors. This section does not apply to the adoption of a plan that will have a legally binding effect on later activities. Association of Environmental Professionals 2014 CEQA Guidelines 229.”
AB-1218 extends CEQA exemptions for bicycle transportation plans for an urbanized area until January 1, 2021. These exemptions include restriping of streets and highways, bicycle parking and storage, signal timing to improve street and highway intersection operations, and related signage for bicycles, pedestrians, and vehicles under certain conditions. It exempts projects consisting of restriping of streets and highways for bicycle lanes in an urbanized area that are consistent with a bicycle transportation plan under certain conditions. Planning projects such as this Plan are generally exempt from CEQA analysis since they are planning and conceptual recommendations. As individual recommendations move forward toward further design and implementation, the City will then need to determine if there are impacts for which additional environmental review may be necessary.
AB-1358 Complete Streets (2008)
This bill requires the legislative body of a city or county, upon revision of the circulation element of their general plan, to identify how the jurisdiction will provide for the routine accommodation of all users of the roadway including drivers, pedestrians, cyclists, individuals with disabilities, seniors, and public transit users. The bill also directs the State Office of Planning Research (OPR) to amend guidelines for general plan circulation element development so that the building and operation of local transportation infrastructure safely and conveniently accommodates everyone, regardless of their travel mode.
AB-1371 Passing Distance/Three Feet for Safety (2013)
This bill, widely referred to as the “Three Foot Passing Law,” requires drivers to provide at least three feet of clearance when passing cyclists. If traffic or roadway conditions prevent drivers from giving cyclists three feet of clearance, they must “slow to a speed that is reasonable and prudent” and wait until they reach a point where passing can occur without endangering the cyclist. Violations are punishable by a $35 base fine, but drivers who collide with cyclists and injure them in violation of the law are subject to a $220 fine.
AB-1581 Bicycle and Motorcycle Traffic Signal Actuation (2007)
This bill defines a traffic control device as a traffic-actuated signal that displays one or more of its indications in response to the presence of traffic detected by mechanical, visual, electrical, or other means. Upon the first placement or replacement of a traffic-actuated signal, the signal would have to be installed and maintained, to the extent feasible and in conformance with professional engineering practices, so as to detect lawful bicycle or motorcycle traffic on the roadway. Caltrans has adopted standards for implementing the legislation.
SB-1 Road Repair and Accountability (2017)
This bill was drafted to address California’s significant funding shortfall in maintaining the state’s multi-modal transportation network, which is considered the state’s economic backbone and critical to quality of
PLACENTIA OPEN SPACES AND URBAN GREENING MASTER PLAN 12
life. It is specifically intended to direct increased revenue to the state’s highest transportation needs, while fairly distributing the economic impact of increased funding across all user types.
SB-1 increases several taxes and fees to raise over $5 billion annually in new transportation revenues, prioritizing funding towards maintenance and rehabilitation and safety improvements on state highways, local streets, and roads, and bridges and to improve the state’s trade corridors, transit, and active transportation infrastructure. Once fully implemented, approximately $1.5 billion per year in new revenue is earmarked for local streets and roads maintenance and rehabilitation and other eligible uses, including Complete Streets projects.
In addition to augmenting the Active Transportation Program by $100 million per year, SB 1 requires that Caltrans update the Highway Design Manual to incorporate “Complete Streets” design concepts.

SB-375 Redesigning Communities to Reduce Greenhouse Gases (2008)
This bill seeks to reduce vehicle miles traveled through land use and planning incentives. Key provisions require the larger regional transportation planning agencies to develop more sophisticated transportation planning models, and to use them for the purpose of creating “preferred growth scenarios” in their regional plans that reduce greenhouse gas emissions. The bill also provides incentives for local governments to incorporate these preferred growth scenarios into the transportation elements of their general land use plans.
SB-672 Traffic-Actuated Signals: Motorcycles and Bicycles (2017)
This bill extends indefinitely the requirement to install trafficactuated signals to detect lawful bicycle or motorcycle traffic on the roadway. By indefinitely extending requirements regarding traffic-actuated signals applicable to local governments, this bill would impose a state-mandated local program. Existing law requires the state to reimburse local agencies and school districts for certain costs mandated by the state.
SB-743 CEQA Reform (2013)
For decades, vehicular congestion has been interpreted as an environmental impact. Projections of degraded Level of Service (LOS) have, at a minimum, driven up project costs and, at a maximum, precluded projects altogether, particularly on-street bicycle projects.
SB-743 removes the requirement of LOS as a measure of vehicle traffic congestion that must be used to analyze environmental impacts under the California Environmental Quality Act (CEQA). This is important because adequately accommodating bicyclists, particularly in built-out environments, often requires reallocation of right-of-way, and the potential for increased vehicular congestion. The reframing of LOS as a matter of driver inconvenience, rather than an environmental impact, forces planners to assess the impacts of transportation projects differently and may help to support active transportation projects that improve mobility for all
CHAPTER 1 | INTRODUCTION
roadway users. For example, as of November 2017, California state agencies stopped using LOS to measure environmental impacts in lieu of Vehicle Miles Traveled (VMT).
SB-760 Transportation Funding: Active Transportation: Complete Streets (2017)
This bill established a Division of Active Transportation within Caltrans to give attention to active transportation program matters to guide progress toward meeting the department’s active transportation program goals and objectives. This bill requires the California Transportation Commission (CTC) to give high priority to increasing safety for pedestrians and bicyclists and to the implementation of bicycle and pedestrian infrastructure. The bill also directs the department to update the Highway Design Manual to incorporate “Complete Streets” design concepts, including guidance for selection of bicycle infrastructure.
Caltrans’ Deputy Directive 64-R1
Deputy Directive 64-R1 is a policy statement affecting Caltrans mobility planning and projects requiring the agency to: “...provide for the needs of travelers of all ages and abilities in all planning, programming, design, construction, operations, and maintenance activities, and products on the State highway system. The Department (Caltrans) views all transportation improvements as opportunities to improve safety, access, and mobility for all travelers in California and recognizes bicycle, pedestrian, and transit modes as integral elements of the transportation system.” The directive goes on to describe the environmental, health, and economic benefits of more Complete Streets.
Federal Legislation
S-2004/HR-2468 Safe Streets Act (2014)
HR2468 encourages safer streets through policy adoption at the state and regional levels, mirroring an approach already being used in many local jurisdictions, regional agencies, and states governments. The bill calls upon all states and metropolitan planning
organizations (MPOs) to adopt Safe Streets policies for federally funded construction and roadway improvement projects within two years. Federal legislation will ensure consistency and flexibility in road-building processes and standards at all levels of governance.
Complete Streets and Routine Accommodation
A Complete Street is one designed and operated to provide safe access for all users, including pedestrians, bicyclists, vehicle drivers, and transit riders of all ages and abilities. Complete Streets make it easy to cross the street, to walk to shops, and to bicycle to work. They allow buses to operate efficiently and make it safer for people to walk to and from transit locations.
A hurdle many cities face is that their various plans are not well integrated. Despite many cities’ attempts to support a “Complete Streets approach,” entrenched and often contradictory policies can make implementation difficult. For instance, an active transportation plan, an ADA transition plan, and a specific plan may address the same area, but ignore each other’s recommendations. One plan may identify a certain project, but it may not be implementable due to prevailing policies and practices that prioritize vehicular flow and parking over other modes.
Implementing Complete Streets policy often addresses increased flexibility to allow for the creation of a more balanced transportation system. In the case of an active transportation plan, the network identified could become the bicycle and pedestrian layers. Identification in such a plan, reiteration within a Complete Streets policy framework, and exemption from traditional traffic analyses can make implementation more likely and much more affordable.
Legislative support for Complete Streets can be found at the State level (AB-1358) and is being developed at the national level (HR2468). As noted in the previous section on applicable legislation, AB-1358 requires cities and counties to incorporate Complete Streets in their general plan updates and directs the State Office of Planning Research (OPR) to include Complete Streets principles in its update of guidelines for general plan circulation elements.
PLACENTIA OPEN SPACES AND URBAN GREENING MASTER PLAN 14
Existing Conditions & Analyses

02
Existing Conditions
Understanding the existing roadway conditions, demographics, land uses, and other context-sensitive information in Placentia is important for planning for its future. This chapter summarizes various datasets to provide meaningful discussions on how each of the topics support or impede bicycle and pedestrian facility development within the City.
This chapter also summarizes various analysis models used to understand the City’s park distribution and roadway network. Each dataset provides valuable information that contributes to the holistic understanding of the City’s current park and open space network and how to improve it.
Demographics
According to the U.S. Census 2017 American Community Survey (ACS), there are 52,294 residents living within Placentia’s 6.63 square miles. This results in a population density of 7,887 residents per square mile among the 16,408 households. Age distribution varies among the population, with 26.1 percent under the age of 19, 48.1 percent between the ages of 20 and 59, and 25.8 percent over the age of 60.
Placentia is also home to a racial and ethnic diverse population. 72.1 percent identify as white, 1.3 percent as black or African American, 0.7 percent American Indian and Alaska Native, 17.6 percent as Asian, 0.2 percent as native Hawaiian or Pacific Islander, 3.5 percent as two or more races, and 4.6 percent as some other race. Of the total population, 38.8 percent identify as Hispanic or Latino.
The median household income is $88,501. Of the households surveyed in 2017, most households have access to one or more vehicles, with just over 3 percent reporting lacking access to a vehicle.
PLACENTIA OPEN SPACES AND URBAN GREENING MASTER PLAN 16
Source: 2017 American Community Survey 5-year Estimate
Mode Share
According to the U.S. Census 2017 American Community Survey, there are an estimated 26,237 workers in Placentia. Mode splits for workers’ commute trips are:
• Car: 91 percent
• Public Transit: 2 percent
• Walk: 1 percent
• Bicycle: 1 percent
• Work from Home: 4 percent
• Other Means: 1 percent
Over 91 percent of workers in Placentia drive to work. This suggests that investments in transit and other mobility choices should be done to reduce employee commuter trips and reduce traffic congestion in Placentia.
Walking Mode Share
The walking mode share measures the percentage of workers aged 16 years and over who commute to work by foot. Mode share reflects how well infrastructure and land use patterns support travel to work by foot. In the City, walking mode share patterns are connected to the relative proximity of housing to employment centers.
Bicycling Mode Share
Similar to the walking mode share, bicycling mode share measures the percentage of resident workers aged 16 years and over who commute to work by bicycle. In the City, moderate bicycling mode share levels are evenly distributed, with peaks observed near high residential concentrations and retail commercial centers.
Public Transit Mode Share
Transit mode share measures the percentage of workers aged 16 years and over who commute to work by transit. This mode share reflects how well first mile-last mile infrastructure, transit routes, and land-use patterns support travel to work by transit.
Source: 2017 American Community Survey 5-year Estimate
CHAPTER 2 | EXISTING CONDITIONS & ANALYSES 17
Land Use
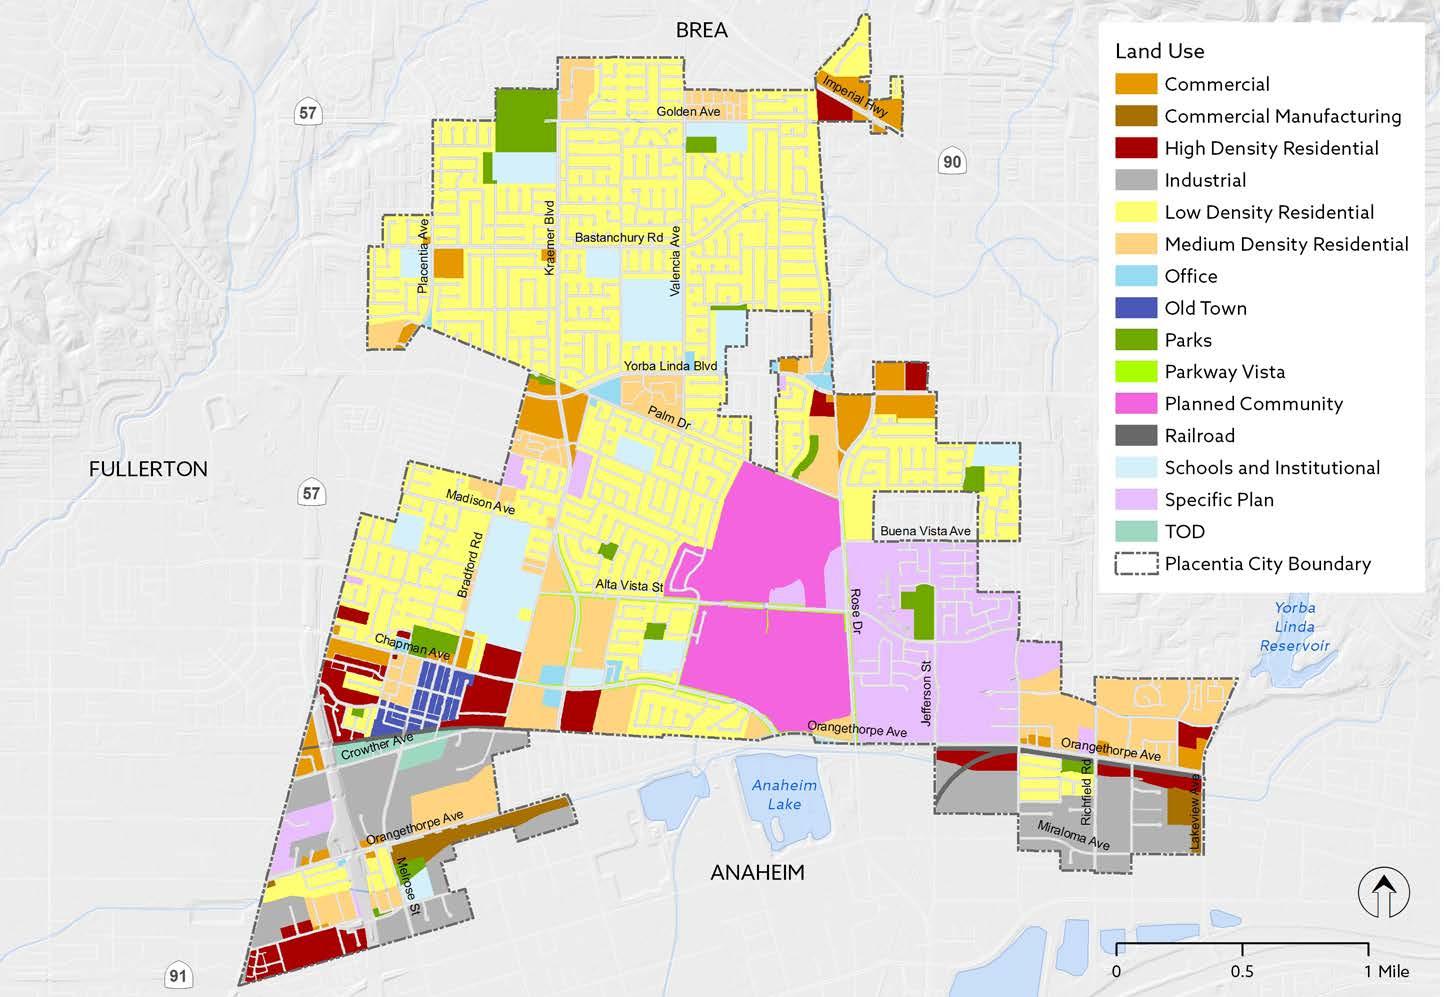
Placentia is home to a diverse set of land uses. The City contains large tracts of residential land uses supported by education, open space, commercial, and mixed use land uses north of Crowther Avenue. Industrial land uses are primarily found south of Crowther Avenue, supported by small sections of residential land uses. Commercial land uses are primarily found along arterial and collector streets such as Chapman Avenue, Kraemer Boulevard, and Yorba Linda Boulevard.
People who live in walkable neighborhods are
2 times
as likely to get enough physical activity as those who dont
PLACENTIA OPEN SPACES AND URBAN GREENING MASTER PLAN 18
CHAPTER 2 | EXISTING CONDITIONS & ANALYSES 19
Figure 2-1: Land Use
Parks and Open Space
Placentia defines open space and recreational facilities as parks, schools, community and privately-owned recreational facilities, bikeways, trails, golf courses, and open space easements. Efforts were focused on parks, joint-use agreements with schools, bikeways, trails, and open space easements for this Plan. Figure 2-2 depicts all of the parks that were evaluated and discussed during field work and community engagement.
PLACENTIA OPEN SPACES AND URBAN GREENING MASTER PLAN 20
1 2 3 4 5 6 7 8 9 10 11 12 13 14 15 16
Bradford Park
Placentia Champions Sport Complex
Goldenrod Park
Jaycee Parkette
Koch Park Kraemer Park
La Placita Parkette
Parque de los Vaqueros
Parque del Arroyo Verde
Richard R. Samp Park
Santa Fe Park
Tri-City Park
Tuffree Park
Wagner Park
McFadden Park
Parque de los Ninos

CHAPTER 2 | EXISTING CONDITIONS & ANALYSES 21 1 2 3 4 5 6 7 8 9 10 11 12 13 14 15 16
Figure 2-2: Parks and Open Space
PLACENTIA OPEN SPACES AND URBAN GREENING MASTER PLAN
Park and Recreation Inventory
The following table depicts the features and amenities present at each of the parks in Placentia.
22
Park Sites Acreage Barbecues Baseball/Softball Basketball Drinking Fountains Field Lights Flag Poles Walking Paths Overnight Camping Tot Lots Lake with Fishing Handball Courts Mobile Storage Multi-Purpose Facilities Bradford Park 1.7 1 1 1 Placentia Champions Sports Complex 13 2 3 2 12 22 1 1 1 3 1 Goldenrod Park 2.5 3 0.5 1 1 Jaycee Parkette 0.4 1 1 Koch Park 4.3 4 2 2 1 1 1 4 1 Kraemer Park 11 4 1 2 1 1 1 3 La Placita Parkette 0.9 1 McFadden Park 3.9 2 1.5 2 1 1 2 1 Parque de los Ninos 3.7 1 1 1 1 1 1 1 2 1 Parque de los Vaqueros 5.4 3 1 1
CHAPTER 2 | EXISTING CONDITIONS & ANALYSES 23 Open Grass Areas Park Lighting Picnic Structure Picnic Tables Playground Areas Restrooms Soccer Fields Tennis Courts Benches Reservations Swimming Pool Snack Shack Trash Cans Trash Dumpsters Outdoor Exercise Equipment 6 1 N 7 4 45 1 9 1 2 2 15 Y 1 51 2 1 1 7 1 7 N 7 1 1 N 1 12 3 17 1 1 15 Y 1 13 3 1 15 2 10 1 1 2 Y 19 3 X 1 1 N 1 18 1 1 1 Y 1 4 1 X 1 18 5 1 2 2 N 1 2 X 1 14 1 9 1 1 10 Y 8 2
PLACENTIA OPEN
24 Park Sites Acreage Barbecues Baseball/Softball Basketball Drinking Fountains Field Lights Flag Poles Walking Paths Overnight Camping Tot Lots Lake with Fishing Handball Courts Mobile Storage Multi-Purpose Facilities Parque del Arroyo Verde 4.4 2 2 1 1 Richard R. Samp Park 3.4 4 1 1 1 Santa Fe Park 1.1 1 Tri-City Park 40 10 4 1 1 1 Tuffree Park 3.4 2 2 2 14 1 1 1 2 2 1 Wagner Park 1.8 1
SPACES AND URBAN GREENING MASTER PLAN
CHAPTER 2 | EXISTING CONDITIONS & ANALYSES 25 Open Grass Areas Park Lighting Picnic Structure Picnic Tables Playground Areas Restrooms Soccer Fields Tennis Courts Benches Reservations Swimming Pool Snack Shack Trash Cans Trash Dumpsters Outdoor Exercise Equipment 1 9 9 1 1 4 Y 4 1 1 1 7 1 2 N 4 1 4 1 1 1 N 2 X 1 7 3 48 1 2 45 Y 88 2 1 4 1 6 1 1 2 2 Y 1 9 2 3 2 4 N 5
Tree Canopy
Figure 2-3 depicts Placentia’s tree canopy using the City’s current GIS tree data. This map identifies the current distribution of tree canopy benefits, and areas that are deficient. . The consistency of a tree canopy varies between neighborhoods and is largely based on the presence or absence of parkways or planted setbacks from the back of the sidewalk to property lines. Land use types also play a major role in the availability of a tree canopy. Industrial areas such as those found in the southwest section of the City between Crowther Avenue and Orangethorpe Avenue lack trees. This is contrasted by the neighborhood in northwest Placentia between Bastanchury Road, Kraemer Boulevard, Yorba Linda Boulevard, and Placentia Avenue which has an evenly distributed tree canopy. This information provides a visual guide to help prioritize neighborhoods and corridors that lack a consistent tree canopy.
711,000 tons
$3.8 billion
Urban trees in the U.S. remove of air pollution annually, providing in savings and improving public health
PLACENTIA OPEN SPACES AND URBAN GREENING MASTER PLAN 26

CHAPTER 2 | EXISTING CONDITIONS & ANALYSES 27
Figure 2-3: Tree Canopy
Public Easement, Utility Corridor Opportunities, and Vacant Parcels
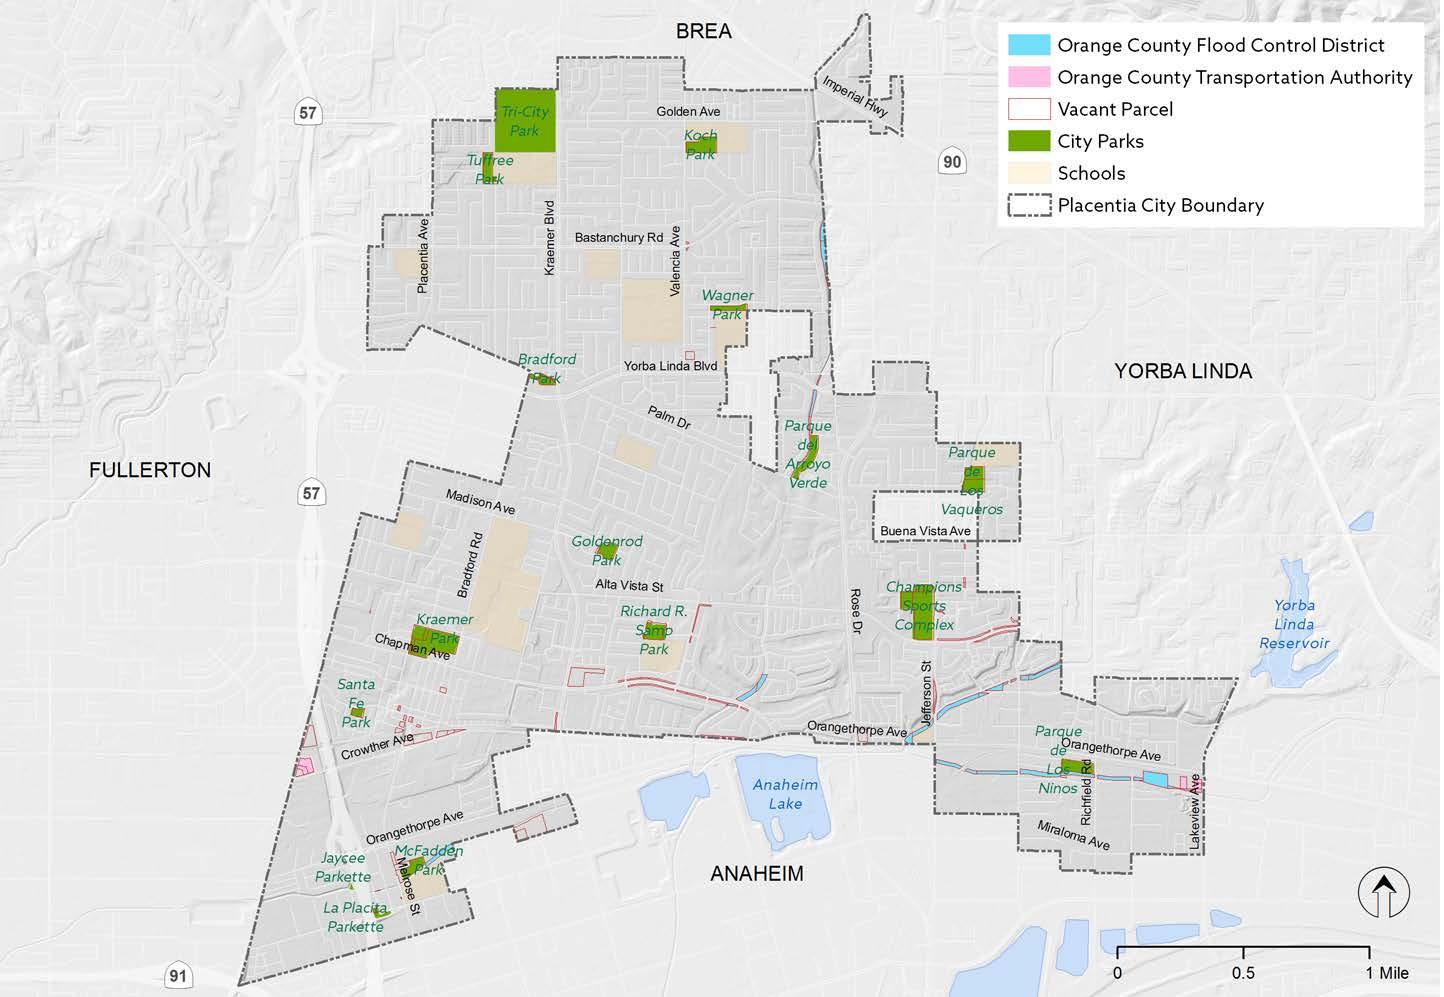
Within the City’s boundaries, there are limited public easement and utility corridor opportunities. There are a few flood control channels in the southern region of the City that may provide active transportation opportunities to parks and open space. Other opportunities include vacant parcels in the southern and southwestern regions of the city. Below is an example of a flood control channel the City is conducting research on to determine the feasibility of constructing a multi-use path. This potential multi-use path would provide access to McFadden Park, Valadez Middle School Academy, and Melrose Elementary School.
The City maintains a bikeway and trails agreement with County of Orange to use flood control properties as off-street pedestrian and bike trails. The City has partnered with the County on the development of ‘Segment D’ of OC Loop Project, which will be hosted in Placentia. In addition, the City recently received a Bicycle Corridor Improvement Program (BCIP) Grant application for planning and environment review for a bike trail along Atwood Channel.

PLACENTIA OPEN SPACES AND URBAN GREENING MASTER PLAN 28
McFadden Park
Valadez Middle School Academy
CHAPTER 2 | EXISTING CONDITIONS & ANALYSES 29
Figure 2-4: Public Easements and Utility Corridor Opportunities
Street Classification: Orange County Master Plan of Arterial Highways

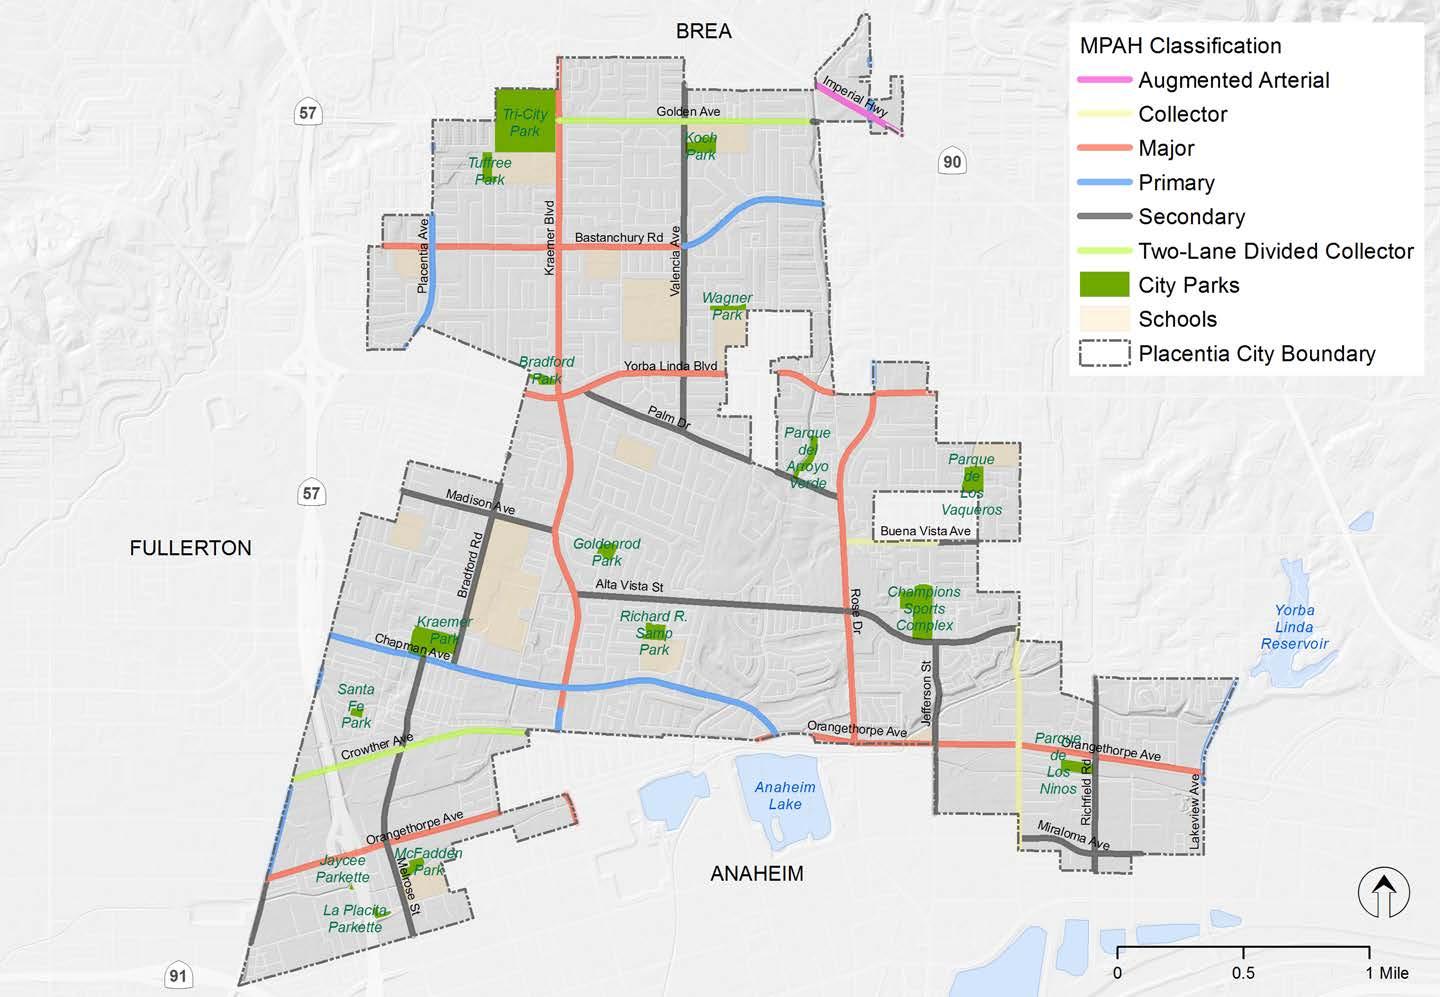
Placentia uses the Orange County Master Plan of Arterial Highways (MPAH) designation for its streets. The MPAH establishes a countywide surface roadway network intended to provide a guideline for the development of an inter-community arterial highway system to effectively serve existing and future land uses in the County. According to the Mobility Element, most of the major, primary, and secondary arterial streets within the City are built out to their designated width including curb, gutter, and sidewalk.
PLACENTIA OPEN SPACES AND URBAN GREENING MASTER PLAN 30
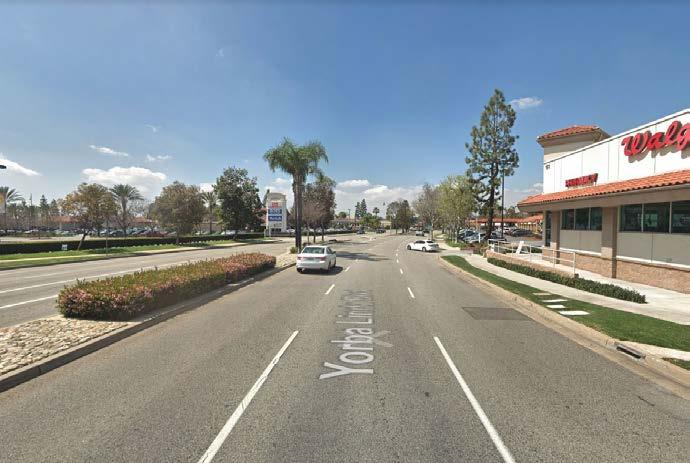
Arterial street, Yorba Linda Boulevard
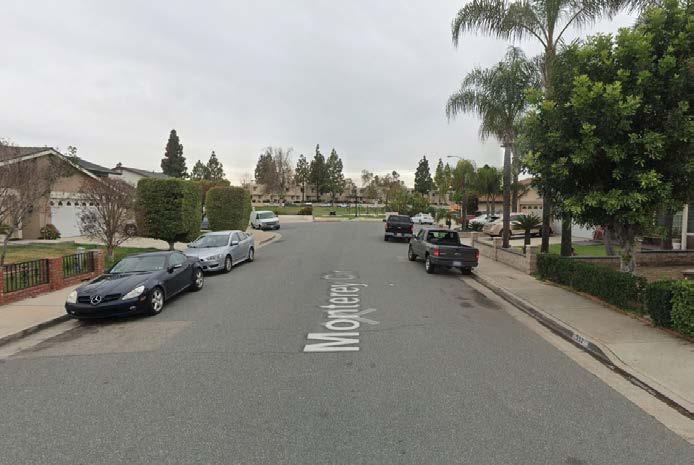
Collector street, Palm Drive Local street, Monterey Circle
CHAPTER 2 | EXISTING CONDITIONS & ANALYSES 31
Figure 2-5: Street Classifications
Transit Routes
Orange County Transportation Authority (OCTA) provides transit service to the City. OCTA has a small network of OC BUS routes that are found along the some of the City’s arterial and collector streets. Routes 20,24,26,30,71,129,153, and 213 service the City. A major ongoing effort between the City, OCTA, California State University Fullerton, and Metrolink is currently underway for the planning and construction of the future Placentia Metrolink Station located in Old Town Placentia. This new Metrolink station will service both the City and the region, and provide improved access to the other local and regional destinations.
30%
Public transit users take more steps per day than people who rely on cars
PLACENTIA OPEN SPACES AND URBAN GREENING MASTER PLAN 32

CHAPTER 2 | EXISTING CONDITIONS & ANALYSES 33
Figure 2-6: Transit Routes
Existing and Previously Proposed Bike Facilities
Placentia’s existing bike facility network includes bike routes, bike lanes, and multi-use paths. These facilities are located along major corridors and residential streets such as Kraemer Boulevard, Alta Vista, Jefferson Street, and Palm Drive. Figure 2-7 depicts previously planned bikeways that will aid in providing citywide connections to destinations such as schools, commercial centers, and parks. The Plan will use this information to determine where gaps can be addressed to ensure safe biking facilities are planned to and from parks throughout Placentia.
The OC Loop
The OC Loop is a 66-mile vision for biking and walking that improves quality of life, supports freedom from car-dependency, and promotes healthy living for residents of Orange County. When complete, it will provide users with options to bike, walk, and connect to beaches and other Orange County destinations. Current improvements include Segment D which involve the addition new access points at the proposed Golden Avenue Bridge.
Go Placentia Loop
The Go Placentia Loop is planned to provide bikeway improvements for southwest Placentia, primarily through their Old Town neighborhood. These improvements consist of a network of bike lanes and bike routes that will provide improved connections to destinations such as Kraemer Park, Kraemer Middle School, Valencia High School, and the new Metrolink Station.
50% People who live near trails are more likely to meet physical activity guidelines
PLACENTIA OPEN SPACES AND URBAN GREENING MASTER PLAN 34

CHAPTER 2 | EXISTING CONDITIONS & ANALYSES 35
Figure 2-7: Existing and Previously Proposed Bike Facilities
Analysis
Analysis of existing and future conditions, as well as latent demand, is an essential step in any parks or transportation planning process. For this Plan, analysis included spatial (GIS) analysis, fieldwork, and community and stakeholder input. This multi-pronged approach allowed for maximal data capture and cross-referencing of findings.
This section is primarily concerned with explanations and discussions of the various spatial analyses employed in this project. Brief discussions of the role of fieldwork and community/stakeholder input are provided below, while the remainder is devoted to spatial analysis.
The project team conducted fieldwork, using measuring tools and georeferenced photos, on several occasions. Fieldwork was conducted prior to the project kick-off (to better understand existing conditions) and during project development (to verify data obtained from GIS and community/stakeholder input).
Community and stakeholder input played a very important role in developing facility and program recommendations. A summary of community and stakeholder input obtained and its impact on project recommendations is included in Chapter 3, “Community Engagement.”
Spatial analysis included simple, data-driven analyses and more complex analyses, requiring evaluations of layered information and multiple inputs. Data-driven topics include park level of service analysis, healthy and equity index analysis, collision analysis, and a propensity model analysis.
Park Level of Service Analysis
A Level of Service Analysis (LOS) was performed on all parks and open spaces located within the City. LOS examines the walktime and biketime to these facilities by using a Geographical Information System (GIS) based parkshed analysis. The LOS analysis took into account the percentage of population being serviced by neighborhood, community, and regional parks. Instead of using
radius circles from parks that only consider a direct distance instead of walking, driving, or biking distances, this study utilizes actual network routes that lead to park and recreation facilities. This method is more accurate and is more appropriate to use, and it puts attention on the need to improve the local network in order to improve access to these park facilities. This type of analysis is important, since a general goal for access should be that neighborhood park users live within walking or biking distance of neighborhood parks.
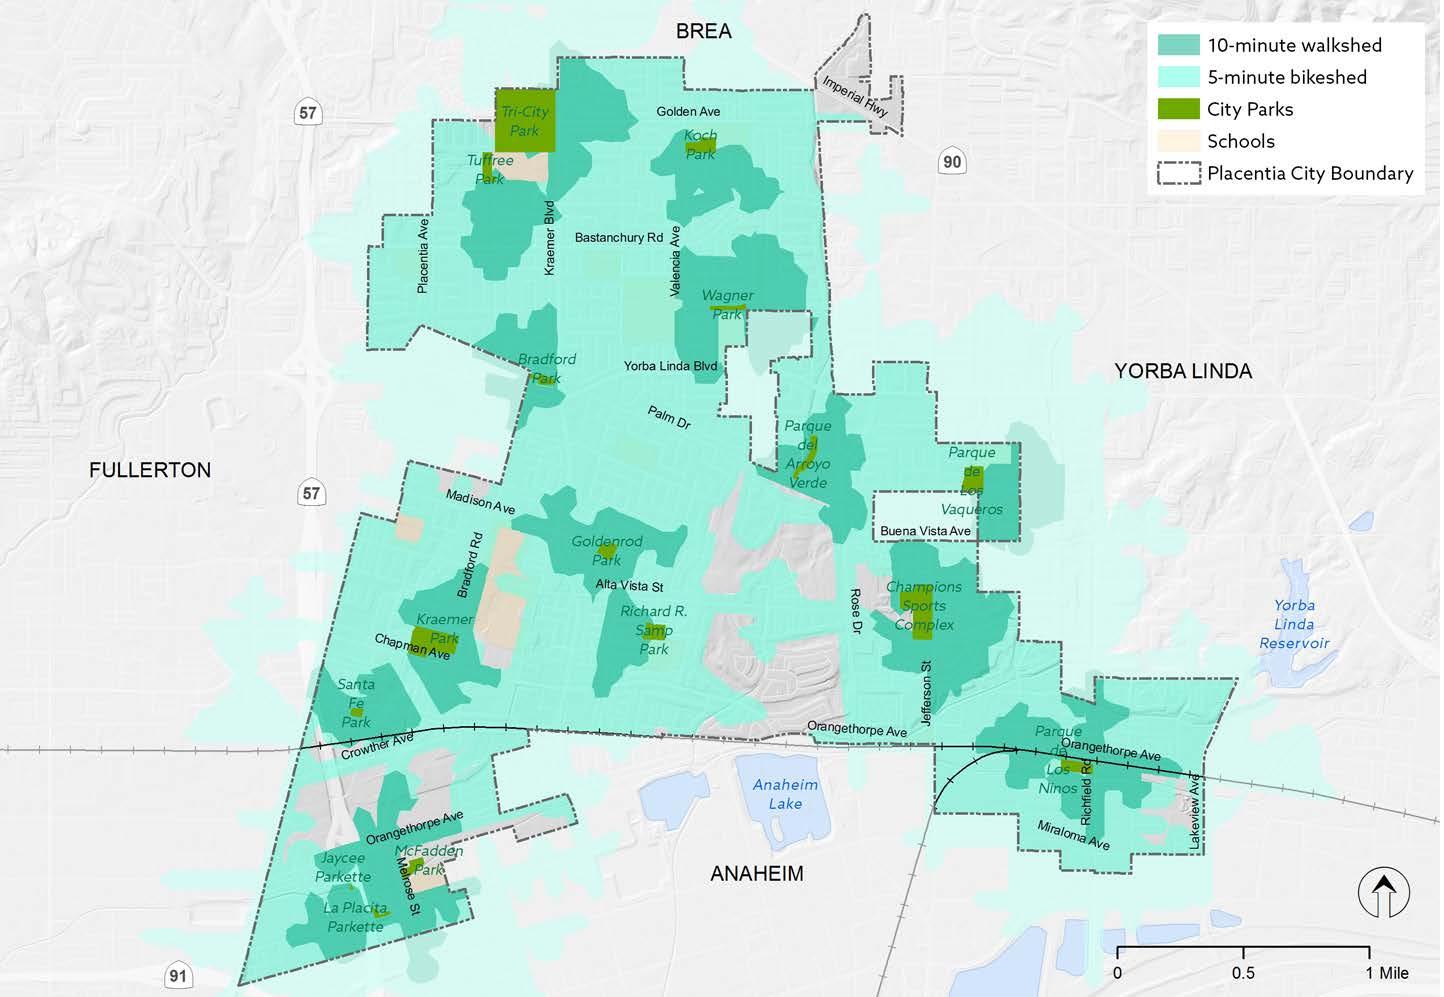
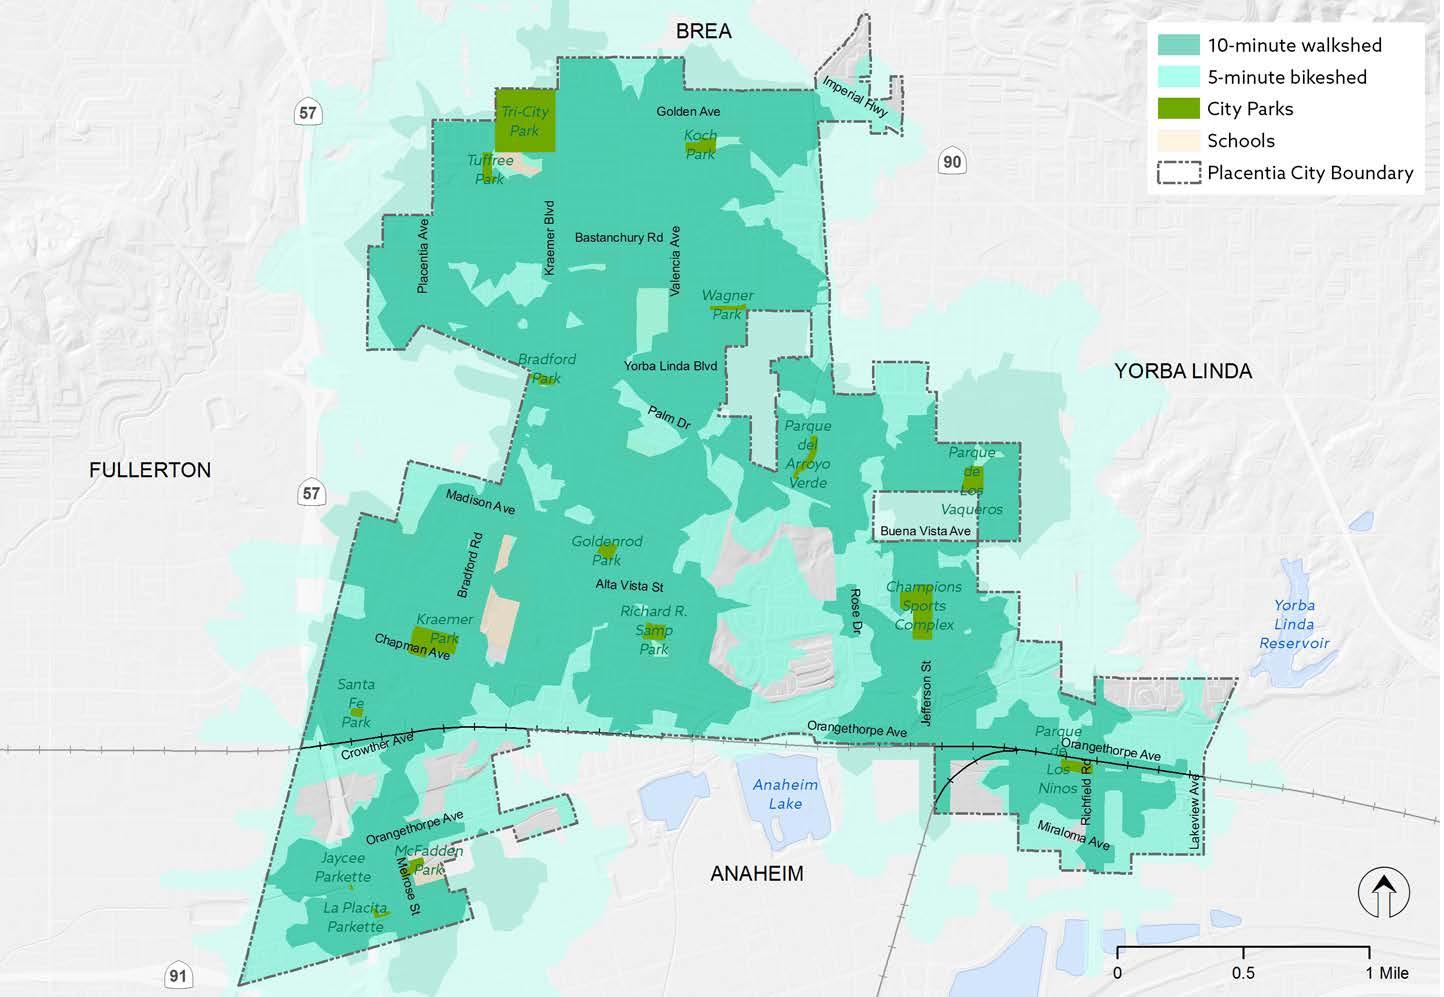
For each park, a GIS analysis was completed that generated polygons representing a 10-minute walkshed and a 5-minute bikeshed, including total travel time with approximate delay due to traffic signals and finding parking. Resulting walkshed and bikeshed polygons were superimposed on the city base map to see which regions were well covered by park access and to estimate the number of residents served by park type. Results from this analysis are displayed in Figure 2-8 through 2-10.
Figure 2-8 depicts the park level of service utilizing only the existing parks and open space in the City. The map informs the City that there are gaps in the 10-minute walking times to parks, but that most of the City is served well with a 5-minute bike time to a park.
Figure 2-9 depicts park level of service with the addition of schools through the City’s joint-use agreements. This map informs the City that with the schools, most neighborhoods have access to a park or open space with recreation amenities. Gaps include areas in the southwest and southcentral regions of the City.
Figure 2-10 depicts park level of service utilizing existing parks, joint-use agreements, and proposed improvements (discussed in Chapter 4) throughout the City. This analysis informs the City that almost all residents of Placentia would have 10-minute walking or 5-minute biking access to parks and open space if the proposed projects were implemented and if the City maintained their jointuse agreements with the schools.
PLACENTIA OPEN SPACES AND URBAN GREENING MASTER PLAN 36
CHAPTER 2 | EXISTING CONDITIONS & ANALYSES 37
Figure 2-8: Existing Parks Level of Service
PLACENTIA OPEN SPACES AND URBAN GREENING MASTER PLAN 38
Figure 2-9: School Joint-Use Agreements Parks Level of Service

CHAPTER 2 | EXISTING CONDITIONS & ANALYSES 39
Figure 2-10: Expanded Parks Level of Service
Bicycle and Pedestrian Collisions
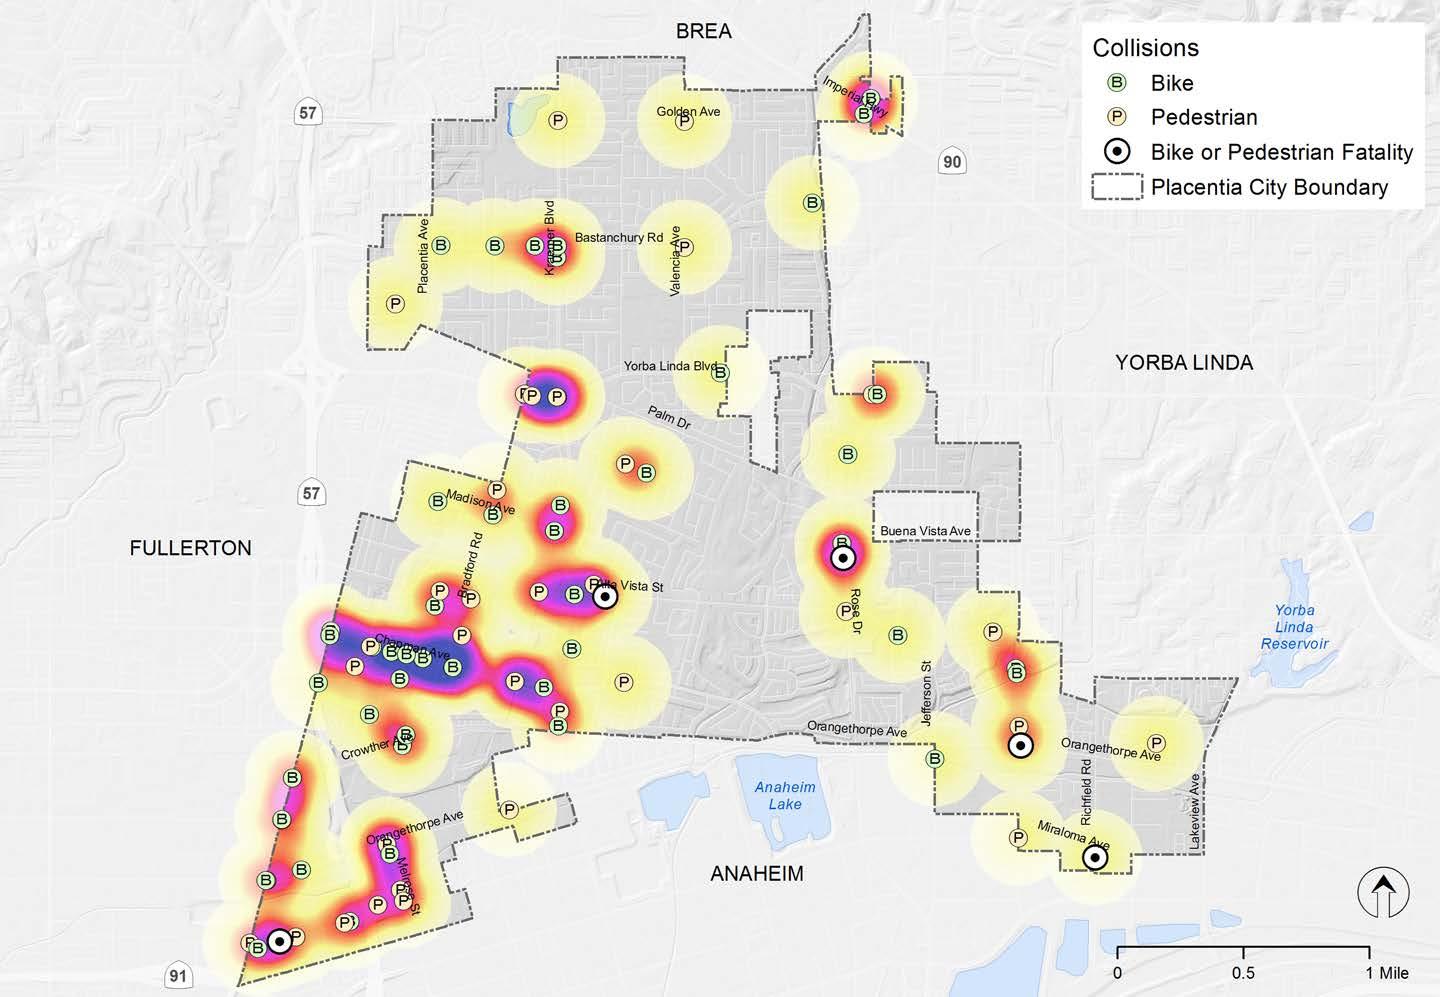
Bicycle and pedestrian collision data were obtained from the Statewide Integrated Traffic Records System (SWITRS) collision data set managed by the California Highway Patrol (CHP). This dataset captures all reported bicycle-vehicle, pedestrian-vehicle, and bicycle-pedestrian collisions that resulted in injury or property damage in Placentia in the five-year period of 2014 through 2018. Collisions on off-street paths or highways are not reported in the data. It is important to note that collisions involving bicyclists are known to be under-reported, and therefore bicycle collisions are likely under-represented in this analysis.
During this five-year period there were a total of 48 bicycle-related collisions and 53 pedestrian-related collisions; 7 of which resulted in fatalities. Most collisions (27) were caused by vehicles not driven on the right side of the roadway. The remainder of collisions were caused by a variety of driver, bicyclist, and pedestrian violations. The corridors and intersections with the highest density of collisions include:
• Chapman Avenue between Kraemer Boulevard
• Alta Vista Street between Angelina Drive and Hollyhock Lane
• Kraemer Boulevard at Bastanchury Road, Yorba Lina Boulevard, and Madison Avenue
• Rose Drive between Buena Vista Avenue and Alta Vista Street
Pedestrian Collisions, 2014-2018
Bicyclist Collisions, 2014-2018
PLACENTIA OPEN SPACES AND URBAN GREENING MASTER PLAN 40
53 48
CHAPTER 2 | EXISTING CONDITIONS & ANALYSES 41
Figure 2-11: Bicyclist and Pedestrian Collision Analysis
Health and Equity Index
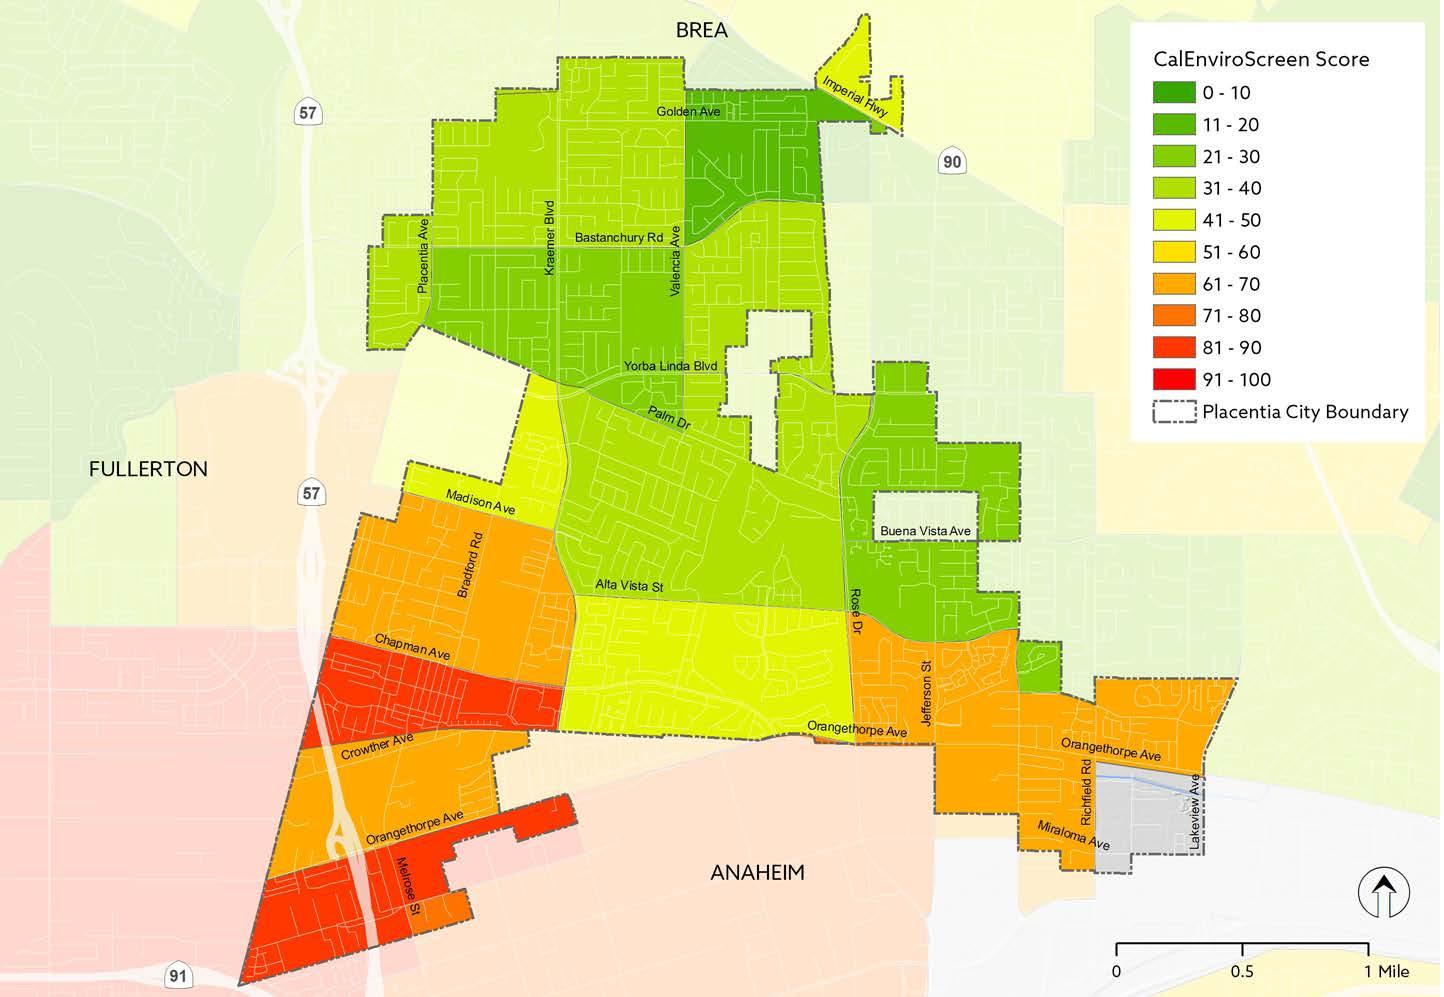
Socio-economic and demographic data was analyzed to identify disadvantaged communities by census tract. The data for this analysis is derived from California’s Environmental Health Hazard Assessment (CEHHA) CalEnviroscreen 3.0 mapping tool. CalEnviroscreen 3.0 is a mapping tool that can be used to help identify California communities that are disproportionately burdened by pollution and where people are most vulnerable to its effects. It uses environmental, health, and socioeconomic information to produce scores for every census tract in the state. The online tool allows users to download GIS-based data to study how well the community they’re studying stands. The tool depicts the area’s scores: a high score means a higher pollution and environmental burden compared to areas with lower scores. The tool helps the TMP identify opportunities for low-income residents, children, seniors and the disabled, to access nonmotorized transportation options. This analysis can also be used to verify that recommended facilities are addressing the transportation needs of disadvantaged residents by ensuring that their neighborhoods are being adequately served by nonmotorized facilities to access important destinations like schools, parks, employment, food, and medical services.
Figure 2-12 depicts the CalEnviroscreen Index for the City. The map depicts that the southwest region of the City has a higher score as compared to central and northern Placentia. The higher pollution and environmental burden of this area can help this plan and the City prioritize projects that may help address the issues and conditions that contributed to their high score.
PLACENTIA OPEN SPACES AND URBAN GREENING MASTER PLAN 42
CHAPTER 2 | EXISTING CONDITIONS & ANALYSES 43
Figure 2-12: Health and Equity Index
Parks Connection Model
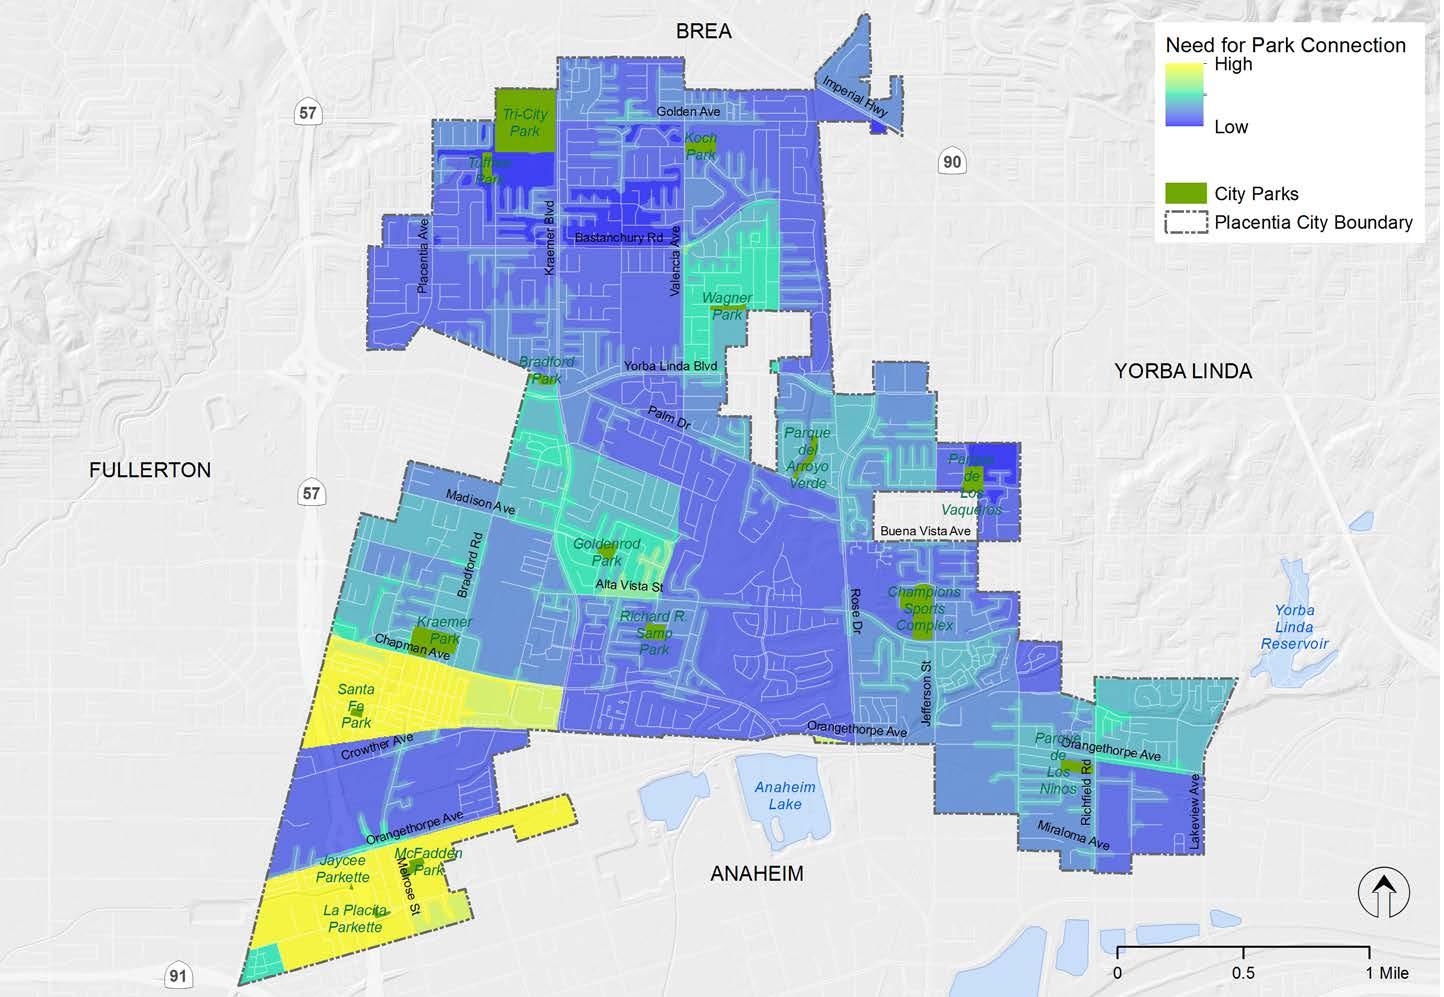
A parks connection model was developed to help understand the relationship between availability of park spaces as well as the physical connections to and from those parks. The park connections model has two components: a score based on the number of overlapping park walksheds (walkshed component), and a score based on populations likely to use parks or the need for active transportation to parks (population component). The model was generated using 10-minute park walksheds and Census data. The walkshed component was calculated by identifying the overlapping areas among all park walksheds. Areas that that were able to access more than one park within a 10-minute walk were ranked higher in the model than those that could only access one park. Citywide, the maximum number of parks accessible within a 10-minute walk was 3. Therefore, 3 is the highest score in the walkshed component.
The population component used 2017 American Community Survey (ACS) data for the following factors: population density, school-age children (ages 0 -17), commuters using walk and bike modes, and individuals with no vehicles. Each ACS factor was given a range of scores (0 - 3) based on natural breaks in the data. The population component also incorporates CalEnviroscreen, a statewide environmental justice index which includes socioeconomic factors such median household income in addition to environmental pollution factors. The highest percentile score in CalEnviroscreen were ranked using the following: 50-70 percentile (1), 70-100 percentile (2).
All factors in both subcomponents of the parks connections model were overlaid in GIS. High scores in the model represent areas where populations in need of park connections overlap with areas that have relatively more parks within a 10-minute walk.
Figure 2-13 is the park connections model map that depicts areas of need in Placentia. Based on all of the inputs, the model depicts that the southwest region of the City has a higher need for parks and improved access to parks. This model can be used as a means to develop general recommendations and to help select projects described in Chapter 4 of this Plan.
PLACENTIA OPEN SPACES AND URBAN GREENING MASTER PLAN 44
CHAPTER 2 | EXISTING CONDITIONS & ANALYSES 45
Figure 2-13: Park Connections Model
Community Engagement

03
Community Engagement Overview
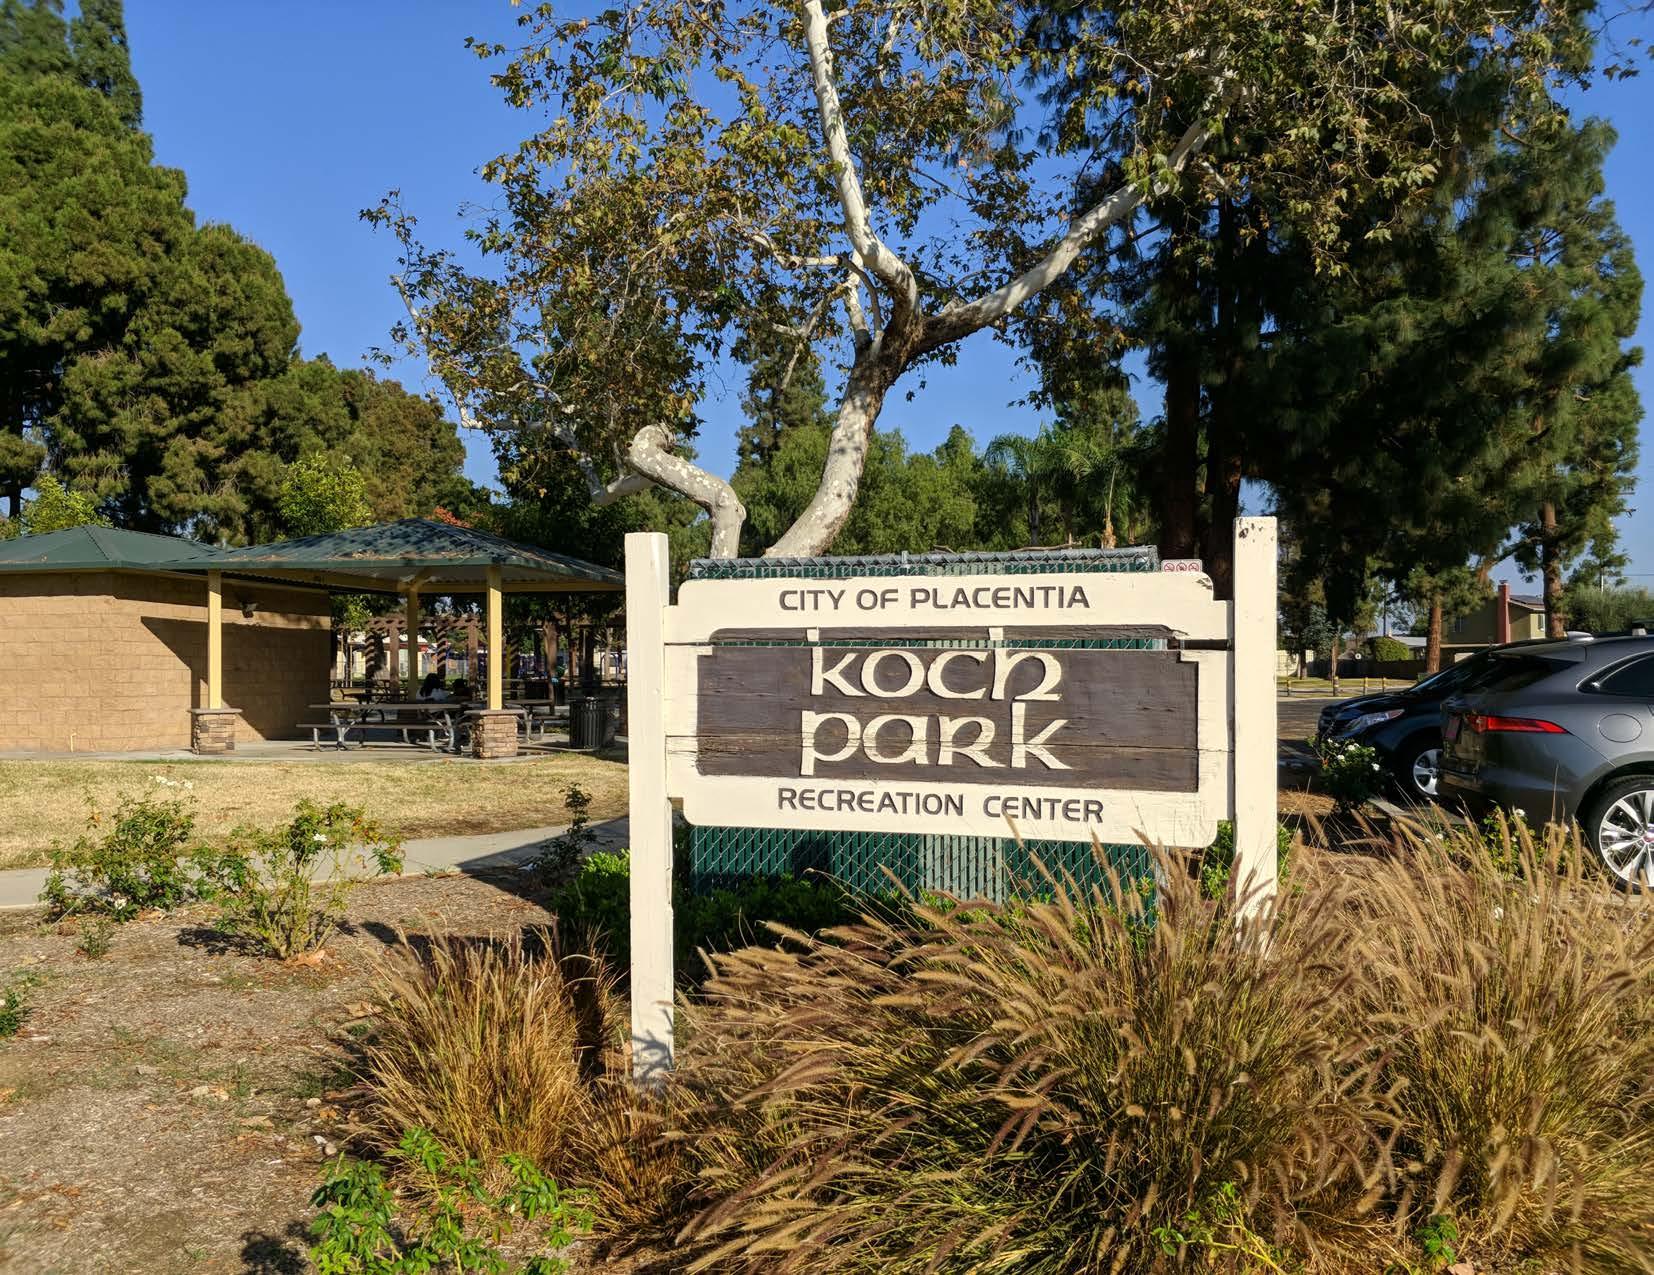
Community engagement played a major role throughout the planning process. One of the many goals of the Plan was to rely heavily on what Placentia residents and stakeholders had to say regarding their parks and how they access them. The City engaged with the community through a series of community workshops, stakeholder interviews, a project survey, and online tools. Outreach materials were designed to maximize community engagement. All outreach materials were designed and made available in both paper and digitally, as well as in English and Spanish, because of Placentia’s multi-generational and diverse population. Spanish-speaking team members were present at all workshops.
Branding and Announcements
To generate public interest and to create a unique identity, the team branded the project with a logo designed specifically for this project with the colors found in the City’s logo and website. Branding this project assisted in easy and immediate recognition whenever outreach materials such as flyers and surveys, were posted online or when the team was present at a special event workshop.
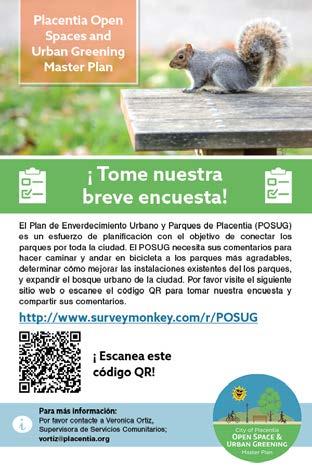
Community engagement materials for the workshops included fact sheets and flyers. These materials were designed using the project’s branding and were printed in both English and Spanish. These materials were distributed prior to and during the workshops to encourage participation and invite people to share their thoughts.

PLACENTIA OPEN SPACES AND URBAN GREENING MASTER PLAN 48
Community Workshops
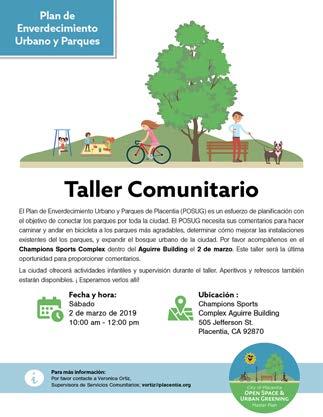
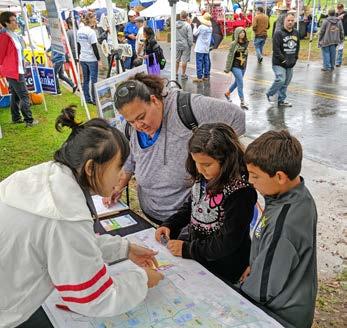
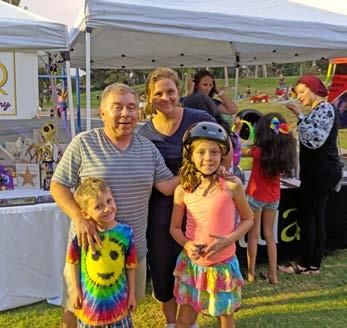
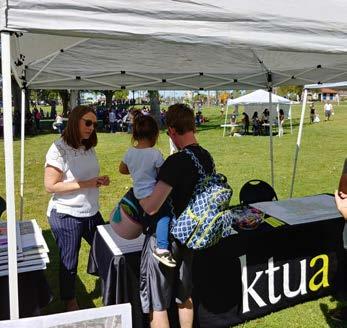
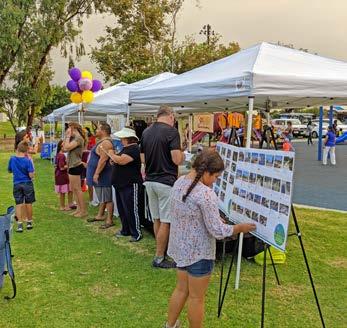
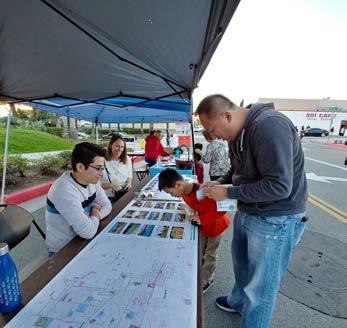
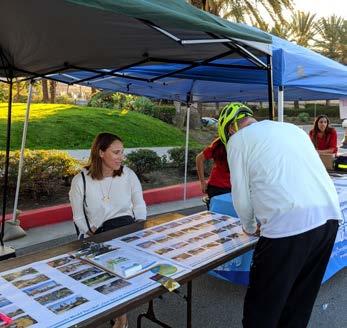
Four community workshops were scheduled at key milestones in the project’s planning process to communicate goals, objectives, and present preliminary results. These workshops primarily took place at city-wide events to efficiently reach out to large numbers of community members in a setting with guaranteed attendance.
Workshop #1: Concerts in the Park
The first workshop took place on Thursday, August 9, 2018 at Tri-City Park. The focus of the first workshop was to introduce the project, present the Plan’s goals and objectives, and invite community members to participate in the project survey.
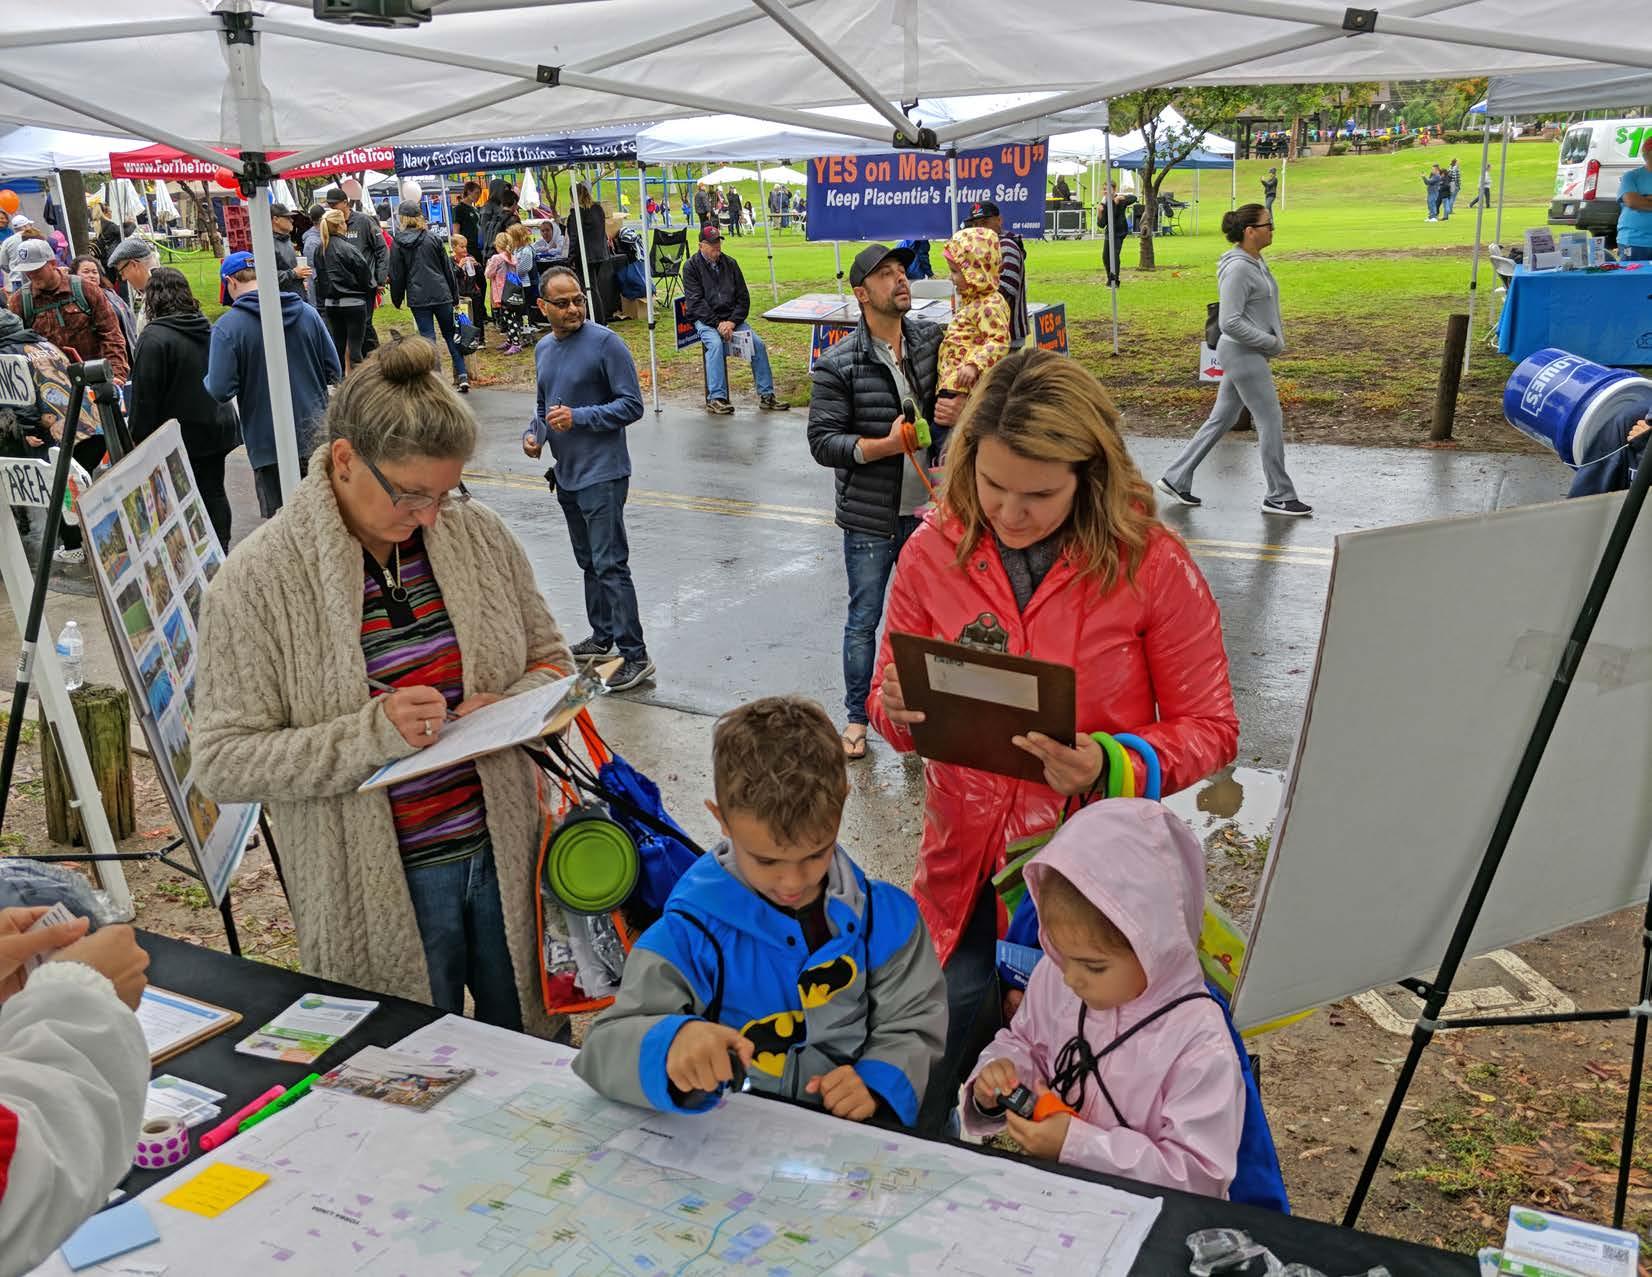
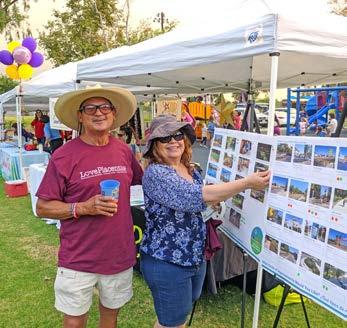
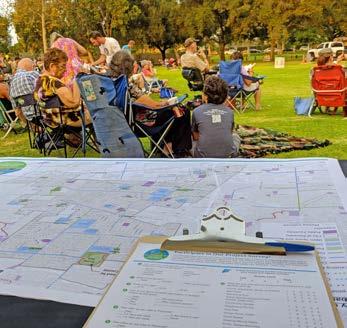
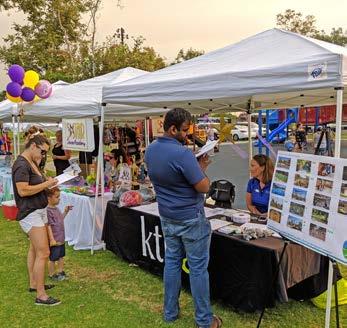
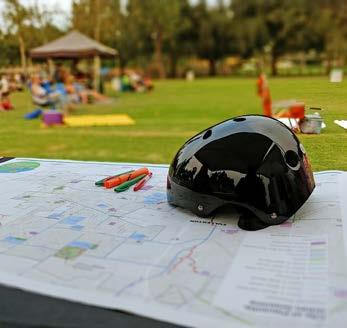
At this special event workshop, the team made available a citywide map depicting all the parks and existing bikeways found throughout the City. Support exhibits included photo boards depicting potential park amenity improvements, as well as potential pedestrian and bikeway improvements. A bicycle helmet raffle took place and free bike lights were distributed. The information gathered at this workshop provided valuable direction regarding where to focus the data-gathering and analyses process.
Workshop #2: Heritage Festival
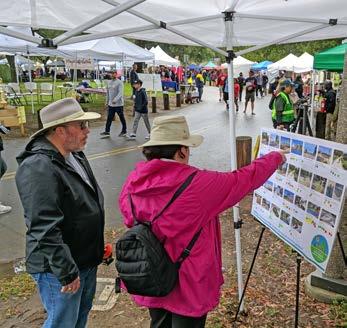
The second workshop was scheduled on Saturday, October 13, 2018. The workshop took place during the annual Placentia Heritage Festival that is held at Tri-City Park. This workshop was very similar to the first workshop in that its focus was to gather initial input from community members on the table maps as well as to encourage them to participate in the project survey. Support exhibits, a bike helmet raffle, and free bike lights were made available.
Scheduling this workshop at the Heritage Festival was successful thanks to the large attendance from not only Placentia residents, but neighboring cities as well. This provided helpful information regarding access to parks from adjacent cities and their residents.
Workshop #3: Tamale Festival
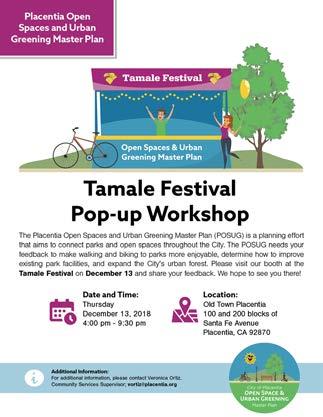
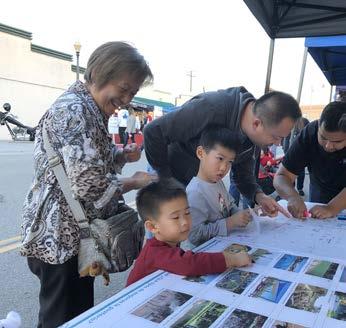
The third workshop took place on Thursday, December 13, 2018. The team participated in the immensely popular annual Tamale Festival held in Old Town Placentia. This event draws crowds from not only the entire City, but all over Orange County as well. The materials for this workshop once again included a table map with existing and previously proposed bikeways, and all the parks within the City’s boundaries. Additional exhibits included a tree canopy analysis that depicted the City’s urban forest using existing GIS tree data. This workshop was the last time the paper survey was made available to the community.
The information gathered at this workshop was used to finalize in-person community input. All of information gathered was used to help develop preliminary project recommendations later discussed in Chapter 4.
CHAPTER 3 | COMMUNITY ENGAGEMENT 49
Shade! Need shade for the kids to enjoy the parks during the summer.
I would improve the baseball fields at Tuffree Hill Park and Champions. More care to the fields means happier parents and leagues. Update playground equipment.
Workshop #4.1 Champions Sports Complex
The fourth workshop was originally scheduled on Saturday, March 2, 2019 at Champions Sports Complex. The purpose of the fourth workshop was to present preliminary recommendations for parks and open spaces, as well as pedestrian and bikeway improvements. The workshop was held at the Aguirre Building and was meant to coincide with a baseball tournament that was to take place during the same time frame. Due to rainy weather, the baseball tournament was cancelled and workshop participation suffered as well. Four residents came out to provide their valuable comments.
The City instructed the team to schedule another special event workshop to gather much-needed community feedback on the preliminary recommendations.
Workshop #4.2 Easter Egg-Citement & Spring Carnival
I would love to have ropes/par course style in and around the parks for kids to get off their screens and get outside.
Safe walking or bike trails to and from parks.
The team scheduled a follow-up workshop to supplement the rained-out workshop previously scheduled at Champions Sports Complex. The Easter Egg-Citement & Spring Carnival was the perfect opportunity to have a final community workshop. The annual event took place on April 13th, 2019 at Kraemer Park. Easter related activities, arts and crafts, community booths, and vendors were present at this event.
I would connect them with a bike/walking path away from the street. I don’t feel safe enough to ride my bike or walk in some areas due to high amounts of street traffic.
Materials for this workshop included table maps for each of the parks with their respective preliminary recommendations. The maps depicted under-utilized park spaces and potential improvements that may qualify within that footprint. Pedestrian improvements such as missing curb ramps, sidewalks, and enhanced crossings were included. Additional exhibits included city-wide maps depicting park level of service and bikeway/trail recommendations as well as infographics depicting survey results.
We also desperately need a splash pad.
The team gave out bike lights, reflective “slap bands”, and Easter themed candy.
Dog park at Tri City would be awesome!
PLACENTIA OPEN SPACES AND URBAN GREENING MASTER PLAN 50
“ “ “ “ “ “ “ “ “ “ “ “ “ “ “ “
5 Community Workshops 1 Project Survey 498 Completed Surveys 700+ Survey and Map Comments 8 Bike Helmets Awarded 7 Stakeholder Meetings
Community Engagement Results



PLACENTIA OPEN SPACES AND URBAN GREENING MASTER PLAN 52
Concerts in the Park
Concerts in the Park
Heritage Festival
Concerts in the Park
Concerts in the Park
Heritage Festival
Concerts in the Park
Heritage Festival
Heritage Festival
Concerts in the Park
Heritage Festival
Heritage Festival




CHAPTER 3 | COMMUNITY ENGAGEMENT 53
Heritage Festival
Tamale Festival
Easter Egg-Citement
Heritage Festival
Easter Egg-Citement
Easter Egg-Citement
Tamale Festival
Easter Egg-Citement
Easter Egg-Citement
Tamale Festival
Easter Egg-Citement
Easter Egg-Citement
Placentia Parks Commission Meeting
The project team scheduled a Recreation and Parks Commission meeting to discuss the goals and objectives of this Plan. The meeting included a short presentation regarding the planning process, community engagement strategies, and project development. The commissioners had an opportunity to provide their feedback and voice their thoughts on existing challenges and potential opportunities. Feedback they provided included:
• Make all parks accessible and safe
• Address gaps in the sidewalk and bicycling network

• Need for more recreation and park funding to address maintenance and renovations
• Encourage City to continue applying for grant funding
Survey
A survey was designed to determine priority levels for park amenities and improvements. People had the opportunity to provide specific park comments using the open-comment question. In addition, questions regarding satisfaction levels of current pedestrian and bicycle infrastructure, as well as desired improvements were also included. The survey was initially made available at the first community workshop on August 9, 2018 at the Concerts in the Park. The survey was subsequently announced via the City’s email listserv and social media outlets through February 25, 2019.

A total of 12 questions were asked, many of which included the option to provide additional comments related to the question. Most questions allowed respondents to select more than one category, resulting in totals that exceeded 100 percent.
A remarkable 498 surveys were completed during the planning process. The results provided helpful insight to important challenges and opportunities that will be used to guide additional GIS analyses and to develop recommendations. The following section depicts several of the questions asked and their respective results. The complete survey summary can be found in Appendix A.
PLACENTIA OPEN SPACES AND URBAN GREENING MASTER PLAN 54
How do you get to city parks, open spaces, or facilities?
How often do you walk in Placentia?
How often do you bike in Placentia?
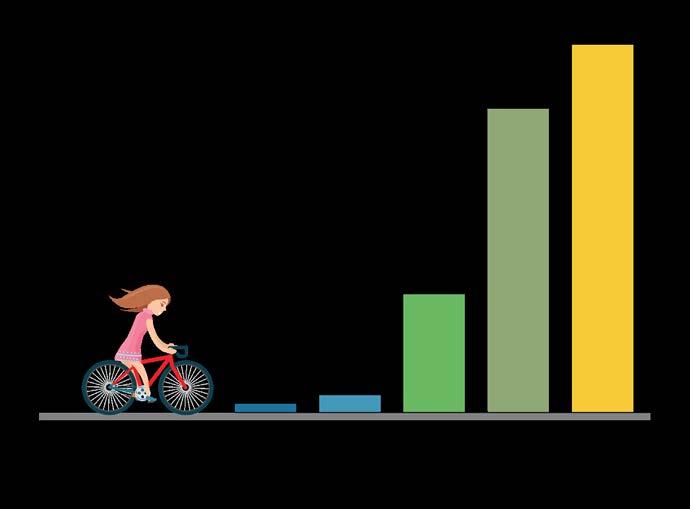
What would make it easier for you to walk, bike, or take public transit more to parks and open spaces in Placentia?


CHAPTER 3 | COMMUNITY ENGAGEMENT
498 Surveys Completed!
People were asked to select their lowest and highest priorities for park program elements. A higher number means higher priority. Public priorities based on a scale of 1 through 5.
4.22
3.37
3.27
3.21
3.11
PLACENTIA OPEN SPACES AND URBAN GREENING MASTER PLAN 56
Walking Trails Senderos para caminar
Ball Fields (soccer, baseball, football) Campos de pelota (fútbol, béisbol, fútbol americano)
Playground / Tot Lot Área de juegos para niños
3.35 Dog Park Parque para perros
Picnic Tables / Benches Mesas o bancas para picnics
3.25
Community Garden Jardines comunitarios
3.24
Group Picnic Areas Zonas de picnic para grupos
Splash Pad Área de juegos de agua para niños
Recommendations

04
Park Recommendations
The following section includes cut sheets created for each park in Placentia. Each cut sheet contains recommendations for pedestrian improvements within a 10-minute walk and park amenities for under-utilized spaces based on field work and input received at the community outreach events. These recommendations will guide future improvements throughout the City. Additional trees, where appropriate, should be incorporated into all parks to provide shade, comfort, and to help with greenhouse gas reductions. Recommendations to repair existing park features are also included for each park.
PLACENTIA OPEN SPACES AND URBAN GREENING MASTER PLAN 58
1 2 3 4 5 6 7 8 9 10 11 12 13 14 15 16
Bradford Park
Kraemer
Placentia Champions Sport Complex
Goldenrod Park Jaycee
Parkette
Koch Park
Park
La Placita Parkette
Parque de los Vaqueros
Parque del Arroyo Verde
Richard R. Samp Park
Santa Fe Park
Tri-City Park (County of Orange)
Tuffree Park Wagner Park
McFadden Park
Parque de los Ninos

CHAPTER 4 | RECOMMENDATIONS 59 1 2 3 4 5 6 7 8 9 10 11 12 13 14 15 16
Bradford Park
Bradford Park is located in central Placentia and is accessed via Kraemer Boulevard and Yorba Linda Boulevard. The park is primarily used for passive recreation due to the lack of amenities and playground features. The park is part of the larger Historic Bradford House complex that is preserved and managed by The Placentia Founders Society.
Potential improvements include park identification signage, security lighting, and turf damage repair.
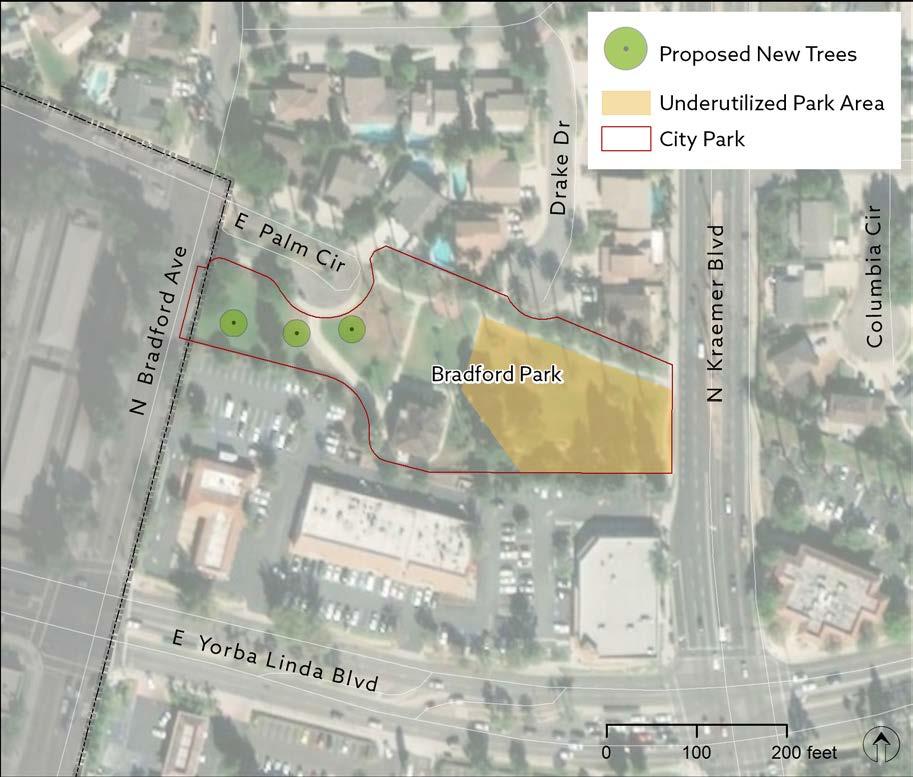
PLACENTIA OPEN SPACES AND URBAN GREENING MASTER PLAN 60
Figure 4-1: Bradford Park Infill/Expansion Potential
Area 1 Infill Facility Types Typical SF 22,782 Ball Field 30,000-100,000 Bocce Ball/Shuffleboard 5,000-10,000 • Community Center/Gym 25,000-70,000 Court Sports 2,000-5,000 Dog Park 10,000-75,000 Exterior Exercise Areas 5,000-20,000 Picnic Areas 500-1,500 • Playgrounds 4,000-6,000 Soccer Field 14,000-75,000 Non-Traditional Recreation Facilities Adventure Playgrounds 4,000-6,000 Community Garden 10,000-40,000 • Disk Golf Course 50,000-200,000 Pump Track/Bike Skills Course 10,000-20,000 Pickleball
Park 10,000-35,000 Skate Spot 1,500-10,000 Small Performance Stage 15,000 • Tennis 7,000-28,000 Volleyball 4,000-16,000
Table 4-1: Park Infill/Expansion – Bradford Park
25,000-35,000 Skate
Add safety and security lighting as needed
Park identification signage
Repair / replace damaged turf throughout
1

CHAPTER 4 | RECOMMENDATIONS 61
Figure 4-2: Bradford Park Travelshed
Goldenrod Park
Goldenrod Park is located in central Placentia and is accessed via Madison Avenue and Hollyhock Lane. People use the park for passive and active recreation with the available open grass areas, playground features, benches, and picnic tables.
Potential improvements include ADA upgrades, playground upgrades, playground surface replacement, park identification signage, security lighting, shading around playgrounds,
Recommendations
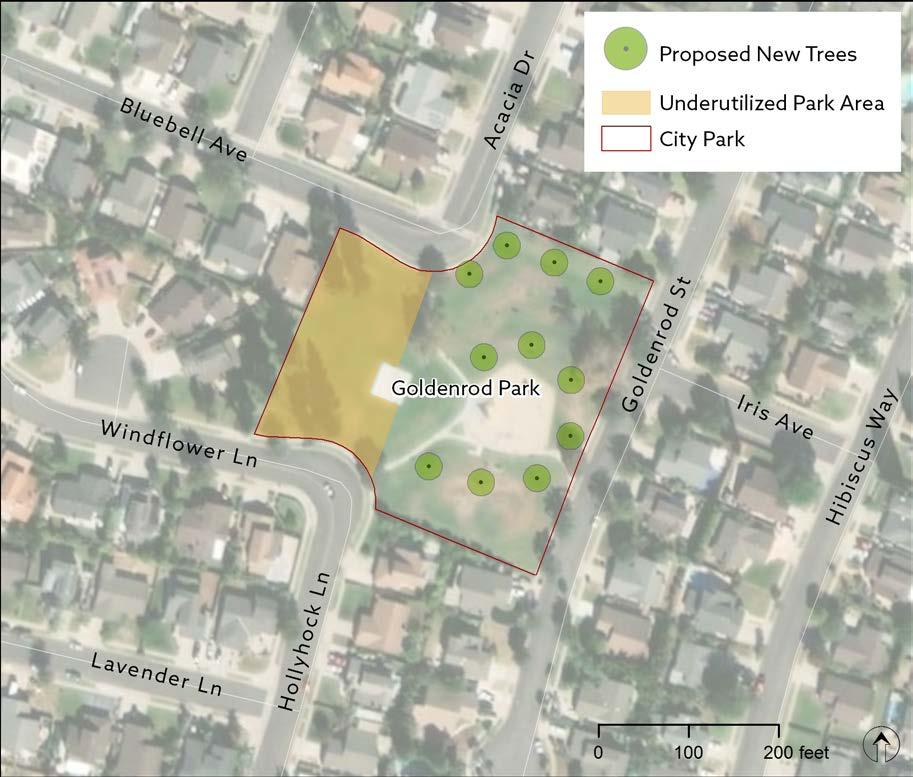
PLACENTIA OPEN
AND
PLAN 62 Area 1 Infill Facility Types Typical SF 27,192 Ball Field 30,000-100,000 Bocce Ball/Shuffleboard 5,000-10,000 • Community Center/Gym 25,000-70,000 • Court Sports 2,000-5,000 • Dog Park 10,000-75,000 Outdoor Exercise Areas 5,000-20,000 • Picnic Areas 500-1,500 • Playgrounds 4,000-6,000 • Soccer Field 14,000-75,000 Non-Traditional Recreation Facilities Adventure Playgrounds 4,000-6,000 • Community Garden 10,000-40,000 • Disk Golf Course 50,000-200,000 Pump Track/Bike Skills Course 10,000-20,000 Pickleball 25,000-35,000 • Skate Park 10,000-35,000 Skate Spot 1,500-10,000 Small Performance Stage 15,000 Tennis 7,000-28,000 Volleyball 4,000-16,000 ADA upgrades throughout the park Add seating around play area Repair/Replace playground & surfaces Add safety and security lighting as needed Park identification signage Add shading around play area Replace
drought
SPACES
URBAN GREENING MASTER
turf with
tolerant plants
Figure 4-3: Goldenrod Park Infill/Expansion Potential
Table 4-2: Park Infill/Expansion – Goldenrod Park
and
1
turf damage repair.

CHAPTER 4 | RECOMMENDATIONS 63
Figure 4-4: Goldenrod Park Travelshed
Jaycee Parkette
Jaycee Parkette is located in southwest Placentia and is accessed via Iowa Place and Kansas Avenue. People use the small park for passive recreation with the available playground and picnic tables.
Potential improvements include ADA upgrades, playground upgrades, playground surface replacement, park identification signage, security lighting, shading around playgrounds, and turf damage repair.
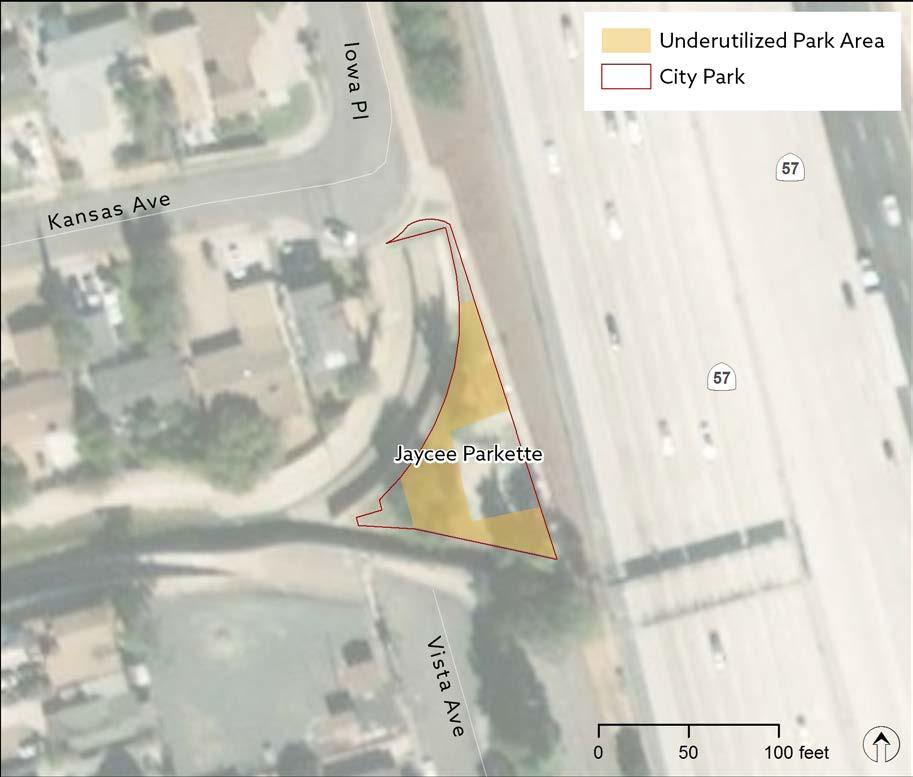
Recommendations
PLACENTIA OPEN SPACES AND URBAN GREENING MASTER PLAN 64
Table
Area 1 Infill Facility Types Typical SF 4,082 Ball Field 30,000-100,000 Bocce Ball/Shuffleboard 5,000-10,000 Community Center/Gym 25,000-70,000 Court Sports 2,000-5,000 Dog Park 10,000-75,000 Exterior Exercise Areas 5,000-20,000 Picnic Areas 500-1,500 • Playgrounds 4,000-6,000 • Soccer Field 14,000-75,000 Non-Traditional Recreation Facilities Adventure Playgrounds 4,000-6,000 Community Garden 10,000-40,000 Disk Golf Course
Pump
Skills Course
Park
Skate Spot 1,500-10,000 Small Performance Stage 15,000 Tennis 7,000-28,000 Volleyball 4,000-16,000 ADA upgrades throughout the park Add seating around play area Repair/Replace playground surfaces Add safety and security lighting as needed Park identification signage Add shading around play area Replace turf with drought tolerant plants
Figure 4-5: Jaycee Parkette Infill/Expansion Potential
4-3: Park Infill/Expansion – Jaycee Parkette
50,000-200,000
Track/Bike
10,000-20,000 Pickleball 25,000-35,000 Skate
10,000-35,000
1
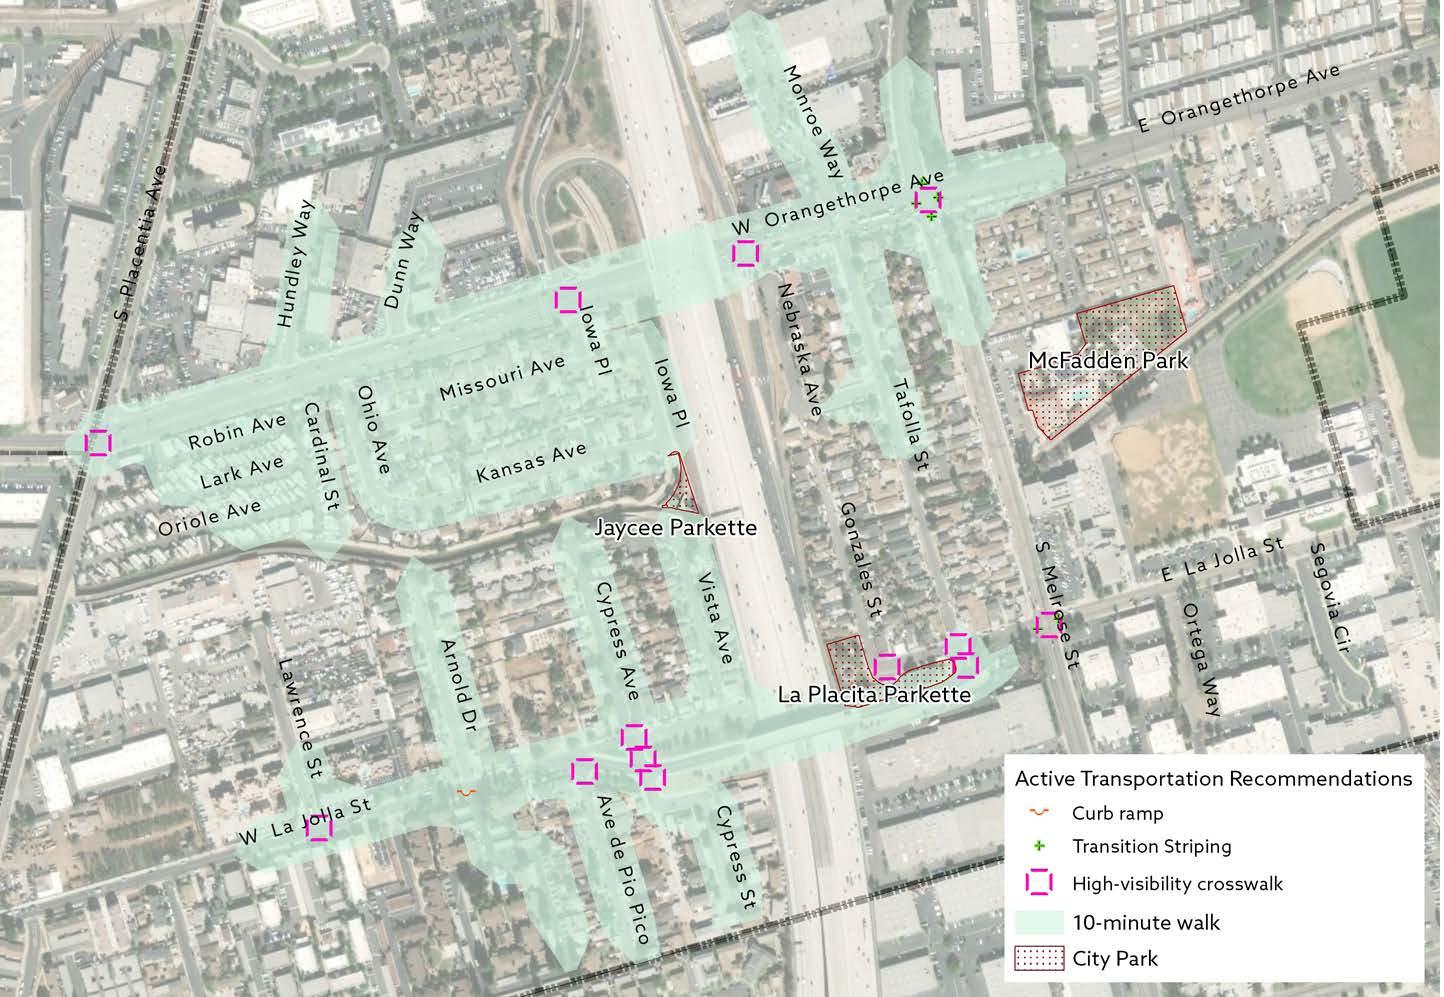
CHAPTER 4 | RECOMMENDATIONS 65
Figure 4-6: Jaycee Parkette Travelshed
Koch Park
Koch Park is located in northeast Placentia and is accessed via Valencia Avenue and Golden Avenue. Koch Park is heavily used by the residential community and the adjacent Golden Elementary School. The recreation center, picnic tables, and passive recreation serve as major attractors. Potential improvements include ADA upgrades, sidewalk repairs, shading around playgrounds, playground surface repairs, slope erosion, new shade shelters, and new picnic tables.
Recommendations
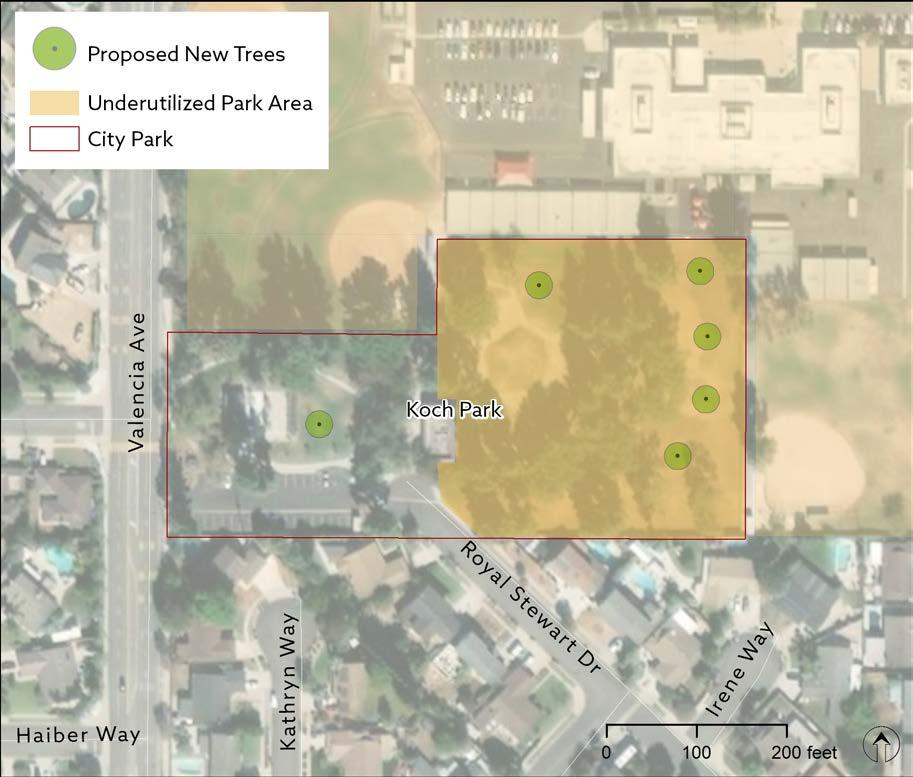
PLACENTIA OPEN SPACES AND
GREENING MASTER PLAN 66 Area 1 Infill Facility Types Typical SF 110,894 Ball Field 30,000-100,000 Bocce Ball/Shuffleboard 5,000-10,000 • Community Center/Gym 25,000-70,000 Court Sports 2,000-5,000 • Dog Park 10,000-75,000 • Outdoor Exercise Areas 5,000-20,000 • Picnic Areas 500-1,500 • Playgrounds 4,000-6,000 • Soccer Field 14,000-75,000 Non-Traditional Recreation Facilities Adventure Playgrounds 4,000-6,000 • Community Garden 10,000-40,000 • Disk Golf Course 50,000-200,000 Pump Track/Bike Skills Course 10,000-20,000 Pickleball 25,000-35,000 • Skate Park 10,000-35,000 Skate Spot 1,500-10,000 Small Performance Stage 15,000 • Tennis 7,000-28,000 • Volleyball 4,000-16,000 • ADA upgrades throughout the park Add seating around play area Repair/Replace playground & surfaces Add safety and security lighting as needed Park identification signage Add shading around play area Replace
URBAN
turf with drought tolerant plants
Figure 4-7: Koch Park Infill/Expansion Potential
1
Table 4-4: Park Infill/Expansion – Koch Park

CHAPTER 4 | RECOMMENDATIONS 67
Figure 4-8: Koch Park Travelshed
Kraemer Park
Kraemer Park is located in southwest Placentia and is accessed via Bradford Avenue and Chapman Avenue. The City considers Kraemer Park as the primary green jewel in the City since it is programmed with community events and offers many park amenities across its 11 acres. Potential improvements include ADA upgrades, park identification signage, security lighting, shading around playgrounds, turf damage repair, slope erosion, a new skate park/skate spot, and an addition to the Backs Community Center for the new Senior Center.
Recommendations

PLACENTIA OPEN SPACES AND URBAN GREENING MASTER PLAN 68
Figure 4-9: Kraemer Park Infill/Expansion Potential
Table 4-5: Park Infill/Expansion – Kraemer Park
Area 1 Area 2 Infill Facility Types Typical SF 9,331 264,241 Ball Field 30,000-100,000 • Bocce Ball/Shuffleboard 5,000-10,000 • • Community Center/Gym 25,000-70,000 • Court Sports 2,000-5,000 • • Dog Park 10,000-75,000 Exterior Exercise Areas 5,000-20,000 • • Picnic Areas 500-1,500 • • Playgrounds 4,000-6,000 • • Soccer Field 14,000-75,000 • Non-Traditional Recreation Facilities Adventure Playgrounds 4,000-6,000 • • Community Garden 10,000-40,000 • Disk Golf Course 50,000-200,000 Pump Track/Bike Skills Course 10,000-20,000 Pickleball 25,000-35,000 • Skate Park 10,000-35,000 • Skate Spot 1,500-10,000 • Small Performance Stage 15,000 • Tennis 7,000-28,000 • • Volleyball 4,000-16,000 • • ADA upgrades throughout the park Add safety and security lighting as needed Park identification signage Repair / replace damaged turf throughout Replace trees that have died Provide park access from Melrose St Address slope
Potential location for skate park or skate spot
erosion
1 2

CHAPTER 4 | RECOMMENDATIONS 69
Figure 4-10: Kraemer Park Travelshed
La Placita Parkette
La Placita Parkette is located in southwest Placentia and is accessed via La Jolla Street. People use the small park for passive recreation with the available playground, picnic tables, and open grass areas. Potential improvements include ADA upgrades, playground surface repair, park identification signage, security lighting, shading around playgrounds, and turf damage repair.
Recommendations

PLACENTIA OPEN SPACES AND URBAN GREENING MASTER PLAN 70
Figure 4-11: La Placita Parkette Infill/Expansion Potential
Table 4-6: Park Infill/Expansion – La Placita Parkette
Area 1 Infill Facility Types Typical SF 10,529 Ball Field 30,000-100,000 Bocce Ball/Shuffleboard 5,000-10,000 Community Center/Gym 25,000-70,000 Court Sports 2,000-5,000 Dog Park 10,000-75,000 Exterior Exercise Areas 5,000-20,000 • Picnic Areas 500-1,500 • Playgrounds 4,000-6,000 • Soccer Field 14,000-75,000 Non-Traditional Recreation Facilities Adventure Playgrounds 4,000-6,000 • Community Garden 10,000-40,000 Disk Golf Course 50,000-200,000 Pump Track/Bike Skills Course 10,000-20,000 Pickleball 25,000-35,000 Skate Park 10,000-35,000 Skate Spot 1,500-10,000 Small Performance Stage 15,000 Tennis 7,000-28,000 Volleyball 4,000-16,000 ADA upgrades throughout the park Repair/Replace playground surfaces Address slope erosion Add safety and security lighting as needed Park identification signage Add shading around play area
1
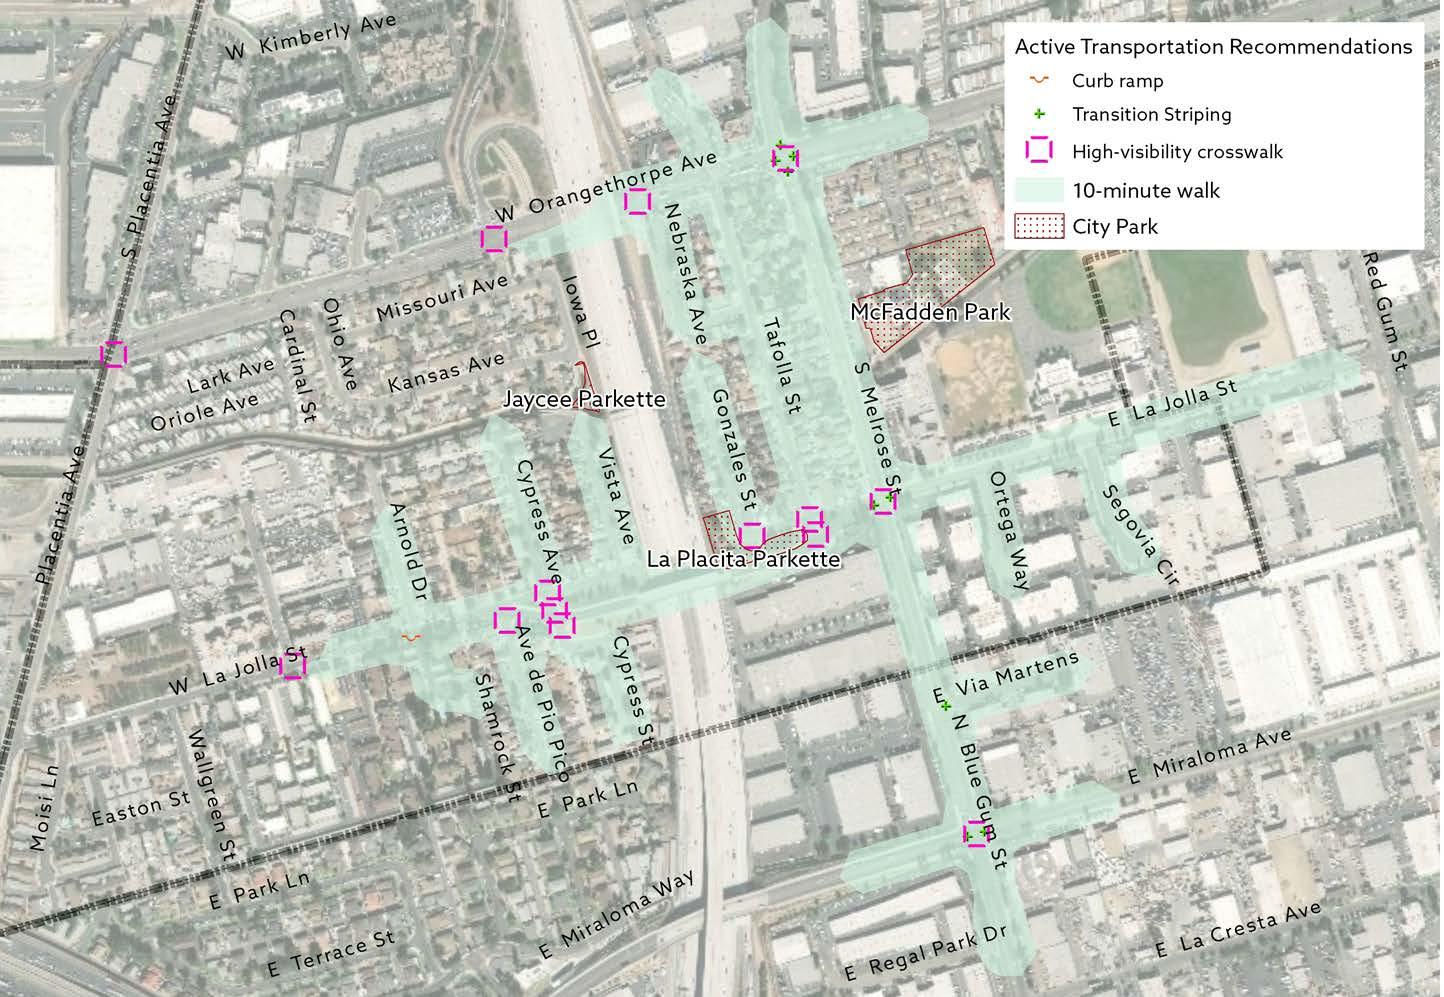
CHAPTER 4 | RECOMMENDATIONS 71
Figure 4-12: La Placita Parkette Travelshed
McFadden Park
McFadden Park is located in southwest Placentia and is accessed primarily via Melrose Street. The park offers many opportunities for passive and active recreation with the available open grass areas, playground features, benches, picnic tables, pool, handball courts, basketball courts, and exercise equipment. Potential improvements include ADA upgrades, playground surface repair, security lighting, shading around playgrounds, turf damage repair, and irrigation repair.
Recommendations
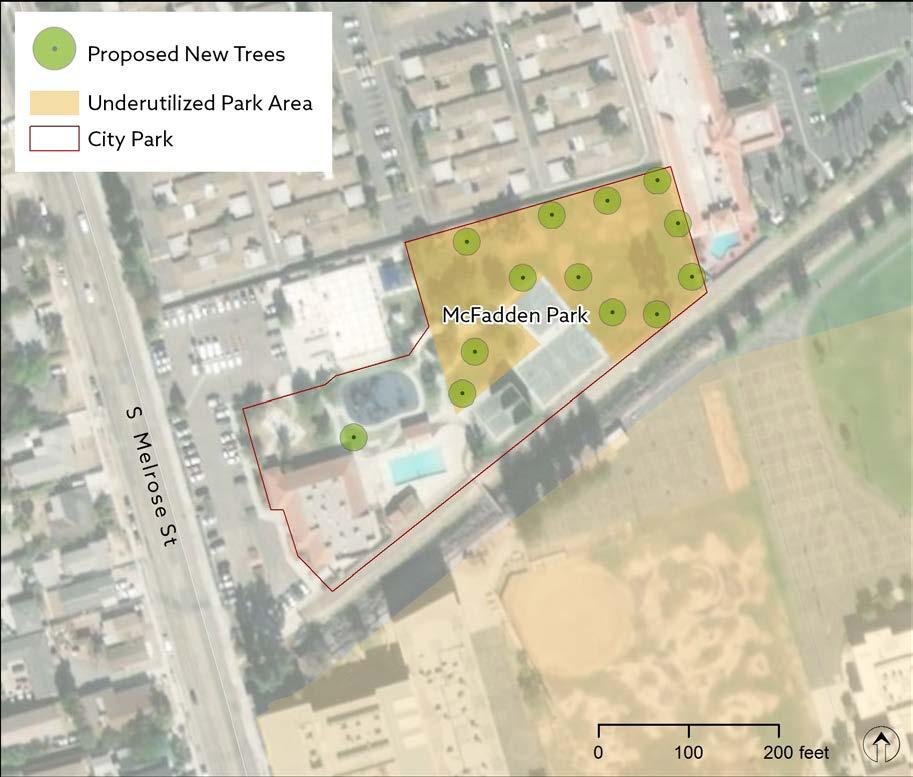
PLACENTIA OPEN SPACES AND URBAN GREENING MASTER PLAN 72
Figure 4-13: McFadden Park Infill/Expansion Potential
Table 4-7: Park Infill/Expansion – McFadden Park
Area 1 Infill Facility Types Typical SF 47,794 Ball Field 30,000-100,000 • Bocce Ball/Shuffleboard 5,000-10,000 • Community Center/Gym 25,000-70,000 Court Sports 2,000-5,000 Dog Park 10,000-75,000 Exterior Exercise Areas 5,000-20,000 • Picnic Areas 500-1,500 • Playgrounds 4,000-6,000 • Soccer Field 14,000-75,000 • Non-Traditional Recreation Facilities Adventure Playgrounds 4,000-6,000 • Community Garden 10,000-40,000 Disk Golf Course 50,000-200,000 Pump Track/Bike Skills Course 10,000-20,000 Pickleball 25,000-35,000 • Skate Park 10,000-35,000 Skate Spot 1,500-10,000 Small Performance Stage 15,000 Tennis 7,000-28,000 Volleyball 4,000-16,000 ADA upgrades throughout the park Repair / replace damaged irrigation throughout Repair / replace damaged playground surfaces Add shading around play area Repair / replace damaged turf and planting throughout
1
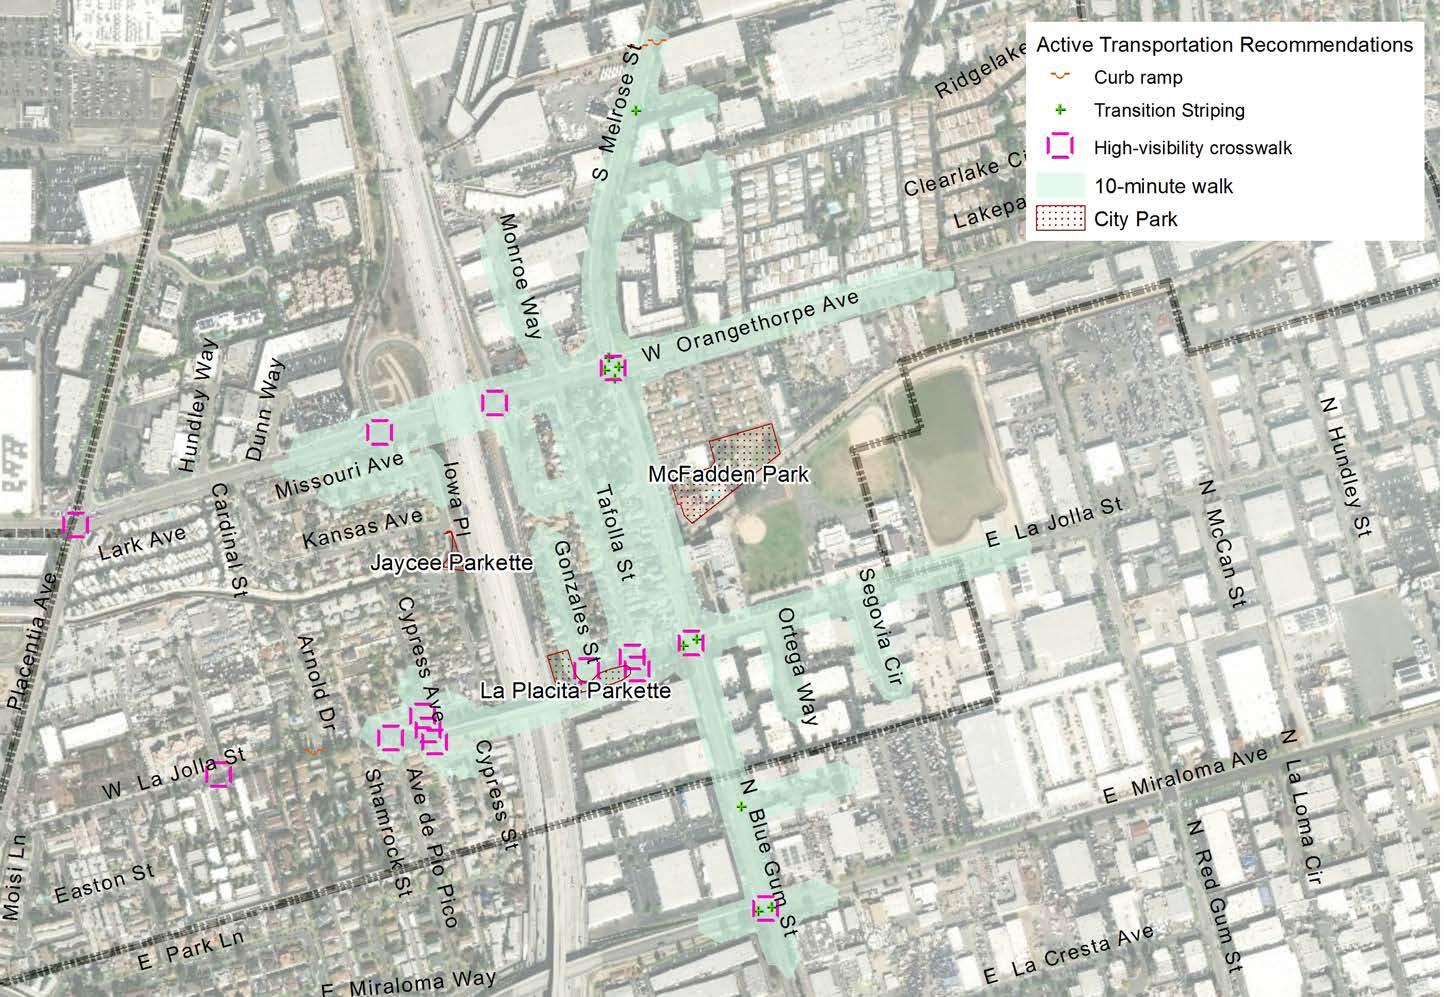
CHAPTER 4 | RECOMMENDATIONS 73
Figure 4-14: McFadden Park Travelshed
Parque de los Ninos
Parque de los Ninos is located in southeast Placentia and is accessed via Orangethorpe Avenue and Richfield Road. The park offers many opportunities for passive and active recreation with the available open grass areas, playground features, benches, picnic tables, pool, handball courts, basketball court, and outdoor exercise equipment.
Potential improvements include ADA upgrades, playground upgrades, playground surface repair, security lighting, shading around playgrounds, turf damage repair, and irrigation repair.
Recommendations

PLACENTIA OPEN SPACES AND URBAN GREENING MASTER PLAN 74
Figure 4-15: Parque de los Ninos Infill/Expansion Potential
Table 4-8: Park Infill/Expansion – Parque de los Ninos
1 Infill Facility Types Typical SF 78,297 Ball Field 30,000-100,000 Bocce Ball/Shuffleboard 5,000-10,000 • Community Center/Gym 25,000-70,000 Court Sports 2,000-5,000 • Dog Park 10,000-75,000 • Exterior Exercise Areas 5,000-20,000 • Picnic Areas 500-1,500 • Playgrounds 4,000-6,000 • Soccer Field 14,000-75,000 • Non-Traditional Recreation Facilities Adventure Playgrounds 4,000-6,000 • Community Garden 10,000-40,000 • Disk Golf Course 50,000-200,000 Pump Track/Bike Skills Course 10,000-20,000 Pickleball 25,000-35,000 Skate Park 10,000-35,000 Skate Spot 1,500-10,000 Small Performance Stage 15,000 Tennis 7,000-28,000 Volleyball 4,000-16,000 ADA upgrades throughout the park Replace outdated playground equipment Repair / replace damaged playground surfaces Replace cracked concrete walkways within park Add safety and security lighting as needed Park identification signage Repair / replace damaged turf throughout Explore addition of multi-use path along flood control channel with park access Replace trees that have died Add shading around play area and outdoor exercise equipment 1
Area

CHAPTER 4 | RECOMMENDATIONS 75
Figure 4-16: Parque de los Ninos Travelshed
Parque de los Vaqueros
Parque de los Vaqueros is located in central Placentia and is accessed via Yellowstone Avenue and Carlsbad Street. The park offers many opportunities for passive recreation with the available open grass areas, playground features, benches, and picnic tables.
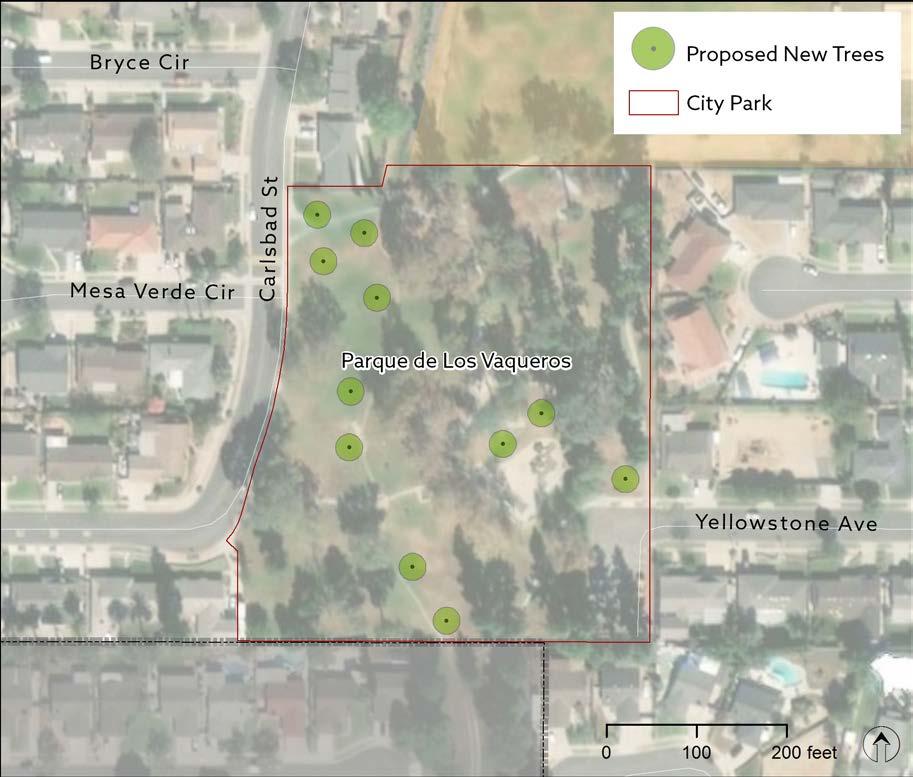
Potential improvements include ADA upgrades, playground upgrades, playground surface repair, security lighting, shading around playgrounds, turf damage repair, and park furnishings upgrades.
All areas of the park are currently programmed and being utilized at appropriate levels. No additional programs or park amenities are recommended at this time except for the general park improvements described above.
Recommendations
PLACENTIA OPEN SPACES AND URBAN GREENING MASTER PLAN 76
Figure 4-17: Parque de los Vaqueros Infill/Expansion Potential
ADA upgrades throughout the park Replace outdated playground equipment Repair / replace damaged playground surfaces Replace cracked concrete walkways within park Add safety and security lighting as needed Park identification signage Repair / replace damaged turf throughout Replace wood decking on pedestrian bridges over creeks Replace trees that have died Maintain drainage ditches Replace park furnishings

CHAPTER 4 | RECOMMENDATIONS 77
Figure 4-18: Parque de los Vaqueros Travelshed
Parque del Arroyo Verde
Parque del Arroyo Verde is located in central Placentia and is accessed primarily via Palm Drive. The park offers several opportunities for passive and active recreation with the available open grass areas, playground, benches, and picnic tables.
Potential improvements include ADA upgrades, playground upgrades, playground surface repairs, security lighting, turf damage repair, and park furnishings upgrades.
Recommendations
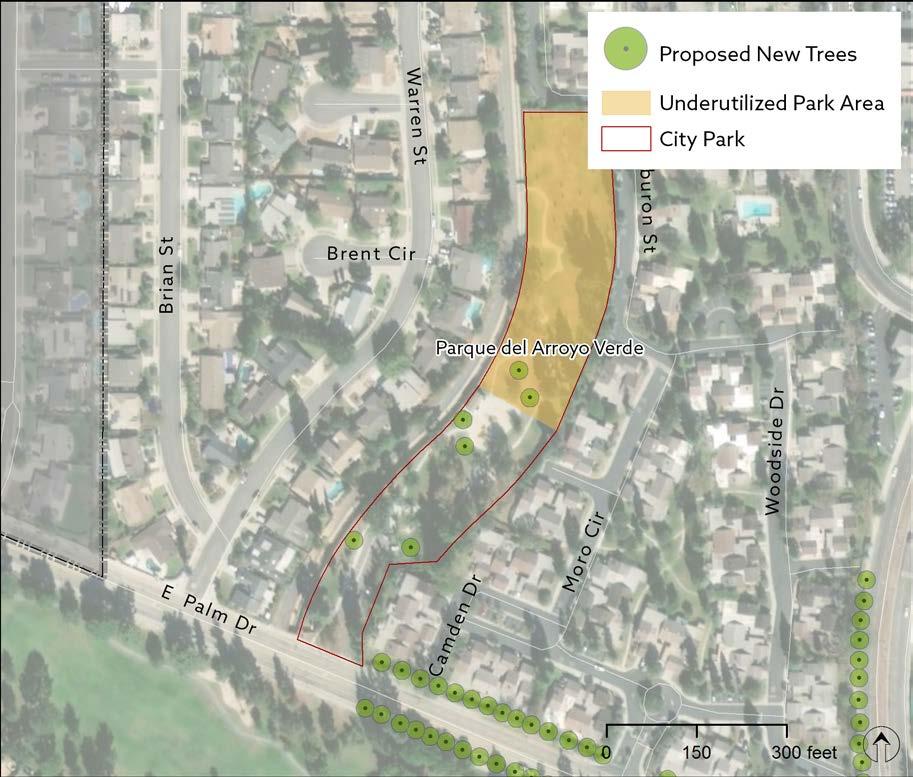
PLACENTIA OPEN SPACES AND URBAN GREENING MASTER PLAN 78
Figure 4-19: Parque del Arroyo Verde Infill/Expansion Potential
Table 4-9: Park Infill/Expansion – Parque del Arroyo Verde
Area 1 Infill Facility Types Typical SF 74,342 Ball Field 30,000-100,000 Bocce Ball/Shuffleboard 5,000-10,000 Community Center/Gym 25,000-70,000 Court Sports 2,000-5,000 Dog Park 10,000-75,000 • Exterior Exercise Areas 5,000-20,000 • Picnic Areas 500-1,500 • Playgrounds 4,000-6,000 • Soccer Field 14,000-75,000 Non-Traditional Recreation Facilities Adventure Playgrounds 4,000-6,000 • Community Garden 10,000-40,000 Disk Golf Course 50,000-200,000 Pump Track/Bike Skills Course 10,000-20,000 Pickleball 25,000-35,000 • Skate Park 10,000-35,000 Skate Spot 1,500-10,000 Small Performance Stage 15,000 Tennis 7,000-28,000 Volleyball 4,000-16,000 ADA upgrades throughout the park Replace outdated park furnishings Replace outdated playground equipment Repair / replace damaged playground surfaces Replace cracked concrete walkways within park Add safety and security lighting as needed Park identification signage Repair / replace damaged turf throughout Explore addition of multi-use path along flood control channel with park access 1
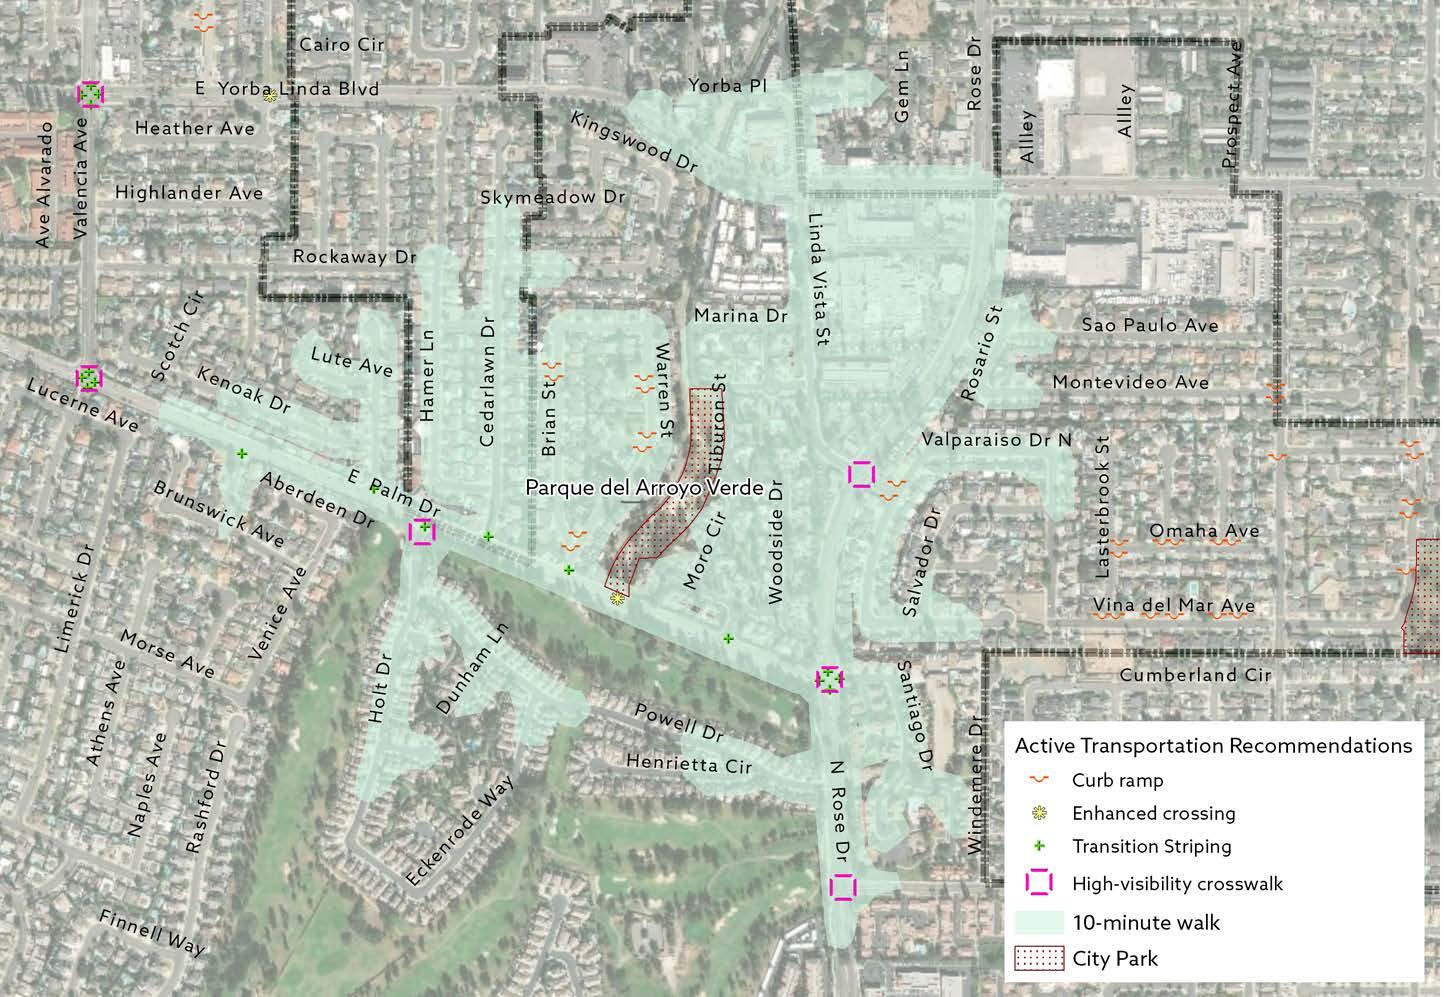
CHAPTER 4 | RECOMMENDATIONS 79
Figure 4-20: Parque del Arroyo Verde Travelshed
Placentia Champions Sports Complex
Placentia Champions Sports Complex is located in south-central Placentia and is accessed via Alta Vista Street and Jefferson Street. The park offers many opportunities for passive and active recreation with the available open grass areas, ball fields, playground features, benches, picnic tables, basketball courts, and multi-purpose room. Potential improvements include ADA upgrades, playground surface repair, security lighting, turf damage repair, and furnishing upgrades.
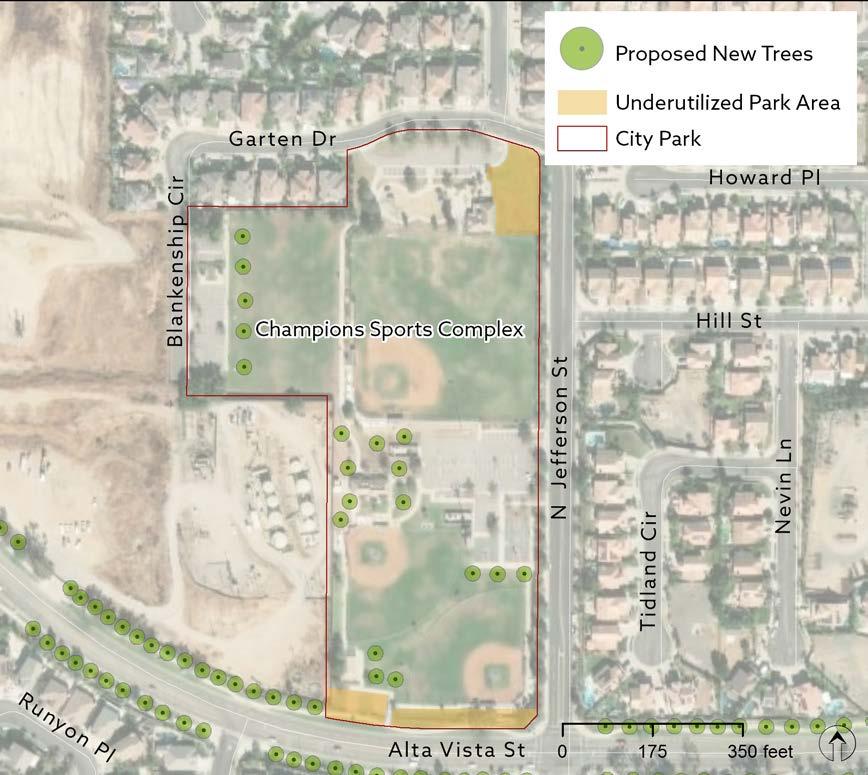
PLACENTIA OPEN SPACES AND URBAN GREENING MASTER PLAN 80
Figure 4-21: Placentia Champions Sports Complex Infill/Expansion Potential
Table 4-10: Park Infill/Expansion – Champions Sports Complex
Area 1 Area 2 Area 3 Infill Facility Types Typical SF 15,946 10,119 7,143 Ball Field 30,000-100,000 Bocce Ball/Shuffleboard 5,000-10,000 • • • Community Center/Gym 25,000-70,000 Court Sports 2,000-5,000 • • • Dog Park 10,000-75,000 • • Exterior Exercise Areas 5,000-20,000 • • • Picnic Areas 500-1,500 • • • Playgrounds 4,000-6,000 • • • Soccer Field 14,000-75,000 • Non-Traditional Recreation Facilities Adventure Playgrounds 4,000-6,000 Community Garden 10,000-40,000 Disk Golf Course 50,000-200,000 Pump Track/Bike Skills Course 10,000-20,000 • • Pickleball 25,000-35,000 Skate Park 10,000-35,000 • • Skate Spot 1,500-10,000 • • • Small Performance Stage 15,000 • Tennis 7,000-28,000 • • • Volleyball 4,000-16,000 • • • ADA upgrades throughout the park Repair / replace damaged playground surfaces Add safety and security lighting as needed Add adequate lighting to baseball fields Park identification signage Repair / replace damaged turf throughout, especially in playing fields Replace trees that have died Provide additional park furnishings, i.e. trash cans near playing fields Install doors in men’s restroom Recommendations 1 2 3
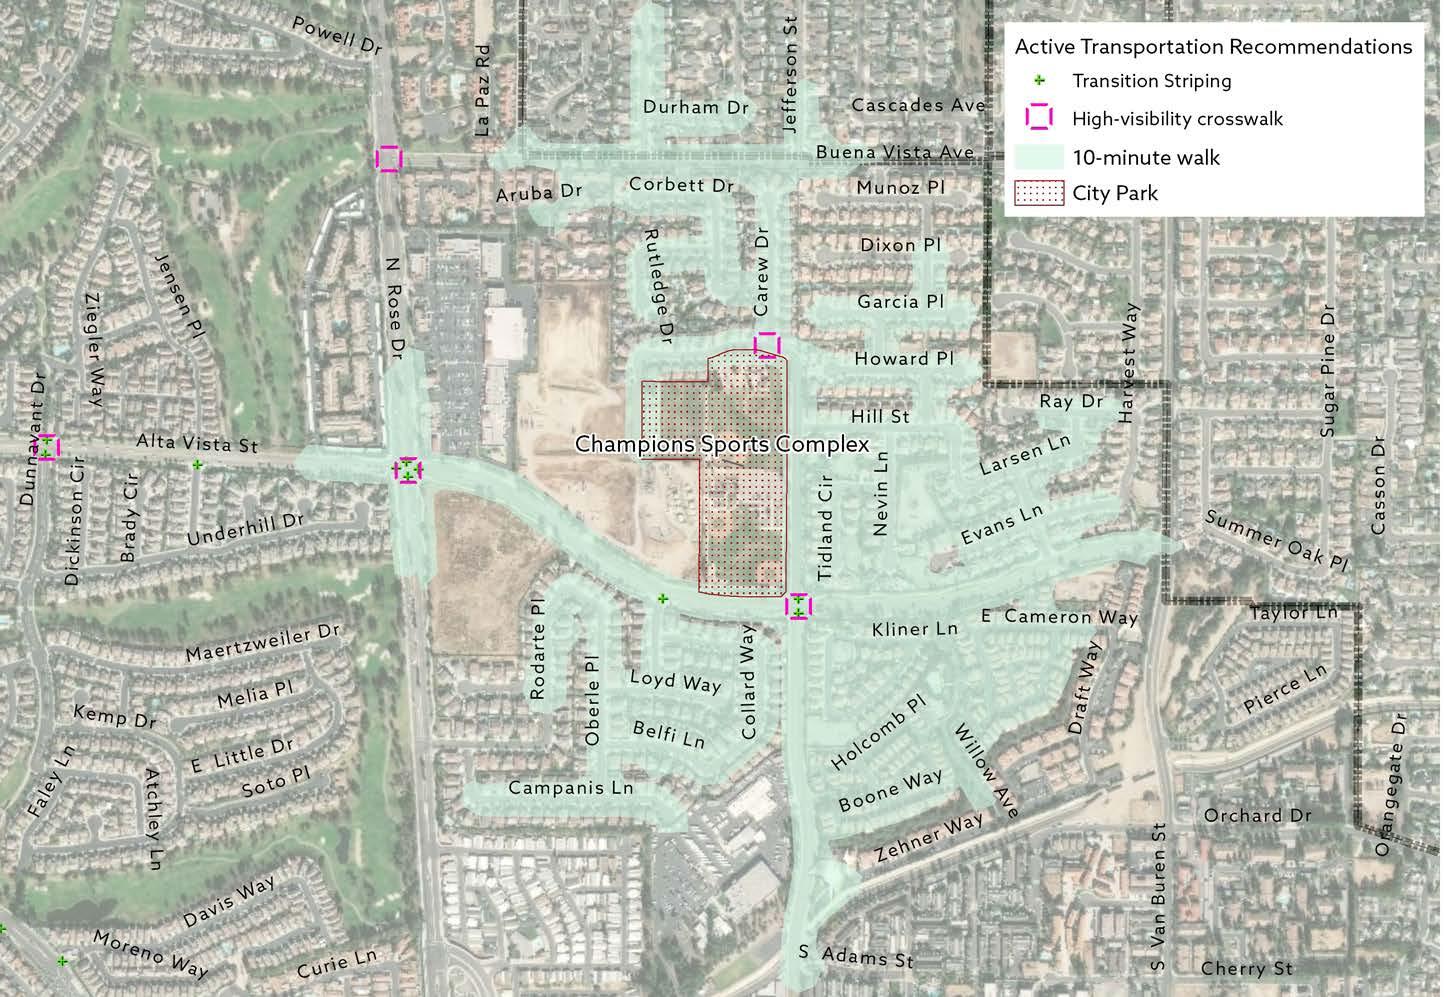
CHAPTER 4 | RECOMMENDATIONS 81
Figure 4-22: Placentia Champions Sports Complex Travelshed
Richard R. Samp Park
Richard R. Samp Park is located in central Placentia and is accessed via Alta Vista Street and Central Avenue. The park offers several opportunities for passive recreation with the available open grass areas, playground, benches, and picnic tables.
Potential improvements include ADA upgrades, playground surface repairs, park identification signage, security lighting, turf damage repair, shading around playground, and park furnishings upgrades.
Recommendations
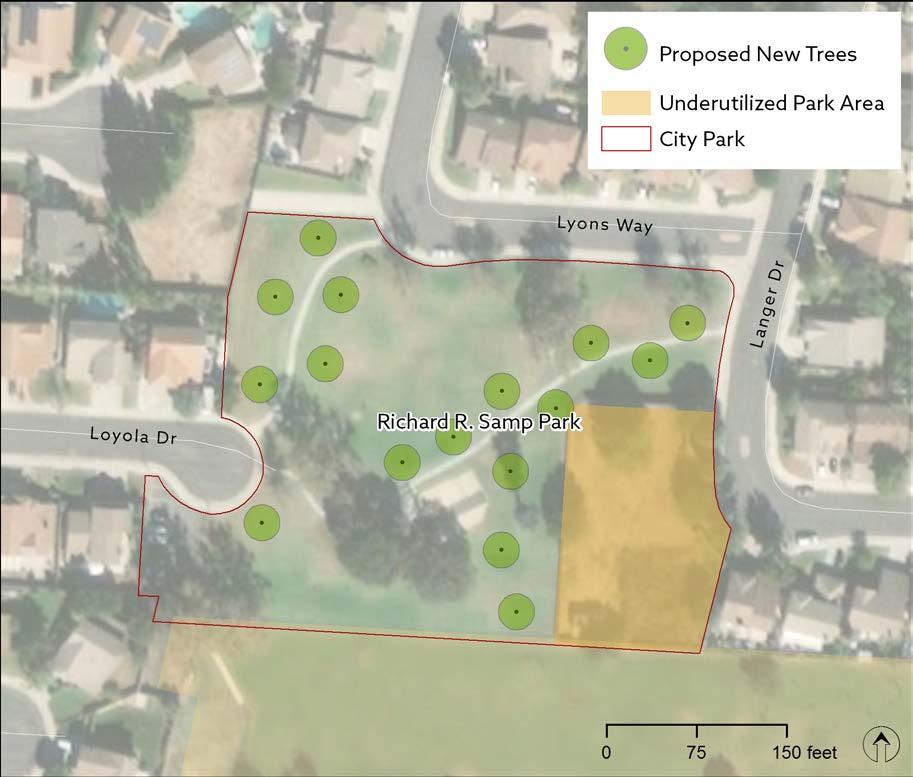
PLACENTIA OPEN SPACES AND URBAN GREENING MASTER PLAN 82
Figure 4-23: Richard R. Samp Park Infill/Expansion Potential
Table 4-11: Park Infill/Expansion – Richard R. Samp Park
Area 1 Infill Facility Types Typical SF 26,704 Ball Field 30,000-100,000 Bocce Ball/Shuffleboard 5,000-10,000 • Community Center/Gym 25,000-70,000 • Court Sports 2,000-5,000 • Dog Park 10,000-75,000 Exterior Exercise Areas 5,000-20,000 • Picnic Areas 500-1,500 • Playgrounds 4,000-6,000 • Soccer Field 14,000-75,000 Non-Traditional Recreation Facilities Adventure Playgrounds 4,000-6,000 • Community Garden 10,000-40,000 • Disk Golf Course 50,000-200,000 Pump Track/Bike Skills Course 10,000-20,000 Pickleball 25,000-35,000 • Skate Park 10,000-35,000 Skate Spot 1,500-10,000 Small Performance Stage 15,000 Tennis 7,000-28,000 Volleyball 4,000-16,000 ADA upgrades throughout the park Repair / replace damaged playground surfaces Add safety and security lighting as needed Park identification signage Repair / replace damaged turf throughout Add shading around play area
1

CHAPTER 4 | RECOMMENDATIONS 83
Figure 4-24: Richard R. Samp Park Travelshed
Santa Fe Park
Santa Fe Park is located in southwest Placentia and is accessed via Santa Fe Avenue. Capistrano Street, and Santa Barbara Street. The park offers several opportunities for passive recreation with the available open grass areas, playground, picnic tables, and outdoor exercise equipment. Potential improvements include ADA upgrades, playground surface repairs, park identification signage, turf damage repair, shading around playground, and park furnishings upgrades.
Recommendations

PLACENTIA OPEN SPACES AND URBAN GREENING MASTER PLAN 84
Figure 4-25: Santa Fe Park Infill/Expansion Potential
Table 4-12: Park Infill/Expansion – Santa Fe Park
Area 1 Infill Facility Types Typical SF 5,203 Ball Field 30,000-100,000 Bocce Ball/Shuffleboard 5,000-10,000 • Community Center/Gym 25,000-70,000 Court Sports 2,000-5,000 Dog Park 10,000-75,000 Exterior Exercise Areas 5,000-20,000 • Picnic Areas 500-1,500 • Playgrounds 4,000-6,000 • Soccer Field 14,000-75,000 Non-Traditional Recreation Facilities Adventure Playgrounds 4,000-6,000 • Community Garden 10,000-40,000 Disk Golf Course 50,000-200,000 Pump Track/Bike Skills Course 10,000-20,000 Pickleball 25,000-35,000 Skate Park 10,000-35,000 Skate Spot 1,500-10,000 • Small Performance Stage 15,000 Tennis 7,000-28,000 Volleyball 4,000-16,000 • ADA upgrades throughout the park Park identification signage Add shading around play area and exercise area Replace damaged turf throughout Repair / replace damaged playground surfaces
1
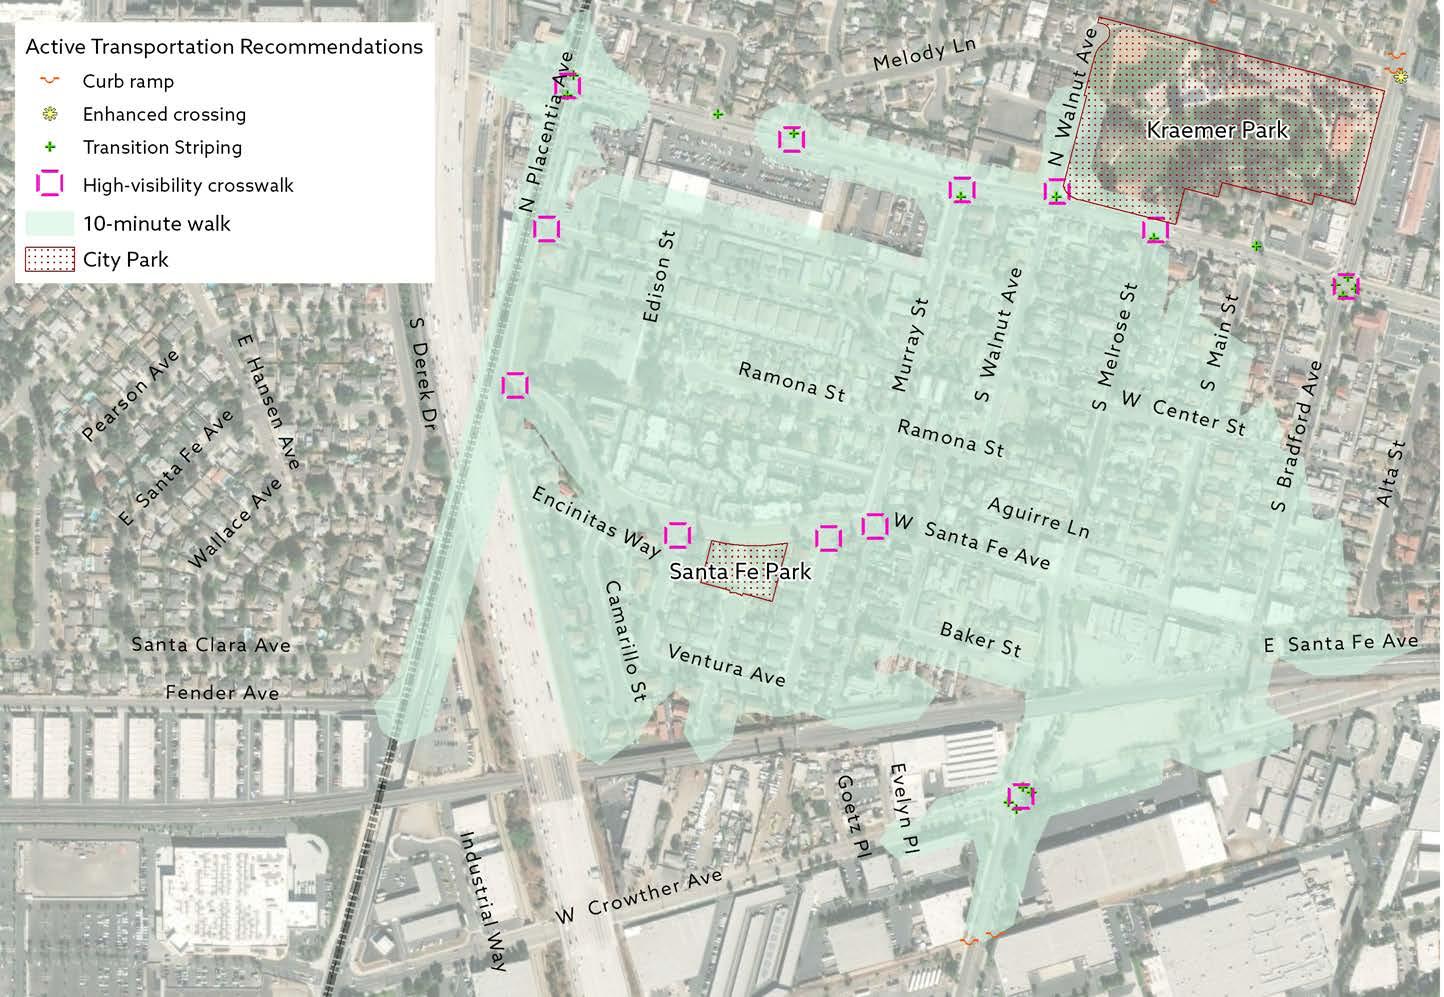
CHAPTER 4 | RECOMMENDATIONS 85
Figure 4-26: Santa Fe Park Travelshed
Tuffree Park
Tuffree Park is located in northwest Placentia and is accessed via Tuffree Boulevard and Fremont Avenue. The park offers several opportunities for passive and active recreation with the available playground features, benches, picnic tables, handball courts, and multi-purpose room.
Potential improvements include ADA upgrades, playground surface repair, security lighting, turf damage repair, park furnishings upgrades, and ball field repairs. All areas of the park are currently programmed and being utilized at appropriate levels. No additional programs or park amenities are recommended at this time except for the general park improvements described above.
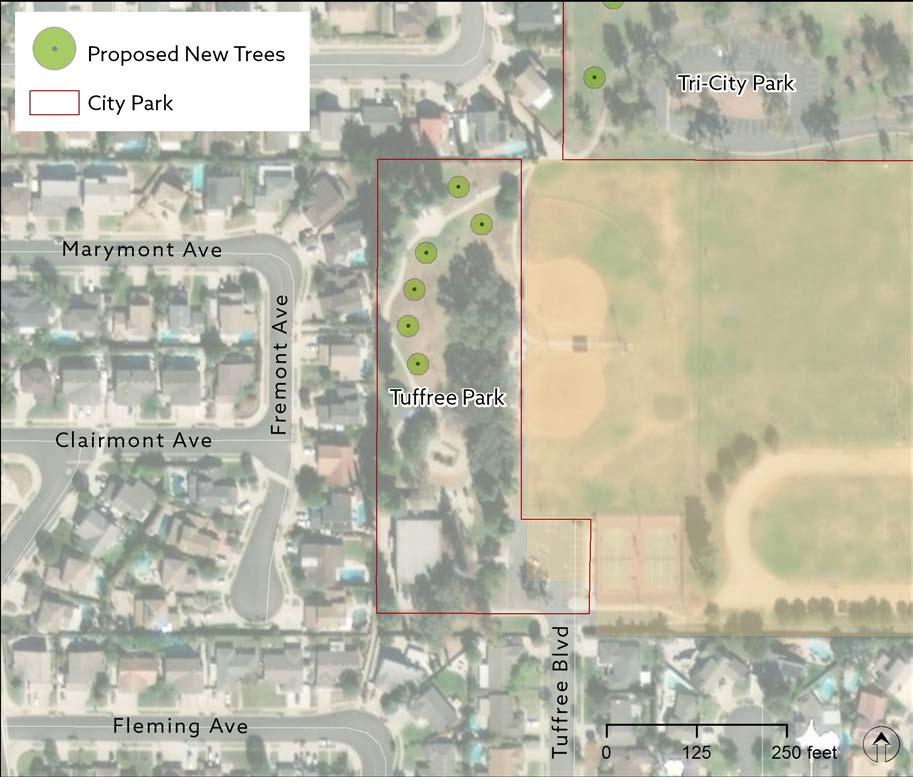
Recommendations
PLACENTIA OPEN SPACES AND URBAN GREENING MASTER PLAN 86
Figure 4-27: Tuffree Park Infill/Expansion Potential
ADA
Repair / replace damaged playground surfaces Repaint handball courts Replacing fencing around baseball fields Coordinate ball field repairs with school per jointuse-agreement Add safety and security lighting as needed Park identification signage Repair / replace damaged turf throughout Provide additional park furnishings
upgrades throughout the park
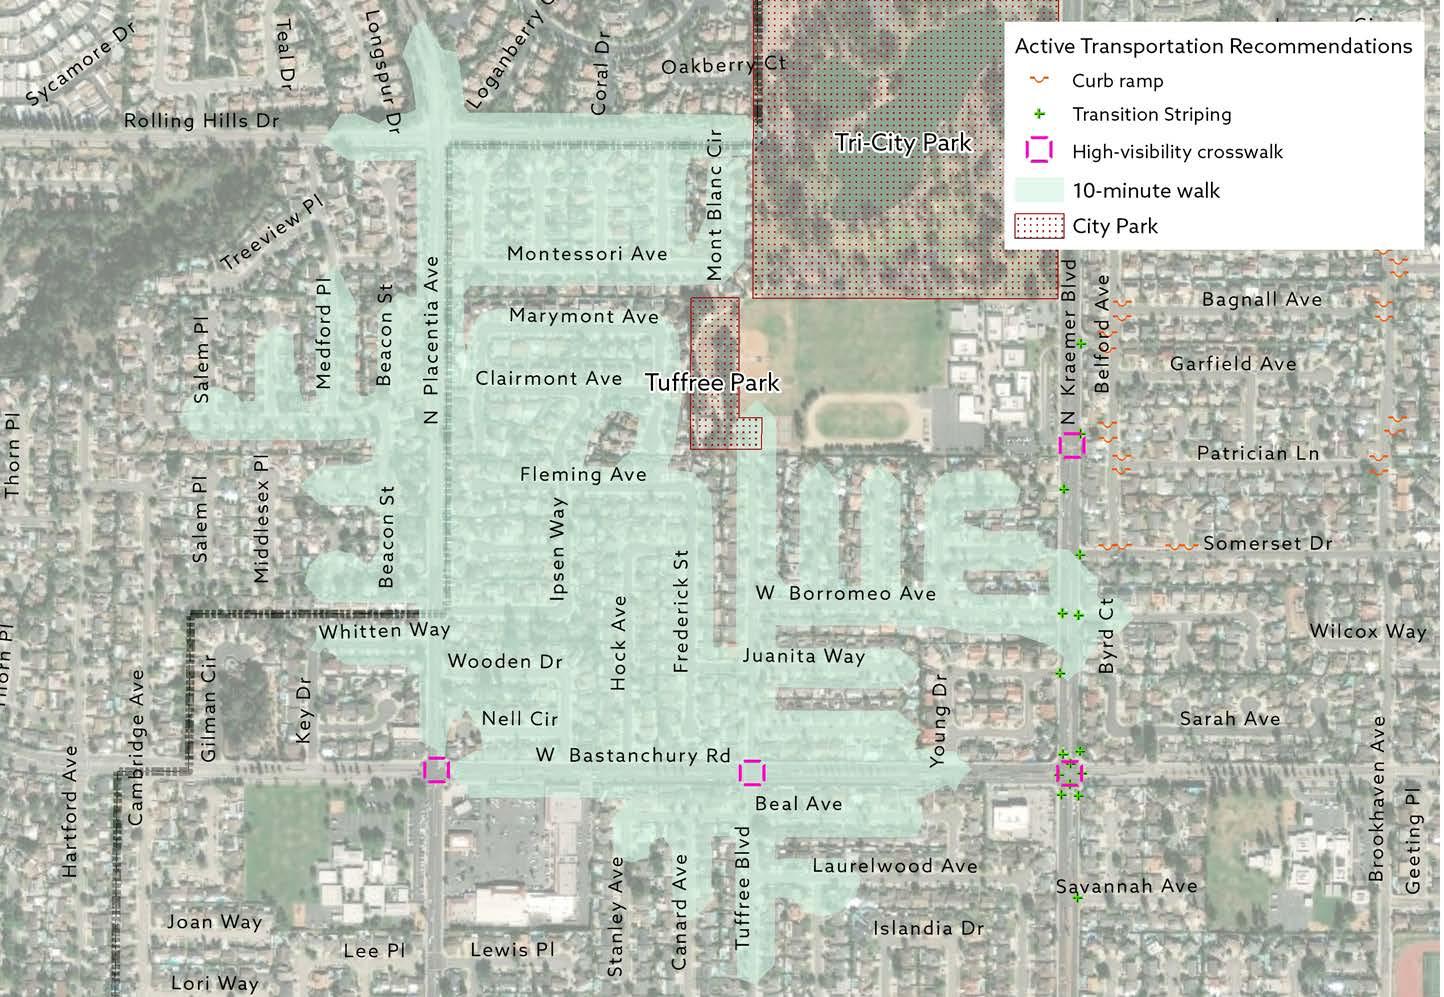
CHAPTER 4 | RECOMMENDATIONS 87
Figure 4-28: Tuffree Park Travelshed
Wagner Park
Wagner Park is located in central Placentia and is accessed via Trumpet Avenue and Cartlen Drive. The park offers opportunities for passive recreation activities with the available playgrounds, picnic tables, benches, and open grass areas.
Potential improvements include ADA upgrades, playground surface repairs, park identification signage, turf damage repair, shading around playground, replacing cracked concrete walkways, and park furnishings upgrades.
Recommendations

PLACENTIA OPEN SPACES AND
GREENING MASTER PLAN 88
URBAN
Area 1 Infill Facility Types Typical SF 55,241 Ball Field 30,000-100,000 Bocce Ball/Shuffleboard 5,000-10,000 • Community Center/Gym 25,000-70,000 Court Sports 2,000-5,000 • Dog Park 10,000-75,000 • Exterior Exercise Areas 5,000-20,000 • Picnic Areas 500-1,500 • Playgrounds 4,000-6,000 • Soccer Field 14,000-75,000 Non-Traditional Recreation Facilities Adventure Playgrounds 4,000-6,000 • Community Garden 10,000-40,000 • Disk Golf Course 50,000-200,000 • Pump Track/Bike Skills Course 10,000-20,000 Pickleball 25,000-35,000 • Skate Park 10,000-35,000 Skate Spot 1,500-10,000 Small Performance Stage 15,000 Tennis 7,000-28,000 Volleyball 4,000-16,000 ADA upgrades throughout the park Replace outdated playground equipment Repair / replace damaged playground surfaces Replace cracked concrete walkways within park Add safety and security lighting as needed Park identification signage Repair / replace damaged turf throughout Replace park furnishings
Table 4-13: Park Infill/Expansion – Wagner Park
Figure 4-29: Park Infill/Expansion – Wagner Park
1

CHAPTER 4 | RECOMMENDATIONS 89
Figure 4-30: Wagner Park Travelshed
Tri-City Park
Tri-City Park is located in northwest Placentia and is accessed via Kraemer Boulevard, Golden Avenue, and Rolling Hills Drive. The park is managed by the County of Orange and offers many opportunities for passive and active recreation with the available grass areas, playground features, benches, picnic tables, multi-use paths, and fishing lake. This park is owned, operated, and maintained by County of Orange and not within Placentia’s jurisdiction; however, it serves as a valuable recreational resource to the community.
The City of Placentia should coordinate with the County of Orange to improve Class 1 connectivity through the park between Rolling Hills Drive and Golden Avenue.

PLACENTIA OPEN SPACES AND URBAN GREENING MASTER PLAN 90
Figure 4-31: Tri-City Park Infill/Expansion Potential
Rolling Hills Drive
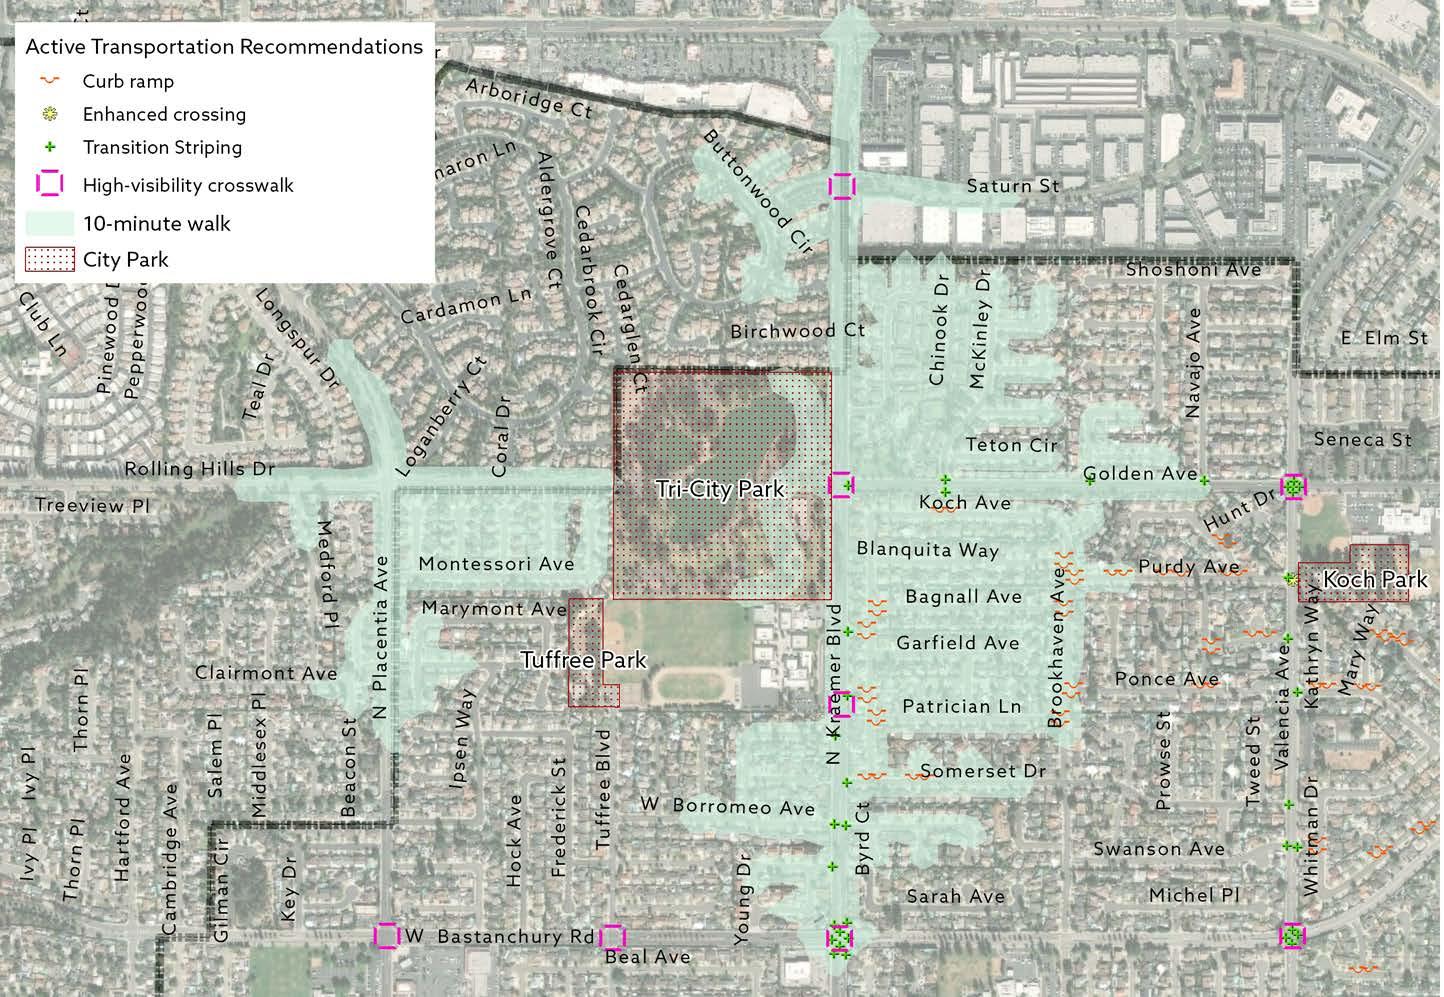
CHAPTER 4 | RECOMMENDATIONS 91
Figure 4-32: Tri-City Park Travelshed
Linear Park and Multi-Use Path Opportunities
Identifying linear park or multi-use path opportunities throughout Placentia was one of major goals of this Plan. The team reviewed aerial maps and conducted field work to identify locations for potential improvements.
Part of the exercise was to determine where in Placentia city-owned vacant parcels, flood control channels, railroad corridors, or streets with excess right-of-way were located. These types of locations provide the space needed to design and implement linear parks, multiuse paths, or a combination of the two for current and future Placentia residents to enjoy. They provide new opportunities for recreation, exercise, or comfortable connections to and from parks and other local destinations. These features will also help reduce the City’s overall vehicle miles traveled and help reduce the carbon footprint. Furthermore, they help close park deficiencies identified in the level of service analysis discussed in Chapter 2 of this Plan.
To the right are a few examples both locally and from across the country where planners, engineers, and landscape architects came together to design and build linear parks or multi-use paths. Figure 4-33 depicts linear park and multi-use path opportunities identified throughout Placentia that are broken into different segments throughout the City. The map is supported by photos of a small sample of existing locations that depict their existing conditions.
Linear Park or Multi-Use Path Examples
City of Santa Ana, Pacific Electric Trail
The Pacific Electric Trail is a two-mile, multi-use path found in central-east Santa Ana that provides residents recreational and transportation opportunities. Additional amenities along the trail include playground equipment and outdoor exercise stations. The trail provides connections to Downtown Santa Ana, the Pacific Electric Park, and other trail connections at its southern terminus.
City of Brea, The Tracks at Brea
The Tracks at Brea is a 50-acre, four mile long linear park that provides Brea residents recreational and transportation opportunities. The corridor features a two-way bike path, pedestrian path, outdoor exercise equipment, bike repair stations, seating areas, shade structures, themed gardens, and green infrastructure, among other amenities. The corridor was created with the help of a volunteer community task force.
City of Chicago, The Bloomingdale Trail (The 606)
The 606 is a linear park and greenway trail network found throughout northwest Chicago. The Bloomingdale Trail is the backbone to this network, providing residents recreation and transportation opportunities along its 2.7 miles. The trail was originally a railroad that was converted into a greenway after the City partnered with local neighborhood groups and The Trust for Public Land.
City of Atlanta, The BeltLine
The BeltLine is a planned 22-mile loop of multi-use paths and parks that will eventually connect 45 neighborhoods in Atlanta along railroad corridors that once serviced the city. As of 2019, the BeltLine consists of five trails and seven parks that welcome approximately two million visitors each year. The BeltLine was a grassroots initiative of local citizens and leaders to create a comprehensive approach to transportation, land use, open space, and sustainability.
PLACENTIA OPEN SPACES AND URBAN GREENING MASTER PLAN 92
1 2
3 4

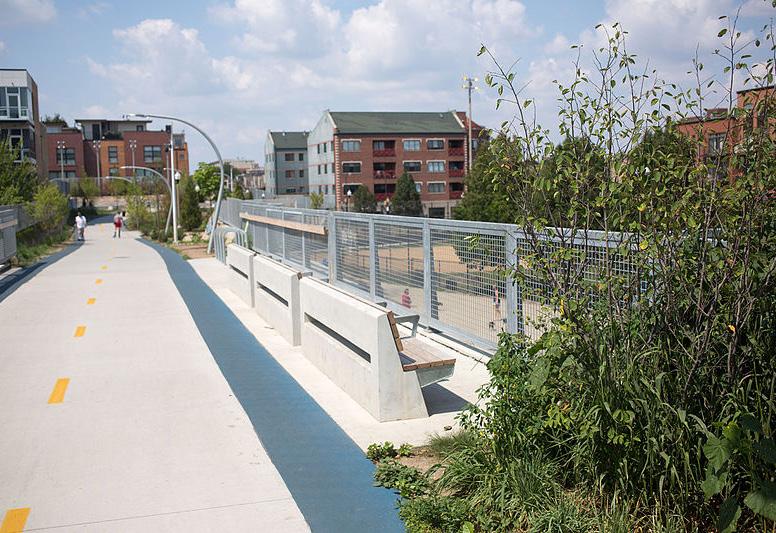

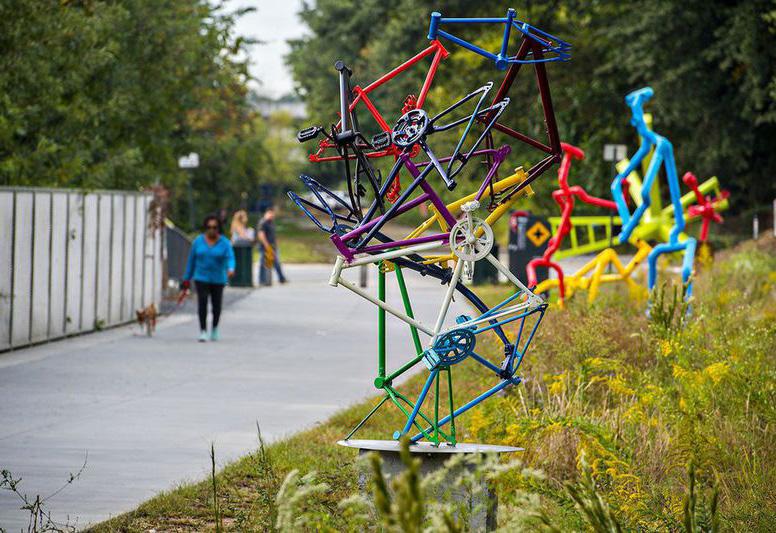
CHAPTER 4 | RECOMMENDATIONS 93
Outdoor exercise equipment along The Tracks at Brea
Exercise equipment and playground features along Santa Ana’s PE Trail
1 2 3 4
Site furnishings and lighting along Chicago’s Bloomingdale Trail Art installations along the Atlanta BeltLine path

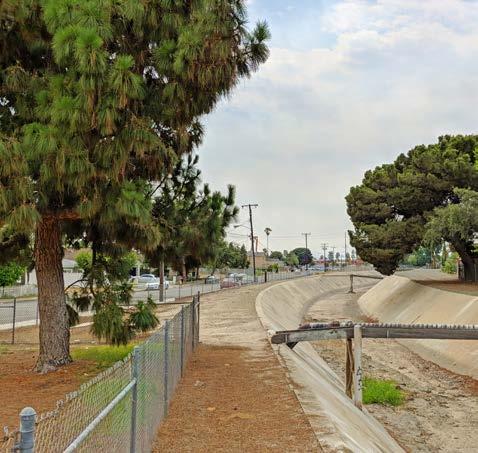
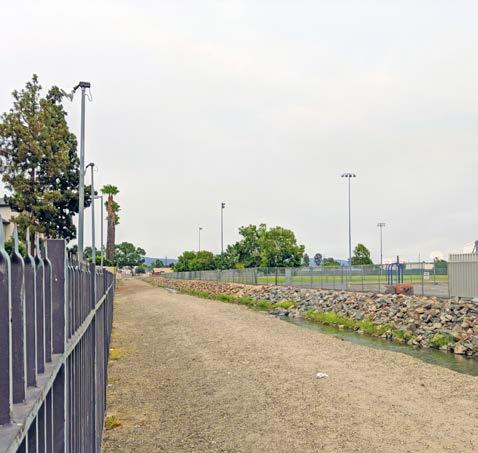
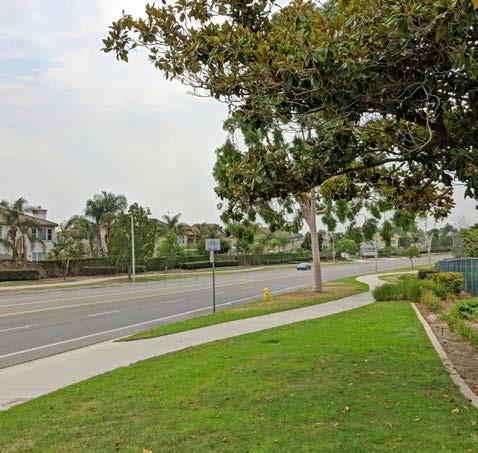
PLACENTIA OPEN SPACES AND URBAN GREENING MASTER PLAN 94 Project # Name Length (Miles) Carbon Canyon Channel 1.2 Carbon Canyon Channel 0.4 Palm Drive 0.2 Rose Drive 0.7 Kraemer Boulevard 0.7 Alta Vista Street 2.0 Central Avenue 0.2 Chapman Avenue 1.1 Carbon Canyon Channel 0.4 Carbon Creek Channel 0.4 Carbon Creek Channel 3.0 Richfield Channel 0.7 Atwood Channel 1.10 Golden Avenue 1.2
Carbon Canyon Channel, Section adjacent to Parque del Arroyo Verde
Atwood Channel, section adjacent to Parque de Los Ninos
Carbon Creek Channel, section adjacent to McFadden Park, Melrose ES, and Valadez MS
2 6 11 11 3 7 4 8 5 9 6 10 12 11 13 14 1 2
Opportunities for linear park elements or multi-use path on Alta Vista St.
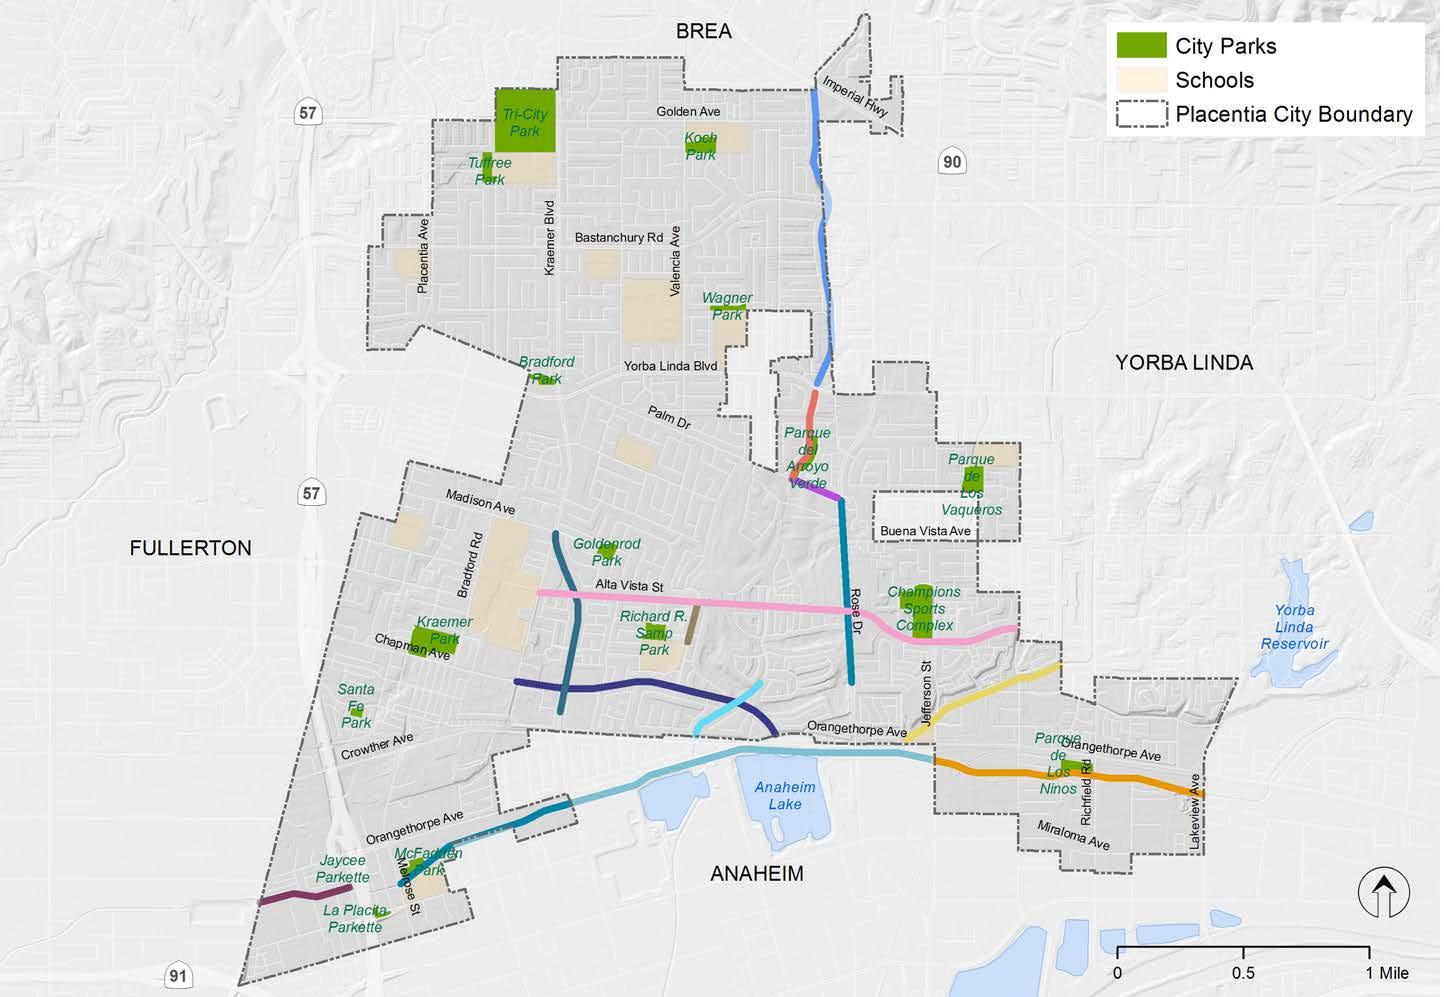
CHAPTER 4 | RECOMMENDATIONS 95
1 2 3 7 4 8 5 9 6 10 12 11 13 14
Figure 4-33: Linear Park and Multi-Use Path Opportunities
Linear Park and Multi-Use Path Amenities

The following section describes amenities that are commonly found along linear parks and multi-use paths. These amenities can vary in design but they may incorporate a theme to reflect the area’s history or culture. The local context and community of Placentia should be considered when selecting amenities.
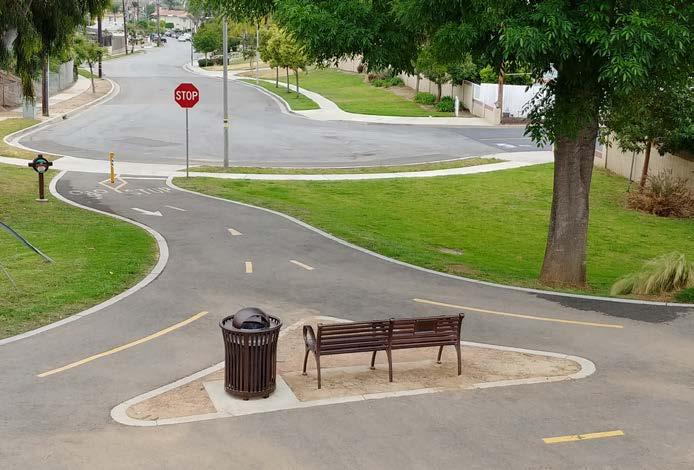
• Benches / rest stops
• Picnic tables
• Trash and recycling receptacles
• Small plazas or gathering spaces
• Shade trellis / shade structures
• Restroom
• Pedestrian-scale lighting
• Small playground features / play pockets
• Exercise equipment
• Bicycle parking
• Bicycle fix-it stations
• Public art
• Green infrastructure such as rain gardens
• Trees
• Themed gardens such as butterfly gardens
• Demonstration gardens
• Interpretive signage
• Wayfinding signage
• Geocaching markers
• Mile markers
• Drinking fountains / dog bowls
• Emergency call boxes
PLACENTIA OPEN SPACES AND URBAN GREENING MASTER PLAN 96
Small playground, City of Santa Ana
Benches and trash receptable, City of Brea
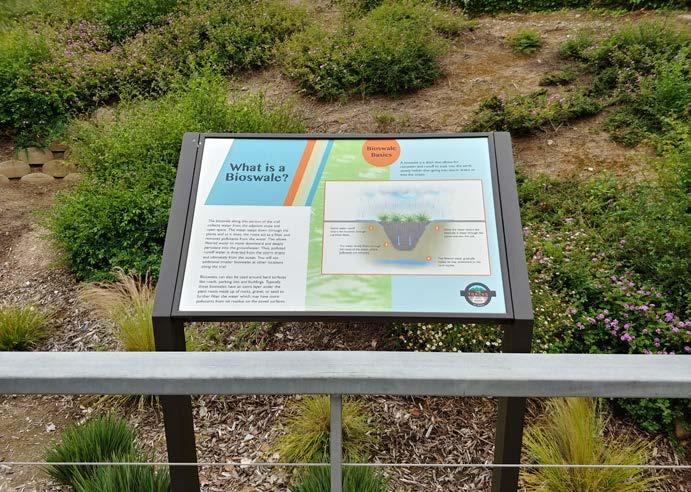


CHAPTER 4 | RECOMMENDATIONS 97
Bicycle parking, City of Brea
Interpretive signage, City of Brea
Rain garden, City of Brea
Linear Park and Class 1 Multi-Use Path Vignettes
The linear park and multi-use path opportunities identified in Figure 4-33 exist within flood control channels or along excess right-of-way along main corridors. The following two vignettes depict potential improvements that can be designed for these two conditions. Figure 4-34 depicts improvements along flood control channels with typical widths of 14 feet. Figure 4-35 depicts improvements for street corridors with typical widths of 30 to 35 feet.
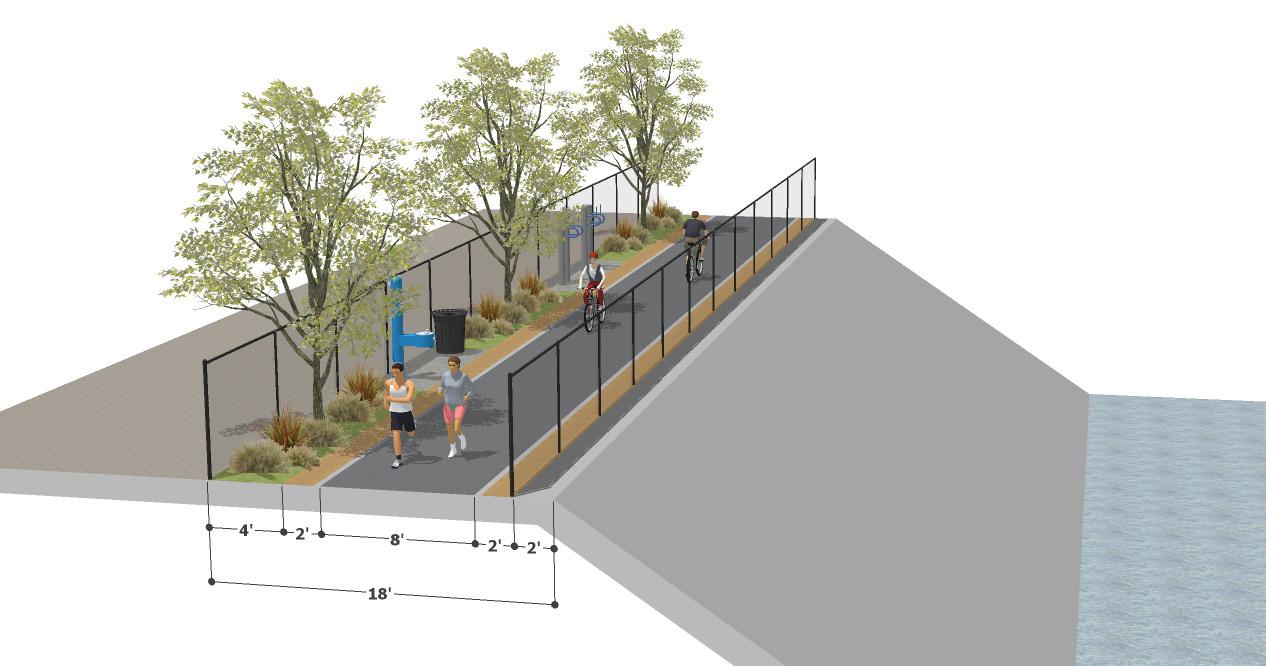
PLACENTIA OPEN SPACES AND URBAN GREENING MASTER PLAN 98 1 2 3 4 5
1 Class 1 multi-use path
Figure 4-34: Typical 14 Foot Class 1 multi-use path
3 New trees and droughttolerant landscaping
2 Amenities i.e. trash bins or water bottle stations
4 Recreation elements i.e. exercise equipment
5 Enhanced fencing
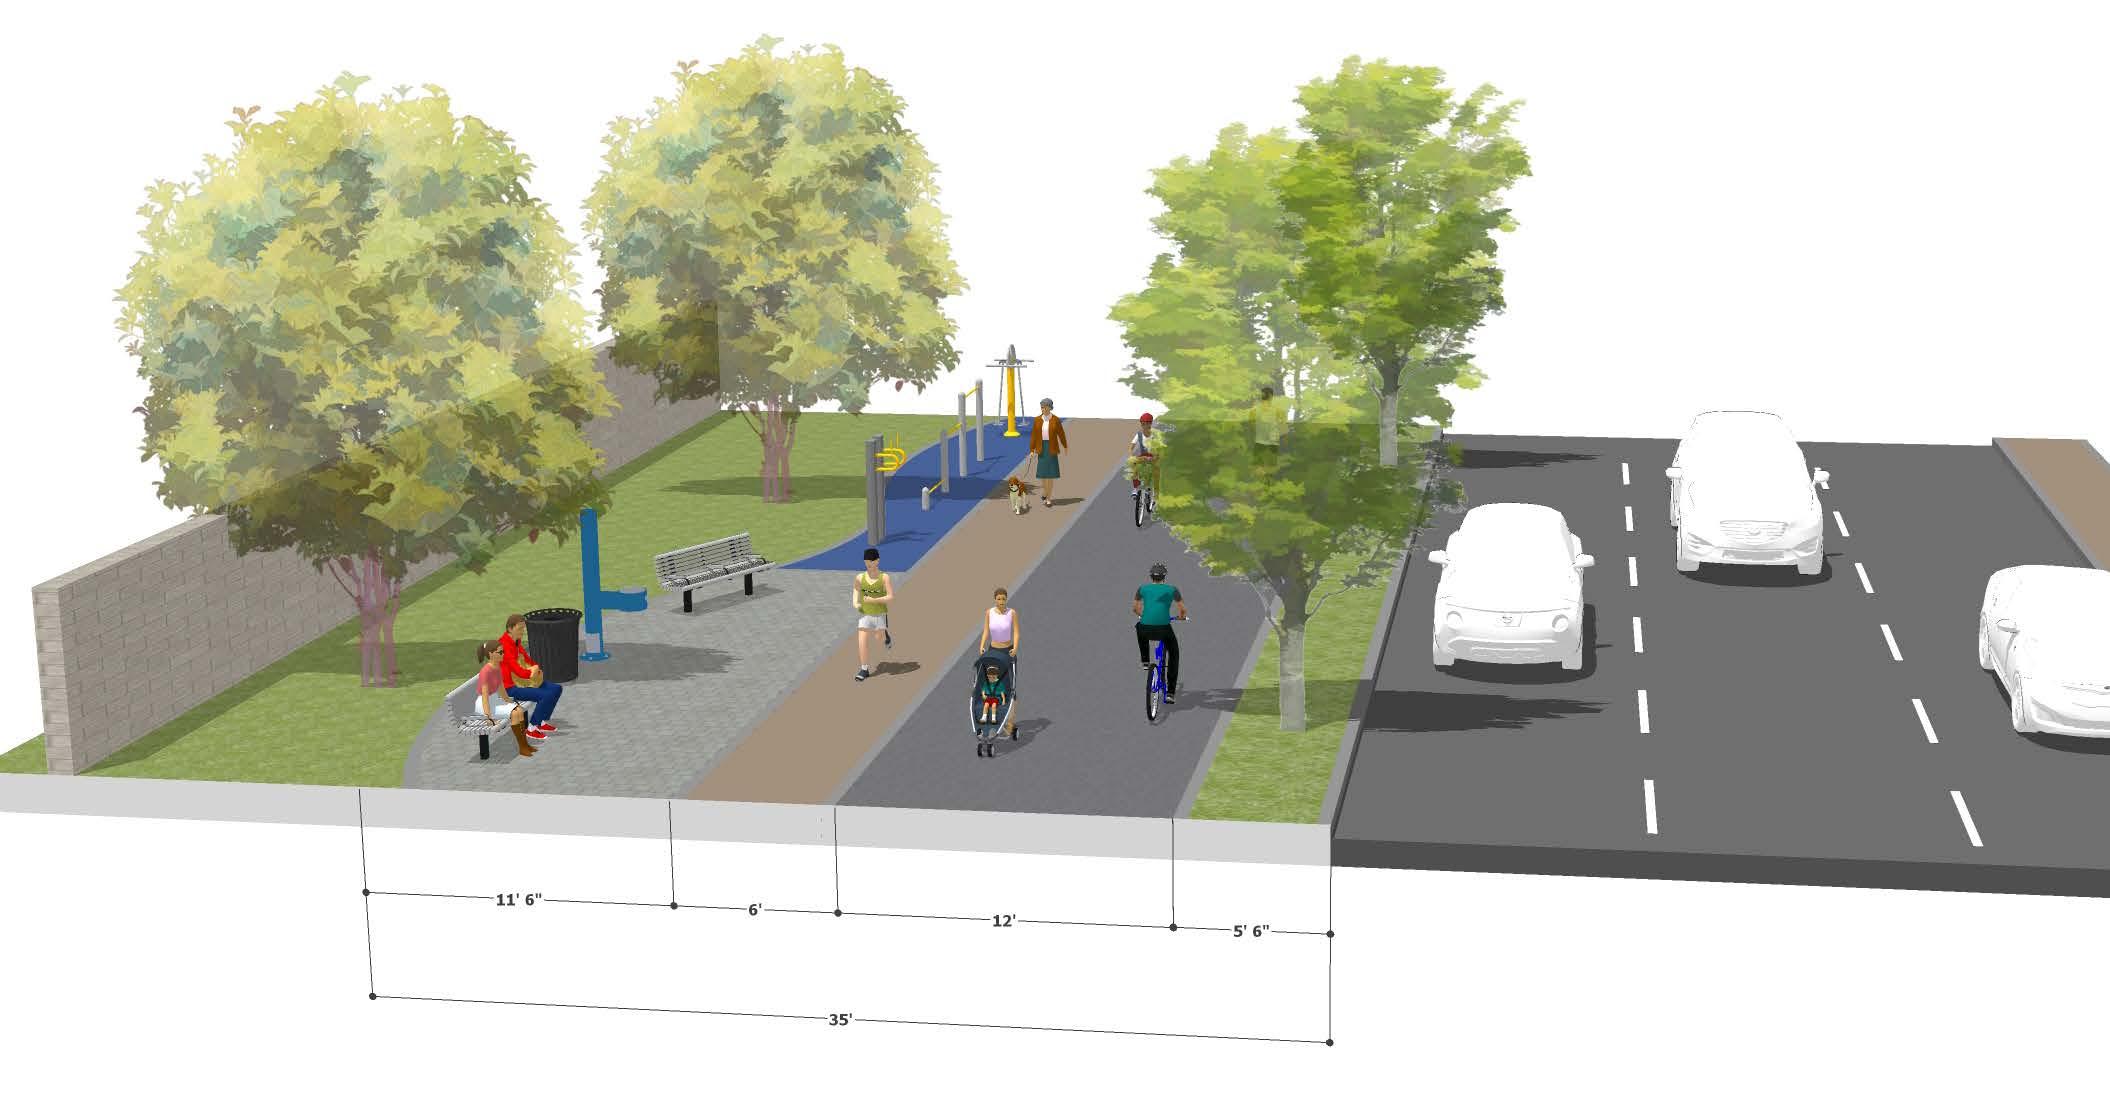
CHAPTER 4 | RECOMMENDATIONS 99 1 1
Figure 4-35: Typical 30-35 Foot Class 1 multi-use path
Class 1 multi-use path
Soft-surface pedestrian path
3
3
Drought-tolerant trees and landscaping
2
4
2
Gathering space w/ amenities i.e. seating, shading, trash bins, or water bottle filling stations 4
5
Recreation elements i.e. exercise equipment 5
Greenhouse Gas Emission Reduction Analysis
The Greenhouse Gas Emission Analysis in this Plan consists of understanding the important role trees have in trapping greenhouse gases before they reach the atmosphere. Trees absorb and store key greenhouse gases before they reach the upper atmosphere where they can help trap heat around the Earth’s surface. Carbon sequestration is the process where CO2 is pulled from the atmosphere and stored for a long period of time. The terrestrial approach consists of trees absorbing carbon during photosynthesis and storing it in the tree’s wood.
This Plan utilized the i-Tree calculator to better understand where the City of Placentia stands in current levels of carbon sequestration. The i-Tree calculator is a comprehensive, state-of-the-art, peerreviewed software suite from the USDA Forest Service that provides urban and rural forestry analysis and benefits assessment tools. Communities, non-profit organizations, consultants, volunteers, and students around the world have used i-Tree to report on individual trees, parcels, neighborhoods, and cities.
The following infographics depict the results from the iTree calculator using available tree data. The first set of infographics depict the amount of carbon sequestration taking place with the existing trees in the City. The second set of infographics depict carbon sequestration quantities based on an estimated number of new trees planted in either streetscape projects, existing park projects, and proposed linear park / multi-use path corridors.
Additional Guidance
Inevitably, the City of Placentia will continue to develop and change. With any building improvements or new construction, trees should always be considered within the development to increase the urban tree canopy. There is a long list of things to consider when selecting a tree for a site or space. Certain species may be more appropriate than others for various reasons.
As part of the goal to maximize carbon sequestration, the following should be taken into consideration:
• Trees with large leaves and wide crowns enable the highest levels of photosynthesis;
• Fast growing trees store the most carbon during their first decades, this being a tree’s most productive period; and
• Long-lived trees can keep carbon stored for generations without releasing it in decomposition.
Recommended Trees for Southern California
The following trees have been identified as excellent choices for carbon sequestration.
• Liquidambar styraciflua, American sweetgum (parks only)
• Pinus species, Pines (parks and parkways)
• Quercus species, Oaks (parks and parkways)
• Platanus x acerifolia, London plane (parks and parkways)
• Liriodendron tulipifera, Tulip tree (parks and parkways)
• Taxodium distichum, Bald cypress (parks and parkways)
Recommended Tree Pallette
The following table includes a recommended list of trees that can be planted in Placentia. The trees in the table were selected based on the regions growing climate, the maintenance, height, canopy, and potential to sequester carbon.
PLACENTIA OPEN SPACES AND URBAN GREENING MASTER PLAN 100
Carbon Sequestration: Existing Trees
Carbon Sequestration: Proposed Trees
7,652
2,134 Existing Trees in Placentia Proposed Trees in Placentia
8,089,715 lbs
16,090,900 lbs of carbon dioxide captured over the next 30 years by existing trees in Placentia
of carbon dioxide captured over the next 30 years by trees proposed in this Plan
CHAPTER 4 | RECOMMENDATIONS 101
PLACENTIA OPEN SPACES AND URBAN GREENING MASTER PLAN
102 Scientific Name Common Name Type Mature H x W Carbon Sequestration (lbs) (Assumes equal perimeters) Minimum Parkway Requirements (feet) Flowering Tree Fall Color Agonis flexuosa Peppermint tree Evergreen 30’ x 25’ 1,809 5’ Albizia julibrissin Mimosa or Silk Tree Deciduous 60’ x 40’ 95 5’ • Arecastrum romanzoffianum Queen Palm Evergreen 50’ x 20’ 19,335 3’ Bauhinia blakeana Hong Kong Orchid Tree Deciduous 20’ x 20’ 1,966 3’ • Bauhinia variegata ‘Purpurea’ Purple Orchid Tree Semi 30’ x 20’ 1,966 5’ • Betula nigra River Birch Deciduous 80’ x 50’ 3,865 8’ • Brachychiton populneus Bottle Tree Evergreen 40’ x 30’ 82,964 5’ • Callistemon citrinus Lemon Bottlebrush Evergreen 15’ x 10’ 318 3’ • Callistemon viminalis Weeping Bottlebrush Evergreen 30’ x 20’ 251 5’ • Calocedrus decurrens Incense Cedar Evergreen 60’ x 30’ 1,325 5’ Calodendron capense Cape Chestnut Semi 40’ x 40’ 26,053 5’ • Cassia leptophylla Gold Medallion Semi 20’ x 30’ 1,324 5’ • Cedrus deodara Deodar Cedar Evergreen 40’ x 80’ 5,204 8’ Celtis sinensis Chinese Hackberry Deciduous 50’ x 50’ 731 8’ Cercis canadensis ‘Forest Pansy’ Eastern Redbud Deciduous 20’ x 15’ 95 3’ • • Cercis reniformis ‘Alba’ Texas White Redbud Deciduous 20’ x 20’ 95 3’ • • Chionanthus retusus Chinese Fringe Tree Deciduous 20’ x 15’ No Data Available 3’ • • Chitalpa tashkentensis Chitalpa Deciduous 25’ x 25’ No Data Available 3’ • Cinnamomum camphora Camphor Tree Evergreen 50’ x 60’ 7,215 8’ Fraxinus velutina Modesto Ash Evergreen 50’ x 40’ 858 5’ • Ficus benjamina Weeping Fig Evergreen 30’ x 30’ 7,357 3’ Geijera parviflora Australian Willow Evergreen 40’ x 25’ 60,008 5’ Ginkgo biloba Maidenhair Tree Deciduous 60’ x 40’ 2,678 5’ • Hymenesporum flavum Sweetshade Evergreen 40’ x 20’ No Data Available 3’ • Jacaranda mimosifolia Jacaranda Deciduous 40’ x 50’ 3,431 5’ • Koelreuteria bipinnata Chinese Flame Tree Deciduous 50’ x 50’ 952 8’ • • Koelreuteria paniculata Goldenrain Tree Deciduous 25’ x 25’ No Data Available 5’ • • Lagerstroemia indica Crape Myrtle Deciduous 25’ x 20’ 741 3’ • • Laurus nobilis Grecian Laurel Evergreen 40’ x 30’ No Data Available 5’ Liquidambar styraciflua ‘Rotundiloba’ Round-Leafed Sweetgum Deciduous 60’ x 35’ 18,824 8’ • Liriodendron tulipifera Tulip Tree Deciduous 80’ x 40’ 5’ • • Magnolia grandiflora Magnolia Evergreen 60’ x 40’ 16,465 8’ • Magnolia grandiflora ‘Russett’ Russett Magnolia Evergreen 20’ x 15’ No Data Available 3’ • Magnolia grandiflora ‘St. Mary’ St. Mary Magnolia Evergreen 30’ x 20’ No Data Available 3’ •
Table 4-14: Tree Pallette
CHAPTER 4 | RECOMMENDATIONS 103 Scientific Name Common Name Type Mature H x W Carbon Sequestration (lbs) (Assumes equal perimeters) Minimum Parkway Requirements (feet) Flowering Tree Fall Color Magnolia grandiflora ‘Majestic Beauty’ Majestic Beauty Magnolia Evergreen 40’ x 20’ No Data Available 5’ • Magnolia grandiflora ‘Samuel Sommer’ Samuel Sommer Magnolia Evergreen 40’ x 30’ No Data Available 5’ • Melaleuca linariifolia Flaxleaf Paperbark Evergreen 30’ x 30’ No Data Available 5’ • Melaleuca quinquenervia Cajeput Tree Evergreen 40’ x 60’ 1,809 5’ Metasequoia glyptostroboides Dawn Redwood Deciduous 80’ x 30’ No Data Available 8’ • Metrosideros excelsus New Zealand Christmas Tree Evergreen 40’ x 40’ 26,539 5’ • Nyssa sylvatica Sour Gum Deciduous 50’ x 25’ No Data Available 5’ • Pinus canariensis Canary Island Pine Evergreen 80’ x 50’ 3,366 8’ Pistachia chinensis Chinese Pistache Deciduous 40’ x 40’ No Data Available 5’ • Pittosporum phillyraeoides Willow Pittosporum Evergreen 50’ x 15’ No Data Available 3’ Platanus mexicana Sycamore Alamo Deciduous 50’ x 25’ No Data Available 5’ • Platanus racemosa Sycamore California Deciduous 60’ x 40’ 3,682 8’ • Platanus acerifolia Sycamore London Plane Deciduous 60’ x 40’ No Data Available 8’ • Podocarpus gracilior Fern Pine Evergreen 60’ x 60’ 2,239 8’ Pyrus betulaefolia ‘Southworth’ Dancer Pear Deciduous 25’ x 20’ No Data Available 3’ • • Pyrus calleryana var. Pear Deciduous 35’ x 25’ 24,302 3’ • • Quercus agrifolia Coast Live Oak Evergreen 70’ x 100’ 6,069 8’ Quercus engelmannii Mesa Oak Evergreen 60’ x 80’ No Data Available 8’ Quercus ilex Holly Oak Evergreen 70’ x 70’ 8,728 5’ Quercus rubra Northern Red Oak Evergreen 90’ x 80’ No Data Available 8’ Quercus suber Cork Oak Evergreen 100’ x 100’ No Data Available 8’ Quercus virginiana Southern Live Oak Evergreen 60’ x 100’ No Data Available 8’ Rhus lancea African Sumac Evergreen 30’ x 30’ No Data Available 5’ Sapium sebiferum Chinese Tallow Tree Deciduous 40’ x 35’ No Data Available 5’ • Sophora japonica Japanese Pagoda Tree Deciduous 40’ x 40’ No Data Available 5’ Tabebuia chrysotricha Golden Trumpet Tree Evergreen 25’ x 20’ No Data Available 3’ • Tabebuia ipe Lavender Bloom Deciduous 30’ x 30’ No Data Available 5’ • Tipuana tipu Tipu Tree Semi 50’ x 60’ No Data Available 8’ • Tristania conferta Brisbane Box Evergreen 60’ x 40’ No Data Available 5’ • Tristania laurina Swamp Myrtle Evergreen 20’ x 10’ No Data Available 3’ Ulmus parvifolia Chinese Elm Evergreen 60’ x 70’ 7,441 5’ • Washingtonia robusta Mexican Fan Palm Evergreen 90’ x 15’ 43,778 3’ Zelkova serrata Sawleaf Zelkova Deciduous 40’ x 40’ No Data Available 8’ •
Vehicle Miles Traveled Reduction Analysis
Reducing vehicle miles traveled (VMT) is an official goal of the U.S. Government as it is stated in sections of the Clean Air Act (CAA), the 1993 Climate Change Action Plan (CCAP), and in the Congestion Mitigation Air Quality Improvement Program (CMAQ). Similar goals are also included in both the Intermodal Surface Transportation Efficiency Act (ISTEA) and the Transportation Equity Act for the 21st Century (TEA-21). With the adoption of Senate Bill (SB) 375 in 2008, California became one of the first states in the country to establish a comprehensive policy aimed at reducing VMT in an attempt to reduce the greenhouse gas (GHG) emissions. Achieving VMT reduction goals also relies on major behavioral transportation changes for Californians, making safe, comfortable, and convenient active transportation infrastructure that much more important.
Identifying opportunities to reduce VMT to parks and open spaces in a city like Placentia, where 93 percent of survey respondents claim they drive to parks, is crucial to address regional, state-wide, and national goals for a healthy future. As discussed in the previous section, this Plan identified multi-use path opportunities throughout the City that would provide safe and comfortable connections to parks, as well as safe and comfortable connections to other destinations in Placentia and areas beyond the boundaries of the City. These 12 projects totaled approximately 11 miles of multi-use paths which are widely considered the most favored and beloved facilities for recreation and transportation purposes.
This Plan used a tool developed by the California Air Resources Board to estimate VMT reduction based on walking and bicycling infrastructure improvements in a given city. The infographic to the right depicts the reduction in VMT’s using the proposed 12 multi-use paths identified in this Plan. Although the tool is an approximation of VMT reduction, it provides insight to the impact just 12 projects may have in Placentia.
Encouraging people to walk, bike, or scooter to their nearest park is one crucial component in the overall objective of reducing VMT and GHG. By implementing facilities such as these multi-use paths, Placentia will be on its way to truly making a positive impact on the environment and resident’s lives.
11 Miles of proposed multi-use paths
171,858 VMT
reduced with proposed multi-use paths
3,051,197 lbs
GHG emissions avoided
PLACENTIA OPEN SPACES AND URBAN GREENING MASTER PLAN 104
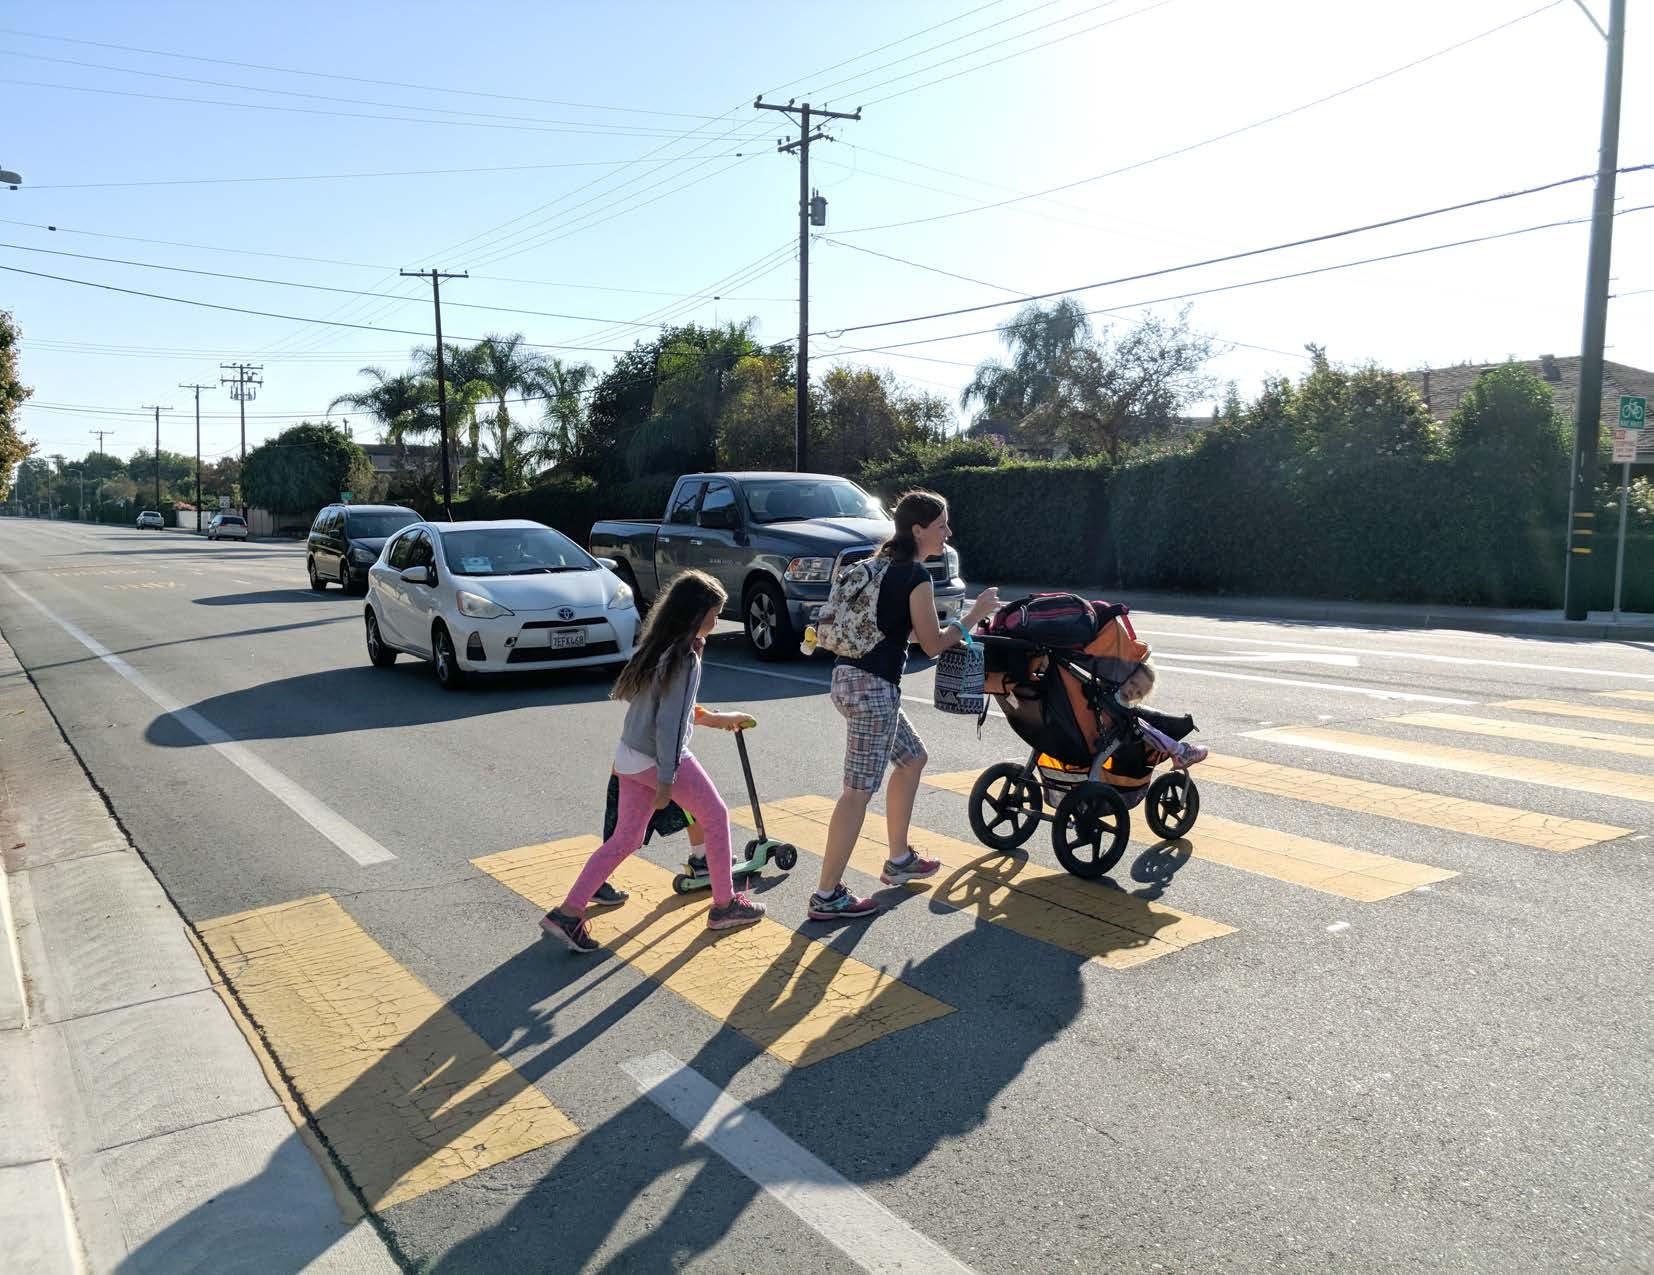
Green Street Toolbox
The Green Street Toolbox is a guide that can be used to design a multi-faceted street or urban trail. The toolbox is organized by the following four design elements: Urban Forestry, Urban Runoff, Multi-Modal Connectivity, and Urban Open Space.

The following pages identify where the various improvements and solutions can be applied. It is important to recognize the existing right-of-way found throughout many of the neighborhoods in Placentia when using this guide. Many of Placentia’s streets are already built-out, limiting certain toolbox elements and designs.
Building Interface Zone
The building interface zone is the space immediately adjacent to a building. This space typically contains outdoor seating, merchandise displays, and other features that may attract people to enter the business.
Excess ROW
The excess ROW zone is excess space located adjacent to the pedestrian zone. This zone is found along streets with wide setbacks or locations adjacent to open space.
Pedestrian Zone
The pedestrian zone is the paved space in the right-of-way dedicated to pedestrians directly adjacent to the building interface zone or excess ROW zone. Sidewalks are constructed within this zone.
Parkway Zone
The parkway zone is the space between the sidewalk and the curb edge. It serves as a buffer between people on a sidewalk and parked or traveling vehicles.
On-Street Parking Zone
This zone is the space used for on-street parking. Pedestrian curb extensions (also known as bulbouts) can be constructed within this space at intersections or midblock crossings. Curb extensions reduce the crossing distance from one side of the street to another while also providing improved pedestrian visibility to drivers.
Bicycle Zone
The bicycle zone is the space in the right-of-way that is used for bicycle facilities such as bicycle lanes or separated bikeways.
Travel Lane Zone
The travel lane zone is the space dedicated for vehicular traffic.
Center Median
The center median separates opposing lanes of traffic on roadways. This space can be delineated though road striping or as a raised curb with decorative paving or vegetation.
PLACENTIA OPEN SPACES AND URBAN GREENING MASTER PLAN 106
What are the Elements of the Toolkit?
Urban Forestry-Green Infrastructure
This element addresses improvements related to improving the urban tree canopy and related environmental benefits. These improvements should be coordinated with the urban runoff element as much as possible to maximize benefits.
Urban Runoff
The urban runoff element addresses improvements as they relate to capturing water. These strategies can be incorporated into sidewalks, parkways, or center medians.
Multi-Modal Connectivity
Multi-modal connectivity enhances the pedestrian and bicyclist experience by providing a variety of safe and comfortable facilities such as crosswalks, lighting, and wayfinding signage.
Urban Open Space
Urban open spaces may include canyons, parks, plazas, access to existing trails, or excess right-of-way. This element describes how open spaces can be placed in the public realm and how connections to existing trails can be improved.

CHAPTER 4 | RECOMMENDATIONS 107 Excess ROW / Building Interface Zone Pedestrian Zone On-Street Parking Zone Travel Lane Zone Center Median Bicycle Zone Parkway Zone
Urban Forestry-Green Infrastructure Element


Parkway, On-Street Parking with Curb Extensions and Center Median Zones
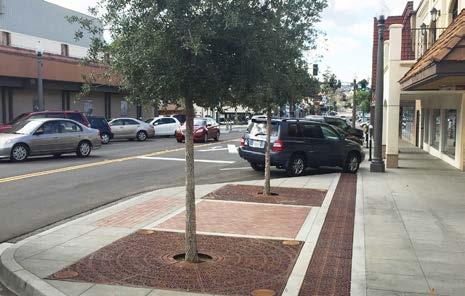
Recommendations for the Urban Forestry-Green Infrastructure Element include drought-tolerant, evergreen, upright trees with canopies that provide adequate shade. Native, drought-tolerant shrubs or ground cover with mulch are also recommended in all parkway zones, curb extensions, and center medians. Green infrastructure such as bioswales and rain gardens are highly recommended to be included to maximize environmental benefits.

PLACENTIA OPEN SPACES AND URBAN GREENING MASTER PLAN 108
Ground cover in a midblock curb extension
Bioswale designed as center median
Small tree in a curb extension
Trees planted in rain garden
Small to large canopy tree
Bioswale with appropriate trees and vegetation
Urban Runoff Element
Pedestrian Zone
The Urban Runoff Element in the Pedestrian Zone recommends installing hardscape features that improve water infiltration. Permeable pavers or asphalt are a few examples.
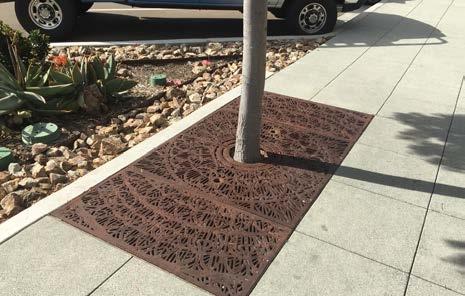


Parkway, On-Street Parking Zone, and Center Median
The Urban Runoff Element in this zone recommends the use and/ or installation of infiltration basins to capture and filter water. Infiltration basins should be planted with vegetation that tolerates both wet and dry conditions. For areas that don’t have a Parkway Zone, a sidewalk with permeable pavers in conjunction with trees installed with a tree grate can improve water infiltration.

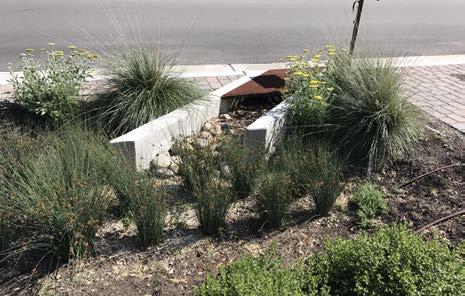
CHAPTER 4 | RECOMMENDATIONS 109
Permeable pavers
Permeable asphalt
Permeable pavers
Curb openings draining to bioretention or infiltration areas
Infiltration basin with bioretention soils and subsurface drain
Small to large tree with tree grate
Multi-Modal Connectivity
Building Interface Zone
In the Building Interface Zone, multi-modal connectivity recommendations include seating, bicycle racks, bicycle lockers, wayfinding signage, or pedestrian scale lighting.
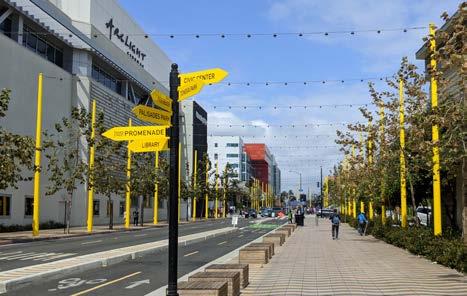
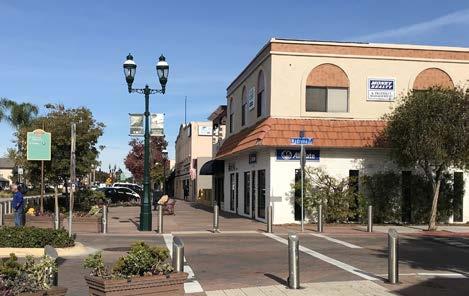


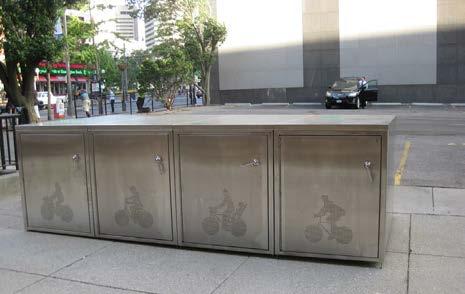
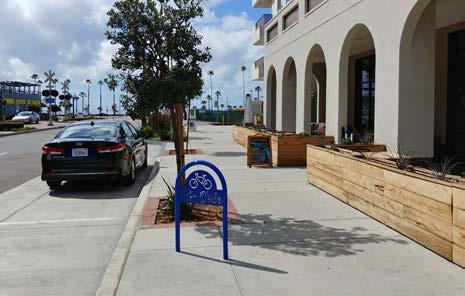
Parkway Zone
Multi-Modal Connectivity elements in the Parkway Zone includes public art, wayfinding signage, seating, transit amenities, and pedestrian scale lighting.
PLACENTIA OPEN SPACES AND URBAN GREENING MASTER PLAN 110
Public seating
Bicycle rack
Bicycle lockers
Transit facilities with shelters and seating Wayfinding signage
Pedestrian-scale lighting
Street Crossing Options
Street crossing options to improve multi-modal connectivity include enhanced crosswalks, curb extensions, median refuges, or enhanced crossing signals such as Rectangular Rapid Flashing Beacons (RRFB) or Pedestrian Hybrid Beacons (PHB).


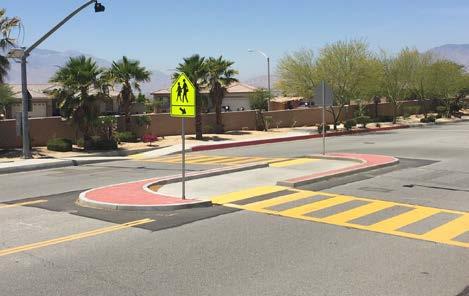
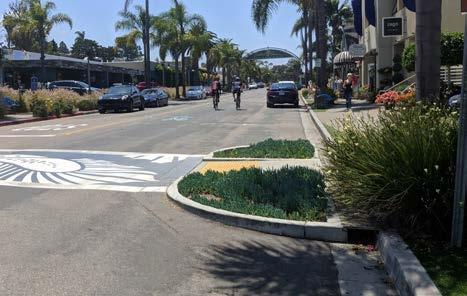
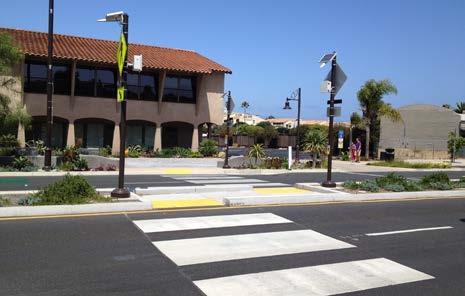

CHAPTER 4 | RECOMMENDATIONS 111
Median refuge
Enhanced marked crosswalk Staggered crossing with school zone crosswalks
Curb extension with enhanced crosswalk
Pedestrian Hybrid Beacon (PHB)
Rectangular Rapid Flashing Beacon (RRFB)
Bicycling Zone
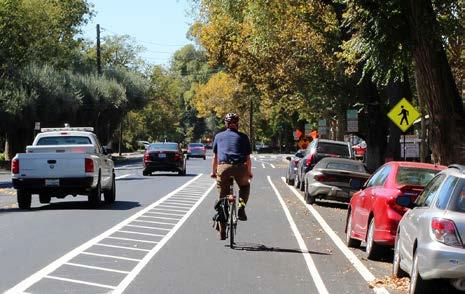
The following bicycle facilities can be designed and installed throughout Placentia. The specific facility type will vary from street to street depending on the street’s existing right-of-way, traffic volumes, traffic speeds, and land use.
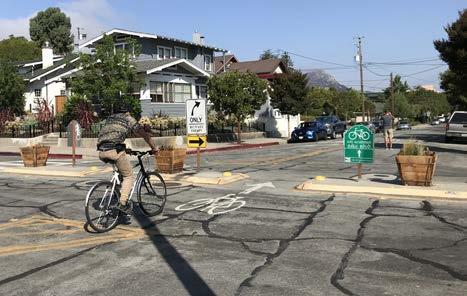

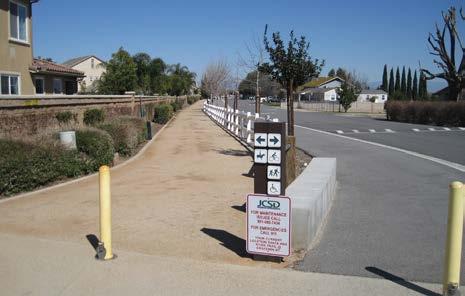


PLACENTIA OPEN SPACES AND URBAN GREENING MASTER PLAN 112
Separated bikeway
Multi-use path
Buffered bicycle lane
Bicycle lane
Bicycle route
Bike boulevard
Urban Open Space
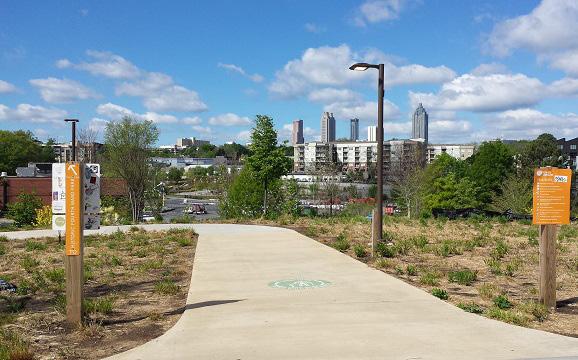
The Urban Open Space element includes a variety of amenities and enhancements based on the surrounding context. Options include multi-use paths, DG walkways, trailhead signage, wayfinding signage, green infrastructure, trees, par course equipment, or small playground features.
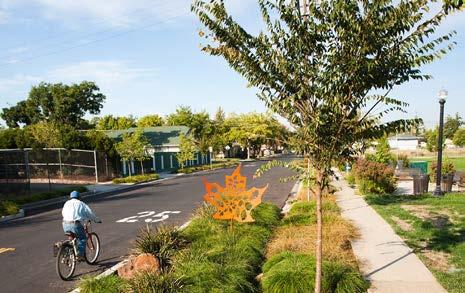


CHAPTER 4 | RECOMMENDATIONS 113
DG walkways
Multi-use path
Trailhead signage
Wayfinding signage
Green infrastructure
Trees
Recommended Programs and Partnerships
The City’s Community Services Department already offers an incredible list of recreation programs and activities, most of which can be found in their quarterly publication, the Placentia Palm Quarterly. The City also offers youth programs through the Youth Positive Activities and Recreation for Kids Program (P.A.R.K.). P.A.R.K is offered at four locations during the school year and include arts and crafts, excursions, homework assistance, sports, and other supervised activities. The City also has several partnerships with local groups and organizations such as the Friendly Center, Placentia Community Foundation, Placentia Boys and Girls Club, Placentia Teen Center, St. Jude Hospital, and Lot 318. The following section describes programs that take place throughout the state of California and the country that Placentia can explore pursuing related to parks and open space, urban forestry, and multi-modal transportation.
Tree Planting Program
The City recently adopted an urban forest management program and is in the process of developing a tree ordinance in support of increasing their urban tree canopy. Programs throughout the state and nation allow residents to sign up for a street tree if they have a parkway or front yard available. Available trees are based off of a list of approved trees that have been vetted by an arborist to thrive in the climate and context of Placentia.
Apply for Tree City USA
The Tree City USA program began in 1976 as a nationwide movement to provide the framework necessary for communities to manage and expand their urban tree canopy. As of 2019, more than 3,400 communities have achieved the Tree City USA status. Placentia can achieve this goal by meeting the four core standards established by the program which include: maintaining a tree board or department, having a community tree ordinance, spending at least $2 per capita on urban forestry, and celebrating Arbor Day. Placentia already has an annual program as part of “Love Placentia” which is a service day in association with Arbor day.
Public Health Partnerships
Partnering with local public health organizations such as hospitals and non-profit groups may provide several opportunities to improve the community’s access to parks as well as encourage residents to get active and participate in outdoor recreation. Placentia has already partnered with groups such as the Community Action Partnership of Orange County and St. Jude Hospital. Through this partnership, the City received nutrition education and physical activity opportunities in the neighborhoods around Title I schools. This partnership also provided funding for outdoor exercise equipment in parks and new playground features.
There are many other kinds of public health partnerships throughout the state and country that Placentia can explore as well. Programs such as the Pittsburgh Parks Conservancy Community, Family, School, and Summer Camp educate people of all ages and backgrounds about the value of healthy habitats and ecosystems, and the relationship between humans and nature. Another awardwinning program is the St. Croix River Valley PowerUp initiative. This programs was launched in 2013 with a major focus on youth healthy living. PowerUp educated youth on the importance of being outdoors, playing in parks, hiking, bicycling, and walking.
Prescribing Vitamin N
New York Times best-seller Richard Louv published a book called Vitamin N in which he describes 500 activities parents can organize and participate in to connect their children with the natural world. Richard Louv’s acclaimed efforts have inspired environmental and health organizations to participate in what’s called Prescribing Vitamin N to people to encourage them to connect with nature. The City can explore partnerships with local organizations, health officials, businesses, schools, etc. that are open to participating in nature-focused activities such as visiting and playing in local parks.
Placentia can also coordinate a Vitamin N Challenge. This familyfriendly activity was created by the Children & Nature Network to get people outside and to interact with the natural world.
PLACENTIA OPEN SPACES AND URBAN GREENING MASTER PLAN 114
 City of Long Beach Housing and Neighborhood Services Bureau
Foundations, Philanthropies, and Non-Profit Organizations
Orange County is fortunate to be home to several dozen environmental and recreation foundations, philanthropies, and non-profit organizations whose mission is to educate, protect, and encourage people. The City can explore meaningful partnerships with the following groups to provide Placentia residents additional resources related to parks, open space, trails, nature, and recreation:
• Back to Natives Restoration
• Boys & Girls Clubs of Brea-Placentia-Yorba Linda

• California Cultural Resources Preservation Alliance, Inc.
• Chino Hills State Park Interpretive Association
• Earthroots Field School, Inc.
• Environmental Nature Center
• Friendly Center

• Friends of Harbors, Beaches and Parks, Inc.
• Goin Native Therapeutic Gardens
• Hills For Everyone
• Inside the Outdoors Foundation
• Lot 318
• Orange County Conservation Corps
• Orange County Community Foundation
• Placentia Community Foundation
• Playworks Southern California
• St. Jude Medical Center
• The Bicycle Tree
• The Ecology Center
• Trails4All
• Yorba Linda-Placentia Family YMCA
PLACENTIA OPEN SPACES AND URBAN GREENING MASTER PLAN 116
National Take a Walk in the Park Day
National Take a Walk in the Park Day is observed annually on March 30th. This event encourages people of all ages to walk to and throughout their local parks.
Participate in National Bike Month
Since 1956, communities from all over the country have celebrated National Bike Month as a chance to showcase the many benefits of bicycling as well as to encourage people of all ages and backgrounds to bicycle more often. The biggest event that takes place during National Bike Month is Bike to Work Day. Local business, nonprofits, and entire city agencies participate by either hosting pit stops where bicyclists can stop to gather healthy food and drinks, or by simply bicycling to work.
Placentia is encouraged to partner with OCTA on national Bike Month announcements, promotion, and events.

Host a Ciclovia, Open Streets, and Other Signature Events
A Ciclovía (also ciclovia or cyclovia in English) is a Spanish word that translates into “bicycle path” and is used to describe a temporary event where a street(s) is closed to vehicles for use by people and non-motorized transportation. Ciclovias and open streets events are celebrations of livable streets and communities, encouraging citizens and businesses to get out in the street and enjoy their city through active participation. Ciclovias have gained considerable popularity in the United States in the past five years. While all open streets events are alike in their creation of a people-oriented, carfree space, they are otherwise unique. In some cities, the event occurs once or twice a year, while in others it occurs every Saturday or Sunday throughout the entire summer. Open streets events often have a theme of health, exercise, and active transportation, and include groups promoting free, healthy activities stationed along the route.
Orange County has participated in demonstration projects in collaboration with SCAG Go Human Events over the last few years. Several of these events were conducted during the planning and design phases of the OC Loop connections.

CHAPTER 4 | RECOMMENDATIONS 117
Fairmont Connector, Demonstration Project by OCTA and SCAG
Fairmont Connector, Demonstration Project by OCTA and SCAG
Evolving State of Mobility
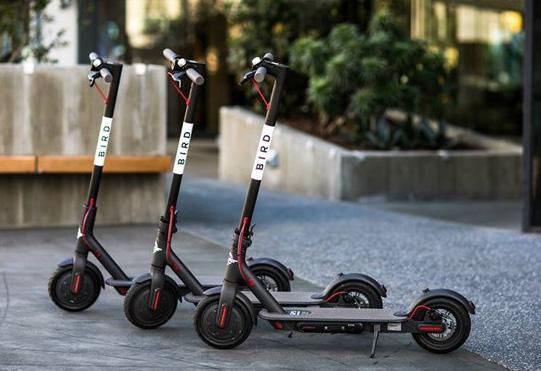
During the development of this Plan, many cities throughout the country, especially in Southern California, were experiencing a new way of transportation: bike-share and scooter-share. Even though bike-share had already been established in other major cities such as New York and Washington D.C., these mobility options were relatively new in the region. Even more remarkable was the rise of dockless bike-share and scooter-share. Several companies, both nationally and abroad, have created diverse fleets of mobility options that rely on today’s technology.

Transportation options and services throughout communities and large cities are in a continuous evolving state. Thankfully, there are several resources available by notable groups that help breakdown the complexity of embracing these mobility options. The National Association of City Transportation Officials (NACTO), PeopleForBikes, and the Better Bike Share Partnership are a few examples of national resources Placentia can refer to if they wish to explore these mobility options for their community. Placentia can also seek OCTA’s suggested policies document published in 2018. This document provides guidance to local agencies considering shared active transportation permitting programs.
These resources provide valuable information on the successes and failures of new mobility products and programs, and how it’s affected those communities. Understanding the overall balance of infrastructure, mobility devices, technology, and programs, will be key to establishing a successful environment where all people have the option to walk, hike, or ride to their destinations.
PLACENTIA OPEN SPACES AND URBAN GREENING MASTER PLAN 118
Dockless bikes
Electric dockless scooters

05
Funding
Potential Funding Sources
The following chapter identifies potential funding opportunities for design, implementation, and maintenance for parks, open space, and transportation-related projects. Table 5-1 provides this information and is arranged into federal, state, local, and private categories. The right side of the table lists both typical and atypical approaches to address each funding source. Many funding sources can be accessed through atypical project approaches by combining several categories or elements of a project into one application.
The table makes it clear that there are many potential funding opportunities available for cities to apply for. Placentia is encouraged to partner with other groups to develop comprehensive and competitive applications to increase their chances of receiving funding. The Placentia Community Foundation, Lot 318, The Friendly Center, or St. Jude Medical Center are all excellent groups, with which the city has partnered in the past, and should continue their relationship on future funding and grant applications.
The city should also be aware that whenever federal funds are used for park, bicycle, and pedestrian projects, a certain level of state and/ or local matching funding is generally required. State funds are often available to local governments on similar terms. Almost every implemented project or program in the United States has had more than one funding source and it often takes a large level of effort and coordination to compile the various sources together.
The information provided in this chapter is relevant as of the completion of this plan. It should be noted that current funding sources may be depleted, or that new sources may become available. The city should coordinate and encourage staff to periodically review these funding sources and verify their viability.

PLACENTIA OPEN SPACES AND URBAN GREENING MASTER PLAN
Table 5-1: Potential Funding Sources
FINDING, FRAMING, AND FUNDING A PROJECT FUNDING USES
CHAPTER 5 | FUNDING 121
FUNDING SOURCE FUNDING ORIGIN Typical Approaches Implementation First and Last Mile Atypical Approaches CIP Development Maintenance and Operations Urban Forestry Back to Nature Low Impact Development Culture and History Federal Funding Sources Land and Water Conservation Fund (LCWF) U.S. National Park Service/California Department of Parks and Recreation • • • Urban Community Forestry Program U.S. National Park Service • • Surface Transportation Program (STP) Federal Highway Administration (FHWA)/ Caltrans • • • • Highway Safety Improvement Program (HSIP) • • • • Transportation Alternative Program (TAP) Federal Highway Administration (FHWA) • • • • Recreational Trails Program Federal Highway Administration (FHWA)/ Regional agency may also contribute • • • • • EPA Brownfields Clean Up and Assessments U.S. Environmental Protection Agency • • • • Sustainable Communities Planning Grant and Incentive Program U.S. Dept. of Housing and Urban Development (HUD) • Urban Revitalization and Livable Communities Act • • Community Development Block Grants • • • • ACHIEVE, Communities Putting Prevention to Work, Pioneering Communities Center for Disease Control and Prevention • • Urban and Community Forest Program Department of Agriculture, Forest Service • • • • • Community Forest and Open Space Conservation • • • • •
TABLE 5-1:Potential Funding Sources (cont.)
FINDING, FRAMING, AND FUNDING A PROJECT FUNDING USES
122
PLACENTIA OPEN SPACES AND URBAN GREENING MASTER PLAN
FUNDING SOURCE FUNDING ORIGIN Typical Approaches Implementation First and Last Mile Atypical Approaches CIP Development Maintenance and Operations Urban Forestry Back to Nature Low Impact Development Culture and History Choice Neighborhoods Implementation Grants Department of Housing and Urban Development, Office of Public and Indian Housing • • • • • Safe Routes to School, Mini-grants National Center for Safe Routes to School and Caltrans • • • Metropolitan and Statewide and Nonmetropolitan Transportation Planning Federal Transit Administration (FTA) • • • • Urbanized Area Formula Grants • • • • Bus and Bus Facilities Formula Grants • • Enhanced Mobility of Seniors and Individuals with Disabilities • • • Formula Grants for Rural Areas • • • TOD Planning Pilot Grants • • • •
TABLE 5-1:Potential Funding Sources (cont.)
FINDING, FRAMING, AND FUNDING A PROJECT FUNDING USES
CHAPTER 5 | FUNDING 123
FUNDING SOURCE FUNDING ORIGIN Typical Approaches Implementation First and Last Mile Atypical Approaches CIP Development Maintenance and Operations Urban Forestry Back to Nature Low Impact Development Culture and History State Funding Sources Land and Water Conservation Fund (LCWF) California Department of Parks and Recreation (DPR) • • • • Statewide Park Program Prop 84 Round 2 • • • Recreational Trails Program • • • • • • Proposition 117 - Habitat Conservation • • • • • Nature Education Facilities • • • • Watershed Program • • • • Parks and Water Bond Act of 2018 - Prop 68 • • • • • • Stormwater Flood Management Prop. 1E • • • • • • Roberti-Z’Berg-Harris (RZH) Grant ProgramProp 40 • • • • • • Aquatic Center Grants Department of Boating and Waterways •
TABLE 5-1:Potential Funding Sources (cont.)
FINDING, FRAMING, AND FUNDING A PROJECT FUNDING USES
PLACENTIA OPEN SPACES AND
GREENING
PLAN 124
URBAN
MASTER
FUNDING SOURCE FUNDING ORIGIN Typical Approaches Implementation First and Last Mile Atypical Approaches CIP Development Maintenance and Operations Urban Forestry Back to Nature Low Impact Development Culture and History Community Based Transportation Planning, Environmental Justice and Transit Planning California Department of Transportation (Caltrans) • • • Active Transportation Planning Grants (ATP) • • • • Regional Improvement Program • • • Safe Routes to School Programs(SR2S) • • • Traffic Safety Grants California Office of Traffic Safety • • • Local Partnership Program - Competitive and Formulaic California Transportation Commission (SB 1 funds) • • • Coastal Conservancy Grants California Coastal Conservancy • • • • • • Non-point Source Pollution, Watershed Plans, Water Conservation (Props 13, 40, 50 and 84) State Water Resources Control Board • • • • Sustainable Communities Planning, Regional SB 375 Strategic Growth Council/Dept of Conservation • • • • • • Environmental Enhancement and Mitigation (EEMP) California Natural Resources Agency and Caltrans • • • California River Parkways and Urban Streams Restoration Grant California Natural Resources Agency/ Department of Water Resources • • • • • Strategic Growth Council Urban Greening Program California Natural Resources Agency • • • • • California Cap and Trade Program Cal EPA, Air Resources Board • • • • • Urban Forestry Program (Leafing Out, Leading Edge and Green Trees Grants) California Department of Forestry and Fire Protection (CAL FIRE) • • •
TABLE 5-1:Potential Funding Sources (cont.)
FINDING, FRAMING, AND FUNDING A PROJECT FUNDING USES
CHAPTER 5 | FUNDING 125
FUNDING SOURCE FUNDING ORIGIN Typical Approaches Implementation First and Last Mile Atypical Approaches CIP Development Maintenance and Operations Urban Forestry Back to Nature Low Impact Development Culture and History Local Funding Sources Special Habitat Conservation Programs Regional MPOs/Local Cities • • • • Special Parks and Recreation Bond Revenues • • • • • • • • Special Transportation Bonds and Sales Tax Initiatives • • • • • • • • Advertising Sales/Naming Rights Local Jurisdictions • • • • • Community Facilities District (CFD) • • • • • • • • Infrastructure Financing District (IFD) • Facilities Benefit Assessment District (BFA) • Easement Agreements/Revenues • • • • Equipment Rental Fees • • • • • Facility Use Permits Fees • • • • • Fees and Charges/Recreation Service Fees • • • • • Food and Beverage Tax • • • • •
PLACENTIA OPEN SPACES AND URBAN GREENING MASTER PLAN
TABLE 5-1:Potential Funding Sources (cont.)
FINDING, FRAMING, AND FUNDING A PROJECT FUNDING USES
126
FUNDING SOURCE FUNDING ORIGIN Typical Approaches Implementation First and Last Mile Atypical Approaches CIP Development Maintenance and Operations Urban Forestry Back to Nature Low Impact Development Culture and History General Fun Local Jurisdictions • • • • • • • • General Obligation Bonds • • • • • • • • Intergovernmental Agreements • • • • • • • • Lease Revenues • • • • • • • Measure U • • • • • Mello Roos Districts • • • • • • • • Residential Park Improvement Fees • • • • • • • Park Impact Fees • • • • • • • Traffic Impact Fees • • • • • • • • In-Lieu Fees • • • • • • • Pouring Rights Agreements • • • • • • Private Development Agreements • • • • • • • • Surplus Real Estate Sale Revenues • • • • • •
TABLE 5-1:Potential Funding Sources (cont.)
FINDING, FRAMING, AND FUNDING A PROJECT FUNDING USES
CHAPTER 5 | FUNDING 127
FUNDING SOURCE FUNDING ORIGIN Typical Approaches Implementation First and Last Mile Atypical Approaches CIP Development Maintenance and Operations Urban Forestry Back to Nature Low Impact Development Culture and History Revenue Bond Revenues Local Jurisdictions • • • • • • • Sales Tax Revenues • • • • • • • • Transient Occupancy Tax Revenues • • • • • • • • Wastewater Fund Reserves • • • • Utility Taxes • • • • • • • Business Improvement Districts (BID) Non-profits, Business Organizations or City • • • • • • Maintenance Assessment Districts (MAD) • Property Based Improvement Districts (PBID) Landscape Maintenance District (LMD) • Various Sports Field Grants Various Agencies, Foundations and Corporations • • • • Community Health Initiatives Kaiser Permanente • • • • America’s Historical Planning Grants National Endowment for the Humanities • • • Corporate Sponsorships Private Corporations • • • • • • • • Private Sector Partnerships • • • • • • • •
PLACENTIA OPEN SPACES AND URBAN GREENING MASTER PLAN
TABLE 5-1:Potential Funding Sources (cont.)
FINDING, FRAMING, AND FUNDING A PROJECT FUNDING USES
128
FUNDING SOURCE FUNDING ORIGIN Typical Approaches Implementation First and Last Mile Atypical Approaches CIP Development Maintenance and Operations Urban Forestry Back to Nature Low Impact Development Culture and History Non-Profit Partnerships Non-Profit Corporations • • • • • • • • Foundation Grants Private Foundations • • • • • • • • Private Donations Private Individuals • • • • • • • • Irrevocable Remainder Trusts • • • • • Targeted Fund-raising Activities Local Jurisdictions • • • • • • • •


 City of Long Beach Housing and Neighborhood Services Bureau


