MARCH
ACTIVE TRANSPORTATION Plan
2020
Acknowledgements
City of Rialto
Savat Khamphou, Director of Public Works/City Engineer
Katie Nickel, Public Works Program Coordinator
KTUA


Mike Singleton, Principal
Joe Punsalan, Associate Principal
Jacob Leon, Associate
Juan Alberto Bonilla, Senior Planner
Jorge Nozot, Planner
Sureena Basra, Planner
KPA
Cindy Suh, Outreach Project Manager
Thelma Herrera, Outreach Support
1 2 3
4 5 6
Community Engagement 69 Community Engagement Overview 70 Community Engagement Strategies 70 Outreach Materials 71 Technical Advisory Committee 73 Community Workshops and Pop-Up Events 74 Survey Summary 76 Recommendations 79 Recommendations Overview 80 Bicycle and Pedestrian Treatments 80 Bicycle Recommendations 90 Ranking methodology 90 Recommended Bikeway Projects 96 Bikeway Project Phasing 192 New Mobility 195 Safe Routes to Parks & First and Last Mile to Transit Recommendations 198 Programs 240 Funding 249 Potential Infrastructure Funding Sources 250 Introduction 1 Purpose 2 Study Area 2 Active Transportation Trends 3 Bicycling and Walking Benefits 4 Planning Context 6 State of Practice 10 Existing Conditions 21 Overview 22 Demographics 22 Transportation Mode Share 23 Existing Land Use and Activity Centers 24 Roadway Conditions 26 Existing Bicycle Facilities and Current CIP Projects 28 Transit Routes and Stops 30 Safe Routes to School 32 Analysis 35 Bicycle and Pedestrian Propensity Model 36 Level of Traffic Stress (LTS) 38 Safe Routes to Parks 40 First and Last Mile Assessment 50 Transit Needs 61 Social Equity 64 TABLE OF CONTENTS
LIST OF FIGURES
RIALTO ACTIVE TRANSPORTATION PLAN II
Figure 1-1: Location Map 2 Figure 2-1: Land Use 25 Figure 2-2: Street Classification 26 Figure 2-3: Speed Limits 27 Figure 2-4: Existing and Previously Proposed Bikeways 29 Figure 2-5: Transit Routes and Stops 31 Figure 2-6: Fitzgerald Elementary Suggested Walking Routes to School 32 Figure 2-7: Quarter-mile buffer around schools in Rialto 33 Figure 3-1: Bicycle and Pedestrian Propensity Model 37 Figure 3-2: Level of Traffic Stress 39 Figure 3-3: Safe Routes to Parks Zones 41 Figure 3-4: Fergusson Park Pedestrian Needs 42 Figure 3-5: Roger Birdsall Park Pedestrian Needs 43 Figure 3-6: Jerry Eaves Park Pedestrian Needs 44 Figure 3-7: Frisbie Park Pedestrian Needs 45 Figure 3-8: Flores Park Pedestrian Needs 46 Figure 3-9: Bud Bender Park and Margaret Todd Park Pedestrian Needs 47 Figure 3-10: Andreson Park and Joe Sampson Park Pedestrian Needs 48 Figure 3-11: Rialto City Park Pedestrian Needs 49 Figure 3-12: First and Last Mile Assessment 51 Figure 3-13: Carter High/Birdsall Park (1) and Renaissance at Linden (2) First and Last Mile Needs 52 Figure 3-14: Riverside at Easton (3) First and Last Mile Needs 53 Figure 3-15: Baseline at Riverside (4) First and Last Mile Needs 54 Figure 3-16: Baseline at Ayala (5) First and Last Mile Needs 55 Figure 3-17: Riverside at Foothill (6) First and Last Mile Needs 56 Figure 3-18: Metrolink Station (7) and Riverside at Merrill (8) First and Last Mile Needs 57 Figure 3-19: Riverside at San Bernardino (9) and Valley at Riverside (10) First and Last Mile Needs 58 Figure 3-20: San Bernardino at Bloomington (11) First and Last Mile Needs 59 Figure 3-21: Foothill at Linden (12) and Foothill at Cedar (13) First and Last Mile Needs 60 Figure 3-22: Vanpool Route Options 63 Figure 3-23: CalEnvrioScreen 3.0 64 Figure 3-24: US Census and American Community Survey (ACS) 65 Figure 3-25: Free and Reduced Price School Meals (FRPM) Program 67 Figure 5-1: Proposed Bikeway Projects 95 Figure 5-2: Highest Ranked Projects 99 Figure 5-3: Class II Recommended Projects 101 Figure 5-4: Class III Recommended Projects 104 Figure 5-5: Riverside Avenue (from W Foothill Blvd to W Agua Mansa Rd) Proposed Improvements 109 Figure 5-6: Riverside Avenue (from W Walnut Ave to E Etiwanda Ave) Proposed Improvements 115 Figure 5-7: Willow Avenue Proposed Improvements 117
LIST OF FIGURES (CONT.)
TABLE OF CONTENTS III
Figure 5-8: Lilac Avenue Proposed Improvements 123 Figure 5-9: Pepper Avenue (from City Limits to E Base Line Rd) Proposed Improvements 129 Figure 5-10: Foothill Boulevard Proposed Improvements 131 Figure 5-11: Sycamore Avenue Proposed Improvements 135 Figure 5-12: Bloomington Avenue Proposed Improvements 139 Figure 5-13: Eucalyptus Avenue Proposed Improvements 143 Figure 5-14: Pacific Electric ROW Trail Proposed Improvements 147 Figure 5-15: Cactus Avenue Trail Proposed Improvements 151 Figure 5-16: Walnut Avenue Proposed Improvements 159 Figure 5-17: Linden Avenue Proposed Improvements 163 Figure 5-18: San Bernardino Avenue Proposed Improvements 169 Figure 5-19: Renaissance Parkway/Easton Avenue Proposed Improvements 173 Figure 5-20: Randall Avenue Proposed Improvements 177 Figure 5-21: Locust Avenue Proposed Improvements 181 Figure 5-22: Valley Boulevard Proposed Improvements 185 Figure 5-23: Slover Avenue Proposed Improvements 187 Figure 5-24: Casmalia Street Proposed Improvements 189 Figure 5-25: Mobility Hub Example 196 Figure 5-26: Proposed Bikeshare Locations 197 Figure 5-27: Park and Bus Stop Locations 199 Figure 5-28: Alec Fergusson Park Recommended Pedestrian Improvements 201 Figure 5-29: Rodger Birdsall Park Recommended Pedestrian Improvements 203 Figure 5-30: Jerry Eaves Park Recommended Pedestrian Improvements 205 Figure 5-31: Frisbie Park Recommended Pedestrian Improvements 207 Figure 5-32: Flores Park Recommended Pedestrian Improvements 209 Figure 5-33: Bud Bender Park and Margaret Todd Park Recommended Pedestrian Improvements 211 Figure 5-34: Andreson Park and Joe Sampson Park Recommended Pedestrian Improvements 213 Figure 5-35: Rialto City Park Recommended Pedestrian Improvements 215 Figure 5-36: Carter High/Birdsall Park Recommended First and Last Mile Improvements 217 Figure 5-37: Renaissance at Linden Recommended First and Last Mile Improvements 219 Figure 5-38: Riverside at Easton Recommended First and Last Mile Improvements 221 Figure 5-39: Baseline at Riverside Recommended First and Last Mile Improvements 223 Figure 5-40: Baseline at Ayala Recommended First and Last Mile Improvements 225 Figure 5-41: Riverside at Foothill Recommended First and Last Mile Improvements 227 Figure 5-42: Metrolink Station Recommended First and Last Mile Improvements 229 Figure 5-43: Riverside at Merrill Recommended First and Last Mile Improvements 231 Figure 5-44: Riverside at San Bernardino Recommended First and Last Mile Improvements 233 Figure 5-45: Valley at Riverside Recommended First and Last Mile Improvements 235 Figure 5-46: San Bernardino at Bloomington Recommended First and Last Mile Improvements 237 Figure 5-47: Foothill at Linden and Foothill at Cedar Recommended First and Last Mile Improvements 239
LIST OF TABLES
RIALTO ACTIVE TRANSPORTATION PLAN IV
Table 2-1: Top Five Bus Routes and Bus Stop Locations 30 Table 3-1: Park Names and Locations 40 Table 3-2: Transit Stop Locations 50 Table 3-3: Eligibility for Free and Reduced Price School Meal (FRPM) Program 68 Table 5-1: Proposed Bikeway Projects 93 Table 5-2: Highest Ranked Projects 96 Table 5-3: Class II Future Recommended Projects 100 Table 5-4: Class III Recommended Projects 102 Table 5-5: Pavement Condition Index 192 Table 6-1: Federal Funding Sources 252 Table 6-2: State Funding Sources 254 Table 6-3: Local Funding Sources 258
Chapter 1 INTRODUCTION
Purpose
Study Area
Active Transportation Trends
Bicycling and Walking Benefits
Planning Context
State of Practice
PURPOSE
The comprehensive Active Transportation Plan (ATP) will provide safer, walkable streets for residents that are dependent on walking or bicycling for transportation every day in Rialto. The recommended actions included in this ATP are meant to support and increase bicycling and walking in Rialto and to enhance non-motorized travel infrastructure and create options to support the existing population. This ATP includes an inventory of existing bike and pedestrian infrastructure, identifying deficiencies, developing and prioritizing improvements and producing materials for future grant applications for implementation.
STUDY AREA
The City of Rialto is in San Bernardino County in Southern California. Rialto is bordered by the cities of San Bernardino to the east, Riverside to the south
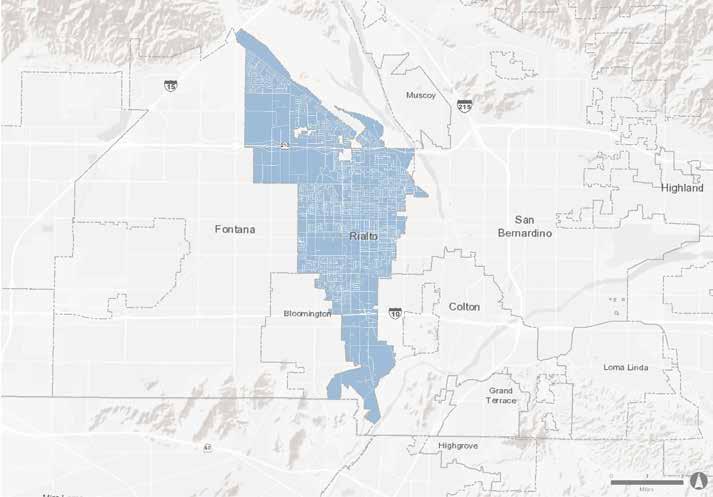
and Fontana to the west. Three major thoroughfares run through Rialto, connecting it to other regions in southern California, including Interstate 10, Historic Route 66, and California State Route 210.
According to the U.S. Census Bureau, Rialto has a population of 103,440 within its 22.35 square mile city boundary. The city has a population density of 4,437 people per square mile in 25,992 households. Rialto is primarily a Hispanic community with over 70 percent of the population identifying as Latino. In addition, over 93 percent of workers over the age of 18 in Rialto drive to work. Between 20142018, the average was 32.1 minutes
These statistics communicate the importance of improving the walking and biking infrastructure in the city. The ATP recognizes the importance of addressing barriers that prevent non-motorized trips from being safe, especially for the younger and lower-income populations who cannot afford, operate, or choose to forgo vehicle ownership.
RIALTO ACTIVE TRANSPORTATION PLAN 2
FIGURE 1-1: Location Map
ACTIVE TRANSPORTATION TRENDS
Many American cities were built on a foundation of auto-centric infrastructure, programs, and policies, but many of those same cities are embracing active transportation as a viable option to driving. Some of them are making minor improvements to support bicycling and walking, while others are working hard to undo decades of planning that privileged motor vehicle throughput and speed above all else. Environmental, health, and economic benefits reinforce the task of retrofitting American cities to make them bicycle and pedestrian friendly. The movement to make bicycling and walking viable transportation options is also supported by several recent pieces of California legislation.
Recent active transportation statistics and trends depict steps both forward and backward. For example, the Alliance for Biking and Walking released a Benchmarking Report in 2016 that communicated that there is an overall increase in walking to and from school. In 2013, the percent of kids who walked to school was found to be approximately 15 percent nationwide, an increase from 2007 where the approximate percentage was 12 percent. The report also found an increase in students that walked from school in the same time frame. In 2013, approximately 18 percent of students walked from school compared to 15 percent in 2007.
Empty nesters, particularly as the number of baby boomers reaching retirement age accelerates, are also showing a strong preference for communities that support walking. American Association of Retired Persons (AARP) surveys found that 70 percent of respondents age 65 and older agreed that living near where they want to go, such as grocery stores, health care providers, libraries, transit, and social or religious organizations, was extremely or very important. Additionally, 51 percent agreed that it was extremely or very important to be able to walk easily in their community.
There has also been a growing preference for new facility types that enhance pedestrian and bicyclist safety, particularly bicycle lanes physically separated from motor vehicle traffic. In addition, acknowledging that most trips Americans make are within one mile, it is important to assess the infrastructure and make a genuine effort to entice people to walk or bike to their destinations through enhanced facilities.
18%
CHAPTER 1 » INTRODUCTION 3
of students walked from school in 2013 compared to 15.2 percent in 2007
BICYCLING AND WALKING BENEFITS
Numerous environmental, health, and economic benefits are attributable to bicycling and walking, especially as substitutes for travel by motor vehicle. This section summarizes these benefits, some from research by the Pedestrian and Bicycle Information Center (PBIC).
ENVIRONMENTAL BENEFITS
Increased bicycling and walking reduces fossil fuel emissions. In California, 41 percent of carbon dioxide (CO2) emissions are produced by the transportation sector.1 While CO2 is not the most harmful greenhouse gas (GHG), it is the most abundant. Even after accounting for the global warming potentials of other greenhouse gases (comparing them in terms of CO2), 95 to 99 percent of vehicle emissions are CO2 2 The Environmental Protection Agency (EPA) found the average vehicle emits 0.89 pounds of CO2 per mile. Therefore, almost a pound of CO2 emissions could be avoided each day for each mile, each way of an individual’s commute that was switched from driving to an active transportation mode like bicycling or walking.
HEALTH BENEFITS
Despite dramatic strides in recent decades through regulations and technological improvements, vehicle emissions still pose a significant threat to human health. Vehicle-generated air pollution contains harmful greenhouse gas emissions including carbon dioxide, carbon monoxide, methane, nitrous oxide, and volatile organic compounds. These pollutants and irritants can cause asthma, bronchitis, pneumonia, and decreased resistance to respiratory infections. Taking steps to reduce these emissions is particularly important in the United States, which leads the world in petroleum consumption. The conversion of driving to bicycling or walking offers a great opportunity to reduce emissions, improve air quality, increase physical activity, and improve public health.
Regular active travel is associated with a decreased risk of chronic disease, as well as significant physical and mental health benefits. Given the rising costs of healthcare and the economic burden of poor health, prevention is key, and active transportation can play a valuable role. A significant percentage of Americans are overweight or obese and projections indicate 42 percent of the population will be obese by 2030.3 To combat this trend and
RIALTO ACTIVE TRANSPORTATION PLAN
Moderate activity, like bicycling or walking, improves strength and stamina through better heart and lung function and reduces the risk of high blood pressure, heart attacks, and strokes.
prevent a variety of diseases and their associated societal costs, the Center for Disease Control (CDC) suggests a minimum of 30 minutes of moderate intensity physical activity five days per week. Not only do bicycling and brisk walking qualify as “moderate intensity activities,” they can also be seamlessly integrated into daily routine, especially if chosen for utilitarian purposes like commuting or running errands.
Other health benefits associated with moderate activity like bicycling or walking include improved strength and stamina through better heart and lung function. Regular exercise also reduces the risk of high blood pressure, heart attacks, and strokes. In addition to heart disease, regular exercise can help to prevent other health problems such as non-insulin dependent diabetes, osteoarthritis, and osteoporosis. Lastly, exercise has been shown to improve mental health by relieving depression, anxiety, and stress.
ECONOMIC BENEFITS
$8,849
Bicycling infrastructure and programs have increasingly been shown to deliver economic benefit to both individuals and society at large. The benefits of bicycling may, in fact, outweigh its costs. Bicycling, and utilitarian bicycling in particular, offers obvious cost savings to individuals. Beyond the upfront cost of operating a vehicle are additional maintenance, insurance, and often parking expenses. According to a 2018 American Automobile Association report, the annual cost of owning a car and driving 15,000 miles a year is on average $8,849.
15
Walkable neighborhoods have substantially lower rates of obesity, overweightness and diabetes
CHAPTER 1 » INTRODUCTION
A short, four-mile round trip by bicycle keeps about 15 pounds of pollutants out of the air we breathe
– WorldWatch Institute
lbs
5
According to the American Automobile Association, the annual cost of owning a car and driving 15,000 miles a year is on average
Cost of Transportation
$250 $680 $1,810 $8,776
Converting even a fraction of automobile trips to bicycling or walking trips can generate transportation-related savings, including reduced vehicle traffic congestion. Increased bicycling and walking also translates to health-related savings, for both individuals and taxpayers, in the form of less need for preventative care. More bicycling and walking have also been tied to increases in commercial and residential property values and retail sales. Shoppers who reach their destination by bicycle have been shown to make smaller purchases but shop more often and to spend more money overall. Shoppers who arrive by bicycle or on foot, because of their more limited range, are also more likely to support local businesses, and do not require the space for parking a motor vehicle compared to those who drive.
Perhaps more compelling than reducing GHG emissions or combating the obesity epidemic is the benefits bicycling has to offer in terms of quality of life. Bicycling, and especially utilitarian bicycling, is increasingly seen as a fun, low-cost, healthy, and sustainable form of getting around.
SOCIAL JUSTICE
In addition to the extensive environmental, health, and economic benefits gained from enhanced active transportation infrastructure, there is also the potential to alleviate issues for disadvantaged populations that are disproportionately impacted by rising transportation costs. According to the Federal Highway Administration’s (FHWA) 2017 National Household Travel Survey, individuals living in poverty are more likely to lack access to a personal vehicle and also have the highest rates of bicycling and walking trips as compared to higher income groups. The survey also reported that poor, racial, and ethnic minorities, and the elderly have much lower mobility rates than the general population. These trends highlight the importance of providing safe and comprehensive transportation options for community members who do not have regular access to a personal vehicle.
PLANNING CONTEXT
The ATP incorporates regional and local planning efforts that are directly related to walking, biking, and trails. These efforts range from long-range regional planning to neighborhood-specific plans. The following information summarizes a few of the planning documents that were evaluated as part of ATP development.
RIALTO ACTIVE TRANSPORTATION PLAN
Lower income groups have the highest rates of bicycling and walking trips as compared to higher income groups
Source: Transit for Liveable Communities, Minnesota
RIALTO GENERAL PLAN
The Rialto General Plan is the primary citywide comprehensive plan that guides future growth. The General Plan contains goals and objectives to guide decisions and preserve the quality of life within the City of Rialto. The Circulation and Land Use elements contain goals and objectives that contribute to the success of this ATP. Find the document here: https://www.yourrialto.com/general-plan/
Land Use Element
The ATP implements land use policies to provide a circulation system that allows residents to travel between residential areas, open spaces areas, schools, and local shopping areas. This plan encourages the development of transit-oriented, mixed-use development that fosters alternate modes of transportation and maximizes potential pedestrian connections. Other land uses policies, including improved landscaping, urban furniture, and transit shelters, are also supported by the ATP. This plan also encourages the enhancements of certain areas, including downtown Rialto and Foothill Boulevard, in order to reduce traffic congestion and air pollution. Additionally, the Active Transportation Plan promotes long term recreational opportunities within and between open space areas, parks, and schools.
Circulation Element
The Circulation Element provides a strong support for developing an adequate and safe pedestrian and bicycle system. In order to achieve this, the Circulation Element provides goals and policies to create a continuous bicycle network that promotes a safe and efficient travel for recreational and commuter use within the city. Additionally, the ATP carries out circulation policies that intend to improve pedestrian safety and access along certain corridors and areas through a series of physical improvements that enhance comfort and promote walking. These areas include Riverside Avenue, Foothill Boulevard, and downtown Rialto. In the same way, the ATP intends to increase access to reliable and convenient public transit services. It also ensures that traffic calming elements are implemented on local residential streets by creating environments that are conducive to walking.
SAN BERNARDINO COUNTY NON-MOTORIZED TRANSPORTATION PLAN
The purpose of the San Bernardino Countywide Transportation Plan is to lay out a strategy for long term investment and management of the county’s transportation assets. This plan seeks to improve safety and mobility for all modes of transportation and to integrate countywide transportation plans and initiatives to better serve the needs of the county. The ATP is consistent with some of the objectives of this plan, such as reducing the number of vehicle miles traveled and vehicle emissions, as well as increasing the share of people carpooling, bicycling, walking, and using transit. The plan also proposes a series of pedestrian improvements within the County of San Bernardino, including enhanced access to transit, removal of existing pedestrian barriers, development of rational trails, and bettering of the pedestrian environment on major regional corridors and activity centers. Find the document here: https://www.gosbcta.com/wp-content/uploads/2019/10/Non-Motorized-Transportation-Plan-.pdf
CALIFORNIA TRANSPORTATION PLAN 2040
The California Transportation Plan (CTP) 2040 addresses the status and anticipated needs of the State’s Transportation System to improve the movement of people, goods, services, and information to meet the State’s future multi-modal mobility needs. The CTP 2040 is a statewide long-range policy plan that presents a vision for California’s future transportation system. The plan identifies goals, policies, and strategies to achieve a vision, and recommended performance measures for assessing their effectiveness. Goals of the plan include improving multi-modal mobility and accessibility for all people, improving public safety and security, fostering livable and healthy communities, and promoting social equity. In addition, the plan provides a common framework to help guide transportation decisions and investments that support a statewide multi-modal transportation system. Find the document here: https://dot.ca.gov/-/media/dot-media/ programs/legislative-affairs/documents/f0004899ctp2040-a11y.pdf
CHAPTER 1 » INTRODUCTION 7
2018 CALIFORNIA STATE RAIL PLAN (CSRP)
Caltrans has completed the new 2018 California State Rail Plan (CSRP) which provides a new framework to improve rail and community connections. The 2040 Vision will extend the benefits of highspeed rail (HSR) and multimodal connectivity to riders across the state. One feature of this plan includes integrated services that examines multimodal hubs which will connect all levels of service with a common fare system, allowing trips to be made on a single ticket. The 2040 Vision improvements make it possible for people to drive less, thus reducing vehicle miles traveled (VMT), roadway congestion, GHG, and vehicle emissions.
2017 TOWARD AN ACTIVE CALIFORNIA
Toward an Active California is Caltrans’ first statewide policy-plan to support travel by bicyclists and pedestrians through objectives, strategies, and actions. This policy direction remains supportive for the recent trend of increasing active transportation modes in the state and strengthens the relationship between transportation, environmental sustainability, and public health. This plan is an important element of a statewide goal to provide robust multi-modal transportation options to everyone in California. Toward an Active California also aims to achieve goals and targets set in the Caltrans Strategic Management Plan, including double walking trips, triple bicycle trips, and double transit trips by 2020, reducing bicycle and pedestrian fatalities by ten percent per year, as well as increasing the number of complete streets projects by twenty percent. This plan was released concurrent with major new funding directed to active transportation from Senate Bill 1, the Road Repair and Accountability Act of 2017. Caltrans recognizes that successful implementation of this plan requires strong partnerships with other state, regional, and local agencies. Find the document here: https://altaplanning.com/wp-content/uploads/Toward-an-Active-California.pdf
CITY OF FONTANA ACTIVE TRANSPORTATION PLAN
The purpose of Fontana’s Active Transportation Plan is to reach its goal of becoming a community that is healthy, engaged, economically vibrant, fami-
ly-oriented, and safe. The purpose of the plan is for it to be used as an important tool for implementing infrastructure improvements for better connectivity throughout the city and to other surrounding regions by providing safe and comfortable walking and bicycling linkages. The plan aims to provide and promote pedestrian and bicyclist friendly environments including streets, sidewalks, and pathways that are attractive, convenient, and safe for active transportation modes. This ATP is coordinated with the Fontana ATP to make connections with Rialto and complete a regional network. Find the document here: https:// www.fontana.org/DocumentCenter/View/27009/ ATP-Final-Report
CITY OF RANCHO CUCAMONGA CIRCULATION MASTER PLAN FOR BICYCLISTS AND PEDESTRIANS
The Rancho Cucamonga Circulation Master Plan for Bicyclists and Pedestrians accompanies local and regional planning efforts that relate to active transportation opportunities and provides guidance for investing in infrastructure, programming, and education to ultimately encourage community health and increase access to multi-modal transportation choices, specifically in areas that are underserved throughout the city. This plan intends to make bicycling and walking safe, convenient, and comfortable. Active transportation modes will provide the city with viable transportation options that will connect people to places, foster recreational and economic development opportunities. This ATP is coordinated with the Rancho Cucamomga CMPBP to complete a regional network.
TERRA VISTA SAFE ROUTES TO SCHOOL PROJECT
Terra Vista’s Safe Routes to School (SRTS) Project will construct SRTS infrastructure improvements at Fitzgerald Elementary School and Kucera Middle School located in Rialto. New infrastructure investments are needed to increase awareness of pedestrians in uncontrolled intersections. The Rialto Safe Routes to School (SRTS) Program that was formerly funded by ATP Cycle 1 sought community input, stakeholder guidance, engineering expertise, and strategic planning to develop recommendations to be implemented. The proposed Improve-
RIALTO ACTIVE TRANSPORTATION PLAN 8
ments will help provide connectivity between the neighborhoods where students live and where their respective schools are located and ultimately help alleviate pedestrian and bicyclist exposure to vehicles. The addition of Class II bike lanes will help close gaps in bike lanes to make biking to school safe and practical. The implementation of these improvements can help the city to realize increases in the number of students walking and biking to school, as well as improved safety for all pedestrians and cyclists traveling within the community.
IMPROVEMENT TO TRANSIT ACCESS FOR CYCLISTS AND PEDESTRIANS FINAL REPORT
In this report, San Bernardino County Transportation Authority (SBCTA) studied the capability of non-motorized users to access its regional transit network including its existing County Metrolink Commuter Rail stations along the San Bernardino Line and its
CORRIDOR DESIGN PROJECTS
Bus Rapid Transit (BRT) Stations in the cities of San Bernardino and Loma Linda. This project identified existing barriers to access via non-motorized modes and proposed planning-level improvements in and around the selected stations. Ten stations were developed for analysis, which served as a model for how to implement infrastructure improvements that are designed to best serve the needs of bicyclists and pedestrians at transit stations throughout the Inland Empire.
The Rialto Metrolink Station located on Rialto Avenue between Willow Avenue and Riverside Avenue was identified as one of the stations lacking pedestrian and bicycling infrastructure, as well as access. Recommended improvements at this station included multi-use paths, pedestrian overcrossings, proposed bike routes, and bicycle parking. Find the document here: ftp://gis.sanbag.ca.gov/SANBAG/SANBAG%20Access%20To%20Transit%20 Draft%20Report.pdf
In addition to the documents reviewed in this section, there are several improvement projects in the City of Rialto either pending or undergoing construction. These projects were also reviewed as part of this ATP and are listed below:
» Etiwanda Corridor Improvement Project
» Randall Avenue Improvement Plan
» Alder Avenue - Phase 2 Baseline Road to Renaissance Parkway Street Improvement Plans
» Alder Avenue - Phase 2 Baseline Road to Renaissance Parkway Signing and Striping Plans
» Alder Avenue - Phase 2 Baseline Road to Renaissance Parkway Traffic Signal Modification Plan
» Foothill Blvd Aesthetic Improvements
» SR2S-Cycle 10 Cedar Improvements
» Alder & Randall Widening
» Valley Widening - Spruce, Cactus, and Linden
» Riverside & Union Pacific Railroad Bridge Widening
» Etiwanda Corridor - TDA, ATP, and MSRC
» Metrolink Parking Lot & Depot Improvement II
» MSRC Pedestrian & Bike Share Project
» HSIP Signal Improvements Left Turns
» HSIP Baseline Median
» HSIP Class II Bike Lane - Merrill & Riverside
» Systematic Safety & Analysis Report
» Street Overlay 2018
» Street Slurry Seal 2018
» Curb, Gutter & Sidewalk Improvements 2018
» Riverside South of I-10 Improvement
» Climate Adaptation Plan
» Traffic Management Center Upgrade & Master Comm Plan
» Traffic Signal - Pepper & Winchester
» Traffic Signal Battery Backup System
» Street Overlay 2019
» Street Slurry Seal 2019
» Curb, Gutter & Sidewalk Improvements 2019
» Pavement Crack Sealing Treatment
» Public Right of Way Transition Plan
» Casa Grande Traffic Calming
» Traffic Signal - Ayala & Fitzgerald
» Easton Sidewalk Treatment (without Acacia)
» Baseline: Acacia to Meridian Parkway Improvements
» I-10 & Cedar Interchange Rialto Fare Share
» Alder Interchange SR-210
» Curb, Gutter, Sidewalk & ADA - CDBG 2018
» Safety Lights Conversion to LED
» Curb, Gutter & Sidewalk Improvement 2020
» Pavement Crack Sealing Treatment 2020
» Street Overlay 2020
» Street Slurry Seal 2020
CHAPTER 1 » INTRODUCTION 9
RIALTO BIKE SHARE FEASIBILITY STUDY
Bike share has the potential to greatly expand transportation options for residents, employees, and visitors to travel to and around Rialto and adjacent communities. Bike share is a network of shared bicycles that offers quick and convenient transportation options for short-term, one-way trips. Bike share is ideal for trips that are between a half mile and three miles—those that are too long to walk but too short to drive.
These short trips to the store, school, parks and other local destinations are about half of the trips most people take on a normal day. Bike share is a point-to-point, on-demand transit system that allows users to rent a bike in one location and return it at their destination, without having to travel back to the point of origin. Bike share also provides a number of health benefits including improved individual and community health through active transportation, as well as a reduction in emissions generated from car trips.
The goal of this project was to gather community input to direct possible locations for bikeshare stations and garner support for the system. Due to the varying types of bikeshare systems and other micromoblity options, this study aims to guide the feasibility of bikeshare within the city.
RIALTO SAFE ROUTES TO SCHOOL (SRTS) PROGRAM
The Rialto Safe Routes to School (SRTS) Program is an effort to promote walking and biking as a safe and healthy way to get to and from school in Rialto. SRTS is an international movement to both increase the number of students using active modes of transportation to get to and from school and improve pedestrian and bicycle travel around schools. There are many benefits to SRTS which include improved safety for pedestrians and bicyclists, reduced traffic congestion, and improved air quality, as well as improved academic achievement. As part of this ATP, Rialto’s SRTS program was studied to further assess areas of improvement regarding pedestrian and bicycling safety.
STATE OF PRACTICE
While pedestrians have long benefited from “routine accommodation” with amenities like sidewalks, curb ramps, crosswalks, dedicated signals, etc., it is only more recently that the state of practice for bicycle facilities in the United States has undergone a similar transformation. Much of this may be attributed to bicycling’s changing role in the overall transportation system. Long viewed as an “alternative” mode, it is increasingly considered a legitimate transportation mode and one that should be actively promoted as a means of achieving environmental, social, and economic goals.
Recent research indicates that, beyond connectivity and convenience, “low-stress” bicycle facilities are essential to the increased acceptance and practice of daily bicycling. Facility types and specific design interventions intended to encourage ridership among the large “interested, but concerned” demographic, tend to be those that provide separation from high volume and high-speed vehicular traffic.
Just as the state of practice of bicycle facilities has evolved, so has the technical guidance. While bikeway design guidance in California has traditionally come from the state, especially Caltrans and the California Manual on Uniform Traffic Control Devices (CA MUTCD), cities are increasingly turning to national organizations for guidance on best practices. Primary organizations include the National Association of City Transportation Officials (NACTO), American Association of State Highway and Transportation Officials (AASHTO), and the Federal Highway Administration (FHWA).
Fortunately for California cities, there is increased flexibility in design guidance offered by both Caltrans and the FHWA. In 2014, Caltrans officially endorsed the NACTO Urban Street Design Guide and Urban Bikeway Design Guide as valuable toolkits for designing and constructing safe, attractive local streets. California cities may also apply for experimental designation from the FHWA for projects not in conformance with the CA MUTCD.
The guidance provided by these manuals support the creation of more Complete Streets. The guidance is also supported by several pieces of important legislation. The following section provides a review of the state of practice for bicycle facilities, drawing on the AASHTO and NACTO guides. It also includes a dis-
RIALTO ACTIVE TRANSPORTATION PLAN 10
cussion on Complete Streets/Routine Accommodation, as well as summaries of relevant legislation at the local, regional, state, and national levels.
PRIMARY GUIDANCE
In 2014, the California Department of Transportation (Caltrans) updated the CA MUTCD to provide uniform standards and specifications for all official traffic control devices in California. This update is meant to implement Caltrans’ 2014 mission to provide a safe, sustainable, integrated, and efficient transportation system to enhance California’s economy and livability. The purpose of the CA MUTCD is to improve safety and mobility for all travelers by setting minimum standards and providing guidance intended to balance safety and convenience for everyone in traffic, including drivers, pedestrians, and bicyclists.
The CA MUTCD contains the basic principles that govern the design and use of traffic control devices that aim to promote highway safety and efficiency by providing for the orderly movement of all road users on streets, highways, bikeways, and private roads open to public travel. Multi-modal policies for safer crossings, work zones, and intersections are integrated as part of the CA MUTCD, with improvements including:
» Crosswalks Enhancements Policy
» Temporary Traffic Control Plans
» Work Zone and Higher Fines Signs and Plaques
» Traffic Control for School Areas
Additionally, NACTO guidance was analyzed to ensure flexibility and innovation in the design and operations of streets and highways in California. Much of the guidance provided in the CA MUTCD is consistent with the NACTO Urban Bikeway Design Guide.
Caltrans Highway Design Manual, Chapter 1000: Bicycle Transportation Design
Chapter 1000 of the Caltrans Highway Design Manual serves as the official design standard for bikeways in California. This chapter defines a “bikeway” as a facility that is provided primarily for bicycle travel and recognizes its importance in improving bicycling safety and convenience. Chapter 1000 intends to help accommodate motor vehicle and bicycle traffic on the roadway system, or as a com-
plement to the road system to meet the needs for bicyclists. This chapter classifies bikeway facilities into five different types that include:
1. Shares Roadway (No Bikeway Designation)
2. Class I Bikeway (Bike Path)
3. Class II Bikeway (Bike Lane)
4. Class III Bikeway (Bike Route)
5. Class IV Bikeways (Separated Bikeways)
However, Chapter 1000 states that these designations should not be construed as a hierarchy of bikeways, since each bikeway type has its appropriate application. Additionally, this chapter only provides design guidance for Class I bike paths, Class III bike routes, as well as trails.
FHWA Bike Lane Planning and Design Guide
This 2015 guide is the most recent national bike lane design guide and for many, the primary national resources for planning and designing bicycle facilities. It captures the state of practice of bicycle facility design within the street right-of-way. It provides a menu of design options covering typical one and two-way cycle tracks and provides detailed intersection design information covering topics such as turning movement operations, signalization, signage, and on-road markings.
FHWA Bikeway Selection Guide
This 2019 guide is an important complement to the 2015 FHWA Bike Lane Planning and Design Guide. It has a focus on designing for all ages and abilities. It gives the designer additional tools such as matrices, flow charts, and graphs that facilitate the design of the appropriate bikeway based both on roadway characteristics and the intended type of cyclist.
MassDOT Separated Bike Lane Planning & Design Guide
This guide draws on research and best practices from the United States and around the world to deliver a unique manual not covered in other manuals, such as protected intersections and cycle tracks within roundabouts. Although it is a state guide and not a national guide, the up-to-date information and the easy-to-read graphics make it an important reference guide for bicycle planners and designers.
CHAPTER 1 » INTRODUCTION 11
AASHTO Guide to Bikeway Facilities
The AASHTO bicycle and pedestrian design guides are important national resources for planning, designing, and operating bicycle and pedestrian facilities, especially for bike path design outside a typical road right-of-way that is not covered in other guides. The NACTO Urban Bikeway Design Guide and the Institute of Transportation Engineers (ITE) Designing Urban Walkable Thoroughfares Guide build upon the flexibilities provided in the AASHTO guides, which can help communities plan and design safe and convenient facilities for pedestrians and cyclists. FHWA supports the use of these resources to further develop non-motorized transportation networks, particularly in urban areas. Moreover, in August 2013, the FHWA issued a memo on Bicycle and Pedestrian Facility Design Flexibility issuing their support for taking a flexible approach to bicycle and pedestrian facility design. Moving away from standards and towards flexibility in design using the designer’s judgement is an important step towards contextual design, implementing the appropriate facility based on location and context.
NACTO Urban Bikeway and Urban Street Design Guides
The NACTO guides represent the industry standard for innovative bicycle and streetscape facilities and treatments in the United States. In 2014, Caltrans officially endorsed the NACTO Urban Street Design Guide and Urban Bikeway Design Guide as valuable toolkits for designing and constructing safe, attractive local streets. At the time, Caltrans was only the third State Department of Transportation to officially endorse the guides.
It is important to note that virtually all of the Urban Bikeway Design Guide design treatments (with two exceptions) are permitted under the Federal MUTCD. The NACTO Urban Street Design Guide is the more generalized of the two guides and organized into six sections. Each section is further subdivided, depending on topic. The NACTO Urban Bikeway Design Guide is also organized into six sections, but its information is bicycle-specific. For each section, it offers three levels of guidance: Required Features, Recommended Features, and Optional Features. The following section introduces the broad facility types included in the NACTO Urban Bikeway Design Guide.
RIALTO ACTIVE TRANSPORTATION PLAN 12
NACTO Transit Street Design Guide
As transit gains a more prominent role in cities, more people are using buses, streetcars, and light rail than ever before. As a result, street design is shifting to give transit the space it deserves. The NACTO Transit Street Design Guide provides design guidance for the development of transit facilities on streets, as well as for prioritizing transit, improving its service quality, and to support other related goals.
The majority of design elements included in this guide are consistent with CA MUTCD standards, including signage, markings, and signal elements that have received interim approval. These guidelines were developed using other design guidance as a basis, along with city case studies, best practices, research and evaluation of existing designs, and professional consensus.
NACTO Urban Street Stormwater Guide
The NACTO Urban Street Stormwater Guide provides guidelines on how to create resilient cities that are better prepared for climate change, while creating public spaces that deliver social and economic value to these places. This guide focuses on green infrastructure within urban streets, including the design and engineering of stormwater management practices that support and improve mobility. It also intends to reduce the impacts of runoff and human activity on natural ecological processes.
One of the main goals of this guide is to encourage interdepartmental partnerships around sustainable infrastructure, which includes communicating the benefits of such projects. However, this guide does not address stormwater management strategies on private property, nor does it address drainage and infiltration around controlled-access highways.
Complete Streets and Routine Accommodation
An adopted Active Transportation Plan provides a roadmap to support planning and implementing a bicycle and pedestrian network, can help to integrate bicycle and pedestrian planning into broader planning efforts, and is required for state funding of bikeway and pedestrian projects.
For many cities, however, a bicycle and pedestrian plan alone is not enough to ensure the implementation of the plan’s goals and projects. A hurdle many cities face is that their various plans are not well integrated. Despite many cities’ attempts to support a “Complete Streets approach,” entrenched and often contradictory policies can make implementation difficult. For instance, an ATP, an ADA transition plan, and a specific plan may address the same area, but ignore each other’s recommendations. One plan may identify a certain project, but it may not be implementable due to prevailing policies and practices that prioritize vehicular flow and parking over other modes.
An adopted Complete Streets policy has the potential to address these shortcomings through the designation of some important corridors as Complete Streets, accommodating all roadway users, and other corridors as priority corridors for certain modes. A system that assigns priority for different modes to specific corridors, offset from one another, is referred to as a layered network.
Efforts to implement Complete Streets policy often highlight other significant obstacles, chief among them documents defining “significant impacts” to traffic, acceptable vehicular “Level of Service” thresholds, and parking requirements. Drafting a Complete Streets policy often means identifying roadblocks like these and ultimately mandating increased flexibility to allow for the creation of a more balanced transportation system. In the case of an ATP, the network identified could become the bicycle and pedestrian layers. Identification in such a plan, reiteration within a Complete Streets policy framework, and exemption from traditional traffic analyses can make implementation more likely and much more affordable.
Legislative support for Complete Streets can be found at the state level (AB-1358) and is being developed at the national level (HR-2468). As explained in further detail in the following section on applicable legislation, AB-1358 requires cities and counties to incorporate Complete Streets in their general plan updates and directs the State Office of Planning Research (OPR) to include Complete Streets principles in its update of guidelines for general plan circulation elements. Examples of best practices in Complete Streets Policies from around the United States can be found at: http://www.smartgrowthamerica.org/complete-streets-2013-analysis.
CHAPTER 1 » INTRODUCTION 13
APPLICABLE LEGISLATION
Several pieces of legislation support increased bicycling and walking in California. Much of the legislation addresses greenhouse gas (GHG) reduction and employs bicycling and walking as means to achieve reduction targets. Other legislation highlights the intrinsic worth of bicycling and walking and treats the safe and convenient accommodation of bicyclists and walkers as a matter of equity. The most relevant legislation concerning bicycle and pedestrian policy, planning, infrastructure, and programs are described in the following sections.
State Legislation and Policies
AB-32 California Global Warming Solutions Act
AB-32 calls for the reduction of greenhouse gas emissions and codifies a 2020 emissions reduction goal. This act also directs the California Air Resources Board (CARB) to develop specific early actions to reduce greenhouse gases while also preparing a scoping plan to identify how best to reach the 2020 limit.
SB-375 Redesigning Communities to Reduce Greenhouse Gases
This bill seeks to reduce vehicle miles traveled (VMT) through land use and planning incentives. Key provisions require the larger regional transportation planning agencies to develop more sophisticated transportation planning models, and to use them for the purpose of creating “preferred growth scenarios” in their regional plans that reduce greenhouse gas emissions. The bill also provides incentives for local governments to incorporate these preferred growth scenarios into the transportation elements of their general land use plans.
AB-1358 Complete Streets Act
AB-1358 requires the legislative body of a city or county, upon revision of the circulation element of their general plan, to identify how the jurisdiction will provide for the routine accommodation of all users of the roadway including drivers, pedestrians, cyclists, individuals with disabilities, seniors, and public transit users. The bill also directs the OPR to amend guidelines for general plan circulation element development so that the building and operation of local transportation facilities safely and conveniently accommodates everyone, regardless of their travel mode.
RIALTO ACTIVE TRANSPORTATION PLAN 14
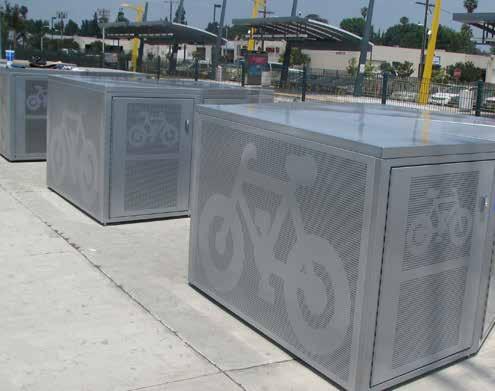
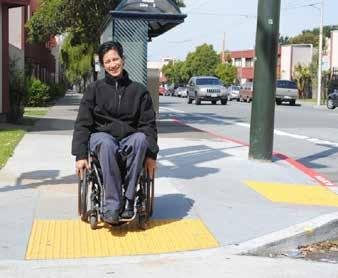
ADA curb ramp with truncated domes
Bicycle lockers
California Bicycle Coalition Three Feet
Passing for Safety Education Logo
AB-1581 Bicycle and Motorcycle Traffic Signal Actuation
This bill defines a traffic control device as a traffic-actuated signal that displays one or more of its indications in response to the presence of traffic detected by mechanical, visual, electrical, or other means. Upon the first placement or replacement of a traffic-actuated signal, the signal would have to be installed and maintained, to the extent feasible and in conformance with professional engineering practices, so as to detect lawful bicycle or motorcycle traffic on the roadway. Caltrans has adopted standards for implementing the legislation.
AB-1371 Passing Distance/Three Feet for Safety Act
This statute, widely referred to as the “Three Foot Passing Law,” requires drivers to provide at least three feet of clearance when passing bicyclists. If traffic or roadway conditions prevent drivers from giving bicyclists three feet of clearance, they must “slow to a speed that is reasonable and prudent” and wait until they reach a point where passing can occur without endangering the bicyclists. Violations are punishable by a $35 base fine, but drivers who collide with bicyclists and injure them in violation of the law are subject to a $220 fine.
SB-743 CEQA Reform
Just as important as the aforementioned pieces of legislation that support increases in bicycling and walking infrastructure and accommodation is one that promises to remove a long-standing roadblock to them. That roadblock is vehicular Level of Service (LOS) and the legislation with the potential to remove it is SB-743.
For decades, vehicular congestion has been interpreted as an environmental impact and has often stymied on-street bicycle projects, in particular. Projections of degraded Level of Service have, at a minimum, driven up project costs and, at a maximum, precluded projects altogether. In many cases, it leads to high stress environments for cyclists and pedestrians. SB-743 removes LOS as a measure of vehicle traffic congestion that must be used to analyze environmental impacts under the California Environmental Quality Act (CEQA).
This is extremely important because adequately accommodating bicyclists, particularly in built-out
environments, often requires reallocation of rightof-way and the potential for increased vehicular congestion. The reframing of Level of Service as a matter of driver inconvenience, rather than an environmental impact, allows planners to assess the true impacts of transportation projects and will help support bicycling projects that improve mobility for all roadway users.
CEQA for Bicycle and Pedestrian Plans
Based on Public Resources Code Section 15262 (Feasibility and Planning Studies) guidance, planning documents such as this ATP are exempt from CEQA analysis since they are planning and conceptual recommendations:
“A project involving only feasibility or planning studies for possible future actions which the agency, board, or commission has not approved, adopted, or funded does not require the preparation of an EIR or Negative Declaration but does require consideration of environmental factors.”
As individual recommendations move forward toward further design and implementation, the city will then need to determine if there are environmental impacts that may warrant an EIR.
AB-1193 Bikeways
This act amends various code sections, all relating to bikeways in general, specifically by recognizing a fourth class of bicycle facility, cycle tracks. However, another component of AB-1193 may be even more significant to future bikeway development.
Existing law requires Caltrans, in cooperation with county and city governments, to establish minimum safety design criteria for the planning and construction of bikeways, and requires the department to establish uniform specifications and symbols regarding bicycle travel and traffic related matters. Existing law also requires all city, county, regional, and other local agencies responsible for the development or operation of bikeways or roadways to utilize all of those minimum safety design criteria and uniform specifications and symbols.
This bill revises these provisions to require Caltrans to establish minimum safety design criteria for each type of bikeway, and also authorizes local agencies to utilize different minimum safety criteria if adopted by resolution at a public meeting.
CHAPTER 1 » INTRODUCTION 15
Design Information Bulletin 89-01
A Class IV Bikeway (separated bikeway) is a bikeway for the exclusive use of bicycles and includes a separation required between the separated bikeway and the through vehicular traffic. The purpose of Design Information Bulletin (DIB) 89-01 is to provide design criteria and guidance on best practices related to these separated bikeways to establish a uniform guidance that will facilitate consistent user expectations.
DIB 89-01 intends to allow designers to exercise sound judgement when applying it, while being consistent with Caltran’s Highway Design Manual and the CA MUTCD. This DIB is written to allow for flexibility in applying design criteria, taking into consideration the context of the project’s location, enabling designers to tailor the design and maximize safety and comfort.
Best practices from cities, states, and countries currently operating separated bikeways have been used to formulate DIB 89-01. This DIB will be updated as necessary based on lessons learned from engineers and practitioners as they gain more experience with the use of separated bikeways.
RIALTO ACTIVE TRANSPORTATION PLAN 16
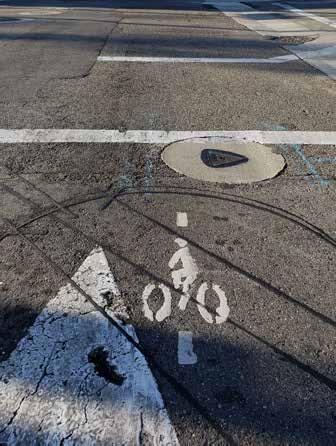
Bicycle detector pavement marking
Class IV separated bikeway
SB-1 Transportation Funding
This bill creates the Road Maintenance and Rehabilitation Program to address deferred maintenance on the state highway system and the local street and road system. A total of $5.4 billion will be invested annually over the next decade, which will undertake a backlog of repairs and upgrades, of which $1.8 billion is being made available to local streets and roads. Additionally, cleaner and more sustainable travel networks will be ensured for the future, including upgrades to local roads, transit agencies, and an expansion of the state’s growing network of pedestrians and bicycle routes.
SB-672 Traffic-Actuated Signals: Motorcycles and Bicycles
This bill extends indefinitely the requirement to install traffic-actuated signals to detect lawful bicycle or motorcycle traffic on the roadway. By extending indefinitely requirements regarding traffic-actuated signals applicable to local governments until standards are established:
“Cities, counties, and cities and counties shall not be required to comply with the provisions contained in subdivision (b) until the Department of Transportation, in consultation with these entities, has established uniform standards, specifications, and guidelines for the detection of bicycles and motorcycles by traffic-actuated signals and related signal timing.”
Existing law requires the state to reimburse local agencies and school districts for certain costs mandated by the state.
SB-760 Transportation Funding: Active Transportation: Complete Streets
This bill seeks to establish a Division of Active Transportation within Caltrans to give attention to active transportation program matters to guide progress toward meeting the department’s active transportation program goals and objectives. This bill requires the California Transportation Commission to give high priority to increasing safety for pedestrians and bicyclists and to the implementation of bicycle and pedestrian facilities. The bill also directs the department to update the Highway Design Manual to incorporate Complete Streets design concepts, including guidance for the selection of bicycle facilities.
CHAPTER 1 » INTRODUCTION 17
Bike traffic signal
Shared lane marking (“Sharrow”)
Bicycle lane
AB-1218 California Environmental Quality Act Exemption: Bicycle Transportation Plans
This bill extends CEQA requirements exemptions for bicycle transportation plans for an urbanized area until January 1, 2021. These exemptions include restriping of streets and highways, bicycle parking and storage, signal timing to improve street and highway intersection operations, and related signage for bicycles, pedestrians, and vehicles under certain conditions. Additionally, CEQA will also exempt from its requirements projects consisting of restriping of streets and highways for bicycle lanes in an urbanized area that are consistent with a bicycle transportation plan under certain conditions.
Caltrans’ Deputy Directive 64-R2
Deputy Directive 64-R2 is a policy statement affecting Caltrans mobility planning and projects requiring the agency to:
“…Provide for the needs of travelers of all ages and abilities in all planning, programming, design, construction, operations, and maintenance activities and products on the state highway system. Caltrans views all transportation improvements as opportunities to improve safety, access and mobility for all travelers in California and recognizes bicycle, pedestrian, and transit modes as integral elements of the transportation system.”
The directive goes on to mention the environmental, health and economic benefits of more Complete Streets.
AB-902 Traffic Violations and Diversion Programs
Existing law provides that a local authority may not allow a person who has committed a traffic violation under the Vehicle Code to participate in a driver awareness or education program as an alternative to the imposition of those penalties and procedures, unless the program is a diversion program for a minor who commits an infraction not involving a motor vehicle and for which no fee is charged.
This bill would instead allow any person of any age who commits an infraction not involving a motor vehicle to participate in a diversion program sanctioned by local law enforcement. The bill would eliminate the requirement that such a program charge no fee, as well as other technical changes.
RIALTO ACTIVE TRANSPORTATION PLAN 18
Electric bicycle
Pedestrian countdown timer
Intersection bicycle box
AB-1096 Electric Bicycles as Vehicles
Existing law defines a “motorized bicycle” as a device that has fully operative pedals for propulsion by human power and has an electric motor that meets specified requirements. The bill would define an “electric bicycle” as a bicycle with fully operable pedals and an electric motor of less than 750 watts, and would create three classes of electric bicycles.
The bill would prohibit the operation of the most powerful Class 3 electric bicycles on specified paths, lanes, or trails, unless that operation is authorized by a local ordinance. The bill would also authorize a local authority or governing body to prohibit, by ordinance, the operation of Class 1 or Class 2 electric bicycles on specified paths or trails.
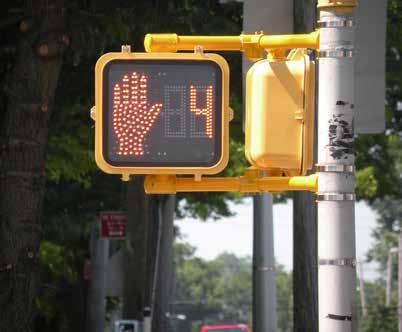
AB-390 Pedestrian Crossing Signals
This bill authorizes a pedestrian facing a flashing “DON’T WALK” or “WAIT” or approved “Upraised hand” symbol with a “countdown” signal to proceed, so long as the pedestrian completes the crossing before the display of the steady “DON’T WALK OR WALK” or “WAIT” or approved “Upraised Hand” symbol.
AB-285 Forecast Impacts of Emerging Technologies
The California Transportation Plan (CTP), produced by Caltrans, is required to address how it will help meet state greenhouse gas emission and clean air goals. Starting in 2025, the CTP will have to forecast potential impacts of future transportation technologies on infrastructure, access, and the overall transportation system. It will also be required to consider environmental justice in its planning for transportation and freight movement.
AB-1266 Bicycle Guidance Signs Through an Intersection
AB-1266 ultimately aims to make it safer for bicycle riding in California at busy intersections. The bill requires Caltrans to develop standards for lane striping, pavement marking, and appropriate regulatory signs that allow bicyclists to go straight from a right or left turn lane and to safely cross outside of the high-traffic lanes.
SB-400 Clean Cars 4 All Program
This bill would include e-bikes and bike sharing pro-
grams as options within California’s Clean Cars 4 All program. CC4A aims to reduce car emissions by increasing the turnover of the existing vehicles and replacing them with newer, cleaner, and more efficient vehicles. Reducing emissions from existing vehicles is a component of California’s State Implementation Plan for meeting air quality standards and also supports efforts to meet the state’s 2030 climate change goals.
Executive Order N-19-19
California Governor Gavin Newsom signed Executive Order N-19-19 on September 20, 2019 to require the State to continue efforts to reduce greenhouse gas emissions and mitigate climate change impacts while building a sustainable economy. The California State Transportation Agency is directed to leverage strategies towards lowering vehicle miles traveled by supporting active modes of transportation such as biking and walking that also benefit public health.
Federal Legislation Safe Streets Act (S-2004/HR-2468)
HR2468 encourages safer streets through policy adoption at the state and regional levels, mirroring an approach already being used in many local jurisdictions, regional agencies, and state governments. The bill calls upon all states and metropolitan planning organizations (MPOs) to adopt Safe Streets policies for federally funded construction and roadway improvement projects within two years. Federal legislation will ensure consistency and flexibility in road-building processes and standards at all levels of governance.
Interim Approval for Optional Use of an Intersection Bicycle Box (IA-18)
Intersection bicycle boxes are designated areas at signalized intersections that provide bicyclists with a space in which to wait in front of stopped motor vehicles during the red signal phase so that they are more visible to motorists. Since they are still considered an experimental traffic control device, the Federal Highway Administration issued an Interim Approval to allow the provisional use of intersection bicycle boxes in October 2016. This Interim Approval does not create a new mandate compelling the use of intersection bicycle boxes, but will allow agencies to install intersection bicycle boxes,
CHAPTER 1 » INTRODUCTION 19
pending official rulemaking revising the MUTCD, to facilitate more efficient operations at intersections. Interim Approval of a provisional device typically results in its inclusion in a future Notice of Proposed Amendments to revise the MUTCD. However, this Interim Approval does not guarantee adoption of the provisional device, either in whole or in part, in any future rulemaking that revises the MUTCD.
NOTES
1 https://ww2.arb.ca.gov/ghg-inventory-data
2 https://nepis.epa.gov/Exe/tiff2png.cgi/P100CZFP.PNG?-r+75+-g+7+D%3A%5CZYFILES%5CINDEX%20 DATA%5C11THRU15%5CTIFF%5C00000154%5CP100CZFP.TIF
3 https://www.washingtonpost.com/national/health-science/study-predicts-42-percent-of-americans-will-beobese-in-2030/2012/05/07/gIQAeaDL9T_story.html
RIALTO ACTIVE TRANSPORTATION PLAN 20
Chapter 2
EXISTING CONDITIONS
Overview
Demographics
Transportation Mode Share
Existing Land Use and Activity Centers
Roadway Conditions
Existing Bicycle Facilities and Current CIP Projects
Transit Routes and Stops
Safe Routes to School
OVERVIEW
Understanding the existing roadway conditions, demographics, land use, and other context-sensitive information in Rialto and the adjacent region is imperative for planning for its future. This chapter summarizes various datasets to provide meaningful discussions on how each of the topics support or impede pedestrian and bicycle facility development within the city.
This chapter also includes sections on Rialto’s land use, various relevant datasets such as bicycle and pedestrian collisions, and existing infrastructure. In addition to physical characteristics, data from the 2017 American Community Survey were used to analyze the demographic and commuting characteristics of the city’s residents. Each dataset provides valuable information that contributes to the comprehensive understanding of the street network and how to improve it.
DEMOGRAPHICS
According to the U.S. Census Bureau, Rialto has a population of 103,440 within its 22.35 square mile city boundary. The city has a population density of 4,437 people per square mile in 25,992 households.
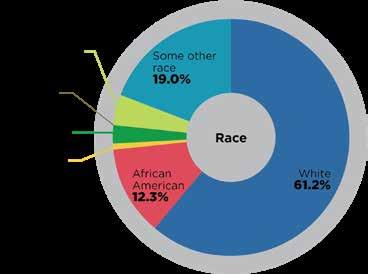
The population of Rialto is relatively young with 32 percent of the population being under the age of 19, while only 8 percent being classified as seniors (over the age of 65). The racial and ethnic makeup in Rialto is 61.2 percent White, 12.3 percent African American, 0.7 percent American Indian and Alaska Native, 2.5 percent Asian, 0.1 percent Native Hawaiian and Other Pacific Islander, 4.2 percent two or more races, and 19 percent of some other race. About 73 percent of the population identifies as Hispanic or Latino; this percentage is spread across all racial groups represented in the race chart below.
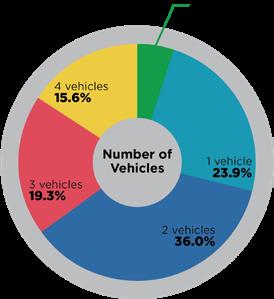
The median household income is $54,962. Of the households surveyed in 2017, a majority of households have access to one or more vehicles, with 1.5 percent reporting lacking access to a vehicle.
RIALTO ACTIVE TRANSPORTATION PLAN
TRANSPORTATION MODE SHARE
According to the U.S. Census 2017 American Community Survey, there are an estimated 41,397 workers in Rialto. Mode splits for workers’ commute trips are:
» Car: 93.4 percent
» Transit: 2.1 percent
» Walk: 0.6 percent
» Bicycle: 0.1 percent
» Work from Home: 3.0 percent
» Other Means: 0.8 percent
Over 93 percent of workers in Rialto drive to work. This suggests that investments in transit have the potential to change the methods used to make trips to non-motorized travel modes.
Walking Mode Share
The walking mode share measures the percentage of workers aged 16 years and over who commute to work by foot. Mode share reflects how well infrastructure and land-use patterns support travel to work by foot. In the city, walking mode share patterns are connected to the relative proximity of housing to employment centers.
Bicycling Mode Share
Similar to the walking mode share, bicycling mode share measures the percentage of resident workers aged 16 years and over who commute to work by bicycle.
Public Transit Mode Share
Transit mode share measures the percentage of workers aged 16 years and over who commute to work by transit. This mode share reflects how well first mile-last mile infrastructure, transit routes, and land-use patterns support travel to work by transit.
CHAPTER 2 » EXISTING CONDITIONS
Mode Share 23
Transportation
EXISTING LAND USE AND ACTIVITY CENTERS
Existing land use patterns in Rialto are defined by a fairly conventional urban street pattern of primarily low-density residential development interspersed with pockets of other land uses that include low-medium and medium density residential, institutional, commercial, and industrial (refer to Figure 2-1). The concentrations of general commercial and professional and administration offices occur primarily along major thoroughfares, such as Baseline Road, Valley Boulevard, Cedar Avenue, Riverside Avenue, and Casmalia Avenue. Concentrations of industrial facilities can be found on Rialto Avenue, Merrill Avenue, Cactus Avenue, Riverside Avenue, and Slover Avenue. Areas of major activity, including Downtown Rialto, Rialto Civic Center, Rialto Marketplace, and Renaissance Marketplace, among others, are designated as districts. Urban neighborhoods can be found primarily near these activity centers, especially north of downtown and along Baseline Road. Small pockets of open space can be found throughout major parts of the city, with a large dedicated area northeast of the 210 freeway.
In order to be eligible for State funding, a city’s bicycle and pedestrian plan must address connections between specific activity center types. These activity centers are essential destinations, including the community’s major employers, office buildings, industrial sites, government sites, retail centers, hospitals, religious facilities, tourist attractions, schools and parks. Identifying these centers, and their draw for the community, is essential to creating useful bicycle and pedestrian networks. It is important to site facilities that connect the places people actually want to frequent.
Activity centers in Rialto are spread throughout the City with commercial and office sites mostly concentrated along major and secondary arterials that include Riverside Avenue, Rialto Avenue, Valley Boulevard, Cedar Avenue, and Baseline Road (refer to Figure 2-2). Sites such as schools and parks are more evenly distributed throughout Rialto.
RIALTO ACTIVE TRANSPORTATION PLAN 24
CHAPTER 2 » EXISTING CONDITIONS 25
FIGURE 2-1: Land Use
ROADWAY CONDITIONS
The streets in Rialto are classified into a number of different categories, which is consistent with the City’s General Plan. The street network consists of major arterials, secondary arterials, and collector streets. The arterial streets provide city-wide, uninterrupted transportation to commuters. Two
major freeways intersect the city, including SR-210 and I-10. The minor streets primarily service the residential neighborhoods, many ending in cul-desacs near railroad, highways, and utility right-of-way corridors. The prevalence of major arterials within Rialto, as shown in Figure 2-2, underscores the need for defined facilities along the roadways with higher lane counts as they typically experience higher traffic volumes. It also identifies connector streets that may be good alternatives for bicycle facilities given their low lane count. The roadways were analyzed further to determine suitability.
Classification
RIALTO ACTIVE TRANSPORTATION PLAN 26
FIGURE 2-2: Street
SPEED LIMITS
The majority of Rialto’s busier corridors have posted speed limits of 25-35 and 40-50 miles per hour (mph), including major arterial streets for cross city traffic, as shown in Figure 2-3. Besides the high-volume streets, the city’s low speed streets have a posted speed limit of 25 mph, which makes them conducive to bicycle facilities, such as bicycle boulevards and neighborhood greenways, or shared bicycle routes.
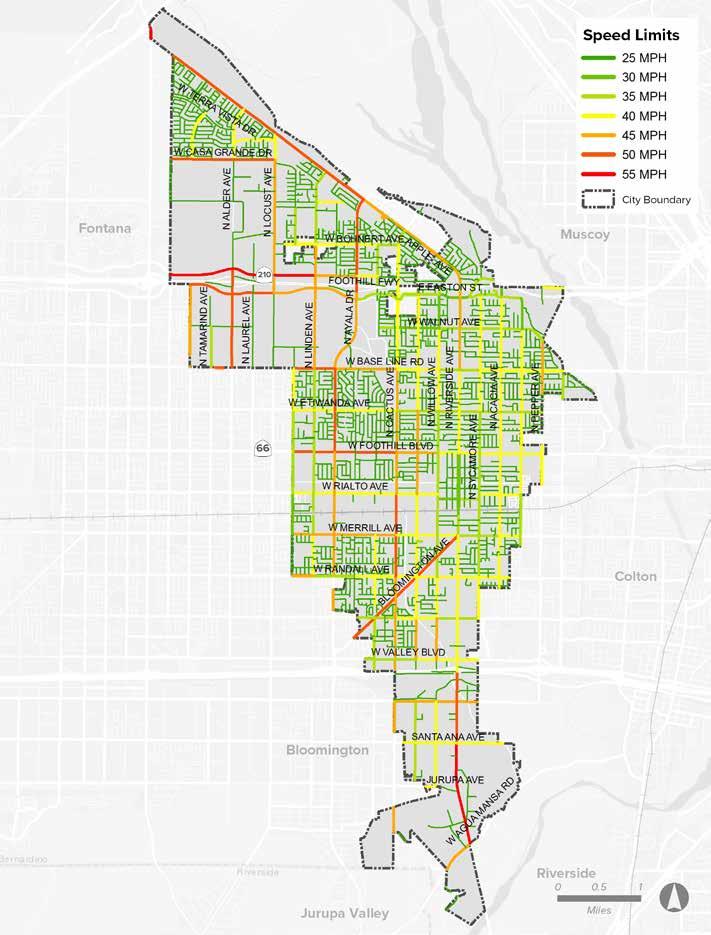
CHAPTER 2 » EXISTING CONDITIONS 27
FIGURE 2-3: Speed Limits
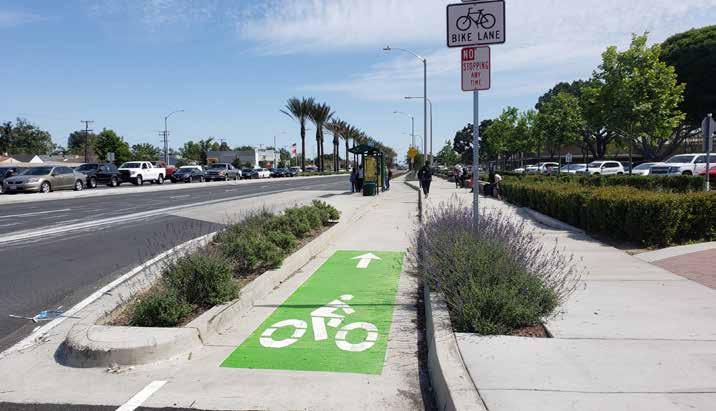
EXISTING BICYCLE FACILITIES AND CURRENT CIP PROJECTS
The existing bicycle facility network in Rialto is comprised of multi-use paths, bicycle lanes, and shared bicycle routes making up 14 miles of existing bikeways, as shown in Figure 2-4. Approximately 91 percent of the existing infrastructure are bike lanes and most of them are along Alder Avenue, Cedar Avenue, Cactus Avenue, Case Grande Drive, and Renaissance Parkway. The current Capital Improvement Projects (CIP) provides a foundation for the recommended bicycle network of this plan. This network was analyzed for connectivity within the city and with other surrounding jurisdictions, and was presented at the public workshops to gather additional input on routes they felt were important and which should move forward as recommendations.
RIALTO ACTIVE TRANSPORTATION PLAN 28
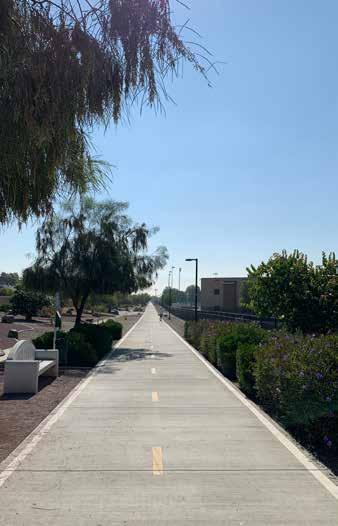
Pacific Electric trail multi-use path
Class II bike lane on Rialto Avenue
Class III bike route on Riverside Avenue
of the existing bicycle infrastructure in Rialto are Class II bike lanes
91%
CHAPTER 2 » EXISTING CONDITIONS 29
FIGURE 2-4: Existing and Previously Proposed Bikeways
TRANSIT ROUTES AND STOPS
There are six bus routes including Routes 10, 12, 14, 15, 19 and 22 in Rialto serviced by Omnitrans, San Bernardino’s largest transit operator. Other transit services include Fixed Routes, Community Shuttles, Intracounty Express Routes, and Metrolink Feeder Routes. As part of the analysis, these routes and stops were collected to ensure improving access to them was integrated into the plan as major destinations. Approximately two percent of workers in Rialto use public transit as their primary mode of transportation. The top five most demanding bus stops and average boardings in Rialto that have the highest average number of passengers are listed in Table 2-1.
Routes 10 and 14 both provide service to Fontana and San Bernardino. Route 15 provides service to Fontana, San Bernardino, Highland, and Redlands. Route 19 provides service to Fontana, Colton, Redlands, and Yucaipa. Route 22 provides service to North Rialto and the Ar rowhead Regional Medical Center (ARMC) lo cated in the city of Colton. Route 12 connects Highland Avenue to North Linden Avenue via Easton Street and West Renaissance Parkway. The re-route for Route 22 to Renaissance Mar ketplace connects Ayala Drive to Riverside Av enue via Renaissance Parkway, North Linden Avenue, Bohnert Avenue, Locust Avenue, Casa Grande Drive, Terra Vista Drive, Locust Avenue and Bohnert Avenue.
RIALTO ACTIVE TRANSPORTATION PLAN 30
BUS ROUTE BUS STOP LOCATION TOTAL AVERAGE NUMBER OF RIDERS 14 Foothill Blvd and Riverside Ave (Eastbound) 178 22 Riverside Ave and Foothill Blvd (Northbound) 151 22 Riverside Ave and Foothill Blvd (Southbound) 141 14 Foothill Blvd and Cedar Ave (Westbound) 115 14 Foothill Blvd and Riverside Ave (Westbound) 94
of workers use public transit as their primary mode of transportation to get to work
2.1%
TABLE 2-1: Top Five Bus Routes and Bus Stop Locations
CHAPTER 2 » EXISTING CONDITIONS 31
FIGURE 2-5: Transit Routes and Stops
SAFE ROUTES TO SCHOOL
The Rialto Safe Routes to School Program (SRTS Program) is a partnership program with the City of Rialto, Rialto Unified School District, and Rialto Police Department in an effort to promote walking and biking as safe and healthy ways to get to and from school in Rialto. The plan involves an extensive and inclusive community engagement process, identification and prioritization of school infrastructure improvements, as well as the development of programs and strategies to better educate and encourage students to walk and bike to school. The program includes a comprehensive “6 Es” plan that contains improved safety and mobility for all Rialto residents, especially the community’s students and youth, through engineering, education, encouragement, enforcement, equity, and evaluation recommendations.
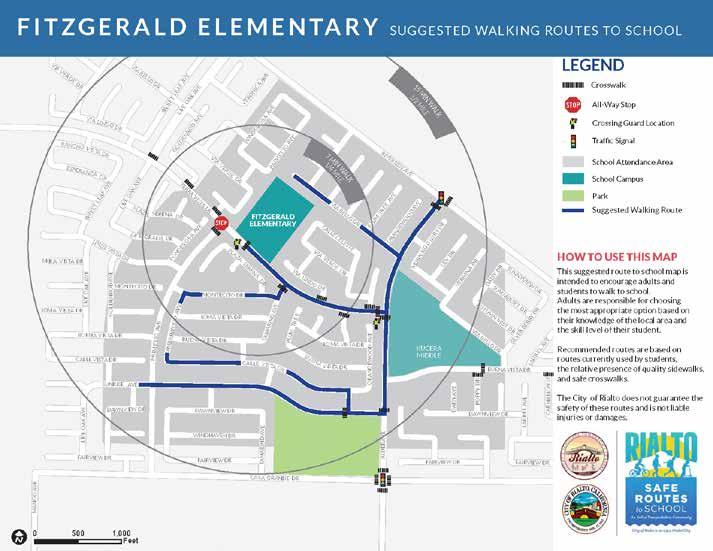
All 28 schools in the Rialto Unified School District were identified for inclusion in the SRTS Program. The prioritization process of the SRTS segments involved the collection of data for each school from multiple sources including walk assessment findings, location, roadway configuration, and engineering judgement. A number of behaviors were observed from the walk audits conducted that pose challenges to student safety including unsafe crossing and driving behaviors when leaving school after drop-off and pick-up, violation of traffic and parking regulations, and lack of secure bicycle parking structures that encourage bicycling as a mode of transportation to school. Figure 2-6 is a suggested walking route map to Fitzgerald Elementary School located off Terra Vista Drive. Fitzgerald Elementary was one of the schools identified as a high priority in the Rialto SRTS Plan.
RIALTO ACTIVE TRANSPORTATION PLAN 32
FIGURE 2-6: Fitzgerald Elementary Suggested Walking Routes to School
CHAPTER 2 » EXISTING CONDITIONS 33
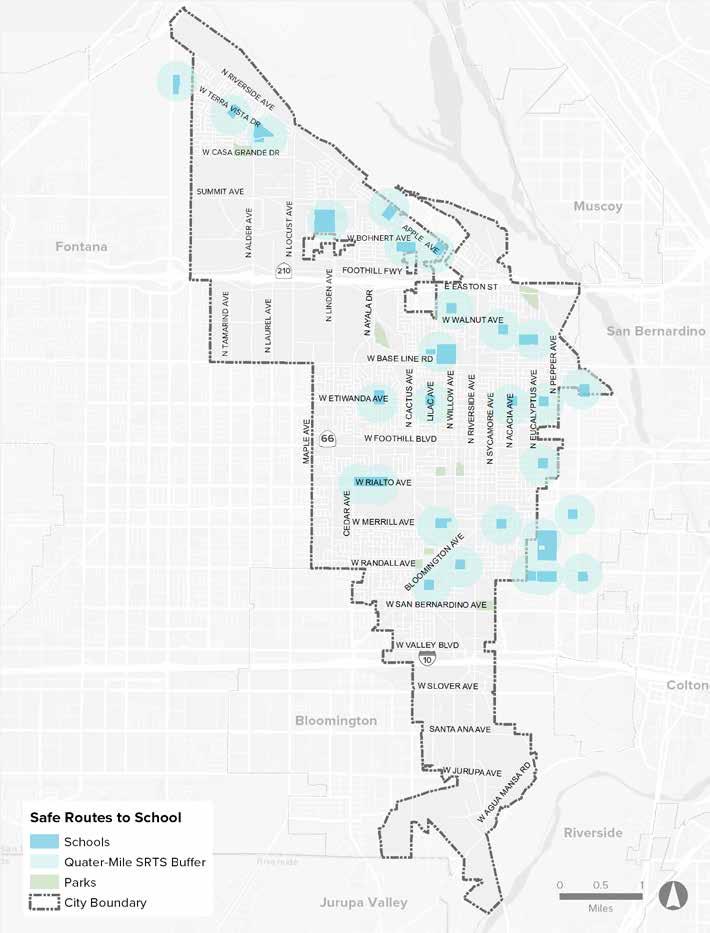
FIGURE 2-7: Quarter-mile buffer around schools in Rialto
Page intentionally left blank
RIALTO ACTIVE TRANSPORTATION PLAN 34
Chapter 3 ANALYSIS
Bicycle and Pedestrian Propensity Model
Level of Traffic Stress (LTS)
Safe Routes to Parks
First and Last Mile Assessment
Transit Needs
Social Equity
BICYCLE AND PEDESTRIAN PROPENSITY MODEL
To help define study focus areas and corridors, a Geographic Information Systems (GIS) model was created to reveal relationships between the many factors. A Bicycle-Pedestrian Priority Model (BPPM) was developed considering various inputs to establish where bicyclists and pedestrians are most likely to be, either currently or if improvements were to be made. The BPPM is comprised of three sub-models: Attractor, Generator, and Barrier Models. These three sub-models are then combined to create the composite Bicycle-Pedestrian Priority Model.
Attractors are essentially activity centers known to attract bicyclists and pedestrians. Examples are schools, transit stops, and shopping centers. Generators are developed from demographic data and address potential pedestrian and bicyclist volume based on how many people live and work within the study area. Examples of generators are population density, employment density, primary mode of transportation to work, and vehicle ownership. Barriers are features likely to discourage or detract
people from bicycling or walking. These are generally physical limitations, such as areas with high numbers of bicycle-related collisions, high vehicle volumes and speeds, and missing sidewalks.
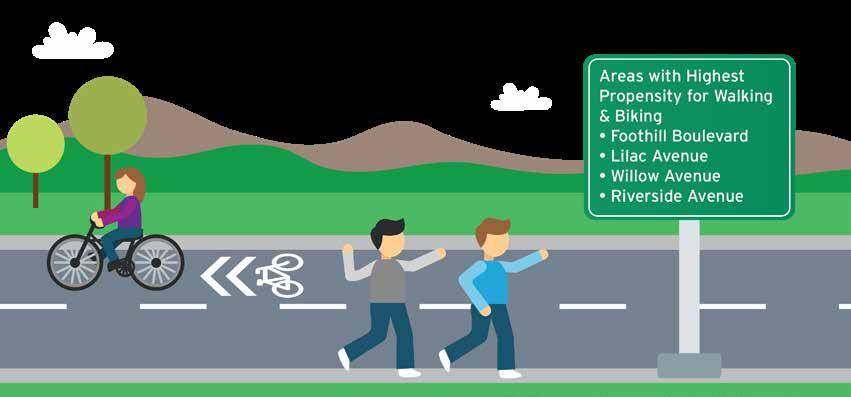
The resulting map displayed in Figure 3-1 was employed to aid in developing general improvements described in the following chapter. When comparing the input from public workshops, stakeholders, and project surveys, there was correlation between the high propensity areas for bicycling and walking with input provided.
The bicycle and pedestrian propensity map shows highest likely use along a number of major corridors, especially in downtown and central Rialto, including Foothill Boulevard, Cactus Avenue, Lilac Avenue, Riverside Avenue, Eucalyptus Avenue, Pepper Avenue, Rialto Avenue, Merrill Avenue, Bloomington Avenue, San Bernardino Avenue, and Valley Boulevard. However, bicycle and pedestrian propensity is not only concentrated on the major roadways, it also permeates into local streets that people tend to use frequently.
RIALTO ACTIVE TRANSPORTATION PLAN
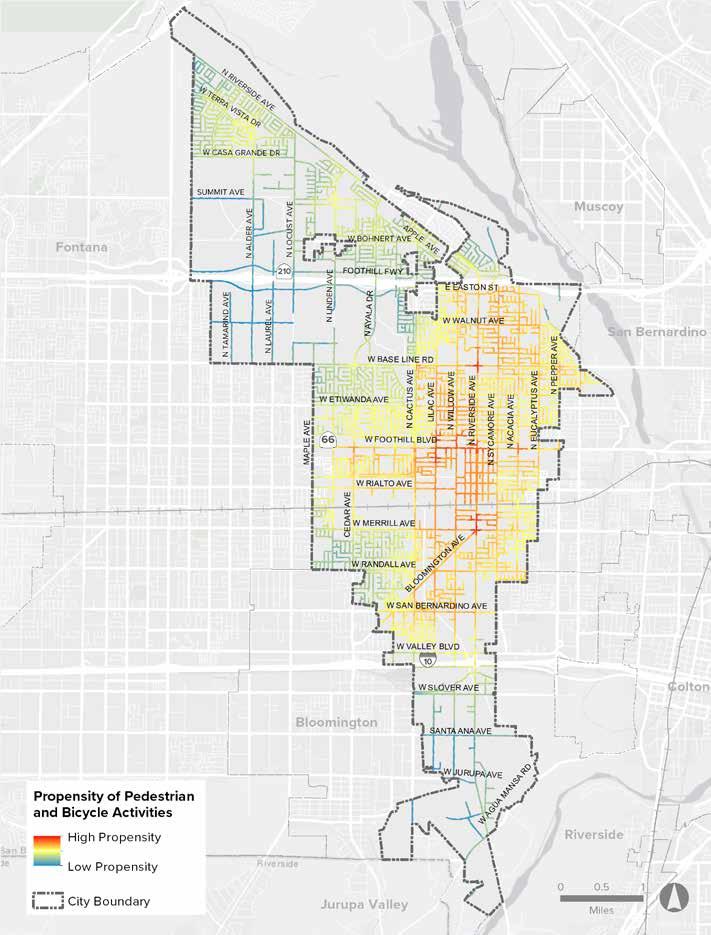
37 CHAPTER 3 » ANALYSIS
FIGURE 3-1: Bicycle and Pedestrian Propensity Model
LEVEL OF TRAFFIC STRESS (LTS)
The Bicycle Level of Traffic Stress (LTS) analysis is a GIS-based tool used to quantify a bicyclist’s perception of comfort given specific roadway conditions. Because different bicyclists have different tolerances for stress created by volume, speed, and proximity of automobile traffic, the LTS method identifies four levels of stress, from the most comfortable scenario to the least tolerable conditions. Bicycle Level of Traffic Stress (LTS) criteria span from 1 to 4, with 1 being the least stressful or most comfortable, and 4 being the most stressful. The analysis was applied to Rialto’s entire street network, as shown in Figure 3-2. Most of Rialto’s existing bikeways are located on Alder Avenue, Cedar Avenue, Casa Grande Drive, and Renaissance Parkway. All show a low level of traffic stress (LTS 1) with the exception of Cedar Avenue, showing a higher level of traffic stress (LTS 3) in which riding a bike is tolerated by confident riders. Most of Rialto’s major roadways that lack existing bicycle facilities, including Cactus Avenue, sections of Riverside Avenue, Foothill Boulevard, Merrill Avenue, Bloomington Avenue, and Valley Boulevard, all have the most stressful level of traffic (LTS 4). This means that only the most confident, experienced, and strong bicyclists are willing to ride on these facilities, while the other users may not feel safe and comfortable riding on the larger thoroughfares, as shown in the Bicycle User Classification System developed by the City of Portland. Low stress corridors can be found on the smaller neighborhood streets, as well as busier roadways, including Sycamore Avenue, Acacia Avenue, and Eucalyptus Avenue. Currently, these corridors lack bicycle facilities.
Bicycle User Classification System
Strong and Fearless
Enthused & Confident
Riding is a strong part of my identity and I am undeterred by traffic speed and volume, or other roadway conditions.
I am comfortable sharing the road with motor vehicles, but given a choice, I prefer to use bike lanes and boulevards.
Interested
I like riding a bike, but I don’t ride much. I would like to feel safer when I do ride, with less traffic and slower speeds.
I don’t ride at all due to inability, fear for my safety, or simply a complete and utter lack of interest.
RIALTO ACTIVE TRANSPORTATION PLAN 38
but
No Way, No How! 7% 60% 33% 1%
Concerned
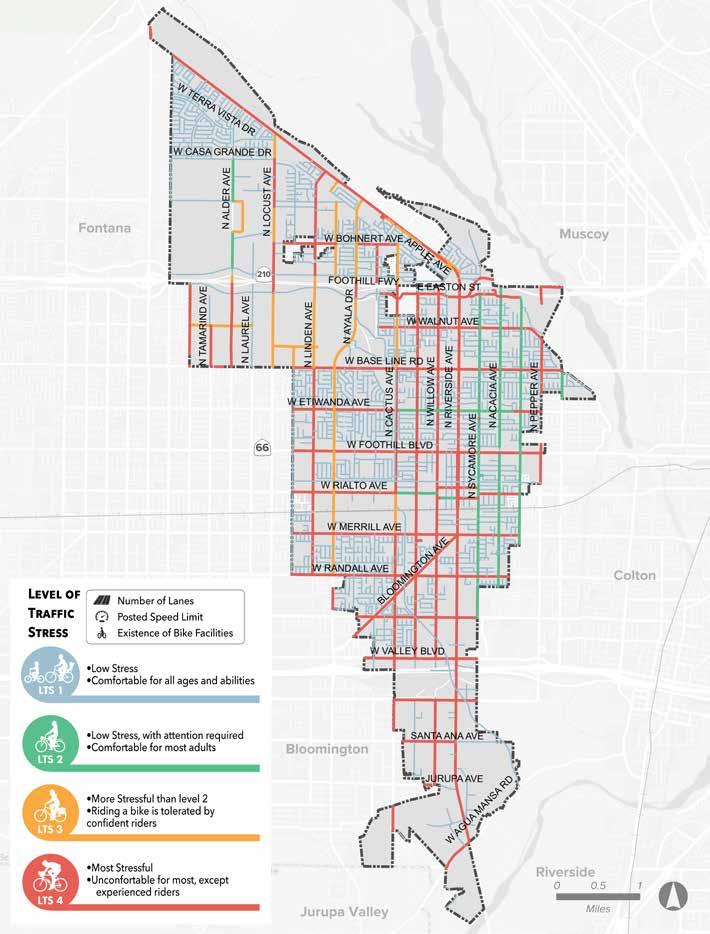
39 CHAPTER 3 » ANALYSIS
FIGURE 3-2: Level of Traffic Stress
SAFE ROUTES TO PARKS
The city has some of the best parks in San Bernardino County. Through the community engagement process, parks were the number one destination residents would like to see access through non-motorized modes. Safe Routes to Parks is a growing trend throughout the nation and funding is increasing to plan and implement more bicycling and walking amenities to parks. This analysis will be the basis of the pedestrian projects for Rialto’s Active Transportation Plan and will provide the city additional opportunities to pursue funding through various grant sources. This interim submittal identifies pedestrian needs within each of the Safe Routes to Parks (SRTPs) zones shown in Figure 3-3.
This section identifies a total of 11.4 miles of pedestrian improvements (missing sidewalks) and 130 curb ramp improvements (missing curb ramps). A needs assessment was developed using public input, onsite investigations, GIS analysis, and the city’s Safe Routes to School (SRTS) plan. The following pages include an overview of the recommended improvements inside each of the SRTPs Zones.
While the feasibility of improving all of the identified needs is difficult and costly, the city can leverage various funding sources to complete high priority improvements. As the city identifies areas of redevelopment or new development projects arise, the recommended improvements in this report can be incorporated into the projects. This enables the improvements to be built without city spending.
RIALTO ACTIVE TRANSPORTATION PLAN 40
NUMBER PARK NAME 1 Alec Fergusson Park 2 Rodger Birdsall Park 3 Jerry Eaves Park 4 Frisbie Park 5 Flores Park 6 Bud Bender Park 7 Margaret Todd Park 8 Andreson Park 9 Joe Sampson Park 10 Rialto City Park
TABLE 3-1: Park Names and Locations
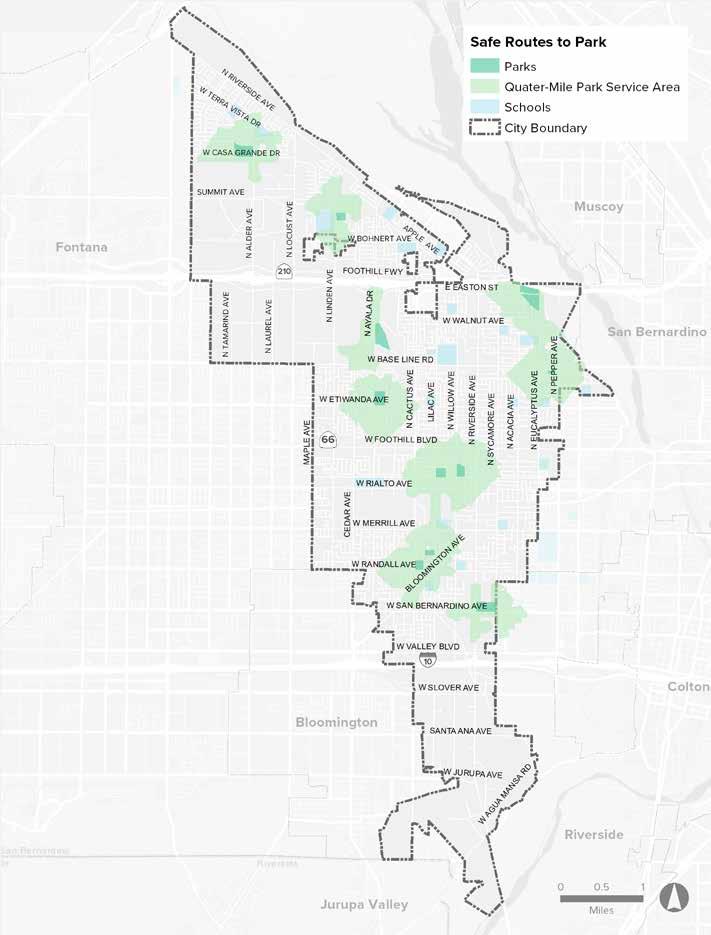
41 CHAPTER 3 » ANALYSIS
1 2 3 4 5 6 7 9 10 11 8
FIGURE 3-3: Safe Routes to Parks Zones
Half
- Mile Park Service Area
Curb Ramps
2 Feet of Sidewalk Improvements
2,456
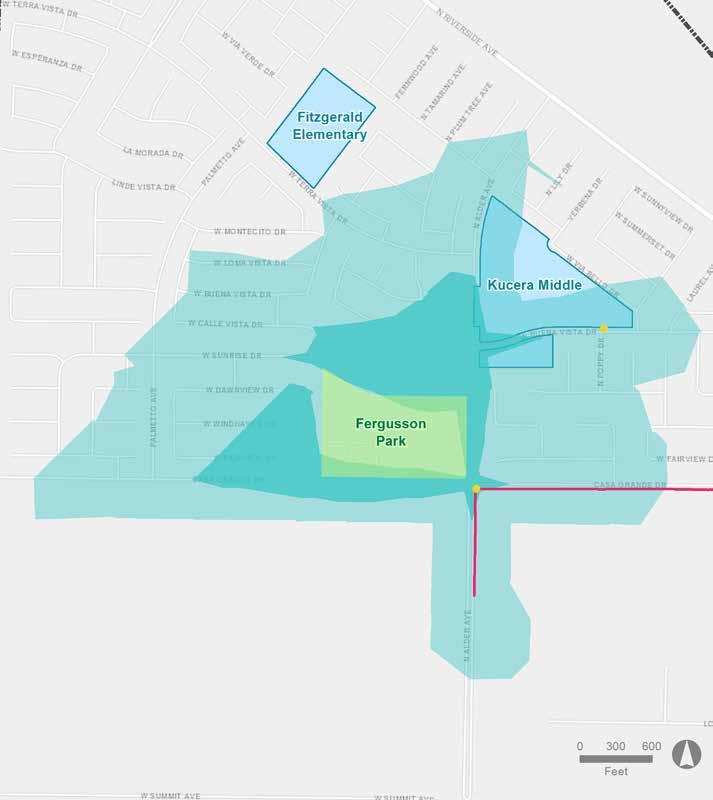
RIALTO ACTIVE TRANSPORTATION PLAN 42
FIGURE 3-4: Fergusson Park Pedestrian Needs
Curb Ramps
13 Feet of Sidewalk Improvements
16,550
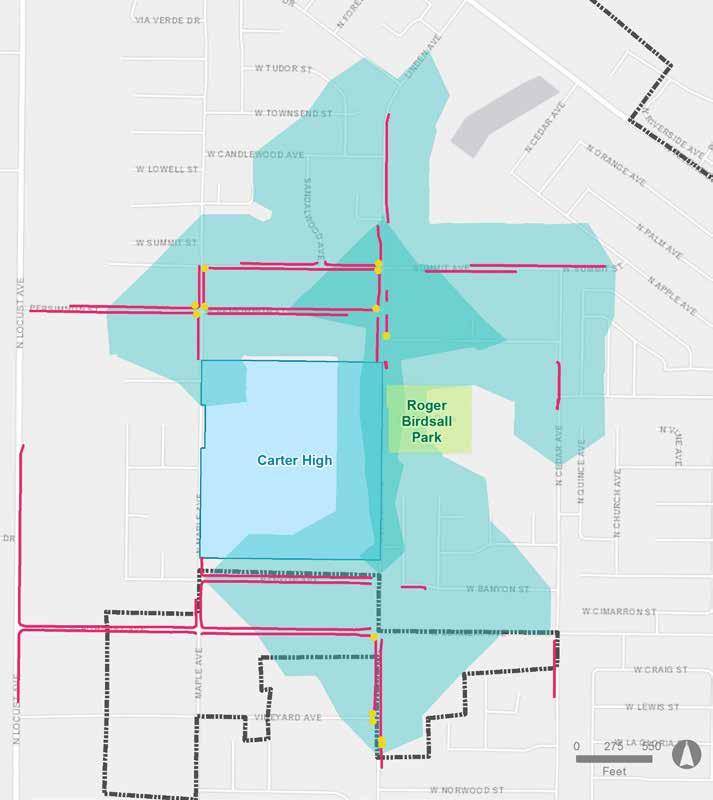
43 CHAPTER 3 » ANALYSIS
FIGURE 3-5: Roger Birdsall Park Pedestrian Needs
Curb Ramps
2 Feet of Sidewalk Improvements
6,217
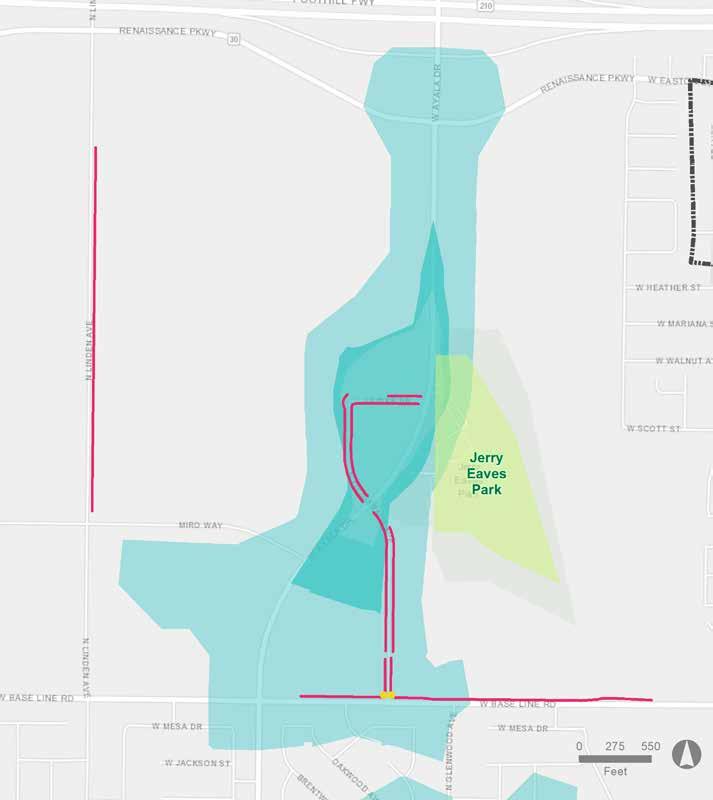
RIALTO ACTIVE TRANSPORTATION PLAN 44
FIGURE 3-6: Jerry Eaves Park Pedestrian Needs
Curb Ramps
46 Feet of Sidewalk Improvements
13,413
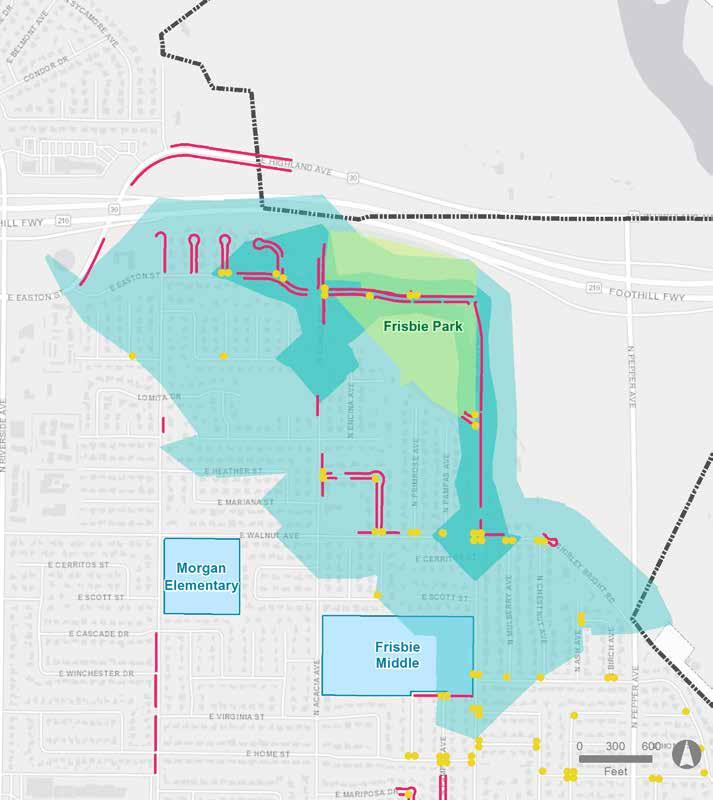
45 CHAPTER 3 » ANALYSIS
FIGURE 3-7: Frisbie Park Pedestrian Needs
28
Curb Ramps
714
Feet of Sidewalk Improvements
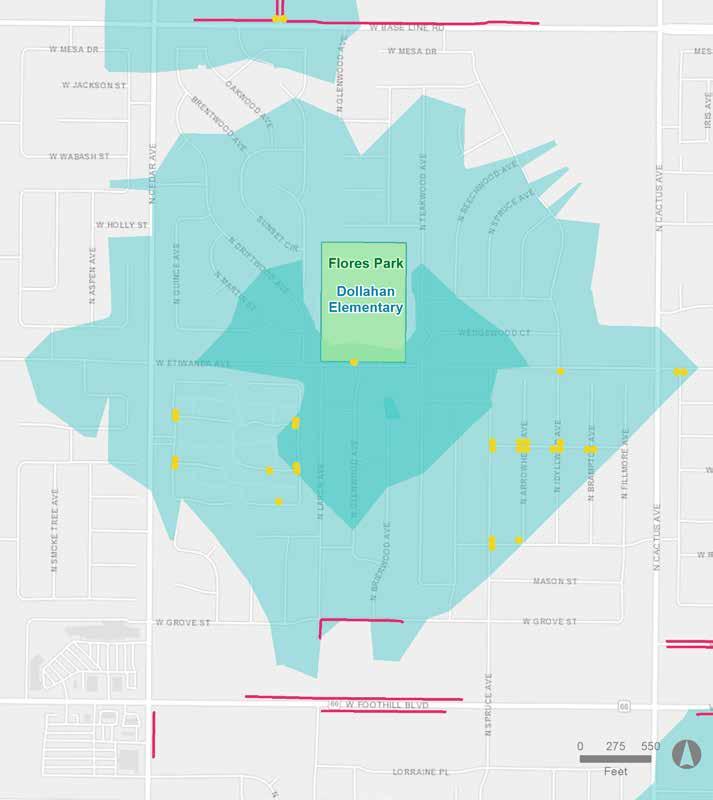
RIALTO ACTIVE TRANSPORTATION PLAN 46
FIGURE 3-8: Flores Park Pedestrian Needs
Curb Ramps
27 Feet of Sidewalk Improvements
9,770
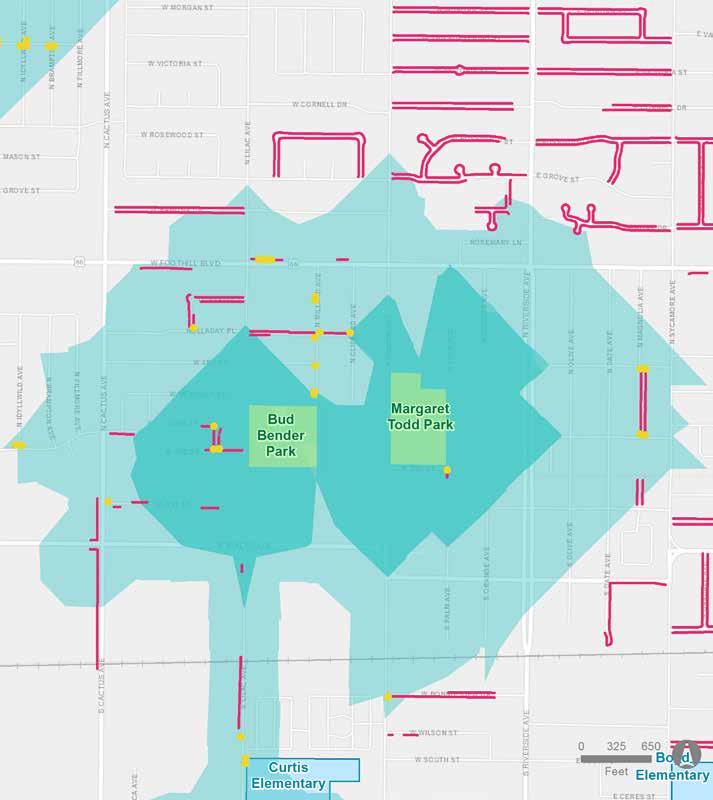
47 CHAPTER 3 » ANALYSIS
FIGURE 3-9: Bud Bender Park and Margaret Todd Park Pedestrian Needs
Curb Ramps
5 Feet of Sidewalk Improvements
7,423
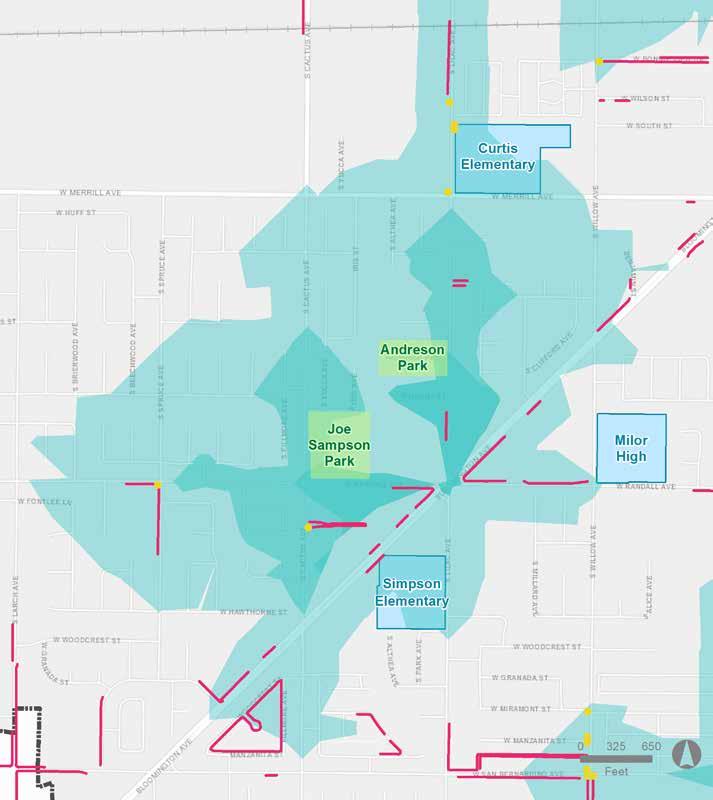
RIALTO ACTIVE TRANSPORTATION PLAN 48
FIGURE 3-10: Andreson Park and Joe Sampson Park Pedestrian Needs
Curb Ramps
7 Feet of Sidewalk Improvements
3,885
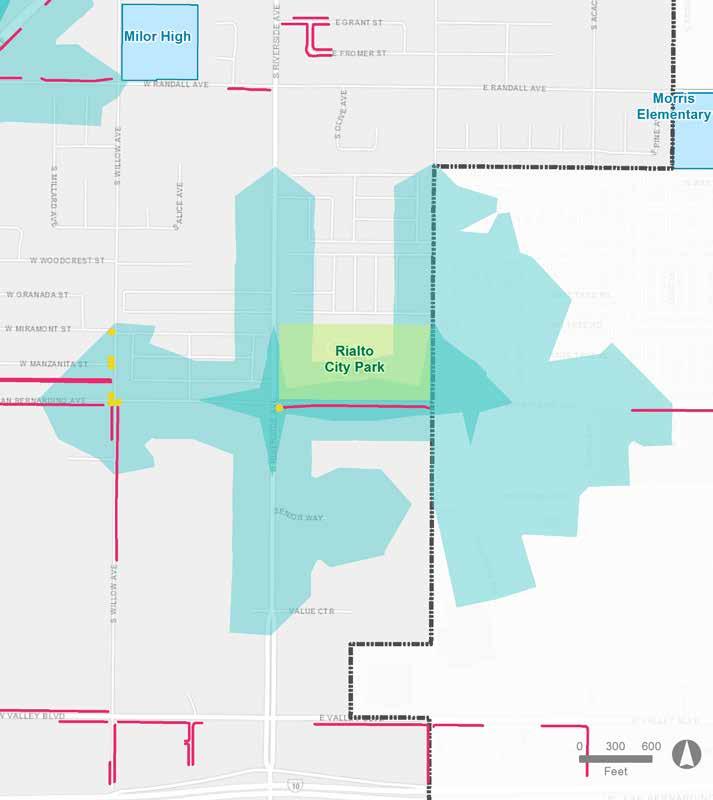
49 CHAPTER 3 » ANALYSIS
FIGURE 3-11: Rialto City Park Pedestrian Needs
FIRST AND LAST MILE ASSESSMENT
The First and Last Mile Assessment targets the conditions potentially affecting transit use levels within specified distance from high ridership locations. It evaluates how to effectively link people to and from transit stops to their origins and destinations, specifically addressing the proverbial last mile at each end of their journey where suitable facilities are often lacking.
Stations were identified based on the following criteria:
» Ridership: High ridership volumes
» Adjacent Land Use: Based on survey results such as Downtown Rialto, retail, schools and parks
» Proximity of Non-motorized Collisions: Locations with a history of nearby bicycle and pedestrian collisions
» Geographic Distribution: Equitable distribution around the city to cover various street and land use types
» Future Stops and Routes: Proposed Rapid Transit stops and new and/or updated bus routes
TABLE 3-2: Transit Stop Locations
Understanding that public transportation rarely stops directly in front of a passenger’s origin or destination is important to ensure transit users have the required non-motorized infrastructure to help encourage them to get to and from their transit stop by walking or bicycling, or using a wheelchair, skateboard, or scooter.
This First and Last Mile analysis employs GIS spatial analysis to determine walking and bicycling distances to transit stops based on actual street and sidewalk data. Figure 3-12 depicts those distances based on a half mile walkshed. This section identifies a total of 21.1 miles of pedestrian improvements (missing sidewalks) and 47 curb ramp improvements (missing curb ramps). Needs were developed using public input, on-site investigations, GIS analysis, and the city’s Safe Routes to School (SRTS) plan. The map shows that a number of the city’s schools and parks are located outside of a half mile walking distance of existing transit stops.
Note that all of the high-volume transit stops fall within the high to medium propensity range as mentioned in the Bicycle and Pedestrian Propensity Model section, indicating that active transportation infrastructure improvements may be needed to help people more safely reach their preferred transit stops.
Large commercial and multi-family residential adjacent land use. High transit use and proposed Rapid Transit stop at Cedar. Along Route 12 on Linden.
RIALTO ACTIVE TRANSPORTATION PLAN 50
NUMBER LOCATION NOTES 1 Carter High / Birdsall Park Suburban setting. Analysis would overlap with Safe Routes to School & Safe Routes to Park Analysis. 2 Renaissance at Linden Along Omnitrans Routes 12 &22. Bus stop exists. For future planning purposes. 3 Riverside at Easton Residential and commercial setting. 210 Freeway access with history of bike/ pedestrian collisions. Along Routes 12 & 22. 4 Baseline at Riverside Residential and commercial setting. History of bike/pedestrian collisions. 5 Baseline at Ayala Residential, industrial, and commercial setting. History of bike/ped collisions. 6 Riverside at Foothill Edge of Downtown Rialto. Residential and commercial setting. Highest intersection with transit use. 7 Metrolink Station The city’s major regional connector. 8 Riverside at Merrill May overlap with Boyd Elementary and Curtis Elementary Safe Routes to School Analysis. Commercial and residential setting with high transit ridership. 9 Riverside at San Bernardino May overlap with Rialto
and residential setting. High transit use. 10 Valley at Riverside Commercial and industrial setting. Freeway crossing constraints and bike/ped collisions in close proximity. 11 San Bernardino at Bloomington Rural residential, single family residential, and commercial. 12 & 13 Foothill at Linden and Foothill at Cedar
City Park Safe Routes to Parks Analysis. Commercial, industrial,
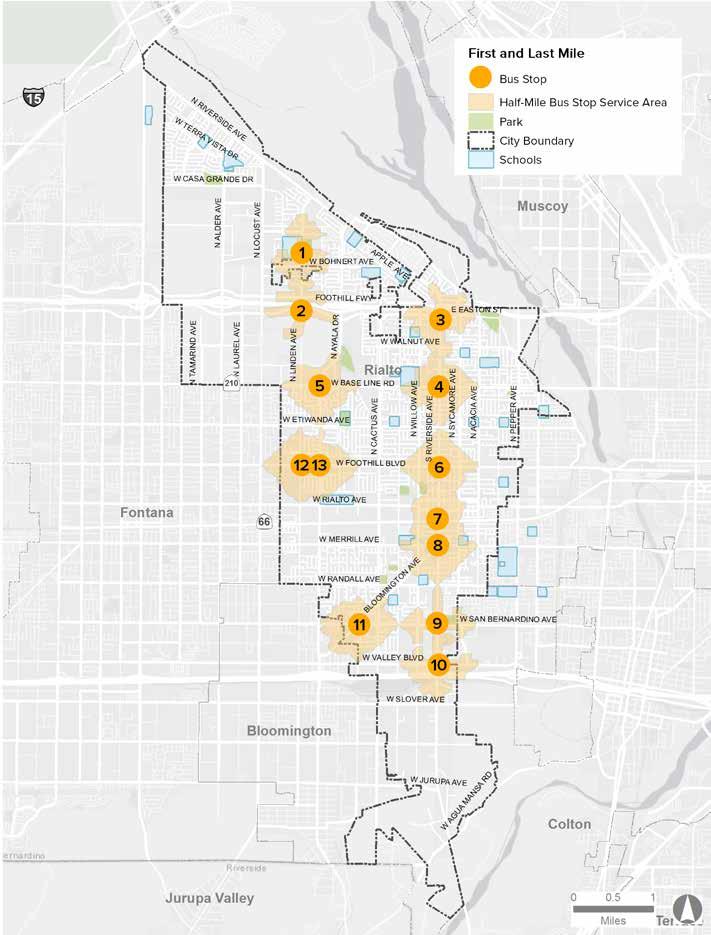
51 CHAPTER 3 » ANALYSIS
FIGURE 3-12: First and Last Mile Assessment
Curb Ramps
13 Feet of Sidewalk Improvements
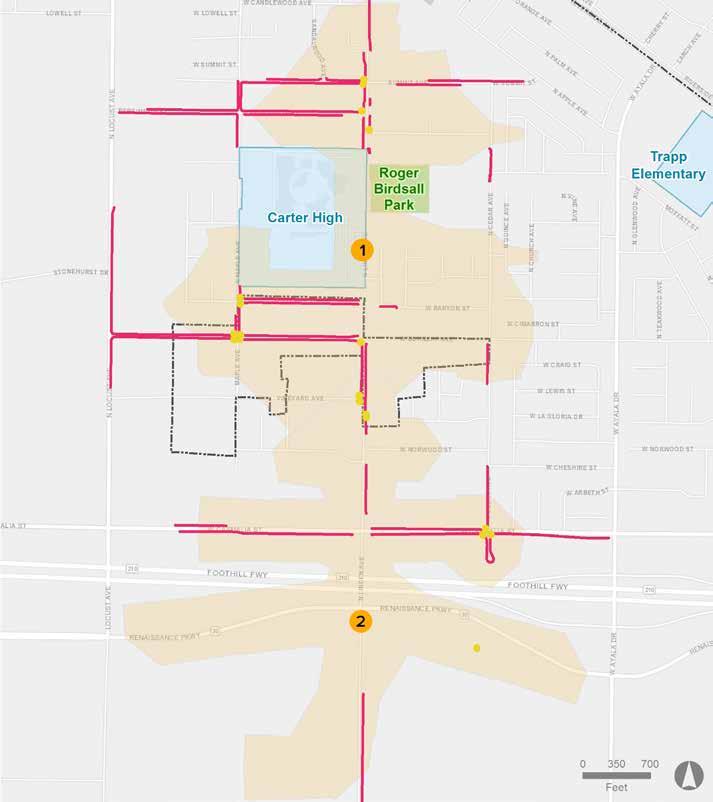
23,441
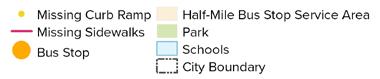
RIALTO ACTIVE TRANSPORTATION PLAN 52
FIGURE 3-13: Carter High/Birdsall Park (1) and Renaissance at Linden (2) First and Last Mile Needs
Curb Ramps
5 Feet of Sidewalk Improvements
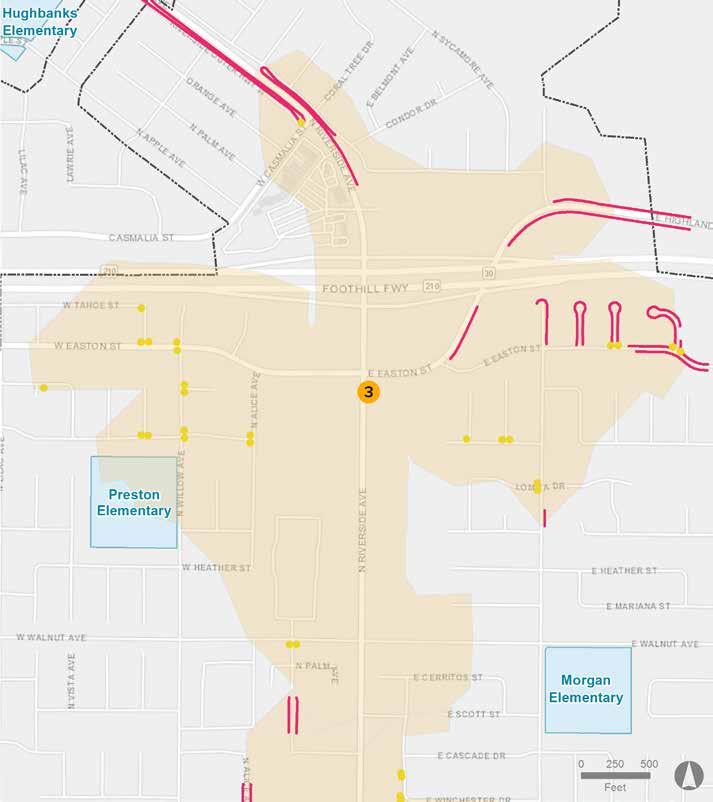
7,796
53 CHAPTER 3 » ANALYSIS
FIGURE 3-14: Riverside at Easton (3) First and Last Mile Needs
0
Curb Ramps
910
RIALTO ACTIVE TRANSPORTATION PLAN 54
Feet of Sidewalk Improvements
FIGURE 3-15: Baseline at Riverside (4) First and Last Mile Needs
Curb Ramps
2 Feet of Sidewalk Improvements
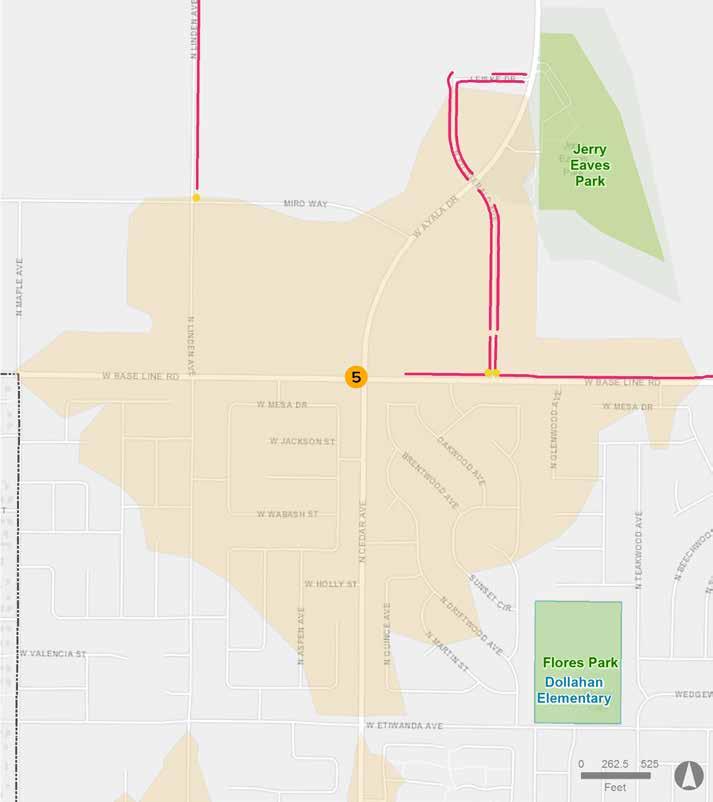
6,226
55 CHAPTER 3 » ANALYSIS
FIGURE 3-16: Baseline at Ayala (5) First and Last Mile Needs
Curb Ramps
13 Feet of Sidewalk Improvements
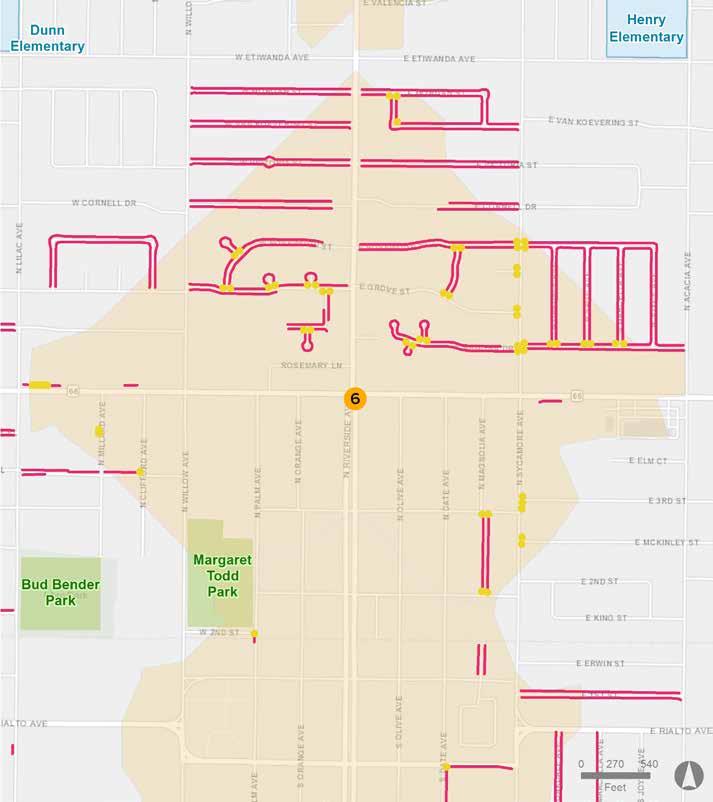
26,065
RIALTO ACTIVE TRANSPORTATION PLAN 56
FIGURE 3-17: Riverside at Foothill (6) First and Last Mile Needs
Curb Ramps
3 Feet of Sidewalk Improvements
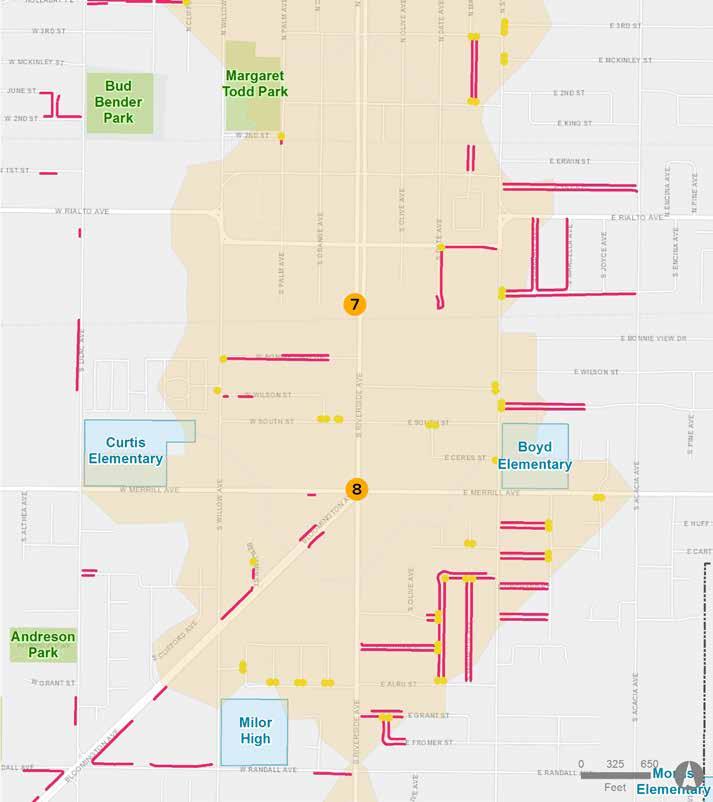
19,500
57 CHAPTER 3 » ANALYSIS
FIGURE 3-18: Metrolink Station (7) and Riverside at Merrill (8) First and Last Mile Needs
Curb Ramps
7 Feet of Sidewalk Improvements
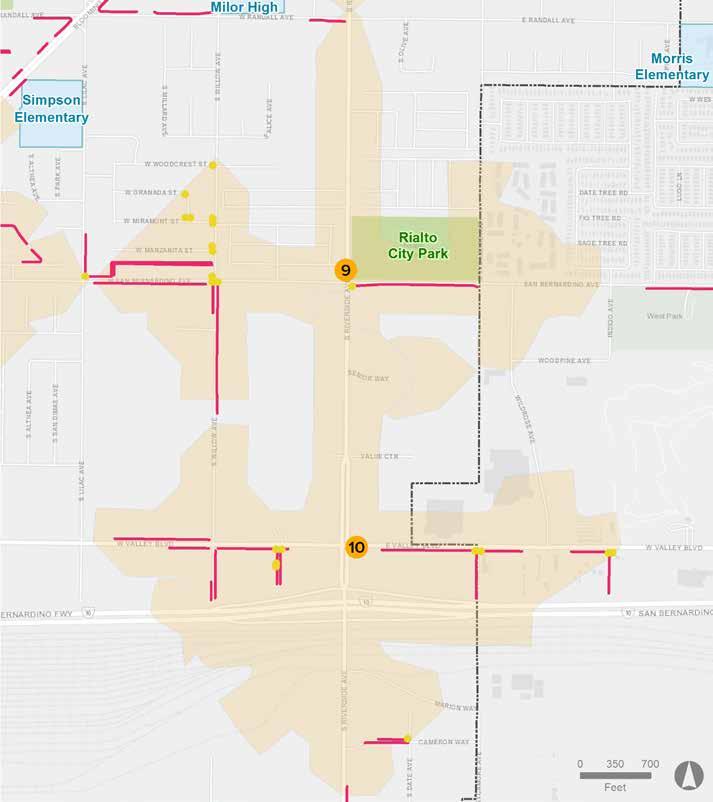
12,494
RIALTO ACTIVE TRANSPORTATION PLAN 58
FIGURE 3-19: Riverside at San Bernardino (9) and Valley at Riverside (10) First and Last Mile Needs
Curb Ramps
0 Feet of Sidewalk Improvements
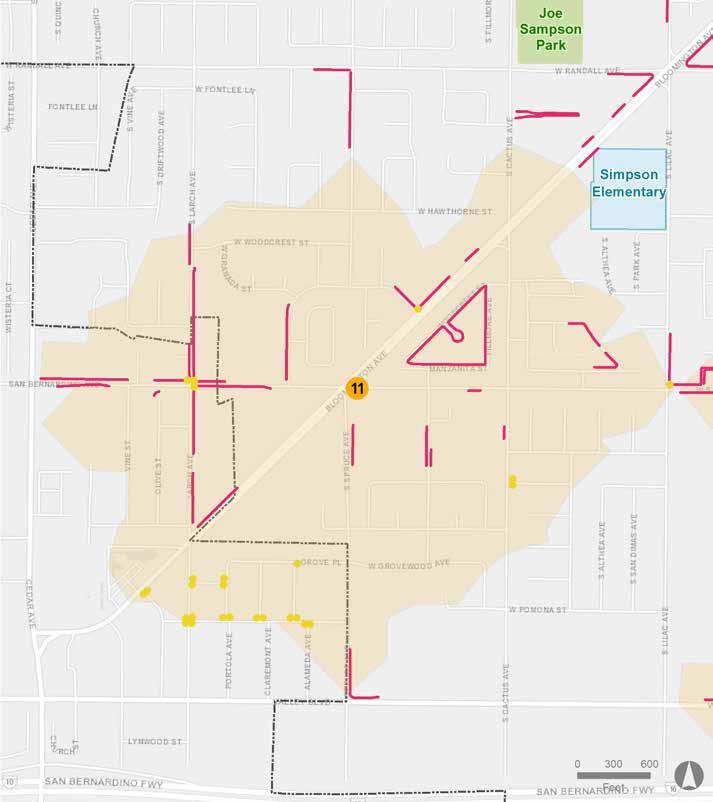
11,204
59 CHAPTER 3 » ANALYSIS
FIGURE 3-20: San Bernardino at Bloomington (11) First and Last Mile Needs
Curb Ramps
4 Feet of Sidewalk Improvements
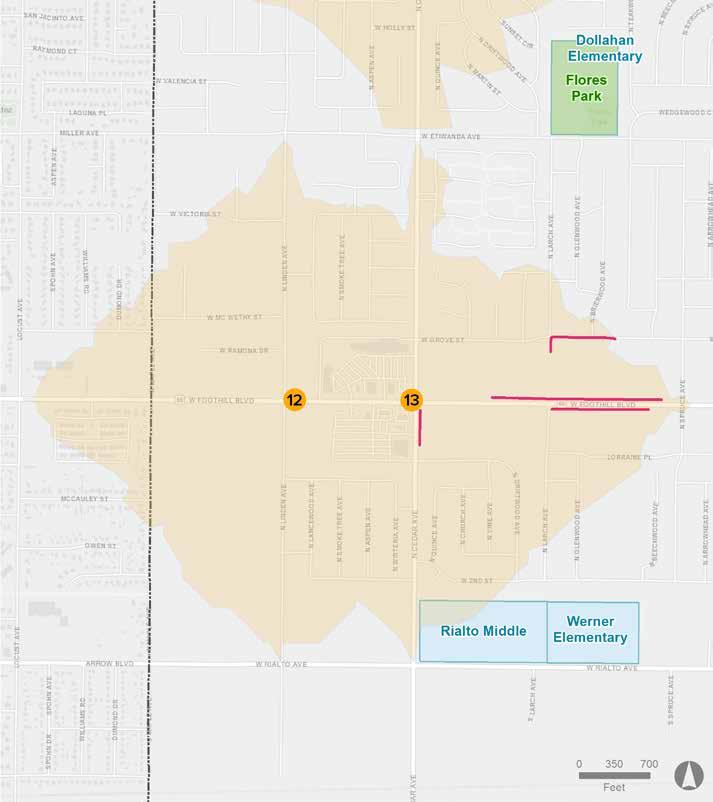
3,751
RIALTO ACTIVE TRANSPORTATION PLAN 60
FIGURE 3-21: Foothill at Linden (12) and Foothill at Cedar (13) First and Last Mile Needs
TRANSIT NEEDS
There are six bus routes including Routes 10, 12, 14, 15, 19 and 22 in Rialto serviced by Omnitrans, San Bernardino’s largest transit operator. Other transit services include fixed routes, community shuttles, intracounty express routes, and Metrolink feeder routes. There is also re-route for Route 22 to Renaissance Marketplace.
According to the U.S. Census Bureau, approximately two percent of workers in Rialto use public transit as their primary mode of transportation. As part of this analysis, three vanpool route options are being proposed to increase access to public transit and better serve the needs of commuters within the city. Vanpools are an element of the transit system that allow groups of people to share the ride similar to a carpool, but on a slightly larger scale. There are many benefits to vanpool including the following:
» Concurrent savings in fuel and vehicle operating costs
» Flexibility in stops and less overall stops, therefore increasing frequency
» Reduced commute times and work-related stress
» Reliability of service
» Build relationships with co-workers, neighbors, and members of the community
» Ability to use HOV lanes and receive preferred parking at most work sites
» Reduction in greenhouse gases and the number of vehicles on a roadway
VANPOOL CASE STUDIES
County of San Bernardino
A number of surrounding counties offer vanpool programs or something similar, including San Bernardino, San Diego and Orange counties. The County of San Bernardino offers a Vanpool Program through Enterprise, North America’s largest vanpool provider. The purpose of this program is for people to share the ride from home or one or more common meeting locations and travel together to a common destination or work area. San Bernardino’s vanpool program consists of at least
five members and a maximum of 14. Vanpool rates are typically based on mileage, fuel, the number of members in each vanpool vehicle, and the size of the vanpool vehicle itself. Employees who participate in the county’s Vanpool Program, may also be eligible to receive a pre-tax payroll deduction.
Omnitrans
Omnitrans is undergoing a new microtransit program which is being proposed for Fall 2020 to replace the current fixed route to Chino Hills. Microtransit is an on-demand service that offers flexible routing and flexible scheduling of vehicles. Omnitrans microtransit service would be operated by a contractor and would essentially function like a curb-to-curb service where passengers can call for their service via smartphone ahead of time by purchasing and reserving rides with an app.
Riverside County Transportation Commission (RCTC)
Eligible vanpools that participate in RCTC’s VanClub can receive up to $400 per month towards the cost of their vanpool lease, including vehicle maintenance, roadside assistance, and insurance. As part of their program, RCTC subsidizes qualified Enterprise Rideshare vanpools on an ongoing basis. In order to satisfy minimum requirements, individuals must commute more than 30 miles each day or commute 12 or more days each month, and must also be willing to share their commute with at least four co-workers and other riders.
RCTC’s Vanpool program also partners with the California Vanpool Authority (CalVans) to subsidize eligible vanpools. Agricultural workers, college and vocational students, and generally cost-conscious commuters are eligible to participate in CalVans. Vanpools formed by CalVans in the RCTC service area may also be eligible to receive up to $400 per month to offset the cost of the lease.
61 CHAPTER 3 » ANALYSIS
Orange County Transportation Authority (OCTA)
In addition to these programs, the Orange County Transportation Authority (OCTA) currently provides a $400 subsidy to vanpool groups enrolled in OC Vanpool. Similar to the County of San Bernardino’s Vanpool Program, the vehicles registered with OC Vanpool are leased, maintained, and insured by their contractor, Commute with Enterprise. In addition, OCTA reports miles traveled through OC Vanpool and other relevant data to the National Transit Database and receives reimbursement for the costs they allocate towards subsidizing vanpool groups.
San Diego Association of Governments (SANDAG)
iCommute, the Transportation Demand Management (TDM) program for the San Diego region administered via SANDAG, encourages use of transportation alternatives to help reduce traffic congestion and greenhouse gas emissions. iCommute manages the SANDAG Vanpool Program, which provides a comfortable, cost-effective, and convenient way for groups of five or more people to get to work in and around the San Diego region. San Diego vanpool participants typically spend less than $100 per month to get to work. The SANDAG Vanpool Program, like OC Vanpool and RCTC VanClub, provides a subsidy of up to $400 per month to offset the lease price of a vanpool vehicle.
Similar to these initiatives, the City of Rialto should consider working with Omnitrans to coordinate vanpool efforts such as conducting a pilot program comparable to these case studies. Another recommendation is to research and obtain funding to expand routing and increased frequency of existing transit routes throughout the city to improve current transit services and conditions for residents.
Through input from the Technical Advisory Committee, proposed vanpool routes should not duplicate existing transit routes. Three general vanpool routes were then developed to access various areas of the City where existing transit routes do not or have very little access. The three vanpool route options are displayed in Figure 3-22 on page 63 and described in greater detail below:
» Option Route 1 follows existing Route 22 located on Riverside Avenue where it connects to North Locust Avenue and travels south where it then meets West Randall Avenue via Etiwanda Avenue and Cedar Avenue. This vanpool route option connects to several destinations including commercial shopping centers along Riverside Avenue and Cedar Avenue, Downtown Rialto, as well as several industrial sites along Locust Avenue. This route also provides connectivity to its neighboring community- the City of Fontana located west outside of Rialto’s city boundary.
» Option Route 2 follows Riverside Avenue and North Eucalyptus Avenue via Merrill Avenue. The route continues to meet North Cactus Avenue via West Walnut Avenue, Casmalia Street, Locust Avenue, and West Baseline Road. This vanpool option connects to destinations including several industrial sites along Riverside Avenue, Locust Avenue, Baseline Road, Cactus Avenue, and Valley Boulevard.
» Option Route 3 provides connectivity to several surrounding communities outside of the City’s boundary including, Colton and Bloomington. This route follows Eucalyptus Avenue and loops around central Rialto via Etiwanda Avenue, Cedar Avenue, Slover Avenue, and Valley Boulevard where it then meets Eucalyptus Avenue again. This vanpool option connects to destinations including commercial businesses along Eucalyptus Avenue and both commercial and industrial sites along Cedar Avenue as well as industrial sites along Slover Avenue.
RIALTO ACTIVE TRANSPORTATION PLAN 62
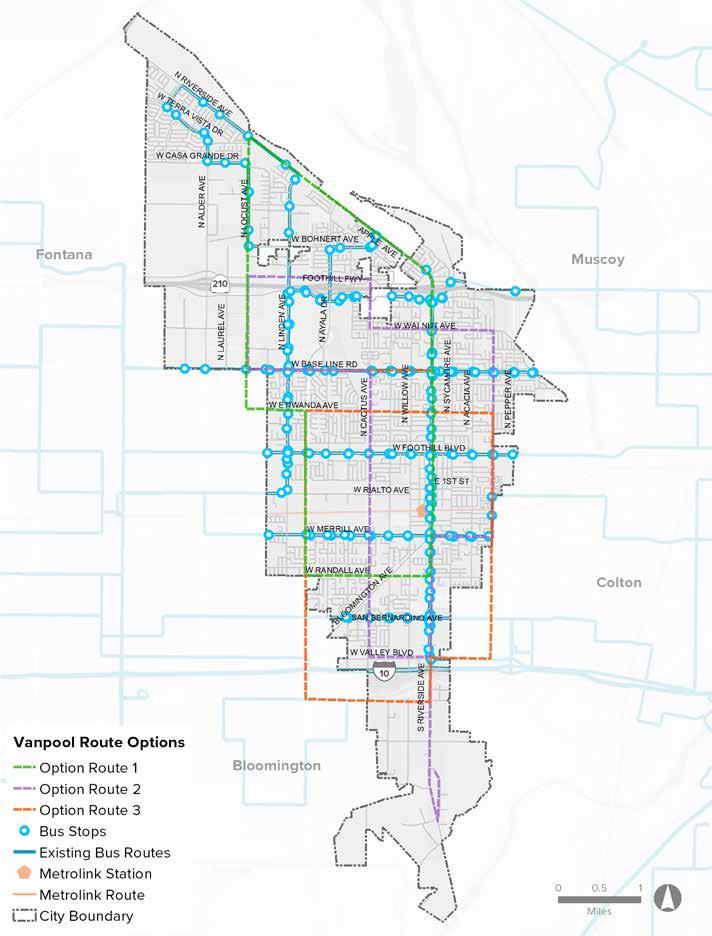
63 CHAPTER 3 » ANALYSIS
FIGURE 3-22: Vanpool Route Options
SOCIAL EQUITY
Identifying barriers that hinder access to transit in disadvantaged communities can help improve and attain social equity in undeserved areas. For this assessment, various sources of data were analyzed including CalEnviroScreen 3.0, US Census and American Community Survey, California Health Interview Survey (CHIS), and Free and Reduced-Price School Meals Program. Data and analyses from these sources are critical in leveraging funds from not only the Caltrans ATP grant, but other funding sources including urban greening and sustainable community grants.
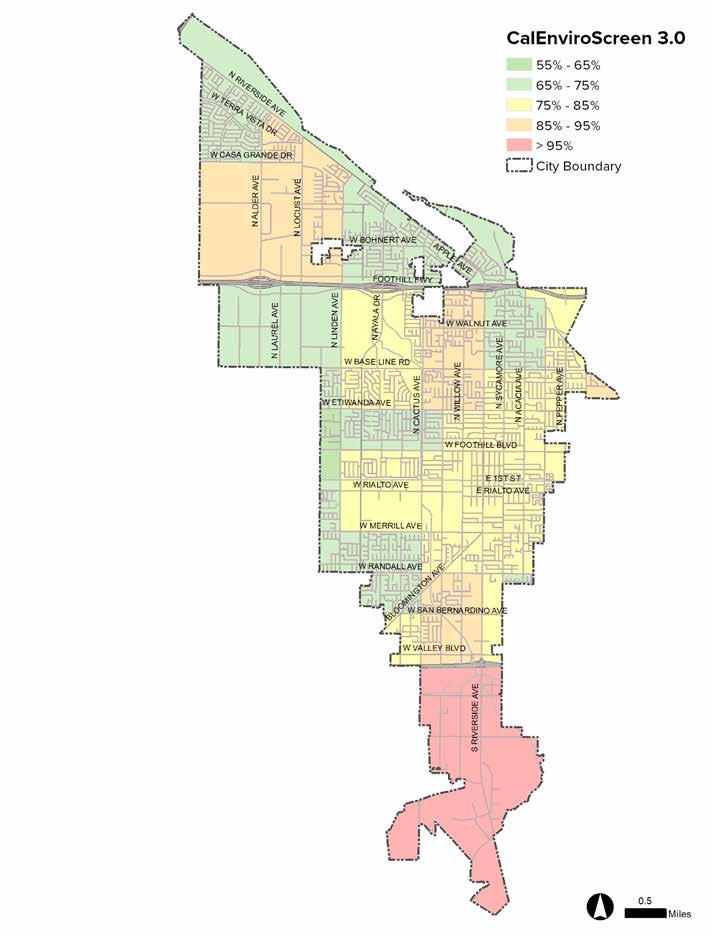
CALENVIROSCREEN 3.0
CalEnviroScreen identifies California communities by census tract that are disproportionately burdened by, and vulnerable to, multiple sources of pollution. Identifying pollution burdened communities is a critical step towards improving public health, quality of life, and economic opportunity while reducing pollution that causes climate change. Disadvantaged communities are defined as the top 25% scoring areas from CalEnviroScreen. According to this data, 62.9% of Rialto falls within the top 25% score area with high amounts of pollution.
RIALTO ACTIVE TRANSPORTATION PLAN 64
FIGURE 3-23: CalEnvrioScreen 3.0
Figure 3-23 shows the pollution burden present throughout Rialto.
US CENSUS & AMERICAN COMMUNITY SURVEY (ACS)
The American Community Survey (ACS) is an ongoing survey that provides vital information on a yearly basis about the nation and its residents. Through ACS, we can identify specific data about communities including demographics such as median household income, transportation mode share, and more.
To qualify as a disadvantaged community through the California Department of Transportation (Caltrans), household income must be less than or equal to $51,026. According to US Census data, 27 out of 71 census tracts in the City of Rialto have an income that falls below $51,026.
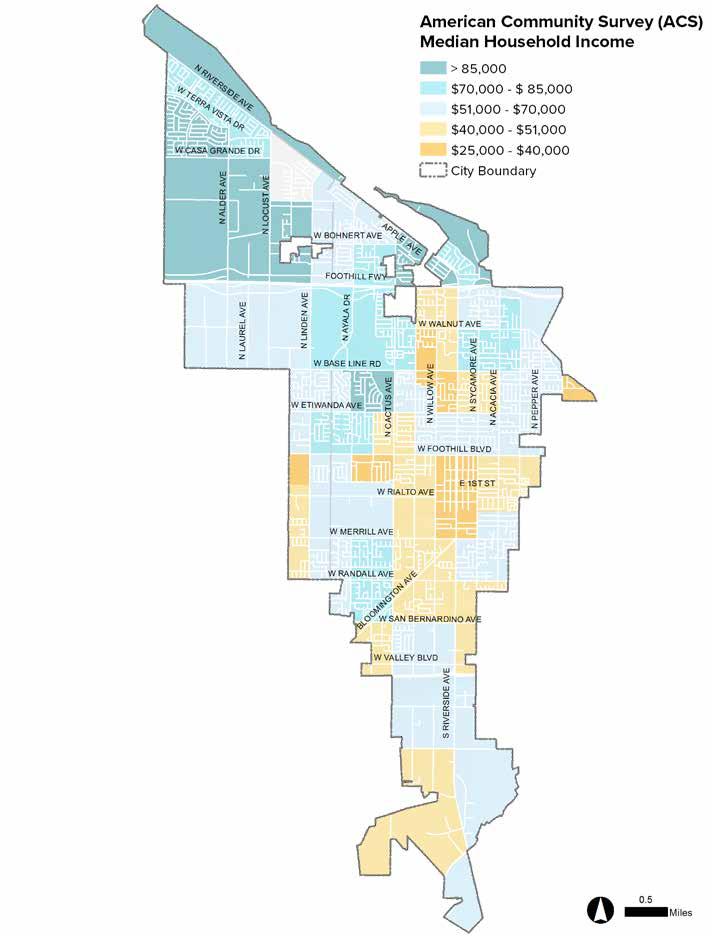
65 CHAPTER 3 » ANALYSIS
FIGURE 3-24: US Census and American Community Survey (ACS)
CALIFORNIA HEALTH INTERVIEW SURVEY (CHIS)
CHIS is the nation’s largest state health survey. CHIS is a web and telephone survey conducted on a continuous basis and covers a wide range of health topics including health status, asthma, obesity, and physical activity. The infographics to the right represents CHIS data from 2014 that illustrates a comparison of Rialto to San Bernardino and to the state of California as a whole.
FREE & REDUCED PRICE SCHOOL MEALS (FRPM) PROGRAM
The State Meal Program is a child nutrition program funded by California. The program provides funding to public school districts and county superintendents of schools that serve nutritious meals, free or at a reduced price to children in need. Free or reduced price meals must be provided to those children who qualify for such benefits according to specified family size and income standards. The program is administered by the California Department of Education (CDE), Nutrition Services Division.
Figure 3-25 on page 67 shows all the schools within the City of Rialto that are eligible for the program, while Table 3-3 on page 68 includes the list of schools in Rialto Unified School District that are over 75% eligible for the program.
Source: CHIS 2014
Source: CHIS 2014
Source: CHIS 2014
RIALTO ACTIVE TRANSPORTATION PLAN 66
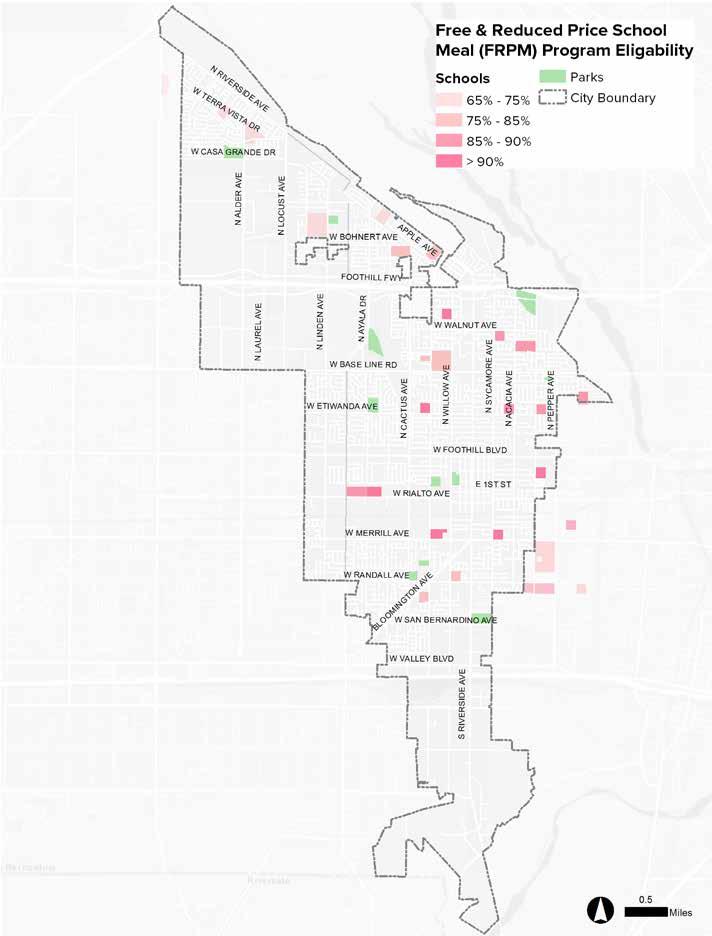
67 CHAPTER 3 » ANALYSIS
Eligibility
FIGURE 3-25: Free and Reduced Price School Meals (FRPM) Program
TABLE 3-3: Eligibility for Free and Reduced Price School Meal (FRPM) Program
RIALTO ACTIVE TRANSPORTATION PLAN 68
SCHOOL SCHOOL DISTRICT ELIGIBILITY FOR FRPM (%) Kelley Elementary Rialto Unified School District 94.2% Dunn Elementary Rialto Unified School District 93.9% Werner Elementary Rialto Unified School District 92.8% Casey Elementary Rialto Unified School District 92.8% Boyd Elementary Rialto Unified School District 92.7% Preston Elementary Rialto Unified School District 91.3% Curtis Elementary Rialto Unified School District 91% Myers Elementary Rialto Unified School District 90.4% Frisbie Elementary Rialto Unified School District 90.3% Henry Elementary Rialto Unified School District 89.6% Bemis Elementary Rialto Unified School District 89.3% Morris Elementary Rialto Unified School District 88.6% Rialto Middle Rialto Unified School District 87.5% Morgan Elementary Rialto Unified School District 87.2% Jehue Middle Rialto Unified School District 86.1% Eisenhower High Rialto Unified School District 84.8% Dollahan Elementary Rialto Unified School District 83.2% Rialto High Rialto Unified School District 83.1% Kolb Middle Rialto Unified School District 82.9% Garcia Elementary Rialto Unified School District 82.75 Hughbanks Elementary Rialto Unified School District 82.4% Simpson Elementary Rialto Unified School District 81.3% Milor High Rialto Unified School District 79.7% Trapp Elementary Rialto Unified School District 77.4% Fitzgerald Elementary Rialto Unified School District 77% Kucera Middle Rialto Unified School District 76.3%
Chapter 4 COMMUNITY ENGAGEMENT
Community Engagement Overview
Community Engagement Strategies
Outreach Materials
Technical Advisory Committee
Community Workshops and Pop-Up Events
Survey Summary
COMMUNITY ENGAGEMENT OVERVIEW
The ATP planning process was conducted in an open and transparent manner to ensure that community members were included throughout the entire course of the project. Community input and involvement were crucial to identify barriers to walking, bicycling, skateboarding, or accessing transit. To achieve that, the community engagement process was designed to include stakeholder education and the involvement of a broad spectrum of stakeholders working towards a common goal, particularly people with little or no experience with civic engagement. Stakeholders included residents, city staff, local advocacy groups, and health organizations.
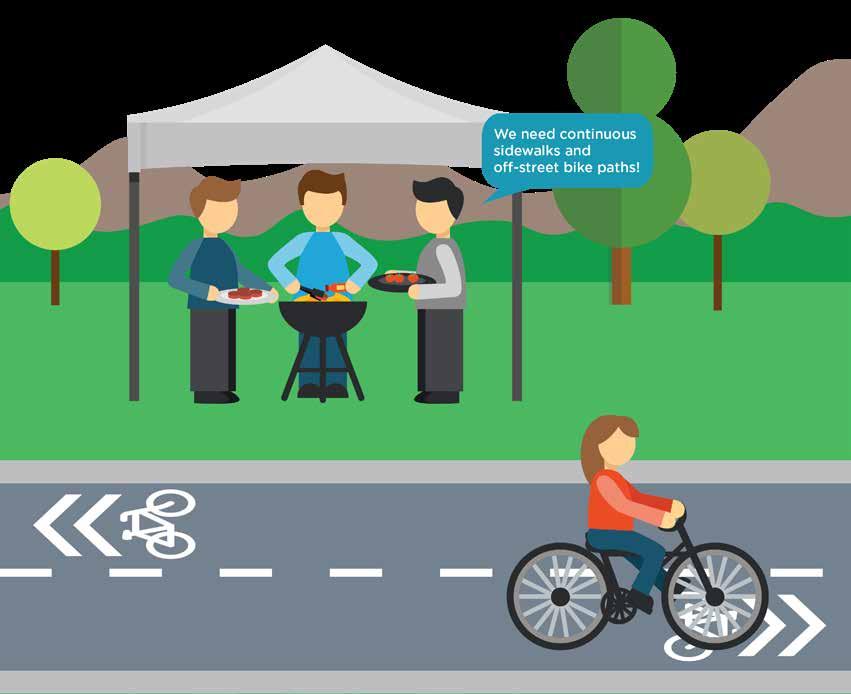
COMMUNITY ENGAGEMENT STRATEGIES
The three primary community engagement strategies utilized for the ATP were:
» Community workshops
» Technical Advisory Committee (TAC)
» Flyers and social media announcements
These strategies informed the public about the ATP, actively engaging community members and stakeholders in the process, allowing them to provide meaningful input.
RIALTO ACTIVE TRANSPORTATION PLAN
OUTREACH MATERIALS
As part of the community engagement process, outreach materials were developed to maximize public participation.

PROJECT BRANDING
In order to be consistent with previous planning efforts, including the Safe Routes to Schools Program and the Bikeshare Feasibility Study, a similar branding was used for this ATP. The project’s branding was used in all outreach materials, including flyers, surveys, online maps, and workshop exhibits.
FLYERS AND SOCIAL MEDIA ANNOUNCEMENTS
Because of Rialto’s diverse population, the project needed to have a variety of outreach methods, including printed media and an online presence. Bilingual flyers were created to promote the six community workshops that took place at various parks and community centers. According to the 2017 American Community Survey, approximately 73 percent of Rialto’s population is Hispanic or Latino. Because of these demographics, both illustrative and online outreach materials were created both in English and Spanish.
In addition to this, the project team developed social media messages, including Facebook, to reach out to interested members of the community. Furthermore, meeting notices and other communications were sent via email blast to notify the stakeholders about upcoming meetings and project updates.
modes of transportation have the potential to alleviate issues for disadvantaged populations that are disproportionately impacted by rising transportation costs. Enhanced Safety Improved facilities enable safe, comfortable, and attractive access for users of all ages and abilities.
Economic Benefits More bicycling and walking has also been tied to increases in commercial and residential property values and retail sales.
Las ciudades están haciendo mejoras para fomentar que las personas anden en bicicleta y caminen, creando comunidades más sanas. Numerosos beneficios ambientales, económicos y a la salud pueden ser atribuidos a estos modos de transporte, especialmente la reducción de viajes de vehículos motorizados. Permitir que los residentes caminen y anden en bicicleta les ayudará a ser más activos físicamente en sus rutinas diarias y a tener un aire más limpio.
¿Qué es un ATP? La Ciudad de Rialto está llevando a cabo un Plan de Transporte Activo (ATP) para mejorar el acceso, la movilidad y la seguridad para los modos de transporte no motorizados, incluyendo caminar, andar en bicicleta y el transporte público. Por favor participa y dinos qué te gustaría hacer para que estas alternativas sean una mejor opción.
¿Qué es un sistema de bicicletas compartidas?
Un sistema de bicicletas compartidas (bike share) es una red de bicicletas públicas disponibles para uso a corto plazo, generalmente de 15 a 45 minutos. Las personas pueden tomar una bicicleta desde diversos puntos de la ciudad, viajar a su destino y luego dejar la bicicleta para que otra persona la use. Los programas de bicicletas compartidas tienen como objetivo aumentar las opciones de transporte al ayudar a las personas a moverse rápidamente por su vecindario o conectarse con la comunidad en general sin usar un vehículo.
¡Queremos hablar contigo!
SEAMLESS BBQ KICKOFF en el parque Joe Sampson Viernes, 7 de junio de 2019 de 10 am a 12:30 pm.
650 W Randall Ave, Rialto, CA 92376

PUMP IT BBQ EVENT en el parque de la ciudad de Rialto Miércoles, 10 de julio de 2019 de 10 am a 12:30 pm.
130 E San Bernardino Ave, Rialto, CA 92376
Déjanos saber lo que se puede hacer para que caminar y andar en bicicleta sea más seguro y agradable. Pasa por nuestro stand y recibe una luz para bicicleta gratis.
BENEFICIOS DEL sistema de bicicletas públicas y el transporte activo
Emisiones reducidas El aumento en el número de personas que caminan y andan en bicicleta puede reducir las emisiones de combustibles fósiles. Alrededor del 5 al 25% de los automóviles puedes ser sustituidos por los usuarios de bicicletas públicas.
Suplementa el sistema de tránsito Los modos alternativos de transporte pueden conectar efectivamente a las personas desde y hacia las paradas de tránsito, así como a sus orígenes y destinos.
Mejoras de la salud
Además del beneficio universal para la salud pública, como mejorar la calidad del aire, andar en bicicleta y caminar tiene el potencial de impactar positivamente la salud personal.

Igualdad social Los modos alternativos de transporte tienen el potencial de aliviar los problemas de las poblaciones desfavorecidas que se ven afectadas de manera desproporcionada por el aumento de los costos de transporte.
Seguridad mejorada Las instalaciones mejoradas permiten un acceso seguro, cómodo y atractivo para usuarios de todas las edades y habilidades.
Help Us Make Walking and Biking Better in Rialto!

Beneficios económicos El aumento en el número de personas que caminan y andan en bicicletas también se han relacionado con aumentos en el valor de las propiedades comerciales y residenciales y en las ventas minoristas.
¡DINOS LO QUE PIENSAS! Queremos escucharte. Toma nuestra encuesta en línea hoy en: www.surveymonkey.com/r/RialtoATP
Project logo Workshop flyers
CHAPTER 4 » COMMUNITY ENGAGEMENT 71
HelpUsMakeWalkingandBiking Better in Rialto! What is an ATP? PlanTheCityofRialtoisundertakinganActiveTransportation (ATP) to improve access, mobility, and safety for non-motorized modes of travel, including walking, howbicycling,andridingtransit.Pleaseparticipateandtellus youwouldliketomakethesemodesabetteroption.What is a Bike Share System? A bike share system is a network of shared bicycles available for short-term use, usually 15 to 45 minutes. People can check out a bicycle from locations around the city, ride to their destination, and then leave the bicycle for someone else to use. Bike share programs aim to increase transportation option by helping people move quickly about their neighborhood or connect with the larger community without using a car. Cities are making improvements to support cyclingandwalkinginordertocreatehealthier andcommunities.Numerousenvironmental,health, economic benefits are attributable toforbicyclingandwalking,especiallyassubstitutes travel by motor vehicle. Allowing residents to walk and bike enables them to be more physically active in their daily routines and havingcleanerair. We Want to Meet You! Visit us during the Spring Eggstravaganza on Saturday, April 20, 2019 at the Rialto Civic Center. Let us know what can make walking and biking safer and more enjoyable. Stop by our booth for an opportunity to participate in a bike helmet raffle. We hope to see you there from 11 am to 2 pm!
&
Reduced emissions Increasedbicyclingandwalkingreduce fossil fuel emissions. About 5 to 25% of users substitute bike share for cars. Supplements the transit system Alternate modes of transportation can effectively link people to and from transit stops to their origins and destinations. Improved Health In addition to the universal public health benefit, such as improved air quality, bicycling and walking has the potential to positively impact personal health. Social EquityAlternate
BENEFITSOF Bike Share
TransportationActive
¡Ayúdanos a que caminar y andar en bicicleta sea fácil en Rialto!
What is an ATP? The City of Rialto is undertaking an Active Transportation Plan (ATP) to improve access, mobility, and safety for non-motorized modes of travel, including walking, bicycling, and riding transit. Please participate and tell us how you would like to make these modes a better option. What is a Bike Share System? A bike share system is a network of shared bicycles available for short-term use, usually 15 to 45 minutes. People can check out a bicycle from locations around the city, ride to their destination, and then leave the bicycle for someone else to use. Bike share programs aim to increase transportation option by helping people move quickly about their neighborhood or connect with the larger community without using a car. Cities are making improvements to support cycling and walking in order to create healthier communities. Numerous environmental, health, and economic benefits are attributable to bicycling and walking, especially as substitutes for travel by motor vehicle. Allowing residents to walk and bike enables them to be more physically active in their daily routines and having cleaner air. We Want to Meet You! Visit us during the Inland Empire 2019 Walk Like MADD run on Saturday, May 4, 2019 at the Charlotte N. Werner Elementary at 1050 W Rialto Ave, Rialto, CA Let us know what can make walking and biking safer and more enjoyable. Stop by our booth for an opportunity to participate in a bike helmet raffle. We hope to see you there from 6 am to 10 am! BENEFITS OF Bike Share & Active Transportation Reduced Emissions Increased bicycling and walking reduce fossil fuel emissions. About 5 to 25% of users substitute bike share for cars. Supplements the Transit System Alternate modes of transportation can effectively link people to and from transit stops to their origins and destinations. Improved Health In addition to the universal public health benefit, such as improved air quality, bicycling and walking has the potential to positively impact personal health. Social Equity Alternate modes of transportation have the potential to alleviate issues for disadvantaged populations that are disproportionately impacted by rising transportation costs. Enhanced Safety Improved facilities enable safe, comfortable, and attractive access for users of all ages and abilities. Economic Benefits More bicycling and walking has also been tied to increases in commercial and residential property values and retail sales. TELL US WHAT YOU THINK! We want to hear from you. Take our online survey today. www.surveymonkey.com/r/RialtoATP
SURVEY
A survey was prepared to determine satisfaction levels of current pedestrian and bicycle infrastructure, along with desired improvements. The survey asked people a variety of walking, bicycling, and public transit questions, and prompted them to provide both general and site-specific comments. Additionally, questions regarding the feasibility of a bikeshare system were also included.
Surveys were distributed during the six community workshops, both in English and Spanish. Additionally, an online version was also made available to the public through the last community workshop on August 17, 2019.
ONLINE MAP
An online comment map was created as a supplemental input method that Rialto residents and stakeholders could use to highlight location-specific constraints and opportunities. It also provided the opportunity to categorize the type of issues or improvements identified on the map (e.g. bike, pedestrian, transit, etc.) and allowed respondents to at tach photos and include comments. All points were automatically geo-ref erenced and allowed anyone to see where others had similar issues. This platform allowed the team and the city to efficiently document and analyze comments identified by the community.
ACTIVE TRANSPORTATION SURVEY

The Rialto Active Transportation Plan and Bikeshare Feasibility Study will guide the design of safe, enjoyable and convenient walking and biking options to schools, parks, and other places you would like to go. With your help, we can make walking and biking in Rialto a top choice!
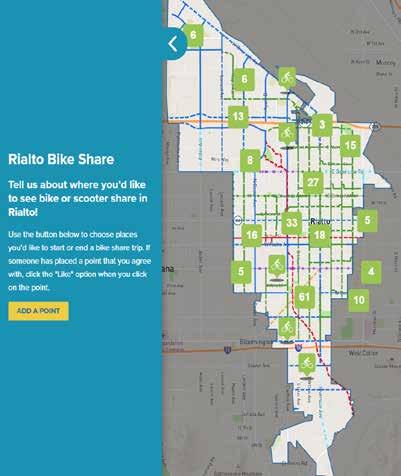
www.surveymonkey.com/r/RialtoATP
How safe do you feel when using the following types of transportation? (Check the box that applies for each mode)
Would you be interested in seeing any of the following shared mobility options in Rialto? (Check all that apply)
I would not like to see these
in
Which of the following statements would support your interest in using a bike or scooter share system? (Check all that apply)
It's good for the environment Walk Bike Bus Drive Other
It
looks like fun / I am curious to try it out
am not interested in using these shared mobility options
RIALTO ACTIVE TRANSPORTATION PLAN 72
How would you best describe your relationship with Rialto? Live in Rialto Live and work in Rialto Work in Rialto, but live outside of city limits Own a business in Rialto Student in Rialto Other How do you identify yourself? Male Female Non-Binary Decline to state Which of the following groups includes your age? 0-18 19-24 25-45 46-64 65+ 5 6 7 8 4 3 2 1 How do you get to work/school? (Check all that apply) Walk Bike Bus Drive Other How do you get to a city park? (Check all that apply) Where would you like to see better pedestrian and bicycling routes to? Downtown Rialto MetroLink station North of SR-210 South of I-10 Schools Parks Community Centers Transit/Bus Stops Shopping Centers Other For either commuting or recreation, how often do you walk/bike/use bike share in Rialto? Walk Daily 3-4 days per week 1-2 days per week A few times a year Never Bike Daily 3-4 days per week 1-2 days per week A few times a year Never Your top three concerns related to bike/scooter share in Rialto? What would make it easier for you to bike more in Rialto? Do you have any additional comments? On-street bike lanes Off-street bike paths Bike share Electric bike (e-bike) share Electric scooter share Lighting Street Trees Bike Parking Slower Traffic Speeds Other Please provide your contact information below if you want to stay informed about the Active Transportation Project. 10 9 12 11 15
Very safe Somewhat safe Not feel safe
Walking Bicycling Bus Safety sharing the road and interacting with other vehicles
at all
I
Other 13 14 Bikeshare Electric bike (e-bike) share Electric scooter (e-scooter) share
shared mobility options
I could use it from transit stops to work I could use it for short trips for errands, food or meetings It could replace car trips It could replace walking trips I could save money on transportation It could help me get around more easily/faster Rialto Other A specific destination (cross-street or landmark): Would your use of public transportation increase if you could use a shared scooter or bike to connect to the transit stop? Yes No I don't know/Prefer not to answer
I
could use it if the City would install protected bike lanes
Sidewalks Continuous Sidewalks Marked Crosswalks Street Lighting Street Trees/Parkways Bus Shelters Slower Traffic Speeds Protected Crossings (signals or stop signs) Other (Check all that apply) (Check all that apply) (Check all that apply)
What would make it easier for you to walk more in Rialto?
Wider
Survey & Online Interactive Map
To fill out this survey online, please visit:
TECHNICAL ADVISORY COMMITTEE
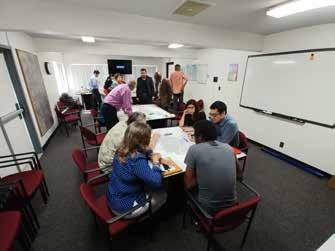
The Technical Advisory Committee (TAC) was a key component of the community engagement process. For consistency purposes, the TAC consisted of the same members from the Bike Share Feasibility Project. These members represented various community areas/neighborhoods, businesses, school district, and city departments. Participating organizations included:
» Development Services Department
» Planning Division
» City Clerk Department
» Community Services Department
» Omnitrans
» Police Department
» Fire Department
» Rialto Unified School District
» San Bernardino County Transportation Authority (SBCTA)
» Transportation Commission
» Recreation and Parks Commission
» Planning Commission
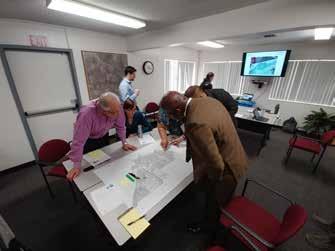
» Caltrans
» Mobile Source Air Pollution Reduction Review Committee (MSCR)
» Inland Empire Bicycle Alliance (IEBA)
» San Bernardino County Public Health
The TAC met quarterly to share information, collaborate, and guide the ATP process and guidelines.
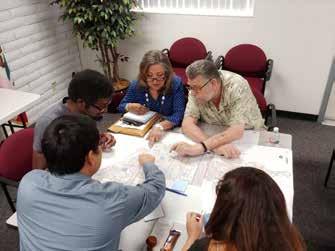
CHAPTER 4 » COMMUNITY ENGAGEMENT 73
TAC Meeting
COMMUNITY WORKSHOPS AND POP-UP EVENTS
A total of six community workshops were conducted throughout the ATP planning process to gather input and solicit feedback on recommendations. It was determined that the pop-up workshop approach would be the best avenue to gather input for the project. This would allow the project team to gather feedback at events where there is already an audience.
WORKSHOP #1: SPRING EGGSTRAVAGANZA
The first workshop was conducted on Saturday, April 20, 2019 as part of the City’s Spring Eggstravaganza at the Rialto Civic Center. A project booth was present to gather community input. Bicycle lights, reflective bands, and bike helmet give-aways were provided at the booth. A table map, pedestrian and bicycle improvements boards, and surveys were displayed to gather information from the public.
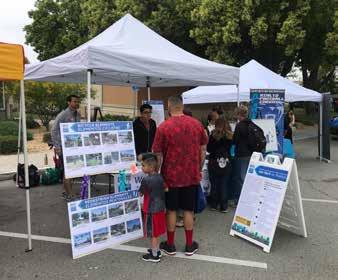
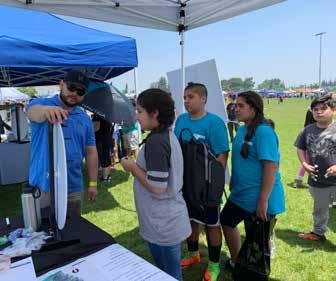
WORKSHOP #2: INLAND EMPIRE 2019 WALK LIKE MADD
The second workshop took place on Saturday, May 4, 2019 during the Inland Empire 2019 Walk Like MADD run at Charlotte N. Werner Elementary. As in the first workshop, a project booth with information boards, a table map, and give-aways was present to obtain information on opportunities and constraints from participants.
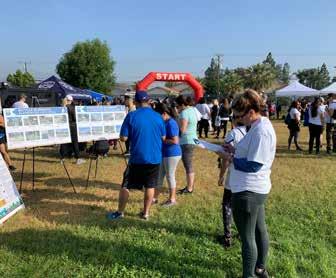
WORKSHOP #3: SEAMLESS BBQ KICKOFF
The third workshop was held on Friday, June 7, 2019 as part of Rialto’s Seamless BBQ Kickoff at Joe Sampson Park. A project booth was present to gather information on opportunities and existing issues from participants. Maps, data, and surveys were displayed and passed out at the booth. Additional activities included a magnet board where children could build their “ideal street” and a spinning wheel that participants could spin for a chance to win a prize after filling out a survey.
RIALTO ACTIVE TRANSPORTATION PLAN 74
Workshop #1: Spring Eggstravaganza
Workshop #2: 2019 Walk Like MADD run
Workshop #3: Seamless BBQ Kickoff
WORKSHOP #4: PUMP IT UP BBQ EVENT
The fourth community workshop took place on Wednesday, July 10, 2019 at Rialto City Park. The event was a summer barbecue hosted by Rialto Unified School District. A variety of outreach methods were used to ensure community participation. Flyers and posters were distributed, both in English and in Spanish, as well as surveys that allowed residents to share their thoughts and concerns regarding active transportation in Rialto.
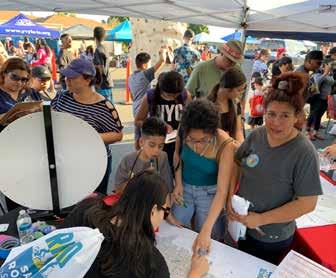
WORKSHOP #5: NATIONAL NIGHT OUT
The fifth community workshop was conducted on Tuesday, August 6, 2019 during the National Night Out Event at the Rialto Civic Center. National Night Out promotes community spirit and enhances police-community partnerships to create a safe city. This yearly event draws hundreds of residents from Rialto with games, vendors, police car rides, police K9 demonstrations, and more. A project booth was setup and a variety of outreach methods were used to gather community input. Bilingual surveys were also distributed.
WORKSHOP #6: BIKE RODEO AT THE PACIFIC ELECTRIC BIKE TRAIL
The sixth and final community workshop took place on Saturday, August 17, 2019 along the Pacific Electric Trail in Rialto, behind Charlotte N. Werner Elementary School. The event was a bike rodeo that was held for kids ages 5 to 12, and included a bike raffle, bike safety tips, helmet check, bike skills and games, a bicycle license, and more. A variety of outreach methods were used to ensure community participation. Surveys were disseminated and collected to allow residents to share their thoughts and concerns regarding active transportation in Rialto.
CHAPTER 4 » COMMUNITY ENGAGEMENT 75
Workshop #4: Pump It Up BBQ event
Workshop #5: National Night Out
Workshop #6: Bike Rodeo
SURVEY SUMMARY
A total of 371 people completed the survey and provided comments. The results were analyzed and used for the development of the potential project list. The survey also provided the city with a current view of people’s opinions, concerns, and desires for pedestrian and bicycle facilities.
The following six figures depict results from the survey. About 54 percent of respondents walk more than once a week, while only 26 percent of respondents bike more than once a week. Over 79 percent of respondents drive to work or school and 63 percent of them drive to the park. In addition, when asked what would make walking and biking better in Rialto, respondents answered street lighting and on-street bike lanes respectively. These results communicate the importance of improving the walking and biking infrastructure in the city.
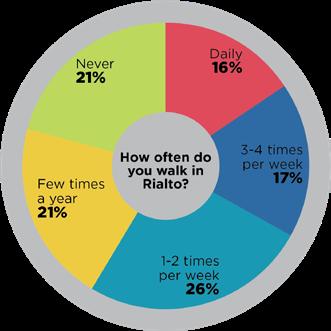
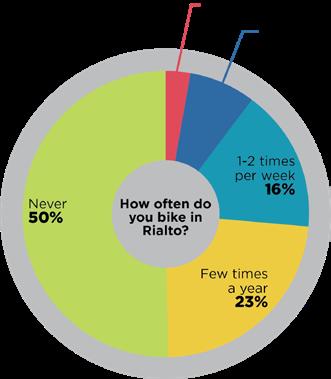
Note: The survey was available online and was also distributed during community workshops and pop-up events. However, the share of respondents only represents 0.36 percent of Rialto’s population.
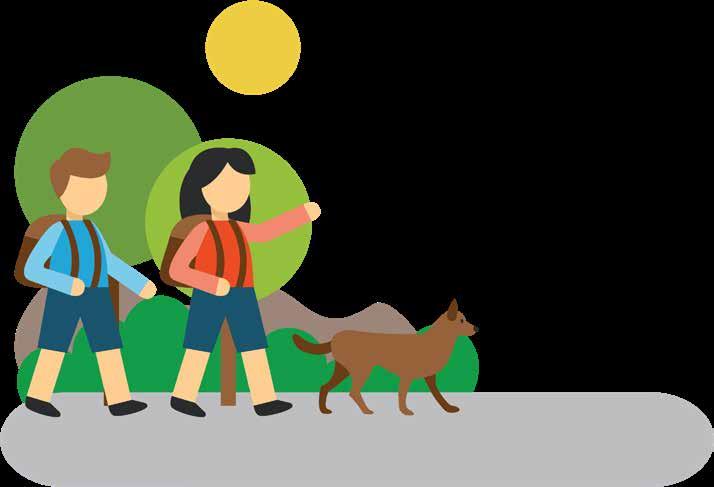
RIALTO ACTIVE TRANSPORTATION PLAN 76
Where would you like to see better pedestrian and bicycling routes to?
CHAPTER 4 » COMMUNITY ENGAGEMENT 77
What would make walking easier in Rialto?
What would make biking easier in Rialto?
RIALTO ACTIVE TRANSPORTATION PLAN 78
Chapter 5 RECOMMENDATIONS
Recommendations Overview
Bicycle and Pedestrian Treatments
Bicycle Recommendations
Ranking methodology
Recommended Bikeway Projects
Bikeway Project Phasing
New Mobility
Safe Routes to Parks & First and Last Mile to Transit Recommendations Programs
RECOMMENDATIONS OVERVIEW
This chapter addresses the physical improvements recommended to enhance bicycling and walking in Rialto. The recommended improvements list includes both short-term and long-term improvements and is meant to serve as a guide to help the city in allocating funds as they become available through various sources. The chapter contains maps and tables that detail improvement location, extent, and type.
It is important to note that the success of Recommended Projects is closely tied to programs and adopted standards, codes, and policies. Education, Encouragement, Enforcement, Evaluation programs, and Equity can be used to leverage investments in these projects. Similarly, the effectiveness of bicycle and pedestrian programs is maximized by actual project implementation. Likewise, changes to city standards, codes, and policies may be needed to implement bicycle and pedestrian improvements. Project implementation may, in turn, facilitate changes to city standards, codes, and policies.
BICYCLE AND PEDESTRIAN TREATMENTS
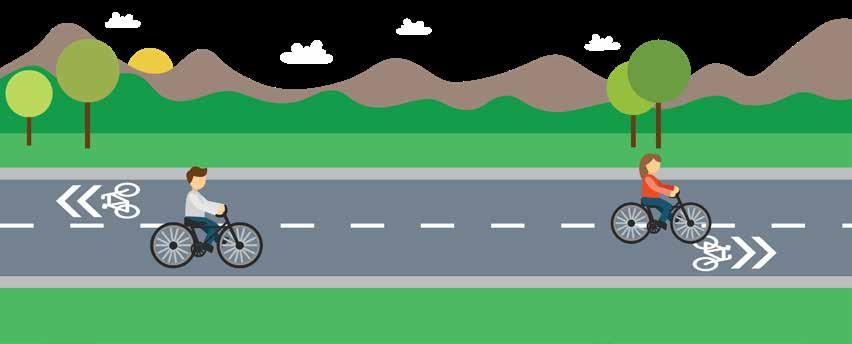
While not universally applied, in general, pedestrian travel in urban areas has long tended to be accommodated with features like sidewalks, crosswalks, dedicated signals, and curb extensions. Suggested pedestrian treatments address a wide
variety of issues identified in the analysis and community engagement process to enhance connectivity to transit, school zones, senior zones, activity centers, parks, and other community destinations. Pedestrian improvements help to ensure equitable multi-modal transportation because they serve populations that may not be able to afford a bicycle or likely to ride a bicycle, and instead rely on transit and walking. Newer innovations like pedestrian scrambles, modified signal timing, flashing beacons, and other pedestrian improvements are described in this chapter in addition to standard pedestrian treatments.
A focus on providing safer, less stressful bicycle travel has occurred more recently across the United States, with significant transformation in the state of practice for bicycle travel over the last five years. Much of this may be attributed to bicycling’s changing role in the overall transportation system. No longer viewed as an “alternative” mode, it is increasingly considered as legitimate transportation that should be actively promoted as a means of achieving community environmental, social, and economic goals. While connectivity and convenience remain essential bicycle travel quality indicators, recent research indicates the increased acceptance and practice of daily bicycling will require “low-stress” bicycle routes, which are typically understood to be those that provide bicyclists with separation from high volume and high-speed vehicular traffic. The route types recommended in this plan, and described in the following section, are consistent with this evolving state of practice.
RIALTO ACTIVE TRANSPORTATION PLAN
CONVENTIONAL BICYCLE TREATMENTS
There are four conventional bicycle route types recognized by the California Department of Transportation. Details of their design, associated wayfinding, and pavement markings can be found in the CA MUTCD and CA Highway Design Manual.
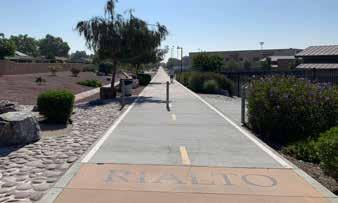
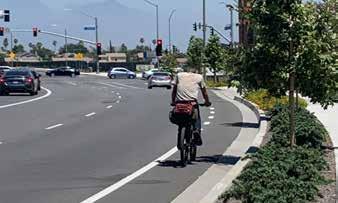
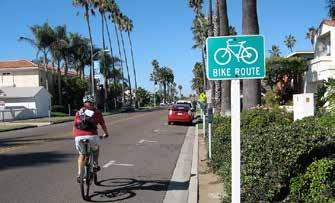
Class I: Multi-Use Paths
Class I multi-use paths (frequently referred to as “bicycle paths”) are physically separated from motor vehicle travel routes, with exclusive rights-of-way for non-motorized users like bicyclists and pedestrians.
Class II: Bicycle Lanes
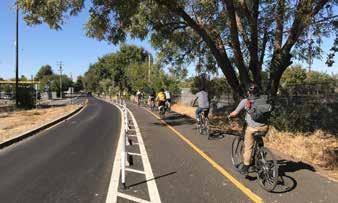
Bicycle lanes are one-way route types that carry bicycle traffic in the same direction as the adjacent motor vehicle traffic. They are typically located along the right side of the street (although can be on the left side) and are between the adjacent travel lane and curb, road edge, or parking lane. They are not physically separated from motor vehicle traffic.
Class III: Bicycle Routes
A bicycle route is a suggested bicycle path of travel marked by signs designating a preferred path between destinations. They are recommended where traffic volumes and roadway speeds are fairly low (35 mph or less). They do not have pavement marking and are not separated from traffic, rather are a share the road facility.
Class IV: Separated Bikeways
Separated bikeways, also known as cycle tracks, are bicycle-specific routes that combine the user experience of a multi-use path with the on-street infrastructure of a conventional bicycle lane. Separated bikeways are physically separated from motor vehicle traffic and designed to be distinct from any adjoining sidewalk. The variety of physical protection measures can include raised curbs, parkway strips, reflective bollards, or parked vehicles. Separated bikeways can be either one-way or two-way, depending on the street network, available right-of-way, and adjacent land use, but the safety of two-way separated bikeways must be carefully evaluated, especially if they cross motor vehicle routes. This is because few motor vehicle drivers are accustomed to two-way separated bikeways and they may tend to look to the left only when deciding whether it is safe to proceed across the separated bikeways.
CHAPTER 5 » RECOMMENDATIONS 81
Class I multi-use path
Class II bicycle lane
Class III bicycle route
Class IV separated bikeway
ENHANCED BICYCLE TREATMENTS
While the conventional bicycle route types can be found throughout the United States, there has been a distinct shift towards further enhancement. For example, the CA MUTCD has approved the installation of buffered bicycle lanes, while Shared Lane Markings or “Sharrows” have been in use since 2004 throughout the state.
These enhancements are low cost, easy to install, and provide additional awareness about the likely presence of bicyclists. In many instances, installation of these bicycle route enhancements can be coordinated as part of street resurfacing projects. The use of green markings has also become a simple and effective way to communicate the likely presence of bicyclists. It is also used to denote potential conflict zones between bicyclists and vehicles.
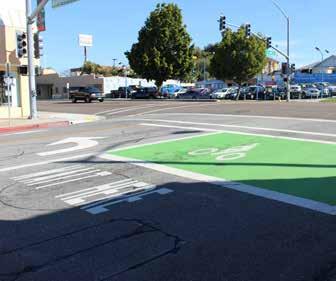
Buffered Bicycle Lanes
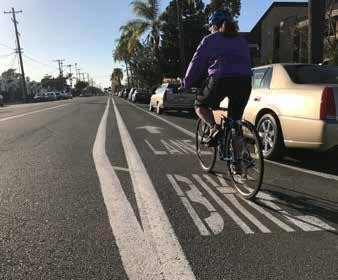
Buffered bicycle lanes provide additional space between the bicycle lane and traffic lane, parking lane, or both, to provide a more protected and comfortable space for bicyclists than a conventional bicycle lane. The buffering also encourages bicyclists to avoid riding too close to parked vehicles, keeping them out of the “door zone” where there is the potential danger of drivers or passengers suddenly opening doors into the bicyclists’ path.
Shared Lane Markings (“Sharrows”)
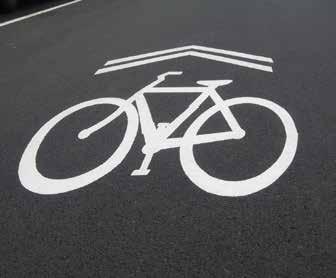
The shared lane marking is commonly used where parking is allowed adjacent to the travel lane. It is now common practice to center them within the typical vehicular travel route in the rightmost travel lane to ensure adequate separation between bicyclists and parked vehicles. Many cities install sharrows over a green background to enhance visibility.
Bike Boxes
A bike box is a designated area at the head of a traffic lane at a signalized intersection that provides bicyclists a safe and visible way to wait ahead of queuing traffic during the red signal phase. This positioning helps encourage bicyclists traveling straight through not to wait against the curb for the signal change.
RIALTO ACTIVE TRANSPORTATION PLAN 82
Buffered bicycle lane
Shared lane “sharrow” marking
Bike box
LOW STRESS BICYCLE TREATMENTS
There are a number of other non-conventional route types that the city may find useful in specific situations. In many cases, the conventional bicycle route types previously mentioned may not meet the community’s perceptions of safe and comfortable bikeways. Protected, low-stress streets, and bicycle-prioritized route types are constantly being revised and improved to meet the community’s needs.
The improvements described in this section have been implemented in other states in the United States as well as other countries with great success and are quickly becoming standard recommendations.
Details of these route types and other treatments can be found in the NACTO Urban Bikeway Design Guide, FHWA Separated Bike Lane Planning and Design Guide, or the AASHTO Guide for the Development of Bicycle Facilities.
Bicycle Boulevards
Bicycle boulevards provide a convenient, low-stress cycling environment for people of all ages and abilities. They are installed on streets with low vehicular volumes and speeds and often parallel higher volume, higher speed arterials. Bicycle boulevard treatments use a combination of signs, pavement markings, traffic diverters, and traffic calming measures that help to discourage through trips by motor vehicle drivers and create safe, convenient bicycle crossings of busy arterial streets. They are similar to Class III bicycle routes but tend to include more traffic calming and diversion infrastructure.
Signage and Wayfinding
Signage and wayfinding on all streets and bicycle routes are intended to identify routes to both bicyclists and drivers, provide destination information and branding, and to inform all users of changes in roadway conditions.
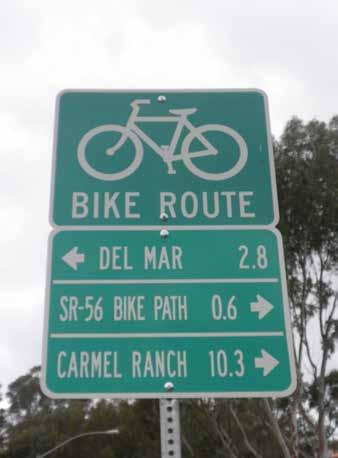
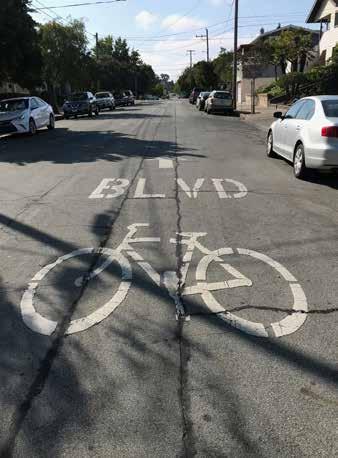
CHAPTER 5 » RECOMMENDATIONS 83
Bicycle boulevard Wayfinding signage
Colored Bicycle Lanes
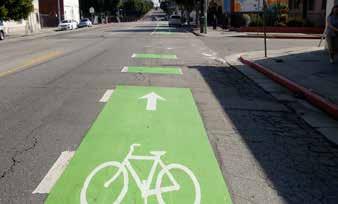
Colored pavement increases the visibility of bicycle routes, identifying potential areas of conflict or transition, and reinforces bicyclists’ priority in these areas. Colored pavement can be used as a corridor treatment, along the length of a bicycle lane or within a protected bikeway. Additionally, it can be used as a spot treatment, such as crossing markings at particularly complex intersections where the bicycle path may be unclear. Consistent application of color across a bikeway corridor is important to promote clear understanding for all roadway users.
Green Colored Transition Striping
Intersection or mid-block crossing markings indicate the intended path of bicyclists. Colored striping can be used to highlight conflict areas between bicyclists and vehicles, such as where bicycle lanes merge across motor vehicle turn lanes.
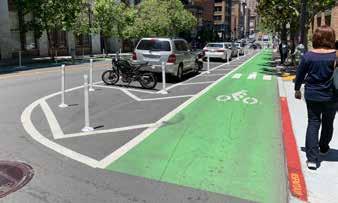
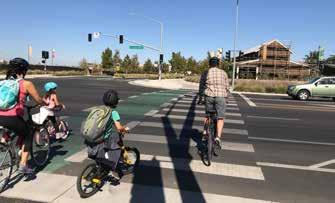
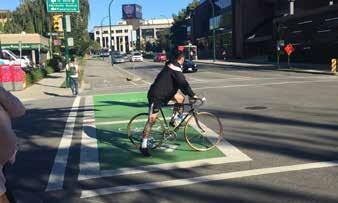
Protected Intersections
Protected intersections maintain the integrity (lowstress experience) of their adjoining separated bicycle lanes by fully separating bicyclists from motor vehicles at intersections. Hallmark features of these protected intersections include two-stage crossings supported by an advance queuing space, protective concrete islands, special bicycle-cross markings (parallel with crosswalks), and special signal phasing.
Two-Stage Left Turn Queue Box
Two-stage turn queue boxes can provide a more comfortable left-turn crossing for many bicyclists because they entail two low stress crossings, rather than one potentially high stress one. They also provide a degree of separation from vehicular traffic because they do not require merging with vehicle traffic to make left turns. Bicyclists wanting to make a left turn can continue into the intersection when they have a green light and pull into the green queue box. Bicyclists then turn 90 degrees to face their intended direction and wait for the green light of a new signal phase to continue through.
RIALTO ACTIVE TRANSPORTATION PLAN 84
Colored bicycle lane
Green transition striping
Protected intersection
Two-stage left turn queue box
Bicycle Signals
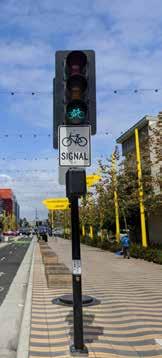
This category includes all types of traffic signals directed at bicyclists. These can include typical green/yellow/red signals with signage explaining the signal controls, or special bikeway icons displayed within the signage lights themselves. Nearside bicycle signals may incorporate a “countdown to green” display, as well as a “countdown to red.”
Bicycle Detection
Bicycle detection is used at intersections with traffic signals to alert the signal controller that a bicycle crossing event has been requested. Bicycle detection can occur either through the use of push buttons or by automated means, and are marked by standard pavement symbols.
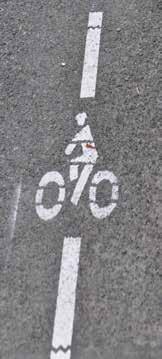
TRAFFIC CALMING
Traffic calming involves changes in street alignment, installation of barriers, and other physical measures to reduce traffic speeds and/or cut-through motor vehicle traffic volumes. The intent of traffic calming is to alter driver behavior and to improve street safety, livability, and other public purposes. Other techniques consist of operational measures such as police enforcement and speed displays. The following examples are traffic calming measures that may apply to Rialto.
Roundabouts/Traffic Circles
A roundabout is a circular intersection with yield control at its entry that allows a driver to proceed at controlled speeds in a counter-clockwise direction around a central island. Roundabouts are designed to maximize motorized and non-motorized traffic through their innovative design that includes reconfigured sidewalks, bikeway bypasses, high-visibility crosswalks, pedestrian flashing beacons, and other traffic measures. Roundabouts can be implemented on most streets, but may require additional right-of-way.
A traffic circle is a small-scale traffic calming measure commonly applied at uncontrolled intersections on low volume, local residential streets. They lower traffic speeds on each approach and typically avoid or reduce right-of-way conflicts because the overall footprint is smaller compared to roundabouts. Traffic circles may be installed using simple markings or raised islands, but are best accompanied with drought-tolerant landscaping or other attractive vertical elements.
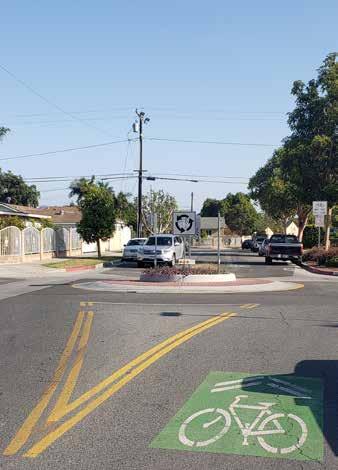
CHAPTER 5 » RECOMMENDATIONS 85
Traffic circle
Bicycle signal
Bicycle detection
Signals and Warning Devices
Traditional pedestrian signals remain the gold standard for high quality pedestrian crossings, although some cases warrant new signal technologies. Pedestrian Hybrid Beacons (PHBs) and Rectangular Rapid Flashing Beacons (RRFBs) are special signals used to warn and control traffic at unsignalized locations to assist pedestrians in crossing a street via a marked crosswalk. Either of these devices should be installed at locations that experience pedestrian desire lines and that connect people to popular destinations such as schools, parks, and retail. Research has shown that PHBs tend to have a 90% motorist compliance rate versus RRFBs, which tend to have an 80% motorist compliance rate. Traditional pedestrian signals tend to have nearly a 100% compliance rate, which improves safety over other types of signals, and therefore are preferable for pedestrian facilities.
Signals and warning devices should be paired with additional pedestrian improvements, where appropriate, such as curb extensions, enhanced crosswalk marking, lighting, median refuge islands, corresponding signage, and advanced yield markings to mitigate multiple threat crashes on multi-lane roadways.
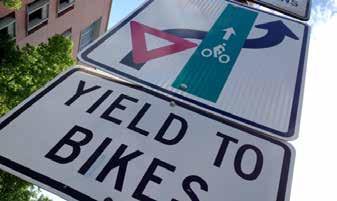
Speed Tables/Raised Crosswalks
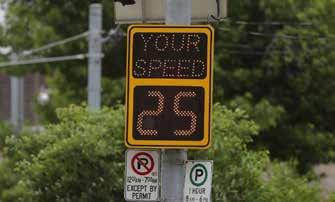
Speed tables are flat-topped road humps, often constructed with textured surfacing on the flat section. Speed tables and raised crosswalks help to reduce vehicle speeds and enhance pedestrian safety.
Speed Displays
Speed displays measure the speed of approaching vehicles by radar and inform drivers of their speeds using an LED display. Speed displays contribute to increased traffic safety because they are particularly effective in getting drivers traveling ten or more miles per hour over the speed limit to reduce their speed.
Chicanes
Chicanes are a series of narrowings or curb extensions that alternate from one side of the street to the other forming an S-shaped path. Chicanes reduce drivers’ speeds by causing them to shift their horizontal path of travel.
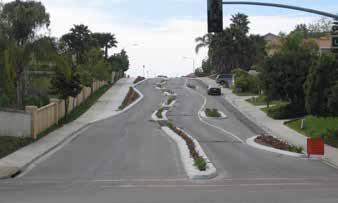
RIALTO ACTIVE TRANSPORTATION PLAN 86
Signal and warning devices
Speed table
Speed displays
Chicanes
Traffic Diverters
A traffic diverter is a roadway design feature placed in a roadway to prohibit vehicular traffic from entering into or exiting from the street, or both.
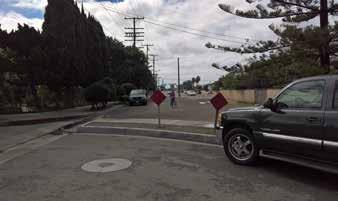
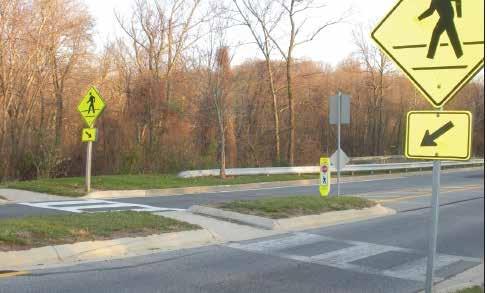
On-Street Edge Friction
Edge friction is a combination of vertical elements such as on-street parking, bicycle routes, chicanes, site furnishings, street trees, and shrubs that reduce the perceived street width. This treatment has been shown to reduce motor vehicle speeds.
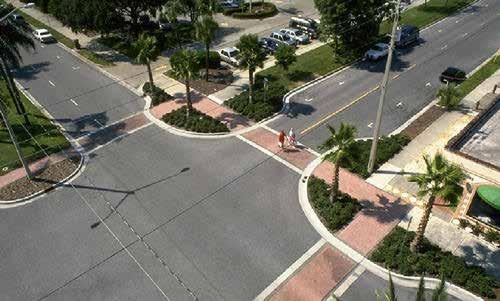
PEDESTRIAN TREATMENTS
Most streets in Rialto have sidewalks, and the network has been evaluated to determine if appropriate sidewalk widths and ADA compliant curb ramps are present (ADA Transition Plan). While many intersections are signalized and have crosswalks, there are some segments with long blocks without convenient crossing places. Providing crossing treatments will help to reduce “jaywalking” and unsafe crossings between intersections.
Enhanced Crosswalk Markings
Enhanced crosswalk markings can be installed at existing or proposed crosswalk locations. They are designed to both guide pedestrians and to alert drivers of a crossing location. The bold pattern is intended to enhance visual awareness.
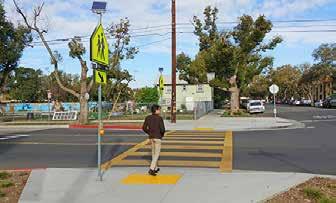
Curb Extensions
Also called bulb-outs or neck-downs, curb extensions extend the curb line outward into the travel way, reducing the pedestrian crossing distance. Typically occurring at intersections, they increase pedestrian visibility, reduce the distance a pedestrian must cross, and reduce vehicular delay. Curb extensions must be installed in locations where they will not interfere with bicycle lanes or separated bikeways. If both treatments are needed, additional design features such as ramps or half-sized curb extensions should be considered.
In addition, it’s common for cities to have minimum road widths for fire truck access where those widths are not impeded by curb extensions or median islands. These minimums tend to range from 14 feet to 20 feet, with 16 feet and 18 feet being the most common minimum widths. The minimum will depend on the size of the city’s fire trucks and the level of comfort of the fire department with those road widths.
CHAPTER 5 » RECOMMENDATIONS 87
Traffic diverter
Enhanced crosswalk
Curb extensions
Refuge island
Refuge Island
Refuge islands provide pedestrians and bicyclists a relatively safe place within an intersection and midblock crossing to wait if they are unable to complete their crossing in one movement.
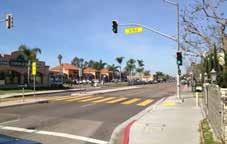
Mid-block Crossings
Mid-block crossings provide convenient locations for pedestrians and bicyclists to cross thoroughfares in areas with infrequent intersection crossings or where the nearest intersection creates substantial out-of-direction travel. Mid-block crossings should be paired with additional traffic-control devices such as traditional pedestrian signals, PHBs, RRFBs, LED enhanced flashing signs, and/or refuge islands.
Lighting
Pedestrian-scale lighting provides many practical and safety benefits, such as illuminating the path and making crossing walkers and bicyclists more visible to drivers. Lighting can also be designed to be fun, artistic, and interactive.
Leading Pedestrian Intervals (LPIs)
A Leading Pedestrian Interval (LPI) is a signal timing technique that typically gives pedestrians a 3–7 second head start when entering a crosswalk with a corresponding green signal in the same direction of travel. LPIs enhance the visibility of pedestrians in the intersection and reinforce their right-of-way
over turning vehicles, especially in locations with a history of conflict. Generally, this leads to a greater likelihood of vehicles yielding. Depending on intersection volume and safety history, a normal rightturn-on-red (RTOR) might be explicitly prohibited during the LPI phase.
Pedestrian Scramble
Pedestrian scrambles, also known as all-way pedestrian phases, stop vehicular traffic flow simultaneously in all directions to allow pedestrians to cross the intersection in any direction. They are used at intersections with particularly heavy pedestrian crossing levels. Unless cycle lengths can be kept under 90 seconds, Leading Pedestrian Intervals (LPIs) are generally preferred over pedestrian scrambles.
Modified Traffic Signal Timing
Adjusting the time, phasing, and actuation needed to cross high-volume and wide streets provides additional safety and comfort for pedestrians and bicyclists.
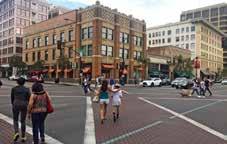
Senior Zones
Potential future city designated senior zones can be enhanced with street signage, increased crossing times at traffic signals, benches, bus stops with shelters, and pedestrian lighting.
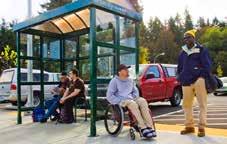
RIALTO ACTIVE TRANSPORTATION PLAN 88
Lighting
Senior zone
Mid-block crossing
Transit stop shelter
Pedestrian scramble
Transit Stop Amenities
Transit stop amenities such as shelters with overhead protection, seating, trash receptacles, and lighting are essential for encouraging people to make use of public transit.
PLACEMAKING
The inclusion of urban elements such as parklets and community gardens encourages walking and provides usable space for all ages. In many cities, these urban elements have helped to transform urban villages and downtowns into walkable destinations. Coordinating with local Rialto businesses and organizations may provide collaborative design and funding opportunities between the city, its businesses, residents, and visitors.
Parklets
Parklets are small, outdoor seating areas that take over one or two parking spots, reclaiming the space for the community, and improving the urban environment’s aesthetics and streetscape.
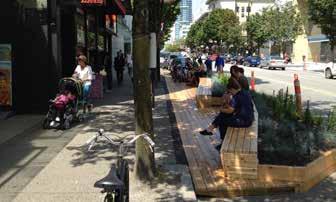
Community Gardens
Community gardens provide fresh produce and plants and assist in neighborhood improvement through a sense of community and connection to the environment. They are typically managed by local governments or non-profit associations.
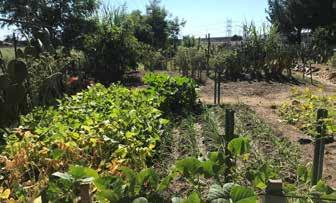
Special Intersection Paving and Crosswalk Art
Special intersection paving and crosswalk art provide unique opportunities at intersections to highlight crossings, and key civic or commercial locations while breaking the visual monotony of asphalt. Intersection paving treatments and crosswalk art can integrate context-sensitive colors, textures, and scoring patterns.
Paving treatments and crosswalk art do not define a crosswalk and should not be seen as a safety measure. Standard transverse or longitudinal high visibility crosswalk markings are still required.
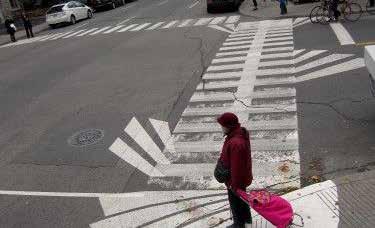
Furnishings and Public Art
Transit shelters, bicycle racks, seating, and public art provide important amenities for functionality, design, and vitality of the urban environment. They announce that the street is a safe and comfortable place to be and provide visual detail and interest.
CHAPTER 5 » RECOMMENDATIONS 89
Parklet
Community garden
Crosswalk art
Public art
BICYCLE RECOMMENDATIONS
The proposed projects form a comprehensive, lowstress network, including bicycle facilities on every major (arterial) street and several smaller (local) streets. The plan recommends a total of 47 bikeway projects that equate to 84.5 miles of new bikeways. Of these, 10 percent are multi-use paths, 31 percent are bicycle lanes, 50 percent are bicycle routes, and 7 percent are mixed bicycle lanes and bicycle routes. Class IV protected bikeways make up about 2 percent of the proposed bikeway projects.
Recommended Projects are mapped by facility types and identification number accompanied with tables listing detailed information such as location, route type, extent, and notes. The notes provide additional information, such as right-of-way constraints and further coordination needed with specific agencies and jurisdictions. These notes serve as a reminder that for project implementation, additional design and engineering will be needed to fully assess feasibility.
Each of these proposed projects represent a variety of street types that currently lack safe access and mobility for pedestrians, bicyclists, and other non-motorized modes. These treatments are important to mending existing safety and connectivity gaps within the City’s current bicycle network. They can be implemented at the interval that best fits funding cycles, city discretion, or to take into consideration the availability of new information, new funding sources, updated collision statistics, updated CIP lists, etc. Table 5-1 on page 93 briefly summarizes the 47 proposed bikeway projects and Figure 5-1 on page 95 is a map showing their location within the City as well as facility type.
RANKING METHODOLOGY
Project prioritization methodology is data-driven using available data and criteria from regional and national best practices and approved by the Technical Advisory Committee. Some criteria were modified according to the knowledge of deficiency and need based on community feedback. The following list includes the various inputs used for the prior-
itization scoring process. All projects were scored according to cumulative scores derived from the following criteria that address both geographic and demographic characteristics. This prioritization methodology can be used to prioritize projects in the future.
GEOGRAPHIC CHARACTERISTICS
Attractors/Activity Centers
This criterion addresses points of interest and destinations that people would be likely to visit, or also called attractions. The number of public facilities and retail facilities within 500 feet (or average block length) of the identified project alignment are totaled and those with a higher point value receive a higher overall score. (Data Source: SBCTA)
Schools
This criterion addresses schools along the project corridor. Schools within a quarter-mile of the identified project alignment are counted, then totaled and those with a higher point value receive a higher overall score. (Data Source: SBCTA)
Parks
This criterion addresses parks along the project corridor. Parks within a quarter-mile of the identified project alignment are counted, then totaled and those with a higher point value receive a higher overall score. (Data Source: SBCTA)
Transit Stops
This criterion addresses bus and transit stops along the project corridor. Bus and transit stops within a quarter-mile of the identified project alignment are counted, then totaled and those with a higher point value receive a higher overall score. (Data Source: SBCTA)
Reported Collisions
This criterion addressed safety through five years of collision data, normalized by collisions per mile of recommended facility. The dataset was derived from the California Highway Patrol’s Statewide Integrated Traffic Records System (SWITRS).
RIALTO ACTIVE TRANSPORTATION PLAN 90
Gap Closure/Completes the Corridor
This criterion addressed potential sidewalk and bicycle network connectivity improvements by evaluating each recommended facility’s overall contribution to system completeness. (Data Source: KTUA)
» Closes gap in an existing bicycle or sidewalk facility, or connects to regional facilities = 3
» Upgrades facility to wider sidewalks, with parkway strips, or enhanced bike facility = 2
» New sidewalk or crosswalk connecting existing and proposed bicycle and sidewalk facilities = 1
Level of Bicycle Comfort
This criterion addresses the bicycle level of stress analysis. Lower levels of bicycle comforts (3 and 4) receive higher scores to improve corridors where bicycling comfort is poor. (Data Source: KTUA)
» BLOC 1, suitable for almost all cyclists, including children trained to safely cross intersections = 1
» BLOC 2, suitable to most adult cyclists but demanding more attention than might be expected from children = 2
» BLOC 3, suitable to many people currently riding bikes in American cities = 3
» BLOC 4, suitable to very few people, the “strong and fearless” cyclists who will ride in nearly any setting = 4
Bicycle and Pedestrian Priority Methodology Model Results
The Bicycle and Pedestrian Priority Methodology Model acquires the routes total model score and is then divided by the length of that project. The average score per square feet is then calculated to normalize the score for all facilities. This allows projects with smaller footprints to have the same scoring parameters as larger projects. (Data Source: KTUA)
Consistent with Previous Planning Efforts
This criterion highlights corridors that are part of existing local and regional active transportation planning efforts. (Data Source: SBCTA, City of Rialto)
» Project in the SANBAG Non-Motorized Transportation Plan or in Local Grants = 3
» Project identified in the city’s General Plan, existing CIP Projects, and SRTS Plan = 2
Cost-Benefit
Measures the financial benefits associated with the corridor, normalized by the number of anticipated users (which is in turn a product of the facility type, population density along the corridor and length), and divided by planning level construction costs estimates.
(Data Source: NCHRP Report 552/Benefit Cost)
DEMOGRAPHIC CHARACTERISTICS
The following demographic criteria takes the total number of the specific population (number of people that walk to work, take transit work, etc.) and divides it by the area generated by either the quarter-mile or average block length buffer. This is done to limit large pedestrian projects to score higher due to the larger area they may influence.
Public Transportation to Work
This criterion looks at the number of people who use public transit to get to work. By improving access to transit, projects may solve the first and last mile issues that may hinder increased transit use.
(Data Source: US Census Bureau, American Community Survey)
Under 14 Years of Age
This criterion looks at the number of children under the age of 14. To encourage children to walk to school, good facilities need to be put in use. Knowing where large populations of children live is important in this prioritization. (Data Source: US Census Bureau, American Community Survey)
Walk to Work
This criterion looks at the number of people who walk to work. Neighborhoods with higher populations of people that walk to work, or walk to transit, should get higher priority for improvement, especially if they lack the necessary facilities. It can also be said that neighborhoods that have very little walking activity can be prioritized to increase pedestrian activity. (Data Source: US Census Bureau, American Community Survey)
CHAPTER 5 » RECOMMENDATIONS 91
Bike to Work
This criterion looks at the number of people who bike to work. Neighborhoods with higher populations of people that bike to work, or bike to transit, should get higher priority for improvement, especially if they lack the necessary facilities. It can also be said that neighborhoods that have very little biking activity can be prioritized to increase cycling activity. (Data Source: US Census Bureau, American Community Survey)
Household with No Vehicles
This criterion looks at the number of households with no vehicles. To people who have no car and rely on public transportation, bicycles, or walking to get to work and other destinations, it is important to provide safe means of using these alternate transportations types. (Data Source: US Census Bureau, American Community Survey)
Population Density
This criterion looks at the population density around project corridors. Bicycle and pedestrian facilities are more efficient and work best in highly populated areas where there are people to use the facilities. (Data Source: US Census Bureau, American Community Survey)
Employment Density
This criterion looks at the employment density around project corridors. Pedestrian facilities are more efficient when they help transport people to work either directly or through other means of transportation such as transit. (Data Source: US Census Bureau, American Community Survey)
Public Input
This criterion quantifies the amount of comments from the public workshops and online mapping survey and give points to projects that have higher amounts of comments. (Data Source: KTUA)
Micromobility
This criterion gives a score to the projects that provide the separated facilities for micromobility. If a project is a multi-use path, bike lane, or separated bikeway, it receives a score. Additional points are
given if potential bikeshare stations from the Bikeshare Feasibility Study are located on the corridor. (Data Source: KTUA & Bikeshare Feasibility Study)
Pavement Condition Index (PCI)
One of the key purposes of the Pavement Management Program is to identify the greatest return on public works investments by combining pavement field condition data with annual budget allocations. This system is essential to the city in that it assists Public Works staff in capturing funding for its arterial street system as well as cost-effectively manages the local network through proactive maintenance and scheduling. For this criterion, the Pavement Condition Index was used to give a Recommended Project a score based on the road condition. If a project is recommended on a road with a poor condition rating, it receives a higher score due to the opportunity to add bike lanes or neighborhood greenway pavement markings and signage during a potential nearterm repaving project. (Data Source: City of Rialto)
PCI Range Condition
» 86-100 Very Good = 1
» 75-85 Good = 2
» 60-74 Fair = 3
» 41-59 Poor = 4
» 0-40 Very Poor = 5
The resulting scores can serve as an essential reference for implementation, while they do not necessarily imply which route should be built first. Route implementation timeline depends on the availability of funds for implementation as funding is variable and tied to the priorities of the City’s Capital Improvement Projects and Pavement Management Plan. The proposed bikeway projects are shown in Table 5-1 .
IMPLEMENTATION STEPS
Plan implementation is necessarily multi-faceted. Besides adoption of goals and policies, it often includes carrying out programs and pursuing project funding, whether through the city’s capital improvements project process or grant funding. The plan addresses programs and projects that may not be feasible to implement right away but are included to stir thinking and inspire long-term actions.
RIALTO ACTIVE TRANSPORTATION PLAN 92
TABLE 5-1: Proposed Bikeway Projects
CHAPTER 5 » RECOMMENDATIONS 93
ID # CORRIDOR FROM STREET TO STREET FACILITY TYPE LENGTH (MILES) COST 1 Riverside Ave Foothill Blvd Agua Mansa Rd II/III 5.43 $2,000,648 2 Riverside Ave Walnut Ave Etiwanda Ave II 1.01 $172,006 3 Willow Ave Easton St Valley Blvd III 4.42 $2,142,497 4 Lilac Ave Apple St Valley Blvd III 5.05 $3,008,039 5 Pepper Ave Foothill Fwy Baseline Rd II 0.89 $98,844 6 Foothill Blvd Maple Ave Pepper Ave II 3.00 $1,087,034 7 Sycamore Ave Easton St San Bernardino Ave III 3.91 $2,243,309 8 Bloomington Ave Cedar Ave Riverside Ave IV 1.76 $830,105 9 Eucalyptus Ave Easton St Carter St III 2.99 $1,916,262 10 PE ROW Trail Cactus Ave Pepper Ave I 1.75 $6,500,187 11 Cactus Ave Trail Ayala Dr Agua Mansa Rd I 7.66 $22,583,507 12 Walnut Ave Cactus Ave Eucalyptus Ave III 1.50 $912,257 13 Linden Ave Riverside Ave Randall Ave III 4.96 $1,216,661 14 San Bernardino Ave Larch Ave Sycamore Ave II 1.46 $439,964 15 Easton St / Renaissance Pkwy Palmetto Ave Eucalyptus Ave II/III 2.29 $1,259,794 16 Randall Ave Maple Ave City Limits II 1.88 $497,141 17 Locust Ave Casa Grande Ave Baseline Rd II 2.07 $771,347 18 Valley Blvd City Limits City Limits II 1.29 $448,879 19 Slover Ave Cactus Ave City Limits II 0.98 $718,125 20 Casmalia St / Sierra Lakes Pkwy City Limits Riverside Ave II 3.31 $1,547,254 21 Cactus Ave Baseline Rd PE ROW III 1.37 $107,546 22 E Rialto Ave Riverside Ave Eucalyptus Ave II 0.76 $59,661 23 Rialto Ave Maple Ave Cactus Ave II 1.25 $98,126 24 Santa Ana Ave City Limits City Limits II 1.19 $93,416
TABLE 5-1: Proposed Bikeway Projects (Cont.)
RIALTO ACTIVE TRANSPORTATION PLAN 94
ID # CORRIDOR FROM STREET TO STREET FACILITY TYPE LENGTH (MILES) COST 25 Terra Vista Dr Dove Tree Ave City Limits II 0.11 $8,635 26 Acacia Ave E Easton St E Montrose St III 3.61 $843,747 27 Palm Ave Foothill Blvd Rialto Metrolink Station III 0.68 $158,933 28 Mckinley St and 3rd St Riverside Ave Eucalyptus Ave III 0.75 $175,294 29 Cornell St Eucalyptus Ave Cactus Ave III 1.57 $366,948 30 PE Trail Access PE ROW (via Spruce Ave) Etiwanda Ave III 0.84 $196,329 31 South St Eucalyptus Ave Willow Ave III 1.10 $257,097 32 Cactus Ave Merrill Ave Valley Blvd III 1.50 $350,587 33 PE Trail Access PE ROW (via Larch Ave) Etiwanda Ave III 0.83 $193,992 34 Holly St Pepper Ave Lilac Ave III 1.72 $402,007 35 Bohnert Ave N Locust Ave Cactus Ave III 1.50 $350,587 36 Home St Riverside Ave Eucalyptus Ave III 0.81 $189,317 37 Maple Ave Foothill Blvd Randall Ave III 1.50 $350,587 38 Apple Ave Cactus Ave Casmalia St III 0.73 $170,619 39 Larch Ave Merrill Ave San Bernardino Ave III 1.00 $233,725 40 Fromer St/Sage Ave Sycamore Ave Randall Ave III 0.17 $39,733 41 Grove St Cactus Ave Cedar Ave III 0.86 $201,003 42 Alru St Larch Ave Cactus Ave III 0.51 $119,200 43 Sunrise Dr N Palmetto Ave N Alder Ave III 0.52 $121,537 44 Shirly Bright Rd Pepper Ave Walnut Ave III 0.39 $91,153 45 Maple Ave/ West Coast Blvd Locust Ave Bohnert Ave III 1.16 $271,121 46 E Winchester Dr Pepper Ave Eucalyptus Ave III 0.25 $58,431 47 Jurupa Ave Riverside Ave City Limits III 0.22 $51,419
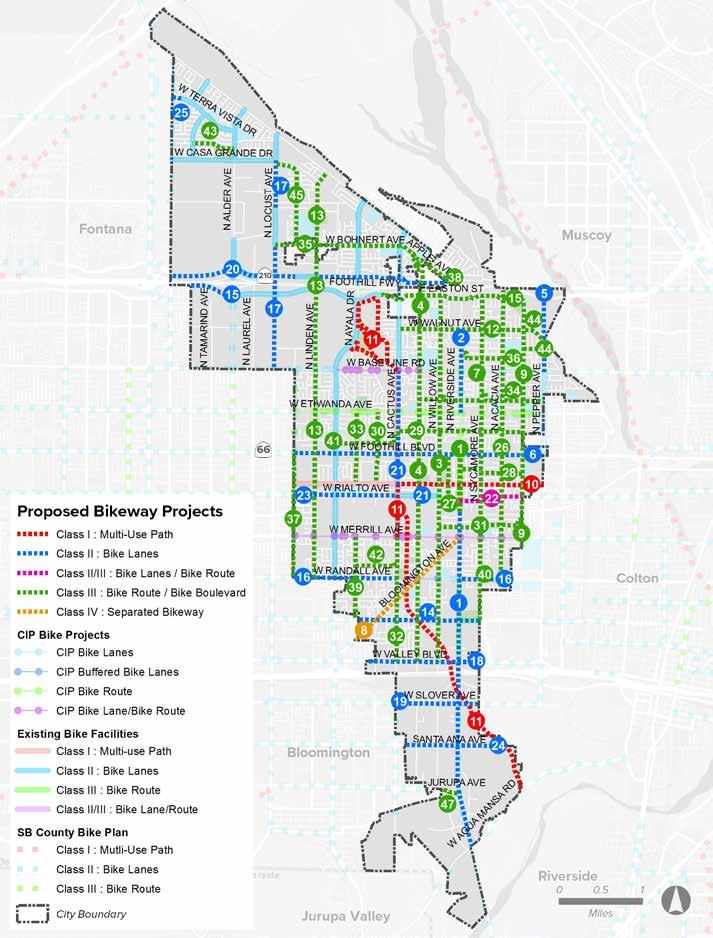
CHAPTER 5 » RECOMMENDATIONS 95
FIGURE 5-1: Proposed Bikeway Projects
RECOMMENDED BIKEWAY PROJECTS
A total of 20 bikeway Recommended Projects were selected for further analysis upon completion of the ranking process. These top 20 recommended bikeway projects will create a network of complete streets that will improve non-motorized travel and transit use throughout the City of Rialto. Due to funding and implementation purposes, the remaining proposed bikeway projects were organized by their recommended facility type, including class II and class III. Listed below is a brief description of Tables 5-2 through 5-4 and Figures 5-2 through 5-4.
» Table 5-2 and Figure 5-2 include the highest ranked projects that sum up to 57.6 miles of proposed bicycle facilities.
TABLE 5-2: Highest Ranked Projects
» Table 5-3 and Figure 5-3 include the Class II Recommended Projects that sum up to 4.7 miles of proposed bicycle lanes.
» Table 5-4 and Figure 5-4 include the Class III Recommended Projects that sum up to 22.2 proposed bicycle routes.
The following detailed cut sheets (Figures 5-5 through 5-24) highlight each of the highest ranked bikeway projects including existing conditions as well as their proposed recommendations. Design concepts, cost estimates and characteristics are also included for each corridor. Schools, parks, and other metrics were derived from data included in a quarter-mile buffer from the corridor. All bikeway projects within this section are planning level concepts. Further evaluation regarding funding and implementation will be required for these concepts.
Provides connection to Milor High School and to Rialto City Park; Add parklets along the downtown area; Potential pocket parks; Project identified in SBCTA Non-Motorized Transportation Plan and City of Rialto General Plan 2010
Provides connection to Morgan Elementary, Eisenhower Senior High School and Henry Elementary; Completes CIP bike lanes on S Riverside Ave; Project identified in SBCTA Non-Motorized Transportation Plan and City of Rialto General Plan 2010
Provides connection along Willow Ave between Easton St and Valley Blvd and to Preston Elementary School, Eisenhower Senior High School, Margaret Todd Park and Rocking Horse Preschool
Provides connection along Lilac Ave between W Casmalia St and Valley Blvd and to Eisenhower Senior High School, Dunn Elementary School, Bud Bender Park, Curtis Elementary School, Anderson Park, Simpson Elementary School, and Joe Baca Middle School; Connects to pedestrian bridge over the 210 freeway and to Hughbanks Elementary School
RIALTO ACTIVE TRANSPORTATION PLAN 96 ID # CORRIDOR FROM STREET TO STREET FACILITY TYPE LENGTH (MILES) COST
1 Riverside Ave Foothill Blvd Agua Mansa Rd II/III 5.43 $2,000,648
NOTES
2 Riverside Ave Walnut Ave Etiwanda Ave II 1.01 $172,006
3 Willow Ave Easton St Valley Blvd III 4.42 $2,142,497
4 Lilac Ave Apple St Valley Blvd III 5.05 $3,008,039
TABLE 5-2: Highest Ranked Projects (Cont.)
between
Closes the gap between Cactus Ave and the city’s limit; Extends to existing PE ROW; Project identified in SBCTA Non-Motorized Transportation Plan and City of Rialto General Plan 2010
Connects to N Cactus Ave, continues existing Class I to Merrill Ave and fills part of gap between Baseline Rd and Valley Blvd; Continues multi-use path from Cactus Trail to Renaissance Marketplace; Provides connection from Cactus Ave to Santa Ana River Trail
Closes the gap between Cactus Ave and Eucalyptus Ave; Provides connection to Morgan Elementary School
Fills the gap between Riverside Ave and Baseline Rd and connects to Wilmer Amina Carter High School and Roger Birdsall Park; Fills sidewalk gaps north of and across from Carter High School; Fills the gap between Baseline Rd and Randall Ave; Project identified in SBCTA Non-Motorized Transportation Plan
Provides connection along San Bernardino Ave between the city’s limits, extending to Rialto City Park; Project identified in SBCTA NonMotorized Transportation Plan
CHAPTER 5 » RECOMMENDATIONS 97 ID # CORRIDOR FROM STREET TO STREET FACILITY TYPE LENGTH (MILES) COST NOTES 5 Pepper Ave Foothill Fwy Baseline Rd II 0.89 $98,844
Completes CIP bike
Pepper Ave:
SBCTA Non-Motorized Transportation Plan and Pepper Avenue Specific Plan 6 Foothill Blvd Maple Ave Pepper Ave II 3.00 $1,087,034 Provides connection
Foothill Blvd
closing the gap between the city’s limits 7 Sycamore Ave Easton St San Bernardino Ave III 3.91 $2,243,309
connection
Sycamore
Easton St
Elementary School and to Rialto City Park 8 Bloomington Ave Cedar Ave Riverside Ave IV 1.76 $830,105
Closes the gap between Foothill Freeway and E Baseline Rd;
lanes on
Project identified in
along
by
Provides
along
Ave from
to Morgan
Transportation Plan and City of Rialto General Plan 2010 9 Eucalyptus Ave Easton St Carter St III 2.99 $1,916,262
connection
Eucalyptus
Frisbee Park
Middle School, Rialto Eucalyptus Head Preschool, Casey Elementary School and Rialto High School 10 PE ROW Cactus Ave Pepper Ave I 1.75 $6,500,187
Provides connection along Bloomington Ave, closing the gap
Cedar Ave and Riverside Ave; Project identified in SBCTA Non-Motorized
Provides
along
Ave from
to Frisbee
11 Cactus Ave Ayala Dr Agua Mansa Rd I 7.66 $22,583,507
12 Walnut Ave Cactus Ave Eucalyptus Ave III 1.50 $912,257
13 Linden Ave Riverside Ave Randall Ave III 4.96 $1,216,661
14 San Bernardino Ave Larch Ave Sycamore Ave II 1.46 $439,964
TABLE 5-2: Highest Ranked Projects (Cont.)
Provides connection along Easton St from existing Class II on Renaissance Pkwy to Frisbee Park; Closes the gap between Renaissance Pkwy and Eucalyptus Ave; Closes the gap between Alder Ave and Palmetto Ave and extends to existing Class II on Renaissance Pkwy; Extends to Fontana’s ATP; Project identified in SBCTA Non-Motorized Transportation Plan
Extends to CIPs along Randall Ave and fills the gap west of Cactus Ave and East of Riverside Ave; Connects to Jehue Middle School, Rocking Horse Preschool and Joe Sampson Park; Extends to Fontana’s ATP
Provides connection along Locust Ave and fills the gap between Casa Grande Ave and Persimmon Ave; Closes sidewalk gaps; Extends to existing Class II on N Locust Ave and fills the gap between Bohnert Ave and Baseline Rd; Project identified in SBCTA NonMotorized Transportation Plan and City of Rialto General Plan 2010
Provides connection along Valley Blvd to Cactus Ave, Lilac Ave, Willow Ave and Riverside Ave; Connects to Joe Baca Middle School; Project identified in SBCTA Non-Motorized Transportation Plan
Connects to planned Class II bike facilities in the neighboring communities of Colton and Bloomington; Project identified in SBCTA Non-Motorized Transportation Plan
Provides connection along Casmalia St extending to Sierra Lakes Pkwy; Extends to Fontana’s ATP; Project identified in SBCTA Non-Motorized Transportation Plan and City of Rialto General Plan 2010
RIALTO ACTIVE TRANSPORTATION PLAN 98
ID # CORRIDOR FROM STREET TO STREET FACILITY TYPE LENGTH (MILES) COST NOTES 15 Easton St / Renaissance Pkwy Palmetto Ave Eucalyptus Ave II/III 2.29 $1,259,794
16 Randall Ave Maple Ave City Limits II 1.88 $497,141
17 Locust Ave Casa Grande Ave Baseline Rd II 2.07 $771,347
18 Valley Blvd City Limits City Limits II 1.29 $448,879
19 Slover Ave Cactus Ave City Limits II 0.98 $718,125
20 Casmalia St / Sierra Lakes Pkwy City Limits Riverside Ave II 3.31 $1,547,254
Highest Ranked Projects
FIGURE 5-2: Highest Ranked Projects
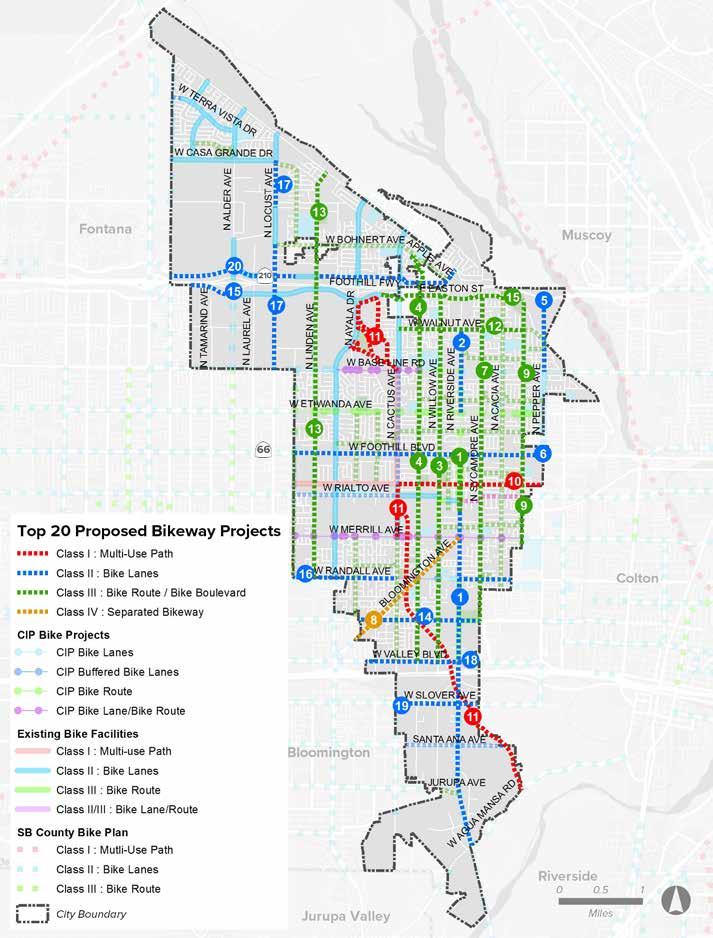
CHAPTER 5 » RECOMMENDATIONS 99
TABLE 5-3: Class II Future Recommended Projects
NOTES
Connects to existing Class II on N Cactus Ave to PE ROW and fills part of gap between Baseline Rd and Valley Blvd; Project identified in SBCTA NonMotorized Transportation Plan and City of Rialto General Plan 2010
Connects to existing Class II on Rialto Ave and closes the gap between Riverside Ave and Eucalyptus Ave; Project identified in SBCTA NonMotorized Transportation Plan
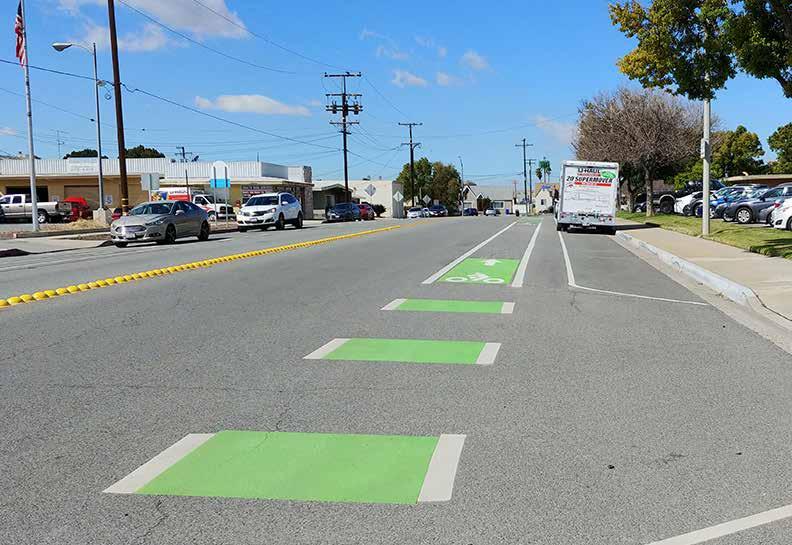
Connects Rialto Middle School and Charlotte N. Werner Elementary School and continues existing Class II to City’s limit; Extends to Fontana’s ATP; Project identified in SBCTA Non-Motorized Transportation Plan
Connects to proposed flood control channel multi-use path; Project identified in SBCTA NonMotorized Transportation Plan and City of Rialto General Plan
Extends existing Class II bike facilities west to Sierra Ave/City of Fontana; Project identified in SBCTA Non-Motorized Transportation Plan and City of Rialto General Plan 2010
RIALTO ACTIVE TRANSPORTATION PLAN 100 ID # CORRIDOR FROM STREET TO STREET LENGTH (MILES) COST
21 Cactus Ave Baseline Rd PE ROW 1.37 $107,546
22 E Rialto Ave Riverside Ave Eucalyptus Ave 0.76 $59,660
23 Rialto Ave Maple Ave Cactus Ave 1.25 $98,126
24 Santa Ana Ave City Limits City Limits 1.19 $93,416
2010 25 Terra Vista Dr Dove Tree Ave City Limits 0.11 $8,635
Existing Class II bike lane with transition striping along W Rialto Avenue
Class II Recommended Projects
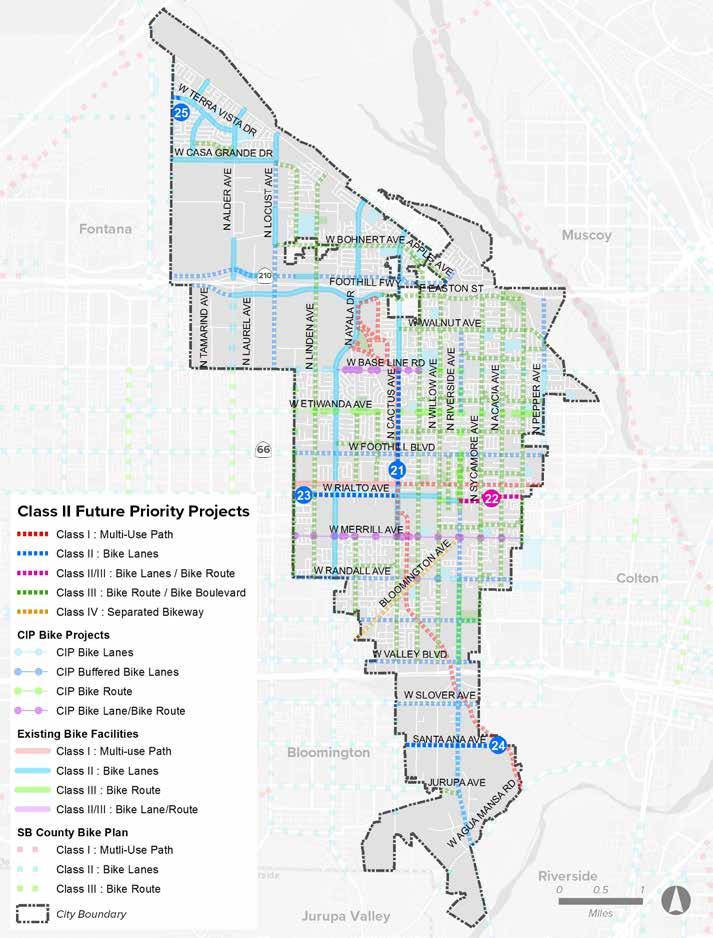
CHAPTER 5 » RECOMMENDATIONS 101
FIGURE 5-3: Class II Recommended Projects
TABLE 5-4: Class III Recommended Projects
RIALTO ACTIVE TRANSPORTATION PLAN 102 ID # CORRIDOR FROM STREET TO STREET LENGTH (MILES) COST
26 Acacia Ave E Easton St E Montrose St 3.61 $843,746 Provides connection along Acacia Ave to Frisbie Park, Frisbie Middle School and to Henry Elementary School 27 Palm Ave Foothill Blvd Rialto Metrolink Station 0.68 $158,932 Provide connection to Rialto Metrolink Station 28 Mckinley St and 3rd St Riverside Ave Eucalyptus Ave 0.75 $175,293 Enhanced pedestrian crossing recommended on Sycamore Ave; Wayfinding/traffic calming 29 Cornell St Eucalyptus Ave Cactus Ave 1.57 $366,948 Enhanced pedestrian crossing recommended on Eucalyptus Ave, Acacia Ave, Sycamore Ave, Riverside Ave, Willow Ave, and Lilac Ave; Wayfinding/traffic calming 30 PE Trail Access PE ROW (via Spruce Ave) Etiwanda Ave 0.84 $196,328 Provide gate access/open school gates during morning and afternoon 31 South St Eucalyptus Ave Willow Ave 1.10 $257,097 Enhanced pedestrian crossing recommended on Willow Ave, Riverside Ave, Sycamore Ave, Acacia Ave and Eucalyptus Ave; Wayfinding/ traffic calming 32 Cactus Ave Merrill Ave Valley Blvd 1.50 $350,587 Closes the final gap between Baseline Rd and Valley Blvd and connects to Joe Sampson Park and Joe Baca Middle School 33 PE Trail Access PE ROW (via Larch Ave) Etiwanda Ave 0.83 $193,991 Integrate route into future development; Provide gate access/open school gates during morning and afternoon 34 Holly St Pepper Ave Lilac Ave 1.72 $402,006 Enhanced crossing recommended on Riverside Ave; Coordinate with City of San Bernardino to extend route to Myers Elementary School 35 Bohnert Ave N Locust Ave Cactus Ave 1.50 $350,587 Closes the gap between Locust Ave and Cactus Ave; Provides connection to Kolb Middle School 36 Home St Riverside Ave Eucalyptus Ave 0.81 $189,317 Enhanced pedestrian crossing recommended on Riverside Ave, Sycamore Ave, Acacia Ave, and Eucalyptus Ave; Wayfinding/traffic calming 37 Maple Ave Foothill Blvd Randall Ave 1.50 $350,587 Closes the gap between Foothill Blvd and Randall Ave and connects to Maple Elementary School and to CIP bike route on Maple Ave 38 Apple Ave Cactus Ave Casmalia St 0.73 $170,619 Provides connection to Hughbanks Elementary School and shopping center located on the corner of Casmalia St and Riverside Ave 39 Larch Ave Merrill Ave San Bernardino Ave 1.00 $233,724 Enhanced pedestrian crossing recommended on Merrill Ave; Wayfinding/traffic calming 40 Fromer St/ Sage Ave Sycamore Ave Randall Ave 0.17 $39,733 Enhanced signage/wayfinding; Route bypasses hill on Randall Ave 41 Grove St Cactus Ave Cedar Ave 0.86 $201,003 Improves pedestrian crossing on Cactus Ave/ Cedar Ave (i.e. PHB or RRFB) 42 Alru St Larch Ave Cactus Ave 0.51 $119,199 Enhanced pedestrian crossing recommended on Cactus Ave/Larch Ave; Wayfinding and traffic calming 43 Sunrise Dr N Palmetto Ave N Alder Ave 0.52 $121,536 Enhanced signage, wayfinding/traffic calming
NOTES
TABLE 5-4: Class III Recommended Projects (Cont.)
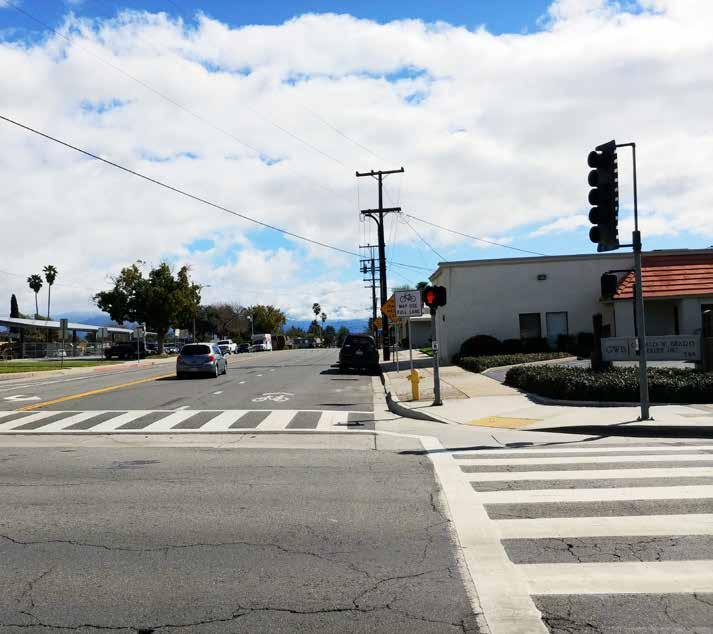
CHAPTER 5 » RECOMMENDATIONS 103
ID # CORRIDOR FROM STREET TO STREET LENGTH (MILES) COST NOTES 44 Shirly Bright Rd Pepper Ave Walnut Ave 0.39 $91,152 Provides connection/shortens non-motorized travel from Pepper Ave to Frisbie Park 45 Maple Ave/ West Coast Blvd Locust Ave Bohnert Ave 1.16 $271,120 Closes the gap between Locust Ave and Bohnert Ave; Connects to Wilmer Amina Carter High School; Closes sidewalk gaps 46 E Winchester Dr Pepper Ave Eucalyptus Ave 0.25 $58,431 Connects class III bike facilities on Pepper Ave to Frisbie Middle School 47 Jurupa Ave Riverside Ave City Limits 0.22 $51,419 Provides connection from Rialto to Bloomington Community; Coordinate with future CIP bike facilities on Riverside Ave; Project identified in SBCTA Non-Motorized Transportation Plan
Existing Class III bike route along W Rialto Avenue
Class III Recommended Projects
FIGURE 5-4: Class III Recommended Projects
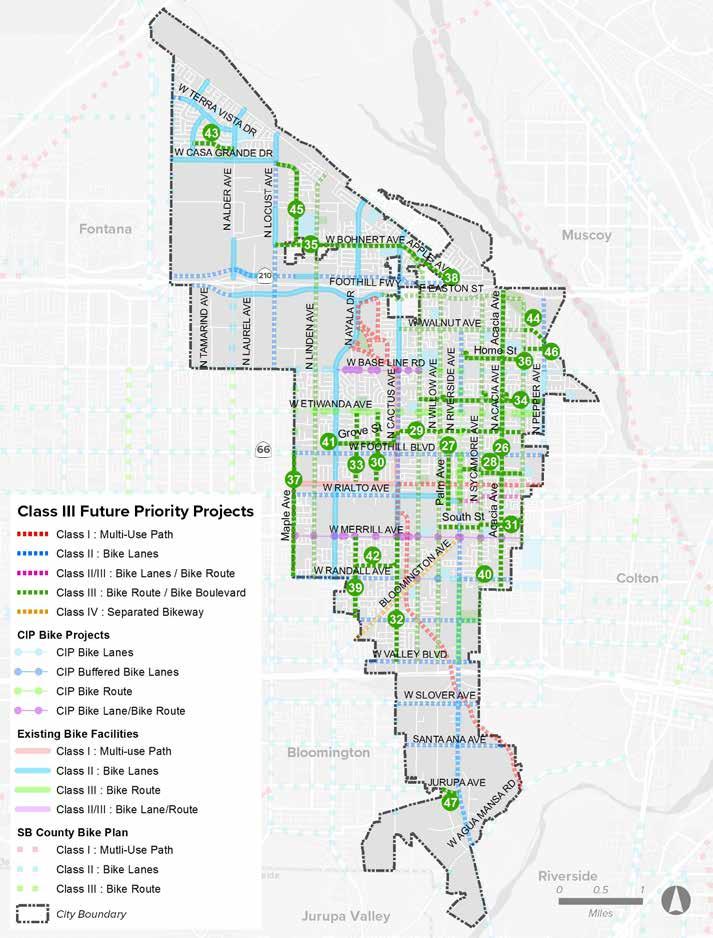
RIALTO ACTIVE TRANSPORTATION PLAN 104
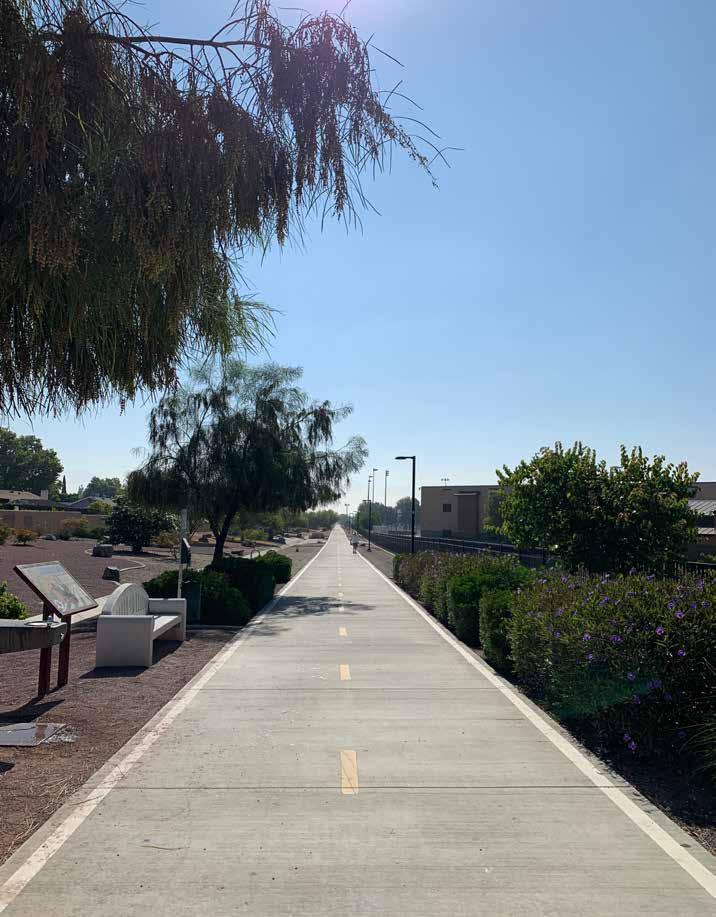
CHAPTER 5 » RECOMMENDATIONS 105
Exiting Class I multi-use path along Pacific Electric ROW
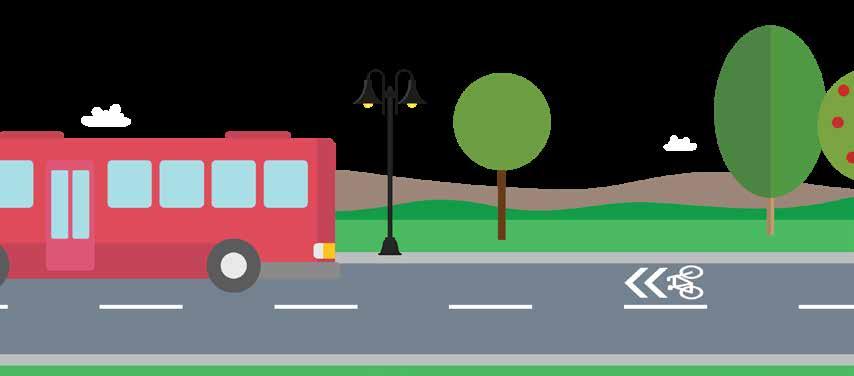
RIALTO ACTIVE TRANSPORTATION PLAN
1 Riverside Avenue (from Foothill Blvd to Agua Mansa Rd) 2 Riverside Avenue (from Walnut Ave to Etiwanda Ave) 3 Willow Avenue 4 Lilac Avenue 5 Pepper Avenue (from City Limits to Base Line Rd) 6 Foothill Boulevard 7 Sycamore Avenue 8 Bloomington Avenue 9 Eucalyptus Avenue 10 Pacific Electric ROW Trail 11 Cactus Avenue Trail 12 Walnut Avenue 13 Linden Avenue 14 San Bernardino Avenue 15 Renaissance Parkway/ Easton Avenue 16 Randall Avenue 17 Locust Avenue 18 Valley Boulevard 19 Slover Avenue 20 Casmalia Street
Highest Ranked Projects
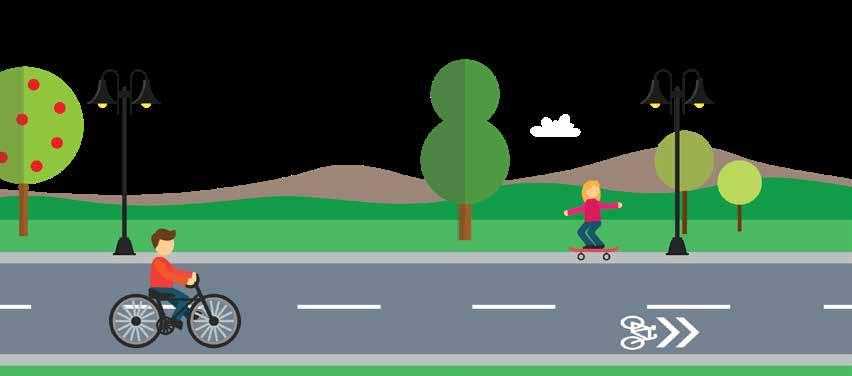
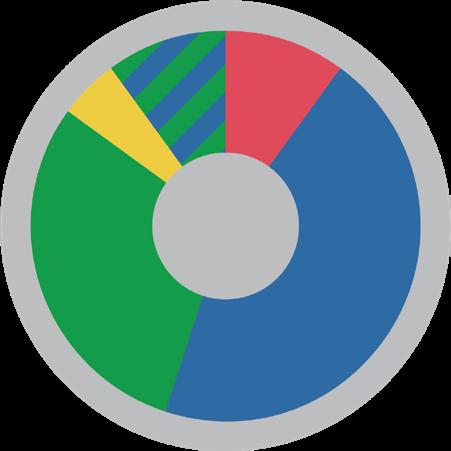
CHAPTER 5 » RECOMMENDATIONS
1
107
Highest Ranked Projects by Facility Type 2 Class I Multi-use Path 9 Class II Bike Lane 6 Class III Bike Route
Class IV Separated Bikeway 2 Class II/III Bike Lane/ Bike Route
RECOMMENDED
PROJECT 1
RIVERSIDE AVENUE
(FROM FOOTHILL BLVD TO AGUA MANSA RD)
COST ESTIMATE: $2,000,648
EXISTING CONDITIONS
Riverside Avenue is a north-south major arterial located in southern Rialto. The surrounding land uses include single family residential, other residential, commercial, and industrial. There were four pedestrian collisions and 18 bicycle collisions reported between 2013 and 2017. The posted speed limit varies from 40 to 55 mph, and the number of travel lanes vary between two to five lanes. The existing LTS level is 4. The corridor is missing sidewalks south of I-10. Bus routes only serve the corridor between W Foothill Boulevard and E Valley Road.
RECOMMENDATIONS
The Riverside Avenue proposed improvements include restriping to decrease the width of travel lanes and facilitate the addition of Class II buffered bike lanes south of W Bonnie View Dr. A Class III bike route with sharrows is recommended through Downtown Rialto. Pedestrian improvements include the installation of missing sidewalks, curb ramps, truncated domes, high-visibility crosswalks, and bus shelters. AT A GLANCE
Project Length: 5.43 miles
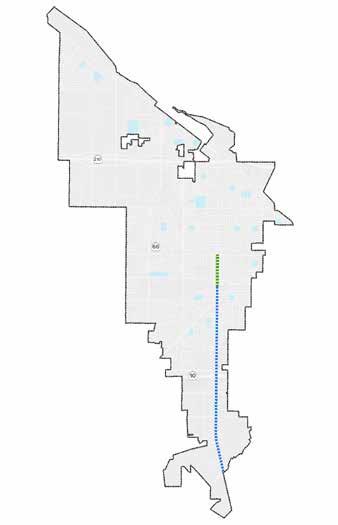
RIALTO ACTIVE TRANSPORTATION PLAN 108 Recommended Facilities Class II Bike Lane Class III Bike Route Schools Bus Stops Pedestrian Collisions Missing Curb Ramps Parks Speed Limit Bicycle Collisions Crosswalk Improvements 1 31 4 4 2 40-55 mph 18 42
Install shared lane markings and wayfinding signage.
Explore reducing travel lanes and install Class II Buffered Bike Lanes.
Install shared lane markings and wayfinding signage.
Explore reducing travel lanes and install Class II Buffered Bike Lanes.
Install bus shelters with seating.
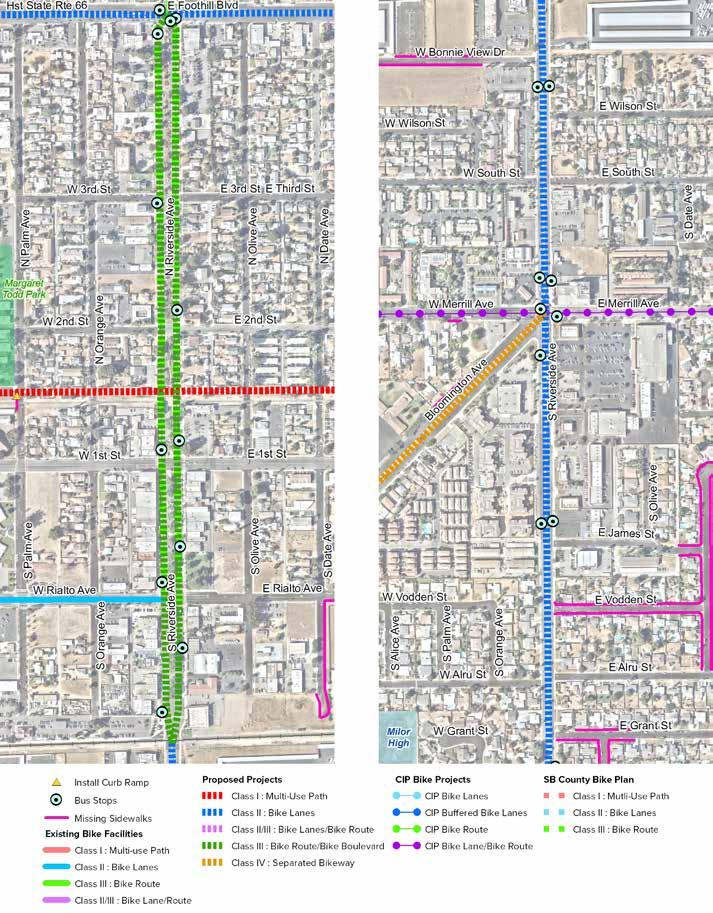
CHAPTER 5 » RECOMMENDATIONS 109
FIGURE 5-5: Riverside Avenue (from W Foothill Blvd to W Agua Mansa Rd) Proposed Improvements
Install 4 high-visibility crosswalks.
Install 6 high-visibility crosswalks.
Install 4 high-visibility crosswalks.
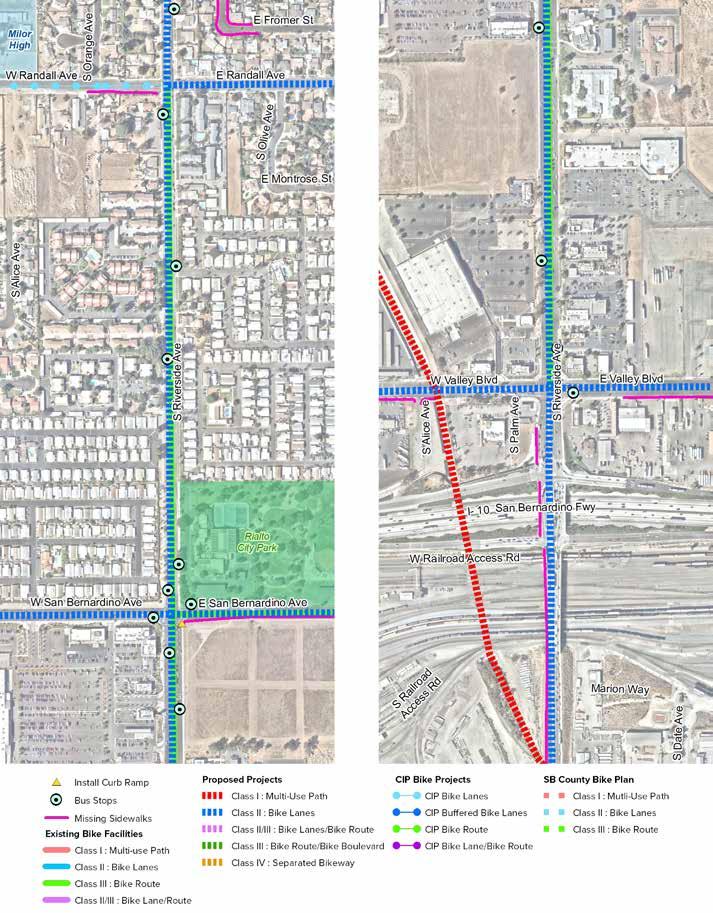
RIALTO ACTIVE TRANSPORTATION PLAN 110
FIGURE 5-5: Riverside Avenue (from W Foothill Blvd to W Agua Mansa Rd) Proposed Improvements (Cont.)
Install 4 high-visibility crosswalks. Install 4 high-visibility crosswalks.
Install 3 high-visibility crosswalks. Install 1 high-visibility crosswalk.
Explore reducing travel lanes and install Class II Buffered Bike Lanes. Explore reducing travel lanes and install Class II Buffered Bike Lanes.
Explore reducing travel lanes and install Class II Buffered Bike Lanes. Install missing sidewalk.
Install bus shelters with seating. Install bus shelters with seating.
Explore reducing travel lanes and install Class II Buffered Bike Lanes.
Install missing sidewalks.
Install 4 high-visibility crosswalks.
Install missing sidewalks.
Explore reducing travel lanes and install Class II Buffered Bike Lanes.
Explore reducing travel lanes and install Class II Buffered Bike Lanes.
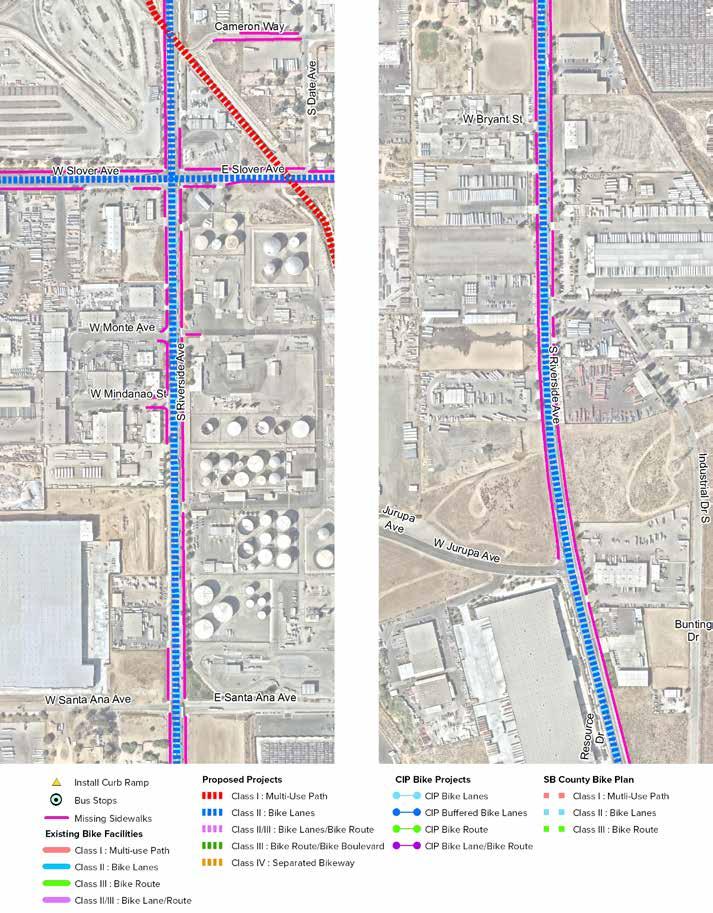
Install missing sidewalks.
Install 4 high-visibility crosswalks.
CHAPTER 5 » RECOMMENDATIONS 111
FIGURE 5-5: Riverside Avenue (from W Foothill Blvd to W Agua Mansa Rd) Proposed Improvements (Cont.)
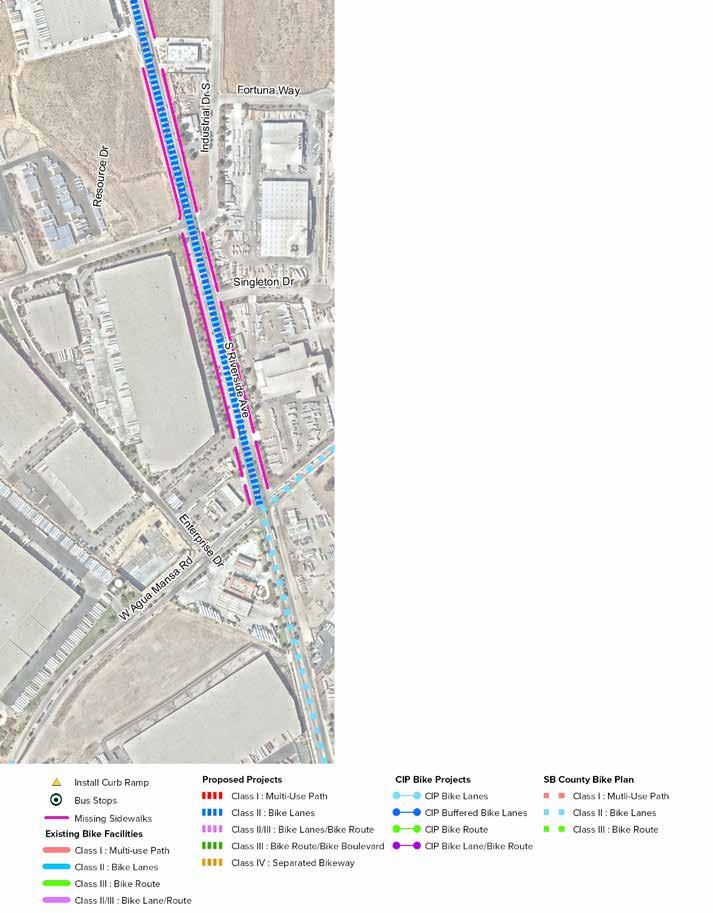
RIALTO ACTIVE TRANSPORTATION PLAN 112
FIGURE 5-5: Riverside Avenue (from W Foothill Blvd to W Agua Mansa Rd) Proposed Improvements (Cont.)
Explore reducing travel lanes widths to install Class II Buffered Bike Lanes.
Install missing sidewalks.
Coordinate with City of Colton on connection. Install 4 high-visibility crosswalks. Install 4 high-visibility crosswalks.
END OF CORRIDOR
CHAPTER 5 » RECOMMENDATIONS 113
RECOMMENDED PROJECT 2
RIVERSIDE AVENUE
(FROM WALNUT AVE TO ETIWANDA AVE)
COST ESTIMATE: $172,006
EXISTING CONDITIONS
Riverside Avenue is a north-south major arterial located in central Rialto. The surrounding land include residential and commercial. There were five pedestrian collisions and six bicycle collisions reported between 2013 and 2017, most notably at the Base Line Ave intersection. It has two travel lanes in each direction with a center turn lane and the posted speed limit varies from 40 to 45 mph. On-street parking and sidewalks are present throughout. The existing LTS is 4. Riverside Avenue serves as a bus transit corridor.
RECOMMENDATIONS
The Riverside Avenue proposed improvements include restriping to reduce lane width and facilitate the addition of Class II bike lanes. Consideration of lane diet or on-street parking removal is recommended to accommodate Class II bike lanes. Pavement markings and transition striping are also recommended in locations where conflicts may occur. Pedestrian improvements include curb ramps, truncated domes, installation of high visibility crosswalks, and bus shelters.
Project Length: 1.01 miles
RIALTO ACTIVE TRANSPORTATION PLAN 114
Schools Bus Stops Pedestrian Collisions Parks Speed Limit Bicycle Collisions 0 10 5 0 40-45 mph 6 Recommended Facilities Class II Bike Lane 18 12 AT A GLANCE
Missing Curb Ramps Crosswalk Improvements
Explore reducing travel lanes widths to remove parking and accommodate Class II bike lanes.
Install bus shelters with seating.
Explore reducing travel lanes widths to to remove parking and accommodate Class II bike lanes.
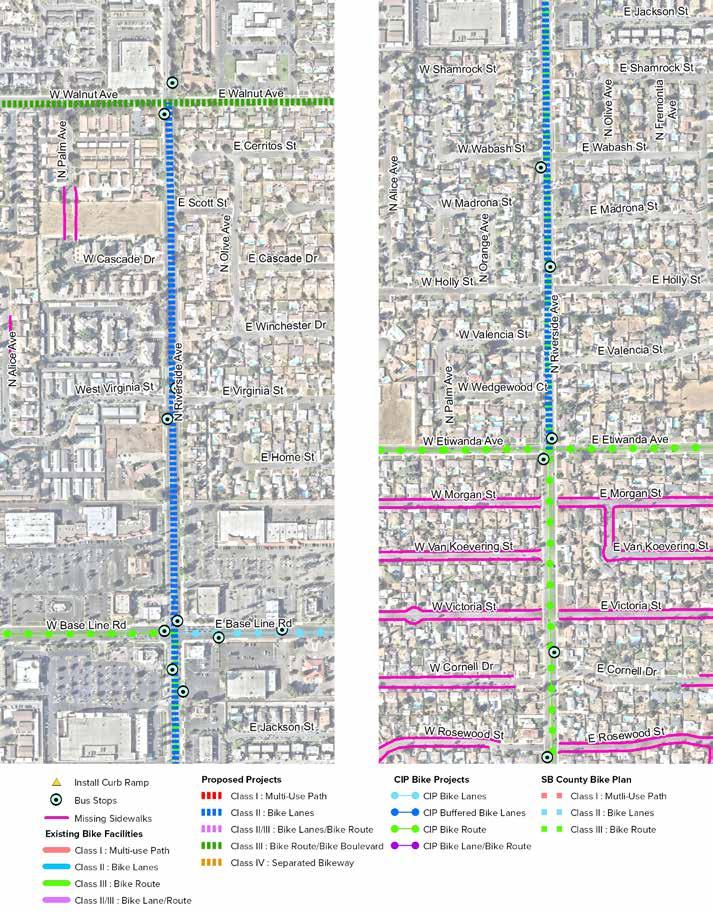
Install bus shelters with seating.
Install
Install bus shelters with seating.
Install
Install
CHAPTER 5 » RECOMMENDATIONS 115
FIGURE 5-6: Riverside Avenue (from W Walnut Ave to E Etiwanda Ave) Proposed Improvements
Install 4 high-visibility crosswalks.
4 high-visibility crosswalks.
4 high-visibility crosswalks and transition striping.
bus shelters with seating.
RECOMMENDED PROJECT 3
WILLOW AVENUE
COST ESTIMATE: $2,142,497
EXISTING CONDITIONS
Willow Avenue is a north-south collector street located in central Rialto. The surrounding land uses include single family residential, industrial, education, and commercial. A total of 14 pedestrian collisions and five bicycle collisions were reported between 2013 and 2017. The posted speed limit varies from 35 to 40 mph, and it contains one travel lane in each direction. On-street parking is present throughout most of the corridor. The existing LTS level is 4. Eight bus stops are located along this corridor.
RECOMMENDATIONS
The Willow Avenue proposed improvements include speed limit reduction to 35 mph to accommodate a Class III bicycle route. The project proposes green-back sharrows and signage throughout the corridor. Pedestrian improvements include the installation of missing sidewalks, curb ramps, truncated domes, high-visibility crosswalks, and bus shelters.
Project Length: 4.42 miles
RIALTO ACTIVE TRANSPORTATION PLAN 116
Recommended Facilities Class III Bike Route/Bike Blvd Schools Bus Stops Pedestrian Collisions Parks Speed Limit Bicycle Collisions 4 2 14 2 35-40 mph 5 2 30 AT A GLANCE
Missing Curb Ramps
Crosswalk Improvements
CHAPTER 5 » RECOMMENDATIONS 117
FIGURE 5-7: Willow Avenue Proposed Improvements
Install 4 high-visibility crosswalks.
Install 4 high-visibility school crosswalks.
Install 1 high-visibility school crosswalk.
Install 4 high-visibility crosswalks.
Install 4 high-visibility crosswalks.
Install 4 high-visibility crosswalks.
RIALTO ACTIVE TRANSPORTATION PLAN 118
FIGURE 5-7: Willow Avenue Proposed Improvements (Cont.)
Install bus shelters with seating.
Install 4 high-visibility crosswalks.
Install 1 high-visibility crosswalk.
Install 2 high-visibility crosswalks.
Improve sidewalk conditions near railroad tracks.
CHAPTER 5 » RECOMMENDATIONS 119
FIGURE 5-7: Willow Avenue Proposed Improvements (Cont.)
Install 4 high-visibility school crosswalks.
Install 4 high-visibility crosswalks.
Install 4 high-visibility crosswalks.
Install 4 high-visibility crosswalks.
Install bus shelters with seating.

RIALTO ACTIVE TRANSPORTATION PLAN 120
FIGURE 5-7: Willow Avenue Proposed Improvements (Cont.)
Install 4 high-visibility crosswalks.
END OF CORRIDOR
CHAPTER 5 » RECOMMENDATIONS 121
RECOMMENDED PROJECT 4
LILAC AVENUE
COST ESTIMATE: $3,008,039
EXISTING CONDITIONS
Lilac Avenue is a north-south collector street located in central Rialto. The surrounding land uses include single family residential, industrial, education, commercial, and vacant lots. A total of eight pedestrian collisions and nine bicycle collisions were reported between 2013 and 2017. The posted speed limit varies from 35 to 45 mph, and it contains one travel lane in each direction. The existing LTS level is 1. The majority of the corridor has sidewalks but are missing along the northern portion. Bus routes serve this corridor between W Easton St and W Merrill Ave.
RECOMMENDATIONS
The Lilac Avenue proposed improvements include speed limit reduction to 35 mph to accommodate a Class III bicycle route. The project proposes greenback sharrows and signage throughout the corridor. Pedestrian improvements include the installation of missing sidewalks, curb ramps, truncated domes, high-visibility crosswalks, and bus shelters.
Project Length: 5.05 miles
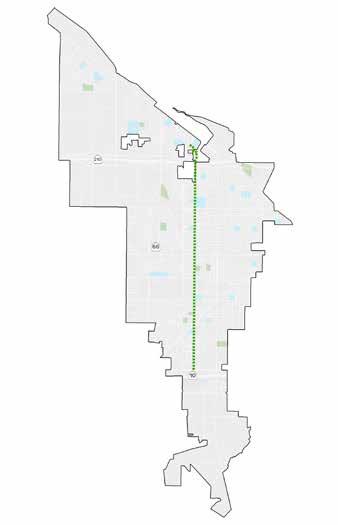
RIALTO ACTIVE TRANSPORTATION PLAN 122 Schools Bus Stops Pedestrian Collisions Parks Speed Limit Bicycle Collisions 7 4 8 3 35-45 mph 9
Recommended Facilities Class III Bike Route/Bike Blvd 15 86 AT A GLANCE
Missing Curb Ramps Crosswalk Improvements
CHAPTER 5 » RECOMMENDATIONS 123
FIGURE 5-8: Lilac Avenue Proposed Improvements
Install 1 high-visibility school crosswalk.
Install 4 high-visibility school crosswalks.
Install 3 high-visibility school crosswalks.
Install 4 high-visibility crosswalks.
Install bus shelter with seating.
Install 2 high-visibility crosswalks.
Install 3 high-visibility crosswalks.
Install 2 high-visibility crosswalks.
Install wayfinding signage and shared lane pavement markings along the corridor.
Install wayfinding signage and shared lane markings along the corridor.
Install missing sidewalks.
RIALTO ACTIVE TRANSPORTATION PLAN 124
FIGURE 5-8: Lilac Avenue Proposed Improvements (Cont.)
Install 1 high-visibility crosswalk.
Install 4 high-visibility crosswalks.
Install bus shelter with seating.
Install 4 high-visibility crosswalks.
Install 3 high-visibility crosswalks.
Install 2 high-visibility crosswalks.
Install 4 high-visibility crosswalks.
Install 4 high-visibility school crosswalks.
Install wayfinding signage and shared lane markings along the corridor.
CHAPTER 5 » RECOMMENDATIONS 125
Install bus shelter with seating. Install 4 high-visibility
Install 3 high-visibility crosswalks. Install 10 high-visibility crosswalks. Evaluate for an RRFB or pedestrian signal. Install 1 high-visibility
Install 1
Install 1 high-visibility
Improve sidewalk conditions near tracks. Install missing sidewalks. Install missing sidewalks. Install missing sidewalks. Install 4 high-visibility school
Install wayfinding signage and shared lane markings along the corridor.
FIGURE 5-8: Lilac Avenue Proposed Improvements (Cont.)
crosswalks.
crosswalk.
high-visibility crosswalk.
crosswalk.
crosswalks.
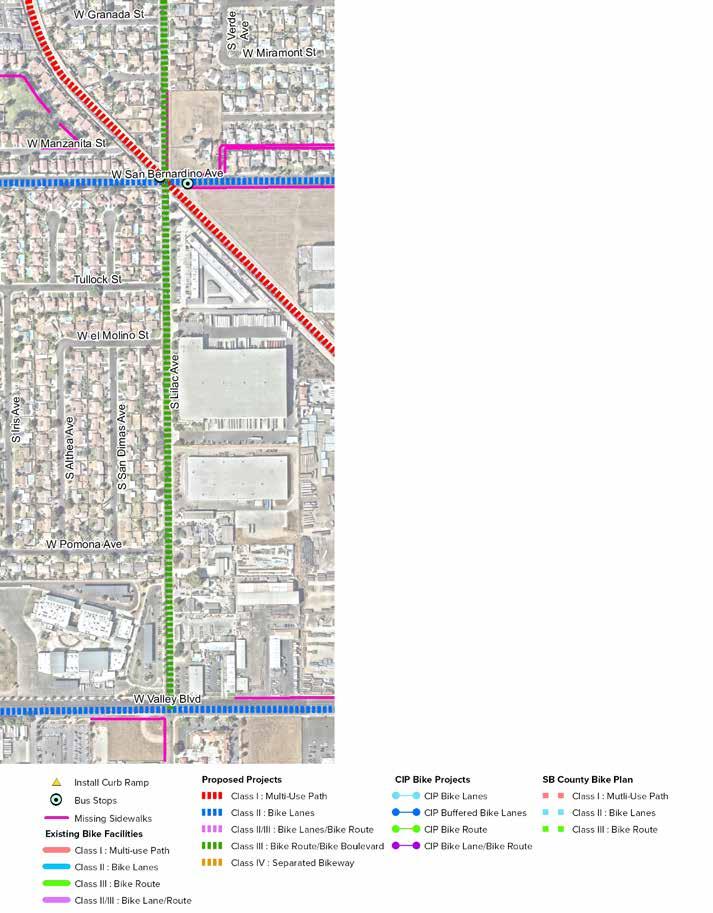
RIALTO ACTIVE TRANSPORTATION PLAN 126
FIGURE 5-8: Lilac Avenue Proposed Improvements (Cont.)
Install 4 high-visibility crosswalks.
Install 4 high-visibility crosswalks.
Install 1 high-visibility crosswalk.
Install bus shelters with seating.
Install wayfinding signage and shared lane markings along the corridor.
END OF CORRIDOR
CHAPTER 5 » RECOMMENDATIONS 127
RECOMMENDED PROJECT 5
PEPPER AVENUE
(FROM CITY LIMITS AVE TO BASE LINE RD)
COST ESTIMATE: $98,844
EXISTING CONDITIONS
Pepper Avenue is a north-south major arterial located in northeastern Rialto. The surrounding land uses are residential, but commercial and open space are planned per the Pepper Avenue Specific Plan. There was one pedestrian collision reported between 2013 and 2017. Pepper Avenue has two travel lanes in each direction with a center turn lane and has a posted speed limit 45 mph. On-street parking and sidewalks are present throughout. The existing LTS is 4. Bus stops are located at the intersection of Base Line Rd.
RECOMMENDATIONS
The Pepper Avenue proposed improvements include restriping to decrease the lane width and add Class II bike lanes. The width allows for a 5’ buffer from the freeway to approximately 600 ft south. Pavement markings and transition striping are also recommended in locations where conflicts may occur. Pedestrian improvements include truncated domes and installation of high visibility crosswalks.
Project Length: 0.89 miles
RIALTO ACTIVE TRANSPORTATION PLAN 128 Schools Bus Stops Pedestrian Collisions Parks Speed Limit Bicycle Collisions 0 2 1 1 45 mph 0
Recommended Facilities Class II Bike Lane
0 0 AT A GLANCE
Missing Curb Ramps
Crosswalk Improvements
Evaluate feasibility of a pedestrian bridge connection to Frisbie Park as per Pepper Avenue Specific Plan.
Explore reducing travel lanes widths to install Class II Buffered Bike Lanes. to accommodate Class II bike lanes.
Install 2
Proposed major intersection per Pepper Ave Specific Plan. Install 4 high-visibility crosswalks, shared lane markings and transition striping.
Explore reducing travel lanes widths to install Class II Buffered Bike Lanes. to accommodate Class II bike lanes.
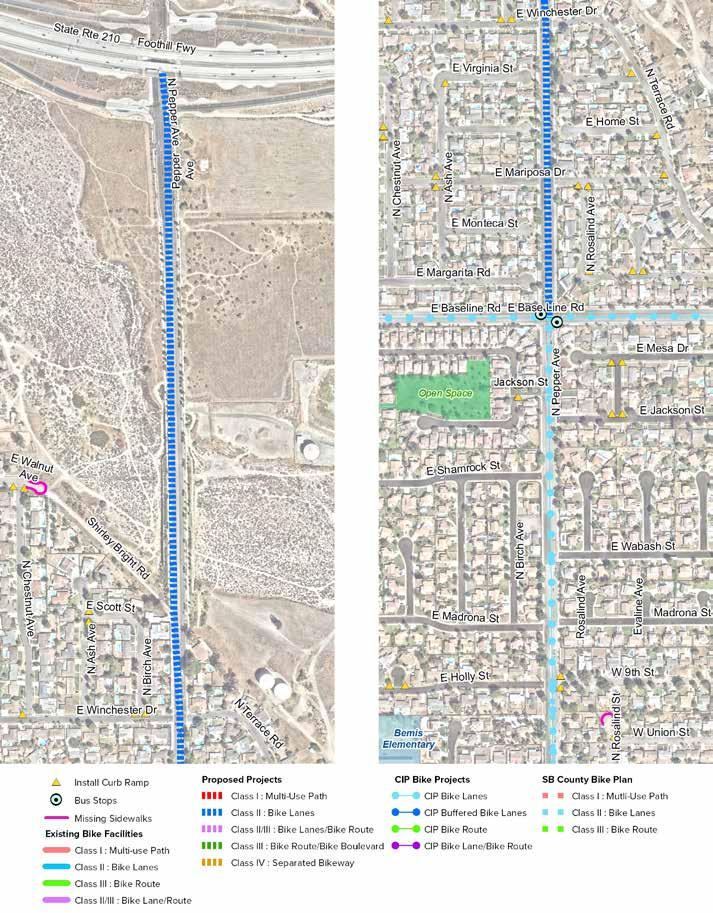
CHAPTER 5 » RECOMMENDATIONS 129
FIGURE 5-9: Pepper Avenue (from City Limits to E Base Line Rd) Proposed Improvements
high-visibility crosswalks.
Install 4 high-visibility crosswalks.
RECOMMENDED PROJECT 6
FOOTHILL BOULEVARD
COST ESTIMATE: $1,087,034
EXISTING CONDITIONS
Foothill Boulevard is an east-west major arterial located in central Rialto. The surrounding land uses include commercial with some multi-family residential. There were 18 pedestrian collisions and 11 bicycle collisions reported between 2013 and 2017. The posted speed limit varies from 40 to 50 mph, and the number of travel lanes vary from 2 to 3 in each direction with a center turn lane. The existing LTS is 4. Sidewalks are present on both sides of the street but are lacking on undeveloped parcels. Foothill Boulevard serves as a bus transit corridor, with several bus stops with simple transit signage. Very few stops are equipped with benches and shelters.
RECOMMENDATIONS
Project Length: 3.00 miles
The proposed improvements include restriping to decrease lane width to add Class II bike lanes. High-visibility crosswalks and additional wayfinding signage are recommended at the intersection with the Cactus Ave Trail. Pedestrian improvements include the installation of missing sidewalks, curb ramps, truncated domes, high-visibility crosswalks, and bus shelters. 8
RIALTO ACTIVE TRANSPORTATION PLAN 130 Schools Bus Stops Pedestrian Collisions Parks Speed Limit Bicycle Collisions 1 26 18 2 40-50 mph 11
Recommended Facilities Class II Bike Lane
44 AT A GLANCE
Missing Curb Ramps Crosswalk Improvements
Further evaluation needed to accommodate bike lanes throughout entire corridor.
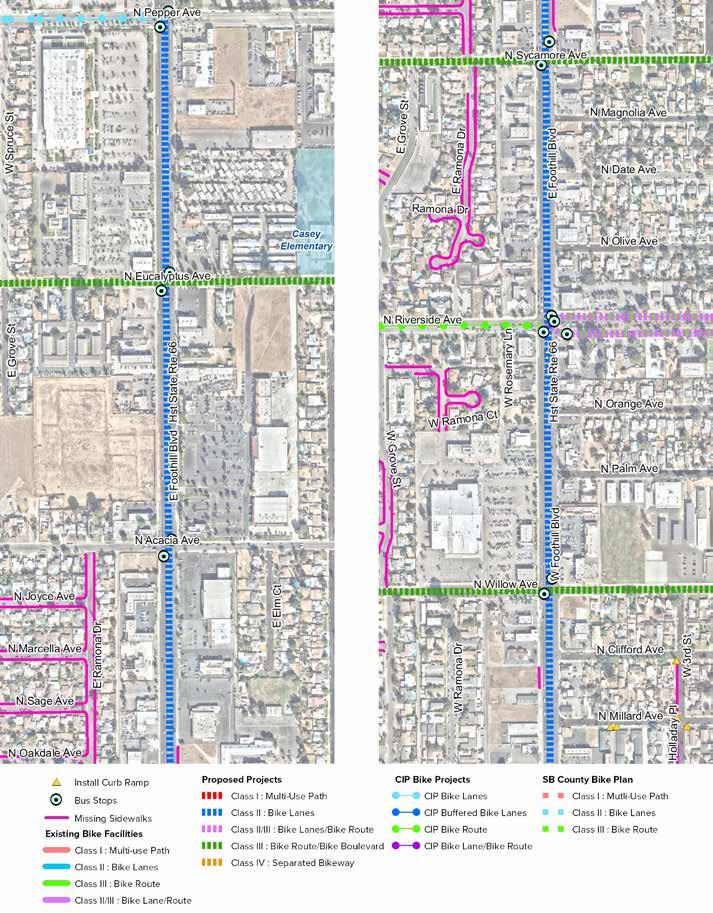
CHAPTER 5 » RECOMMENDATIONS 131
FIGURE 5-10: Foothill Boulevard Proposed Improvements
Install 4 high-visibility crosswalks. Install 4 high-visibility crosswalks. Install 4 high-visibility crosswalks.
Install 4 high-visibility crosswalks.
Install 4 high-visibility crosswalks. Install 4 high-visibility crosswalks.
Install bus shelter with seating. Install bus shelter with seating. Install bus shelter with seating.
may accommodate
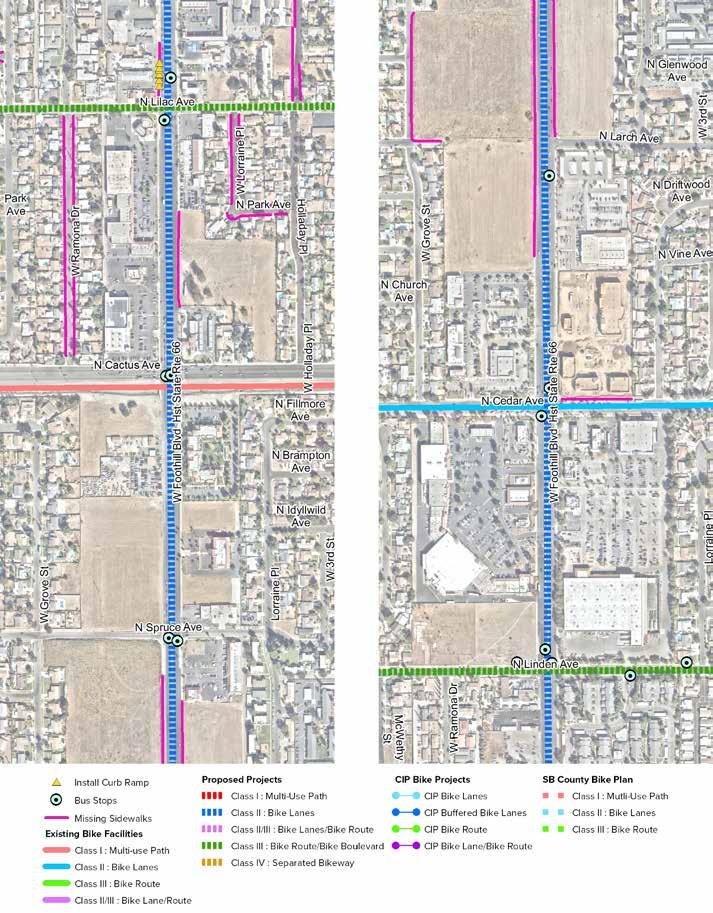
RIALTO ACTIVE TRANSPORTATION PLAN 132
FIGURE 5-10: Foothill Boulevard Proposed Improvements (Cont.)
Install 4 high-visibility crosswalks. Install 4 high-visibility crosswalks. Add additional wayfinding for Cactus Trail crossing.
Install 4 high-visibility crosswalks.
Install 4 high-visibility crosswalks.
Install 4 high-visibility crosswalks.
Westbound lanes may accommodate buffered bike lanes.
Westbound lanes
buffered bike lanes.
Install bus shelter with seating. Install bus shelter with seating.
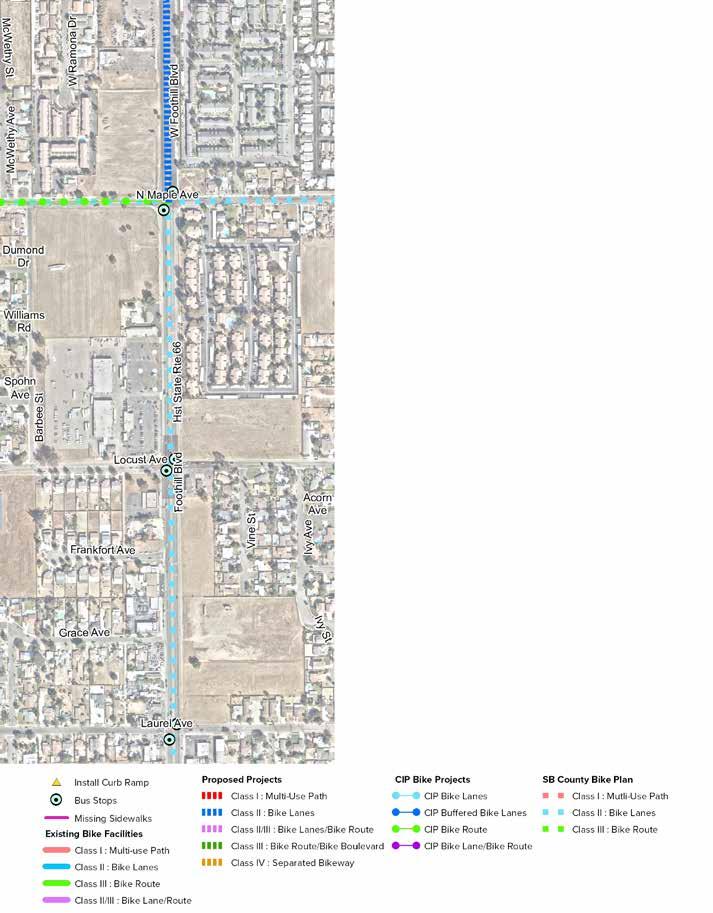
CHAPTER 5 » RECOMMENDATIONS 133
FIGURE 5-10: Foothill Boulevard Proposed Improvements (Cont.)
Install 4 high-visibility crosswalks.
RECOMMENDED
PROJECT 7
SYCAMORE AVENUE
COST ESTIMATE: $2,243,309
EXISTING CONDITIONS
Sycamore Avenue is a north to south corridor located in east Rialto. On average, Sycamore Avenue consists of one travel lane in each direction. The posted speed limit is 35 to 40 mph. Near schools, the posted speed limit is 25 mph. There were three pedestrian collisions and three bicycle collisions reported on Sycamore Avenue. The surrounding land use is mostly single-family residential. On-street parking is available along most of the corridor. A number of sidewalks are missing on the residential streets that surround the corridor, but the corridor itself has very few missing sidewalks. There are currently no bicycle facilities present.
RECOMMENDATIONS
The proposed improvements to the Sycamore Avenue corridor include reducing the travel speed limit to 35 miles per hour to accommodate sharrow lane markings along the entire corridor. In addition to sharrows, wayfinding signage along the entire corridor should also be installed.
Project Length: 3.91 miles
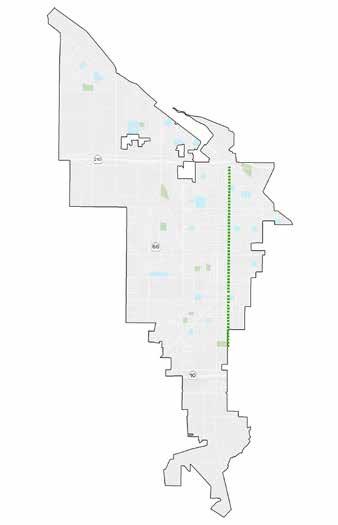
RIALTO ACTIVE TRANSPORTATION PLAN 134 Schools Bus Stops Pedestrian Collisions Parks Speed Limit Bicycle Collisions 3 1 3 1 25-40 mph 3
Recommended Facilities Class III Bike Route/Bike Blvd 11 38 AT A GLANCE
Missing Curb Ramps
Improvements
Crosswalk
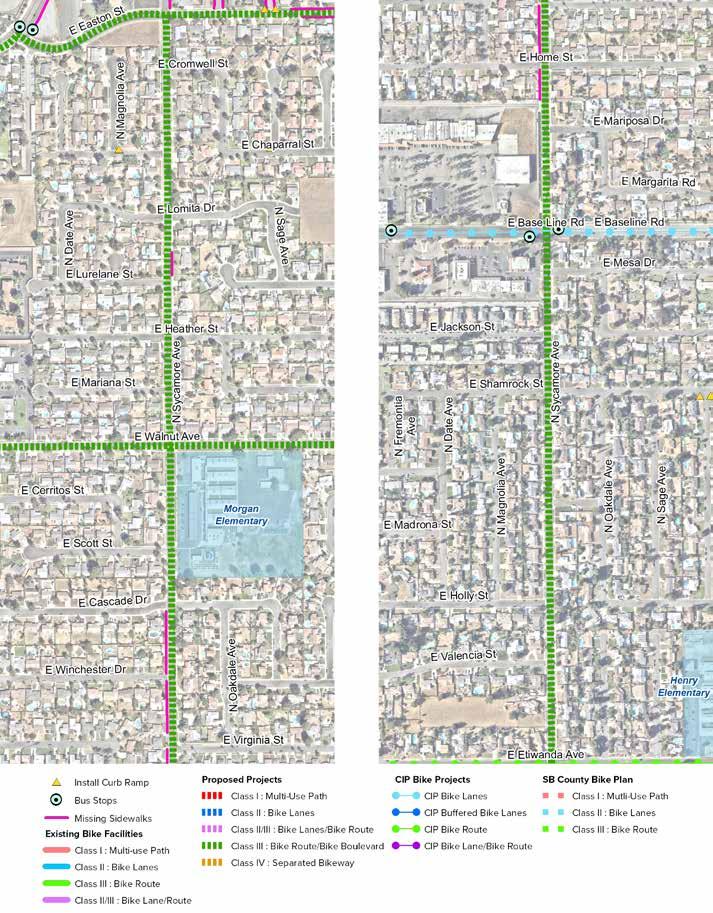
CHAPTER 5 » RECOMMENDATIONS 135
FIGURE 5-11: Sycamore Avenue Proposed Improvements
Evaluate location for installation of RRFB or pedestrian signal
Install 2 high-visibility crosswalks.
Install 2 high-visibility school crosswalks.
Install 4 high-visibility school crosswalks.
Install 2 high-visibility school crosswalks and 1 stop sign.
Install 4 highvisibility crosswalks and 1 bus shelter.
Install wayfinding signage.
Install shared lane markings along the corridor.
Install shared lane markings and wayfinding signage along the entire corridor.
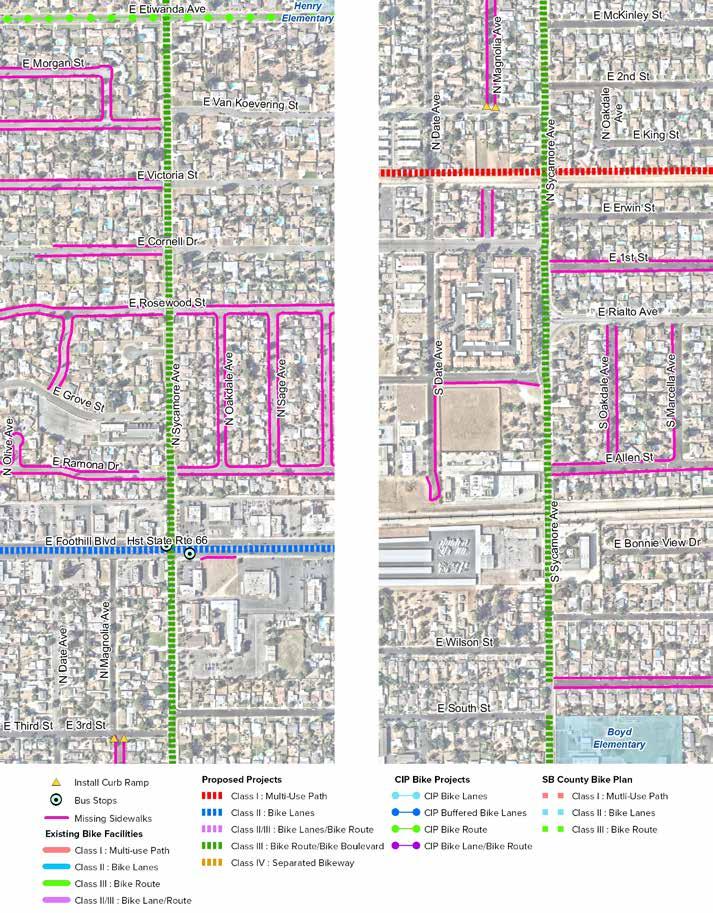
RIALTO ACTIVE TRANSPORTATION PLAN 136
FIGURE 5-11: Sycamore Avenue Proposed Improvements (Cont.)
Install 4 high-visibility crosswalks.
Install 2 high-visibility crosswalks.
Install 4 highvisibility crosswalks and 1 bus shelter.
Evaluate for a pedestrian signal or RRFB.
Improve sidewalk conditions near tracks.
Install 1 high-visibility crosswalk.
Install 1 highvisibility crosswalk and evaluate for an RRFB.
Install 1 high-visibility school crosswalk.
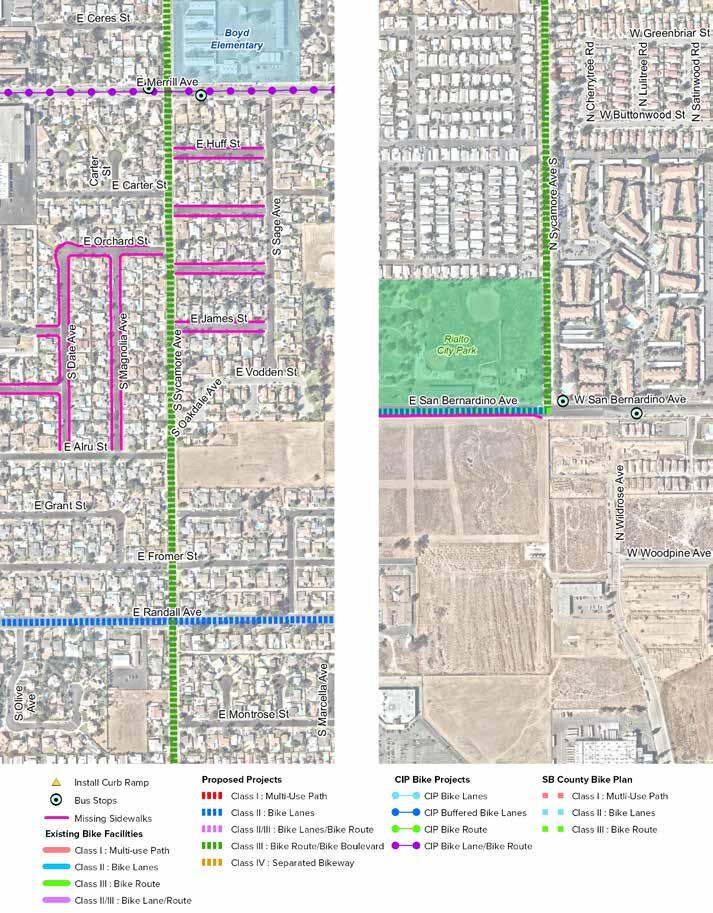
CHAPTER 5 » RECOMMENDATIONS 137
FIGURE 5-11: Sycamore Avenue Proposed Improvements (Cont.)
Install 4 highvisibility school crosswalks.
Install 1 high-visibility crosswalk.
Install 1 high-visibility crosswalk.
Evaluate for a pedestrian signal or RRFB.
Install shared lane markings and wayfinding signage along the corridor.
RECOMMENDED PROJECT 8
BLOOMINGTON AVENUE
COST ESTIMATE: $830,105
EXISTING CONDITIONS
Bloomington Avenue is a major arterial highway that runs diagonally in southern Rialto. The surrounding land uses include residential and commercial. There were two pedestrian collisions and three bicycle collisions reported between 2013 and 2017. Bloomington Avenue has a posted speed limit of 50 mph, and the number of travel lanes are two travel lanes in each direction with a center median. The existing LTS is 4. Sidewalks are mostly present on both sides of the street, but are missing periodically throughout.
RECOMMENDATIONS
The Bloomington Avenue proposed improvements include restriping to decrease the width of travel lanes and removal of on-street parking to facilitate the addition of Class IV separated bikeways. Median modifications, including a bike traffic signal, signage, and high-visibility crosswalk, are recommended at the intersection with the Cactus Ave Trail. Pedestrian improvements include the installation of missing sidewalks, curb ramps, truncated domes, and high-visibility crosswalks.
Recommended Facilities Class IV Separated Bikeway
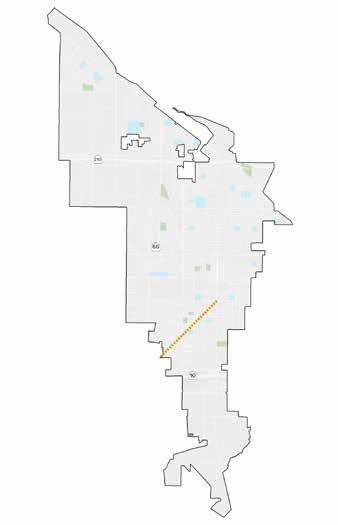
Project Length: 1.76 miles
Missing Curb Ramps
RIALTO ACTIVE TRANSPORTATION PLAN 138 Schools Bus Stops Pedestrian Collisions Parks Speed Limit Bicycle Collisions 3
2 2 50
3
1
mph
1 42 AT A GLANCE
Crosswalk Improvements
Explore reducing travel lanes widths to install separated bikeways.
Explore reducing travel lanes widths to install separated
Install
Install pedestrian signal, signage, and highvisibility crossing. Modify median for Class I multiuse path crossing.
Reduce northbound travel lanes to
Explore reducing travel lanes widths to install separated
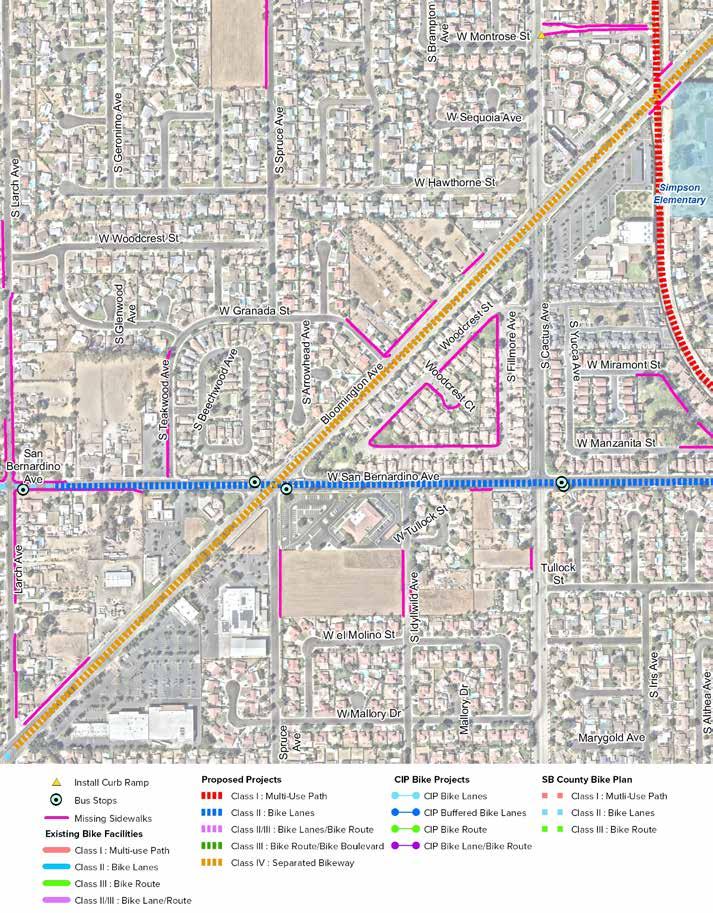
CHAPTER 5 » RECOMMENDATIONS 139
FIGURE 5-12: Bloomington Avenue Proposed Improvements
10 ft.
bikeways.
Install southbound Class IV separated bikeway with a 2 ft wide physical buffer.
Install southbound Class IV separated bikeway with a 2 ft wide physical buffer.
Install 2 Class IV separated bikeways with a 6 ft wide physical buffer.
bikeways.
Install 3 high-visibility crosswalks.
Install 7 high-visibility crosswalks.
6 high-visibility crosswalks.
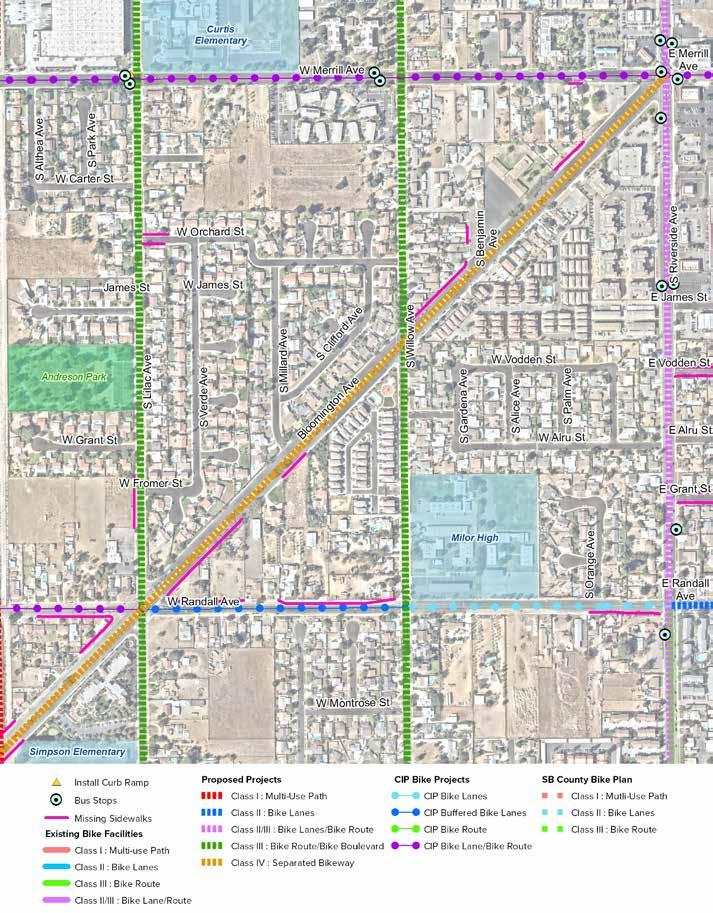
RIALTO ACTIVE TRANSPORTATION PLAN 140
FIGURE 5-12: Bloomington Avenue Proposed Improvements (Cont.)
Install 11 high-visibility school (yellow) pedestrian crossings.
Install 6 high-visibility crosswalks.
Consider inside lanes 12 ft wide and outside lane 141 ft wide.
Conside inside lanes 12 ft wide and all outside lanes 14 ft wide. Reduce
northbound
travel lanes to 11 ft.
Install 2 Class IV separated bikeways with a 5 ft wide physical buffer.
Install 2 Class IV separated bikeways with a 6 ft wide physical buffer.
END OF CORRIDOR
CHAPTER 5 » RECOMMENDATIONS 141
RECOMMENDED PROJECT 9
EUCALYPTUS AVENUE
COST ESTIMATE: $1,916,262
EXISTING CONDITIONS
Eucalyptus Avenue runs north to south in east Rialto. On average, Eucalyptus Avenue consists of one travel lane in each direction. The posted speed limit varies from 25 mph near schools and 45 mph on other segments of the corridor. The surrounding land use is mostly single-family residential. This corridor provides a connection to Frisbie Park and a number of schools. There were 11 pedestrian collisions and two bicycle collisions reported between 2013 and 2017. Sidewalks are present in each direction of the corridor. Currently, there are no existing bicycle facilities.
RECOMMENDATIONS
Recommendations for the Eucalyptus Avenue corridor include reducing the travel speed limit to 35 mph as several segments of the corridor have a posted speed limit of 40 mph This specific recommendation would allow for sharrow lane markings along the entire corridor. In addition, wayfinding signage should also be installed throughout the corridor.
Project Length: 2.99 miles
RIALTO ACTIVE TRANSPORTATION PLAN 142 Schools Bus Stops Pedestrian Collisions Parks Speed Limit Bicycle Collisions 4 8 11 1 25-45 mph 2
Recommended Facilities Class III Bike Route/Bike Blvd 11 38 AT A GLANCE
Missing Curb Ramps
Crosswalk Improvements
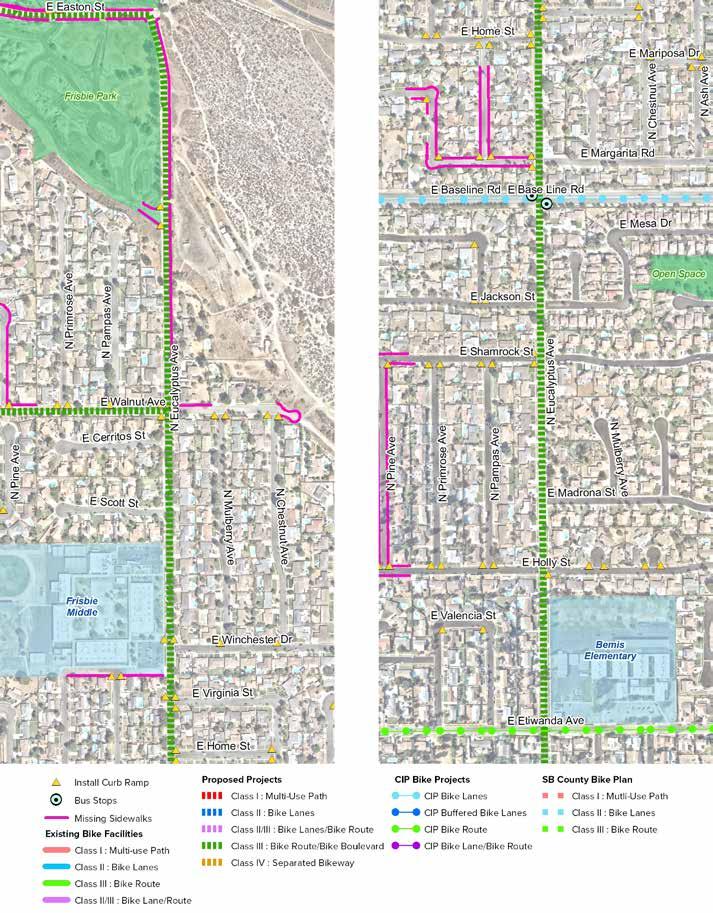
CHAPTER 5 » RECOMMENDATIONS 143
FIGURE 5-13: Eucalyptus Avenue Proposed Improvements
Install enhanced pedestrian crossing with wayfinding signage.
Install high-visibility school crosswalks with curb extensions.
Install 4 high-visibility crosswalks.
Install highvisibility school crosswalks and curb extensions.
Install 4 high-visibility crosswalks.
Install 4 high-visibility school crosswalks and curb extensions.
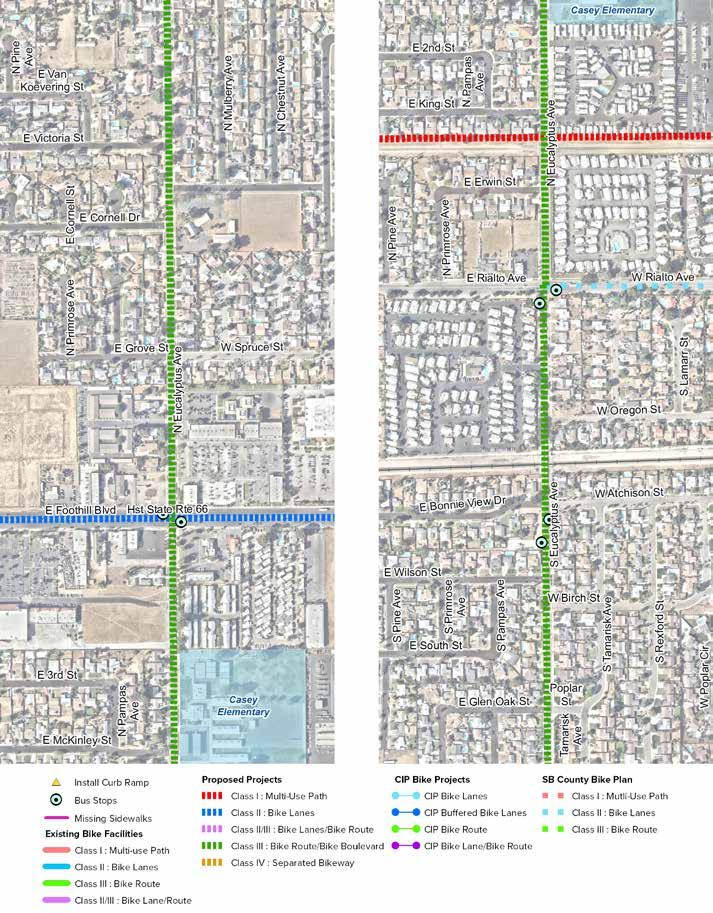
RIALTO ACTIVE TRANSPORTATION PLAN 144
FIGURE 5-13: Eucalyptus Avenue Proposed Improvements (Cont.)
Install highvisibility crosswalks and wayfinding signage.
Install shared lane markings and wayfinding signage along entire corridor.
Install 4 highvisibility crosswalks and 2 bus shelters.
Install 1 highvisibility school crosswalk and curb extensions.
Install 1 highvisibility school crosswalks with curb extensions.
Install 4 high-visibility crosswalks and 1 bus shelter.
Install 1 bus shelter.
Install 2 bus shelters.
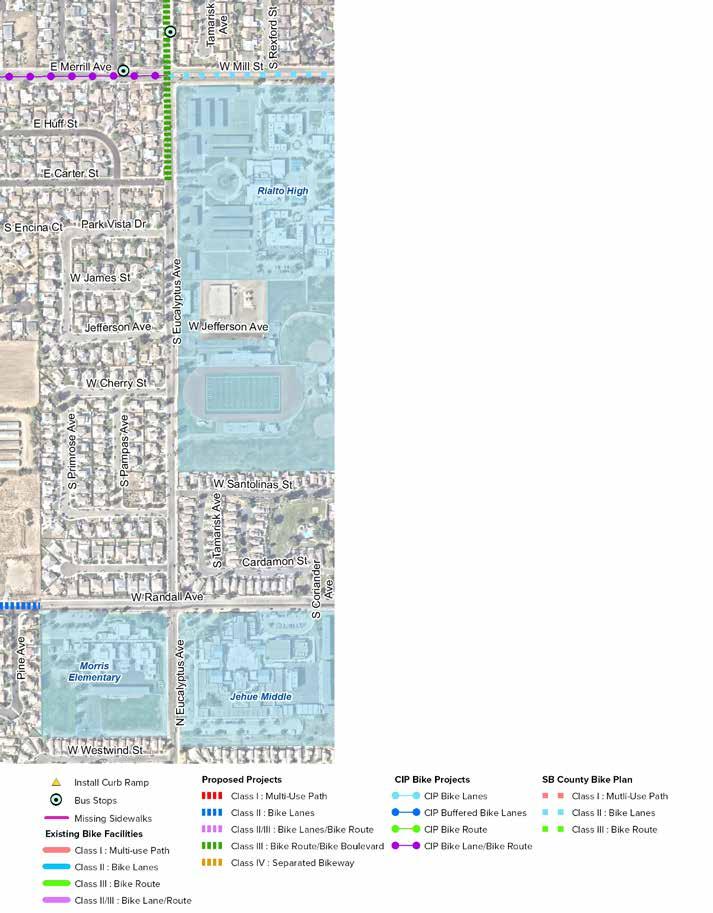
CHAPTER 5 » RECOMMENDATIONS 145
FIGURE 5-13: Eucalyptus Avenue Proposed Improvements (Cont.)
Install 4 highvisibility school crosswalk and 1 bus shelter.
Install 1 highvisibility school crosswalk with curb extensions.
RECOMMENDED PROJECT 10
PACIFIC ELECTRIC ROW TRAIL
COST ESTIMATE: $6,500,187
EXISTING CONDITIONS
This project continues the existing Pacific Electric ROW Trail from the City of Rancho Cucuamonga through the City of Rialto and into the city of San Bernardino. Within the city, the trail exists between Maple Avenue and terminates at Cactus Avenue. Schools, parks, residential, commercial, and industrial land uses are directly adjacent to this project.
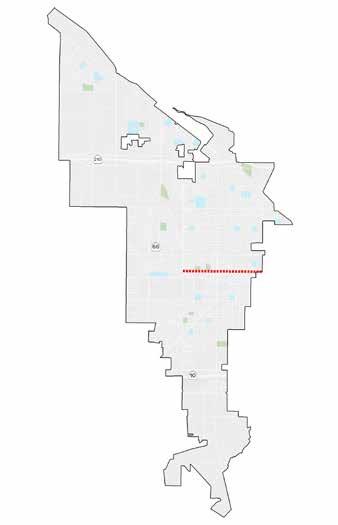
RECOMMENDATIONS
The proposed improvements include enhanced pedestrian crossings, such as pedestrian signals to improve access to the trail from local streets and provide direct connections to schools and parks. This will give access for children and prevent them from traveling on major streets. This project will also provide a safe and attractive regional connection to adjacent cities and beyond. Installing enhanced and safe crossings at streets will be important for a continuous facility. The City has recently acquired a Caltrans planning grant to address the feasibility of the Pacific Electric Trail for future implementation.
Project Length: 1.75 miles
RIALTO ACTIVE TRANSPORTATION PLAN 146 Schools Bus Stops Pedestrian Collisions Parks Speed Limit Bicycle Collisions 1 0 0 2 N/A 0
Recommended Facilities Class I Multi-Use Path 13 7 AT A GLANCE
Missing Curb Ramps Crosswalk Improvements
Coordinate with City of San Bernardino on connection.
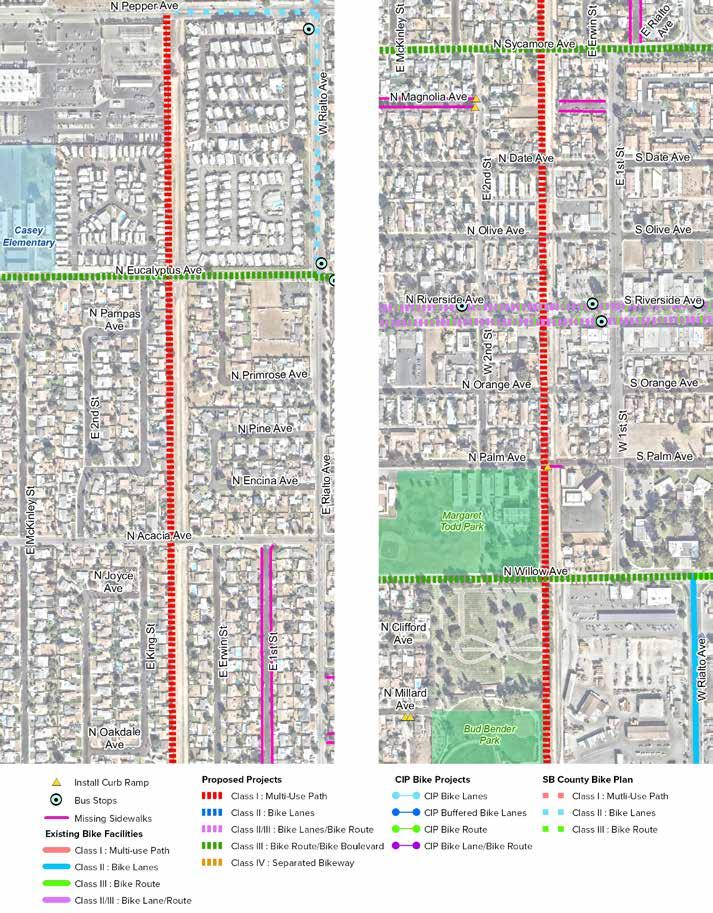
Evaluate location for installation of RRFBs or pedestrian signals.
Evaluate location for installation of RRFBs or pedestrian signals.. Install 4 high-visibility crosswalks
Evaluate location for installation of RRFBs or pedestrian signals.
Evaluate location for installation of RRFBs or pedestrian signals.
Provide access to Margaret Todd Park.
Evaluate location for installation of RRFB or pedestrian signal.
CHAPTER 5 » RECOMMENDATIONS 147
FIGURE 5-14: Pacific Electric ROW Trail Proposed Improvements
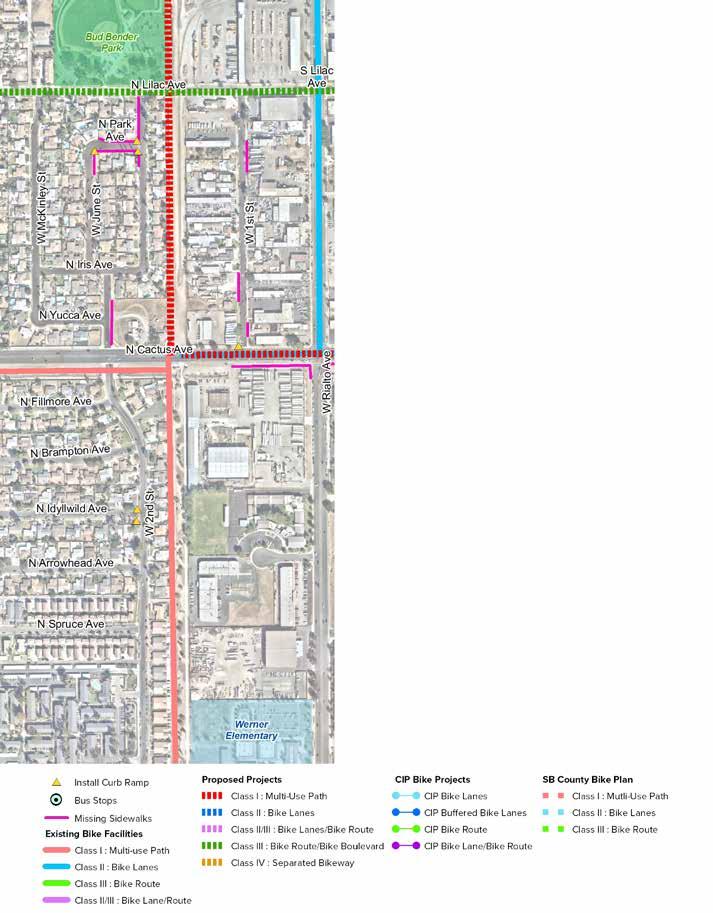
RIALTO ACTIVE TRANSPORTATION PLAN 148
FIGURE 5-14: Pacific Electric ROW Proposed Improvements (Cont.)
Provide access to Bud Bender Park. Evaluate location for installation of RRFB or pedestrian signal.
Install 4 high-visibility crosswalks
END OF CORRIDOR
CHAPTER 5 » RECOMMENDATIONS 149
RECOMMENDED PROJECT 11
CACTUS AVENUE TRAIL
COST ESTIMATE: $22,583,507
EXISTING CONDITIONS
The possible trail alignment will be located along the flood control channel between Baseline Road and Agua Mansa Road for a north-south connection from the Renaissance Marketplace to the Santa Ana River Trail. Three parks and one school are adjacent to the trail. The surrounding land uses range from single-family residential, commercial, and heavy industrial south of I-10.
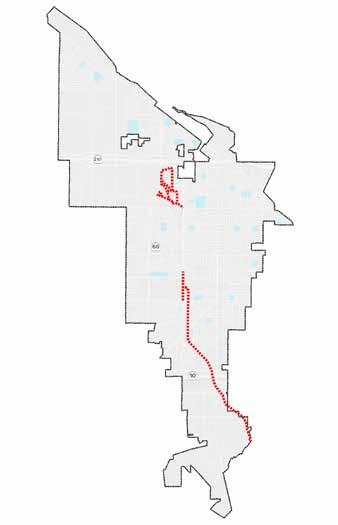
RECOMMENDATIONS
This alignment will utilize the existing Cactus Avenue Trail that is currently being redesigned. A section of the trail between Randall Avenue and Merrill Avenue could be reopened. The feasibility of a loop trail system around Jerry Eaves Park should be explored. Pedestrian signals or Rectangular Rapid Flashing Beacons are recommended options for all pedestrian crossing along with high-visibility crosswalks. Access through the industrial land uses south of I-10 will need to be coordinate with the property owners, Coordination with the City of Colton will be needed to make the final connection to the Santa Ana River trail.
Project Length: 7.66 miles
RIALTO ACTIVE TRANSPORTATION PLAN 150 Schools Bus Stops Pedestrian Collisions Parks Speed Limit Bicycle Collisions 3 2 0 3 N/A 2
Recommended Facilities Class I Multi-Use Path 13 5 AT A GLANCE
Missing Curb Ramps Crosswalk Improvements
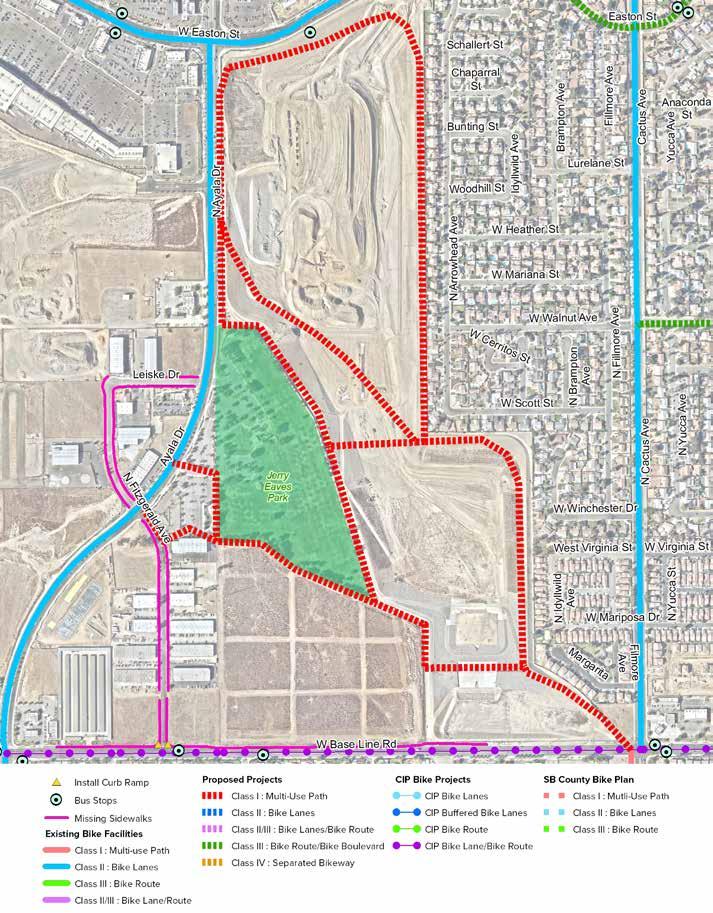
CHAPTER 5 » RECOMMENDATIONS 151
FIGURE 5-15: Cactus Avenue Trail Proposed Improvements
Coordinate with future development for a loop trail system and connection to Renaissance Marketplace.
Evaluate for a pedestrian signal or RRFB crossing.
Install missing sidewalks.
Evaluate for a pedestrian signal or RRFB crossing.
Work with SB County Flood Control District on trail access. Both sides of channel have available space to install multi-use path.
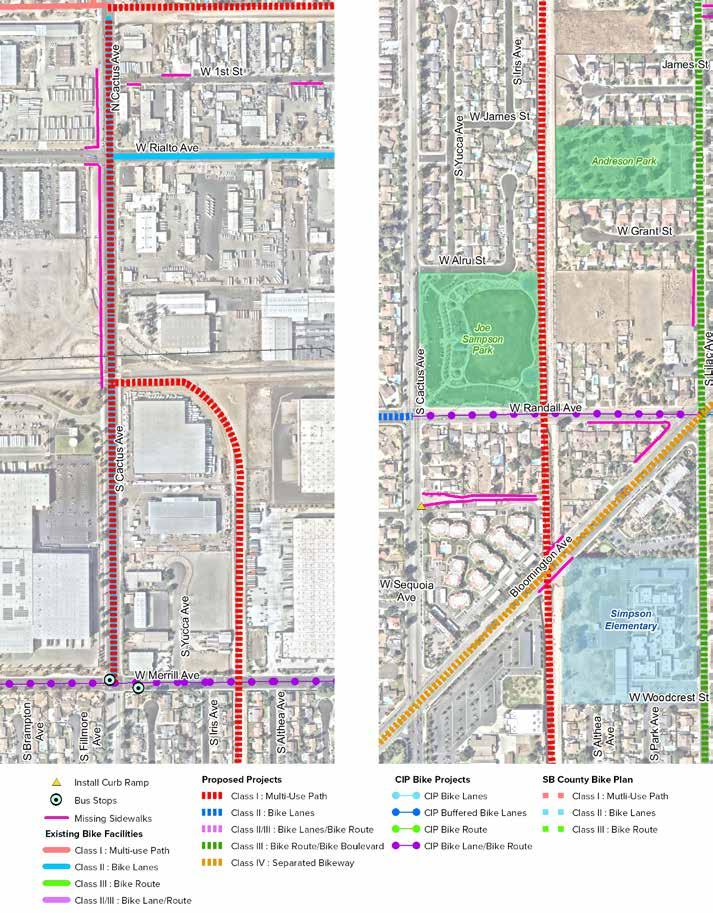
Evaluate for a pedestrian signal or RRFB crossing and crossing at adequate angle for adequate sight lines.
Evaluate for a pedestrian signal or RRFB crossing.
Evaluate for a pedestrian signal or RRFB crossing.
RIALTO ACTIVE TRANSPORTATION PLAN 152
FIGURE 5-15: Cactus Avenue Proposed Improvements (Cont.)
Utilize existing paved surface on west side of channel.
Evaluate location for installation of RRFB or pedestrian signal and crossing at adequate angle for adequate sight lines.
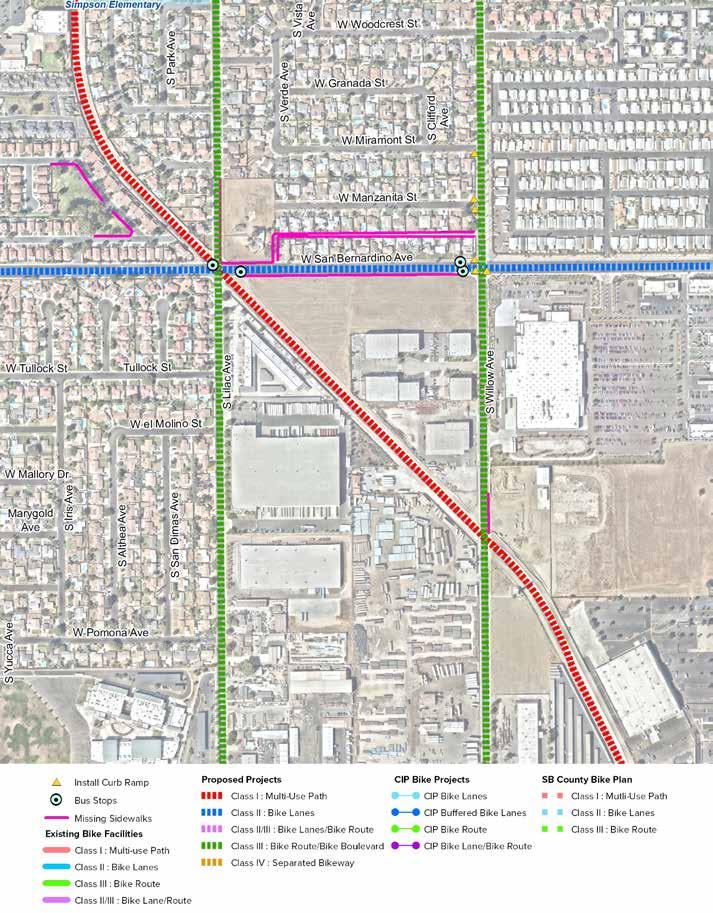
CHAPTER 5 » RECOMMENDATIONS 153
Install 4 highvisibility crosswalks with wayfinding.
FIGURE 5-15: Cactus Avenue Proposed Improvements (Cont.)
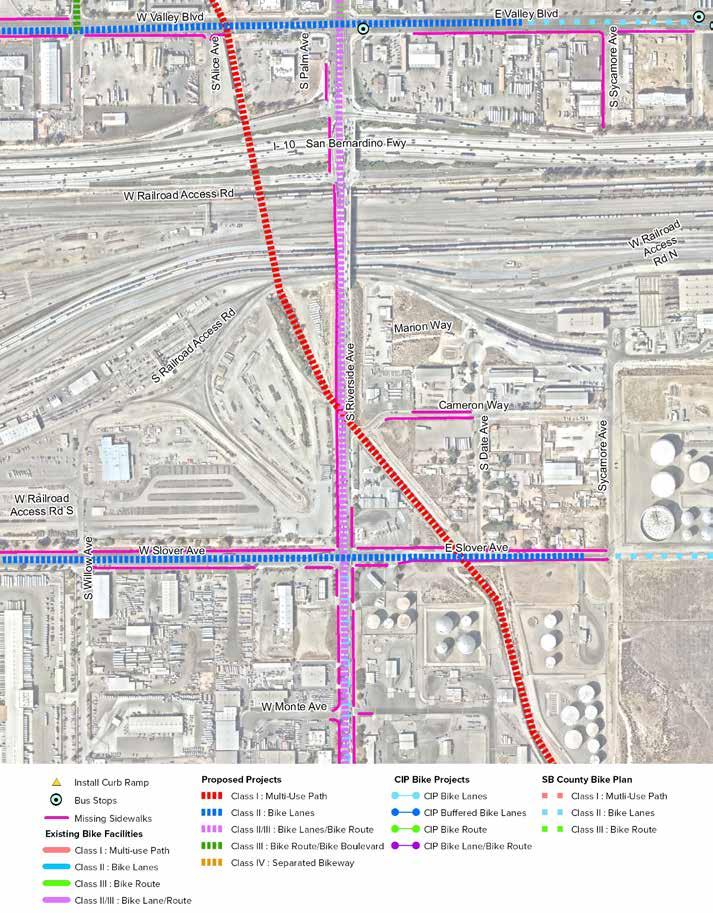
RIALTO ACTIVE TRANSPORTATION PLAN 154
Provide access to existing signalized crosswalk. Evaluate location for installation of RRFB or pedestrian signal.
Alternative route through railroad and I-10 needs further assessment. Coordinate access with existing property owners.
FIGURE 5-15: Cactus Avenue Proposed Improvements (Cont.)
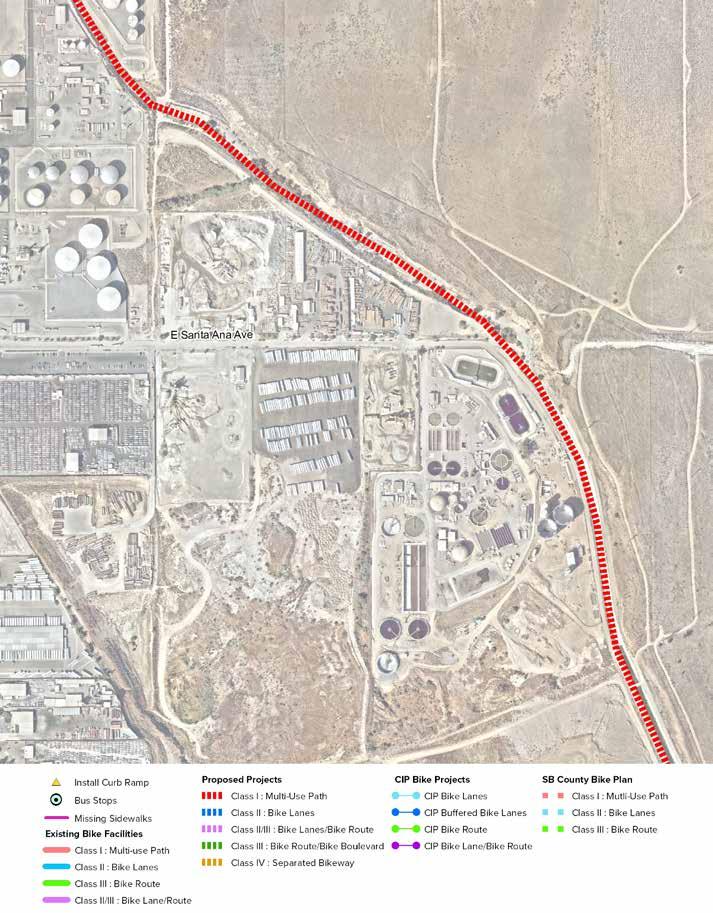
CHAPTER 5 » RECOMMENDATIONS 155
Coordinate access with existing property owners.
FIGURE 5-15: Cactus Avenue Proposed Improvements (Cont.)
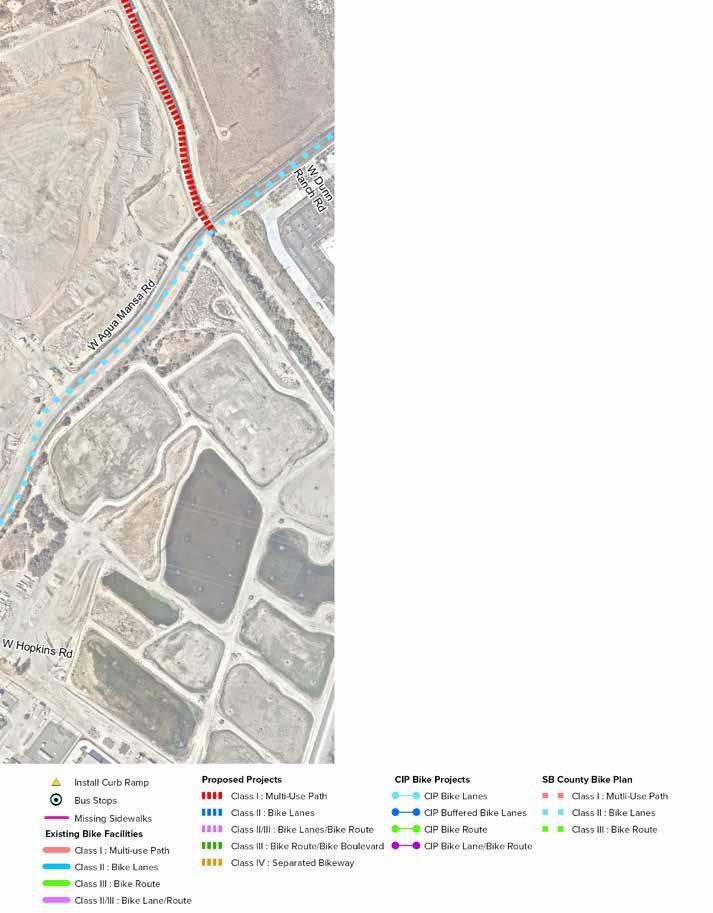
RIALTO ACTIVE TRANSPORTATION PLAN 156
FIGURE 5-15: Cactus Avenue Proposed Improvements (Cont.)
Coordinate with City of Colton on Santa Ana River Trail access.
Coordinate access with existing property owners.
END OF CORRIDOR
CHAPTER 5 » RECOMMENDATIONS 157
RECOMMENDED PROJECT 12
WALNUT AVENUE
COST ESTIMATE: $912,257
EXISTING CONDITIONS
Walnut Avenue is an east-west collector street located in northeastern Rialto. The surrounding land uses include single family residential, other residential, education, and commercial. A total of two pedestrian collisions were reported between 2013 and 2017. The posted speed limit varies from 35 to 40 mph, and travel lanes vary from one to two in each direction. The existing LTS level is 4. The majority of the corridor has sidewalks with small missing segments at N Encina Ave and N Lilac Ave. Two bus stops are located at N Riverside Ave.
RECOMMENDATIONS
The Walnut Avenue proposed improvements include speed limit reduction to 35 mph to accommodate a Class III bicycle route. The project proposes green-back sharrows and signage throughout the corridor. Pedestrian improvements include the installation of missing sidewalks, curb extensions, curb ramps, truncated domes, high-visibility crosswalks, and bus shelters.
Project Length: 1.50 miles
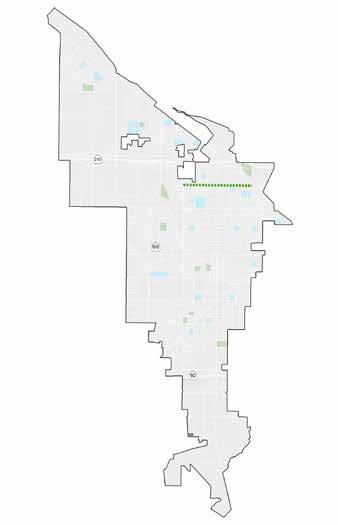
RIALTO ACTIVE TRANSPORTATION PLAN 158 Schools Bus Stops Pedestrian Collisions Parks Speed Limit Bicycle Collisions 3 0 2 1 35-40 mph 0
Recommended Facilities Class III Bike Route/Bike Blvd 4 28 AT A GLANCE
Missing Curb Ramps Crosswalk Improvements
Install
Evaluate
Install
CHAPTER 5 » RECOMMENDATIONS 159
FIGURE 5-16: Walnut Avenue Proposed Improvements
Install 4 high-visibility crosswalks and curb extensions.
Install missing sidewalks.
location for installation of RRFB or pedestrian signal.
Install 4 high-visibility school crosswalks and curb extensions.
Install 4 high-visibility crosswalks and curb extensions.
Install 4 high-visibility crosswalks.
Install 4 high-visibility school crosswalks.
Install 4 high-visibility school crosswalks.
Install bus shelter with seating.
wayfinding signage and shared lane markings along the corridor.
wayfinding signage and shared lane markings along the corridor.
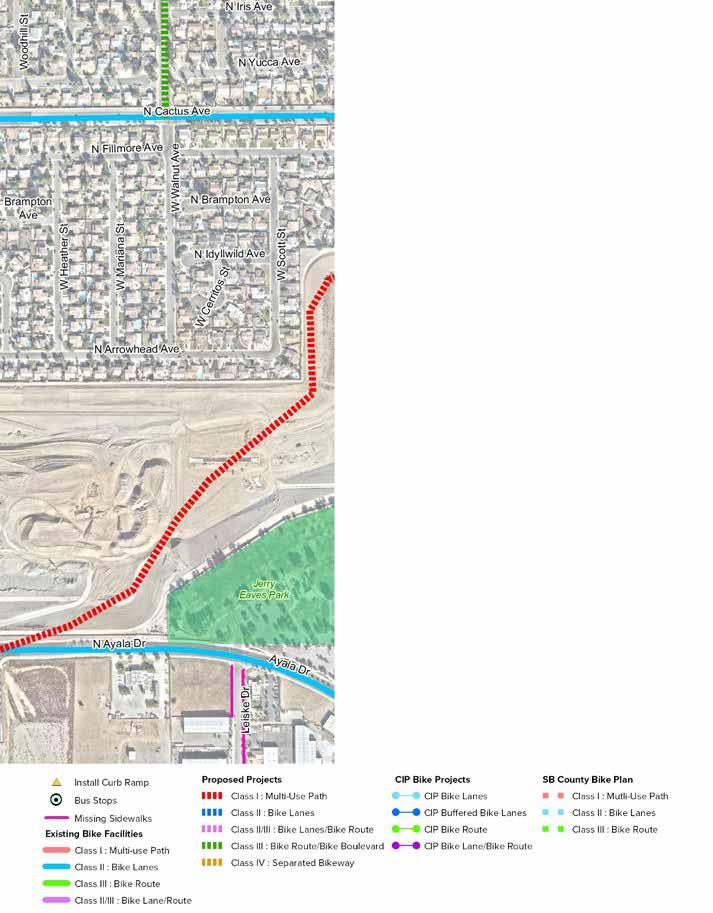
RIALTO ACTIVE TRANSPORTATION PLAN 160
FIGURE 5-16: Walnut Avenue Proposed Improvements (Cont.)
Install 4 high-visibility crosswalks.
Install wayfinding signage and shared lane markings along the corridor.
END OF CORRIDOR
CHAPTER 5 » RECOMMENDATIONS 161
RECOMMENDED PROJECT 13
LINDEN AVENUE
COST ESTIMATE: $1,216,661
EXISTING CONDITIONS
Linden Avenue is a north-south major arterial located in western Rialto. The surrounding land uses include single family residential, education, transportation and facilities, commercial, and industrial. There were three pedestrian collisions and two bicycle collisions reported between 2013 and 2017. The posted speed limit varies from 25 to 35 mph and varies from one to two travel lanes in each direction with a center turn lane. The existing LTS is 4. Sidewalks are missing periodically on the northern portion of the corridor. Bus routes serve the corridor, however the bus stops lack benches and shelter.
RECOMMENDATIONS
The Linden Avenue proposed improvements include the addition of a Class III bike route. Further analysis is recommended where the railroad tracks intersect Linden Avenue. The project proposes green-back sharrows and signage throughout corridor. Pedestrian improvements include the installation of missing sidewalks, curb ramps, truncated domes, high-visibility crosswalks, and bus shelters.
Project Length: 4.96 miles
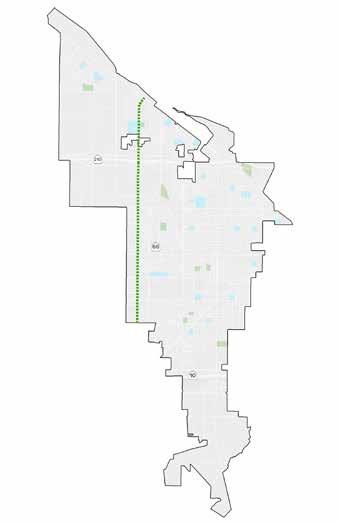
RIALTO ACTIVE TRANSPORTATION PLAN 162 Schools Bus Stops Pedestrian Collisions Parks Speed Limit Bicycle Collisions 1 18 3 1 25-35 mph 2
Recommended Facilities Class II/III Bike Lane/Bike Route 9 42 AT A GLANCE
Missing Curb Ramps Crosswalk Improvements
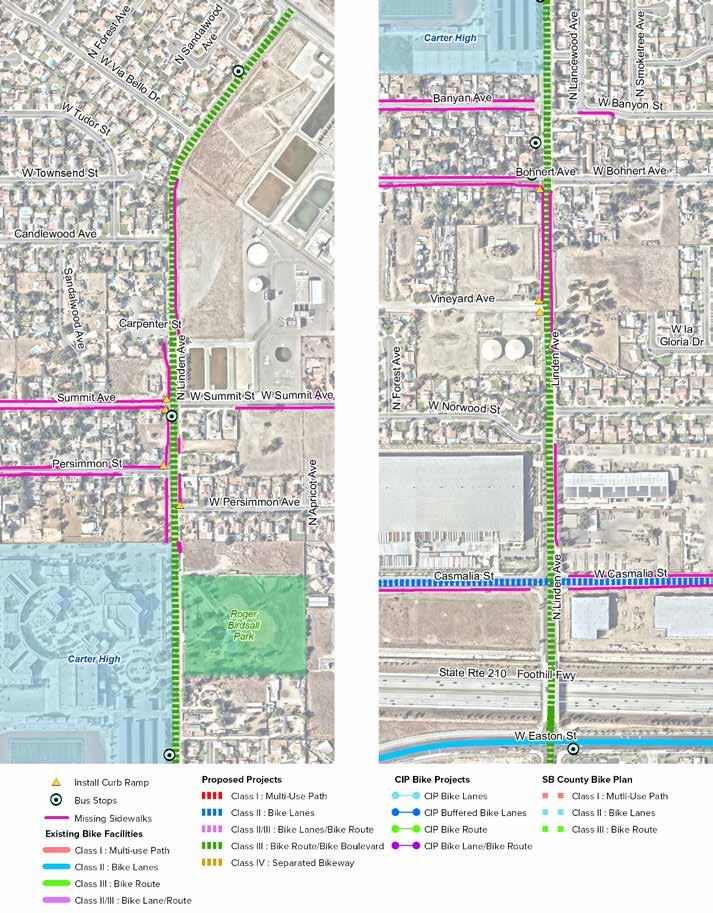
CHAPTER 5 » RECOMMENDATIONS 163
Install wayfinding signage. Install bus shelter with seating. Install shared lane
the
Install shared lane
the
1
Install
FIGURE 5-17: Linden Avenue Proposed Improvements
markings along
corridor.
markings along
corridor. Install 2 high-visibility crosswalks. Install
high-visibility school pedestrian crossing. Install 2 highvisibility crosswalks with wayfinding. Install 4 high-visibility crosswalks.
bus shelter with seating.
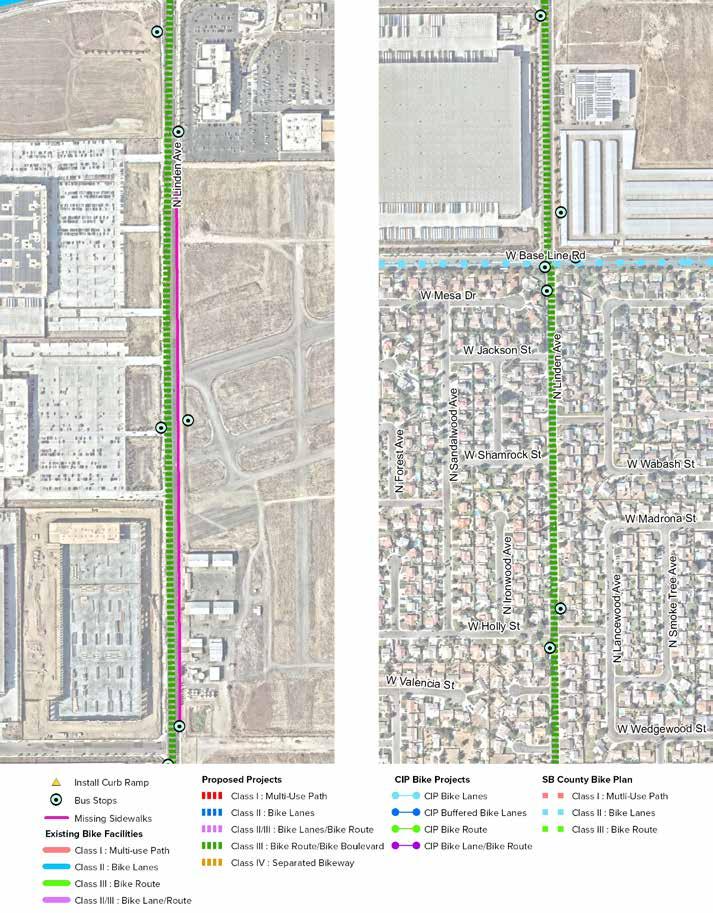
RIALTO ACTIVE TRANSPORTATION PLAN 164
Install wayfinding signage Install wayfinding signage. Install shared lane markings along the corridor Install shared lane markings along the corridor. Install 4 high-visibility crosswalks. Install bus shelter with seating. Install bus shelter with seating. Install bus shelter with seating. Install bus shelter with seating. Install bus shelter with seating. Install bus shelter with seating.
FIGURE 5-17: Linden Avenue Proposed Improvements (Cont.)
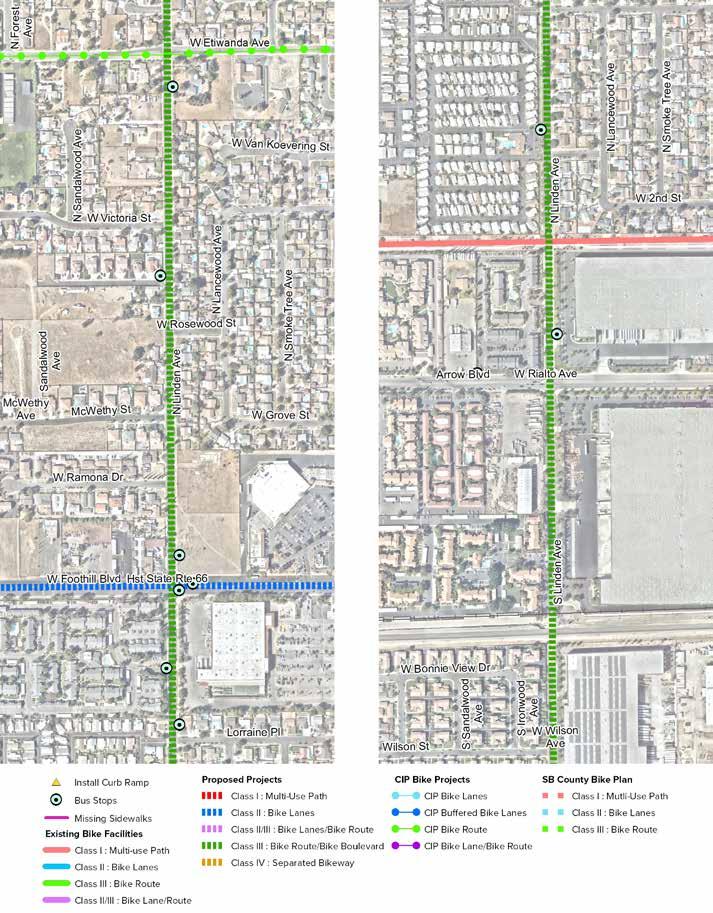
CHAPTER 5 » RECOMMENDATIONS 165
FIGURE 5-17: Linden Avenue Proposed Improvements (Cont.)
Install shared lane markings and wayfinding signage along the corridor.
Install shared lane markings and wayfinding signage along the corridor.
Install 4 high-visibility crosswalks.
Install 4 highvisibility crosswalks.
Install 2 high-visibility crosswalks.
Route connection through railroad needs further assessment.
Install bus shelter with seating. Install bus shelter with seating.
Install bus shelter with seating.
Install bus shelter with seating.
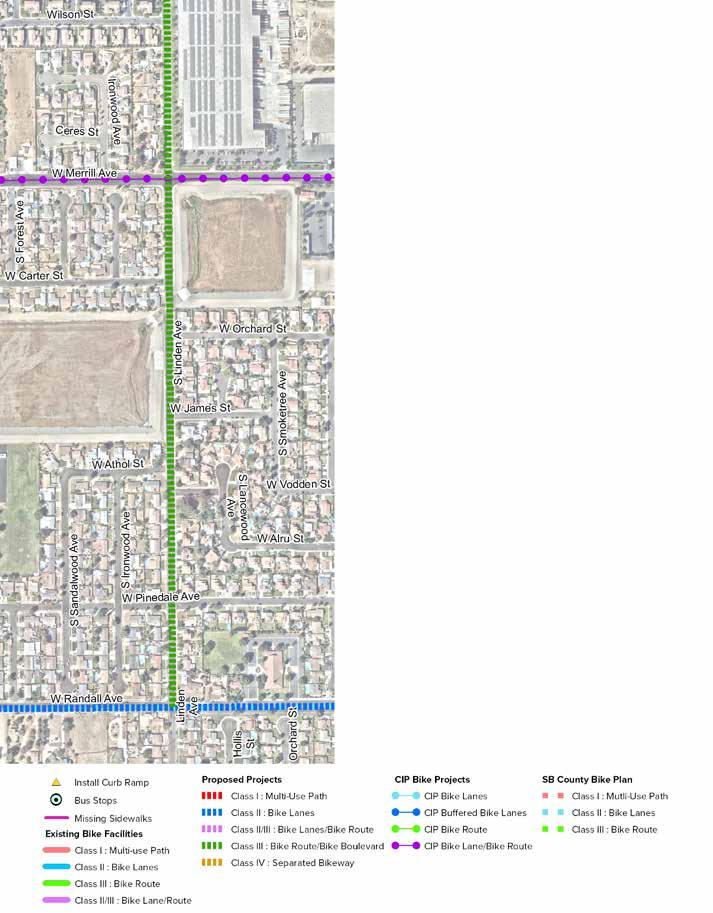
RIALTO ACTIVE TRANSPORTATION PLAN 166
FIGURE 5-17: Linden Avenue Proposed Improvements (Cont.)
Install 4 high-visibility crosswalks..
Install 4 highvisibility crosswalks. Install wayfinding signage
Install shared lane markings along the corridor
END OF CORRIDOR
CHAPTER 5 » RECOMMENDATIONS 167
RECOMMENDED PROJECT 14
SAN BERNARDINO AVENUE
COST ESTIMATE: $439,964
EXISTING CONDITIONS
San Bernardino Avenue is an east-west secondary arterial located in southern Rialto. The surrounding land uses include residential and commercial. There were three pedestrian collisions and one bicycle collision reported between 2013 and 2017. The posted speed limit varies from 30 to 35 mph, and the number of travel lanes vary from one to two in each direction, at times with a center turn lane. The existing LTS is 4. Sidewalks are present on both sides of the street but are lacking on undeveloped parcels. San Bernardino Ave serves as a bus transit corridor, with several bus stops with simple transit signage and very few equipped with benches and shelters.
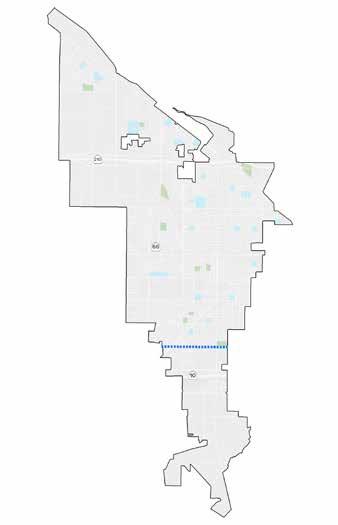
RECOMMENDATIONS
The proposed improvements include restriping to decrease the width of lanes to add Class II bike lanes. A bike traffic signal high-visibility crosswalk is recommended at the intersection with the Cactus Ave Trail. Pedestrian improvements include the installation of missing sidewalks, curb ramps, truncated domes, high-visibility crosswalks, and bus shelters.
Project Length: 1.46 miles
RIALTO ACTIVE TRANSPORTATION PLAN 168 Schools Bus Stops Pedestrian Collisions Parks Speed Limit Bicycle Collisions 0 10 3 1 30-35 mph 1
Recommended Facilities Class II Bike Lane 8 17 AT A GLANCE
Missing Curb Ramps Crosswalk Improvements
Explore reducing travel lane widths to install Class II Bike Lanes.
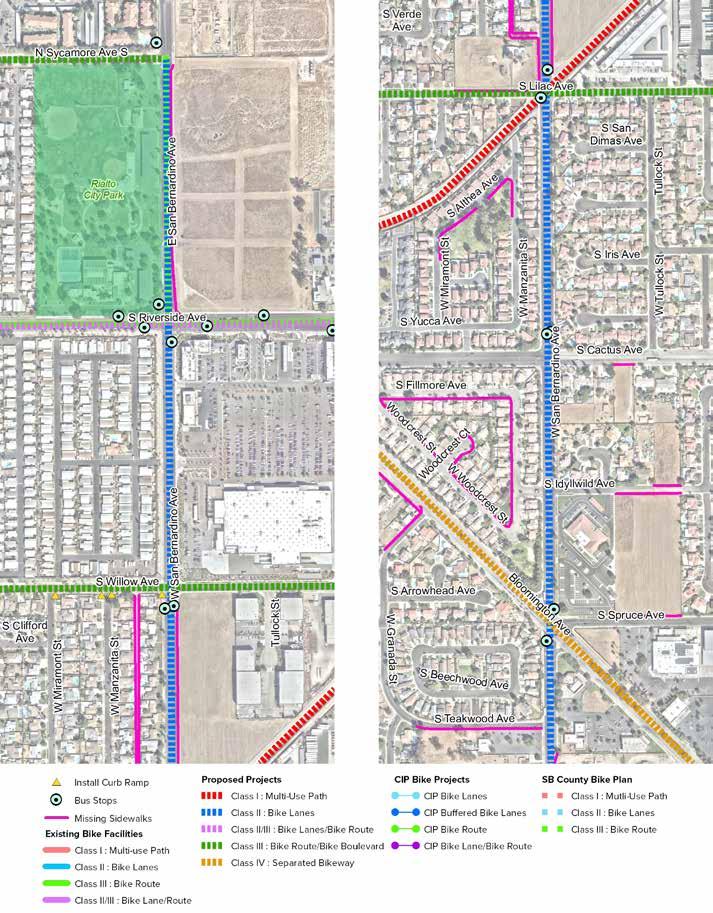
CHAPTER 5 » RECOMMENDATIONS 169
Install bus shelter with
Install bus
with
Install bus shelter with
Install bus shelter with
FIGURE 5-18: San Bernardino Avenue Proposed Improvements
seating.
shelter
seating.
seating.
seating.
Install bus shelter with seating.
Install
bus shelter with seating.
Install highvisibility pedestrian crossing.
Install 4 highvisibility pedestrian crossings. Install 4 highvisibility pedestrian crossings.
Install 4 highvisibility pedestrian crossings. Install 7 highvisibility pedestrian crossings.
Install pedestrian signal, signage, highvisibility crosswalk, and 4 high-visibility crossings. Modify median for Class I multi-use path crossing.
Explore reducing travel lane widths to accommodate Class II bike lanes.install Class II Bike Lanes.
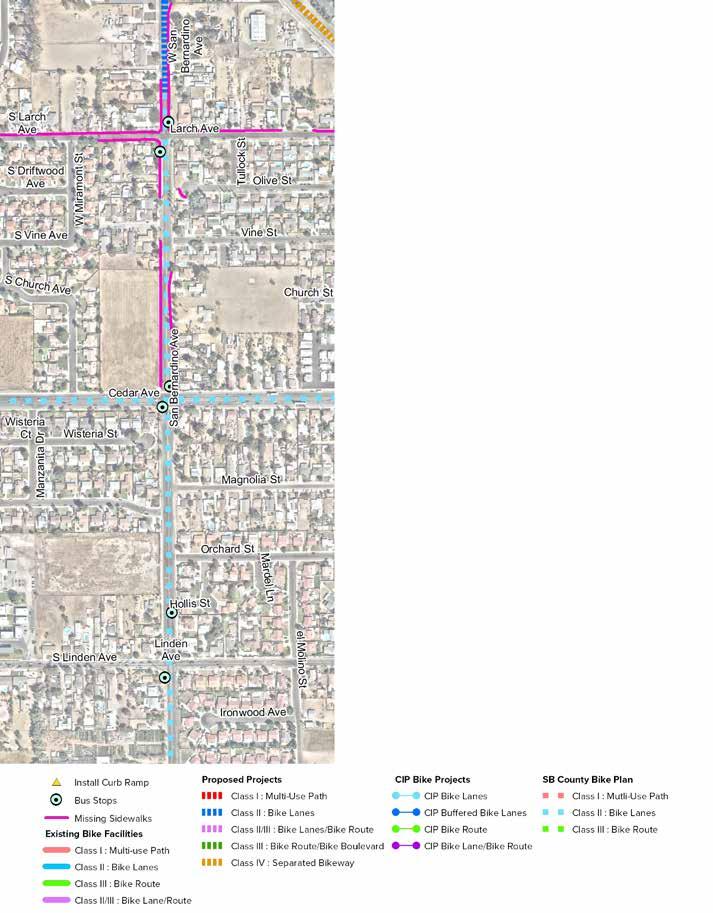
RIALTO ACTIVE TRANSPORTATION PLAN 170
FIGURE 5-18: San Bernardino Avenue Proposed Improvements (Cont.)
Install bus shelter with seating.
Explore reducing travel lane widths to install Class II bike lanes.
END OF CORRIDOR
CHAPTER 5 » RECOMMENDATIONS 171
RECOMMENDED PROJECT 15
RENAISSANCE PARKWAY/ EASTON AVENUE
COST ESTIMATE: $1,259,794
EXISTING CONDITIONS
Renaissance Parkway/Easton Avenue is an east-west local street in northeastern Rialto. The surrounding land uses include single family residential, public facilities, and transportation and utilities. There were two pedestrian collisions and one bicycle collision reported between 2013 and 2017. This corridor has a posted speed limit of 35 mph, and the number of travel lanes vary between two to five lanes. The existing LTS level is 4. The corridor is missing sidewalks west of Alder Ave. Bus routes only serve the corridor between Cactus Ave and N Ayala Dr.
RECOMMENDATIONS
The proposed improvements for this corridor include the addition of a Class III bike route that will provide connections to the Class II bike lane located south of Alder Ave. Bicycle route signage and sharrow pavement markings are recommended. Pedestrian improvements include the installation of missing sidewalks, curb ramps, truncated domes, high-visibility crosswalks, and bus shelters.
Project Length: 2.29 miles
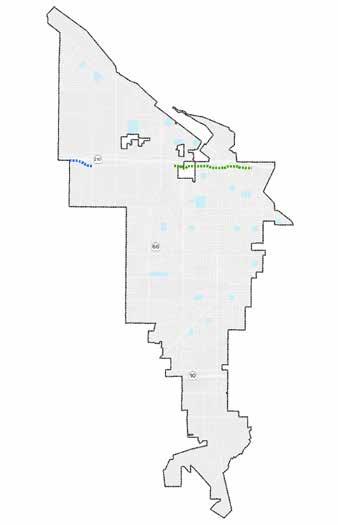
RIALTO ACTIVE TRANSPORTATION PLAN 172 Schools Bus Stops Pedestrian Collisions Parks Speed Limit Bicycle Collisions 1 10 2 1 35 mph 1
11 43
A GLANCE
AT
Recommended Facilities Class II Bike Lane Class III Bike Route
Missing Curb Ramps
Crosswalk Improvements
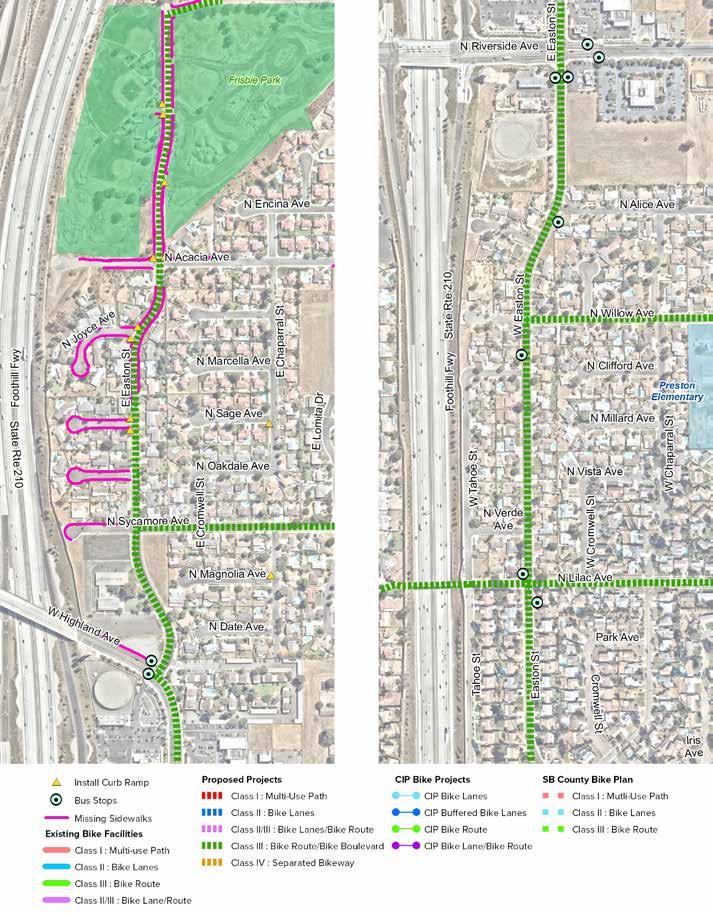
CHAPTER 5 » RECOMMENDATIONS 173
FIGURE 5-19: Renaissance Parkway/Easton Avenue Proposed Improvements
Install 1 high-visibility crosswalks.
Install 4 high-visibility crosswalks.
Install 3 high-visibility crosswalks.
Install 3 high-visibility crosswalks. Install 4 high-visibility crosswalks.
Install shared lane markings and wayfinding signage along the corridor. Install shared lane markings and wayfinding signage along the corridor. Install bus shelters with seating. Install bus shelters with seating.
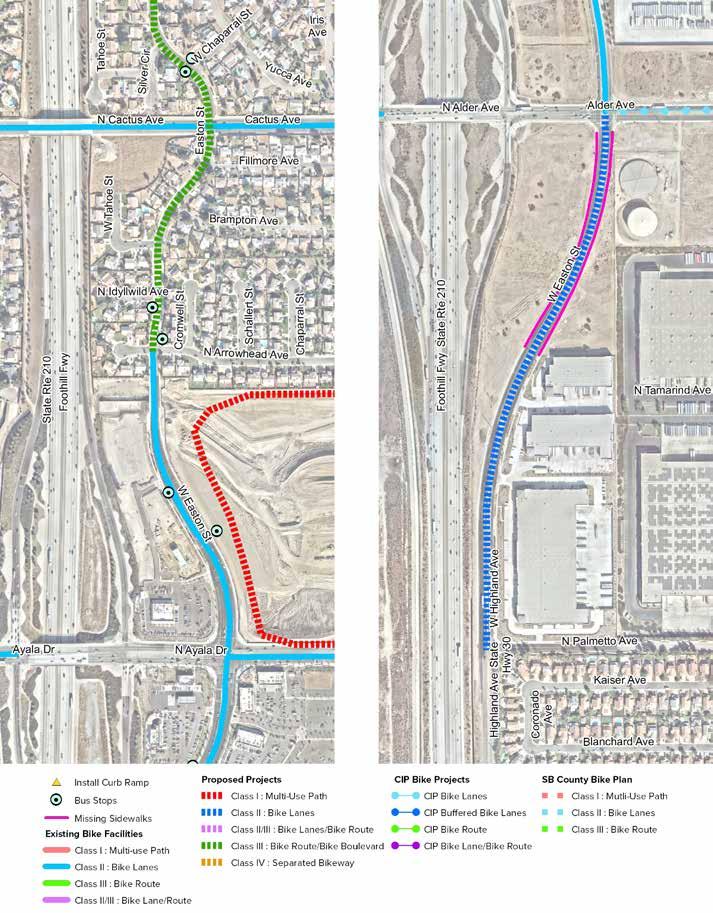
RIALTO ACTIVE TRANSPORTATION PLAN 174
FIGURE 5-19: Renaissance Parkway/Easton Avenue Proposed Improvements (Cont.)
Install 1 highvisibility crosswalks and evaluate for a 3-way stop controlled intersection.
Install 2 high-visibility crosswalks.
Install 4 high-visibility crosswalks.
Install 4 high-visibility crosswalks.
Install 1 high-visibility crosswalks.
Install missing sidewalks. Install shared lane markings and wayfinding signage along the corridor.
Install bus shelters with seating.
Install bus shelters with seating.
Restripe to accommodate Class II bike lanes.
END OF CORRIDOR
CHAPTER 5 » RECOMMENDATIONS 175
RECOMMENDED PROJECT 16
RANDALL AVENUE
COST ESTIMATE: $497,141
EXISTING CONDITIONS
Randall Avenue is an east-west collector street located in southern Rialto. The surrounding land uses are almost entirely residential with some public land uses. There were five pedestrian collisions and one bicycle collision reported between 2013 and 2017. The posted speed limit varies from 35 to 40 mph, and the number of travel lanes vary from one to two in each direction. The existing LTS is 4. Sidewalks are present on both sides of the street but are lacking on undeveloped parcels. Bus routes currently do not serve Randall Avenue.
RECOMMENDATIONS
The Randall Avenue proposed improvements include restriping to decrease the width of travel lanes and adjusting centerlines to facilitate the addition of Class II bike lanes. Consideration of lane diet or on-street parking removal is recommended to accommodate Class II bike lanes. Pedestrian improvements include the installation of missing sidewalks, curb ramps, truncated domes, and high-visibility crosswalks.
Project Length: 1.88 miles
RIALTO ACTIVE TRANSPORTATION PLAN 176 Schools Bus Stops Pedestrian Collisions Parks Speed Limit Bicycle Collisions 5 0 5 2 35-40 mph 1
Recommended Facilities Class II Bike Lane 5 26 AT A GLANCE
Missing Curb Ramps Crosswalk Improvements
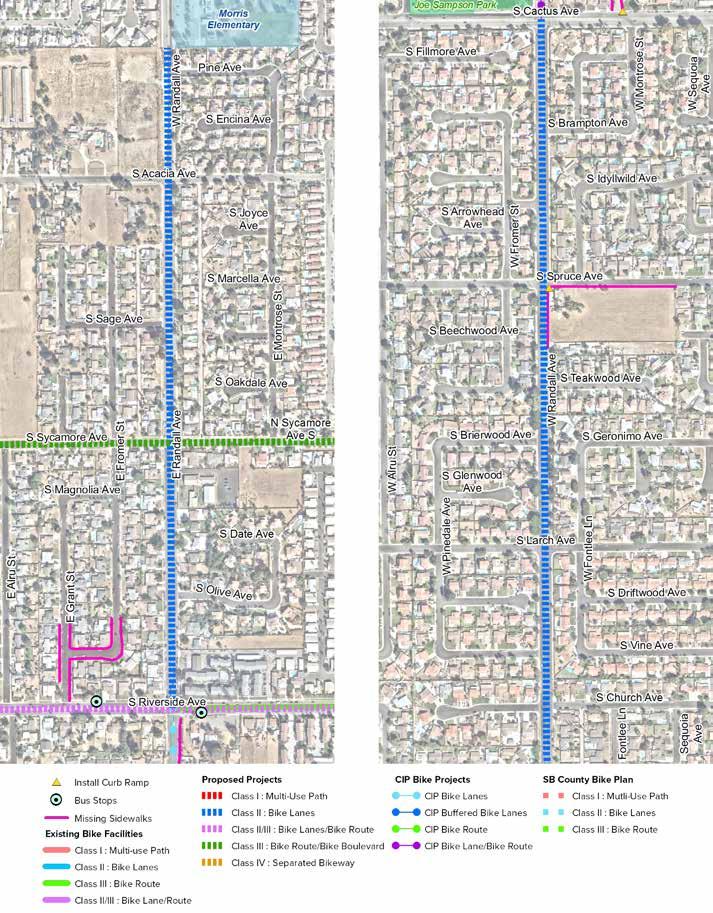
CHAPTER 5 » RECOMMENDATIONS 177
FIGURE 5-20: Randall Avenue Proposed Improvements
Install 2 high-visibility crosswalks.
Install 4 high-visibility crosswalks.
Install 4 high-visibility crosswalks.
Install 4 high-visibility crosswalks.
Install 4 high-visibility crosswalks.
Install missing sidewalks. Adjust centerline to add Class II bike lanes or change to Class III bike route.
Explore reducing travel lane widths to accommodate Class II bike lanes.
Explore reducing travel lane widths to accommodate Class II bike lanes.
Explore reducing travel lane widths to accommodate Class II bike lanes and parking.
Explore reducing travel lane widths to accommodate Class II
Explore reducing travel lane widths to accommodate Class II
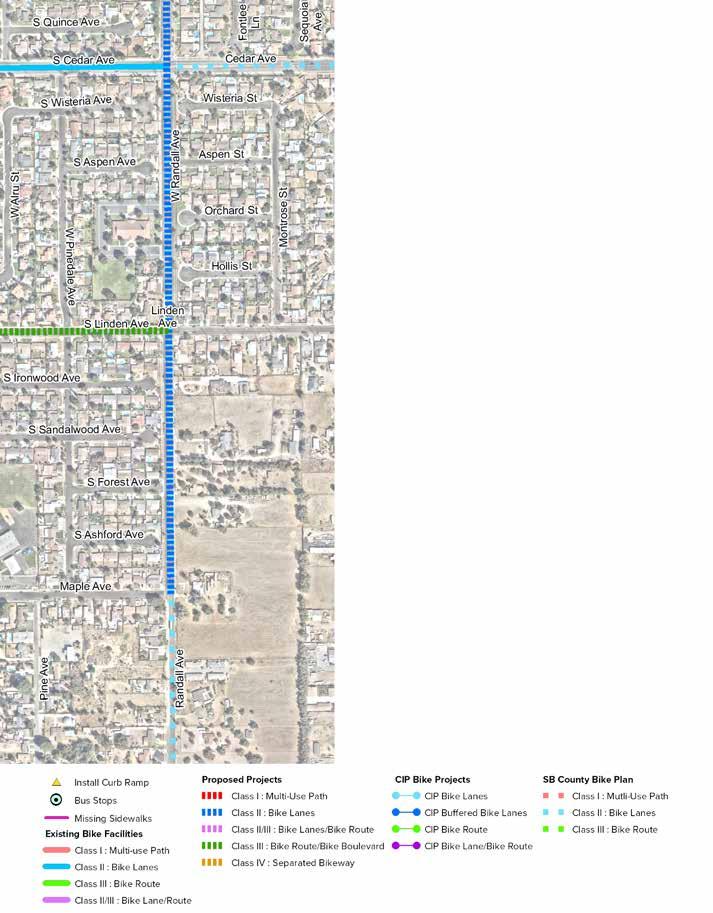
RIALTO ACTIVE TRANSPORTATION PLAN 178
FIGURE 5-20: Randall Avenue Proposed Improvements (Cont.)
Install 4 high-visibility crosswalks.
Install 4 high-visibility crosswalks.
Install missing sidewalks.
bike lanes.
bike lanes and parking.
END OF CORRIDOR
CHAPTER 5 » RECOMMENDATIONS 179
RECOMMENDED PROJECT 17
LOCUST AVENUE
COST ESTIMATE: $771,347
EXISTING CONDITIONS
Locust Avenue is a north-south secondary arterial located in northwest Rialto. The surrounding land uses are entirely industrial. There were no pedestrian or bicycle collisions reported between 2013 and 2017. This corridor has 2 to 4 travel lanes in each direction, at times with a center turn lane, and a posted speed limit of 45 mph. There are multiple sidewalks missing on the northern portion of the corridor. The existing LTS is 4. Locust Avenue serves as a bus transit corridor with amenities ranging from simple transit signage to one bench.
RECOMMENDATIONS
The Locust Avenue proposed improvements include restriping to decrease the width of travel lanes and adjusting the centerline when needed to facilitate the addition of Class II bike lanes. Pavement markings and transition striping are also recommended in locations where conflicts may occur, such as right turn lanes and intersections. Pedestrian improvements include the installation of missing curb ramps, truncated domes, high-visibility crosswalks, and bus shelters.
Project Length: 2.07 miles Missing Curb Ramps
RIALTO ACTIVE TRANSPORTATION PLAN 180 Schools Bus Stops Pedestrian Collisions Parks Speed Limit Bicycle Collisions 0 2 0 0 45 mph 0
17 12 AT A GLANCE
Recommended Facilities Class II Bike Lane
Crosswalk Improvements
Adjust centerline or widen street to add Class II bike lanes.
Explore reducing travel lane widths to accommodate Class II bike lanes and parking.
Explore reducing travel lane widths to accommodate Class II bike lanes and parking.
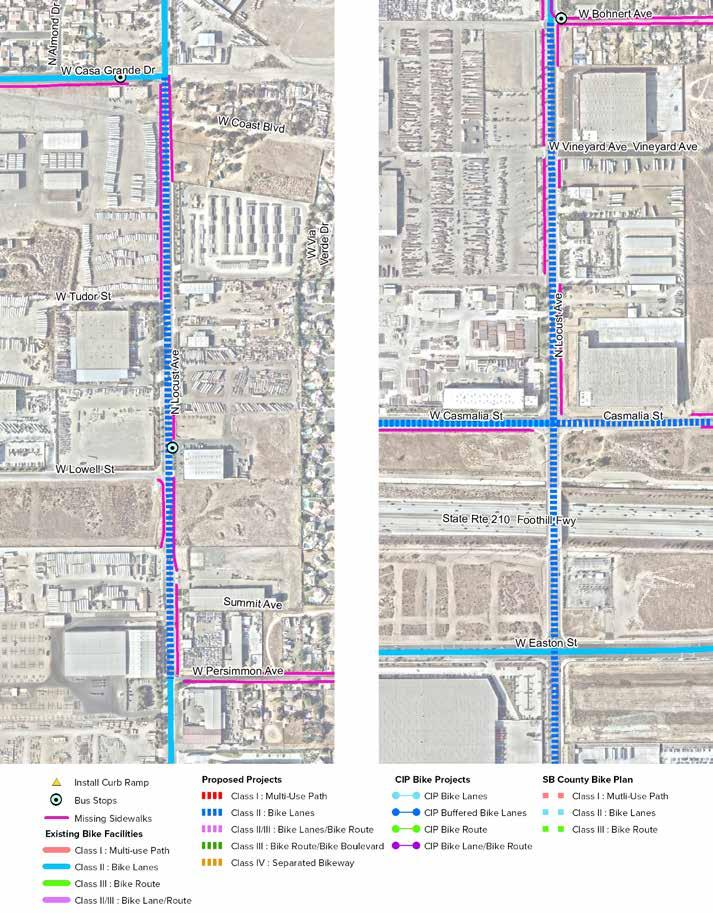
ROW to add
II bike lanes.
CHAPTER 5 » RECOMMENDATIONS 181
FIGURE 5-21: Locust Avenue Proposed Improvements
Ensure consistent
Class
Keep parking on west side of the street. Install 4 high-visibility crosswalks. Install missing sidewalks. Install missing sidewalks.
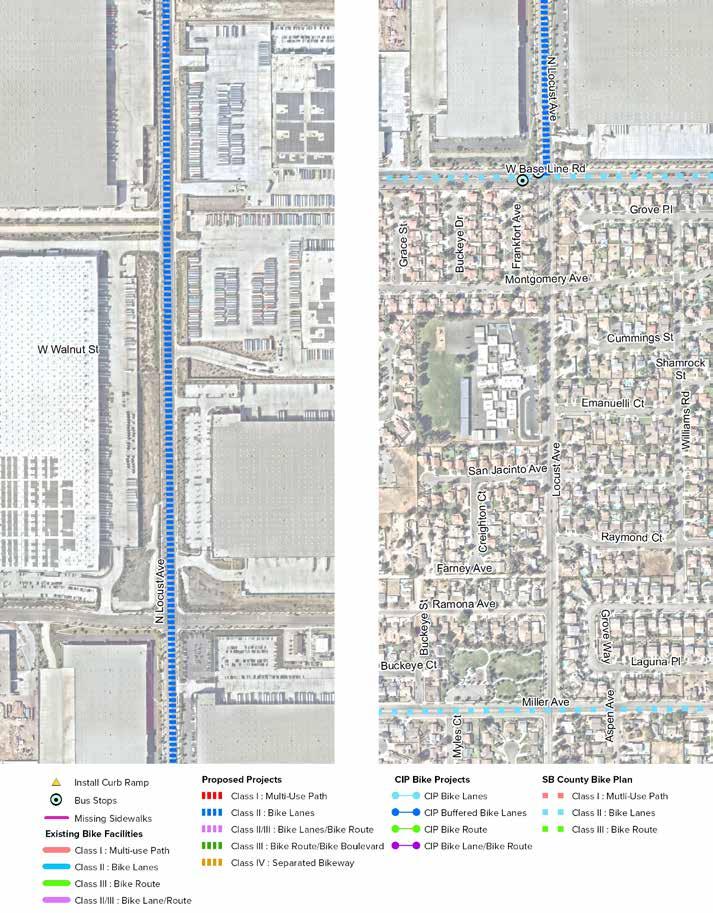
RIALTO ACTIVE TRANSPORTATION PLAN 182
FIGURE 5-21: Locust Avenue Proposed Improvements (Cont.)
Install 4 high-visibility crosswalks.
Install 4 highvisibility school crosswalks.
Explore reducing travel lane widths to accommodate Class II bike lanes and parking.
Explore reducing travel lane widths to accommodate Class II bike lanes and parking.
Coordinate with City of Fontana on connection.
END OF CORRIDOR
CHAPTER 5 » RECOMMENDATIONS 183
RECOMMENDED PROJECT 18
VALLEY BOULEVARD
COST ESTIMATE: $448,879
EXISTING CONDITIONS
Valley Boulevard is an east-west major arterial located in southern Rialto. The surrounding land uses include commercial, industrial, and vacant parcels. There were three pedestrian collisions and two bicycle collisions reported between 2013 and 2017. Valley Boulevard has a posted speed limit of 45 mph, and the number of travel lanes vary between four to five lanes. The existing LTS level is 4. The corridor is missing sidewalks throughout. Three bus stops can be found at the intersection with S Riverside Ave.
RECOMMENDATIONS
The Valley Boulevard proposed improvements include restriping and incorporating Class II bike lanes along the corridor. Pedestrian improvements include the installation of missing sidewalks, curb ramps, truncated domes, high-visibility crosswalks, and bus shelters.
Project Length: 1.29 miles
Missing Curb Ramps
RIALTO ACTIVE TRANSPORTATION PLAN 184 Schools Bus Stops Pedestrian Collisions Parks Speed Limit Bicycle Collisions 0 1 3 0 45 mph 2
Recommended Facilities Class II Bike Lane 3 12 AT A GLANCE
Crosswalk Improvements
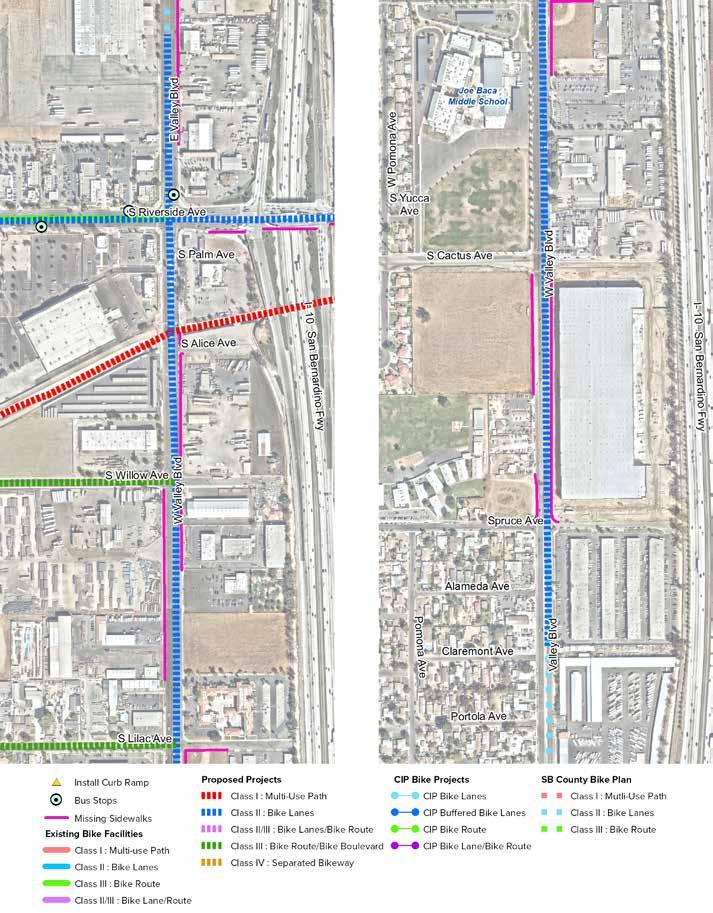
CHAPTER 5 » RECOMMENDATIONS 185
FIGURE 5-22: Valley Boulevard Proposed Improvements
Install bus shelters with seating.
Install Class II bike lanes.
Install Class II bike lanes.
Install 3 highvisibility crosswalks.
Install 4 highvisibility crosswalks.
Install 2 highvisibility crosswalks.
Install missing sidewalks.
Install missing sidewalks.
Install 2 highvisibility school crosswalks.
RECOMMENDED PROJECT 19
SLOVER AVENUE
COST ESTIMATE: $718,125
EXISTING CONDITIONS
Slover Avenue is an east-west major arterial located in southern Rialto. The surrounding land uses include industrial and transportation and utilities. No pedestrian or bicycle collisions were reported between 2013 and 2017. Slover Avenue has a posted speed limit of 35 mph, and it contains two travel lanes in each direction. The existing LTS level is 4. The corridor is missing sidewalks throughout. There are no bus routes serving this corridor.
Recommendations
The Slover Avenue proposed improvements include the installation of Class II bike lanes along the corridor, which may require widening the road east of S Riverside Ave to accommodate them. Pedestrian improvements include the installation of missing sidewalks, curb ramps, truncated domes, and high-visibility crosswalks.
Project Length: 0.98 miles Missing Curb Ramps
RIALTO ACTIVE TRANSPORTATION PLAN 186 Schools Bus Stops Pedestrian Collisions Parks Speed Limit Bicycle Collisions 0 0 0 0 35 mph 0
Recommended Facilities Class II Bike Lane
7 AT A GLANCE
5
Crosswalk Improvements
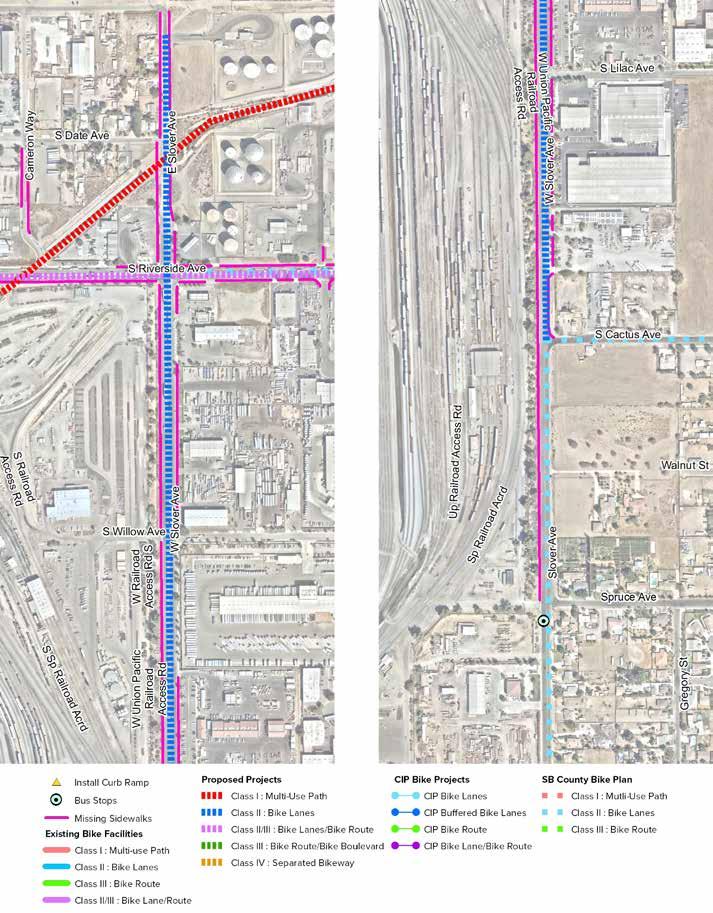
CHAPTER 5 » RECOMMENDATIONS 187
FIGURE 5-23: Slover Avenue Proposed Improvements
Install 4 highvisibility crosswalks.
Install 1 highvisibility crosswalk.
Install 1 highvisibility crosswalk.
Install Class II bike lanes.
Install Class II bike lanes.
Install 1 highvisibility crosswalk.
Consider widening roadway to accommodate Class II bike lanes.
Install missing sidewalks.
Install missing sidewalks.
RECOMMENDED PROJECT 20
CASMALIA STREET
COST ESTIMATE: $1,547,254
EXISTING CONDITIONS
Casmalia Street is an east-west local street located in northern Rialto. The surrounding land uses include single family residential, industrial, and vacant lots. One pedestrian collision was reported between 2013 and 2017. Casmalia Street has a posted speed limit of 25 mph, and it contains one travel lane in each direction. The existing LTS level is 1. Sidewalks are not consistent with missing sections throughout the corridor. There are no bus routes serving this corridor.
RECOMMENDATIONS
The Casmalia Street proposed improvements include the installation of Class II bike lanes along the entire corridor. Pedestrian improvements include the installation of missing sidewalks, curb ramps, truncated domes, and high-visibility crosswalks. Coordination with the City of Fontana on the connection with their CIP bike lane is also recommended.
Project Length: 3.31 miles
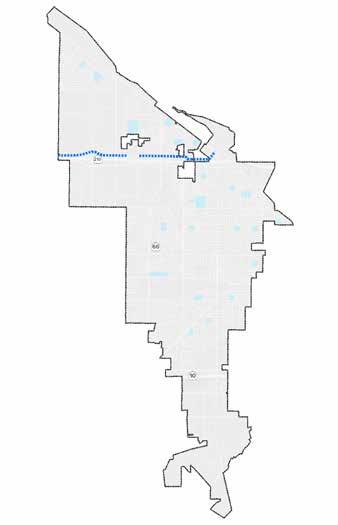
RIALTO ACTIVE TRANSPORTATION PLAN 188 Schools Bus Stops Pedestrian Collisions Parks Speed Limit Bicycle Collisions 1 0 1 0 25 mph 0
Recommended Facilities Class II Bike Lane 31 35 AT A GLANCE
Missing Curb Ramps Crosswalk Improvements
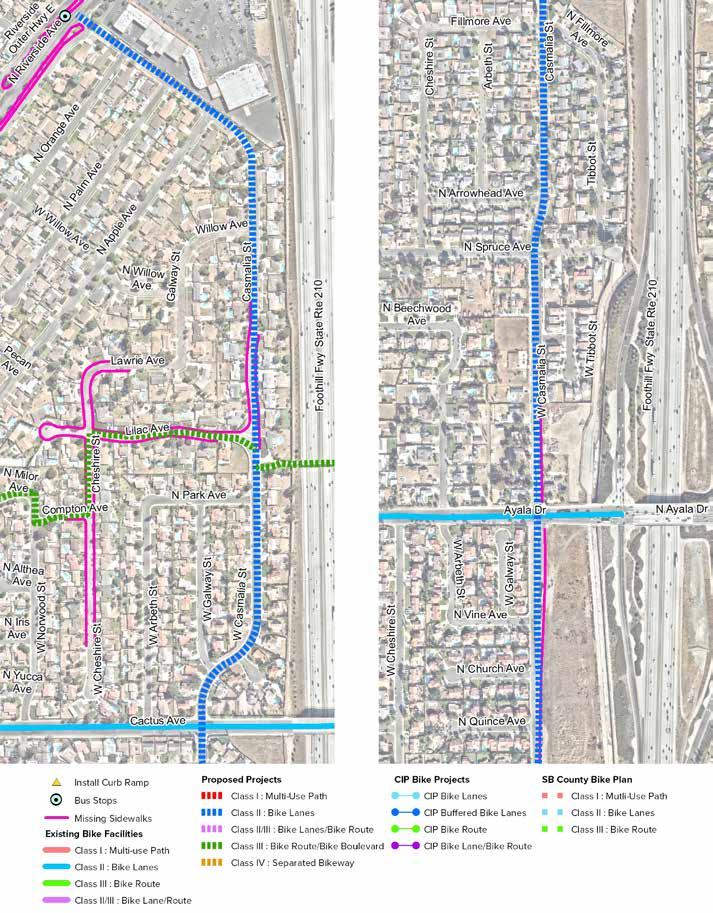
CHAPTER 5 » RECOMMENDATIONS 189
FIGURE 5-24: Casmalia Street Proposed Improvements
Install 2 highvisibility crosswalks.
Install 1 high-visibility crosswalk.
Install 4 highvisibility crosswalks.
Install Class II bike lanes.
Install Class II bike lanes.
Install 4 highvisibility crosswalks.
Install 4 highvisibility crosswalks.
Install missing sidewalks.
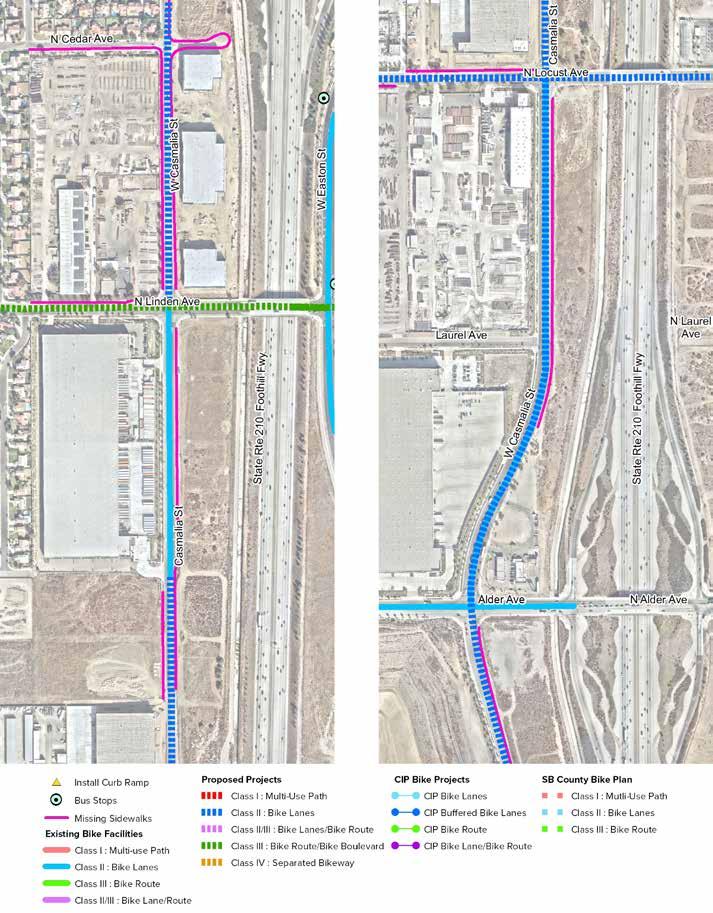
RIALTO ACTIVE TRANSPORTATION PLAN 190
missing sidewalks.
Install missing sidewalks.
FIGURE 5-24: Casmalia Street Proposed Improvements (Cont.)
Install 3 highvisibility crosswalks. Install 4 highvisibility crosswalks. Install 2 highvisibility crosswalks. Install 4 highvisibility crosswalks. Install 4 highvisibility crosswalks. Install
Install missing sidewalks.
Install Class II bike lanes. Install Class II bike lanes.
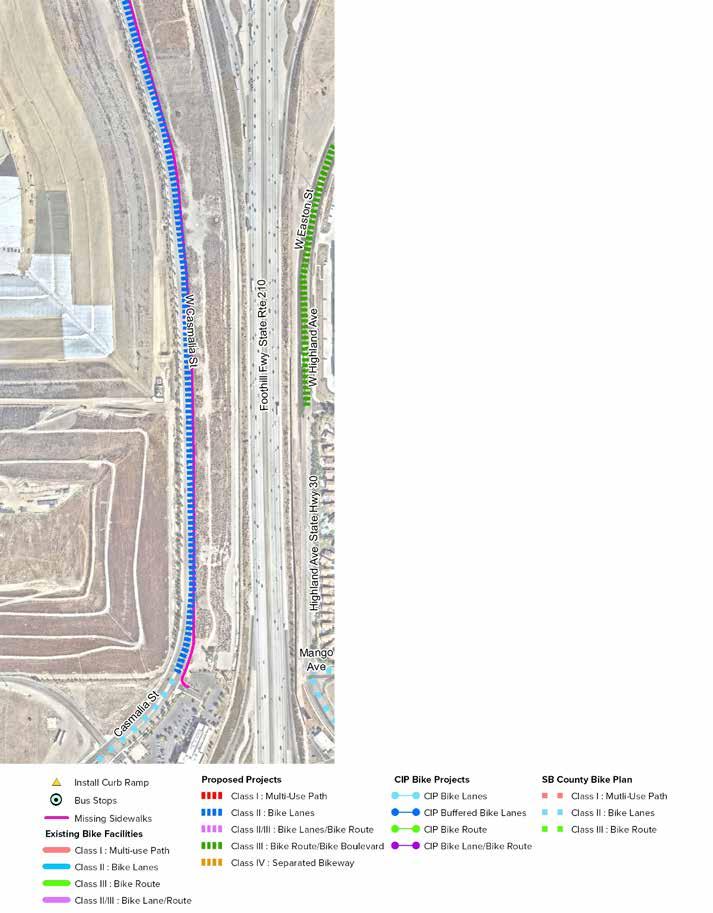
CHAPTER 5 » RECOMMENDATIONS 191
FIGURE 5-24: Casmalia Street Proposed Improvements (Cont.)
Install missing sidewalks.
Install missing sidewalks.
Install Class II bike lanes.
Coordinate with City of Fontana on connection.
BIKEWAY PROJECT PHASING
Implementation of some bikeways, such as multi-use paths, separated bikeways and other innovative techniques described in this plan, will require a capital improvement project process, including identifying funding, a public and environmental review process,and plan preparation. Other bikeway improvements can be integrated into planned construction, such as resurfacing, reconstruction, or utility work.
Most bikeway facilities are provided on streets in the form of shared roadways or bicycle lanes. Shared roadways usually require virtually no change to existing roadways, except for some directional signs, occasional markings, and minor changes in traffic control devices and/or traffic calming features. Each project will need a varying level of additional study and analysis before installation.
Potential Implementation Steps
» Preliminary design and/or technical traffic studies
» Parking study if parking removal is recommended
» Construction drawings and detailed cost estimates
» Funding (CIP, grant, etc.)
» Recommendations for further environmental studies
» Construction
Table 5-5 lists the bikeway projects for phased implementation based on the Pavement Management Program (PMP). City roadways were surveyed as part of the PMP for road condition to prioritize resurfacing and other improvements. The on-street bikeway projects were aligned with the PMP results to assist in phasing the implementation of on-street bikeways. Poorer road conditions result in a shorter-term implementation since bike lanes or shared lane pavement marking can be installed during resurfacing projects. Bikeway projects on newly resurfaced roads may have a lower priority since the roads were recently repaired. However, this list is only a guide to assist in planning and coordination between road resurfacing and bikeway implementation. The city reserves the right to implement projects as needed. This is the same criteria used in the overall bikeway prioritization process. The following is the rating based on the PMP.
» 86-100 Very Good
» 75-85 Good
» 60-74 Fair
» 41-59 Poor
» 0-40 Very Poor
RIALTO ACTIVE TRANSPORTATION PLAN 192
PAVEMENT CONDITION INDEX CORRIDOR FROM STREET TO STREET LENGTH (MILES) FACILITY TYPE ID # Very Poor Santa Ana Ave City limit City limit 1.2 Bike lanes, bike lane markings and signage 38 Poor Eucalyptus Ave E Easton St E Carter St 3.0 Shared lane markings and signage 10 Poor Bohnert Ave N Locust Ave Cactus Ave 1.5 Shared lane markings and signage 29 Poor Slover Ave City limit City limit 1.0 Bike lanes, bike lane markings and signage 34 Poor Terra Vista Dr Dove Tree Ave City limit 0.1 Bike lanes, bike lane markings and signage 43 Fair Willow Ave W Easton St Valley Blvd 4.4 Shared lane markings and signage 2 Fair Lilac Ave W Apple St Valley Blvd 5.1 Shared lane markings and signage 4 TABLE 5-5: Pavement Condition Index
TABLE 5-5: Pavement Condition Index (Cont.)
CHAPTER 5 » RECOMMENDATIONS 193 PAVEMENT CONDITION INDEX CORRIDOR FROM STREET TO STREET LENGTH (MILES) FACILITY TYPE ID # Fair Sycamore Ave E Easton St San Bernardino Ave 3.9 Shared lane markings and signage 5 Fair Palm Ave Foothill Blvd Rialto Metrolink Station 0.7 Shared lane markings and signage 13 Fair Walnut Ave Cactus Ave Eucalyptus Ave 1.5 Shared lane markings and signage 16 Fair Cornell St Eucalyptus Ave Cactus Ave 1.6 Shared lane markings and signage 19 Fair PE Trail Access PE ROW (via Spruce Ave) Etiwanda Ave 0.8 Shared lane markings and signage 20 Fair PE Trail Access PE ROW (via Larch Ave) Etiwanda Ave 0.8 Shared lane markings and signage 26 Fair Pepper Ave Foothill Blvd/E Winchester Dr PE ROW/E Baseline Rd 0.7 Bike lanes, bike lane markings and signage 32 Fair Home St Riverside Ave Eucalyptus Ave 0.8 Shared lane markings and signage 31 Fair Locust Ave Casa Grande Ave Persimmon Ave 0.6 Bike lanes, bike lane markings and signage 36 Fair Locust Ave Bohnert Ave Baseline Rd 1.5 Bike lanes, bike lane markings and signage 37 Fair Apple Ave Cactus Ave Casmalia St 0.7 Shared lane markings and signage 40 Fair Larch Ave Merrill Ave San Bernardino Ave 1.0 Shared lane markings and signage 41 Fair Sunrise Dr N Palmetto Ave N Alder Ave 0.5 Shared lane markings and signage 47 Fair Shirly Bright Rd Pepper Ave Walnut Ave 0.4 Shared lane markings and signage 48 Fair E Winchester Dr Pepper Ave Eucalyptus Ave 0.3 Shared lane markings and signage 52 Good Riverside Ave Walnut Ave Santa Ana Trail 5.2 Bike lanes, bike lane markings, shared lane marking and signage 1 Good Foothill Blvd Maple Ave Pepper Ave 3.0 Bike lanes, bike lane markings and signage 3 Good Acacia Ave E Easton St E Montrose St 3.6 Shared lane markings and signage 6 Good Riverside Ave Sierra Ave Walnut Ave 5.1 Bike lanes, bike lane markings and signage 7 Good Bloomington Ave Cedar Ave Riverside Ave 1.8 Buffered bike lanes, bike lane markings, vertical barriers and signage 8 Good Cactus Ave Baseline Rd PE ROW 1.4 Bike lanes, bike lane markings and signage 12 Good E Rialto Ave Riverside Ave Eucalyptus Ave 0.8 Bike lanes, bike lane markings, shared lane marking and signage 15
TABLE 5-5: Pavement Condition Index (Cont.)
RIALTO ACTIVE TRANSPORTATION PLAN 194
CONDITION INDEX CORRIDOR FROM STREET TO STREET LENGTH (MILES) FACILITY TYPE ID # Good Linden Ave Baseline Rd Randall Ave 2.5 Shared lane markings and signage 17 Good Mckinley St and 3rd St Riverside Ave Eucalyptus Ave 0.7 Shared lane markings and signage 18 Good Cactus Ave Merrill Ave Valley Blvd 1.5 Shared lane markings and signage 24 Good Easton St/W Renaissance Pkwy Ayala Dr Eucalyptus Ave 2.1 Shared lane markings and signage 22 Good Rialto Ave Maple Ave Cactus Ave 1.3 Bike lanes, bike lane markings and signage 25 Good Linden Ave Riverside Baseline Rd 2.5 Bike lanes, bike lane markings and signage 27 Good Holly St Pepper Ave Lilac Ave 1.7 Shared lane markings and signage 28 Good Valley Blvd City limit Sycamore Ave 1.3 Bike lanes, bike lane markings and signage 30 Good Cactus Ave multi-use path PE ROW Merrill Ave 0.6 Class I 35 Good Maple Ave Foothill Blvd Randall Ave 1.5 Shared lane markings and signage 33 Good Grove St Cactus Ave Cedar Ave 0.9 Shared lane markings and signage 44 Good Casmalia St/Sierra Lakes Pkwy City limit Riverside Ave 3.6 Bike lanes, bike lane markings and signage 46 Good Maple Ave/ West Coast Blvd Locust Ave Bohnert Ave 1.2 Shared lane markings and signage 49 Very Good San Bernardino Ave Larch Ave Sycamore Ave 1.5 Bike lanes, bike lane markings and signage 14 Very Good South St Eucalyptus Ave Willow Ave 1.1 Shared lane markings and signage 21 Very Good Randall Ave Maple Ave Eucalyptus Ave 1.9 Bike lanes, bike lane markings and signage 23 Very Good Renaissance Pkwy Palmetto Ave Alder Ave 0.7 Bike lanes, bike lane markings and signage 39 Very Good Fromer St/Sage Ave Sycamore Ave Randall Ave 0.2 Shared lane markings and signage 42 Very Good Alru St Larch Ave Cactus Ave 0.5 Shared lane markings and signage 45 Very Good Jurupa Ave Riverside Ave City limit 0.2 Shared lane markings and signage 53
PAVEMENT
NEW MOBILITY
The practice of active transportation has been quickly evolving with the rise of new mobility options including:
» Shared use mobility is a term used to describe transportation services that are shared among multiple users. This can include traditional transit services such as buses and trains, as well as bikeshare programs and ride sourcing services such as Uber and Lyft.
» Shared micromobility encompasses all sharedused fleets of small, fully, or partially human-powered vehicles such as bikes, e-bikes, and e-scooters.
» Neighborhood Electric Vehicles (NEVs) are low speed motorized vehicles that have four wheels and can reach speeds of up to 25 mph. They offer a zero-emission mobility option that is convenient for making short trips within the community.
IMPACTS OF NEW MOBILITY
» Reduces driving and parking congestion
» Lowers vehicle miles traveled and vehicle ownership rates
» Improves air quality and achieves climate action targets
» Provides mobility access to underserved populations such as low-income travelers
While these are convenient additions to fulfill residents’ first-last mile travel needs, they may also create regulation and safety problems. The City of Rialto may see the emergence and growth of these options in different forms. For future needs, the city may look to utilize and expand the existing curb extensions and mid-block flexible parking space to improve service for existing mobility modes and accommodate potential storing and transferring needs for private or shared new mobilities. Apart from physical improvements, educational signage and programs should follow to promote safe riding and parking of shared micromobility vehicles.
CURB MANAGEMENT AND MOBILITY HUB
Managing curbsides at a neighborhood scale makes it possible to assign curbside uses that don’t need to be directly in front of a destination and
planning for access beyond the corridor makes it easier to reassign parking on a corridor.
Cities can improve transit by using the following strategies to manage the curb:
» Shifting from Parking Lane to Flex Zone
» Clearing the Way for Transit
» Moving Loading and Access Nearby
» Looking Beyond the Corridor
Data from North American cities show that repurposing parking spaces for transit priority supports businesses and mobility. Arrival-mode surveys show that transit delivers many times more people to streets and businesses than do private cars. As a public asset, curbside can be planned to serve broader purposes in an organized manner. Figure 5-25 shows an example of such concept.
Pilot practices on curb management and mobility hubs include:
» City of Minneapolis - Mobility Hub Pilot Program, Twin Cities Shared Mobility Action Plan
» San Francisco Bay Area - Mobility Hubs at Affordable Housing Pilot
» San Diego Association of Governments (SANDAG) - Regional Mobility Hub Strategy
» LA Metro - Los Angeles County Shared Mobility Action Plan
Figure 5-26 on page 197 displays the proposed bikeshare parking locations from the Bikeshare Feasibility Study which include:
» N Cactus Ave & Foothill Blvd
» Renaissance Marketplace (located on W Renaissance Pkwy)
» Renaissance Center (N Cedar Ave & W Foothill Blvd)
» Rialto City Park (S Riverside Ave & E San Bernardino Ave)
» Metrolink Station (located on S Palm Ave)
» Downtown Rialto (located on E Rialto Ave)
» Pacific Electric Trail (N Cactus Ave & South of 2nd St)
» N Riverside Ave & Foothill Blvd
» N Riverside Ave & Merrill Ave
» N Riverside Ave & 1st St
CHAPTER 5 » RECOMMENDATIONS 195
Simple Intersection Mobility Mini Hub
Seating with
Additional Off-street Bike Parking
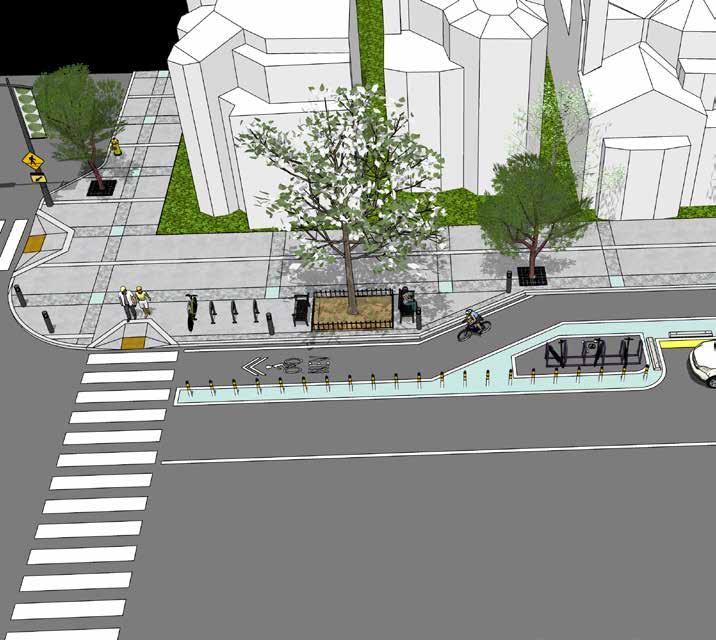
RIALTO ACTIVE TRANSPORTATION PLAN 196
5 3 2 1 1 4 2 5 3 4
Shared Micromobility Parking Zone High-visibility Crosswalk
Placemaking:
Shade Wayfinding/Community Branding
FIGURE 5-25: Mobility Hub Example
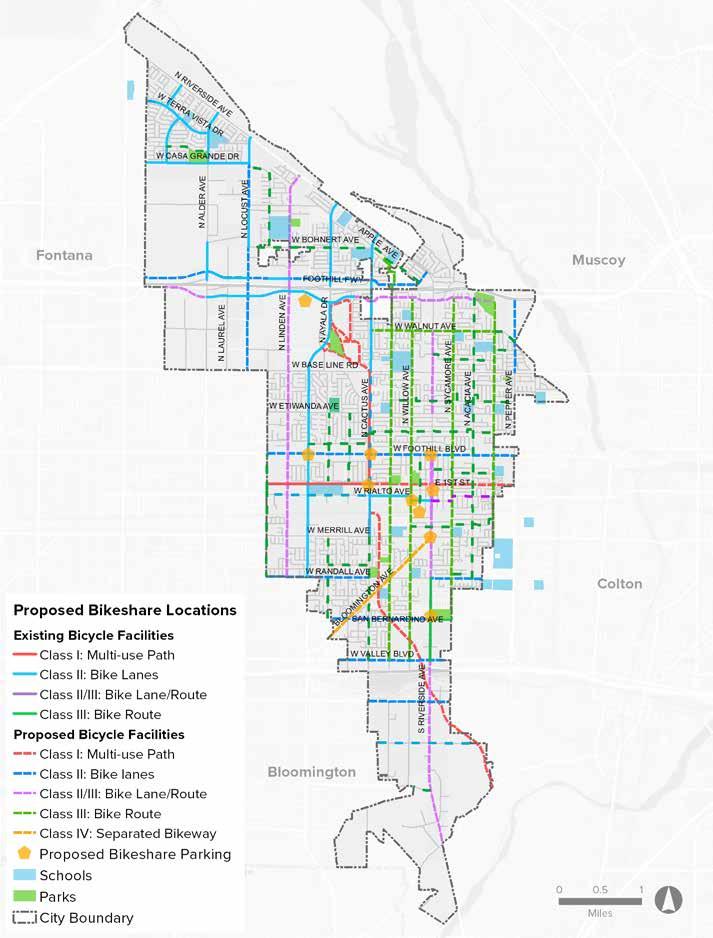
CHAPTER 5 » RECOMMENDATIONS 197
FIGURE 5-26: Proposed Bikeshare Locations
SAFE ROUTES TO PARKS & FIRST AND LAST MILE TO TRANSIT RECOMMENDATIONS
Through the community engagement process, access to parks and transit were some of the top destinations where residents wanted to see active transportation improvements. Residents primarily wanted to see a connected sidewalk network, more frequent and highly visible crosswalks, and amenities at the bus stops. The analysis in Chapter 3 identified some of the deficiencies such as missing sidewalks, curb ramps, and high-visibility crosswalks. Using similar methodology as the city’s Safe Routes to School Plan and first and last mile best practices, routes to parks and TAC approved existing and future transit stops were identified and bicycle and pedestrian improvements were developed.
Within the walksheds of these destinations, recommendations were developed based on community input, data from Chapter 3, field observations, and previous planning and CIP projects. The following project sheets provide a brief description, maps, and metrics associated with each park and study transit stops. These project sheets can be used to help future development, CIP projects, and grant pursuits. Please refer to Figure 5-27 for park and bus stop locations. 1
Parks Bus Stops
1
2
RIALTO ACTIVE TRANSPORTATION PLAN 198
Alec Fergusson Park
Rodger Birdsall Park
Jerry Eaves Park 4 Frisbie Park 5 Flores Park 6 Bud Bender Park 7 Margaret Todd Park 8 Andreson Park 9 Joe Sampson Park
Rialto City Park
2
3
10
Carter High/Birdsall Park
Renaissance at Linden
Riverside at Easton
Baseline at Riverside
Baseline at Ayala
Riverside at Foothill
Metrolink Station
Riverside at Merrill
Riverside at San Bernardino
Valley at Riverside
San Bernardino at Bloomington
& 13 Foothill at Linden and Foothill at Cedar
3
4
5
6
7
8
9
10
11
12
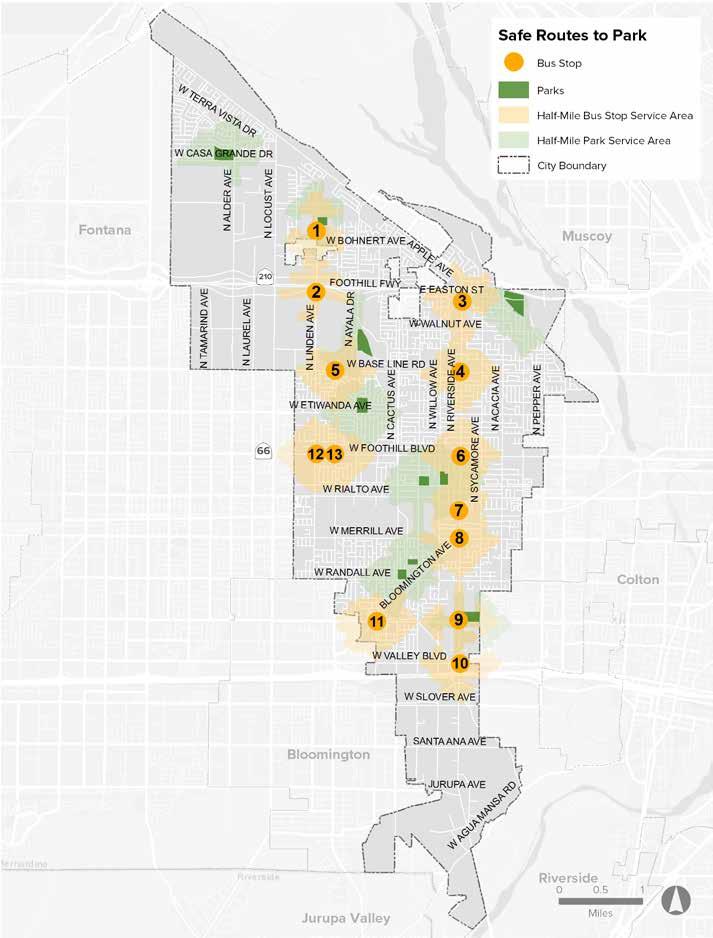
CHAPTER 5 » RECOMMENDATIONS 199 1 2 3 4 5 6 7 8 9 10
FIGURE 5-27: Park and Bus Stop Locations
SRTP PROJECT 1
ALEC FERGUSSON PARK
COST ESTIMATE: $165,199
EXISTING CONDITIONS
Fergusson Park is located in northeastern Rialto and is accessed via W Sunrise Drive and W Casa Grande Drive. The park is primarily surrounded by single family residential uses to the north, east, and west, while industrial uses can be found south of W Casa Drive. Fergusson Park features two football fields, a ¼ mile walking track, skate park for skateboarding and skating, picnic area, playground equipment, horse shoe pits, a little league field, basketball court and restrooms. Visitors use the park for passive and active recreation.
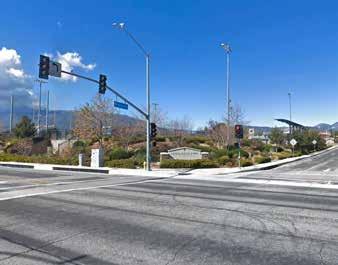
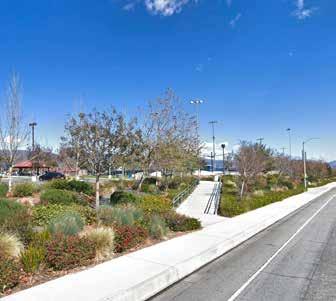
AT A GLANCE
2
2,456
1
RIALTO ACTIVE TRANSPORTATION PLAN 200
to Safe Routes to Schools recommendations
feet of missing sidewalk missing curb
Refer
linear
ramps bicycle/pedestrian collision
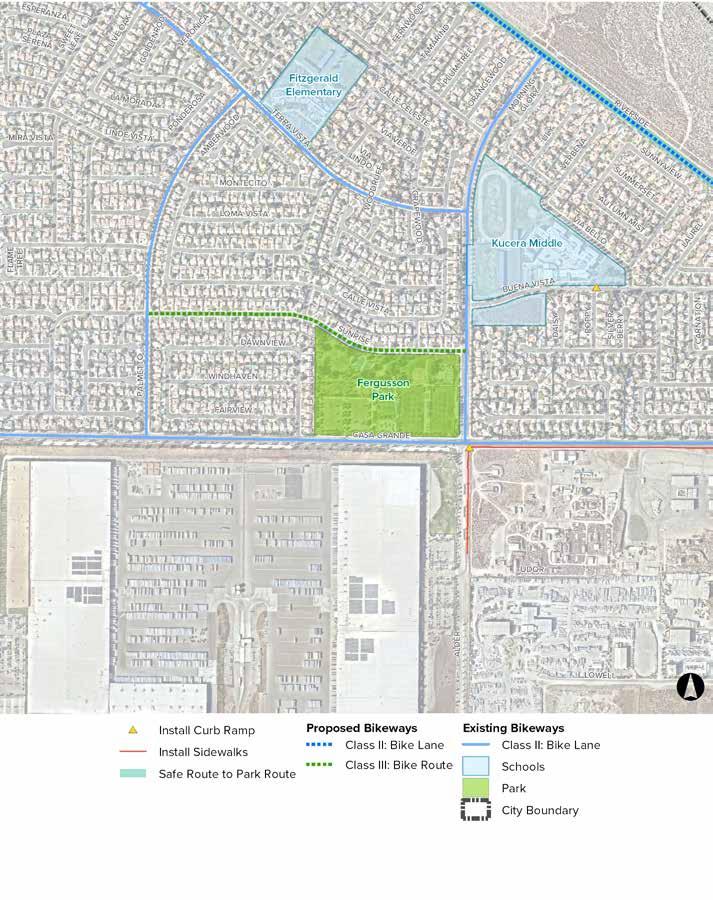
CHAPTER 5 » RECOMMENDATIONS 201
FIGURE 5-28: Alec Fergusson Park Recommended Pedestrian Improvements
SRTP PROJECT 2
RODGER BIRDSALL PARK
COST ESTIMATE: $1,161,303
EXISTING CONDITIONS
Rodger Birdsall Park is located in northern Rialto across the street from Wilmer Amina Carter High School. The park is accessed via N Linden Avenue and is surrounded by single family residential uses, as well public facilities and vacant parcels. The park features little league fields, a t-ball field, public picnicking facilities, basketball court, children’s playground, picnic shelters and restrooms. The park is used for both passive and active recreation.
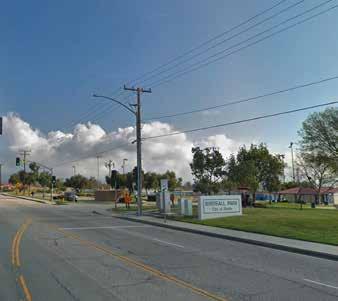
AT A GLANCE
14
recommended crosswalks
13
16,550
linear feet of missing sidewalk
3
missing curb ramps bicycle/pedestrian collisions
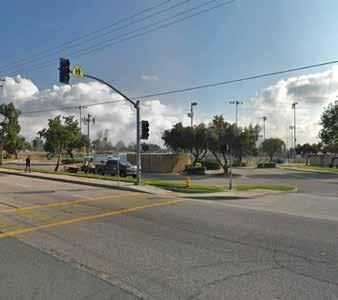
RIALTO ACTIVE TRANSPORTATION PLAN 202
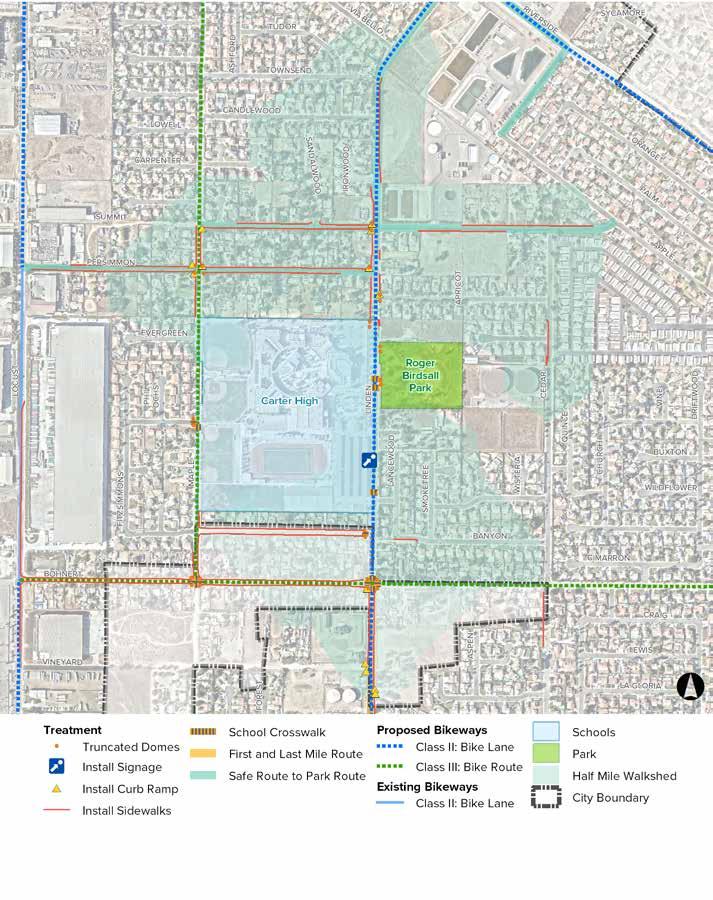
CHAPTER 5 » RECOMMENDATIONS 203
FIGURE 5-29: Rodger Birdsall Park Recommended Pedestrian Improvements
Install school crosswalks.
Install school crosswalks.
SRTP PROJECT 3
JERRY EAVES PARK
COST ESTIMATE: $969,910
EXISTING CONDITIONS
Jerry Eaves Park is a large park located in north central Rialto. The park is accessed via N Ayala Drive and is surrounded by commercial and service uses to the west, transportation and utilities uses to the north and east, and vacant land to the south. Jerry Eaves Park features seven soccer fields, two large picnic shelters, children’s playground, and restrooms. Visitors use the park for passive and active recreation. AT
20
recommended crosswalks
6,217
linear feet of missing sidewalk
2 2
missing curb ramps bicycle/pedestrian collisions
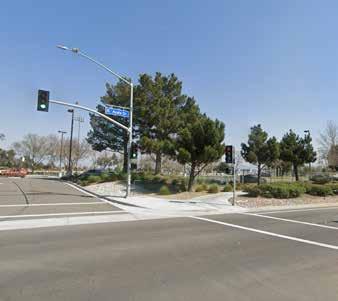
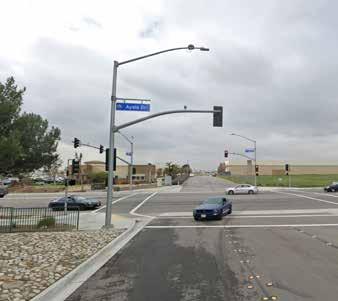
RIALTO ACTIVE TRANSPORTATION PLAN 204
A GLANCE
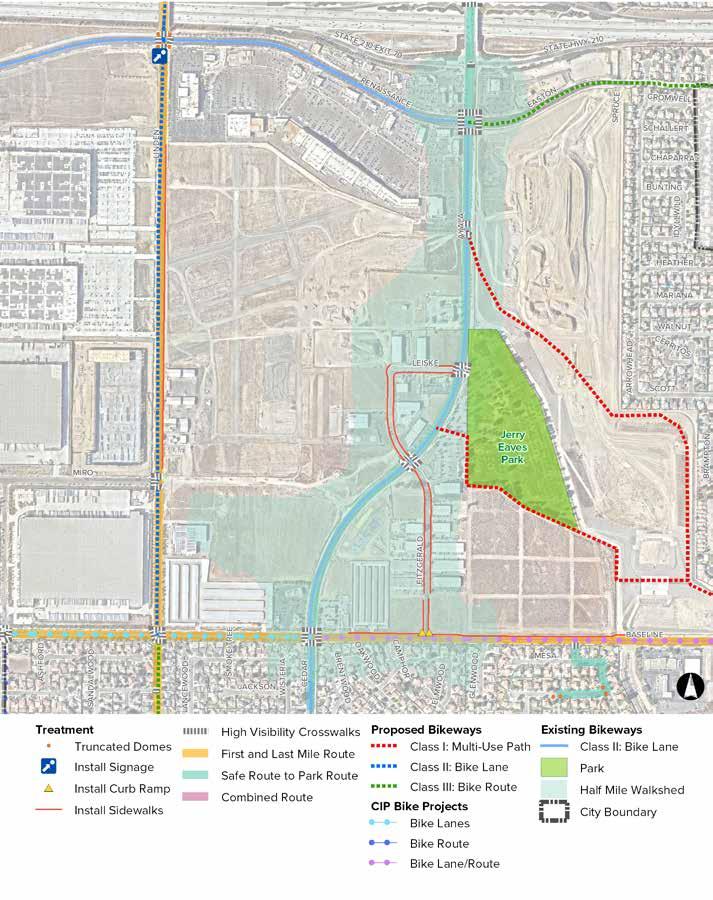
CHAPTER 5 » RECOMMENDATIONS 205
FIGURE 5-30: Jerry Eaves Park Recommended Pedestrian Improvements
Proposed traffic signal.
SRTP PROJECT 4
FRISBIE PARK
COST ESTIMATE: $1,248,610
EXISTING CONDITIONS
Frisbie Park lies in northeastern Rialto just south of California State Route 210. The park is split into two by E Easton Street and can also be accessed via N Eucalyptus Avenue. The park is surrounded by single family residential uses to the west and south and vacant land to the west. The park features three little league fields, three girls softball fields, public picnic areas, playground equipment, basketball courts and restrooms. Frisbie Park offers both passive and active recreation opportunities.
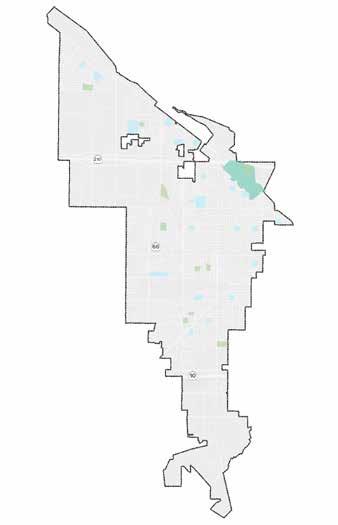
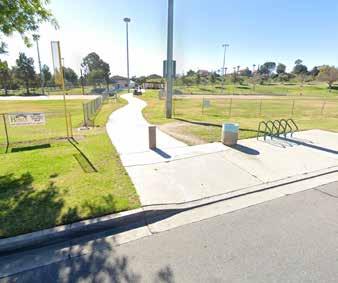
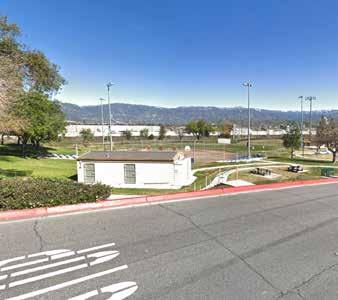
AT A GLANCE
6
recommended crosswalks
46
missing curb ramps
13,413
linear feet of missing sidewalk
5
bicycle/pedestrian collisions
RIALTO ACTIVE TRANSPORTATION PLAN 206
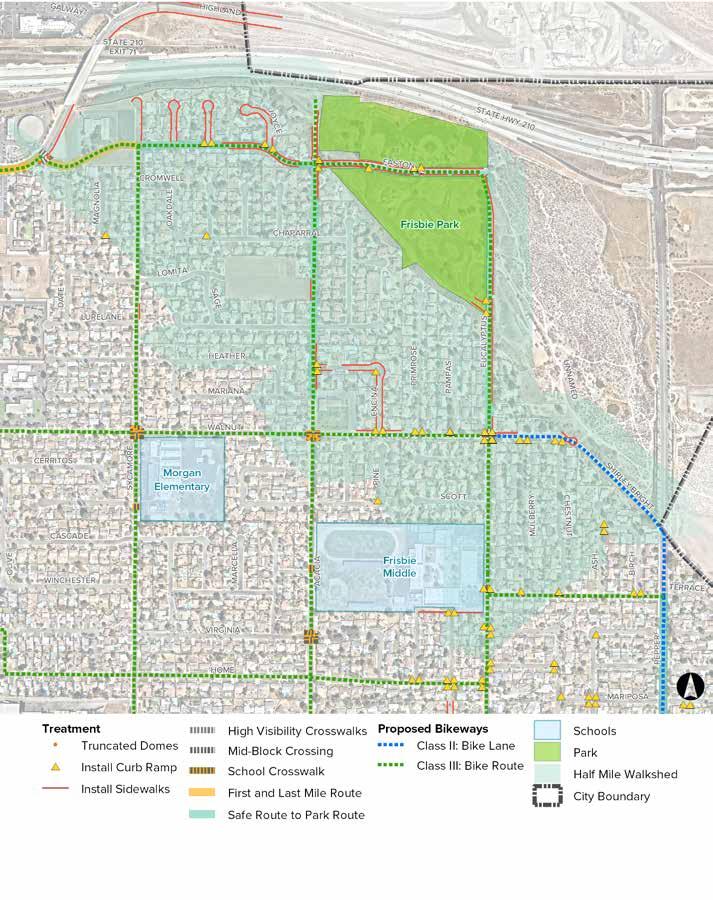
CHAPTER 5 » RECOMMENDATIONS 207
FIGURE 5-31: Frisbie Park Recommended Pedestrian Improvements
Install curb extensions.
Install school crosswalks.
Install school crosswalks.
SRTP PROJECT 5
FLORES PARK
COST ESTIMATE: $310,401
EXISTING CONDITIONS
Flores Park is located in central Rialto immediately south of Helen L. Elementary School. The park can be accessed via W Etiwanda Avenue and is surrounded by single-family homes to the east, west, and south. The park features a ¼ mile walking track, picnic area, children’s playground, and restrooms. Flores Park offers both passive and active recreation opportunities.
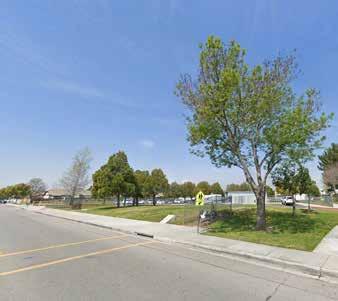
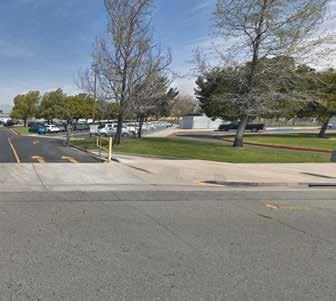
10 714
recommended crosswalks
linear feet of missing sidewalk
28 5
missing curb ramps
bicycle/pedestrian collisions
RIALTO ACTIVE TRANSPORTATION PLAN 208
AT A GLANCE
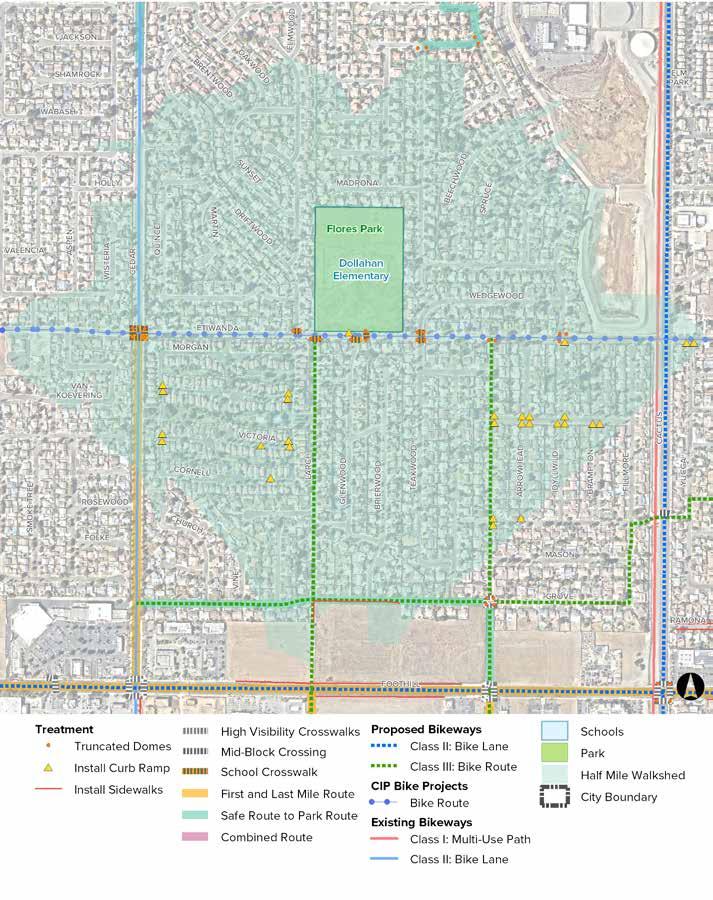
CHAPTER 5 » RECOMMENDATIONS 209
FIGURE 5-32: Flores Park Recommended Pedestrian Improvements
Install high visibility crosswalks and truncated domes.
Install school crosswalks and truncated domes.
SRTP PROJECT 6 & 7 BUD BENDER PARK AND MARGARET TODD PARK
COST ESTIMATE: $1,002,326
EXISTING CONDITIONS
The Bud Bender and Margaret Todd parks are located in central Rialto. The parks are separated by the Rialto City Cemetery. The parks are surrounded by a variety of uses, including single-family residential, industrial, and education. Bud Bender Park features picnic facilities, a little league field, a pony league field, a t-ball field and restrooms. Margaret Todd Park features a skate park for skateboarding and skating. Both parks offer passive and active recreation opportunities.
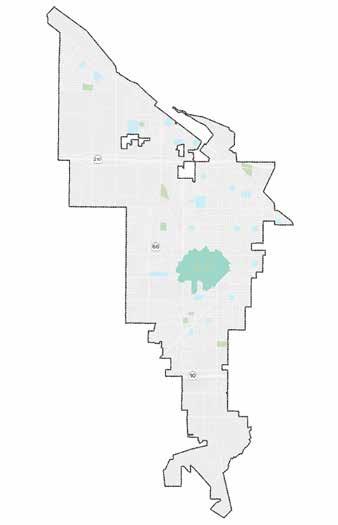
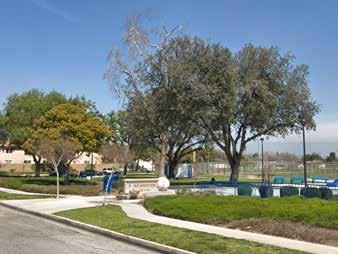
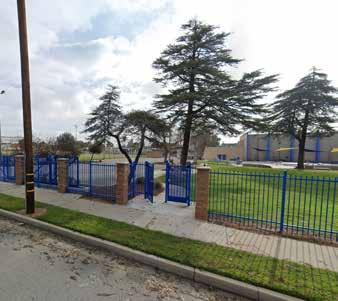
51
recommended crosswalks
9,770
linear feet of missing sidewalk
27 24
missing curb ramps
bicycle/pedestrian collisions
RIALTO ACTIVE TRANSPORTATION PLAN 210
AT A GLANCE
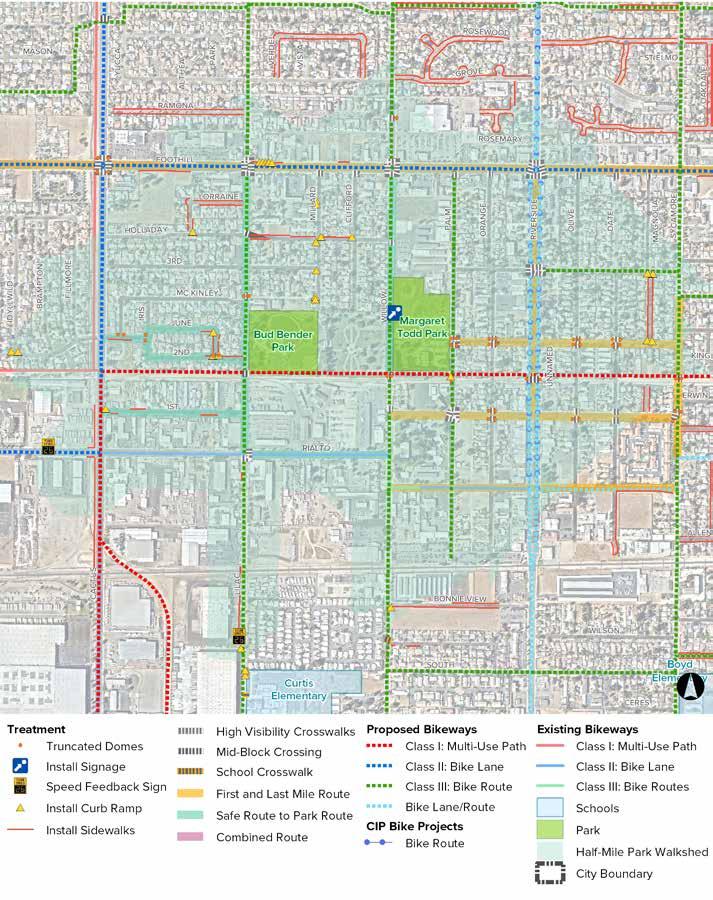
CHAPTER 5 » RECOMMENDATIONS 211
FIGURE 5-33: Bud Bender Park and Margaret Todd Park Recommended Pedestrian Improvements
Install high visibility crosswalks.
Install high visibility crosswalks.
Install high visibility crosswalks.
Install signage.
SRTP
PROJECT 8 & 9
ANDRESON PARK AND JOE SAMPSON PARK
COST ESTIMATE: $615,538
EXISTING CONDITIONS
The Andreson and Joe Sampson parks are located in central Rialto in the middle of a single-family residential neighborhood. Andreson Park can be accessed via S Lilac Avenue, while Joe Sampson Park can be accessed via W Randall Avenue and S Cactus Avenue. Andreson Park doubles as a dog park and features a ¼ mile walking track, a basketball court, children’s playground, three large picnic shelters, and restrooms. Joe Sampson Park features four picnic shelters, playground equipment, basketball courts, ¼ mile walking trail, and restrooms. Visitors use both parks for passive and active recreation.
26
recommended crosswalks
5
7,423
linear feet of missing sidewalk
7
missing curb ramps bicycle/pedestrian collisions
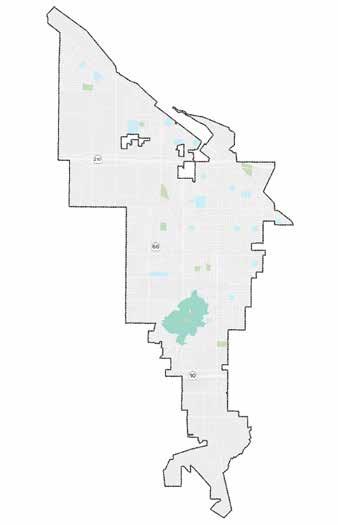
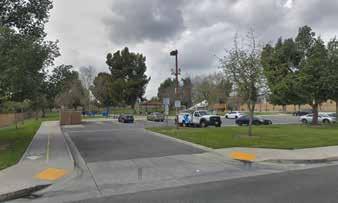
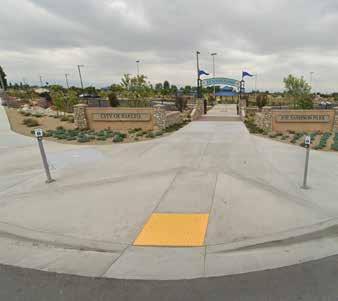
RIALTO ACTIVE TRANSPORTATION PLAN 212
AT A GLANCE
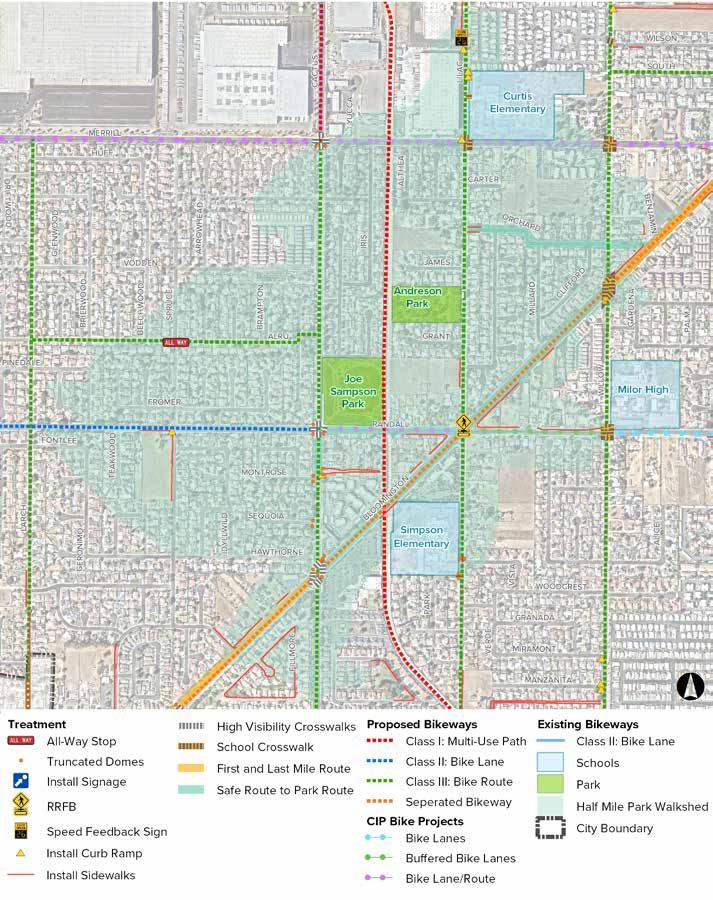
CHAPTER 5 » RECOMMENDATIONS 213
FIGURE 5-34: Andreson Park and Joe Sampson Park Recommended Pedestrian Improvements
Install school crosswalks.
Install school crosswalks.
Install high visibility crosswalks and truncated domes.
SRTP PROJECT 10
RIALTO CITY PARK
COST ESTIMATE: $379,621
EXISTING CONDITIONS
Rialto City Park is located in central Rialto immediately west of the city limits. The park is surrounded by residential uses to the north and east, as well as vacant land to the south. The park can be accessed via E San Bernardino Avenue and S Riverside Avenue. The park features a football field, a pony league field, a little league field, several picnic areas, playground equipment, a basketball court, an outdoor gym and restrooms. Rialto City Park offers opportunities for passive and active recreation. AT
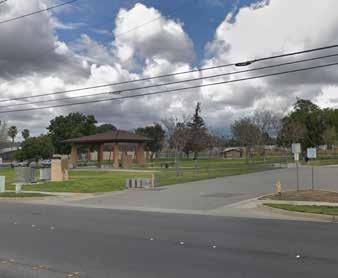
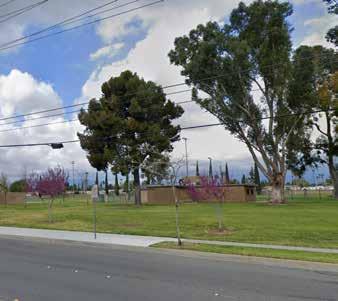
18
recommended crosswalks
7
3,885
linear feet of missing sidewalk
5
missing curb ramps bicycle/pedestrian collisions
RIALTO ACTIVE TRANSPORTATION PLAN 214
A GLANCE
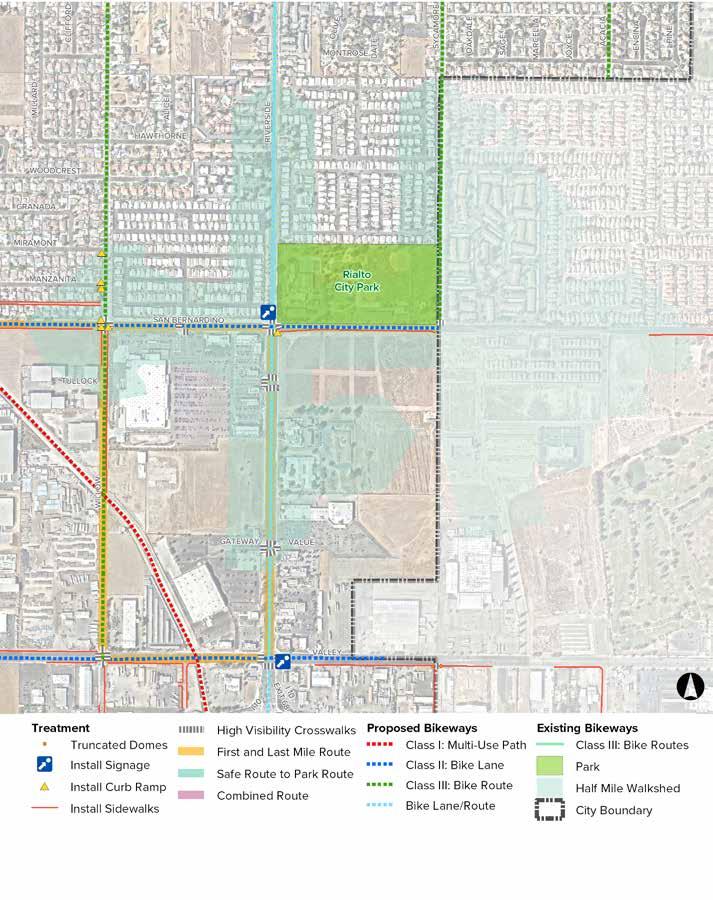
CHAPTER 5 » RECOMMENDATIONS 215
FIGURE 5-35: Rialto City Park Recommended Pedestrian Improvements
Install curb extensions.
Install high visibility crosswalks.
Install high visibility crosswalk.
FLM PROJECT 1
CARTER HIGH / BIRDSALL PARK
COST ESTIMATE: $1,107,929
EXISTING CONDITIONS
The Linden at Carter High School bus stop is located in northern Rialto at N Linden Avenue approximately 380 feet south of Carter High School’s main entrance. The bus stop is mainly surrounded by single-family homes. Roger Birdsall Park is located 0.1 miles north of the bus stop. Currently, the bus stop only features a sign and lacks a bench and shelter. AT
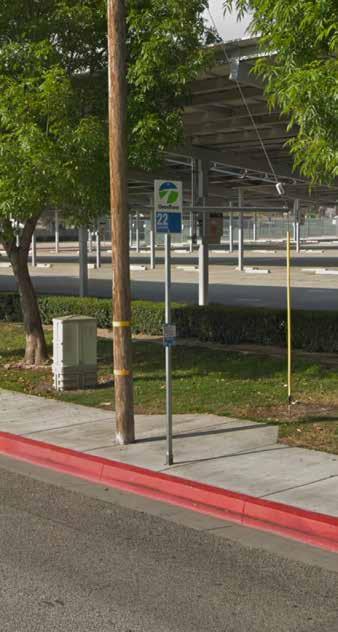
14
recommended crosswalks
9
15,164
linear feet of missing sidewalk
3
missing curb ramps bicycle/pedestrian collisions
RIALTO ACTIVE TRANSPORTATION PLAN 216
A GLANCE
CHAPTER 5 » RECOMMENDATIONS 217
school crosswalks and truncated domes.
FIGURE 5-36: Carter High/Birdsall Park Recommended First and Last Mile Improvements bus shelter and bench. 1
Install
Install
FLM PROJECT 2
RENAISSANCE AT LINDEN
COST ESTIMATE: $625,616
EXISTING CONDITIONS
The Renaissance at Linden bus stop is a future bus stop location that is along new Omnitrans Routes 12 and 22. The stop will be located in northern Rialto at the corner of W Renaissance Parkway and N Linden Avenue. The bus stop is surrounded by commercial and retail uses to the east and vacant land and an Amazon distribution center to the south.
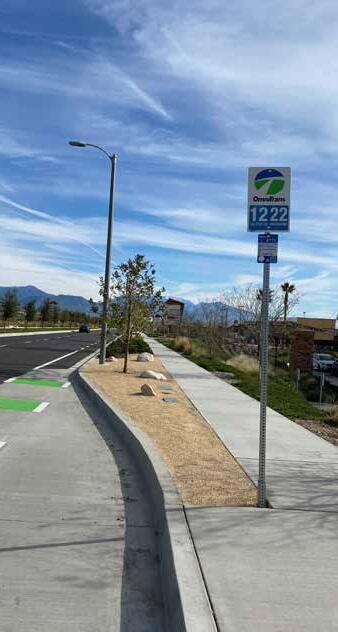
8
recommended crosswalks
8,277
linear feet of missing sidewalk
4 0
missing curb ramps bicycle/pedestrian collisions
RIALTO ACTIVE TRANSPORTATION PLAN 218
AT A GLANCE
CHAPTER 5 » RECOMMENDATIONS 219
FIGURE 5-37: Renaissance at Linden Recommended First and Last Mile Improvements
2
Install high visibility crosswalks and truncated domes.
Install bus shelter, bench and signage.
FLM PROJECT 3
RIVERSIDE AT EASTON
COST ESTIMATE: $613,449
EXISTING CONDITIONS
The Easton at Riverside bus stop is located at the intersection of N Riverside Avenue and W Easton Street in northeastern Rialto. This bus stop lies approximately 0.13 miles south of CA State 210 and is primarily surrounded by retail and other commercial uses. The bus stop is also located along new Omnitrans Routes 12 and 22. Currently, the bus stop only features a sign and lacks a bench and shelter. AT
12
recommended crosswalks
5
7,796
linear feet of missing sidewalk
7
missing curb ramps bicycle/pedestrian collisions
RIALTO ACTIVE TRANSPORTATION PLAN 220
A GLANCE
CHAPTER 5 » RECOMMENDATIONS 221
FIGURE 5-38: Riverside at Easton Recommended First and Last Mile Improvements
high visibility
high visibility
high visibility
3
Install high visibility crosswalks and truncated domes. Install
crosswalks and truncated domes. Install
crosswalks. Install
crosswalks.
Install bus shelter and bench.
FLM PROJECT 4
BASELINE AT RIVERSIDE
COST ESTIMATE: $99,487
EXISTING CONDITIONS
The Baseline at Riverside bus stop is located at the corner of W Baseline Road and N Riverside Avenue in northeastern Rialto. The bus stop is primarily surrounded by retail and other commercial uses. The bus stop features a sign as well as a bench and shelter for passengers to wait. AT
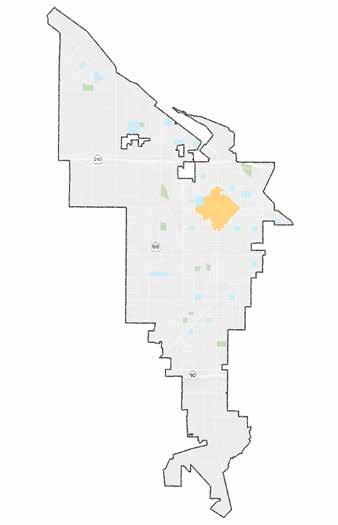
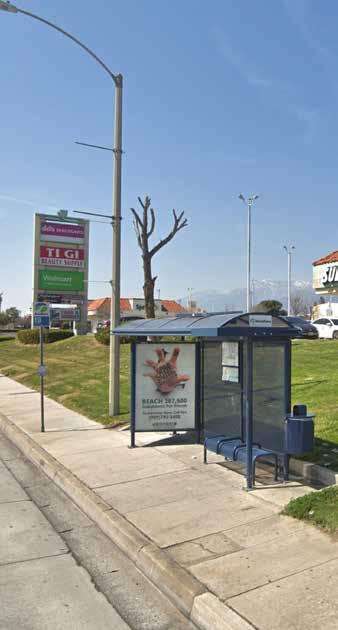
A GLANCE
16 910
recommended crosswalks
linear feet of missing sidewalk
0 20
missing curb ramps
bicycle/pedestrian collisions
RIALTO ACTIVE TRANSPORTATION PLAN 222
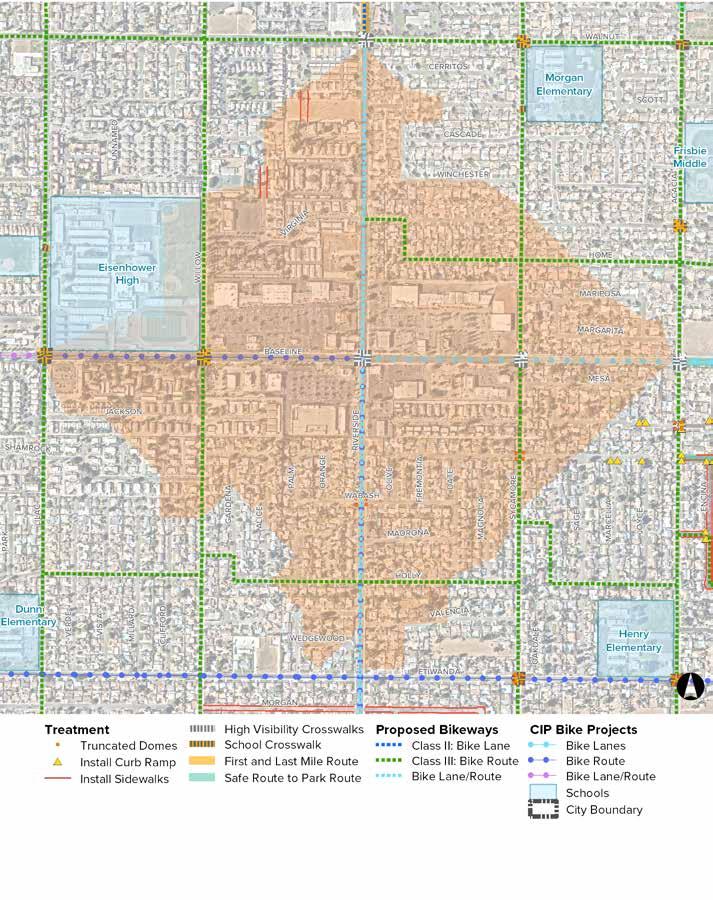
CHAPTER 5 » RECOMMENDATIONS 223
FIGURE 5-39: Baseline at Riverside Recommended First and Last Mile Improvements high visibility crosswalks. 4
Install
FLM PROJECT 5
BASELINE AT AYALA
COST ESTIMATE: $976,854
EXISTING CONDITIONS
The Baseline at Ayala bus stop is located at the intersection of W Baseline Road and N Ayala Drive in west central Rialto. The bus stop is surrounded by a mix of uses, including retail and commercial services to the north and east and single-family homes to the south. Currently, the bus stop only features a sign and lacks a bench and shelter. AT A GLANCE
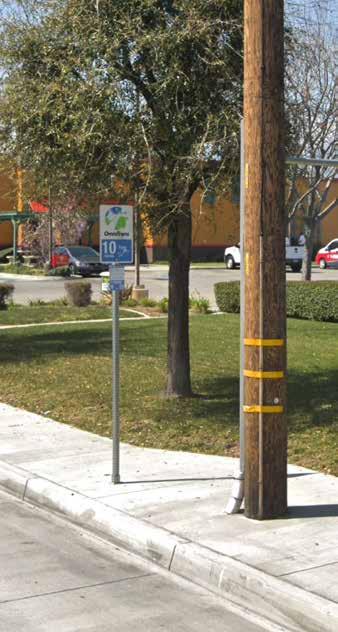
22
recommended crosswalks
6,226
linear feet of missing sidewalk
2 4
missing curb ramps
bicycle/pedestrian collisions
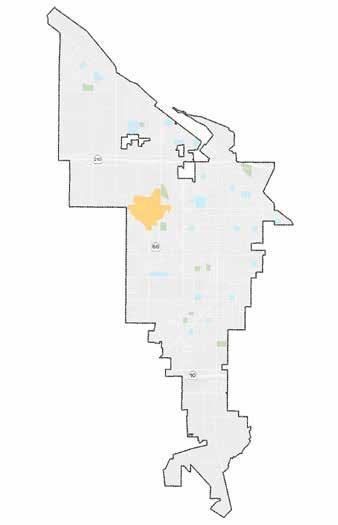
RIALTO ACTIVE TRANSPORTATION PLAN 224
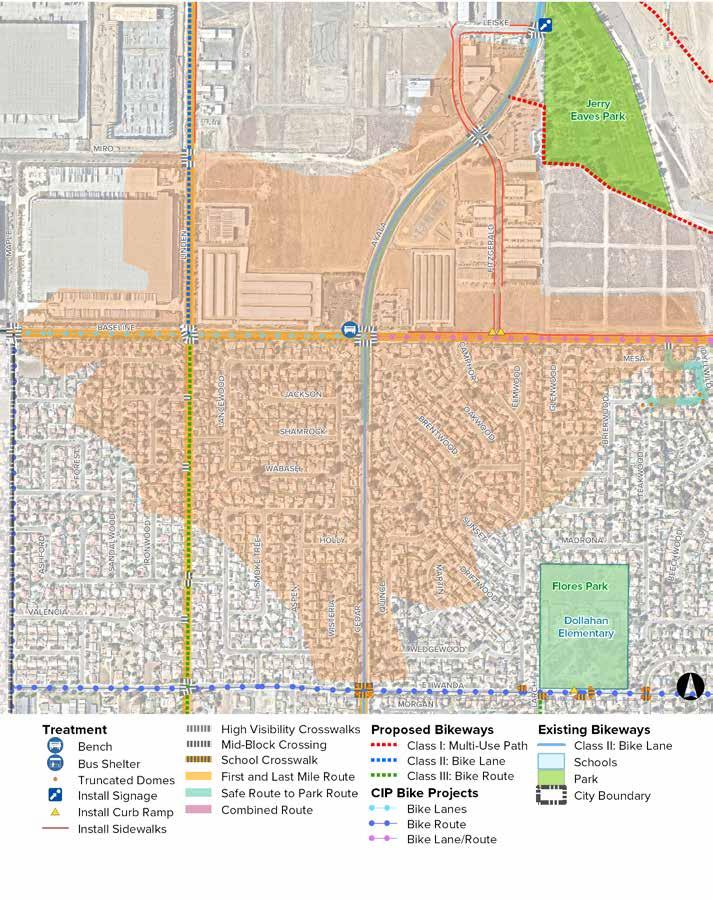
CHAPTER 5 » RECOMMENDATIONS 225
Install high visibility crosswalks. Install bus shelter. Install traffic signal. 5
FIGURE 5-40: Baseline at Ayala Recommended First and Last Mile Improvements
FLM PROJECT 6
RIVERSIDE AT FOOTHILL
COST ESTIMATE: $1,850,028
EXISTING CONDITIONS
The Riverside at Foothill bus stop is located at the corner of N Riverside Avenue and E Foothill Boulevard in central Rialto and also has the highest transit ridership. This bus stop is surrounded by a variety of commercial and retail uses. The stop features a sign as well as two benches and a shelter for passengers to wait. AT
34
recommended crosswalks
26,065
linear feet of missing sidewalk
13 18
missing curb ramps
bicycle/pedestrian collisions
RIALTO ACTIVE TRANSPORTATION PLAN 226
A GLANCE
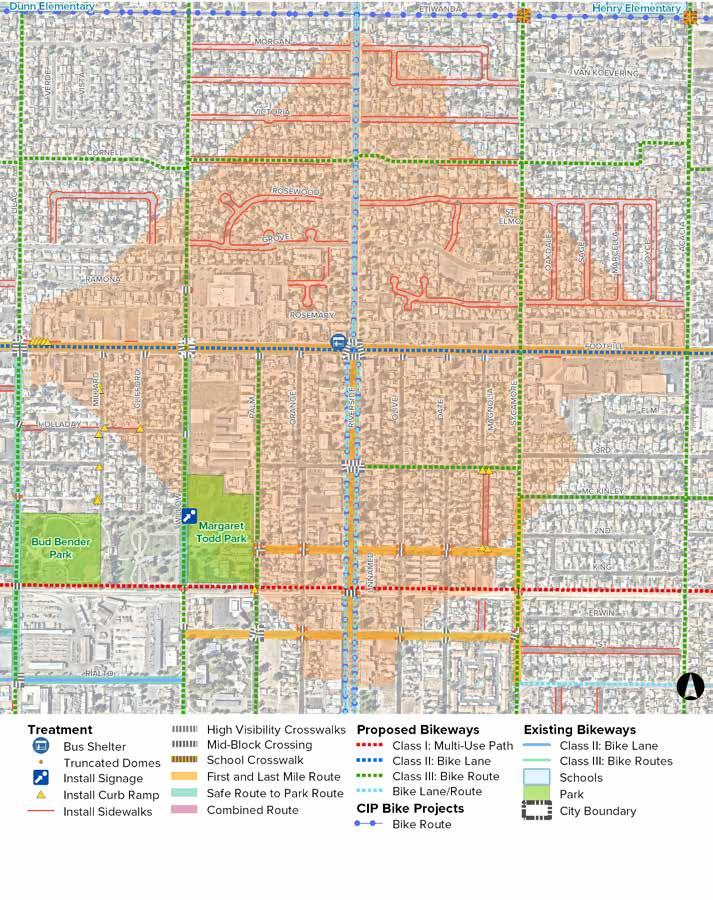
CHAPTER 5 » RECOMMENDATIONS 227
FIGURE 5-41: Riverside at Foothill Recommended First and Last Mile Improvements
Install high visibility crosswalks.
Bus shelter.
6
Install high visibility crosswalks and truncated domes.
FLM PROJECT 7
METROLINK STATION
COST ESTIMATE: $498,320
EXISTING CONDITIONS
The Rialto Metrolink station is the city’s major regional connector and is located in central Rialto just south of downtown. The Metrolink bus stop is located at the eastern edge of the station along Riverside Avenue. The bus stop is surrounded primarily by retail, commercial, and office uses. The bus stop features a sign as well as a bench and shelter for passengers to wait.
27
recommended crosswalks
2
6,245
linear feet of missing sidewalk
14
missing curb ramps bicycle/pedestrian collisions
RIALTO ACTIVE TRANSPORTATION PLAN 228
A GLANCE
AT
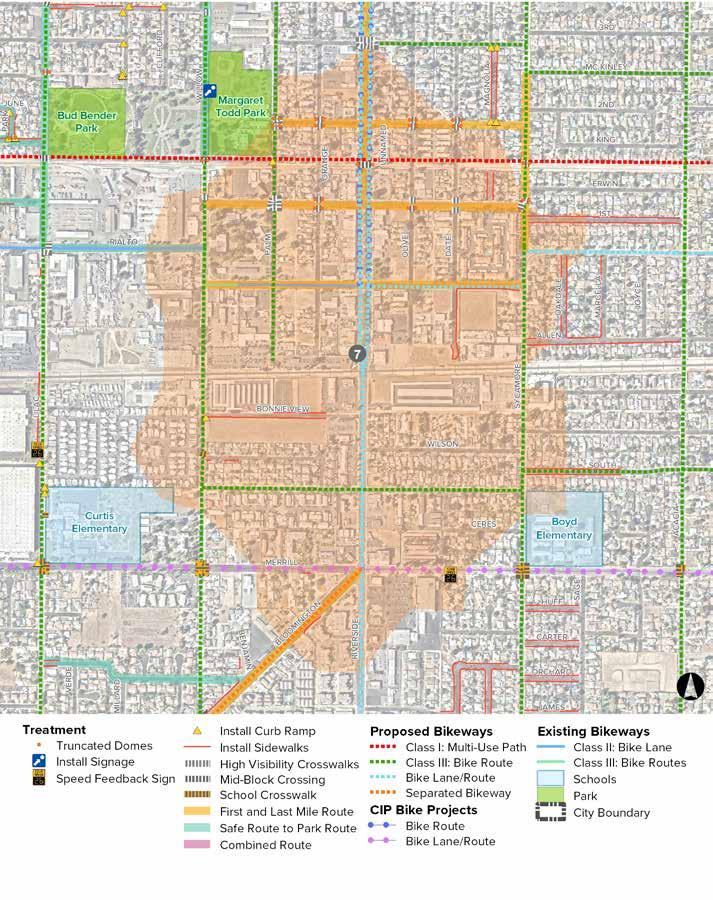
CHAPTER 5 » RECOMMENDATIONS 229
FIGURE 5-42: Metrolink Station Recommended First and Last Mile Improvements
Install high visibility crosswalk.s
Install high visibility crosswalks.
Install high visibility crosswalks and truncated domes.
FLM PROJECT 8
RIVERSIDE AT MERRILL
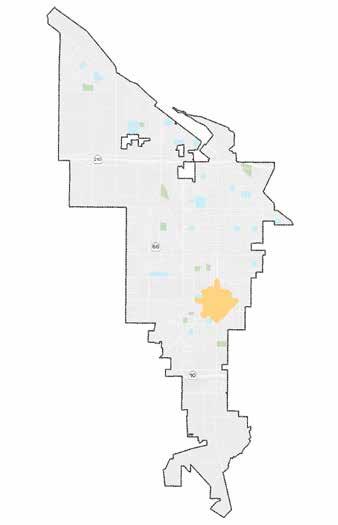
COST ESTIMATE: $884,815
EXISTING CONDITIONS
The Merrill at Riverside bus stop has high transit ridership and is located at the intersection of S Riverside Avenue, E Merrill Avenue, and Bloomington Avenue in central Rialto. Various commercial uses can be found around this bus stop, including a gas station, a grocery store, and several restaurants. The bus stop features a sign as well as two benches and a shelter for passengers to wait.
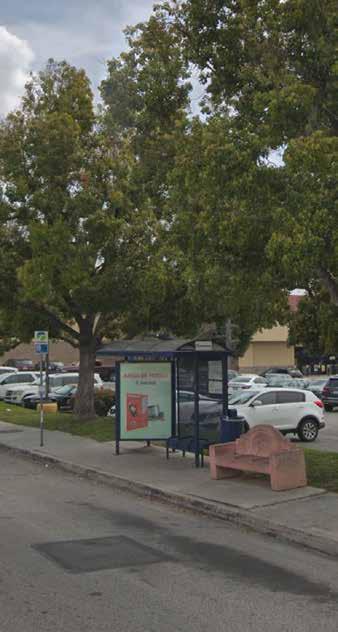
22
recommended crosswalks
1
missing curb ramps
13,255
linear feet of missing sidewalk
20
bicycle/pedestrian collisions
RIALTO ACTIVE TRANSPORTATION PLAN 230
AT A GLANCE
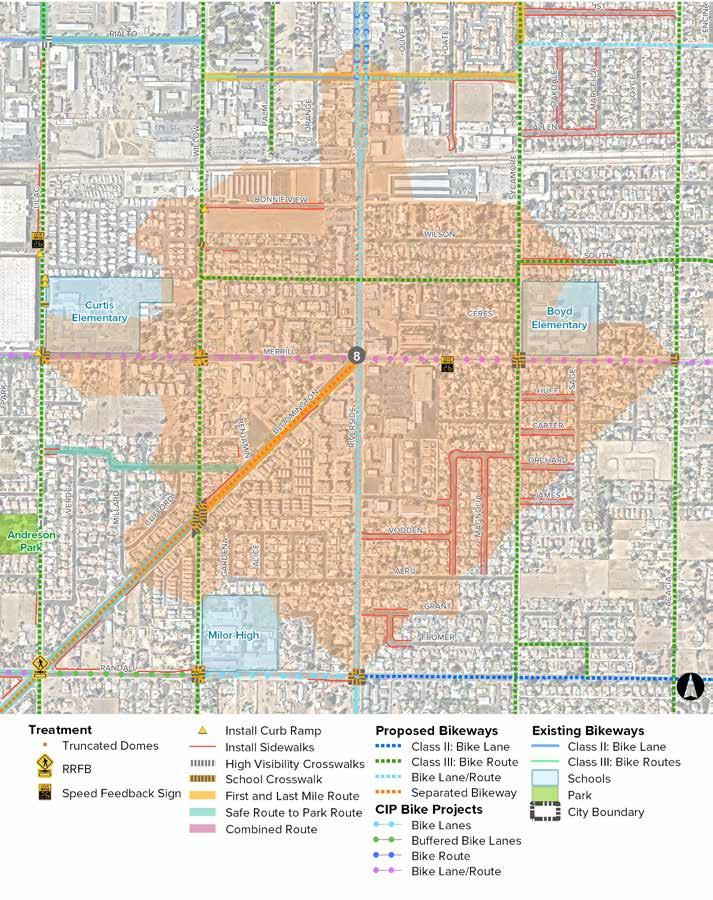
CHAPTER 5 » RECOMMENDATIONS 231
FIGURE 5-43: Riverside at Merrill Recommended First and Last Mile Improvements
Install school crosswalks.
Install school crosswalks.
Install school crosswalks.
FLM PROJECT 9
RIVERSIDE AT SAN BERNARDINO
COST ESTIMATE: $658,090
EXISTING CONDITIONS
The Riverside at San Bernardino bus stop has high transit ridership and is located at the corner of S Riverside Avenue and W San Bernardino Avenue in eastern Rialto. The bus stop currently features a sign and bench but lacks a bus shelter. The stop is surrounded by a variety of uses, including residential and commercial uses, vacant land, and Rialto City Park. AT
22
recommended crosswalks
6,217
linear feet of missing sidewalk
7 8
missing curb ramps bicycle/pedestrian collisions
RIALTO ACTIVE TRANSPORTATION PLAN 232
A GLANCE
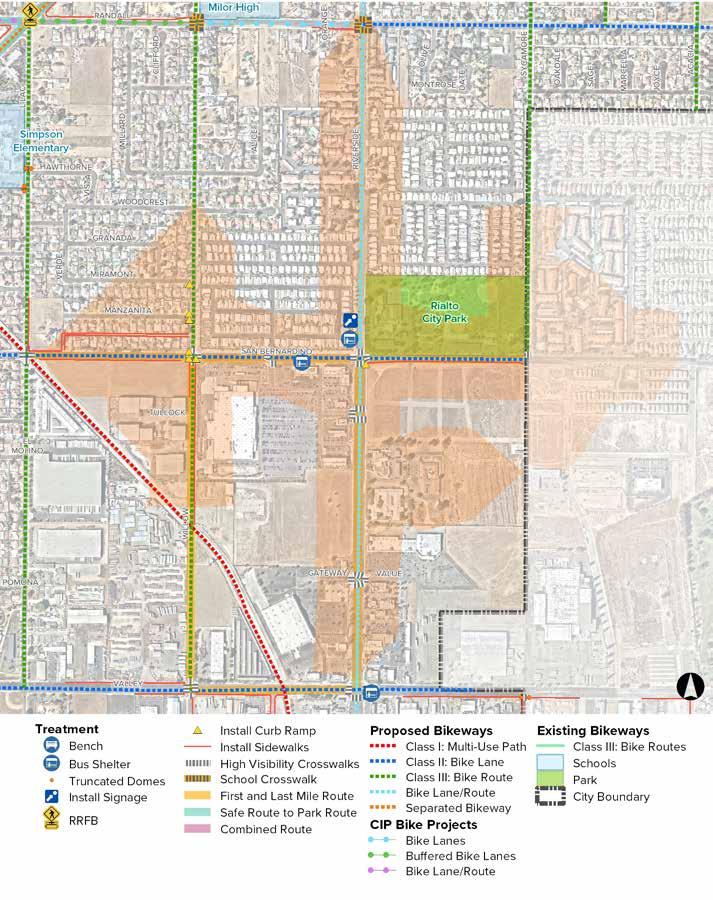
CHAPTER 5 » RECOMMENDATIONS 233
school crosswalks. Install high visibility crosswalks and truncated domes. Install high visibility crosswalks and missing curb ramps. Install curb extensions. Install bus shelter and bench. Install bus shelter. 9
FIGURE 5-44: Riverside at San Bernardino Recommended First and Last Mile Improvements
Install
FLM PROJECT 10
VALLEY AT RIVERSIDE
COST ESTIMATE: $453,271
EXISTING CONDITIONS
The Valley at Riverside bus stop is located at the intersection of W Valley Boulevard and S Riverside Avenue in eastern Rialto. The bus stop lies approximately 0.1 miles north of Interstate 10 and is surrounded by retail and commercial uses. Currently, the bus stop only features a sign and lacks a bench and shelter.
AT A GLANCE
15
recommended crosswalks
0
missing curb ramps
6,277
linear feet of missing sidewalk
8
bicycle/pedestrian collisions
RIALTO ACTIVE TRANSPORTATION PLAN 234
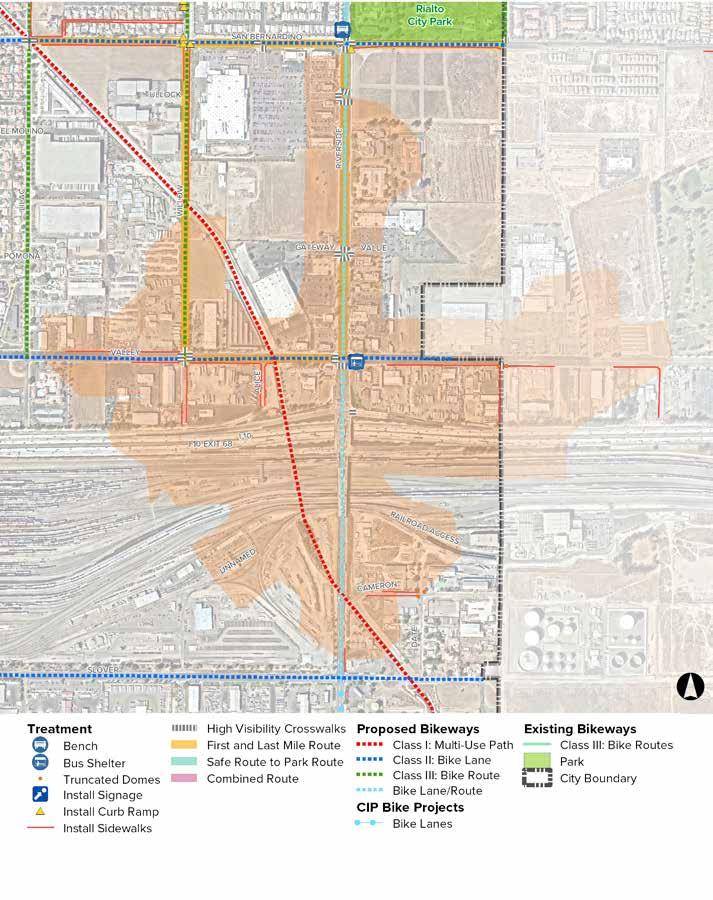
CHAPTER 5 » RECOMMENDATIONS 235
Install high visibility crosswalks. Install bus shelter and bench. 10
FIGURE 5-45: Valley at Riverside Recommended First and Last Mile Improvements
FLM PROJECT 11 SAN BERNARDINO AT BLOOMINGTON
COST ESTIMATE: $836,103
EXISTING CONDITIONS
The San Bernardino at Bloomington bus stop is located at the intersection of W San Bernardino Avenue, Bloomington Avenue, and Spruce Avenue in western Rialto. A variety of uses can be found around the bus stop, such as single-family homes, retail, warehouses, and offices. Currently, the bus stop features a sign and two benches, but lacks a shelter. AT A
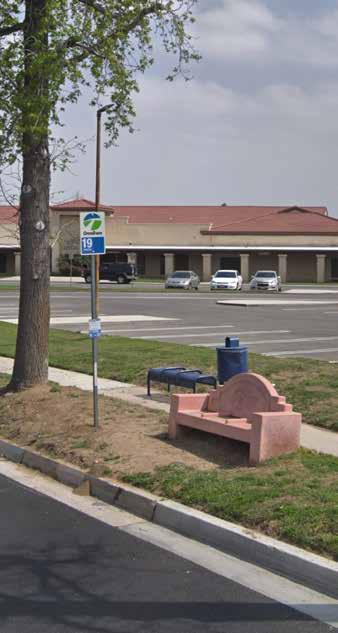
30
recommended crosswalks
0
missing curb ramps
11,204
linear feet of missing sidewalk
0
bicycle/pedestrian collisions
RIALTO ACTIVE TRANSPORTATION PLAN 236
GLANCE
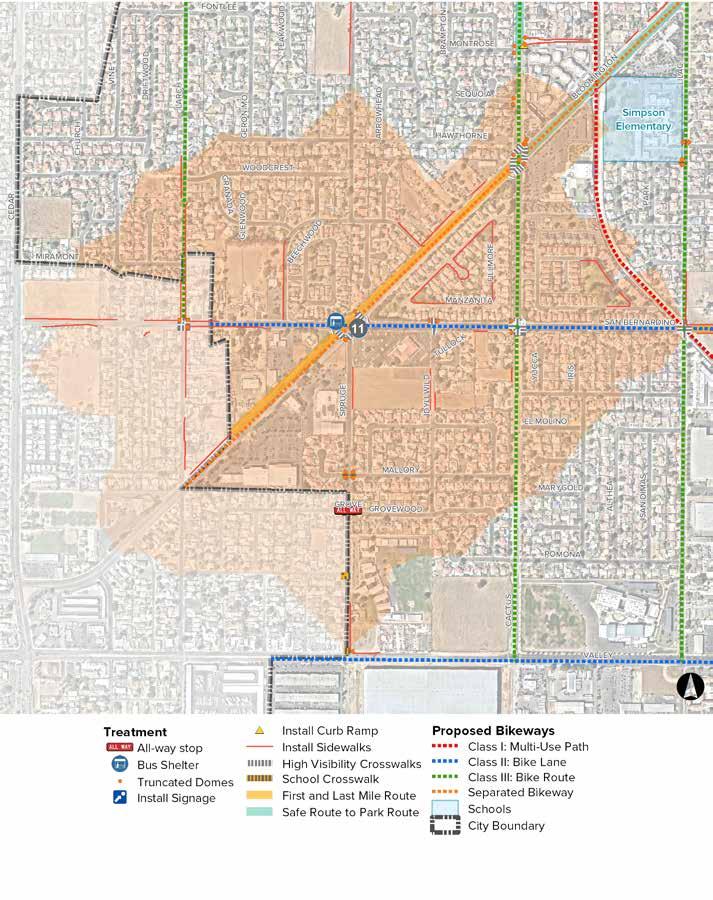
CHAPTER 5 » RECOMMENDATIONS 237
FIGURE 5-46: San Bernardino at Bloomington Recommended First and Last Mile Improvements
Install high visibility crosswalks and truncated domes.
Install high visibility crosswalks and truncated domes.
Install bus shelter.
FLM PROJECT 12 & 13 FOOTHILL
AT LINDEN AND FOOTHILL AT CEDAR
COST ESTIMATE: $450,461
EXISTING CONDITIONS
The Foothill at Linden and Foothill at Cedar bus stops have high transit ridership and are located in eastern Rialto along W Foothill Boulevard at the intersection of N Linden Avenue and N Cedar Avenue, respectively. Both bus stops are along new Omnitrans route 12 on Linden Avenue and there is also a proposed Rapid Transit stop at Cedar Avenue. The bus stops are 0.2 miles apart and they are surrounded by a mix of uses that include commercial, retail, single-family residential, apartments, and vacant land. Both of these bus stops feature a sign and bench, but lack a shelter for passengers.
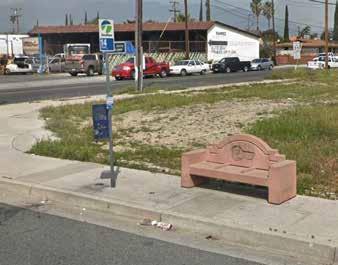
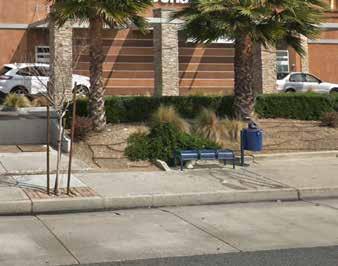
26
recommended crosswalks
3,751
linear feet of missing sidewalk
4 9
missing curb ramps bicycle/pedestrian collisions
RIALTO ACTIVE TRANSPORTATION PLAN 238
AT A GLANCE
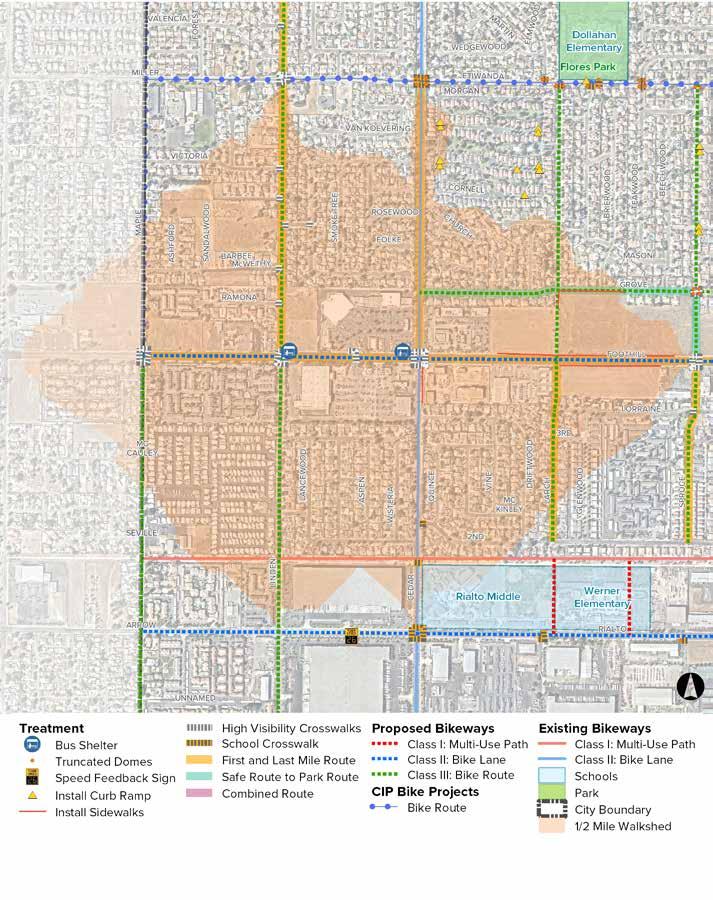
CHAPTER 5 » RECOMMENDATIONS 239
FIGURE 5-47: Foothill at Linden and Foothill at Cedar Recommended
First and Last Mile Improvements
Install high visibility crosswalks.
12 13
Install bus shelter.
PROGRAMS
This section comprises a diverse menu of programs intended to support the projects recommended in this plan. Due to a long history of routine accommodation for pedestrians (i.e. sidewalks, crosswalks, dedicated signals, etc.), programs targeting walking are relatively uncommon. Conversely, the historic lack of routine accommodation for bicyclists has fostered confusion about the role of bicycles in the overall transportation system and has necessitated an impressive diversity and breadth of bicycle-related programs. Despite a common emphasis on projects, bicycle programs remain an important element of a successful bicycle plan. The following sections offer some background on the changing “state of practice” in bicycle programming, namely the increased integration of programs and projects, culminating in a comprehensive menu of bicycle and pedestrian programs.
EVOLVING STATE OF PRACTICE IN ACTIVE TRANSPORTATION
In order to realize local goals and objectives, communities should take a multifaceted approach to advance biking and walking and support development of safe, comfortable, and connected active transportation networks.
The principles articulated through the “Six Es” developed by the League of American Bicyclists (Engineering, Education, Encouragement, Enforcement, Equity, and Evaluation) can help create successful programs. In particular, many policy, programmatic, and design elements can be used to improve equity if they are targeted to address mobility needs of low-income residents, minorities, children, people with disabilities, and older adults.
In addition, there has been a shift in implementation strategies. Physical projects represent the most visible and perhaps most tangible evidence of a great place for bicycling or walking. Programs are increasingly targeted to occur in conjunction with the construction of specific bicycle and pedestrian projects to take advantage of the opportunity that capital project implementation represents for a city to promote bicycling and walking as attractive options.
A new multi-use path, for instance, represents a great opportunity to reach out to the area’s walkers and parents of school-age children, as well as the neighborhood’s “interested, but concerned” bicyclists. These target groups will benefit most by directly linking route improvements and supportive programs. In this way, bundling bicycling and walking programs with projects represents a much higher return on investment for both.
The programs recommended for the City of Rialto are organized as a menu of initiatives, each listed under a broad category:
These categories are not definitive. They are merely intended to offer some level of organization to the many program initiatives, the majority of which fall into at least one category.
RIALTO ACTIVE TRANSPORTATION PLAN 240
Engineering Enforcement Education Equity Encouragement Evaluation
ENGINEERING
The Public Works Agency is responsible for building and maintaining all public streets in Rialto to ensure that the community is able to travel around the city efficiently. A variety of engineering tools are used to make sure that the roadways in Rialto are designed to keep bicyclists and pedestrians safe at all times. Some of these tools include street design techniques that are meant to reduce traffic congestion, decrease vehicular speeds, and enhance pedestrian and bicycle safety and comfort.
Some examples of engineering and traffic enhancements that provide a safer environment for pedestrians and bicyclists include:
» Traffic control signs
» Curb and high visibility pavement markings
» Signal timing
» Parking controls
» Traffic safety monitoring
EDUCATION
Rialto has had a number of collisions involving pedestrians and bicyclists. According to the Statewide Integrated Traffic Records System (SWITRS) bicycle and pedestrian collision dataset, there were 87 bicycle-related collisions and 154 pedestrian-related collisions in the past five years in Rialto. The city should consider carrying out public education campaigns to improve pedestrian and bicyclist safety. These education campaigns can help teach motorists, pedestrians, and bicyclists how to share the road safely.
Example of education campaigns include:
Safety Assemblies
Safety assemblies can be organized as interactive gatherings or festivals that consist of various stations throughout a school gymnasium or park. Each station can have a bicycle, pedestrian, and teen driver safety component that allows students to participate in various activities while learning the basics of “on the road” safety.
Bike Safety Workshops
A two-hour long class intended to build habits and skills, and an in-depth exploration of rights and responsibilities of bicyclists, including an “on bike” maneuvers class intended to increase confidence. Participants get a free helmet and bike lights.
Ped and Bike Traffic Safety Fairs
An obstacle course to teach pedestrians and bicyclist how to identify different street signs and use street infrastructure to increase safety. Youth and children navigate the obstacle course to win free helmets and lights.
Family Cycling Education
Family-friendly interactive training and infrastructure tour intended to increase the confidence of pedestrians and bicyclists. Participants get a free helmet and bike lights.
Safety Resource Event
Safety resource distribution events where people learn about the importance of wearing a helmet. Participants receive free helmets and bike lights and are taught about the bicycle rules of the road, as well as how to be visible and predictable when riding.
Bike and Maintenance and Ride Workshops
Bike maintenance and ride workshops can include a series of classes for youth between 12-18 years. These classes teach riders how to fix and ride a bicycle. Participants learn the rules of the road, as well as their rights and responsibilities as bicyclists. These classes can offer the opportunity for participants to receive a free bike. The City of Rialto hosts a bike rodeo which teaches youth bike safety tips, helmet check, and other valuable skills.
Motorist-Targeted Messaging
Billboards and changeable message signs can be an effective tool to inform motorists of pedestrian and bicycling safety. Such messaging can also encourage drivers to be more cognizant when sharing the road with cyclists.
CHAPTER 5 » RECOMMENDATIONS 241
Bike Rodeo
Like school pedestrian and bicycle safety rodeos, community pedestrian and bike rodeos provide participants with an interactive hands-on experience in traffic situations that involve pedestrians and bicyclists. The City of Rialto hosted a bike rodeo that took place along the Pacific Electric trail behind Charlotte N. Werner Elementary School. Bike rodeos are a great way to provide community members with an opportunity to learn and practice safe pedestrian and bicycling skills.
ENCOURAGEMENT
Vehicle usage can be decreased in part by actively encouraging residents and visitors to bike, walk, and ride transit for a variety of trips and purposes. Encouragement is all about making bicycling and walking more fun, healthy, and easy to do. In order to achieve this, the city, along with other local organizations, can organize a series of activities and events that promote alternate modes of transportation and healthier lifestyles.
National Bike Month in May
During the month of May, cities across the country organize events and campaigns to educate people about biking and to encourage them to bike more to their destinations. Activities such as Bike Week, Bike to Work, and Bike Fridays can be organized and promoted.
Cargo Bike Lending Program
While bike shares are growing in prevalence in almost all major metropolitan cities, the unique benefits of cargo bikeshares can also be utilized. Introducing a cargo bike rental program in various neighborhoods throughout Rialto can offer residents a unique mode of active transportation to carry out daily tasks such as carrying children, groceries, small furniture, and even pets.
Open Streets Events
Open streets events are increasingly popular in Southern California. They provide families and friends an opportunity to walk, bike, skate, or scooter down streets in their city free of cars.
RIALTO ACTIVE TRANSPORTATION PLAN 242
Walk to School logo
Walk Like MADD logo
National Bike Month logo
City of Rialto Bike Rodeo logo
Family Friendly Bike Rides
Fun family-friendly summer bike rides meant to encourage bike usage. This event teaches about bicycle and road safety.
Walk to School
This is a fun, educational event involving children, parents, and community leaders. This event gives students and families the opportunity to socialize and start the day off with enthusiasm while encouraging them to build connections with other members of the community.
The Rialto Safe Routes to School (SRTS) Program is an effort to promote walking and biking as a safe and healthy way to get to and from school in Rialto. SRTS is an international movement to both increase the number of students using active modes of transportation to get to and from school and improve pedestrian and bicycle travel around schools.
Ride and Walk of Lights
Annual winter evening family-friendly walk and bike ride where participants use battery lights and/or bike lights to be more visible while they walk or bike.
5K Running / Walking Events
Free 5 kilometers running and walking events that takes place in the city are an excellent way to encourage people to explore their city on foot. Postrace refreshments and healthy snacks can be provided to participants. These running events include Walk Like MADD (Mothers Against Drunk Driving), a fundraising event that helps raise awareness and funds to stop drunk and drugged driving. Inland Empire hosted a Walk Like MADD run at Charlotte N. Werner Elementary in Rialto. Programs like these can encourage communities to get more involved and promote safety and awareness.
Food-Focused Bike Rides
Bike ride events where participants get together to enjoy food while cruising through this city’s streets and neighborhoods are an innovative way of bridging bike riding with community building.
Female Focused Group Rides
Local groups can identify individuals that can host allfemme rides that promote social interactions, healthy lifestyles, and advocacy efforts in Rialto. It also provides participants with the opportunity to ride as part of a group, increasing their sense of safety.
Walking Tours
The city and other local groups can organize family-friendly themed walks. Specific destinations in Rialto can be explored as a local example of a walking tour where participants have the opportunity to explore key locations including historical buildings, parks, murals, and businesses.
ENFORCEMENT
Enforcement, especially when it targets high-risk behaviors and maximizes educational benefits, will help make road users more compliant and make both driving and bicycling behaviors more predictable.
Educate Police Department Staff Regarding Bicycle and Pedestrian Issues
If the ultimate aim is to promote bicycling as a legitimate form of transportation, all officers should receive some form of bicycle training. Appropriate training regarding pedestrian issues and solutions should be provided as well.
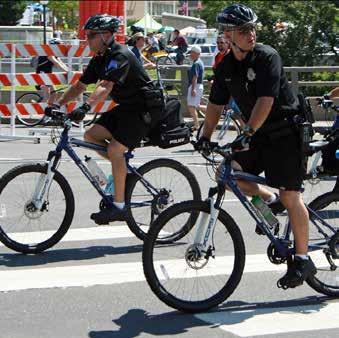
CHAPTER 5 » RECOMMENDATIONS 243
Police Bicycle Patrol
Designate a Law Enforcement Liaison Responsible for Bicycling and Walking Concerns
This liaison would perform the important function of communication between the law enforcement agency and bicyclists and pedestrians. The liaison would be in charge of the supplemental education of officers regarding bicycle and pedestrian rules, etiquette, and behavior.
Targeted Enforcement
Many law enforcement departments employ targeted enforcement to educate drivers, bicyclists, and pedestrians about applicable traffic laws and the need to share the road. These efforts are an effective way to expand mobility education, such as in the form of a brochure or tip card explaining each user’s rights and responsibilities
Implement a Bicycle Diversion Program
A bicycle diversion program allows for adult bicyclists who commit traffic violations to receive reduced fines in exchange for taking a bicycle education class. It could encourage bicycling by treating violations as opportunities to educate people, as well as to impart confidence and skills.
Institute Law Enforcement Referral Process
Communication process that encourages students and parents to notify the school and law enforcement of the occurrence of a crash or near-miss during school commute trips involving auto, bus, pedestrian or bicycle transportation.
EQUITY
The ATP prioritizes the safety of Rialto residents whose primary mode of transportation is walking, biking, skateboarding, and public transportation. Special emphasis is given to low-income neighborhoods and streets where the risk for collisions is greater. This plan intends to reduce barriers for underserved populations while mitigating potentially harmful long-term impacts, such as displacement and gentrification.
Strategies and practices to address bicycle and pedestrian inequities include:
Consider the Transportation Needs of Traditionally Underserved Populations
Recognize the importance to address the barriers that prevent trips from being safe, especially for the younger and lower income populations who cannot afford, operate, or choose to forgo vehicle ownership.
Examine Organizational Practices and Policies
Existing practices and policies may have unintended consequences when it comes to transportation equity. A systematic review of its practices should be performed to identify potential equity issues and opportunities.
Increase Staff Diversity
A recent survey has shown disparity between the sociodemographics of transportation decision-makers and the community they are meant to serve. Agencies should continually seek to increase the diversity of its staff at all levels of leadership and decision-making so that its workforce represents the community it serves.
Prioritize Projects in Light of Equity Considerations
Agencies can aim to implement improvements in areas that are disproportionally affected by health and safety burdens, acknowledging that policies and designs that improve conditions for vulnerable groups can benefit everyone in the community.
Encourage Public Involvement
Collaboration with the community is an integral part of the planning process. Individuals, especially those belonging to traditionally underserved communities, need to be empowered to participate in the transportation planning processes and have their needs heard.
EVALUATION
In order to improve programs and ensure that the bicycle and pedestrian conditions in Rialto are adequate, audits, traffic-safety data collection, analysis, and reporting are necessary. Additionally, surveys allow the city to gain input from users on existing issues and potential solutions.
RIALTO ACTIVE TRANSPORTATION PLAN 244
Some ways to evaluate and monitor programs and infrastructure include:
Create City Staff Active Transportation Coordinator Position
An active transportation evaluator position would assist the city’s current active transportation coordinator in reviewing project plans and built projects, as well as ensuring consistency and cooperation between city departments. The evaluator would also assist with completing grant applications, maintaining a prioritized list of improvements, researching appropriate funding sources, and updating cost estimates. This investment in staff is often returned since this position is usually responsible for securing state and federal funding.
Active Transportation Advisory Committee
While the city has an active Bicycle Advisory Team that provided valuable oversight for this Active Transportation Plan, many municipalities have developed bicycle and pedestrian or active transportation advisory committees to address walking along with bicycling, and some address overall mobility, including transit. This group can act as a community liaison and support city staff, volunteers, and advocate efforts to address issues concerning local bicycling and walking, as well as regularly evaluate the progress of improvements in this Active Transportation Plan. City support is imperative for creating the committee, budgeting time and resources for city staff, and for elected officials to attend and to support the committee.
Conduct Bicycle and Pedestrian Counts and Review Collision Data
Conduct regular bicyclist and pedestrian counts throughout the city to determine baseline mode share and subsequent changes. Conducting counts would allow the city to collect information on where the most bicycling and walking occurs. This assists in prioritizing and justifying projects when funding is solicited and received. Counts can also be used to study bicycling and walking trends throughout the city. Analysis that could be conducted includes:
» Changes in volumes before and after projects have been implemented
» Prioritization of local and regional projects
» Research on clean air change with increased bicycle use
Counts should be conducted at the same locations and at the same times every year. Conducting counts during different seasons within the year may be beneficial to understanding the differences in bicycle and pedestrian traffic volumes based on seasonal weather. In addition, bicycle and pedestrian counts should be collected as part of any existing traffic counts. Results should be regularly recorded for inclusion in the bicycle and pedestrian report card
The Rialto Police Department should collect and track collision data. Regular reports of traffic collisions should be presented to the advisory committee. Traffic collisions involving bicyclists and pedestrians should be regularly reviewed and analyzed to develop plans to reduce their frequency and severity. Any such plans should include Police Department involvement and should be monitored to determine their effectiveness. Results of the number of collisions should be recorded in a bicycle and pedestrian report card described in the next section.
Bicycle and Pedestrian Report Card
The city could develop a bicycle and pedestrian report card, a checklist used to measure the success of plan implementation, as well as effort made within the city. The report card could be used to identify the magnitude of accomplishments in the previous year and general trends. The report card could include, but not be limited to, keeping track of system completion, travel by bicycle or on foot (counts) and safety.
The city can use the report card to track trends, placing more value on relative than absolute gains (in system completion, mode share, and safety). For example, an upward trend in travel by bicycle or on foot would be viewed as a success, regardless of the specific increase in the number of bicyclists or walkers. Safety should be considered relative to the increase in bicyclists and walkers. Sometimes crash numbers go up simply because bicycling and walking increases, at least initially. Instead, measure crashes as a percentage of an estimated overall mode share count.
A major portion of the report card would be an evaluation of system completion. An upward trend would indicate that the city is progressing in its efforts to complete the bicycle and pedestrian net-
CHAPTER 5 » RECOMMENDATIONS 245
work identified in this document. The report card could be developed to utilize information collected as part of annual and on-going evaluations, as discussed in the previous sections. The report card is not intended to be an additional task for city staff, but rather a means of documenting and publicizing the city’s efforts related to bicycle and pedestrian planning. It can be a task of the advisory committee to review annual report cards and to suggest future plan and goal adjustments.
In addition to quantifying accomplishments related to the bicycle plan, the city should strive to quantify its efforts. These may be quantified as money spent, staff hours devoted, or other in-kind contributions. The quantified effort should be submitted as a component of the bicycle and pedestrian report card. Some cities publish their report cards online.
Update Bicycle Friendly Community Designation
Bicycle Friendly Community designation is part of a program offered by the League of American Bicyclists (LAB) intended to provide communities with guidance on becoming more bicycle friendly and to award recognition for their achievements. Like the report card described previously, Bicycle Friendly Community designation provides a standard by which the City of Rialto can measure its progress toward bicycle friendliness. It could be a function of the Bicycle Advisory Team to support city staff to compile an updated application to improve upon its current Bronze level Bicycle Friendly Community status.
Automated Count Measures
A traffic counter device with publicly available data can be deployed at certain locations, such as the Pacific Electric right-of-way or E Cactus Road, to count, classify, and/or measure the speed of active users passing along a given route. This data can help measure non-motorized travel and monitor trends of a facility or network.
HEALTH-RELATED PROGRAMS
There are a number of actions and programs that can be made available in communities to further promote healthy lifestyle choices through active transportation modes. Active transportation has many proven physical, social, and mental health benefits through increased levels of physical activ-
RIALTO ACTIVE TRANSPORTATION PLAN 246
Sample report card
Bicycle friendly community logos
ity. Opportunities for residents of Rialto to engage in physical activity and improve their well-being, include the following health programs:
Vision2BActive, San Bernardino County
The Vision2BActive campaign aims to improve health and wellness in San Bernardino County by encouraging residents to increase their physical activity and connecting them to existing recreational programs, amenities and activities in their communities. Vision2BActive invites all of San Bernardino County to participate in improving health and wellness in their community and to improve overall quality of life.
Healthy Communities, San Bernardino County Department of Public Health
A healthy community promotes a positive physical, social, and economic environment that supports the well-being of its members. It includes healthy schools, walkable communities, transportation options, parks and open space, adequate housing, and access to health care. In 2006, the Healthy Communities program was created as a central point of contact for health-related issues throughout San Bernardino County. Healthy Communities provides technical assistance to communities throughout the county, giving specific recommendations for policy and environmental strategies to improve residents’ health.
They collaborate on multiple projects throughout the region, partnering with schools, communities, and faith-based organizations, public and private agencies, and city governments. These partnerships are effective tools for improving health in local communities. Healthy Communities works in partnership with cities, towns, and community partners to improve and advance the health of all residents within San Bernardino County. Healthy Communities works to increase the skills and commitment of community leaders and stakeholders to develop and promote lasting strategies that help people make healthy choices where they live, learn, work, and play.
Fontana Walks
Fontana Walks began as a challenge to the community to be more physically active for better health. The program hosts a number of community walks, held each month. Fontana Walks will continue to
expand and includes taste tests/food demos, tips on how to include more fruits and vegetables into a daily lifestyle, as well as how to access free resources in the community.
Rialto Fitness and Aquatic Center
Rialto’s Fitness and Aquatic Center is located on the corner of Riverside Avenue and San Bernardino Avenue and offers various membership options for residents. Residents can enjoy a variety of amenities and services such as group exercise fitness classes, senior programs, and more.
Rialto Community Center
Located off North Palm Avenue, Rialto’s Community Center is home to multiple recreation and community service programs and activities developed for the enjoyment and well-being of the city’s community. The center offers classes, activities, sports, and events that provide residents with exciting opportunities to improve their overall health.
Rialto Community Center Youth Sports
The Sports Division of the Community Services Department offers a wide variety of sports for youth. Their staff and volunteer coaches are dedicated to creating supportive and challenging sports programs for any child interested in developing and improving their athletic and competitive skills. All skill levels are welcome to play. The sports programs offered include Little Tots Sports, Co-Ed Youth Basketball, and Girls Volleyball.
CHAPTER 5 » RECOMMENDATIONS 247
Vision2BActive logo
Rialto Farmers’ Market
Farmers’ markets provide a variety of benefits to communities, including rebuilding local food economies. Residents benefit by receiving access to fresh, locally produced foods and goods. Rialto Farmers’ Market takes place each Wednesday from 10am to 2pm on Palm Avenue.
Trapp Elementary Running Club
The Trapp Running Club, hosted by Trapp Elementary School, is a weekly running club for third to fifth graders that provides a positive and healthy opportunity for children to develop a physical exercise routine. Through running, the club promotes healthier lifestyle choices.
San Bernardino Family YMCA
With a focus on strengthening communities, youth development, and healthy living, the San Bernardino YMCA offers a variety of services to surrounding communities including Rialto. Several programs that the YMCA offers include group exercise classes and many youth sports and fitness programs including martial arts, dance, basketball, swim, and soccer.
Fit 4 Kids
Fit 4 Kids is a health and fitness program that is designed to help youth ages 6 to 15 years overcome obesity. The program helps with character development through positive socialization and team motivation. The program’s 12-week sessions include challenging warm-up routines, boot camp-style activities including relay races and obstacle courses, nutrition education and demonstrations, as well as a variety of games such as soccer, basketball, and volleyball.
Pacific Electric Inland Empire Trail
The Pacific Electric Inland Empire Trail is a great commuter and recreation trail in western San Bernardino valley, with expansive views and connections to community centers and parks. The trail follows the old Pacific Electric Railway, which was known for its red cars. One of its last remaining railway depots along the San Bernardino line is found in Rancho Cucamonga on Etiwanda Avenue, where the street intersects the trail. When complete, the Pacific Electric Inland Empire Trail will run 21 miles east-west between Rialto and Claremont.
Cycling Connection
Cycling Connection is a multi-level recreational bicycling club. The club hosts a variety of weekend rides throughout the Inland Empire area. The length of their rides average from 30-70 miles in distance. They offer two levels of riding groups - level one’s riding average is from 16-18mph and level two's riding average is from 13-15mph. As a club, they believe that “no rider is left behind” and regroup after rides to ensure everyone makes it back safely.
Healthy Rialto
Healthy Rialto offers healthy programs and services to the residents of Rialto. Their programs are designed to enrich and empower the lives of residents in the community. Healthy Rialto is dedicated to providing innovative and proactive solutions to everyone that is motivated to get fit, stay healthy, and pursue happiness. The Rialto City Council recognized that obesity is a serious public health threat to the health and well-being of adults, children, and families. While individual lifestyle changes are necessary, individual effort alone is not enough to fully address increasing obesity rates. Significant societal and environmental changes are needed to support individual efforts to make healthier choices. In response to this, the City of Rialto adopted the Healthy Eating Active Living resolution. The campaign aims to engage municipal leaders to champion health in their communities by adopting policy and promoting opportunities for residents and municipal employees.
RIALTO ACTIVE TRANSPORTATION PLAN 248
Healthy Rialto logo
Chapter 6 FUNDING
Potential Infrastructure Funding Sources
POTENTIAL INFRASTRUCTURE FUNDING SOURCES
Federal, state, and local government agencies invest billions of dollars every year in the nation’s transportation system. Only a fraction of that funding is used to develop policies, plans, and projects to improve conditions for bicyclists and pedestrians. Even though appropriate funds are available, they are limited and often hard to find. Desirable projects sometimes go unfunded because communities may be unaware of a fund’s existence or may apply for the wrong type of grant. In addition, there is increasing competition between municipalities for the limited available funds.
Whenever federal funds are used for bicycle and pedestrian projects, a certain level of state and/or local matching funding is generally required. State funds are often available to local governments on similar terms. Almost every implemented active transportation or complete street program and infrastructure in the United States has had more than one funding source and it often takes a good deal of coordination to pull the various sources together.
According to the publication by the Federal Highway Administration (FHWA), An Analysis of Current Funding Mechanisms for Bicycle and Pedestrian Programs at the Federal, State and Local Levels, where successful local bicycle infrastructure programs exist, there is usually an active transportation coordinator with extensive understanding of funding sources, such as Caltrans. City staff are often
ditions for bicyclists and pedestrians within their jurisdictions. Some of the following information on federal and state funding sources was derived from the previously mentioned FHWA publication.
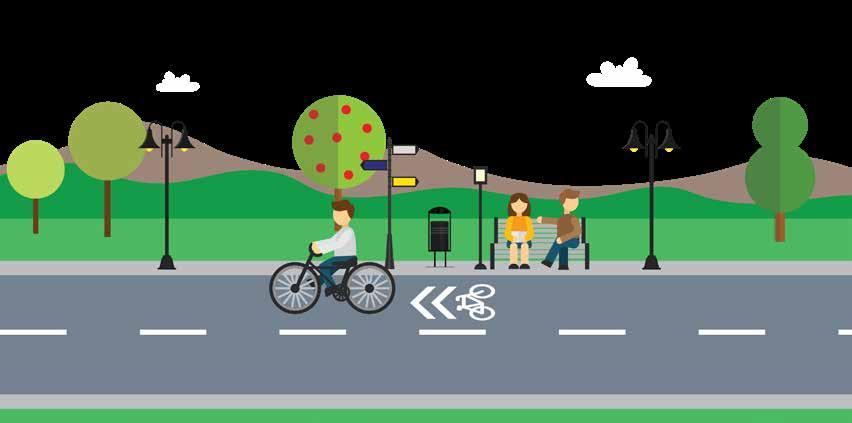
Rialto should continue to pursue state level grants through programs such as Caltrans’ Active Transportation Planning (ATP) and Sustainable Transportation Planning grants, the Strategic Growth Council’s Sustainable Community Planning Grants, Urban Greening Grants and through the Highway Safety Improvement Program (HSIP). Projects that are not awarded funding through the Caltrans ATP cycles are sent to the Southern California Association of Governments (SCAG), the local MPO, for consideration for funding through their programs. It will be important to coordinate efforts with adjacent jurisdictions on projects that affect and benefit both cities. Coordination and joint efforts also strengthen an application due to combined benefits for multiple jurisdictions.
Table 6-1 through 6-3 identify potential federal, state, and local funding opportunities that may be used from design to maintenance phases of projects. Due to trends in Low Impact Development (LID) and stormwater retention street designs, funding sources for these improvements not only increase the chances for first and last mile improvements, but can also be incorporated into streetscape and development projects.
RIALTO ACTIVE TRANSPORTATION PLAN
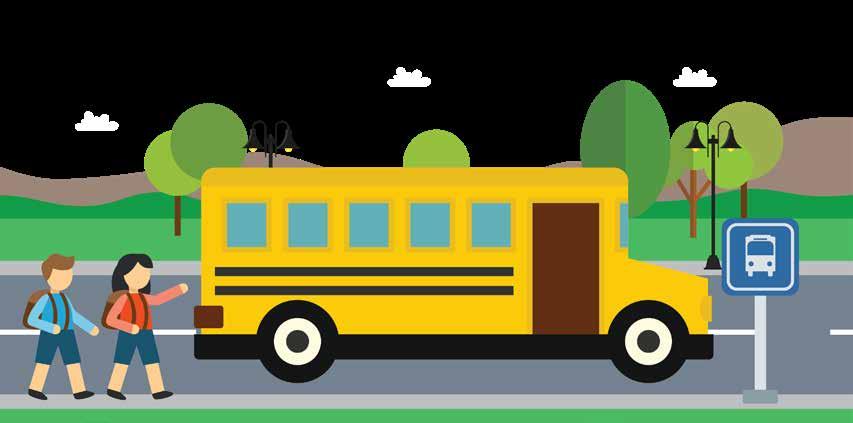
CHAPTER 6 » FUNDING
22 26 48 Federal State Local 251
Funding Origin
6-1: Federal Funding Sources
RIALTO ACTIVE TRANSPORTATION PLAN 252 FUNDING SOURCE FUNDING ORIGIN FUNDING CYCLE CIP DEVELOPMENT MAINTENANCE AND OPERATION IMPLEMENTATION Land and Water Conservation Fund (LCWF) U.S. National Park Service/California Department of Parks and Recreation DecemberJanuary • Urban Community Forestry Program U.S. National Park Service SeptemberNovember • Surface Transportation Program (STP) Federal Highway Administration (FHWA)/ Caltrans June • • Highway Safety Improvement Program (HSIP) Unavailable • • Transportation Alternatives Program (TAP) Federal Highway Administration (FHWA) Annual • • Recreational Trails Program Federal Highway Administration (FHWA)/ Regional agency may also contribute Annual • • EPA Brownfields Clean Up and Assessments U.S. Environmental Protection Agency NovemberJanuary • • Sustainable Communities Planning Grant and Incentive Program U.S. Department of Housing and Urban Development (HUD) Unavailable Urban Revitalization and Livable Communities Act Due in June • Community Development Block Grants Ongoing • ACHIEVE Centers for Disease Control and Prevention (CDC) Unavailable Urban and Community Forest Program Department of Agriculture, Forest Service Due in November • • Community Forest and Open Space Conservation Unavailable • • Choice Neighborhoods Implementation Grants Department of Housing and Urban Development, Office of Public and Indian Housing Unavailable • • Safe Routes to School, Mini-grants National Center for Safe Routes to School and Caltrans Unavailable • • Safe Routes to Parks, Activating Communities Program Unavailable • • Transit and Intercity Rail Capital Program (TIRCP) Due in November • • TABLE
CHAPTER 6 » FUNDING 253 FIRST AND LAST MILE URBAN FORESTRY BACK TO NATURE LOW IMPACT DEVELOPMENT CULTURE AND HISTORY ART HEALTH • • • • • • • • • • • • • • • • • • • • • • • • • • • • • • • • • • • • • • • • • •
TABLE 6-1: Federal Funding Sources (Cont.)
TABLE 6-2: State Funding Sources
RIALTO ACTIVE TRANSPORTATION PLAN 254
SOURCE FUNDING ORIGIN FUNDING CYCLE CIP DEVELOPMENT MAINTENANCE AND OPERATION IMPLEMENTATION Metropolitan and Statewide and Nonmetropolitan Transportation Planning Federal Transit Administration (FTA) Unavailable • • Urbanized Area Formula Grants Unavailable • • Bus and Bus Facilities Program Grants March • Enhanced Mobility of Seniors and Individuals with Disabilities Unavailable • • Formula Grants for Rural Area Unavailable • • TOD Planning Pilot Grants SeptemberNovember • •
FUNDING
SOURCE FUNDING ORIGIN FUNDING CYCLE CIP DEVELOPMENT MAINTENANCE AND OPERATION IMPLEMENTATION Land and Water Conservation Fund (LCWF) California Department of Parks and Recreation (DPR) Annual • Parks and Water Bond Act of 2018 (Prop 68) Unavailable • • Statewide Park Program Prop 84 Round 2 Unavailable • • Recreational Trails Program Due in November • • • Proposition 117 - Habitat Conservation Unavailable • • Nature Education Facilities Unavailable • • Watershed Program Unavailable • • Stormwater Flood Management Prop. 1E Unavailable • • Roberti-Z’Berg-Harris (RZH) Grant ProgramProp 40 Unavailable • •
FUNDING
FIRST
BACK
FIRST
BACK
CHAPTER 6 » FUNDING 255
IMPACT DEVELOPMENT CULTURE AND HISTORY ART HEALTH • • • • • • • • •
AND LAST MILE URBAN FORESTRY
TO NATURE LOW
CULTURE AND HISTORY ART HEALTH • • • • • • • • • • • • • • • • • • • • • • • • • • •
AND LAST MILE URBAN FORESTRY
TO NATURE LOW IMPACT DEVELOPMENT
TABLE 6-2: State Funding Sources (Cont.)
RIALTO ACTIVE TRANSPORTATION PLAN 256
FUNDING SOURCE FUNDING ORIGIN FUNDING CYCLE CIP DEVELOPMENT MAINTENANCE AND OPERATION IMPLEMENTATION Community Based Transportation Planning, Environmental Justice and Transit Planning California Department of Transportation (Caltrans) Annually • Active Transportation Planning Grants (ATP) March - June • • Transportation Development Act (TDA) Article 3 (SB 821) Annually • • Sustainable Transportation Planning Grants Annually • • Regional Improvement Program Every 2 years • Safe Routes to School Programs (SR2S) April • Traffic Safety Grants California Office of Traffic Safety Due in January • • Local Partnership Program - Competitive and Formulaic California Transportation Commission (SB 1 funds) March - June • • Non-point Source Pollution, Watershed Plans, Water Conservation (Props 13, 40, 50 and 84) State Water Resources Control Board Unavailable • • Sustainable Communities Planning, Regional SB 375 Strategic Growth Council/Department of Conservation Unavailable • Environmental Enhancement and Mitigation (EEMP) California Natural Resources Agency and Caltrans Unavailable • California River Parkways and Urban Streams Restoration Grant California Natural Resources Agency/ Department of Water Resources October • • Strategic Growth Council Urban Greening Program California Natural Resources Agency Unavailable • • California Cap and Trade Program Cal EPA, Air Resources Board Unavailable • • Urban Forestry Program (Leafing Out, Leading Edge and Green Trees Grant) California Department of Forestry and Fire Protection (CAL FIRE) Unavailable • •
CHAPTER 6 » FUNDING 257 FIRST AND LAST MILE URBAN FORESTRY BACK TO NATURE LOW IMPACT DEVELOPMENT CULTURE AND HISTORY ART HEALTH • • • • • • • • • • • • • • • • • • • • • • • • • • • • • • • • • • • • • •
TABLE 6-3: Local Funding Sources
RIALTO ACTIVE TRANSPORTATION PLAN 258 FUNDING SOURCE FUNDING ORIGIN FUNDING CYCLE CIP DEVELOPMENT MAINTENANCE AND OPERATION IMPLEMENTATION Special Habitat Conservation Programs Regional MPOs/Local Cities Unavailable • Special Parks and Recreation Bond Revenues Unavailable • • • Special Transportation Bonds and Sales Tax Incentives Unavailable • • • Advertising Sales/Naming Rights Local Jurisdictions Annual Budget • • Community Facilities District (CFD) • • • Infrastructure Financing District (IFD) Facilities Benefit Assessment District (BFA) Easement Agreements/ Revenues • • • Equipment Rental Fees • • Facility Use Permits Fees • • Fees and Charges/ Recreation Service Fees • • Food and Beverage Tax • • General Fund • • • General Obligation Bonds Intergovernmental Agreements Lease Revenues • • Mello Roos Districts • • • Residential Park Improvement Fees • • Park Impact Fees • • Traffic Impact Fees • • • In-Lieu Fees • • Pouring Rights Agreements • Private Development Agreements • • •
CHAPTER 6 » FUNDING 259 FIRST AND LAST MILE URBAN FORESTRY BACK TO NATURE LOW IMPACT DEVELOPMENT CULTURE AND HISTORY ART HEALTH • • • • • • • • • • • • • • • • • • • • • • • • • • • • • • • • • • • • • • • • • • • • • • • • • • • • • • • • • • • • • • • • • • • • • • • • • • • • • • • • • • • • • • • •
TABLE 6-3: Local Funding Sources (Cont.)
RIALTO ACTIVE TRANSPORTATION PLAN 260 FUNDING SOURCE FUNDING ORIGIN FUNDING CYCLE CIP DEVELOPMENT MAINTENANCE AND OPERATION IMPLEMENTATION Surplus Real Estate Sale Revenues Local Jurisdictions Annual Budget • Revenue Bond Revenues • • Sales Tax Revenues • • • Transient Occupancy Tax Revenues • • • Wastewater Fund Reserves • Utility Taxes • • Business Improvement Districts (BID) Non-profits, Business Organizations or City Unavailable • • Maintenance Assessment Districts (MAD) Unavailable • • Property Based Improvement Districts (PBID) Landscape Maintenance District (LMD) Unavailable • • Various Sports Field Grants Various Agencies, Foundations and Corporations Unavailable • • • Community Health Initiatives Kaiser Permanente Unavailable • • America’s Historical Planning Grants National Endowment for Humanities Unavailable • • Corporate Sponsorships Private Corporations Unavailable • • • Private Sector Partnerships Unavailable Non-Profit Partnerships Non-Profit Corporations Unavailable • • • Foundation Grants Private Foundations Unavailable • • • Private Donations Private Individuals Unavailable • • • Irrevocable Remainder Trusts Unavailable • • • Targeted Fund-raising Activities Local Jurisdictions Unavailable • • • Active Living by Design Robert Wood Johnson Foundation Unavailable • Cultivating Healthy Communities Grant Program Aetna Foundation Unavailable • Obesity Prevention Regional Grant Program Unavailable •
CHAPTER 6 » FUNDING 261 FIRST AND LAST MILE URBAN FORESTRY BACK TO NATURE LOW IMPACT DEVELOPMENT CULTURE AND HISTORY ART HEALTH • • • • • • • • • • • • • • • • • • • • • • • • • • • • • • • • • • • • • • • • • • • • • • • • • • • • • • • • • • • • • • • • • • • • • • • • • • • • • •
PeopleForBikes
RIALTO ACTIVE TRANSPORTATION PLAN 262
CYCLE CIP DEVELOPMENT
AND OPERATION IMPLEMENTATION
FUNDING SOURCE FUNDING ORIGIN FUNDING
MAINTENANCE
California Wellness
Unavailable •
Grant for Making a Healthier California
Foundation
Community Grant Program PeopleForBikes/Partners Twice a year
Grant
U.S. Department of Agriculture (USDA) Unavailable • • •
Community Facilities Direct Loan and
Program
CHAPTER 6 » FUNDING 263
LAST MILE URBAN
BACK TO NATURE LOW IMPACT DEVELOPMENT CULTURE AND HISTORY ART HEALTH • • • • •
FIRST AND
FORESTRY
Page intentionally left blank
RIALTO ACTIVE TRANSPORTATION PLAN 264
