2019
Active Transportation Plan City of Thousand Oaks June


City of Thousand Oaks

Kathy Naoum, AICP, Transportation Planner, Project Manager
Mary Anne Van Zuyle, GISP, GIS Specialist
KTUA

John Holloway, Senior Principal, Project Manager
Joe Punsalan, Associate Principal
Juan Alberto Bonilla, Senior Planner
Silvia Fang, Planner/GIS Analyst
LLG
KC Yellapu, Associate Principal Engineer
Erika Carino, Transportation Engineer
Southern California Association of Governments (SCAG)
Caitlin Sims

This Active Transportation Plan (ATP) was developed to provide Thousand Oaks with planning guidance for non-motorized travel infrastructure improvements that make multimodal transportation safer and more enjoyable. Additionally, this ATP seeks to educate and to promote active transportation to increase bicycling and walking throughout the city as a way to reduce vehicle miles traveled (VMT) and greenhouse gas (GHG) emissions. This ATP was created with input from community, stakeholders, and City staff as a tool to facilitate future grant efforts and public-private partnerships. Facility inventory, document research, field visits, and extensive GIS analysis were conducted as part of this plan’s preparation.
Numerous environmental, health, and economic benefits are attributable to bicycling and walking, especially as substitutes for travel by motor vehicle. This section summarizes these benefits, some from research by the Pedestrian and Bicycle Information Center (PBIC).
The ATP was funded through SCAG’s Sustainability Planning Grant, and it will serve as a guide for development of multimodal projects that best meet the needs of the community.
The following goals are supported by the ATP:
1. Develop an active transportation friendly environment.
2. Identify an integrated network of walkways and bikeways to connect neighborhoods to destinations and activity centers.
3. Encourage development of local plans.
4. Provide a “roadmap” for education and promotion of active transportation.
Increased bicycling and walking reduces fossil fuel emissions. In California, 40 percent of carbon dioxide (CO2) emissions are produced by the transportation sector. While CO2 is not the most harmful greenhouse gas (GHG), it is the most abundant. Even after accounting for the global warming potentials of other greenhouse gases (comparing them in terms of CO2), 95 to 99 percent of vehicle emissions are CO2. The Environmental Protection Agency (EPA) found the average vehicle emits 0.95 pounds of CO2 per mile. Therefore, almost a pound of CO2 emissions could be avoided each day for each mile, each way of an individual’s commute that was switched from driving to an active transportation mode like bicycling or walking.
15 lbs
A four-mile walking trip keeps about 15 pounds of pollutants out of the air we breathe
Despite dramatic strides in recent decades through regulations and technological improvements, vehicle emissions still pose a significant threat to human health. Vehicle-generated air pollution contains harmful greenhouse gas emissions including carbon dioxide, carbon monoxide, methane, nitrous oxide, and volatile organic compounds. These pollutants and irritants can cause asthma, bronchitis, pneumonia, and decreased resistance to respiratory infections. Taking steps to reduce these emissions is particularly important in the United States, which leads the world in petroleum consumption. The conversion of driving to bicycling or walking offers a great opportunity to reduce emissions and improve public health.
In addition to the universal public health benefit, such as improved air quality, bicycling and walking has the potential to positively impact personal health. A significant percentage of Americans are overweight or obese and projections indicate 42 percent of the population will be obese by 2030. To combat this trend and prevent a variety of diseases and their associated societal costs, the Center for Disease Control (CDC) suggests a minimum of 30 minutes of moderate intensity physical activity five days per week. Not only does bicycling and brisk walking qualify as “moderate intensity activities,” they can also be seamlessly integrated into daily routine, especially if chosen for utilitarian purposes like commuting or running errands.
Other health benefits associated with moderate activity like bicycling or walking include improved strength and stamina through better heart and lung function. Regular exercise also reduces the risk of high blood pressure, heart attacks, and strokes. In addition to heart disease, regular exercise can help to prevent other health problems such as non-insulin dependent diabetes, osteoarthritis, and osteoporosis. Lastly, exercise has been shown to improve mental health by relieving depression, anxiety, and stress.
Bicycling infrastructure and programs has increasingly been shown to deliver economic benefit to both individuals and society at large. The benefits of bicycling may, in fact, outweigh its costs. Bicycling, and utilitarian bicycling in particular, offers obvious cost savings to individuals. Beyond the upfront cost of operating a vehicle are additional maintenance, insurance, and often parking expenses. According to the American Automobile Association, the annual cost of owning a car and driving 15,000 miles a year is now over $9,000.
During the first year of bicycling to work, active commuters lose an average of 13 lbs
Converting even a fraction of automobile trips to bicycling or walking trips can generate transportation-related savings, including reduced vehicle traffic congestion. Increased bicycling and walking also translates to health-related savings, for both individuals and taxpayers, in the form of less need for preventative care. More bicycling and walking has also been tied to increases in commercial and residential property values and retail sales. Shoppers who reach their destination by bicycle have been shown to make smaller purchases, but shop more often and to spend more money overall. Shoppers who arrive by bicycle or on foot, because of their more limited range, are also more likely to support local businesses, and do not require the space for parking a motor vehicle compared to those who drive.
Perhaps more compelling than reducing GHG emissions or combating the obesity epidemic is the benefits bicycling has to offer in terms of quality of life. Bicycling, and especially utilitarian bicycling, is increasingly seen as a fun, low-cost, healthy, and sustainable way of getting around.
In addition to the extensive environmental, health, and economic benefits gained from enhanced active transportation infrastructure, there is also the potential to alleviate issues for disadvantaged populations that are disproportionately impacted by rising transportation costs. According to the Federal Highway Administration’s (FHWA) 2009 National Household Travel Survey, individuals living in poverty are more likely to lack access to a personal vehicle and also have the highest rates of bicycling and walking trips as compared to higher income groups. The survey also reported that poor, racial, and ethnic minorities and the elderly have much lower mobility rates than the general population. These trends highlight the importance of providing safe and comprehensive transportation options for community members who do not have regular access to a personal vehicle.
$680
$1,810
$8,776
The City of Thousand Oaks is located in Ventura County, approximately 40 miles northwest of Los Angeles, and about 30 miles east of the City of Ventura. Nestled against the Santa Monica Mountains, Thousand Oaks lies 12 miles inland from the Pacific Ocean and is bordered by the City of Simi Valley to the north, the City of Camarillo to the west, the City of Westlake Village to the southeast, and by the unincorporated community of Oak Park to the east. While the main access to the city are US Route 101 and CA Highway 23, there are other options that include local and regional transit, local roads, and bikeways.
According to the 2016 census estimate, Thousand Oaks had a population of 128,623, making it the second-largest city in Ventura County. The city has a area of 55.33 square miles with a population density of 2,325 people per square mile. The city prides itself with having over 15,000 acres of natural publicly owned open space with 150 miles of recreational trail within its limits. Thousand Oaks has been designated one of the safest cities in the United States and one of the best places to raise children. The city is also known for its schools, parks, retail opportunities, and for having one of the country’s largest auto malls.

This ATP will guide the development of active transformation infrastructure, programs, and policies for Thousand Oaks. The following goals guided the planning process to ensure a successful product that everyone can support and work towards implementing:
The ATP identifies barriers, both actual and perceived, to bicycling and walking, and provides opportunities through community outreach and improvement projects to remove the barriers and improve the network.
Implementing the ATP will improve community health as access to more active means of transportation (bicycling and walking) are developed. The public health will benefit from increased exercise, collision reduction, and reduction in GHG emissions through less vehicle miles traveled (VMT) as alternative methods are used and level of physical activity increases.
The disadvantaged community will benefit from a plan, and subsequent projects, that provide social equity. Many low-income residents rely on alternative transportation for jobs, access to medical facilities, and food options.
There will be an increased sense of pride in the community as a result of the community engagement, social interaction, and participating in achieving a common goal.
This ATP aims to be the vehicle for the city’s commitment to become a greener, more pedestrian and bicycle friendly community as part of a comprehensive sustainability strategy by reducing the need for motor vehicle travel and associated emissions.
The ATP incorporates regional and local planning efforts that are directly related to walking, biking, and trails. These efforts range from long-range regional planning to neighborhood-specific plans. The following information summarizes the planning documents that were evaluated as part of ATP development.
The Thousand Oaks General Plan is the primary citywide comprehensive plan that guides future growth. The General Plan contains goals and objectives to guide decisions and preserve the quality of life within the City of Thousand Oaks. The Circulation and Open Space Elements contain goals and objectives that contribute to the success of this ATP.
The purpose of the Thousand Oaks Bicycle Facilities Master Plan is to develop a comprehensive bikeway system that effectively connects all residential neighborhoods with major activity centers within the city, as well as to other regional bicycle systems. The plan also provides recommendations for education and information programs in order to encourage bicycling as an alternate mode of transpiration.
The Ventura Countywide Bicycle Master Plan was developed to improve bicycling transportation and recreation in Ventura County. This plan provides strategies and actions meant to enhance bicycling in the county, while maximizing funding sources, improving safety, expanding the network and support facilities, and enhancing residents’ quality of life.

The purpose of the ADA Transition Plan is to identify physical barriers on the streets and other pedestrian routes within the public right-of-way and estimate their mitigation costs. The plan also provides a detailed outline of the methods to be utilized to remove these barriers, which allows the city to schedule and implement the required improvements.
Thousand Oaks developed a Safe Routes to School program to create safer and enjoyable options for walking and bicycling to and from school within the city. This SRTS program contains both infrastructure and program-based recommendations that the city, local organizations, the school district, and other community members can use to improve the school’s surrounding environment. The recommendations in the SRTS program will help guide other kinds of improvements citywide in the ATP.
The Thousand Oaks Forestry Master Plan intends to strengthen the connection between the natural environment and residents in hopes of creating a more resilient city capable of withstanding the impacts of climate change and urban development. The plan provides guidance for sustaining the vegetation growing within the urban environment. This includes design guide-

lines for creating a canopy that would bring major streets and arterials down to a human scale and provide shade for people on sidewalks and in bicycle lanes.
The Thousand Oaks Area Plan serves as the land use plan for approximately 3,767 acres of unincorporated land that are adjacent to or within the City of Thousand Oaks. The plan provides specific goals and policies to guide development in these areas, including recreation, transportation, and circulation. The area plan calls for the development of safe pedestrian and bicycle facilities throughout the unincorporated areas around Thousand Oaks, which may help guide other kinds of improvements in and around the city in the ATP.
The Ventura County Non-Coastal Zoning Ordinance contains comprehensive zoning regulations for the unincorporated areas located within and around the City of Thousand Oaks. These ordinances intend to promote and protect public health, safety, and general welfare, as well as the environment and economic and social development. The zoning ordinance promotes the reduction of motor vehicle trips by providing more transit stops, bicycle and pedestrian facilities, improved wayfinding, and other amenities.

The Ventura County Regional Bikeway Wayfinding
serves as a toolkit for the development of a regional bicycle wayfinding network that helps provide seamless navigation along the bikeways of Ventura County. The purpose of the plan is to create a convenient and safe environment for those who bicycle in the county, while developing a consistent wayfinding design for regional bicycle routes. To achieve this, the plan identifies routes in the county that prioritize connections between the various communities. The information and recommendations found in the Wayfinding Plan may play an important role in prioritizing bicycle routes and identifying potential locations for infrastructure improvements throughout Thousand Oaks.
While pedestrians have long benefited from “routine accommodation,” with amenities like sidewalks, curb ramps, crosswalks, dedicated signals, etc., it is only more recently that the state of practice for bicycle facilities in the United States has undergone a similar transformation. Much of this may be attributed to bicycling’s changing role in the overall transportation system. Long viewed as an “alternative” mode, it is increasingly considered a legitimate transportation mode and one that should be actively promoted as a means of achieving environmental, social and economic goals.
Recent research indicates that, beyond connectivity and convenience, “low-stress” bicycle facilities are essential to the increased acceptance and practice of daily bicycling. Facility types and specific design interventions intended to encourage ridership among the large “interested, but concerned” demographic tend to be those that provide separation from high volume and high speed vehicular traffic.
Just as the state of practice of bicycle facilities has evolved, so has the technical guidance. While bikeway design guidance in California has traditionally come from the State, especially Caltrans and the California Manual on Uniform Traffic Control Devices (CA MUTCD), cities are increasingly turning to national organizations for guidance on best practices. Primary organizations include the American Association of State Highway and Transportation Officials (AASHTO), the National Association of City Transportation Officials (NACTO) and the Federal Highway Administration (FHWA).
Fortunately for California cities, there is increased flexibility in design guidance offered by both Caltrans and the FHWA. In 2014, Caltrans officially endorsed the NACTO Urban Street Design Guide and Urban Bikeway Design Guide as valuable toolkits for designing and constructing safe, attractive local streets. California cities may also apply for experimental designation from the FHWA for projects not in conformance with the CA MUTCD.
The guidance provided by these manuals support the creation of more Complete Streets. The guidance is also supported by several pieces of important legislation. The following section provides a review of the state of practice for bicycle facilities, drawing on the AASHTO and NACTO guides. It also includes a discussion on Complete Streets/Routine Accommodation, as well as summaries of relevant legislation at the local, regional, State, and national levels.
This memorandum expresses the Federal Highway Administration’s (FHWA) support for taking a flexible approach to bicycle and pedestrian facility design. The AASHTO bicycle and pedestrian design guides are the primary national resources for planning, designing, and operating bicycle and pedestrian facilities. The NACTO Urban Bikeway Design Guide and the Institute of Transportation Engineers (ITE) Designing Urban Walkable Thoroughfares guide builds upon the flexibilities provided in the AASHTO guides, which can help communities plan and design safe and convenient facilities for pedestrians and cyclists. FHWA supports the use of these resources to further develop non-motorized transportation networks, particularly in urban areas.

The NACTO guides represent the industry standard for innovative bicycle and streetscape facilities and treatments in the United States. In 2014, Caltrans officially endorsed the NACTO Urban Street Design Guide and Urban Bikeway Design Guide as valuable toolkits for designing and constructing safe, attractive local streets. At the time, Caltrans was only the third State Department of Transportation to officially endorse the Guides.
It is important to note that virtually all of the Urban Bikeway Design Guide design treatments (with two exceptions) are permitted under the Federal MUTCD. The NACTO Urban Street Design Guide is the more generalized of the two guides and organized into six sections. Each section is further subdivided, depending on topic. The NACTO Urban Bikeway Design Guide is also organized into six sections, but its information is bicycle-specific. For each section, it offers three levels of guidance: Required Features, Recommended Features, and Optional Features. The following section introduces the broad facility types included in the NACTO Urban Bikeway Design Guide.
As transit gains a more prominent role in cities, more people are using buses, streetcars, and light rail than ever before. As a result, street design is shifting to give transit the space it deserves. The NACTO Transit Street Design Guides provide design guidance for the development of transit facilities on streets, as well as for prioritizing transit, improving its service quality, and to support other related goals.
The majority of design elements included in this guide are consistent with MUTCD standards, including signage, markings, and signal elements that have received interim approval. These guidelines were developed using other design guidance as a basis, along with city case studies, best practices, research and evaluation of existing designs, and professional consensus.

The NACTO Urban Street Stormwater Guide provides guidelines on how to create resilient cities that are better prepared for climate change, while creating public spaces that deliver social and economic value to these places. This guide focuses on green infrastructure within urban streets, including the design and engineering of stormwater management practices that support and improve mobility. It also intends to reduce the impacts of runoff and human activity on natural ecological processes.

One of the main goals of this guide is to encourage interdepartmental partnerships around sustainable infrastructure, which includes communicating the benefits of such projects. However, this guide does not address stormwater management strategies on private property, nor does it address drainage and infiltration around controlled-access highways.
An adopted Active Transportation Plan provides a roadmap to support planning and implementing a bicycle and pedestrian network, can help to integrate bicycle and pedestrian planning into broader planning efforts, and is required for State funding of bikeway and pedestrian projects.


For many cities, however, a bicycle and pedestrian plan alone is not enough to ensure the implementation of the plan’s goals and projects. A hurdle many cities face is that their various plans are not well integrated. Despite many cities’ attempts to support a “Complete Streets approach,” entrenched and often contradictory policies can make implementation difficult. For instance, a ATP, an ADA transition plan, and a specific plan may address the same area, but ignore each other’s recommendations. One plan may identify a certain project, but it may not be implementable due to prevailing policies and practices that prioritize vehicular flow and parking over other modes.
An adopted Complete Streets policy has the potential to address these shortcomings through the designation of some important corridors as Complete Streets, accommodating all roadway users, and other corridors as priority corridors for a certain modes. A system that assigns priority for different modes to specific corridors, offset from one another, is referred to as a layered network.
Efforts to implement Complete Streets policy often highlight other significant obstacles, chief among them documents defining “significant impacts” to traffic, acceptable vehicular “Level of Service” thresholds and parking requirements. Drafting a Complete Streets policy often means identifying roadblocks like these and ultimately mandating increased flexibility to allow for the creation of a more balanced transportation system. In the case of an ATP, the network identified could become the bicycle and pedestrian layers. Identification in such a plan, reiteration within a Complete Streets policy framework, and exemption from traditional traffic analyses can make implementation more likely and much more affordable.
Legislative support for Complete Streets can be found at the State level (AB-1358) and is being developed at the national level (HR-2468). As explained in further detail in the following section on applicable legislation, AB-1358 requires cities and counties to incorporate Complete Streets in their general plan updates and directs the State Office of Planning Research
(OPR) to include Complete Streets principles in its update of guidelines for general plan circulation elements. Examples of best practices in Complete Streets Policies from around the United States can be found at: http://www.smartgrowthamerica.org/complete-streets-2013-analysis.
Several pieces of legislation support increased bicycling and walking in the State of California. Much of the legislation addresses greenhouse gas (GHG) reduction and employs bicycling and walking as means to achieve reduction targets. Other legislation highlights the intrinsic worth of bicycling and walking and treats the safe and convenient accommodation of bicyclists and walkers as a matter of equity. The most relevant legislation concerning bicycle and pedestrian policy, planning, infrastructure, and programs are described in the following sections.
AB-32 calls for the reduction of greenhouse gas emissions and codifies a 2020 emissions reduction goal. This act also directs the California Air Resources Board to develop specific early actions to reduce greenhouse gases while also preparing a scoping plan to identify how best to reach the 2020 limit.
This bill seeks to reduce vehicle miles traveled (VMT) through land use and planning incentives. Key provisions require the larger regional transportation planning agencies to develop more sophisticated transportation planning models, and to use them for the purpose of creating “preferred growth scenarios” in their regional plans that reduce greenhouse gas emissions. The bill also provides incentives for local governments to incorporate these preferred growth scenarios into the transportation elements of their general land use plans.
AB-1358 requires the legislative body of a city or county, upon revision of the circulation element of their general plan, to identify how the jurisdiction will provide for the routine accommodation of all users of the roadway including drivers, pedestrians, cyclists, individuals with disabilities, seniors, and public transit users. The bill also directs the OPR to amend guidelines for general plan circulation element development so that the building and operation of local transportation facilities safely and conveniently accommodates everyone, regardless of their travel mode.
This bill defines a traffic control device as a traffic-actuated signal that displays
one or more of its indications in response to the presence of traffic detected by mechanical, visual, electrical, or other means. Upon the first placement or replacement of a traffic-actuated signal, the signal would have to be installed and maintained, to the extent feasible and in conformance with professional engineering practices, so as to detect lawful bicycle or motorcycle traffic on the roadway. Caltrans has adopted standards for implementing the legislation.
This statute, widely referred to as the “Three Foot Passing Law,” requires drivers to provide at least three feet of clearance when passing bicyclists. If traffic or roadway conditions prevent drivers from giving bicyclists three feet of clearance, they must “slow to a speed that is reasonable and prudent” and wait until they reach a point where passing can occur without endangering the bicyclists. Violations are punishable by a $35 base fine, but drivers who collide with bicyclists and injure them in violation of the law are subject to a $220 fine.

California Bicycle Coalition Three Feet
Passing for Safety Education Logo
Just as important as the aforementioned pieces of legislation that support increases in bicycling and walking infrastructure and accommodation is one that promises to remove a longstanding roadblock to them. That roadblock is vehicular Level of Service (LOS) and the legislation with the potential to remove it is SB-743.
For decades, vehicular congestion has been interpreted as an environmental impact and has often stymied on-street bicycle projects, in particular. Projections of degraded Level of Service have, at a minimum, driven up project costs and, at a maximum, precluded projects altogether. SB-743 could completely remove LOS as a measure of vehicle traffic congestion that must be used to analyze environmental impacts under the California Environmental Quality Act (CEQA).
This is extremely important because adequately accommodating bicyclists, particularly in built-out environments, often requires reallocation of right-of-way and the potential for increased vehicular congestion. The reframing of Level of Service as a matter of driver inconvenience, rather than an environmental impact, allows planners to assess the true impacts of transportation projects and will help support bicycling projects that improve mobility for all roadway users.


Based on Public Resources Code Section 15262 (Feasibility and Planning Studies) guidance, planning documents such as this ATP are exempt from CEQA analysis since they are planning and conceptual recommendations:
“A project involving only feasibility or planning studies for possible future actions which the agency, board, or commission has not approved, adopted, or funded does not require the preparation of an EIR or Negative Declaration but does require consideration of environmental factors.”
As individual recommendations move forward toward further design and implementation, the City will then need to determine if there are environmental impacts that may warrant an EIR.
This act amends various code sections, all relating to bikeways in general, specifically by recognizing a fourth class of bicycle facility, cycle tracks. However, another component of AB-1193 may be even more significant to future bikeway development.
Existing law requires Caltrans, in cooperation with county and city governments, to establish minimum safety design criteria for the planning and construction of bikeways, and requires the depart-

ment to establish uniform specifications and symbols regarding bicycle travel and traffic related matters. Existing law also requires all city, county, regional, and other local agencies responsible for the development or operation of bikeways or roadways to utilize all of those minimum safety design criteria and uniform specifications and symbols.
This bill revises these provisions to require Caltrans to establish minimum safety design criteria for each type of bikeway, and also authorizes local agencies to utilize different minimum safety criteria if adopted by resolution at a public meeting.
This bill creates the Road Maintenance and Rehabilitation Program to address deferred maintenance on the state highway system and the local street and road system. A total of $5.4 billion will be invested annually over the next decade, which will undertake a backlog of repairs and upgrades. Additionally, cleaner and more sustainable travel networks will be ensured for the future, including upgrades to local roads, transit agencies, and an expansion of the state’s growing network of pedestrians and bicycle routes.
This bill extends indefinitely the requirement to install traffic-actuated signals to detect lawful bicycle or motorcycle
traffic on the roadway. By extending indefinitely requirements regarding traffic-actuated signals applicable to local governments, this bill would impose a state-mandated local program.
Existing law requires the state to reimburse local agencies and school districts for certain costs mandated by the state.
SB-760 Transportation Funding: Active Transportation: Complete Streets
This bill seeks to establish a Division of Active Transportation within Caltrans to give attention to active transportation program matters to guide progress toward meeting the department’s active transportation program goals and objectives. This bill requires the California Transportation Commission to give high priority to increasing safety for pedestrians and bicyclists and to the implementation of bicycle and pedestrian facilities. The bill also directs the department to update the Highway Design Manual to incorporate “Complete Streets” design concepts, including guidance for selection of bicycle facilities.
AB-1218 California Environmental Quality Act Exemption: Bicycle Transportation Plans
This bill extends CEQA requirements exemptions for bicycle transportation plans for an urbanized area until January 1, 2021. These exemptions include restriping of streets and highways, bicycle parking and storage, signal timing to
improve street and highway intersection operations, and related signage for bicycles, pedestrians, and vehicles under certain conditions. Additionally, CEQA will also exempt from its requirements projects consisting of restriping of streets and highways for bicycle lanes in an urbanized area that are consistent with a bicycle transportation plan under certain conditions.
Caltrans’ Deputy Directive 64-R1
Deputy Directive 64-R1 is a policy statement affecting Caltrans mobility planning and projects requiring the agency to:
“...provide for the needs of travelers of all ages and abilities in all planning, programming, design, construction, operations, and maintenance activities and products on the State highway system. The Department views all transportation improvements as opportunities to improve safety, access, and mobility for all travelers in California and recognizes bicycle, pedestrian, and transit modes as integral elements of the transportation system.” The directive goes on to mention the environmental, health and economic benefits of more Complete Streets.
Existing law provides that a local authority may not allow a person who has committed a traffic violation under the Vehicle Code to participate in a driver awareness or education program as an alternative to
the imposition of those penalties and procedures, unless the program is a diversion program for a minor who commits an infraction not involving a motor vehicle and for which no fee is charged.
This bill would instead allow any person of any age who commits an infraction not involving a motor vehicle to participate in a diversion program sanctioned by local law enforcement. The bill would eliminate the requirement that such a program charge no fee, as well as other technical changes.

Existing law defines a “motorized bicycle” as a device that has fully operative pedals for propulsion by human power and has an electric motor that meets specified requirements. The bill would define an “electric bicycle” as a bicycle with fully operable pedals and an electric motor of less than 750 watts, and would create three classes of electric bicycles.
The bill would prohibit the operation of the most powerful Class 3 electric bicycles on specified paths, lanes, or trails, unless that operation is authorized by a local ordinance. The bill would also authorize a local authority or governing body
to prohibit, by ordinance, the operation of Class 1 or Class 2 electric bicycles on specified paths or trails.

This bill authorizes a pedestrian facing a flashing “DON’T WALK” or “WAIT” or approved “Upraised hand” symbol with a “countdown” signal to proceed, so long as the pedestrian completes the crossing before the display of the steady “DON’T WALK OR WALK” or “WAIT” or approved “Upraised Hand” symbol.
Safe Streets Act (S-2004/HR-2468)
HR2468 encourages safer streets through policy adoption at the state and regional levels, mirroring an approach already being used in many local jurisdictions, regional agencies and states governments. The bill calls upon all states and metropolitan planning organizations (MPOs) to adopt Safe Streets policies for federally funded construction and roadway improvement projects within two years. Federal legislation will ensure consistency and flexibility in road-building processes and standards at all levels of governance.
This chapter includes sections on Thousand Oaks’ demographics, various relevant datasets such as bicycle and pedestrian collisions, and existing infrastructure. A city’s development pattern and existing bicycle and pedestrian facilities guide the location and type of new or upgraded facility recommendations. For instance, employment and retail centers should be served by bicycle routes and bicycle parking facilities, and schools should have continuous, safe bicycle and pedestrian connections to serve them.
To develop the Master Plan, a thorough analysis of existing conditions in Thousand Oaks was conducted that involved GIS analyses, field work, community outreach, and meetings with city staff to gather data and input. GIS-specific analyses involved processing datasets from the city and open source databases, such as the Statewide Integrated Traffic Records System (SWITRS), and combining them to reveal patterns and relationships within Thousand Oaks. In addition to physical characteristics, data from the 2015 American Community Survey were used to analyze the demographic and commuting characteristics of the city’s residents. Field work was conducted to catalog existing conditions and to collect geo-referenced photography to aid in illustrating concepts in the plan.
The existing bicycle facility network in Thousand Oaks is comprised of multi-use paths, bicycle lanes, and shared bicycle routes making up 112.2 miles of existing bikeways. Over 76 percent of the existing infrastructure is bicycle lanes and most of them are on major arterials. The existing infrastructure was reviewed for potential upgrades and missing sidewalk data helped guide future infill project recommendations.
112.2 miles of bikeways
Currently, four multi-use facilities exist within the city, including a 1.5-mile long path that connects Janss Road to Combard Avenue, and a 0.2-mile long section of Greenmeadow Avenue just south of Los Robles Greens golf course. Some of the bicycle lanes in the southeastern end of Thousand Oaks extend beyond the city limits, connecting the city to the greater regional bicycle network.

The pedestrian network in Thousand Oaks is largely made up of sidewalks along roadways (68 percent), followed by trails (23 percent), roadways with missing sidewalks (9 percent), and finally by greenbelts (1 percent). In addition to the existing facilities, there are designated crossing guard locations throughout the city to help children safely cross streets, and to remind drivers of the presence of potentially vulnerable pedestrians.


Existing land use patterns in Thousand Oaks are defined by a fairly conventional urban street pattern of primarily very low and low density residential development interspersed with pockets of other land uses, such as institutional, commercial, and industrial. The concentrations of commercial, office, and moderate density residential land use occur primarily along U.S. Route 101. Most of the existing undeveloped land is located closer to the city limits, specially to the north, south, and east.
Activity centers include employment hubs, industrial sites, government sites, retail centers, hospitals, schools, colleges, parks, open spaces, and other attractions. (Most of these activity centers are required to be considered under California’s bicycle planning enabling legislation.) Identifying these centers, and their draw for the community, is essential to creating useful bicycle and pedestrian networks. It is important to site facilities that connect the places people actually want to frequent.
Primary activity centers in the City of Thousand Oaks include public facilities, commercial/retail facilities, parks, and schools. Notable attractions include The Oaks Mall, The Promenade at Westlake, the Civic Arts Plaza, among others.

The road network in Thousand Oaks is made up of predominantly two to four lane roads, making up almost 67 percent of the total network. About 28 percent of the roadways have five to six lanes and less than six percent have seven or more lanes. This trend underscores the need for defined facilities along the roadways with higher lane counts as they typically experience higher traffic volumes. It also identifies connector streets that may be good alternatives for bicycle facilities given their low lane count. The roadways were analyzed further to determine suitability.
Average Daily Vehicular Trips were analyzed to identify the highvolume streets for inclusion or exclusion of bicycle facility types and enhanced amenities for pedestrians. Studies show that most bicyclists and pedestrians tend to prefer roadways with relatively low motor vehicle traffic volumes and speeds. Within the context of bicycle and pedestrian facility planning, the FHWA defines high traffic volumes as more than 12,000 vehicles per day. Lynn Road, Moorpark Road, and Thousand Oaks Boulevard are major arterials, with segments exceeding 22,000 daily trips. Other secondary arterials, such as Hillcrest Drive, Westlake Boulevard, and Olsen Road contain segments with 13,500-22,000 daily trips.
A majority of Thousand Oaks’ streets have a posted speed limit of 40-45 miles per hour (MPH), including major arterial streets for cross city traffic. However, some of the major arterials, such as Lynn Road, Olsen Road, and Westlake Boulevard are typically posted 50 MPH or greater. Besides these high speed, high volume streets, the city’s low speed streets are conducive to bicycle facilities, such as bicycle boulevards/neighborhood greenways, or shared bicycle routes.
Two major highways, US HWY 101 and State Route 23, run through the City, creating about 20 highway intersections within the city limit. Most these intersections involve highway entrances and exits, which makes pedestrian and bicycle crossing particularly challenging. Five of these highway interchange intersections are overpasses with no fencing. As pedestrians and bicyclists travel on the road side, overpasses with no fencing degrades the sense of safety for them.


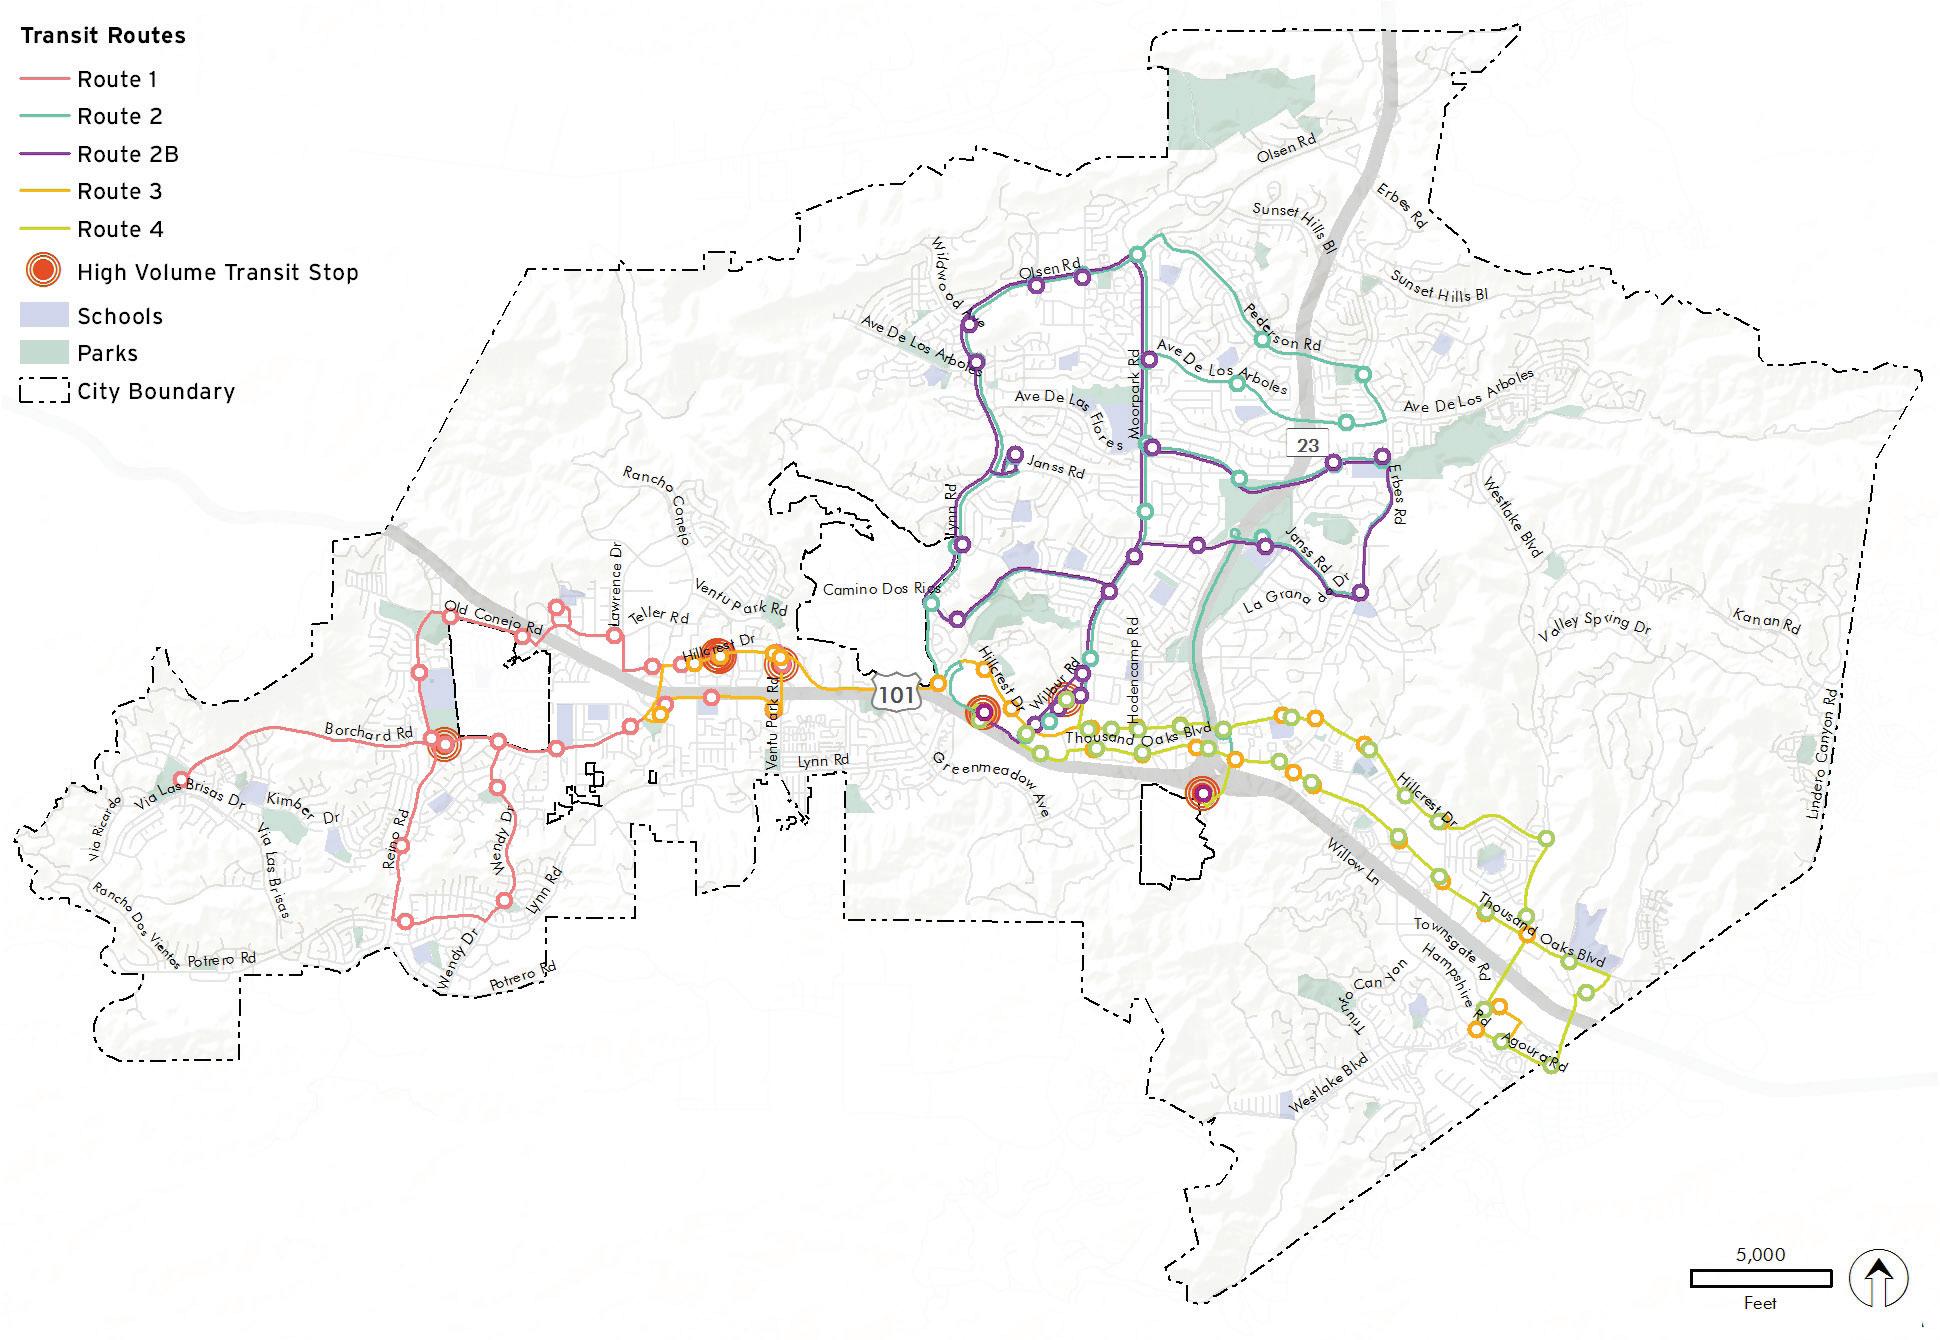
There are eight bus routes within the study area, as shown in Figure 2-8. The transit services include fixed routes provided by Thousand Oaks Transit and intercity routes provided by the Ventura County Transportation Commission (VCTC) that follow major arterials through the city. As part of the analysis, these routes and stops were evaluated to ensure improved access to them was integrated into the plan as major destinations.

According to the U.S. Census 2016 American Community Survey, there are an estimated 5,670 workers in Thousand Oaks. Mode splits for workers’ commute trips are:
Car: 87.0 percent
Transit: 1.2 percent
Walk: 2.2 percent
Bicycle: 0.4 percent
Work from Home: 8.0 percent
Other Means: 1.2 percent
Over 87 percent of workers in Thousand Oaks drive to work. This suggests that investments in transit and other mobility choices should be done to reduce employee commuter trips and reduce traffic congestion in Thousand Oaks.
The walking mode share measures the percentage of workers aged 16 years and over who commute to work by foot. Mode share reflects how well infrastructure and land-use patterns support travel to work by foot. In the city, walking mode share patterns are connected to the relative proximity of housing to employment centers.
Similar to the walking mode share, bicycling mode share measures the percentage of resident workers aged 16 years and over who commute to work by bicycle. In the city, moderate bicycling mode share levels are evenly distributed, with peaks observed near high residential concentrations and retail commercial centers.
Transit mode share measures the percentage of workers aged 16 years and over who commute to work by transit. This mode share reflects how well first mile-last mile infrastructure, transit routes, and land-use patterns support travel to work by transit.
According to the U.S. Census 2016 American Community Survey (ACS), Thousand Oaks has a population of 128,623 within its 55.33 square mile city boundary, resulting in a population density of 2,325 people per square mile in 45,873 households. The population of Thousand Oaks has a relatively even age distribution with 17 percent of the population classified as seniors (over the age of 65), and 25 percent being under the age of 19. The racial and ethnic make-up in Thousand Oaks is 81.2 percent white, 9.5 percent Asian, 1.1 percent black, 0.3 percent American Indian, 0.1 percent Pacific Islander, 3.9 percent two or more races, and 4.0 percent of some other race. About 18.3 percent of the population identifies as Hispanic or Latino.
Median household income is $129,033, while 6.5 percent of residents reporting incomes below the national poverty level. Of the households surveyed in 2016, most households have access to one or more vehicles, with one percent reporting lacking access to a vehicle.
Analysis of existing and likely future conditions is an essential component of any transportation project planning process. For this project, analysis included spatial (GIS) analysis, fieldwork, and community and stakeholder input. This multi-pronged approach allowed for maximal data capture and cross-referencing of findings. For example, bicycle and pedestrian safety concerns were analyzed through public input and collision data, which included locations, frequencies, and causes. Cross-referencing collision data with public input helped to confirm safety issues and identify areas for new or improved infrastructure.
The following sections describe the safety, first-last mile, and level of traffic stress (LTS) analyses conducted for this ATP, as well as likely demand, street lighting, and community engagement.
Bicycle and pedestrian collision data were obtained from the Statewide Integrated Traffic Records System (SWITRS) collision dataset managed by the California Highway Patrol (CHP), which captures reported bicycle-vehicle, pedestrian-vehicle, and bicycle-pedestrian collisions that resulted in injury or property damage in Thousand Oaks in the five year period of 2013 through 2017. Collision density and locations data are displayed on Figure 3-1. Collisions on off-street paths are not reported in the dataset. It is important to note that collisions involving bicyclists and pedestrians are known to be under-reported, and therefore such collisions are likely under-represented in this analysis.
In the past five years there were 157 bicycle-related collisions and 117 pedestrian-related collisions, six of which resulted in fatalities. Both collision types share a similar trend and peaked in 2014. The bulk of both collision types resulted in injury or complaint of pain (83 percent), with 17 percent resulting in severe injury or death. Most collisions (78 percent) occurred in daylight conditions or lighted conditions (15 percent), with seven percent occurring in either unlighted conditions or at dawn/dusk.
Almost half (48 percent) of all bicycle collisions were caused by bicyclists traveling on the wrong side of the road, or bicyclists violating automobile right-of-way. Other major causes were unsafe speed (17 percent), improper turning (11 percent), and not following traffic signals and signals (6 percent). Pedestrian crash causes were quite different than bicycle collisions. Most were caused by drivers failing to yield to pedestrian right-of-way (61 percent), and 42 percent of collisions occurred at intersections. Most of the 286 victims were male (72 percent). Teenagers age 14 or younger were involved the highest numbers among all age groups, followed by middle-aged people between 50-59 years old. Table 3-1 able lists the top 10 corridors with the highest number of reported collisions.
This collision map illustrates crash density across the city, as well as highlights several crash hot spots involving bicycles and pedestrians. Note that three out of the six fatal collisions from 2013 to 2017 occurred at crossings along Highway 101.

First and Last Mile Analysis evaluates how to effectively link people to and from transit stops to their origins and destinations, specifically addressing the proverbial last mile at each end of their journey where suitable facilities are often lacking. Understanding that public transportation rarely stops directly in front of a passenger’s origin or destination is important to ensure transit users have the required non-motorized infrastructure to help encourage them get to and from their transit stop by walking or bicycling, or using a wheelchair, skateboard, or scooter.
This First and Last Mile analysis employs GIS spatial analysis to determine walking and bicycling distances to transit stops based on actual street and sidewalk data. Figure 3-2 depicts those distances based on a half mile walkshed (darker shade) and a three mile bikeshed (lighter shade). The map shows that most of the city’s schools and parks are within a half mile walking distance of existing transit stops. The map also shows that nearly the entire city lies within a three mile bicycling distance of existing transit stops.
Note that all of the high-volume transit stops fall within the bicycle and pedestrian collision hot spots mentioned in the previous section, indicating that active transportation infrastructure improvements may be needed to help people more safely reach their preferred transit stops.

To further understand the active transportation needs and define study focus areas, a composite Geographic Information Systems (GIS) model was created to reveal relationships between the many data layers analyzed. The Propensity Model is comprised of three sub-models: Attractor, Generator and Barrier Models. Attractor and Generator Models show travel demands based on destination density. These three sub-models are then combined to create the composite Bicycle-Pedestrian Priority Model. Propensity model maps for bicyclists and pedestrians were developed respectively, considering a comprehensive set of analysis inputs, to reflect different levels of walking and bicycling demands across the city.
Table 3-2 displays the weighted factors analyzed in the sequence of importance within each sub-model. Some factors are unique to the City of Thousand Oaks, such as Neighborhood Access Points and Greenbelt Access Points, which are great amenities that encourage non-motorized travel in the city.
When comparing input from public workshops, stakeholders, and online surveys, there was correlation between the high propensity areas for bicycling and walking and the input provided. The resulting map shown in Figure 3-3 was employed to develop general recommendations and to select priority projects described in the following chapter.
Both pedestrian and bicyclist propensity maps show highest likely use along and between Thousand Oaks Boulevard and Hillcrest Drive, Westlake Boulevard south of Highway 101, the area around Moorpark Road north of Janss Road, and the Reino Road corridor. While bicyclist propensity is mostly concentrated on the major roadways, pedestrian propensity also permeates into local streets that people tend to use frequently.
TABLE
Activity centers known to attract bicyclists and pedestrians
DESTINATION LOCATION DATA
Shopping Centers & Commercial Land Uses
Parks
Preschool/Elementary Schools
Bus Stops
Community Attractions (City Hall, Library, Arts Centers)
Neighborhood Access Points
Greenbelt Access Points
Healthcare
Middle/High School
Class I Access Points
GENERATORS
Demographic characteristics that address potential pedestrian and bicyclist volume within the study area
CENSUS DATA ACS 2016
Junior resident density
Senior resident density
Bike/Ped
Bike/Ped
Disability Ped Only
Household Income Bike/Ped
Population Density Bike/Ped
Public Transit to work Bike/Ped
Bicycle to work Bike Only
Walk to work
Features likely to discourage or detract people from bicycling
TRAFFIC & ROAD CONDITION DATA
Features likely to discourage or detract people from walking
TRAFFIC & ROAD CONDITION DATA
Ped Only
Vehicle Ownership Bike/Ped
Health and Equity Factors Bike/Ped
Speed (Buffer 150’)
Absence of Bicycle Facility (Buffer 150’)
Bicycle Related Collisions (1/16-Mile Buffer)
Major Crossings
Slope
Speed (Buffer 150’)
Missing Sidewalk
Missing Curb Ramps (Buffer 150’)
Pedestrian Related Collisions (1/16-Mile Buffer)
Major Crossings
Slope


The Bicycle Level of Traffic Stress (LTS) analysis is a GIS-based tool used to quantify a bicyclist’s perception of comfort given specific roadway conditions. Because different bicyclists have different tolerances for stress created by volume, speed, and proximity of automobile traffic, the LTS method identifies four levels of stress, from the most comfortable scenario to the least tolerable conditions. Bicycle Level of Traffic Stress (LTS) criteria span from 1 to 4, with 1 being the least stressful or most comfortable, and 4 being the most stressful.
The analysis was applied to the major roadways within the city, most of which already have bicycle facilities, as shown in Figure 3-5. Although the city has a well developed bicycle network, most of the analyzed roadways have a high level of traffic stress (LTS 3 and LTS 4). This means that the facilities are geared towards more confident, experienced, and strong bicyclists, and other users may not feel safe and comfortable riding on these roadways. The most stressful corridors are Thousand Oaks Boulevard, Hillcrest Drive, Reino Road, and part of Borchard Road, all of which have high bicycling demand, but also suffer from a high collision history.
•Low Stress
•Comfortable for all ages and abilities
•Low Stress, with attention required
•Comfortable for most adults
•More Stressful than level 2
•Riding a bike is tolerated by confident riders
•Most Stressful
•Unconfortable for most, except experienced riders

Street lighting has been an important factor for public safety, both actual and perceived. Dark roadway segments was an issue brought up in community input, both on some residential streets and crossing Highway 101, particularly while walking. The city maintains a well-established street light database that allowed further analysis to correlate street light coverage and corridors with existing active transportation facilities. Figure 3-6 illustrates street light coverage along the major roadways. The yellow dots represent the approximate illumination areas, and the heavy black lines represent the underlying streets to help make the gaps in street light presence stand out.
Overall, the city is well lighted. However, segments of Westlake Boulevard, Lynn Road, Moorpark Road, Hillcrest Drive, Ave De Los Arboles, and Ave De Los Flores have dark segments. Janss Road, Reino Road, and Borchard Road also have minor discontinuous unlighted segments.
Streets with dark segments include:

In developing the community engagement process, the planning team and the city initially agreed that a variety of outreach methods and materials were advisable, beginning with a Stakeholder Outreach Plan (SOP) that outlined outreach goals. The SOP was developed to establish a set of guidelines to maximize public outreach and engage city stakeholders, including education and involvement of a broad spectrum of stakeholders including city staff, residents, an existing Bicycle Advisory Team (BAT), and other interested persons. The SOP included goals, key messages, a list of contacts, and an outline for potential public workshops and committee meetings. Outreach methods and materials included branding, online and paper surveys, an online comment map, and BAT input.
A substantial component of the SOP addressed the participation of the city’s Bicycle Advisory Team (BAT), representing a range of knowledgeable stakeholders. The BAT’s role was to provide feedback on project direction, as well as public outreach support by reaching out to their members, allies, and partners.
The BAT holds regular quarterly meetings at which the project’s important planning issues and milestones were discussed, such as project status, public outreach results to date, and the next steps in the planning process. BAT members also discussed more general topics such as coordination with the city’s existing and future land use and transportation plans, and optimum community outreach methods and venues. Some BAT meetings were focused on specific topics, such as reviewing the proposed project list, gathering feedback on how to best prioritize the projects, and reviewing the draft document.
To generate interest, the team worked with the city to develop an easily recognizable and vibrant branding scheme specifically addressing the project, including a project logo employing the city seal. This branding was used in all outreach materials, including flyers, surveys, an online map, website, outreach event exhibits and banners.
A variety of outreach materials were designed to maximize public engagement. The City of Thousand Oak’s population is ethnically and economically diverse, including workers and professionals who commute daily in and out of Thousand Oaks. This diverse background meant the project needed to have a variety of outreach methods, including printed media and an online presence. Other public outreach materials for workshops and meetings included flyers and email/text blasts. All of these materials were designed using the project branding and most were made available in both English and Spanish.

A project survey was prepared in English and Spanish to determine satisfaction levels with existing pedestrian and bicycle infrastructure. The survey asked a variety of walking and bicycling infrastructure questions and allowed respondents to provide both general and specific comments. The survey questions were designed to develop a general understanding of the community’s current and future state of mind regarding active transportation. Some questions included the option to provide additional related comments. The survey also directed respondents to an online comment map that allowed them to place comments on specific street corridors and intersections.
Printed and online surveys were available at local civic spaces, such as the Thousand Oaks Library and City Hall, and through online platforms. The city and the BAT worked together to distribute surveys using the city’s website, stakeholder email listservs, and at a pop-up event in conjunction with the Love Run.
Survey
Student Visitor/Patron Other
Are there students in the household? If so, what school/university?
What is your gender? Male Female Prefer not to answer
19-45 46-64
What would make it easier for you to walk more in Thousand Oaks? (Check all that apply)
Encuesta
What would make it easier for you to bike more in Thousand Oaks?
El Plan de Transporte Activo de Thousand Oaks guiará el diseño de opciones más seguras, agradables y
convenientes para caminar y andar en bicicleta. ¡Con su ayuda podemos hacer que caminar y andar en
bicicleta en Thousand Oaks sea una mejor opción! ¿Cómo describiría su relación con Thousand Oaks? (Seleccione todas las opciones que apliquen) Residente Propietario Propietario de negocio Empleado Estudiante Visitante Otro
0-18
Drive Other (please specify)
How do you get to work/school? (Check all that apply) Walk Bike Bus
How do you get to a city park? (Check all that apply)
Walk Bike Bus
Drive Other (please specify)
Where would you like to see better pedestrian and bicycling routes to? Schools Parks Community Centers Transit/Bus Stops
For
Shopping Centers Other (please specify)
Oaks? Daily 3-4 days per week 1-2 days per week A few times a year Never Daily 3-4 days per week 1-2 days per week A few times a year Never

(Check all that apply)
¿Hay estudiantes en el hogar? De ser así, ¿a qué escuela o universidad asisten?
¿Cuál es su sexo?Masculino Femenino Prefiero no responder
¿Cómo llega al trabajo o a la escuela? (Seleccione todas
las opciones que apliquen) A EnEnpiebicicleta autobús En carro Otro (por favor especifique)
you have any additional
¿Cómo llega a algún parque de la ciudad? (Seleccione todas las opciones que apliquen)
A pie En bicicleta En autobús En carro Otro (por favor especifique)
Velocidades de tráfico más (altosCruceslentasprotegidos o señales) Otro ¿Qué te facilitaría andar en bicicleta más en Thousand Oaks? (Seleccione todas las opciones que apliquen) Carriles para bicicleta en las calles Rutas para bicicleta fuera de la calle Alumbrado Árboles
Estacionamiento para bicicletas Velocidades de tráfico más Bicicletaslentascompartidas Otro
¿Quétansegurosesienteusandolossiguientesmodosde transporte?(Marquelacasillaqueapliqueparacadamodo)
¿Tiene comentarios adicionales?
¿Qué tan seguido camina en Thousand Oaks?
Diario
3-4 días a la
Surveys (English and Spanish)
5 6 7 8 4 3 2 1 9 14 10 12 11 13 Nombre: Email: Teléfono: 15 Para llenar esta encuesta en línea, visite: https://www.surveymonkey.com/r/TOaksATP 2100 Thousand Oaks Blvd Thousand Oaks, CA 91362 Tel: (805) 449-2416 Para más información, por favor contacte a: Kathy Lowry, Engineer Associate/City Bicycle Coordinator klowry@toaks.org
¿Se quiere mantener informado sobre este plan? De ser
así, por favor anote su dirección de correo electrónico a continuación. Si lo prefiere, puede proporcionar su número de teléfono en su lugar.
Me siento muy seguro Me siento algo seguro No me segurosiento A pie Bicicleta Autobús
An online comment map provided through the ArcInfo Online platform was created as a supplemental input method that respondents could use to highlight location-specific issues. It allowed respondents to input comments about existing issues or to highlight good existing infrastructure, and to distinguish whether the highlighted issue had a pedestrian, bicycle, or “other” related focus. A screen image of the map interface is shown below, and a compilation of the comments received is included on the following two pages, the first for pedestrian comments and the second for bicyclist comments.
The ArcInfo Online platform also allows participants to see where others had made comments and automatically geo-references all comment inputs. This valuable feature allowed the team and the city to efficiently document and analyze comments as they related to specific locations and issues identified by respondents, and to address them in subsequent recommendations.


The planning team worked with the BAT to determine the optimum opportunity for community input, and it was decided that a pop-up workshop was the most appropriate. Pop-up workshops are programmed to coincide with existing regularly scheduled community events. Such on-site workshops allow the project team to reach out to large numbers of community members in a setting with documented high attendance. Pop-up workshops have proven to work well to gather comments, as well as to generate interest in a project and in survey participation.
From a list of upcoming events, it was determined that the next annual Love Run was the best choice, because the event attracts thousands of participants and supporters. The team set up a booth at the 2018 Love Run on Saturday, June 3, staffed by two planners and two city staff members. The event was very well attended and allowed the team to introduce the project to a large number of community members. People readily provided comments on the city’s pedestrian and bicycle infrastructure. They shared issues about certain corridors and intersections, but also highlighted areas that were good examples.

Besides verbal input, the team gathered comments on large table maps and on educational preference exhibits prepared for the event, including the example on the next page. The team distributed postcards inviting people to take the online survey and to provide additional comments via the online map.

Pop-up event preference voting board

The survey and resulting map data were used to gain a general understanding of the existing pedestrian and bicycle issues, both as factors for subsequent GIS analyses, and to help guide project prioritization in conjunction with BAT input. With over a hundred survey responses, the following results helped to highlight what residents considered to be the most important issues and were used later in the recommendations and prioritization process. Full survey results can be found in the appendix.
From the pop-up workshop at the Love Run to the last BAT meeting, public participation was insightful. Community members took advantage of opportunities to voice their thoughts and make suggestions on how to improve the walking and bicycling environment in the city.
In the following paragraphs, note that respondents were allowed to select more than one answer for some questions, some times resulting in totals greater than 100 percent.
When asked how would they best describe their relationship with Thousand Oaks, 87 percent identified themselves as residents and 53 percent as property owners. Only three percent identified themselves as students, which correlates with the age distribution, since no one under 19 took the survey, and the bulk of responses, 58 percent, was from people 46-64 years old, with respondents very evenly split between male and female.
When asked whether there were any students in the household and which school(s) they attended, slightly more than half answered yes and noted 18 individual schools, including community colleges, public high, middle, and elementary schools, as well as two private religious schools. The most common response was elementary schools, with one to three students each attending 10 different schools.
When asked how they got to work or school, an impressive 20 percent said they rode a bicycle and eight percent walked. 81 percent said they drove and two percent used the bus system. Under the additional comments, 14 respondents said they were retired and one split a 65 mile commute between driving and bicycling.
Most (62 percent) or respondents said they access city parks on foot, compared to 35 percent by bicycle, and 72 percent by car.
When asked where they would like to see better pedestrian and bicycling routes, the results were relatively evenly split across the destination choices offered, with the highest two being parks and shopping centers, followed by schools, community centers and transit stops. Under the additional comments, several each requested safer routes over or around freeway overpasses, more off-street bicycle paths, and protected bikeways along the busier arterials like Thousand Oaks Boulevard. There were also several comments that no new facilities are needed, as well as several that more routes were needed across the city. Other comments noted better access to trails and trailheads and to employment centers.
When asked how often they walked in Thousand Oaks, almost 60 percent of respondents said daily or 3-4 days a week. However, only 26 percent said they bicycled that often, with less than four percent saying daily.
When asked what would make it easier for respondents to walk more in Thousand Oaks, 65 percent said continuous sidewalks and 32 percent said wider sidewalks. Enhanced or marked crosswalks and street lighting ranked between 25 and 38 percent each. Within the additional comments, several respondents noted that sidewalks with excessive sideslopes where they cross driveways were an issue. Other comments noted the need to cut back adjacent brush, uneven paving, and the desire for sidewalks physically separated from adjacent vehicle traffic. Vehicle speeds, driver inattention, and lack of lighting were also noted, as well as easier ways to cross Highway 101.
When asked what would make it easier for them to bicycle more in Thousand Oaks, “bike paths away from streets” was selected by 72 percent of respondents. The next highest selection was bicycle lanes on the street at 56 percent, followed by bicycle parking at 41 percent. Among the additional comments were several specifically calling for protected crossings of Highway 101, as well as several each concerning the desire for more physically separated bicycle routes, and for better enforcement of traffic laws and outreach addressing the three foot passing law and the legality of riding side-by-side.
When asked how comfortable respondents felt when walking, bicycling, or taking the bus, by a wide margin, bicycling was perceived as the least safe mode. Only 11 percent of bicyclists said they felt safe, compared to 61 percent of walkers, and 57 percent of bus users. This question generated additional comments about vehicle speeds, the need for more bicycle infrastructure in general, but also comments concerning bicyclists not obeying the rules of the road. There were also comments noting the generally good condition of Thousand Oak’s streets, and the need for shorter bus headways.
The following is a summary of the major topics and issues from outreach and meetings:
The city has a good foundation of bicycle and pedestrian infrastructure.
The city needs to focus on closing bikeway gaps and improving specific sections along corridors, such as with multi-use paths or separated bicycle lanes.
Sidewalks exist across much of the city, but there are a few areas where they are still needed.
Crossing at the freeway overpasses and underpasses was a frequently cited issue for both pedestrians and bicyclists. Crossing the freeways on foot or by bicycle is perceived as unsafe, especially at night.
Major intersections would benefit from crosswalk enhancements and pedestrian lighting.
Existing bicycle lanes should be upgraded to buffered bicycle lanes or separated bicycle lanes where possible.
Some streets need lighting improvements.
Page intentionally left blank
This chapter addresses the physical improvements recommended to enhance bicycling and walking in Thousand Oaks. The recommended improvements list includes both short-term and longterm improvements and is meant to serve as a guide to help the city in allocating funds as they become available through various sources. The chapter contains maps and tables that detail improvement location, extent, and type.
It is important to note that the success of recommended projects is closely tied to programs and adopted standards, codes, and policies. Education, Encouragement, Enforcement, and Evaluation programs can be used to leverage investments in these projects. Similarly, the effectiveness of bicycle and pedestrian programs is maximized by actual project implementation. Likewise, changes to city standards, codes, and policies may be needed to implement bicycle and pedestrian improvements. Project implementation may, in turn, facilitate changes to city standards, codes, and policies.
While not universally applied, in general, pedestrian travel in urban areas has long tended to be accommodated with features like sidewalks, crosswalks, dedicated signals, and curb extensions. Suggested pedestrian treatments address a wide variety of issues identified in the analysis and community engagement process to enhance connectivity to transit, school zones, senior zones, activity centers, parks, and other community destinations. Pedestrian improvements help to ensure equitable multi-modal transportation because they serves populations that may not be able to afford a bicycle, and instead rely on transit and walking. Newer innovations like pedestrian scrambles, modified signal timing, flashing beacons, and other pedestrian improvements are described in this chapter in addition to standard pedestrian treatments.
A focus on providing safer, less stressful bicycle travel has occurred more recently across the United States, with significant transformation in the state of practice for bicycle travel over the last five years. Much of this may be attributed to bicycling’s changing role in the overall transportation system. No longer viewed as an “alternative” mode, it is increasingly considered as legitimate transportation that should be actively promoted as a means of achieving community environmental, social, and economic goals. While connectivity and convenience remain essential bicycle travel quality indicators, recent research indicates the increased acceptance and practice of daily bicycling will require “low-stress” bicycle routes, which are typically understood to be those that provide bicyclists with separation from high volume and high speed vehicular traffic. The route types recommended in this plan, and described in the following section, are consistent with this evolving state of practice.
There are four conventional bicycle route types recognized by the California Department of Transportation. Details of their design, associated wayfinding, and pavement markings can be found in the CA MUTCD and CA Highway Design Manual.


Class I multi-use paths (frequently referred to as “bicycle paths”) are physically separated from motor vehicle travel routes, with exclusive rights-of-way for non-motorized users like bicyclists and pedestrians.
Bicycle lanes are one-way route types that carry bicycle traffic in the same direction as the adjacent motor vehicle traffic. They are typically located along the right side of the street, between the adjacent travel lane and curb, road edge, or parking lane.
A bicycle route is a suggested bicycle path of travel marked by signs designating a preferred path between destinations. They are recommended where traffic volumes and roadway speeds are fairly low (35 mph or less).
Separated bikeways are bicycle-specific routes that combine the user experience of a multi-use path with the on-street infrastructure of a conventional bicycle lane. Separated bikeways are physically separated from motor vehicle traffic and designed to be distinct from any adjoining sidewalk. The variety of physical protection measures can include raised curbs, parkway strips, reflective bollards, or parked vehicles. Separated bikeways can be either one-way or two-way, depending on the street network, available right-of-way, and adjacent land use, but the safety of two-way separated bikeways must be carefully evaluated, especially if they cross motor vehicle routes. This is because few motor vehicle drivers are accustomed to two-way separated bikeways and they may tend to look to the left only when deciding whether it is safe to proceed across the separated bikeways.
While the conventional bicycle route types can be found throughout the United States, there has been a distinct shift towards further enhancement. For example, the CA MUTCD has approved the installation of buffered bicycle lanes, while Shared Lane Markings or “Sharrows” have been in use since 2008 throughout the State.

These enhancements are low cost, easy to install, and provide additional awareness about the likely presence of bicyclists. In many instances, installation of these bicycle route enhancements can be coordinated as part of street resurfacing projects. The use of green paint has also become a simple and effective way to communicate the likely presence of bicyclists. It is also used to denote potential conflict zones between bicyclists and vehicles.

Buffered bicycle lanes provide additional space between the bicycle lane and traffic lane, parking lane, or both, to provide a more protected and comfortable space for bicyclists than a conventional bicycle lane. The buffering also encourages bicyclists to avoid riding too close to parked vehicles, keeping them out of the “door zone” where there is the potential danger of drivers or passengers suddenly opening doors into the bicyclists’ path.

The shared lane marking is commonly used where parking is allowed adjacent to the travel lane. It is now common practice to center them within the typical vehicular travel route in the rightmost travel lane to ensure adequate separation between bicyclists and parked vehicles. Many cities install sharrows over a green background to enhance visibility.
A bike box is a designated area at the head of a traffic lane at a signalized intersection that provides bicyclists a safe and visible way to wait ahead of queuing traffic during the red signal phase. This positioning helps encourage bicyclists traveling straight through not to wait against the curb for the signal change.
There are a number of other non-conventional route types that the city may find useful in specific situations. In many cases, the conventional bicycle route types previously mentioned may not meet the community’s perceptions of safe and comfortable bikeways. Protected, low-stress streets, and bicycle-prioritized route types are constantly being revised and improved to meet the communities needs.
The improvements described in this section have been implemented in other states in the United States as well as other countries with great success and are quickly becoming standard recommendations.
Details of these route types and other treatments can be found in the NACTO Urban Bikeway Design Guide or AASHTO Guide of the Development of Bicycle Facilities.
Bicycle boulevards provide a convenient, low-stress cycling environment for people of all ages and abilities. They are installed on streets with low vehicular volumes and speeds and often parallel higher volume, higher speed arterials. Bicycle boulevard treatments use a combination of signs, pavement markings, and traffic calming measures that help to discourage through trips by motor vehicle drivers and create safe, convenient bicycle crossings of busy arterial streets.
Signage and wayfinding on all streets and bicycle routes are intended to identify routes to both bicyclists and drivers, provide destination information and branding, and to inform all users of changes in roadway conditions.


Colored pavement increases the visibility of bicycle routes, identifying potential areas of conflict or transition, and reinforces bicyclists’ priority in these areas. Colored pavement can be used as a corridor treatment, along the length of a bicycle lane or within a protected bikeway. Additionally, it can be used as a spot treatment, such as crossing markings at particularly complex intersections where the bicycle path may be unclear. Consistent application of color across a bikeway corridor is important to promote clear understanding for all roadway users.
Intersection crossing markings indicate the intended path of bicyclists. Colored striping can be used to highlight conflict areas between bicyclists and vehicles, such as where bicycle lanes merge across motor vehicle turn lanes. An example within the city is northbound Lynn Road approaching W. Hillcrest Drive, immediately north of the Highway 101 overcrossing.
Protected intersections maintain the integrity (low-stress experience) of their adjoining separated bicycle lanes by fully separating bicyclists from motor vehicles. Hallmark features of these protected intersections include two-stage crossings supported by an advance queuing space, protective concrete islands, special bicycle-cross markings (parallel with crosswalks), and special signal phasing.
Two-stage turn queue boxes can provide a more comfortable left-turn crossing for many bicyclists because they entail two simple crossings, rather than one complex one. They also provide a degree of separation from vehicular traffic, because they do not require merging with vehicle traffic to make left turns. Bicyclists wanting to make a left turn can continue into the intersection when they have a green light and pull into the green bike box. Bicyclists then turn 90 degrees to face their intended direction and wait for a green light to continue through.

This category includes all types of traffic signals directed at bicyclists. These can include typical green/yellow/red signals with signage explaining the signal controls, or special bikeway icons displayed within the signage lights themselves. Near-side bicycle signals may incorporate a “countdown to green” display, as well as a “countdown to red.”
Bicycle detection is used at intersections with traffic signals to alert the signal controller that a bicycle crossing event has been requested. Bicycle detection can occur either through the use of push buttons or by automated means, and are marked by standard pavement symbols.


Traffic calming involves changes in street alignment, installation of barriers, and other physical measures to reduce traffic speeds and/or cut-through motor vehicle traffic volumes. The intent of traffic calming is to alter driver behavior and to improve street safety, livability, and other public purposes. Other techniques consist of operational measures such as police enforcement and speed displays. The following examples are traffic calming measures that may apply to Thousand Oaks.

A roundabout is a circular intersection with yield control at its entry that allows a driver to proceed at controlled speeds in a counter-clockwise direction around a central island. Roundabouts are designed to maximize motorized and non-motorized traffic through their innovative design that includes reconfigured sidewalks, bikeway bypasses, high-visibility crosswalks, pedestrian flashing beacons, and other traffic measures. Roundabouts can be implemented on most streets, but may require additional right-of-way.
A traffic circle is a small-scale traffic calming measure commonly applied at uncontrolled intersections on low volume, local residential streets. They lower traffic speeds on each approach and typically avoid or reduce right-of-way conflicts because the overall footprint is smaller compared to roundabouts. Traffic circles may be installed using simple markings or raised islands, but are best accompanied with drought-tolerant landscaping or other attractive vertical elements.

Pedestrian Hybrid Beacons (PHBs) and Rectangular Rapid Flashing Beacons (RRFBs) are special signals used to warn and control traffic at unsignalized locations to assist pedestrians in crossing a street via a marked crosswalk. Either of these devices should be installed at locations that experience high pedestrian volumes and that connect people to popular destinations such as schools, parks, and retail. PHBs are more commonly used in multi-lane situations, and RRFBs on two lane roadways.
Signals and warning devices should be paired with additional pedestrian improvements, where appropriate, such as curb extensions, enhanced crosswalk marking, lighting, median refuge islands, and corresponding signage.


Speed tables are flat-topped road humps, often constructed with textured surfacing on the flat section. Speed tables and raised crosswalks help to reduce vehicle speeds and enhance pedestrian safety.
Speed displays measure the speed of approaching vehicles by radar and inform drivers of their speeds using an LED display. Speed displays contribute to increased traffic safety because they are particularly effective in getting drivers traveling ten or more miles per hour over the speed limit to reduce their speed.

Chicanes are a series of narrowings or curb extensions that alternate from one side of the street to the other forming an S-shaped path. Chicanes reduce drivers’ speeds by causing them to shift their horizontal path of travel.
A traffic diverter is a roadway design feature placed in a roadway to prohibit vehicular traffic from entering into or exiting from the street, or both.
Edge friction is a combination of vertical elements such as on-street parking, bicycle routes, chicanes, site furnishings, street trees, and shrubs that reduce the perceived street width, which has been shown to reduce motor vehicle speeds.


Most streets in Thousand Oaks have sidewalks, and the network has been evaluated to determine if appropriate sidewalk widths and ADA compliant curb ramps are present (ADA Transition Plan). While many intersections are signalized and have crosswalks, there are some segments with long blocks without convenient crossing places. Providing crossing treatments will help to reduce “jaywalking” and unsafe crossings between intersections.


Enhanced crosswalk markings can be installed at existing or proposed crosswalk locations. They are designed to both guide pedestrians and to alert drivers of a crossing location. The bold pattern is intended to enhance visual awareness.
Also called bulb-outs or neck-downs, curb extensions extend the curb line outward into the travel way, reducing the pedestrian crossing distance. Typically occurring at intersections, they increase pedestrian visibility, reduce the distance a pedestrian must cross, and reduce vehicular delay. Curb extensions must be installed in locations where they will not interfere with bicycle lanes or separated bikeways. If both treatments are needed, additional design features such as ramps, or half-sized curb extensions should be considered.
Refuge Island
Refuge islands provide pedestrians and bicyclists a relatively safe place within intersection and mid-block crossings to wait if they are unable to complete their crossing in one movement.
Mid-block crossings provide convenient locations for pedestrians and bicyclists to cross thoroughfares in areas with infrequent intersection crossings or where the nearest intersection creates substantial out-of-direction travel. Mid-block crossings should be paired with additional traffic-control devices such as PHBs, RRFBs, LED enhanced flashing signs, and/or refuge islands.
Lighting
Pedestrian-scale lighting provides many practical and safety benefits, such as illuminating the path and making crossing walkers and bicyclists more visible to drivers. Lighting can also be designed to be fun, artistic, and interactive.

Pedestrian Scramble
Pedestrian scrambles stop vehicular traffic flow simultaneously in all directions to allow pedestrians to cross the intersection in any direction. They are used at intersections with particularly heavy pedestrian crossing levels.

Modified Traffic Signal Timing
Adjusting the time needed to cross high-volume and wide streets provides additional safety and comfort for pedestrians and bicyclists.
Senior Zones
Potential future city designated senior zones can be enhanced with street signage, increased crossing times at traffic signals, benches, bus stops with shelters, and pedestrian lighting.
Transit Stop Amenities
Transit stop amenities such as shelters with overhead protection, seating, trash receptacles, and lighting are essential for encouraging people to make use of public transit.

The inclusion of urban elements such as parklets and community gardens encourages walking and provides usable space for all ages. In many cities, these urban elements have helped to transform urban villages and downtowns into walkable destinations. Coordinating with local Thousand Oaks businesses and organizations may provide collaborative design and funding opportunities between the city, its businesses, residents, and visitors.
Parklets are small, outdoor seating areas that take over one or two parking spots, reclaiming the space for the community, and improving the urban environment’s aesthetics and streetscape.

Community gardens provide fresh produce and plants and assist in neighborhood improvement through a sense of community and connection to the environment. They are typically managed by local governments or non-profit associations.

Transit shelters, bicycle racks, seating, and public art provide important amenities for functionality, design and vitality of the urban environment. They announce that the street is a safe and comfortable place to be and provide visual detail and interest.

This section addresses the prioritized recommendations to help improve Thousand Oaks’ walking and bicycling environment. This process is based on traffic conditions, public engagement, other need analyses, as well as the city’s ongoing resurfacing projects. These recommended projects can include many of the facility types and amenities referenced at the beginning of this chapter. Subsequent sections discuss the associated programs that can help to support the city’s long-term mobility goals.
Recommended projects are mapped by facility types and identification number accompanied with tables listing detailed information such as location, route type, extent, and notes. The notes provide additional information, such as right-of-way constraints and additional coordination needed with specific agencies. These notes serve as a reminder that for project implementation, additional design and engineering will be needed to fully assess feasibility.
These preliminary treatments are crucial to mending existing safety and connectivity gaps in the city’s bicycle and pedestrian network. As a next step, the city may consider a low-stress active transportation network by upgrading existing Class 2 bicycle lanes to buffered bicycle lanes to further reduce the level of traffic stress (LTS). A low-stress active transportation network is one that provides ample options for residents, visitors, and anyone in the region to get to and from their destinations in a safe, comfortable, and enjoyable manner by walking, bicycling, or a combination of both. Recommended projects can be implemented at the interval that best fits funding cycles or to take into consideration the availability of new information, new funding sources, updated collision statistics, updated CIP lists, etc.
Project prioritization is data-driven using available data and criteria from regional and national best practices. Some criteria were i modified according to the knowledge of deficiency and need based on community and BAT feedback. The following list includes the various inputs used for the prioritization scoring process.
Number of Attractors (Commercial centers, civic centers, transit stops, other points of interest)
Number of Schools (1/4 mile buffer)
Number of Parks (1/4 mile buffer)
Reported Collisions
Public Transportation to Work (500’ buffer)
Walk to Work (500’ buffer)
Bike to Work (500’ buffer) - for bicycle projects
Households Without Vehicles (500’ buffer)
2016 Population Density (Residents per acre, 500’ buffer)
2016 Employment Density (Employed per 16+ Residents, 500’ buffer)
Sidewalk Priority List - for pedestrian projects
Outreach Comments
The resulting scores can serve as an essential reference for implementation, while they do not necessarily imply which route should be built first. Route implementation timeline depends on the availability of funds for implementation is variable and tied to the priorities of the city’s capital projects.

The bicycle recommendations mainly focus on closing the gaps and completing the bike network in the city as is shown in Figure 4-1. About 16.5 miles of Class 2 bike lanes and 4.2 miles of Class 3 bike routes , some with sharrows are proposed. Two projects are already in design. While Thousand Oaks Boulevard is scored the highest due to the high density of collisions and destinations, it needs more support from the community since it is a centrally located, busy street and the proposed treatment involves lane reduction and potential parking removal.
The Ventura County Transportation Commission (VCTC) has initiated a 101 Improvement Project aiming to preserve the quality of life, reduce existing congestion, improve traffic operations, and accommodate future traffic volumes forecasted in the area. Apart from the improving the highway system, the project also commits to preserve the quality of life, improve the local transportation system, maintain Ventura’s ranking as one of the best places to live, and give residents easy access to local travel. The VCTC is currently in the planning stage for this momentous project. This presents great opportunity to improve inter-community and regional connection along and across HWY 101, which would tremendously benefit residents who would like to take a walk or ride a bike rather than driving. This master plan identifies three potential trails (shown as yellow dash lines in Figure 4-1) that could help connect communities and the region together.
Opportunity for a Class I multi-use path along the south side of HWY 101 to connect both sides of Conejo Ridge Open Space. Further study needed for specific alignment.

Opportunity for a Class I multi-use pathway along the maintenance road on the north side of the channel, between Wendy Drand the Borchard Rd offramp, with access to Michael Dr on the east end.
Opportunity for a Class I multi-use path along HWY 101 to connect Thousand Oaks to Camarillo. Further study needed for specific alignment.


The density and complexity of highway intersections is also a unique situation for the City of Thousand Oaks. A number of bike network gaps occur at major intersections, where high volume and high speed traffic prevails and safety risk is high. This master plan identifies and prioritizes 15 intersections improvements. These intersections vary in types, and some involves highway
interchanges. Most treatments are adding green bike transition lanes, as is shown in the example pictures below. These help guide cyclists through large intersections and help drivers anticipate cyclists on the road. Fencing is proposed at intersections with highway overpass.


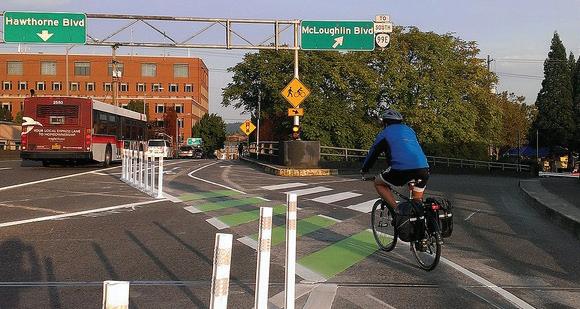
The planning cost estimate summary is a compilation of individual planning cost estimates for each proposed bicycle corridor project in the City of Thousand Oaks per the Active Transportation Plan. Each proposed facility was assessed from a high level constructability perspective. Based on the assessment, the cost was calculated based on several factors:
• Construction/Material Cost: This cost identifies the materials needed to construct the proposed improvement and its associated unit cost. The unit cost was based on the adjusted average price per unit from Caltrans’ cost database for District 7 and other sources.
• Design / Permitting / Management / Engineering / Civil Cost: A lump sum based on a 50-150% percent of the construction/material cost was utilized for planning purposes.

• Contingency: A lump sum based on a 30% percentage of the total of construction/material and design/permitting/management/engineering/civil costs was utilized for planning purposes.
It should be noted that the unit cost and percentages can be easily be changed through the Excel planning cost estimation tool if more localized values are available or to see how the different factors affect the cost.
It is important to note that the costs are planning level only and design plans are needed to determine an engineer’s cost estimate. The cost may also very substantially based on the magnitude of variety of factors such as right of way acquisition, environmental, drainage and other factors.


The City of Thousand Oaks is well served by sidewalks, with relatively few streets lacking them. The pedestrian recommendations also aim for maximize connectivity and accessibility. A total of 44 projects are identified and scored, including 12 miles of sidewalks on both side of the streets and 18 miles on one side or mixed sides of the streets. Figure 4-2 shows all the sidewalk projects, and Figure 4-3 is a zoomed in map for the downtown area where projects are in proximity to and intersect others. All sidewalk projects are to meet ADA standard with ramp and truncated domes at the intersections.
Table 4-3 lists the projects by major street name, and provides more informations such as proposed length of sidewalk and sides of the street or mix of gaps and existing sidewalks. Final project extent and potential lighting improvements may vary depending on funding, community needs and ongoing projects.


The planning cost estimate summary is a compilation of individual planning cost estimates for each proposed pedestrian project in the City of Thousand Oaks per the Active Transportation Plan. Each proposed facility was assessed from a high level constructability perspective. Based on the assessment, the cost was calculated based on several factors:

• Construction/Material Cost: This cost identifies the materials needed to construct the proposed improvement and its associated unit cost. The unit cost was based on the adjusted average price per unit from Caltrans’ cost database for District 7 and other sources.
• Design / Permitting / Management / Engineering Cost: A lump sum based on a 30% percent of the construction/material cost was utilized for planning purposes.
• Drainage / Landscaping / ROW / Utilizes: A lump sum based on 15-30% percent of the construction cost was utilized since for planning purposes.
• Contingency: A lump sum based on a 30% percentage of the total of construction/material, design/permitting/management/engineering cost, and the drainage/landscaping/ROW/ Utilities costs was utilized for planning purposes.
It should be noted that the unit cost and percentages can be easily be changed through the Excel planning cost estimation tool if more localized values are available or to see how the different factors affect the cost.
It is important to note that the costs are planning level only and design plans are needed to determine an engineer’s cost estimate. The cost may also very substantially based on the magnitude of variety of factors such as right of way acquisition, environmental, drainage and other factors.


The practice of active transportation has been quickly evolving during the development of this master plan with the rise of new mobility options such as shared and private bikes and scooters. While these are convenient additions to fulfill residents’ first-last mile travel needs, they may also create regulation and safety problems. The City of Thousand Oaks may see the emergence and growth of these options in different forms. For future needs, the city may look to utilize and expand the existing bike Fixit stations to improve service for bicycles but flexible enough to accommodate potential storing and repairing needs for private or shared new mobilities. Examples of new station locations may include Wendy Drive and Potrero Road, the Lakes Shopping Center, and the Oaks Mall.


This section comprises a diverse menu of programs intended to support the projects recommended in this plan. Due to a long history of routine accommodation for pedestrians (i.e. sidewalks, crosswalks, dedicated signals, etc.), programs targeting walking are relatively uncommon. Conversely, the historic lack of routine accommodation for bicyclists has fostered confusion about the role of bicycles in the overall transportation system and has necessitated an impressive diversity and breadth of bicycle-related programs. Despite a common emphasis on projects, bicycle programs remain an important element of a successful bicycle plan. The following sections offer some background on the changing “state of practice” in bicycle programming, namely the increased integration of programs and projects, culminating in a comprehensive menu of bicycle and pedestrian programs.
There has been a shift away from the traditional, compartmentalized “Six Es” approach developed by the League of American Bicyclists (Engineering, Education, Encouragement, Enforcement, Evaluation and Planning, and Equity) and toward a more integrated and complementary menu of initiatives. By offering such a menu, rather than a prescriptive list, active transportation programming can more accurately address the existing conditions and the desired outcomes of a given context.
In addition to changes in the content and organization of active transportation programs, there has also been a shift in implementation strategies. Programs are increasingly targeted at specific project areas, in conjunction with the construction of bicycle and pedestrian facility projects. The implementation of a capital project represents a unique opportunity to promote a city’s active transportation system and bicycling and walking
as attractive transportation options. Projects or “Engineering” represent the most visible and perhaps most tangible evidence of a great place for bicycling. The same can be said for walking. A new bicycle facility attracts the attention of bicyclists and non-bicyclists alike. As such, it represents a great opportunity to reach out to the “interested, but concerned” within the neighborhood. Impact to this target group will be strongest by directly linking facility improvements and supportive programs. In this way, bundling bicycle programs with projects represents a much higher return on investment for both.
The programs recommended for the City of Thousand Oaks are organized as a menu of initiatives, each listed under a broad category:
Education/Encouragement/Marketing
Education/Enforcement
Monitoring and Evaluation
Education, Management & Marketing
Education & Enforcement Monitoring & Evaluation
These categories are not definitive. They are merely intended to offer some level of organization to the many program initiatives, the majority of which fall into at least one category.

The BikeSafe campaign was designed to promote bicycle safety and to educate the community about good bicycling practices. This campaign focuses on youth and adult bicyclists by providing the following:
Bicycle-friendly bilingual route maps with safety tips
Bicycle safety presentations for children
BikeSafe materials and information at community events
Bicycle Rack Grant Program
The Bicycle Rack Grant Program is a partnership between BikeSafe and the city’s Community Engagement Grant program and the local Eagle Scouts. This program aims to encourage bicycling as an alternate mode of transportation within Thousand Oaks by providing free bicycle racks to local businesses and other activity centers. The Bike Rack Program includes:
Grant of one or more bicycle racks per applicant
Bicycle rack location assistance including installation assistance
Recognition of grant recipients - press releases and city BikeSafe website
Inclusion of bicycle rack location on the city’s Bicycle Facilities Map
The Conejo Schools Foundation established the Cycles for Success initiative to provide bicycles for students who do not have access to school or public transportation. As of today, a total of 15 students that live far from their schools have benefited. In addition to bicycles, this initiative also provides students with bicycle locks and helmets.

Community bicycle programs, also known as Bike Kitchens, are commonly formed as grass roots initiatives by community members within low income and underserved communities to provide bicycles, helmets, maintenance and safety instruction to people as a means of expanding their transportation options and providing people better access to work and services.
The City of Thousand Oaks could support the creation of a Bike Kitchen and leverage its resources in coordination with the bicycle facilities prioritized in the ATP. This combination will help to encourage an increase in bicycling mode share, serve as a missing link in the public transit system, reduce GHG emissions and provide additional “green” jobs related to system management and maintenance.
This initiative promotes safe bicycling through community-based outreach, which helps bridge the gap between people who want to start riding and the availability of opportunities to help people learn to bicycle safely. The city could support this program through funding or, at least, in-kind contributions. The

Bicycle ambassadors may concentrate their efforts along corridors of existing and/or planned bicycling facilities. Bicycle ambassadors could also offer great value in areas and among populations with a high latent demand for bicycling and in areas with high collision rates.

This one-day October event in more than 40 countries celebrates the many benefits of safely walking and bicycling to school. The National Center for Safe Routes to School, which serves as the clearinghouse for the federal Safe Routes to School (SRTS) program, coordinates online registration efforts and provides technical support and resources for Walk to School Day. For more information, go to www.walktoschool.org.
Since 1956, communities from all over the country have celebrated National Bike Month as a chance to showcase the many benefits of bicycling, as well as to encourage people of all ages and backgrounds to bicycle more often. The biggest event that takes place during Bike month is Bike to Work Day. Local business, non-profits, and entire city agencies participate by either hosting pit stops where bicyclists can stop to gather healthy food and drinks, or by simply bicycling to work.

An Open Street event, or a Ciclovía (“bicycle path” in Spanish) is a temporary event where a street is closed to vehicles for use by people and non-motorized transportation. While ciclovias began in Bogotá, Colombia, they have gained considerable popularity in the United States. In southern California, Ciclovias have become known as Open Street events, celebrations of liveable streets and communities, encouraging citizens and businesses to get out onto the streets and enjoy their city through active participation.
While all Open Street events are alike in their creation of a people-oriented, carfree space, they are otherwise unique. In some cities, the event occurs once or twice a year, while in others it occurs every Saturday or Sunday for an entire season. Some routes are circuitous, while others are linear. Most include parks or other open public spaces. Most events include music, performance, games, and other activities, some of which is scripted and some spontaneous. Event routes often incorporate and highlight new bikeways or preferred routes, encouraging their use and maximizing investment.
Thousand Oaks hosted a successful inaugural Open Street Festival, Spokes in the Oaks, on October 31st, 2015. The City invited the community to come out and play on almost 2 miles of closed streets. The route included Townsgate Road, Hampshire Road and a portion of Agoura Road. Parking lots were open on Townsgate Road and Hampshire Road and accessible by roads with controlled crossings. These streets were closed to motorized traffic for the day, bringing the streets alive with all forms of people-powered movement to promote better public health, flexibility and fun, sustainable transportation. The event also included live music performance, food and Halloween themed activities.
It would benefit both the active transportation community and local retailers to re-initiate such Open Street events. The City should consider hosting them as a local annual or bi-annual festival.


The Southern California Association of Governments (SCAG) can provide Open Streets assistance through their Go Human initiative, a community outreach and advertising campaign to help reduce traffic collisions in Southern California and to encourage people to walk and bicycle more. The city should coordinate with SCAG for implementing an Open Streets event.

If the ultimate aim is to promote bicycling as a legitimate form of transportation, all officers should receive some form of bicycle training and should be offered LCI training, if possible. Appropriate training regarding pedestrian issues and solutions should be provided as well.

This liaison would be the main contact for Thousand Oaks residents concerning bicycle and pedestrian related incidents. This liaison would perform the important function of communication between the law enforcement agency and bicyclists and pedestrians. The liaison would be in charge of the supplemental education of fellow officers regarding bicycle and pedestrian rules, etiquette and behavior. The liaison should be LCI certified, as well as ride a bicycle while on duty, as appropriate. Funding should be allocated for the training and support of this duty, as well as for necessary bicycle equipment.
Many law enforcement departments employ targeted enforcement to educate drivers, bicyclists, and pedestrians about applicable traffic laws and the need to share the road. These efforts are an effective way to expand mobility educa-
tion, such as in the form of a brochure or tip card explaining each user’s rights and responsibilities. Targeted enforcement may help mitigate the following traffic safety problems:
Speeding in school zones
Illegal passing of school buses
Parking violations – bus zone, crosswalks, residential driveways, time zones
Risks to bicyclists during drop-off and pick-up times
Lack of safety patrol/crossing guard operations
Unsafe bicycling and pedestrian practices
Other school zone traffic law violations
This approach has been successful in Los Angeles where four officers, one for each Police Department Traffic Division, have been dedicated solely to bicycle safety and outreach.

If law enforcement officers observe a bicyclist riding at night without the proper reflectors or lights, they may give the bicyclist a light, along with a note or friendly reminder about the light requirement and its importance. This provides a positive and educational interaction rather than a punitive one. This program could be funded through a safety-oriented grant. Many cities have targeted the end of daylight savings as an ideal time to perform this function.

Helmet giveaway programs are another opportunity for positive education and interaction. Law enforcement departments have conducted public events to hand out helmets, as well as distributing them in the community during the course of patrol when an officer sees a child riding helmetless.
Design a communication process that encourages students and parents to notify the school and law enforcement of the occurrence of a crash or near-miss during school commute trips involving auto, bus, pedestrian or bicycle transportation. Include not only the Police Department, but also the Planning Department and SRTS stakeholders in this reporting system to help better use the data generated. Enlist the help of law enforcement with a number of traffic safety duties:
Enforcement of traffic and parking laws through citations and warnings.
Targeted enforcement of problem areas – an intensive, focused effort during the first two weeks of school, as well as a strategy for the rest of the year.
Participation in traffic safety programs such as SRTS Task Force, etc.
Los Angeles has a successful program called the LA Bike Map that allows bicyclists to submit incidents, see them displayed instantly, and study the overall pattern, dynamically, in one place.
While the city’s Bicycle Coordinator managed this Active Transportation Plan, formally broadening the position to address pedestrian issues would demonstrate the city’s commitment to walking and creating more “complete streets,” as well as bicycling. An Active Transportation coordinator or program manager can help coordinate between city departments to ensure project planning consistency and cooperation. This coordinator would manage programs and implement projects listed in the ATP, and would be responsible for timely updates. This includes maintaining a prioritized list of improvements, appropriate funding sources, and updating cost estimates. This investment in staff is often returned since this position is usually responsible for securing State and federal funding.
While the city has an active Bicycle Advisory Team that provided valuable oversight for this Active Transportation Plan, many municipalities have developed bicycle and pedestrian, or active transportation advisory committees to address walking along with bicycling, and some address overall mobility, including transit. This group can act as a community liaison and support city staff, volunteers, and advocate efforts
to address issues concerning local bicycling and walking, as well as regularly evaluate the progress of improvements in this Active Transportation Plan. City support is imperative for creating the committee, budgeting time and resources for city staff, and for elected officials to attend and to support the committee.
Conduct regular bicyclist and pedestrian counts throughout the city to determine baseline mode share and subsequent changes. Conducting counts would allow the city to collect information on where the most bicycling and walking occur. This assists in prioritizing and justifying projects when funding is solicited and received. Counts can also be used to study bicycling and walking trends throughout the city. Analysis that could be conducted includes:
Changes in volumes before and after projects have been implemented
Prioritization of local and regional projects
Research on clean air change with increased bicycle use
Counts should be conducted at the same locations and at the same times every year. Conducting counts during different seasons within the year may be beneficial to understanding the differences in bicycle and pedestrian traffic volumes based on seasonal weather. In addition, bicycle
and pedestrian counts should be collected as part of any existing traffic counts. Results should be regularly recorded for inclusion in the bicycle and pedestrian report card (see next section).
The Thousand Oaks Police Department should collect and track collision data. Regular reports of traffic collisions should be presented to the advisory committee. Traffic collisions involving bicyclists and pedestrians should be regularly reviewed and analyzed to develop plans to reduce their frequency and severity. Any such plans should include Police Department involvement and should be monitored to determine their effectiveness. Results of the number of collisions should be recorded in a bicycle and pedestrian report card described in the next section.
The city could develop a bicycle and pedestrian report card, a checklist used to measure the success of plan implementation, as well as effort made, within the city. The report card could be used to identify the magnitude of accomplishments in the previous year and general trends. The report card could include, but not be limited to, keeping track of system completion, travel by bicycle or on foot (counts) and safety.
The city can use the report card to track trends, placing more value on relative than absolute gains (in system completion, mode share, and safety). For example, an upward trend in travel by bicycle
or on foot would be viewed as a success, regardless of the specific increase in the number of bicyclists or walkers. Safety should be considered relative to the increase in bicyclists and walkers. Sometimes crash numbers go up simply because bicycling and walking increases, at least initially. Instead, measure crashes as a percentage of an estimated overall mode share count.
A major portion of the report card would be an evaluation of system completion. An upward trend would indicate that the city is progressing in its efforts to complete the bicycle and pedestrian network identified in this document. The report card could be developed to utilize information collected as part of annual and on-going evaluations, as discussed in the previous sections. The report card is not intended to be an additional task for city staff, but rather a means of documenting and publicizing the city’s efforts related to bicycle and pedestrian planning. It can be a task of the advisory committee to review annual report cards and to suggest future plan and goal adjustments.
In addition to quantifying accomplishments related to the bicycle plan, the city should strive to quantify its efforts. These may be quantified as money spent, staff hours devoted or other in-kind contributions. The quantified effort should be submitted as a component of the bicycle and pedestrian report card. Some cities publish their report cards online.
Bicycle Friendly Community designation is part of a program offered by the League of American Bicyclists (LAB) intended to provide communities with guidance on becoming more bicycle friendly and to award recognition for their achievements. Like the report card described previously, Bicycle Friendly Community designation provides a standard by which the City of Thousand Oaks can measure its progress toward bicycle friendliness. It could be a function of the Bicycle Advisory Team to support city staff to compile an updated application to improve upon its current Bronze level Bicycle Friendly Community status.

Federal, state, and local government agencies invest billions of dollars every year in the nation’s transportation system. Only a fraction of that funding is used to develop policies, plans, and projects to improve conditions for bicyclists and pedestrians. Even though appropriate funds are available, they are limited and often hard to find. Desirable projects sometimes go unfunded because communities may be unaware of a fund’s existence or may apply for the wrong type of grant. In addition, there is competition between municipalities for the limited available funds.
Whenever federal funds are used for bicycle and pedestrian projects, a certain level of State and/or local matching funding is generally required. State funds are often available to local governments on similar terms. Almost every implemented active transportation or complete street program and infrastructure in the United States has had more than one funding source and it often takes a good deal of coordination to pull the various sources together.
According to the publication by the Federal Highway Administration (FHWA), An Analysis of Current Funding Mechanisms for Bicycle and Pedestrian Programs at the Federal, State and Local Levels, where successful local bicycle infrastructure programs exist, there is usually an active transportation coordinator with extensive understanding of funding sources. Cities such as Seattle, Portland, and Tucson are prime examples. City staff are often in a position to develop a competitive project and detailed proposal that can be used to improve conditions for bicyclists and pedestrians within their jurisdictions. Some of the following information on federal and state funding sources was derived from the previously mentioned FHWA publication.
Table 5-1 identifies potential funding opportunities that may be used from design to maintenance phases of projects. Due to trends in Low Impact Development (LID) and stormwater retention street designs, funding sources for these improvements not only increase the chances for first and last mile improvements, but can also be incorporated into streetscape and development projects. The funding sources are arranged into federal, State, local, and private categories. The right side of the table lists both typical and atypical approaches to address each funding source. Many funding sources can be accessed through atypical project approaches such as including an urban forestry, LID, or culture and history component.
Thousand Oaks Active Transportation Plan
Thousand Oaks Active Transportation Plan