17 minute read
Rheology: Bread dough rheology
from f2m Automation Book
by landmagd
Fundamental and empirical measurements
Bread dough rheology
Cereal scientists have developed a range of test instruments for measuring the important properties of wheat and flour. However, no single instrument is available to inform the baker fully about the settings required for optimal dough mixing. This article explores the range of fundamental and empirical methods for measuring dough rheology and what they can be used for.
+It is often stated by bakers that the single most important process in bread making is to mix the dough to its optimal quality. If this is achieved, the downstream processing stages will work smoothly and the baked bread will be of consistently high quality. This means that the dough rheology must be optimal at the end of mixing. To achieve this, firstly it is essential that techniques are available to measure dough rheology and, secondly be able to determine critical settings such as flour water absorption and mixing time. If only it was this simple.
Measurement of dough rheology has challenged the milling and baking sectors for around a century.
Fundamental rheology methods
Instrumental methods for measurement of rheological properties of materials can be divided into two broad classes: + Fundamental tests that measure the inherent properties of the material and do not depend on the geometry and shape of the sample, the conditions of loading or the type of apparatus used. Typically, the properties measured, to name just two include relaxation time and shear modulus. + Empirical tests or imitative tests are those where the mass of sample, geometry and speed of test will decide the magnitude of the parameters measured. Typical examples include texture profile analysis which uses a compression force to measure parameters such as hardness and springiness.
Bread dough is a complex multi-phase material, and, like other structured foods, it displays both viscous and elastic properties, otherwise referred to as a viscoelastic material. Viscoelastic foods lend themselves well to dynamic fundamental tests performed on rheometers. The frequency sweep test in which the frequency of the applied stress or strain frequency is varied is a typical example of a dynamic test. Different types of dynamic tests can be used to study the viscoelastic properties of dough systems. These include creep recovery, stress relaxation and dynamic oscillatory tests.
In a creep test a very small but defined shear stress is applied until shear strain increases at a constant rate. Once this constant rate is reached, the applied shear stress is removed and the material is allowed to reach an equilibrium state. There are two primary pieces of information generated by a creep test: + Zero Shear Viscosity – This is the viscosity of the material under very low shear conditions. It is difficult to measure because of the extremely
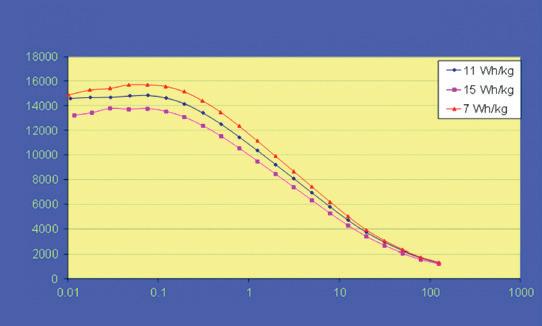
Figure 1: The effect of work input in dough development
low shear conditions and is the subject of much debate about its relationship with yield stress. + Equilibrium Compliance – This is the elastic response of the material to strain and it provides information of the viscoelastic component of a material.
In a stress relaxation test, the material is suddenly brought to a given deformation (strain), and the stress required to hold the deformation constant is measured as a function of time. Even though creep and stress relaxation tests are straightforward to perform, there are two disadvantages in these tests. The first disadvantage is the time it takes to get the complete information about viscoelastic properties of the material, which can be long. For dough systems, this is important because dough is a dynamic system and its properties change continuously with time. For example, yeast and enzymes are continually changing the rheological properties as they generate new materials from the substrates such as starch and protein. The second disadvantage is the difficulty in providing a truly instantaneous application of stress or deformation at the start of the experiment. These disadvantages can be overcome by dynamic tests in which the specimen is deformed by stress which varies sinusoidally with time.
In the dynamic oscillatory tests, the dough material is subjected to deformation or stress that varies sinusoidally with time. The deformation or stress generated in the dough which also varies sinusoidally is measured. The storage modulus (G´) and the viscous modulus (G´´) are defined as follows:
where τ0 is shear stress (Pa), θ is the phase shift and γ0 is the shear strain (s-1).
Dough made from wheat flour is sensitive to the mixing energy used to develop the dough. It is vital to develop dough to its optimal level in order to achieve the correct viscoelastic properties that will ensure a good quality bread is produced. Figure 1 shows the dependency of the glutenforming proteins to mixing energy imparted by the mixer. The optimal elastic properties were achieved with a lower mixing energy, with additional mixing energy resulting in a reduction of the elastic modulus.
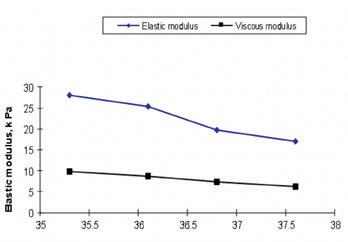
The level of water addition is very important for dough rheology. Too much water leads to soft sticky doughs which can cause processing problems with dough sticking to transfer surfaces and becoming damaged between sheeting rollers. However, a lower level of water produces dough of firmer texture which can also be damaged between rollers, and it will resist expansion during proving and baking. Water addition becomes even more tricky to estimate when water-absorbing components such as fiber are added to the dough. Figure 2 shows the response of the viscoelastic properties of the dough with added fiber for increasing levels of water addition.
Oscillatory shear measurements are a sensitive way to determine the change in interactions within a dough system when other functional ingredients are added. Enzymes are one example of an ingredient added at low levels but with a disproportionate effect on rheology. Enzymes are frequently added to dough systems to improve the handling properties of dough as well as for
Elastic modulud (Pa) Effect of work input on dough development
Applied strain (%)
© Campden BRI
Wholemeal flour
Elastic modulud, k Pa
© Campden BRI G' k Pa Δ
Time (min)
improving the quality of the bread and to increase shelf ife. However, enzymes are employed at low levels, typically parts per million on flour weight. It is not easy to determine the correct level of addition without carrying out time-consuming trials to bake bread containing different concentrations of an enzyme.
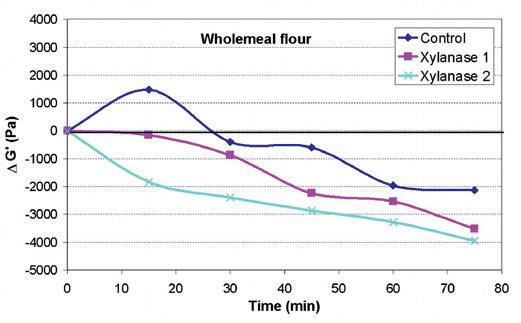
The hydrolytic action of an enzyme such as a xylanase, when acting on the hemicellulose components of flour, breaks down the structure of this substrate and the enzyme action also releases water which lowers the consistency of the dough. Oscillatory measurements can be used to follow the change in the dough with time. In Figure 3, the change in the storage (elastic) modulus of the dough compared with the value obtained of the control dough at time point zero was used to study the activity of two xylanases from different suppliers. Xylanase 2 was found to be considerably more active than xylanase 1 and lowered the storage modulus more rapidly. This indicated that if the same enzymes were used at the same activity level, the dough with xylanase 2 would be considerably softer and may lead to handling problems on the plant with the result that the bread quality may also suffer.
Oscillatory rheology measurements can be an effective way to evaluate the activity of a particular ingredient such as an enzyme, oxidizing agent or emulsifier. Results from a rheometer test are sufficiently sensitive to indicate whether the dough recipe is likely to cause problems during processing. This can reduce the number of mixing and baking experiments required.
Empirical tests
As shown from the rheological tests, dough is a complex material that exhibits both viscous (fluid-like) and elastic (solid-like) behavior when forces are applied to it. When fully hydrated and developed, gluten-forming proteins and polysaccharides are mostly responsible for this viscoelastic nature. Since the main recipe component in conventional bread dough is wheat flour, this contributes to much of the functionality of dough.
Understanding all the functionalities of flour is a challenging subject. Over many years, the wheat and flour sectors have developed and applied a series of unique testing methods that are not found in other sectors. These tests measure the quality of wheat and flour so their suitability for making bakery products can be determined. The measured properties have parallels to the more scientific properties measured from viscometers and rheometers but with the advantage that they can be undertaken by the milling or baking companies. There are many unique instruments developed by the milling and baking sectors, with each measuring different properties of flour. In addition, there are further instruments that measure critical wheat properties such as moisture, protein, kernel weight, hardness and Hagberg Falling Number.
© Campden BRI
Figure 2 (left): Change in viscoelastic properties of a dough with fiber addition
Figure 3 (right): Effect of xylanase addition on the rheological properties of a wholemeal flour dough
No single instrument, or test, has yet been invented that provides all the information required on flour properties. This is because flour is multifunctional. The main properties for baking performance of flour are as follows: + Elasticity: This is very important for bread making. The dough needs to have the elasticity to allow the gas bubbles to expand as various gases inflate them during proof and baking.
If the bubbles cannot stretch, they will break, resulting in lower bread volume and firmer texture. For biscuits, elasticity is not desirable as it causes spring back that makes shape control difficult during molding or depositing. + Viscosity: This is a measure of how much a material will flow. Dough or batter both need to flow although to a different extent. The dough must be sufficiently viscous so it retains its shape when molded. Batters require lower viscosities than dough so they can flow into their natural shapes or into molds. + Extensibility: This is a measure of the ability of the dough to stretch or deform without breaking. It is largely dependent on the quality
of the network created by the gluten-forming proteins. Dough should have enough extensibility to allow dough expansion during proving and baking. + Resistance to deformation: This concept is equivalent to dough softness and relates to the ease of shape change during sheeting and molding. It must be possible to mold dough without damaging the delicate gas bubbles incorporated during mixing.
The following are examples of the many empirical methods used in the baking and milling industry. Table 1 is not an exhaustive list but some of the more commonly used tests in the industry. These tests measure the rheological properties of dough and batter under conditions that simulate, as much as possible, the processing conditions found in commercial plants.
Two of the main instruments used by the flour sector are the farinograph and alveograph. These are very different in their mode of operation yet can provide similar information for bakeries to
Table 1: Commonly used flour testing instruments
Instrument Details
Farinograph or Mixograph Measures the resistance over time of dough against mixing blades or pins operating at a specific speed (rpm) and temperature. Resistance to deformation is measured by the motor torque in dimensionless values (e.g. Brabender Units, BU). Several parameters are calculated from the farinograph trace.
Extensograph Measures the extensibility and resistance to extension of a fully mixed, relaxed flour/water dough. Deforming forces are applied via a hook that moves at a constant rate until the dough ruptures. Resistance to deformation is measured in Pa or N/m2, or in dimensionless values (e.g. Brabender Units).
Alveograph
Mixolab
Amylograph or Rapid Visco Analyser (RVA)
Viscometer Measures the resistance to deformation of a flour/water dough by inflating the dough piece into a bubble until it ruptures. Several parameters are calculated from the alveograph trace. Measures the resistance to deformation of a flour/water dough while subjecting it to variable shear forces and heating and cooling cycles. Resistance to deformation is measured as motor torque in N.m. Measures the resistance of a flour and water slurry in a container while it is stirred by a paddle or mixing pins and heated above the starch gelatinization temperature. Measures the resistance to deformation over time of a flour/water slurry or batter while it is subjected to heating and cooling cycles. Resistance to deformation is measured as viscosity in Pa.s, centipoise (cP), or dimensionless values.
help with recipe and process needs. Both instruments have received widespread global use for measuring the properties of bread dough. The key features of these are described in the next sections.
Farinograph
The farinograph dates to 1928 when Carl Brabender established a method for measuring and predicting the baking qualities of bread flour. It is an instrument that measures the resistance to deformation during the mixing of flour and water into dough. This is similar to the changes expected within a dough mixer in a bakery. Dough resistance is expressed as motor torque, in dimensionless units known as Brabender Units (BU). During the test, the dough is developed past its optimal point until it starts to break down. This is useful information for a bakery to know how a dough will behave through the processing stages from mixing, dividing, molding and proving.
There are several important parameters from the farinograph that define the bread-making ability of a flour. One of the most important is the water absorption of the flour. This is estimated by adjusting the water required to achieve a fixed value of 500 BU at the peak torque. This value is internationally accepted as representative for bread dough but with one main exception. This originates from the UK, where the peak dough consistency is taken at the 600 BU line. This difference is attributed to the high shear style of dough mixing used for bread making using the UK’s Chorleywood Bread Process. Several countries that also use the same process have adopted the 600 line.
Farinograph traces will identify flour suitable for different bakery applications. A flour suitable for bread making will have different farinograph parameters to one for biscuit making. Figures 4 and 5 show examples of farinograph traces for bread and biscuit flours, respectively. Bread flours have higher levels of stability than biscuit flours and do not show as much reduction in consistency during mixing. Several flour parameters are derived from the traces: + Water absorption (%). The amount of water added to achieve the 500 BU line, expressed as a percentage of the flour (14% mb). Water absorption is used to adjust the water in commercial dough recipes. + Dough development time, mixing time or peak time. This is the time (in minutes) between time zero and the maximum or peak torque.
Dough development time is used to make adjustments during mixing in commercial processes when the flour mixing requirements change. + Stability. This is the difference in minutes between the arrival time (the time at which
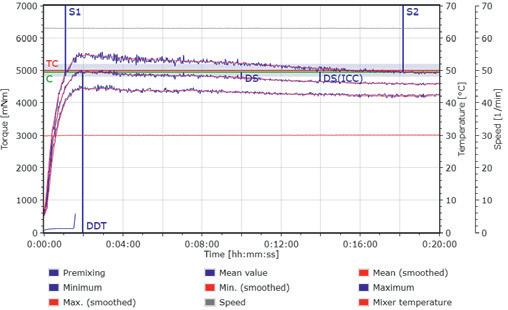
Figure 4: Farinograph for a bread flour
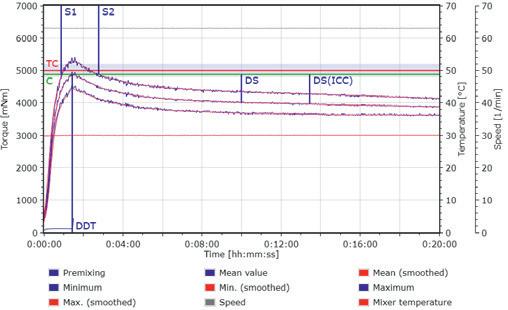
Figure 5: Farinograph for a biscuit flour
© Calibre Control International Ltd
© Calibre Control International Ltd
INTERVIEW BREAD DOUGH RHEOLOGY MEASUREMENTS – FUNDAMENTAL AND EMPIRICAL
the curve reaches the 500 line and departure time (the time at which the curve falls below the 500 line). It is a measurement of how well a flour resists overmixing. + Degree of softening. This is the reduction in consistency from the maximum peak to the value at a period of time later. There are small differences between ICC and AACC definitions but essentially it is a measure of how much consistency loss there is after a fixed time.
Alveograph
The alveograph is a modified version of the extensometer invented by Marcel Chopin in 1920. An alveograph is an instrument to measure the properties of flour for baked products such as bread, noodles, tortillas and biscuits. It does this by injecting air into a thinly stretched sheet of dough to form a bubble, which is inflated and bursts. This simulates the processes taking place within dough as gases swell the bubbles during proving and oven spring in baking. The elasticity and strength of the bubble are important to know about in order to predict the baking performance of a flour.
The test involves mixing flour, water and salt for around eight minutes to form dough for testing. It is extruded and divided into five pieces that are sheeted to a controlled thickness. After resting, the dough sheets are cut into discs and each one inflated by injecting air at constant pressure and flow rate until the resulting bubble bursts. The pressure inside the bubble and time for the bubble to burst are measured for each of the five dough pieces.
There are various parameters that are derived from the alveograph data: + P (y-axis): Height of the peak when the bubble bursts, which is related to the resistance of the dough to deformation (tenacity). + L (x-axis): Length of the curve, or distance at which the bubble breaks, which is an indication of the dough extensibility. + Elasticity Index (Ie): Compares pressure after 200 mL of air has inflated the bubble versus the maximum pressure (P). + W: Total area of the curve, which equates to the energy required to expand the dough. + P/L ratio: This represents the balance of the elastic and viscous components of the dough. + Swelling index (G): is the square root of the volume of air required to rupture the dough.
Figures 6 and 7 show alveographs for strong bread making and weak biscuit flour respectively. Flour for bread making requires elasticity to enable the bubbles to increase in volume, whereas for biscuit making, elasticity is a disadvantage. The ratio of P/L is one of the most used alveograph parameters because it indicates the elasticity and strength of a flour. Bread flour tends to have higher P/L values than biscuit flour because of the need for elasticity. For example, UK flour for export uses P/L targets of 0.9 maximum for ukp (premium bread making wheat) and 0.55 maximum for uks (soft wheat).
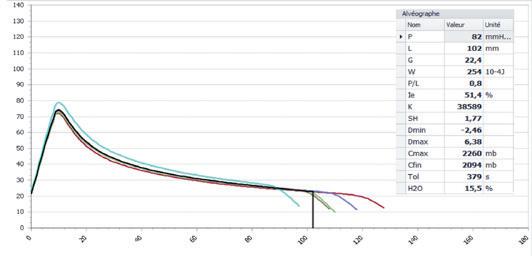
Figure 6: Alveograph for a strong bread flour
© CHOPIN Technologies
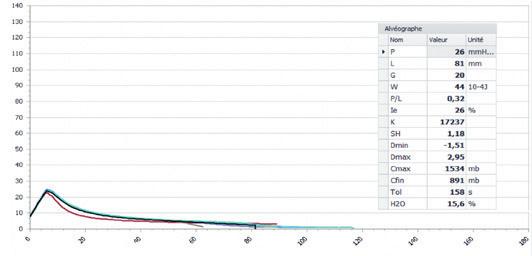
Figure 7: Alveograph for a weak biscuit flour
© CHOPIN Technologies
Summary
The rheological characterization of bread dough is complex and requires both fundamental and empirical methods. Fundamental methods can be used on full bread recipes to investigate the changes in rheology when adding one or more of the minor ingredients. These provide elastic and viscous components of the rheology. Small quantities of enzymes, oxidizing or reducing agents, and emulsifiers can make a measurable difference to the rheology and therefore the bread quality. This can be investigated using fundamental rheology tests. Empirical methods, on the other hand, are designed to work on flour/water systems. They enable the mill to produce flour that meets the baker’s need and for the baker to calculate the correct process settings for that flour. There are many empirical tests available to the miller and baker, and the choice depends on the application. Farinograph and alveograph are described in the article. There is at least one major challenge with dough rheology testing. Attempts to characterize the rheological properties of wheat flour with a single empirical test have not yet proved successful. The holy grail is the all-encompassing flour test that provides bakers with the information they require for setting the recipes and processing conditions. The industry has used empirical methods for 100 years and is yet to find that single test. Technology and instrumentation advances may provide the answer, but for now it seems likely that several tests are going to be required for the foreseeable future. +++
Authors
Gary Tucker and Sarabjit Sahi, Campden BRI
Gary Tucker is a Fellow and Sarabjit Sahi manages the Rheology and Texture section
References
AACC Approved Methods of Analysis (1999), 11th Edition. AACC
Methods 54-21.02 Rheological Behaviour of Flour by
Farinograph: Constant Flour Weight Procedure. http:// methods.aaccnet.org. AACC Approved Methods of Analysis (1999), 11th Edition. AACC
Methods 54-30.02 Alveograph Method for Soft and Hard
Wheat Flour. http://methods.aaccnet.org. ICC Standard No. 121 (1992). Method for using the Chopin
Alveograph (matrix: wheat flour; analyte: rheological
Properties) https://icc.or.at/publications/icc-standards/ standards. Barnes, H.A. and Walters, K. (1985). The yield stress myth?
Rheologica Acta, 24:323-326. Caballero, P.A., Gomex, M. and Rosell, C.M (2007). Bread quality and dough rheology of enzyme-supplemented wheat flour. European Food Research and Technology 224(5):525534. Faridi, H. and Faubion, J.M. (1990). Dough rheology and baked product texture. Springer US. Millar, S. and Tucker, G. (2012). Controlling bread dough development. Chapter 16 in Breadmaking (Second Edition),
Elsevier. Posner, E.S. and Hibbs, A.N. (2011). The Flour Mill Laboratory.
Wheat Flour Milling, 2nd printing, American Association of
Cereal Chemists, Inc., pp. 47–99.


