HYDROGRAPHIC SURVEYING FOR CYCLONE GABRIELLE DRONE TECHNOLOGY RESPONSE
AERIAL SURVEYING: RAPID RESPONSE IMAGERY

June 2023 #112

HYDROGRAPHIC SURVEYING FOR CYCLONE GABRIELLE DRONE TECHNOLOGY RESPONSE
AERIAL SURVEYING: RAPID RESPONSE IMAGERY

New Zealand is no stranger to natural disasters, but the past few years have certainly been record-breaking for natural and climate-change related events.
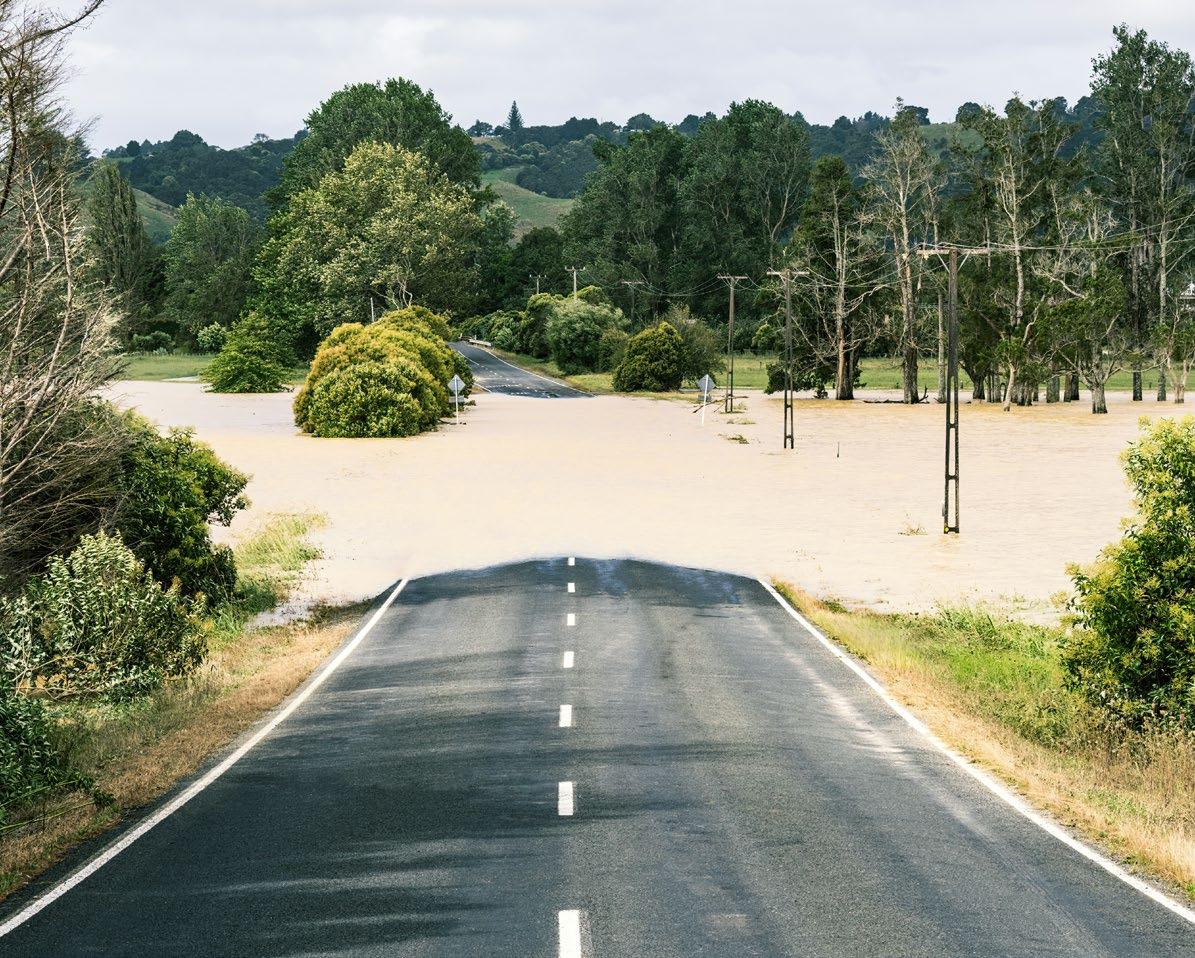
Severe flood events have affected a number of regions around the country, from Westport’s 1-in-100-year town flood to the Nelson, Tasman and Marlborough regions in 2022, to this year’s 1-in-200 year Auckland floods and the devastating impacts of Cyclone Gabrielle.
NIWA reported that an entire summer’s worth of rain fell in one day during the Auckland floods, considered the worst in Auckland’s modern history and the clean-up from Cyclone Gabrielle is still an ongoing task for many communities in Tairāwhiti and Hawke’s Bay.
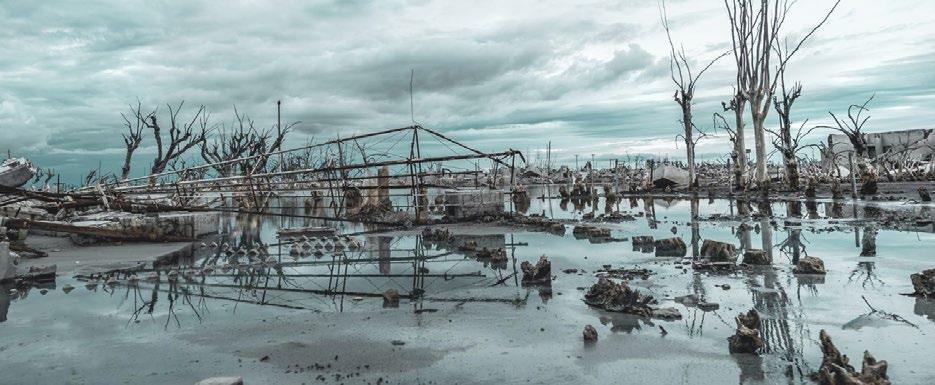
Aerial photos after Cyclone Gabrielle revealed extensive damage and destruction to those regions’ infrastructure, land and personal property and left many towns and communities cut off from support services.
Many organisations including NIWA, the University of Canterbury and GNS Science have joined forces alongside the Hawke’s Bay Regional Council to help provide important data to assess
the risk of future events and assist with long-term recovery.
Aerial surveys, LiDAR data and forecasting river flows are helping researchers to build a clearer picture of the extent of damage and what this may mean in the long term for these communities and many others, to prepare and respond to future events.
These insights will help emergency management services around New Zealand make better informed decisions and develop stronger policies and strategies for the future. In this edition of Survey +Spatial, we’re focusing on the theme ‘Disaster Response’, taking a look at some of the emergency responses, technologies and innovations that are assisting with New Zealand’s recent natural disasters.
James McKenzie of Aerial Surveys outlines some of the challenges of providing aerial imagery and LiDAR for emergency response teams in the aftermath of the Nelson-Marlborough floods and Cyclone Gabrielle. Monitoring 9100 instruments and equipment across 700 locations around the country, GNS Science presents a behind-the-scenes look at how GNS monitors four geological
hazards 24/7 to better inform our research and support emergency responses.
From Beca, Sarah Lang and Andrew Livermore discuss the recent trials of Cyclone Gabrielle and how it may have provided an opportunity for New Zealand to focus on future risk and resilience.
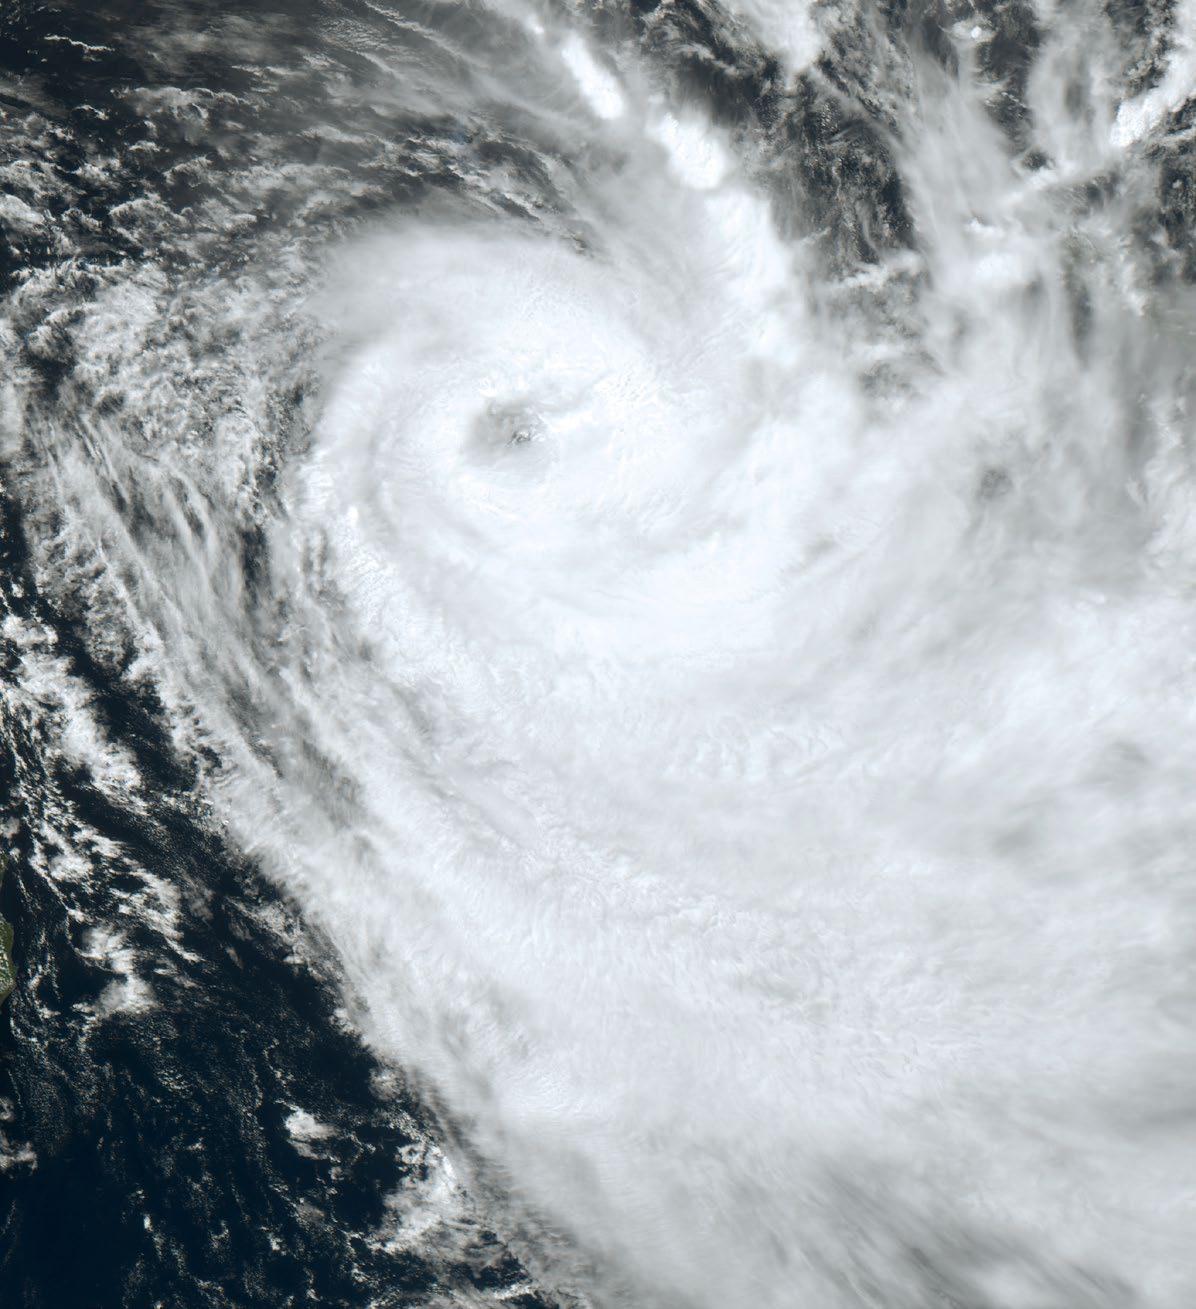
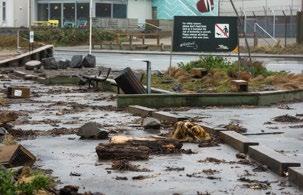
Declan Stubbing presents Discovery Marine Ltd’s hydrographic surveying response in the wake of Cyclone Gabrielle that focused on surveys of critical navigation channels to ensure the ports were functional and supply chains remained open.
And in our Legal column this edition, Stephanie Harris considers a recent High Court judgment that highlights the importance for vendors and agents of obtaining detailed seismic assessments or risk inaccurate disclosures and misrepresentation claims from would-be purchasers. •
A publication of Survey and Spatial New Zealand, Tātai Whenua. ISSN 2382-1604 www.surveyspatialnz.org
EDITOR
Rachel Harris surveyingspatial@gmail.com
All rights reserved. Abstracts and brief quotations may be made, providing reference is credited to Surveying +Spatial. Complete papers or large extracts of text may not be printed or reproduced without the permission of the editor.
Correspondence relating to literary items in Surveying+Spatial may be addressed to the editor. Papers, articles and letters to the editor, suitable for publication, are welcome. Papers published in Surveying+Spatial are not refereed. All correspondence relating to business aspects, including subscriptions, should be addressed to:
The Chief Executive Survey and Spatial New Zealand PO Box 5304
Lambton Quay Wellington 6140 New Zealand
Phone: 04 471 1774
Fax: 04 471 1907
Web address: www.surveyspatialnz.org
Email: admin@surveyspatialnz.org
Distributed free to members of S+SNZ. Published in March, June, September and December by S+SNZ.

If you consider Cyclone Gabrielle in the context of other natural disasters that New Zealand has recently faced, it was very significant. In terms of cost to the country, the quantum of impact is somewhere between the financial impact of the Kaikōura and Christchurch earthquakes. This is according to our Minister of Finance and Minister for Cyclone Recovery, Grant Robertson, who spoke to Beca employees at Beca House in Auckland earlier this year.
As we look to recovery, one key difference between the Christchurch earthquake and Cyclone Gabrielle is that
so much of what needs to be repaired or rebuilt is public infrastructure (i.e. roads, rail, electricity, telecommunications) and is predominantly the responsibility of central and local government, whereas in Christchurch there was a large domestic effect to people’s homes, the repairs of which were mostly funded by private insurance.
As the Minister put it, Cyclone Gabrielle had a narrow but deep geographic impact. He described looking at complete devastation in one community and then driving a few hundred metres down the road and seeing orchardists
harvesting apples – seemingly as normal.
There’s no doubt that this is a very challenging recovery process, and it was good to hear the Minister talk about putting into practice lessons that have been learned from past events (for example, the New Zealand Claims Resolution Service), and also ensuring lessons are being learned today. He mentioned the Christchurch response which he says was viewed by the local community as "Wellingtonians flying in to tell them what to do". This time around, they’re doing things differently by establishing regional recovery bodies. We are excited to hear that the response is being led locally and iwi are very much at the table.
Minister Robertson acknowledges that the recovery is of a scale far greater than what local and central government can deal with (or fund) alone. Hence the reason for his visit: the Cyclone Recovery Task Force, led by Sir Brian Roche, will need a locally coordinated response from across the public and private sectors. This response will include engineering and professional services companies such as Beca, whose technical experts pulled out all stops during the emergency response phase, and will also be involved as the country plans to ‘build back better’. As the Minister put it, we will all need to make those decisions together,
but they need to be locally led from the ground up.
Until recently, Robertson was also Minister for Infrastructure. In that role, he noted the need for medium and longer term thinking, since as a country, New Zealand had not built the infrastructure needed to support its growth, and now faces a significant deficit, with the added challenge of the need to consider improving resilience for communities.
In his address at Beca he noted the good work done by Te Waihanga, the New Zealand Infrastructure Commission, on the New Zealand Infrastructure Strategy, which allows companies to see a longer term view and plan accordingly.
What Cyclone Gabrielle has done, the Minister noted, is push the demand for infrastructure investment forward, as it has highlighted where our understanding of infrastructure resilience is outdated.
If there is a silver lining to the devastation Cyclone Gabrielle has caused, it is the opportunity to learn from what has happened and to focus on risk and resilience, enabling us to think differently about how, where, and in fact if we build, in the context of the climate change impacts we are facing. Addressing issues such as “managed retreat” can no longer be avoided, as for some communities, it has become a sudden and traumatic reality; acknowledging
that it is not always an option of moving away from these areas, but also how we might appropriately re-use and even redevelop (but in different ways) in these areas.
Recent announcements in the Hawkes Bay and Auckland are bringing this into stark relief, with decisions around the salvageability or otherwise of affected homes and businesses, and the need for central and local government to work closely with affected parties to look at potential managed retreat options. Or, for those more 'fortunate' ones, to progress conversations with their insurance companies and commence the repair or rebuild of their properties.
In a long narrow country where none of us live very far from the water, many of us aspire to live and work as close to it as possible. Perhaps that dream is now changing as we start to get a better understanding of the risks and take a longer-term view of how we might live, work and play in these dynamic environments; looking after the interests
not only of ourselves but of many generations to come. Learning from Cyclone Gabrielle, and sharing the lessons widely, so we create confidence in the local communities impacted, whilst mitigating future risks by creating greater resilience across our infrastructure is the opportunity we must now firmly grasp. •
Photos: Beca.
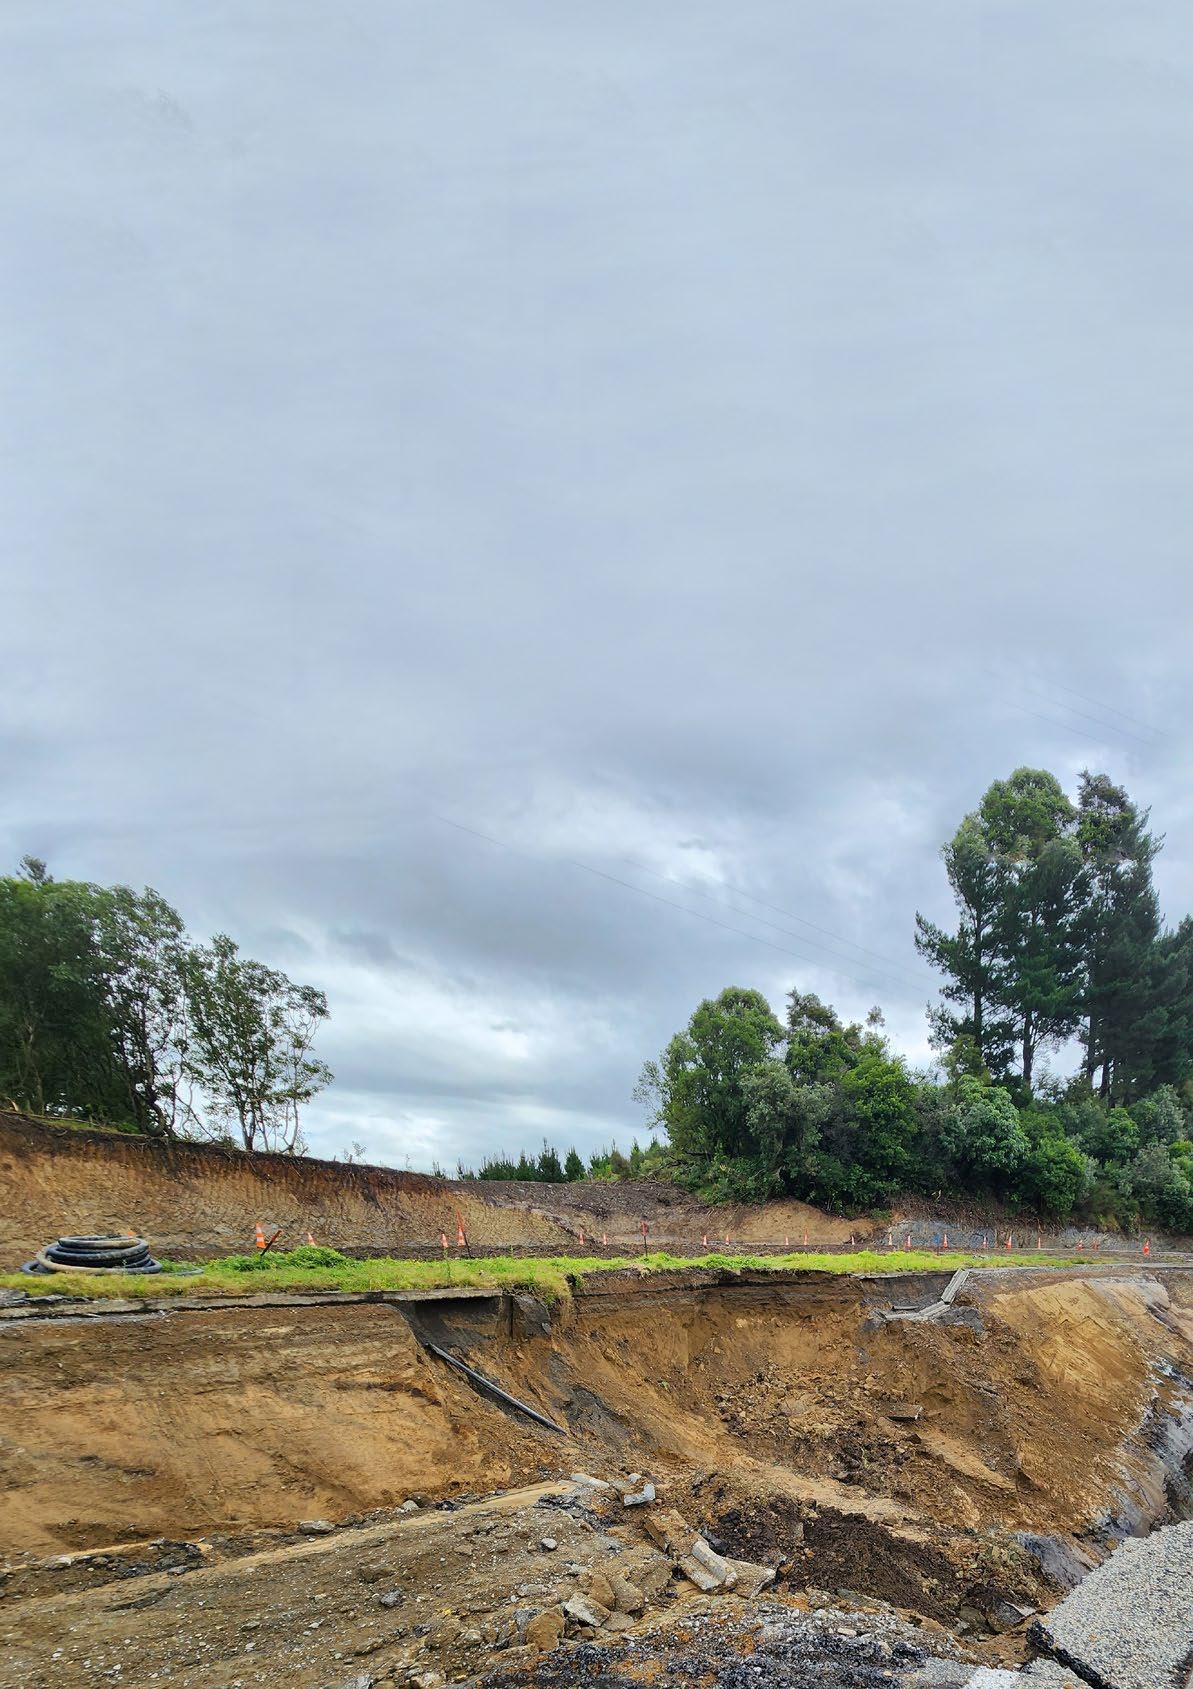
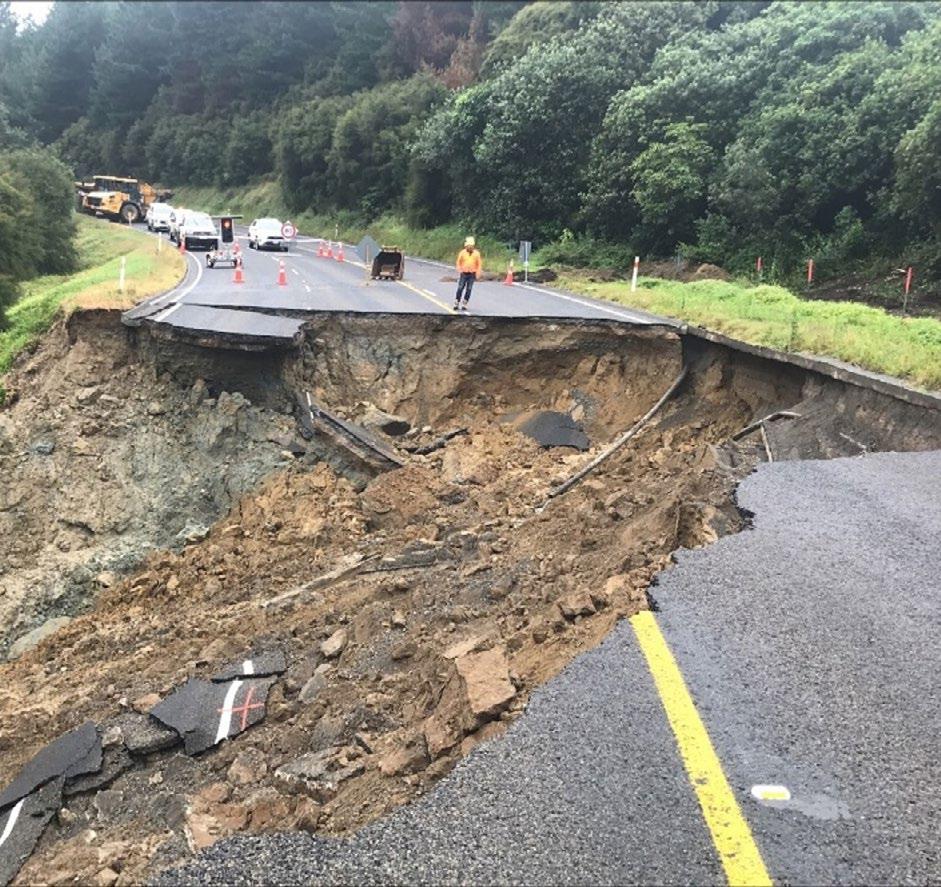
Although Aerial Surveys has responded to natural disasters in the past, the frequency of recent events has changed the way we deliver our products and highlighted the need for local and regional councils to be prepared to mobilise quickly.
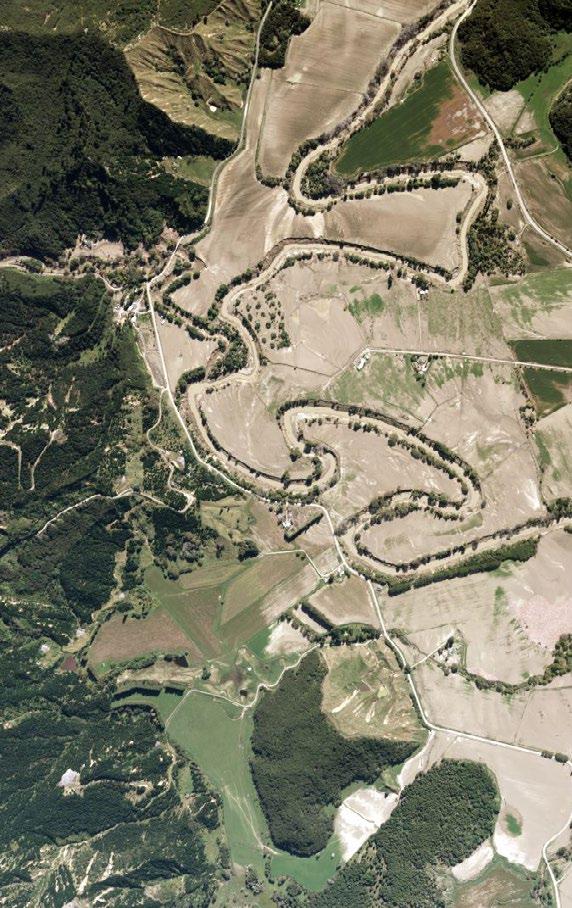
The Marlborough, Nelson, Tasman floods in August 2022 that caused widespread flooding and slips was an interesting case study for Aerial Surveys. Directly after this event, Aerial Surveys was in contact with the response teams discussing and defining areas and specification for aerial imagery and LiDAR. We were able to agree the terms quickly and begin capture three days after the event when a weather window presented itself.
Being able to provide imagery quickly after a natural disaster can be invaluable for the disaster response teams on the ground coordinating the response.
For a normal imagery project, Aerial Surveys may require weeks or months to process imagery to the level of ortho accuracy that will be accepted by clients. After a disaster, speed is key. This was recognised early in the Marlborough, Nelson, Tasman floods. For that reason, Aerial Surveys provided draft imagery hours after capture which the disaster response team was able to use immediately.
Months after responding to this event, we found engineering consultants looking for and capturing data. Had they known what Aerial Surveys was doing, they could have potentially saved time and money.
Aerial Surveys took away the following key learnings from the Marlborough, Nelson, Tasman floods:
The quicker you agree the specification, the greater the chance of timely capture and delivery.
If accuracy is not required immediately, you can provide a lower quality product much faster. This is often of higher value following a disaster.
Knowledge of what other consultants are doing on the ground can benefit all parties and avoid paying twice for things.
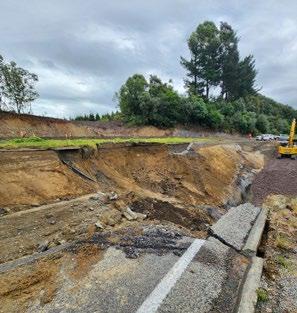
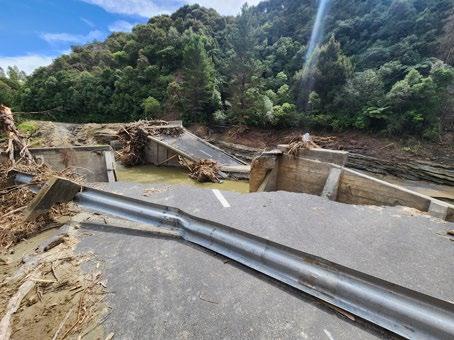
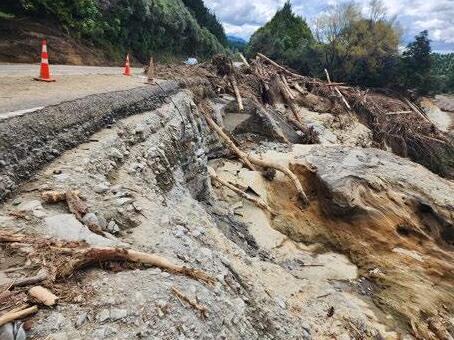
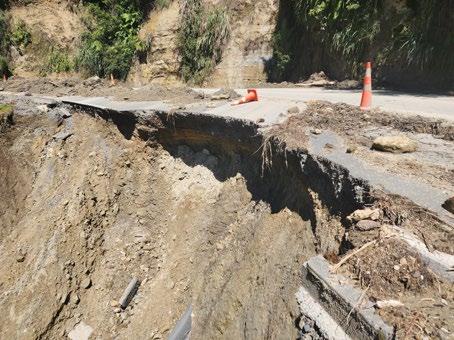
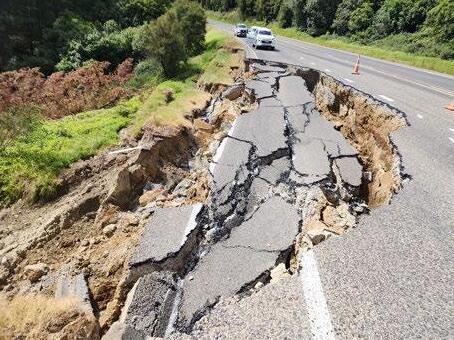
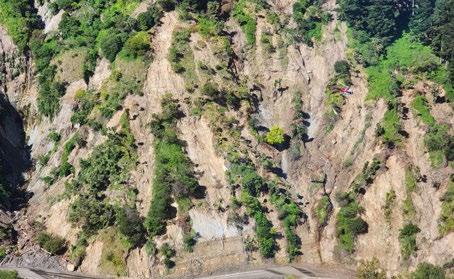
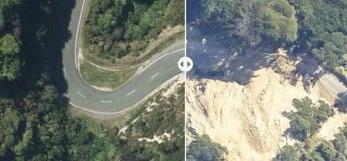
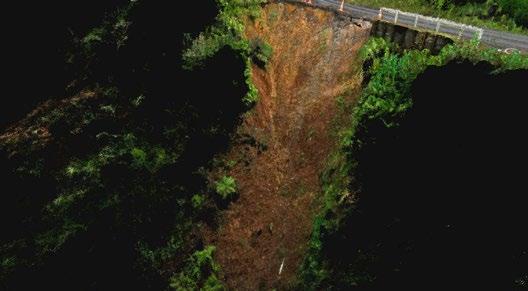
More recently Aerial Surveys has responded to Cyclone Gabrielle in the Gisborne region. This was a more widespread event that caused more significant damage to infrastructure such as power, water and telecommunications. The outages to power and communication
In the past 12 months, Aerial Surveys Ltd has responded to both the Marlborough/ Nelson/Tasman floods and Cyclone Gabrielle. This article delves into what we’ve learnt and how we’re changing what we do to be more responsive and meet the needs of these challenging events.
created delays when trying to get in contact with the right people following the event.
Once communication was established, the areas and specifications were agreed quickly. The greatest challenge for Aerial Surveys following Cyclone Gabrielle was getting cloud-free weather to capture imagery. The waterlogged ground conditions often meant that, come 10am, clouds were beginning to form due to evaporation.
Cyclone Gabrielle affected neighbouring regions Gisborne and Hawke’s Bay. This raised some issues with coordination in the air space. Whilst contracts for Gisborne and Hawke’s Bay were awarded to two separate operators, there were other operators capturing over these areas for private interests. This created additional challenges for surveyors trying to capture in the same air space.
Aerial Surveys took away the following key learnings from Cyclone Gabrielle:
Having a predefined specification in event of a disaster would help if communications are limited. This would also reduce stress and increase the chance of timely capture.
Coordination of the air space to give priority to
Aerial Surveying operators awarded contracts for the regions would help to avoid delays in capture.
Following these events, we’ve had time to discuss and explore how our services could change to meet the needs of those responding to natural disasters. These include the following:
Providing a table of standard Imagery and LiDAR specifications for disaster response. This would cover the different types of area capture including rural, urban, rivers, etc.
Providing quick turnaround products for both imagery and LiDAR at lower levels or accuracy and quality.
Prioritising capture for key infrastructure to ensure work on planning and repairs can start immediately.
It appears natural disasters such as these are becoming more frequent, and technology will have to enable quicker capture and processing. To get the most out of the technology currently available, a balance between quality and speed needs to be understood and agreed.
For example, AI can be used now for automated classification of LiDAR point clouds, drastically increasing the turnaround time. The trade-off is the accuracy of the end product. For imagery, if the priority is speed, then loosening restrictions on cloud and sun angle should be considered. Using automated processing and advanced technology could ensure a much faster delivery, but again the trade-off would be accuracy and quality.
These are considerations that need to be discussed and understood at a national, local and regional level ahead of weather events. Getting the priority and specification right ahead of time will avoid delays and provide data to the teams on the ground that need it. •
To get the most out of the technology currently available, a balance between quality and speed needs to be understood and agreed.

 Tom Goodwin, Ferntech
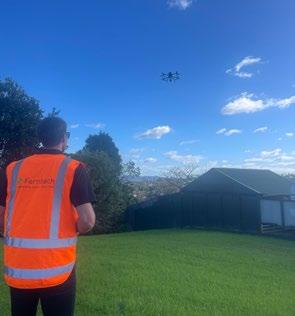
When disaster strikes, gaining fast accurate data on impacted areas and infrastructure is vital – not just for assessing the current damage, but for preventing further incidents and risk to local communities. Since Ferntech began in 2013, we have seen a steady rise in the use of drones across New Zealand, particularly for disaster response. With natural disasters and emergencies at the front of everyone’s minds, we’re taking a closer look at how surveyors, contractors, and local councils can take advantage of drone technology to deliver faster, safer, more effective emergency and disaster response.
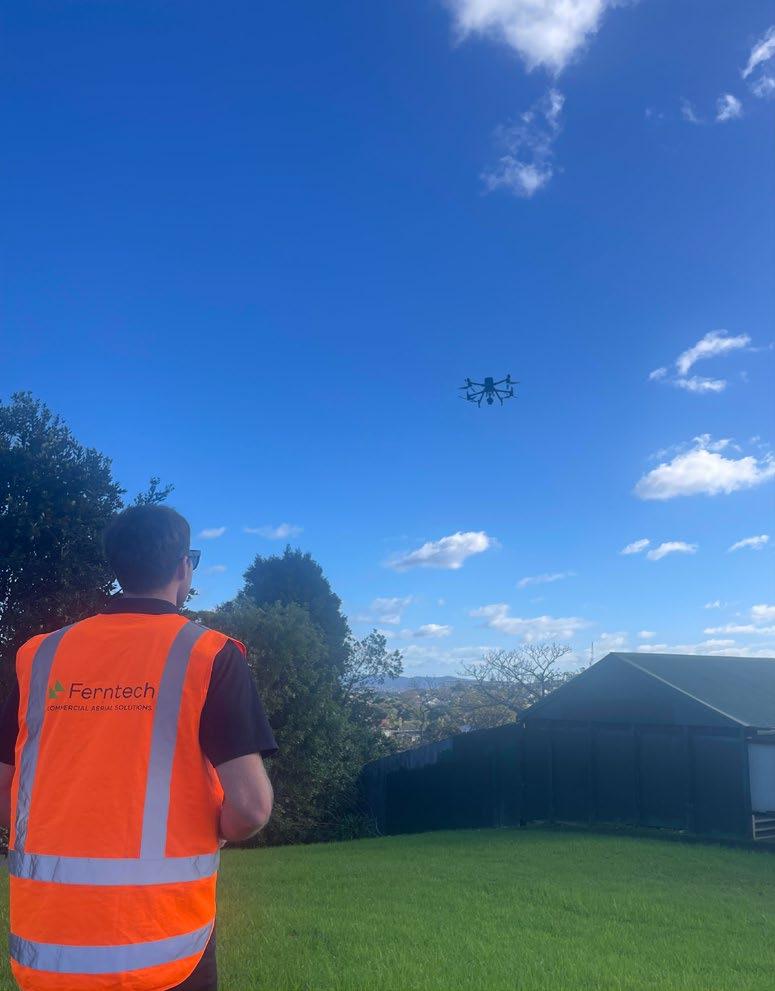
Since Ferntech began in 2013, we have seen a steady rise in the use of drones across New Zealand, particularly for disaster response.
Traditionally, topographical surveying is carried out using a robotic total station or GNSS rover. While both have their advantages, they require methodical land coverage on foot to collect measured points to trace features, followed by a gridded approach to establish the topography’s shape.
When compared with drone surveying, these methods take much longer, carry higher risk to the people involved and deliver far fewer data points, which often leads to a lower quality data set. In times of emergency or disaster, this type of assessment just won’t fly.
On Anniversary Weekend 2023, Auckland was left scrambling as it received “an entire summer's rain in less than a day” during what NIWA dubbed as a 1-in-200-year event. This extreme weather had a dramat-
ic impact on the city’s infrastructure, landscape, and local communities, with flooding closing roads, shops, and businesses, and causing significant slips and landslides across the region. While progress has been made in the months that followed, Auckland remains prone to significant flooding.
We recently spoke with Michael Cutfield, General Manager at Survey Worx, about the surveying work his team has been doing, and how drones have helped deliver key site data that can be used for disaster recovery. Market leaders in land surveying, Survey Worx has increasingly been using drones for slip assessment in recent years, as it becomes the industry standard for reality capture for remediation design purposes.
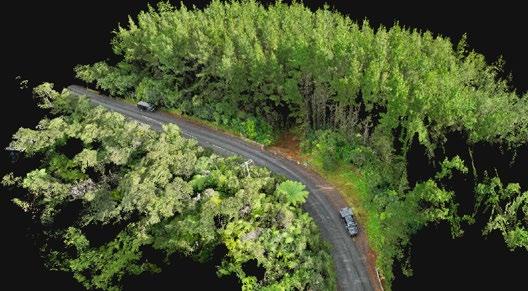
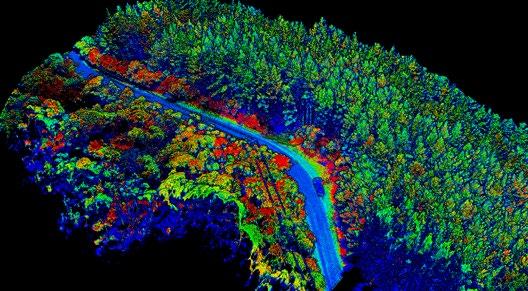
Supported by the Ferntech team,
they use DJI drones to capture raw photogrammetry and LiDAR data via aerial site assessments. This raw data is then processed to produce point clouds, with the photos run through photogrammetry software and the LiDAR run through DJI Terra. These point clouds are cross-checked and compared with the ground control points (GCPs) for accuracy. Once accuracy is confirmed, the features of the point cloud are modelled, the ground surface is extracted and contoured, and the orthomosaic image is placed to produce a plan. The point cloud is tidied up by reducing the noisy points and is sometimes decimalled if it is too large.
Upon completion, Survey Worx produces a plan in pdf format, including the photo, CAD features, contours, and annotation explaining
On Anniversary Weekend 2023, Auckland was left scrambling as it received “an entire summer’s rain in less than a day” during what NIWA dubbed as a 1-in-200-year event.
Fault,
all the features. This plan is also issued in digital CAD format together with the digital image correctly geolocated, as well as the point cloud – all of which can be used by the designers. When asked about the key benefits of using drones for this line of work, Michael Cutfield identified the following three factors:
Using drones for survey mapping significantly increases productivity on large sites, which improves exponentially as site size increases.
Data quality is improved as millions of data points are collected compared with 100s or 1000s via traditional methods, resulting in topology that is much more accurately defined.
By using remote sensing to collect data, drones dramatically improve safety as people no longer need to be physically present for data collection.
Going beyond this type of responsive work, drones can also be employed on a range of preventive
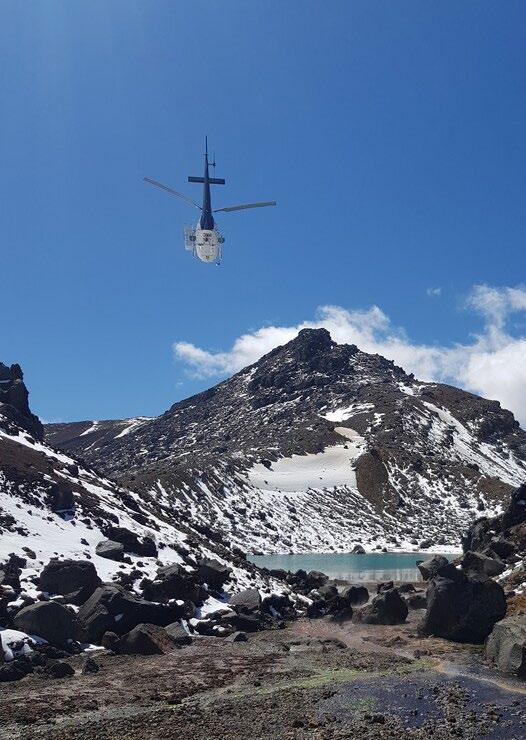
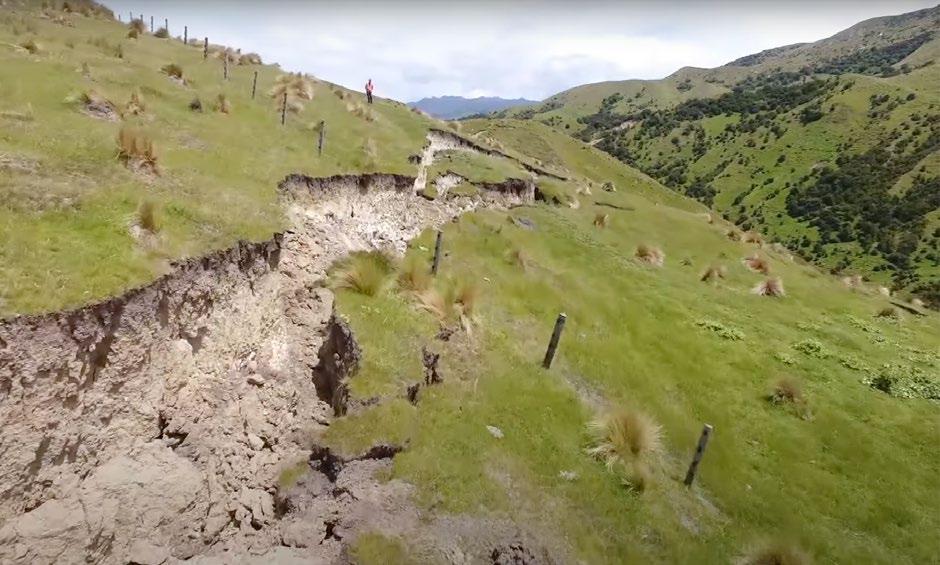
Science YouTube maintenance projects. By closely assessing rock formations and land shapes around regions with historical slips, new data can be captured to help identify potential risk zones, plan evacuation routes, and guide preventive measures to mitigate further damage. This type of work is particularly important when considering less predictable and more complex disasters, such as the Kaikōura earthquake in 2016.
Described by scientists as one of the most complex earthquakes ever recorded with modern instrumental techniques, this event caused extensive damage to farms, beaches, highways, and railway lines – in some cases causing giant fissures to open in the ground. Because of its unique scope and scale, aerial drones were extensively used as a safe, efficient solution for post-disaster assessment.
GNS Science, New Zealand’s Crown Research Institute, released drone flyover videos of the Kekerengu Fault and Papatea Fault a week after the earthquake, providing a bird’s eye
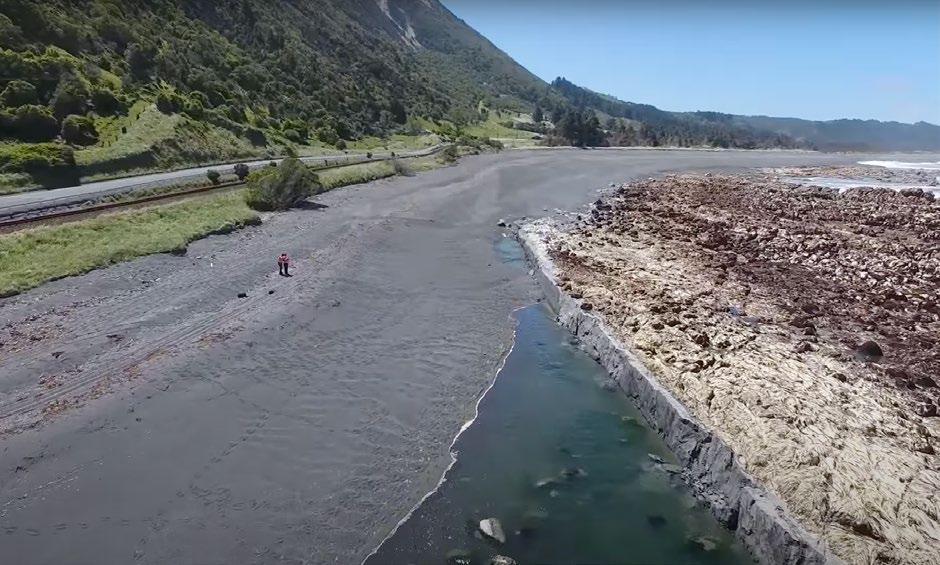
view of the enormous impact – a job that would have previously taken several man hours, with high risk to the people involved. By combining this type of aerial imagery with geological data, scientists and engineers can gain much needed insight into the behaviour and impact of earthquakes across New Zealand.
From slip assessment and hazard mapping, to post-event reconnaissance and search and rescue with thermal imaging, the importance of drones for emergency and disaster response cannot be understated. Combining safe access to hard to reach areas with increased project efficiency and data accuracy, drones add another layer of safety and preparedness for communities facing the aftermath of a disaster or emergency.
By providing the latest drone solutions and support to customers and local communities, Ferntech will continue to ensure the effective use of this technology for future disaster management and relief operations. •

• Compatible with the Matrice 300 RTK
• Integrated Lidar module, an RGB camera, and a high accuracy IMU
• High accuracy data capture
• Colourised point clouds in real-time
• 1 year Enterprise Shield cover
• 6 Months free DJI Terra processing software
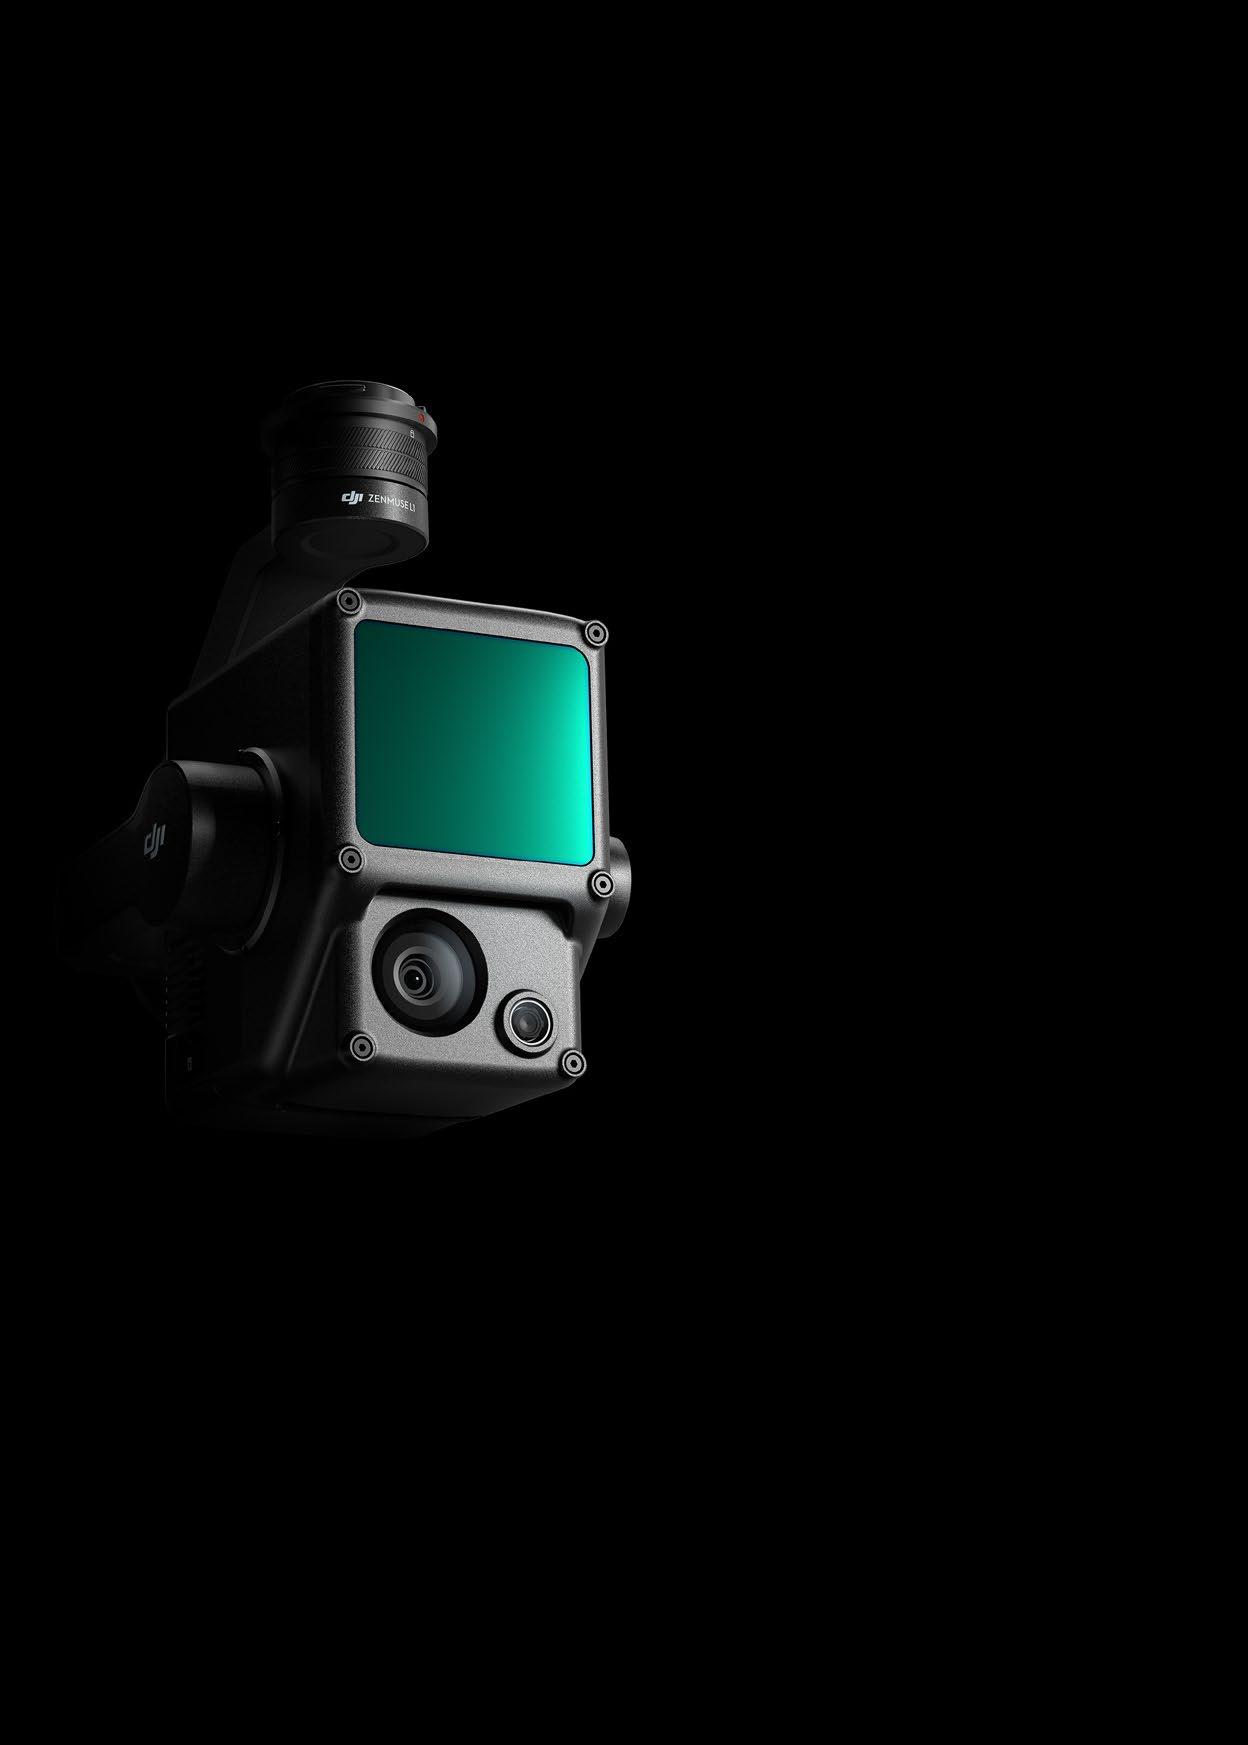
• Frame Lidar with up to 100% effective point cloud results
• Detection Range: 450 m (80% reflectivity, 0 klx) / 190 m (10% reflectivity, 100 klx)
• Effective Point Rate: 240,000 pts/s
• Supports 3 Returns
• Line Scan Mode and Non-repetitive Petal Scan Mode
• 20MP • 1-inch CMOS
• Mechanical Shutter
DML’s core business is hydrographic surveying, using multibeam echo sounders (MBES), single-beam echo sounders (SBES) and side scan sonar (SSS) to map seabed, rivers and lakes.
Our assistance with the response has included emergency surveys for three of our North Island port clients and ongoing surveying services to Hawke’s Bay Regional Council, Napier City Council, KiwiRail and Waka Kotahi. Surveying under normal circumstances for our port clients includes seabed mapping to confirm least depths in approach channels, turning basins and berth pockets. These are areas of critical under-keel clearance where accurate bathymetric data is vital to a safely functioning port. Along with repeat surveys, DML undertakes checks on the location and function of aids to navigation (buoys,
beacons and lights), tide gauge checks and calibrations, and survey support for dredging operations.
In response to a significant weather event, our scope of works for emergency surveys is typically to focus on surveys of critical navigation channels to ensure the ports are functional and supply chains remain open.
Tauranga Moana and Mount Maunganui is the home of DML. We have a long association with Port of Tauranga (POTL) and undertake emergency surveys regularly following weather events.
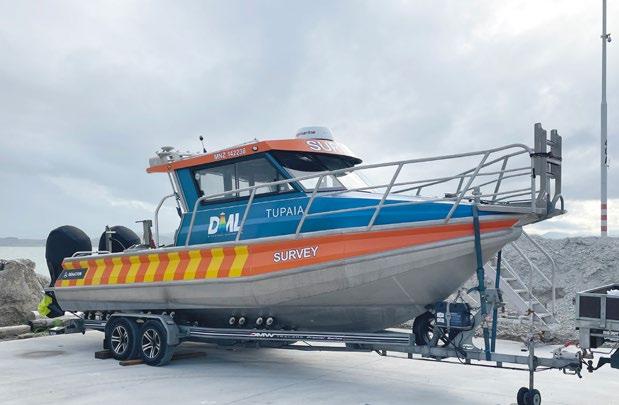
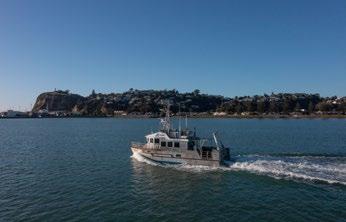
In the hours after the peak of the storm, DML mobilised our 8m survey vessel Tupaia to undertake a check survey of the approach channel including No 1 and No 2 reach, and areas of known sand wave accumula-
Like many other geospatial organisations, Discovery Marine Ltd (DML) has played a significant role in the immediate response and ongoing recovery after the devastating Cyclone Gabrielle.
Our team and a port representative also undertook a visual inspection of port assets along the Matakana Island foreshore and at the entrance to Tauranga Harbour.
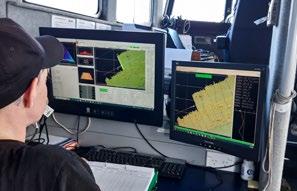
In total, 6 hours of MBES surveying was completed during a full day on the water. Raw MBES data was then delivered to our office where it was processed overnight and checked against the current quarterly full survey of the port. Our surveyors were able to provide information back
to the port engineers the following morning that included confirmation that the main approach was clear of obstructions and the new least depths reported.
Several new logs and trees were identified on the seabed, but all outside the main shipping channel and these didn’t require further action.
Seeing the impact of the storm on the Hawke’s Bay region, the call from
Napier Port requesting urgent survey work was not at all unexpected. The port had received reports of shoaling in the approach channel and required a MBES survey to confirm the extent, and that the seabed in the port was clear of obstructions.
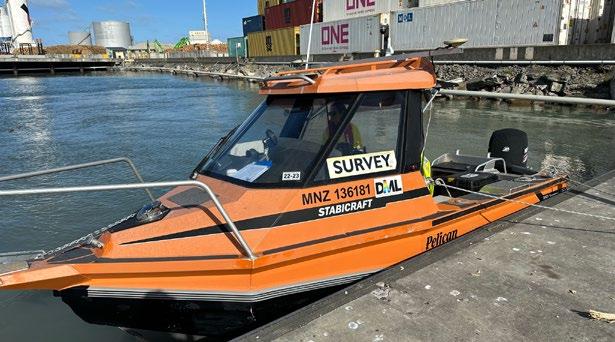
DML was able to reassign a team and our survey vessel Pelican from another project, and made immediate plans to mobilise to Napier. The team needed to be completely self-sufficient for at least three days and prepared to deploy with all stores, fuel and a portable generator.
With limited motel or hotel availability, Napier Port was able to provide accommodation for the team, albeit without power. After completing the required planning and preparations, the team set off on their 8-hour road trip to Napier via Dannevirke.
Once onsite, our team met with the port engineering team who briefed our team on the situation at the port and confirmed a plan. Sea conditions were still marginal but improving so our team was able to make a start surveying inside the port breakwater capturing data in berths and the turning basin.
The second day focused on the approach into the port and known areas of shoaling on the edge of the dredged channel. In total, 14 hours of MBES data was captured across two long days.
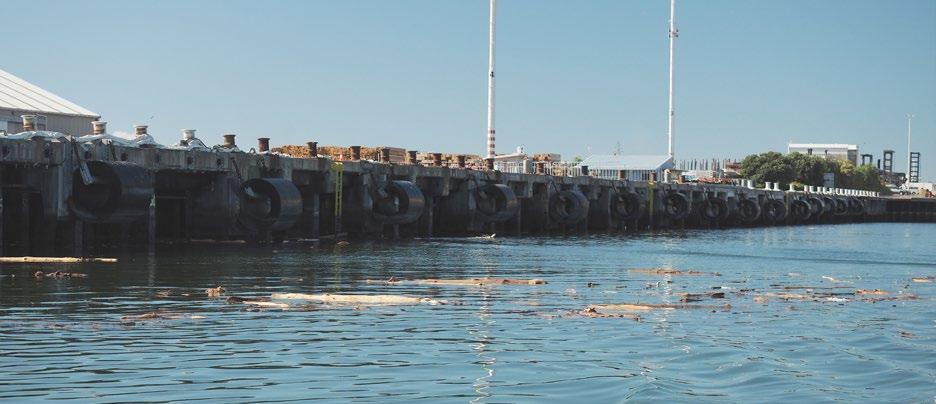
The team faced numerous obstacles while on the water including partially submerged logs or trees, scattered produce, dead animals and other floating debris.
Data processing for both days was undertaken on laptops in the evenings
Surveying under normal circumstances for our port clients includes seabed mapping to confirm least depths in approach channels, turning basins and berth pockets.Tupaia. Pelican alongside at Napier Port during the post-cyclone survey. tion in Cutter Channel.
so new results could be assessed by the port engineering team on the following morning. Surface difference images that compared the previous survey with the new survey were provided that revealed the scale of the shoaling.
The change in operational depth within the port and approaches triggered the need for dredging works and the trailing suction hopper dredge Albatross was mobilised to Napier. After a 6-week dredging campaign, DML returned to Napier Port for a post dredge survey to ensure the approach channel and berth pockets had been restored to pre-cyclone under-keel clearance for shipping operations.
A post-weather event survey request at Northport coincided with our planned annual three-week field campaign in Whangarei Harbour. The team was already well advanced with planning and preparations, therefore Tupaia and our team were able to mobilise to Northport immediately
after the Tauranga port clearance survey.
After quickly establishing themselves on site, the team commenced a clearance survey of the Whangarei Harbour approach channel, harbour navigation channels, turning basin and berth pockets. This involved a full day of surveying along the navigation leading lines from Fairway Buoy to the Portland Cement berth and investigating areas of known shoaling.
That evening the team was able to complete basic processing tasks and compare the new data against the previous year’s survey. Any areas of interest and new least depths along the navigation routes were reported the following morning to the Northport engineering team.
Two significant targets and several minor targets (logs or small targets not considered hazardous to navigation) were identified. Tupaia’s positioning system was used to deploy shot weights onto the significant targets to provide an accurate location for a dive team to investigate.
Both targets were identified as trees covered with large clumps of grass and seaweed. One was determined as being a hazard to navigation and was recovered by the dive team and crane. Once all clearance tasks were complete, the team was able to continue with the annual survey requirements.
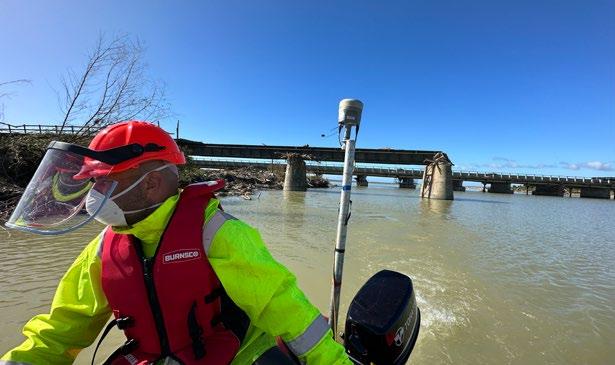
As the floodwaters receded, KiwiRail teams began the enormous task of coordinating the clean-up of the rail corridor and assessing damaged assets for repair. KiwiRail Bridge 217 crosses Waitangi Stream, north of Clive near the coast. The stream is usually a blind tidal tributary branching off the Tutaekuri River, however the ferocity of the floodwaters from Cyclone Gabrielle destroyed the bridge, breached an adjacent stop bank and broke through a natural dune bund separating the stream from the ocean. Several large spans and bridge piers of 217 were completely gone. To assist with planning and design
As the floodwaters receded, KiwiRail teams began the enormous task of coordinating the clean-up of the rail corridor and assessing damaged assets for repair.Figure 3: Floating debris inside Napier Port.
for a replacement bridge, KiwiRail needed to understand the new stream profile and if any remnants of the bridge remained submerged by murky waters or if other debris was present.
To achieve the scope, DML proposed a high-density SBES survey to capture stream bathymetry and side scan sonar survey to provide streambed imaging to assess any scouring or
debris field that might be present.
Waka Kotahi was also concerned about possible erosion or damage to the road bridge piers about 100m downstream of Bridge 217 and so a combined survey was planned which included both bridges and areas up and downstream.
Adding to the complexity of planning for this survey was the reported
high levels of soil and water contamination at the site due to the breach in the flood protection on the north side of the stream. Data capture remained on hold until testing indicated the site was safe to access which gave the DML team extra time to prepare and plan to best protect themselves for the on-water phase.
Getting our team to the site was also challenging with no boat ramps or safe launching area nearby. The team decided the best option was to launch our 5m survey vessel Pelican at Clive and transit about 30 minutes to the confluence of the Tutaekuri River and Waitangi Stream.
From there, the survey team transferred to DML’s 3m inflatable Ruby and transited the short distance along Waitangi Stream to the bridge site to commence work. The survey results showed the stream bed clear of obstructions and provided a new bathymetric surface for planning and design work.
The biggest challenge for DML over this period was ensuring we could get our teams and vessels to the locations safely and be prepared to start work as soon as conditions allowed. Significant road closures meant long transits for our team and planning on the fly. Managing the stress and fatigue of those deployed was a priority as was ensuring they got the necessary time off after returning home.
We’re really proud of the way our field teams conducted themselves over this busy period, going out of their way to assist our clients, meet their requirements and provide timely but accurate data under difficult circumstances. As the recovery and rebuild ramps up, we continue to support projects that require our bathymetric surveying expertise and are proud to support all regions impacted by Cyclone Gabrielle. •
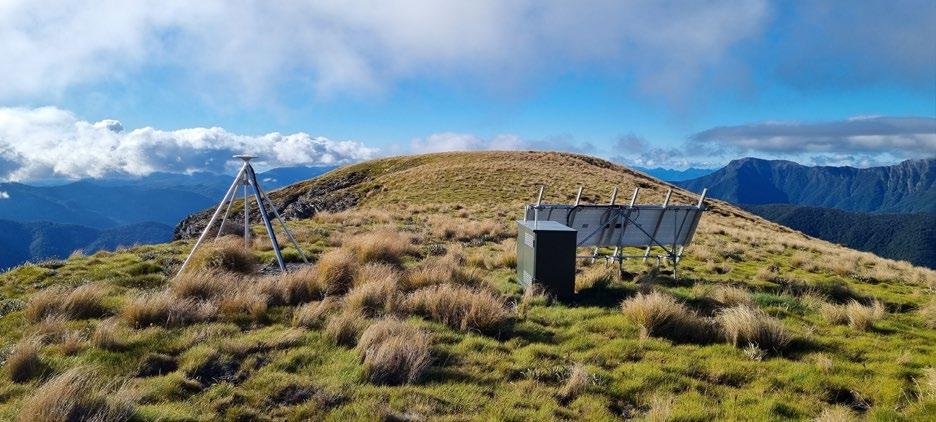
Aotearoa New Zealand has a unique geographical and geological place in the Pacific, along the collision zone of two of the Earth’s major tectonic plates, the Pacific and the Australian. It gives us our stunning landscape, but also puts us at risk from natural hazards such as earthquakes, tsunami, volcanoes, and landslides.
Helping to keep us all safe is a network of 9,100+ monitoring instruments and supporting equipment in more than 700 locations across Aotearoa New Zealand and the Southwest Pacific - in lighthouses, on farmland, under oceans and lakes, up mountains, and even on active landslides. GNS monitors the four geological hazards 24/7, every day of the year, alerting us to impending events, supporting emergency response activity and informing research.
Over time, New Zealand’s capacity and capability to monitor, measure, respond to and mitigate hazards has improved greatly with advancing global technology and continued strong partnerships with our sponsors - Toka Tū Ake EQC, Toitū Te Whenua Land Information New Zealand, Ministry of Business Innovation and Employment Hīkina Whakatutuki and the National Emergency Management Agency Te Rākau Whakamarumaru. Just 22 years ago, Geonet (www.geonet.org.nz)
launched with 102 land-based sensors, gathering data primarily for research. Fast forward to 2023 and we have a 24/7 monitoring centre keeping eyes on more than 800 instruments, each supported by a raft of technology that serves to relay the data being collected. Cutting-edge science combined with capability and research from across the science spectrum and partnerships with many different agencies is helping us to monitor every corner of Aotearoa New Zealand and much of the southwest Pacific.
Our 24/7 monitoring centre monitors the data gathered across the sensor network every hour of the day and night and is supported by on-call science staff and expert panels. Together our experts assess and respond to geohazard events, providing prompt scientific analysis and forecasts to external agencies, primarily NEMA, to help guide the emergency response.
The public now also plays an increasingly important role in monitoring, contributing to the data collected by recording earthquake “felt reports” or “dobbing in a landslide”, sharing their experience of hazard events or hosting scientific monitoring equipment on private land.
New Zealanders are very familiar with earthquakes. In 2022, there were 20,000 earthquakes recorded by GeoNet, although many of these were too small to be felt. The information collected helps our scientists understand more about the seismic processes at play.
Accurately estimating an earthquake’s size and location in near real-time means scientists can rapidly forecast likely impacts, assess the potential tsunami risk, and work alongside NEMA, first-responders, government, and community leaders to keep people safe.
This work is enabled by our extensive network of different types of monitoring devices distributed across the country, both under and above ground, in commercial and
residential buildings and on bridges. They measure ground movement, velocity and acceleration as well as structural responses to ground shaking.
With two thirds of Aotearoa’s population living within five kilometres of the coast, many of our communities are vulnerable to tsunami. Timely and accurate warnings before a tsunami arrives are crucial to saving lives and reducing economic and societal disruption. GNS provides NEMA with tsunami advice and NEMA issues warnings.
A deep-ocean monitoring network, DART, is made up of 12 seafloor sensors and surface buoys that monitor potential tsunami waves across the Pacific. The network can confirm if a tsunami has been generated and allows tsunami experts to estimate more accurately how big the waves could be and when and if they might reach our coast. Deep-ocean monitoring is very valuable in the detection of regional and remote tsunamis, alerting us early and allowing GNS to provide timely and accurate advice to inform warnings that are communicated via targeted public alerting systems, like NEMA’s Emergency Mobile Alert.
The DART network is complemented by a Tsunami Coastal Gauge network, strategically placed on our shores to detect tsunamis arriving at New Zealand’s coasts. With 18 stations across the North and South Islands, at Raoul Island and Wharekauri Chatham Island, plus one in Lake Taupō, the shallow water sensors work by recording changes in water height.
Aotearoa New Zealand has eight volcanoes classed as active, dotted across the North Island and out to sea along the Kermadec Ridge, and several more with the potential to become active in the future. A combination of research and 24/7 monitoring provides GNS scientists with valuable insights into past eruptions, helps them to predict and model future events, and informs disaster management

196 GNSS Records very precise GPS data of ground movement
198 Weak motion Measures ground velocity – smaller shaking
333 Strong motion Measures ground acceleration – bigger shaking
20 Structural arrays Measure structural response to shaking
19 Tsunami gauges Shallow water sensors that work by recording changes in water height
33 Acoustics / infrasound Measure air pressure waves (e.g. volcano blast)
12 Cameras Visual changes in activity over time (e.g. volcanoes and landslides)
12 DARTs Seafloor sensors and surface buoys that work together to monitor potential tsunami waves across the Pacific 8000+ Supporting instruments Data logging, communications and power supply systems, site hosting and protection
and evacuation plans.
The Volcano Monitoring Group tracks the current state of our volcanoes. The team uses visual observations, chemical analysis, air pressure sensors, seismic and acoustic monitoring, and ground assessments, both on-site and remote, to determine how active each volcano is. Considering all that information allows the science team to determine its position on the Volcanic Alert Level system, from 0 (no volcanic unrest) to 5 (major volcanic eruption). The surveillance programme includes a network of 12 cameras, which capture images roughly every ten minutes to show changes over time, and more frequently during volcanic events.
Aotearoa New Zealand is prone to landslides, in part because of the many earthquakes we experience each year. Unstable geology, rainfall, environment change, and human modification of landscapes also play a contributing role. These factors all have the potential to overwhelm the strength of slopes, causing them to fail, and resulting in sudden or gradual landslides.
Landslides are largely unpredictable, which means much of the monitoring and research is done after they
have occurred, although landslide forecasting models being developed by our scientists are maturing quickly. GNS specialists work to catalogue landslides using their own observations and information from the public, plus photographs and satellite data. This information is helping scientists to model the probability of landslides in certain regions. It also means the relevant regional authorities and infrastructure providers can be alerted to potential issues in the short and longer term.
Monitoring on some active landslide sites is helping scientists understand what influences the rate of landslide movement. Fox Glacier valley is currently home to five monitoring sites, including one on the Alpine Gardens landslide – one of New Zealand’s largest actively moving landslides. Data gathered helps track the impact of the Fox Glacier’s retreat which is leaving the steep rock walls more at risk of cracking and collapse once their ice support is gone.
With our state-of-the-art 24/7 monitoring supported by expert science, New Zealand’s hazard responders are making better decisions, and significantly improving our ability to prepare for, respond to and recover from earthquakes, tsunami, volcanic activity, and landslides. •


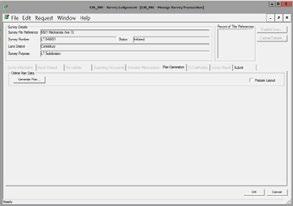
Since rolling out New Landonline – Survey capture in April 2023, feedback on how easy it is to use and navigate has been overwhelmingly positive.
More than 1000 Landonline survey users (that’s over half) piloted the new Survey app before it was released, with hundreds more embracing the opportunity to use it as soon as they could.
The Modernising Landonline programme’s Lead Consultant Surveyor Nick Stillwell says that rigorously piloting the functionality for 18 months ensured what was delivered was what users wanted.

“We worked with our customer representatives before the pilot to ensure what we delivered was easy to use and intuitive. Getting honest feedback during the pilot helped us understand what worked well and what didn’t.
“The beauty of designing the functionality with our customers is that we were able to make changes when they told us something needed improvement.
“Another key deliverable was ensuring it was easy for users to revert to Legacy Landonline to complete plan generation and submit and sign after they’d captured data sets in the new application.
“Since April, we’ve had a rapid uptake. It’s not an overstatement to say most survey users prefer the new app over Legacy Landonline.
“With that endorsement, we’re now ready to target July for survey capture to only be able to be accessed in New Landonline.
“Legacy Landonline and the new application remain fully compatible and integrated, which is important because users will continue to use Legacy Landonline for plan generation and submit and sign,” says Nick.
Toitū Te Whenua is encouraging users to transition to the new application now while they can also work on capture in Legacy, to ensure they’re comfortable using the new application.
“This will help eliminate the impact of any challenges for those who haven’t used the new application before July.
“I’d encourage anyone who hasn’t tried the new application yet to start using it now – you’ll be pleasantly surprised.”
“Don’t be afraid to give it a go. Feedback from survey users is very clear: it was easier to start using than they could ever have imagined,” says Nick. •
To get started visit: www.linz.govt.nz/getting-started-survey
The next phase of work – to replace plan generation and submit and sign – has started. We’ll keep you in the loop with what’s happening as this work progresses.

The program will initially provide two qualifications in the first year:
• Certified Professional Engineering Surveyor
• Certified Professional Land Development Engineer
The Survey and Spatial NZ Certification of Professional Engineering Surveying Competence and Professional Land Development Engineering Competence are formal recognition by Survey and Spatial New Zealand of those who have been assessed against a defined set of professional and technical competencies which meet standards and technical sign off criteria required by private and public asset owners, Territorial and Local Authorities and other such entities.
Over time, it is our hope that the Certification framework will be expanded to include other professions
with Frequently Asked Questions about Certification on the S+SNZ website and this will be continually updated. Candidate Guides and Video Guides for both Certifications have also been released and are available to download on the website.

Over the next two months, our focus will be on providing the information that will help members to decide whether to seek this important new qualification. Then, in August we will celebrate launching our new Certification Framework and Certification at our Annual Conference in Dunedin.
Later in the year, we will also be kicking off our National Stakeholder Engagement Strategy to ensure that Local Authorities and other stakeholders are fully informed regarding the purpose and scope of Certification. The strategy is simple: ‘National Reach/Local
It is with great excitement that we announce from Monday 24th July 2023, we will be accepting applications for the new Survey and Spatial
To lodge a CSD (Cadastral Survey Set) or not? That is the question.
David Crerar, Spacelink Surveyors Ltd
Ok, this topic might sound a bit boring to those who don’t know land surveying well, but it is an enduring topic that comes up in our surveying business from time to time and it needs to be resolved.

The issue is basically this, when I was starting out in my own surveying business in Auckland, I occasionally
put boundary pegs in without lodging an SO plan with DOSLI (Department of Survey and Land Information), now LINZ. Until the Chief Surveyor Bruce Morrison pulled me aside one day when I was in the survey office searching manually for plans through their microfiche files. This being some 30 years ago.
Bruce Morrison was a revered land surveyor and stood proudly as the bastion for all things surveying, when we had a LINZ office in Auckland.
I subsequently had a lecture from Bruce on the legalities of lodging an SO plan for my boundary definition. The gist of it was Bruce suggested that by providing discounted and non-official boundary peg surveys, I was doing myself (as a young surveyor in business), and the overall profession no good. Short-term thinking versus long term professionalism and long-term gains. That requiem still rings out today.
Bruce was the voice of authority at the time, so from that point on, I have always lodged the paperwork, along with the field survey.
I bring this topic up, because I recently was in dispute with a person with whom I was contracted to complete a Topo survey.
Unfortunately, at the back of her mind, she was wanting two boundary pegs, but she was not specific in her instructions, and this was not part of our legal agreement. Unknow to myself, she was quoted by another firm, from whom she requested the two boundary pegs, and they quoted a mere $400 on top of our quote for the in-depth Topo survey, for the two pegs.
I found later on, that the other firm suggested that the two pegs be installed under the guidance of a Licensed Cadastral Surveyor, but with no paperwork.
It took me some time to get payment from our Topo survey, and after some discount from us, just to get rid of this time-consuming dispute.
So first of all, I suggest the following: If you are firm in the business of putting in boundary pegs without the documentation, you are doing land surveying a disservice.
You are reducing the value of our work, and also harming our collective professional status. We are all Licensed Cadastral Surveyors together.
We have spent four years at Otago University, two years professional experience, passed your Cadastral Law exam, and submitted your in-depth projects to become a LCS.
And in return, some of you are trading unrecorded boundary pegs for a few hundred dollars. This doesn’t make any sense.
Some may say they do not want the bother of recording the Cadastral Survey Dataset (CSD) within Land on-line, but done effectively this can done within 2-3 hours.
Your client has then the government guarantee that your work will stand up to the scrutiny of others, including the direct neighbours. This is always important. Your professional work needs to be enduring and the CSD is there to help you to keep you from being sued, or your work being devalued. Secondly, there are the legalities.
The Cadastral Survey Rules 2021.
Part 2 Duty of surveyor- Without the lodged CSD you are not fulfilling your Duty.
This is an important part of being a professional surveyor. You need to be trusted, and you need to believe in your word, in what you do (actions), and collectively we have a duty to each other in this profession, as members of Survey & Spatial NZ. Part 9 Boundary Reinstatement. (Section 113)
113 CSD must be lodged for boundary marking
A CSD that complies with these rules must be lodged within 6 months after the placement of a boundary mark on a boundary reinstatement survey.
Standards for Licensing Surveyors 2021 (Cadastral Surveyors Licensing Board of New Zealand).
8. Professional Conduct
1. Public confidence in the cadastral survey and land tenure systems requires licensed cadastral surveyors to maintain and act in accordance with high standards of professionalism within their area of expertise or specialisation.
2. Accordingly, the competencies required in professional conduct are the ability to—
a. act professionally and honestly at all times to maintain public confidence in the cadastral survey and land tenure systems; and
b. develop, maintain, and apply systems of professional practice management and effective quality assurance to all aspects of a cadastral survey to ensure compliance with the Surveyor-General’s Rules
We renew our license each year for a reason, and that is not to make a few bucks from the odd client who just wants boundary pegs.
Thirdly, by definition you are a professional.
:the skill, good judgment, and polite behaviour that is expected from a person who is trained to do a job well
A high level of professionalism is expected when working with clients.
She is highly respected for her professionalism
We are land surveying professionals that need to have higher standards than some of our clients expect of us. While the client may not ask for the CSD to be lodged with LINZ, as professionals we know that there are legal requirements, as per above.
Some of us view this as optional and belittle the actual process of legally completing the CDS and survey approval, but I hope that I have argued the case well enough for you to understand.
It is our job to educate the client as to the legal requirements and to stick to our guns as professional land surveyors.

We need to stand by our word as licensed cadastral surveyors that we will do everything to uphold profession-
al standards and uphold the law relating to land surveying in New Zealand.


Otherwise, what is the point? We have wasted our 6-8 years of education, and probably we should not have gone into debt over our student loans.
Whatever we do in this profession, please uphold own standards highly and believe that the gratitude will be rewarded back to you both ethically and financially.
You most likely will be in business for a long time, so why not act to the best of your abilities.
I found later on, that the other firm suggested that the two pegs be installed under the guidance of a Licensed Cadastral Surveyor, but with no paperwork.
 Roshni Sharma
The human brain is an efficient machine which filters incredible amounts of data about the world around us from all of our senses in every second. For our brains to cope with this overload of information, we – from the moment we are born – create assumptions and ‘rules’ to help us to operate in the society around us.
At home, we are often exposed to people who tend to be reasonably similar to us. However, in schools and workplaces, we get exposed to a wide variety of people who are both similar and different to us in many ways. At school, children often meet other children who are somewhat different to them for the first time and can often be quite candid in expressing this.
Much of the time, young children are open-minded when it comes to seeing and meeting people who look or behave differently to them. Children are often able to leverage their naivety constructively, identifying differences and being willing to overcome these positively and proactively.
If young children are able to do this, why then do we find ourselves in a society that is still so fraught with social injustice, inequality, and division?
As we grow through childhood and onwards into adulthood, the types of assumptions we make get cemented based on the thoughts, emotions and behaviours of those around us . This influence comes from our immediate family members, our friends and extended family members, what we see on television and the internet, the news channels we are exposed to, and so on.
Importantly, we form certain views, beliefs and assumptions about the people in the world – around age, gender identity, physical and intellectual abilities, sexual orientation, weight, race, and many other things. These are the legacy of generations of thinking and behaving in social hierarchies where parts of society are treated as ‘other’, distrusted, disliked or excluded.
Sometimes we are conscious of the assumptions we hold towards certain groups of people, but often we are unaware of our own prejudices – they are unconscious, and therefore more insidious.
These unconscious ways of thinking and behaving
Learn how unconscious bias creates social divisions and how to be aware of them so you can work to overcome them.
that come from society at large will continue to create social divisions unless they are challenged – and that challenging starts on an individual level.
If we don’t strive to be conscious of them, to be aware of them and work to overcome them, they will cement themselves in our children and result in our children growing into adults with unconscious bias who then keep perpetuating the cycle
In many workplaces and social situations where people with different identity aspects come together, unconscious and conscious biases around what these differences mean result in tension and trauma.
Microaggressions are one of the most common manifestations of this.
Microaggressions are ‘everyday verbal, nonverbal, and environmental slights, snubs, or insults, whether intentional or unintentional, which communicate hostile, derogatory, or negative messages to target persons based solely upon their marginalized group membership’. (Derald Wind Sue, PhD).
These are often not malicious or intended to cause harm. However, to those on the receiving end, they feel devalidating, discriminatory and excluding. These can take many forms, such as:

Continuously mispronouncing someone’s name after they have explained to you the correct pronunciation.
Having double standards for people of different races, genders, age groups, and so on.
Listening to the opinions and suggestions of men in meetings and ignoring the women present, or not seeking the views of younger staff because the more experienced staff have all spoken.
Denying the lived experiences expressed by a marginalised group because you have had different experiences in your life.
Asking people with disabilities to publicly identify themselves.
She Maps is Australia’s leading expert in drone and geospatial education. She Maps assist schools with the purchasing of drones, school-industry created drone and geospatial teaching resources and highly supportive teacher professional development.
Microaggressions occur in the classroom, too. And making children more aware of the impact of them from an early age will give them many advantages as they progress through life. By cultivating diversity in STEM and non-STEM schools, students could become more caring and empathetic. They are also able to raise their awareness to unconscious bias and emotional intelligence, which are also skills in great demand in the workplace. This can be done effectively by parents and teachers through modelling positive behaviours, such as:
Avoiding making assumptions about particular groups, and gently calling out assumptions that children make as they make them.
Setting high expectations for all children, encouraging them to challenge unconscious biases they may have about people in the classroom that look or behave differently to themselves.
Work to build STEM diversity and create a safe environment in the classroom for people with marginalized identities, through helping students be aware of differences and consciously working towards fair and equitable treatment of each other.
Be careful of using humour in ways which is appropriate, ensuring it doesn’t target or degrade people of certain identities.
Teachers and parents are in a leadership position when it comes to guiding children around awareness of, and response to, conscious and unconscious bias. This means that we, as teachers and parents, are responsible for facing our own unconscious biases and assumptions around the world, and reflecting on how we would like to behave to set examples for our children. Learn more about the major benefits of diversity in STEM here:
ABOUT THE AUTHOR: ROSHNI SHARMA
Roshni is a Geospatial Scientist and Soft Skills Enthusiast, working to harness location intelligence to create tangible change for society. She loves dogs (but not cats) and reads copiously at every opportunity. Roshni strives to be a thought leader, a compassionate disruptor, a connector and someone who gets things done. Having traversed environmental science and management, human geography, palaeoclimatology and business, in her lifetime she wants to help shift the culture of the geospatial industry to adopt new ways of thinking and technologies ethically to leverage location to change the way society conceptualises and enacts sustainability across all industries.

The ISA was undertaken in August 2017 and concluded that the property was at 60% of the NBS. The 60% NBS was represented as a ‘good rating’ and an ‘investment highlight’ in the sales marketing material.
However, the ISA also contained a disclaimer that stated:
‘Detailed inspections and engineering calculations, or engineering judgments based on them, have not been undertaken and these may lead to a different result or seismic grade.’
The marketing materials produced by the real estate agent also included a letter from the engineer which was subsequently made available to prospective purchasers. The letter represented that:
‘Normally a building which rates around 60% with an ISA is going to exceed 70% of the NBS if a more detailed analysis or a DSA is carried out.’
‘Therefore, it is most likely, but not guaranteed, a better assessment will give a higher rating on the building’.
In a transactional context there are always risks for both purchasers and vendors. Tadd Management Ltd v Weine [2023] NZHC 764 (TADD) demonstrates for vendors, and their agents, that they should be mindful of their legal risks and obligations when making disclosures and representations to purchasers about their property for sale.
The recent High Court judgment in TADD reinforces the importance to vendors of obtaining accurate reports and assessments for their property. Failing this, vendors risk inaccurate disclosures and misrepresentation claims from purchasers, which can have drastic and expensive consequences.

At an auction on December 7, 2017, TADD Management Ltd (TADD), purchased a three-storey commercial building at 134 Queens Drive, Lower Hutt (the property) for $1,227,000.
The property was designed in 1986 and built in 1987 – 30 years before the New Building Standard (NBS). It is located on the northern fringe of Lower Hutt CBD along an earthquake fault line.
Part of the sale process was disclosure by the vendor of a report called an Initial Seismic Assessment (ISA) completed by a third-party engineering company. TADD relied upon the results of this assessment because the ISA included a representation about the property’s seismic rating as a percentage of the NBS.
‘In summary then, the 60% NBS can probably be bettered with more input’.
After TADD had bought the building, it commissioned its own Detailed Seismic Assessment (DSA) to enable it to assess how it would seismically upgrade the building. That DSA assessed the building to be at 10% of the NBS – drastically lower than the initial seismic assessment originally represented to TADD in the marketing materials.
TADD then sought a second DSA from another engineering firm, which assessed the building at 30% NBS. Having received the two DSA reports, TADD elected to undertake works to strengthen the property to 100% of the NBS at significant cost.
In 2017 the New Zealand Society for Earthquake Engineering issued guidelines to provide engineers with the means to assess the seismic behaviour of existing buildings and building parts. The guidelines were issued in three parts. Part A provides assessment objective and core principles to support detailed guidance on the initial seismic assessment in Part B, and the more extensive detailed seismic assessment method in Part C.
The ISA and DSA processes indicate the seismic performance of a building as an earthquake score or rating, expressed as a percentage of the NBS.
The guidelines describe the ISA procedure as:
‘Essentially a qualitative procedure that observes
building attributes, uses these to develop a holistic understanding of how the building would respond to an earthquake and provides an initial assessment of its earthquake rating.’ The society also describes the process used to prepare an ISA as ‘a coarse evaluation involving as few resources as possible.’

In contrast, a DSA procedure is a quantitative procedure that can take several forms. A DSA is used to confirm an earthquake rating for a building, particularly when a higher degree of reliability than considered available from a qualitative ISA rating is required.
As a result of the rating discrepancies between the ISA and the two DSAs, TADD filed proceedings against the vendor in the High Court. The vendor joined the engineering company which had prepared the ISA to the proceedings as a third-party defendant.
TADD claimed it relied upon the vendor’s representations as to the NBS rating when it was bidding for and ultimately purchased the property. It claimed it was induced by representations about the NBS rating. It claimed those representations were incorrect and it suffered loss as a result.
The vendor’s case in defending the claim was that the ISA contained the relevant engineer’s opinion only. It was therefore not actionable as a misrepresentation because a misrepresentation must be a statement of fact that is false or misleading and cannot be mere opinion. The vendor denied the ISA was incorrect and claimed there was a reasonable basis for the engineer’s opinion.
The High Court found TADD’s claim for contractual misrepresentation was made out.
Although the letter contained the reasonable opinions of the engineer, the Court held the representation that the
property had a 60% NBS rating and that this was a ‘good rating’ as incorrect. The Court was not persuaded that the disclaimer had any material impact on the vendor’s liability because it was generic and did not specifically refer to the limitations of the report.
The vendor’s representations taken together amounted to a clear statement the property had a good earthquake rating when in fact it did not. Consequently, the vendor was liable in contractual misrepresentation to the purchaser for the diminution in value of the property assessed against the purchase price.
The vendor was ordered by the High Court to pay the purchasers $592,000 plus interest and costs. The sum being the difference in value between the property as represented in the marketing materials and the property’s real value following the detailed seismic assessment.
Vendors would be wise to exercise caution when marketing their properties with information about how a property rates as a percentage of the NBS and before making representations to a purchaser during the sale and purchase process. NBS ratings can vary between assessments and between engineers and, while they can be relied on, caution should be exercised in how that reliance is framed at sale and the terms and efficacy of disclaimers.
A key takeaway for vendors and real estate agents must be that special focus should be exercised on what material they provide that could be relied upon by purchasers in the sale of a property. For engineers, caution should be employed when using generic limitations within disclaimers of reports. A more specific limitation and detailed disclaimer should be preferred.
Overall, the context of the provision of information and the type of seismic assessment report obtained needs to be carefully considered before disclosure occurs. Prudent deployment of this information could avoid inadvertent misrepresentations with seismic and expensive consequences. •

NIWA scientists will be in Hawkes Bay this week to map the seabed to measure the effects of Cyclone Gabrielle.
NIWA marine geologist Dr Joshu Mountjoy, says sediment from cyclone Gabrielle doesn’t just affect life on land.
"After weather events like this, we know that a huge amount of sediment will have come out of the rivers, and a lot of that will be sitting out there on the seafloor. Communities along the coast might be looking at all the sediment and debris in the ocean and wondering how it is affecting marine life."
Starting April 18, scientists onboard the 13.9m-long research vessel, Ikatere, will be mapping around 200 square kilometres with a multibeam
Napier’s port every day to complete the work and may be visible from shore at sites between Cape Kidnappers and Mohaka until Saturday, April 29.
Dr Mountjoy says previous monitoring in the area was carried out to help NIWA and the Hawkes Bay Regional Council identify which areas are important for biodiversity habitat, and to improve ongoing reporting on the state of the marine environment.
storm-generated wave events that we know can stir up sediment offshore and may have moved some of it around. We expect to see changes where rock or other structures have been smothered in sediment and we can image these with our multibeam bathymetry data.
echosounder from 15 m water depth and deeper.
The vessel will be in and out of
"We have maps already, so now we are going to see if anything has changed and establish a baseline to understand the impact of Cyclone Gabrielle on the marine environment," he says.
"It’s hard to anticipate what we will find. There have already been a few
"These areas are rich in biodiversity and an important coastal marine ecosystem, so we are very interested in what we might find."
NIWA has been involved in mapping vast amounts of New Zealand’s seafloor using multibeam echosounder equipment. These provide images of the seabed shape and contours of the seafloor and identify different seafloor physical characteristics. •


Stuart Caie, Chair, Hydrographic Stream
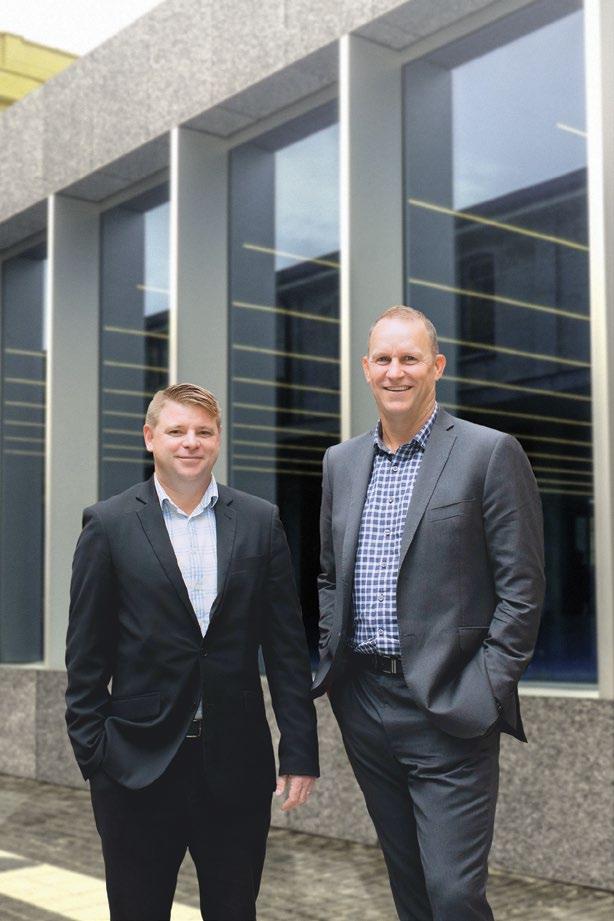
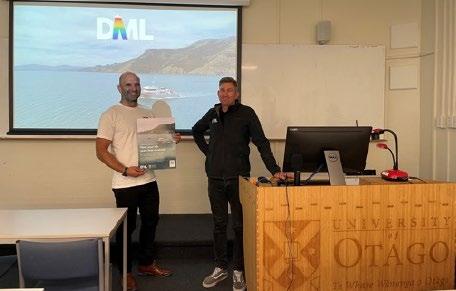
Hydro Stream members Discovery Marine Ltd’s Operations Manager Jimmy Van der Pauw and CEO Declan Stubbing visited the School of Surveying at Otago University in May to announce a new DML Hydrographic Survey Scholarship for students studying hydrographic surveying.
The scholarship will provide generous support to a student enrolled in hydrographic papers who intends to complete a research project during their final year at Otago University. The successful recipient’s full fourth year tuition fees will be paid and it also includes a paid trip to DML and the annual Australasian Hydrographic Society (AHS) seminar, as well as the opportunity for a summer internship at DML.
Declan said “DML are proud to support the School of Surveying, and hydrographic students specifically. It’s a really exciting time for graduates entering the hydrographic industry with huge local opportunity across New Zealand and Australia.
“Jimmy and I are both Otago graduates, along with around half the DML team, and we’re keen to support Emily in raising the profile of the hydrographic surveying and ensure there continues to be quality grads entering the industry.” •
Applications will open later this year through the DML website (https://www.dmlsurveys.co.nz/dml-scholarship/) and the School of Surveying.
NIWA
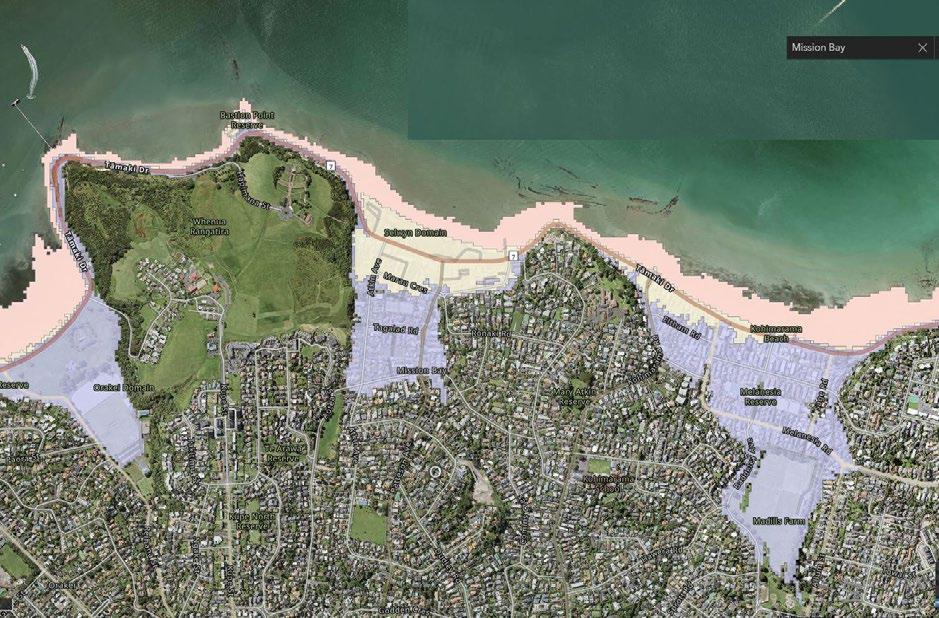
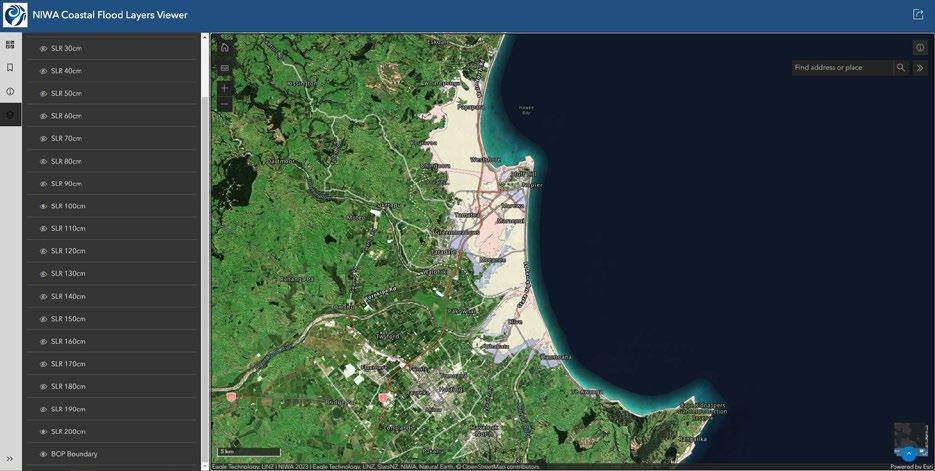
New maps from NIWA and the Deep South National Science Challenge show areas across Aotearoa New Zealand that could be inundated by extreme coastal flooding. They show a large storm-tide with the sea-level rise that we are likely to see with climate change.
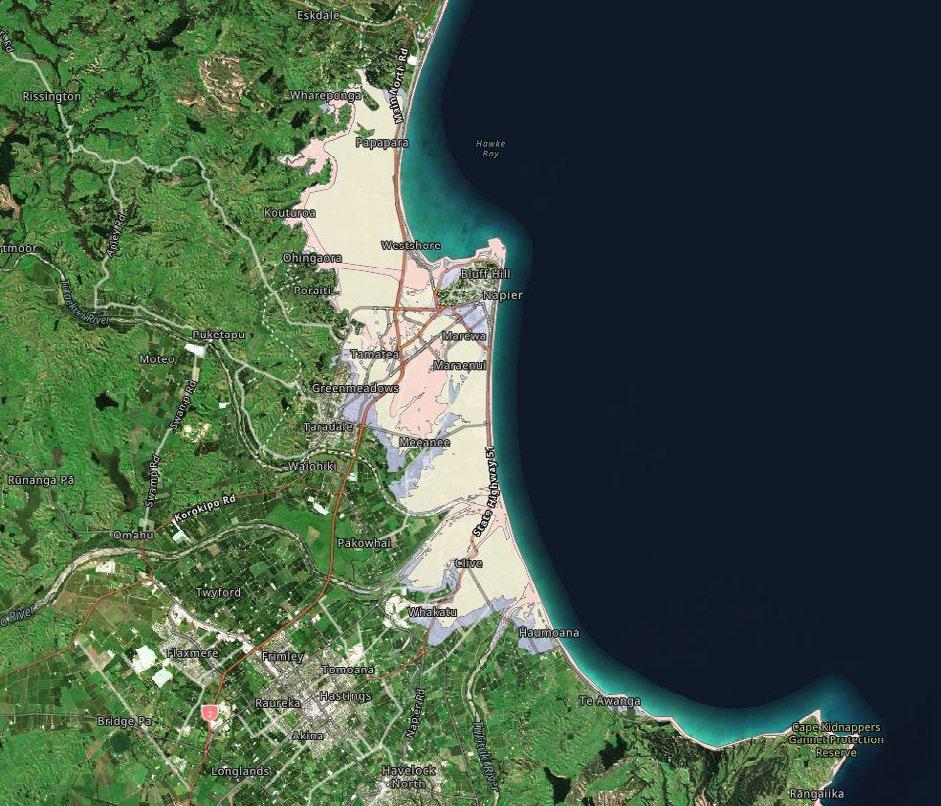
NIWA’s Chief Scientist for Coasts and Estuaries Dr Scott Stephens says that these maps will help shape decisions on how we adapt to sea-level rise.
“Coastal flooding is a global hazard that impacts New Zealand, with rising sea levels already causing more frequent and intense flooding along many coasts. We have created maps that help identify the changing risk to land, property, and infrastructure from rising seas, at a regional and national scale.
“We hope this information will raise awareness and help councils and government to know where to conduct detailed investigations when developing adaptation strategies to protect our coastal communities,” said Dr Stephens.
The maps are also intended to help the financial industry, national infrastructure, and service providers to risk assess their portfolios.
“It’s difficult to make decisions about the future if you can’t see it - these maps provide a window into the future,” said Dr Stephens.
Coastal flooding is particularly likely when high tides, storm surges and large waves occur simultaneously. At these times, low-lying areas are inundated when high seas overtop or even break barriers, and cause rivers to back up inland.
This can destroy property, infrastructure, and be a danger to life, as well as having severe impacts on the natural environment and ecosystems.
“With much of our major infrastructure and roughly 65% of New Zealanders living within 5km of the coast, this is an issue that will impact many of us, so we must be aware of what’s coming and be prepared to adapt.”
“These maps are not designed for assessing exposure
to individual properties, however. Many councils have more detailed maps for that purpose. The advantage is that they fill in gaps for areas of the country that don’t currently have this data available, they provide nationwide information, and they include many scenarios of sea-level rise,” said Dr Stephens.
The maps were used in new research that examined New Zealand’s increasing exposure to coastal flooding with sea-level rise.
The research found that small amounts of sea-level
rise will drive a rapid increase in cumulative flooding from increasingly frequent coastal-flood events-nationally, and 30% more land area would be regularly flooded after 0.3m relative sea-level rise.
“By 2065, there could be 0.4m of sea-level rise, based on the current trajectory, or sooner where the landmass is subsiding,” said Dr Stephens.
The maps can be viewed, and data downloaded at https://niwa.co.nz/natural-hazards/our-services/extreme-coastal-flood-maps-for-aotearoa-new-zealand. •
NIWA
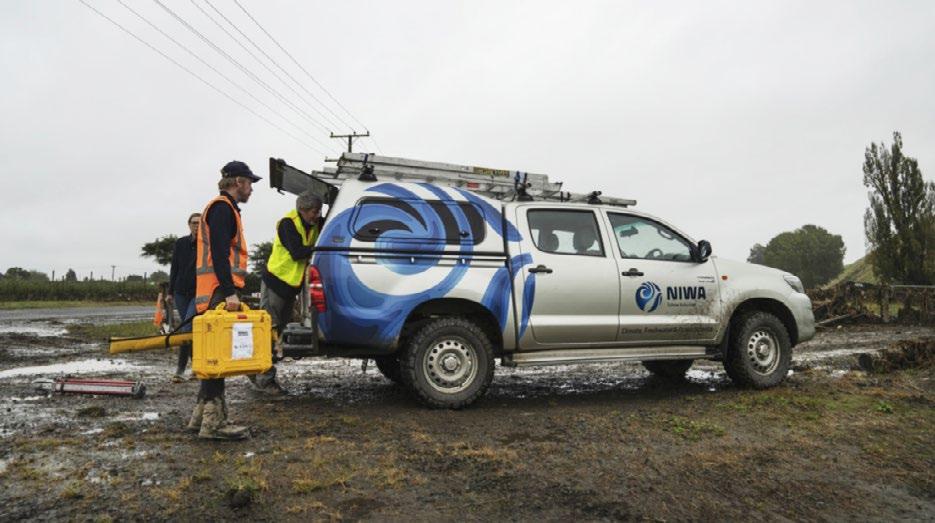
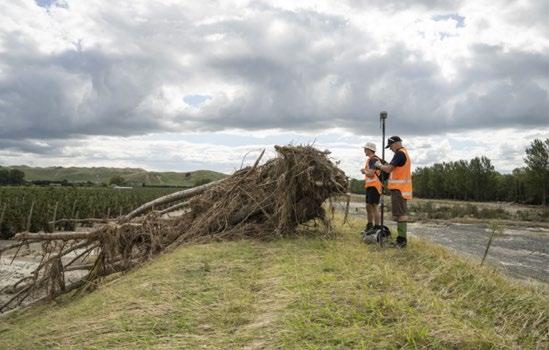
Cyclone Gabrielle unleashed torrential rain and record floods across Hawke’s Bay and Tairāwhiti in the second week of February. In the days that followed, river flow experts and hazard scientists rushed to the region to capture vital data showing the full fury of the storm. Stacy Mohan talks to the researchers unravelling Gabrielle’s legacy and helping local communities plan for their future.
Dr Graeme Smart is looking out across a featureless metre-high layer of silt. Behind him are the remains of a stopbank breached by the raging Tūtaekurī River.
Just a week ago this was a thriving orchard in full production. Now orphaned apples litter the landscape and there’s not a fruit tree in sight. The orchard has been completely swept aside by terrifying, torrential flood waters, and everywhere you look is sediment or debris.
“It’s devastating,” says Smart, a NIWA principal hazards and hydrodynamics scientist.
“This was a really large flood – the stopbank had half a metre clearance on what they thought was a one-in-100year flood level when they designed it. The river level went well above that.”
Smart and his colleagues are on a mission: to urgently capture, measure and map the flood levels left in Cyclone Gabrielle’s wake, before more forecast rain washes the evidence away.
He knows the importance of his work. The people of Hawke’s Bay, he says, need to understand exactly what happened to their rivers, if they are to recover from this disaster and effectively prepare for what lies ahead.
“Just a little bit of rain washes away all the silt lines and all the top water levels. We have to get this data before it is obliterated.”
“It is critical for future planning.”
NIWA forecasting, hazards and hydrodynamics staff had already had a hectic start to the year.
Cyclone Hale swept in during the second week of January, leaving a trail of wrecked roads and severed power lines from Northland, through the Coromandel and down the East Coast.
Next came the Auckland Anniversary Weekend floods –four dead, homes, streets and airports inundated and a city reeling from the record-breaking deluge.
Little over a week later, NIWA’s Forecasting Services team, led by meteorologist Chris Brandolino, watched in alarm as Cyclone Gabrielle began to form in the northeastern Coral Sea, possibly heading south.
Worried by its size, the team started to alert agencies about Gabrielle’s progress. A string of briefings followed for Fire and Emergency New Zealand, the Department of Conservation and the Ministry for Primary Industries, with
officials from the National Emergency Management Agency and Civil Defence also sitting in. These briefings were interspersed with on-going media interviews and updates on social media.
While the cyclone’s track was still uncertain, coastal and river flow specialists pitched in. Natural hazards scientist Dr Emily Lane worked with her team to combine coastal storm surge predictions with forecasts for the multiple possible cyclone tracks.
Led by Dr Céline Cattoën-Gilbert, another group focused on river catchments. They are fine tuning a new modelling tool that combines rainfall forecasts with a hydrological model to pinpoint areas likely to be most impacted by high river flows. During weather events such as Cyclone Gabrielle, Brandolino and the other NIWA forecasters often present data from this tool.
Brandolino can’t speak highly enough about the value of having NIWA’s other experts on hand to help understand what might happen. “As meteorologists we’re well versed at communicating direct weather-related impacts, but we really need the other experts when it comes to coastal inundation and river flooding. Having them in the tent during Cyclone Gabrielle was critical,” he says.
“It’s all about the impacts. There were questions that people were going to ask and without that extra information we wouldn’t have been able to answer them. Even though there was still uncertainty, the agencies we briefed before and during the cyclone were incredibly grateful for the additional information.”
Other researchers started looking at landslide risks. Over the past year NIWA has been working with GNS Science on a pilot study looking at forecasting rainfall-induced landslides (RILs) in the Wellington region.
The work combines NIWA’s near-real time rain forecasts with GNS’s land stability data.
“As Cyclone Gabrielle approached, GNS Science extended the pilot study to trial the RIL forecast tool across much of the upper North Island,” explains NIWA climate scientist Dr Trevor Carey-Smith.
“The landslide forecasts were converted to impact forecasts – houses, roads and rail networks – and shared with councils, central government and emergency response agencies to help inform decisions about things like evacuations and road closures.”
Gabrielle swept onto the northeast of the North Island in the early hours of Sunday, 12 February, saving its full fury for Hawke’s Bay and Tairāwhiti two days later. It claimed 11 lives, destroyed hundreds of homes and devastated huge
swathes of agricultural and horticultural land.
The most expensive weather event to hit New Zealand, the bill is being counted in billions. Treasury’s latest estimates suggest it may top the $13 billion price tag for the 2011 Christchurch earthquakes.
The flood waters were only starting to recede as Christchurch-based Smart and his colleagues packed their survey equipment and headed for Hawke’s Bay and Tairīwhiti to gather critical time-sensitive data.
“Hawke’s Bay Regional Council put out a call to ask who could pitch in,” explains hydrodynamics technician Jochen Bind. “And NIWA, amongst a whole bunch of other organisations, said ‘yes, we’ll be there’.”
Smart and Bind were two of several NIWA staff, alongside teams from agencies and locations across the country, who answered the call.
The first sites they tackled were the stopbank breaches and extensive flooding caused by the Tūtaekurī, Ngaruroro and Esk Rivers.
The data captured is now being used to calibrate flood models and help pinpoint the mechanisms driving sediment transport and stopbank breaches. It will be key to designing new flood defences.
“It’s really important when there’s a natural disaster like this that we capture the water depths, levels and extents, because an event is the real thing. It’s not a model, it’s a one hundred percent perfect model,” says Smart.
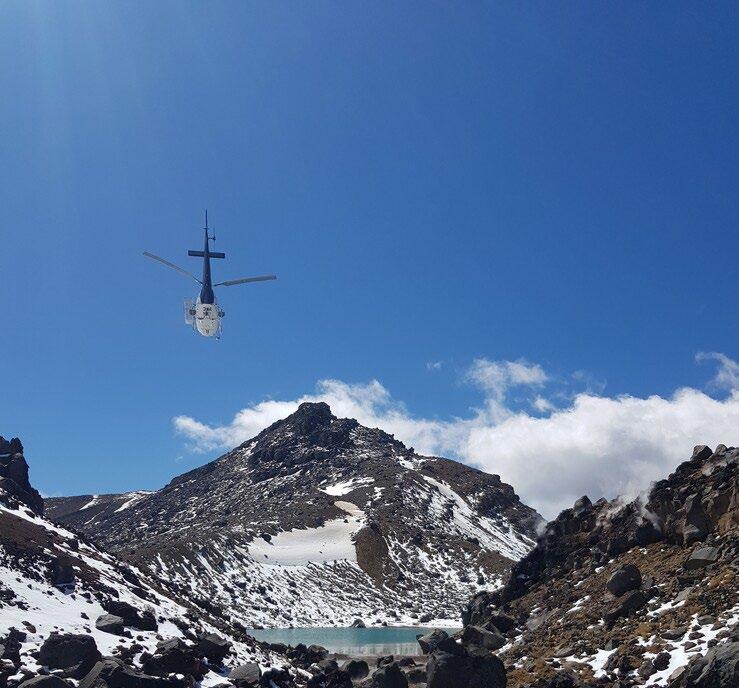
As the survey team worked on the ground, NIWA also joined forces with the University of Canterbury (UC) and Christchurch Helicopters, to collect aerial LiDAR data, covering the worst affected areas.
LiDAR – which stands for Light Detection and Ranging – is a method of rapidly capturing topographic data to build 3D maps. With the LiDAR instrument mounted on a helicopter, a team led by UC’s Professor James Brasington flew rapid response surveys of stop banks for Hawke’s Bay Regional Council.
“The LiDAR data has been critical for investigating the impact of Cyclone Gabrielle,” says NIWA hydrodynamics scientist Dr Hamish Biggs.
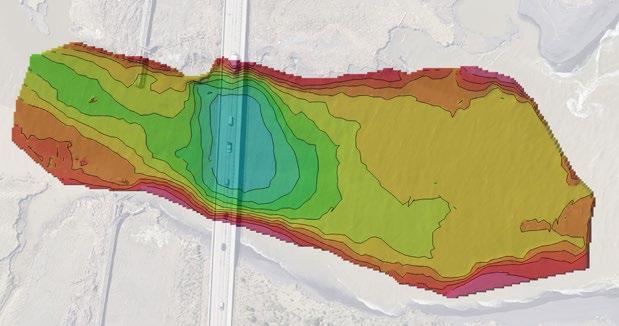
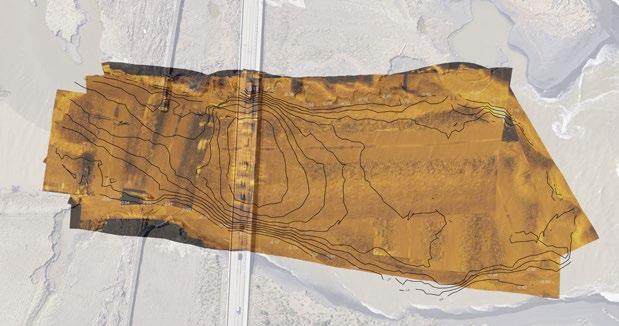
By comparing the post-Gabrielle helicopter LiDAR data with LiDAR surveys from 2020 by Land Information New Zealand (LINZ), researchers can investigate stopbank breaches, woody debris piles, riverbank erosion, flood inundation depths and sediment deposits.
The LiDAR data is also a critical input for NIWA’s flood modelling work.
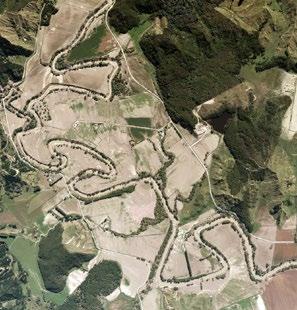
Sediment is one of the biggest challenges for communities facing the long road of recovery. It’s estimated that about eight million tonnes of river sediment and four million tonnes of hillside erosion lies in the Esk Valley alone.
“The amount of sediment deposited through the lower catchment was mind-blowing, and just devastating to the agricultural and horticultural lands,” says Haddadchi.
“Lab analysis of the samples will help us understand more about particle size distribution, stratification and contamination by toxic chemical and biological substances.”
Dust created by the wind or clean-up activities, and smoke from debris burn off, is also compounding air quality problems.
Aerial surveys reveal widespread sediment deposits across the Esk Valley floor. Red dots on the LiDAR generated map to the left denote more than 50 sediment sampling sites. [NIWA]
To gain insights into what people are inhaling, NIWA air quality researchers led by Dr Elizabeth Somervell are working with local health and air quality experts to set up monitoring networks across Hawke’s Bay and Tairāwhiti.
These findings, along with the sediment sampling work, will help councils and communities make decisions about how best to tackle recovery.
Millions of tonnes of sediment have also poured out the river estuaries into Hawke Bay. NIWA marine scientists have begun mapping around 200km² of coastal seafloor using multibeam echosounder equipment.
This data will build on surveys carried out six years ago, assessing where the sediment outwash has settled and possible impacts on biodiversity and the marine environment.
Mā te haumaru ō te wai is a five-year research programme funded by the Ministry of Business, Innovation and Employment (MBIE). Led by Dr Emily Lane, the team is developing a system to map flood hazard consistently across the whole country.
It will reveal how flood risk across New Zealand will vary over the next 100 years, as climate-induced changes, such as rising rainfall and sea levels, interact with land-use changes.
In Gabrielle’s wake, the team refocused their efforts on urgent new flood hazard maps for the worst affected parts of
Hawke’s Bay.
Additional investment by MBIE has enabled the work to be extended across the rest of the region and Tairāwhiti.
“We need to understand what will happen when the next extreme event comes our way. How have changes in riverbed levels and channels from sediment deposits altered the flood hazard? And what is the impact of the changing climate?” says Lane.
“Councils need to be able to respond to this event as quickly as possible to provide certainty to their residents. They are already making decisions about managed retreat and rebuilding stopbanks.”
In addition, NIWA and GNS Science have begun working directly with Cyclone Gabrielle recovery agencies using the RiskScape analysis tool
RiskScape is a sophisticated software application that enables users to rapidly work out the dangers and impacts of a range of natural hazards.
It will help councils and other agencies make maximum use of the new flood maps, and other data being produced, to inform their response.
The version of RiskScape being used for the Gabrielle response includes a dashboard for agencies tasked with short- and long-term recovery decisions for individuals, communities and sectors.
“It’s highly customisable, and will let users input the data they’re interested in to assess vulnerability of assets and people to future storms and floods,” says NIWA hazard analyst Ryan Paulik.
“This will help response planning, including difficult discussions about things like managed retreat,” he says.
Back by the Tūtaekurī stopbank breach, Graeme Smart takes in the devastation around him.
He was here so quickly, he says it reminds him of his experience living through the Christchurch earthquakes and their aftermath. But he also talks warmly about the community spirit he witnessed then, and is seeing again now.
Smart clearly considers he is working for the local community, helping them respond to this disaster and prepare for the next.
“Until we had climate change, past behaviour of weather was the best indicator of future behaviour. This is getting really uncertain now because disastrous events like this are happening in many countries.
“It’s like there’s a step-change in the way that the climate is behaving and it’s very difficult for us to predict into the future,” says Smart.
“But whatever happens, if we measure what is happening, we’re partly on that journey.” •
Recent weather events affecting Aotearoa New Zealand clearly indicate that increased study and research is needed into the impacts of climate change on urban development, infrastructure and the built environment.
Surveyors and spatial scientists are often at the forefront of design decisions and planning approvals for new housing and changes to the environment that can ultimately be adversely affected by increased risk of flooding, sea-level rise and other climate-induced natural hazards. These changing weather patterns require surveyors to respond and seriously reconsider their modelling parameters to more realistically determine water flow volumes, storm flood paths and safer urban housing areas.
Dr Mick Strack, of the School of Surveying, has conducted research over many years on climate response and produced many relevant articles on the effects of sea-level rise on property, and the inevitable need for managed retreat in this country. Some of these articles include:
‘The order is rapidly fadin': Responding to the impact of climate change on property with reference to the Aotearoa New Zealand context (http://dx.doi. org/10.1108/JPPEL-03-2019-0007)
'They'll be drownded in the tide':
Reconsidering coastal boundaries in the face of sea-level rise (https:// grf.bgu.ac.il/index.php/GRF/article/ view/423/414)
‘Before it is washed to the sea’, Coastal development and erosion (https://www. academia.edu/40190413)
As the titles suggest, Mick is a lover of Bob Dylan, and students and alumni may recount that his lectures would typically start with a Dylan song, or another artist from that period. Now after 27 years of teaching, research and mentoring at the School, he is retiring, as he says, to spend more time with his mokopuna. He has been a pillar of the School and made a significant contribution to many areas of teaching, but particularly land planning, tenure, land administration, environmental and Māori land studies.
The industry has also greatly benefited from his considerable body of research – on responding to climate change as above, but also in the areas of the legal definition of rivers, environmental teaching in higher education, Māori land Treaty issues as well as other subjects. Mick has also supervised and mentored a very large number of honours and postgraduate students in his time.
Many years ago, Mick and I worked together in Nelson at the survey office of I. and H. Gourdie. He was a technician surveyor, and I was a graduate. I doubt many members would be aware that Mick had a large amount of survey work experience before his time at university, including a number of years working in Egypt on various oil and gas projects and housing developments.
He says that I encouraged him to come to Dunedin to undertake a BSurv – which he did and ultimately stayed on for an MSurv, a PhD and a lecturing role – but, it is Mick who has provided the most encouragement, mentoring and guidance in teaching for me, and many of my colleagues during his tenure here. We are sad to see him depart but wish
him all the very best for his pending and well-deserved retirement.
As noted in the last issue of Surveying+Spatial, another staff change took place at the start of this year with Professor Christina Hulbe’s second five-year term as dean coming to an end and Associate Professor Antoni (Tony) Moore taking over the helm.
Christina has worked tirelessly for the School during her time as dean. She has been responsible for some very positive improvements in management, worked through departmental and curriculum reviews, and significantly strengthened the School’s practices with respect to te ao Māori and mātauranga Māori. She has encouraged us to engage with this tikanga, and all staff have actively embraced this in their teaching and strived to increase their personal knowledge and use of te reo.
Christina will remain in the School and is coordinating the new first year paper – People, Place and the Built Environment. Even at this early stage of their tertiary study, this paper will be critical in introducing new surveying and spatial students to the risk of climate change, and improved ways of thinking about design, planning and surveying responses to this new and ever-changing normal.
The School and University of Otago are looking forward to hosting this year’s S+SNZ Conference (August 30-31). The School is also taking the opportunity to celebrate its 60th anniversary and hopes many conference attendees will remain in Dunedin for the reunion on Friday August 31 and the School’s open day on Saturday September 1.
We also hope that attendees can take advantage of the industry pre-conference training day on Wednesday August 29. Information on all of these School-organised events can be found on the S+SNZ conference website: https://www.surveyspatialnzconference.org/. •