
BENV0054 WELLBEING IN BUILDINGS: THEORY & PRACTICE VXGC7 AN EXPERIMENT ON THE EFFECT OF BIOPHILIA IN THE BUILT ENVIRONMENT ON WELLBEING
This study explores the potential influences of blue and green biophilic colour exposures on human wellbeing. It conducts an experiment that places 11 participants in a room with (1) blue-desk (2) green-desks and (3) wooden-desks subsequently with breaks in-between and measures their performance through three cognitive tasks and a typing task. The environmental conditions within the room are monitored and the participants are directed to fill out the Warwick-Edinburgh Mental Wellbeing Scale survey before and after the experiment. The results indicate that blue-desk exposure allows for better performance in fast counting and visual reaction speed while wooden-desk exposure allows for better performance in accurate fast typing and visual backward digit span. The experiment however lacks validity as it represented several flaws and limitations within the adapted approach. The research suggests a more holistic and comprehensive approach should be adapted to measure wellbeing in the built environment.
i
A B S T R A C T
ii C O N T E N T S 1 . 0 I N T R O D U C T I O N Defining Wellbeing......................................................................................................................................01 Measuring Wellbeing....................................................................................................................................03 Difficulties in Defining and Measuring Wellbeing.....................................................................................05 Biophilia and Wellbeing..............................................................................................................................05 Research Aims and Objectives..................................................................................................................09 2 . 0 M E T H O D S 1.1 1.2 1.3 1.4 1.5 1.4.1 1.4.2 What is Biophilia?............................................................................................................. .............05 Biophilic Design............................................................................................................... ..............05 Experiment Design and Methodology........................................................................................................10 Experiment Flaws........................................................................................................................................14 Experiment Procedure................................................................................................................................14 Approach to Data Analysis.........................................................................................................................15 2.1 2.2 2.3 2.4 2.1.1 2.1.2 2.1.3 Experiment Measures.....................................................................................................................11 Experiment Interventions.............................................................................................................12 Experiment Tasks...........................................................................................................................13 3 . 0 R E S U L T S & D I S C U S S I O N 4 . 0 C O N C L U S I O N 5 . 0 R E F E R E N C E S 6 . 0 A P P E N D I X Information Sheet.........................................................................................................................................24 Consent Form...............................................................................................................................................27 Sample from Colour-Blindness Test............................................................................................................30 ASHRAE 55-2014 Thermal Comfort Verification Survey...........................................................................30 Warwick-Edinburgh Mental Wellbeing Scale..............................................................................................32 Typing Task Text............................................................................................................................................32 1 2 3 4 5 6 p. 16 p. 21 p. 22 p. 24 p. 10 p. 01 Tasks............................................................................................................................................................16 Wellbeing Scale...........................................................................................................................................18 Heart Rate..................................................................................................................................................19 Limitations and Improving the Study.........................................................................................................21 3.1 3.2 3.3 3.4
1.1 2.1 2.2 2.3 2.4 2.5 3.1 3.2 3.3 3.4 3.5 T A B L E S
1.1 1.2 1.3 2.1 2.2 2.3 3.1 3.2
Illustration based on Maslow’s hierarchy of needs..................................................................................02
Experiment room before required arrangement......................................................................................12 Experiment room after required arrangement.........................................................................................12 Blue desks setting............................................................................................................. ..........................12 Green desks setting....................................................................................................................................12 Wooden desks - controlled setting...........................................................................................................12
Average task scores within the blue desk setting, the green desk setting, and the wooden desk-controlled setting.............................................................................................................................................16
Thermal comfort survey results................................................................................................................17 Participant’s wellbeing by the end of the experiment.............................................................................18 Warwick-Edinburgh Mental Wellbeing survey mean scores before and after the experiment.............18 Heart rate activity of 5 participants in the three exposure settings......................................................20
Wellbeing measuring approaches...............................................................................................................04 The different types of biophilic design strategies with examples...........................................................07 An overview on the impact of biophilic design strategies on health and wellbeing..............................08
Experiment measures, interventions, tasks, outcome data and rationale...............................................11 Flaws within the experiment design..........................................................................................................14 Procedure and mean environmental conditions on experiment day......................................................15
Correlations between performance tasks................................................................................................17 Correlations between wellbeing scores and performance tasks............................................................19
iii L I S T O F F I G U R E S
F I G U R E S
Building for the wellbeing of people bestows benefits on multiple fronts. The influence of the built environment on individuals is not trivial, but rather significant in impact. Studies have found that the quality of indoor spaces pose the ability to positively influence health, wellbeing, and productivity (Allen et al., 2015; Allen et al., 2016; MacNaughton et al., 2017; Samet and Spengler, 2003). It is thus with reason, that built forms should motion for conducive health and wellbeing, and in effect facilitate fruitful, human-giving environments that better the lives of communities and greater organisations.
DEFINING WELLBEING
In order to understand the relationship between the built environment and wellbeing, it is important to first define the term ‘wellbeing’ with regard to its broad relations.
In many cases, studies have linked the definition of wellbeing to health. The World Health Organization (2014) for instance, recognises health as a ‘state of complete physical, mental and social wellbeing and not merely the absence of disease or infirmity’. This can imply that wellbeing is a physical, mental, and social determinant of health, and not simply limited to mental capital or being a constituent to health through lack of illness. The Department for Environment, Food and Rural Affairs adds onto this by outlining that wellbeing ‘is not just the absence of pain, discomfort and incapacity. It requires that basic needs are met, that individuals have a sense of purpose, that they feel able to achieve important personal goals and participate in society.’ (Department of Health, 2010). Through this statement, the term ‘wellbeing’ advances to incorporate and recognise individual and societal contributions. It further alludes to Maslow’s (1943) theory of human motivation and hierarchy of needs - where Maslow proposes wellbeing and higher performance are achieved when an individual meets their fundamental physical, functional, and psychological needs, in ascending order; see figure 1.1.
1 . 0 I N T R O D U C T I O N
01
1.1
SELFACTUALISATION
ESTEEM BELONGING SAFETY
HIGH PERFORMANCE
WELLBEING
Correspondingly, the definition of wellbeing is adopted with considerations on individual subjectivity. In a study conducted by Shin and Johnson (1978), the authors link happiness to wellbeing by stating that the notion should be viewed as “a global assessment of a person’s quality of life according to his own chosen criteria” (p. 478), consequently this implies that wellbeing can be defined by the individual through self-declaration. Such definition puts great emphasis on an individual’s perception of their life and the degree to which they believe they are well. Similarly, the World Health Organization (1997) accounts for how perception can be ambiguous in terms of context, culture, goals, expectations, standards, and concerns, and thus defining an individual’s quality of life and consequently their wellbeing, is a complex concept affected by physical, psychological, personal, social, and environmental contributions.
More relevantly, acknowledging personal circumstance yields a better understanding on the definitive nature of wellbeing. Dodge et al. (2012), identify the concept of wellbeing as a balance point between an individual’s psychological, social, and physical available resources and challenges in which they face. In the case where an individual has enough resources to meet demanding life challenges, there will be balance and hence conducive wellbeing is maintained - elsewise, an unbalance would imply wellbeing suffers.
WELLNESS
Figure 1.1, illustration based on Maslow’s hierarchy of needs

02
GUIDES
PHYSICAL FUNCTIONAL PSYCHOLOGICAL REGULATIONS STANDARDS
PHYSIOLOGICAL nourishment, comfort, health, sleep
purpose, potential
intimacy, trust, social, friendship
achieve, prestige, respect
There are several strategies that have been adopted in the built environment to better account wellbeing. They branch across quantitative and qualitative measures, and can be categorised into two dimensions: objective, where wellbeing expands on capabilities and fair allocations, and subjective, where wellbeing expands on emotional wellbeing and life evaluation (Department of Health, 2014; Drabsch, 2012).Individual assessments in objective dimensions can include actual work, tasks, and physiological assessment, whereas subjective dimensions include direct self-report such as surveys, interviews, and focus groups.
It is important to note that objective measures are only a proxy of wellbeing – consequently, data gathered through that approach may not be substantial to determine wellbeing. On the other hand, subjective measures are more focused on individual perception – this however might question the generalisability of results. Table 1.1 explores a range of wellbeing measuring approaches, along with their methods, advantages, and potential limitations.
03
1.2 MEASURING WELLBEING
Measuring Approach Method Examples Advantages Limitation Supporting References
Can be carried out without asking people directly, involves on looking at quantative data.
Average Income Assessment Allows insight into a populasituation.
Does not identify how an individual feels about (Department of Health, 2014)
Objective Wellbeing
It is based on assumptions about basic human needs such as adequate food, physical health, education & safety.
It can be measured through self-report of health conditions.
Gross Domestic Product (GDP) Functions as an account of a given country’s economic health.
Life Expectancy Provides a metric for assessing a population’s health.
Absenteesim Rate Allows insight into people and their work spheres - may help identify casual relationships between work & wellbeing.
Human Development Index (HDI)
Consists of asking people directly about how they think and feel about their own perceived wellbeing.
ONS Wellbeing Questions
Considers life expectancy & health, knowledge & education, and standard of living.
Considers life satisfaction, worthwhile, happiness & anxiety.
Does not declare individual situation or reveal other aspects of wellbeing.
Does not directly address non-fatal health outcomes.
Missed workdays involve individual circumstance and are not merely a result of suffering wellbeing.
(Drabsch, 2012) (UNDP, 2020) (World Health Organization, 2014)
Subjective Wellbeing
This includes life satisfaction (evaluation), positive emotions (hedonic) & meaningful life (eudemonic).
The Warwick Edinburgh Mental Wellbeing Scale
Complete reliance on it may be misleading.
Covers feelings and functioning aspects of mental wellbeing - results provide a single score.
Short Smith Wellbeing Questionnaire about an individual’s job which inform aspects of wellbeing.
Occupant Indoor Environmental Quality Survey
Offers different surveys for different building types and occupancies.
Sick Building Syndrome (SBS) Explores potential physical illness from buildings.
Questions on the scale refer to past feelings and thoughts - subjects may provide answers that are sensitive to change.
Does not derive a single answer or indicator. (CBE, n.d.) (Department of Health, 2014) (Drabsch, 2012) (Warwick, 2021) (Smith and Smith, 2017)
Some questions in the survey need to be specinformation (i.e., physical, mental and emotional fatigue addressed separately and not as whole)
Percieved satisfaction on environmental qualities may vary during different times.
Questions in the survey may be a result of personal conditions but individuals are unaware.
04
Table
1.1, wellbeing measuring approaches
1.3 DIFFICULTIES IN DEFINING AND MEASURING WELLBEING
From what has been mentioned in prior, it is evident that there should be continuous recognition of the multiple levels of environmental factors as well as personal and global, that determine an individual’s wellbeing. The problem in the latter, is that much like human evolution, societal systems and the environment are ever-changing and dependant on various interconnected factors. This has continuously raised difficultly in grasping the definition and measuring of wellbeing. As put by Pollard and Lee (2003), wellbeing is “a complex, multi-faceted construct that has continued to elude researchers’ attempts to define and measure it” (p. 60-61).
1.4 BIOPHILIA AND WELLBEING
1.4.1
WHAT IS BIOPHILIA?
Throughout millenniums, the natural world has proven to provide human beings with substantial sustenance, refuge, and immense qualities and systems that have in effect, shaped human evolution. The sensory world dominated by environmental features such as light, sound, smell, wind, weather, water, vegetation, animals, and landscapes, proved to be influential in enhancing human physical, emotional, and intellectual health, and hence, the development of the human mind and body (Kellert, Heerwagen and Mador, 2008). In effect, this process has resulted to a biologically encoded human tendency to affiliate with nature – and this is what the term ‘biophilia’ refers to. Put in other words by Wilson (1984), ‘biophilia’ is the “innate tendency to focus on life and lifelike processes” (p. 1). Crucially, Kellert and Wilson (1993) raise the notion that the inherent human inclination to gravitate towards natural features of the nonhuman environment extend beyond material and physical sustenance to include a human need for aesthetic, intellectual, cognitive, and even spiritual meaning, and satisfaction; all of which can be identified as determinants of wellbeing.
1.4.2 BIOPHILIC DESIGN
The application of biophilia in the built environment is referred to as biophilic design, and this encompasses a wide variety of exposures and applications that link humans to natural life and processes.
05
Kellert and Calabrese (2015) and Browning, Ryan, and Clancy (2014) provide a substantial documentation on biophilic design, and similarly cover three dimensions that embody the definition of biophilia. Firstly, Kellert and Calabrese (2015) refer to biophilic design strategies as experiences and attributes. The authors propose that nature represents three categories of experience, and these inform their biophilic design framework. The latter expands on - direct experience of nature, indirect experience of nature, and experience of space and place. Meanwhile, Browning, Ryan, and Clancy (2014) organise biophilic design strategies as principles, and similarly into three categories that acknowledge different dimensions of biophilia and inform their biophilic design framework, and these are - nature in the space, natural analogues, and nature of the space. Table 1.2 explores the common strategies proposed by both accounts and expands on them by providing distinguishable examples.
06
Direct Experience of Nature
• Light
• Air
Indirect Experience of Nature Experience of Space and Place
• Images of nature
• Natural materials
• Prospect & refuge
• Organized complexity
(Kellert and Calabrese, 2015) (Browning, Ryan and Clancy, 2014)
• Water
• Plants
• Animals
• Weather
• Natural landscapes & ecosystems
• Fire
Examples (Oseland 2022)
• Generous use of glass
• Inclusion of natural sounds
• Wind variation
• Inclusion of abundant & local species of plants
• Visual view of nature
• Natural colors
• Simulating natural light and air
• Naturalistic shapes and forms
• Evoking nature
• Information richness
• Age, change, and the patina of time
• Natural geometries
• Biomimicry
• Integration of parts to wholes
• Transitional spaces
•
• Cultural and ecological attachment to place
• Using materials such as timber and stone
• Furniture with organic shapes
• Artwork & wall patterns that incorporate fractals and spirals
• Incorporation of earth tone colours, and not bright colours
• Visual connection with nature
• Non-visual connection with nature
• Non-rhythmic sensory stimuli
•ability
• Presence of water
• Dynamic & diffused light
• Connection with natural systems
Nature in the Space
• Biomorphic forms & patterns
• Material connection with nature
• Complexity & order
Natural Analogues
Following the account of biophilic design strategies, the subsequent impacts on human health and wellbeing from the mentioned dimensions are explored in table 1.3, with recognition to potential knowledge gaps.
• Integration of a central focal point
• Clear pathways & points of entry
• Inclusion of both high & low ceilings
• Design for play of shadows & depths
• Prospect
• Refuge
• Mystery
• Risk/Peril
Nature of the Space
Table 1.2, the different types of biophilic design strategies with examples – adopted from Kellert and Calabrese (2015), Browning, Ryan and Clancy (2014) and Oseland (2022)
07
Biophilic Design Strategy
Direct Experience of Nature
( Kellert and Calabrese, 2015)
Indirect Experienceof Nature
Impacts on Health & Wellbeing Knowledge Gaps Reduces Stress Improves Cognitive Performance
Improves Emotion, Mood & Satisfaction
Light X X
Air X X X Water X X X Plants X X X Animals X X Weather X
Natural Landscapes & Ecosystems X Fire X
Images of Nature X
Natural Materials X X Natural Colours X X X
Simulating Natural Light & Air Naturalistic Shapes & Forms
• Experience / results from different levels of sensory stimuli.
• how individual experience is affected by personal and environmental factors.
• Limited knowledge on how different personality types and preference affects individual perception of indirect experience of nature.
• levels of variance.
Organised Complexity X Integration of Parts to Wholes X Transitional Spaces X X X
Evoking Nature X Information Richness X Age, Change, & the Patina of time X Natural Geometries Biomimicry X Experience of Space and Place Prospect & Refuge X X X
• An account for its diverse and broad measures.
• The impact of exposure to several ‘experience of space & place’ attributes on an individual.
Nature in the Space
Visual Connection with Nature X X X
Non-visual Connection with Nature X X X Non-rhythmic Sensory Stimuli X X X X X
Presence of Water X X X Dynamic & Diffuse Light X Connection with Natural Systems X
• Experience / results from different levels of sensory stimuli.
• levels of variance.
Natural Analogues Biomorphic Forms & Patterns X
Cultural & Ecological Attachment to Place X X (Browning, Ryan and Clancy, 2014)
Material Connection with Nature X X Complexity & Order X X
Nature of the Space Prospect X X X
Refuge X Mystery X Risk / Peril X
• The effects of different biomorphic forms on wellbeing.
• The right balance of mystery in built forms to avoid occupant distress.
Table 1.3, an overview on the impact of biophilic design strategies on health and wellbeing - adopted from research by Kellert and Calabrese (2015) and Browning, Ryan and Clancy (2014)
08
RESEARCH AIMS AND OBJECTIVES
The reviewed literature has provided evidence that implies indirect experience with nature or natural analogues, such as the use of colours can positively impact wellbeing. They have not articulated however, the effects of blue hues against green hues. To test this hypothesis, this study will be directed into an experiment that measures the effect of biophilic colour exposures on cognitive performance and wellbeing.
The aim of the experiment is to identify potential differences between blue and green biophilic colour exposures and a controlled setting, on cognitive performance and wellbeing.
The experiment objective is to therefore design three different settings with the same amount of colour exposure (blue, green, controlled), and direct participants to undertake a set of tasks in each setting and fill out subjective experience and wellbeing questionnaires.
09
1.5
2.1 EXPERIMENT DESIGN AND METHODOLOGY
11 students from the UCL Master’s programme choose to participate in an experiment approved by the BENV0054 Wellbeing in Buildings Module. The experiment tested participant’s cognitive performance and wellbeing in two biophilic design settings and a controlled setting: (1) setting with blue tables; (2) setting with green tables; (3) setting with wooden tables – controlled setting. Before the start of the experiment, participants were presented with an information and consent form, from which the documents highlighted the experiment procedure, the tasks expected to be done, and how the data conducted from experiment will be managed (see appendix 1 & 2). These were revised and signed by the participants to acknowledge their approval on taking part in the experiment.
All 11 participants were instructed to arrive at room 739 in the UCL Institute of Education department at 10:00 AM on the 24th of November and bring their laptops along with them and avoid having any caffeinated drinks prior to the experiment. Once in the experiment room, the participants were directed to fill out a subjective experience questionnaire, a survey about their perceived wellbeing and a colour-blindness test before starting the experiment. Due to equipment availability, only 5 out of the 11 participants’ heart rate was further monitored via a Fitbit device.
All 11 participants were first exposed to the (1) setting with blue tables – where they were directed to complete an online, typing task and 3 cognitive tasks before taking an approximate 10-minute break. The same procedure was carried out for (2) setting with green tables and (3) setting with wooden tables – controlled. At the end of the experiment, participants were instructed to fill out a survey about their perceived wellbeing. Environmental conditions in the room were monitored throughout via the use of an EDU Logger.
Table 2.1 summarises the experiment design, methodology and rationale by identifying the chosen measures, interventions, tasks, and outcome data.
10 2 . 0 M E T H O D S
Measures
Colour-Blindness Test
ASHRAE 55-2014: Thermal Comfort
Experiment Design
Warwick-Edinburgh Mental Wellbeing Scale: 7-items
Fitbit Devices: Heart rate activity of 5 participants
Edu-Logger:
• Temperature (°C)
• Light (lux)
• Sound (dB)
• R. Humidity (%)
Interventions Tasks Outcome Data
Blue Desks setting
Green Desks setting
Wooden Desks controlled setting
Typing Task:
• A non-sensical paragraph.
Cognitive Tasks:
• Fast Counting
• Go/No-Go Visual Reaction Time
• Visual Backward Digit Span
Warwick-Edinburgh Mental Wellbeing Scale: 7-itemsResults
Typing TaskAccuracy Results
Cognitive TasksScore Results
Experiment Rationale
Thorough account of:
• Potential individual limitation on colour stimuli.
• Subjective thermal comfort.
• Subjective case of wellbeing.
• Heart rate activity.
• Environmental conditions.
- and how this may impact results.
Table 2.1, experiment measures, interventions, tasks, outcome data and rationale
• Controlled exposure of biophilic design strategy - indirect experience of nature.
• Controlled setting introduced last to better comparison of results.
• Tasks test the impact of each intervention setting on task performance.
• Chosen tasks are cultural context.
• Require focus and cognitive skills.
• Compare the participant’s subjective feeling of wellbeing after the experiment in relation to before the experiment.
• Identify task scores in each intervention setting.
2.1.1 EXPERIMENT MEASURES
The experiment measures:
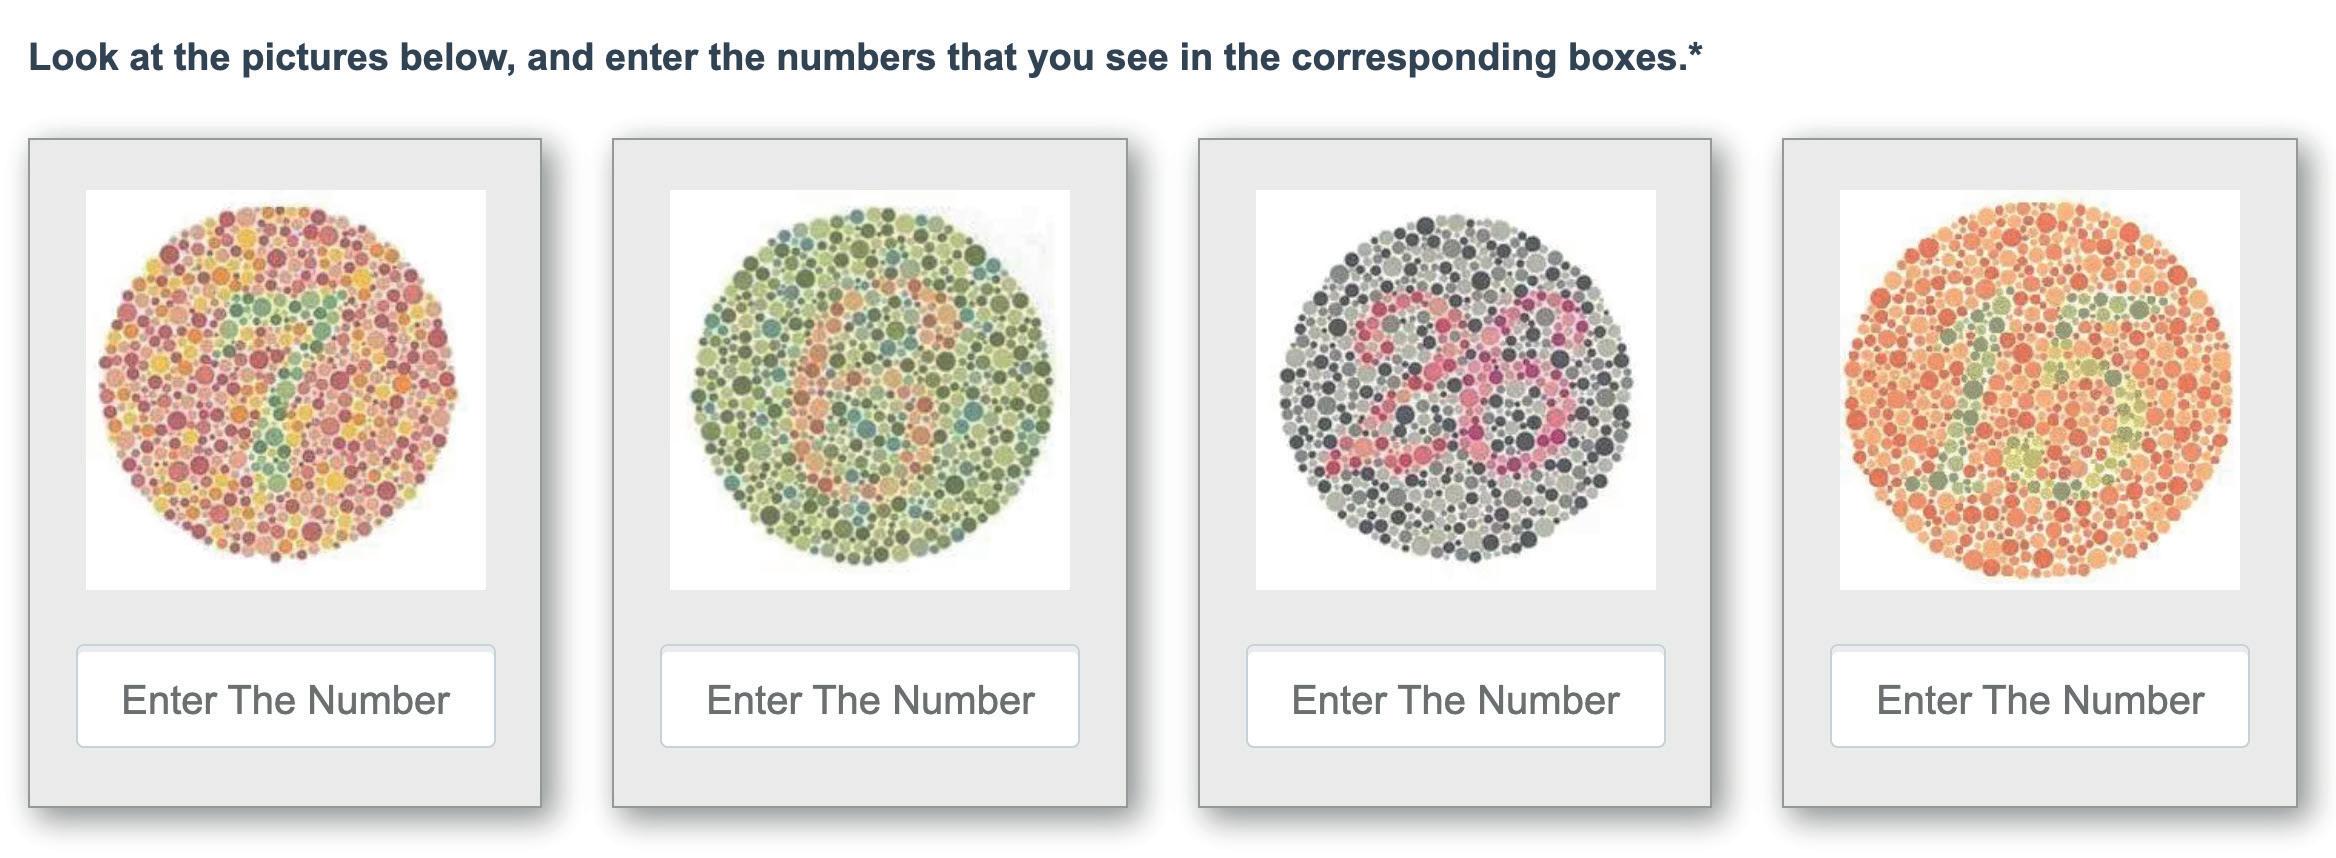
• Colour-Blindness: through Color Blind Test (n.d.), (see appendix 3 for sample).
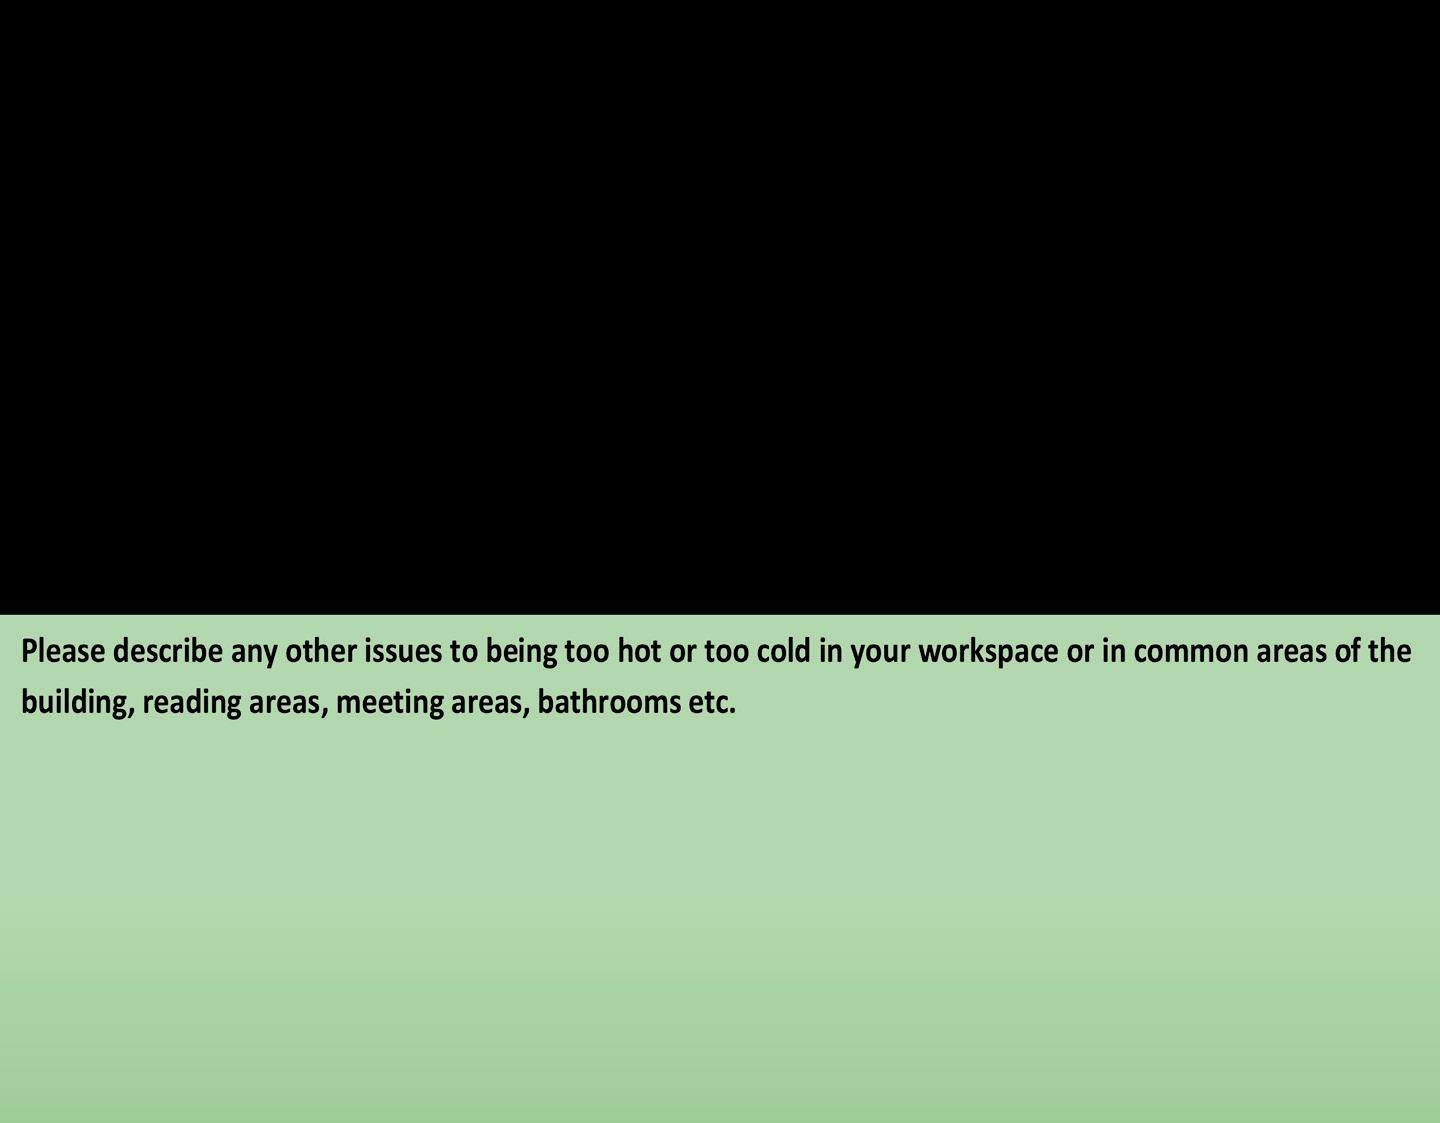
• ASHRAE 55-2014 Thermal Comfort Verification Survey (see appendix 4).
• The Warwick-Edinburgh Mental Wellbeing Scale: 7-items (see appendix 5).
• Heart rate activity: Fitbit device and monitoring application.
• Environmental conditions: EDU-Logger.
11
2.1.2 EXPERIMENT INTERVENTIONS
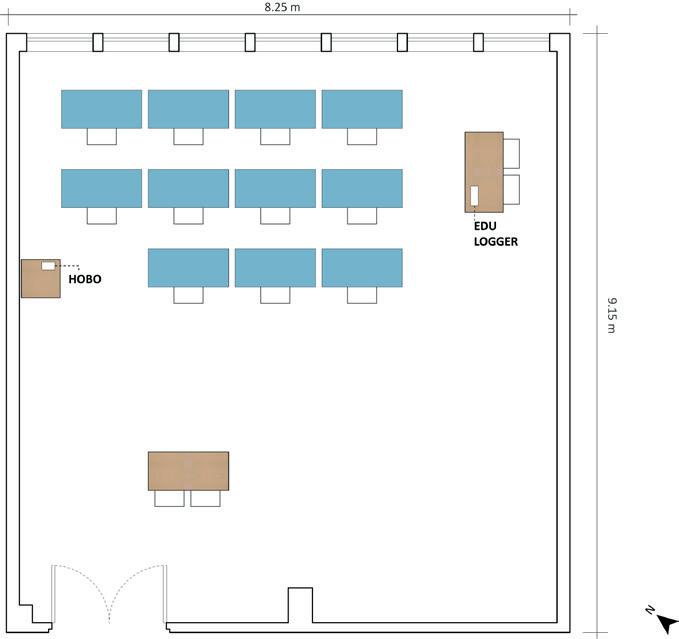
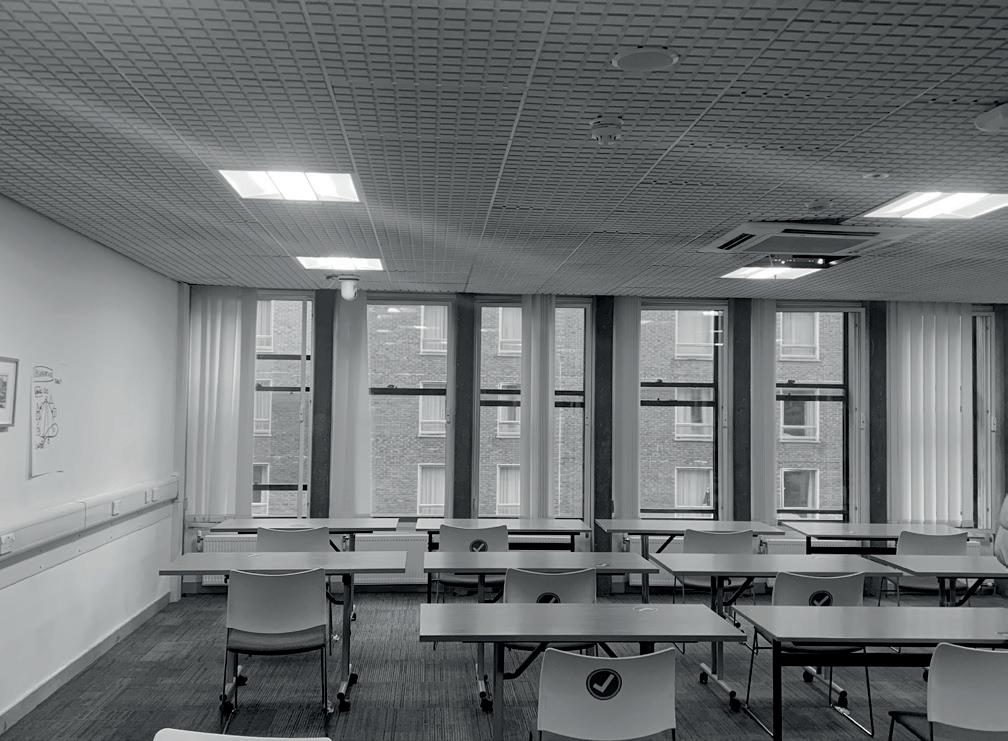
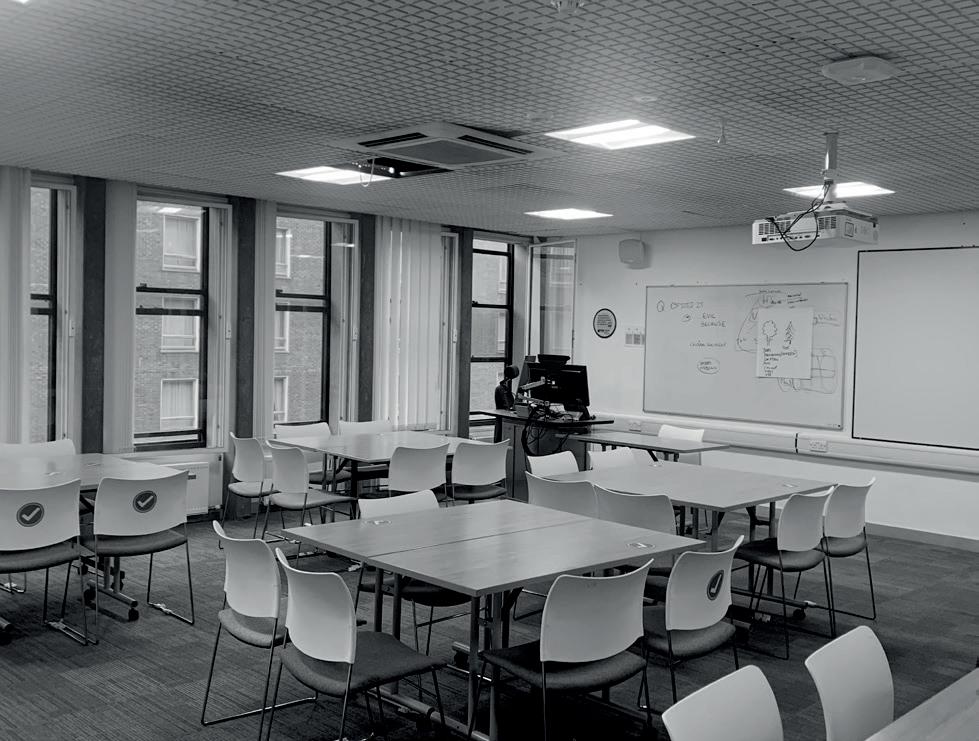
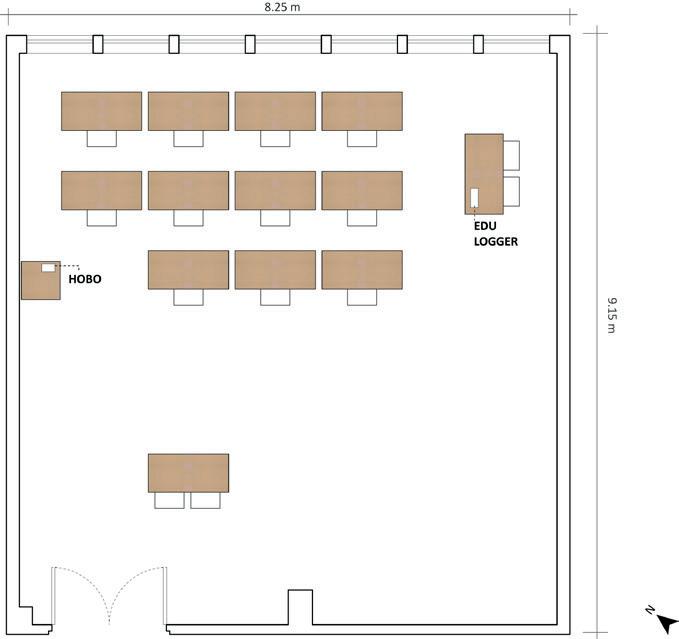
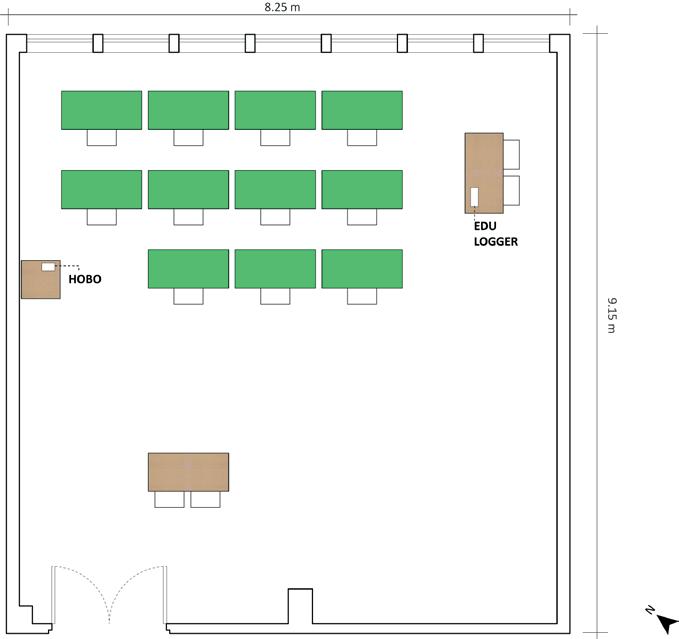
The room 739 in UCL Institute of Education department was re-arranged to adhere to the experiment. Figure 2.1 shows the room before modification, while figure 2.2 shows the room after adjustments.
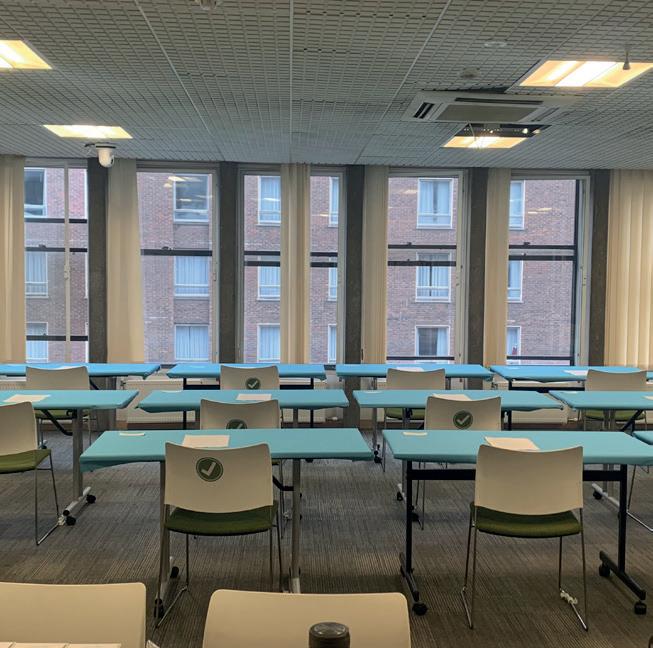
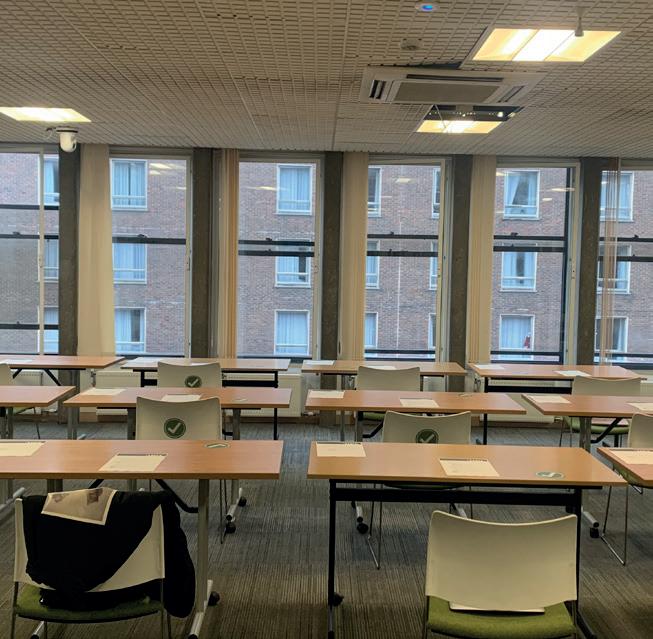
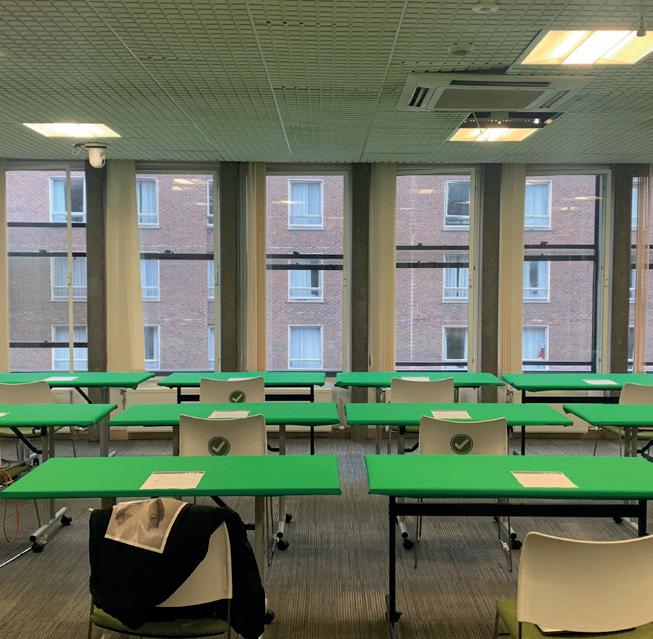
The blue and green colour hues and the controlled setting desk surface used in the experiment are identified below, along with an image taken on the day of the experiment and a plan of the desk arrangement.
12
C: 58 M: 15 Y: 11 K: 0
Figure 2.1, experiment room before required arrangement Figure 2.2, experiment room after required arrangement
Figure 2.3, blue desks setting
2.1.3 EXPERIMENT TASKS
The following tasks are completed by each participant on their preferred technical device.
Typing task:
• A non-sensical paragraph: participants try to re-type the text as fast as possible and with the upmost accuracy in terms of punctuation and capital/lower case letters (see appendix 6 for text used).
Cognitive tasks – adopted from Cognitive Fun (n.d.):
• Fast Counting: A series of dots appear for a certain period on screen, participants type how many dots they counted.
• Go/No-Go Visual Reaction Time: A circle appears on screen, if it is green participants promptly press on it, if it is patterned, they ignore the dot.

• Visual Backward Digit Span: Three numbers, one by one, appear on screen. Participants recall the numbers that are flashed in backwards order.
13
76 M:
Y: 97
C:
0
K:0 C: 22 M: 37 Y: 60 K: 1
Figure 2.4, green desks setting
Figure 2.5, wooden desks - controlled setting
Experiment Flaws
Measures
2.2 EXPERIMENT FLAWS
Table 2.2 explores flaws that emerged within the experiment measures, interventions, and tasks throughout this study.
Experiment Design
Interventions Tasks
Did not adopt an additional measure similar to the Warwick-Edinburgh Mental Wellbeing Scale, to further help identify the dynamic of wellbeing in each participant.
Fitbit devices were not given to all participants - limits the reliability of physiological data.
Although environmental conditions were monitored, they were not intervened with to suit the comfort of most participants - thermal discomfort increases variability in results.
The Warwick-Edinburgh Mental Wellbeing Scale: 7-items - was not given to participants after each intervention, but before and after the experiment as a whole - complicates interpretation of results but minimizes variance.
The biophilic colour hues were not adopted from ‘earth tones’ but rather material availability.
Wooden desk surface in controlled setting interferes with experiment strategy as it tests biophilic colour hues in comparison with biophilic texture/ material and not a plain surface.
The amount of biophilic colour wellbeing was not adequately determined, proposed interventions may have needed to be increased in amount.
Scores from participants who were unfamiliar with the online interface may have performed worse than their actual ability - prior introduction to the online interface may have been required.
As tasks were conducted online, internet speed should have been tested to ensure tasks operated smoothly.
2.3 EXPERIMENT PROCEDURE experiment design
Table 2.3 highlights the timestamps of the experiment session and the room’s mean environmental conditions.
14
Blue Desks Setting
Green Desks Setting
Wooden Desks
Time Operation
10:58 AM Participants entered room
Mean Temp. (°C)
Mean illuminance (lux)
Mean Sound (dB)
Controlled Setting
Mean R. Humidity (%)
18.7 68.9 49.6 37.6 11:18 AM Tasks given
11:47 AM Tasks completed and retrieved from desks
X B R E A K
12:05 PM Participants entered room
12:06 PM Tasks given
12:24 PM Tasks completed and retrieved from desks
X B R E A K
12:33 PM Participants entered room
12:47 PM Tasks completed and retrieved from desks
Table 2.3, procedure and mean environmental conditions on experiment day
18.9 69.5 49.4 37.4
19.0 68.2 48.1 37.3
2.4 APPROACH TO DATA ANALYSIS
The information collected from the participants has been protected throughout by an anonymous participant ID and organised in an Excel spreadsheet by two experiment managers.
15
3.1 TASKS
Initially, the colour-blindness test taken by participants prior to the experiment start, indicated that all participants have normal vision and can distinguish between different colours.
In a sense, the tasks given to participants in the first blue setting, establish a reference point to the green setting and the controlled setting. Figure 3.1 demonstrates the mean scores of all four tasks taken in the design interventions.
The gathered data indicates that performance in the typing and the visual backwards digit span tasks improved whereas performance in fast counting and visual reaction time worsened as the setting changed from blue-desks to green-desks to wooden-desks, subsequently. Where the typing task assessed speed and focus, the visual backwards digit span similarly assessed speed and memory. However, when speed and memory were also assessed within the fast counting and visual reaction time, the scores did not follow the same pattern.
The correlation between each task was further explored in table 3.1. The results presented positive correlations between tasks that followed the same pattern, and similarly negative correlations between tasks that opposed the trend in scores.
Figure 3.1, average task scores within the blue desk setting, the green desk setting, and the wooden desk-controlled setting
16 3 . 0 R E S U L T S & D I S C U S S I O N
U
S
A V E R A G E T A S K R E S
L T
It is worth mentioning that the improvement in performance might have been due to experiment methodology where participants were directed to take the same tasks in each setting. Merely rearranging the order in which they were given may have not been sufficient. In the case where performance worsened, the participants might have gradually felt fatigue or were exposed by a condition that interfered with their performance. Figure 3.2, assess the response of the participants’ thermal comfort. 6 out of the 11 participants felt that they were dissatisfied with the environmental conditions in the room, and hence the theory that thermal discomfort might have an impact on task performance is further introduced.
Table 3.1, correlations between performance tasks
Figure 3.2, thermal comfort survey results
17
G E N E R A L T H E R M A L C O M F O R T R E S U L T S
3.2 WELLBEING SCALE
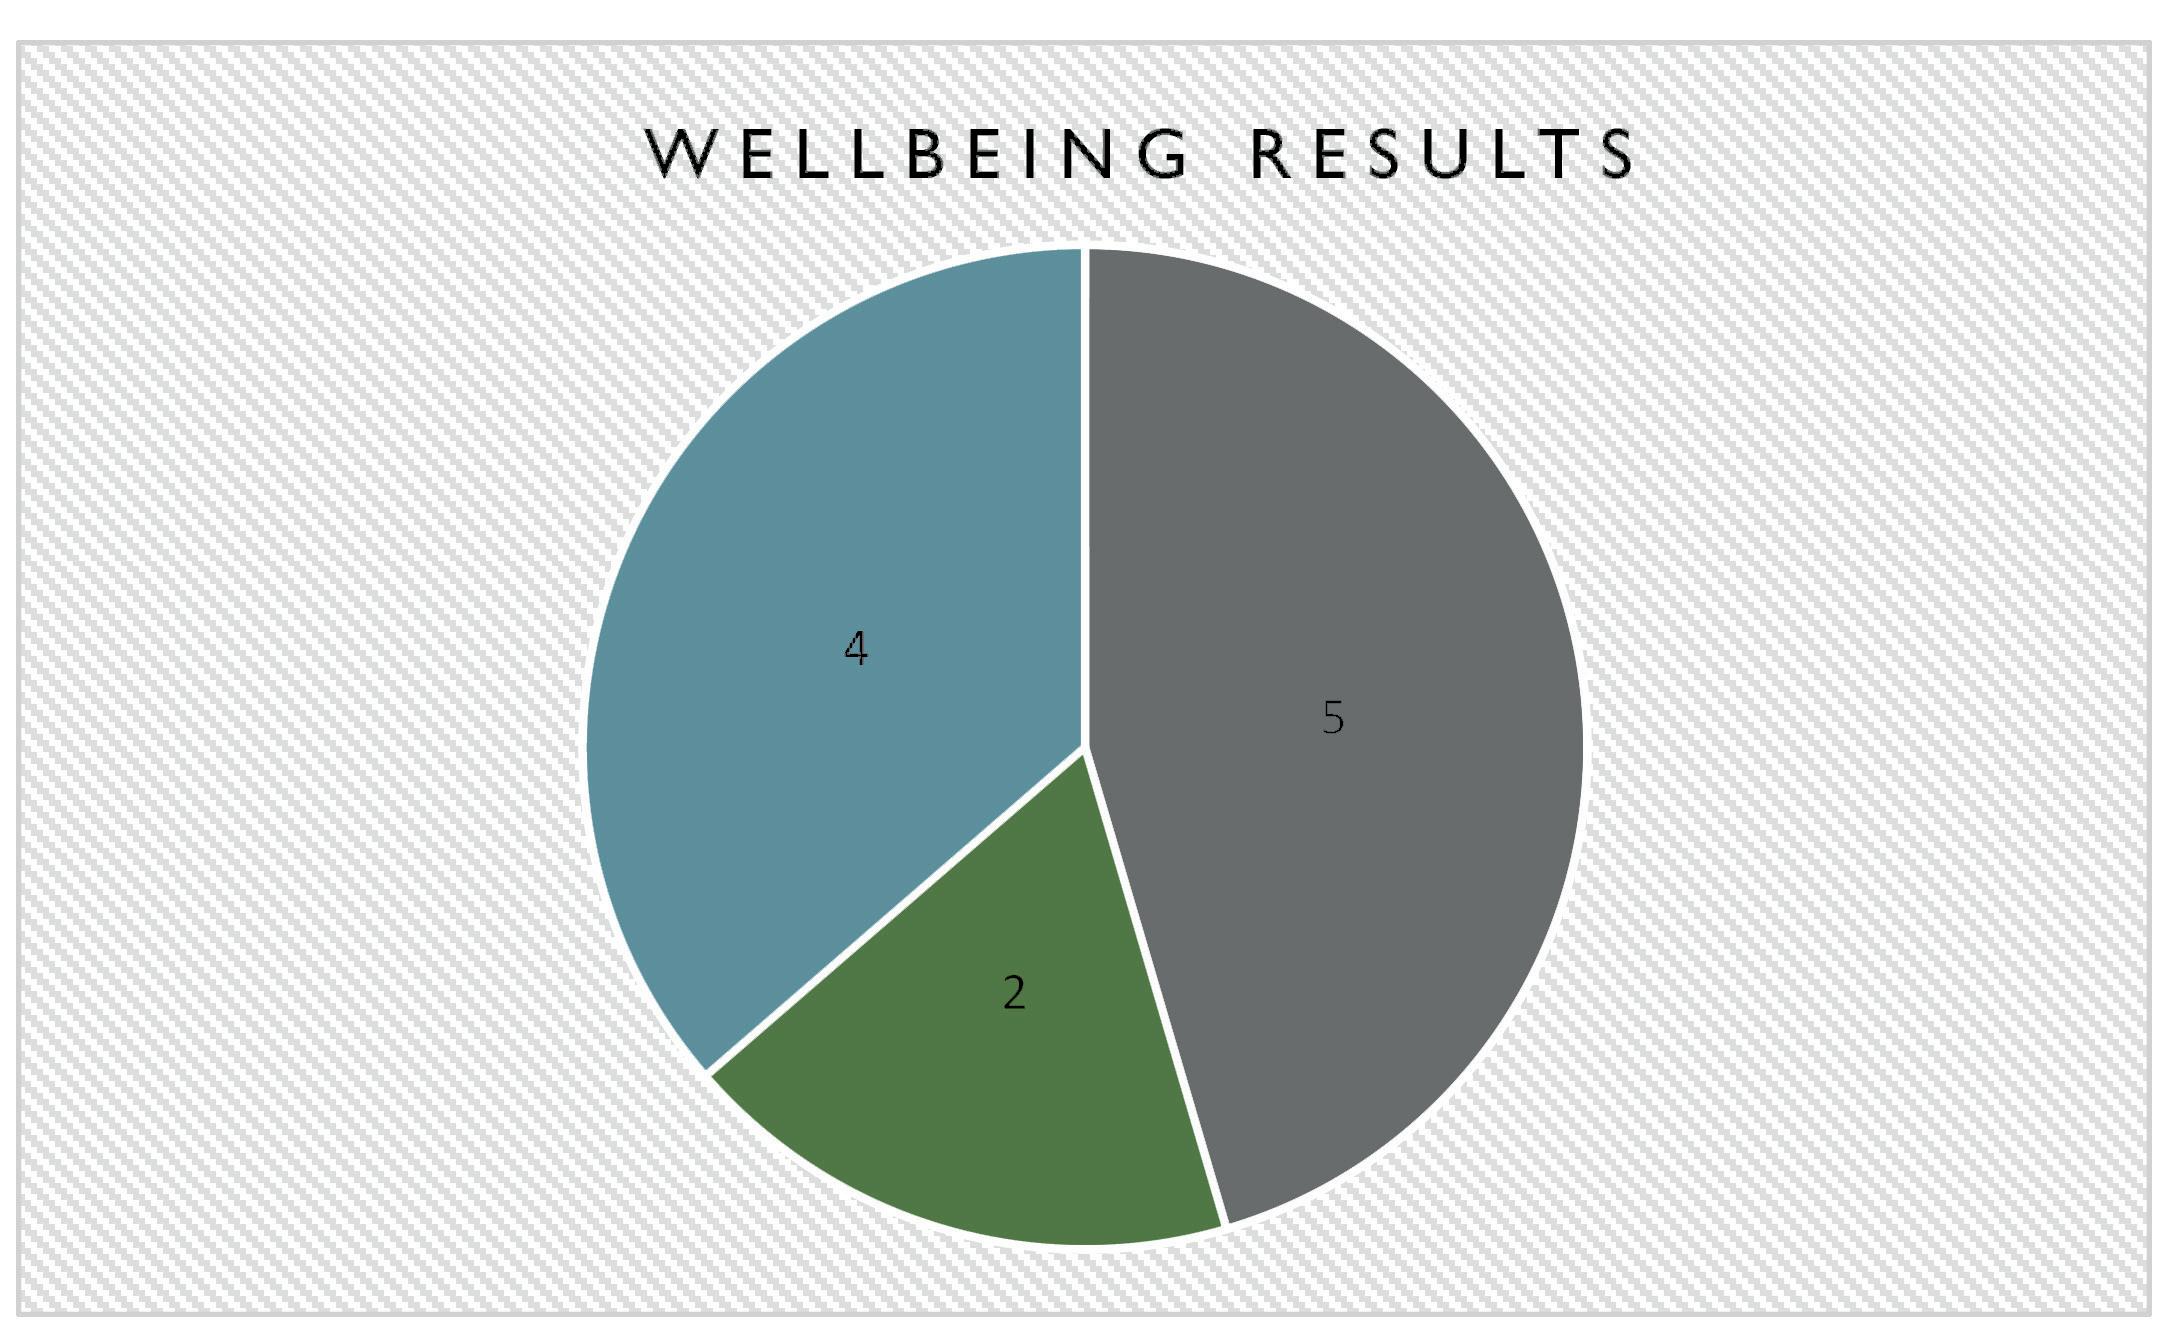
As illustrated in figure 3.3, according to the Warwick-Edinburgh Mental Wellbeing survey scores, 2 participants felt better by the end of the experiment, 4 felt no different, and 5 felt worse.
participants felt no different participants felt better participants felt worse
To statistically explore what might have caused almost 50% of the participants to feel worse after the experiment, the Warwick-Edinburgh Mental Wellbeing survey scores were analysed as seen in figure 3.4. The mean scores after the experiment in comparison with before the experiment indicate that the participants’ responses most varied in (Q4) ‘I’ve been dealing with problems well’ and (Q5) ‘I’ve been thinking clearly’.
Figure 3.3, participant’s wellbeing by the end of the experiment
Figure 3.4, Warwick-Edinburgh Mental Wellbeing survey mean scores before and after the experiment
none of the time rarely some of the time often all of the time
18
W E L L B E I N G M E A N R E S U L T S
While it is odd that participants changed their responses in (Q4), as the tasks were not problem-solving tasks, it is understandable that the overall experiment might have raised certain subjective feelings that led to that response. The change in (Q5) is further understandable as the experiment directed participants to undertake a total of 12 tasks within a short period of time. This consequently might have had an impact on mental clarity.
Table 3.2 investigates the correlation of the mean wellbeing scores before and after the experiment to the proposed tasks. It is evident that the strength of both negative and positive correlations increased by the end of the experiment.
Table 3.2, correlations between wellbeing scores and performance tasks
3.3 HEART RATE
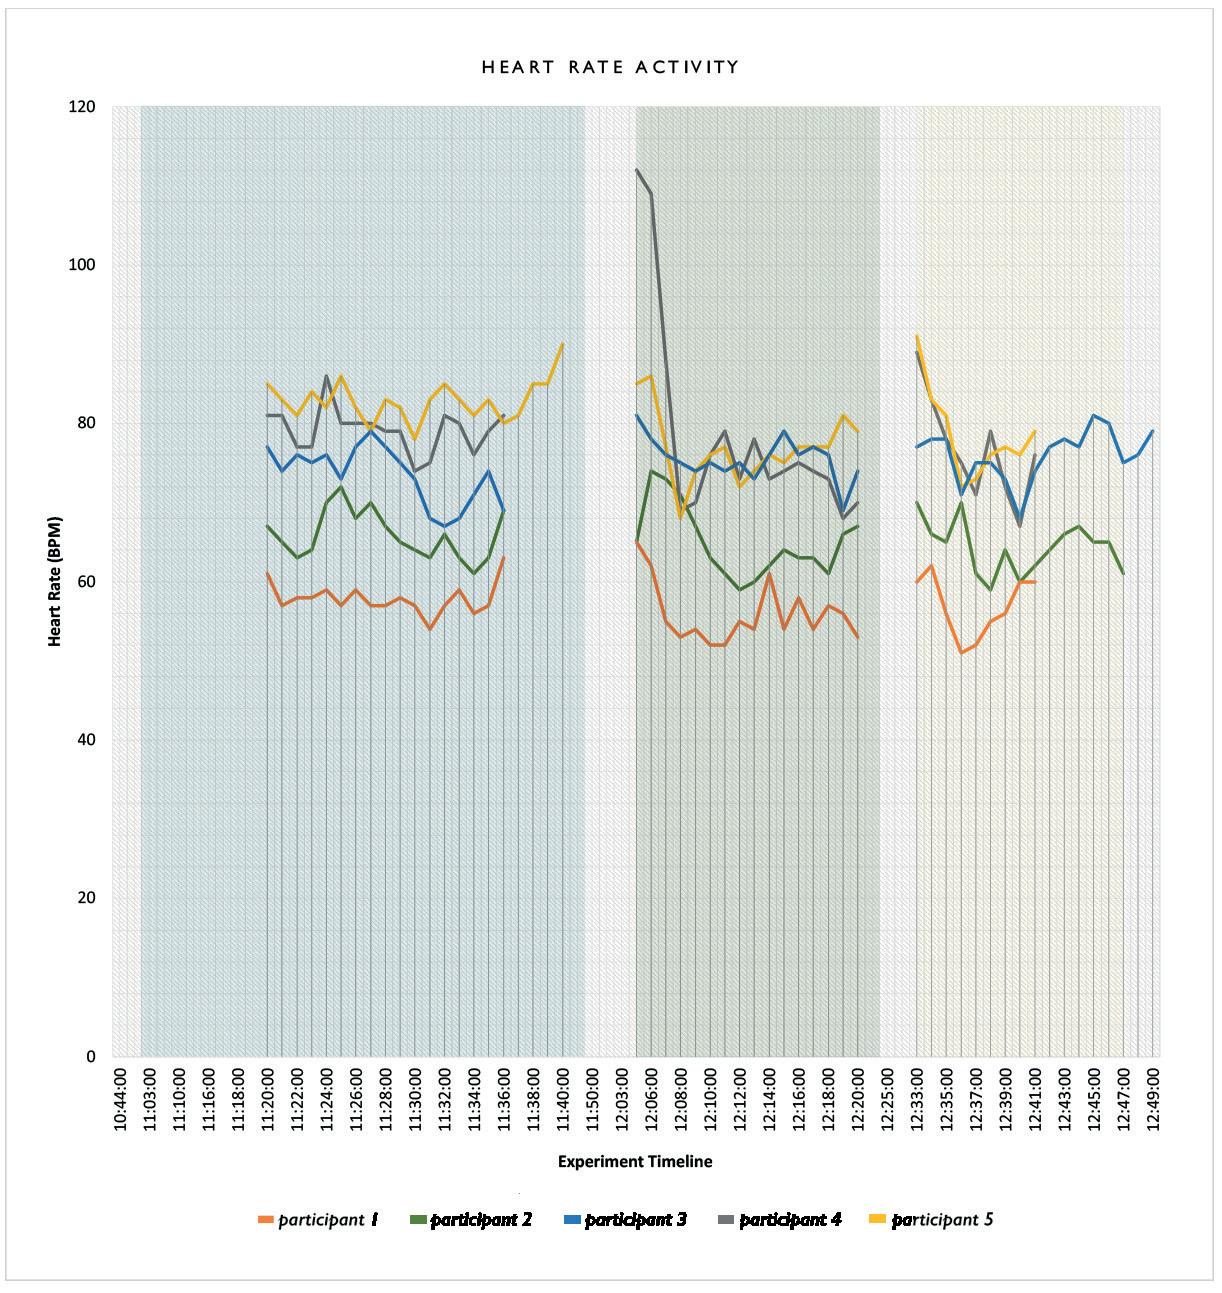
Figure 3.5 represents the heart rate activity of the 5 participants that were monitored with a Fitbit device within the different exposure settings and in accordance with the experiment procedure timeline. The data is represented separately as each measure configures to the individual solely through health variance. It is however difficult to draw conclusions from this data, as a low heart rate may indicate the feeling of calmness and a high heart rate may indicate stress or a level of arousal that aids the individual to perform better depending on their personality type (Yerkes and Dodson, 1908). It is however visible, that participants adopted a slightly fair heart rate throughout. The activity spike on participant 4 at the start of the exposure to green desk setting is likely to be from rushing back into the experiment room after the given break.
19
Figure 3.5, heart rate activity of 5 participants in the three exposure settings
20
exposure to blue desk setting
exposure to green desk setting exposure to wooden desk setting
Essentially, the overall experiment encompassed various limitations that raised more questions than they did with answers. The approach of the overall experiment consisted of many flaws, as outlined prior, that in effect interfered with identifying the effect of blue and green biophilic colour exposures on wellbeing. The data conducted from the number of participants that were part of this study (N=11) imply that a larger sample is needed to validate outcome data. In addition, the use of generic performance tasks questioned the ecological validity of the proposed experiment. As further raised by Kellert and Calabrese (2015), biophilic design requires repeated and sustained engagement with nature - elsewise, the adopted strategies oppose the essence biophilia, and present insignificant impact on measures of wellbeing. An improved version of the study would therefore present a more substantial amount of biophilic exposure and in more than one setting. To better improve the interpretation of the results, an improved experiment could further represent tasks that could be formulated in a single index. It is also important to note that the broader contributions of the individual, social, and economic, factors influencing wellbeing were taken into very little consideration and therefore performance affected by extraneous factors was not accounted for.
. 0 C O N C L U S I O N
The presented study conducted an experiment through environmental measures and biophilic design interventions, in efforts of outlining the effects of biophilic colour exposures on wellbeing. The results indicated that task performance and wellbeing are affected by blue and green hue exposures, however there were various flaws in the experiment that affected knowing exactly what factors determined these results. The experiment methodology made it difficult to conclude which intervention led to a more conducive state of wellbeing. This is not to say however that the study was false, but rather that there remains a deep need for understanding more practically how to approach experiment design and better account for the complex systems that inform a wellbeing enhancing environment.
21
3.4 LIMITATIONS & IMPROVING THE
STUDY 4
5.0
22
REFERENCES
23
Appendix 3 - Sample from Colour-Blindness Test

30

31
5 - Warwick-Edinburgh Mental Wellbeing Scale
Appendix 6 - Typing Task Text


Destroy the world with the purpose of creating a new one yet instead of making up all of this quality each zone of process and liability such as the jar of kindred you won’t understand why or when or how or why i’m writing this nonsense

Appendix
32
VXGC7 BENV0054 WELLBEING IN BUILDINGS: THEORY AND PRACTICE EXPERIMENT ON THE EFFECT OF THE BUILT ENVIRONMENT ON WELLBEING 25 JANUARY 2022


