partnership providing innovative mining products and services
A partnership providing innovative mining products and services
A partnership providing innovative mining products and services

FOR INCREASED ASSET PRODUCTIVITY
collaborative delivery model value-added products and services, including:
A collaborative delivery model of value-added products and services, including:
A collaborative delivery model of value-added products and services, including:
Mill linings
Mill linings
Mill linings
Wear resistant liners
Wear resistant liners
Wear resistant liners
Conveyor components
Conveyor components
Conveyor components
Screening and filtering solutions
Screening and filtering solutions
Screening and filtering solutions
Trommels
Trommels
Trommels
Hydrocyclones
Hydrocyclones
Hydrocyclones
Water cutting services
Water cutting services
Water cutting services
DYNAPRIME® IS IDEAL FOR HIGH ASPECT MILLS
The DYNAMAX range of mill liners offers optimum mill lining endurance and reliability
The DYNAMAX range of mill liners offers optimum mill lining endurance and reliability
The DYNAMAX range of mill liners offers optimum mill lining endurance and reliability


SPILLEX
SPILLEX
SPILLEX


Conveyor for environmental
Conveyor for the environmental
Conveyor skirt for the ultimate environmental

VOLUME 123 NO. 6 JUNE 2023
info@tegaindustries.co.za www.tegaindustries.com
Mill Linings
Dynamic innovation maximum durability
A partnership providing innovative mining products and services
partnership providing innovative mining products and services

A partnership providing innovative mining products and services
collaborative delivery model value-added products and services, including:
A collaborative delivery model of value-added products and services, including:
A collaborative delivery model of value-added products and services, including:
Mill linings
Mill linings
Mill linings
Wear resistant liners
Wear resistant liners
Wear resistant liners
Conveyor components
Conveyor components
Conveyor components
Screening and filtering solutions
Screening and filtering solutions
Screening and filtering solutions
Trommels
Trommels
Trommels
Hydrocyclones
Hydrocyclones
Hydrocyclones
Water cutting services
Water cutting services
Water cutting services
The DYNAMAX range of mill liners offers optimum mill lining endurance and reliability
The DYNAMAX range of mill liners offers optimum mill lining endurance and reliability
The DYNAMAX range of mill liners offers optimum mill lining endurance and reliability


SPILLEX
SPILLEX
SPILLEX


Conveyor for the environmental
Conveyor for the environmental
Conveyor skirt for the ultimate environmental
www.tegaindustries.com
The Southern African Institute of Mining and Metallurgy
OFFICE BEARERS AND COUNCIL FOR THE 2022/2023 SESSION
Honorary President
Nolitha Fakude
President, Minerals Council South Africa
Honorary Vice Presidents
Gwede Mantashe
Minister of Mineral Resources and Energy, South Africa
Ebrahim Patel
Minister of Trade, Industry and Competition, South Africa
Blade Nzimande
Minister of Higher Education, Science and Technology, South Africa
President
Z. Botha
President Elect
W.C. Joughin
Senior Vice President
E. Matinde
Junior Vice President
G.R. Lane
Incoming Junior Vice President
T.M. Mmola
Immediate Past President
I.J. Geldenhuys
Honorary Treasurer
W.C. Joughin
Ordinary Members on Council
W. Broodryk G. Njowa
Z. Fakhraei S.J. Ntsoelengoe
R.M.S. Falcon (by invitation) S.M. Rupprecht
B. Genc M.H. Solomon
K.M. Letsoalo A.J.S. Spearing
S.B. Madolo A.T. van Zyl
F.T. Manyanga E.J. Walls
M.C. Munroe
Co-opted to Members
K. Mosebi
A.S. Nhleko
Past Presidents Serving on Council
N.A. Barcza C. Musingwini
R.D. Beck S. Ndlovu
J.R. Dixon J.L. Porter
V.G. Duke M.H. Rogers
R.T. Jones D.A.J. Ross-Watt
A.S. Macfarlane G.L. Smith
M.I. Mthenjane W.H. van Niekerk
G.R. Lane–TPC Mining Chairperson
Z. Botha–TPC Metallurgy Chairperson
M.A. Mello–YPC Chairperson
K.W. Banda–YPC Vice Chairperson
Branch Chairpersons
Botswana Being established
DRC Not active
Johannesburg N. Rampersad
Namibia Vacant
Northern Cape I. Tlhapi
North West I. Tshabalala
Pretoria Vacant
Western Cape A.B. Nesbitt
Zambia J.P.C. Mutambo (Interim Chairperson)
Zimbabwe A.T. Chinhava
Zululand C.W. Mienie
PAST PRESIDENTS
* W. Bettel (1894–1895)
* A.F. Crosse (1895–1896)
* W.R. Feldtmann (1896–1897)
* C. Butters (1897–1898)
* J. Loevy (1898–1899)
* J.R. Williams (1899–1903)
* S.H. Pearce (1903–1904)
* W.A. Caldecott (1904–1905)
* W. Cullen (1905–1906)
* E.H. Johnson (1906–1907)
* J. Yates (1907–1908)
* R.G. Bevington (1908–1909)
* A. McA. Johnston (1909–1910)
* J. Moir (1910–1911)
* C.B. Saner (1911–1912)
* W.R. Dowling (1912–1913)
* A. Richardson (1913–1914)
* G.H. Stanley (1914–1915)
* J.E. Thomas (1915–1916)
* J.A. Wilkinson (1916–1917)
* G. Hildick-Smith (1917–1918)
* H.S. Meyer (1918–1919)
* J. Gray (1919–1920)
* J. Chilton (1920–1921)
* F. Wartenweiler (1921–1922)
* G.A. Watermeyer (1922–1923)
* F.W. Watson (1923–1924)
* C.J. Gray (1924–1925)
* H.A. White (1925–1926)
* H.R. Adam (1926–1927)
* Sir Robert Kotze (1927–1928)
* J.A. Woodburn (1928–1929)
* H. Pirow (1929–1930)
* J. Henderson (1930–1931)
* A. King (1931–1932)
* V. Nimmo-Dewar (1932–1933)
* P.N. Lategan (1933–1934)
* E.C. Ranson (1934–1935)
* R.A. Flugge-De-Smidt (1935–1936)
* T.K. Prentice (1936–1937)
* R.S.G. Stokes (1937–1938)
* P.E. Hall (1938–1939)
* E.H.A. Joseph (1939–1940)
* J.H. Dobson (1940–1941)
* Theo Meyer (1941–1942)
* John V. Muller (1942–1943)
* C. Biccard Jeppe (1943–1944)
* P.J. Louis Bok (1944–1945)
* J.T. McIntyre (1945–1946)
* M. Falcon (1946–1947)
* A. Clemens (1947–1948)
* F.G. Hill (1948–1949)
* O.A.E. Jackson (1949–1950)
* W.E. Gooday (1950–1951)
* C.J. Irving (1951–1952)
* D.D. Stitt (1952–1953)
* M.C.G. Meyer (1953–1954)
* L.A. Bushell (1954–1955)
* H. Britten (1955–1956)
* Wm. Bleloch (1956–1957)
* H. Simon (1957–1958)
* M. Barcza (1958–1959)
* R.J. Adamson (1959–1960)
* W.S. Findlay (1960–1961)
* D.G. Maxwell (1961–1962)
* J. de V. Lambrechts (1962–1963)
* J.F. Reid (1963–1964)
* D.M. Jamieson (1964–1965)
* H.E. Cross (1965–1966)
* D. Gordon Jones (1966–1967)
* P. Lambooy (1967–1968)
* R.C.J. Goode (1968–1969)
* J.K.E. Douglas (1969–1970)
* V.C. Robinson (1970–1971)
* D.D. Howat (1971–1972)
* J.P. Hugo (1972–1973)
* P.W.J. van Rensburg (1973–1974)
* R.P. Plewman (1974–1975)
* R.E. Robinson (1975–1976)
* M.D.G. Salamon (1976–1977)
* P.A. Von Wielligh (1977–1978)
* M.G. Atmore (1978–1979)
* D.A. Viljoen (1979–1980)
* P.R. Jochens (1980–1981)
* G.Y. Nisbet (1981–1982)
A.N. Brown (1982–1983)
* R.P. King (1983–1984)
J.D. Austin (1984–1985)
* H.E. James (1985–1986)
H. Wagner (1986–1987)
* B.C. Alberts (1987–1988)
* C.E. Fivaz (1988–1989)
* O.K.H. Steffen (1989–1990)
* H.G. Mosenthal (1990–1991)
R.D. Beck (1991–1992)
* J.P. Hoffman (1992–1993)
* H. Scott-Russell (1993–1994)
J.A. Cruise (1994–1995)
D.A.J. Ross-Watt (1995–1996)
N.A. Barcza (1996–1997)
* R.P. Mohring (1997–1998)
J.R. Dixon (1998–1999)
M.H. Rogers (1999–2000)
L.A. Cramer (2000–2001)
* A.A.B. Douglas (2001–2002)
S.J. Ramokgopa (2002-2003)
T.R. Stacey (2003–2004)
F.M.G. Egerton (2004–2005)
W.H. van Niekerk (2005–2006)
R.P.H. Willis (2006–2007)
R.G.B. Pickering (2007–2008)
A.M. Garbers-Craig (2008–2009)
J.C. Ngoma (2009–2010)
G.V.R. Landman (2010–2011)
J.N. van der Merwe (2011–2012)
G.L. Smith (2012–2013)
M. Dworzanowski (2013–2014)
J.L. Porter (2014–2015)
R.T. Jones (2015–2016)
C. Musingwini (2016–2017)
S. Ndlovu (2017–2018)
A.S. Macfarlane (2018–2019)
M.I. Mthenjane (2019–2020)
V.G. Duke (2020–2021)
I.J. Geldenhuys (2021–2022)
Honorary Legal Advisers M H Attorneys Auditors Genesis Chartered Accountants Secretaries The Southern African Institute of Mining and Metallurgy 7th Floor, Rosebank Towers, 19 Biermann Avenue, Rosebank, 2196 PostNet Suite #212,
2132 E-mail: journal@saimm.co.za
*Deceased
Private Bag X31, Saxonwold,
Editorial Board
S.O. Bada
R.D. Beck
P. den Hoed
I.M. Dikgwatlhe
R. Dimitrakopolous*
L. Falcon
B. Genc
R.T. Jones
W.C. Joughin
A.J. Kinghorn
D.E.P. Klenam
H.M. Lodewijks
D.F. Malan
R. Mitra*
H. Möller
C. Musingwini
S. Ndlovu
P.N. Neingo
M. Nicol*
S.S. Nyoni
M. Phasha
P. Pistorius
P. Radcliffe
N. Rampersad
Q.G. Reynolds
I. Robinson
S.M. Rupprecht
K.C. Sole
A.J.S. Spearing*
T.R. Stacey
E. Topal*
D. Tudor*
F.D.L. Uahengo
D. Vogt*
*International Advisory Board members
Editor /Chairman of the Editorial Board
R.M.S. Falcon
Typeset and Published by
The Southern African Institute of Mining and Metallurgy

PostNet Suite #212
Private Bag X31
Saxonwold, 2132
E-mail: journal@saimm.co.za
Printed by Camera Press, Johannesburg
Advertising Representative
Barbara Spence
Avenue Advertising
Telephone (011) 463-7940
E-mail: barbara@avenue.co.za

ISSN 2225-6253 (print)
ISSN 2411-9717 (online)
Directory of Open Access Journals


Contents
Journal Comment: The Value of Variety by W.C. Joughin iv President’s Corner: The neuroscience of high-performing teams by Z. Botha .................................................................
PROFESSIONAL TECHNICAL AND SCIENTIFIC PAPERS
In this study the flat jack method was used to measure pillar stresses in three underground rock salt mines from the Eastern, Central and Western Salt Ranges, in Punjab, Pakistan. It was found that the measured pillar stresses in the Salt Range are proportional to the overburden stress values with their magnitude ranging from 4.38 MPa to 11.97 MPa. Pillars were found to be stable. A guideline chart was developed to find out the suitable length of pillar for safety.
Dependence of solar reflector soiling on location relative to a ferromanganese smelter
287
M.A. Swart, L. Hockaday, Q. Reynolds, and K. Craig
299 This paper presents the results from a solar reflector soiling study at Transalloys, a ferromanganese smelter in South Africa. Several meteorological parameters were monitored to establish the conditions that lead to increased soiling. The reflector set’s proximity to the dust source was the primary driver for increased soiling. The study revealed that, while there are periods of intense soiling at this particular site, proper planning of reflector location relative to the smelter dust sources can have a significant positive impact on soiling rate.
THE INSTITUTE, AS A BODY, IS NOT RESPONSIBLE FOR THE STATEMENTS AND OPINIONS ADVANCED IN ANY OF ITS PUBLICATIONS.
Copyright© 2023 by The Southern African Institute of Mining and Metallurgy. All rights reserved. Multiple copying of the contents of this publication or parts thereof without permission is in breach of copyright, but permission is hereby given for the copying of titles and abstracts of papers and names of authors. Permission to copy illustrations and short extracts from the text of individual contributions is usually given upon written application to the Institute, provided that the source (and where appropriate, the copyright) is acknowledged. Apart from any fair dealing for the purposes of review or criticism under The Copyright Act no. 98, 1978, Section 12, of the Republic of South Africa, a single copy of an article may be supplied by a library for the purposes of research or private study. No part of this publication may be reproduced, stored in a retrieval system, or transmitted in any form or by any means without the prior permission of the publishers. Multiple copying of the contents of the publication without permission is always illegal.
U.S. Copyright Law applicable to users In the U.S.A. The appearance of the statement of copyright at the bottom of the first page of an article appearing in this journal indicates that the copyright holder consents to the making of copies of the article for personal or internal use. This consent is given on condition that the copier pays the stated fee for each copy of a paper beyond that permitted by Section 107 or 108 of the U.S. Copyright Law. The fee is to be paid through the Copyright Clearance Center, Inc., Operations Center, P.O. Box 765, Schenectady, New York 12301, U.S.A. This consent does not extend to other kinds of copying, such as copying for general distribution, for advertising or promotional purposes, for creating new collective works, or for resale.
▶ ii JUNE 2023 VOLUME 123 The Journal of the Southern African Institute of Mining and Metallurgy
VOLUME 123 NO. 6 JUNE 2023
v-viii
of
salt
a
–
case
Y. Majeed, N. Abbas, and M.Z. Emad
Stability evaluation
room-and-pillar rock
mines by using
flat jack technique
A
study
Predicting open stope performance at an octree resolution using multivariate models
B. McFadyen, M. Grenon, K. Woodward, and Y. Potvin
This article presents a step towards a new stope design approach, where stope OB and UB is measured and georeferenced at an approximately cubic metrer resolution (octrees) and predicted using statistical multivariate models. Results showed that OB and UB location as well as their magnitude is predicted with good precision. The resolution of the data and the use of multivariate analysis has enabled the prediction of the variation of stope performance along the design surface.
Spontaneous combustion of carbonaceous shale at an iron ore mine, South Africa
The SPONCOM liability and properties of samples of black carbonaceous shales in an iron mine were examined and compared with results of studies conducted on Witbank coal-field samples. The Wits-Ehac Index classification results show that the samples displayed between medium and high risk. The linear regression analysis showed very poor correlations between the Wits-Ehac Index results and the XRF and proximate and ultimate results. The most valuable relationship was between the presence of relatively high sulphur (greater than 3%) and ground reactivity with nitrate-bearing explosive emulsion.
Assessing coal mine closures and mining community profiles for the ‘just transition’ in South Africa
This paper provides an in-depth view of the coal mining industry in South Africa, and it questions the narrative that premature mine closure is inevitable. Our research shows that the shift to cleaner energy will likely occur without the premature closure implied by the ‘just transition’. The South African approach to the ‘just transition’ needs to take local realities into account. The narrative needs to support an effective transition that does not undermine energy security and economic growth.
309
321
The Journal of the Southern African Institute of Mining and Metallurgy VOLUME 123 JUNE 2023 iii ◀
C. Gous and B. Genc ........................................................................
Cole, M. Mthenjane, and A. van Zyl ........................................................
M.
329
Journal Comment
The Value of Variety

This edition of the Journal contains five general papers on a variety of topics. Three of the papers deal with rock engineering issues, one deals with spontaneous combustion, and another with soiling of solar reflectors or heliostats. The three rock engineering papers each cover very different challenges faced by the mining industry.
Squeezing rock conditions occur when tunnels located in weak, ductile rock masses are overstressed. Unlike the strong, brittle rock masses typically encountered in deep South African gold mines, which fracture and burst when overstressed, these weaker rock masses deform excessively, resulting in gradual closure of the tunnels until they are no longer serviceable. Support needs to be designed to manage squeezing rock conditions without rockfall incidents, and to keep the tunnels serviceable. The paper on this topic represents an update of an earlier benchmarking exercise on squeezing ground management in Australian and Canadian mines, taking into account advancements in deformation monitoring technologies and the increased availability of yielding ground support elements. The authors provide practical guidelines for predicting the level of squeezing, selecting appropriate support systems, and rehabilitation.
Another rock engineering paper deals with pillar design in Himalayan rock salt mines. The authors describe a comprehensive field testing exercise using flat jacks to determine pillar stress.
Monitoring and predicting the performance (overbreak and underbreak) of open stopes is essential for minimizing dilution, ore loss, and disruptions to the mining cycle to ensure profitability. Most open stoping operations perform cavity monitoring surveys of all stopes. The paper on open stope performance describes an improvement on the classic empirical methods for predicting overbreak that includes prediction of underbreak. The method was developed using machine learning techniques.
Spontaneous combustion is a common problem in coal mines, which causes environmental and safety and health problem risks. Another paper deals with the potential for spontaneous combustion and ground reactivity in carbonaceous shales at an opencast iron ore mine, and highlights the importance of determining the properties of the carbonaceous shale.
The soiling of solar reflectors (heliostats) is perhaps an unusual topic for inclusion in the Journal. However, concentrating solar power (CSP) technology is likely to play an important role in the energy transition, particularly for energy-intensive industries such as smelting. This paper addresses the soiling rate due to dust from a ferromanganese smelter, and its effect on heliostat performance.
W.C. Joughin

▶ iv JUNE 2023 VOLUME 123 The Journal of the Southern African Institute of Mining and Metallurgy
President’s Corner
The neuroscience of highperforming teams


Iam going to be honest … I have a little bit of an obsession with neuroscience research and how that can be utilized to create highperforming teams. I have been exposed to this by a fantastic project manager and a brilliant industrial psychologist. Neuroscience can show us how we build relationships, react to our environment, respond to learning, and learn to work collaboratively. How do multiple, unique, and different individuals, each with their own perspective, ideas, thoughts, skills, and abilities, contribute to the success of a working, whole unit? I believe, for the most part, that a large sum of that success is how the team enables each member to feel included, valued, heard, and safe. Neuroscience can show us how to do this.
Knowing a little bit more about how neuroscience influences your own performance can help you contribute to the wellbeing of the whole team. Through scrutinizing neuroscientific research, Neurozone has identified all the drivers (outer sphere) and conditions (inner sphere) for optimal performance (Figure 1).

The Journal of the Southern African Institute of Mining and Metallurgy VOLUME 123 JUNE 2023 v ◀
Figure 1–An example of a Neurozone Model, taken from a Neurozone report, April 2019. Since 2019 the Neurozone model has been updated. It now refers to high performance rhythms, not foundational drivers. When operating from a regulated state of being (the four high performing rhythms), social interaction will be easier to engage in
President’s Corner (continued)
This ‘model’ shows granular responses of the internal system; small, nuanced behaviours that make up our complex response to our environments. This refers to the following: types of exercise and mobility, the components of sleep and mindfulness training, our emotional-energy-releasing responses (such as optimism, gratitude, enthusiasm, and humour), ways in which we learn and solve problems, as well as the ways that we ensure collective creativity through belonging, bonding, and mining diversity. This complexity and adaptability in response allow us to have many ways to solve a problem.

External changes require internal adaptations. If you know the ‘reprioritizing code’, then you can assign the most energy to the right behaviour, leading you to act in the best interest of not only yourself, but the group.
This is a very good description of building resilience. Resilience, of course, refers to adaptability and capacity to respond appropriately in changing situations. Resilience is not about personality; rather, it’s about behaviour. That’s why it is so important to continually assess and monitor behaviour so that you can ensure you get the highest yield for the energy ascribed to the tasks of living, surviving, and thriving.
Neuroscience, and more specifically the Neurozone model, supports the development of our capacity to maximize personal optimization so that we maximize other higher-order entities that we form, such as teams and organizations, by shining a light on the complex connections between the brain, nervous system, and immune system (This is taken from CEO and Co-Founder of Neurozone, Dr Etienne van der Walt, neurologist and a subject matter expert in clinical neurology, 5 July 2023).
I believe we desperately need to remember, and understand, that we are wired for connection and empathy. There is power and healing in relationships and community. Dr Bruce Perry, a renowned brain development and trauma expert, child psychiatrist, neuroscientist, and principal of the neurosequential model of brain-based therapy, has proven this in his book What Happened to You? (Perry, B.D. and Winfrey, O. 2021. Flatiron Books).
He says: ‘Marginalized people — excluded, minimized, shamed — are traumatized people, because as we’ve discussed, humans are fundamentally relational creatures. To be excluded from an organization, community, or society you are exposed to prolonged uncontrollable stress that is sensitizing.’
The key difference between team members NOT affected by trauma and those affected by trauma is that members ‘sensitized’ by trauma can escalate more quickly into states of dysregulation. In Figure 2 you can see how a sensitized person can easily end up in a state of fear or terror daily. As we move
▶ vi JUNE 2023 VOLUME 123 The Journal of the Southern African Institute of Mining and Metallurgy
Figure 2–Stress-reactive curve, taken from What Happened to You?, Perry, B.D.and Winfrey, O. 2021, Flatiron Books
President’s Corner (continued)
between different emotional states, from ‘Calm’ to ‘Terror’, the amount and type of access we have to our cognitive abilities changes. This is also confirmed in the book by Malcolm Gladwell, ‘Talking to Strangers’. We lose our ability to do creative problem-solving, with our prefrontal cortex, when we perceive ourselves to be under threat and we consequently move back into amygdala regulation, where we resort to freeze, flight, or fight, which not only leads to destructive conflict, but also complete disengagement (Figure 3).


How do we combat exclusion in a team? How do we ensure that one of our team members are not exposed to chronic stress?
Psychologist Kelly McGonigal (health psychologist and lecturer at Stanford University), with her TED talk ranking under the 25 most popular TED Talks of all time (updated January 2023), shows that while stress has been made into a public health enemy, new research suggests that stress may only be bad for you if you believe that to be the case. She urges us to see stress as a positive and introduces us to an unsung mechanism for stress reduction: reaching out to others. Again, connection plays a crucial role in resilience. When any individual perceives the stress response to be chronic, their whole brain-body system will continually be in fight mode, which will lead to burnout, ill health, and ultimately, death. From a neurobiological perspective, the best protection against this is resilience. This capacity of the brain-body system to prevent implosion under severe stress is underpinned by the ability to belong and contribute to the group. To solve a problem or
The Journal of the Southern African Institute of Mining and Metallurgy VOLUME 123 JUNE 2023 vii ◀
Figure 3–Accessing the Cortex, taken from What Happened to You?, Perry, B.D.and Winfrey, O. 2021. Flatiron Books
President’s Corner (continued)
fashion novel products that are adapted for the group, promoting group survival and thrivability. We need forces that will foster a cohesive whole so that we can surpass the sum of its parts. According to Neurozone, there are four themes that could combat exclusion in a team and ensure that one of our team members are not exposed to chronic stress.
Are you practising this in your teams?
Table
I
Four themes to ensure connection, inclusion, and resilience for high-performing teams. This is my own representation of work done by Dr Etienne van der Walt and his team at Neurozone
 Z. Botha President, SAIMM
▶ viii JUNE 2023 VOLUME 123 The Journal of the Southern African Institute of Mining and Metallurgy
Stability evaluation of room-and-pillar rock salt mines by using a flat jack technique – A case study
Y. Majeed1, N. Abbas1, and M.Z. Emad1
Affiliation:
Mining Engineering Department, University of Engineering and Technology, Lahore, Pakistan.
Correspondence to:
M.Z. Emad
Email: zaka@uet.edu.pk
Dates:
Received: 25 Oct. 2021
Revised: 17 Oct. 2022
Accepted: 17 Oct. 2022

Published: June 2023
How to cite:
Majeed, Y., Abbas, N., and Emad, M.Z. 2023
Stability evaluation of room-and-pillar rock salt mines by using a flat jack technique – A case study.
Journal of the Southern African Institute of Mining and Metallurgy, vol. 123, no. 6. pp. 287–298
DOI ID:
http://dx.doi.org/10.17159/24119717/1872/2023
Synopsis
Room-and-pillar mining is commonly employed for the extraction of rock salt in underground mines. Pillar stress is a major concern in these mines as it is directly related to stability and mineral recovery. In this study a flat jack method was used to measure pillar stresses in three underground rock salt mines in Pakistan. The field work included determination of in-situ stress, in-situ elastic modulus, recording of field variables (pillar length and width, height and width of opening, opening width to height ratio, extraction ratio, and overburden height) and collection of salt block samples. The geomechanical properties of rock salt (uniaxial compressive strength, Young’s modulus, Brazilian tensile strength, and density) were also determined to estimate overburden stress, pillar strength, and factor of safety (both estimated and actual). It was found that the measured pillar stresses are proportional to the overburden stress values, with their magnitude ranging from 6.05 MPa to 11.97 Mpa, and the pillars were found to be stable. Regression analysis was performed to develop statistical models for in-situ stress and in-situ elastic modulus. Finally a quick guideline chart was developed to determine the suitable length of pillar for a given span and required level of safety.
Keywords
flat jack, room-and-pillar mining, in-situ stress, factor of safety, regression analysis.
Introduction
The global practice for excavating massive underground rock salt deposits is by adopting stope-and-pillar or chamber-and-pillar mining techniques, which can be applied with both regular and irregular layouts depending upon the deposit characteristics. In this method almost 40% of the material is excavated forming the rooms, whereas around 60% is left in place as structural pillars in order to support the overlying burden (Hustrulid, 2001).
Pakistan has vast deposits of Himalayan rock salt in a Precambrian sequence known as the Salt Range Formation of the Salt Range, Punjab (Shah, 2009; Baloch et al., 2012). Mining of rock salt and allied industries plays an important role in the local economy. Salt Range is located in the northern part of the province of The Punjab, extending from Tilla Jogian in the east to Warcha in the central and Kalabagh in the western portion. The Salt Range Formation is associated with a dynamic frontal thrust zone of the Himalayan mountain range. The present name of ‘Salt Range Formation’ was suggested by Asrarullah (1967). The same rock unit was previously called the ‘Saline Series’ or ‘Punjab Saline Series’ (Wynne, 1878; Gee, 1945). The Salt Range Formation is further classified into three units, namely the Sahwal Marl unit, Bhandar Kas Gypsum unit, and Billianwala Salt unit. The Billianwala Salt unit consists of red ferruginous marl and massive layers of rock salt having a thickness more than 650 m. This unit is exposed along the southern escarpment of the Salt Range, where underground mining of rock salt is conducted at Khewra, Warcha, and Kalabagh (Shah, 2009). The rock salt deposits are categorized as massive, with only Khewra mine containing more than 82 Mt of rock salt (Asrarullah, 1967). Khewra salt mine is the second largest in the world and the largest underground room-and-pillar mining operation in Pakistan (Baloch et al., 2012). When underground excavations are made the original in-situ stresses are disturbed, since stresses cannot pass through the excavated voids, hence they are transferred to the adjacent rock pillars. This results in an increase in the pillar stresses due to the load of overburden above the pillars and the excavations (Brady and Brown, 2005). The stability of a pillar depends on its strength and the level of stress generated in it. Many researchers have considered pillar stress as an important parameter in room-and-pillar mine design. According to Deng et al. (2003) a good pillar design can be obtained by accurate estimation of strength to stress ratio. Salamon and Munro (1967) studied 125 pillar failure cases to estimate pillar safety factor (ratio of pillar strength to pillar stress). Similarly, Bieniawski (1968) formulated equations for pillar strength calculations by performing tests on samples of various sizes ranging from 0.75 in. to 2 m. The pillar strength can be estimated by employing Equation [1]:
287 The Journal of the Southern African Institute of Mining and Metallurgy VOLUME 123 JUNE 2023
Stability evaluation of room-and-pillar rock salt mines by using a flat jack technique
where Sp = strength of pillar, Si = strength of a specimen measured in the laboratory, and w h is the width to height ratio.


The in-situ pillar stresses can be quantified by using two approaches, namely a theoretical approach and on-site experimentation. It is noteworthy that unlike many other uniform materials, rocks and earth materials contain a lot of natural complexities like joints, faults, groundwater etc. These complexities offer many challenges in the correct estimation of pillar stresses (Sebastiani et al., 2015). Generally a theoretical approach to estimate the in-situ stress considers it as unit weight of the rock (γ) times the depth of overburden (Z). Many researchers (Hoek, Kaiser, and Bawden, 1995; Salamon and Munro 1967; Hedley and Grant, 1972; Krauland and Soder 1987) have used the tributary area method to determine the expected average pillar stress. According to the tributary area theory the pillar stress is not only a function of the rock above it, but also the load over the excavated area. As per Brady and Brown (2005) the load of overburden material above an excavation is shared by the pillars on the either side of excavation. Brady and Brown (2005) formulated the following equation based on the tributary area theory.
➤ Measurement of average stress orthogonal to the surface of the test slot
➤ For jack tests the rock mass is assumed to be isotropic and homogenous
➤ In highly cracked or shattered rock materials the relief of stress may not be completely reversed (ASTM, 2008)
➤ The flat jack is only useful at the excavation's surface where the rock is close to being overstressed (Lin et al., 2018). Flat jack is one of the reliable technologies that have been used by many researchers in measuring in-situ stresses in mining and civil structures. Comprehensive information on flat jack testing can be found in the relevant literature (Bieniaweki, 1981; ISRM, 1986; Binda and Tiraboschi, 1999; Gregorczyk and Lourenco, 2000; Fedele and Marier, 2007; ASTM, 2008; Verstricht et al., 2010; Lamas, Muralha, and Figueiredo, 2010; Figueiredo, Lamas, and Muralha, 2010, 2011; Simoes et al., 2012; Dhawan, 2012; Sabri, Ulybin, and Zubkov, 2015; He and Hatzor, 2015; Cescatti et al., 2016; Latka and Matysek, 2017; Mendola, Giudice, and Minafo, 2019; Selen et al., 2020; Corkum, 2020; Armanasco and Foppoli, 2020; Rios and O’dwayer, 2020; Medeiros, Soriani, and Parsekian, 2020, amongst others)
where σP denotes the in-situ stress acting on the pillar, γ is the unit weight; Z is the depth below surface, and e is the extraction ratio. For real-time on-site stress measurements in mines, various techniques have been developed including hydraulic fracturing, overcoring, and flat jack. Hydraulic fracturing is particularly employed in the petroleum engineering industry for the measurement of ground stresses. In 1960, this method was used for stress assessment in productivity stimulation. There are now two major categories of this technique, namely conventional hydraulic fracturing and hydraulic tests on pre-existing fractures (HTPF). Bell and Gough (1979) proposed the traditional concept of borehole breakout stress orientation by interpreting the stress field around the borehole using Kirsch's solution. Overcoring is another common stress measurement technique, especially utilized in the geotechnical industry (Feng, Harrison, and Bozorgzadeh, 2020). The calculation is based on the deformation of a pilot hole. This technique delivers high-accuracy stress measurements and can be used in a variety of geological situations (Lin et al., 2018). Details regarding hydraulic fracturing and overcoring techniques can be found in the literature (Obert and Duvall 1967; Jumikis, 1983; Goodman, 1989; Hoek and Brown, 2005; Brady and Brown, 2005; Lamas, Muralha, and Figueiredo, 2010; Eberhardt and Stead, 2011).
The flat jack technique of in-situ stress measurment is particularly employed in the mining industry. The idea is to use the pressurization of a flat jack in a slot to calculate stress. Strain gauges are used to continually measure two points A and B, and a slot is cut adjacent to the measurement points. A flat jack is then put into the slot and compressed until the distance between A and B is restored to its previous value. The cancellation pressure at this point is believed to represent the average normal stress over the slot, and the stress field can then be evaluated. According to Gregorczyk and Lourenco (2000) the stress test results are interpreted converting jack pressure to the in-situ compressive stress. This method is simple, inexpensive, and straightforward to implement, and it does not require an elastic modulus for calculation. On the other hand there are some limitations of this method:
Pakistan produces around 3,193,791 Mt of rock salt per annum (Mines and Minerals Department, 2020). Due to the massive nature of the deposits, mines have mostly multi-level operations developed using the stope-and-pillar method with regular layouts. For example, the Khewra salt mine, rated as second largest mine in the world, has 17 working levels. The annual production is about 465,000 t and the expected mine life is around 350 years (Baloch et al., 2012). Due to the multi-level underground operations the in-situ pillar stresses are important for the stability and integrity of mine structure.
This research study is focused on determining vertical stress levels in rock salt pillars at three selected salt mines located in the Salt Range, Punjab. Stress measurements were performed in pillars with the help of the flat jack method, and on-site challenges associated with its use are also discussed. The stability of selected rock salt mines was evaluated by using actually measured stresses as well as empirically estimated pillar stress and strength values. Moreover, the effect of pillar dimensions on mine stability was investigated based on the factor of safety approach.
Research methodology
The research work consisted of field work and laboratory investigations along with computations of pillar strength and in-situ stress using an empirical approach.
Field work
The field studies included real-time in-situ stress measurements using the flat jack technique, study of underground mine plans, and collection of representative blocks of rock salt for subsequent laboratory studies. Three rock salt mining projects operated by M/s. Pakistan Mineral Development Corporation (PMDC), namely Khewra, Warcha, and Kalabagh, located in the eastern, central, and western regions of the Salt Range, were selected (Figure 1). Table I lists the selected projects along with their locations, geological environment, and age (Shah, 2009). At each mine suitable pillars for flat jack testing were selected based on the underground mine plans, pillar geometry, rock salt type, overburden height, and distance from the mine portal. Figures 2, 3, and 4 show the mine plans of PMDC Warcha, Khewra, and Kalabagh projects respectively, illustrating the test pillars selected for performing flat jack tests
288 JUNE 2023 VOLUME 123 The Journal of the Southern African Institute of Mining and Metallurgy [1]
[2]
Stability evaluation of room-and-pillar rock salt mines by using a flat jack technique
along with mine geometry and extraction ratio. At PMDC Warcha project (Figure 2) the pillar width varies from 4.5 m to 10 m and the width of the chambers ranges from 12 m to 16 m. The height of chambers varies from 4 m to 16.5 m, with an average mining height of 12.2 m. The PMDC Khewra project has two mine plan configurations, comprising 10.5 m (Figure 3, left) and 15.5 m (Figure 3, right) wide rooms and pillars. The height of openings varies from 3.65 m to 12.50 m. It is worth mentioning here that Khewra has adopted the layout with 15.5 m wide rooms and pillars for its current and future workings. The mine layout at PMDC Kalabagh project (Figure 4) comprises 14 m wide pillars and rooms with 8.5 m width and 7 m height. Before proceeding with the flat jack tests, the specific locations on selected pillar ribs were checked for material competence and the presence of any micro- and macro-
flaws by visual inspection and sonic testing using blows with a geological hammer.
Field experimental set-up
The in-situ stress measurement set-up comprised a flat jack, hydraulic pump, and deformometer (a device to measure length variation). A locally manufactured flat jack (length 40 cm; width 20 cm; thickness 1.5 mm) with maximum operating pressure of 400 bars was used (Figure 5a). It consisted of two steel plates (20/10 plate thickness) welded together along the edges using high-strength acetylene-assisted welding. Two steel tubes with 6 mm outer diameter and 3 mm inner diameters were introduced to pressurize the flat jack with hydraulic oil, one tube for the attachment with the hydraulic pump and the other to connect an extra flat jack if used, otherwise plugged. The hydraulic pump was a single-stage hand pump with reservoir with a pressure gauge of 700 bar range
Selected rock salt mining projects for flat jack testing
1 Khewra Salt PMDC Khewra Project, White, pink, red, Room and Salt Range
Precambrian Mines Khewra, District Jhelum, Punjab, Pakistan and industrial pillar Formation

2 Warcha Salt PMDC Warcha Project, Rukhla Mandi, Pure white, pink, Room and Salt Range
Precambrian Mines Tehsil Qaidabad, District Khushab, and industrial pillar Formation

Punjab, Pakistan
3 Kalabagh Salt PMDC Kalabagh Project, Kalabagh, White, pin.k and Room and Salt Range
Precambrian Mines District Mianwali, Punjab, Pakistan industrial pillar Formation
PMDC – Pakistan Mineral Development Corporation
289 The Journal of the Southern African Institute of Mining and Metallurgy VOLUME 123 JUNE 2023
Figure 1—Map of Pakistan showing locations of PMDC rock salt projects (Khewra, Warcha, and Kalabagh) included in this research work (adapted from Khan and Shah, 2019)
Table I
Sr No. Project Location Salt seams Mining method Formation/Group Geological horizon
Figure 2—Selected location for testing in main mine at PMDC Warcha. Pillar no. 22, extraction ratio 73%
Stability evaluation of room-and-pillar rock salt mines by using a flat jack technique


290 JUNE 2023 VOLUME 123 The Journal of the Southern African Institute of Mining and Metallurgy
Figure 3—Selected pillars for testing in PMDC Khewra. (a) Main level pillar no. 25-26; extraction ratio 73%, (b) main level pillar no. 51-52, extraction ratio 72%
Figure 4—Selected locations for in-situ testing at PMDC Kalabagh. (a) Mine no. KB-14, extraction ratio 66.20% ,(b) mine no. WK-16, extraction ratio 37.88%
Figure 5— (a) Flat jack equipment, (b) hydraulic pump with pressure gauge
Stability evaluation of room-and-pillar rock salt mines by using a flat jack technique


and flexible hose for connection with the flat jack (Figure 5b). A mechanical dial gauge deformometer was used to measure the rock deformation as shown in Figure 6. It consists of three components, namely the dial gauge, moveable limb, and static limb or scale. The static limb is fixed while the moveable limb gives a measuring range of 5.00 mm. The instrument can be used to measure deformations in rock with an accuracy of 0.001 mm.

On-site challenges
Site selection was a major challenge as pillar stress was determined in the middle of the mine instead of a test gallery. The testing required an undisturbed rock surface with an electrical connection nearby. In addition, the site had to be safe and away from operational activities. The flat jack testing requires a lateral slot to be cut in the rock, which is a challenging task. Generally, the slot can be developed using overlapping or contiguous drill-holes, a disc cutter, or chainsaw. In this work the slot was cut using contiguous drill-holes due to the relatively soft rock conditions. The other two methods of slot creation (disc cutter and chainsaw cutter) are usually preferred in hard rock. The disc cutter can be used on site with an appropriate mounting assembly, which enables lateral movement of the cutter, thus creating a slot. The cutter must have a large enough diameter to cut a deeper slot. If a chainsaw is employed for slot cutting, the cutting tips must be customized for use in softer and corrosive rocks such as rock salt. Overall, the locally manufactured flat jack equipment used in this research work was handy in terms of flexibility, with specifications making it robust for site conditions. It was also cheaper than the commercial solution available. The only catch was its calibration and validation of the tests performed. The calibration was performed in the laboratory as suggested by Mendola, Giudice, and Minafo (2019).
Flat jack calibration
The pressure exerted by the flat jack on the walls of the slot is
indicated by the pressure gauge of the hydraulic pump. Therefore in order to perform precise in-situ stress measurements the pressure gauge was calibrated using the pre-calibrated read-out gauge/ unit of the laboratory 200 t Schimadzu universal testing machine (UTM). For this purpose the flat jack was placed between the platens of the UTM under a known applied force. Then the pressure in the flat jack was increased in increments of 11 kg/cm2 and at each increment the dial gauge reading of the hydraulic pump and corresponding reading of the UTM gauge were noted. Finally, a relationship was developed (Figure 7) to calculate the calibrated stress value using the stress value indicated by the pressure gauge of the flat jack hydraulic pump.
In-situ stress measurement
The in-situ flat jack tests were performed according to the test procedure provided in Brady and Brown (2005). In the selected pillar rib, the location for evaluating rock deformation was prepared by installing three sets of measuring pins (Figure 8a) on each side along the centreline orthogonal to the axis of the pre-marked flat jack slot. The distance between the measuring points was accurately measured by using a highly sensitive dial-gauge deformometer with an accuracy of 0.001 mm. A slot approximately 48 cm wide was cut (Figure 8b) using a hand-held rock-drill machine to drill contiguous holes of 25 mm diameter. After cutting the slot, the distance between the installed pins was measured again in order to determine the amount of slot closure (Figure 9). The difference between the measured distances before and after slot cutting is the deformation of rock around the slot. Finally, the flat jack was
291 The Journal of the Southern African Institute of Mining and Metallurgy VOLUME 123 JUNE 2023
Figure 6—Mechanical dial gauge for deformation measurement
Figure 7—Relationship for the calibration of stress values indicated by the hydraulic pump of the flat jack
Figure 8—(a) Marking and installing the measuring points, (b) cutting of slot and its dimensions
Stability evaluation of room-and-pillar rock salt mines by using a flat jack technique

fully inserted into the slot and hydraulic pressure was applied in increments of 20 kgf/cm2 utilizing a manual hydraulic pump capable of exerting a pressure of up to 700 bar. The cancellation pressure at which the measurment points shifted to their original positions was noted from the pressure gauge on the hydraulic pump. Figure 10 illustrates an integrated view of in-situ stress measurement carried out at PMDC Khewra (pillar no. 51-52). During experimentation reversals of axial deformations were also noted after every 20 kg/cm2 increment of hydraulic pressure. This data was utilized to plot axial stress versus axial strain and ultimately in-situ moduli of elasticity were determined for all the selected pillars.
Computation of pillar strength and stress
The average pillar strength and stress were determined by employing the tributary area method (Brady and Brown (2005) for rectangular room-and pillar-layout. According to this approach the load of the overlying strata is equally distributed among the pillars. The pillar strength for rock salt mines was computed by using Equation [3] (Mao, 2015). It is pertinent to highlight here that Equation [3] is a modified version of Bieniawski (1968, Equation 1) which was originally developed for coal pillars only. Similarly the pillar stress was computed by using Equation [4] (Brady and Brown, 2005). Finally, the factor of safety (FOS) was computed both for actual in-situ pillar stress (measured in the field) and estimated stress scenarios.
from all three selected mining projects according to the ASTM D2113 (2014) standards. In this regard, representative salt blocks of appropriate size (at least 12 inches edge dimensions) and free from any noticeable flaws were selected.
Laboratory testing
As per the research plan a comprehensive suite of laboratory experiments including uniaxial compressive strength (UCS), Young’s modulus (E), Brazilian tensile strength (BTS), and density (ρ) tests were performed. Rock salt cores were obtained by drilling the collected blocks using standard NX size (54 mm) core cutting bits and cylindrical specimens were prepared according to the guidelines in the ASTM D4543 (2008) standards.
Compressive strength and elastic modulus
The UCS and uniaxial deformability tests were performed on prepared cylindrical rock salt core samples utilizing a 200 t universal testing machine. To compute the elastic moduli, axial as well as lateral strains were determined at fixed loading intervals until the sample failed. Two mechanical dial gauges having a least count of 0.01 mm were used for this purpose. The tests were carried out according to the recommendations in ASTM D7012 (2010).

Brazilian tensile strength
where Sp = strength of pillar. Si = strength of specimen measured in the laboratory, and w h is pillar width to height ratio.

The BTS tests were carried out in accordance with the recommendations in ASTM D3967 (2016). Prepared discs of rock salt with thickness or height approximately equal to 0.5 times the diameter were loaded diametrically and failure loads were noted.
Density
where Pzz = vertical component of pre-mining stress field, r is the extraction ratio, Wo is the span of the opening or room, Wp is the span of the pillar, and a and b are the pillar dimensions in plan view for a rectangular pillar.

Collection of rock salt blocks
To carry out laboratory scale testing, rock salt blocks were collected
The density of rock salt was determined from the weight to volume ratio of prepared core samples. The volume of each core specimen was determined by taking the average of height and diameter values with a Vernier caliper. A weighing balance with a least count of 0.01 g was used to determine the weight of the specimen.
Results and discussion
Table II lists the field variables along with actual and estimated parameters including pillar width (W), pillar length (L), width of opening (Wop), height of opening (Hop), opening width to height
292 JUNE 2023 VOLUME 123 The Journal of the Southern African Institute of Mining and Metallurgy
[3]
[4]
Figure 9—Deformation measurement after cutting the slot
Figure 10—In-situ stress measurement test being carried out at PMDC Khewra (pillar 51-52)
Stability evaluation
Table II
Field
of room-and-pillar rock salt mines by using a flat jack technique
Results of laboratory testing
ratio (W/H(op)), extraction ratio (ER), overburden height (OB), insitu pillar stress (σ(Measured)), estimated pillar stress (σ(EST)), estimated pillar strength (ST(EST)), factor of safety based on in-situ pillar stress (FOS(Actual)), factor of safety based on estimated pillar stress (FOS(EST)), and in-situ Young’s modulus (E(Measured)). Similarly, Table III lists the data acquired from laboratory investigations comprising uniaxial compressive strength (UCS), Young’s modulus E(Lab)), Brazilian tensile strength (BTS), and density (ρ). The discussion of results is chiefly focused on performing a comprehensive pillar stability analysis for the selected rock salt projects by considering stress (in-situ versus estimated) and factor of safety (actual against measured) approaches. Moreover, statistical relationships including in-situ and laboratory elastic modulus, in-situ pillar stress versus width to height ratio of opening, as well as overburden height are also developed specifically for room-and-pillar rock salt mines. Finally, the pillar optimization analysis was performed to suggest the effective pillar length based on factor of safety for a given pillar width.
Pillar stability analysis
To investigate the stability of the mine layout, analysis was performed based on pillar stress and pillar factor of safety (FOS) by considering both in-situ and estimated values. It is worth mentioning here that Salamon and Munro (1967) and Bieniawski (1981) initially recommended the factor of safety (FOS) approach to evaluate the stability of underground room-and-pillar mines. A close look at Table II shows that estimated stresses for pillars KH_25-26; KH_51-52, and WR-22 are an order of magnitude higher than expected. This is attributed to deviations from the designed mine plans, especially around the test locations or pillars selected for in-situ testing. Due to over-extraction of pillars (i.e increased width of crosscuts and high chambers) the resulting extraction ratios in respect of pillars KH_25-26; KH_51-52, and WR-22 are 73, 72%, and 73% respectively. This fact is also evident from the actual measured stress values (σ(Measured)) (Table II), which
remain in a closer range to the estimated stress values([σ(EST)) and demonstrate the accuracy of field measurements. Similarly, in the case of pillars KB_14 and WK_16 (Table II) the measured stress values (σ(Measured)) are somewhat higher in comparison to the estimated stress values (σ(EST)), which may be ascribed to the complex tectonosedimentary framework of the western Salt Range (Ghazi et al., 2015). Moreover, inclined chambers are forming ramps around the test pillar, incorporating ground stresses leading to higher in-situ stresses. Figure 11 shows the relationship (R2 = 0.93) between the in-situ stresses measured in the field and those estimated using Equation [4], where an increasing linear trend can be observed. The developed relationship (Figure 11) can be applied for the estimation of in-situ stress in rock salt pillars from empirically estimated stress values.
An attempt was also made to establish a possible correlation (Figure 12) between the FOS(Actual) and FOS(EST) and a power function of moderate strength (R2 = 0.96) was found. According to Jeremic (1994) FOS values of 1.0, 1.3, and 1.6 must be maintained for temporary, intermediate, and long-term underground roomand-pillar rock salt mines in order to carry out safe mining operations. The FOS(Actual) and FOS(EST) values determined in this

293 The Journal of the Southern African Institute of Mining and Metallurgy VOLUME 123 JUNE 2023
Project Test W L Wop Hop W/H ER OB σ(Measured) σ(EST) ST(EST) FOS(Actual) FOS(EST) E(Measured) ID (m) (m) (m) (m) (op) (%) (m) (MPa) (MPa) [Eq. 4] (MPa) [Eq. 3] (GPa) Khewra KH_25-26 10.50 45.00 10.50 8.20 1.28 73.00 139 11.23 10.81 28.71 2.56 2.66 0.68 KH_51-52 15.50 45.00 15.50 5.00 3.10 72.00 142 11.97 10.57 60.88 5.09 5.76 10.70 Warcha WR_22 10.00 31.00 13.00 7.33 1.77 73.00 65 7.53 5.18 46.87 6.22 9.05 1.63 Kalabhagh KB_14 11.66 16.00 8.00 7.00 1.14 66.20 52 6.05 3.25 64.26 10.62 19.77 1.21 WK_16 14.00 21.00 8.54 6.50 1.31 37.88 56 7.52 3.13 65.53 8.71 20.94 3.50
parameters of the selected rock salt projects
Table III
Project Test ID UCS (MPa) E(Lab) (GPa) BTS (MPa) Density (ρ) (kg/m3) Khewra KH_25-26 20.13 0.73 2.14 2143.99 KH_51-528 21.03 2.41 1.19 2130.10 Warcha WR_22 31.37 1.41 2.08 2161.01 Kalabhagh KB_14 36.99 0.97 2.37 2113.31 WK_16 30.75 1.51 2.81 2198.91
Figure 11—Correlation between in-situ and estimated pillar stresses
Stability evaluation of room-and-pillar rock salt mines by using a flat jack technique
work (Table II) are well above the recommended value of 1.6 for long-term underground mines, which indicates the stability of the layouts and allowance for pillar optimization, which will enable the extraction ratio to be increased without compromising stability.
Relationship between in-situ and static elastic modulus

Elastic modulus (Young’s modulus) is a fundamental property that represents the stiffness of a material, i.e. how the material deforms under applied load. In underground room-and-pillar mines it is an important design parameter which indicates the likelihood of pillar failure as well as providing an evaluation of the stability of the overall layout. In this work, the elastic moduli were determined both in the field and in the laboratory. Table II shows the in-situ modulus of elasticity (E(Measured)) measured for the selected projects, whereas Table III includes the static Young’s modulus (E(Lab)) measured in laboratory tests. A significant correlation (R2 = 0.95) was established between E(Measured) and E(Lab) (Figure 13). Since it is both costly and laborious to measure in-situ stress and elastic modulus, the developed conversion equation in Figure 13 can be utilized to estimate the in-situ modulus for underground roomand-pillar rock salt mines based on the laboratory-measured static Young’s modulus.
Correlation of in-situ stress with room width to height ratio and overburden height

In underground room-and-pillar mining layouts, the vertical stress on pillars (due to overburden material) is dependent on the width of rooms and pillars as well as height of rooms. The opening width to height ratio [W/H(op)] is an important parameter in studying the combined effect of these factors on the pillar stress (Hartman and Mutmansky, 2002). In the current work efforts have been made to establish a relationship between width to height ratio of the opening and actual or in-situ stress measured in the field. Figure 14 displays a linear positive correlation of moderate power (R2 = 0.41) illustrating the effect of increasing room span on pillar stress. The results are in full conformity with past investigations (Hartman and Mutmansky, 2002; Lau, 2010).
The effect of height of overburden material on in-situ pillar stress was also investigated. Room-and-pillar mining in a massive orebody like rock salt causes redistribution of the load, which results in an increase of stress concentration on the supporting pillars (Brady and Brown, 2005). A plot of overburden height (OB) against the actual in-situ stress measured in the pillar ribs for the selected mine sites yields a positive increasing trend with a high coefficient of determination (R2 = 0.96, Figure 15). The correlation so developed is specific to rock salt mines of the Salt Range, and

can be used for the estimation of in-situ pillar stress by using the overburden height.
Effect of pillar dimensions on mine stability

The influence of pillar dimensions on factor of safety (FOS) was investigated for the selected rock salt mines based on the average values of rock salt properties [σ(Measured), UCS] for the calculations of FOS included in Tables II and III. This pillar optimization analysis was performed by keeping the height of pillars the same as those in the actual field situations (3.65 m) and varying the width and length of pillars. In the case of rectangular pillars, equivalent pillar length was determined by using Equation [5] as suggested by Wagner 1974).

294 JUNE 2023 VOLUME 123 The Journal of the Southern African Institute of Mining and Metallurgy
[5]
Figure 12—Correlation between FOS(Actual) and FOS(EST)
Figure 13— Correlation of in-situ elastic modulus and laboratory Young’s modulus for selected rock salt projects
Figure 14 Correlation of in-situ stress with room width to height ratio (W/H(op))
Figure 15 Correlation of in-situ stress with overburden height (OB)
Stability evaluation of room-and-pillar rock salt mines by using a flat jack technique
Table IV
Example calculation of equivalent length and FOS for a fixed pillar width of 5 m and height of 3.65 m
where; WE = equivalent length, A = area of pillar, and C = perimeter of the pillar.
Table IV shows an example calculation for a pillar width fixed at 5 m and various pillar lengths from 5 m to 110 m. In a similar way, equivalent lengths and FOS calculations were performed for pillar widths of 10, 15, 20, and 25 m. Figure 16 shows the relationship between pillar effective length and FOS for selected pillar widths.
It is interesting to note from Figure 16 that initially the FOS increases with increasing in pillar length, but the influence on FOS becomes negligible when the length of pillar is increased beyond a certain limit. This limit is termed here the maximum effective length (MEL). It is evident from Figure 16 that a pillar length beyond MEL is responsible only for lowering the extraction ratio and sterilizing mineral resources. Similarly, optimum length (Figure 16) is that which falls at the point of maximum gradient on the FOS versus pillar length curves for the selected pillar widths and is the
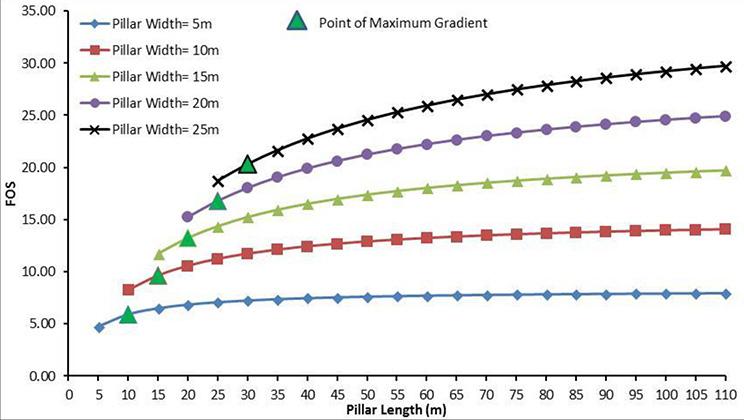
most suitable length in terms of obtaining the maximum extraction ratio. Keeping these facts in view, the generic chart (Figure 16) can be used to determine the most efficient layout of rock salt pillars without compromising the extraction ratio and stability of the mine for a planned pillar width. As can be seen in Figure 16, a pillar of 5 m width should not be longer than 20 m in order to obtain maximum extraction and safety. All other layouts are conservative designs and can be amended for maximum extraction. The curves proposed in Figure 16 are applicable for rock salt mines in the Salt Range with similar rock and mine conditions.
In order to find the maximum effective length (MEL) of a pillar the percentage FOS difference (computed for each increment of 5 m in pillar length) is adopted by setting the cut-off value at 1.00. For example, in Table IV for a pillar width of 5 m, the values of pillar length and FOS at predetermined cut-off grade are 45 m and 7.54 respectively. In addition to the generic chart (Figure 16), a
295 The Journal of the Southern African Institute of Mining and Metallurgy VOLUME 123 JUNE 2023
Pillar width (m) Length (m) WE (m) W/H Strength (MPa) (Equation [3]) FOS % change in FOS 5.00 5.00 1.37 42.03 4.74 10.00 6.67 1.83 52.37 5.91 21.899 15.00 7.50 2.05 57.54 6.49 9.405 20.00 8.00 2.19 60.64 6.84 5.248 25.00 8.33 2.28 62.70 7.08 3.352 30.00 8.57 2.35 64.18 7.24 2.327 35.00 8.75 2.40 65.29 7.37 1.711 40.00 8.89 2.44 66.15 7.47 1.311 45.00 9.00 2.47 66.84 7.54 1.036 50.00 9.09 2.49 67.40 7.61 0.840 55.00 9.17 2.51 67.87 7.66 0.695 5.00 60.00 9.23 2.53 68.27 7.71 0.584 65.00 9.29 2.54 68.61 7.74 0.498 70.00 9.33 2.56 68.91 7.78 0.430 75.00 9.38 2.57 69.16 7.81 0.374 80.00 9.41 2.58 69.39 7.83 0.329 85.00 9.44 2.59 69.60 7.86 0.292 90.00 9.47 2.60 69.78 7.88 0.260 95.00 9.50 2.60 69.94 7.89 0.234 100.00 9.52 2.61 70.09 7.91 0.211 105.00 9.55 2.62 70.22 7.93 0.191 110.00 9.57 2.62 70.34 7.94 0.174
Figure 16— Relationship between FOS and effective pillar length
Stability evaluation of room-and-pillar rock salt mines by using a flat jack technique
Table V
Maximum effective length and FOS for selected pillar widths
and WK_16, Table II) were greater than the estimated stresses (σ(EST)) due to the complex regional tectonic setting of the western Salt Range and the development of ramps around the test pillar that impart lateral stresses.
➤ The actual and estimated values of FOS determined (Table II) for the three mines lie above the recommended value of 1.6, which indicates their long-term structural stability. Moreover, a strong linear correlation (R2 = 0.93, Figure 11) was established between the actual and estimated pillar stresses. Similarly, a power function correlation of moderate significance (R2 = 0.96) was also established (Figure 12) between the FOS(Actual) and FOS(EST).
➤ In view of the cost and laborious work involved in the determination of in-situ stress and elastic modulus, efforts have been made to suggest a correlation between E(Measured) and E(Lab). The application of this proposed relationship (R2 = 0.95, Figure 13) is specific for the estimation of the in-situ modulus for underground chamber-and-pillar rock salt mines based on the laboratory-measured static Young’s modulus.
regression equation is proposed to predict MEL based on the pillar width. Table V lists down the data values (FOS and maximum effective pillar length) corresponding to the cut-off value of 1.00 for the selected pillar widths of 5, 10, 15, 20, and 25 m. Figure 17 shows the regression plot and correlation between MEL and pillar width.

Conclusions
Pillar stability was investigated at three underground rock salt mining projects operated by Pakistan Mineral Development Corporation (PMDC) in the Salt Range of Punjab, Pakistan. The first part of this study comprised field work and included actual in-situ pillar stress (σ(Measured)) measurements conducted on suitable pillar locations using a flat jack, determination of in-situ modulus of elasticity (E(Measured)), and recording of mine geometry parameters. This data was further utilized to estimate empirically the pillar stress (σ(EST), Equation [4]). The second part of the study consisted of rock mechanics laboratory testing in order to estimate pillar strength (ST(EST), Equation [3]). The physico-mechanical properties of rock salt considered were uniaxial compression strength (UCS), Brazilian tensile strength (BTS), Young’s modulus [E(Lab)), and density (ρ). Finally, safety factors of pillars for both actual and estimated scenarios were calculated. The following conclusions can be drawn from the results.
➤ The pillar stabilities for the selected mines were checked based on pillar stress and pillar factor of safety (FOS) by considering both in-situ and estimated values. The in-situ pillar stresses (Table II) were found to be 11.60 MPa, 7.53 Mpa, and 6.78MPa at Khewra, Kalabagh, and Warcha salt mining projects respectively. The estimated stresses in the pillars at Khewra (KH_25-26; KH_51-52) and Warcha (WR-22) were somewhat higher than expected. This is mainly due to the deviations from the mine design and pillar robbing to increase the extraction ratios. The same result was reflected from field measurements (σ(Measured)) (Table II) having values close to the estimated stresses (σ(EST)). However, the measured stress values (σ(Measured)) at test pillars at Kalabagh mine (KB_14
➤ In order to demonstrate the effect of opening width to height ratio (W/H(op)) and overburden height (OB) on actual in-situ pillar stress in underground conditions, two linearly increasing correlations have been developed (Figures 14 and 15) that can be used for the estimation of in-situ pillar stress for the rock salt mines of Salt Range by employing the room width to height ratio and overburden height.
➤ In addition, the influence of pillar dimensions on FOS (pillar optimization analysis) was investigared for the selected mines by keeping the height of pillars the same as in the actual field situations (3.65 m) and varying the width and length. It was noticed that a greater pillar length does not contribute significantly to FOS beyond a certain length, termed the maximum effective length (MEL). Therefore, it is recommended to reduce pillar length to improve the extraction ratio without compromising mine stability. Finally a generic chart (Figure 16) was developed for different pillar widths from 5 m to 25 m to determine the effective length and FOS of rock salt pillars. Furthermore, a correlation (Figure 17) was also proposed to predict MEL based on pillar width. The generic chart so developed can be used to establish a suitable length of pillar for a given span and required level of safety.
➤ For future work it is recommended that three-dimensional geomechanical modelling and simulation be performed using the data from this research project in order to enhancethe recovery ratio of rock salt through optimization of pillar dimensions for the rock salt mines of the Salt Range, Punjab.
Funding information
This study was funded by the Higher Education Commission (HEC), Pakistan with Grant No.9545.
Acknowledgements
The authors would like to acknowledge the support provided by the management of Pakistan Mineral Development Corporation (PMDC) at their Khewra, Kalabagh, and Warcha salt mines. Especial appreciations goes to Engr. Rana Tanveer (Project Manager) and Engr. Umer Pervaiz (Assistant Manager) at PMDC Khewra Project, Engr. Irfan Chaudhry (Project Manager), Engr. Mohsin Aziz (Assistant Manager) and Engr. Shoaib (Assistant Manager) at PMDC Kalabagh Project and Engr. Malik Naeem (Project Manager), and Engr. Imran Khan at PMDC Warcha
296 JUNE 2023 VOLUME 123 The Journal of the Southern African Institute of Mining and Metallurgy
Figure 17—Correlation between MEL and pillar width
Pillar width (m) Maximum effective length (MEL) (m) FOS 5.00 45.00 7.54 10.00 65.00 13.38 15.00 80.00 18.93 20.00 90.00 24.15 25.00 105.00 29.51
Stability evaluation of room-and-pillar rock salt mines by using a flat jack technique
Project. Many thanks are also due to the Department of Mining Engineering, Faculty of Earth Sciences and Engineering, of University of Engineering and Technology (UET), Lahore, for facilitating this research work.
References
Armanasco, A. and Foppoli, D. 2020. A flat jacks’ method for in situ testing of brick masonry shear characteristics. Construction and Building Materials, vol. 262.119840.
Asrarullah, P. 1967. Geology of the Khewra Dome. Proceedings of 18th and 19th Combined Session of all Pakistan Science Conference Part III, Hyderabad, Pakistan.
ASTM D4729. 2008. Standard test method for in-situ stress and modulus of deformation using flatjack method. American Society for Testing and Materials. doi: 10.1520/D4729-08
ASTM D2113. 2014. Standard practice for rock core drilling and sampling of rock for site exploration. American Society for Testing and Materials. https:// standards.globalspec.com/std/ 9885092/ASTM D211.
ASTM D4543. 2008. Standard practices for preparing rock core as cylindrical test specimens and verifying conformance to dimensional and shape tolerances. American Society for Testing and Materials. https://www.astm.org/ DATABASE. CART/HISTORICAL/ D4543-08.htm
ASTM D7012. 2010. Standard test method for compressive strength and elastic moduli of intact rock core specimens under varying states of stress and temperatures. American Society for Testing and Materials. https://www.astm. org/DATABASE.CART/HISTORICAL/D7012-10.htm
ASTM D3967 2016. Standard test method for splitting tensile strength of intact rock core specimens. American Society for Testing and Materials. https://www.astm. org/Standards/D3967.htm
Baloch, M., Qureshi, A., Waheed, A., Ali, M., Ali, N., Tufail, M., and Khan, H 2012. A study on natural radioactivity in Khewra Salt Mines, Pakistan. Journal of Radiation Research, vol. 53, no. 3. pp. 411–421.
Bell, J.S. and Gough, D.I. 1979. Northeast-southwest compressive stress in Alberta evidence from oil wells. Earth and Planetary Sciences Letters, vol. 45, no. 2. pp. 475–482.
Bieniawski, Z.T. 1968. The effect of specimen size on compressive strength of coal. International Journal of Rock Mechanics and Mining Sciences & Geomechanics Abstracts, vol. 5, no. 4. pp.c325–335, doi: 10.1016/0148-9062(68)90004-1
Bieniawski, Z.T. 1981. Experience with in situ measuremment of deformability. Geophysical Research Letters, vol. 8, no. 7. pp. 675–677.
Binda, L. and Tiraboschi, C. 1999. Flat-Jack Test: A slightly destructive technique for the diagnosis of brick and stone masonry structures. International Journal for Restoration of Buildings and Monuments, vol. 5, no. 5. pp. 449–472.
Brady, B.H.G. and Brown, E.T. 2005 Rock Mechanics for Underground Mining.3ed edn. Springer, Dordrecht.
Brady, B. and Brown, E. 2007. Pillar supported mining methods. Rock Mechanics for Underground Mining. Springer, Dordrecht. https://doi.org/10.1007/978-14020-2116-9_13
Cescatti, E., Benetta, M.D., Modena, C., and Casarin, F. 2016. Analysis and evaluations of flat jack test on a wide existing masonry buildings sample. Proceedings of the 16th International Brick and Block Masonry Conference, Padova, Italy. Routledge. pp. 26–30.
Corkum, A.M.M.A.G. 2020 Experimental evaluation of rapid flat jack testing with various shaped saw cut slots. Rock Mechanics and Rock Engineering, vol. 53, no. 1. pp. 455–466.
Deng, J., Yue, Z., Tham, L., and Zhum, H.H. 2003. Pillar design by combining finite element methods, neural networks and reliability: A case study of the Feng Huangshan copper mine. China. International Journal of Rock Mechanics and Mining Sciences, vol. 40. pp. 585-599.
Dhawan, K.R. 2012. Flat jack method for measuring design parameters for hydraulic structures of the Koyna hydro-electric project in India. ISSMGE International Journal of Geo-engineering Case Histories, vol. 2, no. 3. pp. 182–195.
Eberhardt, E. and Stead, D. 2011. Geotechnical Instrumentation. Mining Engineering Handbook. 3rd edn, Darling, P. (ed.). Society for Mining, Metallurgy & Exploration, Littleton, CO. pp 551–571.
Fedele, R. and Maier, G. 2007. Flat-jack tests and inverse analysis for the identification of stress states and elastic properties in concrete dams. Meccanica, vol. 42, no. 4. pp. 387–402.
Figueiredo, B., Lamas, L., and Muralha, J. 2010. Determination of in situ stresses using large flat jack tests. Proceedings of the 6th Asian Rock Mech.Symposium - Advances in Rock Engineering, New Delhi, India,, 23-27 October 2010. doi: 10.13140/2.1.3118.9762
Figueiredo, B., Lamas, L., and Muralha, J. 2011. Numerical simulation of a large flat jack test with cyclic loading. Proceedings of the 6th International Conference on Dam Engineering, Lisbon, Portugal, 15-17 February. Pina, C., Portela, E., and Gomes, J. (eds). CI-Premier, Singapore. http://repositorio.lnec.pt:8080/ jspui/h,andle/123456789/1002718
Feng, Y., Harrison, J.P., and Bozorgzadeh, N. 2020. A Bayesian approach for uncertainty quantification in overcoring stress estimation. Rock Mechanics and Rock Engineering, vol. 54, no. 2. pp. 627–645. doi: 10.1007/S00603-020-02295W
Gee, E.R. 1945. The age of the Saline Series of the Punjab and of Kohat. National Academy of Sciences, India, Section B, vol. 14. pp. 269-310.
Ghazi, S., Ali, S.H., Sahraeyan, M., and Hanif. T. 2014. An overview of tectonosedimentary framework of the Salt Range, northwestern Himalayan fold and thrust belt, Pakistan. Arabian Journal of Geoscience. doi: 10.1007/s12517014-1284-3
Goodman, R.E. 1989. Introduction to Rock Mechanics. 2nd edn. Wiley & Sons.
Gregorczyk, P. and Lourenço, P.B. 2000. A review on flat-jack testing. Revista Engenharia Civil, vol. 9. pp. 39-50. https://citeseerx.ist.psu.edu/ document?repid=rep1&type=pdf&doi=093cbc7d06f40d24b02fc849eb50cb14c78629a5
Hartman, H.L. and Mutmansky, J.M. 2002. Introductory Mining Engineering. 2nd edn. Wiley.
He, B.G. and Hatzor, Y.H. 2015. An analytical solution for recovering the complete in-situ stress tensor fpp. rom flat jack tests. International Journal of Rock Mechanics and Mining Sciences, vol. 100, no. 78. pp. 118–126.
Hedley, D.G.F. and Grant, F. 1972. Stope-and-pillar design for Elliot Lake Uranium Mines. CIM Bulletin, vol. 65. pp. 37–44.
Hoek, E., Kaiser, P.K., and Bawden, W.F. 1995. Support of Underground Excavations in Hard Rock. Balkema, Rotterdam, 215 pp.
Hoek, E. and Brown, E.T. 2005. Underground Excavations in Rock. Revised 1st edn. Taylor & Francis.
ISRM. 1986. Suggested method for deformability determination using a large flat jack technique. vol. 23, no. 2. pp. 133–140.
Jeremic, M.L. 1994 Rock Mechanics in Salt Mining. Ist edn. CRC Press. 544 pp.
Jumikis, A.R. 1983. Rock Mechanics. 2nd edn. Vol. 7. Trans Tech.
Khan, S. and Shah, M.M. 2019. Multiphase dolomitization in the Jutana Formation (Cambrian), Salt Range (Pakistan): Evidences from field observations, microscopic studies and isotopic analysis. Geologica Acta, vol. 17. pp. 1–18.
Krauland, N. and Soder, P. 1987. Determining pillar strength from pillar failure observation. Engineering and Mining Journal, vol. 8. pp. 34–40.
Łątka, D. and Matysek, P. 2017. The estimation of compressive stress level in brick masonry using the flat-jack method. Procedia Engineering, vol. 193. pp. 266–272.
297 The Journal of the Southern African Institute of Mining and Metallurgy VOLUME 123 JUNE 2023
Stability evaluation of room-and-pillar rock salt mines by using a flat jack technique
Lamas, L., Muralha, J., and Figueiredo, B. 2010. Application of Global Interpretation Model for Assessment of the Stress Field for Engineering Purposes. Taylor and Francis, London.
Lin, H., Oh, J., Masoumi, H., Canbulat, I., and Zhang, C. 2018. A review of insitu stress measurement techniques. Proceedings of the Coal Operators Conference 2018. Australasian Institute of Mining and Metallurgy, Melbourne. pp 95–102.
Medeiros, W.A., Soriani, M. de O., and Parsekian, G.A. 2020. Innovation in flat-jack application to evaluate modern high-strength hollow concrete block masonry. Construction and Building Materials, vol. 255. 119341. doi: 10.1016/J. CONBUILDMAT.2020.119341
Mendola, L.L., Giudice, E.L., and Minafo, G. 2019. Experimental calibration of flat jacks for in-situ testing of masonry. International Journal of Architectural Heritage: Conservation, Analysis and Restoration, vol. 13, no. 5. pp. 619–629.
Mines and Minerals Department, Government of The Punjab. 2020. Mineral production 2019-20. https://mnm.punjab.gov.pk/system/files/2019-20

Obert, L. and Duvall, W.I. 1967. Rock Mechanics and the Design of Structures in Rock. Wiley.
Rios, A.J. and O’Dwyer, D. 2020. Adaptations of the flat jack test for its application in cob walls. MethodsX. doi:10.1016/j.mex.2020.101003
Sabri, M.M., Ulybin, A.V., and Zubkov, S.V. 2015. A review on different destructive methods to determine the compressive strength of an existing masonry. International Journal of Engineering Research and Development, vol. 11, no. 4. pp. 19–26.
Salamon, M.D.G. and Munro, A.H. 1967. A study of the strength of coal pillars. Journal of the Southern African Institute of Mining and Metallurgy, vol. 68. pp. 55–67.
Sebastiani, M., Johanns, K.E., Herbert, E.G., and Pharr, G.M. 2015. Measurement of fracture toughness by nanoindentation methods: Recent advances and future challenges. Current Opinion in Solid State and Materials Science, vol. 19, no. 6. pp. 324–333. doi: 10.1016/J.COSSMS.2015.04.003
Selen, L., Panthi, K., Tunbridge, L., and Schönborn, T. 2020. Field testing of weak rock deformation in water tunnels: A practical review of the flat jack test. Rock Mechanics for Natural Resources and Infrastructure DevelopmentProceedings of the 14th International Congress on Rock Mechanics and Rock Engineering, ISRM 2019, November. pp. 1716–1723.
Shah, S.M.I. 2009. Stratigraphy of Pakistan. Memoirs of the Geological Survey of Pakistan, vol. 22. 355 pp.
Simões, A., Gago, A., Lopes, M., and Bento, R. 2012. Characterization of old masonry walls: Flat-jack method. Proceedings of the 15th World Conference on Earthquake Engineering. Sociedade Portuguesa de Engenharia Sismica, Lisbon. 10 pp. http://www.civil.ist.utl.pt/~rbento/tmp/SEVERES/WCEE2012_2438.pdf
Verstricht, J., Areias, L., Bastiaens, W., and Li, X.L. 2010. Measurement techniques for in situ stresses around underground constructions in a deep clay formation. ICEM 14 – Proceedings of the 14th International Conference on Experimental Mechanics. EDP Sciences, Les Ulis, France. doi: 10.1051/epjconf/20100622018
Wagner, H. 1974. Determination of the complete load-deformation characteristics of coal pillars. Proceedings of the 3rd ISRM Conference, Denver, Colorado. pp. 1076–1081
Wynne, A. 1887. On the geology of the Salt Range in the Punjab: India. Memoirs of the Geological Survey of India, vol. 14. Kolkata, West Bengal, India. 313 pp.
298 JUNE 2023 VOLUME 123 The Journal of the Southern African Institute of Mining and Metallurgy
Affiliation:
1Pyrometallurgy Division, Mintek, South Africa.
2Department of Mechanical and Aeronautical Engineering, University of Pretoria, South Africa.
3Western Australia School of Mines, Curtin University, Australia.
4Department of Chemical Engineering, Stellenbosch University, South Africa.
Dependence of solar reflector soiling on location relative to a ferromanganese smelter
M.A. Swart1,2, L. Hockaday3, Q.G. Reynolds1,4, and K.J. Craig2
Synopsis
Correspondence to:
M.A. Swart
Email: u04535465@tuks.co.za
Dates:
Received: 10 Feb. 2022
Revised: 8 Dec. 2022
Accepted: 8 Dec. 2022
Published: June 2023
How to cite:
Swart, M.A., Hockaday, L., Reynolds, Q.G, and Craig, K.J. 2023 Dependence of solar reflector soiling on location relative to a ferromanganese smelter.
Journal of the Southern African Institute of Mining and Metallurgy, vol. 123, no. 6. pp. 299–308
DOI ID: http://dx.doi.org/10.17159/24119717/2021/2023
ORCID:
M.A. Swart
http://orcid.org/0000-0002-5145-6273
L. Hockaday http://orcid.org/0000-0003-2597-9756
A solar reflector soiling study was carried out at a ferromanganese smelter in South Africa to assess the soiling rates at different locations around the plant. Several meteorological parameters were monitored to give insight into the conditions that lead to increased soiling. Mineralogical characterization of dust samples collected from the reflectors and the atmosphere revealed that only a certain size fraction is of importance with regard to soiling, and that the dust can be attributed to both raw materials and smelter products. Proximity to the dust source was the primary driver for increased soiling. The site that experienced the most soiling was very close to raw material heaps; this was deemed an outlier and was excluded from the summary statistics. The secondary driver for increased soiling was location relative to the smelter dust sources and the wind’s direction and speed. The reflector set at the best location experienced 13.1% less soiling than the set at the ‘worst’ (but still feasible) location, represented by an averaged mean daily reflectance loss of 0.0186. The study revealed that while there are periods of intense soiling at this particular site, proper planning of reflector location in relation to the smelter dust sources can significantly mitigate the soiling rate.
Keywords
Heliostat soiling, energy-intensive industry (EII), solar thermal process heat, concentrating solar thermal (CST).
Introduction
Energy-intensive industries (EIIs) are major carbon emission sources, consuming a large portion of global energy and emitting roughly a third of global greenhouse-gases (IPCC, 2014). Some mineral processing activities, such as smelting, are major carbon emitters and the demand for the products is likely to increase (Hund et al., 2020). The successful integration of concentrating solar thermal (CST) technologies with EIIs is set to lessen their reliance on fossil fuels and their impact on the climate. The performance of a concentrating solar (CS) plant depends largely on the optical performance of its reflectors, but the effects of industrially generated dust on the performance of solar reflectors are still largely unknown.
Solar photovoltaic (PV) and other renewables that generate power have been developed extensively and are quite mature (IRENA, 2021), but renewable technologies that provide high-temperature (> 600°C) thermal process heat directly are in need of further development. Low-temperature (< 400°C) solar process heat has been used industrially for some time (Weiss and Spörk-Dür, 2021), but only recently have technologies able to supply higher temperature solar process heat started moving closer to commercialization (Ebert et al., 2018).
There are various challenges associated with integrating solar process heat into EIIs. These include industry readiness, energy conversion technology readiness, continuity of heat supply, ease of process adaptation, unknowns regarding process responses to the introduction of solar energy stream, unknowns around CST system performance, and economic feasibility. These challenges are in addition to those that need to be addressed for typical concentrating solar power (CSP) installations, where optimal operation is not yet always achieved (Mehos et al., 2020).
Research is under way towards addressing these challenges, for example the work of Reichart et al (2021) on a novel high-temperature gas-particle heat exchanger to exchange solar process heat stored in particles with air for introduction into an EII process stream. The system-side response to the introduction of solar process heat is also being investigated (Sambo, Hockaday, and Seodigeng, 2020). Mckechnie, McGregor, and Venter (2020) modelled the CST system requirements to feed thermal energy to a manganese ferroalloy smelting plant that processes 40 t of ore per hour, and the financial feasibility of such an integration (Hockaday et al., 2020).
299 The Journal of the Southern African Institute of Mining and Metallurgy VOLUME 123 JUNE 2023
Dependence of solar reflector soiling on location relative to a ferromanganese smelter

An area of CS and PV research that has been receiving increased attention is soiling of solar panels and reflectors (Costa, Diniz, and Kazmerski, 2016, 2018; Kazmerski, Diniz, and Costa, 2020). The performance of a PV cell is inversely proportional to the amount of dust shading the cell, whereas the performance loss for CS systems can be up to 14 times greater because the solar radiation has to pass twice through the soiled layer (Bellmann et al., 2020). The schematic in Figure 1 illustrates the problem.
There is a complex relationship between meteorological comditions, site location, and reflector soiling (Pennetta et al., 2016; Bouaddi, Ihlal, and Fernández-García, 2017). The performance of a CS plant depends on proper reflector cleaning strategies, which constitute a large part of operational and maintenance costs (Picotti et al., 2020). This paper deals with soiling of solar reflectors in the vicinity of a ferromanganese smelter by industrial dust. The aim the study is to lessen the challenges involved in integrating CST technology into EIIs. The questions asked are:
➤ What are the soiling rates (reflectance losses) in the vicinity of a manganese smelter, and are they comparable to soiling rates found in arid regions?

➤ Does placement of the mirrors relative to the main dust source have an effect on soiling rates?
➤ Does industrial dust affect mirrors differently to naturally occurring dust?
➤ Can a heliostat field perform effectively in the vicinity of a manganese smelter?
The outcomes are intended to specifically benefit regions where a good solar and mineral resource base co-exist, and more generally any planned solar project in the vicinity of a ‘point’ dust source that can be considered separately from the surrounding ‘area’ source.
Data collection
A soiling study was carried out from February to November 2020, involving 32 reflectors grouped into four sets of eight reflectors, at different locations around the smelter. Various methods were used
to characterize the dust in and around the plant, especially samples collected from the reflectors. Meteorological conditions were also recorded.
Location
The investigation was conducted at Transalloys, a ferromanganese smelter in Emalahleni, Mpumalanga, South Africa. The plant is one of two ferromanganese producers in South Africa, with an annual production of around 165 000 t. The smelter is located in the industrial heart of South Africa (Figure 2), with numerous coalfired power plants, coal mines, cement quarries, and ferrochrome smelters in the vicinity. These factors make Transalloys an ideal location at which to to investigate aspects of solar reflector soiling. The following raw materials and process products are found at the plant.
➤ FeOx iron oxide dust produced during furnace tapping
➤ SiMn silicomanganese dust produced during casting
➤ C carbon dust from handling of high-carbon charcoal
➤ Baghouse dust a mixture of FeOx, SiMn, and C
➤ MnOx manganese ore dust resulting from ore handling
➤ SiO2 quartz dust from raw materials handling
➤ Local red sand dust generated by agricultural and other human activities, as well as natural processes.
300 JUNE 2023 VOLUME 123 The Journal of the Southern African Institute of Mining and Metallurgy
Figure 1 Illustration of the shading and blocking effect of dust particle on a solar reflector
Figure 2 Land-use classifications of the area immediately surrounding the Transalloys ferromanganese smelter. Data from Lotter (2010) with Google Earth insert
Dependence of solar reflector soiling on location relative to a ferromanganese smelter

Method
The aim of this study is to observe how soiling rates vary with reflector location and time of year. The reflectors were cleaned every 14 (±3) days by spraying with demineralized water using a handpump pressure sprayer, followed by wiping with a microfibre cloth to loosen the dust particles, and a final spray to remove loosened material. The aim was to clean the mirrors as well as possible, and not to test the effectiveness of cleaning.
Field soiling studies of solar reflectors are conducted using portable reflectometers, such as the ones compared by FernándezGarcía et al. (2017). Guidelines developed by a SolarPACES (Solar Power and Chemical Energy Systems) working group on reflectance measurement (Meyen et al., 2018) were adhered to as far as is possible.
The measurement campaign procedures can be summarized as follows:
➤ Take reflectivity measurements of calibration mirror in the laboratory, and keep mirror in a safe place
➤ Install mirrors in field and take baseline reflectivity measurements of each mirror
➤ Let mirrors soil for 14 days
➤ Take reflectivity measurements of each mirror
➤ Wash mirrors after measuring reflectivity of soiled mirrors
➤ Take reflectivity measurements of cleaned mirrors
➤ Repeat steps 3 – 6 for the duration of the campaign
Wind speed and direction measurements were obtained using a standalone wind mast. All other meteorological parameters were gathered from a separate on-site weather station (Brooks et al., 2015).


Equipment
The locations of the sampling sets, along with the wind mast location, are shown in Figure 3.
The wind mast consists of two 2-dimensional Gill Windsonic 1405-PK-100 SDI-12 ultrasonic anemometers, one at 4 m and one at 10 m height above the ground. The anemometers are capable of sampling the wind at 4 Hz and have a 0.01 m/s and a 1° resolution for wind speed and direction respectively. Figure 4 shows an image of the mast, located in an area with no significant obstructions. The reflector samples were 5 mm thick, 200 mm by 400 mm, silvered second-surface low-iron glass with a protective vinyl
coating applied on the back. The reflectors were installed 2 m above the ground and facing towards the smelter area, assumed to be the main dust source, with six reflectors at 60° elevation and two at 30° elevation. The reflectors were positioned in four-by-two arrays, each reflector spaced 2 m apart horizontally and diagonally, as shown in Figure 5. Dust deposition samplers were co-located with each set of reflectors to allow measurement of atmospheric dust characteristics. The reflectivity measurements of the solar reflectors were made using a custom reflectometer developed by Griffith, Vhengani, and Maliage (2014) as an alternative to an off-the-shelf handheld reflectometer such as those described by Merrouni et al. (2017). This device offers the advantage of capturing images of the sampled reflector area, complementing the information obtained and allowing for qualitative visual inspection. The device and a schematic representation are shown in Figure 6.
A Nikon D5300 DSLR camera was attached to the custom lens and light system. The camera is built for professional use, with a very high signal-to-noise ratio. The sampling area is 17.7 mm by
301 The Journal of the Southern African Institute of Mining and Metallurgy VOLUME 123 JUNE 2023
Figure 3 Reflector sampling sets and wind mast locations at the Transalloys site
Figure 4 Wind mast with two ultrasonic anemometers, one at 4 m and one at 10 m height
Figure 5 A reflector sampling set consisting of eight reflectors, six of which are elevated at 60° and two at 30°. Two dust fallout monitors can be seen in the background. The reflector set shown here is set four (S4). A ferrochrome smelter can be seen in the far background
Dependence of solar reflector soiling on location relative to a ferromanganese smelter
16.8 mm, giving a linear field of view of approximately 300 mm2 The reflectometer gives an incidence angle of θi = 45°, and an acceptance aperture of ϕ = 15.7 mrad. The angle of incidence is not considered to be near-normal. This is justifiable because a large proportion of heliostats in the concentrating solar field reflect at this range of incidence.
The camera-based reflectometer does not measure the incident light intensity required to determine reflectance. However, the specular reflectance can still be determined without knowing the incident light intensity. The detected beam intensities are a function of the same components, with different reflectance distribution functions. This allows the specular reflectance to be determined as the ratio of light intensity reflecting specularly from a soiled mirror to the intensity from a reference mirror, measured by the same receiving device. For convenience, this will be referred to simply as reflectance.

The method of calculating the reflectance for each mirror is described by Griffith, Vhengani, and Maliage, (2014). First, a dark image is taken to subtract from the illuminated image, cancelling out the camera sensor and background noise. Red-green-blue (RGB) mean channel pixel intensities (PIs) are then calculated for the corrected image, yielding PIRGB. These two steps are repeated for a minimum of ten sampling spots, Ns, per mirror. The mirror mean is then calculated by
Results and discussion
Dispersed dust characterization
To establish whether the smelter is indeed the main dust source, both the total atmospheric dust and the dust soiling the reflectors were characterized. The deposited atmospheric dust (dustfall particles) was sampled after the extended March to May 2020 sampling period. The reflector soiling dust was sampled after the reflectance measurement campaign.
Particle size distributions (PSDs) for both samples were determined using a Malvern Mastersizer v3.63, which uses a laser diffraction measurement technique. Two separate composite samples, made up from the dust collected from the dust deposition buckets and the dust collected from the reflectors, were analysed. The PSDs for both composite samples are shown in Figure 7.
The PSD curves indicate that the dust present in the atmosphere has a much wider size range than the dust found on the reflectors. It was observed that particles larger than 100 μm tend to fall off the mirror, and for the most part are transported only a limited distance from the dust source, as shown by the count peak of the atmospheric dust PSD being below 100 μm. The mean dust particle size found on the reflectors was 35.5 μm, with 50% of the sample being less than 31.1 μm, and 90% smaller than 98 μm.
The dust morphology was assessed by high-resolution imaging using scanning electron microscopy (SEM) at different magnifications, as shown in Figure 8. The secondary electron detector of a Joel JSM 6360LV instrument was used for this purpose.
The mean PI for the mirror is then used to calculate the reflectance of the mirror as a fraction of the mean PI of a reference (calibration) mirror as follows:


The SEM images show agglomerates of small particles that formed during storage, and which do not represent the state the dust was collected in. The particle shapes become more visible at the largest magnification. Some rough edges are visible, but not enough for the particles to be called jagged or abrasive.
Quantitative analysis was conducted using a Thermo Noran energy dispersive spectroscopy (EDS) instrument. A representative spectrum of the reflector dust is shown in Figure 9.
The reference mirror is kept in a clean laboratory environment. A representative reflectance is then calculated for each set of mirrors by
where Nm represents the number of mirrors at the same elevation in the current set.
The data in Figure 9 is summarized in Table I. The three dominant elements were Si (23.46%), Al (15.15%), and Fe (8.16%).
The crystalline phases present in the sample were identified by X-ray diffraction (XRD) analysis using a Bruker D8 diffractometer with a Fe-filtered Co-K radiation source and a point detector. The Bruker EVA software was used with a reference intensity ratio method to perform phase matching. The phase matching results should thus be considered low-confidence and semi-quantitative only. Phase matching revealed that silica-related phases were dominant:
302 JUNE 2023 VOLUME 123 The Journal of the Southern African Institute of Mining and Metallurgy
[1]
[2]
[3]
DSLR
DSLR CAMERA FLANGE MIRROR SURFACE RELAY LENS LED LIGHT SOURCE COLLIMATOR LENS IMAGING LENS IRIS APERTURE MIRROR SAMPLE Y Z a) b)
Figure 6 (a) Camera-based portable reflectometer on cleaned reflector, (b) schematic representation
FOCAL PLANE
Dependence of solar reflector soiling on location relative to a ferromanganese smelter


The oxide phases are common in sand as well as ores. Routine XRD analysis detects above-trace levels of alumina (Al2O3) in coals, ores, and slag at the smelter site.These materials are the most likely source of the aluminium oxide-related phases but not the silica. The alumina content in the coal is typically approximately 1%, with 4–5% in the manganese ores and 3–6% in the slags. Although the alumina concentration in the raw coal is considered low, alumina constitutes 3–7% of the 15% ash content of the reacted coal. The silica phase could originate either from the raw silica (quartz) stockpiles or from sand at the site; probably a combination of both. The most common phase (SiO2) is also the least dense(2.20 g/cm3), suggesting that less dense phases are more likely to disperse further from their source than denser phases. The other common phases found, including the aluminium phases, probably originate from fugitive furnace dust or (more likely) from the baghouse.

303 The Journal of the Southern African Institute of Mining and Metallurgy VOLUME 123 JUNE 2023 ➤
- silica ➤
– iron silicate ➤
- kyanite ➤
SiO2
Fe2SiO4
Al2O3.SiO2
Al9Fe2Si2 – ferrosilicon aluminium
Figure 7 PSDs of dust collected from dustfall monitors and from reflector samples
Figure 8 Secondary SEM images of dust samples collected from reflectors. (a) 50× magnification, (b) 100× magnification, (c) 250× magnification
Figure 9 Representative EDS spectrum of reflector dust
Table I
Element Si Al Fe S O Mn Sample 23.5 15.2 8.2 7.7 7.5 5.8
Summary of chemical composition of reflector dust sample, (wt. %)
Dependence of solar reflector soiling on location relative to a ferromanganese smelter
As the slag heaps are formed by dumping of liquid and solidified slag, slag particles are likely to be larger than dust and ore particles. Slags are also handled less than raw materials and it therefore makes sense that dust from the slag products does not seem to contribute significantly to mirror soiling.
Atmospheric conditions
Rainfall data for two full seasons is shown in Figure 10. The dry winter season (June-August) coincides with a decrease in reflectance and rise in soiling trends (Figures 12 and 13, respectively).

Wind mast data is displayed in Figure 11 in the form of wind roses. The data is for seven two-week periods during the dry season when increased loss of reflectance was observed (June to September), chosen. to coincide with reflectance sampling dates. The dominant wind direction during this period was from the southwest.
Figure 11 reveals that the wind blows predominantly from the north-northeast (NNE) or the south-southwest (SSW) directions. A peak wind is defined here as a wind speed equal to or above 6 m/s at 10 m above the ground, which occurred roughly 18% of the time during the study period.
Reflectance measurements
The results from the reflectance measurement campaign are presented in Figure 12. Only results from the reflectors at 60° are shown here as soiling for the reflectors at 30° follows similar trends, except with more intense soiling as expected. The maximum measurement uncertainty is 3.2%, with an average uncertainty of 1.3%, which is acceptable. The standard deviation from the averaged reflectance of each reflector set is used as a proxy for uncertainty.
The reflectance of all mirrors starts off at 1.0 and decreases until the reflectors are cleaned. The goal was to take samples every 14 days, but this was not always possible. Notably, the second soiling period (6 March to 13 May) was 68 days, corresponding to a nationwide lockdown due to the COVID-19 pandemic. The reflectance loss during this period averaged 32.7% across the four reflector sets, which is markedly less than the averaged losses of 32.6% experienced over the consecutive 14-day sampling periods during the dry season (26 June to 22 September). These reflectance losses, while high, are not uncommon in arid regions. The differences in soiling for sampling sets S1-to-S4 are also greater in the dry season.
A comparison of the rainfall data (Figure 10) with the soiling results (Figure 12) shows a decrease in reflectance losses with the first rains in the region around the end of September. The rain reduces the levels of atmospheric dust, thereby decreasing the potential for soiling, and washes dust collected off the reflectors.
The smelter shutdown in August does not appear to significantly impact measured reflectance on any of the sampling sets. This seems to contradict the conclusion drawn from dust characterization, that furnace emissions are a major dust source as well as those reached by Davourie et al. (2017), who cited furnace processes and stack emissions as contributing a large proportion of total plant dust emissions. These apparently disparate conclusions can be reconciled if we consider that a large fraction of the furnace ground-level and stack emissions settles out near the origins, resulting in a dust ‘reservoir’ everywhere in close proximity to the major emission sources. During a shutdown, dust will still be dispersed much as usual from these areas. This implies that dust emission control at source will be effective only if the existing dust ‘reservoirs’ are also suppressed.
The mean daily reflectance loss (MDRL) data, or rate of change in reflectance for that period, calculated from the data presented in Figure 12, is in Figure 13. The MDRL is a better way of interpreting the data because it accounts for time, making it easier to identify the worst soiling periods.
Analysis of wind and soiling data
Although background dust concentrations and levels of activity on the plant play a role, the major comntributor to soiling is assumed to be the plant area, based on the dust characterization results.
A first inspection of Figure 13 shows that reflector set S3 consistently experienced higher levels of soiling than the other three sets during the dry season. The marked changes from one period to the next show that there are factors that influence soiling apart from proximity, but for S3 proximity to source clearly outweighs these other factors. The worst soiling is observed during the height of the dry season àt the beginning of August when the most dust is present in the atmosphere. S3 experienced a significantly higher soiling rate with an MDRL of 0.043, in comparison to the rates at S1 and S2 with MDRLs of 0.028 and 0.026 respectively. The weakest winds of the entire sampling period occurred during this time.
Upon closer inspection of the data some interesting trends emerge. During periods A and B (11–26 June and 26 June–8 July)
304 JUNE 2023 VOLUME 123 The Journal of the Southern African Institute of Mining and Metallurgy
Figure 10 Rainfall measured at Transalloys site from January 2019 to December 2020
Dependence of solar reflector soiling on location relative to a ferromanganese smelter
2020/06/11 - 2020/06/26
Figure 11—Wind data corresponding to the reflectance sampling periods. Data averaged over 10-minute intervals, measured at 10 m height above ground, from 11 June to 1 October 2020

Figure 12 Reflectance of the 60° elevation reflectors for all four sampling sets (S1 to S4) from 5 February to 29 October 2020.

305 The Journal of the Southern African Institute of Mining and Metallurgy VOLUME 123 JUNE 2023
A
N N-W W S-W S S-E E N-E 17.8% 14.2% 10.7% 7.1% 3.6% B 2020/06/26 - 2020/07/08 N N-W W S-W S S-E E N-E 17.7% 14.2% 10.6% 7.1% 3.5% C 2020/07/08 - 2020/07/22 N N-W W S-W S S-E E N-E 13.7% 10.9% 8.2% 5.5% 2.7% D 2020/07/22-
N N-W W S-W S S-E E N-E 17.3% 13.8% 10.4% 6.9% 3.5% E 2020/06/26 - 2020/07/08 N N-W W S-W S S-E E N-E 11.9% 19.5% 7.1% 4.8% 2.4% F 2020/08/21 - 2020/09/05 N N-W W S-W S S-E E N-E 13.8% 11.0% 8.3% 5.5% 2.8% G 2020/09/05- 2020/09/22 N N-W W S-W S S-E E N-E 19.2% 15.3% 11.5% 7.7% 3.8% [0.0 : 1.5) m/s [1.5 : 3.0) m/s [3.0 : 4.5) m/s [4.5 : 6.0) m/s [6.0 : 7.5) m/s [7.5 : 9.0) m/s [9.0 : inf) m/s
2020/08/04
Dependence of solar reflector soiling on location relative to a ferromanganese smelter
the wind data appears to be very similar, yet the soiling rates are different. The highest soiling rate observed for period A occurs at S3 with an MDRL of 0.032, and the second highest at S1 with an MDRL of 0.021, a significant difference. In period B the highest soiling rate is for S1 with an MDRL of 0.031, and the second highest at S3 with an MDRL of 0.028. During both periods the winds were predominantly SW and SSW, except for the SE tertiary wind reaching peak speeds for a short while in period A.
During period C the highest soiling rate was at S3 with an MDRL of 0.033, and the second highest at S1 with an MDRL of 0.025. The winds were predominantly SSW, with only shortduration peak winds from other directions.
There are clear changes in the MDRL patterns for the different reflector sets for periods E to G. A general decrease in soiling rates is noted as the winds speeds increase and with the first rains falling towards the end of September. The MDRLs are similar for all reflector sets in period F, as a result of the variability in wind direction. Period F signifies a turning point coinciding with the change of season, with S3 no longer consistently experiencing the worst soiling. The winds were predominantly NNE/N in period G, causing S4 to experience a significantly higher soiling rate than the other sets, with an MDRL of 0.021.
The performance of the different reflector sets during the dry season is simmarized in Table II. The averaged MDRLs are listed alongside a simple scoring system, with one point assigned to the set with the highest MDRL during a particular period and four points to the lowest MDRL.
This analysis leads to the conclusion that although the soiling intensity is determined mainly by the predominant wind direction, shorter duration peak winds can disproportionately influence soiling rates. Thus merely considering predominant wind directions might not be adequate if there is a clear point source of dust close to a planned CS site. The data also reveals that S3 is poorly situated, experiencing much higher soiling rates than the other three sampling locations throughout the dry season. S4 and S1 performed similarly, with averaged MDRLs of 0.0214 and 0.0203 respectively, and S2 perform the best with an averaged MDRL of 0.0186, 13.1% lower than S4.
Dependence of soiling rate
on reflector location
Figure 14 shows the relative contributions of different parts of the plamt to dust generation, based on the dust characterization
Reflector set performance scoring for the considered dry season, periods A-to-G, with higher being better
study, observations made throughout the campaign, and informal discussions with staff at the site.
The three different source strength categorues are:
➤ Major dust sources dust from the baghouse endpoints, furnace emissions, metal tapping and casting zones, all contributing to the hypothesised ‘dust reservoir’
➤ Intermediate dust sources raw materials handling and screening
➤ Minor dust sources slag heaps and general smelter area.
A cause-and-effect relationship emerges from the soiling data and the wind direction data for the same sampling periods. This relationship is most apparent during the dry season. Figure 15 shows image data from two sampling sets, one pair of images acquired during the dry season and the other when the rains have started falling.
Figure 15 clearly shows the difference in soiling between the dry and wet seasons. Sites S1 and S4 were chosen to illustrate this because they are only about 500 m apart, and yet there is a clear difference in the amount of dust seen on the surfaces regardless of the season. The images correspond to period E in Figure 11, with predominant and peak winds blowing from the NW or NNE sending more dust in the direction of S4.
Conclusions
An average reflectance loss of 32.6% for all for sampling sets was observed for the 14-day sampling periods during the dry season. If, however, the poorly sited reflector set S3 is excluded, an average loss of 22.6% is obtained.
It was found that the position of the reflector sets in relation to the plant area, together with the wind direction, determines

306 JUNE 2023 VOLUME 123 The Journal of the Southern African Institute of Mining and Metallurgy
Table II
Reflector set Averaged MDRL Score S2 0.0186 23 S1 0.0203 18 S4 0.0214 18 S3 0.0272 11
Figure 13 MDRL of the 60° elevation reflectors for all four sampling sets (S1 to S4), from 5 February - to 29 October 2020
Dependence of solar reflector soiling on location relative to a ferromanganese smelter

the intensity of soiling. A 44.8% difference in MDRL (mean daily reflectance loss) for the worst period (in terms of soiling) was observed for two reflector sets in different locations. It was also found that peak winds (> 6 m/s) can disproportionately impact where the most soiling occurs, even if these are not from the dominant wind direction. The peak soiling period coincided with the weakest winds, leading to the conclusion that ‘wind washing’ does help to limit soiling during dry dusty periods.
The dust characterization study revealed that 90% of the particles found on the reflector surfaces were smaller than 98 μm, with 50% less than 31.5 μm. The main dust elements were Si, Al, Fe, S, O, and Mn. The phases identified were SiO2, Fe2SiO4, Al2O3 SiO2, and Al9Fe2Si2, none of which are expected to have particularly
adverse effects on the reflectors’ useful lifetime. SEM micrography also revealed that the particle morphology is not particularly abrasive and the dust is therefore not expected to pose a serious risk of increased mechanical wear on a reflector surface when washing. The project did not last long enough to draw conclusion regarding reflector degradation resulting from the environment over lifetime use.
The results of the study point to a number of methods for preventing and mitigating solar reflector soiling. A minor difference in reflector location relative to the dust source resulted in a 13.1% lower soiling rate. At the reflector set with the lowest averaged MDRLduring the dry season, it is conceivable that by utilizing other well-known interventions such as anti-soiling coatings, an

307 The Journal of the Southern African Institute of Mining and Metallurgy VOLUME 123 JUNE 2023
Figure 15 Captured image data from the reflectometer for a reflector in S1 and S4, each for the dry and wet season
Figure 14 Relative contributions of different parts of the plamt to dust generation
Dependence of solar reflector soiling on location relative to a ferromanganese smelter
acceptable soiling rate coukd be achieved. It is recommended that any soiling mitigation technique, including choosing an appropriate location relative to source, should be optimized to have the greatest effect during the season when the most severe soiling is expected.
Acknowledgements
This paper is published by permission of the University of Pretoria, the University of Stellenbosch, Transalloys, and Mintek. This project has received funding from the European Union’s Horizon 2020 research and innovation programme under grant agreement no. 820561. The authors would like to thank the EU Horizon programme for its continued support of research and development projects working towards a sustainable future. Further gratitude is expressed to the CSIR for the use of their reflectometer, and to the Southern African Universities Radiometric Network (SAURAN) for providing research-quality meteorological data. Melanie Smit (Mintek) is also thanked for her contribution to the dispersed dust characterization work.
References
Bellmann, P.,Wolfertstetter, F., Conceiçāo, and Silva, H.G. 2020. Comparative modeling of optical soiling losses for CSP and PV energy systems. Solar Energy, vol. 197. pp. 229–237. doi: 10.1016/j.solener.2019.12.045
Bouaddi, S., Ihlal, A., and Fernández-García, A. 2017. Comparative analysis of soiling of CSP mirror materials in arid zones. Renewable Energy, vol. 101. pp. 437–449. doi: 10.1016/j.renene.2016.08.067
Brooks, M.J. du Clou, S., van Niekerk, W.L., Gauché, P., Leonard, C., Mouzouris, M.J., Meyer, R., van der Westhuizen, N., van Dyk, E.E., and Vorster, F.J. 2015. SAURAN: A new resource for solar radiometric data in Southern Africa. Journal of Energy in Southern Africa, vol. 26.pp. 2–10.
Costa, S.C.S., Diniz, A.S.A.C., and Kazmerski, L.L. 2016. Dust and soiling issues and impacts relating to solar energy systems: Literature review update for 20122015. Renewable and Sustainable Energy Reviews [preprint]. doi: 10.1016/j. rser.2016.04.059
Costa, S.C.S., Diniz, A.S.A.C., and Kazmerski, L.L. 2018. Solar energy dust and soiling R&D progress: Literature review update for 2016. Renewable and Sustainable Energy Reviews, vol. 82. pp. 2504–2536. doi:10.1016/j. rser.2017.09.015
Davourie, J., Westfall, L., Ali, M., and McGough, D. 2017. Evaluation of particulate matter emissions from manganese alloy production using life-cycle assessment. NeuroToxicology, vol. 58. pp. 180–186. doi: 10.1016/j. neuro.2016.09.015
Ebert, M., Amsbeck, L., Buck, R., Rheinländer, J., Schlögl-Knothe, B., Schmitz, S., Sibum, M., Stadler, H., and Uhlig, R. 2018. First on-sun tests of a centrifugal particle receiver system. Proceedings of the ASME 2018 12th International Conference on Energy Sustainability collocated with the ASME 2018 Power Conference and the ASME 2018 Nuclear Forum, Lake Buena Vista, FL.. American Society of Mechanical Engineers. p. V001T11A002. doi: 10.1115/ ES2018-7166
Fernández-García, A., Sutter, F., Martínez-Arcos, L., Sansom, C., Wolfertstetter, F, and Delord, C. 2017. Equipment and methods for measuring reflectance of concentrating solar reflector materials. Solar Energy Materials and Solar Cells, vol. 167. pp. 28–52. doi: 10.1016/J. SOLMAT.2017.03.036
Griffith, D.J., Vhengani, L., and Maliage, M. 2014. Measurements of mirror soiling at a candidate CSP Site. Energy Procedia, vol. 49. pp. 1371–1378. doi: 10.1016/j.egypro.2014.03.146
Hockaday, L., McKechnie, T., von Puttkamer, M.N., and Lubkoll, M. 2020. The impact of solar resource characteristics on solar thermal pre-heating of manganese ores. Proceedings of Energy Technology 2020: Recycling, Carbon Dioxide Management, and Other Technologies. Chen, X., Zhong, Y., Zhang, L.,
Howarter, J.A., Baba, A.A., Wang, C., Sun, Z., Zhang, M., Olivetti, E., Luo, A., and Powell, A. (eds). Springer, Cham. pp. 3–13. doi: 10.1007/978-3-030-368302_1
Hund, K. , la Porta, D., Fabregas, T.P., Laing, T., and Drexhage, J. 2020. Minerals for Climate Action: The Mineral Intensity of the Clean Energy Transition. World Bank, Washington.
IPCC. 2014. Contribution of Working Group III to the Fifth Assessment Report of the Intergovernmental Panel on Climate Change. Cambridge University Press. 1454 pp.
IRENA. 2021. Renewable Power Generation Costs in 2020. International Renewable Energy Agency, Abu Dhabi.
Kazmerski, L.L., Diniz, A.S.A.C., and Costa, S.C.S. 2020. Dust in the wind: An historical timeline of soiling R&D for solar technologies. Proceedings of the ISES Solar World Congress 2019 and IEA SHC International Conference on Solar Heating and Cooling for Buildings and Industry 2019. doi: 10.18086/ swc.2019.54.01
Lotter, M.C. 2010. MBSP Landcover 2010 [Vector] 2010. Mpumalanga Tourism and Parks Agency. http://bgis.sanbi.org/SpatialDataset (accessed 15 September 2020).
Mckechnie, T., McGregor, C., and Venter, G. 2020. Concentrating solar thermal process heat for manganese ferroalloy production: Plant modelling and thermal energy storage dispatch optimization. Proceedings of the ASME 2020 14th International Conference on Energy Sustainability. American Society of Mechanical Engineers. p. V001T14A001. doi: 10.1115/ES2020-1635
Mehos, M., Price, H., Cable, R., Keamey, D., Kelly, B., Kolb, G., and Morse, F. 2020. Concentrating solar power best practices study. Technical Report NREL/ TP-5500-75763. National Renewable Energy Laboratory. wahington. 269 pp. https://www.nrel.gov/docs/fy20osti/75763.pdf
Merrouni, A.A. , Mezrhab, A., Ghennioui, A., and Naimi, Z. 2017. Measurement, comparison and monitoring of solar mirror’s specular reflectivity using two different reflectometers. Energy Procedia, vol. 119. pp. 433–445. doi: 10.1016/J. EGYPRO.2017.07.045
Meyen, S., Monteccji, M., Kennedy, C., Zhu, G., Gray, M., Crawford, J., Jiemer, S., Platzer, W., Heimsath, A., O'Neill, M., Ziegler, S., Brändle, S., and Fernandez, A. 2018. Parameters and method to evaluate the solar reflectance properties of reflector materials for concentrating solar power technology. SolarPACES. https://www.solarpaces.org/wp-content/uploads/Document-1_ SolarPACES_Reflectance-Guideline_V3.1.pdf
Pennetta, S., Yu,S., Borghesani, P., Cholette, M., and Barry, J. 2016. An investigation on factors influencing dust accumulation on CSP mirrors. SOLARPACES 2015: Proceedings of the International Conference on Concentrating Solar Power and Chemical Energy Systems, Cape Town, South Africa. p. 070024. doi: 10.1063/1.4949171
Picotti, G., Moretti, L., Cholette, M.E., Binotti, M., Simonetti, R., Martelli, E., Steinberg, T.A., and Manzolini, G. 2020. Optimization of cleaning strategies for heliostat fields in solar tower plants. Solar Energy, vol. 204. pp. 501–514. doi: 10.1016/j.solener.2020.04.032
Reichart, M., Puttkamer, M.N., Buck, R., and Pitz-Paal, R. 2021. Numerical assessment of packing structures for gas-particle trickle flow heat exchanger for application in CSP plants. ASME 2021: Proceedings of the 15th International Conference on Energy Sustainability. American Society of Mechanical Engineers. https://doi.org/10.1115/ES2021-62746
Sambo, S.N., Hockaday, C.S.A., and Seodigeng, T. 2020. The development of a heat and mass transfer model for a shaft kiln to preheat manganese ore with hot air, model development methodology. Proceedings of the 11th International Symposium on High-Temperature Metallurgical Processing. Peng, Z., Hwang, J-Y., Downey, J.P., Gregurek, D., Zhao, B., Yücel, G., Keskinkilic, E., Jiang, T., White, J.F., and Mahmoud, M.M. (eds). Springer, Cham. pp. 43–53. doi: 10.1007/978-3-030-36540-0_5
Weiss, W. and Spörk-Dür, M. 2021. Solar Heat Worldwide - Edition 2021. AEEInstitute for Sustainable Technologies, Gleisdorf, Austria. u
308 JUNE 2023 VOLUME 123 The Journal of the Southern African Institute of Mining and Metallurgy
Predicting open stope performance at an octree resolution using multivariate models
B. McFadyen1, M. Grenon1, K. Woodward2, and Y. Potvin2
Affiliation:
1Université Laval, Département de génie des mines, de la métallurgie et des matériaux, Canada.
2Australian Centre for Geomechanics, The University of Western Australia, Australia.
Correspondence to: M. Grenon
Email: Martin.Grenon@gmn.ulaval.ca
Dates:
Received: 2 May 2023
Revised: 25 May 2023
Accepted: 21 Jun. 2023
Published: June 2023
How to cite:
McFadyen, B., Grenon, M., Woodward, K., and Potvin, Y. 2023
Predicting open stope performance at an octree resolution using multivariate models.
Journal of the Southern African Institute of Mining and Metallurgy, vol. 123, no. 6. pp. 309–320
DOI ID:
http://dx.doi.org/10.17159/24119717/2770/2023
ORCID:
M. Grenon
http://orcid.org/ 0000-0003-3919-9275
Synopsis
Open stoping has become a popular mining method in hard rock mines, not only due to the safety of the method as a non-entry approach, but also because of the high extraction rate and low costs. At mine sites, stope performance is evaluated by calculating stope overbreak using the stability chart. However, limitations of the stability chart regarding the precision of the predictions, nonconsideration of factors such as the influence of blasting, and the exclusion of underbreak have led to non-optimal designs. The capabilities of today's computers have increased the amount of data being collected and the power of models being built. This article presents a step towards a new stope design approach where stope overbreak and underbreak are measured and georeferenced using octrees at an approximately cubic metre resolution and predicted using multivariate statistical models (partial least square, linear discriminant analysis, and random forest). Results show that overbreak and underbreak location along the design surface and their magnitude are predicted with good precision using a random forest model. These predictions are used to build the expected geometry of the open stope. The resolution of the data and the use of multivariate analysis has enabled the prediction of variation in stope performance along the design surface, going well beyond the simple qualitative per stope face prediction provided by a traditional stability chart approach.
Keywords stope design, stope reconciliation, overbreak, underbreak, multivariate, prediction, random forest.
Introduction
When designing and mining an open stope, the goal is to create a final void geometry which is stable and closely matches the designed geometry. However, what commonly occurs when extracting open stopes is the unintentional mining of volumes of overbreak (OB; rock or backfill material mined outside of the design volume) and underbreak (UB; rock in the design volume left behind). This can have a strong operational and economic impact on the mine as it can cause stability issues which extend to the adjacent mining excavations, dilution of ore with waste material, the loss of ore reserves that are no longer recoverable, or problems at the mill which is optimized for expected grades and rock chemistry. Therefore, identifying the root cause factors of stope OB and UB enables the mine's engineers to understand stope performance. This knowledge is then used when designing open stopes to minimize stope OB and UB and to maximize the value realized from mining.
The stability chart is a popular predictive tool used in current stoping practices (Mathews et al., 1981; Potvin, 1988; Nickson, 1992). This chart is an empirical and bivariate tool that qualitatively predicts the stability of a stope face and assesses a stability number, which is calculated from the geomechanical properties of the rock mass and the hydraulic radius, which is derived from the planned geometry. Based on the results, a decision is made regarding stope dimensions or the need for ground support. Once mining has started, the use of the stability chart as an optimizing tool is limited as it does not quantify operational parameters that can be modified for optimizing stope performance, e.g. blasting parameters. The stability chart is not capable of assessing UB, which is largely controlled by operational parameters not considered by the method. Therefore, the use of the stability chart is best suited at the feasibility stage (or the life-of-mine stope planning step) when the approximate dimensions of the stopes and sequence need to be decided.
Site-specific tools can also be developed using their own reconciliation data. However, workshops conducted in Australia and Canada in 2019 highlighted that root cause analysis is done for OB at all participating mine sites, but only some mines do it for UB. Furthermore, they still use the stability chart developed over 40 years ago to assess stope stability and do not use any tools to predict UB (Potvin et al.,
309 The Journal of the Southern African Institute of Mining and Metallurgy VOLUME 123 JUNE 2023
Predicting open stope performance at an octree resolution using multivariate models
2020). Important parameters that have a major impact on the stope performance, such as faults, undercut, stand-up time, and blasting, are not considered in the standard stability chart (Clark and Pakalnis, 1997; Wang, 2004; Potvin et al., 2016; Guido, Grenon, and Germain, 2017; McFadyen, 2020). Despite the evolution of technology increasing the amount and type of data collected at mine sites and the computational methods for quantifying these parameters, these parameters are not currently used for prediction of stope performance.
The common mining practices described above highlight the need for developing a new stope design approach that incorporates the different parameters critical to stope OB and UB in order for mines to understand, predict, and optimize stope performance at the design stage. A novel approach to predict and optimize the outcome of a planned stope can be developed, thanks to a combination of increased computational capabilities, powerful multivariate statistical analysis (Guido and Grenon, 2018; McFadyen, 2020), and reconciliation tools at a significantly finer resolution (Woodward et al., 2019).
Building towards a new stope design methodology, this paper will show how multivariate statistics and data measured at an approximately cubic metre resolution (referred to here as octrees) is used to predict stope performance, giving information and knowledge at the design stage for the optimization of stope performance and mine planning. This approach presents many novelties due to the resolution of the analysis (per octree) and the wide range of parameters considered which are known to impact stope performance. Georeferenced points along the design surface are efficiently obtained with the octree data structure, providing much better predictions and spatial representation of stope OB and UB compared to a per-face prediction. This research represents a significant leap for the capability of mine sites to optimize stope performance at the design stage. The following work details the statistical analysis approach and presents the results of a case study.

Literature review
The stope design process can be divided into four main steps (Potvin et al., 2020):
➤ Life-of-mine stope planning
➤ Stope design
➤ Operation and execution
➤ Reconciliation.
Predicting stope performance is an empirical process that utilizes information gathered from the final reconciliation step to develop a tool that can be integrated into the first two steps of the design process. Stope reconciliation compares the design and mined geometry to quantify the OB and UB (Figure 1).
This step is typically done at two levels of resolution, on a per-stope and per-face basis. The total volume and percentage are quantified and, at a per-face resolution, the linear equivalent overbreak slough first introduced by Clark, 1998 (ELOS; Figure 2) and the linear equivalent loss ore (ELLO) are also quantified.

The mined surface is generated by a cavity monitoring system scan (CMS; Miller, Potvin, and Jacob, 1992). A CMS uses a laser rangefinder mounted on a head that tilts and rotates 360° to survey a cavity from one of the entry points. The scan generates a point cloud which can then be meshed for analysis. The resolution will depend on the density of points set by the surveyors. Multiple CMS scans can be done at different times to follow the evolution of the void. However, the CMS used for the reconciliation is the final scan done once mucking is finished. The accuracy is typically 2 cm, but
the scan can be affected by external factors such as fog, dust, ground support mesh, or irregular surfaces. These will cause shadowed areas for part of the stope, preventing adequate interpretation of the actual geometry. It is possible to get around these limitations by doing multiple scans from different entry points.
The predictive tools can be based on the mine's own data as mining progresses or on a stope database built from other mines that employ similar methods and have analogous conditions. The latter approach is comparable to the stability chart (Figure 3), which is the most widely used predictive tool at the life-of-mine stope planning step. The stability chart qualitatively estimates OB on a per-face basis. This tool is well adapted for this step

310 JUNE 2023 VOLUME 123 The Journal of the Southern African Institute of Mining and Metallurgy
Figure 1 Illustration of stope overbreak and underbreak with respect to an open stoping mining method (McFadyen et al., 2023)
Figure 2 Illustration of equivalent linear overbreak slough (ELOS) (modified by Potvin and Hadjigeorgiou, 2001 from Clark 1998)
Slough
Stope Width Strike Length Stope Height Cross-Sections Generated from CMS Survey Equivalent Linear Overbreak/Slough (Expressed in Meters) MODIFIED STABILITY GRAPH HYDRAULIC RADIUS (m) MODIFIED STABILITY NUMBER (N') 1000 100 10 1.0 0.1 0 5 10 15 20 25 STABLE ZONE CAVED ZONE Mined Design Underbreak Overbreak
Figure 3 Stability chart (from Nickson, 1992)
from Stope Walls Equivalent linear overbreak/Slough
Predicting open stope performance at an octree resolution using multivariate models
as no reconciliation data is available from the mine and only geomechanical and geometrical data are quantified. The stability chart is also commonly used at the stope design stage, although it does not offer possibilities for optimization.

As stope extraction progresses, data from the reconciliation of the mined stopes becomes increasingly available and can be used to develop a site-specific predictive tool. These tools use a statistical approach for a given resolution of reconciled data. Existing predictive tools generate predictions on a per-face basis, as this is the finest resolution being processed for most mines (Potvin et al., 2020). Mines generally predict an OB volume as the ELOS using parameters averaged over the whole face. They also tend to focus on specific faces such as the hangingwall (Potvin et al., 2020). UB tends to not be considered during these assessments. A new and finer detailed reconciliation process where data is reconciled on a per-octree basis allows for a more refined and complete prediction (Woodward et al., 2019).
Octrees represent georeferenced blocks which cover the design and mined three-dimensional (3D) space. A finer resolution of blocks is obtained along the design and mined surfaces by recursively subdividing the 3D space until the desired size or resolution of the octrees (usually ≤ 1 m) is obtained (Figure 4). The stope performance is quantified for each octree block on the design surface by calculating a projected distance, which is defined as the distance in the direction normal to the design between the design and mined surfaces. Positive values represent OB while negative values represent UB.

Different statistical methods exist for building a predictive model. The ability of a model to generate accurate predictions will depend on the type of data and its distribution, along with the relationship between the parameters. The statistical model can be obtained by using a supervised method, which means, in this specific case, the stope performance data is used for building the model. The method used to build the model can be linear, discriminant, tree-based, additive, or a neural network (Hastie et al., 2017). The model can also be obtained using an unsupervised method, meaning, in this specific case, the stope performance is not considered when building the model but can be used later to analyse the applicability of the model to distinguish stope performance. These methods are usually based on cluster analysis or principal component analysis (Hastie et al., 2017).
Current statistical approaches for predicting stope performance vary from a bivariate to a multivariate decision-making process. In all cases, a supervised method is used to calculate the predictions, but some do utilize concepts of unsupervised methods to create
the charts used for predictions. The stability chart is a bivariate approach, where the decision is made from two parameters (stability number and hydraulic radius). The different zones (stable, unstable, caving) can be separated using a discriminant method (Nickson, 1992). Mines can also create their own bivariate chart if the critical parameters are known and quantified. However, these tend to be limited in terms of predictive capabilities since there is most likely more than one critical parameter affecting stope performance. A multivariate approach is therefore the most suitable method for generating accurate predictions. Multiple linear regression (MLR; Wang, 2004; Hughes, 2011; Guido and Grenon, 2018) and principal component logistic regression (PCR; Guido and Grenon, 2018) were shown to improve the OB predictions accuracy over the stability chart on a per face basis. McFadyen (2020) has shown that a partial least square model (PLS) can be used to generate accurate predictions of OB in the hangingwall. Random forest (Breiman, 2001) was used by Qi et al. (2018) and an artificial neural network (McCulloch and Pitts, 1943) was used by Adoko et al (2022) to classify a face OB performance using geometrical and geomechanical parameters.
Methodology
This article proposes a new empirical stope design approach to help engineers with optimizing stope performance. This approach uses data at an octree resolution to understand (through multivariate statistical analysis) and predict (through a multivariate statistical model) stope performance at the mine site. The methodology for understanding and identifying the critical parameters using multivariate analysis is detailed in McFadyen et al. (2023). The critical parameters are used for predicting stope performance on a point basis, giving detailed and spatial information of the OB and UB. Furthermore, this allows for the generation of a predicted shape of the final void (referred to as 'predicted CMS' in this article). The acquired knowledge and predicted CMS can then be used during stope design for optimization and planning. This article details the prediction process from building to validating the models.
Octree data
The new stope design approach is based on data being quantified and reconciled at an octree resolution. Using this resolution means we are quantifying and predicting the spatial variation of the stope performance along the designed stope shape. Figure 5 gives an example of the spatial variation of stope performance captured using octrees. For this example, predicting on a per-face basis would give the thickness of OB and UB (ELOS and ELLO), but would
311 The Journal of the Southern African Institute of Mining and Metallurgy VOLUME 123 JUNE 2023
Figure 4 Illustration of the recursive process of octrees, as well as the octrees defined along the design surface and the stope performance quantified by calculating the distance in a direction normal to the design surface between the design surface and the CMS for each octree (modified from McFadyen et al., 2020)
3 2.5 2 1.5 1 0.5 0 -0.5 Projected distance Development surveys Mined Design Idealised Cross Section Octree Blocks Design Resolution Projected Distance
Figure 5 An example of how stope performance can spatially vary along a stope surface (McFadyen, Woodward, and Potvin, 2021)
Predicting open stope performance at an octree resolution using multivariate models
not allow identification of where the OB and UB would occur in the face, or the magnitude of OB or UB in specific locations. Using octrees, the stope performance is measured at thousands of georeferenced points, spatially capturing where OB and UB occur, as well as the spatial distribution of the parameters being analysed. We can therefore predict the magnitude of OB or UB in specific locations across the designed stope surface.
Another advantage of using data quantified at an octree resolution is that geometrical, geological, geomechanical, and operational parameters can be quantified, offering a wider range of parameters that can be considered than on a per-face basis. It also allows for optimization as operational parameters such as blasting can be integrated into the model.
Multivariate predictive model
Multivariate statistical models are used to generate the predictions. These models use multiple input parameters and previously mined stope data to predict the performance of the future stopes. While many different models exist, three models were tested and are discussed in this paper: PLS (Wold, 1966), linear discriminant analysis (LDA; Fisher, 1936), and random forest (Breiman, 2001). PLS is a linear approach that quantifies the covariance between the input parameters and stope OB and UB in order to make predictions. LDA is a discriminant approach that aims to correctly classify the octrees as OB or UB (for this paper) by finding the axis that best separates the two. Random forest is a tree-based method where multiple trees are generated to obtain a predictive value. These models were selected due to previous use and performance on a per-face basis (PLS: McFadyen, 2020, and LDA: Nickson, 1992) as well as the random forest model's ability to capture a complex data structure. The three models were developed through the free software environment R (R Core Team, 2021). PLS used the PLS package (Liland et al., 2020), LDA used the MASS package (Venables and Ripley, 2002), and random forest used the Ranger package (Wright and Ziegler, 2017).
Statistical evaluation of model performance
The data is separated chronologically into three groups to test the quality of the models during their construction. The first group represents the first 50% of the data, the second represents the following 25%, and the final group represents the final 25% of the data. This approach enables the user to train a model with the first group of data and then test the predictive performance on the second group, optimize the model variables and finally predict the third group of data. This allows verification of whether the model generates accurate predictions and determines which model is best suited for the data-set, all while minimizing overfitting by the model.
When evaluating the model's statistical predictive performance, there are two aspects to consider. First, is whether an octree is correctly predicted as OB or UB, and secondly, is the predicted distance close to the actual projected distance. Based on the model's performance, the parameters can be analysed to understand their relationship with OB and UB.
For the first case, the capacity of the model to correctly predict if OB or UB is generated at the octree's location is measured by using the confusion matrix presented in Table I. This table separates the data into four categories, allowing the user to evaluate the error rate for OB and UB.
Different performance metrics will be calculated, such as the accuracy (percentage of octrees correctly predicted), the precision
(percentage of overbroken octrees predicted as OB), the sensitivity (percentage of OB predictions that are correct), and the specificity (percentage of UB predictions that are correct). Each of these metrics evaluates a specific quality of the model. There is also the Matthews correlation coefficient (MCC; Matthews, 1975), which is a more complex metric but gives a global measure of the quality of the classifications, with 1 being perfect predictions, 0 being random, and -1 being all wrong predictions. Table II gives the equations for these metrics.
For the second case, the error of the prediction is measured by calculating the difference between the predicted value and the actual value of the projected distance for the octree. The overall root mean square error (RMSE) will be calculated from the predicted and observed distances as well as the distribution of the absolute value of the errors. This allows calculation of the percentage of octrees for which the predictions are within a certain distance. In the case of stope performance, six brackets have been established, as shown in Table III. These brackets have been determined using engineering judgement to characterize the spread in the accuracy.
It is also possible to evaluate the accuracy of the prediction by plotting the predictions versus the actual values for each octree. A perfect model would have the predictions follow a linear trend with all the points falling on a 45° line, meaning the predicted CMS would look exactly like the actual CMS. This rarely occurs due to the inherent uncertainty of measuring causative factors arising from the complexity of the underground geological and mining
Performance metric equations for evaluating the model's capacity to classify an octree as OB or UB. Refer to Table I for the acronyms Performance metric Equation Accuracy Precision


312 JUNE 2023 VOLUME 123 The Journal of the Southern African Institute of Mining and Metallurgy
Table I Confusion matrix for a threshold of 0 m projected distance Predicted underbreak Predicted overbreak (UB) (OB) Actual UB True UB (TUB) False OB (FOB) Actual OB False UB (FUB) True OB (TOB) TUB
= true underbreak, TOB = true overbreak, FUB = false underbreak, FOB = false overbreak Table II
MCC
Sensitivity Specificity
Predicting open stope performance at an octree resolution using multivariate models
Table III
Prediction error brackets for evaluating the model's statistical performance
the ore. Stope dimensions will vary depending on the area of the mine, but stopes are around 25 m high, between levels, and 15 m to 30 m long (Hassell et al., 2015). Stope widths vary between 2 m and 35 m depending on the orebody thickness. The orebody reaches a depth of approximately 1 km.

Data overview
environment where the variation in the geomechanical properties of the rock mass, as well as the variation between the mined and planned data, cannot be fully captured. Furthermore, blasting is not a precise cutting tool compared to a tunnel-boring machine, implying some uncertainty around the final excavation geometry. A linear regression fit will be passed through the data to visualize the general trend of the predictions. The coefficient of determination (R²) will also be calculated to analyse the statistical quality of the regression. While the slope for the best linear fit in the data may not match the slope of the linear fit for a perfect model, it does not mean the predictions cannot be used at the design stage. The predictions can still indicate where OB and UB will likely occur and the expected magnitude. The reduced statistical significance arises from the model not precisely estimating the magnitude of the expected OB and UB. A visual analysis should be done in the end by comparing the predictions with the actual stope OB and UB to evaluate the performance of the model as the statistical evaluation does not describe spatial performance.
Case study
The Dugald River Pb-Ag mine is located in Queensland, Australia (Figure 6). Longitudinal and transversal stopes are used to extract
This article focuses on 49 transversal stopes mined between 2017 and 2020 (Figure 7a). Each stope is reconciled on a per-stope, per-face, and per-octree basis. Drifts are cut out of the design and CMS geometry by site personnel during the building and processing of the geometries. For this reason, stope faces identified as drift surfaces (floors and crown mostly) are excluded from the analysis. Additionally, stope faces that are mined against backfill are excluded from analysis due to their vastly different strength and stress conditions. The 49 transversal stopes were separated into three groups chronologically. The first group contained 24 stopes, the second 13 stopes, and the last 12 stopes. The models were built using data from the first group, which consisted of 200 000

313 The Journal of the Southern African Institute of Mining and Metallurgy VOLUME 123 JUNE 2023
Error brackets % <0.5 m % <1 m % <2 m % >2 m % >3 m % >4 m
Figure 6 Location of Dugald River mine, Queensland, Australia
Figure 7 3D section view of the transversal stope database (a) and stopes part of group 3 used for predicting and testing the models (b)
Predicting open stope performance at an octree resolution using multivariate models
points, representing half the database. Since the final testing of the model was done with the final group, the results for group 3 will be presented (Figure 7b).
The parameters included in the analysis are presented in Table IV. These parameters correspond to the critical parameters idwentified in McFadyen et al., 2023 while assessing stope performance. Absent data occurs for the structural parameters since not all stopes have a fault in their vicinity. A maximum of 30 m between the fault and octrees is used in order to compute the distance and angle to fault. This distance was set based on the work by Woodward et al., (2019). For octrees with absent fault data a value must be given to include these octrees in the model since the model does not tolerate absent data. An arbitrary choice of a distance of 40 m is set and an angle of 100° in order to separate them from the octrees with fault data and keep them in the model.
Results
The overall statistical performance of the three predictive models is presented in Table V. Comparing the models, the random forest model performs better than the LDA and PLS based on the capacity to correctly predict octrees as OB and UB (67%) and the prediction error. It has a higher MCC (0.3) and a higher portion of octrees with a prediction error smaller than 0.5 m (39%) and 1 m (65%). Based on these statistical metrics, the random forest model performs well at predicting where OB and UB will occur as well as its magnitude, and would bring beneficial insight to the engineers.
After evaluating the statistical performance of the model, the predictions and the observations were visually compared in 3D space on the design surfaces. This innovative method predicts the detailed geometry of the expected void and allows for comparison of the spatial variation of the predictions to the actual CMS geometry. This is important as it will enable local verification of whether the predicted OB or UB matches the stope OB and UB. It also allows verification if the predictions would help the engineers in their decision-making since the prediction location is not considered in the statistical verification of the model's performance. Overall, with the PLS model, around 50% of the faces predicted would lead the engineer to the right interpretation of the location of OB and UB in the face based on the visual comparison of the predictions with the observed projected distance (location and magnitude of OB and UB). Good and bad prediction examples will be provided
Table IV
Critical parameters as established in McFadyen et al., 2023
Table V
Summary of the performance metrics for the different models
later in this paper. Similar to the PLS method, around 50% of the faces predicted with the LDA model would lead the engineer to the right interpretation of the location of OB and UB in the face. This assessment is based on a side-by-side visual comparison of the predictions with the observed projected distance for each face. These results indicate little benefit of the PLS and LDA models in stope design as the results are as likely to be wrong as right. For the random forest, around 75% of the faces predicted would lead the engineer to the right interpretation of the location of OB and UB in the face based on the visual comparison. The success rate of the random forest model indicates that stope OB and UB are predicted at an octree resolution using a more complex statistical model with good confidence. Given the superiority of the random forest model at predicting stope performance, the following section will further explore the results of the model in order to give visual examples and discuss the accuracy, probabilities, and limitations of the approach.
Random forest
Predictions from the random forest model represent the average prediction of all trees in the model (Figure 8). The model performance is optimized for a given data-set by varying the number of trees generated, the number of parameters randomly picked at each node (from which, based on a specified criterion, the parameter that maximizes the separation of the stope performance is then selected for that node), and the weight of octrees with a
Categories Parameters Unit Description
Geometrical Equivalent radius factor (ERF)
Two-dimensional measure of the hydraulic radius Dip ° Dip of the design face at the octree location
Direction ° Direction of the design face at the octree location
Undercut m Measure of stope undercut by drifts using a convex hull that includes the drifts
Geological Distance to fault m Distance between the octree and the nearest fault Angle to fault
Fault directional measure
Angle between the octree and the nearest fault
° Angle function of the position and distance to the nearest fault
Operational Blasting energy proxy - Energy estimated from the drill design
Blasting orientation
Drift directional measure
° Angle between the octree and the nearest drill hole
° Angle function of the position and distance to the nearest drift
Spatial Dissimilarity – Characterization of the similarity between the octree's parameters for the adjacent octrees
Performance Projected distance sm Distance between the octree and the CMS in a normal direction to the design
314 JUNE 2023 VOLUME 123 The Journal of the Southern African Institute of Mining and Metallurgy
–
°
metrics Random forest LDA PLS Accuracy 67% 66% 65% Precision 63% 53% 56% Sensitivity 57% 57% 50% Specificity 70% 74% 70% MCC 0.3 0.27 0.25 % < 0.5 m 39% - 34% % < 1 m 65% - 60% % < 2 m 88% - 86% % > 2 m 12% - 14% % > 3 m 3% - 3% % >4 m 0.75% - 0.4% RMSE 1.26 - 1.31
Performance
Predicting open stope performance at an octree resolution using multivariate models
large predicted distance (over 2 m OB or UB) when randomly picking the octrees used for each tree due to the lower frequency of these distances. Preliminary testing of these three variables was done using the second group of stopes to obtain the most accurate predictions possible with this method. Based on the preliminary testing, the model is built using 500 trees, randomly picking two parameters at each node and assigning a 3:1 weight ratio to the larger projected distances to ensure an accurate representation. This model was used for the prediction of the stopes in group 3 and to evaluate its performance.

Statistical performance overview
The predictions generated for group 3 are plotted against the observations in Figure 9. The points have been coloured according to their confusion matrix classification. Linear regressions have been overlaid, with the blue line representing the ideal linear fit for predictions and the red line representing the best linear fit that is obtained from the predictions. The linear regressions help show that the data does have a linear trend, but the slope is smaller than what is desired.
The statistical metrics presented in Table V indicates the octrees were correctly predicted as OB or UB 67% of the time. This means 67% of the design surface would be accurately depicted as OB or UB. The MCC value is 0.3, meaning the classification is not perfect (MCC = 1), but is not random either (MCC = 0), indicating the selected parameters are critical for determining where OB and UB will occur and the model allows the user to make the distinction between the two. The model performs better at predicting if an octree is underbroken (70%) compared to overbroken (57%). The RMSE is 1.26, meaning the average error is around 1.26 m. The distribution of the prediction error indicates that just under 40% of the octrees are predicted within 0,5 m of the actual projected distance, 65% under 1 m, and 88% under 2 m. Given that the median is under 1 m error, the higher average error is due to localized areas of the stope where OB or UB is underpredicted.
Also, given the prediction error distribution, when looking at the predicted stope surface it can be assumed that most of the surface is within 1 m of its actual position and the majority within 2 m. Knowing that the stope performance has a range of 10 m (projected distance between –4 m and 6 m), the model allows the expected value range to be decreased to 1 to 2 m much of the time and up to 4 m for the majority of instances. The practical outcomes of these projected distances for a 25 × 20 × 20 m stope with a 0.5 m error across the whole stope would represent 1250 m³ error on the final volume (or 12.5%), while a 2 m error would represent 5000 m³ error on the final volume (or 50%). This volume is, however, separated between OB and UB. Overall, the random forest model with the selected critical parameters at an octree resolution has enabled us to determine where OB and UB will occur for the majority of the surface, as well as the projected distance within 1 m in many cases, and 2 m for the majority. These are considered significant contributions to prediction of stope performance, as the following visual example and probabilities will show.
Visual example
To better visualize the quality and accuracy of the predictions, a stope example (stope A) is presented for which the predictions match the statistical results presented in Table V and discussed in the previous section. Figure 10 presents two views of stope A, showing the actual values, the predictions, and the prediction error side-by-side. The visual example shows that the statistical accuracy of the model allows visual depiction of where OB and UB will occur and in the most part, the magnitude. The following conclusions are drawn from this figure.

➤ The model predicts that the bottom of the hangingwall will be underbroken and the top part overbroken. The sidewall will be overbroken for the most part. The bottom of the footwall will be overbroken and the top part underbroken. UB will be observed in most of the corners.
➤ When compared with the actual CMS, we observe a similar trend overall, predicting OB where there will be OB and UB where there will be UB.
➤ The main difference between the predictions and the actual values is in the prediction of large magnitudes of OB and UB (over 2 m or under 1 m). As we can see from the prediction error (areas with errors over 2 m), the predictions underpredict the OB or UB.
➤ These discrepencies occur, for the most part, towards the side of the stope that is against backfill, which is not taken into account in the model. The probabilities discussed in the next sections will provide further information.

Model accuracy
The overall accuracy of the model indicated in Table V and the visual analysis indicate reliable results can be obtained for predicting
315 The Journal of the Southern African Institute of Mining and Metallurgy VOLUME 123 JUNE 2023
Figure 8 Random forest diagram for generating a prediction
Critical variables influencing performance Predicted performance per octree R1 R2 Rn Best linear fit Ideal linear fit True OB True UB False OB False UB 5 0 -5 -5 0 5 Observations (m)
Figure 9 Predictions versus observations for the random forest model. The points are coloured according to their confusion matrix classification. The ideal and best linear fit of the data are overlaid
Predicting open stope performance at an octree resolution using multivariate models
stope performance through a random forest model using the critical parameters identified at the mine site. Further analysis indicates that the accuracy of the model will vary depending on the observed projected distance. Figure 11 shows that the majority of octrees with a projected distance between –2 m and 2 m have smaller errors than larger distances. This is due in part to the fact that there are fewer octrees with a projected distance over 2 m and under –2 m. Since the predictions from random forest are the result of averaging, they are less sensitive to extreme values and can underpredict the larger projected distances. However, for each prediction, the standard error is calculated as the standard deviation of the predictions based on the prediction of each tree. A probabilistic approach is therefore used to assess larger OB and UB.


Probabilistic approach
From the standard error and predicted value, the probability density function (PDF) is obtained as well as the probability density curve. A normal distribution is assumed in this case. Using the PDF, we calculate the probability of observing a given value or the probability that an octree's projected distance will be larger or smaller than a specified distance. We also calculate a prediction interval within which the projected distance of the predicted octree is most likely to be for a given level of confidence. This means that for a level of 95% (calculated using the standard score), there is a 95% probability that the actual projected distance will be within the interval based on the model and selected observations.
Figure 12 shows the observed projected distance and the 60% prediction interval. The upper bound represents a probability that 80% of the projected distance will be smaller than this value and the lower bound represents a probability that 80% of the projected distance will be larger. These limits highlight the possibilities of large OB and UB. The projected distance of 63% of the octrees falls within the maximum and minimum projected distance values of the 60% prediction interval. Large OB can be expected in the hangingwall and UB in the bottom of the hangingwall and top of the footwall. Octrees that fall within the interval are also highlighted. In addition to the observations made in Figure 8,
the probabilistic approach allows the user to determine that the hangingwall will likely see OB over 2 m, the top of the footwall ,UB over 2 m and the top of the bottom drive in the sidewall will see OB over 1.5 m. Since the location is not considered in the model, adjacent octrees can show a different prediction interval. In such cases, engineering judgement should be used for interpreting these predicted distances.
Given the standard error of the predicted octree, the probability of observing the predicted value will vary (the probability decreases as the standard error increases) and reflects the level of confidence we can attribute to the prediction. Figure 13 shows the binned cumulative probability of the predicted projected distances versus the prediction error. The prediction error increases when the probability of observing the predicted distance decreases, indicating the model's confidence in the prediction (higher probability), reflects the accuracy that can be expected based on the probability of the prediction. Small probabilities (larger standard error) for octrees are observed when some of the trees in the model will predict a wide range of projected distance. This would mean large and small OB or UB has been observed previously for octrees with similar parametric values, and therefore the probability of large
316 JUNE 2023 VOLUME 123 The Journal of the Southern African Institute of Mining and Metallurgy
Figure 10 Stope A observed projected distances of the octrees on the left, the predicted distances in the middle, and the absolute prediction error on the right, from the random forest model. The face with no octree (dark green) is a backfill face
Observed Projected distance Prediction error Hangingwall - side wall view Footwall view 2,4 2,2 2 1,8 1,6 1,4 1,2 1 0,8 0,6 0,4 0,2 0 -0,2 -0,4 -0,6 -0,8 -1 2,4 2,2 1,8 1,6 1,4 1,2 1 0,8 0,6 0,4 Predicted Predicted error 2 0,2 -4 -2 0 2 4 6 0 1 2 3 4 5 6 7 Projected distance (m) Prediction absolute error (m)
Figure 11 Prediction absolute error versus the projected distance for the random forest model
Predicting open stope performance at an octree resolution using multivariate models
OB or UB is higher for these octrees and hence the standard error is larger. The probability groups merge into one line for prediction errors over 4 m. These errors are associated with octrees with large OB and UB distances and can be due in part to the model averaging; and also to the fact that the selected parameters do not fully capture the cause for these large OB and UB distances and that some critical parameters do not match the reality or are missing.
There are, however, some octrees for which the model would be misleading as the probability of the prediction is high (over 0.4, indicating a small standard error, usually under 2 m), but for which the prediction error is large (error over 2 m). These octrees were plotted in a 3D view to identify the causes for the model's inaccuracy. Two observations were made. First, some of these octrees are randomly distributed and isolated, meaning the


surrounding octrees were well predicted. These octrees would have limited effects on the visual interpretation of the predictions. Second, some of these octrees are grouped in clusters, meaning an area of a stope is not well predicted. From a visual analysis, these clusters are located in parts of the stopes that behaved abnormally. In the Figure 14. example, the large UB seems to be a muckpile left in the stope and therefore reflects the quality of the data and not the model.
Limitations
The quality of the predictions can vary from stope to stope and is attributed to the data quality, such as fault position being wrong or the OB and UB being controlled by different parameters than those that the model considers as critical. Sometimes an individual wall is not well predicted but the rest of the stope is. Figure 15 gives an example of inaccurate predictions where OB is expected for an UB region and vice-versa. The probabilities also failed to highlight the possibility of large OB in the footwall. From discussions with mine personnel, OB was expected due to the presence of a nearby fault in the hangingwall. Poor ground conditions were expected, which would have caused the rock to break towards the fault. The different outcome indicates information about the fault and its influence was inaccurate in this instance, which can occur because part of the structural model is inferred. The random forest does, however, perform better than the PLS and LDA model for this example.
317 The Journal of the Southern African Institute of Mining and Metallurgy VOLUME 123 JUNE 2023
Figure 12 Observed projected distances for the octrees, the lower and upper bound of a 60% prediction interval calculated from the random forest model, and the octrees identified in or out of the prediction interval. The face with no octree is a backfill face
Figure 13 The probability of the predicted projected distances versus the prediction error for the predicted octrees using the random forest mode
Observed Projected distance Lower bound Upper bound Probability Octree within interval Within Iinterval Out Hangingwall - side wall view Footwall view 2,4 2,2 2 1,8 1,6 1,4 1,2 1 0,8 0,6 0,4 0,2 0 -0,2 -0,4 -0,6 -0,8 -1 2,5 2 1,5 1 0,5 0 -0,5 -1 -1,5 -2 Binned probability of the predicted projected distance 0.45 0,4 0,35 0,3 0,25 0,2 0,15 0,1 0,05 1 0,8 0,6 0,4 0,2 Cumulative distribution of the probabilities Absolute prediction error (m) 1 2 3 4 5 6 CMS Design Drives
Figure 14 Example of a cluster of octrees with large PDF values (over 0.4) and large prediction errors (over 2 m)
Predicting open stope performance at an octree resolution using multivariate models
Table VI
Parameters ordered by importance in the partial least square (PLS) and random forest models
PLS Randon Forest
Blasting energy proxy Dip
ERF Blasting energy proxy
Undercut Direction
Parameters' Directional measure fault Undercut importance Angle to fault Borehole orientation in the model
Direction Distance to fault
Dissimilarity
Directional meaure development
Borehole orientation ERF
Distance to fault Directional measure fault
Dip Angle to fault
Directional measure
Dissimilarity development
face with no octree is a backfill face
Discussion
The new proposed design approach enables the prediction of stope performance at an octree level. This means the location and magnitude of OB and UB are predicted, allowing the user to visualize the expected CMS in 3D and calculate volumes of OB and UB from it. This is a step change from current practice, which can only predict performance at individual stope surface scale without identifying the location of OB, while UB is ignored. Three separate multivariate statistical models were tested for predicting the projected distance of OB and UB. When choosing the best model, three criteria need to be considered: the classification of the octrees as OB or UB, the prediction error (how close is the prediction to the actual measure) and how the predictions compare to the actual CMS in a 3D view. It is important to validate the last criterion if the model is used in the stope design process to provide accurate information for engineers to make decisions.

The accuracy of each model at classifying the octrees is similar. The random forest model performs better than the other two models when looking at the statistical metrics (Table V). For the three cases, the model performed better at classifying UB than OB. Similar statistical trends were observed for the three models, but the random forest model performed better statistically and visually. The PLS model would lead the engineer to the right assessment 50% of the time compared to 75% of the time for the random forest when analysing stope face performance, which indicates a high success rate for the random forest model. The model would bring valuable insight to the engineers during the design, unlike anything before.
The PLS and random forest models take two different approaches to predicting stope performance. While PLS is a linear
approach, random forest is a nonlinear approach and is better adapted for the complex interaction between blasting, the rock mass properties, the stope geometry, and stope performance. This is seen by the parameters' importance in the models (Table VI), which change according to the predictive model. The PLS model assigns more importance to the equivalent radius factor (ERF) parameter and this is seen in the predictions as the projected distance increases towards the middle of the faces. For the random forest model, the stope geometry and orientation are important parameters for making a prediction. Since the model generates useful predictions, the parameters' importance is used to interpret, to a certain degree, which parameters seem to influence the stope performance more. In this case, the blasting energy proxy, the stope geometry and orientation, and how the drifts cut the stope faces are probably the most important parameters for determining the stope performance, followed by the presence of faults.
Table VII presents the random forest model's performance at correctly classifying OB and UB according to the rounded projected distance. This allows the comparison of the model's OB and UB classification performance according to the projected distance that was measured with the post-mining CMS. The distance was rounded to the lowest unit, creating 10 classes. The model is less accurate in classifying octrees with small OB (0 to 1 m) as OB (61%) but performs very well for classifying octrees with a larger projected distance of OB or UB (over 80%).
This indicates that the locations where large OB and UB occur have certain characteristics quantified by the parameters that indicate that OB and UB will occur in these locations and will reliably identify these octrees as OB or UB. Therefore, given the selection of parameters used, critical portions of the stope are efficiently classified as OB or UB. These locations are key for optimizing the design. These numbers also reflect the quality parameters selected.
In addition, probabilities are generated for the predictions with random forest which enables the user to develop a probabilistic approach to stope design. This means different geometry of the mined shape can be built. The engineer can build a mean and worst-case geometry for assessing the expected stope performance. Therefore, the random forest model is the recommended statistical multivariate model for generating predictions based on the models presented in this paper.
318 JUNE 2023 VOLUME 123 The Journal of the Southern African Institute of Mining and Metallurgy
Figure 15 An example where the predictions were not accurate with the random forest model. The observed and predicted projected distances are seen at the top with the absolute prediction error and the lower and upper bounds of the 60% prediction interval at the bottom, with the octrees identified in or out of the reliability interval. Pale blue octrees on the crest of the hangingwall have a distance of 0 m and were not part of the predictions. The
Observed Projected distance Hangingwall view Footwallside wall view 2,4 2,2 2 2,2 2 1,8 1,6 1,4 1,2 1 0,8 0,6 0 -0,2 -0,4 -0,6 -0,8 -1 2,4 2,2 1,8 1,6 1,4 1,2 1 0,8 0,6 0,4 Predicted Predicted error 2 0,2 Predicted error 0,4 0,2 Lower bound Upper bound Octree within interval Probability Within interval Out 2,5 2 1,5 1 0,5 0 -0,5 -1 -1,5 -2
Predicting open stope performance at an octree resolution using multivariate models
Table VII
Random forest model performance at correctly predicting OB and UB grouped per projected distance
correctly predicted as
incorrectly predicted
Testing of the random forest model showed that the predictions are quickly generated (less than five minutes). The process can be interactive, where the engineer generates a prediction and, based on the results, modifies certain parameters to optimize stope performance and obtain a new set of predictions. This can be done for one stope or multiple stopes at once if a certain area or period of mining needs to be analysed. The predictive model is flexible and can be generated for different sectors, types of stope, and be updated over time. Stopes can be added to the model or removed if they are outdated, making sure the stopes in the model are relevant to the stopes being predicted.
This new stope design approach started with collecting mine site data and quantifying parameters at an octree resolution. Through multivariate analysis, an accurate understanding of the stope performance was established and the critical parameters were identified (McFadyen et al., 2023). Stope performance was predicted at an octree's resolution, as demonstrated in this paper, using a multivariate model. The good quality results of this first attempt at a complete prediction of the stope geometry using a random forest predictive model show the power and possibilities of using multivariate analysis to predict stope performance and spatially visualize what the CMS shape could look like. The standard error is used to create probability shells. As further work is done to refine and define input parameters at an octree resolution, the model can be refined, improving the predictions of the stope geometry.
The predictions could be implemented at the two main stages in the stope design process. There is the long-term design where the design geometry is established and the short-term design, closer to the mining date, where the operational parameters such as the drill rings are established. The selected parameters for the model would vary.
Summary and conclusion
Multivariate statistical models were built using parameters quantified at an octree resolution to predict stope performance; more precisely, predicting the location and magnitude of overbreak (OB) and underbreak (UB) at each point along the design surface. This novel approach significantly increases the capability of mine sites to optimize stope performance at the design stage due to the resolution of the analysis (per octree) and the wide range of parameters considered which are known to impact stope performance. Of the three tested statistical models (PLS, LDA,
and random forest), the random forest approach was the most suitable for predicting stope performance at an octree resolution, correctly classifying octrees as OB or UB 67% of the time with the predictions being 65% of the time within 1 m of the actual surface in that location. From the 3D view analysis, 75% of the stope faces (hangingwall, footwall, sidewalls and, crown) that were predicted would have led an engineer to an accurate expectation of the face OB and UB in terms of location and magnitude. These predicted results can be included in the stope design step for optimizing stope performance.
This methodology results in an accurate and site-specific predictive model which is available at the stope design stage. The multivariate approach enables the user to consider multiple critical parameters and their complex relationship to understand the effect on OB and UB locally, and to predict stope performance and CMS shape. This empirical approach is easily applied at any mine site, allowing a complete and good quality database of the sites' stopes to be built at the same time, making it quick and easy to predict stope performance by simply importing a design geometry or drill-ring design and running the model.
Acknowledgement
The authors thank the sponsors for permission to use their data in this paper. This research would not be possible without the six industry sponsors of the project, the Minerals Research Institute of Western Australia (MRIWA), and the ongoing collaboration from mine site personnel. The sponsors were: BHP (Olympic Dam), Glencore (Mount Isa), IAMGOLD Corporation (Westwood), MMG Limited (Dugald River), OZ Minerals (Prominent Hill), and Newmont (Tanami). We gratefully acknowledge both corporate and individual support.
References
Adoko, A.C., Saadaari, F., Mireku-Gyimah, D., and Imashev, A. 2022. A feasibility study on the implementation of neural network classifiers for open stope design. Geotechnical and Geological Engineering, vol. 40. pp. 677–696. https://doi.org/10.1007/s10706-021-01915-8
Breiman, L. 2001. Random forest. Machine Learning, vol. 45. pp. 5–32. https://doi. org/10.1023/A:1010933404324
Clark, L. 1998. Minimizing dilution in open stope mining with a focus on stope design and narrow vein longhole blasting. Master's thesis, University of British Columbia, Vancouver. 357 pp. https://open.library.ubc.ca/soa/cIRcle/ collections/ubctheses/831/items/1.0081111
319 The Journal of the Southern African Institute of Mining and Metallurgy VOLUME 123 JUNE 2023
Projected distance Number of octrees in Percentage
Percentage
class (m) the class OB or US (%) as OB or UB (%) –5 237 81 18 –4 233 69 31 –3 496 66 34 –2 859 77 23 –1 1958 73 27 0 1569 61 39 1 451 70 30 2 608 89 11 3 221 89 11 4 1 100 0
Predicting open stope performance at an octree resolution using multivariate models
Clark, L. and Pakalnis, R. 1997. An empirical design approach for estimating unplanned dilution from open stope hangingwalls and footwalls. Proceedings of the 99th CIM-AGM, Vancouve. CIM, Montreal.
Fisher, R.A. 1936. The use of multiple measurements in taxonomic problems. Annals of Eugenics, vol. 7, no. 2. pp. 179–188. https://doi. org/10.1111/j.1469-1809.1936.tb02137.x
Guido, S. and Grenon, M. 2018. Contributions to geomechanical stope optimization at the Goldcorp Eleonore Mine using statistical analysis. Proceedings of the 10th Asian Rock Mechanics Symposium. Singapore. Society for Rock Mechanics & Engineering Geology, Singapore. 12 pp.
Guido, S., Grenon, M., and Germain, P. 2017. Stope performance assessment at the Goldcorp Eleonoe mine using bivariate analysis. Proceedings of AfriRock 2017: Rock Mechanics for Africa, Cape Town. International Society of Rock Mechanics. pp. 1107–1124.
Hassell, R., Villaescusa, E., de Vries, R., and Player, J.R. 2015. Stope blast vibration analysis at Dugald River underground mine. Proceedings of the 11th International Symposium on Rock Fragmentation by Blasting, Sydney. Australasian Institute of Mining and Metallurgy, Melbourne. 16 pp.
Hastie, T., Tibshirani, R., and Friedman, J. 2017. The Elements of Statistical Learning: Data Mining, Inference, and Prediction. 2nd edn. Springer, New York. 764 pp. https://doi.org/10.1007/978-0-387-84858-7
Hughes, R. 2011. Factors influencing overbreak in narrow vein longitudinal retreat mining. Master's thesis, McGill University. 143 pp.
Liland, K.H., Mevik, B.-H., Wehrens, R., and Hiemstra, P. 2020. pls: Partial Least Squares and Principal Component Regression. R package version 2.7-3. The Comprehensive R Archive Network. https://cran.r-project.org/
Mathews, K.E., Hoek, E., Wyllie, D.C., and Stewart, S.B.V. 1981. Prediction of stable excavation spans for mining at depth below 1,000 m in hard rock mines. Report 802-1571. CANMET. Ottawa, Canada.
Matthews, B.W. 1975. Comparison of the predicted and observed secondary structure of t4 phage lysozyme. Biochimica et Biophysica Acta—Protein Structure, vol. 405, no. 2, pp. 442–451.
McCulloch, W.S. and Pitts, W. 1943. A logical calculus of ideas immanent in nervous activity. Bulletin of Mathematical Biophysics, vol. 5, pp. 115–133. https:// doi.org/10.1007/BF02478259
McFadyen, B. 2020. Détermination de facteurs contrôlant la stabilité des chantiers souterrains pour une mine sujette à la sismicité. Master's thesis, Université Laval, Canada. 146 pp. https://corpus.ulaval.ca/entities/publication/5b4c3a9b9179-4821-ae3b-3939c84c233e
McFadyen, B., Woodward, K R , Potvin, Y., and Grenon, M. 2020. A new stope reconciliation approach. UMT 2020: Proceedings of the Second International Conference on Underground Mining Technology. Wesseloo, J. (ed.). Australasian Institute of Mining and Metallurgy, Melbourne. pp. 335–350. https://doi. org/10.36487/ACG_repo/2035_17
McFadyen, B., Woodward, K., and Potvin, Y. 2021. Open stope design; beyond the Stability Graph. Proceedings of the Underground Operators Conference 2021 Australasian Institute of Mining and Metallurgy, Melbourne. 13 pp.
McFadyen, B., Grenon, M., Woodward, K., and Potvin, Y. 2023. Assessing stope performance using georeferenced octrees and multivariate analysis. Mining Technology, vol. 132, no. 2. pp. 132–152. https://doi.org/10.1080/25726668.202 3.2205080
Miller, F., Potvin, Y., and Jacob, D. 1992. Laser measurement of open stope dilution. CIM Bulletin, vol. 85. pp. 96–102.
Nickson, S.D. 1992. Cable support guidelines for underground hard rock mine operations. Master's thesis. University of British Columbia. 223 pp. https:// open.library.ubc.ca/media/stream/pdf/831/1.0081080/2
Potvin, Y. 1988. Empirical open stope design in Canada. PhD thesis, University of British Columbia. 372 pp. https://open.library.ubc.ca/soa/cIRcle/collections/ ubctheses/831/items/1.0081130
Potvin, Y., Grant, D., Mungur, G., Wesseloo, J., and Kim, Y. 2016. Practical stope reconciliation in large-scale operations Part 2, Olympic Dam, South Australia. Proceedings of the Seventh International Conference & Exhibition on Mass Mining, Sydney. Australasian Institute of Mining and Metallurgy, Melbourne. pp. 501-509.
Potvin, Y. and Hadjigeorgiou, J. 2001. The stability graph method for openstope design. Underground Mining Methods, Engineering Fundamentals and International Case Studies. Hustrulid, W.A. and Bullock, R.L. (eds). Society for Mining, Metallurgy & Exploration, Littleton, CO. pp. 513–520
Potvin, Y., Woodward, K., McFadyen, B., Thin, I., and Grant, D. 2020. Benchmarking of stope design and reconciliation practices. UMT 2020: Proceedings of the Second International Conference on Underground Mining Technology, Australian Centre for Geomechanics, Perth. Wesseloo, J. (ed.). Australasian Institute of Mining and Metallurgy, Melbourne. pp. 299–308, https://doi.org/10.36487/ACG_repo/2035_14
Qi, C., Fourie, A., Du, X., and Tang, X. 2018. Prediction of open stope hangingwall stability using random forests. Natural Hazards, vol. 92. pp. 1179–1197. https:// doi.org/10.1007/s11069-018-3246-7
R Core Team. 2021. R: A language and environment for statistical computing. Astria: R Foundation for Statistical Computing, Vienna. https://www.R-project. org/
Venables, W.N. and Ripley, B.D. 2002. Modern Applied Statistics with S. 4th edn. Springer, New York. 498 pp. https://doi.org/10.1007/978-0-387-21706-2
Wang, J. 2004. Influence of stress, undercutting, blasting and time on open stope stability and dilution. PhD thesis, University of Saskatchewan. 303 pp. https:// harvest.usask.ca/handle/10388/etd-11032004-094152
Wold, H. 1966. Estimation of principal components and related models by iterative least squares. Multivariate Analysis. Krishnajah, P.R. (ed.). Academic Press, New York. pp. 391–420.
Woodward, K., McFadyen, B., Potvin, Y., and Wesseloo, J. 2019. Probabilistic stope design. MRIWA Project no. M489. Australian Centre for Geomechanics. Perth. 50 pp.
Wright, M.N. and Ziegler, A. 2017. ranger: A fast implementation of random forests for high dimensional data in C++ and R. Journal of Statistical Software, vol. 77, no. 1. pp. 1–17. https://doi.org/10.18637/jss.v077.i01 u
320 JUNE 2023 VOLUME 123 The Journal of the Southern African Institute of Mining and Metallurgy
Spontaneous combustion of carbonaceous shale at an iron ore mine, South Africa
C. Gous and B. Genc
Affiliation:
1School of Mining Engineering, University of the Witwatersrand, South Africa.
Correspondence to: B. Genc
Email: bekir.genc@wits.ac.za
Dates:
Received: 12 May 2023
Revised: 22 May 2023
Accepted: 12 Jun. 2023
Published: June 2023
How to cite:
Gous, C. and Genc, B. 2023
Spontaneous combustion of carbonaceous shale at an iron ore mine, South Africa.
Journal of the Southern African Institute of Mining and Metallurgy, vol. 123, no. 6. pp. 321–328
DOI ID: http://dx.doi.org/10.17159/24119717/2806/2023
ORCID: B. Genc http://orcid.org/ 0000-0002-3943-5103
Synopsis
Spontaneous combustion during coal mining operations is a major problem that affects the health and safety of workers and causes environmental problems. The phenomenon is associated with the presence of coal, coal shale, and pyrite. In 2020, a premature detonation incident occurred at an iron ore mine where the waste material contains black carbonaceous shale units known to be associated with pyrite. The spontaneous combustion propensity and properties of samples of the black carbonaceous shales from the mine were examined and compared with samples from the Witbank Coalfield. The spontaneous combustion liability indexes of these samples were correlated with X-ray fluorescence (XRF) and proximate and ultimate analyses using linear regression. The Wits-Ehac Index classification results show that the samples were between medium and high risk. The linear regression analysis showed very poor correlations between the Wits-Ehac Index results and the XRF and proximate and ultimate results. The most valuable relationship found is between the presence of relatively high sulphur (greater than 3%) and ground reactivity with nitrate-bearing explosive emulsion.
Keywords
coal, spontaneous combustion, carbonaceous shale, linear regression, premature detonation, iron ore mine.
Introduction
An unplanned detonation incident occurred in April 2020 at an iron ore mine (‘Mine A’) in South Africa. The incident was classified as a high potential incident (HPI) that could have caused a fatality. The post-incident investigation confirmed the presence of carbonaceous shale near the detonation site. The carbonaceous shale was known to be present in the mine, but was neither separately modelled nor predicted to occur in the specific mining block (Scott and Gous, 2020). The chemical properties of the carbonaceous shale were not studied extensively as the mine’s drilling operations focused on intersecting the iron ore and were not concerned with the overlying waste domains. The incident could have occurred due to self-heating of the carbonaceous shale, leading to spontaneous combustion, or reaction between the carbonaceous shale and the bulk explosive emulsion.
Coal-shale, or carbonaceous shale, is a sedimentary rock containing less than 50% organic material (Schopf, 1966), and according to the ECE-UN coal classification (1998), a rock with 80-50% ash content. These shales are believed to be formed in depositional environments such as nondeltaic coastal salt-marshes from peats preserved in the stratigraphy. The non-carbonaceous and inorganic mineral matter content in carbonaceous shale is non-combustible and is represented by ash and sulphur-forming compounds (Jones and Cameron, 1988). The organic constituents are lower in carbonaceous shales than in coal itself and are represented by microscopic macerals.
The risk of spontaneous combustion in coal and coal-shale are commonly known and managed in the mining of coal deposits. Spontaneous combustion occurs due to the self-heating characteristic of coal and coal-shale (Onifade and Genc, 2018a). However, the risk of spontaneous combustion occurring in the iron ore environment is not well known or widely documented. Spontaneous combustion will result in lost working time which adversely impacts the mine performance, and the safety of the mine personnel (Phillips, Uludag, and Chabedi, 2011). These incidents occur commonly in underground coal mines as well as surface mines (Genc and Cook, 2015). Such incidents also occur in sulphide mines, where ground reactivity incidents were recorded as recent as April 2021 (Pieterse, 2021).
The major risk of blasting in ground conditions that have elevated temperatures is the unplanned premature detonation of blast-holes, which has the potential to cause loss of life (Australasian Explosives Industry Safety Group (AEISG), 2017). This risk exists due to the potential of the ground to react with the explosives used (Pieterse, 2021). Elevated ground temperatures may be caused by the inherent rock
321 The Journal of the Southern African Institute of Mining and Metallurgy VOLUME 123 JUNE 2023
Spontaneous combustion of carbonaceous shale at an iron ore mine, South Africa
chemistry, such as the case with coal seams, and when sulphides are present (AEISG, 2017). Other causes of elevated ground temperatures are related to the geothermal gradient, which is the rate of increase in temperature per unit depth due to heat flow from the Earth’s core (Kanana and Matveyev, 1989). Sulphide oxidation is a special case of elevated temperature ground conditions where the addition of nitrates causes an oxidation reaction that releases heat and may lead to the premature detonation of blast blocks (AEISG, 2017).
Occurrences of elevated ground conditions leading to spontaneous combustion in coal environments are common and well documented. The Witbank Coalfield is one of these localities and work has been done in this area to evaluate the propensity for spontaneous combustion using an index (Wits-Ehac Index). Studies by Onifade et al. (2019 , 2021) and, Onifade and Genc (2018a, 2018b, 2018c) aimed to relate the intrinsic properties of coal-shale to the Wits-Ehac Index. Analyses performed on samples from the Witbank Coalfield by Onifade et al. (2019) included X-ray diffractometry (XRD) and X-ray fluorescence (XRF) to geochemically characterize the coal-shale, as well as proximate, ultimate, and total sulphur analyses. The relationship between the inherent properties and risk of spontaneous combustion as determined via the Wits-Ehac Index was investigated by Onifade and Genc (2018a). Onifade et al. (2019) reported that the carbonaceous shale of the Witbank Coalfield is enriched in silica, aluminium, and iron, with kaolinite and quartz the dominant minerals.
Spontaneous combustion is described by Kim and Chaiken (1990) in terms of the rate at which energy is released and transferred to the surrounding rock mass. The rate of combustion depends on the concentration of reactants (carbon and oxygen), the surface area and particle size, ambient/initial temperature, and the activation energy (Kim and Chaiken, 1990). During the oxidation of coal or carbonaceous shale, CO2, CO, and heat are generated (Chaiken, 1977). With enough organic carbon as fuel, no external heat source may be required for spontaneous combustion to occur (Kim and Chaiken, 1990). In the case of carbonaceous shale, the presence of pyrite, and potentially water, increases the risk of spontaneous combustion due to the exothermic oxidation reaction of pyrite (Kim and Chaiken, 1990).
This exothermic oxidation reaction of carbon-rich material (coal and related shales) with pyrite is a three-stage self-heating process that may lead to spontaneous combustion (Beamish and Theiler, 2016; Kim and Chaiken, 1990). This process can occur either on waste dumps or in in-situ material into which blasting drill-holes have been drilled. Spontaneous combustion can also occur in places where there is air flow due to natural or non-natural fracturing (Potgieter, 2018; Restuccia, Ptak, and Rein, 2017). This reaction leads to elevated ground temperatures of varying degrees of intensity (Beamish and Theiler, 2016).
Due to the heterogeneous nature of coal and coal-shales and the many physical and chemical interactions at play during oxidation, it is very difficult to identify one variable to explain the propensity of coal or coal-shales to self-heat (Carras and Young, 1994; Singh and Demirbilek, 1987). No single property can be identified to predict spontaneous combustion (Carras and Young, 1994; Singh and Demirbilek, 1987). Many methods exist to assess the propensity of coal to heat and spontaneously combust and to analyse the factors influencing this event. These methods can be grouped into mathematical models, experimental models, and statistical methods. Onifade and Genc (2020) provide a summary of

global methods based on this grouping. However, the most readily available testing method for spontaneous combustion liability in the Africa continent is the Wits-Ehac Index. The current study aims to quantify the risk of spontaneous combustion of carbonaceous shale at Mine A and compare the results with those for the Witbank coalshale available from the literature. This will aid in understanding the risk of spontaneous combustion that informs the drill-and-blast activities at the mine.
Materials and methods
Location of the study area
Mine A is located on the southern extent of the Maremane Dome in the Northern Cape Province of South Africa, within the Palaeoproterozoic Transvaal Supergroup (Beukes, 1980). The Gamagara Formation of the Olifiantshoek Supergroup, in which the carbonaceous shale of the mine occurs, unconformably overlies the iron ore (Alchin and Botha, 2006, Cousins, 2016). The shale is classified geochemically as a ‘poor’ carbonaceous shale, falling on the limit of being classified as a ‘rock’, due to its low carbon content, low calorific value, and high ash content. The unit is characterized by a low iron content, except when siderite is present, and a low but variable sulphur content. Higher sulphur values may be ascribed to the presence of pyrite, which increases the risk of reactive ground. According to the classification of Wagner (2021), the carbonaceous shale at Mine A can be referred to as ‘shale’ and not ‘carbonaceous shale’ due to it containing less than 10% carbonaceous matter.
Visual inspection of the pit area was conducted following the detonation incident. The presence of carbonaceous shale was confirmed through visual identification based on the black colour in the pit. The location of the unit is indicated in Figure 1.
Existing boreholes were identified that had the potential to be twin-drilled. The boreholes were chosen to cover the expanse of the carbonaceous shale, to better delineate the risk area, as well as to confirm the modelled contacts. Due to the boreholes extending into the deposit, coverage of the carbonaceous shale was targeted at depth as well. The boreholes were planned at a spacing of 100-200 m. The extensive testing was done to describe risk levels for reactivity and spontaneous combustion and to identify potential proxies from geological features, such as chemistry and mineralogical content. This would aid in future risk identification and delineation per mining bench.
322 JUNE 2023 VOLUME 123 The Journal of the Southern African Institute of Mining and Metallurgy
Figure 1—In-pit expression of carbonaceous shale (SH-C) at Mine A
Spontaneous combustion of carbonaceous shale at an iron ore mine, South Africa
Sample collection and preparation
Ten core-drilled samples were identified for testing from the targeted drill-holes. The samples were collected from each hole as soon as it was drilled and stored in airtight plastic bags, clearly labelled, and recorded, to prevent oxidation and to retain sample integrity. The samples were crushed to 3 mm and then split into fractions for XRF and XRD analysis. These analytical splits were milled to 75 µm. The samples identified for spontaneous combustion liability via the Wits-Ehac Index were crushed to –212 µm. For the XRF analyses, the sample loss on ignition was determined by thermogravimetric analysis (ISO 9516-1 and ISO 11536), after which a fused glass-bead was prepared for analysis using Axios and Axios Advanced instruments. The percentage of total sulphur was measured using an ELTRA sulphur analyser according to ASTM 4239 . The proximate and ultimate analyses were done according to accredited and validated methods under ISO/IEC 17025 with practices outlined in ISO 17246 and ASTM 3176, for the proximate and ultimate analysis respectively.
Proximate analyses were done as per ISO 1171 for the ash (A), ISO 562 for volatile matter (VM), and ISO 11722 for moisture (M). Total sulphur (TS) and calorific value (CV) were determined according to ASTM D4239 and ISO 1928 respectively. Ultimate analyses were done according to ASTM D3176-15. The XRD analyses were done on a Bruker X-ray diffractometer and identification of minerals was conducted using the Bruker AXS Topas software, based on the best matched peaks according to accredited and validated methods under ISO/IEC 17025. Lastly, the mineral phases were identified and quantified via the Rietveld refinement method.
The propensity for spontaneous combustion of the coal-shale samples was evaluated using the Wits-Ehac test apparatus at the University of the Witwatersrand (Wits University). The WitsEhac test apparatus was developed by Wits University in the late 1980s and the Wits-Ehac Index is a nationally accepted standard for determining the spontaneous combustion liability of coal. A detailed description of the apparatus and the test method is documented by Onifade et al. (2021). In summary, the test uses a combination of crossing-point temperature (XPT) and differential thermal analysis (DTA) to determine the likely point of spontaneous combustion, calculated via Equation [1]:
The XPT is measured by heating the coal sample and an inert sample at a constant rate in an oil bath. The point at which the
temperature of the coal sample equals that of the inert sample is taken as the XPT. The DTA test measures and plots the temperature difference between the coal sample and the inert sample, and consists of three stages (Gouws and Wade, 1989; Wade, Gouws, and Phillips, 1987). Stage II is reached once all the moisture is evaporated and the coal sample is heating up to reach the bathmedium temperature (Wade, Gouws, and Phillips, 1987).
Results and discussion
Ten samples of carbonaceous shale from three successfully completed drill-holes were submitted for Wits-Ehac testing (Table I). The samples were taken at different intervals within each hole so as to be representative of the vertical extent of the unit, with a minimum of three samples per hole. The spomtaneous combustion liability of all samples is between medium and high, with variation between holes as well as variation with depth in each hole. These results correspond with the Genc and Cook (2015) results for Witbank Coalfield samples. The XPTs are on average lower per liability category for the Mine A carbonaceous shale compared to those of the Witbank Coalfield.
The Wits-Ehac Index results were further analysed by correlating them with the intrinsic factors and chemical composition to determine the linear relationship with the spomtaneous combustion propensity. This correlation can then be compared with the correlations determined from the results of studies of the Witbank Coalfields. The correlation was done by grouping the results according to the categories defined by Onifade and Genc (2018b) as presented in Table II.
Table II shows the categories in which results of statistical analysis can be grouped based on the determined R2 values. The closer to unity the R2 value is, the more perfect the correlation between the two variables plotted (Onifade and Genc, 2018b). The categories are numbered 1-6, which corresponds to ranges of R2 intervals between unity and zero. The interval ranges in turn correspond to a ‘very strong to perfect relationship’ to ‘no linear relationship’ at zero.
Linear regression of Wits-Ehac Index and XRF data
In Table III, the XRF data is compared with the measured WitsEhac Index. At Mine A, Fe, Si, Al2O3, K2O, P, and S are the common analytes used to classify the quality of the ore. Therefore, this suite of analyses is commonly understood by mine personnel and was used to investigate a possible link with the Wits-Ehac Index. If a
XPT is the crossing point temperature and WEI is the Wits-Ehac Index
323 The Journal of the Southern African Institute of Mining and Metallurgy VOLUME 123 JUNE 2023
[1]
Table I
Sample ID Hole ID From (m) To (m) WEI XPT (°C) Spomtaneous combustion liability 0027 HN124_M 1.50 2.12 3.89 132.4 Medium 0011 HN124_M 6.85 7.25 5.58 95.1 High 0028 HN124_M 16.72 17.31 4.75 113.2 Medium 0025 HN612_M 4.00 4.54 5.31 96.1 High 0016 HN612_M 14.5 14.94 6.25 95.7 High 0026 HN612_M 19.00 19.55 4.34 121.5 Medium 0017 HN621_M 0.55 1.05 5.59 91.7 High 0019 HN621_M 4.00 4.30 6.05 86.7 High 0022 HN621_M 19.72 20.17 4.95 105.8 Medium 0024 HN621_M 31.84 32.19 5.33 104.3 High
Wits-Ehac test results
Spontaneous combustion of carbonaceous shale at an iron ore mine, South Africa
Categories used to define a relationship between carbonaceous shale properties and the Wits-Ehac index (Onifade and Genc, 2018a)
Comparison of XRF results with the Wits-Ehac Index
proxy could be picked up between any of these analytes with the potential for spontaneous combustion, it would be useful to manage the risk going forward.
The Fe values fall within 0-3%, SiO2 above 60%, Al2O3 above 15%, K2O below 2.5%, P ranging from 0.010 to 0.014%, and S values are low, all below the 1% limit defined as a risk in AEISG (2017). The highest Fe sample is 0028, which has an outlying Fe content greater than 3%, compared to the rest of the samples at less than 1.7% Fe. The Wits-Ehac Index for this outlying sample is 4.75, falling within the medium risk range for spontaneous combustion. The highest S values are for samples 0017 and 0026, which fall within the high and medium ranges of liability respectively, based on their Wits-Ehac Index results. To aid in this correlation determination between the chemical analytes and Wits-Ehac Index, the XRF results and the Wits-Ehac Index values were subjected to linear regression as illustrated in Figure 2.
Based on Figure 2, the Fe, K2O, and P contents show a weak negative relationship with the WEI, and S shows a weak positive relationship when using the categories set out in Table II, according to R2 values. The SiO2 and Al2O3 contents have a very weak positive and negative relationship with WEI respectively. Although still weak, the strongest correlation of WEI is with the Fe and K2O contents since their R2 values are the highest. The correlation between Fe and the Wits Ehac Index might make sense if the Fe is from pyrite, which is known to increase spomtaneous combustion risk.
Linear regression with proximate and ultimate analyses
Coal and coal-shales are known to undergo spomtaneous combustion due to the interaction of the organic carbon with atmospheric conditions (Onifade and Genc, 2018a, 2018b, 2018c). The carbonaceous shale at Mine A is not related to any coal deposit, and spomtaneous combustion in situ is highly unlikely considering that such incidents typically occur in the coal environment (Kim
and Chaiken, 1990). However, the carbonaceous shale does pose a risk of elevated ground temperatures, especially where fractures are present due to blasting activities (Potgieter, 2018; Restuccia, Ptak, and Rein, 2017), as was the case in the area in which the incident occurred.
In order to compare the carbonaceous shale of Mine A to the coal-shale of the Witbank area, proximate and ultimate analyses were conducted. The analyses were carried out on 9 out of the 10 samples sent for Wits-Ehac Index tests (Table IV). Sample 0016 is excluded from the linear regression analyses due to no results being available, but for reference, it is included since it has a Wits-Ehac Index value.
High ash content is related to high mineral matter content (Snyman, 1989). The Witbank coal-shale described by Onifade and Genc (2018a) has a lower ash content than the Mine A carbonaceous shale, thus the Mine A carbonaceous shale poses a lower risk with respect to spontaneous combustion.
The low calorific values are expected since calorific value determines the coal grade, which is not applicable to a carbonaceous shale. However, the low calorific value may be an indication that the material may be more inert since more energy will be consumed during heating/combustion than is released (Alpern and de Sousa, 2002). The higher the volatile matter content, the higher the propensity for spontaneous combustion (Onifade and Genc, 2018a; Banerjee, 2000), and since the volatile matter content of the shale at Mine A is much lower than that of the Witbank coal-shales, the shale poses less of a risk.
The carbon and sulphur contents are very low. The carbon, hydrogen, and nitrogen levels of the Mine A carbonaceous shale are significantly lower than ths values for the Witbank coal-shales reported by Onifade and Genc (2018a), resulting in it posing a relatively lower risk.
The sulphur content is significant for drill-and-blast activities due to the potential for reactive ground. The sulphur levels are low,
324 JUNE 2023 VOLUME 123 The Journal of the Southern African Institute of Mining and Metallurgy
Table II
Category R2 value range Relationship 1 0.95 to 1 or –0.95 to –1 Very strong to perfect positive or negative relationship 2 0.51 to 0.94 or –0.51 to –0.94 Strong positive or negative linear relationship 3 0.25 to 0.50 or –0.25 to –0.50 Moderate positive or negative linear relationship 4 0.1 to 0.24 or –0.1 to –0.24 Weak positive or negative linear relationship 5 <0.1, >0 Very weak positive or negative relationship 6 0 No linear relationship
Table III
Sample ID Fe (%) SiO2 (%) Al2O3 (%) K2O (%) P (%) S (%) WEI 0011 1.34 63.51 21.89 1.95 0.014 0.214 5.58 0016 0.71 65.79 20.61 1.59 0.011 0.210 6.25 0017 1.20 64.36 21.95 1.77 0.012 0.584 5.59 0019 1.23 66.46 20.31 1.65 0.012 0.490 6.05 0022 1.67 60.47 24.20 2.25 0.014 0.038 4.95 0024 1.19 62.41 22.88 1.98 0.013 0.205 5.33 0025 0.70 73.89 15.90 1.16 0.010 0.264 5.31 0026 0.96 64.53 21.59 1.66 0.012 0.539 4.34 0027 1.62 64.12 20.93 2.02 0.013 0.110 3.89 0028 3.43 63.78 18.24 1.78 0.011 0.424 4.75
Spontaneous combustion of carbonaceous shale at an iron ore mine, South Africa
well below the risk limit of 1% as supplied in the AEISG (2017) guidelines. Carbonaceous shales with the following properties have a higher spontaneous combustion liability index (Onifade and Genc, 2018a):
➤ Lower ash content (less risk with between 51.5% and 68.4% ash, and above)
➤ Higher moisture content (lower risk with moisture content less than 1.5%)
➤ High volatile matter (Lower risk with VM less than 15.9%)
➤ High sulphide (low risk with less than 0.1% pyrite, medium with 0.1% to 4%).
Based on the observations, the carbonaceous shale samples from Mine A pose a low risk for spontaneous combustion compared to that of the Witbank coal-shale (Onifade and Genc 2018a).
The volatile matter is below 10% for the carbonaceous shale samples listed in Table IV, while the ash content is greater than 90%. The high ash content indicates that the Mine A carbonaceous shale has a high mineral (inorganic) matter content and low organic matter (Falcon and Ham, 1988). The low volatile matter content is indicative of a low maceral (organic) composition (Snyman, 1989). The total carbon content for the samples is very low, below 0.5% in all the samples. The Wits-Ehac Index results indicate a medium to high propensity for spontaneous combustion.
The relationship between ultimate and proximate results was investigated further by linear regression analysis to correlate the
results with the Wits-Ehac Index results shown in Figure 3. The correlation is compared to results previously reported for the Witbank coal-shales (Onifade and Genc, 2018a).

Based on the R2 values in Figure 2, the strongest positive linear relationship is between nitrogen and the Wits-Ehac Index. Total sulphur has a moderate positive relationship, while the rest of the variables (volatile matter, hydrogen, oxygen, moisture, total carbon, and ash) have very weak relationships with the Wits-Ehac Index. Nitrogen occurs in the organic carbonaceous material itself (Kim and Cheiken, 1990); none of the minerals in the XRD analysis contain nitrogen. This may indicate a relationship between the carbonaceous material content (albeit low) and the propensity for spontaneous combustion.
Categorical comparison
Table V presents the categorical results for the Witbank coal-shale samples as reported by Onifade and Genc (2018a), along with the Mine A categorical results from this study.
The categorical results of the Mine A carbonaceous shale are different to those of the Witbank coal-shales. No proximate or ultimate result reports to category 1 or category 4 for either the Witbank coalfields or Mine A. The only analytes of both mines reporting to the same category (category 5) are moisture and oxygen. Sulphur and nitrogen are the chemical constituents with the strongest relationship to the Wits-Ehac Index results for Mine
325 The Journal of the Southern African Institute of Mining and Metallurgy VOLUME 123 JUNE 2023
Figure 2—XRF analyses correlated with Wits-Ehac Index
Spontaneous combustion of carbonaceous shale at an iron ore mine, South Africa
Table IV
Proximate, ultimate, and spontaneous combustion test results for carbonaceous shale samples from Mine A
M is the inherent moisture, A is the ash content, CV is the calorific value, VM is the volatile matter, TS is total sulphur , H is hydrogen, N is nitrogen, and O is oxygen
Figure 3—Correlation of proximate and ultimate analyses with Wits-Ehac Index

A, where volatile matter, ash, carbon, hydrogen, and nitrogen have the strongest relationship for the Witbank coal-shale. Therefore, nitrogen is the only common analyte with a relatively strong
relationship with the Wits-Ehac Index for both the Witbank coalshale and the Mine A shale. Sulphur does not have a common relationship with the Wits-Ehac Index for either the Mine A shale
326 JUNE 2023 VOLUME 123 The Journal of the Southern African Institute of Mining and Metallurgy
Sample ID M (%) VM (%) A (%) CV (%) H (%) N (%) TS (%) O (%) WEI 0011 0.91 7.3 91.8 0.03 0.89 0.10 0.32 6.88 0016* n.a. n.a. n.a. n.a. n.a. n.a. n.a. n.a. 6.25 0017 0.75 7.4 91.9 0.01 0.88 0.09 0.58 6.54 5.59 0019 0.74 6.7 92.5 0.01 0.81 0.09 0.58 6.01 6.05 0022 0.94 7.2 91.9 0.06 0.96 0.07 0.40 6.61 4.95 0024 0.78 7.4 91.8 0.01 0.9 0.08 0.31 6.91 5.33 0025 0.43 5.3 94.1 0.01 0.66 0.06 0.39 4.78 5.31 0026 0.91 7.0 92 0.00 0.79 0.05 0.45 6.71 4.34 0027 0.71 6.6 92.5 0.01 0.82 0.05 0.12 6.5 3.89 0028 0.91 6.6 92.4 0.00 0.79 0.05 0.41 6.35 4.75
Spontaneous combustion of carbonaceous shale at an iron ore mine, South Africa
or the Witbank carbonaceous shale. Contrasting the Witbank coalshale results, the ash content of Mine A shale has no relationship with the Wits-Ehac Index.
Mineralogical composition of the Mine A carbonaceous shale
The XRD results for the Wits-Ehac samples are presented in Figure 4. The mineralogical composition of the Mine A carbonaceous shale is typical of shales occurring in a coal environment, namely clays, pyrite, and carbonates (Wagner, 2021). The dominant minerals in the Mine A samples are kaolinite, quartz, and siderite, whereas the Witbank coal-shale reported by Onifade et al. (2019) is dominated by kaolinite and quartz. Kaolinite is a common clay mineral, and quartz is a common silicate mineral. Pyrite can have a catalytic effect on the oxidation reaction that may lead to an increased spontaneous combustion propensity (Kim and Chaiken, 1990).
The Witbank coal-shale results studied by Onifade, et al. (2019) suggest that a higher pyrite and muscovite content poses a higher risk for spontaneous combustion, and higher kaolinite, quartz, plagioclase feldspar, and siderite a lower risk. The significance of siderite (iron carbonate) is that the carbonate acts as a buffer (inhibitor) to the exothermic oxidation reaction (Descotes et al., 2002). Siderite is present in low amounts, and the greater abundance of it in sample 0028 might contribute to the sample’s lower Wits-Ehac Index (Descotes et al., 2002). The pyrite content is the highest in sample 0026, but this sample has the second lowest Wits-Ehac Index classification. Pyrite is present in almost all of the samples, ranging from the highest to the lowest Wits-Ehac Index, therefore no direct relationship is apparent to link the spontaneous combustion risk with the presence of pyrite. Apart from the presence of pyrite and siderite, the mineralogical composition of the Mine A carbonaceous shale does not exhibit the same trend. The high Wits-Ehac Index samples (0011, 0016, 0019, 0024, 0025) do not exhibit any significant correlation with a specific mineral. The medium liability samples (WEI 3-5) have a higher siderite content, and high liability samples (WEI>5) a higher pyrite content.
Conclusion
The properties of the carbonaceous shale at iron ore Mine A are of importance regarding the propensity for spontaneous combustion and the potential for ground reactivity. Based on the proximate and ultimate analyses, the carbonaceous shale in question falls
Table V
between being classified as a ‘rock’ and as a carbonaceous shale. The proximate and ultimate analysis results bring into question the probability of a pure spontaneous combustion reaction taking place at the mine. Reaction between the explosive emulsion and the sulphide and carbonaceous materials in the shale might be a plausible explanation as opposed to pure spontaneous combustion.
With respect to the XRF results, all analytes have a weak to poor correlation with the Wits-Ehac Index, the strongest relationship being for iron. As regards the proximate and ultimate analyses, the strongest relationship is with nitrogen, followed by sulphur. Sulphur has a moderate linear relationship with the Wits-Ehac Index and this may indicate a risk for spontaneous combustion in areas where the sulphur content in the carbonaceous shale is elevated. The risk for spontaneous combustion according to the Wits-Ehac Index is between medium and high, with no spatial trends. No correlation between the Wits-Ehac Index and the presence of pyrite could be made. However, a negative correlation is observed between the siderite content and the Wits-Ehac Index analysis results.
In comparison with the Witbank coal-shale, the Mine A carbonaceous shale shows little to no correlation between chemistry and spontaneous combustion propensity, apart from nitrogen. The validity of the Wits-Ehac test as a measure of spontaneous combustion risk in the Mine A carbonaceous shale may be low due to the inconsistency between the response variables in comparison to the Witbank coal-shale. The reason for the inconsistency may be the inherent differences in composition and genesis of the lithologies between the two localities.
Acknowledgements
The work reported in this paper is part of an MSc research report in the School of Mining Engineering at the University of the Witwatersrand, Johannesburg, South Africa.
References
Alchin, D.J. and Botha, W.J. 2006. The structural/stratigraphic development of the Sishen South iron ore deposit, South Africa, as deduced from ground gravity data modelling. Applied Earth Science, vol. 115, no. 4. pp. 174–186.
Alpern, B. and de Sousa, M.J.L. 2002. Documented international enquiry on solid sedimentary fossil fuels, coal: definitions, classifications, reserves-resources, and energy potential. International Journal of Coal Geology, vol. 50, no. 1-40. pp. 3–41.
ASTM 3176. 2017. Standard practice for ultimate analysis of coal and coke. ASTM International, West Conshohocken, PA.
Categorical comparison between the Mine A carbonaceous shale and the reported Witbank coal-shale
Category R2 range Relationship
1 0.95 to 1
Very strong to perfect positive or or negative relationship
–0.95 to –1
2 0.51 to 0.94
Strong positive or negative or linear relationship
–0.51 to –0.94
3 0.25 to 0.50
Moderate positive or negative or linear relationship
–0.25 to –0.50
4 0.1 to 0.24
Weak positive or negative or linear relationship
–0.1 to –0.24
5 <0.1, >0
Very weak positive or negative relationship
6 0 No linear relationship
Mine A shale ultimate and Witbank coal-shale ultimate and proximate analyses proximate analyses
327 The Journal of the Southern African Institute of Mining and Metallurgy VOLUME 123 JUNE 2023
– –
N –
S V, A, C, H, N
– –
M, V, C, H, O M, O, S
A –
Spontaneous combustion of carbonaceous shale at an iron ore mine, South Africa
ASTM D-4239. 2017. Standard test method for sulfur in the analysis sample of coal and coke using high-temperature tube furnace combustion. ASTM International, West Conshohocken, PA.
Australasian Explosives Industry Safety Group (AEISG). 2017. Code of Practice. Elevated temperature and reactive ground. https://www.aeisg.org. au/wp-content/uploads/ELEVATED-TEMPERATURE-AND-REACTIVEGROUND-COP-EDITION-5-APRIL-2020-3.pdf [accessed: January 2022].
Banerjee, S.C. 2000. Prevention and Combating Mine Fires. Oxford and IBH, New Delhi.
Beamish, B. and Theiler, J. 2016. Characterising the spontaneous combustion propensity of waste rock. Proceedings of the Life-of-Mine Conference, Brisbane, Queensland, 28-30 September 2016. Australasian Institute of Mining and Metallurgy, Melbourne.
Beukes, N.J. 1980. Lithofacies and stratigraphy of the Kuruman and Griquatown iron-formations, northern Cape Province, South Africa. South African Journal of Geology, vol. 83. pp. 69–86.
Carras, J.N. and Young, B.C. 1994. Self-heating of coal and related materials: Models, application, and test methods. Progress in Energy and Combustion Science, vol. 20, no. 1. pp.1–15.
Chaiken, R.F. 1977. Heat balance in in-situ combustion. Report of Investigations 8221. Department of the Interior, US Bureau of Mines.
Cousins, D.P. 2016. A stratigraphic, petrographic and geochemical study of the Gamagara Formation at the Maremane Dome, Northern Cape Province, South Africa. MSc dissertation, Rhodes University, Grahamstown, South Africa.
Descotes, M., Beaucaire, C., Mercier, F., Savoye, S., Sow, J., and Zuddas, P. 2002. Effect of carbonate ions on pyrite (FeS2) dissolution. Bulletin de la Societe Geologique de France, vol. 173, no. 3. pp. 265–270.
ECE-UN. 1998. International classification of in-seam coals. Economic Commission for Europe Commitee on Sustainable Energy. https://digitallibrary.un.org/ record/260911?ln=en [accessed September 2021]
Falcon, R. and Ham, A. 1988. The characteristics of Southern African coals. Journal of the South African Institute of Mining and Metallurgy, vol. 88, no. 5. pp. 145–161.
Genc, B. and Cook, A. 2015. Spontaneous combustion risk in South African coalfields. Journal of the South African Insitute of Mining and Metallurgy, vol. 115. pp. 563–568.
Gouws, M.J. and Wade, L. 1989. The self-heating liability of coal: Predictions based on composite indices. Mining Science and Technology, vol. 9. pp. 81–85.
ISO 1171. 2010. Solid mineral fuels — Determination of ash. International Organization for Standardization, Geneva.
ISO 562. 2010. Hard coal and coke — Determination of volatile matter. International Organization for Standardization, Geneva.
ISO 17246. 2010. Practice for the proximate analysis of coal. International Organization for Standardization, Geneva.
ISO 11722. 2013. Solid mineral fuels — Hard coal, method for determining moisture. International Organization for Standardization, Geneva.
ISO 11536. 2015. Iron ores — Determination of loss on ignition. International Organization for Standardization, Geneva.
ISO 1928. 2020. Determination of gross calorific value. International Organization for Standardization, Geneva.
ISO 9516. 2003. Iron ores — Determination of various elements by X-ray fluorescence spectrometry Part 1: Comprehensive procedure. International Organization for Standardization, Geneva.
Jones, J.R. and Cameron, B. 1988. Modern coastal back-barrier environment: Analog for coal basin or carbonaceous black shale? Geology, vol. 16, no. 4. pp. 345–348.
Kanana, Y.F. and Matveyev, A.K. 1989. Temperature and geologic time in the regional metamorphism of coal. International Geology Review, vol. 31, no. 3. pp. 258–261.
Kataka, M.O., Matiane, A.R., and Odhiambo, B.D.O. 2018. Chemical and mineralogical characteristics of reactive coal from Northern Natal and VendaPafuri coalfields in South Africa. Journal of African Earth Sciences, vol. 137. pp.278–285.
Kim, A.G. and Chaiken, F. 1990. Relative self-heating tendencies of coal, carbonaceous shales and coal refuse. Proceedings of the American Society of Mining and Reclamation. pp. 535–544.
Onifade, M. and Genc, B. 2018a. Prediction of the spontaneous combustion liability of coals and coal-shales using statistical analysis. Journal of the Southern African Institute of Mining and Metallurgy, vol. 118, no. 8. pp. 779–808.
Onifade, M. and Genc, B. 2018b. Spontaneous combustion of coals and coal-shales. International Journal of Mining Science and Technology, vol. 28, no. 6. pp. 933–940.
Onifade, M. and Genc, B. 2018c. Modelling spontaneous combustion liability of carbonaceous materials. International Journal of Coal Science and Technology, vol. 5, no. 2. pp. 191–212.

Onifade, M. and Genc, B. 2020. A review of research on spontaneous combustion of coal. International Journal of Mining Science and Technology, vol. 30, no. 3. pp. 303–311.
Onifade, M., Genc, B., Gbadamosi, A.R., Morgan, A., and Ngoepe, T. 2021. Influence of antioxidants on SPONCOM and coal properties. Process Safety and Environmental Protection, vol. 148. pp. 1019–1032.
Phillips, H., Uludag, S., and Chabedi, K. 2011. Prevention and control of spontaneous combustion. Best practice guidelines for surface coal mines in South Africa. Coaltech Research Association. https://miningandblasting.files. wordpress.com/2009/09/spontaneous_combustion_guidelines.pdf [accessed January 2022].
Pieterse, D. 2021. Reactive ground - April 2021. Internal BME report. Unpublished. Potgieter, N. 2018. Analysis and investigation of drill-core samples of characteristics of reactive ground. EnviroSim Consulting, Pretoria.
Priyananda, P., Djerdjev, A., Gore, J., Neto, C., Beattie, J., and Hawkett, B 2015. Premature detonation of an NH4NO3 emulsion in reactive ground. Journal of Hazardous Materials, vol. 283. pp. 314–320.
Restuccia, F., Ptak, N., and Rein, G. 2017. Self-heating behaviour and ignition of shale rock. Combustion and Flame, vol. 176. pp. 213–219.
Schopf, J.M. 1966. Definitions of peat and coal and of graphite that terminates the coal series (graphocite). International Journal of Coal Geology, vol. 74, no. 5, part 1. pp. 584–592.
Scott, T. and Gous, C. 2020. Geological input for reactive ground identification. Kumba Iron Ore.
Singh, R.N. and Demirbilek, S. 1987. Statistical appraisal of intrinsic factors affecting spontaneous combustion of coal. Mining Science and Technology, vol. 4, no. 2. pp.155–165.
Snyman, C.P. 1989. The role of coal petrography in understanding the properties of South African coal. International Journal of Coal Geology, vol. 14. pp.83–101.
Wade, L., Gouws, M.J., and Phillips, H.R. 1987. An apparatus to establish the spontaneous combustion propensity of South African coals. Proceedings of the Symposium on Safety in Coal Mines, CSIR, Pretoria. pp. 7.1–7.2.
Wagner, N.J. 2021. Geology of coal. Encyclopedia of Geology. Alderton, D. and Elias, S.A. (eds). : Academic Press, Lindon. pp. 745-761. u
328 JUNE 2023 VOLUME 123 The Journal of the Southern African Institute of Mining and Metallurgy
Figure 4—XRD results for Mine A carbonaceous shale samples together with the Wits-Ehac Index results
Assessing coal mine closures and mining community profiles for the ‘just transition’ in South Africa
M.J. Cole1, M. Mthenjane2, and A.T. van Zyl3
Affiliation:
1University of Cape Town, Rondebosch, South Africa.
2Exxaro Resources, Centurion, South Africa.
3SRK Consulting, Illovo, South Africa.
Correspondence to: M.J. Cole
Email: megan.cole@uct.ac.za
Dates:
Received: 30 Mar. 2023
Revised: 15 Jun. 2023
Accepted: 21 Jun. 2023
Published: June 2023
How to cite: Cole, M.J., Mthenjane, M., and van Zyl, A.T. 2023
Assessing coal mine closures and mining community profiles for the ‘just transition’ in South Africa. Journal of the Southern African Institute of Mining and Metallurgy, vol. 123, no. 6. pp.329–342
DOI ID: http://dx.doi.org/10.17159/24119717/2689/2023
ORCID: M.J. Cole http://orcid.org/ 0000-0003-0815-7590
Synopsis
Growing global concern over the impacts of climate change, attributable largely to fossil fuel energy sources, has led to the widely shared goal for a ‘just transition’ to cleaner energy and reduced dependence on carbon-based fuels. As the world’s 14th biggest CO2 emitter and being particularly vulnerable to the impacts of climate change, South Africa must embark on a just transition pathway. This paper reviews expected coal mine closures and associated community vulnerabilities and local governance challenges in South Africa. Decommissioning schedules for all coal-fired power stations and operating coal mines are plotted, and 69 mining host communities and 21 municipalities are mapped, classified, and described. Community socio-economic profiles are measured using a set of SDG indicators and census data and municipalities assessed through financial audits. Our research shows that five coal-fired power plants (8.9 GW) and 15 coal mines (29.5 Mt/a) will probably close by 2030, and a further four plants (14 GW) and 23 mines (106 Mt/a) by 2040. Thus, the shift to cleaner energy will likely occur without the premature closures implied by the just transition. The impact of mine closure on the 2.5 million residents of host communities will be significant, particularly as levels of income, employment, and education are already very low and many municipalities are in financial distress. The South African approach to the just transition needs to take local realities into account and the narrative must support an effective transition that does not undermine energy security and economic growth.
Keywords
just transition, South Africa, coal mining, mining communities, energy, mine closure.
Introduction: What is the just transition?
Growing concern over the impacts of climate change on livelihood across the world has led to the widely shared goal of a ‘just transition’ to cleaner energy sources and reduced dependence on coal (World Bank Group, 2018). Internationally, the transition away from coal mining and coal-based energy generation is intensifying, particularly in Europe, despite the intermediate resort to coal for energy security due to the Russia/Ukraine war and resulting withdrawals of Russian gas and sanctions on Russian coal. Furthermore, some countries have growing domestic demand for coal, such as China and India, and expanding coal exports, such as Australia and Indonesia (Ruppert Bulmer et al., 2021). At the same time, global renewable energy jobs have been growing rapidly, with 12 million jobs (temporary and permanent) in 2020, 39% of them in China, covering the whole renewable energy production value chain (IRENA, 2022). At least 36 governments and 54 companies have committed to phasing out thermal coal from the power sector by 2030, and governments have instituted ‘just transition’ task forces, coal transition commissions, and stakeholder consultation platforms to explore options for the end of coal use (Ruppert Bulmer et al., 2021).
Many different definitions are used for the ‘just transition’, but a key feature is that no-one is left behind when making necessary changes to energy and economic systems. That involves sharing the costs and benefits of the changes fairly, supporting workers with new jobs or retraining, and supporting communities through broader economic changes. The International Renewable Energy Agency (IRENA and ILO, 2021) has identified four key concerns that require policy intervention:
➤ Temporal misalignments, where job losses precede job gains
➤ Spatial misalignments, where new jobs emerge in other communities or regions
➤ Educational misalignments, where skills levels or the occupations required under the energy transition have not been developed or needed under the previous energy system
➤ Sectoral misalignments, where changing value chains and supply chains affect job count and location.
The South African context
The coal mining industry has been an important part of the South African economy since the late 1800s when it supported the growth of the gold and diamond mining industries (Cole and Broadhurst, 2020).
329 The Journal of the Southern African Institute of Mining and Metallurgy VOLUME 123 JUNE 2023
Assessing coal mine closures and mining community profiles for the ‘just transition’
Today, South Africa is the seventh biggest coal producer in the world with 3.2% of global coal production (BP, 2022) and about 20% of production is exported (Minerals Council South Africa, 2022). In 2022 the industry directly employed 90 977 people who earned R31.7 billion, had total sales of R252.3 billion, and paid R1.97 billion in royalties (Minerals Council South Africa, 2023). In 2021 the coal industry spent R61 billion procuring goods and services (Minerals Council South Africa, 2022). The median wage of mineworkers is double that of other formal sector workers in South Africa (Pai et al., 2021). There are an estimated 170 000 indirect jobs linked to the coal mining industry (Chamber of Mines of South Africa, 2018).
The major users of coal in South Africa are national utility Eskom’s coal-fired power stations (53% of total production), Sasol’s coal-to-liquid (CTL) fuel plant (33%), and aluminium and ferroalloys producers (12%) such as ArcelorMittal (Eskom, 2021). The power grid and economy are heavily reliant on fossil fuels, with 80.1% of electricity produced in 2022 using coal and 1.6% from diesel; while hydropower (6.4%), other renewables (7.3%), and nuclear (4.6%) produce the balance (Pierce and le Roux, 2023). The country’s dependence on coal for electricity is the highest in the world (IEA, 2021) and its total energy consumption (oil, gas, and coal) resulted in 438.9 Mt of CO2 emissions in 2021 (BP, 2022). Mining operations require baseload electricity and are highly dependent on Eskom’s coal-fired power stations and affected by electricity tariffs, which have increased by over 500% in the past decade (Minerals Council South Africa, 2023).
South Africa is the world’s 17th biggest greenhouse gas (GHG) emitter, with 1.13% of global emissions in 2020 (Climate Watch, 2023), despite being the 39th biggest economy (IMF, 2023), and therefore faces international pressure to reduce its emissions. It also faces domestic pressure as the country will experience greater temperature increases than the global average – with 5-8°oC possible by 2100 causing, amongst other problems, heatwaves, floods, and droughts (DEA, 2013). South Africa’s Low-Emission Development Strategy (SA-LEDS), submitted to the UNFCCC in 2020, has an aspirational net zero CO2 emissions target for 2050. The vision is that ‘South Africa follows a low-carbon growth trajectory while making a fair contribution to the global effort to limit the average temperature increase, while ensuring a just transition and building of the country’s resilience to climate change’ (Republic of South Africa, 2020). South Africa’s updated Nationally Determined Contribution (NDC) under the 2016 UNFCCC Paris Agreement includes mitigation targets based on an assessment of the country’s ‘fair share’ of global emissions and likely outcome of current policies, including the Integrated Resource Plan (IRP) 2019 (DMRE, 2019), draft post-2015 National Energy Efficiency Strategy, Green Transport Strategy, and the carbon tax (Marquard et al., 2021). The climate mitigation targets in the 2021 NDC commit to absolute GHG emissions reduction of 350-420 Mt CO2e, including land use, by 2030 (Republic of South Africa, 2021). This would be 18-32% below 2010 levels and is almost sufficient, against modelled domestic pathways, for meeting the 1.5°C global temperature goal (Climate Action Tracker, 2022). Although the country plans to add over 20 GW of renewable energy capacity over the next decade, coal will remain an important energy resource for the forseeable future. This vision for a low-carbon economy requires significant funding. At the UNFCCC COP26 climate negotiations in Glasgow in 2021, the World Bank announced the world’s first ‘Just Energy Transition Partnership’, a new funding mechanism for the just transition in coal-producing emerging economies, to support South Africa with a US$8.5 billion loan (Kramer, 2022). South Africa’s
Just Energy Transition Investment Plan (JET IP) for the period 2023-2027, published in November 2022, lays out priority required investments in the electricity, new energy vehicles, and green hydrogen sectors totalling US$98 billion, highlighting the breadth of interventions required (The Presidency Republic of South Africa, 2022). This builds on the South African Just Transition Framework published in 2022, with seven pillars and four at-risk value chains identified – coal, auto, agriculture, and tourism (Presidential Climate Commission, 2022). This framework is broad and the definition for the just transition in South Africa includes mitigation, resilience, decent work, social inclusion, and poverty alleviation (ibid.).
The global literature on the just transition has focused on OECD countries and the national level, despite the regional and local implications (Pai et al., 2021). This paper seeks to contribute to the relatively new and strategic debate on South Africa’s just transition by providing an in-depth and comprehensive spatial and temporal analysis of the coal mining industry and its host communities, particularly looking at expected coal mine closures and current community vulnerability. The followin sections describe the methodology employed, the results for coal-fired power stations, coal mines, coal mining host communities, and local municipalities, and provide a discussion on the local, national, and regional implications of the data and the just transition imperatives.
Methodology
There are four parts to the paper that involved data collection and analysis. Firstly, all coal-fired power stations (coal plants) were identified and data on location, unit capacity, start dates, and planned decommissioning was collected from the Global Energy Monitor’s Coal Plant Tracker (Global Energy Monitor, 2022a). The plants were mapped in ArcGIS and a closure schedule plotted from 2023 to 2071.
Secondly, all operating coal mines were identified and data on location, start date, owner and operator, mining method, customers, employment, production, life of mine, resources and reserves, and extension projects were collated from the lead author’s previously published work on all South African mines and mining host communities (Cole and Broadhurst, 2021, 2022), the Global Energy Monitor Coal Mine Tracker (Global Energy Monitor, 2022b), and mining company annual reports (Integrated Reports, ESG Reports and Mineral Resources and Reserves Reports), websites, and Social and Labour Plans (SLPs). The mines were mapped in ArcGIS and a production and mine closure schedule plotted for the next 55 years.
Thirdly, all coal mining communities were identified and mapped based on the lead author’s previously published work on all South African mines and mining host communities (Cole and Broadhurst, 2021, 2022) and additional research using Google Earth, the national census 2011 geographical files demarcating ‘main places’ and ‘sub places’ (Frith, 2019), and data published by Statistics South Africa (StatsSA) and provided by the University of Cape Town’s DataFirst (StatsSA, 2016). The communities were categorized and analysed as cities, towns, townships, rural villages, mine villages, and informal settlements on mine land, based on population, demographics, location, levels of informal housing, and visual assessment of satellite images in Google Earth.
Demographic and socio-economic indicators were selected based on the South African Index of Multiple Deprivation (SAIMD) (Wright and Noble, 2009) and Sustainable Development Goals (SDGs) indicators that can be comprehensively measured at the town/village level. These indicators are found in seven SDGs,
330 JUNE 2023 VOLUME 123 The Journal of the Southern African Institute of Mining and Metallurgy
Assessing coal mine closures and mining community profiles for the ‘just transition’
namely SDG 1 (poverty), SDG 4 (education), SDG 6 (water and sanitation), SDG 7 (energy), SDG 8 (decent work), SDG 11 (sustainable cities and communities), and SDG 17 (partnerships). These indicators were measured using the Census 2011 main place and sub place data collected from SuperCross (StatsSA, 2016) and aggregated or disaggregated to fit each individual community. Although the census data used for the community analysis is now relatively old, it is valuable as it provides a comparison between the different types of communities and will allow for a useful assessment of changes over time when the 2022 census data is released.
Fourthly, all coal mining local municipalities were identified and mapped and the most recent financial data sourced from the Auditor-General of South Africa (AGSA) reports (Auditor-General South Africa, 2022) and National Treasury’s Municipal Money Data website (National Treasury, 2022), while data on local government election results was sourced from the Independent Electoral Commission (IEC) website (Independent Electoral Commission, 2023).
Results
Coal plants
South Africa has 16 operational coal plants located in Mpumalanga, KwaZulu-Natal, Gauteng, and Limpopo provinces and one coalto-liquid (CTL) fuel plant owned and operated by Sasol located in Secunda in Mpumalanga (see Table I and Figure 1). The coal plants have a total capacity of 43 GW and employ over 12 000 people. Most of the Eskom power stations are more than 30 years old and four are more than 50 years old. The current schedule involves decommissioning the oldest three power stations (3.6 GW) by 2025 and retiring a further four (12 GW) by 2035, as shown in Table I and Figure 2. The NDC notes that flexible retirement allows the
Summary of coal plants in South Africa, listed by retirement date
option of these plants retiring early if their annual utilization drops below 40%. Komati power station (the oldest in the country at 61 years) was decommissioned in October 2022 and is now a ‘just transition’ pilot site for repurposing to renewable energy (solar PV, wind, and battery storage) with R9 billion in concessional loans and grants secured from the World Bank (Eskom, 2022). Grootvlei power station will be one of the next plants to close (along with Hendrina and Camden) and Eskom has secured a grant from the German development bank, KfW, to set up a renewable training facility at the Grootvlei site (Bega, 2022).
Despite the abundance of coal, South Africa is experiencing a national electricity crisis due to the poor performance of Eskom’s new coal-fired power stations (Medupi and Kusile), escalating maintenance and breakdowns of ageing plants, and slow roll-out of the national Renewable Independent Power Producer Programme (REIPPP) due to political and governance factors (Kruger and Alao, 2022). This has resulted in increasing load-shedding since 2018 (Pierce and Ferreira, 2022). In 2021, the country experienced load-shedding 13% of the time (ibid.) and this increased to 43% of the time (3773 hours) in 2022, with mostly stage 4 load-shedding occurring (Pierce and le Roux, 2023). To partly address the electricity crisis, in June 2021 the President announced an increase in the threshold for generation license exemptions for embedded generation projects connected to the grid from 1 MW to 100 MW, and this cap has since been removed. The mining industry has led the way in taking advantage of this change in legislation and now has a pipeline of 89 self-generation projects of 6.5 GW (95% solar) at 29 mining companies with a project value exceeding R100 billion (Minerals Council South Africa, 2023).
More than the climate crisis, the electricity crisis is driving the renewable energy sector, which is fundamentally shifting the transmission grid from concentration near coal mines in the east, to decentralization to accommodate solar and wind farms spread
331 The Journal of the Southern African Institute of Mining and Metallurgy VOLUME 123 JUNE 2023
Table I
Name Owner Province Units Operating capacity First unit start Last unit retirement Combined capacity (MW) to be retired (MW) Grootvlei Eskom Mpumalanga 6 600 1969 2025 8 952 MW by 2030 Hendrina Eskom Mpumalanga 10 1 400 1970 2025 Camden Eskom Mpumalanga 8 1 600 1967 2025 Arnot Eskom Mpumalanga 6 2 352 1971 2029 Kriel Eskom Mpumalanga 6 3 000 1976 2029 Matla Eskom Mpumalanga 6 3 600 1979 2034 6 600 MW by 2035 Duvha Eskom Mpumalanga 6 3 000 1980 2034 Tutuka Eskom Mpumalanga 6 3 654 1985 2040 7 362 MW by 2040 Lethabo Eskom Mpumalanga 6 3 708 1985 2040 Matimba Eskom Limpopo 6 3 990 1987 2041 8 106 MW by 2045 Kendal Eskom Mpumalanga 6 4 116 1988 2043 Majuba Eskom Mpumalanga 6 4 143 1996 2051 Medupi Eskom Limpopo 6 4 800 2015 2071 Kusile Eskom Mpumalanga 6 3 200 2017 2071 Eskom Total 90 44 763 Kelvin Anergi Gauteng 6 180 1957 2026 Richards Bay Mill Mondi KwaZulu-Natal 2 72 1984 Grand Total 98 45 015
Assessing coal mine closures and mining community profiles for the ‘just transition’


across the western half of the country (Kruger and Alao, 2022). The country is moving to a multi-market model where municipalities and consumers can buy directly from independent power producers (IPPs) and Eskom could unbundle the transmission sector to
promote the development of the renewable energy sector (ibid.). The International Renewable Energy Agency (IRENA) found that South Africa could ‘realistically, and cost-effectively … supply 49% of its electricity mix from renewables by 2030’ (IRENA, 2020).
332 JUNE 2023 VOLUME 123 The Journal of the Southern African Institute of Mining and Metallurgy
Figure 2 Planned reduction in total operating capacity of Eskom’s coal fleet (grey) as individual coal-fired power stations (green) are retired from 2025 to 2071, simplified to include all currently operating units in each bar
Figure 1 Coal mines and coal plants in South Africa (labels refer to coal plants)
Assessing coal mine closures and mining community profiles for the ‘just transition’
Coal mining
There are 66 operating coal mines in South Africa, largely in Mpumalanga Province (see Figure 1), owned by 32 private mining companies (Table II), most of which are locally owned. Five companies produce 77% of all coal; Seriti is the biggest producer (62 Mt/a) followed by Sasol (42 Mt/a), Exxaro Resources (26 Mt/a), Thungela (25 Mt/a), and Glencore (22 Mt/a). There are many junior or emerging mining companies operating relatively short-life mines. Altogether they produced 231 Mt of thermal and metallurgical coal in 2022, generating earnings of R28 billion and employing 90 977 people. In 2021 just over 79% of coal production was sold locally, although it has averaged 72% since 1998 (see Figure 3). Despite high coal prices in 2021 and 2022, exports were constrained by road and port infrastructure and operations, resulting in lost export revenues of R22.7 billion (Minerals Council South Africa, 2022). Coal mining employment steadily increased from 2003 to 2019, except for a drop in 2015, though it has decreased slightly in the past three years, as shown in Figure 4. Figure 4 also shows the significant drop in coal mining employment during the 1980s and 1990s as many mines in KwaZulu-Natal closed.
Life of mine (LOM) data is available for 82% of the mines, and if not extended through brownfield or greenfield exploration,
II
Summary of operating coal mines in South Africa
production will steadily decline from 2023 to 2057 as shown in Figure 5. According to this data, four mines will close by 2025 (6.5 Mt), 11 will close in 2026 to 2030 (23 Mt), 12 in 2031 to 2035 (62 Mt), 11 in 2035 to 2040 (44 Mt), nine in 2041 to 2050 (23 Mt), and seven mines will close after 2050 (53.5 Mt). There are 11 mines with an unknown life of mine (32 Mt). If the planned operation of coal plants continued until 2071, there would be a 14-year gap in supply from the last coal mine closure based on available data. It is expected that some of the mines will extend their lives. There are three existing planned mine expansions that are not incorporated into the published LOM (at Aviemore, Khwezela, and Kangala) and 18 new coal projects with LOMs ranging from five to 39 years, which would add over 30 Mt/a if they all proceed to production (see Table III). For example, Mbuyelo Coal has four mines planned in Mpumalanga with a total mineral resource of 68.8 Mt and LOM ranging from 5 to 15 years (Mbuyelo Coal, 2022). Thungela’s Dalyshope project east of Lephalale would be the second large mine in the Waterberg and would produce 10 Mt.a for 30 years (Global Energy Monitor, 2022a). MC Mining has five projects in the unmined Soutpansberg Coalfield in northeast Limpopo Province which would produce 17.5 Mt/a for at least 38 years (MC Mining, 2023). If South Africa’s coal production were to expand significantly, it would be focused on the Waterberg Coalfield in

333 The Journal of the Southern African Institute of Mining and Metallurgy VOLUME 123 JUNE 2023
Table
Province Coal fields Number of mines Number of Total annual Maximum life of mining companies production (Mt) mine (years) Free State Vereeniging-Sasolburg 2 2 16.3 17 Gauteng Witbank 3 2 5.9 37 KwaZulu-Natal Utrecht, Vryheid, Nongoma 7 6 4.5 28 Limpopo Waterberg 1 1 17.0 55 Mpumalanga Witbank, Highveld, Eastern Transvaal 53 26 201.3 50 Total 66 32 231 55
Figure 3 Coal production for local sales and export. Data sources: DMR (2020), Minerals Council South Africa (2022)
sales Export sales Coal production in Million tonnes (Mt)
Local
Assessing coal mine closures and mining community profiles for the ‘just transition’


Limpopo Province near Lephalale and two coal plants – Matimba and Medupi. The Waterberg Coalfield contains an estimated 75 Gt of coal resources and is underexploited due to deeper orebodies and transport and water constraints (DMR, 2009; DOE, 2016). Given the climate change mitigation requirements, clean coal technologies would be essential for this expansion to be viable.
Coal mining communities
Coal mines are located in two metropolitan municipalities and 19 local municipalities (see Figures 6 and 7), home to over 10 million people. More specifically, there are 69 mining host communities (settlements located close to a coal mine) which are home to about 2.5 million people. These communities are classified as cities,
334 JUNE 2023 VOLUME 123 The Journal of the Southern African Institute of Mining and Metallurgy
Figure 5 Predicted reduction in total annual coal production in South Africa from the year 2023 to 2057, based on current life of mine (LOM) of all operating coal mines. Mines with no publicly available LOM data are shown in the blue box
Figure 4 Coal mine employment in South Africa from 1981 to 2022, with the main reduction in jobs being due to mine closure in KwaZulu-Natal in the 1980s. Data sources: Binns and Nel (2003), Minerals Council South Africa (2022)
Assessing coal mine closures and mining community profiles for the ‘just transition’
towns, townships, rural villages, mine/plant villages, and informal settlements on mine land, based on population size, demographics, location, and history. In the past, thousands of mineworkers lived in mine accommodation (mostly single quarters). However, the majority of the mine villages have been removed and, in a few places, informal settlements have developed.

More than half of the people live in four cities (eMalahleni, Newcastle, Vereeniging, Springs), a quarter live in 16 townships, a fifth live in 26 towns, and the remaining 2% live in rural villages, mine/plant villages, and on mined out-land (see Table IV). These towns comprise both pre-existing towns (16 towns) like Middelburg and Bronkhorstspruit and those established to support mining and
power generation (10 towns) like Dundee and Glencoe. Figure 4 shows that these communities are concentrated in the western part of Mpumalanga (particularly eMalahleni Local Municipality and Steve Tshwete Local Municipality) and the northwestern part of KwaZulu-Natal.
Census 2011 data shows that many people in these communities have low levels of income, employment, and education which could hinder the just transition (Table V). Overall, 37% are living below the poverty line of R19 600 annual household income (SDG 1), only 46% of adults have a Grade 12 or NQF4 qualification or higher (SDG 4), and 36% of the labour force is unemployed (SDG 8). In terms of basic services, 9% lack access to piped water in their
335 The Journal of the Southern African Institute of Mining and Metallurgy VOLUME 123 JUNE 2023
Table
Figure 6 Coal mining communities and local municipalities in South Africa
III
Province Mines Mining companies Total annual Maximum life of production (Mt/a) mine (years) Gauteng Bekezela, Sukuma Canyon Coal 1.2 36 KwaZulu-Natal Aviemore Buffalo Coal 0.4 15 Limpopo Makhado, Soutpansberg MbeYashu, MC Mining, 27.5 38 Coal Project, Dalyshope Thungela Mpumalanga Clydesdale, Eloff, Mbuyelo Coal, Canyon Coal, Roodepoort, Maboko, Rirhandzhu, Glencore, Sasol, Thungela, Boschpoort, Ukwenama, Umzila, Salunguno Group, TerraCom, >4.82 39 Sukuma, Gugulethu, Gila, Thuso, Ndalamo Resources
Alexander, Elders, Sterkfontein
Summary of planned coal mine expansions and projects in South Africa
Springboklaagte,
Assessing coal mine closures and mining community profiles for the ‘just transition’
dwelling or yard (SDG 6), 15% lack formal housing, 15% lack refuse removal (SDG 11), and 10% do not use electricity as their main source for lighting (SDG 7).
These averages hide the significant inequality between communities, visually shown by the SDG barometers in Figure 8. The living conditions and level of basic services are much higher in towns and cities and much lower in rural villages, which are underserviced, have 57% of households below the poverty line, and 54% female residents (see Table V). Active mining areas also host a few male-dominated villages that are relatively well off, while inactive mining areas host a few informal settlements that are the worst off out of all types of communities (see Table V). The data shows the impact of mine closure that has already taken place, giving an indication of what may ensue in the coming decades as more mines close. The results also show that it is going to be
very difficult to achieve the SDGs and South Africa’s National Development Plan goals in these communities by 2030 without a significant collaborative effort on the part of the government, mining companies, civil society, and the communities themselves.
Coal mining local municipalities
Coal mines in South Africa are spread across five provinces, ten district municipalities, two metropolitan municipalities, and 19 local municipalities (see Table VI). Of the local municipalities, five are categorized in the South African Municipal Infrastructure Investment Framework (MIIF) as B1, as they have a ‘secondary city’, three are categorized as B2, with a large town, seven are B3 municipalities home to several small towns, and four are B4 (rural) municipalities. The AGSA findings for municipalities in 2021 (see Table VI) show that:

336 JUNE 2023 VOLUME 123 The Journal of the Southern African Institute of Mining and Metallurgy
*Excludes 9,132 people in mine villages that have since been removed
Table IV
Community type Number of Area Population Households Household Gender Race communities (km2) size (% female) (% non-white) Cities 4 1,014 1,326,979 377,798 3.5 50.4 89.3 Towns 26 1,185 496,035 145,260 3.4 48.7 67.8 Townships 16 272 626,264 179,278 3.5 49.0 99.8 Rural villages 13 362 43,388 7,399 5.9 53.9 100.0 Mine and power plant villages* 5 98 4,413 1,743 2.5 35.6 80.0 Mine land with informal settlements 5 92 6,177 2,543 2.4 38.1 92.0 Total 69 2,929 2,515,082 718,055 3.5 49.7 87.8
Summary of demographic data for all coal mining communities in 2011. Data source: Census 2011 SuperCross database (StatsSA, 2014)
Figure 7 Coal mining communities, coal mines and coal plants in Mpumalanga
Assessing coal mine closures and mining community profiles for the ‘just transition’
➤ Only two host municipalities had a clean audit, six had an unqualified audit with findings (the municipality produced quality financial statements, but struggled to produce quality performance reports and/or to comply with all key legislati)
➤ Ten had a qualified audit with findings (financial statements contained material misstatements and the municipality had challenges with the quality of the performance report and/or compliance with key legislation)
➤ One (Emakhazeni) had an adverse audit (financial statements contained so many material misstatements that the AGSA disagreed with virtually all the amounts and disclosures)
➤ One (Lekwa) had a disclaimed audit (the municipality could not provide evidence for most of the amounts and disclosures in the financial statements).
National Treasury’s municipal financial data (see Table VI) shows that there was almost R7 billion (US$376 million) of ‘unauthorized, irregular, fruitless, and wasteful expenditure’ (UIFW) in 2021 in these host municipalities. Thus, most local municipalities hosting coal mining do not have adequate financial and performance management in place. Local politics affects the governance of the municipality, and the recent 2021 local elections saw a major shift away from single party dominance to coalitions and minority governments (see Table VI). It is too early to tell whether this will improve or hinder good governance and potential improvement in the provision of basic services.
Discussion
Local implications and considerations
The poverty and poor living conditions of thousands of people in coal mining host communities is distressing and is not being adequately addressed by the government. A major concern is the high unemployment rate of 39%, which is much higher than in other developing-country coal economies like India (7.7%) and Indonesia (3.8%) (World Bank, 2023), although the South African population is much smaller. This poses a threat to the social licence to operate for coal mining companies, which in turn is an energy security risk and economic risk for the country. Stakeholder engagement with communities is essential but, despite good efforts from some companies, is often overlooked by others (Hallowes and Munnik, 2019). Many of these communities have experienced mine closures and do not have the skills and opportunities to take advantage of the inevitable transition, let alone the transition to clean energy. The majority of renewable energy development has taken place in the Northern Cape, far from those living in the coalfields, although eMalahleni has been identified as a Renewable Energy Development Zone (REDZ) based on its solar PV potential and proximity to transmission infrastructure (DEA and CSIR, 2019).
Much of the focus of the ‘just transition’ is on supporting mineworkers. However, most of the coal mining communities are small towns and townships that are dependent on coal mining for the local economy. For example, 57% of businesses in Steve Tshwete local municipality offer services to either coal mines or coal plants (Semelane et al., 2021) and hundreds of small businesses rely on spending by direct and indirect coal workers (Pai et al., 2021). Globally, mining regions have generally struggled to cope with mine closure and the resulting economic loss, often leading to regional decline and effective town abandonment (Nel, Marais, and Mqotyana, 2023). Literature on regional resilience identifies key elements as strong local leadership, endogenous knowledge,
innovation, willingness to change, experience from previous crises, access to funds, transferrable skills, and willingness to retrain, coupled with the availability of resources and market opportunities for a ‘new’ economy (ibid.). The just transition must take all these factors into account.
There are good reasons for mining communities being included in equity positions in mine site IPPs, leading to potential longterm financial flows into the communities. The significant financial resources being utilized by the mining industry for corporate social investment and social and labour plans (SLPs) could be more strategically spent to support the just transition. Mining companies have spent billions of rands over the past 15 years on SLPs but it is unclear how sustainable that spend has been and research in this area is required. The mining industry needs to rethink the model for mines benefiting host communities, as is being done in the Impact Catalyst initiative in Mpumalanga and Limpopo provinces (Impact Catalyst, 2023), and this could be facilitated by the just transition.
Municipal audits show that most of the local municipalities that host coal mines do not have adequate financial and performance management and misspent almost R7 billion in 2021. This is unacceptable given the poor living conditions of so many people in these communities, and the significant financial needs of ensuring that the energy transition is just. Local municipalities are very dependent on large businesses such as mines who are big users of water and electricity, which make up a significant part of the municipal operating budget (Ledger, 2021), about 40% on average in 2021 (StatsSA, 2022). The closure of coal mines could mean that the municipalities struggle to cope with the resultant loss of revenue and basic service delivery to the communities suffers.
National implications and considerations
South Africa’s shift from fossil fuels to renewable energy is inevitable. Disastrous mega coal-fired power station projects have led to dramatic rises in electricity tariffs and damag to the economy (Kruger and Alao, 2022). Worldwide renewable energy investment has created twice as many jobs as investment in fossil fuels (UNIDO and GGGI, 2015), evident in over 50 000 renewable energy jobs created in 2020 (IRENA, 2022), and 12 planned coal-fired power plants have been cancelled in recent years (Global Energy Monitor, 2022). The cost of solar and wind energy has declined consistently over the past decade in South Africa (Evans, 2021) and renewable energy projects appear to have been generally delivered on time and on budget. Importantly, the projects are short-term with revenue being generated relatively soon after capital expenditure begins. The latest REIPP bid window (DMRE, 2023) asks for 4200 MW (similar in capacity to the new coal-fired plants, although with lower steadystate production), with power available on the grid in less than three years from closure of the bid window, compared to more than 12 years for the new Medupi and Kusile coal plants.
The main techno-economic argument in favour of coal power is that solar and wind cannot provide uninterrupted power and that energy storage is still expensive, despite solar and wind power being cheaper than coal at a levellized cost basis (Pai et al., 2021). In addition, the transmission grid does not extend to potential renewable energy sites, although Eskom is looking at ways to accelerate the rollout of new transmission lines. Current thinking is that coal power will be required during peak electricity usage times (evenings and mornings) when the sun does not shine, or wind may not blow, and for managing the grid throughout the day owing to the intermittency of renewables. However, rapid improvements in storage technologies are bringing down renewable energy storage
337 The Journal of the Southern African Institute of Mining and Metallurgy VOLUME 123 JUNE 2023
Assessing coal mine closures and mining community profiles for the ‘just transition’


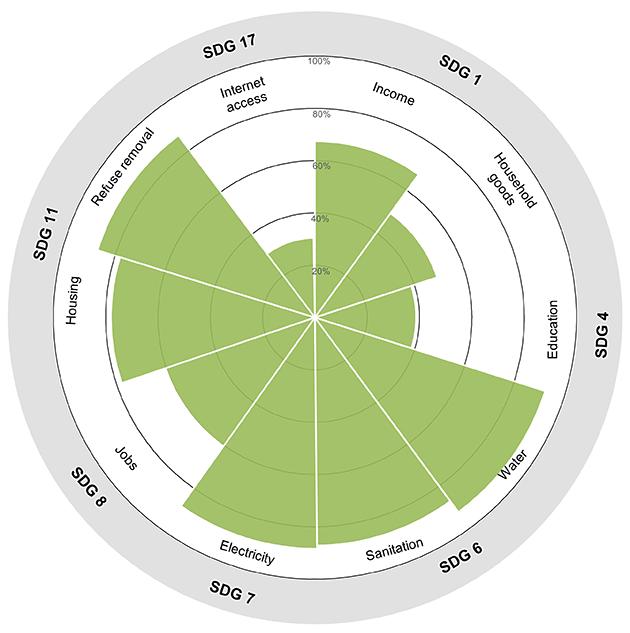


338 JUNE 2023 VOLUME 123 The Journal of the Southern African Institute of Mining and Metallurgy
Figure 8 SDG barometers for coal mining communities in South Africa (green triangles show socio-economic indicator status in 2011)
a: Cities b: Towns
c: Townships d: Rural villages
e: Mine/plant villages
d: Informal settlements
Assessing coal mine closures and mining community profiles for the ‘just transition’
Table V
Socio-economic indicators for all coal mining communities in 2011. Data source: Census 2011 SuperCross database (StatsSA, 2014)
Audit findings and political parties for municipalities that host coal mines
* Unauthorised, irregular, fruitless and wasteful expenditure
339 The Journal of the Southern African Institute of Mining and Metallurgy VOLUME 123 JUNE 2023
Table VI
Province District Local Type of Audit finding UIFW* expenditure in Elected political Number of municipality municipality municipality for 2020/21 2020/21(R million) parties in 2021 coal mines Mpumalanga Nkangala eMalahleni B1 Qualified 644 ANC majority 19 Steve Tshwete B1 Clean 107 ANC majority 13 Emakhazeni B2 Adverse 23 ANC majority 2 Victor Khanye B3 Qualified 182 ANC majority 9 Thembisile Hani B4 Qualified 21 ANC majority 1 Gert Sibande Lekwa B3 Disclaimed 286 LCF-EFF minority 1 Govan Mbeki B1 Qualified 980 ANC majority 7 Msukaligwa B2 Qualified 258 ANC majority 1 Mkhondo B3 Unqualified 180 Independent-EFF-ATM minority 2 Gauteng Ekhuruleni A Clean 227 DA coalition 1 City of Tshwane A Unqualified 3 490 DA coalition 2 Free State Fezile Dabi Metsimaholo B2 Qualified 91 DA minority 2 Emadlangeni B3 Qualified 41 IFP coalition 1 Amajuba Dannhauser B4 Qualified 22 IFP-EFF minority 1 Newcastle B1 Unqualified 36 IFP coalition 2 KwaZulu- Umzinyathi Endumeni B3 Qualified 44 IFP minority 2 Natal uThungula uMlalazi B4 Unqualified 36 IFP majority 1 uMhlatuze B1 Clean 12 IFP-DA-EFF coalition 2 Zululand Abaqulusi B3 Qualified 218 IFP minority 1 Ulundi B4 Unqualified 44 IFP majority 1 Limpopo Waterberg Lephalale B3 Unqualified 23 ANC majority 1
SDG Indicator Cities Towns Townships Rural villages Mine /power Mine land with TOTAL plant villages informal settlements SDG 1 Annual household 56.7 74.8 67.5 45.3 82.6 63.4 63.1 No Poverty income >R19,600 (%) Household ownership 68.2 72.5 49.2 58.3 62.6 20.0 64.0 of a fridge (%) SDG 4 Adult education level 45.9 56.8 38.7 25.4 40.5 20.4 45.8 Education NQF4/Grade 12 or higher (%) SDG 6 Persons with access to piped 90.1 94.0 92.4 37.4 95.2 16.2 90.3 Water and water in dwelling or yard (%) Sanitation Persons with access to a toilet (%) 80.1 87.5 87.2 13.6 95.7 16.1 82.0 SDG 7 Persons with electricity as 88.8 94.4 88.4 77.2 97.0 14.4 89.3 Energy main source of lighting SDG 8 Employed labour force (%) 61.1 75.7 60.3 36.1 65.5 68.4 63.1 Decent Work SDG 11 Persons with formal housing 87.3 88.6 78.0 74.5 97.1 23.9 84.8 Sustainable Cities Persons with municipal 86.4 91.9 87.0 0.8 94.0 1.9 85.8 and communities refuse removal SDG 17 Household internet access (%) 38.5 48.3 30.5 23.3 32.0 20.9 38.2 Partnerships Well-being Score 7.0 7.8 6.8 3.9 7.6 2.7 7.1
Assessing coal mine closures and mining community profiles for the ‘just transition’
costs further, which will aid renewables to provide consistent and cheap power throughout the day (ibid.).
The country needs to prioritize energy security to support economic growth and job creation that will build the momentum for social progress. South Africa still has significant untapped mineral resources that are of strategic interest to the rest of the world, and mining and processing operations could expand if the policy and investment environment is right (MISTRA, 2018). Mining has been a catalyst of and major contributor to the national economy since the mid-1800s and this is likely to continue. This means that energy demand will increase, and coal plants and coal mining will be required for many years to come. Much can be done to improve the social impact and reduce the negative environmental impact of coal mining. The national government needs to partner with mining companies and communities to support the most effective means of maximizing benefit from the country’s coal resources.
Regional implications and considerations
South Africa operates within the regional context of the Southern African Development Community (SADC), which is an electricitypoor region where only 50% of residents have access to electricity (SADC, 2023). In 1995, the Southern African Power Pool (SAPP) was set up as a cooperative venture between 13 national electricity companies to create a regional power grid and common electricity market to improve access to electricity in the SADC (SAPP, 2023). The SAPP allows for bilateral agreements between national utilities, and trading arrangements through SAPP where excess power is auctioned. Although South Africa is the biggest power producer by far (73% of operating capacity in the SAPP), it imports hydropower from Mozambique’s Cahorra Bassa dam (SAPP, 2022). South Africa, can and sometimes does, export to Lesotho, Swaziland, Mozambique, Botswana, Zimbabwe, and Namibia, though they experience load reduction when Eskom implements load-shedding. Thus South Africa’s management of national electricity generation and distribution has direct economic implications for SADC countries.
South Africa has an important role to play in supporting socioeconomic development in the SADC region through electricity exports, and the country’s coal-fired power could be exported to the SADC in the medium term to address the regional energy deficit and promote energy security. This could ensure that no new coal plants are built elsewhere in the SADC while also ensuring that the region does not end up with less energy in a bid to mitigate climate change. High interest rates, lack of capital, and limited electricity grids across Africa mean that investment in decentralized renewable energy is much more likely on the continent.
Conclusion
South Africa is dependent on coal mining for power generation and economic growth, but is planning to reduce this dependence as coal plants are decommissioned and renewable energy is rolled out. Despite the narrative that coal mines will close prematurely to meet climate mitigation commitments to the UNFCCC, data shows that coal mines will be closing regularly over the coming decades as resources are depleted and new projects will replace only a small part of total production. These mine closures will impact the 2.5 million people living in 69 communities who benefit directly and indirectly from coal mining. Although there are significant inequalities in standards of living and thus resilience to shocks, all these people will be affected to some degree. Addressing community
needs requires significant efforts to improve local governance across municipalities, which will be critical to the success of a just transition to a lower carbon economy in South Africa. The just transition is possible through firstly, a dual energy generation strategy of coal and renewable energy with a net renewable energy outcome; secondly, regional collaboration in the SADC, where the comparative advantages of surrounding countries is applied; and thirdly, political will and integrity to enable the investment and development required for the just transition to manifest.
Acknowledgements
Funding for the lead author (MJC) from the University of Cape Town’s University Research Committee (URC) is gratefully acknowledged.
CRediT statement
MC: conceptualisation, methodology, investigation, validation, formal analysis, writing – original draft, visualization; MM: conceptualisation, writing – reviewing and editing, AvZ: conceptualization, writing - reviewing and editing.
References
Auditor-General South Africa. 2022. Consolidated General Report on local government audit outcomes MFMA 2020-21, AG Consolidated General Report on the Local Government Audit Outcomes FY 2018/19. Pretoria: Pretoria.: https://www.agsa.co.za/Portals/0/Reports/MFMA/201819/GR/MFMA GR 2018-19 Final View.pdf
Binns, T. and Nel, E. 2003. The village in a game park: Local response to the demise of coal mining in KwaZulu-Natal, South Africa. Economic Geography, vol. 79, no. 1. pp. 41–66. doi: 10.1111/j.1944-8287.2003.tb00201.x
BP. 2022. BP Statistical Review of World Energy 2022. 71st edn. https://www.bp.com/ content/dam/bp/business-sites/en/global/corporate/pdfs/energy-economics/ statistical-review/bp-stats-review-2022-full-report.pdf
Bega, S. 2022. Eskom workers: ‘We’re in the dark about just transition plans’, Mail & Guardian, 9 December. Available at: https://mg.co.za/environment/2022-12-09eskom-workers-were-in-the-dark-about-just-transition-plans/
Chamber of Mines of South Africa. 2018. National Coal Strategy for South Africa 2018. Minerals Council South Africa, Johannesburg. https://www. mineralscouncil.org.za/component/jdownloads/send/25-downloads/535-coalstrategy-2018
Climate Action Tracker. 2022. Climate Action Tracker South Africa.: https:// climateactiontracker.org/countries/south-africa/targets/ (accessed: 27 June 2023).
Climate Watch. 2023. South Africa. https://www.climatewatchdata.org/countries/ ZAF?end_year=2020&filter=2216%2C2217%2C2218%2C2219&start_ year=1990 [accessed 26 June 2023]).
Cole, M.J. and Broadhurst, J.L. 2020. Mapping and classification of mining host communities:A case study of South Africa. The Extractive Industries and Society, vol. 7, no. 3. pp. 954–964. doi: 10.1016/j.exis.2020.06.007
Cole, M. J. and Broadhurst, J. L. 2021. Measuring the sustainable development goals (SDGs) in mining host communities: A South African case study. The Extractive Industries and Society, vol. 8, no. 1. pp. 233–243. doi: 10.1016/j. exis.2020.11.012.
Cole, M.J. and Broadhurst, J.L. 2022. Sustainable development in mining communities: The case of South Africa’s West Wits Goldfield. Frontiers in Sustainable Cities, vol. 4 (June). pp. 1–15. doi: 10.3389/frsc.2022.895760
DEA. 2013. Long Term Adaptation Scenarios Flagship Research Programme (LTAS) for South Africa. Summary for Policy-Makers. Department of Environmental Affairs, Pretoria.
DEA and CSIR. 2019. Phase 2 Strategic Environmental Assessment for Wind and Solar PV Energy in South Africa. Department of Environmental Affairs, Pretoria. https://www.dffe.gov.za/sites/default/files/reports/phase2sea_ windsolarphotovoltaicenergy.pdf
340 JUNE 2023 VOLUME 123 The Journal of the Southern African Institute of Mining and Metallurgy
Assessing coal mine closures and mining community profiles for the ‘just transition’
DMR. 2009. The future role of the Waterberg Coalfield in South Africa’s coal industry. Department of Mineral Resources,Pretoria.
DMR. 2020. Statistical tables 2019. Department of Mineral Resources, Pretoria. https://www.statssa.gov.za/publications/P2041/P2041June2019.pdf
DMRE. 2019. Integrated Resource Plan 2019. Department of Minerals and Energy, Pretoria.
DMRE. 2023. Independent Power Producer Procurement Programme, IPP Renewables. Department of Minerals and Energy, Pretoria. https://www.ipprenewables.co.za/ [accessed: 17 February 2023].
DOE. 2016 South African Coal Sector Report. Department of Energy. Pretoria. Eskom. 2021. Coal in South Africa, Fact Sheet. https://www.eskom.co.za/wpcontent/uploads/2021/08/CO-0007-Coal-in-SA-Rev-16.pdf
Eskom. 2022. As Komati coal-fired power station reaches end of life, renewable energy project takes shape, Media Statement. Available at: https://www.eskom. co.za/as-komati-coal-fired-power-station-reaches-end-of-life-renewableenergy-project-takes-shape/ (Accessed: 1 March 2023).
Evans, J. 2021.The real deal with renewable energy in South Africa — Unpacking the suite of options. Daily Maverick, 8 November. https://www.dailymaverick. co.za/article/2021-11-08-the-real-deal-with-renewable-energy-in-south-africaunpacking-the-suite-of-options/.
Frith. A. 2019. Census 2011. https://census2011.adrianfrith.com/ [accessed: 1 June 2019].
Global Energy Monitor. 2022a. Global coal plant tracker. https:// globalenergymonitor.org/projects/global-coal-plant-tracker/
Global Energy Monitor. 2022b. Coal mine tracker. https://globalenergymonitor. org/projects/global-coal-mine-tracker/.
Hallowes, D. and Munnik, V. 2019. Down to zero: The politics of just transition. groundWork. https://groundwork.org.za/wp-content/uploads/2022/07/downto-zero.pdf
Independent Electoral Commission. 2023. Municipal election results 2021https://results.elections.org.za/home/downloads/me-results [accessed 23 February 2023].
IRENA. 2020. Renewable energy prospects: South Africa. International Renewable Energy Agency, Abu Dhabi.
IRENA. 2022. Global Atlas for Renewable Energy. International Renewable Energy Agency Abu Dhabi.
IRENA and ILO. 2021. Renewable Energy and Jobs - Annual Review 2021, International Renewable Energy Agency. Abu Dhabi and International Labour Organisation, Geneva:.
Kramer, K. 2022. Making the Leap: The need for Just Energy Transition Partnerships to support leapfrogging fossil gas to a clean renewable energy future. IISD Policy Brief. International Institute for Sustainable Development, Winnipeg, Manitoba.
Kruger, W. and Alao, O. 2022. The status of South Africa’s Renewable Energy Independent Power Projects Procurement Progamme. Graduate School of Business, University of Cape Town.
Ledger, T. 2021. Broken promises: Electricity for low-income households: good policy intentions, bad trade-offs and unintended consequences. https://pari2. wpenginepowered.com/wp-content/uploads/2021/04/broken-promises21-0421c.pdf
Marquard, A., Merven, B., Hartley, F., McCall, B., Ahjum, F., Burton, J., Hughes, A., von Blottnitz, H., Ireland, G., Schers, J., Dane, A., Cohen, B., Winkler, H., McGregor, J., and Stevens 2021. South Africa’s NDC Targets for 2025 and 2030. https://pccommissionflow.imgix.net/uploads/image s/1eb85a_75d745eb859d43c288f461810b336dd3-compressed.pdf.
Mbuyelo Coal. 2022. Mbuyelo Coal mining areas. https://mbuyelocoal.com/ projects/ [accessed 18 February 2022].
Minerals Council South Africa. 2022. Facts and Figures 2021. Johannesburg. Minerals Council South Africa. 2023. Facts & Figures Pocketbook 2022. Johannesburg.
National Treasury. 2022. Municipal money data. Pretoria. https://municipaldata. gov.za/ [accessed: 12 April 2023].
Nel, E., Marais, L., and Mqotyana, Z. 2023. The regional implications of just transition in the world’s most coal-dependent economy: The case of Mpumalanga, South Africa. Frontiers in Sustainable Cities, vol. 4. doi: 10.3389/ frsc.2022.1059312
Pai, S., Allen, M.M., O’Hare, K., Barlow, I., Searight, H., Madhu-sudanan, R., and Ward, M. 2021. Understanding just transitions in coal-dependent communities: Case studies from Mpumalanga, South Africa, and Jharkhand, India. Center for Strategic and International Studies (CSIS) and Climate Investment Funds (CIF). https://justtransitioninitiative.org/understanding-justtransitions-in-coal-dependent-communities/
Pierce, W. and Ferreira, B. 2022. Statistics of utility-scale power generation in South Africa in 2021. CSIR Energy Centre, Pretoria.
Pierce, W. and le Roux, M. 2023. Statistics of utility-scale power generation in South Africa. CSIR Energy Centre, Pretoria. https://researchspace.csir. co.za/dspace/bitstream/handle/10204/12067/Statistics of utility-scale power generation in South Africa_Jul_2021.pdf?sequence=1&isAllowed=y
Presidential Climate Commission. 2022. Framework for a Just Transition in South Africa. Draft for public comment. Pretoria.
Republic of South Africa. 2020. South Africa’s Low-Emission Development Strategy 2020. Pretoria.
Republic of South Africa. 2021. South Africa’s First Nationally Determined Contribution Under The Paris Agreement. Pretoria. https://unfccc.int/sites/ default/files/NDC/2022-06/South Africa updated first NDC September 2021. pdf
Ruppert Bulmer, E., Pela, K., Eberhard-Ruiz, A., and Montoya, J. 2021. Global Perspective on Coal Jobs and Managing Labor Transition out of Coal. World Bank. doi: 10.1596/37118
SADC.(2023. SADC Energy. https://www.sadc.int/pillars/energy#:~:text=SADC falls behind in Africa,for Sub-Saharan Africa while [accessed 16 March 2023].
SAPP. 2022. SAPP Statistics 2019-2020.. Southern African Power Pool. https://www. sapp.co.zw/sites/default/files/Statistics%202019-20.pdf
SAPP. 2023. About the Southern African Power Pool. https://www.sapp.co.zw/aboutsapp [accessed: 9 March 2023].
Semelane, S., Nwulu, N., Kambule, N., and Tazvinga, H. 2021. Evaluating available solar photovoltaic business opportunities in coal phase-out regions –An energy transition case of Steve Tshwete local municipality in South Africa. Energy Policy, vol. 155 (April). p. 112333. doi: 10.1016/j.enpol.2021.112333
StatsSA. 2016. SuperCross Census 2011 Version 1. Statistics South Africa, Pretoria. StatsSA. 2022. Statistical Release P9114, Financial census of municipalities for the year ended 30 June 2021. Statistics South Africa, Pretoria. doi: 10.1016/s00225223(12)01451-1
The Presidency Republic of South Africa. 2022. South Africa’s Just Energy Transition Investment Plan (JET IP) for the initial period 2023-2027. Pretoria.
UNIDO and GGGI. 2015. Global Green Growth: Clean Energy Industrial Investments and Expanding Job Opportunities. Volume I: Overall Findings. Global Green Growth Institute, Vienna and Seoul. doi: 10.13140/ RG.2.1.2179.7605
World Bank. 2023. World Bank Data Unemployment, Total (% of labour force). https://data.worldbank.org/indicator/SL.UEM.TOTL.ZS
World Bank Group. 2018. Managing Coal Mine Closure: Achieving a Just Transition for All. http://documents.worldbank.org/curated/ en/484541544643269894/pdf/130659-REVISED-PUBLIC-Managing-CoalMine-Closure-Achieving-a-Just-Transition-for-All-November-2018-final.pdf
Wright, G. and Noble, M. 2009. The South African Index of Multiple Deprivation 2007 at Municipality Level. Department of Social Development, Pretoria. u
341 The Journal of the Southern African Institute of Mining and Metallurgy VOLUME 123 JUNE 2023
Assessing coal mine closures and mining community profiles for the ‘just transition’
CARBON TAX COLLOQUIUM 2023
SOUTH AFRICA AND THE CONTEXT OF THE GLOBAL MINING INDUSTRY
15 NOVEMBER 2023

54 ON BATH, ROSEBANK, JOHANNESBURG
We acknowledge that the intent of carbon tax is to change user behaviour and reduce climate impact. SAIMM wants to evaluate ways to reduce its impact and ensure business viability.
This Colloquium, on the South African Carbon Tax, will provide an understanding of our own unique situation, in South Africa, compared to in the context of the global mining industry. This SA Carbon Tax policy was introduced by the SA government in June 2019, aimed at reducing the country’s greenhouse gas emissions. The aim of the tax is to create a financial incentive for companies to reduce their emissions by switching to cleaner technologies and adopting sustainable practices. Revenue generated from the tax should be used to fund initiatives aimed at promoting energy efficiency and renewable energy. In short: it should be a policy instrument that supports international commitments, a source of revenue that can be used to support initiatives that promote renewable energy, which will in turn create new opportunities for businesses and promote job creation. In specific studies published between 2016 and 2022, it show the negative impact of the carbon tax on economic growth is minimized when the revenue is fed back into the economy. The way carbon tax revenue is recycled back into the economy is important in terms of the extent of emissions reductions achieved. Is the South African carbon tax revenue being recycled efficiently? Or even correctly? Moreover, SA Carbon Tax and its implications for industry, necessitates an evaluation of alternatives to fossil fuel use.
universities, research institutes, development banks and renewable energy supply companies. This colloquium will will endeavour to create a platform for discussion around the following questions:
Are we, in the minerals and metals industry, adequately informed to answer questions about any Carbon Tax policy (National or Global)?
Are we projecting negativity due to the general discontent with the current state of affairs –economic, social and political?
What is our definition of recycling tax revenue ‘efficiently’? Does this depend on perspective?
Is the Minerals and Metals Industry clear on their expectations of and from the South African Carbon Tax policy?

What exactly do we want as professionals and as an Industry?
What options do we as an Industry have? Do we have an option to influence the policy and the tax revenue recycling at all?
Can we ask assistance to analyze the positive and negative aspects of our current strategy and its execution?
342 JUNE 2023 VOLUME 123 The Journal of the Southern African Institute of Mining and Metallurgy Camielah Jardine, Head of Conferencing FOR FURTHER INFORMATION, CONTACT: E-mail: camielah@saimm.co.za Tel: +27 11 538-0237, Web: www.saimm.co.za
NATIONAL & INTERNATIONAL ACTIVITIES
21-22 August 2023 — HMC 2023 Twelth International Heavy Minerals Conference 2023
The Capital Zimbali, Ballito, KwaZulu-Natal, South Africa
Contact: Gugu Charlie
Tel: 011 538-0238
E-mail: gugu@saimm.co.za
Website: http://www.saimm.co.za
23-24 August 2023 — Amira Global Exploration Manager’s Conference 2023
London, United Kingdom
E-mail: owena.duckworth@amira.global
Website: https://mininginnovationnetwork.swoogo.com/ DMA22
28 August 2023-1 September 2023 — Drill and Blast Online
Course 2023 (for five days)
Contact: Camielah Jardine
Tel: 011 538-0237
E-mail: camielah@saimm.co.za
Website: http://www.saimm.co.za
4-7 September 2023 — Geometallurgy Conference 2023
Geomet meets Big Data
Hazendal Wine Estate, Stellenbosch, Western Cape, South
Africa
Contact: Gugu Charlie
Tel: 011 538-0238
E-mail: gugu@saimm.co.za
Website: http://www.saimm.co.za
4-7 September 2023 — 10TH World Gold Conference
Strive for the gold industry development with green and intelligent innovation
Shenyang New World EXPO, China
E-mail: world@china-gold.org
Website: http://world.china-gold.org/en/
12-14 September 2023 — 10TH International Conference on Ground Support in Mining and Underground Construction
Perth, Western Australia
Website: https://www.acggroundsupport.com/
20-21 September 2023 — 6TH Young Professionals Conference 2023
The Canvas, Riversands, Fourways, South Africa
Contact: Gugu Charlie
Tel: 011 538-0238
E-mail: gugu@saimm.co.za
Website: http://www.saimm.co.za
26-27 September 2023 — DIMI SAIMM Diversity and Inclusion Dialogue 2023
Intersectionality in the Minerals Industry From Awareness to Action
Avianto, Muldersdrift Johannesburg, South Africa
Contact: Camielah Jardine
Tel: 011 538-0237
E-mail: camielah@saimm.co.za
Website: http://www.saimm.co.za
24-26 October 2023 — Next Generation Tailings –Opportunity or Risk?
Emperors Palace Conference Centre, Kempton Park, Johannesburg, South Africa
Contact: Camielah Jardine
Tel: 011 538-0237
E-mail: camielah@saimm.co.za
Website: http://www.saimm.co.za
11-13 October 2023 — 11TH International Ground Freezing Symposium 2023
London, United Kingdom
E-mail: events@iom3.org
Website: https://www.iom3.org/events-awards/11thinternational-symposium-on-ground-freezing.html
7-9 November 2023 — Hydroprocess 2023 14TH
International Conference on Process Hydrometallurgy
Sheraton Hotel, Santiago, Chile
Website: https://gecamin.com/hydroprocess/index
15 November 2023 — Carbon Tax Colloquium 2023
South Africa and the context of the global mining industry 54 on Bath, Rosebank, Johannesburg, South Africa
Contact: Camielah Jardine
Tel: 011 538-0237
E-mail: camielah@saimm.co.za
Website: http://www.saimm.co.za
2024
13-14 March 2024 — Southern African Pyrometallurgy 2024 International Conference
Sustainable- Pyrometallurgy - Surviving Today and Thriving Tomorrow
Misty Hills Conference Centre, Johannesburg, South Africa
Contact: Camielah Jardine
Tel: 011 538-0237
E-mail: camielah@saimm.co.za
Website: http://www.saimm.co.za
18-20 June 2024 — Southern African Rare Earths 2ND International Conference 2024
Swakopmund Hotel and Entertainment Centre, Swakopmund, Namibia
Contact: Camielah Jardine
Tel: 011 538-0237
E-mail: camielah@saimm.co.za
Website: http://www.saimm.co.za
3-5 July 2024 — 5TH School on Manganese Ferroalloy Production
Decarbonization of the Manganese Ferroalloy Industry
Boardwalk ICC, Gqeberha, Eastern Cape, South Africa
Contact: Gugu Charlie
Tel: 011 538-0238
E-mail: gugu@saimm.co.za
Website: http://www.saimm.co.za
1-3 September 2024 — Hydrometallurgy Conference 2024 Hydrometallurgy for the Future
Hazendal Wine Estate, Stellenbosch, Western Cape, South Africa
Contact: Camielah Jardine
Tel: 011 538-0237
E-mail: camielah@saimm.co.za
Website: http://www.saimm.co.za
2023 The Journal of the Southern African Institute of Mining and Metallurgy VOLUME 123 JUNE 2023 ix ◀
Company affiliates
The following organizations have been admitted to the Institute as Company Affiliates
3M South Africa (Pty) Limited
acQuire Technology Solutions
AECOM SA (Pty) Ltd
AEL Mining Services Limited
African Pegmatite (Pty) Ltd
Air Liquide (Pty) Ltd
Alexander Proudfoot Africa (Pty) Ltd
Allied Furnace Consultants
AMEC Foster Wheeler
AMIRA International Africa (Pty) Ltd
ANDRITZ Delkowr(Pty) Ltd
ANGLO Operations Proprietary Limited
Anglogold Ashanti Ltd
Arcus Gibb (Pty) Ltd
ASPASA
Aurecon South Africa (Pty) Ltd
Aveng Engineering
Aveng Mining Shafts and Underground
Axiom Chemlab Supplies (Pty) Ltd
Axis House Pty Ltd
Bafokeng Rasimone Platinum Mine
Barloworld Equipment -Mining
BASF Holdings SA (Pty) Ltd
BCL Limited
Becker Mining (Pty) Ltd
BedRock Mining Support Pty Ltd
BHP Billiton Energy Coal SA Ltd
Blue Cube Systems (Pty) Ltd
Bluhm Burton Engineering Pty Ltd
Bond Equipment (Pty) Ltd
Bouygues Travaux Publics
Caledonia Mining South Africa Plc
Castle Lead Works
CDM Group
CGG Services SA
Coalmin Process Technologies CC
Concor Opencast Mining
Concor Technicrete
Council for Geoscience Library
CRONIMET Mining Processing
SA Pty Ltd
CSIR Natural Resources and the Environment (NRE)
Data Mine SA
DDP Specialty Products South Africa (Pty) Ltd
Digby Wells and Associates
DRA Mineral Projects (Pty) Ltd
DTP Mining - Bouygues Construction
Duraset
EHL Consulting Engineers (Pty) Ltd
Elbroc Mining Products (Pty) Ltd
eThekwini Municipality
Ex Mente Technologies (Pty) Ltd
Expectra 2004 (Pty) Ltd
Exxaro Coal (Pty) Ltd
Exxaro Resources Limited
Filtaquip (Pty) Ltd
FLSmidth Minerals (Pty) Ltd
Fluor Daniel SA ( Pty) Ltd
Franki Africa (Pty) Ltd-JHB
Fraser Alexander (Pty) Ltd
G H H Mining Machines (Pty) Ltd
Geobrugg Southern Africa (Pty) Ltd
Glencore
Gravitas Minerals (Pty) Ltd
Hall Core Drilling (Pty) Ltd
Hatch (Pty) Ltd
Herrenknecht AG
HPE Hydro Power Equipment (Pty) Ltd
Huawei Technologies Africa (Pty) Ltd
Immersive Technologies
IMS Engineering (Pty) Ltd
Ingwenya Mineral Processing (Pty) Ltd
Ivanhoe Mines SA
Kudumane Manganese Resources
Leica Geosystems (Pty) Ltd
Loesche South Africa (Pty) Ltd
Longyear South Africa (Pty) Ltd
Lull Storm Trading (Pty) Ltd
Maccaferri SA (Pty) Ltd
Magnetech (Pty) Ltd
Magotteaux (Pty) Ltd
Malvern Panalytical (Pty) Ltd
Maptek (Pty) Ltd
Maxam Dantex (Pty) Ltd
MBE Minerals SA Pty Ltd
MCC Contracts (Pty) Ltd
MD Mineral Technologies SA (Pty) Ltd
MDM Technical Africa (Pty) Ltd
Metalock Engineering RSA (Pty)Ltd
Metorex Limited
Metso Minerals (South Africa) Pty Ltd
Micromine Africa (Pty) Ltd
MineARC South Africa (Pty) Ltd
Minerals Council of South Africa
Minerals Operations Executive (Pty) Ltd
MineRP Holding (Pty) Ltd
Mining Projections Concepts
Mintek
MIP Process Technologies (Pty) Limited
MLB Investment CC
Modular Mining Systems Africa (Pty) Ltd
MSA Group (Pty) Ltd
Multotec (Pty) Ltd
Murray and Roberts Cementation
Nalco Africa (Pty) Ltd
Namakwa Sands(Pty) Ltd
Ncamiso Trading (Pty) Ltd
Northam Platinum Ltd - Zondereinde
Opermin Operational Excellence
OPTRON (Pty) Ltd
Paterson & Cooke Consulting Engineers (Pty) Ltd
Perkinelmer
Polysius A Division Of Thyssenkrupp
Industrial Sol
Precious Metals Refiners
Rams Mining Technologies
Rand Refinery Limited
Redpath Mining (South Africa) (Pty) Ltd
Rocbolt Technologies
Rosond (Pty) Ltd
Royal Bafokeng Platinum
Roytec Global (Pty) Ltd
RungePincockMinarco Limited
Rustenburg Platinum Mines Limited
Salene Mining (Pty) Ltd
Sandvik Mining and Construction
Delmas (Pty) Ltd
Sandvik Mining and Construction
RSA(Pty) Ltd
SANIRE
Schauenburg (Pty) Ltd
Sebilo Resources (Pty) Ltd
SENET (Pty) Ltd
Senmin International (Pty) Ltd
SISA Inspection (Pty) Ltd
Smec South Africa
Sound Mining Solution (Pty) Ltd
SRK Consulting SA (Pty) Ltd
Time Mining and Processing (Pty) Ltd
Timrite Pty Ltd
Tomra (Pty) Ltd
Traka Africa (Pty) Ltd
Trans-Caledon Tunnel Authority
Administarator
Trace Element Analysis Laboratory
Ukwazi Mining Solutions (Pty) Ltd
Umgeni Water
Webber Wentzel
Weir Minerals Africa
Welding Alloys South Africa
Worley
▶ x JUNE 2023 VOLUME 123 The Journal of the Southern African Institute of Mining and Metallurgy
Water cutting services Water cutting services Water cutting services
TEGA’S OPTI-TROMMEL: THE ONE STOP SHOP
info@tegaindustries.co.za
Tega industries Limited (Tega), a pioneer in the field of specialized wear-resistant products, began operations in 1976. Today, Tega is the Market Leader in the segment, exporting to 700+ Customers across 70+ Countries.
Tega has been awarded the Integrated Management System (IMS) certification by SGS India Limited. By virtue of this, Tega is now certified for three management systems: Quality Management System (QMA) - ISO 9001:2015, Environment Management System (EMS) – ISO 14001:2015 and Occupational Health and Safety Management System (OHSMS) – ISO 45001:2018. Tega is also certified for International Standard for Social Accountability SA 8000:2014
Tega has been designing and manufacturing Trommels for Grinding Mills, Ball Mills, SAG Mills, Scrubbers and Pebble Mills. Tega has designed and manufactured Trommels to suit various applications in sizes ranging from 580 mm to 4450 mm in diameter. Over the years, Tega has supplied over 450+ Trommels for various ores like Gold, Chalcopyrite, Iron ore, Nickel and Platinum Groups Metals amongst others.
CONCEPT TO COMMISSION
Tega has the unique advantage of having fully integrated in-house facilities which are utilized for all stages of Trommel production – from concept design, simulation and modeling, to fabrication, Panel manufacturing and final assembly. Our team comprises of engineers, designers, technicians and analysts who carefully analyze all relevant finer details of the end usage to ensure that the equipment set up by us, fits seamlessly into the entire mill process.
In Tega, every piece of the Trommel is specifically manufactured using in-house computerized design programs and tested before being shipped. The outer structure, rubber/ Polyurethane screen panels, Spirals or dams, connecting pipes or flanges are manufactured with precision and attention paid to the minutest of details from concept to finish.
TEGA’S DESIGN ADVANTAGES
Trommel Structure designs undergo extensive analysis by our team of experts, before being readied for manufacturing. Tega uses advanced 3D modeling techniques, DEM (Discrete Element Modeling) and FEA (Finite Element Analysis) to achieve accurate designs.
The DEM allow us to visualize the flow of materials in the Trommel, whereas, The FEA allows us to calculate the equivalent shear stress on the structures and ensure the optimization of the overall Trommel weight and its size. Welding is performed as per AWS D1.1 Standard. The welded Structure is 100% ultrasonically tested and is thermally or electro thermally stress relieved to eliminate stress concentration and increase the fatigue strength of the structure.
Trommel Panel are designed Rubber/Polyurethane Panels based on the operating conditions for various applications or as required by the Customer.
• Reinforcement Strength is tested using FEA.
• Panels Wear Rate and Impact force are tested using DEM.
• Panel Types, Sizes and Fixing are designed to suit the application.
With the help of its fully automated Presses and Injection molding machine, Tega manufactures custom designed panels to suit every kind of application. Tega has the infrastructure to supply aperture sizes ranging from 0.3 mm to 100 mm. The Panels are embedded with Mild Steel Reinforcement to withstand heavy loads as well as to maintain the curvature of the panels.
Trommel Spirals or Dams are analyzed with FEA, DEM and specially stiffened to ensure rigidity to suit customers requirements. The Pitch and Height of the Spirals and dams are designed to ensure that the material flow smoothly and the velocity of slurry is optimized for proper screening.
Tega Spirals or dams are manufactured either as an integral part of the panels or to be fitted separately. The Spirals and dams are manufactured with in-built steel reinforcement, to withstand high slurry forces.
Tega’s Spirals comes with Normal Pith Spirals (NPS) and Reducing Pitch Spirals (RPS). The Reducing Pitch Spirals is a Patented technology by Tega, It facilities to enhance the Trommel efficiency given Geometric constraints of the existing Trommel Structure.
Auto Clave Facility is used for hot vulcanize the Trommel structure. The auto calve machinery can be used on Trommel up to 3800 mm diameter.
Rubber/ Polyurethane Coating are lined on all the Wet Surface of the Trommel, to provide superior protection against corrosion.
• Trommels up to 3800 mm in diameter, are rubber lined on wet surfaces using hot bonding method.
• Trommels greater than 3800 mm in diameter, are spray coated with Polyurethane or lined by cold bonding of rubber.
TEGA’S TROMMEL SERVICES
Trouble Shooting
At Tega, we offers our services towards the enhancement of Trommel efficiency. Tega examine Trommels in use, make suggestions to improve existing panel life or improve efficiency and supply spare for panels, spirals and dams when required.
Site Services
As a part of our value added service, we provide our customers with an experienced team to supervise Trommel installation at the final location.
Wear Measurement
To help our customers plan ahead for maintenance shut down and inventory optimization, we provide them with estimated wear measurement schedules and change our dates of panels and spirals or dams.
Refurbishing
The refurbishing of Trommels is undertaken by Tega, where the Trommel is thoroughly inspected and if required re-engineered, repaired, replaced and restored for optimum performance, making it as good as new.
www.tegaindustries.com
It’s a big milestone for a piece of rubber. But Linatex ® is so much more than that. It’s unlike anything else, using a unique 95% natural latex formula that has made Linatex ® the strongest rubber in mining for the last century – exactly as nature intended. So, here’s to 100 Years Strong, and the next 100 to come.


Learn more at linatex100.weir


Copyright© 2023, Linatex Limited. All rights reserved.
