


Climate Resilience in Indian Cities: Review of the perception, aspirations, and the actions Case of Surat 3 Climate Resilience in Indian Cities: Review of the perception, aspirations, and the actions, case of Surat Sanjana Baidya Dr. Subhrangsu Goswami Roll №: PUP20307 Faculty of Planning Ahmadabad,2022 India

Climate Resilience in Indian Cities: Review of the perception, aspirations, and the actions Case of Surat4 Intellectual Property Rights (IPR) and Publications:
CEPT University reserve the right to use the outputs of the research/thesis project for dissemination and publicity ensuring proper acknowledgment to the Student and Supervisor/s.
The copyright for this report shall remain equally with CEPT University. All publications arising from this research/thesis project will acknowledge the concerned members of the organization.
Climate Resilience in Indian Cities: Review of the perception, aspirations, and the actions Case of Surat 5 This thesis is dedicated to my parents and my dadu.
Climate Resilience in Indian Cities: Review of the perception, aspirations, and the actions Case of Surat6
{sign Namehere.}ofstudent: Sanjana Baidya Roll №: PUP20307 Date : 13th May, 2022 Place : Ahmadabad
Undertaking I, Sanjana Baidya, the author of the DRP report titled “Climate Resilience in Indian Cities: Review of the perception, aspirations, and the actions, case of Surat”, hereby declare that this is an independent work of mine, carried out towards partial fulfilment of the requirements for the award of Master’s Degree at Faculty of Planning, CEPT University, Ahmadabad. This work has not been submitted to any other institution for the award of any Degree/Diploma.
Climate Resilience in Indian Cities: Review of the perception, aspirations, and the actions Case of Surat 7
Climate Resilience in Indian Cities: Review of the perception, aspirations, and the actions Case of Surat8
Certificate This is to certify that the DRP report titled “Climate Resilience in Indian Cities: Review of the perception, aspirations, and the actions, case of Surat”, has been submitted by Ms. Sanjana Baidya towards partial fulfilment of the requirements for the award of Masters Degree. This is a bona-fide work of the student and has not been submitted to any other university for award of any SignatureDegree/Diploma.ofProgram Chair Signature of Guide: Date: 30th April 2022

Climate Resilience in Indian Cities: Review of the perception, aspirations, and the actions Case of Surat10
Finally, I want to express my gratitude to God for guiding me through all of my challenges. Day by day, I have felt your guiding. You are the one who allowed me to complete my degree. I will continue to put my faith in you for my future.
“Climate Resilience in Indian Cities: Review of Perceptions, Aspirations, and Actions, Case of Surat,” which enabled me to conduct extensive research and learn about many new things. This is quite helpful. Without my parents’ support and supervision, no endeavour at any degree can be performed satisfactorily. Despite their busy schedules, they provided me with the best moral support imaginable during my thesis.
It is my pleasure to express my gratitude to my friend Yasin Kabaria for being my Library partner, assisting me during field visits, providing me with technical advice during my thesis, and dealing with all of my last-minute mental breakdowns.
All of the stakeholders I interviewed during my field visit in Surat deserve my gratitude. They were quite helpful and provided me with any and all data and information I requested.
I’m grateful to my friends Shruti, Pratyusha, Suhasini, Shravya, Snehal, Siddhesh, and many others for the stimulating debates, sleepless hours spent working with each other before deadlines, and all the fun we’ve had over the past two years.
Acknowledgments
I am overwhelmed with gratitude and humility to acknowledge my appreciation to all those who have assisted me in putting these concepts, far beyond the realm of simplicity, into something I’dsolid.like
Climate Resilience in Indian Cities: Review of the perception, aspirations, and the actions Case of Surat 11
to express my heartfelt gratitude to my DRP guide, Dr. Subhrangsu Goswami, for providing me with the wonderful opportunity to work on this wonderful project on the topic
Source: Google Image

Urbanization is a demographic phenomenon that exhibits a long-term progressive process of population concentration in urban areas. Data reveals that the rate of urban population growth is indeed higher than the rate of population growth globally, indicating a faster rate of urbanization.
Abstract
Nowadays cities are facing major challenges due to rapid urbanization and the entire world is reeling from its perils of it. Increased density is a major threat to cities, as it puts pressure on land and other infrastructure services, resulting in unplanned and unauthorized settlements, settlements in hazard-prone locations, a lack of capacity, and the negative consequences of climate change. Because of these underlying risk drivers, the impact of natural disasters can be extreme in urban areas. Hence cities must respond effectively to harness the negative externalities of urbanization to create a sustainable and resilient urban development. The notion of resilience is the capability to bounce back. The word resilience was first introduced in the subject of ecology, and it quickly expanded throughout the world in the paradigms of numerous specialties, ranging from ecology to psychology to economics. There are three types of resilience namely- engineering, ecological and evolutionary. Cities being so the complex socio-ecological system is a combination of both ecological and engineering resilience. The majority of the urban resilience is ecological but when it comes to disaster management, economics, and public policy, it is more likely to be engineering resilience. When it comes to climate resilience, several international, national, and state-level initiatives have been taken to deal with the adverse effect of climate change and create a resilient and livable environment. Despite gaining worldwide notice when it comes to Indian cities, most of the time urban resilience fails to address important parameters like social vulnerability, Inclusivity, and equity. Hence Indian cities must assess their capacity and dangers holistically, particularly through genuine interaction with the most disadvantaged and vulnerable population of their communities. Keeping all these factors into consideration, the thesis aims to assess the impact of climate change in India and understand the emerging role of urban planning in achieving equitable climate resilience to make the city more livable, sustainable, and economically viable. The entire thesis is divided into three major objectives. They are as followsThe first objective is to review the relevance of existing climate action frameworks in the context of Global and Indian cities which will mainly show the dichotomy and cohesion between various national and international actions. To strengthen my analysis, I have researched on Climate Change Performance Index 2022, which is an independent monitoring instrument to track climate protections of 60 nations based on 4 parametersGHG emission, Energy Use, Renewable energy, and Climate Policy. The countries have been categorized based on their performance from high to very low. So, for my analysis, I have considered 5 countries from each category (Denmark, India, Indonesia, Ireland, and Algeria) and further studied the national action plans of those countries. Here in this objective, I have come across interesting observations on India’s National Determined Contribution, the recent Net-zero pledge taken in COP 26, the need for intermediate goals in the national action plan, and finally need for more adaptation strategies and their proper framework for implementation.
A city is a complex socio-ecological system that is not just a congregation of people but also services and infrastructure associated with them.
The second objective is a perception study of various stakeholders across India in the context of climate resilience.
Climate Resilience in Indian Cities: Review of the perception, aspirations, and the actions Case of Surat 13
Climate Resilience in Indian Cities: Review of the perception, aspirations, and the actions Case of Surat14
The approach is to make recommendations at all levels, from macro to micro based on the objectives. The task at hand was to tie all of the macro to micro ideas together so that they could be implemented in every Indian city depending on its unique circumstances. The thesis provides with a more comprehensive understanding of global climate action, as well as India’s efforts and attitude on the subject.
In developing countries like India, stakeholders play important role in shaping various climate activities. As a part of the research, various stakeholders have been identified across India who are directly or indirectly associated with climate change-related initiatives. The stakeholders have been broadly categorized into 6 parts- National government, local government, private agency, NGO, civil society group, and academicians. The goal is to gain a better understanding of the synergies and gaps between academics and practicing professionals’ perspectives in the field of climate change. Survey questions have been designed and distributed to various stakeholders across India, both digitally and manually, to achieve the goal.
The third objective is to review the initiatives taken by the city of Surat to withstand the adverse effects of climate change. This objective includes are broader understanding of the climate-induced vulnerability of Surat and the identification of indicators based on demography, socio-economy, infrastructure, and environmental aspects. Then I tried to understand the direct and indirect relationship of these indicators to climate change in Surat. I interacted and met with a number of the stakeholders in Surat and attempted to understand their perspectives and actions on behalf of the government in Surat on climate resilience. Finally, after comprehending all the aspects together, based on my observations I have come across some sectoral level recommendations which can be followed by all other cities in India. As correctly stated by World Economic Forum, I believe in the fact that- “A city can become resilient if its people are healthy and have access to basic services; if its people are safe, socially cohesive with reliable employment supporting a sustainable economy; if the city’s ecosystem, infrastructure, and services are well-balanced catering to the well-being of its people; and if the city leadership and local communities work together in driving integrated planning (WEF, 2015).”
Source: Google Image


Climate Resilience in Indian Cities: Review of the perception, aspirations, and the actions Case of Surat 17 Undertaking ...................................................................................................................................... Certificate ...................................................................................................................................... Acknowledgments TableAbstractofcontents List of figures List of Chaptertables 1: Overview of Climate Resilience 1.1 Why are cities at great risk? 1.2 What is Urban Resilience? 1.3 Evolution of Urban Resilience 1.4 Classifying Urban Resilience 1.5 Resilience and Sustainability 1.6 Resilience for Whom? 1.7 What is climate change? 1.7 Impact of Climate Change 1.7 Who are the most vulnerable? 1.7.4 What Urban Climate Resilience? 1.8 Initiatives taken Globally 1.8.1 Kyoto Protocol 1.8.2 Paris Agreement 1.9 Initiatives by India 1.9.1 Who are the stakeholders 1.10 Financing Climate Resilience 1.11 Climate Finance in India Chapter 2: Aim, Objective & Methodology of the Directed Research Project 2.1 Aim of the topic 2.2 Objective & Methodology 2.3 Final outcome 2.4 Research Timeline Framework Chapter 3: Dichotomy and coherence between national and international actions 3.1 Introduction 3.2 Methodology 3.3 Introduction to the countries and their policies 3.3.1 Denmark 3.3.2 India Content ............................................................................................................................................................................................................................................................................................................................................................................................................................................................................................................................................................................................................................................................................................................................................................................................................................................................................................................................................................................................................................................................................................................................................................................................................................................................................................................................................................................................................................................................................................................................................................................................................................................................................................................................................................................................................................................................................................................................................................................................................................................................................................................................................................................................................................................................................................................................................................................................................................................................................................................................................................................................................................................................................................................................................................................................................................................................................................................................................................................................................................................................................................................................................................................................................................................................................................................................................................................................................................................................................................................................................................... 7 119 434343414139393737343232313029292828272726262525242321201713
Climate Resilience in Indian Cities: Review of the perception, aspirations, and the actions Case of Surat18 3.3.3 Indonesia 3.3.4 Ireland 3.3.5 Algeria 3.4 Are these policies aligned with the NDC of every countries? 3.5 Who are the main target groups mentioned in the acts? 3.6 Target of the mitigation actions as per plan 3.7 Overview of the adaptation actions 3.8 State Action Plan for Climate Change 3.9 Gujarat’s SAPCC Overview 3.10 Conclusion Chapter 4: Perception assessment of various stakeholders across India 4.1 Introduction 4.2 Mapping and defining the Stakeholders 4.3 Tools & Methodology 4.4 Result based on perception study 4.4.1 Perception of climate change, Vulnerability & Resilience 4.4.2 Perception of actions related to climate change 4.4.3 Perception of achievements of climate actions 4.5 Conclusion Chapter 5: Understanding the initiatives taken by case city Surat 5.1 Introduction 5.2 Methodology 5.3 About the city 5.4 Demographic Profile 5.5 Population Density 5.6 Economic Profile 5.7 Physical features and vulnerability 5.8 Vulnerable Population in Surat 5.8.1 Migrant Workers 5.8.2 Homeless Population 5.8.3 Slum Dwellers 5.9 Challenges faced by Surat and their direct indirect connection to climate change 5.9.1 Flood in Surat 5.9.2 The 1994 Plague in Surat 5.9.3 Hazira Port Pollution 5.9.4 Sea level rise in Surat 5.10 Why Surat as the case city 5.11 Initiatives taken under 100 RC 5.12 Identification of stakeholders in Surat 5.13 Impact Chain Analysis 5.14 City Level Impact chain Analysis 5.15 Sectoral level impact chain analysis ....................................................................................................................................................................................................................................................................................................................................................................................................................................................................................................................................................................................................................................................................................................................................................................................................................................................................................................................................................................................................................................................................................................................................................................................................................................................................................................................................................................................................................................................................................................................................................................................................................................................................................................................................................................................................................................................................................................................................................................................................................................................................................................................................................................................................................................................................................................................................................................................................................................................................................................................................................................................................................................................................................................................................................................................................................................................................................................................................................................................................................................................................................................................................................................................................................................................................................................................................................................................................................................................................................................................................................................................................................................................................................................................................................................................................................................................................................................................................................................................................................................................... 80797878767673737271717070707069686766666565636157545454535351494948474645454444
Climate Resilience in Indian Cities: Review of the perception, aspirations, and the actions Case of Surat 19 5.16 Impact chain analysis for transportation 5.16.1 Initiatives taken by SMC a. Promoting used of E-vehicle b. Promoting used of E-Public Transportation c. Public Bi-cycle Initiative 5.17 Impact chain analysis for Water supply 5.17.1 Initiatives taken by SMC a. Tapi Suddhikaran Project b. Decentralized water harvesting & Supply c. Reuse of Treated water supply d. Initiatives by Irrigation Department e. Tapi Riverfront Development Project f. Linear park project near Vesu g. Restoration of Mangrove forest 5.18 Impact chain analysis for Solid waste management 5.18.1 Initiatives taken by SMC a. Solid waste processing by SMC b. Plastic waste management centre c. Construction and demolition waste management facility d. Strategic location of landfill site- Future Initiative 5.19 Other initiatives taken by SMC 5.20 Analysis of the initiatives 5.21 Conclusion Chapter 6: Conclusion and Recommendations 6.1 Introduction 6.2 Recommendations 6.3 Conclusion AppendixImportantBibliographyReferencesWebsite........................................................................................................................................................................................................................................................................................................................................................................................................................................................................................................................................................................................................................................................................................................................................................................................................................................................................................................................................................................................................................................................................................................................................................................................................................................................................................................................................................................................................................................................................................................................................................................................................................................................................................................................................................................................................................................................................................................................................................................................................................................................................................................................................................................................................................................................................................................................................................................................................................................................................................................................................................................................................................................................................................................................................................................................................................ 1031021011009793939087878787868686858585848484838282828181808080
Climate Resilience in Indian Cities: Review of the perception, aspirations, and the actions Case of Surat20 List of Figures Figure 1: Core of City as a system 23 Figure 2: Pillars of Urban Resilience 24 Figure 3: Perspective of stakeholders of Resilience 25 Figure 4: Number of climate related events and their perils 26 Figure 5: Building resilience based on understanding of vulnerability 27 Figure 6: Stakeholders associated with climate resilience in India at various levels 32 Figure 7: India’s Climate Finance Mechanism 34 Figure 8: Ojective 1 37 Figure 9: Ojective 2 38 Figure 10: Objective 3 38 Figure 11: Objective 4 38 Figure 12: Weitage of different indicators in CCPI 2022 41 Figure 13: Climate Change Performance Index 2022- Rating Table 42 Figure 14: Matrix & the performance of the 5 selected countries based on CCPI 2022 indicators 43 Figure 15: Nation climate action plans of the selected 5 countries 45 Figure 16: Summerising the timeline and action plans of Gujarat Climate Change Department 50 Figure 17: 9 Sectors mentioned in SAPCC Gujarat 51 Figure 18: Visual interpretation of collected sample’s locations from survey 53 Figure 19: Response to cliamate change occurance 55 Figure 20: Response to the root cause of vulnerability 55 Figure 21: Response to the vulnerable group as per stakeholders 56 Figure 22: Response to the perception of climate resilience 57 Figure 23: Response to the familiarity with NAPCC 8 missions & SAPCC 58 Figure 24: Response to the statements related to resilience characteristics of Indian cities 58 Figure 25: Response to the statements related to preparedness of Indian cities against disasters 59 Figure 26: Response related to India’s scope of achievement 61 Figure 27: Response to the open ended question floated in the survey 61 Figure 28: Locational advantage of Surat 66 Figure 29: Growth of SMC over the years 66 Figure 30: Sex ratio in Surat over the years 67 Figure 31: Population density map of Surat 67 Figure 32: Location of industrial cluster in Surat 68 Figure 33: Location of industrial cluster in Surat 69 Figure 34: Migration statistics of Surat 70 Figure 35: Map showing flood affected areas in 2006 within SMC 71 Figure 36: Fire from blust in ONGC port 73 Figure 37: Overview of Surat resilience program and their initiatives 76 \Figure 38: Surat resilience program and their initiatives 77 Figure 39: Stakeholders identification from different sectors 78 Figure 40: City level Impact Chain Analysis 79
Climate Resilience in Indian Cities: Review of the perception, aspirations, and the actions Case of Surat 21 List of Tables Table 1: Analysis of Resilience in Systems Thinking 25 Table 2: Various Initiatives to build resilience globally 31 Table 3: Actors involved in India’s Climate Finance 35 Table 4: Tentative research timeline framwork 39 Table 5: Analysis of the alignment of the National climate action plans with the subsequest NDC 46 Table 6: Analysis of target group of the National climate action plans 46 Table 7: Analysis of GHG emission and stated Mitigation actions 47 Table 8: Analysis of adaptation measures 48 Table 9: Summerising the national climate action plans 49 Table 10: Summerising the Response regarding resilience character 59 Table 11: Summerising the Response regarding perceptions of stakeholders regarding India’s resilience preparedness 61 Table 12: Challenges in Surat 65 Table 13: Important definitions related to Impact Chain Analysis 75 Table 14: Distribution of source of waste water which is treated 78 Table 15: Proximity of transfer station to Khajod 88 Table 16: Analysis of Influence and Involvement of the projects in Surat 90 Figure 41: Impact Chain Analysis for transportation 80 Figure 42: A Surat Based company gifted electric scooters to employees as Diwali gifts 81 Figure 43: Electric public buses are successfully running in Surat 81 Figure 44: Impact Chain Analysis for water supply 82 Figure 45: Tapi Suddhikaran Project on the bank of river Tapiy 83 Figure 46: Smart City initiative for water supply 83 Figure 47: Conceptual Master plan of Tapi Riverfront Development project 85 Figure 48: linear park near Vesu Area 85 Figure 49: Impact Chain Analysis for Solid waste management 86 Figure 50: Khajod landfill site 86 Figure 51: Plastic Waste Management Centre, Surat 86 Figure 52: Construction and demolition waste centre, Surat 87 Figure 53: Pie chart showing percentage of Green within SMC zones 88 Figure 54: Green and blue network in Surat in including SUDA 89 Figure 55: India’s GHG emission profile 93 Figure 56: Hierarchy of climate action plans in India 93 Figure 57: Concept of TOD through simple diagram 94 Figure 58: Green dedicated lane for NMT 94 Figure 59: The Walk2Ride Programme, Singapore 94 Figure 60: Visualizing the concept of Urban Forest and it’s advantages 95 Figure 61: Ecological Advantage of Forest 95
Climate Resilience in Indian Cities: Review of the perception, aspirations, and the actions Case of Surat22 Overview of Climate Resilience1 Source: Google Image

Density increases the demand on land and basic services, resulting in unstructured and unlawful settlement. It also encourages settlements in riskprone areas where there is no proper disaster risk reduction mandates as a result of inadequate governance. Expansion of density also causes decreasing ecosystems, severe climate change consequences, and other factors. All of them conjointly pose significant problems to cities.
The word “urbanization” comes from the Latin word “urbs,” which means “city.” According to the United Nations, urbanization is defined as the movement of people from rural to urban areas in quest of better livelihood opportunities, resulting in population growth in urban areas.
Source: Adapted from Cities at risk Building a resilient future for the world’s urban centres, 2020
According to the index of UN population,
2. Technology and space- imprudent use of smart technology causes massive use of data which leads to power outage effecting the essential infrastructure for the citizens.
Why are cities at great risk?
City is a complex socio-ecological system which is not just congregation of people but also services and infrastructure associated with them. City as a system consists of three core area (Fig. 1) which are1. Physical and core system which includes infrastructure, built typology such as residential and commercial and other utility buildings.
Core of City as a system
Figure 1
2. Ecological system consists of green and blue infrastructure, natural resources and quality of air.
3. Geopolitics and society- current biggest geopolitics is associated with the topic of climate and it has a great impact on common people.
Climate Resilience in Indian Cities: Review of the perception, aspirations, and the actions Case of Surat 23
the world’s population will reach 11 billion by the turn of the era. Northern America (82 percent of thee populations residing in cities in 2018), Latin America and the Caribbean (81 percent), and Oceania (68 percent) are recognized for being the most urbanized regions today. As per this trend we can predict By 2025, at least half a billion more people will live in urban areas than in 2019.
Based on the framework used by the Cambridge Centre for Risk Studies, four major categories of risks can be identified which nowadays every developing cities are facing as a aftermath of urbanization. They are as follows-
4. Finance, economics and trade- economic development seems to be a challenge for most of the governments which increase global financial risk.
Data reveals that the rate of urban population growth is indeed surpassing the rate of population growth globally, indicating a faster rate of urbanization.
1. Natural catastrophe and climate- due to rapid urbanization people are exposed to extreme and vulnerable climate condition which leads to natural hazards and disasters.
1.1
Africa and Asia will account for 86% of new urban residents. Due to rapid urbanization, cities face major challenges and currently, the entire world is reeling with the perils of it.
It is a demographic phenomenon that exhibits a long term progressive process of population concentration in urban areas.
3. Social and economic system which includes demography, governance and legislation, economic trend, labor market etc.

“Urban resilience refers to the ability of an urban system-and all its constituent socio-ecological and socio technical networks across temporal and spatial scales-to maintain or rapidly return to desired functions in the face of a disturbance, to adapt to change, and to quickly transform systems that limit current or future adaptive capacity.” What is Urban Resilience?
Refers to an indicator that assesses a community’s economic diversity, including overall employment, the number of industries, and its ability to rebound from a disaster. refers to the governmental and non-governmental systems in charge of the management of a community.
InfrastructureResilienceResilienceEconimicResilienceInstitutionalResilience
The phrase “urban resilience” has become popular in a range of fields, including environmental studies, disaster avoidance, and climate change mitigation techniques. It’s a catchphrase in the urban planning paradigm that has attracted a lot of attention from academics and professionals for research and policymaking to determine how cities, or any complex socio-ecological system, adapt and transform in the face of environmental stress. From an equilibristic viewpoint, urban resilience is frequently mistaken as a system’s ability to absorb damage and restore to its predisaster state, but it is also a primary duty to facilitate post-disaster recovery and the ability to come back to normal life in practice. Resilience is not just the ability to bounce back, but also the ability to change, adjust, and transform, for a dynamic socio-ecological framework.
Despite the ubiquity of the term Resilience in the domain of Urban Planning, it lacks precise definition. Resilience has a fuzziness in its definition that can be used to its advantage by treating it as a common object, which allows the definition to be reshaped numerous times accordingly and encourages multilevel stakeholder interaction. However, because of its ambiguity, it is equally difficult to operationalize in spatial Whenplanning.doing a scholarly review of urban resilience, several definitions are identified based on how individuals perceive it. Definition of resilience as per SaraMeerow, Joshua P.Newell, MelissaStults in their Defining urban resilience: A review paper is, So broadly if we see, urban resilience is the ability of a city to absorb any shock and stress (natural, man made or both) and ability to transform accordingly. It is not only the ability of bouncing back; in the case of urban planning, it more concerned about the ability of bouncing forth.
Figure 2 Pillars of Urban Resilience
Addresses to the vulnerability of man-made infrastruc ture on land such as buildings, and transportation net works.
Source: How To Make Cities More Resilient A Handbook For Local Government Leaders, 2020
1.2
relates to a sense of belonging, a group’s adaptability, and a sense of integrity to a place.
Definition as per UNISDR terminology on disaster risk reduction (2009), “The ability of a system, community, or society exposed to hazards to resist, absorb, accommodate to, and recover from the effects of a hazard in a timely and efficient manner, including through the preservation and restoration of its essential basic structures and functions”.
Climate Resilience in Indian Cities: Review of the perception, aspirations, and the actions Case of Surat24
Social


Both Engineering and Ecological Resilience are applicable to describe natural ecological system, but when it comes to a city which is such a complex socioecological system, we refer to Evolutionary Resilience from TRENDS URBAN RESILIENCE, UN-HABITAT. (2017).
in
Climate Resilience in Indian Cities: Review of the perception, aspirations, and the actions Case of Surat 25 Holling defined resilience as, A measure of the persistence o systems and of their ability to absorb change and disturbance and still maintain the same relationships between populations or state variables (Holling, 1973: 14).
3. Evolutionary resilience - It refers to a complex socio-ecological system’s ability to get accustomed and transform in order to withstand any stress. According to this theory, the system is constantly changing internally, hence there is no such thing as an equilibrium state.
1. Engineering resilience - it talks about the ability of a system to bounce back to it’s single equilibrium state after any disturbance. This engineering perspective understands resilience as a measure of the ‘speed of return’ to equilibrium (Pimm, 1991).
Table 1 gives a brief overview of classification of urban resilience. The notion of resilience was first introduced in the subject of ecology, and it quickly expanded throughout the world in the paradigms of
2. Ecological resilience - it deals with advanced and more complex ecological system which believes in multiple equilibrium state. A typical definition of ecological resilience is “the magnitude of the disturbance that can be absorbed before the system changes its structure” (Holling, C. 1996).
The term “resilience” has a great significance in the urban planning paradigm, especially when global cities are reeling with the perils of rapid urbanization. The term ‘resilience’ first appeared in history in the first century B.C. However, it was popularized in 1960 by prominent theoretical ecologist C.S Holling, who coined the phrase while studying the behavior of an ecological system subjected to external disturbance. Resilience has gained it’s popularity in a variety of disciplines ever since, including environmental and climaterelated disruptions. It is also popular in the domain of social and human geography. It is a city’s ability to withstand any unavoidable shock and stress in the context of urban development. numerous specialties, ranging from ecology to psychology to economics. Overall, if we look at the evolution of resilience, we may categorise it into three groups depending on its ability to adapt to the complexity of the system.
1.3 Evolution of Urban Resilience 1.4 Classifying Urban Resilience Table 1 Analysis of Resilience in Systems Thinking Source: Adapted

Figure 3 Perspective
Source: Adapted from Resilience for Whom? The Problem Structuring Process of the Resilience , Herrera, H. (2017). Analysis.
1.5 Resilience and Sustainability 1.6 Resilience for whom? Resilience and sustainability has difference in terms of their goal, scale of implementation , input and outcomes. Despite the dichotomy, when it comes to their implementation in spatial and temporal planning, there are parallels. Both of them discuss a city’s or region’s socio-ecological aspects. There are some commonalities exist between the two concepts, such as an emphasis on socio-ecological system features and dynamics. Not just that, when it comes to climate change related discussion in the paradigm of urban planning, they always go hand in hand. Resilience and sustainability go hand in hand, with sustainability serving as a guiding paradigm and resilience serving as a descriptive concept for resolving any complex ecological
According to the literature analysis, the best way to reach a common ground is through the problem structuring process (PSP), in which stakeholders attempt to analyse current conditions that have been converted into problems and rectify them through particular research activities.
Practitioners frequently monitor the influence of powerful stakeholders. Poor stakeholder management, which has an impact on the studies’ outcomes, runs the danger of delaying the implementation of proposed policies and, in the worst-case scenario, putting persons in more vulnerable situations accidentally. Larger and more powerful stakeholders, such as central government NGOs and other large-scale stakeholders, have more authority to shape the scope of resilience analysis, whereas small-scale stakeholders, despite being the most affected, have less negotiation power in the decisionmaking process. Hence For the last citizen, resilience required equity and social accountability. Equity does not imply equal distribution of goods and services; rather, it entails recognizing and meeting one’s needs in order to foster trust and emotional bonds.
Becausesystem. of its flexibility, resilience has acquired favor in a variety of fields. As the term “urban resilience” is so broad, it has both benefits and drawbacks. It allows stakeholders from many sectors to collaborate on the phrase “resilience” without having to agree on a clear definition, but operationalization is difficult when it comes to implementation due to the ambiguity. Different stakeholders perceive this word differently and interpret it according to their own perspective, resulting in ideological and strategic conflicts.
Climate Resilience in Indian Cities: Review of the perception, aspirations, and the actions Case of Surat26
“sustainability is the measure of system performance, whereas resilience can be seen as a means to achieve it“ (Tendall et al., 2015) of stakeholders of Resilience
It is critical for stakeholders to first create a mental model and then develop strategic agendas based on that model. The breadth of resilience analysis can then be determined using their negotiation Despiteskills. being such a buzzing topic in the realm of planning, resilience is sometimes undervalued by those who claim to be politically impartial.

Severe flooding, power breakdowns, increased risk of water or vector-borne infections, and heat stress are some of the indirect effects of these disturbances and strains on urban areas. During climatic events, a rise in disease incidence and heat stress can impose strain on the health system and infrastructure.
“Due to climate change, hundreds of millions of people in urban areas across the world will experience rising sea levels, inland floods, more frequent and intense storms, and more frequent periods of extreme heat and cold in the coming years”- WRI, India “Slum dwellers in developing countries tend to be most vulnerable to climate change because they live along river banks, on slopes prone to landslides, near polluted grounds, on desertified land, in unstable structures, and along coastal waterfronts”- WRI, India
“Many cities have not yet addressed climate risks due to lack of relevant city policies and action plans, outmoded regulations on urban planning, lack of capacity to respond to climate disasters, and lack of public awareness “- WRI, India Figure 4 Number of climate related events and their perils
What is Climate Change?
1.7.2 Impact of Climate Change
1.7.1
Source: 2019 Munich RE, Geo Risks Research, NatCatSERVICE. As of March 2019.
Long-term changes in temperature and weather systems are referred to as climate change. It can be caused by both natural and man-made factors. However, it has been discovered that the primary cause is human-made.According to various research, climate change can be caused by natural internal processes, external forcing, or long-term anthropogenic changes in atmospheric composition or land usage. Climate change has become such a severe concern around the world that cities are grappling with its negative externalities. Climate change, without a doubt, has a significant impact on cities. It affects the cities both physically, socially and economically by causing long term damage of buildings and both physical and social infrastructure The consequences can be categorized into two types: direct and indirect. The direct effects of climate change can be divided into two categories: immediate impacts such as hurricanes, tropical storms, and heat waves, and long-term implications such as sea level rise, average temperature increases, and long-term changes in the pattern of rainfall.
Climate Resilience in Indian Cities: Review of the perception, aspirations, and the actions Case of Surat 27

1.7. What is Urban Climate Resilience?
Though both are interlinked but there are dichotomy. Resilience is a long term process which gets evolved based on the shocks and stress a city gets as an impact of climate change. Adaptation is an isolated process which is part of resilience. When we talk about climate, it uses the concept of resilience and not just adaptation.
Climate Resilience in Indian Cities: Review of the perception, aspirations, and the actions Case of Surat28
By vulnerable population we refer to minor communities and also urban poors migrating from rural to urban areas for better living but ends up settling in the city’s most vulnerable neighbourhoods because they are not always included as part of the urban planning and governance paradigm. Hence due to lack of preparedness and problems like face stigma and discrimination they often miss out on disaster alerts, resulting in significant damage and loss. Indian cities are becoming more susceptible to natural and man-made disasters which is directly associated with the onset of climate change as a result of increasing urbanization.
Figure 5 depicts how we must first comprehend the causes and elements that contribute to vulnerability as a result of abrupt climate change. Finally, based on a thorough understanding of the vulnerability, aim to create effective plans and methods to build resilience against climate change. Climate change is an uncertain and dynamic process. Hence when we talk about builing climate resilient city, it is a multi-sectoral approach. Climate change adaptation, mitigation, and
Adaptation v/s Resilience
1.7.3
disaster risk reduction collectively forms the concept of Urban climate change resilience which takes into account the fact that cities are continuously developing as a result of urbanization and are constantly encountering the detrimental effects of climate change. The idea behind the concept is that a city is a complex socioecological system that is continually evolving to accommodate shocks and stressors.
Figure 5 Building resilience based on understanding of vulnerability Developing Disaster-Risk Resilience in Cities, Gupta, A., et al. (2019). Who are the most vulnerable ?
Source:

The Kyoto Protocol was signed on December 11, 1997, and entered into force on February 16, 2005, after a prolonged ratification process involving 37 industrialized countries and European Community countries.
Clean Development Mechanism is also another emission reduction commitement under Kyoto protocol where the emission removal projects in developing countries can earn emission reduction credit which is equivalent to 1 ton of carbon di oxide.
Joint Implementation process in which countries which supports emission removal projects in other developed counties will obtain Emission Reduction Units.
Climate Resilience in Indian Cities: Review of the perception, aspirations, and the actions Case of Surat 29 1.8.1 Kyoto Protocol 1. 100 Resilient Cities by the Rockefeller Foundation 2. City resilience Programme by the world bank 3. Making Cities Resilient Campaign (UNISDR) 4. Sustainable Development Goals (SDGs) - The 2030 Agenda 5. Paris Climate Agreement 6. United Nations Framework Convention on Climate Change (UNFCCC) 7. International Carbon Action Partnership (ICAP) 8. Intergovernmental Panel On Climate Change (IPCC) 9. Sendai-framework for Disaster Risk Reduction (SFDRR) 10. UN Climate Resilience Initiative A2R Global Initiatives for Climate Resilience
The Kyoto Protocol also included a compliance mechanism. For every ton of emissions by which a country exceeded its quantified emission limitation and reduction objective, it would have 1.3 tons of emissions deducted from its assigned amount for a subsequent commitment period (Kuh. K.f., 2018).
The protocol was more concerned about the developed countries than developing countries as 1.8 Initiative taken Globally When we think of rapid urbanization, the first thing that comes to mind is the impact it has on the climate, which has resulted in a number of natural disasters in cities. Climate resilience is the core aspect to robust the urban resilience concept. The negative externalities of rapid urbanization have overwhelmed global cities. Cities are taking initiative to bounce back and forth against climaterelated disasters these days. Global cities have mainstreamed many programmes with the support of renowned organizations to build strategical frameworks in order to take appropriate action to adapt, mitigate, and reduce the impact of climaterelated disasters. These initiatives assist cities in identifying climate risks and vulnerabilities, and they try to make cities more resilient by integrating a variety of stakeholders. in this chapter we will discuss few of these great initiatives taken across the globe.
This procedure was designed to keep greenhouse gas emissions in check. Its first commitment period lasted from 2008 to 2012, during which the participating industrialized countries pledged to cut their GHG emissions by at least 5% below 1990 levels. During the second commitment period, from 2013 to 2020, Parties pledged to reduce GHG emissions by at least 18% below the emission level of 1990. however, the composition of Parties in the second commitment period changes from the first. The protocol was flexible enough through which countries can easily fulfill their obligation regarding GHG emission target. It offered three marketbased mechanism to the countries in order to fulfill their target. These mechanisms areInternational Emissions Trading through which countries could purchase emission credits from other countries which have excess emission units to spare. This help to reducing domestic emissions of the countries. As carbon is the major green house gas, hence it became the main product to be tracked and traded which introduced the new terminology “Carbon Market”.
formulation of INDC framework includes multiple stakeholders from central government ( Niti Aayog, Ministry of climate change etc), industrial associates, aacademicians, civil society goups and what not. Keeping the interest of urban poors and farmars intact, the above mentioned stakeholders do a prime minister level consultation with Ministers based on existing plans and policies on climate change, NAPCC and SAPCC. Followings are few of the major targets those are mentioned in the INDC framework.
4. To create additional carbon sink of 2 5 3 billion tonnes of CO 2 equivalent through additional forest and tree cover (increase of about 680 817 million tonne of carbon stock).
6. To mobilize Domestic and New additional funds from developed countries to implement the mitigation and adaptation actions mentioned in INDC in view of the resource required and the resource gap.
3. To expand the percentage of non-fossil fuelbased electricity, the target is to account for 40% of installed capacity by 2030.
Climate Resilience in Indian Cities: Review of the perception, aspirations, and the actions Case of Surat30 they are more potential to GHG emission. Also The Protocol set the path for carbon emission trading and related financial instruments by establishing internationally binding emission reduction targets.
9. To adopt a climate friendly and a cleaner path than the one followed hitherto by others at corresponding level of economic development. Paris Agreement India’s Nationally Determined Contribution (INDC) The Paris Agreement was signed on 12th December, 2015 which came into action on November 4, 2016. It is a five-year cycle that has been accepted by Germany and the European Union, as well as 196 countries around the world.
2. To maintain high economic growth with low per capita emission.
Nationally Determined Contribution plays important role to guide the government to structure climate related policy framework as a part of the Paris Agreement. The process of
7. To build capacities, create domestic framework and international architecture for quick diffusion of cutting edge climate technology in India and for joint collaborative R&D for such future 8.technologies.Toputforward and further propagate a healthy and sustainable way of living based on traditions and values of conservation and moderation.
1. To reduce the emissions intensity of its GDP by 33-35% by 2030 from 2005 level.
Nations, communities, and enterprises all across the world are looking into low-carbon options to achieve a carbon-neutral goal. In a range of economic sectors that account for 25% of total emissions, zero-carbon solutions are becoming more competitive. The trend is most noticeable in the transportation and electrical sectors, and it has provided opportunities in a variety of linked industries. In industries that account for more than 70% of global emissions, zero-carbon solutions may be competitive by 2030.
The agreement’s goal is to stabilise greenhouse gas emissions and maintain global warming below 2 degrees Celsius, if at all possible, and to limit global temperature rise to 1.5 degrees Celsius above pre-industrial levels. Participating nations are required to develop and submit a Nationally Determined Contribution (NDC) report in order to maintain transparency regarding their greenhouse gas reductions, according to the agreement. The pact states that developed countries will provide financial assistance to developing countries.
5. To better adapt to climate change by enhancing investments in development programmes in sectors vulnerable to climate change, particularly agriculture, water resources, Himalayan region, coastal regions, health and disaster management.
1.8.2
Climate Resilience in Indian Cities: Review of the perception, aspirations, and the actions Case of Surat other important initiatives taken worldwide and their take on climate change. Initiatives to build resilience globally
National Level missions: On June 30, 2008, India’s National Action Plan on Climate Change (NAPCC) was launched, laying out the country’s goals for adaptation and mitigation research and policy measures through eight National Missions. The missions listed below provide direct and indirect opportunities for urban resilience planning through the NAPCC.
Table 2 Various
1.9 Initiative taken by India under various entry points
Source: Adapted from various reports
4. National Water Mission by MoWR
5. National Mission for Green India by MoEF
2. National Solar Mission by MNRE
3. National Mission on Enhanced Energy Efeciency by- MoP & BEE
6. National Mission on Strategic Knowledge for
Resilience planning in India can be integrated into urban development through existing policies and programmes (climate protection), as well as new policies and programmes that promote adaptation and mitigation efforts in Indian cities. These policies and strategies are prepared at National, State and city level.
1. National Mission on Sustainable Habitats (NMSH) by MoUD
31 Table 2 gives overview of some

In the Indian Governance structure there is a hierarchy of stakeholders starting from National level to city level. Resources are allocated by the national government and provided to individual states based on their requirements. This resources are further provided too the city level authorities for their on ground implementation. City governments play an important role to implement climate related strategies on ground with the help of resources.
Figure 6
Source: Adapted from Resilience for Whom? The Problem Structuring Process of the Resilience Analysis, Herrera, H. (2017). Massive financial support is required for climate action. Existing global initiatives also place a focus on how developing nations should receive climaterelated financial assistance from developed countries. Climate finance refers to public, private, and alternative financing that is used to fund mitigation and adaptation efforts to address climate change on a local, national, or global level. There are funds from international, national and local government when it comes to financing 1.10 Financing Climate Resilience
Climate Resilience in Indian Cities: Review of the perception, aspirations, and the actions Case of Surat32 1.9.1. Who are the stakeholders?
1.
Climate Change by DST 7. National Mission for Sustaining the Himalayan Eco-System by DST 8. National Mission for Sustainable Agriculture by StateMoA Level missions: Like the National Action Plan on Climate Change (NAPCC), at state level also there are State Climate Change Action Plans (SAPCC). These State Agendas and Action Plans provide a good example of, and an opportunity for integration of urban resilience at a sub-national level, within identified priority areas of the state (Mainstreaming, 2019).
City Level missions: In India, town planning is an important entry point for mainstreaming urban resilience (Mainstreaming, 2019). To formulate the strategies we need to first go through various existing city level plans and regulations such asTown and country planning act and zoning control rules and building byeplanning manual of the Planning
Commission 4. National building codes 5. Urban Development Plan Formulation and Implementation (UDPFI) guidelines 6. City master plans
Stakeholders associated with climate resilience in India at various levels
2.regulationsDevelopment
3.lawsDistrict


Climate Resilience in Indian Cities: Review of the perception, aspirations, and the actions Case of Surat 33 climate resilience across the globe. This chapter will give some insight on what are the various sources of climate finance.
3. Local Sources of climate finance- LoIf cities want to decrease their risks from climate change and other calamities quickly and efficiently, they need local organizations with appropriate funding and redevelopment authority and competencies that focus on updating specific areas or systems. If global development banks and special climate agencies are to use their limited resources to respond to fast emerging hazards and establish quality project portfolios, local institutional capability is critical.
b. Funds under the United Nations Framework Convention on Climate Change (UNFCCC)- funding mechanism under this category is run by the Global Environment Facility (GEF), can be categorized into two types- the Least Developed Countries Fund (LDCF) and the Special Climate Change Fund (SCCF). There is also another fund named Green Climate Fund (GCF) which is concerned about low emission of green house gas and climate resiliece.
2. National Sources of climate finance- To combat the negative effects of climate change, governments in developing nations have established a variety of national funds. Despite the fact that a lot of funds are still in their infancy, their development and management demonstrate progress. However, there are worries regarding local access and responsibility at the same time.
1. International Sources of climate finance- Huge financial aid connected to climate change is channelled from affluent countries to developing countries through a variety of international sources. They are as followsa. Official development assistance (ODA)- The Development Assistance Committee (DAC) of the OECD defines development assistance as government assistance that promotes and explicitly targets the financial well being of developing nations.
Source:
c. World Bank climate investment funds: Pilot Program for Climate Resilience (PPCR)- Funding mechanism run by the word bank and one of the main pillar of the clity resiliece program. Mnay
Google Image
The most essential investment that can be made to help adaptation is to strengthen the capacity of such institutions, particularly in densely populated and highly exposed metropolitan areas.
affluent countries are choosing this funding investment nowadays over the funds under UNFCC.

Climate Resilience in Indian Cities: Review of the perception, aspirations, and the actions Case of Surat34 1.11 Climate Finance in India India’s Climate Finance Mechanism “The largest source of climate financing in India is public funding, which is routed through budgetary allocation and several funds and schemes related to climate change established by the Government of India such as National Clean Energy Fund (NCEF) and National Adaptation Fund (NAF)“- (Singh, 2017). Figure 7 Source: Jha, V. (2014). The coordination of climate finance in India Table 3 Actors involved in India’s Climate Finance


Climate Resilience in Indian Cities: Review of the perception, aspirations, and the actions Case of Surat 35 Source: Adapted from The coordination of climate finance in India, Jha, V. (2014).


Climate Resilience in Indian Cities: Review of the perception, aspirations, and the actions Case of Surat36 Aim, MethodologyObjective,2 Source: Google Image
2.2 Objective & Methodology
Climate Resilience in Indian Cities: Review of the perception, aspirations, and the actions Case of Surat 37
MethodologyIn order to achieve this ojective, first the Climate Change Performance Index will be read thouroghly. Countries to be identified whose national climate action plans will be reviewed based on the scope and limitations. The major limitation during city selection is availability of data and language barrier as few city has their climate action plan in their native language. Then matrix will be prepared based on few indicators to come up with some observations in the context of Indian cities. Finally analyzing them and based on them conclusion and recommendations will be provided for Indian cities. Figure 8 shows the entire process via flow chart.
The aim is to assess the impact of climate change in Surat and understand the emerging role of urban planning in achieving equitable climate resilience in order to make the city more livable, sustainable and economically viable.
Methodology of Objective 1 Figure 8
To understand the perception of climate resilience among various urban development professionals in Surat and across the country.
MethodologyThis objective deals with a perception study of various stakeholders across India in the context of climate resilience. The goal is to gain a better understanding of the synergies and gaps between academics and practicing professionals perspectives on climate change resilience. For this first step will be identification of stakeholders across India. Then preparation of survey question. A google form will be created and floated via mail to the stakeholders. But during walk in interview the form will be filled in front of the author only. Finally based on the collection of samples analysis will be done and the objective will be concluded with some recommendations for Indian cities in the context of climate change. Figure 9 will show the entire process via flow chart.
Scope of the objectiveBroader perception of what other countries are doing to combat climate change
Source: Author Objective 1
To review the relevance of existing climate resilience frameworks in the context of Global and Indian cities. Objective 2
Limitation of the objective1. Availability of Data 2. Language barrier for few countries
2.1 Aim of this topic

Eventually the objective will end with some recommendations.
Objective 3
To review the initiatives taken by the city of Surat to withstand the adverse effects of climate change.
Methodology-
Climate Resilience in Indian Cities: Review of the perception, aspirations, and the actions Case of Surat38 Methodology of Objective 3 Figure 10 Source: Author Methodology of Objective 2 Figure 9 Source: Author Scope of the objectiveBroader perception of various stakeholders Scope of the objectiveBroader perception of various stakeholders in Surat Limitation of the objectiveNothing as such Limitation of the objective1. Availability of the stakeholders 2. Mainly SMC area have been covered in the first round of site visit
The initiatives taken by the case city of Surat will be discussed in this objective. Baed on the site visit in Surat, an attempt will be made to understand the perspectives and actions taken by the government in Surat on climate resilience. to start this objective first we have to understand the vulnerability of surat based on certain parametres and followed by that the indicators of vulnerability will be identified and their direct and indirect relation with climate change will be analyzed.
In the walk-in interview during site visit, various stakeholder across the Surat Municipal Corporation will be met and based on the informations provided by them and also from various secondary study, the initiatives will be reviewed. Finally based on the data, their direct-indirect relationship wil climate will be analyzed.


Climate Resilience in Indian Cities: Review of the perception, aspirations, and the actions Case of Surat 39 2.4 Research Timeline Framework 2.3 Final Outcome To provide policy level recommendation based on the review for better enforcement of climate resilience interventions in Indian cities. They will be studied in conjunction with the city development plan and devel opment control regulation in order to minimize the negative externalities of climate change and prepare the citizens to withstand them. Table 4 Tentative research timeline framwork Source: Adapted from The coordination of climate finance in India, Jha, V. (2014).

Climate Resilience in Indian Cities: Review of the perception, aspirations, and the actions Case of Surat40 Dichotomy & coherence between national & international actions3 Source: Google Image

Germanwatch, NewClimate Institute, and the Climate Action Network are the creators of the Index. Only the continuing support and contributions of around 450 climate and energy specialists make the CCPI’s unique climate policy section feasible, which evaluates nations’ national and international climate policy performance.
Maximum of the future climate-related are related to global warming which is nothing but induced by human activity and predicted to be around 1.0°C over pre-industrial levels, with a likely range of 0.8°C to 1.2°C. If current trends continue, global warming would likely hit 1.5 degrees Celsius between 2030 and 2052. Climate related risks can only be reduced if we take mitigation, adaptation and resilience measures which are far reaching, multi-level and cross-sectoral.
The first phase in the assessment was to collect data from diverse secondary sources. The primary method was deciding which nations to select for further analysis. After digging through various publications and prestigious international websites, the climate change performance index was discovered, which conducted a comparative analysis of 60 countries plus the EU’s climate “Human activities are estimated to have caused approximately 1.0°C of global warming above pre-industrial levels, with a likely range of 0.8°C to 1.2°C. Global warming is likely to reach 1.5°C between 2030 and 2052 if it continues to increase at the current rate” (SPM,2018).
Introduction
As GHG emission is one of the main reason for global tempurature rise, hence reduction of GHG emission has been given maximum weightage (40%). Followed by this renewable energy an energy use category is having weightage of 20% each. Finally Climate policy indicators is comprises of 20% of the overall weightage which aims to determine whether the policies are effective enough or not (Figure 11).
Climate Resilience in Indian Cities: Review of the perception, aspirations, and the actions Case of Surat 41
To combat the negative externalities of climate change, various governments throughout the world have begun to develop climate action plans. These strategies are implemented in tandem with their National Determined Contributions (NDC). But, more importantly, how effective are these plans? Is there anything in the policies that mentions sense of equity or community participation? This chapter includes a comparative review of such national and worldwide level climate action plans, as well as an understanding of the dichotomy and cohesiveness between them, in order to provide specific solutions to these problems.
3.2 Methodology
Figure 11 Weitage of different indicators in CCPI 2022 Source: Adapted from Climate Change Performance Index. (2022).
mitigation efforts who account for 92 percent of worldwide greenhouse gas emissions.
The Climate Change Performance Index (CCPI), which has been published yearly since 2005, is an independent monitoring instrument for tracking the climate protection performance of 60 nations and the EU. The CCPI aims to improve clarity in international climate ideologies by allowing countries to compare their climate protection attempts and improvement. The performance of such countries in terms of climate protection is evaluated in four categories: GHG Emissions, Renewable Energy, Energy Use, and Climate Policy. Those countries account for 92 percent of global greenhouse gas (GHG) emissions.

Climate Resilience in Indian Cities: Review of the perception, aspirations, and the actions Case of Surat42 Figure 12 Climate Change Performance Index 2022- Rating Table Source: Adapted from Climate Change Performance Index. (2022).

On December 6, 2019, the Danish administration obtained an agreement with 8 of the 10 parties in the Danish Parliament on a new Climate Act. The agreement is enshrined in the Danish Parliament’s Climate Act, which was passed on June 26, 2020. The Danish Ministry of Climate, Energy and Utilities and the Danish Energy Agency have formed a project group to drought the National Energy and Climate Plan. The Ministry of Climate, Energy and Utilities is in charge of the overall development of the plan, while the Danish Energy Agency is in charge of modeling and scenario development. In addition, the Ministry of Finance, the Ministry of Environment and Food, the Ministry of Industry, Business and Financial Affairs, the Ministry of Taxation, and the Ministry of Transport and Housing have all contributed to the plan and have been consulted on it.
The subcontinent is on schedule to reach its 2030 emissions target (which is coherent with a wellbelow-2°C scenario), is able to meet its Nationally Determined Contribution (NDC) target of a 40% non-fossil fuel installed power capacity by 2030, and is on track to achieve a targeted 33–35 percent
The stated objective of the act is- “To reduce greenhouse gas emissions in 2030 by 70% compared to the level of emissions in 1990, and for Denmark to achieve a climate-neutral society by 2050 at the latest, taking into account the Paris Agreement target of limiting the global temperature rise to 1.5 degrees Celsius.” 3.3. 2 India
Figure 13 shows the performance of the 5 countries in the 4 sectors to get a clear idea of where India is lagging and where it is doing better compared to other countries.
The Danish Council on Climate Change in the year The2020. act went through several process of development before publishing the final one. The Danish Parliament created a political energy accord in 2018 that focused on renewable energy, efficiency, research, development, and regulation.
Introduction to the Countries and their Policies
Source: Adapted from Climate Change Performance Index. (2022).
The entire graph (Fig. 12) is divided into 5 colours starting from dark green which simbolises very high to red which simbolises very low. In the next phase, 5 countries including India have been selected from each of the colours. In the final phase the selected countries national climate acts or policies have been identified and reviewed based on certain parameters to fulfill the perpose of this chapter. The main limitation while choosing the countries were availability of the data and language barier.
3.3.1 Denmark Denmark ranked 4th in the list and has set example globally in front of other countries to harness the adverse effect of climate change. In every category Denmark stands among the top 10 countries performing “high” in GHG emission, renewable energy and climate policy sectors which indicates that the policies are effectively implemented on ground. The denmark climate act was prepared by Figure 13 Matrix & the performance of the 5 selected countries based on CCPI 2022 indicators
Climate Resilience in Indian Cities: Review of the perception, aspirations, and the actions Case of Surat 43 3.3

The stated objective of the act is- “To contribute to global goal and to achieve national development objectives, taking into consideration the balance between emission reduction, economic growth, justice and climate resilience development, to guarantee decent life and healthy environment for all citizens.”
Climate Resilience in Indian Cities: Review of the perception, aspirations, and the actions Case of Surat44 Indonesia ranked 27th in the list. In terms of use of renewable energy the country’s performance is observed to be high. The strategy that Indonesia submitted to UNFCC along with their NDC is the Long-Term Strategy for Low Carbon and Climate Resilience 2050. The report was prepared under the guidance of Directorate General of Climate Change of the Ministry of Environment and Forestry (DGCC MoEF) of the Republic of Indonesia. 3.3.3 Indonesia
The stated objective of the NAPCC is- “To establish an effective, cooperative and equitable global approach based on the principle of common but differentiated responsibilites and respective capabilities, enshrined in the United Nations framework Convention on Climate Change (UNFCCC).”
3.3.4 Ireland Ireland ranked 46th in the list. Like Indonesia, Ireland also performed very well in terms of renewable energy. The Climate Action Plan 2021 was prepared by the Cabinet Committee on Environment and Climate Change, supported by the associated senior officials group. Since the release of the Climate Action Plan 2019, the governance framework has been considerably enhanced to facilitate comprehensive climate action, with the Climate Action and Low Carbon Development (Amendment) Act 2021 providing the foundation. The Climate Action Delivery Board guaranteed that each department and public entity is held accountable for implementing the Climate Action Plan’s recommendations.
The Board also took a look at some of the most important strategic projects and areas of activity.
The Cabinet Committee on Environment and Climate Change, with the help of the related senior officials group, promised to be in charge of developing and implementing climate policy across the board. Each quarter, the Cabinet Committee on Environment and Climate Change and the Cabinet aimed to receive a delivery report prior to publication. Simplification of the reporting process was done to make it easier to tell the difference between major measures that result in large emissions reductions and supporting actions. This allowed for more openness in terms of decarbonisation efforts.he stated objective is- “To provide for the approval of plans by the reduction in energy intensity by the same year. India ranked 10th in the list. The National Action Plan on Climate Change (NAPCC) was strcutured by Prime Minister’s Council on Climate Change in the year 2008, which is long back India ratified for the Paris Agreement in 2016. The Ministry of Environment and Forests decided to prepare a document back in 2007 that would include all actions and initiatives taken by India to harness the negative externalities of climate change in six areas, namely: water resources, agriculture, natural ecosystems, health, Coastal Zone Management, and climate modeling. Followed by this document, the Prime Minister’s Council on Climate Change decided in 2008 to drought the NAPCC, which described the methods for achieving development goals while addressing climate change issues in the form of eight missions in multiple sectors.
A National Determined Contribution (NDC) is a climate action plan that every country participating in the Paris Agreement is required to submit and improve every five years. India is 3.4 Are these policies aligned with the NDC of every countries?
The stated objective of the National Climate Act is- “To realize sustained economic growth and inclusive social development, while taking due account of climate change related challenges”. Now after developing a brief idea of the climate change acts of these above mentioned countries, there are certain questings those have been tried to be answered in this chapter based on the reviews and analysis of the acts.
Performance wise Algeria stands in the red category which is very low. But if we decode it’s sector wise performance in GHG emission, renewable energy, energy use and climate policy, it is being observed that in energy use sector, the country has scored medium whereas in renewable energy and climate policy sectors Algeria has shown very low performance.
The National Climate Plan of Algeria was prepared by The National Climate Committee headed by the Minister of Environment in the year 2019. Algeria released its first National Plan of Action for the Environment and Sustainable Development (PNAE-DD) in 2002, with support from the World Bank, the German Technical Cooperation Agency (GTZ), and the Mediterranean Environment Government in relation to climate change for the purpose of pursuing the transition to a low carbon, climate resilient and environmentally sustainable economy; to establish a body to be known as the Climate Change Advisory Council; and to provide for matters connected therewith”.
Source: Adapted from the national climate action plan handbooks the only one of the five countries to have created a National Action Plan on Climate Change in 2008, prior to ratifying the Paris Agreement in 2016. With an economy that is heavily reliant on climate-sensitive sectors like agriculture, water, and forests, India’s government was quick to drought its own national climate strategy.
Technical Assistance Program (METAP). Financial aid has been received from European Commission and the Swiss Agency for Development and Corporation. In 2003, Algeria adopted a National Plan of Action and Adaptation to Climate Change (PNA-ACC), which was updated in 2013. The development of Algeria’s National Climate Plan is a link in a set of actions initiated by Algeria as part of the country’s national development strategy as set out in the action program of the government. It complements other plans such as the National Action Plan for the Environment and the Sustainable Development (PNAEDD), the National Biodiversity Strategy and Action Plan (SPANB), and the National Strategy for Integrated Waste Management (SNGID) by 2035.
Climate Resilience in Indian Cities: Review of the perception, aspirations, and the actions Case of Surat 45 3.3.5 Algeria
Figure 14 Nation climate action plans of the selected 5 countries

Analysis of the alignment of the National climate action plans with the subsequent NDC
Analysis of target group of the National climate action plans
Source: Own compilation based on the national action plans of the subsequent countries
Table 6
Table 5
Whereas the Long-Term Strategy for Low Carbon and Climate Resilience 2050 in Indonesia is more focused to women empowerment and gender 3.5 Who are the main target groups mentioned in the acts?
Source: Own compilation based on the national action plans of the subsequent countries
Inference: Cohesion between all five countries can be observed. Almost every countries national climate action plans are more or less aligned with the National Determined Contribution in order to fulfill the requirement of Paris Agreement. equity. It also focuses on diverse age groups starting from children to elderly people. Ireland’s climate action plan is more inclined towards the farmers. Countries like Denmark and Algiria has not mentioned any specific target groups in their climate action plan.
Inference: In each of the above-mentioned countries’ climate action plans, there is a dichotomy to be found. This demonstrates that everyone is vulnerable to climate change in some way. The vulnerability is mostly determined by the country’s socioeconomic structure.
Climate Resilience in Indian Cities: Review of the perception, aspirations, and the actions Case of Surat46
Interestingly each of the acts talked about different target groups. India is more focused on the urban poor and migrant workers as they are more suseptable to climate induced vulnerabilities.


Table 7 Analysis
3.6
Greenhouse gas emission is one of the prime reason for the temperature rise globally. The gases includes, Carbon dioxide (CO2), Methane (CH4), Nitrous oxide (N2O), Industrial gases such as Hydrofluorocarbons (HFCs), Perfluorocarbons (PFCs), Sulfur hexafluoride (SF6), Nitrogen
Target of the mitigation actions as per plan of GHG emission and stated Mitigation actions
India has committed in COP26 to cut down it’s carbon emission to net-zero by the end of 2070
(NF3) etc. Hence countries are more concerned with the climate mitigation actions. A comparative study has been done to see the contribution of the countries to the global emission and also what are the key targets of their mitigation plans.
When the CO2 emissions caused by mankind balanced worldwide by anthropogenic CO2 exclusions during a given period, the concept of net zero CO2 emissions are accomplished. According to scientists, net zero emission target is needed to be achieved by developing countries by 2050 to 2060. This questions whether the duration of India’s commitment is needed to be reduced or not.
Climate Resilience in Indian Cities: Review of the perception, aspirations, and the actions Case of Surat 47
Inference: Though according to the CCPI the GHG emission reduction performance is high in India this year. The per capita emissions of India is marely about 1.84 Tco2e (tonnes of carbon dioxide equivalent), whereas the global average is 6.45 tco2/per capita. This target is aligned with what was mentioned in the NAPCC. But the overall global contribution percentage of GHG is high in India. This raises the questions the effectiveness the climate policy and the National Determined Contribution.
Source: Own compilation based on the national action plans of the subsequenttrifluoridecountries
But the question is why “Net-Zero” emission pledge is important for India? Alternative technologies such as electric vehicles and renewable energy can help reduce carbon emissions in sectors like transportation and electricity. However, due to technological limitations, it is difficult to stop carbon emissions in sectors such as agriculture or solid waste management. As a result, to balance out the
Denmark emits fewer greenhouse gases than other countries, but the goal of becoming net zero by 2050 is still a long way off. Denmark’s greenhouse gas emissions, on the other hand, account for only 0.1 percent of global emissions. Even if Denmark were to attain climate neutrality right now, it would have little impact on the global climate. As a result, the government’s goal is to lead by example and encourage others. In the other hand India has taken the net-zero pledge in COP 26 in 2021 where the target is to achieve net-zero emission by 2070.

amount of carbon in the environment, it is required to remove it, which is referred to as negative emission. As the world’s third-largest emitter of greenhouse gases and an agriculturalbased country, India’s net-zero commitment is Thevalid.COP 26 agreement, which is part of the Paris Agreement, mentions the net-zero commitment. The carbon-neutrality oath is still unmentioned in the NAPCC. The vow to reduce carbon emissions per capita is a little ambiguous because it is inversely proportional to the population. The population growth rate of India is extremely Basedhigh.
The table also shows that except for India, all four countries appear to have met their medium and long-term climate mitigation targets. Long-term goals aid in understanding where countries are headed in the next years, whereas intermediateterm goals make the process more transparent and tangible. Hence it is required to have an intermediate goal along with the long term goal to achieve the target to combat climate change.
on the analysis another question which arises that Is long-term target is not sufficient without intermediate targets?
Inference: All the 5 countries successfully gave broader overview of their take on climate adaptation strategies and initiatives. Though the action plans are fairly comprehensive but still falls short of identifying specific action-steps (Except Ireland) and implementation strategies.
Source: Own compilation based on the national action plans of the subsequent countries
Table 8 Analysis
3.7 Overview of the adaptation actions of adaptation measures
GHG emission is unambiguously one of the major reason of climate change and for that countries are taking various mitigation measures which is true. But there are also other unavoidable degree of climate change like cyclone, drought, heavy rainfall, flood etc. which are severely impacting the socio-economic development of any country. Hence to harness the negative externalities of climate change and take opportunity of using new opportunities, it is required for global countries to take proper adaptation measures.
Climate Resilience in Indian Cities: Review of the perception, aspirations, and the actions Case of Surat48

Funding comes mainly from different National Gujaratschemes.is the first city which has it’s own climate change department established in 2009. This department is effectively working of climate resilience strategies which comprise both adaptation and mitigation measures. The journey of this department from the beginning to till 2020 is full of successful initiatives in the domain of climate adaptation and mitigation (Fig. 15).
Unlike other countries, India’s climate action plan does not include intermediate targets alongside the long-term 8 mission in the NAPCC.
Summerising the
Climate Resilience in Indian Cities: Review of the perception, aspirations, and the actions Case of Surat 49
Based on the analysis the question that comes to mind is, whether there should be equal or more amount of adaptation actions globally? Specially in countries like India where extreme weather events like flood in Surat, drought in Kalahandi or cyclone like amphan in West Bengal have become that seasonal phenomenon for them. We may be adept at rescuing people once a crisis has struck, but we are woefully unable to prevent preventable tragedies. The devastating experience after every disaster makes us realize that how unprepared we are for such disasters. As a result, several good techniques and their subsequent action plans related to climate-induced adaptation programmes are necessary for almost every countries mentioned above.
The Ministry of Environment, Forestry, and Climate Change (MoEFCC), a central government entity, is in charge of coordinating, while state 9 national climate action Own compilation based on the national action plans of the subsequent countries
3.8 State Action Plan for Climate Change Table
plans Source:
3.9 Gujarat’s SAPCC Overview
Instead, India has State Action Plans on Climate Change, which need to be updated with the National Determined Contribution to address region-specific climate initiatives. Out of the 36 states, 32 have their own SAPCC, which is used in conjunction with the NAPCC and NDC. The SAPCC process began in 2009, well before NDC.
nodal climate change agencies are in charge of developing and implementing SAPCC initiatives. SAPCC does not have its own funding mechanism.

Climate Resilience in Indian Cities: Review of the perception, aspirations, and the actions Case of Surat50 Figure 15 Summerising the timeline and action plans of Gujarat Climate Change Department Source: Author’s interpretation based on the SAPCC Gujarat

Climate Resilience in Indian Cities: Review of the perception, aspirations, and the actions Case of Surat 51 Figure 16 9 Sectors mentioned in SAPCC Gujarat Source: Author’s interpretation based on the SAPCC Gujarat
There are both the sense of dichotomy and cohesion that can be observed within the National climate action plans of the selected countries. Every countries shows that their National climate action plans are almost aligned with their Nationally Determined Contribution. It is being observed that the countries are more concerned Job community Urban Development Sea level rise & coastal infrastructure Health
Forest & Environment Vulnerable
3.10 Conclusion Water Renewable energy & Energy efficiency Agriculture Green
The SAPCC of Gujarat includes 9 thematic groups which were prepared by the state climate change department with technical support from other state government departments, academicians, NGO and International agencies. The SAPCC has gone through revisions. It highlights key aspects of vulnerability in Gujarat and their sector specific measures. Followings are the 9 sectors where SAPCC Gujarat has tremendously work on to combat climate change (Fig. 16). about their mitigation actions rather that climate adaptation and resilience. India is needed to be more cautious about the adaptation actions and their successful implementation on ground as natural calamities have become seasonal phenomenon to the cities.
In order to create more sustainable and climate resilient Gujarat for near future, the department has prepared the State Action Plan for Climate Change in 2014. The goal of this SAPCC is to strengthen the foundation of the state to combat any climate related changes within the State, creating public awareness, capacity building, increasing community participation and having more decentralized actions to face climate change.

Climate Resilience in Indian Cities: Review of the perception, aspirations, and the actions Case of Surat52 Perception assessment of various stakeholders across India4 Source: Google Image


4.2 Mapping and defining the stakeholders
Introduction
The concept of resilience is currently causing concern and fascination among policymakers, academics, private agencies and other stakeholders in the face of climate change. Resilience is a popular buzzword in the field of urban planning right now, and it can be interpreted in a variety of ways depending on one’s perspective. The openness of resilience implies that while talking about resilience, stakeholders risk talking past each other (Herrera, H. 2017). Though the baseline of resilience remains relatively unchanged in principle, there is a significant discrepancy in perspectives among various stakeholders when it comes to on-the-ground implementation. The goal of this chapter is to undertake a perception study of various stakeholders across India in the context of climate resilience. The goal is to gain a better interpretation of the synergies and gaps between academics and practicing professional’s perspectives on climate change resilience. Survey questions have been designed and distributed to various stakeholders across India, both digitally and manually, in order to achieve the goal. It is been observed in various reseaerch all over the world that there is a gap in understading of scholars and practitioners of how climate resilience will act in bothe theory and practice. This chapter attempts to understand the same scenario in the context of Indian cities. The target of this objective is to map and capture perceptions of various stakeholders across India in order to get better idea of where India is actually lagging behind in the face of climate change. The stakeholders has been mapped in such a way that it would reach to major locations in India. The figure below shows the locations from where the samples have been gathered for further analysis. interpretation of collected sample’s locations from survey samples
Source: Authors own interpretation from
Climate Resilience in Indian Cities: Review of the perception, aspirations, and the actions Case of Surat 53
Figure 17 Visual

4.3
3. Questions related to Perception of achievements related to climate resilience. Open-ended questions with clear answers offer a wealth of information that aids in qualitative evaluation of any study. However, having closed ended questions is a smart alternative when it comes to rating resiliencecapacity of a city and comparing its progression across diverse social groups. Hence close ended questions have been created primarily to obtain more accurate replies and to facilitate analysis. Only one open-ended descriptive question was posed, and it was not mandatory for everyone to respond. Closedended questions were largely multiple choice, ranking, and likert scale questions in the form of a matrix. Along with each multiple choice question, there was an option to “specify others,” and interestingly, many reacted with their own perceptions that were not mentioned previously.
2. Questions related to Perception of actions related to climate resilience.
4.4.1 Perception of climate change, Vulnerability & Resilience Tools and Methodology
To examine how practitioners and academicians understand climate resilience, a online servey had been conducted with the help of extensive literature review done in the initial stage of the research. Various research papers and climate actions across the world have been studied in past few months to get a perception of climate resilience. The quiestionaire consists of total 12 questions. Based on the scholarly literature the entire set of questionnaire had been divided into 3 major parts1. Questions related to Perception of Climate change, vulnerability and resilience.
4.4 Result based on Perception
A google form was used to distribute the survey to relevant Perceptionparties.study
of local stakeholders in Surat have been performed during walk-in interviews as the part of objective 3 which was primarily to analyse the climate activities and initiatives by various sectors of the local government in Surat. A Cities and climate change have a statistically significant association. On the one hand, cities are a major contributor to climate change via increasing energy use and greenhouse gas emissions. Cities, on the other hand, are particularly vulnerable to the effects of climate change, which include heat waves, rising sea levels, excessive rains, draughts, and vector-borne diseases. Scholars and policymakers should be increasingly concerned with promoting urban resilience in the face of total of 60 responses were gathered from a wide range of stakeholders. The stakeholders have been broadly divided into two parts- one is local dicision makers which includes government employees from Surat, Ahmadabad, Rajkol, and Kolkata, as well as planners, architects, economists, textile marchants, people associated with NGO and other civil services and the second is academicians which includes students and professors from prestigious institutions across India. The goal was to gather half of the survey from local decision makers and the other half from academicians in order to understand the dichotomy and cohesiveness of their perceptions while incorporating climate action into spatial planning.
The open ended question, “Where do you think the urban planning paradigm is mainly lagging when it comes to implementation of climate action related projects in India/ Surat?” had 15 responses out of a total of 60.The survey received a large number of responses from stakeholders, allowing researcher to examine their perspectives on climate resilience. Furthermore, this diversity of stakeholders brings a variety of perspectives and skills to the table, which can help governments make better decisions. The author decrypted the responses based on the divison of stakeholders already mentioned, and the inconsistencies were then examined and resolved.
Climate Resilience in Indian Cities: Review of the perception, aspirations, and the actions Case of Surat54
V. Any other (specify)
Climate Resilience in Indian Cities: Review of the perception, aspirations, and the actions Case of Surat 55 climate change. However, the question is how many of them are aware of the occurance of climate change. To begin the survey, we asked stakeholders to tell us what they really think about climate change.
6. Awareness among the people about the climate change and its impact.
Source:
2. Lack of professionals to solve issues
II. Economical aspect which is directly related to employment opportunity III. Political biasness
Both of them thinks the main root cause of vulnerability in India is “poor infrastructure & lack of reliable basic services” whereas many of them also thinks that economical aspect which is directly related to employment opportunity and political biasness are also another causes which makes the country more susceptible to cliamte induced calamities.
TheResult:graph (Fig. 19)clearly indicates that a cohesion has been captured among the perception of both the local decision makers and the academicians.
5. High population density in cities, absence of climate responsive spatial planning
3. Unmanaged and unplanned growth.. or when the work is done it is done in silos and need of comprehensive approach is there for development.
I. Poor infrastructure & lack of reliable basic services
Result: Almost all stakeholders have unapologetically acknowledged that climate change is occurring in India. Surprisingly, there were 1% of survey respondents who were apathetic with the fact.
4. Lack of proper urban planning across India
Figure 18 Figure 19Response
Source: Authors
Inference: This survey reveals that almost all stakeholders thinks the same reason as root cause 49% 38% to cliamate change occurance Response to the root cause of vulnerability own interpretation from samples Authors own interpretation from samples
Few of the respondents also shared other opinions which are very interesting. These are as follows-
Inference: This survey reveals that almost all stakeholders are aware of the climate-related changes taking place in India as shown in figure Next,18. we wanted to learn about stakeholders’ perspectives on the root causes of climaterelated vulnerability in India. The goal was to gain a clear image of stakeholders’ perceptions of the source of vulnerability, which would furthur strengthen the concept of various future climate change projects. There are multiple and complex factors of vulnerability with different layers and more often than once it cannot be analyzed in isolation (Chatterjee, C. 2007). The root causes of vulnerability were divided into 4 options based on the literature research conducted earlier. they are as follows-
1. Population inflation
IV. Socio-cultural relations


TheResult:graph (Figure 20) again shows the sense of cohesion among the perception of local decision makers and the academicians. Most of them collectively think that the most vulnerable people during the occurance of any climate induced hazards in India are the urban poors which includes the slum dwellers, homeless people, migrant workers who are often considered as the guest population. Though there is a slight dichotomy been observed between the perception of local Figure 20
People with disabilityphysical most vulnerable group of individuals in the event of a climate related disaster Local decision makers Academicians
Based on secondary resources we have identified the following set of people under the category of vulnerable population -
I. Urban Poor (Slum dwellers, Homeless, Migrant workers etc.)
0 5 3025201510
In India, socio-economical disparity is a prime concern which act as a limitation for a certain group of people to access healthcare and other reliable basic services. It has commonly observed every time that though we talk about the vulnerabilities and aftermath of climate induced changes but we often fail to recognise who are the vulnerable people in the society. It is not a simple process to identify these susceptible populations.
II. Minor Communities (Women, SC, ST etc.)
V. Any other (specify)
Urban Poor (Slum dwellers, Homeless, Migrant workers etc.)
III. People with stigma and discrimination (HIV/ AIDS, Sexual workers etc.)
Inference: By 2030, 505 of the total Indian population are going to reside in urban areas. Urban poors are the integrated part of the urban area who are mostly the migrated and floating population who come from rural area to urban areas for better job opportunities. But it is often noticed that they are most neglected one while it comes to providing any facilities. It is good to observe that both the local stakeholders and academicians have recognized them as the most vulnerable population who are exposed to climate induced hazards, though it is questionable that despite the awareness how many of the initiatives are being taken on their behalf in the face of climate change.
Climate Resilience in Indian Cities:
Finally, evolutionary resilience is concerned with adaptation and transformation, and it believes not only in the ability to bounce back but also in the ability to bounce forward. This sort of resilience is primarily concerned with the absence of an equilibrium state. As previously stated, there is some uncertainty and ambiguity in the definition of resilience. However, while implementing on the ground, it is critical to have a clear understanding of resilience. Because
IV. People with physical disability
We discovered the distinct differences between engineering, ecological, and evolutionary resilience when analyzing scholarly literature on resilience. Engineering resilience is primarily concerned with resisting changes and returning to a previous state in order to preserve a crucial characteristic. It’s essentially a single equilibrium state. Ecological resilience also refers to keeping the vital trait while acknowledging that the thing will never return to its original state. It is primarily concerned with numerous equilibrium states.
Review of the perception, aspirations, and the actions Case of Surat56 has decision makers and academicians. According to the academicians in India minor communities which include women, sc, st and coastal populations are also vulnerable to climate change where as local decision makers acknowledged them as least vulnerable.
Response to the vulnerable group as per stakeholders
Minor (Women,CommunitiesSC,STetc.) People with stigma and discrimination (HIV/AIDS, Sexual workers etc.)
Source: Authors own interpretation from samples
Source: Authors own interpretation from samples
I. The ability to withstand and recover against any climate related change which basically means the ability to bounce back (Engineering resilience) II. The ability to undergo through some transformative changes which means the ability to bounce forward (Ecological and evolutionary III.resilience)Both of them IV. Any other (specify): Result: A sense of cohesion can be observed in the result (Figure 21). Both Academicians and practicing professionals think climate resilience is not only just the ability to bounce back but to undergo through some transformative changes which means the ability to bounce forth as well.
Graphical Interpretation of the missions
Climate Resilience in Indian Cities: Review of the perception, aspirations, and the actions Case of Surat 57
79%64% Figure 21
National Solar Mission National Mission for Enhanced Energy Efficiency
The national knowledge system is constrained by a number of factors that limit their ability to learn about various government initiatives related to climate change at various levels. The majority of the time, we talk about climate change and its adaptation and mitigation actions without even being aware of the actual initiatives that the Indian government has already undertaken. To capture their perceptions of these numerous efforts and increase their popularity among various stakeholders at the same time, a tick question was designed in which stakeholders were asked to tick mark against the initiatives they were familiar with or not familiar with. The following were the initiatives mentioned in figure 22.
State Action Plans on Climate Change National Mission on Sustainable Habitat National Water Mission National Mission for Sustaining the Himalayan Eco-system National Mission for a Green India National Mission for Sustainable Agriculture National Mission on Strategic Knowledge for Climate Change
4.4.2 Perception of actions related to climate change
Inference: Cities being so complex socio-ecological system, is a combination of both ecological and engineering resilience. Majority of the urban resilience is ecological but when it comes to disaster management, economics, and public policy, it is more likely to be engineering resilience.
each stakeholder interprets resilience differently, we posed a closed-ended question to them, asking them to define climate resilience according to their perception. For ease of analysis, we provided them with the following options:
Response to the perception of climate resilience
Figure 22
Source: Authors own interpretation


In our sholarly literature we often talk about various characters of resilience. Few of the important among them in Indian context are: Robustness, Redundancy, Integrity, Equity, Inclusiveness, Transparency, Flexibility, and adaptive capacity. Table 10 gives an overview of these charecteristics. But do climate-related activities genuinely adhere to these characteristics? Are Indian cities properly Table 10 Overview of the character of resilience Authors own interpretation from samples Authors own interpretation from samples
Climate Resilience in Indian Cities: Review of the perception, aspirations, and the actions Case of Surat58 Figure 23 Response to the familiarity with NAPCC 8 missions & SAPCC
Result: Despite the encouraging input from all surveyors, it is clear that there is still a lot of room for capacity building and public awareness in the areas of climate change and national strategies to mitigate externalities (Figure 23). Inference: There should be a mandatory curriculum edition in every school or college syllabus that raises awareness of these national missions.
Source:
Source:


Strongly Disagree Disagree Neutral Agree Strongly Agree
Figure 24 Response to the statements related to resilience characteristics of Indian External shocks can be absorbed by the city, and it can soon recover to its prior operating state
Most of the Indian cities have enough back up in terms of infrastructure, institution and other facilities
Climate Resilience in Indian Cities: Review of the perception, aspirations, and the actions Case of Surat 59
Source: Authors own interpretation from samples
Citizen's livelihood and lifestyle will get changed
Table 10a Summerising the
Strongly Disagree Disagree Neutral Agree Strongly Agree
Strongly Disagree Disagree Neutral Agree Strongly Agree
Almost everyone in India has the capability to adapt climate induced changes
prepared in the event of a climate-related disaster? What are the opinions of the stakeholders? As a result, we created the next question to capture the perspectives of many stakeholders on the characteristics of climate resilience in any Indian city in the face of climate-related disaster. We had provided 4 statements in the context of any indian cities and prepared a likert matrix where the stakeholders had to tick mark their opinion starting from strongly disagree to strongly agree. The statements were as follows• External shocks can be absorbed by the city, and it can soon recover to its prior operating •state.
everyone in India has the capability to adapt climate induced changes
• citizen’s livelihood and lifestyle will get changed Response regarding resilience character
Most of the Indian cities have enough back up in terms of infrastructure, institution and other •facilitiesAlmost
Source: Authors own interpretation from samples
Strongly Disagree Disagree Neutral Agree Strongly Agree


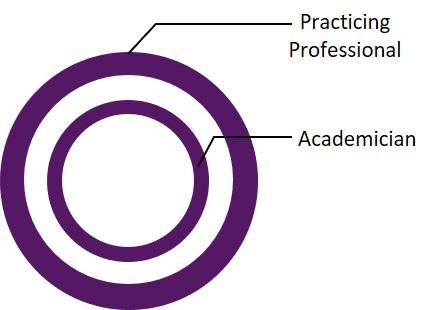
Result:time
The next question we posed was to find out how stakeholders felt about any Indian city’s preparation in the face of climate change and climate-related disasters. The same likert matrix was created this time, and four statements were provided, as follows:
Result: Figure 24 shows the outcome in pie charts. The academicians are represented by the inner circle, while the working professionals are represented by the outer circle. 50% of the professionals think that External shocks can be absorbed by the city, and it can soon recover to its prior operating state, whereas 44% of the academicians think the opposite and 21% are neutral regarding this fact. A strong sense of dichotomy observed here.
In case of the 3rd statement also majority of the stakeholders think that the adaptive capability of Indian people are still not enough. Which reflets their opinion for the 4th statement where both of the stakeholders think that the citizen’s lifestyle and livelihood will get changed due to natural Inference:catastrophe.The findings strongly suggest that there is room for capacity building among Indians in the area of climate change. The professional’s reaction also has a layer of obscurity to it. In the first assertion, they primarily believe that Indian cities are robust in nature because they can absorb external force and return to their original state, which necessitates the cities’ infrastructure and other facilities to be extremely redundant. However, in the second statement, their response does not reflect the same.
For the second statement, 75% of the professionals and 80% of the academicians shows their disagreement with it which means both of them think simillar.
• Benefits and impacts of actions are distributed evenly all through the municipality.
should follow decentralized planning approach
• Actions and their operations follow transparency while implementation
• Resources, services, and Governance
Climate Resilience in Indian Cities: Review of the perception, aspirations, and the actions Case of Surat60
• Actions follow iterative process and modified as per disturbance over the passage of
Figure 25 shows the outcome in pie charts. The academicians are represented by the inner circle, while the working professionals are represented by the outer circle. In response to the first question, 56% of academics and 46% of professionals disagree or strongly disagree with the assertion. Although 25% of professionals are unconcerned by the issue, academicians account for only 16% of the total. The responses show that both the academicians and professionals think there are disparities when it comes to impact and benefit distribution within the municipalities. For the second question 76% of the academicians and 70% of the professional believes that recources, services and governance should follow decentralized approach of planning. Decentralized planning ring more accurecy while implementing the initiatives and also involves more local people. While it comes to transperarency of the implementation process, it is being observed that almost 32% of both the stakeholders disagree to strongly disagree with the statement. whereas rests are either neutral or agree or strongly agree with Thosefact.actions go through iterative process and modified as per disturbance whereas 21% are neutral and 18% disagree with it. Interestingly only 36% of the academicians agree, another 36% of them are neutral of the fact and 28% disagree with Inference:it.
The responses somehow shows a gap in the thought process of both the stakeholders. Because, if according to them if the implementation process is transparent enough (Question. 3, Fig. X). If that would be the case
Strongly Disagree Disagree Neutral Agree Strongly Agree Actions follow iterative process and modified as per disturbance over the passage of time
Summerising the Response regarding perceptions of stakeholders regarding India’s resilience preparedness
Source: Authors own interpretation from samples
Benefits and impacts of actions are distributed evenly all through the municipality.
Resources, services, and Governance should follow decentralized planning approach
Source: Authors own interpretation from samples
Climate Resilience in Indian Cities: Review of the perception, aspirations, and the actions Case of Surat 61
Strongly Disagree Disagree Neutral Agree Strongly Agree 25
Response to the statements related to preparedness of Indian cities against disasters then the benefit and impact would have been evenly distributed among all the minicipalities also there would not have been any need of decentralized approach. Hence the responses are contradicting the thought process of bpth the Alsostakeholders.inthelast question, it shows somehow there is lack of transperency and integrity between professionals and academicians. Based on the answers it can be assumed that though the action plans are modified according but there is a possibility that academicians are not aware of that because of less involvement in it.
Strongly Disagree Disagree Neutral Agree Strongly Agree
Strongly Disagree Disagree Neutral Agree Strongly Agree
Finally to conclude the survey we designed this section which consists of three questions. The idea is to capture the perception of the stakeholders Perception of achievements of climate actions regarding the challenges of operationalising of climate resilience actions in India despite of the increasing ebiquity of the concept in the paradigm of both strategic and spatial planning. Respondents were also asked to provide their idea of interventions that can be brought in order
Actions and their operations follow transparency while implementation
Figure
Table 11 4.4.3

Inference: The analysis shows there is a gap between the perception of practicing professionals and academicians which indicates that there is a lack of sufficient coordination and need for capacity building while implementing the strategic interventions on ground.
Result: There is a clear dichotomy observed in this graph (Figure 26) which represents the gap between the perception of academicians and local decision makers. According to the practicing professionals, the major challenge is data sets are not well integrated. Whereas according to the academicians the main challenge is limited financial backup by Government.
Figure 26
Response related to India’s scope of achievement to achieve a climate resilient city. As there could be many ossible answers to these, so we made the question a close ended one and broadly categorised the ideas into 4 options as followsI. Enhancing multi-stakeholder collaboration, consultation and dialogue II. Data and technology for evidence-based planning III. Building local capacities and participation by incorporating citizen engagement tools IV. Any other (specify):
Source: Authors own interpretation from samples
Climate Resilience in Indian Cities: Review of the perception, aspirations, and the actions Case of Surat62 41%34%
Lastly it is very important to understand what the stakeholders percieve about the reason of India lagging behind to successfully implement any climate related actions. So we floated a open ended question saying “ Where do you think the urban planning paradigm is mainly lagging when it comes to implementation of climate action related projects in India/ Surat? Though it was not a mandetory question but the survey managed to receive some constructive answers to support this question. The answers are shown in figure 27.
Figure 27 Response to the open ended question floated in the survey
Source: Authors own interpretation from samples


Source:
Google Image
Climate Resilience in Indian Cities: Review of the perception, aspirations, and the actions Case of
Surat 63 4.4
Conclusion
In order to bridge the gap between academics and on-the-ground actual implementation, the chapter provides a brief summary of the perceptions of major stakeholders. The major goal is to comprehend the existing situation in India in light of climate change. The results of the survey demonstrate that people all around India are well aware of climate change. When it comes to vulnerability, the majority of them believe that the urban poor are the most vulnerable. The main issue is that they are provided with inadequate infrastructure, which puts them at risk during climate-related disasters.
Even though people in India are aware of the negative effects of climate change, their ability to adapt to these changes needs to be strengthened.
The educational sectors play a significant role in this scenario. Climate change education must be mandated by the schools themselves. Some statements reveal a fuzziness in stakeholders’ perceptions, implying that more workshops and professional training programmes for stakeholders’ capacity building are required. Interdisciplinary collaboration between professionals and academicians must also be strengthened in order to ensure integruity and transparency throughout India’s planning paradigm.

Climate Resilience in Indian Cities: Review of the perception, aspirations, and the actions Case of Surat64 Understanding the initiatives taken by case city Surat5 Source: Google Image

3. Implementation stage & Funding source.
we have discussed in detail about India’s national level actions (NAPCC) and also Indian people’s perception on climate change. But it is very much needed to dig dipper and see how cities are responding to climate hazards. In order to understand India’s approach of dealing with resilience at city level, this chapter has focused on a city like Surat where resilience approaches have been taken already and getting implemented quite successfully. The initiatives taken by the case city of Surat are discussed here.
During the site visit, the author interacted and met with a number of the stakeholders in Surat and attempted to understand their perspectives and actions on behalf of the government on climate Theresilience.chapter starts with a brief introduction of the city profile of Surat and followed by that the interconnection between various initiatives and their connection with climate directly or indirectly.
In the previous chapters
Climate Resilience in Indian Cities: Review of the perception, aspirations, and the actions Case of Surat 65
1. Climate vulnerabilities that Surat is facingIndividual perception
Introduction Source: Google Image
2. Initiatives in subsequent departments have taken in the context of climate change in Surat.
challenges discussed in detail. Till this part, the study was mainly depended on secondary data Insources.thesubsequent stage, during the case city visit, walk in-interviews have been taken of various government and non-governmental stakeholders in order to get an overview of their initiatives. A semi-structured interview had been taken while meeting the stakeholders. Different set of qualitative questions have been prepared for different stakeholders. The sequencing of the questionnaire had been done based on the following parameters-
4. Challenge while implementing. Finally analyzing the data through a impact chain analysis framework and give some city level recommendation to the city which can be adapted by any Indian city with similar profile. The opportunity of conducting these interviews were getting scope to meet various stakeholders and capture broader perception of them. While the limitation was that mainly SMC area had been captured and some interviews had got delayed based on stakeholder’s availability.
As mentioned earlier the chapter starts with a brief introduction of Surat’s demography, economic condition, migration, environmental factors and past natural calamities such as plague in 1994, flood in 2006 and covid in 2019. Then to understand the vulnerabilities and their direct or indirect relationship with climate four aspects and 16 of their indicators have been selected and the 5.2 Methodology
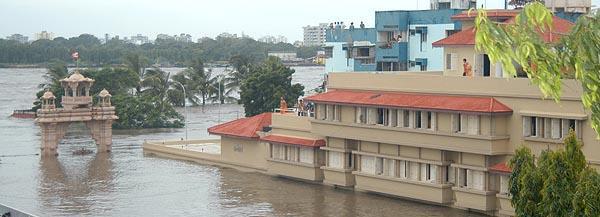
World’s largest Diamond Cutting & polishing hub Migrants comprises about 70% of Surat’s workforce the city 5.4 Demographic Profile
Surat is expected to grow to the size of Ahmadabad in the next several years. Surat Municipal Corporation (SMC) boundaries will be expanded by 36 additional villages established from out four talukas in Surat district. The recent addition of villages into SMC boundary has increased its area to 448 sq.km. Before the DP in 2015 SUDA limits were extended to 100 villages extending the boundary to 1351 sq.km. In 2016, 50 villages wholly and 4 partly were excluded out of newly added 100 villages from SUDA jurisdiction reducing boundary to 985 sq.km. In 2020, few areas were added to be the part of outer ring road and area increased to 1081 sq.km.
Climate Resilience in Indian Cities: Review of the perception, aspirations, and the actions Case of Surat66 Surat is the 2nd largest city of Gujarat positioned after Ahmadabad and is located near the sea making it the nearest port to Ahmadabad and Nagpur. The city with a population of 44.6 lakh is one of the fastest growing cities. The city is well connected from Delhi to Mumbai via NH8 . The proposed Delhi Mumbai Industrial corridor runs through Surat which boosts the economic activity. Surat has been an important trade centre between 1540 -1900. Good rail and road connectivity resulted in establishment of textile and diamond manufacturing industries during the industrial revolution. Surat Urban Development Authority was established in 1978. Thereafter, The first development plan of Surat was sanctioned in 2004. The city witnessed 2 major calamities. A plague in 1994 and a flood in 2006. The city comprises two administrative bodySurat Municipal Corporation (SMC) manages the municipal corporation & Surat Urban Development Authority manages the outer area & defines the Development Control Regulation. The current boundary of SMC covers an area of 448 Sq.Km and SUDA of 1081 Sq.km. Population of Surat is of 48 Lakhs, wherein the projected population for the year 2035 is of 103 Lakhs.
Figure 28 Figure 29
5.3 About
Locational advantage of Surat Growth of SMC over the years
4th9th
Fastest growing city in India Ranking for GDP in Indian cities in the year 2017-2018
Source: Development plan studio CEPT 2021, SuratSource: Development plan studio CEPT 2021, Surat


Source: Development plan studio CEPT 2021, Surat
Source: Development plan studio 2021, Surat Population
5.5
Sex ratio in Surat over the years
Climate Resilience in Indian Cities: Review of the perception, aspirations, and the actions Case of Surat 67
Density
Population directly related to density. Core of Surat has high population density compared to peripheral area (Figure 31). This spread of industries across SUDA can allow incoming of migrants to dense the area across industrial corridor.
In comparison to the rest of SUDA, the population of SMC has grown at a much faster rate. It suggests that SMC operates as a growth magnet, attracting people to live there.
The male population shows higher than the female population (Figure 30) in Surat as compared to Ahmadabad. This is due to increasing Male migrants coming in search of job opportunities in industrial areas.
Figure 30 Figure
Population density map of Surat 31


5.6 Economic profile
Diamond Industries majorly located in Katargam, Varachha and Mahidharpura have 65% export earnings and cater to the employment needs of 7 Lakh People. Textile and weaving industrial clusters shown in the map which contribute 4% to GDP. There are 100 and above markets with over 12 Lakh workers. Surat has the country’s highest per capita income. Despite this, there is still a significant income gap between the wealthiest and lowest income categories. Surat is expected to be part of the Delhi–Mumbai industrial corridor, which will help to boost the local economy.
Climate Resilience in Indian Cities: Review of the perception, aspirations, and the actions Case of Surat68
Source: Development plan studio CEPT 2021, Surat
Location of industrial cluster in Surat Figure 32 Surat is renowned as India’s Diamond City, as it produces 90% of the world’s diamond cutting and polishing, as well as 40% of the nation’s fabric. The major contributors to the informal sector are Textiles, Chemicals, Zari and Diamond and to the formal sector is real-estate which accounts for 11.5 % GDP for 7 fiscal years. Major industrial clusters are Hazira, Kamrej and Kadodara. Industrial estates at Sachin are currently saturated which is also a SEZ. The plan to relocate several polluting and hazardous industries which are present in residential areas within SMC have not yet been implemented.

The average rainfall in Surat is between 1.4-1.7 m, wind is directed from south west to north east direction. The city has tropical savannah climate. SUDA area’s gradual slope is towards western and southern side into the Tapi river whereas the southern part slope is into Mindhola river. Tapi river of length 55 Km covers 3% of the SUDA region. Lakes and other water bodies cover 0.4% of the SUDA region. The major lakes are Gopi Talao, Kavi Kalapi, Icchhapore lake and Madgalla lake. There are total 898 no. of large and small lakes in Surat among which 13 are interlinked during monsoon for storm water. Surat is a coastal city whose elevation varies from Topographical map of Surat Figure 33 5.7 Physical features & vulnerability 0m to 41m where the mean sea level is 13m. The city falls under CRZ zone 2 & 4. According to SUDA, no development can take place within 30 m along the coast. There is provision of restricted development with 500 m from the coast line. Surat city comes in a flood prone area with a history of floods. In 2006 80-95% of Surat got flooded. the red zone around the river Tapi is the most vulnerable zone for floods. Strikingly, Adajan and Rander are the most populated areas of the city. The north and south zones along the Tapi are the least affected zones in floods with higher Suratelevation.city lies in seismic zone 3 which is 350 km away from the epicenter located in Bhuj. studio CEPT 2021,
Climate Resilience in Indian Cities: Review of the perception, aspirations, and the actions Case of Surat 69
Source: Development plan
Surat


The first pie chart in figure 34 shows that most of the migrant workers in Surat come from Maharashtra, Rajasthan, Haryana and Delhi NCR. Ans within the state if we look at the percentage of migrant population, 29% of the migrant worker are located within Surat district. Surat attracts a large number of migrant workers because it is home to a variety of industries. Also building and construction sector is flourishing day by day in Surat which also encourages huge amount of migrant population in Surat. However, various studies found that due to a housing shortage, they frequently live in slums or become homeless.
Climate Resilience in Indian Cities: Review of the perception, aspirations, and the actions Case of Surat70 5.8.1 Migrant Workers
As per the HFAPoA report 2016-2017, it is being observed that there are total 334 numbers of slums located in Surat. Among these238 are tenable slums and 96 are untenable slums. The total slum area in Surat is 3803973 sq.m which gives shelter to 382630 nos. of slum dwellers.
This migrant workers make 70% of Surat’s entire workforce.
Source: Development plan studio CEPT 2021, Surat
5.8 Vulnerable Population in Surat primary concern, which is a place to live, Parayas offer them with a place to live with their family.
5.8.3 Slum Dwellers
As the name suggests, homeless populations are those who do not have census houses. They often end up staying on roads, on the bank of river, on railway platforms, in temples etc. As per 2011 census data, there are total 10931 HH (35283 Population) who are homeless in Surat. The number has increased with the passage of time. We saw in the last chapter that the majority of survey respondents believe the urban poor are the most exposed to any type of hazard. These people have become more exposed to any form of hazard as a result of a lack of basic infrastructure, poor housing facilities, and large economic disparities, making them the most susceptible. Slum dwellers, migratory workers, and homeless people make up the urban poor. In the case of Surat, there is no exemption. We’ll take a look at some of these instances in Surat.
Migration statistics of Surat Figure 34
Initiatives taken by NGO with collaboration with Surat Municipal CorporationPrayas is a Surat-based NGO that has been working for migrant labors for the past few years. During an interview with one of the activists in Prayas, he stated that they take over a few old and abandoned buildings in Surat and transform them into migrant worker shelters. They are affiliated with a migrant worker’s organization, where they are introduced to new migrant workers. Then, depending on their
5.8.2 Homeless Population
Initiatives taken by GovernmentCentral Government policies such as1. National Housing Policy – 1988


Climate Resilience in Indian Cities: Review of the perception, aspirations, and the actions Case of Surat 71 5.9. 1 Flood in Surat Flood is a common natural hazard which has already become seasonal phenomenon for Indian cities. Kerala, Meghalaya and Surat are few of these many cities which has a significant history of flood impacting their urbanization. in the year of 2006, Surat suffered from devastating flood due to consecutive rain of 3 days. Followed by these event, due to emergency release of water from the upstream of Ukai dam, 80% of the city got submerged into water. Due to the geographical location on the bank of lower Tapi basin and downstream of Ukai dam, Surat is highly receptive to flood. During 2006 flood it had been observed that most of the people were not prepared for this calamity. Hence, as a result, SMC and SUDA both took adequate 5.9 Challenges Faced by Surat and their direct indirect connection to climate change Map showing flood affected areas in 2006 within SMC Figure 35 Source: SMC Website 2. NSDP 3. National Urban Housing & Habitat Policy – 2007 4. JnNURM 4. RAY Awas Yojana 5. Interest Subsidy Scheme for Housing the Urban Poor 6. VAMBAY Housing 7. TherePMAYare state Government schemes for slum dwellers such as1. Rehabilitation and Redevelopment of Slums –2.2010Gujarat Slum Rehabilitation Policy – PPP – 2013 3. Gujarat Affordable Housing Policy – 2014 4. Slum Electrification Scheme And local government level policies such as- slum networking Program in Surat. measures in terms of sewage, storm water and health infrastructure. Talking about the flood alarm system, rain gauge has been established on the upstream of the Ukai dam. Calculations and flood-map have been prepared for the entire city in order to evacuate people from vulnerable areas during flood. Systems have been established over Athnur dam area and monitored by this department as a flood control measure. A model has been prepared by the tapi suddhikaran department with the joint association with the irrigation department, Ukai dam authority, collector department and SMC. They have proposed a rule book level of water. So by using this as thumb rule, they will monitor the water level 24*7 and can maintain the water level and excess water at one shot will not be released. Water level of Tapi, Ukai dam and Athnur dam are monitored by using this model. Also flood control room is operated through out the monsoon.

“Two years after the plague, Surat was adjudged India’s cleanest city in 1996” (Basu, M, et al. 2020)
Surat’s 1994 epidemic of pneumonic plague was the outcome of a succession of antecedent hazard events paired with a high social vulnerability. Natural or technological hazards events and other activities that cause environmental change can disrupt local ecological balances, leading to plague outbreaks. For example, habitat loss can cause congregation of sylvatic rodents into fewer areas, causing epidemics of rodent plague, or move them into new environments where the problem of domestic rats or humans exist. Flooding in Surat is also one of the major factor which helped in spreading plague.
The 1994 pneumonic plague epidemic in Surat, which killed a large number of people, emphasized the importance of monitoring in India. The 1994 pneumonic plague epidemic still haunts the local people of Surat as the city had been converted into ghost city during that time. When the pneumonic plague struck in 1994, 40% of the city’s 1.4 million residents were migrants, with 80% of them living in slums. The first incidence of pneumonic plague was detected on September 20th, in a male migrant labors from Maharashtra who later died. Undoubtedly the root cause of the epidemic was social vulnerability which includes indicators such as gender and economic inequalities, unhealthy residential and work environment, lack of planning and citizens awareness and preparedness, and political biasness.
Role of Local Government (SMC) after pandemic
“Surat experienced several epidemics each year, usually of water-borne diseases (Ghosh & Ahmad, 1996) and had a malaria risk ‘15 times higher’ than the rest of India” (Shah, 1994, p. 2675).
The 1994 Plague in Surat
Surat Municipal commissioner S.R.Rao took adequate and prompt actions in order to bounce back and forth against the negative externalities of penemonic plague. He introduced a new action namely “six by six by six” under which the entire city was divided into 6 divisions and the planning director of each division had the power equivalent to the municipal commissioner to take any kind of planning related decisions. Health facility of Surat got improved. Illegal structures were demolished without consideration for the political influence of the contractors. Littering fines were levied, and drains were covered. Payper-use toilets were erected in slums and markets.
Surat’s unprecedented urban growth has resulted in a housing crisis, particularly for migrant workers. They ended themselves living in filthy, unsanitary slums with insufficient basic facilities.
Officials also attended daily review meetings to examine progress and future objectives.
The city was able to boost tax collection and project spending with better financial management and no external aid — neither from the state nor from the federal government.
T he situation remains mostly unchanged. This haphazard, unplanned, and overcrowding growth can easily pave the way for a plague-like pandemic.
Climate Resilience in Indian Cities: Review of the perception, aspirations, and the actions Case of Surat72 5.9.2
Climate Resilience in Indian Cities: Review of the perception, aspirations, and the actions Case of Surat 73 5.9.3 Hazira Port - Pollution
Fire from blust in ONGC port Figure 36 Source: Google
Surat is extremely vulnerable to sea-level rise due to its location on the Arabian Sea’s shore. This puts the lives of coastal residents in jeopardy. Surat’s beach development potential will be harmed by rising sea levels, which will have a negative impact on the city’s tourism value. As a result, the city must keep a close check on the CRZ development regulations and improve the infrastructure along the coastline.
The Gujarat Pollution Control Board takes frequent actions and initiatives to curb these dangerous practices in this special economic zone, although their success is debatable.
Industrial development is necessary for any city’s economic success, but the environment must pay a high price for the negative externalities of industries. There is no exception in the case of Hazira. It is a large port located 25 kilometers from Surat’s main city. It is noted for having India’s largest liquefied natural gas terminal, with a 5-milliontonne annual capacity. Hazira is a multi-cargo port in essence. Industries like ONGC, Kribhco, NTPC, Reliance, and port facilities such as Adani, Essar bulk terminal, Shell, and Gujarat Maritime Board’s Magdalla Port are all located here. It also includes
5.9.4 Sea level rise in Surat-the recent IPCC report
According to the IPCC study, a 0.5 metre rise in sea level is enough to drown coastal communities. According to the analysis, if global temperature rise is limited to 2 degrees Celsius, sea-level rise will be between 30 and 60 centimetres. However, if nothing is done to lower global temperatures, the sea level will rise by up to 11 metres. The report has issued a warning to 45 major cities, including Indian cities such as Mumbai, Surat, Chennai, and Kolkata.
jetties like Kribhco, L&T, and Ultratech, among many others. Due to waste burning and frequent blasts, these enterprises create significant environmental damage. They also release toxic effluents into the Tapi River and the Arabian Sea, polluting the water. Furthermore, it has a negative impact on coastal ecology and wetlands, as well as causing salt water extrusion.
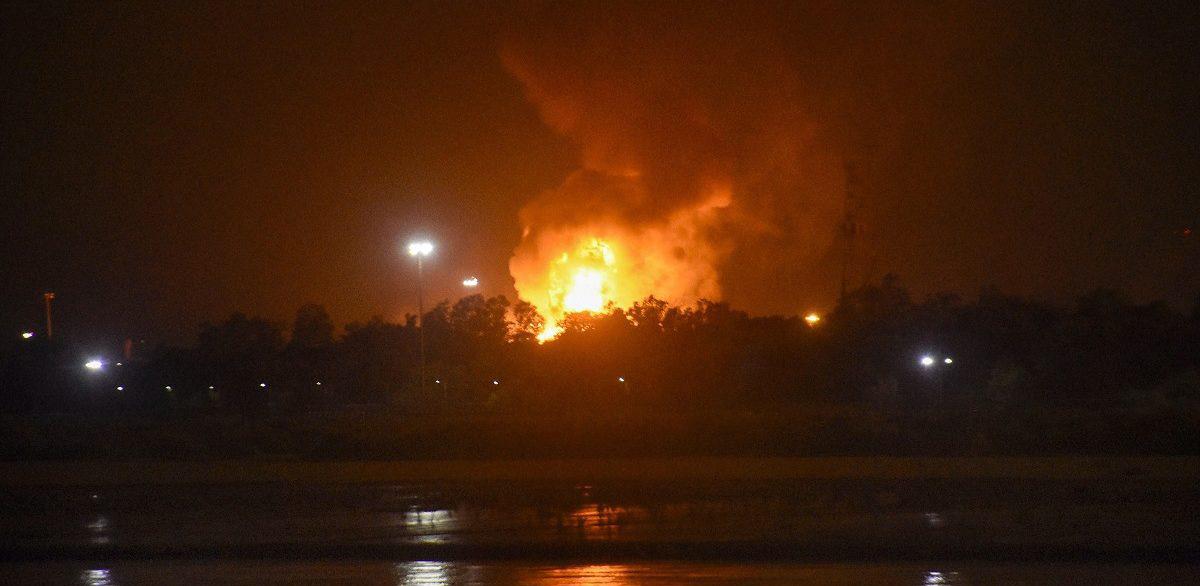
In order to comprehend the challenges faced by Surat city and their direct and indirect impact on climate change, 5 aspects have been identified such as demography, infrastructure, socioeconomy, environment and governance. This Challenges in Surat Table 12 aspects are further divided into 18 indicators and challenges in their subsequent sectors. Finally the research tries to connect their relationship with climate change.
Climate Resilience in Indian Cities: Review of the perception, aspirations, and the actions Case of Surat74

Climate Resilience in Indian Cities: Review of the perception, aspirations, and the actions Case of Surat 75 Source: Analysis done by author

“Surat started off as a place with household workplaces specialising in high skill products –hand woven textiles, diamond cutting/ polishing and em broidery. Due to scarcity of labor, competition in the country and demand for craftsmanship, employers had to be nice to their immigrant employees – they needed to retain their employees. They tried to understand their issues and treated them like family… This sentiment has continued.”- ( CRF, 2015)
5.10
Overview of Surat resilience program and their initiatives Figure 37 Source: Interpretation of Author based on Surat Resilience StrategyThe
Surat, on the other hand, has managed to turn all of these obstacles into opportunities, enhancing the city’s resilience capabilities. The city has been chosen as a case city since SMC and SUDA have already taken various steps that other cities can learn from.
Climate Resilience in Indian Cities: Review of the perception, aspirations, and the actions Case of Surat76 Surat’s environment and ecology both have huge impact on the resident’s health which is directly related to the working productivity and urban quality of life of Surti people. Surat has a strategic location on the bank of Arabian sea. Tapi also contributes important impact on the spatial planning of Surat. Also we have seen that Surat’s ecosystem is under threat from industrial growth, as well as significant population growth and density. Also waste burning is a huge challenge in Surat which contributes to air pollution. Cities water condition is also threatened, the environmental cell should be more active and efficient in monitoring air and water pollution.
100 RC is a initiative taken by Rockefeller foundation which had identified 100 cities all over the world and tried to provide a baseline to make those cities more resilience. Surat is one of the Indian cities falls under that list. The vision is to create “ A resilient Surat which fosters robust and thriving communities that are healthy, just, economically viable, and environmentally sound” ( SRS, 2017). The resilience program has identifies 7 Pillars around different sectors in the paradigm of Urban Planning in Surat. Under these pillars there are 20 goals and 63 initiatives (Figure 37). Initiatives taken under 100 RC
5.11
Pillars Goals Organizations Initiatives Why Surat as the case city?
“Surat resilience strategy is a result of incredible dedication and hard work of city project team (100RC Surat and TARU Leading Edge) and valuable inputs from Surat Municipal Corporation, Surat Urban Development Authority, Surat Climate Change Trust, Surat city police, Sardar Vallabhbhai National Institute of Technology, Centre for Social Studies, Veer Narmad South Gujarat University, Sarvajanik Educa tion Society, Southern Gujarat Chamber of Commerce & Industry, Gujarat Gas, Surat Citizen Council Trust, Traffic Education Trust, Community and non-profit organizations, elected officials, individual subject experts, who have contributed their time, knowledge and expertise in shaping this resilience strategy with innovative initiatives “- (SRS, 2017).
7 20 25 63


Climate Resilience in Indian Cities: Review of the perception, aspirations, and the actions Case of Surat 77 Surat resilience program and their initiatives Figure 38 Source: SCCT, (2017). Surat Resilience Strategy

After identifying the challenges and indicators where the challenges are being observed, also identifying the direct and indirect relationship of those indicators with climate, impact chain analysis has been conducted. The analysis have been done for entire Surat and also for various sectoral level. The impact chain aids in the establishment of significant correlations between various indicators, which has a significant impact on the planning paradigm. It helps to identify key sectors where climate change impacts the most and strategies can be taken to combat the risk and vulnerability associated with climate change. Stakeholders identification from different sectors Figure 39 Source: Author Identification of Important Stakeholders in Surat
Climate Resilience in Indian Cities: Review of the perception, aspirations, and the actions Case of Surat78 5.13 Impact Chain Analysis
In developing countries like India, stakeholders play important role in shaping various climate activities in the domain of urban planning. As a part of the research various stakeholders have been identified across India who are directly or indirectly associated with climate change related
5.12
initiatives. The stakeholders have been broadly categorized into 6 parts- National government, local government, private agency, NGO, civil society group and academicians in order to understand their perception of climate resilience and their on ground implementation in the paradigm of spatial planning. Following in the figure 39 prepared by author for better understanding of the coverage of sectors stakeholder wise
There are few fundamental concepts which needed to be cleared regarding impact chain analysis in order to get better clarity. The following chart will give a brief definition of some key words such asdrivers, hazard, impact, stressor and sensitivity. The framework and definitions have been adopted from the Resin project, 2017.

Climate Resilience in Indian Cities: Review of the perception, aspirations, and the actions Case of Surat 79 5.14 City level Impact Chain Analysis After identifying the indicators where the challenges are being observed and the direct and indirect relationship of those indicators with climate, impact chain analysis has been done for entire Surat and also for various sectors. The Important definitions related to Impact Chain Analysis City level Impact Chain Analysis Table Figure1340 Source: Understanding of Author Source: Adapted from Resin Project, 2017. analysis highlights key pressing issues that Surat has and tried to connect them. It is being observed that whether it is a climatic or non-climatic driver, ultimately all are interconnected somehow.


5.16.1
5.15 Sectoral level Impact Chain Analysis
Climate Resilience in Indian Cities: Review of the perception, aspirations, and the actions Case of Surat80 Now for understanding suitable strategy intervention in micro level detail, a thematic sector based impact chain analysis have been performed for sectors like transportation, water supply and solid waste management. Based on the analysis it is easy to understand what will be suitable resilience strategy for any sector, how many of them the government has already taken and how many yet to be taken.
Figure X shows the entire chain of impact analysis related to transportation. It is being observed that the main hazard in the domain of transportation in Surat is air pollution which impacts in increasing of GHG gas in atmosphere. Also more use of private vehicles which leads to more traffic congestion and increases the amount of accidents as well. As solution, there could be more use of E-vehicle using renewable energy. There can be provision of motorized and non-motorised public transportation like BRTS, MRTS, tram etc. After site visit it was good to acknowledge that SMC has already taken few initiatives which will be discussed below. specially for the industrial and construction workers. The aim is to subsidize the purchase of electric two wheeler within Gujarat which will help in reducing air pollution. The industrial workers will get 30% subsidy or less than 30,000 on purchasing electric vehicle. Whereas construction workers will get 50% or less than 30,000 subsidy from Government of Gujarat on purchasing this vehicles. The scheme is also applicable for students from class 9-12 and aligned
It is being observed that people feel more comfortable while traveling by their own vehicle that public transport. But this impacts various environmental problems such as air pollution.
transportation Figure 41 Source:
Impact
a.
So Government of Gujarat has come up with a new scheme which is the “Go Green Scheme” also known as “Gujarat Two Wheeler Scheme” Chain Analysis for Transportation Initiative taken by SMC Promoting use of E-Vehicles Chain Analysis for Understanding of Author
5.16. Impact

According to a study done by CEE, the total percentage of coverage of Non-motorised transportation in Surat is 17.54%. SMC has taken initiative of shared bicycle and they have 121 bicycle station which will encourage the use of bicycle instead of private vehicle. c. Public bi-cycles initiatives
A Surat
Climate Resilience in Indian Cities: Review of the perception, aspirations, and the actions Case of Surat 81
Surat Municipal Corporation has also made provision of electric buses since last 1 year. Parking policy is being changed. These buses are efficient and affordable. Ticket price is as same as diesel buses. Funding for these buses is done under FAME II scheme initiated by central. SMC is not b. Promoting use of E-Public transportation Electric public buses are successfully running in Surat Based company gifted electric scooters to employees as Diwali gifts responsible for single funding amount for these buses. Overall public are positively using this buses which shows success of the initiative. The BRTS and city buses are covering 100% of SMC and few major growth centres like kamrej and Sachin outside SMC, but within the SUDA Jurisdiction.
Figure 43 Figure 42 Source: Author Source: Surat Local News paper


3. Providing efficient and sustainable waste water management system in the village/Towns along the river Tapi which are major contributors of untreated waste water discharge in river Tapi.
Climate Resilience in Indian Cities: Review of the perception, aspirations, and the actions Case of Surat82 Figure X shows the entire chain of impact analysis related to water supply. It is being observed that the main hazard in the domain of water supply in Surat is related to Flood in Tapi river, Ground water stress and contamination and irrigation water and unconsciously people wasting tap water which impacts various conditions. Chain Analysis for 44
5.17.1 Initiative taken by SMC
2. Encourage the riverfront development activities by establishing recreational areas at various locations along side the defined stretch of the Tapi river.
water supply Figure
4. Recycling treated waste water for irrigation, gardening and flushing purposes and thereby reducing the fresh water requirement for the betterment of river water health.
5.17Impact Chain Analysis for Water Supply Impact
2. Preparation of Detailed Project Report.
1. Protection of Tapi river from any furthered degradation and thereby improvisation and restoration of the river water quality by providing mass plantation alongside the river bank.
Key activities under this project are as follows-
1. Identification of the 44 outlets along the upstream of Tapi river which are polluting Tapi.
Source: Understanding of Author
3. Awareness of the local people regarding the consequences of climate change and importance of conservation of Tapi river.
a. Tapi suddhikaran Project
The project is getting implemented with the help of Surat Municipal Corporation, Gujarat Water Supply & Sewerage Board & Gujarat Pollution Control Board. The funding is coming from GOI, GOG and SMC. Followings are the objective of this project-

Climate Resilience in Indian Cities: Review of the perception, aspirations, and the actions Case of Surat 83 Tapi Suddhikaran Project on the bank of river Tapi Figure 45
“The major challenge for this project is Land acquisition in few areas due to lack of awareness. Also observed that public participation is less. When it comes to giving up their own land for the construction of STPs, its always been noticed that people are hesitant to giving up their land as some sort of sentimental issues are always attached”Stakeholder Interview
b. Decentralized water harvesting &supply Smart City initiative for water supply Figure 46 Source: My Surat Application
4. Managing the land along the river and resettlement of the existing households in that particular stretch.
6. Training & capacity building of the workers and local people of the informal settlements.
5. Infrastructural set up which includes provision of interception & diversion line. Sewage lines and pumping station & STP.
7. Testing the quality of the river and certification from the GPCB. project will help to alleviate water stress while also lowering the contamination of ground water.
Source: Google
Surat Smart City’s area-based development includes a 3% portion of the overall SMC area. There are four water treatment and distribution centres, as well as three ESRs, operating within that selected area, delivering 75 MLD of water and ensuring water supply 24 hours a day, seven days a week. To make this idea accessible and egalitarian, SMART water metres will be placed, and water quality will be verified at the sources and end users locations. Rainwater harvesting and recharging, as well as recharge through storm water drainage systems, are advocated as ways to conserve water. By population, this project will service 10% of the city’s population. This


c. Reuse of Treated Waste Water
to Pandesara GIDC and Sachin GIDC. This generates a total revenue of Rs. 140 crores every year. Through a tanker filling station, the remaining 159 MLD of water is reused for non-potable purposes such as lake rejuvenation, agricultural mass plantation, road dividers, gardening and what not.
Surat’s major river, Tapi, is a fast-flowing river that touches the Arabian Sea. The river has a history of flooding, which we’ve already discussed. Surat’s riverbanks on both sides have also become home to a number of undesirables. There are a few riverfront developments currently in place, but they must be integrated. As a result, the state government has opted to support the tapi riverfront development project alongside the national govt and the World Bank. An SPV has been formed to implement this project in near future. The initiative has less impact directly on water supply byt huge impact on controlling flood. The project will also improve the city’s green coverage and have a good impact on the environment. It will also create a sense of social cohesiveness at the city level.
Distribution of source of waste water which is treated Tale 14
Source: CEE
The main issues related to irrigation department are- maintenance of the canal, illegal encroachment along the canal and river, Due to this socio-economical dis-balance, lack of public awareness & land acquisition. Right after flood, 20 km long embankment, 15 km long retaining wall was proposed to build by government of Surat. Ukai-Kakrapad project is there. The canal system was there since 1970, but recently in last 5-7 years almost 70% of the canals are made line canal which reduce water loss and also wastage of water and water will be supplied in optimum period. The main moto of this department is to maintain the canal periodically by desilting, grass cutting and canal lining.
Climate Resilience in Indian Cities: Review of the perception, aspirations, and the actions Case of Surat84
As a challenge the corporation sometimes face loss of velocity which may causes vegetative
The bifurcation of source of 319 MLD water which is reused, as followsgrowth in the canal. It is a challenge in terms of maintaining the quality of water of the canal. Another is the weak embankment in many areas due to less maintenance. Funding mainly comes from state government and PWD.
“The main opportunity is that the revenue is generated from Industries whereas the department’s main concern is the agricultural growth of Surat”- Stakeholder Interview
e. Tapi Riverfront development Project
According to data supplied by CEE during their presentation at the Surat Smart City convention in April 2022, total generated waste water and treated waste water is 970 MLD. 319 MLD is reused among them. If we look at the bifurcation of this figure further, we can see that 160 MLD is handled further up to tertiary level before being delivered d. Initiatives by Irrigation department

Climate Resilience in Indian Cities: Review of the perception, aspirations, and the actions Case of Surat 85
Conceptual Master plan of Tapi Riverfront Development project Figure 48 Figure 47
Source: Understanding of Author Source: SMC will not only increase mobility but also provide an ecological pleasant environment for the city’s smart residents. The corridor has a total length of 6 kilometres, of which 3 kilometers have already been implemented and are being used effectively by citizens. The linear park has a significant impact on the land value of both the side of the road.
The impact chain analysis (Fig. 49) for Solid waste management shows how climate induced hazards like air pollution, loss of soil nutrients and soil contaminations and human induced hazards like openly waste burning impact solid waste management system in terms of GHG emission increase, 5.18 Impact Chain Analysis for Solid Waste Management
Linear park near Vesu Area
Surat Municipal Corporation took up the Canal Corridor with Linear Park Development Project as part of the Surat Smart City Mission. The main goal was to ameliorate the current unhealthy situation along the existing canal and to utilize the most of the available road capacity within the city. The green corridor is being developed to create an environment along the canal road that f. Linear park project near Vesu area
g. Restoration of Mangrove forest
During storm surges in coastal areas, mangrove forests aid significantly to modify the wind direction. They also help to prevent soil erosion and salt water intrusion from the sea. Because Surat is located on the coast of the Arabian Sea and faces the threat of sea level rise, the Gujarat Ecological Commission has taken the initiative to restore its mangrove forest, around the Olpad and Dandi areas in Surat.


Climate Resilience in Indian Cities: Review of the perception, aspirations, and the actions Case of Surat86 Impact Chain Analysis for Solid waste management Figure 49
Source: Understanding of Author SMC established a 12-acre plot in Khajod as a solid waste disposal site in January of 2017. Nonusable, non-biodegradable, non-combustible, non-recyclable, and non-reactive inert waste, as well as pre-processing rejects and residuals from waste processing plants, shall be disposed of at this sanitary landfill site, according to the Solid Waste Management Rules of 2016. This project is estimated to cost roughly 20 crores of rupees, and it has the positive consequence of reducing landfill garbage. However, the project has a number of negative consequences for the nearby village, particularly the upcoming Dream City Project.
loss of biodiversity, loss of food production and increased air borne diseases. These need fruitful initiatives among which the government has already taken few. Rest is authors recommendation.
In the same year followed by the previously mentioned project, SMC had begun the work of plastic waste management system in Surat on PPP basis for next 20 years. To construct this system, SMC has offered a 2 acre plot of land for a token rent. The processing plant currently has a processing capability of 75 TPD, with the potential to expand to 200 MT/day. By giving indirect jobs to 15,000 people in the unorganized sector, the enterprise has had a significant influence on the economy. SUMUL Dairy has partnered with the initiative. Every day, around 1.5 lacs of milk bags are gathered a. Solid Waste Processing by SMC b. Plastic Waste Management Centre
5.18.1 Initiative taken by SMC
Source: Google Source: Google
Khajod landfill site Plastic Waste Management Centre, Surat Figure 50 Figure 51


The project started operating in the year 2019 and the total project cost is 20 cr. rs. The aim of this project is to collect and recycle 300 ton/ day construction and demolition waste for a period of 20 years. Total 8 locations have been designated by SMC for collection of C & D wastes. State of art technology will help this entire system staring from waste collection to final finished eco-product, so that the system would not have a negative impact on climate.
As an impact, total 642 numbers of bulk waste generators are actively working. The project already has contributed in 10%-15% of air pollution reduction in Surat compared to previous years.
5.19 Other Initiatives taken by SMC
d. Strategic location of Landfill siteFuture Initiative Construction and demolition waste centre, Surat Figure 52 Source: Google and processed. The project reduced trash while also increasing the recycling of virgin plastics as pellets. The total project cost is around 17 cr. rs.
1. Oxygen parks in Surat- SMC has taken initiative to built 2 oxygen park in Bhaimard and Utran to combat environmental challenges.
2. Incentivising buildings with Solar roof top- SMC has taken initiative to incentives building in terms of additional facilities if they install solar panels on top of roof.
3. Air Monitoring System- 2 Air quality monitoring system has been installed in Surat- 1 in Varacha zone and other in Limbayat zone. GPCB and SMC has also decided to install 7 CAAQMS air monitoring stations in Surat under NCAP.
As already mentioned in the Khajod landfill project, that it has an huge negative impact on the nearby villages causing foul smell, also air pollution due to waste burning. Also water pollution is there. All these can causes serious health problems within 10 km radius of the site. The project also had a high chance of affecting the upcoming Diamond city project. Hence the Government has decided to shift the landfill site to three identified plots of land at Mandroi and Bhandup in Olpad and in Wankinada near Kadodara,Palsana.
c. Construction and Demolition Waste Management Facility
5.20 Analysis of the initiatives
Transportation: In order to reduce GHG emission, the initiatives of shared mobility and clean transportation in Surat aim to reduce GHG emission which will eventually reduce air pollution and impact positively on global warming. This initiative will also help India to achieve the net zero emission target by 2070. Despite of these emission-free and noise-free benefits, implementation of e-vehicles have drawbacks specially in Indian context. During the stakeholder’s consultation certain challenges have been observed such as lack of expert drivers and
Other than these there are several initiatives that Surat Municipal Corporation is taking to combat with climate change. Some of these initiatives are-
Climate Resilience in Indian Cities: Review of the perception, aspirations, and the actions Case of Surat 87
“Aag Bhujao is an initiative under suratwatchcommunity where we have teams in all areas of surat. They report waste burning activity and after thorough vigilance we try to nab the offenders and smc serves them a penalty. Our job is to locate such waste burning pockets and get control over it by deploying fire brigade if needed”- Initiative taken by civil society groups like Project Surat

Solid Waste Management: In terms of initiatives linked to solid waste management, it has been found that the majority of the projects are centralized. As the distance between the transfer stations and Khajod dump yard site are quite long. This could result in a variety of air and water pollution issues. Also, the location of Khajod dump yard site causes physical hazards to people residing in the nearly villages. Due to this problem and also for the upcoming Dream city project, the government is planning to shift the dump yard site in olpad.
Green & Blue Infrastructure: As per the Development plan report and based on 2017’s data, it is being observed that despite of having a hierarchy of open spaces in Surat, they are not evenly distributed within the entire city and SUDA region. If we look at their distribution, it can be seen that 50% of the green area are concentrated in south waste zone. The liner park project along the canal (mentioned earlier) is also situated in that zone. Also the area of park, garden and open space is more within SMC boundary (263.78 ha) but very less within the remaining SUDA boundary (21.25 ha). Hence to combat with climate change effectively, we need
Climate Resilience in Indian Cities: Review of the perception, aspirations, and the actions Case of Surat88 Table 15 Proximity of transfer station to Khajod
Source: Own compilation based on the national action plans of the subsequent countries
Pie chart showing percentage of Green within SMC zones Figure 53 Source: Surat Proposed Development Plan other technical advancement to operate the buses, charging points related issues. Also as per the report “Procurement of Electric Buses: Insights from Total Cost of Ownership (TCO) Analysis” by WRI, it is being analyzed that Weather conditions such as temperature, atmospheric pressure and humidity affect the energy efficiency of an e-bus. The report stated that during rainy season due to high humidity in air, the friction between road and tiers increase which reduce the amount of energy recovered by the buses. Also, the batteries of E-buses costs high, which is also another reason of any kind of decision making from central Government. But, most critically, it has been discovered that the electricity used to charge the batteries is primarily generated by coal thermal power stations. Coal is a non-renewable energy source that dominates the Indian electricity sector. In addition, the supply of lithium for use in e-vehicles’ batteries is restricted. And the traditional method of extracting this raw material is hazardous to the environment, posing climate-related risks.


Climate Resilience in Cities: the perception, aspirations, and the actions
Review of
Case of Surat 89 Green and blue network in Surat including SUDA Figure 54
Source: Surat Proposed Development Plan but the rest of the canals and streams are not in such good condition. In addition, according to discussions with stakeholders, land acquisition for any type of development along the canal or river Tapi is the most difficult hurdle in Surat. Due to a lack of maintenance, the water quality of the Tapi river, creeks and canals is also poor, allowing mosquito to breed in the water and causing water-borne diseases. As a result, while the local government is doing an excellent job, it has to be more aware of the issues and act accordingly. Finally, it is noted that the majority of the projects clearly fall under the city’s climate resilience strategy, with a decent number of climate adaptation initiatives compared to mitigationrelated initiatives. To sum up all the initiatives in a nutshell and assess their influence on climate in positive or negative way and the project engagement, a table has been prepared (Table. X).
Indian
to have evenly distributed greens, gardens and open spaces across the city and the outskirts. As per WHO distribution of open space in based on per capita calculation. Per capita green space as per WHO os 9 sqm. But in Gujarat, open space is provided as per TP scheme regulation in GTPUDA. According to it 5% land of the entire Town Planning scheme has to be alloted for open space. According to URDPFI the percentage is 20%. Overall green space is less in Surat compared to it;s population and the distribution is not also proper within the SMC+SUDA region.
In terms of blue infrastructure, there are numerous creeks, which are referred to locally as kharis. Within the city, there are other canal channels. The linear park project is there as a smart city initiative, where the part of canal corridor is being landscaped and converted into communal space,

Resilience in Indian Cities: Review
5.21
in Surat Table 16 Source:
Climate of the perception, aspirations, and the actions Case of Surat90 Influence and Involvement of the projects Understanding of Author Overall, as per table X, Surat is taking good amount of initiatives to combat climate change. The initiatives have sense of equity which is good part. But it has been observed that the common problem stated by mostly all the stakeholders are, public awareness is the biggest challenge towards the successful implementation of these projects. It is being observed while doing site visit Conclusion that, people are not much aware about Smart city mission, but they have good knowledge of schemes like JNNURM. Due to effectiveness of the Surat Municipal Corporation and moderate amount of help by the citizens, Surat is performing quite well, rather the best in India in terms of climate resilience.
Analysis of


Source: Google Image

Climate Resilience in Indian Cities: Review of the perception, aspirations, and the actions Case of Surat92 Final Outcome FromRecommendationsMacrotoMicro6 Source: Google Image

3. There should be equal or more amount of adaptation actions: The devastating experience after every disaster makes us realize that how unprepared we are for such disasters. As a result, several good techniques and their subsequent action plans related to climate-induced adaptation programs are necessary.
Figure 55 Source: Adapted from various sources
To start with the recommendations, we will start with macro level recommendations and then will dig deeper and provide recommendations in micro or local level. The recommendations are as follows-
6.1 Recommendations
1. India’s “Net-Zero” emission pledge horizon year needs to be shifted little earlier: According to scientists, developing countries must attain net zero emissions by the year 2050 or 2060. With some strong policy intervention, the term of India’s commitment can be curtailed. Though India’s per capita carbon emissions are lower than those of other countries due to its higher population growth, the net global carbon emission percentage is fairly high at 6.81 percent, as we observed in Chapter 3. As a result, the netzero pledge road map must be more efficient so that it can be met by 2060, if not 2050.
2. Strenghthen the Adaptation & Mitigation strategies and update the NAPCC & NDC as soon as possible: In order to achieve net zero emission before 2070, we first need to have revised NAPCC & NDC with stronger mitigation and adaptation strategies which are not over ambitious but implementable in the context of India.
Climate Resilience in Indian Cities: Review of the perception, aspirations, and the actions Case of Surat 93
4. Eleminate financial risks while adapting a roust framework ton achieve net zero pledge by encouraging ecosystem based adaptation planning: In order to achieve net zero commitement by 2070, a study done by CEEW shows that India needs almost around Rs. 700 Lakh Crores. This means to achieve the goal before 2070 we need more financial back up. In most of the cases when we talk about mitigation or adaptation strategies it includes new technology which costs a lot. Hence most of the time the ideas do not get implemented on ground due to lack of financial back up from government. Hence we need to find alternative and cost effective processes as part of mitigation and adaptation strategies. In terms of ecological diversity, India is quite rich. From the Himalayas to the Western Ghats, or the natural splendour of the north east to the seashore, India is home to 8% of the world’s known biodiversity.
Introduction
The research was divided into four objectives. The first three objectives are more likely to include reviews, analyses, and observations on macro to micro level climate related aspects, but the fourth objective is to make recommendations based on the findings, which will be explored in depth in this chapter. It is being observed that despite of being aware of climate change, we are obscure about what to do when it comes to reality. The suggestions can be used to any Indian city.
India’s GHG emission profile

Forests, agricultural areas, coastal zones, wetlands, and other natural resources provide vital services that benefit both urban and rural populations. India can exploit this ecosytem diversity as an adaptive mechanism to mitigate climate change’s negative externalities. These methods are lowcost, simple to execute, and need community involvement. As a result, it can deliver economic, social, and environmental benefits all at the same time.
Figure 56 Source: Understanding of Author
6. The chain of Hierarchy of climate action plans is needed to e completed: Indian has a National Action Plan for Climate Change (NAPCC) that does not include any intermediate goals, as we discovered in our research. India, on the other hand, has a hierarchy of climate action policies. We have a State Action Plan for Climate Change (SAPCC), which is guided by the NAPCC . However, city-level climate action action plans are missing which is required to make our climate action plans inclusive, equitable, and transparent. Long term National or state level action plans are good to foresee where our nation can reach in the coming years, but city level plans make the process more tangible to achieve. In this context, it’s worth noting that Mumbai is the first city in India to develop city-level climate action plan for the horizon year of 2050. Surat, Chennai, and Pune, for example, have developed their city level resilience strategy plans with the help of the Rockefeller Foundation and are successfully implementing them. Other Indian cities should take these four cities’ lead and do the Havingneedful.said that, it is important to note that just because most Indian cities lack dedicated climate action plans does not indicate that local governments are not taking action. After evaluating the city of Surat’s initiatives and recommending ecosystem-based adaptation solutions in light of India’s diverse biodiversity, a few recommendations might be made that can be applied to any Indian city.
7. Encouraging Transit oriented development: Most of the Indian cities tend to use more private vehicles. It not only increase GHG emission but also increase traffic congestion or problem of noise pollution ( Eg. Bangalore or any other metro cities). For this we can see how nicely Surat is implementing more Mass transit system like BRTS and MRTS. They encourage more people to travel at the same time, hence cost effective and efficient. But study in Surat has shown that only promoting public transportation does not Hierarchy of climate action plans in India
Climate Resilience in Indian Cities: Review of the perception, aspirations, and the actions Case of Surat94

Climate Resilience in Indian Cities: Review of the perception, aspirations, and the actions Case of Surat 95
The Walk2Ride Programme, Singapore Figure 57 Figure 58 Figure 59
7.2. Promote walkability:
As a solution to it, we can promote non-motorised transportation system like bicycle, more use of paratransit system like bicycle rikshaws of Kolkata.
7.1 Encouraging more non-motorised Transportation System and modifying the road sections accordingly: In Surat we have seen that the concept of E-mobility has been adapted and successfully run. Though it helps in mitigating GHG emission from transportation sector, but the electricity consumption increases. India in COP26 has taken the pledge of producing 500 GW of renewable energy, but still In India the electricity sector is dependent of coal which is a non-renewable.
In order to do that we need to modify and improve our Indian street sections and provide dedicated lane for them to promote hassle-free NMT. We can also make bicycle track plan at community level.
Concept of TOD through simple diagram Green dedicated lane for NMT
To promote walkability in Indian cities, vibrant and innovative street design need to be encouraged at neighborhood level. Also as mentioned earlier, the street sections can be designed in innovative way. For example provision of green sheltered walkways between home and transit stations can create a comfortable pedestrian experience for the population, considering India’s cliamte hazards (eg. The Walk2Ride Programme, Singapore).
Source: Understanding of Author Source: Hongkong community bicycle tracks Source: Google help is not using private vehicle. In this case if we can reduce the distance of their traveling by promoting TOD development and the concept of compact city, then there is chance of less using public vehicle. The 15 minute walk city concept of paris is quite successful. For this kind of redevelopment in Indian cities the concept of Local Area Plan is there. for Greenfield areas there are Town Planning schemes, predominantloy found in Gujarat & Maharashtra. But to further make it more efficient we as planners should promote Transit Oriented Development to reduce the use of private vehicles by bringing people, acticities and buildings closer. As a result GHG emission will reduce and the problem of traffic congestion will also solve.


10. Decentralized Infrastructure: Dumping grounds are not sustainable landfills as these dumping grounds have no foundations, cover soil, leachate managements and treatment facility (Jha et al., 2011). Also people do not prefer to have dumping ground within a clise proximity to their house. Due to lack of proper transportation facilities, solid waste are not properly transported to the destination. And due to financial crisis, they do not often disposed in a very scientific manner. Decentralized solid waste helps to provide a healty environment as it reduce the distance of journey from source to destination and also reduce the quantity of collected garbage at destination point, hence reduce the intensity of pollution. It is financially viable, provide job opportunity to waste collecting labors and also provide them a healthier and cleaner job environment.
11. Promoting Urban Forest: As a macro level initiative we have talked about promoting ecosystem based adaptation process
Climate Resilience in Indian Cities: Review of the perception, aspirations, and the actions Case of Surat96 Visualizing the concept of Urban Forest and it’s advantages Figure 60 Source: Understanding of Author | illustration help taken from google

Source: Understanding of Author 11. Agro Forest in Peri-urban area:
11. Climate change as a part of school curriculam: Observations in chapter 4 shows that there is still a lot of room for capacity building and public awareness in the areas of climate change and national strategies. As a recommendation, there should be a mandatory curriculum edition in every school or college syllabus that raises awareness of our national missions, NDC, India’s contribution and activities at global level.
Climate Resilience in Indian Cities: Review of the perception, aspirations, and the actions Case of Surat 97
6.3 Conclusion: These are the generic recommendations which can be appied for any Indian cities. The approaches are cost effective and efficient. We as the Indian citizen’s need to be more aware of our responsibilities. Agroforestry aids in erosion management of soil and water preservation, recycling of nutrients, biodiversity retention, and better air, as well as assisting communities in coping with severe weather.
In order to propmote eco-system based adaptation approach, we can use the concept of agro-forest in India. Agroforest is a concept that incorporates shrubs and trees into farming and rural landscapes to improve productivity, economy, biodiversity, and environmental sustainability. India is a agriculture based country. Sustainable practice of farming not only helps to protect the soil and the bio-diversity, but also congtributes to a healtier climate and reduce global warming.
Ecological Advantage of Forest Figure 61
Urban forest is an innovative nature based adaptation approach which is kind of scale up version of these lenear park projects at city level. It gives ecological, economical and sociological benefits to the society by improving quality of life and combating climate change in a smart way.
12. Enhancing inter-disciplinary coordination & Cpacity building of all kind of stakeholders: It is also observed that there is some gaps in the understanding of the stakeholders in the domain of climate change. Their own perceptions sometimes contradict with each other. As a result there has to be more capacity building programs which will bring all kind of stakeholders under the same roof, increase awareness and transperency at the same time. to harness climate change. In Surat we have taken the linear park project has been taken up which is a good initiative and an ecosystem based adaptation approach but unfortunately there is only 1 linear canal park in Surat. Also we have seen that city level green open space is less. As per WHO which needs to be minimum 9 sqm. per capita and preferably can go upto 50 sqm. And other Indian cities are also facing same problem.

Source: Author
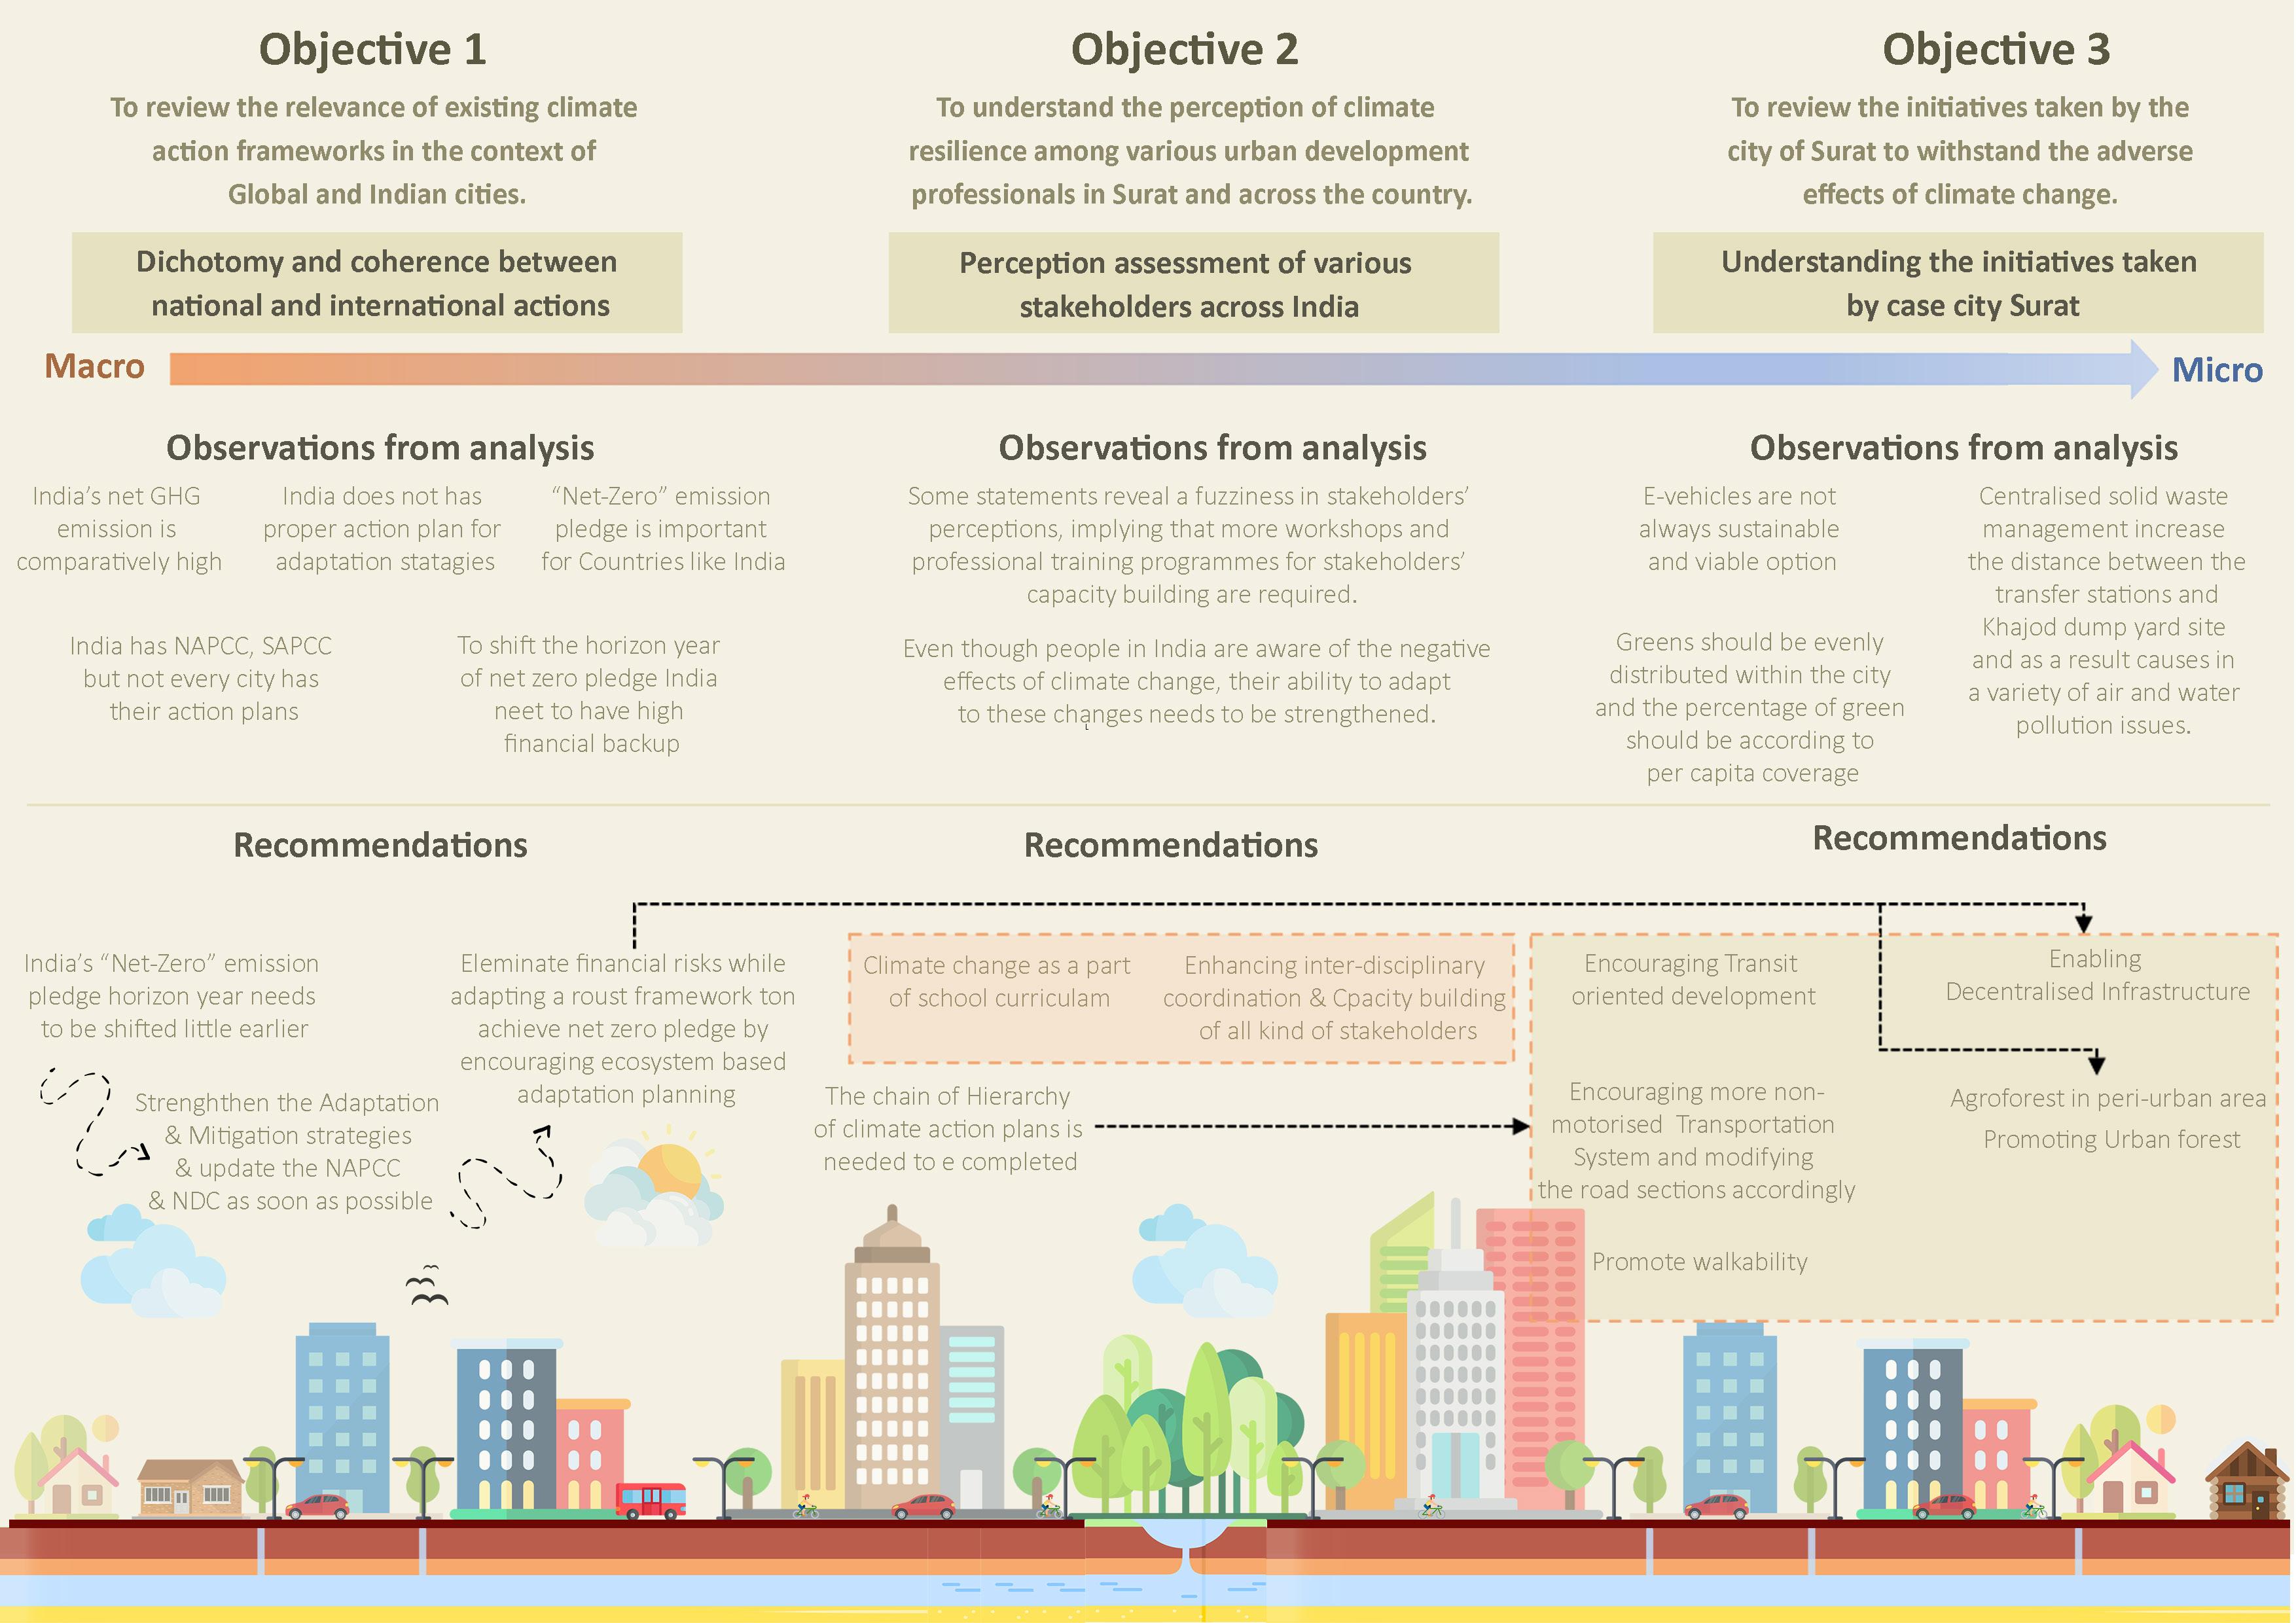
Climate Resilience in Indian Cities: Review of the perception, aspirations, and the actions Case of Surat100 References 1. Beeton, D. et al. (2020). Cities at risk Building a resilient future for the world’s urban centres 2. Gupta, A., et al. (2019). Developing Disaster-Risk Resilience in Cities 3. The World Bank. (2012). Building Urban Resilience, Principles, Tools and Practice 4. The World Bank. (2019). City Resilience Program, Catalyzing Urban Resilience, Program brief. 5. Doyle, A. (2016). Operationalising Resilience within Urban Planning – Bridging Theory and Practice. 6. Meerow, A. et al. (2015). Defining urban resilience: A review. 7. Rega, C. et al. (2020). The Rise of Resilience in Spatial Planning: A Journey through Disciplinary Boundaries and Contested Practices. 8. Herrera, H. (2017). Resilience for Whom? The Problem Structuring Process of the Resilience Analysis. 9. The Rockefeller Foundation. (2015). City resilience programme by Rockefeller. 10. TERI & the Rockefeller Foundation. (2011). Mainstreaming Urban Resilience Planning in Indian Cities A Policy Perspective. 11. UNISDR. (2012). How To Make Cities More Resilient A Handbook For Local Government Leaders. 12. Galderisi, A., et al. (2020). Strengths and weaknesses of the 100 Resilient Cities Initiative in Southern Europe: Rome and Athens’ experiences 13. UN-HABITAT. (2017). TRENDS in URBAN RESILIENCE 14. ADB. (2014). URBAN CLIMATE CHANGE RESILIENCE A Synopsis 15. Jha, V. (2014). The coordination of climate finance in India 16. Smith, B., et al. (2014). Reconfiguring urban adaptation finance 17. SCCT, (2017). Surat Resilience Strategy. 18. ODA . (2021). WHAT IS ODA? 19. Meerow, S., et al. (2019). Seven Principles of Strong Climate Change Planning, Journal of the American Planning Association, DOI: 10.1080/01944363.2019.1652108
25. Global Green Growth Institute and Center for Study of Science, Technology and Policy (2015). Electric Buses in India: Technology, Policy and Benefits, GGGI, Seoul, Republic of Korea
3. ENHANCING CLIMATE ACTION THROUGH STAKEHOLDER ENGAGEMENT AT THE COUNTRY LEVEL. Climate Investment Fund, December 2020 Brooks, N., et al (2011). Tracking adaptation and measuring GUJARAT STATE DISASTER MANAGEMENT PLAN, 2020-2021 STATE ACTION PLAN ON CLIMATE CHANGE GOVERNMENT OF GUJARAT CLIMATE CHANGE DEPARTMENT by The Energy and Resources Institute New Delhi & GIZ ACCRN: India Chapter, City vulnerability analysis report Indore & Surat , submitted to rockefellar foundation by TARU Leading Edge, 2011 Jones, L. (2016). Resilience isn’t the same for all: Comparing subjective and objective approaches to resilience 9.measurementMehta,V.(2016). Climate resilient infrastructure : a case study of Surat municipal solid waste management, CEPT University. Malyan, A., et al. (2022) India’s Vision Towards a Net Zero Economy: Stakeholder Perspectives, CEEW, India
20. SURAT CITY WORKSHOP SUMMARY, prepared by TARU Leading Edge, Pioneer by the Rockefeller foundation 100 Resilient City.
21. Kent B. Barnes (2014): Social vulnerability and pneumonic plague: revisiting the 1994 outbreak in Surat, India, Environmental Hazards, DOI: 10.1080/17477891.2014.892867
4.
Climate Resilience in Indian Cities: Review of the perception, aspirations, and the actions Case of Surat 101
development 5.
2014 7.
22. Waghwala, M., et al. (2020). Flood risk assessment and resilience strategies for flood risk management: A case study of Surat City 23. Kuh. K.F (2018). The Law of Climate Change Mitigation: An Overview 24. Go green Scheme, by Gujarat Government - https://glwb.Gujarat.gov.in/go-green-scheme.htm
Bibliography
1. Meerow, S., et al. (2016). Comparing Conceptualizations of Urban Climate Resilience in Theory and Practice
6.
10.
Supported
8.
2. Jones, L., et al (2016). MEASURING SUBJECTIVE HOUSEHOLD RESILIENCE INSIGHTS FROM TANZANIA
Climate Resilience in Indian Cities: Review of the perception, aspirations, and the actions Case of Surat102 Important Website • https://www.acccrn.net/country/India • https://unfccc.int/topics/climate-finance/the-big-picture/introduction-to-climate-finance • https://www.greenclimate.fund/about • https://unfccc.int/climatefinance?home • https://wri-india.org/our-work/topics/climate • 11.•coronavirus/379531/https://theprint.in/health/1994-surat-plague-has-many-lessons-for-india-on-how-to-beat-https://www.counterview.net/2017/05/industrial-waste-discharge-into-south.htmlNATIONAlACTIONPlANONCliMATECHANGE,GOVERNMENTOFINDIA,PRIMEMINISTER’S COUNCil ON CliMATE CHANGE 12. India: NAPCC Process Country Case Study, GIZ 13. Plan National Climate, Algeria, Spetember 2019. 14. Germanwatch, NewClimate Institute & Climate Action Network. (2022). Climate Change Perfromance 15.IndexClimate Programme 2020 Denmark’s Mid-century, Long-term Low Greenhouse Gas Emission Development Strategy, December 2020 16. Singh, S. (2013). DECENTRALIZED SOLID WASTE MANAGEMENT IN INDIA: A PERSPECTIVE ON TECHNOLOGICAL OPTIONS 17. Proposed Area Development Project “Tapi Riverfront Development and Rejuvenation Project” At Surat City, District Surat, Gujarat By Surat Municipal Corporation 18. IPCC, 2018: Summary for Policymakers. In: Global Warming of 1.5°C. An IPCC Special Report on the impacts of global warming of 1.5°C above pre-industrial levels and related global greenhouse gas emission pathways, in the context of strengthening the global response to the threat of climate change, sustainable development, and efforts to eradicate poverty [Masson-Delmotte, V., P. Zhai, H.-O. Pörtner, D. Roberts, J. Skea, P.R. Shukla, A. Pirani, W. Moufouma-Okia, C. Péan, R. Pidcock, S. Connors, J.B.R. Matthews, Y. Chen, X. Zhou, M.I. Gomis, E. Lonnoy, T. Maycock, M. Tignor, and T. Waterfield (eds.)]. In Press.
Appendix


Climate Resilience in Indian Cities: Review of the perception, aspirations, and the actions Case of Surat106

Climate Resilience in Indian Cities: Review of the perception, aspirations, and the actions Case of Surat 107

Climate Resilience in Indian Cities: Review of the perception, aspirations, and the actions Case of Surat108


Climate Resilience in Indian Cities: Review of the perception, aspirations, and the actions Case of Surat 109 Key findings from interview- Transportation Key findings from interview- SWM


Climate Resilience in Indian Cities: Review of the perception, aspirations, and the actions Case of Surat110 Key findings from interview- Health Key findings from interview- Irrigation


Climate Resilience in Indian Cities: Review of the perception, aspirations, and the actions Case of Surat 111 Key findings from interview- Tapi Suddhikaran Project

Climate Resilience in Indian Cities: Review of the perception, aspirations, and the actions Case of Surat Climate Resilience in Indian Cities: Review of the perception, aspirations, and the actions Case of Surat112 113 Stakeholder Consultation Meeting with Mr. Pankaj Gandhi in Surat during site visit Climate cafe to spread public awareness regarding climate change Intaractive session by WRI on climate action Intaractive session by CEE on climate action Attending Smart cities Smart Urbanization conference Attending Smart cities Smart Urbanization conference Poster designed for CEPT-Summer Exhibition


Climate Resilience in Indian Cities: Review of the perception, aspirations, and the actions Case of Surat114
