


THIS BOOK BELONGS TO: CLASS:
Authors
C.M. de Boer, Chr. de Jong
F. Jutte, J.H.A. Padmos, A.M. Peters
Editors
D. Ariaens, A.M. Peters


THIS BOOK BELONGS TO: CLASS:
Authors
C.M. de Boer, Chr. de Jong
F. Jutte, J.H.A. Padmos, A.M. Peters
Editors
D. Ariaens, A.M. Peters


A different approach
passport for
Start
A different approach
your neighbourhood

Start
landscape and
role in the
Inequality in Brazil

the Amazon
and poor in South America
Amazon region:
G228, G231, G233, G238, G239, G240, G241, G247, G256
chapter has five sections. One section is specifically for
the other four for both havo and vwo. The sections include
pieces of text, maps and photos.
help you learn, the Geo uses structuring symbols:
the Geo
for class along with the online learning environment. This is your personal copy of the coursebook so feel free to make notes in the book. After this school year, you can use the book if you want to look something up again.

are eight chapters in this coursebook. Each chapter has the same structure: Start, five sections, A different approach
your assignment and Finish

Start gives a visual introduction to the chapter. This introduction shows you what you are going to do. The Start shows a photo of the area or topic covered in the chapter.
the topic and
main heading: what is this text about?

or list of different points
example or additional explanation
what region are we studying
in blue: new term with its
text: what is
about?
in bold black letters: you have seen this term before

Geo Guide number(s)
symbol will precede the A different approach section,


which we look more closely at a particular region or a topic.
will have to do tasks, usually in a group.
introduction to the topic
The symbol will also precede the Choose your assignment section. It covers four or five topics. You can choose what you want to do. You can work alone, with a classmate or in groups.

In the workbook you will see the symbol next to the A different approach section and the Choose your assignment section. This means that your task here will be different from ordinary assignments.

The Finish is at the end of each chapter. Here you can find a list of all the terms and their definitions.
There are three projects at the back of the coursebook. You will usually spend several lessons doing some research for these projects. You can combine your research with other subjects.
You will always start working from your workbook. You will find all the assignments there. Your workbook contains assignments on the text, photos, maps and charts in the coursebook. You will often have to do tasks, such as colouring in a map or drawing a chart. For each of the assignments it will be made clear which text or figure in the coursebook you need to be able to complete the assignment or which Geo Guide number you will have to read.


You will use the Geo Guide for three years, so you will need it in years 2 and 3 as well. The Geo Guide contains all the impor tant information about geography and all the terms and their meanings. It will also teach you how to read and draw a map, and explain various phenomena, such as volcanoes, and why it is so cold at the North Pole. You will also find lots of ideas and information for projects or reports. The Geo Guide is also available online. Here you can also find animated clips that explain the terms.


A next to an assignment means that you can or will have to go to the online learning environment to complete an assignment, or to watch a video or an animated clip. Everything in your books is also available in the online learning environment. You can do all your assignments in the online learning environment. Here you will also find special assignments that are not included in the workbook, such as assignments with GIS, interactive maps and videos. You will find the coursebook information that you need for each assignment next to the assignment. You can also check your work immediately.


Iran is a vast country in western Asia. The country is bordered to the west by Turkey and Iraq and to the northwest by Armenia and Azerbaijan. The names of the three countries neighbouring Iran to the east all end in -stan: Turkmenistan, Afghanistan and Pakistan. Stan means land or country in Persian, the language of Iran. The capital Tehran is a five-hour flight from Amsterdam.
If we look out of the airplane window above Iran, we will see that the landscape is mostly mountainous. In fact, the highest mountain peak is more than 5 kilometres high! We can also see that there are many empty spaces: large pieces of land are not being used.
Once you land, the modern Imam Khomeini Airport looks just like Schiphol Airport. But there are some differences. The walls of the airport building are covered in large pictures of the two most important political and religious leaders. These portraits are mandatory in all government buildings in Iran, including all classrooms. The language on the signs is Persian. The Persian alphabet is similar to the Arabic alphabet. Women also wear a headscarf: a hijab (Figure 2).
Maps and photos of Iran teach you more about the country. A map is a scale drawing of an area or region.
Figure 3 tells you a lot about Iran: it shows the names of cities, mountains, rivers, seas and neighbouring countries. And also the main roads and railway lines. The map in Figure 3 is a general map
shows that most Iranians live in the north and west of the country. The average number of people per square kilometre (km2), the population density, is high there. In contrast, the east of Iran is very sparsely populated. Thus the population distribution

uneven. Figure 4 is a thematic map, which is a map with a particular theme (theme means topic).


To understand a map we have to be able to read maps. This skill is called map reading. We need four things to do this: the title, the legend, the scale and the north arrow.
The title tells you the theme and/or the area of the map. In this coursebook the title is always found next to the Figure number, in the caption.
The legend explains the meaning of the colours and symbols on the map. The dots and the square of the cities on the map in Figure 3 are an example of symbols. We cannot read a map without a legend.
The scale shows how much smaller the area has been made on the map. We see, for example 1 : 200,000 (we say: 1 equals 200,000). 1 centimetre on the map equals 200,000 centimetres in real terms. That works out at 2,000 metres or 2 kilometres.
So to find out the number of kilometres in real terms we remove the five zeros from the scale figure. When we know the scale we can work out the distances.
Some maps have a north arrow. If a map does not have a north arrow, the north is at the top of the map.

The photo in Figure 5 was taken in Yazd, a city in the middle of the desert. Almost no one lives in the area surrounding this city: it is too dry to survive. Without the supply of water from wetter areas, nobody would be able to live in Yazd either. The uneven population distribution in Iran has everything to do with the distribution of precipitation across the country.
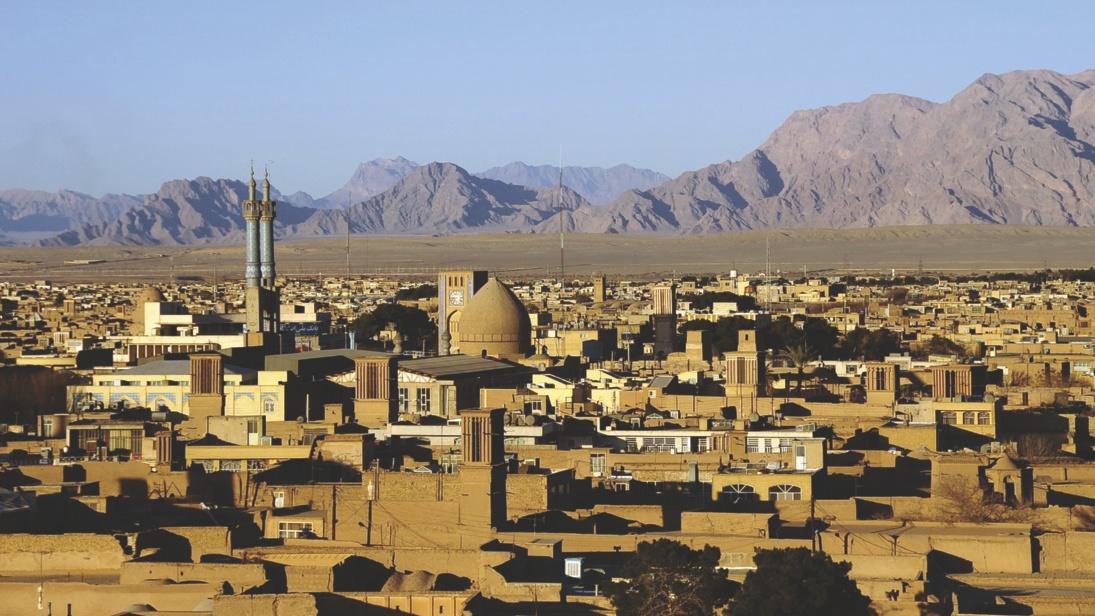
Geography is the study of places and areas. Geography comes from the Greek words geo (meaning earth) and graphía (meaning to describe). For example, a description of the landscape in Figure 5 could be: flat in the foreground and mountainous in the background. But why are the mountains there? And why does the Netherlands not have any mountains? So we also explain phenomena in areas. And we compare phenomena in areas with each other.


Amsterdam is the largest city in the Netherlands with a population of about 850,000 people. That is nothing compared to Tehran, which is home to over 12 million people. And every day it welcomes about 8 million people from outside the city who come to work or study there.
and even swimming pools. The area has shopping centres with cinemas, clothing stores and modern cafés, such as Café Sam. And there are many restaurants and fancy pastry shops selling mostly sweet cakes.
The view of the immense capital city from the top of the tallest building in Tehran, the Milad Tower (435 m), is spectacular. It also clearly shows the differences between the old south and the modern north of the city.
The Grand Bazaar (Figure 6) is located in the older south of Tehran. The buildings in the surrounding districts have been built very close together. They range from two to five storeys and are thus not very tall. The upper floors house Tehranians who live in apartments that often only have two rooms. The ground floors house offices, small shops that sell all sorts of inexpensive things, and workshops for repairing shoes or motorcycles, for instance. There are hardly any open spaces. The narrow streets are crowded with traffic, parked cars and the display of merchandise.

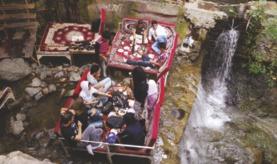
The majority of the residents of Tehran get around the city by car, moped or scooter. This is because the distances between homes, work and amenities are often great. The metro is quicker but is overcrowded and does not go everywhere. The distances are too great to cycle and the traffic is too heavy and dangerous. There are long traffic jams every day (Figure 8). The air in the city is so bad because of the exhaust fumes that many residents leave the city at weekends in search of fresh air in Darband, for instance (Figure 1).
The street map in Figure 7 shows part of northern Tehran. A street map is a map that shows all the streets and the buildings located there.
The north of the city is younger than the south, which can be seen by the wider streets. In addition, space has been set aside for parks and playgrounds. The apartment blocks are taller, the houses are much more spacious and often have a balcony or a communal garden. There are also villas with private gardens
The scale makes a big difference in geography. We can look at the world as a whole or we can zoom in on places. Zooming in means that we look at an area more closely. We go from a large area, such as Asia, to a smaller area, such as Iran. Zooming out is the opposite of zooming in. We look at an area from further away.
When we zoom in on a city like Tehran, we are working on a local scale (local refers to a place or small area) (Figure 9). When we zoom out to the world as a whole, we are working on a global scale (global means world).

There are three other scale levels in between. These are shown in Figure 12.
In Figure 9 we can once more see the district where Café Sam is located. The cartographer (someone who makes maps) has left out many things here. The parks and gardens, the shopping centres, the smaller streets and the café: they are no longer visible. This is necessary because the area on the map is much larger that the area shown in Figure 7. Leaving out things on a map is called generalization
When we look at the population density of Tehran on a local scale, we can see big differences between districts, for example. The population density of the south of the city is much higher than of the north. But if we look on a national scale (national refers to a country) then we can no longer see that (Figure 4). In that case we see something completely different: the unequal population distribution in Iran.
Tehran in one day
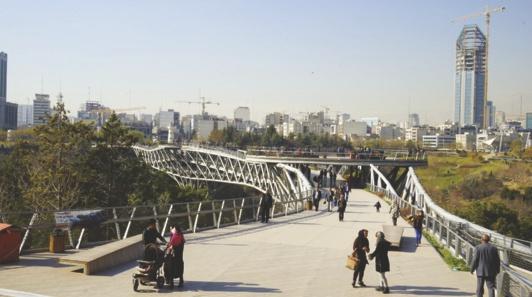
Thomas Erdbrink is a Dutch jour nalist and television presenter. He is married to an Iranian and lives and works in Tehran. He is going to show you around for a day. “Let’s start at the Grand Bazaar in the historical southern part of the city. Don’t wander off during the tour. It’s easy to get lost in the crowds and the narrow streets. After that we will go straight through the city centre to the wealthier and more modern north. We will no doubt end up in your first, but certainly not your last, traffic jam. Here we can go shopping and go to Café Sam in a posh shopping centre. Café Sam is very trendy. This is where the young, urban Tehranians go. When you’ve had enough coffee we’ll take the metro to the modern Tabiat Bridge (Figure 10), which connects two parks on either side of a motorway. Let’s have a bite to eat at Khoone, a restaurant next to the bridge where they serve Iranian food, with yoghurt, salads and stews. We’ll end our tour at a large theme park close to the mountains, where it’s pleasantly crowded in the evenings, especially at the weekends. The park is often called the roof of Tehran because from here you have fabulous views over the city. You can see the Milad Tower in the distance: you can go there tomorrow for an even more spectacular view.”

zooming in zooming out
local scale: city regional scale: area, province, state national scale: country continental scale: countries, continent global scale: world
If we want to know exactly where Tehran is in the world we should look at the absolute location. We need two things to do this: the latitude and the longitude of the city.
latitude: the Earth is a sphere with the equator in the middle. The equator is an imaginary line that splits the Earth into two halves: the northern hemisphere and the southern hemisphere The North Pole is in the far north and the South Pole is in the far south.
You can divide the two hemispheres into degrees of latitude. The equator is located at 0 degrees. The poles are located at 90 degrees. We can draw a circle at each degree of latitude. This is called a circle of latitude (or parallel). All these circles are parallel to the equator.
We use degrees of latitude to measure exactly how far a place is from the equator. That is called the latitude of the place. Latitude in the northern hemisphere is called northern latitude (N). Latitude in the southern hemisphere is called southern latitude (S). Tehran is located at 36°N.
If a place is near the equator, we say that it has a low latitude (less than 30°). If a place is far from the equator, we say that it has a high latitude (more than 60°).
longitude: we can also divide the Earth into degrees of longitude. We can draw a semi-circle at each degree of longitude. This is called a meridian. Meridians run from pole to pole. The 0 meridian is the line that runs through Greenwich (near London). It is also called the prime meridian
We use degrees of longitude to measure exactly how far a place is from the prime meridian. That is called the longitude of a place. The places east of that line have an eastern longitude (E) and the places west of that line have a western longitude (W). There are 180 meridians in both directions. Tehran, for example, is located at 52°E.
We can now make a note of the absolute location of Tehran. The coordinates are: 36°N and 52°E.
Where exactly is Tehran located? And how can the atlas help you to get to know more about Iran?FIGURE
l The world is divided into 24 time zones of one hour. The time at the prime meridian is called GMT (Greenwich Mean Time), 12:00 GMT, for instance. This is the primary time zone of reference for many parts of the world. In the time zones to the west of this zone it is earlier and to the east it is later. For example, in Calgary (Canada) it is −7 hours, in Tehran it is +3.5 hours and in Sydney (Australia) it is +11 hours.
You need an atlas for geography. Four parts of an atlas are very important.

l table of contents: This shows the numbers and titles of all the maps in the atlas. They have been divided into areas: first the Netherlands, then Europe, the other continents and lastly the whole world.
l the page finder: The page finder is useful if you already have an idea of where a place or an area is located. A page finder is a map that gives an overview of all the maps in the atlas and their numbers.
l the index: there are two indexes.


n The index in the atlas is an alphabetical list of all the places, rivers and mountains in the atlas. Next to each name you will see the page number of the map and the map section. For example: The Grote Bosatlas lists Tehran 130-131 E2. This means that we can find Tehran on page 130-131 in map section E2. Alcarta lists 140A, D4 after Tehran. This means page 140A, map section D4. We use this index if we do not know where a place or a region is located.
n The index of geographical terms is a list of topics. For each topic there is a list of maps in the atlas that deal with that topic. For the term population distribution, for instance, we can find a map showing how the population is distributed around the world.
l legend: If the atlas does not have a legend next to the map, then look in the general legend of the atlas. There you can find legends for different kinds of maps, such as general maps and thematic maps

in time are due to the


which always illuminates only one half of the Earth. It is daytime on the illuminated side of the globe, on the dark half it is night. Because the


Use the Geo Guide to answer these questions.

The Geo Guide contains the basic theory of geography, including explanations of the most important terms. The theory is divided into Geo Guide numbers, the G numbers. They are grouped in ten chapters by theme. The theme of Chapter 2, for example, is Weather and climate. If you need a G number, you will be able to find it in your coursebook and you can also read it in your workbook. You will use the Geo Guide for three school years. This makes it easy to look up things that you learnt in year 1 at any time.
Road 59 is a motorway that runs from Tehran straight through the Alborz mountain range towards Chalus, a city on the Caspian Sea. You have to overcome quite some differences in elevation on the way.
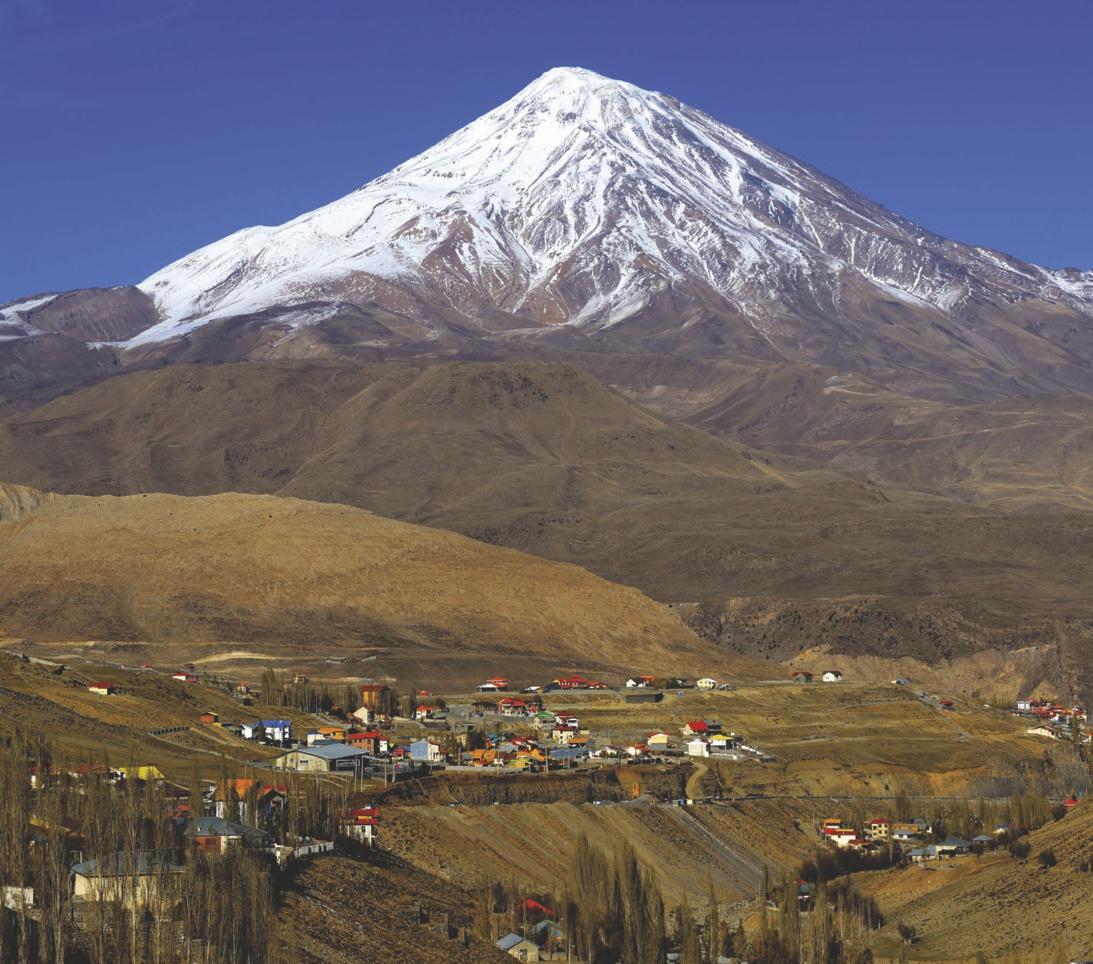
The route starts in the centre of Tehran at an elevation of 1,100 m above sea level and then climbs considerably. There are many high mountain peaks above 1,500 m in the Alborz mountain range, such as Iran’s highest peak, Mount Damavand (5,671 m). En route you will pass through different landscapes. When you leave the city you will first see some grass, trees and shrubs. The higher you go, the less green and more empty and rocky the landscape becomes. The highest peaks are covered in perpetual snow (Source 2). For about six months a year the Alborz mountain range has enough snow for skiing and snowboarding. When you descend from the highest point of the route towards the Caspian Sea, the landscape changes again. The winding roads take you through dense forests (Source 5) to increasingly flatter areas and then to the built-up area of Chalus.

The highest peaks of the Alborz mountain range are always covered in snow (i.e. perpetual snow), because it is colder there than at the foot of the mountain range. The higher you go, the colder it gets. This is true for all mountains in the world.

What is the landscape around Tehran like? And what are the distances to other cities in Iran?
kinds of distances

The distance in a straight line (as the crow flies) between Tehran and Chalus is 110 km. This distance in kilometres, measured as the crow flies, is called the absolute distance But the route shown on the satellite image below and in Source 4 clearly shows that the road does not follow a straight line. All those bends make the route longer, i.e. 201 km, and mean that you cannot drive very fast. How long it will take will also depend on the number of breaks taken and whether it is busy. The travel time will become even longer if you go by bicycle, as some foreign tourists do (Source 6). The distance measured in travel time is called the relative distance. The relative distance will therefore vary by individual, while the absolute distance between two places will always be the same.

KEY
Distances from Tehran
In Iran, the distances between cities is much greater than in the Netherlands. As the crow flies it is 1,129 km from Tehran to Zahedan, a city in the sparsely populated east of Iran. By road it is even nearly 1,500 km. By comparison: that is the same as the distance between Amsterdam and Madrid! The travel times in Iran are always long. To travel from Tehran to many other cities in Iran you have to pass through a mountain range, which is why it is very common in Iran to take a domestic flight instead of going by car. It then only takes you two hours from Tehran to Zahedan instead of about 20 hours.

ARMENIA
Tabriz
AZERBAIJAN
Tabriz
Baku
TURKMENISTAN
in km as the crow flies by road
Bagdad Baghdad
SAUDI ARABIA
Teheran
Tehran
Mashhad Zahedan
Shiraz
ARAB EMIRATES


Millions of Iranians do not live in Iran, but live abroad. The size of this group increases
At the same time, many Afghans and Iraqis are moving to Iran and the size of this group is also increasing. What is going on

It is estimated that about 4 million Iranians live outside Iran.


Every year, this number increases by about 150,000 young and highly educated Iranian migrants. A migrant is a someone who leaves their place of origin and moves to another place. Migrants who leave a country are called emigrants. Migrants who settle in another country are called immigrants. Iranian emigrants have varying reasons for leaving Iran for another country.
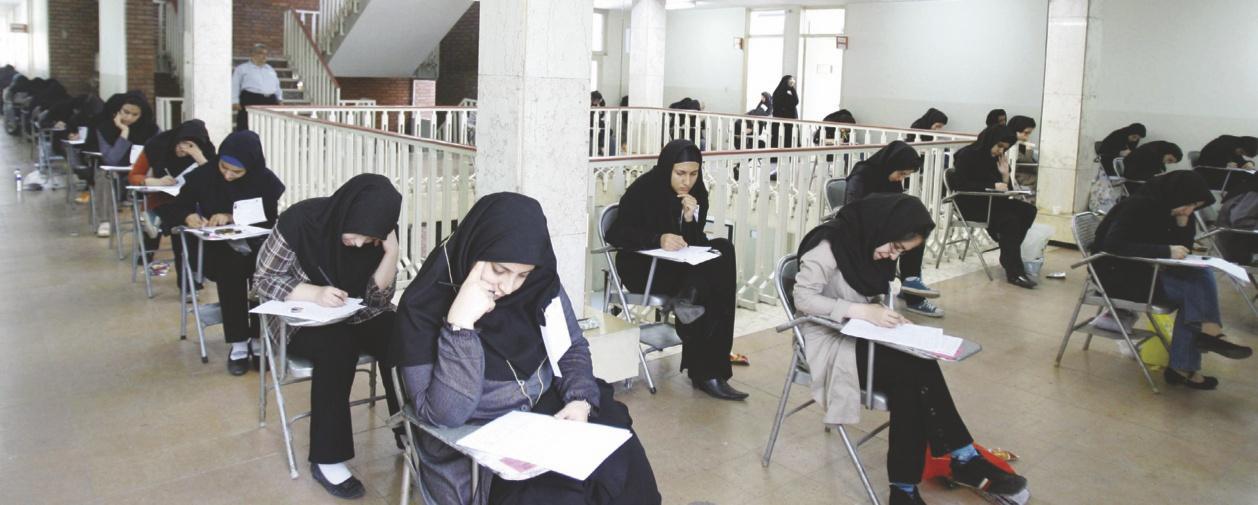
The vast majority leave to pursue a university education in another country. One in four Iranians with a higher level of education now live outside Iran. They stay there after their studies because there are too few jobs in Iran for the highly educated. In addition, wages are higher outside Iran. This group is called economic migrants because they move for economic reasons (money and work). They often end up in Europe, North America and Australia.
Relatives and friends of the Iranian emigrants hear and see how good life is in other countries through social media. If they also decide to leave because they want to live with their relatives or friends, they are called social migrants


In the past, millions of Iranians emigrated for political reasons (political migrants). They disagreed with the government and subsequently did not feel safe in Iran. This group of migrants still constitutes the largest group of Iranian migrants abroad.
emigrants
less than 5,000 5,000 - 20,000 20,000 - 50,000 50,000 - 100,000 more than 100,000


immigrants less than 5,000 5,000 - 20,000 20,000 - 50,000 50,000 - 100,000 more than 100,000


People who leave their country because they are no longer safe in their own country are also called refugees
Especially the departure of the group of young Iranians with a higher level of education has a major impact on Iran. On the one hand the migrants send part of their income back to relatives and friends in Iran, but on the other hand, their departure actually costs billions. Iran is in fact the country with the largest brain drain in the world. The knowledge of all those highly educated Iranian emigrants disappears abroad and cannot be used by Iranian companies.

In addition to being a country of many emigrants, Iran is also a country of many immigrants. In fact, the country even had an immigration surplus from 1990 to 2017. This means that there were more immigrants than emigrants in this period. The two largest groups of immigrants are Afghans and Iraqis. In recent years the net migration rate, i.e. the number of people who come to live in an area minus the number of people who leave it, has been around zero. Iranian emigrants and Afghan and Iraqi immigrants are roughly in balance.
Somayeh (aged 26) and Newsha (aged 25) were at school together in Isfahan. They now both work and study in Tehran. Of all their friends in their class in Isfahan they are the only ones who still live in Iran.

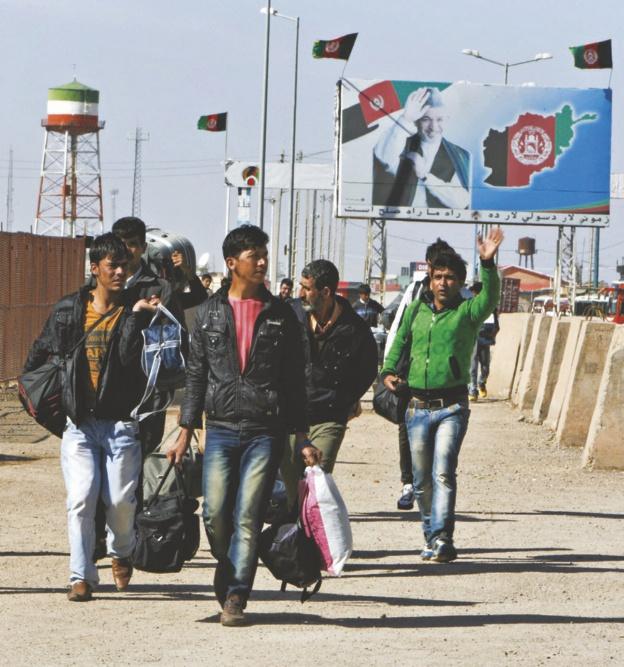
The Afghans and Iraqis in Iran primarily fled from the war in their country. Several thousand Afghans and Iraqis have since returned to their homeland, but more than 2 million Afghans and nearly 100,000 Iraqis still live in Iran. They have stayed because their own country is still in ruins or because it is not yet safe enough to return.
Furthermore, several hundred thousand Afghans still come to Iran every year. They come to Iran in search of employment as there are almost no jobs to be found in Afghanistan. Reasons for people leaving an area are called push factors, such as war or the lack of jobs in Afghanistan. Reasons for people to actually move to an area are called pull factors, such as safety and security and the presence of jobs in Iran.
Somayeh explains: “Parnina has been studying in the German city of Cologne since this year. That is nice for Nilufar who also lives there with her parents and sister. Her parents have been living there for a long time because her father no longer felt safe in Iran due to his work for an American newspaper. Nilufar and her sister lived with their grandparents in Isfahan all this time. Sepideh is now studying at one of the best universities in the United States. And Haleh is doing an internship at a company in Singapore. She was the first to leave, some four years ago now.” Newsha adds: “And then we have Rajan in Norway, Soha in Belgium and Mohammad in Switzerland.” Are Somayeh and Newsha going to stay? Somayeh says: “Probably not. My boyfriend Amin and I are already busy looking for the best place to do our Master’s degree. I think it will either be the Netherlands or Norway.” Newsha says: “I will not be staying either. Australia has more to offer in terms of my further studies so it looks like that is where I will be going.”
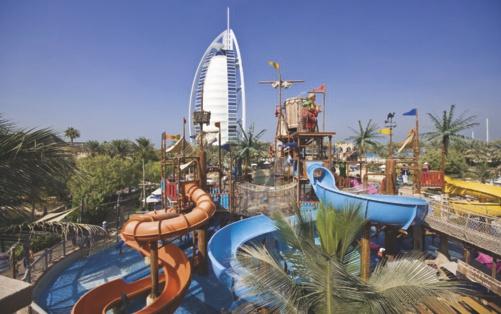
White beaches, palm trees, coral reefs, modern hotels, luxurious shopping malls, spectacular attractions and lots of money. These are the ingredients that Iran is using to try to make the island of Kish a popular tourist destination. The small island is located off the southern coast of Iran and is to resemble Dubai, which was at one time also an empty desert area with a coastline that now attracts many tourists. Kish already has an airport and harbour and also a few hotels and attractions, such as the recently opened water park that is very similar to such a park in Dubai (Source 9). But much of the island is still empty. You are going to help develop the island by drawing a map of the island.

Kish, the next Dubai!


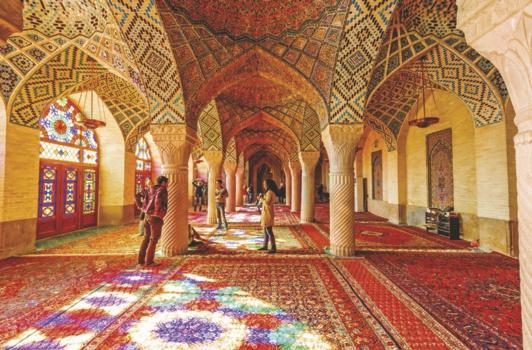
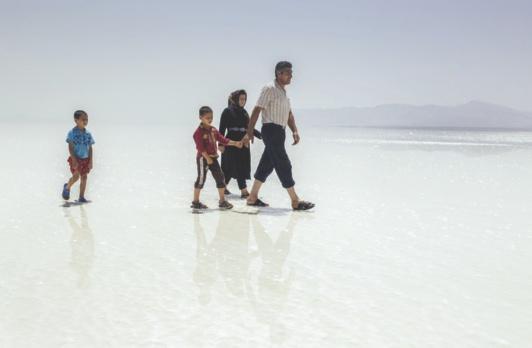
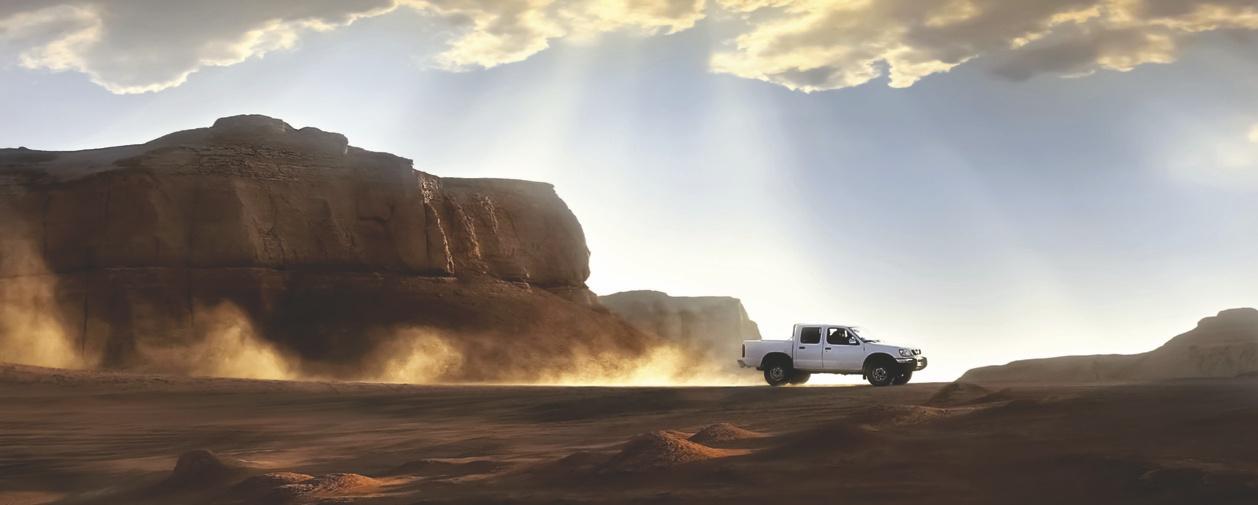
More and more tourists are discovering Iran. Together with a classmate you will plan a trip through Iran in this assignment. You will make a digital poster of your trip. For example, you can plan a trip to Persepolis (Source 10), with its impressively tall and striking buildings from the time when Iran was still called Persia. Or to Isfahan: the city with beautiful palaces, mosques and bridges. You could also consider the desert city of Yazd, the religious city of Mashhad or the huge capital city of Tehran. Or make your trip a little more adventurous by going dune driving in the desert, snowboarding in the mountains or visiting Qeshm Island (Source 11). You will also make a handy road map of your trip.

This game is all about speed, teamwork, having an eye for space and detail and a good memory. As a group you will try to copy a map by drawing it as accurately as possible. This will be made more difficult by the fact that you may only look at the map for a very short time! Which group will make the best map?
Sometimes you walk hundreds of metres between the different classrooms at your school. In addition, you go to the canteen during the break or to the gym or the sports field for PE classes. What distance do you cover in a school day? You can use the map of the school to work that out in this assignment.
Geography helps you discover the world. It teaches you things about countries you have already been to, countries you would like to visit or those that you never want to go to! But did you know that it is much easier for people with a Dutch passport to travel than for people with a passport from most other countries? For this assignment you will explore the internet to find out how many countries you can visit without a visa with a variety of passports.
The beaches are beautiful. The sea is clear and blue. You can go scuba diving or you can drive around the island on a scooter. What island is this? An island that you yourself are going to draw!
Isla Bonita is an island located in the South Pacific Ocean. It measures about 20 kilometres from east to west. It measures 15 kilometres at its widest point from north to south but there are narrower parts too. It is very rocky in the north of the island. In the east, a few kilometres from the coast is the Fugo volcano. Fugo is 2,000 metres high.
The crater is filled with water so you can see a large volcanic crater lake at the top. There are vast forests at the foot of the Fugo volcano. It is a nature reserve for tigers. There are wide palm beaches on the south coast. In the south there is only a holiday park: Palm Village. The holiday park lies between fields and meadows in the flat coastal region.
There are two roads leading from Palm Village: one runs along the beach and leads to the lighthouse on the most easterly point of the island. The other road goes through the fields to the Fugo volcano. It goes up the side of the volcano and ends at the crater lake. There are a few villages on the west side of the island.


absolute distance
Distance measured in a straight line. absolute location
The coordinates of a place (N/S and E/W). cartographer
A person who makes maps. circle of latitude
Imaginary circle that connects places with the same latitude. Also known as a parallel. eastern longitude
Distance from the prime meridian, measured to the east. Indicated by the letter E. elevation
The location of a region measured in metres above or below sea level. Also called altitude. elevation zone
Zone in a mountain range where certain types of vegetation grow. Also called altitude zone. emigration surplus
When there are more people moving away from an area than moving into it. equator
Imaginary line dividing the Earth into two halves: the northern hemisphere and the southern hemisphere. external migration
Moving from one country to another. general map Map that shows the geography of an area: cities, rivers, seas, mountains, roads and railways. generalization
Leaving out certain details when making a map. geography
The study of different parts of the Earth. high latitude
Part of the Earth’s surface that is far from the equator (over 60°). high mountain range
Mountain range with peaks that are higher than 1,500 m. hills
Area with an elevation between 200 and 500 metres. internal migration
Moving to another part of the same country. latitude
Distance in degrees from the equator. legend
Explanation of the colours and symbols used on a map. longitude
Distance in degrees from the prime meridian. lowland
Area with an elevation lower than 200 metres. low latitude
Part of the Earth’s surface that is near the equator (less than 30°).
Mountain range with peaks between 500 and 1,500 metres. map
A scale drawing of an area or region. map reading
Understanding what you see on a map. Map reading requires four tools: the title, the legend, the scale and the north arrow. meridian
Imaginary circle that connects places with the same longitude. migration
When people leave their homes to live somewhere else. northern hemisphere
The upper half of the Earth. northern latitude
Latitude in the northern hemisphere.
Indicated by the letter N. North Pole
The northernmost point on Earth. parallel
See circle of latitude. perpetual snow
Snow that never melts. population density
The average number of people per square kilometre (km2). population distribution
How the people are spread across a country or region. prime meridian
The line of longitude that runs through Greenwich (near London). relative distance
Distance measured in travel time. relief
Differences in elevation in a landscape. scale
Shows how much smaller an area is on a map. scale level
The level of detail you choose when you look at the world: local, regional, national, continental or global. social population growth
Change in the number of people living in an area as a result of migration. southern hemisphere
The lower half of the Earth. southern latitude
Latitude in the southern hemisphere.
Indicated by the letter S. South Pole
The southernmost point on Earth. street map
A map of a neighbourhood, town or city that shows the streets and buildings located there. thematic map
A map that focuses on one aspect of an area, such as climate.
Area on Earth that uses the same standard time. western longitude
Distance from the prime meridian, measured to the west.
Indicated by the letter W. zooming in
Taking a closer look at a certain area; moving from a wide view to a focused view. zooming out
Enlarging an area; moving from a focused view to a wider view.
Someone who comes to a new country to live there. immigration surplus
When there are more people moving into an area than leaving it. migrant
Someone who leaves their place of origin and moves to another place. net migration rate
The number of people who come to live in an area minus the number of people who leave it. political migrant
Someone who moves for political reasons. pull factor
When highly educated people leave their country of origin and move abroad.
Someone who moves for economic reasons. emigrant
Someone who moves to another country.
FIGURE Mount
mountain
Reason that makes another region attractive to migrants. push factor
Reason to move away from a particular region. refugee
Someone who leaves their country for political reasons. social migrant
Someone who moves for social reasons.


on earth is going on?