

THIS BOOK BELONGS TO: CLASS:
Authors
C.M. de Boer, Chr. de Jong
F. Jutte, J.H.A. Padmos, A.M. Peters
Editors
D. Ariaens, A.M. Peters


THIS BOOK BELONGS TO: CLASS:
Authors
C.M. de Boer, Chr. de Jong
F. Jutte, J.H.A. Padmos, A.M. Peters
Editors
D. Ariaens, A.M. Peters
Use the Geo workbook along with the online learning environment and your coursebook for class. This is your personal copy of the workbook. You will do your assignments in it and you can make notes.
You will always start working from your workbook. You will find all the assignments there. Your workbook contains assignments on the text, photos, maps and charts in the coursebook. You will often have to do tasks, such as colouring in a map or drawing a chart. For each of the assignments it will be made clear which text or figure in the coursebook you need to be able to complete the assignment or which Geo Guide number you will have to read. In the workbook you will see the symbol next to the A different approach section and the Choose your assignment section. This means that your task here will be different from ordinary assignments. You will usually have to make something or examine something.
You can answer the atlas questions using either the Grote Bosatlas or Alcarta. The first map title refers to edition 56 of the Grote Bosatlas. Reference to the map in Alcarta 2 is shown in parentheses. If a map in the Grote Bosatlas can only be found online, the symbol will be shown next to the map title. We will provide renumbering tables for students working with another edition of the atlas.


A next to an assignment means that you can or will have to go to the online learning environment to complete an assignment, or to watch a video or an animated clip. Everything in your books is also available online in the online learning environment.
You can do all your assignments in the online learning environment. Here you will also find special assignments that are not in the workbook, such as assignments with GIS. You can also check your work immediately.
the
Start
§1 Introduction to Iran
§2 Zooming in on Tehran
§3 Iran in the atlas
§4 Sources: The location of Tehran
§5 Land of migrants
A different approach
Kish, the next Dubai!
Choose your assignment
Finish
Start
§1 Deforestation in the Amazon
§2 The Australian outback
§3 Inuit in the Arctic
§4 The Lötschental
§5 Population and natural landscapes
A different approach
Climate and landscape
Choose your assignment
Finish
Start 46
§1 Gambia: a different world
§2 Rich and poor in Gambia
§3 Sources: Population characteristics of Gambia
§4 Opportunities for Gambia
§5 Images of Africa
A different approach
No two countries are the same!
Choose your assignment
Finish
Start
§1 Japan: country in the Ring of Fire
§2 The Great East Japan Disaster
§3 Mount Aso volcano
§4 Jebi rages over Japan
§5 Sources: Dealing with natural disasters
A different approach
The Great Kanto earthquake of 1923
Choose your assignment
Finish
Start 86
§1 The Indonesian archipelago 87
§2 Culture of south-east Asia 90
§3 Rapid economic changes 93
§4 Urbanization 96
§5 The Chinese in Indonesia 98
A different approach
Plastic soup 101
Choose your assignment 102
Finish 104
Start 106
§1 Influence of the Gulf Stream 107
§2 Relief as a climate factor 110
§3 Europe: climate and vegetation 113
§4 Climate change 116
§5 Sources: Island hopping in Europe 119
A different approach
Climate passport for the Netherlands 122
Choose your assignment 123
Finish 125
Start 128
§1 Spatial planning of a district 129
§2 The Kinkerbuurt 132
§3 City or countryside? 135
§4 Districts in The Hague 138
§5 Sources: Your own neighbourhood 140
A different approach
Give your neighbourhood a score 142
Choose your assignment 143
Finish 144
Start 146
§1 Brazil: landscape and population 147
§2 Brazil’s role in the world economy 150
§3 Inequality in Brazil 153
§4 Sources: the Amazon region 156
§5 Rich and poor in South America 159
A different approach
The Amazon region: develop it or conserve it? 163
Choose your assignment 164
Finish 167
Projects 170
Main question
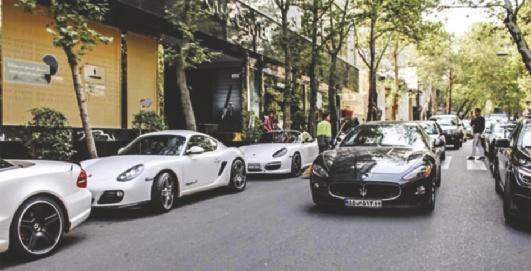
Look at Figure 1 in your coursebook.
a Describe as accurately as possible what you can see in the photo.
c Which things that you wrote down in question 2a can you see in the photo?
b How can you tell that this photo was not taken in the Netherlands? Write down three things.
1 2 3
c How can you tell that this photo was taken in an Islamic country?
Look at Figure 1 in your coursebook with a classmate.
a The photo was taken in Iran. What do you already know about this country or what have you heard about it? Write down as many things as you can.
d Discuss with each other what you would like to know about Iran. Write it down.
Look through the chapter in your coursebook with a classmate.
a Which photo do you both think best fits with Iran? Explain your answer.
b Compare your answers with those of a classmate. Expand on your answers to 2a.
b Which photo had you not expected to see in a chapter about Iran? Explain your answer.
Cross out the incorrect answers.
a Iran is 4 / 40 / 400 times bigger than the Netherlands.
b The population of Iran is 8.3 / 83 / 803 million.
c Most of the people in Iran are Buddhist / Christian / Muslim
d The highest mountain peak in Iran is almost 600 / 6,000 / 60,000 metres.
e Iran is located in Africa / Asia / Europe
f The distance between Iran and the Netherlands is 350 / 3,500 / 35,000 kilometres.
g Iran is closer to / further from the equator than the Netherlands.
h Ankara and Istanbul / Baghdad and Mosul / Tehran and Isfahan are two major cities in Iran.
b Place the numbers and the letters below in the correct places in W2. Use Figure 3.
cities
1 Tehran 5 Mashhad
2 Qom
Read A
look at Figure 2.
Read the following statement:
The photo in Figure 2 could also have been taken in the Netherlands.
a Give an argument that supports this statement.
b Give an argument against this statement.
Shiraz
Isfahan 7 Yazd
4 Tabriz
bodies of water
I Persian Gulf

II Gulf of Oman
III Caspian Sea neighbouring countries
Ahvaz
c Write down three differences between the Netherlands and Iran using information from your coursebook.
3
What differences between the Netherlands and Iran do you recognize in W1?
A Afghanistan G Pakistan
B Armenia H Qatar
C Azerbaijan
I Saudi Arabia
D Iraq J Turkey
E Kuwait K Turkmenistan
F Oman L United Arab Emirates
c Fill in and cross out the incorrect word.
The highest mountain in Iran is ( m, Figure 24).
That mountain is in the north / middle / south / east of the country, close to the capital
Map of Iran.W2
Street scene in Iran.W1
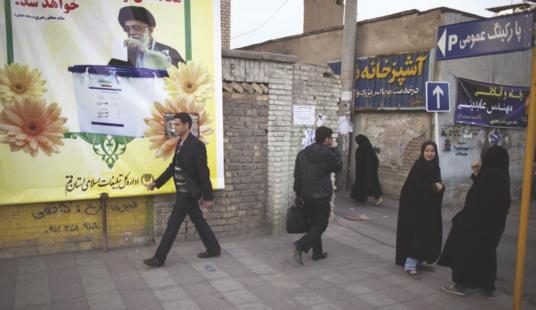
Read Iran on maps
you know
Read Iran on maps in your coursebook.
a Colour in Iran in W3.
b What does W3 tell you about the surface area of Iran compared with the surface area of Europe?
Read Iran on maps in your coursebook and look at Figure 4.
a What kind of map is shown in Figure 4?

b How can you see that?
c Describe the population distribution in Iran.
km


: 55,000,000
Read Iran on maps in your coursebook.
a What is population density?
b How would you calculate the population density? Complete. = population density surface area
c In Iran 83,000,000 people live on a surface area of 1,650,000 km2
What is the population density of Iran? Write down your calculations!
d In the Netherlands 17,000,000 people live on a surface area of 41,500 km2
What is the population density of the Netherlands? Include your calculations!
Read Iran on maps in your coursebook and look at Figures 4 and 5.
a Colour in W4 according to the legend.
b What do you notice when you compare W4 with Figure 4?
e Describe the difference in population density

Iran and the Netherlands.
c If you look at your answer to 6b, the locations of the cities of Yazd, Shiraz and Isfahan stand out. Explain why the location of these cities is worth pointing out.
d Think of ways in which these cities have been able to exist there anyway.
average annual precipitation.
Read Map skills in your coursebook and look at Figures 3 and 4.
a What is the title of the maps?
3
4
b What is the population of the following cities?
Tehran Shiraz Yazd
c What is the elevation of Isfahan?
d What is the population density of: the area around Tehran? people per km2 - the area around Yazd people per km2
Look at Figure 3 in your coursebook.8
a What is the scale of the map in Figure 3?
That means: 1 cm on the map is cm in real terms; which is m or km.
b Use a ruler. How many centimetres is the distance in a straight line from Mashhad to Tabriz?
About cm.
That is km in real terms.
c Use a ruler. How many centimetres is the distance in a straight line from Shiraz to Qom?
About cm.
That is km in real terms.
d Go to the correct figure in the chapter for the following questions:
- Figure 4: 1 cm on the map is km in real terms; 2 cm is therefore km in real terms
- Figure 7: 1 cm on the map is km in real terms; 5 cm is therefore km in real terms
- Figure 9: 1 cm on the map is km in real terms; 8 cm is therefore km in real terms
- Source 8: 1 cm on the map is km in real terms; 3.5 cm is therefore km in real terms
Read Geography in your coursebook and look at Figure 6. 9
a Why does the word ‘geography’ not fully explain what you cover in this subject at school?
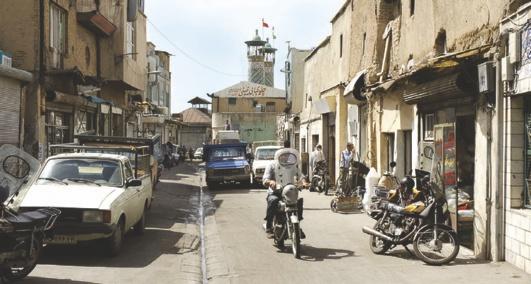
b Look at Figure 6 in your coursebook. Describe what you see at the Iranian market. Write down two things.
c Team up with a classmate and think of two differences between a Dutch and an Iranian market. Give an explanation for both differences.
, because
, because
Revision10
a What kind of map is W4?
b 1 cm on the W4 map is km in real terms.
CB
• the similarities and differences between the Netherlands and Iran
• the difference between general maps and thematic maps
• what the population distribution in Iran looks like and why
• the four things you need to read a map
WB
• the completed W2
• the answers to assignments 6, 7 and 8
Terms
Coursebook general map, geography, legend, map, map reading, population density, population distribution, scale, thematic map
Online summary
Why do you zoom in and out in geography?
Read the introduction and Hustle and bustle in the south in your coursebook. Look at Figure 6.
a Cross out the incorrect words.
There are more people in Tehran every day than live in Amsterdam / all Dutch cities / all of the Netherlands
b Why does Tehran attract so many people?
c What would you do first if you were in the Grand Bazaar?
Look at W6 and W7. In which district are they?
Cross out the incorrect words.
- W6 is in the same neighbourhood as the Grand Bazaar / Café Sam because
- W7 is in the same neighbourhood as the Grand Bazaar / Café Sam because
Street map of part of southern Tehran.
Read Hustle and bustle in the south and Peace and quiet in the north in your coursebook. Look at Figure 7.
a Which two other amenities can be found in the shopping centre where Café Sam is located?
b How can you see that most of the buildings have a garden?
c Name characteristics of the modern district in Figure 7. Cross out the incorrect words.
low-rise buildings / high-rise buildings / both
close together / lots of space
cheap amenities / expensive amenities
busy / quiet
very little greenery / lots of greenery
older / younger
d W5 is a street map of part of southern Tehran. Colour in the historic buildings in W5. Also colour in the legend.
e There is a symbol in the legend. Give an appropriate description on the dotted line.
Look at the characteristics of Figure 7 under question 2c.
Figure 7 with W5. Which three differences between both districts are not visible in Figure 7 and W5?
shopping street house
street
building
3
Read Peace and quiet in the north in your coursebook. Look at and read Figures 8, 9 and 11.
a What differences between the south and the north of Tehran are described in Figure 11? south:
north:
b If you are enjoying the view of the city skyline from the roof of Tehran (Figure 9), will you see taller buildings in the foreground or in the background? Explain your answer.
h What other reasons for the heavy traffic do you find in the text?
Read the section texts in your coursebook and look at Figure 7.
a Cross out the incorrect word. The population density is higher in the north / south of Tehran.
b What evidence for your answer to 5a can you find in the following texts?
- Hustle and bustle in the south:
- Peace and quiet in the north:
c Cross out the incorrect word.
The viewing direction in Figure 8 is towards the north / south
d Why do people with higher incomes choose to live in the north?
1 housing:
2 greenery and space:
3 amenities:
4
Read Peace and quiet in the north and Figure 11 in your coursebook. Look at Figures 7 and 9 and W5.
a How many m is 1 cm in W5 in real terms? m
b How far is it to walk from Panzdah-e Khordad Street to Mowlavi Street?
m
c How many kilometres is it from the Grand Bazaar to Café Sam? km
d If you travel the same number of kilometres from your home as your answer to 4c would you still be in your hometown?
Yes / No
e Follow Thomas’ route with your finger in Figure 9. What do you notice?
f What is the approximate distance in kilometres that you travel through Tehran with Thomas?
g The traffic in the main cities of the Netherlands is also heavy, but not as heavy as in Tehran. Tehranians are also used to travelling criss-cross through the city. How are the long distances and the heavy traffic related in Tehran?
c What evidence for your answer to 5a can you find in Figure 7 and W5?
d Describe the population distribution in Tehran.
e The population density of a district with a lot of space between the buildings can still be higher than that of a district with little space. Explain this.
Read Scale levels in your coursebook and look at Figure 12. 6
a Fill in the scale level at which you are working. A Tehranian who walks from their house to a restaurant: scale level.
Thomas Erdbrink who moves from the Netherlands to Iran: scale level.
Iran has three neighbouring countries with names that end in -stan: scale level.
A Tehranian who travels from Tehran to the mountains just north of the city: scale level.
Tehranians who visit relatives in Shiraz: scale level.
My scale levels.W8


Scale level Example
local regional national continental global
b What is the scale level of: - Figure 3 Source 4 - Figure 7 W10
c If you look at Figure 4, then Figure 9 and finally at Figure 7, then you are zooming in / out
If you look at W7, then W5 and finally at W4, then you are zooming in / out
d Complete W8 with your own examples for each scale level. Think what you would do or would like to do at that scale level and write it down.
Read Scale levels in your coursebook and look at Figure 9 and W5.
a The district shown in W5 can also be seen in Figure 9. Write down two examples of how the cartographer has generalized data in Figure 9 compared with W5.
1
b Why do you think those things were left out in Figure 9?
Read Scale levels in your coursebook and look at Figure 12. 8
Iranians often go on holiday to neighbouring countries, such as Azerbaijan, Turkey or the United Arab Emirates. This is because it is difficult to enter most other countries with an Iranian passport.
a Colour in W9 according to the legend.
b On which continent is Iran located?
c Statement: Travelling from Iran to Azerbaijan, Turkey and the United Arab Emirates are examples of travelling on a continental scale level.
- Explain why this statement is true. - Explain why this statement is not true.
The location of Iran.W9
THE NETHERLANDS
IRAN Europe Africa Asia
km
: 115,000,000
Revision
a The photo in Figure 8 shows characteristics of both the old south and the new north. Explain this.
b What are the scale levels of W5 and W9? W5 W9
CB
• the differences between districts in the south and in the north of Tehran
the difference between zooming in and zooming out
the five scale levels (Figure 12)
WB
• the answers to assignments 4, 5 and 6
Terms
cartographer, generalization, population density, population distribution, scale, scale level, street map, zooming in, zooming out
summary
How to use the atlas?
1
Read The location of Tehran in the world in your coursebook. Look at Figure 17.
Fill in numbers 1-10 in the correct places in W10.
1 equator 6 northern latitude
2 North Pole 7 southern latitude
3 South Pole 8 prime meridian
4 northern hemisphere 9 circle of latitude (parallel)
5 southern hemisphere 10 circle of longitude (meridian)
The Earth divided into longitude and latitude.W10
d Cross out the incorrect words. Rio de Janeiro is located at high / low latitude and Reykjavik at high / low latitude.

e Which city is located at a higher latitude: Sydney or Rio de Janeiro? Explain your answer.
3
Read up to and including the table of contents under How to use the atlas and look at Figure 13. Use the atlas.
a On which pages can you find the table of contents of the atlas?
b Under which continent in the table of contents should you look for maps of Iran?
c Look up the Azië – Landschappen (Azië - Plantengroei en klimaat, Oorspronkelijke plantengroei) map in the table of contents of the atlas. In what kind of landscape was the photo in Figure 13 taken?
d In which part of Iran is this type of landscape most common?
e Alcarta: Some map titles in the table of contents include The Earth while others include The World Why have these maps been given different titles? Tip: Look carefully at the topics covered by these maps.
4
Read up to and including the page finder under How to use the atlas in your coursebook. Use the atlas.
a Where can you find the page finder in your atlas?
2
Read The location of Tehran in the world in your coursebook and look at Figures 16 and 17.
a What are the coordinates of Tehran?
b Cross out the incorrect words. Tehran is located in the northern / southern hemisphere at western / eastern longitude.




Rio de Janeiro is located in the northern / southern hemisphere at western / eastern longitude. Your hometown is located in the northern / southern hemisphere at western / eastern longitude.
c Which cities in Figure 16 have the following coordinates?


- 14°N and 100°E.
- 6°S and 106°E


- 35°S and 58°W
b Which map sheet (a page in the atlas) in the page finder can you best use to find a map of Iran?
c Use the map from question 4b. Complete and cross out the incorrect words.
Iran is located between and N / S en between and W / E
d Use the page finder to look up the map numbers of the following maps: Morocco Australia and New Zealand Iceland Midden-Nederland (Mid-Netherlands)
W11
Five places in the atlas.
Place Map sheet Map section Country
Tabriz
Caravaca de la Cruz
Longreach
Rzhev
Quetzaltenango
5
Read up to and including the index under How to use the atlas in your coursebook. Use the atlas.
a Fill in W11. Use the Index in the atlas.
b Use the Index of geographical terms. Look for a map showing the languages of the world. What language is spoken in Iran?
c In which two other countries is this language also spoken? You could use the page finder to look for a map on which you can find the names of the countries.
6
Read The location of Tehran in the world and up to and including the legend under How to use the atlas in your coursebook. Look at Figures 14 and 18 and use the atlas.
Use the Midden-Oosten en Zuid-Azië (Midden-Oosten) map in the atlas.
a Which city is located at 29°N and 52°E?
b What is the absolute location of the Iranian city of Mashhad in Figure 18?
c Which major city is located to the east of Lake Urmia in Figure 14?
d Use the General legend (Legend). What additional information does the General legend give about this lake?
e How can you see your answer to question 6d in Figure 14?
f Use the General legend
Alcarta: use maps 144A and 154A). Which capital city has a larger population: that of Iraq or Afghanistan? Explain your answer.
g Use the General legend (Legend). What does the black line between Tehran and Mashhad mean?
7
Look at Figures 1, 13 and 15 in your coursebook. Use the atlas.
a What are the coordinates of the city close to where the photo of the desert was taken in Figure 13?
b What are the coordinates of the city where the photo in Figure 15 was taken?
c Name two similarities between the photo in Figure 1 and the photo in Figure 15?
1
2
Use the atlas.8
This assignment is a competition. Split up into groups of two or three. Use the coordinates in W13 to place dots on the map in W12. Then fill in the names of the countries and the capital cities in W13. Use the Aarde - Staatkundig (Wereld - Staatkundig) map in the atlas. All the groups will start at the same time. The winner is the group that finishes first and has completed everything correctly.





















a



a Write down the correct number of hours on the bottom line in W14.

b Shade the area where it is night in W14.
c Where is it later in W14: at location A or B? Explain your answer.


At location , because
d Look up a map in the atlas on which you can see the whole world. The circles of latitude at 23½°N and S and at 66½°N and S have their own name. Fill them in at the correct places in W14.
You will play a game of tennis using terms. Do this in pairs.
Student 1 will have a copy of the list of terms in the Finish section of the coursebook and will choose a term from §3. Student 2 will give as good a description of the term’s meaning as possible. Student 2 is not allowed to look in the coursebook. Student 1 will check whether the description is correct. Student 2 will then choose a term and student 1 will give a description. Do this for all the terms in this section.
b What parts of the atlas do you need to look for:
- the meaning of a red line on a map
- maps about Islam
- a place you have never heard of
- a map of Africa
- the map Brazilië - Rio de Janeiro: arm en rijk (BraziliëSteden, Rio de Janeiro, Segregatie)
c The coordinates of a place are 35°N and 140°E.
This place is located in the northern / southern hemisphere. At the circle of latitude 35° / 140°
It is east / west of the prime meridian.
At the circle of longitude 35° / 140°
It is Buenos Aires / Jakarta / Tokyo / Washington
a What is a quick way to find the world Time zones map in an atlas?
b If it is 12 noon in the Netherlands, what time is it in: London a.m./p.m.
Tehran a.m./p.m.
Calgary a.m./p.m. Sydney a.m./p.m.
c Between which two neighbouring countries is the time difference on land the biggest?
d What is the time difference?

e The time zones should actually run exactly along 24 meridians. However, in reality the lines do not run in a straight line.
is this the case?
the world into
of
to use the table of contents, the page

completed W10 and W13
4, 5 and
absolute location, circle of latitude, eastern
equator, high latitude, latitude, longitude,


meridian, northern hemisphere, northern
North Pole, parallel, prime meridian, southern
South Pole,
profile of the route from Tehran to Chalus.
What kinds of distances are there
Use Source 1 in your coursebook
the Geo Guide.
a What is the name of the chapter in the Geo Guide that includes G51 Elevation zones?
b What mountain range do you see in Figure 2.12 of the Geo Guide?
c Write down the definition of relief as mentioned in G110 Relief of the Geo Guide.
d How many different relief types are there?
e What type of relief is the mountain range in Figure 2.12 of the Geo Guide? Explain your answer.
Use Source 4 in your coursebook.
a At what elevation does the route from Tehran to Chalus start?
b Draw this route in W15. The vertical axis shows the elevation of the route in m; the horizontal axis shows the distance in km. Chalus is already in the right location in W15. Chalus is 0 m above sea level.
Write the name Tehran at the correct place in W15.
c Draw the elevation profile of the route using the map in Source 4. This is how you do that:
- The elevation of the route from the starting point up to 20 km has already been drawn on the chart.
- Look up what the elevation of the route is after 30 km using the map in Source 4. Put a dot at this point.
- Do the same at 40 km, 50 km and so on until you reach Chalus.
- Connect all the dots by drawing a line and this will give you the elevation profile of the route.
d What is the highest point of the route?
e After how many kilometres is this highest point of the route reached?
3
deciduous forest zone coniferous forest zone
meadow rocky zone
Read Source 4 in your coursebook and use G110 Relief in the Geo Guide.
Find the correct map of Iran in the atlas.
a What type of relief does the Alborz mountain range have?
b The highest mountain range in the world is also shown on this map (
Alcarta: 154A). Which mountain range is this?
c On the border between Iran and which other country can you see lowland?
Use Sources 2, 4, 5 and 6 in your coursebook. Read the triangle in G51 Elevation zones in the Geo Guide.
a Check Figure 2.12 in the Geo Guide to see at what heights the various elevation zones occur. Colour in the elevation zones in W15. Choose the colours yourself. Also colour in the legend.
b Through what type of vegetation does the route mainly pass?
c Which Source in this section fits this part of the route?
d At what elevation do trees no longer grow in Figure 2.12 in the Geo Guide?
e Above what elevation, according to Figure 2.12 in the Geo Guide, is the tourist in Source 6 cycling? Explain your answer.
Use Source 3 in your coursebook.
Read G51 Elevation zones and G52 Elevation and temperature in the Geo Guide.
a Fill in. If you climb 1,000 m up a mountain, it gets °C colder.
b How much colder will it get if you climb 3,500 m? °C
c Using G51 and G52, explain why there is perpetual snow on the peaks of the Alborz mountain range.
d Why are the temperature differences in the area around Tehran so much larger than in the area around a Dutch city?
a Make correct sentences using the following words:
- relative distance – cyclist – relief - perpetual snow – elevation zone – high mountain range
Use Sources 6 and 7 in your coursebook.
a Use Source 7. Which line represents the absolute distance?
b Indicate for each of the following whether the relative distance increases or decreases:
- Road 59 is always busy at the start of the holiday period.
- The road conditions on the highest part of the route are poor due to snowfall.
- The government wants to build tunnels on the route.
- The cyclist in Source 6 decides not to take a break and to keep going.
c What could cause the relative distance on a route that you sometimes take to increase?
b Complete W16 using G110 Relief and the Midden-Oosten en Zuidoost-Azië (Midden-Oosten - Overzicht) map in the atlas. Enter the correct name in the third column.
Kies uit: Zagros Mountains Ahvaz Zabol Yazd.
Types of relief.W16
Type of relief Elevation in m Example
lowland
200 - 500
high mountain range
CB
• how to use the Geo Guide
• how elevation and landscape relate to each other
• how elevation and temperature relate to each other
• the difference between the absolute distance and the relative distance
• how the relative distance relates to the size of Iran and the Iranian landscape
WB
• the answers to assignments 5, 6 and 8
GG
• G51 Elevation zones, the triangle
Use Source 8 in your coursebook.
a Work out the absolute distance between Tehran and Dubai in Source 8. Write it down.
b Why is the difference between the absolute distance and the distance by road to Dubai so big?
c Using Source 8, think of another reason why the route from Tehran to Dubai can take very long.
• G52 Elevation and temperature
• G110 Relief, except the last two bullet points
Terms
Coursebook absolute distance, elevation, perpetual snow, relative distance
Geo Guide elevation zone, hills, high mountain range, lowland, low mountain range, relief
Online summary
Subquestion
Why do many people migrate to and from Iran?
Read and look at Figure 23 in your coursebook. Read G158 Immigration and emigration in the Geo Guide (except the last bullet point).
a What is the difference between an immigrant and an emigrant?
f If so, where would you emigrate to and why?
b Is Parnina an emigrant, immigrant or both? Explain your answer.
Read Going abroad in your coursebook and look at Figure 19.
a Why are so many young Iranians migrating from Iran?
b Iran also has very good universities like the one shown in Figure 19. So why do they still migrate? Write down two reasons mentioned in the text.
1 2
c Parnina had a(n) social / economic / political reason for moving because
d Parnina’s Iranian husband has recently moved to Germany to live with her. He missed her too much. He migrated for economic /social / political reasons because
e Which two Iranians are the only ones who fall under the term internal migration? Explain your answer.
c Why can you say that social migration is often an aftereffect of economic or political migration? Write down your answer as: cause: effect:
Read Going abroad in your coursebook and look at Figure 21.
Imagine that all the students in your class emigrate from the Netherlands to Canada. They are offered a better education there and the guarantee of a well paid job after completing their studies.
a Does the term brain drain fit this situation? Explain your answer.
2
Read and look at Figure 23 in your coursebook. Read G158 Immigration and emigration in the Geo Guide (except the last bullet point).
It is very common in Iran that many relatives or friends emigrate.
a To which continent did most of Somayeh and Newsha’s friends move?
b Do you have family or friends who live abroad? Yes / No
c If so, to which continent did they move?
d What were their reasons for emigrating?
e Would you ever want to emigrate? Yes / No
b The Minister of Economic Affairs says the following about the students’ emigration: “The Netherlands will have a problem in the future if all 1 vwo students were to emigrate.”
Explain the minister’s statement.
c What could the Dutch government do to make sure that you go to university in the Netherlands and not in Canada?
d Why is Figure 21 an example of a brain drain for Iran? Explain your answer.
5
Read Going abroad and To Iran in your coursebook.
a What is the difference between a migrant and a refugee?
b From which country do most immigrants come according to Figure 20?
c A different scale level fits the immigration to Iran than the emigration from Iran. What are the scale levels? immigration
b Do Afghan migrants, Afghan refugees or both live in Iran? Explain your answer.
emigration
d What could be an economic reason for the difference in scale level in question 7c?
c Iranians leave Iran because there is no work while Afghans come to Iran for work. Explain why this makes more sense than you would think.
6
Read To Iran and Figure 23 in your coursebook. Use G159 Push factors and pull factors in the Geo Guide.
a Explain that Newsha emigrated to Australia because of a combination of a push and pull factor.
e Look at Figures 21 and 22. You can see migrants in the photos. Which photo do you think best fits the theme of migration? Explain your answer.
8
Look at Figure 20 in your coursebook. Use G151 Social population growth in the Geo Guide.
a Calculate the net migration rates for Iran, Afghanistan and Iraq for the period 1990-2017 in W18.
b Did Iran have a positive or negative net migration rate in the period 1990-2017?
b Which two pull factors are not mentioned in Figure 23 but are shown in G159 Push factors and pull factors?
c Continue to fill in W17.
d Did you include a push factor, pull factor or both in your answer to 2f? Explain your answer.
7
Look at Figures 20, 21 and 22 in your coursebook.
a Where do most Iranian emigrants go according to Figure 20?
c Which neighbouring country is mainly responsible for your answer to question 8b?
d Compare the net migration rates of Iran, Afghanistan and Iraq. What do you notice?
e What will be the main political reason for your answer to question 8d?
Name Reason Push/Pull Type of migrant
Haleh
Received a good salary in Singapore. pull economic
Nilufar’s parents Nilufar’s father no longer felt safe in Iran.
Nilufar and her sister They wanted to live with their parents Germany.
Sepideh Studies at one of the best universities in the world.
Mohammad Couldn’t find a good job in Iran.
W19
f Your coursebook states that an estimated 4 million Iranians live in other countries while according to Figure 20 this number is just above 1 million. Think of a reason why the numbers from the text and Figure 20 could both be correct.
Global migration data (1960-2017).
Year Number of migrants × 1 million
77 1970 84
102
152
173
220
g You only migrate if you think it will make you safer, happier and/or wealthier. What do the high numbers of immigrants and emigrants tell us about how people view life in Iran?
W18
Net migration rates (1990-2017).
Migration Iran Afghanistan Iraq immigrants 2,484,000 99,000 343,000 emigrants 1,167,000 4,826,000 1,508.000 net migration rate
Use G37 Charts and G151 Social population growth in the Geo Guide. 9

a Use W19 to fill in W20.
b What kind of charts are these?
W20
W21
c What development do you see in W20?

d A total of 233,000 migrants came to the Netherlands in 2017. Do you think this is a lot compared to the number of migrants worldwide? Explain your answer.
e Calculate the net migration rate in the Netherlands in 2017 in W22.
f Calculate the population of the Netherlands on December 31st 2017 in W22. Note: Don’t forget the number of births and deaths!
g A total of 1,869 Iranian migrants came to the Netherlands in 2017. 866 Iranian migrants emigrated from the Netherlands. What is the net migration rate of Iranians in the Netherlands in 2017?
h Look at W21. What was the reason for most migrants to come to the Netherlands?
i What kind of migrants are the migrants in question 9h?
W20
258
Migrants worldwide (1960-2017).
W21
Immigration to the Netherlands (2015).
of migrants (in millions) year 2017 in % safety work family education
1970 1980 1990 2000 2010
Net migration rate for the Netherlands (2017).W22
population on 1-1-2017 17,098,000 births 169,000 deaths 149,000 natural population growth immigration 233,000 emigration 151,000 net migration rate population on 31-12-2017
a Read W23. Pair up with a classmate and together link as many terms as possible from this section to the situation in W23. Explain why they are connected.
• why many people migrate to and from Iran
• what role push factors and pull factors play in migration
• the advantages and disadvantages of much emigration from Iran for this country WB
b Think of an example using as many terms from the section as possible that you have not yet used in question 10a. Do this with a classmate.
• how to calculate, compare and explain net migration rates: assignment 8
• how to create, read and compare charts: assignment 9
• G151 Social population growth
• G158 Immigration and emigration
• G159 Push factors and pull factors
• Skill: - G37 Charts
c Which term(s) from this section were you unable to use in your two examples?
Talented football player.W23
Alireza Jahanbakhsh is an Iranian professional footballer who played for Iran at the 2018 World Cup. At the time he played for AZ Alkmaar in the Netherlands. He then left for a club in England because the level of the competitions there is much higher. And no doubt also because they pay higher salaries than in the Netherlands.
Terms Coursebook brain drain, economic migrant, emigrant, immigrant, immigration surplus, migrant, net migration rate, political migrant, pull factor, push factor, refugee, social migrant Geo Guide emigration surplus, external migration, internal migration, migration, net migration rate, pull factor, push factor, social population growth
Chapter 1 summary and self test
Kish, the next Dubai!
Read Kish, the next Dubai! in your coursebook
at Source 8.
a Look up Kish in the index in the atlas or in Figure 3 in your coursebook. Then look for the map in the atlas that includes Kish. Write down the map number
Alcarta: map number is 144A).
b Use the map from question 1a. What is the absolute location of Kish?
c What is the absolute distance from Kish to Tehran in km?
d If you travel by plane from Tehran to Kish and the plane flies at a speed of 800 km per hour, then the flight will take about 30 minutes / one hour / 90 minutes / three hours
e What type of distance did you calculate for question 1d? Explain your answer.
the internet.
Enter Kish Iran in the search box in Google Maps and click Search. Select Satellite in the bottom left corner. You will then be looking at the Earth from a satellite. Zoom in on the island of Kish.
a What is the main colour of the landscape on the island?
b As a result, what type of landscape would you primarily expect on the island?
c The island has a different colour on the map in the atlas that you used for assignment 1. What colour does the island have there?
d Explain why the colour of the island is different in the atlas than in Google Maps.
b How can you tell that there are buildings on part of the island?
c How can you tell that much of the island is still empty?
d To calculate distances using Google Maps, right click your mouse on a location and select Measure distance. Then right click your mouse on another location and select Distance to here. A white line will then appear between the two points. Measure how big the island of Kish is: - from north to south: km - from east to west: km
e Did you calculate absolute or relative distances in question 3d?
Look around the island using satellite view in Google Maps.
a Where is the airport located?
You will make your own map of the island of Kish. Ask your teacher for a blank A4 sheet of paper. Write your names in the top right corner. Tip: Make a draft version first. Once you are happy with the result, draw your final version of the map. Develop the empty parts of the island in such a way that you and many other tourists would like to go there on holiday. a What four things do you always see on a good map?
1 3 2 4
Put them on your map too.
b Draw a map of the island. First draw the outline of the island using Google Maps. Choose an easy scale, such as 1 cm = 1,000 m = 1 km. Then the island will fit on an A4 sheet of paper (horizontally). You already know from assignment 3d how big the island is.
c Draw the buildings that are already there, such as the airport, the villages and the harbour. Again don’t forget the scale. And don’t forget the legend and make sure that everything you draw is also included in the legend.
d Develop the empty areas on the island yourself. Make sure that everything more or less fits to the scale of your map. You must include at least:
- three hotels with a garden and a swimming pool close to the sea - a golf course - a music hall where artists can perform - a marina
You can choose what to put in the remaining areas. Include, for example, attractions you would enjoy when you go on holiday. Briefly explain on the back of your map what you have chosen for the areas and why.
e Make the map as neat and attractive as possible. Then hand it in to your teacher.
Read Assignment A in your coursebook and look at Sources 10 and 11. You will make an A3 digital poster of a tour of Iran. Choose at least five places on the internet that you would like to visit in Iran. For each place include one photo on your poster and give a brief description of the sights there. This is how you do that.
1 You can make a digital poster using a computer program, such as PowerPoint. Open the program. Click Design at the top. Slide Size will be displayed on the right. Click Custom Slide Size. Under Slides Sized For select A3 Paper
2 To find information you can enter travel in Iran in Google. This will give you travel sites that you can use.
3 Ask your teacher how much time you have to complete the poster. Also agree with your teacher how you will hand in the poster.
4 The poster must include the following items: - the title of the poster and your names - at least five tourist attractions with photo(s) and a short description of why the place is interesting - a map with the travel route including the four things that should always be found on a good map
Read Assignment B in your coursebook. In this game you will try to redraw a map as best you can. Your teacher will split the class into groups of four. Group members give themselves a number (1 to 4). Each group will need: One A2 or A3 sheet of paper, grey pencils and coloured pencils.
1 The teacher holds up the map at the front of the class. The numbers 1 of all the groups are allowed to look at the map for exactly one minute.
2 The numbers 1 then return to their group. They tell the rest of the group what they saw. They are not allowed to draw.
3 After a few minutes, steps 1 and 2 are repeated with students 2, 3 and 4 of each group.
4 Then each group member can take turns in taking one more look at the map. But don’t forget your group strategy: who will focus on what? In the second round, each group member will again only get one minute to look at the map. But this time you will also be allowed to draw!
5 At the end of the last round you must check whether the map you have drawn has a title, a legend, a north arrow and a scale that makes sense. You should also colour in the map as attractively as possible.
6 Finally, the teacher will ask all the numbers 1 to come forward with their maps. You will then look at all the maps with the rest of the class. Which is the best? Why? What was their strategy? How could you do better next time?
Distances at schoolC
Do this assignment in groups.
1 Read Assignment C in your coursebook.
2 Ask your teacher for a map of the school.
3 What is the scale of this map?
1 :
4 This means that 1 cm on the map is
metres in real terms.
5 Select a day on which you have many classes and have to change classrooms often.
6 Calculate the distances. Complete them in W24.
Distances at school.W24
Location Distance
bicycle shed to first class
m m m m m m m m m
Total m
Read Assignment D in your coursebook and look at Source 12.
1 Go to https://www.passportindex.org/. Look for the passport of Iran using the Find button. Click on the letter I. Click on Iran next to the passport. Click on Rank at the top of the page and then on Individual. A list appears that ranks all the passports of the world based on access to other countries.
2 Where does Iran rank on the list?
3 How many countries can you visit without a visa if you have an Iranian passport (orange bar)?
passport of which country allows you to enter the
without a visa?
many countries can you visit?
you think it’s fair that a passport from some countries
you to visit many more countries without a visa than
from other countries?
How many countries can you visit without a visa
you have a passport from the number one on the list?
Which country is ranked the highest?
Where does the Netherlands rank on the list?
How many countries can you visit without a visa with a Dutch passport?
the information from the
bar chart
W25.
click on Compare and then on
Select passport and select Iran in the first column. Select Netherlands under Select passport in the second column
it will appear in the column next to Iran. Write down three countries that you can enter without a visa if you have a Dutch Passport but cannot enter with an Iranian passport.
Read Assignment E in your coursebook and look at Source 13.
now know what the island looks like.
What four things must always be included on a good map?
sure these things can also be found on your map.
Draw a map of the island. Choose an easy scale, such as
cm = 1,000 m = 1 km. Then the island will fit on an A4 sheet of paper (horizontally).
not
many countries
you have a Dutch
visit
In this chapter we focused on the question: How can we use maps to learn about Iran? You will once more practice doing this in this Finish
1 Look at Figure 24 in your coursebook.
a What type of relief do you see in the photo?
b How can you see that?
c In which elevation zone did the photographer take the photo?
b Draw your school at the right location in W26 and write school next to it.
c Draw three other things in W26, such as a friend’s house, your favourite shop or your sports club. Write down what it is.
d Look at a street map or Google Maps. Does your map resemble the real map? Explain your answer.
2 Use the atlas.
a What kind of map is Azië - Landschappen (AziëOorspronkelijke plantengroei)?
b How can you see that?
c In what kind of landscape is the Indian city of Mumbai located?
d What is the absolute location of Mumbai?
e Use Aarde - Bevolkingsdichtheid (Wereld - Bevolkingsspreiding) map in the atlas. Is the population of the world spread evenly or unevenly across the globe? Explain your answer.
W26
Your own surroundings.
my house
f Is the population density of Iran high or low compared to that of India? Explain your answer.
4 Read the following lists of terms covered in the chapter with a classmate.
Cross out the term that you think does not belong in the list. Explain your choice.
a local scale level – zooming in – street map – absolute distance b thematic map – geographical names – legend – scale
c southern latitude – parallel – equator – meridian
The world in your memory
3 That’s your house in the middle of W26.
a Cross out the incorrect word. Where is your school located relative to your house: north / northeast / east / southeast / south / southwest / west / northwest?
d elevation – perpetual snow – latitude – relief

What on earth is going on?