THE CENTRAL BUSINESS DISTRICT


Fieldwork in Panaji, India - Fall 2019
Urban Ecological Planning


AAR4525 - Urban Informality Project Department of Architecture and Planning Faculty of Archtecture and Design
Students
The Market Anders Schive Hoel
Jayati Grover
Occitane Mestre
East CBD Karla Cristina Flores
Isabella Moran
Nick A. Kiahtipes
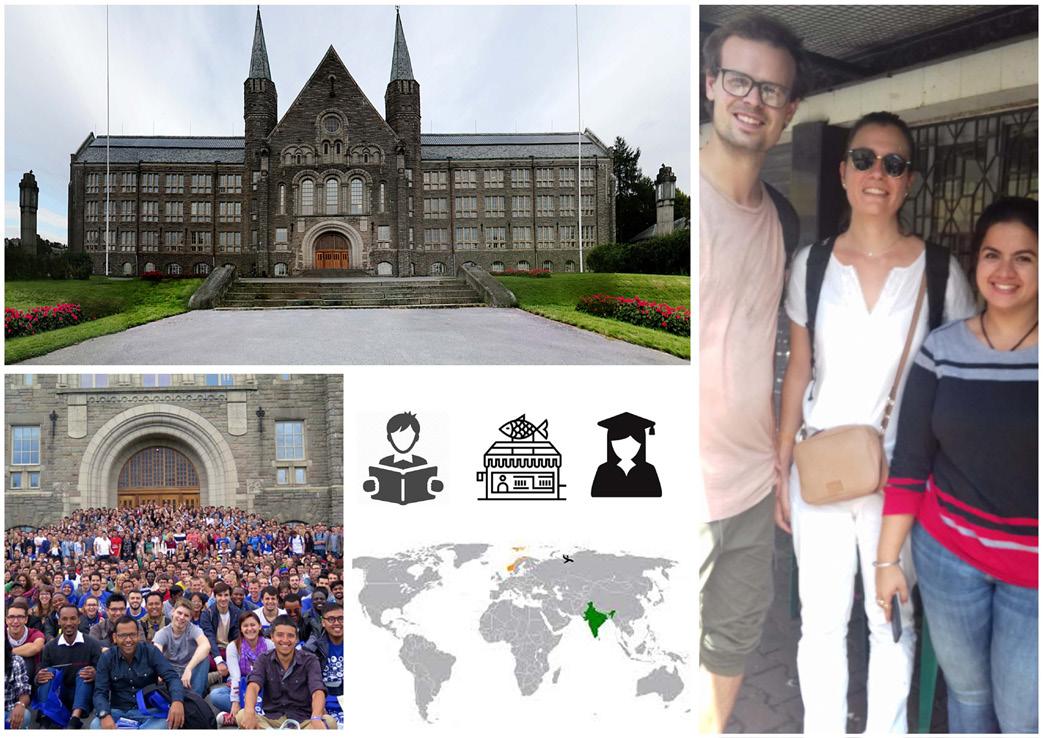
As a yearly tradition, the master students of Urban Ecological Planning (UEP) at the Faculty of Architecture and Design at the Norwegian University of Science and Technology (NTNU) embark on an immersive fieldwork during their first semester. This report is the outcome of a one-semester fieldwork in Panaji, India, conducted by the students in collaboration with the School of Planning and Architecture (SPA) Delhi. The fieldwork was part of a research project “Smart Sustainable City Regions in India” (SSCRI) financed by the Norwegian Centre for International Cooperation in Education (SIU), which included fieldwork in Bhopal in 2018 and Pune in 2017.
The diverse backgrounds and nationalities of students participating in the UEP fieldwork ensures a multiperspective view. This year’s 19 fieldwork participants are architects, food scientists, engineers, landscape architects and planners, coming from Albania, Australia, Austria, Ecuador, France, Germany, India, Indonesia, Iran, Nepal, New Zealand, Norway, the UK and the USA.
The immersion of the fieldwork gives students a reallife practice of the ‘UEP approach’, which focuses on addressing urban complexities from an area-based and participatory point of view, leading to contextual, inclusive and human-driven development processes. Through daily interactions with local communities and relevant stakeholders, students become acquainted with residents and discover the complex realities of these areas, with their specific assets and challenges. By using a variety of participatory (design) methods, the students work on co-designing strategic proposals with the community and other stakeholders.
Students worked in the colonial Fontainhas area, the central business district and along the St Inez Creek. While the main topic of the course is urban informality in all its forms, this year students addressed topics such as public space, heritage, livability and environmental challenges. Warmly hosted by Imagine Panaji Smart City Development Limited, IPSCDL, students were asked to put their areas and proposals in the perspective of the Smart Cities Mission, the large urban development fund and initiative currently implemented by the Government of India.
As an outcome of their learning process, students prepared three reports to illustrate and reflect upon the participatory process through a situational analysis and reflection on methods and methodology that informed a problem statement which they tried to address in strategic proposals. This report sums up the work done by groups three and four in the Central Business District of Panaji, Goa.
Hanne Vrebos, Rolee Aranya, Brita Fladvad Nielsen and Peter Andreas Gotsch, fieldwork supervisors, NTNU, Department of Architecture and Planning
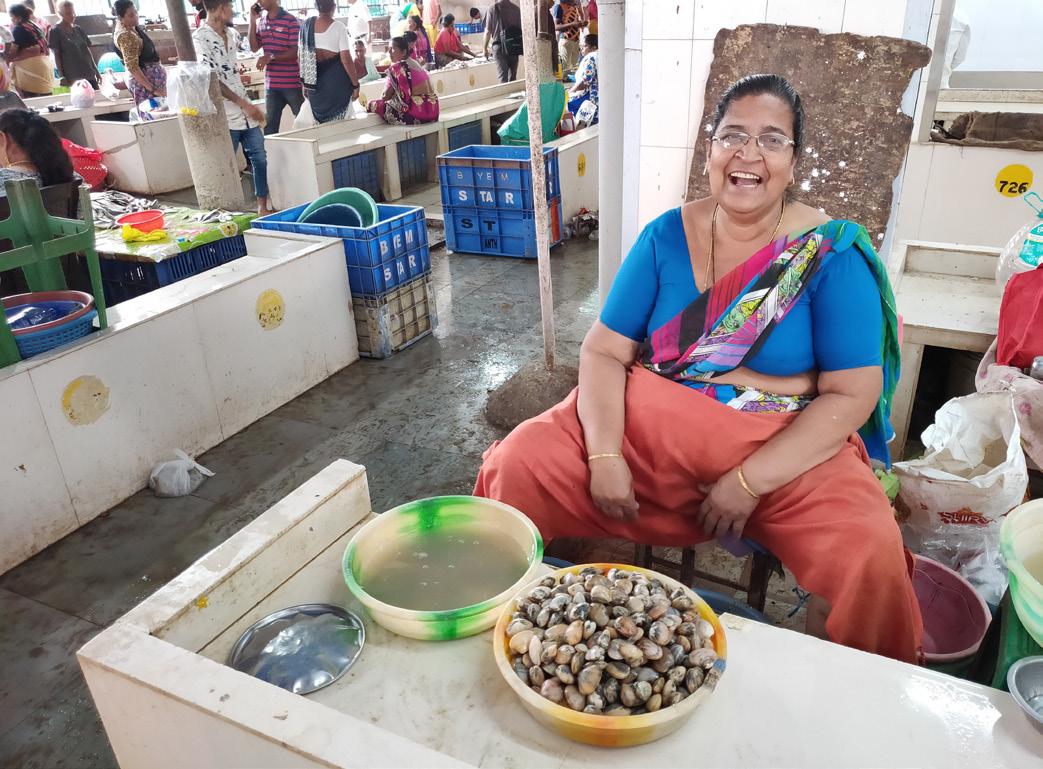
First off, we would like to thank the welcoming and generous community that we came to know. We created strong friendships that will outlast this project. To the families that served coffee and tea in their homes, thank you for generosity. To the business owners that assisted us throughout the project, thank you for your support and guidance. To the vendors who guided us through the market and its processes, thank you for sharing your knowledge. Without your welcoming smiles and heartfelt stories, none of this would have been possible. We hope to deliver a report that exceeds your expectations.
Thank you to our friends from the School of Planning and Architecture Delhi, Ajab Haseena, Chethan Kumar, Isha Nandal, John Sumer, Koyel Das, Siddhartha Kakati, and Surya Gupta. Your support and insights pushed the projects forward and strengthened this report.
To the numerous institutions and organizations that offered their expertise, thank you. From Imagine, Panaji, Town and Country Planning, the Charles Correa Foundation, and many more, your assistance provided critical insights and guided our work.
We would like to give our sincere thanks to the Faculty of Architecture and Planning, Dr. Brita Fladvad Nielsen, Dr. Peter Gotsh, and Dr. Rolee Aranya for their many lessons and teaching. An exceptional thanks to Hanne Vrebos for being with us every step of the way.
Each of the people mentioned above played an important role in the success of this report. For that, we sincerely thank you all.
researching many aspects of Panaji. The first couple weeks consisted of surveying several areas of the city and researching topics such as planning and government structure, land ownership, and water and waste services.
When it came time for groups to be assigned areas, the Central Business District (CBD) was given to groups three and four. After a week of researching the CBD as a team of six, it was time to narrow the focus into two defined areas. To guide the decision, the teams used a participatory method called activity mapping. Participants were asked to mark their most and least favorites on a map and then explain their choices. Through this process, two areas of interest were revealed: the Panaji Market and the area surrounding the church square. Group three took the Market, and group four took the church square.
Through exploring a wide range of participatory methods, we familiarized ourselves with our respective sites and began to identify key stakeholders. These methods provided valuable insights into the culture, building typology, as well as issues and concerns of
the local community. The findings from these insights informed our situational analysis and in turn, enabled us to identify the issues faced by various stakeholders of our area.
The prevailing issues concerning children in the city, livability for families, and mobility were intrinsically linked to concerns of accessibility and safety. This led us to two primary proposals. The first proposal is ‘Children in Public Space’ aimed at facilitating the inclusive and safe participation of children in public space.
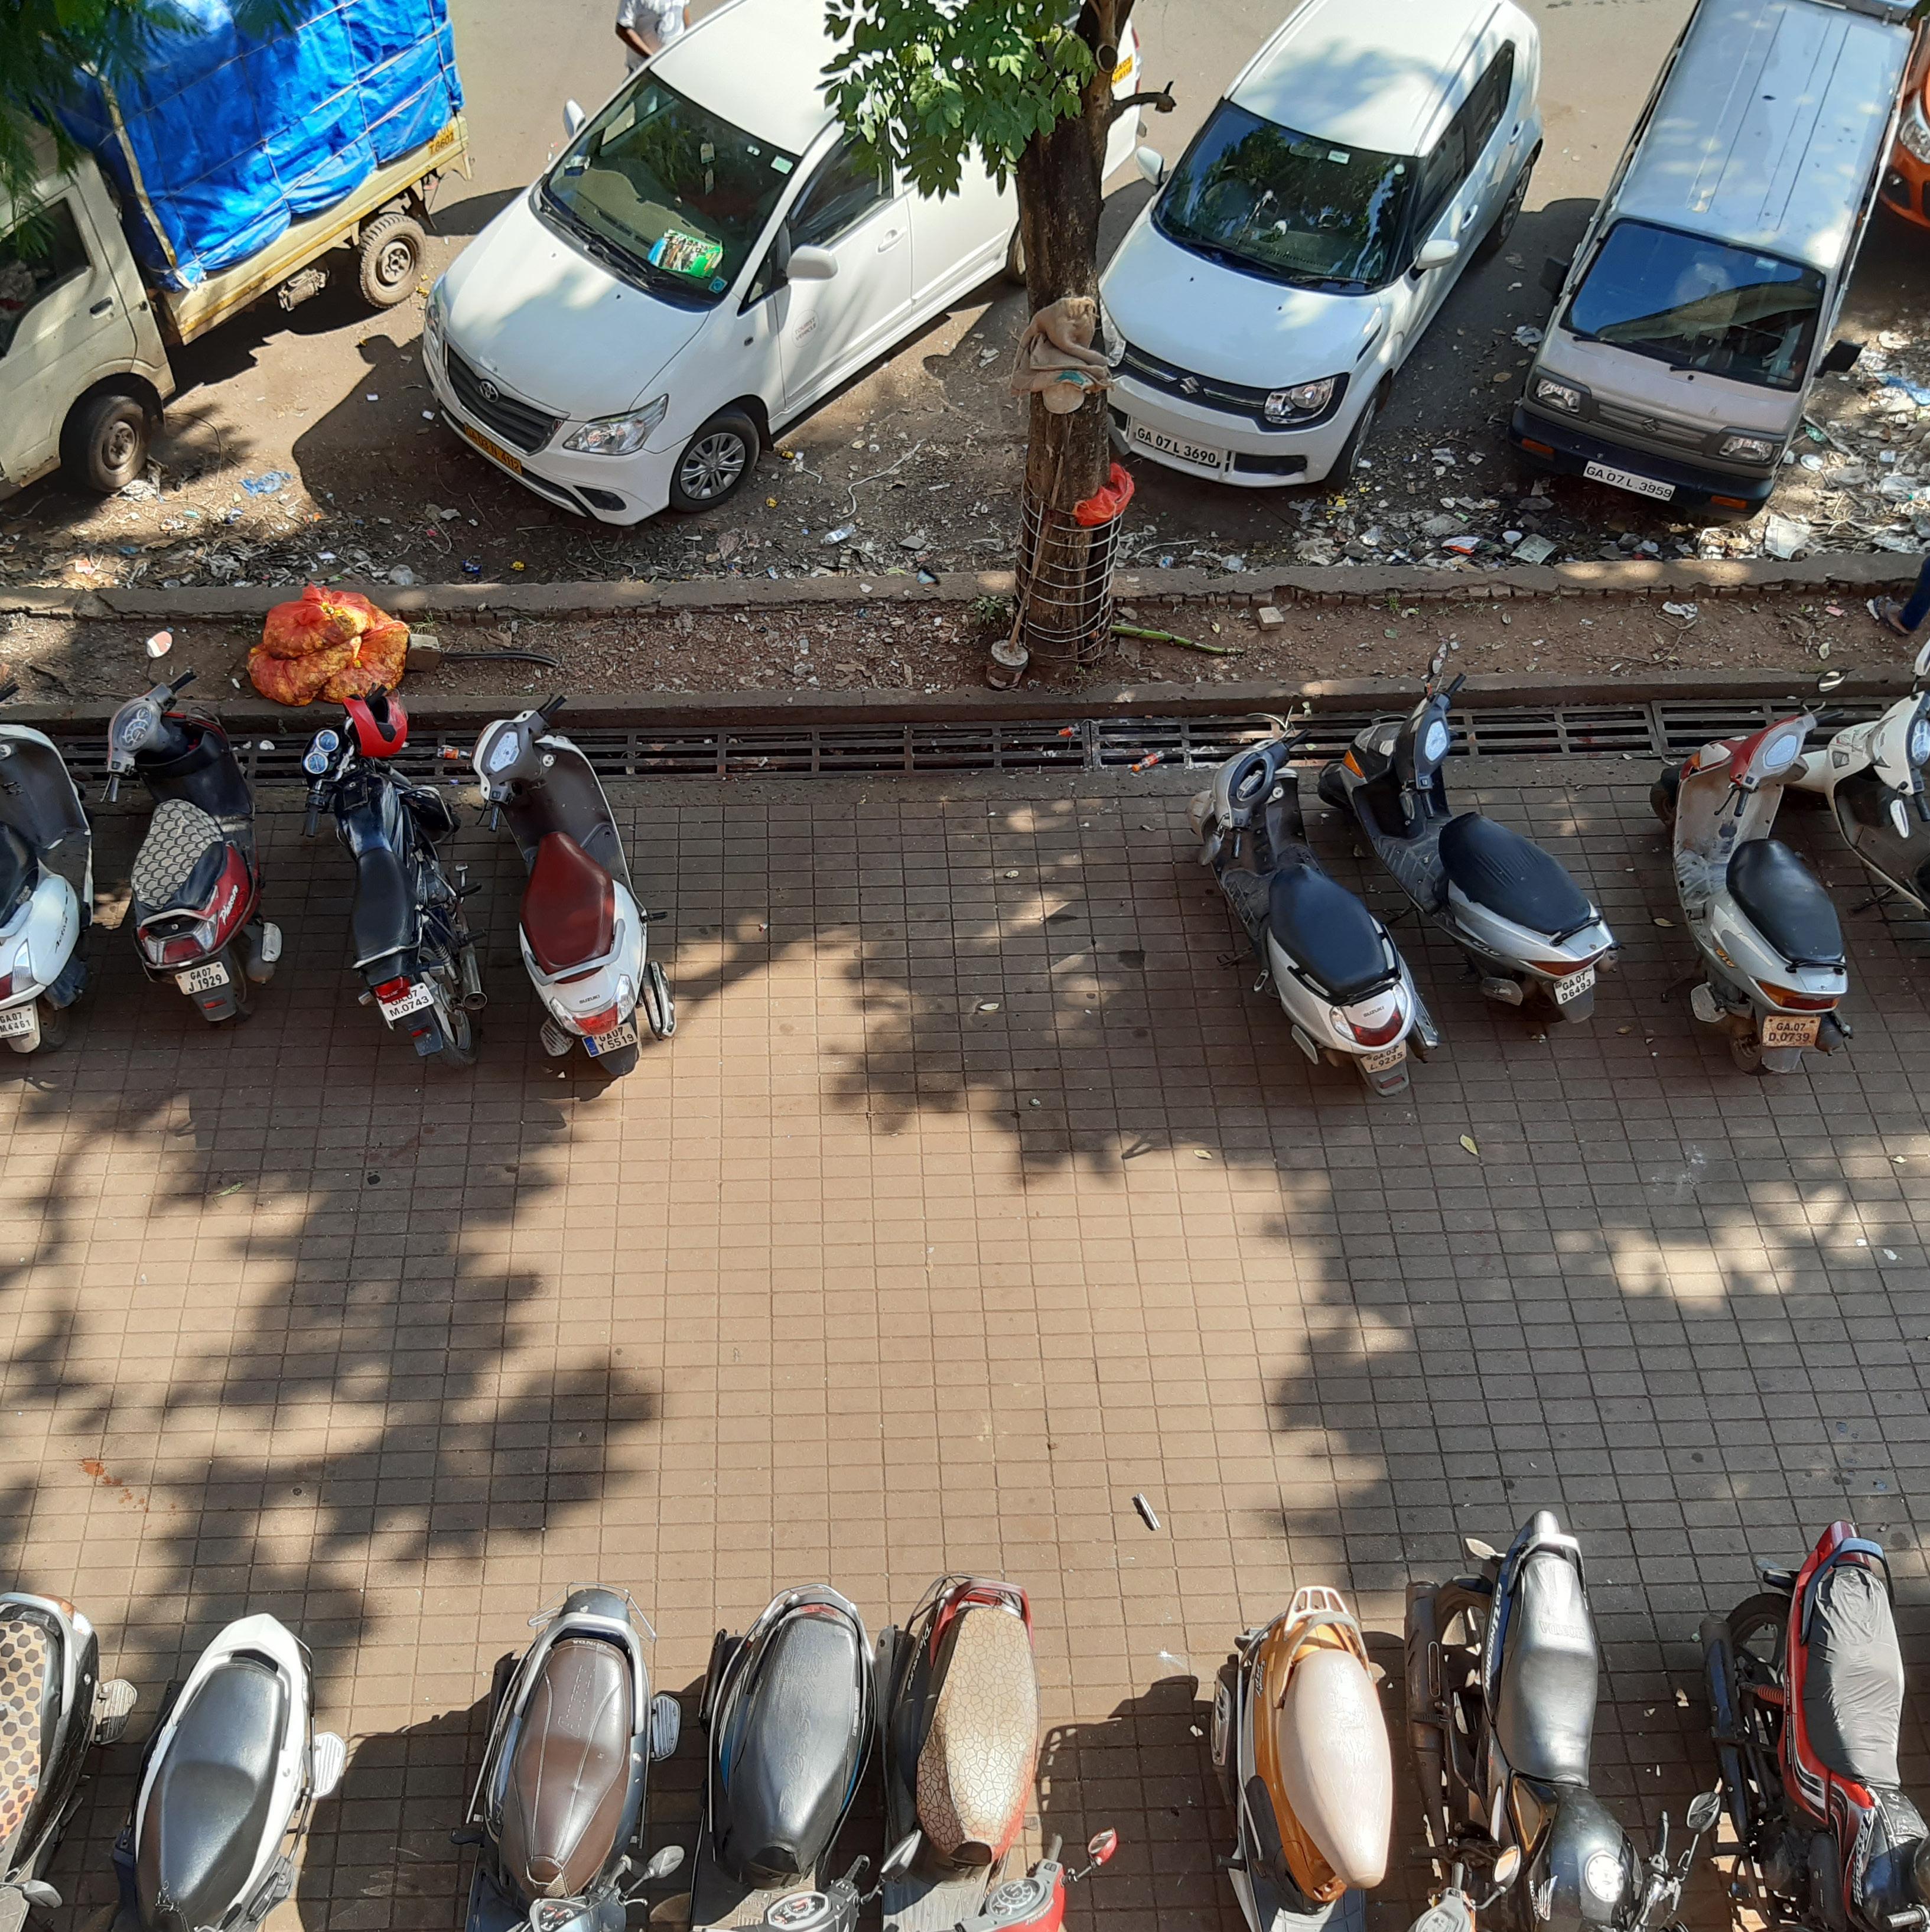
The second proposal, ‘Streets for the People,’ focuses on issues pertaining to mobility. These are wide and varied but attempt to address the issues identified with parking, pedestrian safety, and public transportation.
Preface
Methodology
Situation Analysis
Proposals
An overview
Urban Ecological Planning (UEP) is an emerging field within urban planning at the intersection of social, environmental, and economic systems. This approach to planning acknowledges the inability to facilitate a ’comprehensive plan’ but rather area-based and territorial focused planning initiatives. The UEP approach focuses on the analysis of cities in their complexity by looking at many aspects of local planning which include housing, land, property, water, sanitation, health, education, energy, mobility, infrastructure, environmental sustainability, public space, local economy, and livelihoods (Sliwa et al. 2018).
Cities are studied as complex organisms rather than rigid machines. The experience of residents and visitors are recognized to be many and varied. This work is interdisciplinary and ever-evolving. The program endeavors to marry bottom-up and top-down approaches to planning. Through this marriage, local communities are connected with resources. Planners act as facilitators of these resources and collaboration rather than expert designers.
In this quickly changing world that faces wicked problems such as rapid urbanization and climate change, the UEP program aims to provide a holistic, humancentered, multi-disciplinary, and participatory approach to planning.
Established in 2015, the Indian Smart City Mission was launched by the Ministry of Housing and Urban Affairs. While there is no universally accepted definition of what a smart city is, it is recognized that Indian Smart Cities is, “represented by the four pillars of comprehensive development-institutional, physical, social and economic infrastructure” (Smart City Mission 2016). In general, the Mission focuses on city improvement, renewal, extension, and pan-city development. Pan-city development is the installation of Smart Solutions to the existing city-wide infrastructure. Within the span of three years, 100 Indian cities were chosen throughout every state.
As a special purpose vehicle (SPV) under the Government of Goa, the Imagine Panaji Smart City Development Limited (IPSCDL) was incorporated in 2016. The SPV’s goal is to, “plan, appraise, approve, release funds, implement, manage, operate, monitor and evaluate development projects in Panaji City” (Imagine Panaji 2016). Focusing on economic growth and improving the quality of life for residents, IPSCDL aims to make the environment and urban infrastructure of the City smart, efficient, and sustainable through smart technology and active citizen participation.
Now three years from incorporation, IPSCDL has an array of completed and ongoing projects throughout Panaji. These projects include but are not limited to step and park beautification, a comprehensive mobility plan, installing monitors on existing water infrastructure, researching a city-wide information system, and burying communication cables. With a team of engineers, economists, and planners, IPSCDL’s capacity is stretched thin. Once based on citizen participation, IPSCDL’s focus is now narrowed on implementation. IPSCDL faces dwindling public support, challenging the success of even the most beneficial projects.
India is a South Asian country with 28 states and 9 union territories. Located along the South Western coast of the Arabian Sea is Goa, the smallest state in the country by area. Konkani and Marathi are the dominant languages spoken throughout Goa. Mandovi, Zuari, Terekhol, Chapora, and Betula are the major rivers flowing through the state. Unique to Goa is its previous status as a territory of Portugal. For a period of 450 years, Goa remained in Portuguese possession before liberation on the 18th December 1961.
Goa later became a part of India in 1962 and attained statehood in 1987. The Portuguese influence is evident in the culture, food, and buildings in some parts of the state. Not many people speak Portuguese in present-day Goa, but there are families preserving the Portuguese culture, fusion cuisine, and arts in their own ways. Natives of Goa are referred to as ‘Goans.’ The unique history of Goa has created a culturally diverse community composed of Christians, Muslims, and Hindus.
In an effort to meet Central mandates, the Government of Goa banned illegal mining. However, the Supreme Court of India found the state was ineffective and banned all mining activities in Goa to curtail a depleting forest ecosystem and potential health hazards to the local population. The tourism sector continues to grow, offsetting the loss in GDP. The casinos play a major role in attracting intranational tourists. This has kept Goa’s status as the state with the highest GDP per capita among all Indian states, which is two and a half times that of the country (Academic Foundation 2005). Today Goa is a popular destination for both national and international tourists due to its famous beaches and nightlife.
Centrally located in North Goa along the banks of Mandovi river is Panaji, the capital of Goa. Historically Panaji was a fishermen village. It became the capital for the Portuguese after the initial capital, Old Goa, was abandoned due to a plague in the sixteenth century. Made up of just over 40,000 inhabitants, Panaji houses the Central Business District (CBD). Panaji is the largest concentration of major government institutions and the majority of commercial activity in Goa.
With an average temperature of 27°C and a humid climate, Panaji’s economy is mainly focused on tourism, hotels, casinos, and trade. Visiting tourists come from numerous different parts of India, with around 20% of international tourists (Goa 2019). Many visit Panaji for the historic neighborhood of Fontainhas, where much of the Portuguese inspired architecture of the area is located. Other primary attractions such as the Church of Our Lady of Immaculate Conception, Miramar Beach, Jardim Garcia D’Orta, and various pockets of the CBD are frequented by those seeking to experience Goan culture, food, and historic architecture.
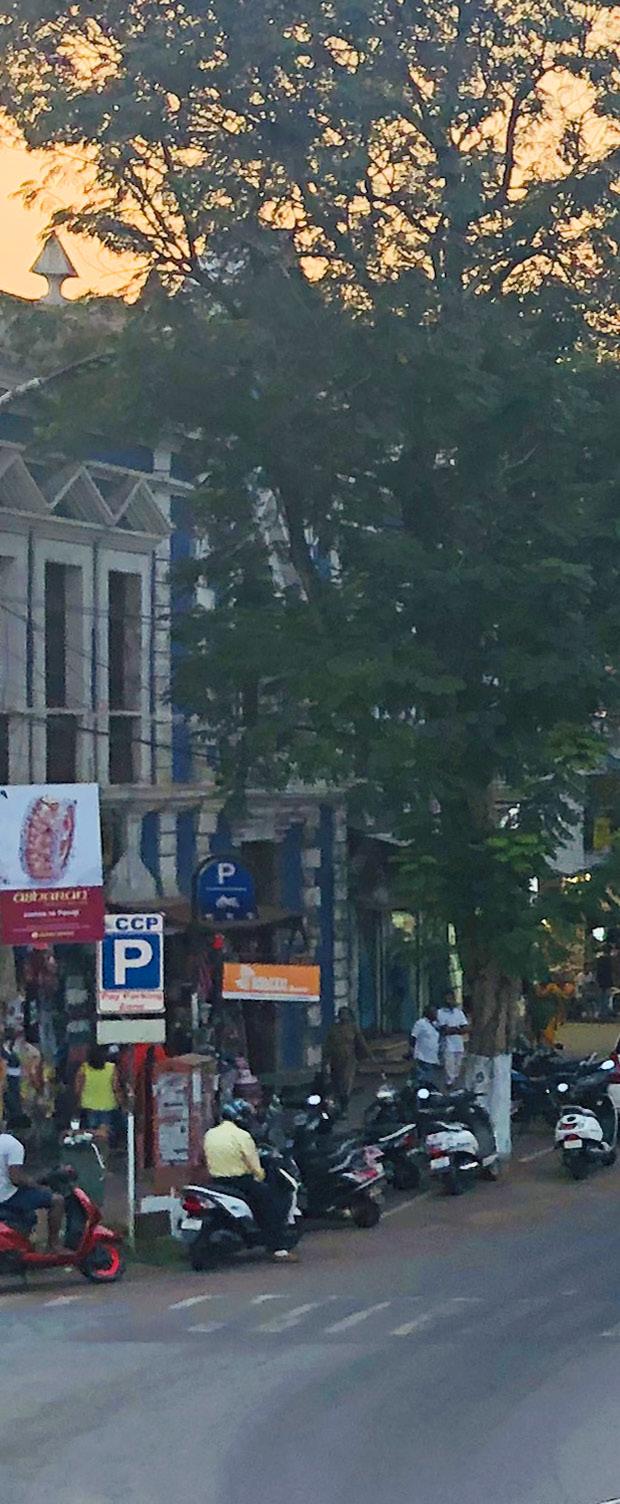
Panaji city is characterized by rich biodiversity with many trees pre-dating the Portuguese colonial period. The Botanical Society of Goa conducted a study identifying Panaji as having 125 different plant species (Braganza 2019). Nestled amidst these beautiful big old trees are the streets of Panaji. An orthogonal grid shapes the layout of many central Panaji streets. However, there lack many conventional organizational elements, such as traffic lights, metered parking, and consistent pedestrian access.
PANAJI, goa
Introduction to the area and the surroundings
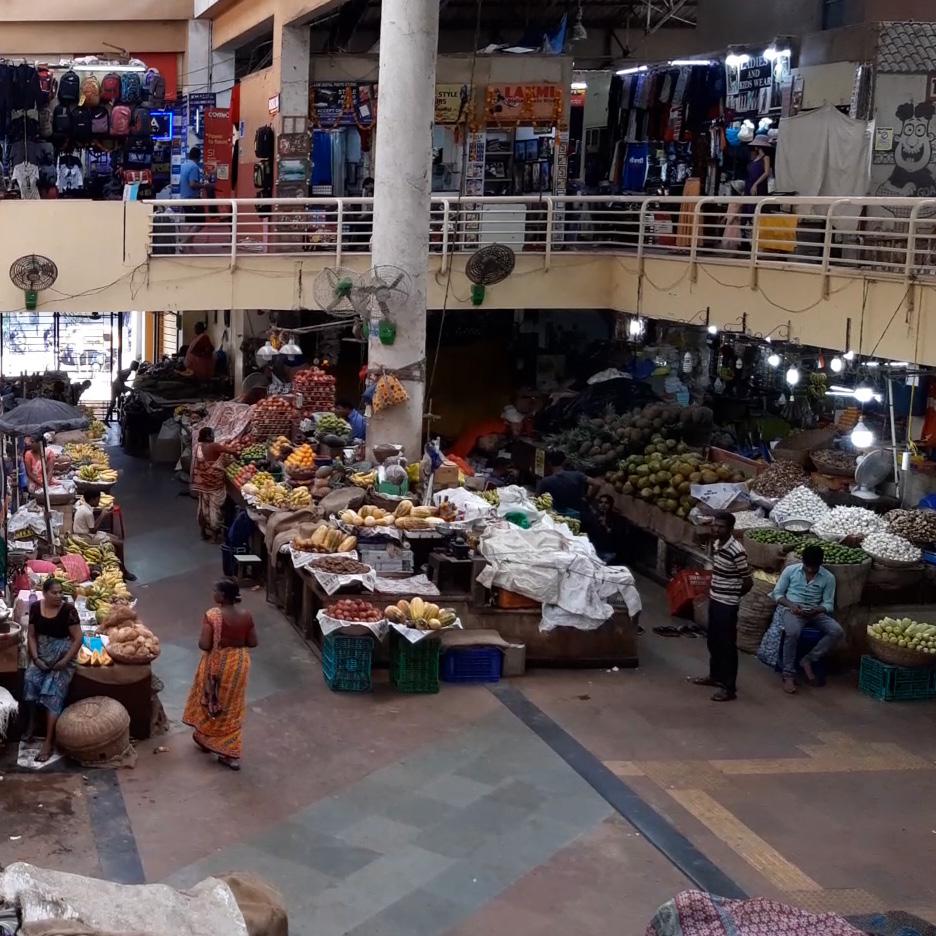
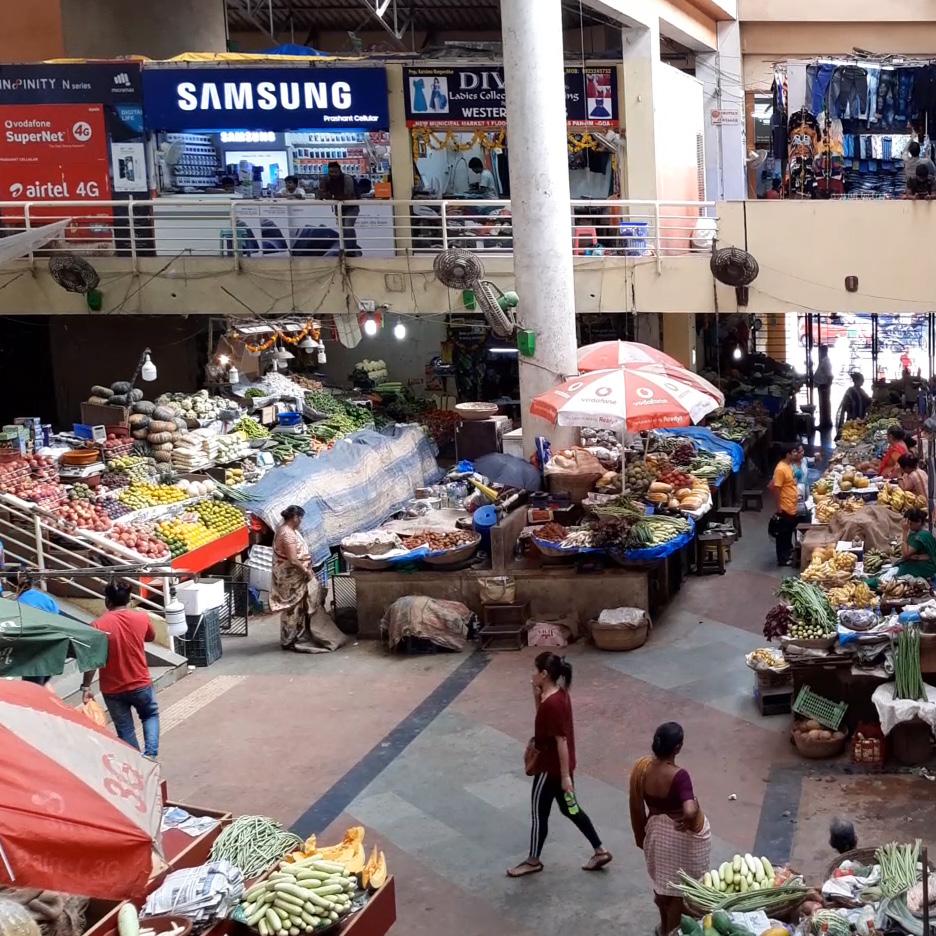
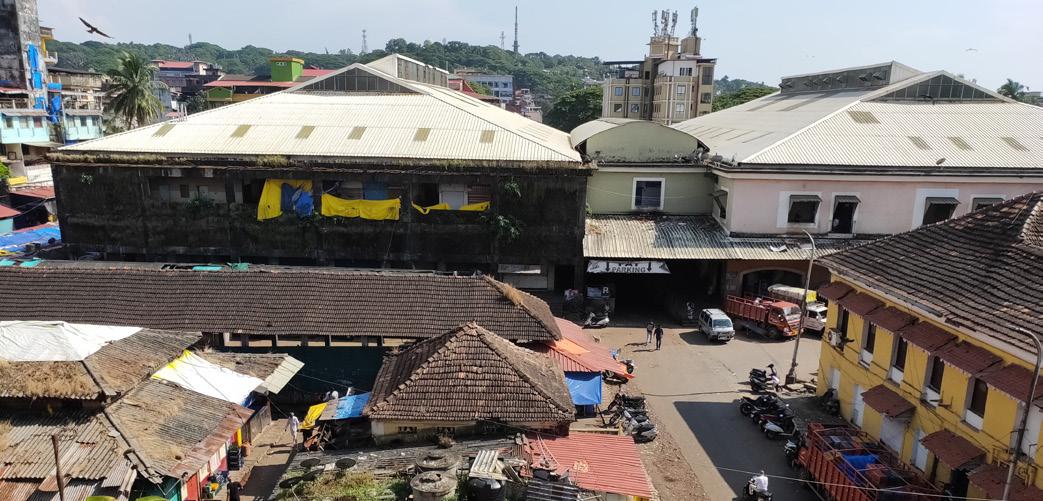
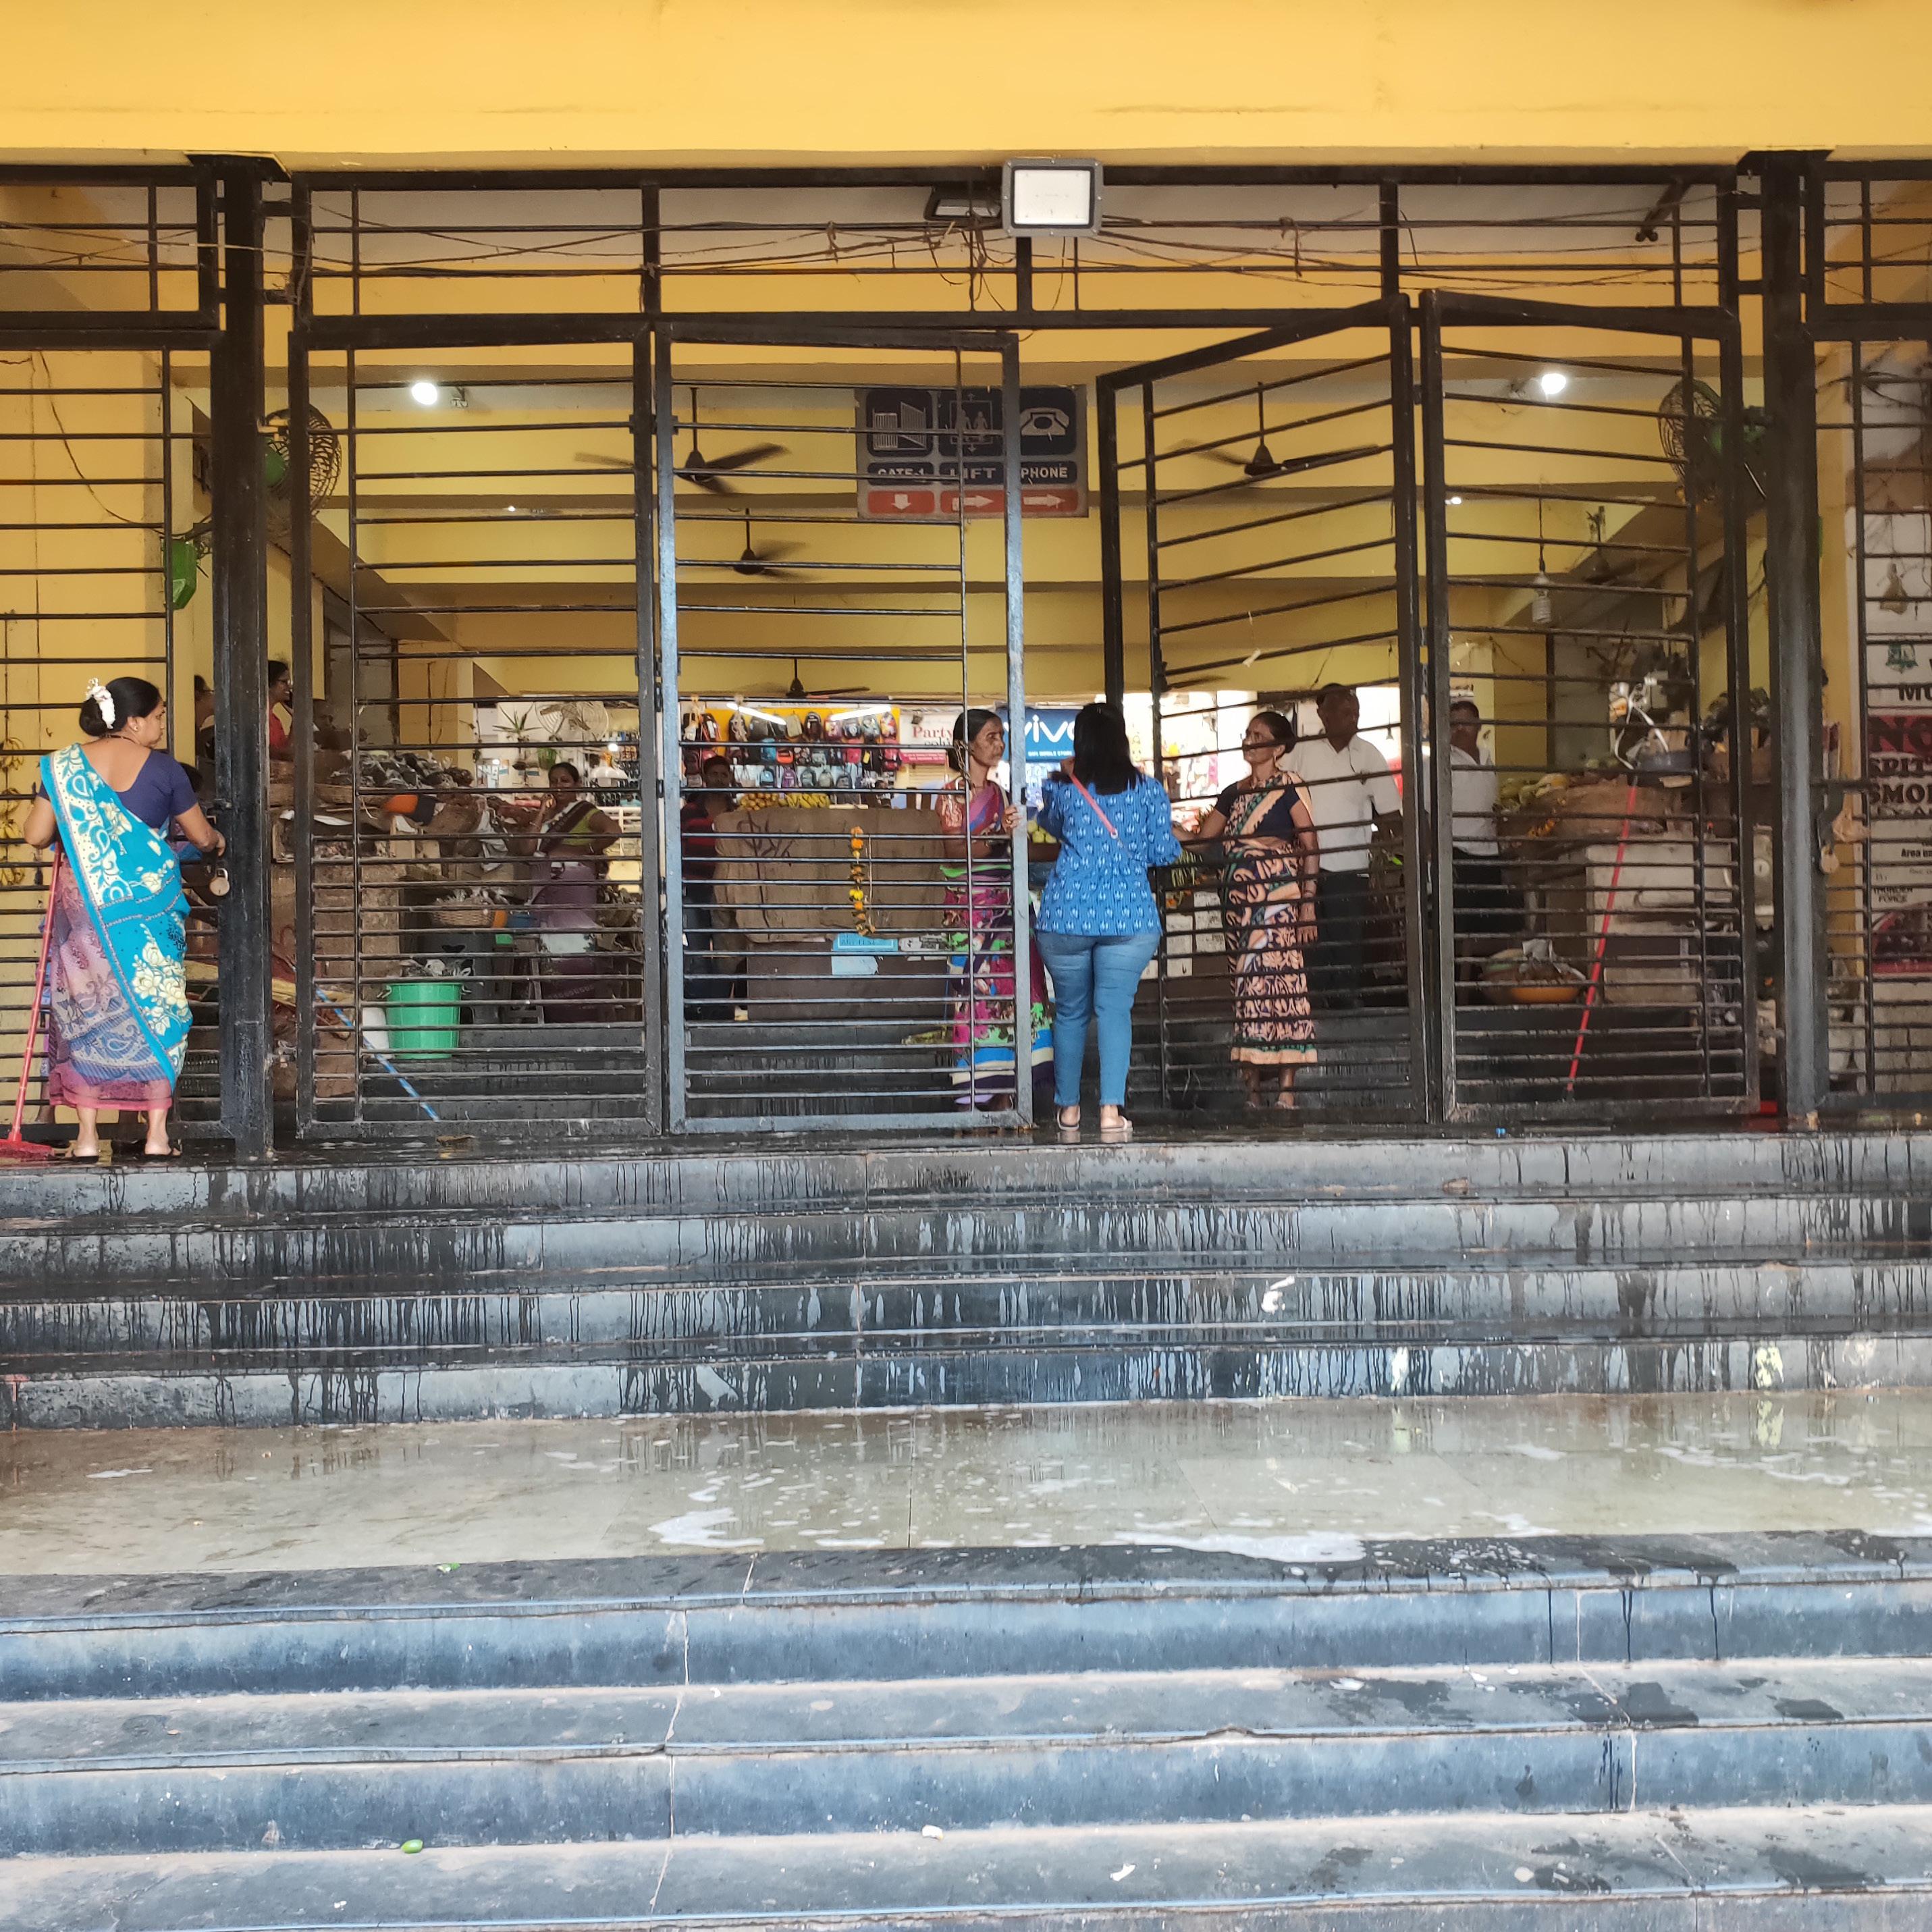
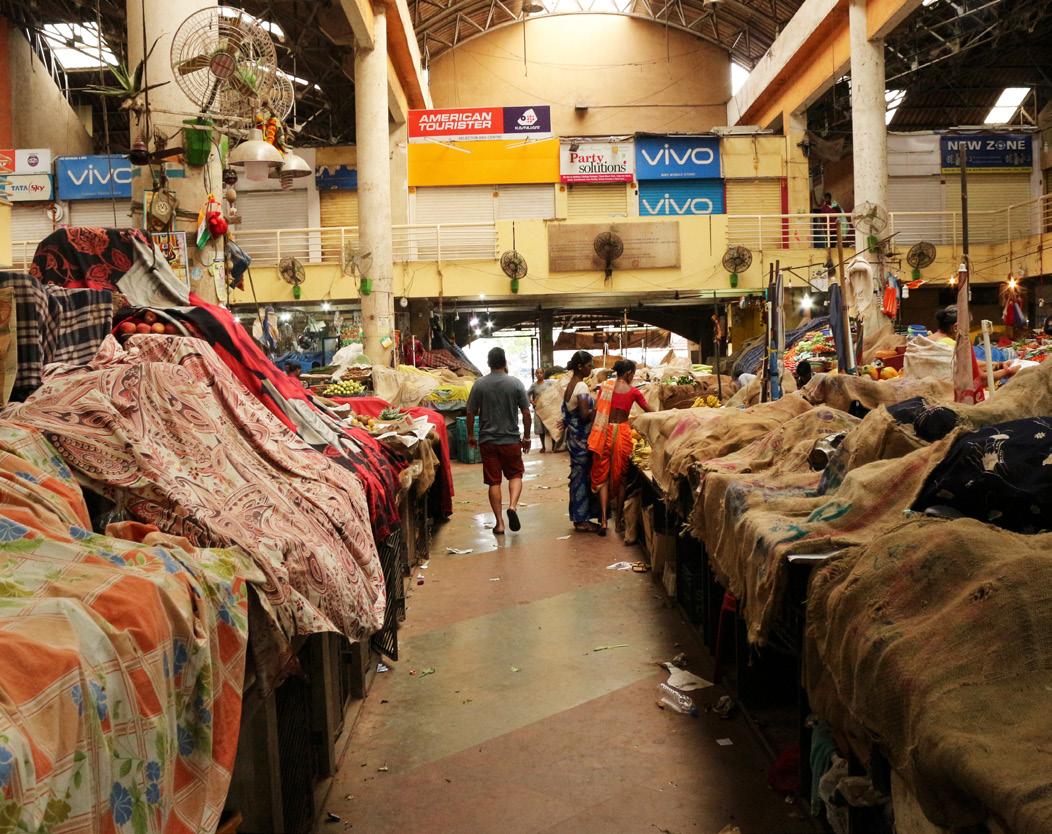
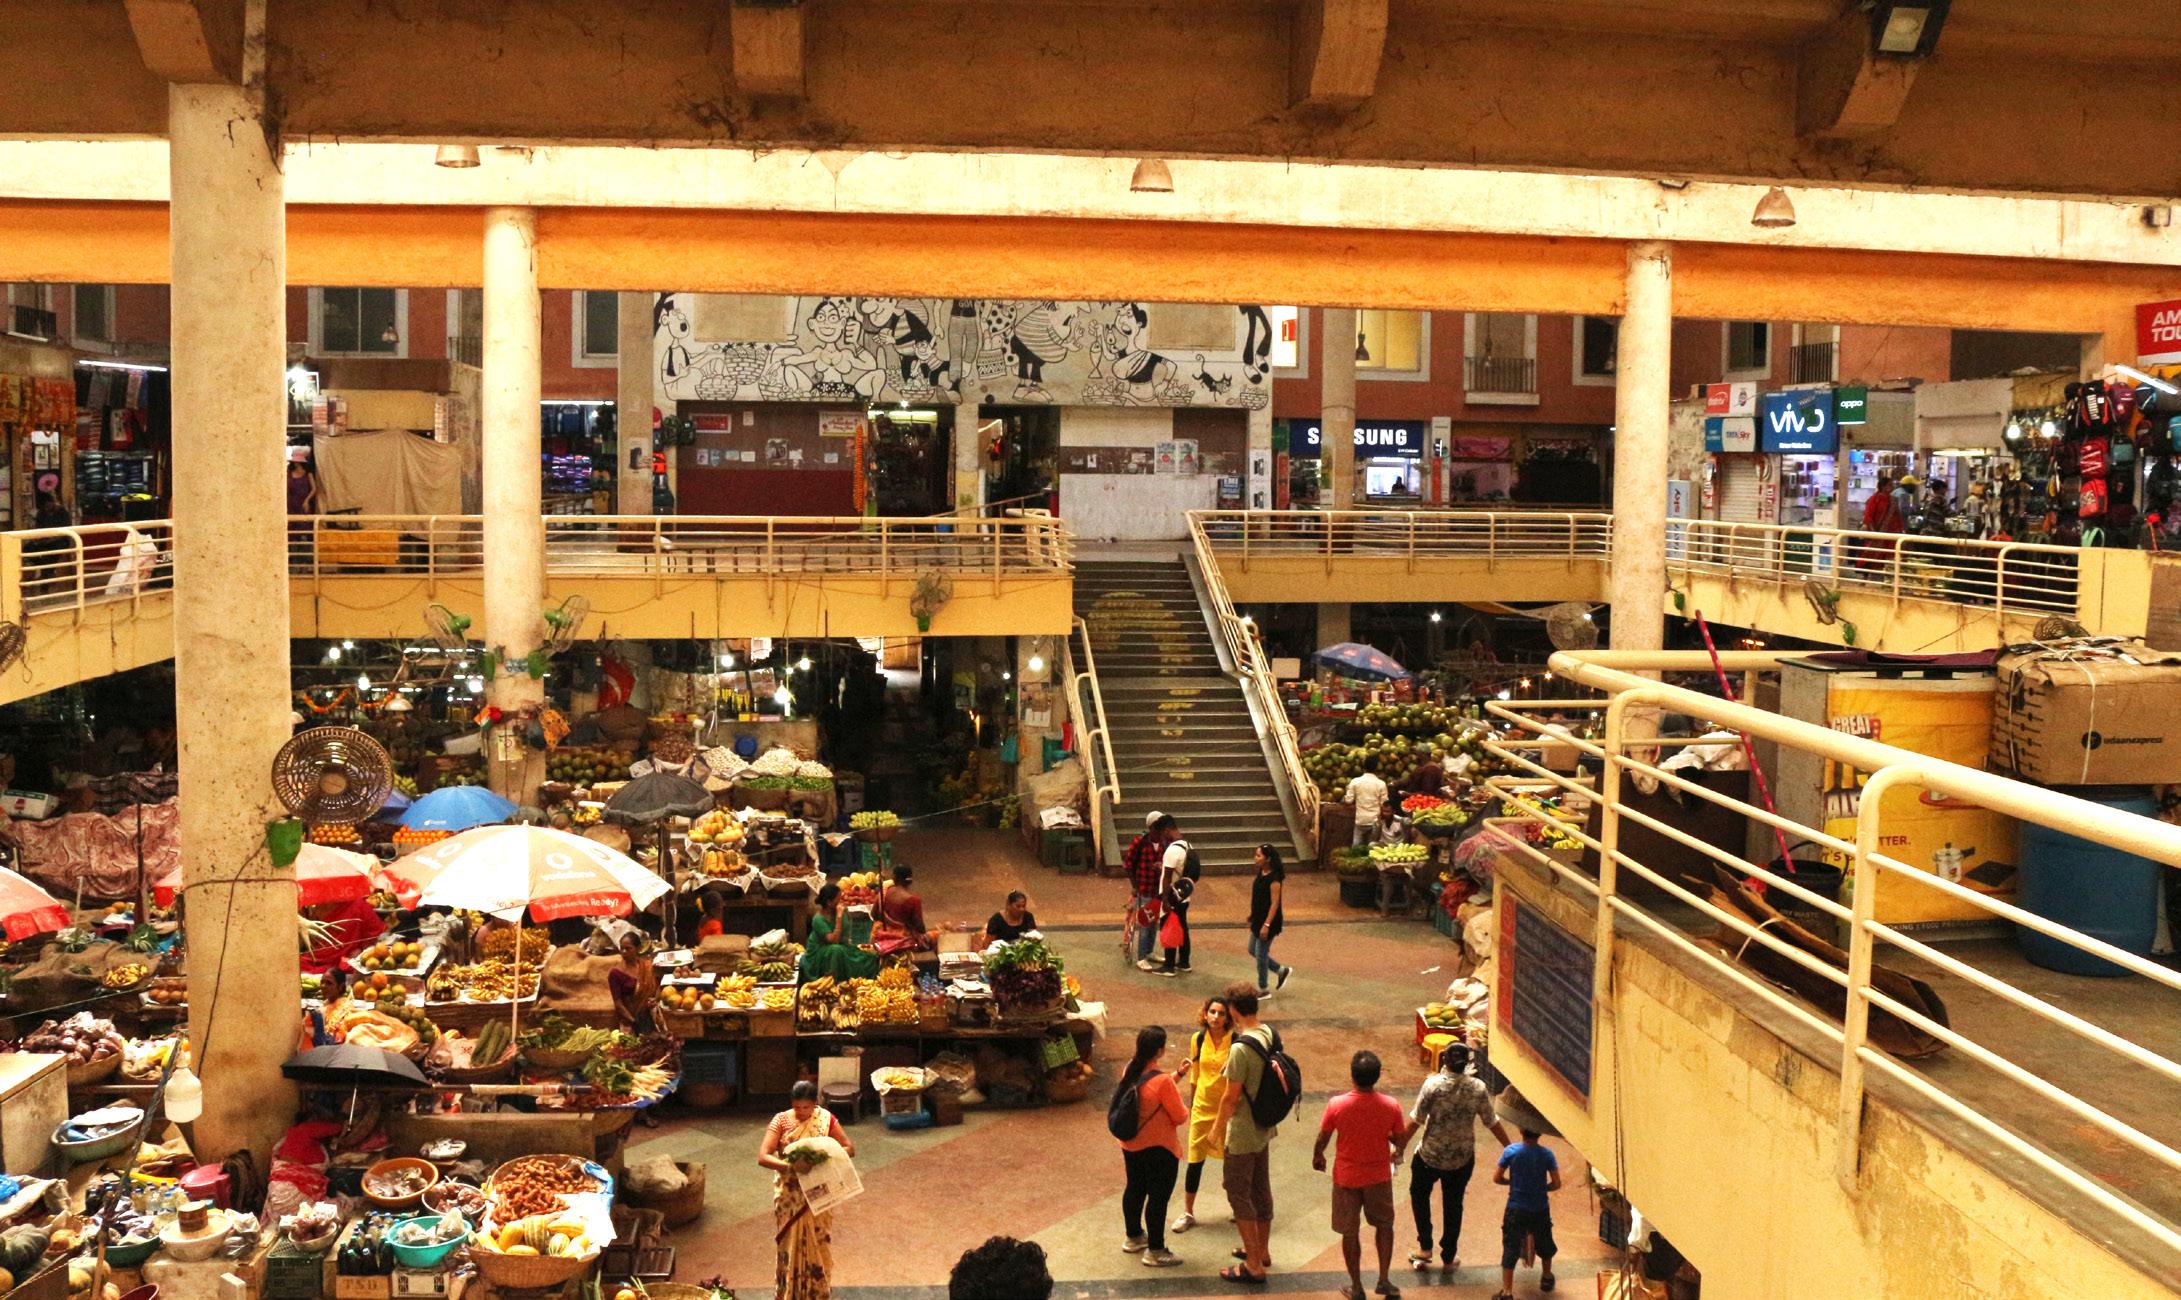
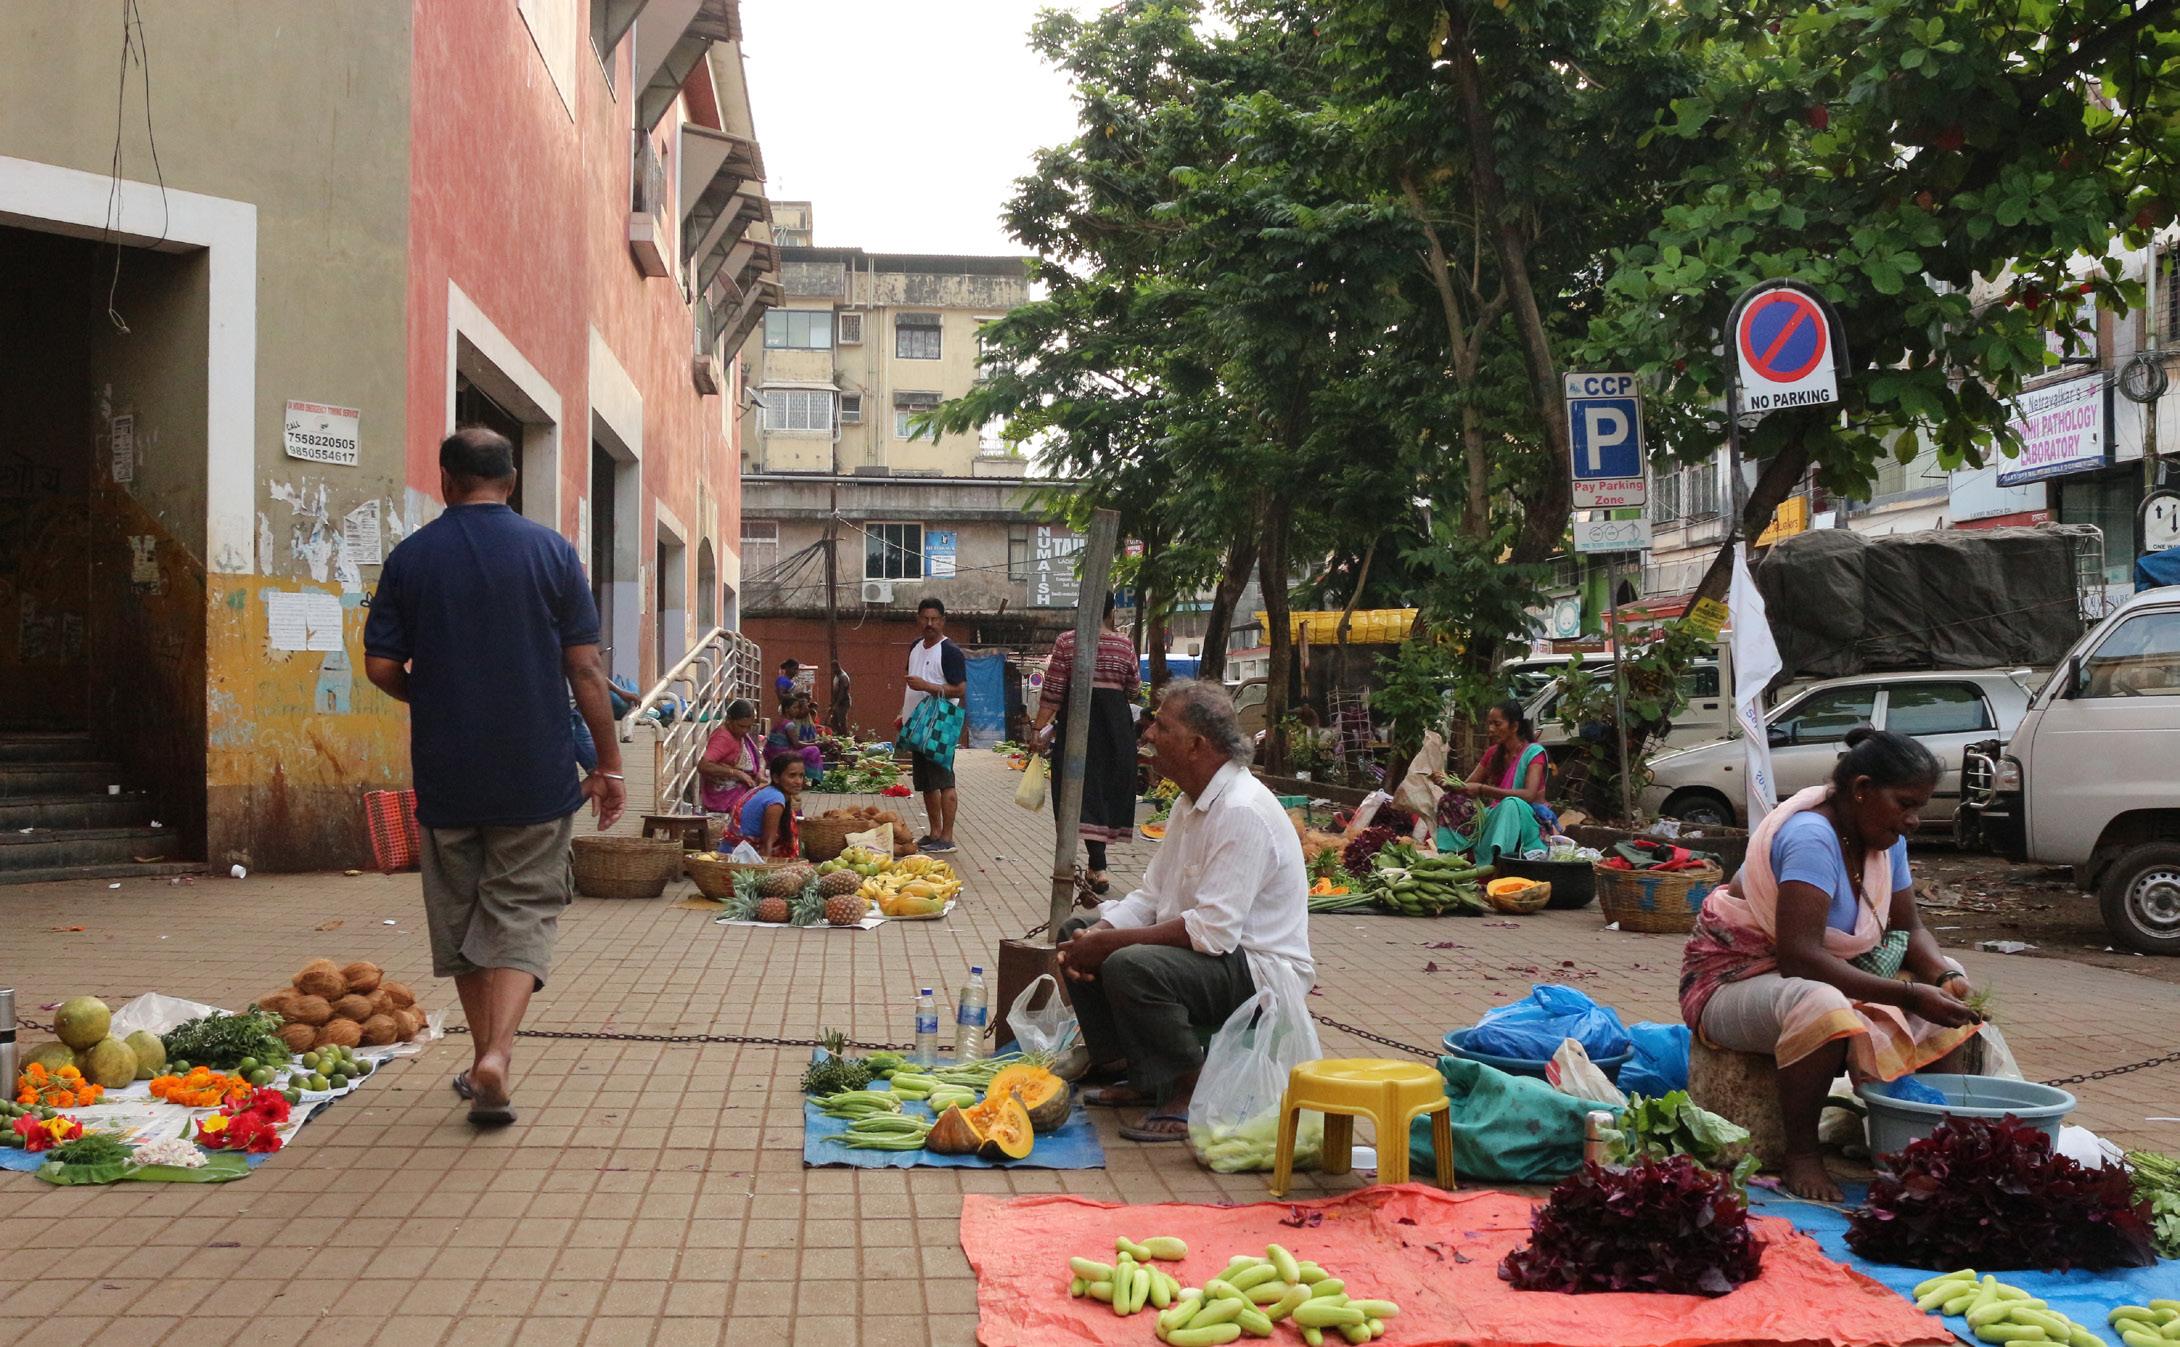
Panaji Municipal market is located in the west side of the central business district. When entering the market for the first time we noticed a high density of locals using the spaces both inside and outside. One of the first noticeable sense walking inside was the smell of spices, fruits and vegetables filling the ground floor. We felt like this was the most dense and lively part of the market. The reason could be the accessibility of goods locals use daily. The first floor felt more vacant having less customers. We found the entry points of this market and the connectivity with the surroundings very interesting. There are several markets in the same area that has been constructed in different times being merged together in interesting ways, giving them different typologies. The spaces around the market are used daily for different purposes. Ranging from dense shopping areas, less maintained areas used for sleeping to unplanned trash collection points. We observed that neglected parts of the market have an informal use of space. The social connection of people managing these spaces is another interesting finding. There is an interesting collaboration between the government and associations inside the market areas.
As we researched the market area, we asked people how the historical site felt like compared to the present infrastructure. We were told that the market area has been existing since the Portuguese era and has been redeveloped several times since then. Roofs define the spatial areas and connections between them progressing from smaller to bigger constructions. As the phases of construction has developed different sections at a time there are now some interesting links between them.
When the old market became structurally unstable, the government intervened and made a plan to demolish the old market and build a new market to accommodate the street vendors around the market.

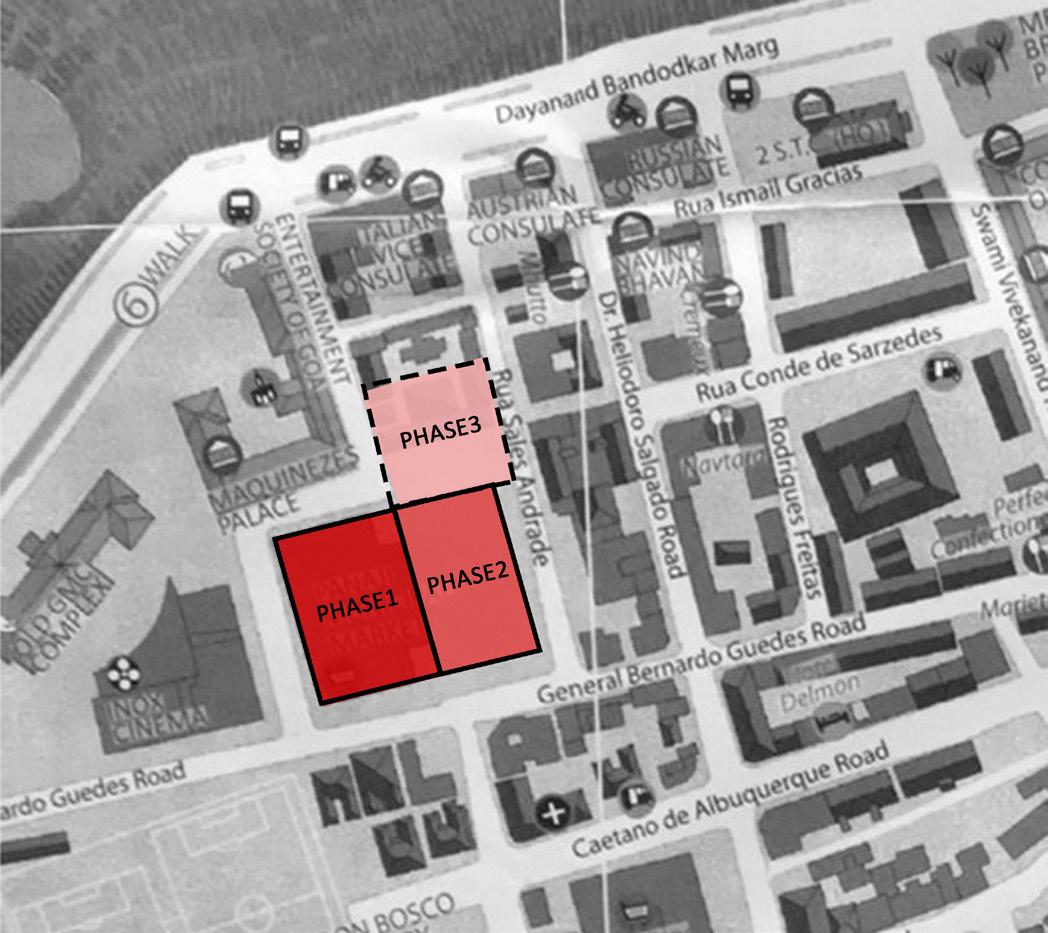
The construction of the new market was planned in three phases. The phase 1 and 2 were completed in 2006 by Goa State Infrastructure Development Authority (GSIDC) (Limited, 2014). The third phase is yet to be implemented. The people in the old market and fish market work in the to-be phase 3 area which is part of the old market.
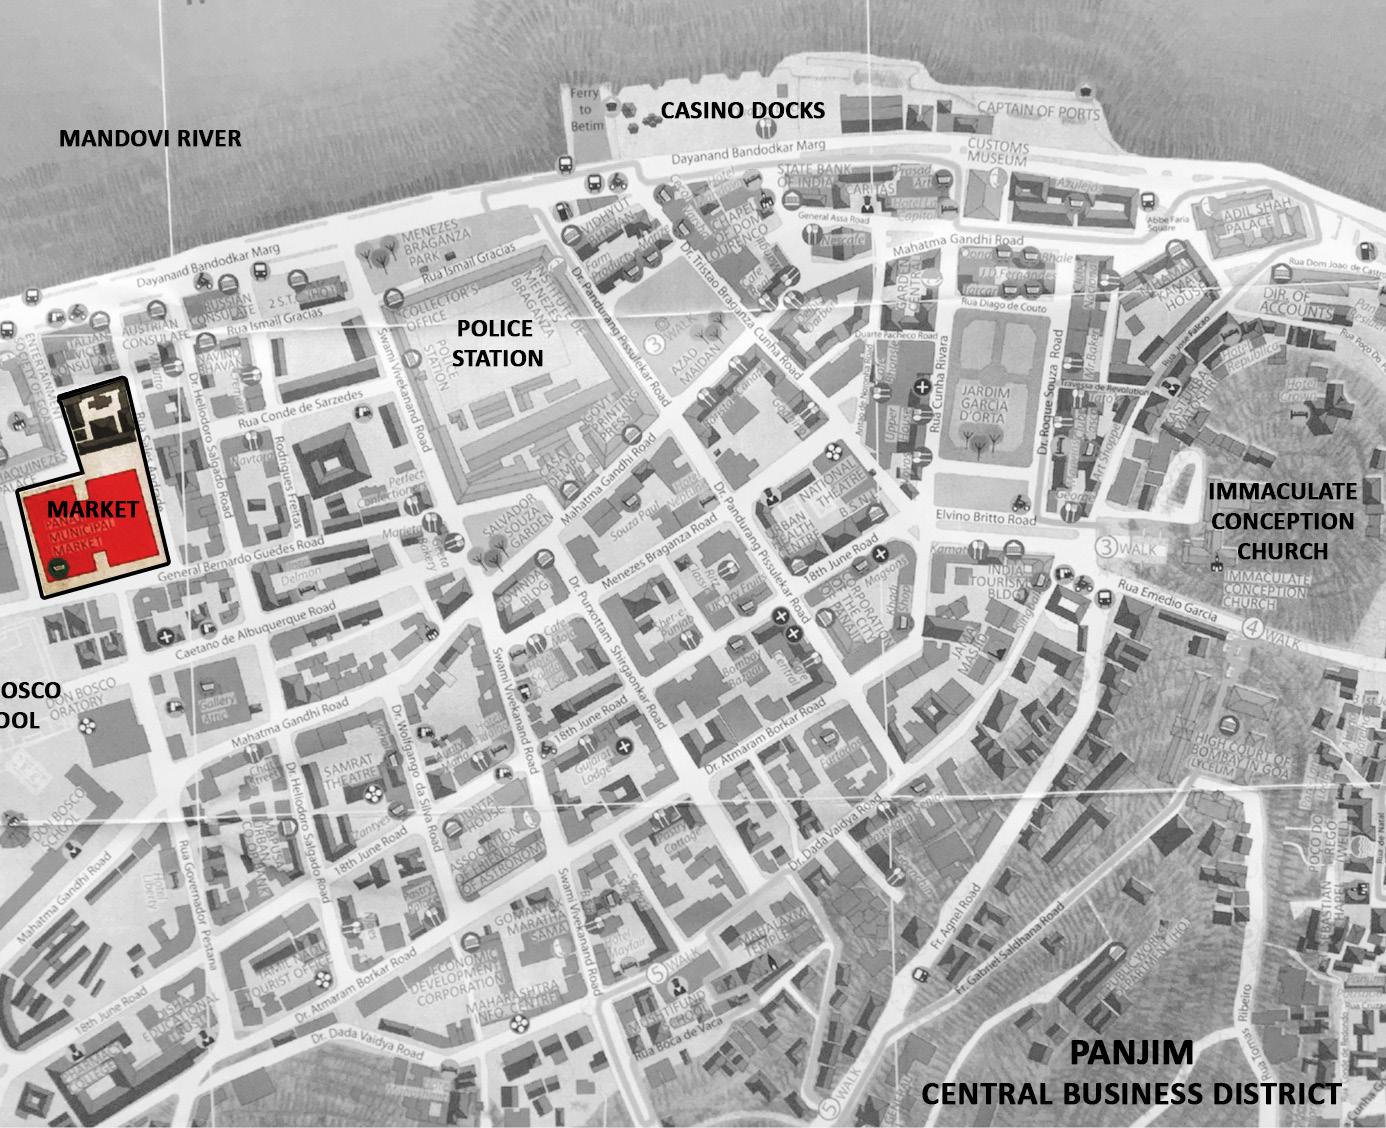
The market is located in Panaji in the CBD. The central location makes it suitable for catering the daily needs of the inhabitants around the city. It is strategically connected with the Dayanand Bandokar Road near the promenade. It is a place where everything people need for a weekly schedule is located in the same place. It is an asset for the residents living close by as well as people living some distance (3-4km radius) away also come here to buy fresh produce. The market area is well served by bus transport. All the buses stop at the market with the conductor shouting “market, market, market, market, market!”. People from different villages nearby use bus to travel to the market and sell produce. The market is also a convenient thoroughfare for people using the bus to come into CBD to their schools, colleges and work.
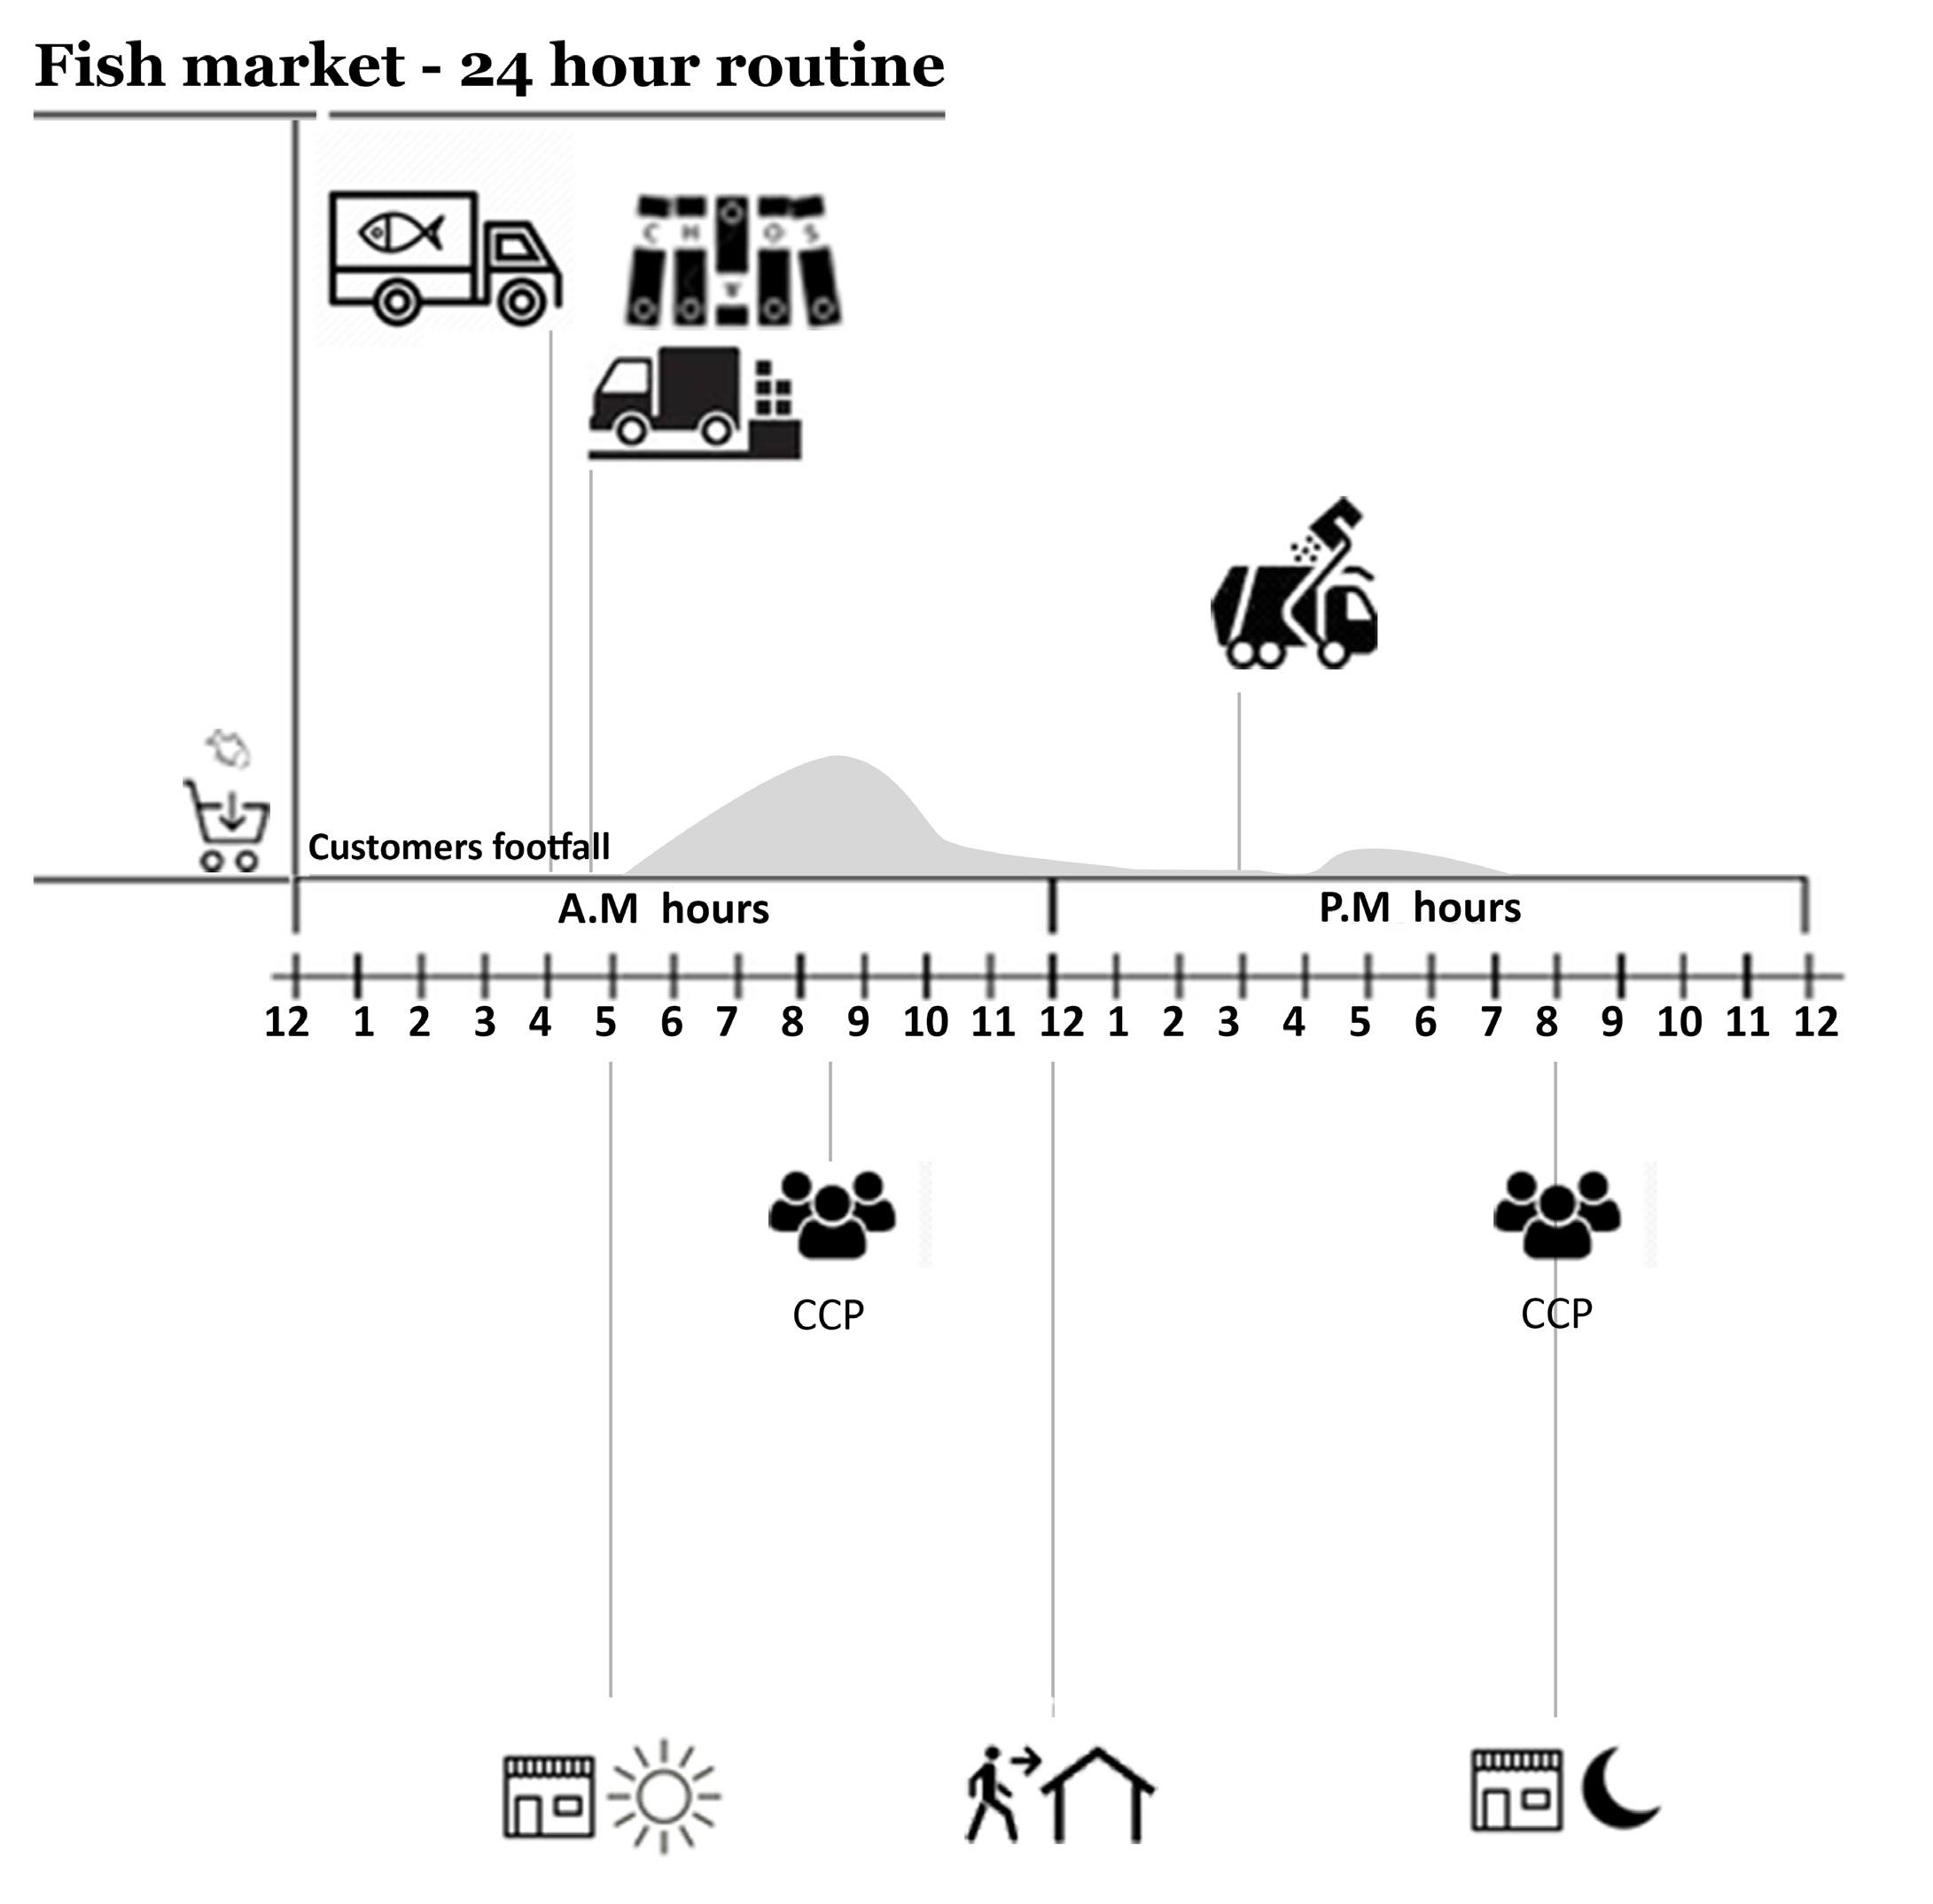
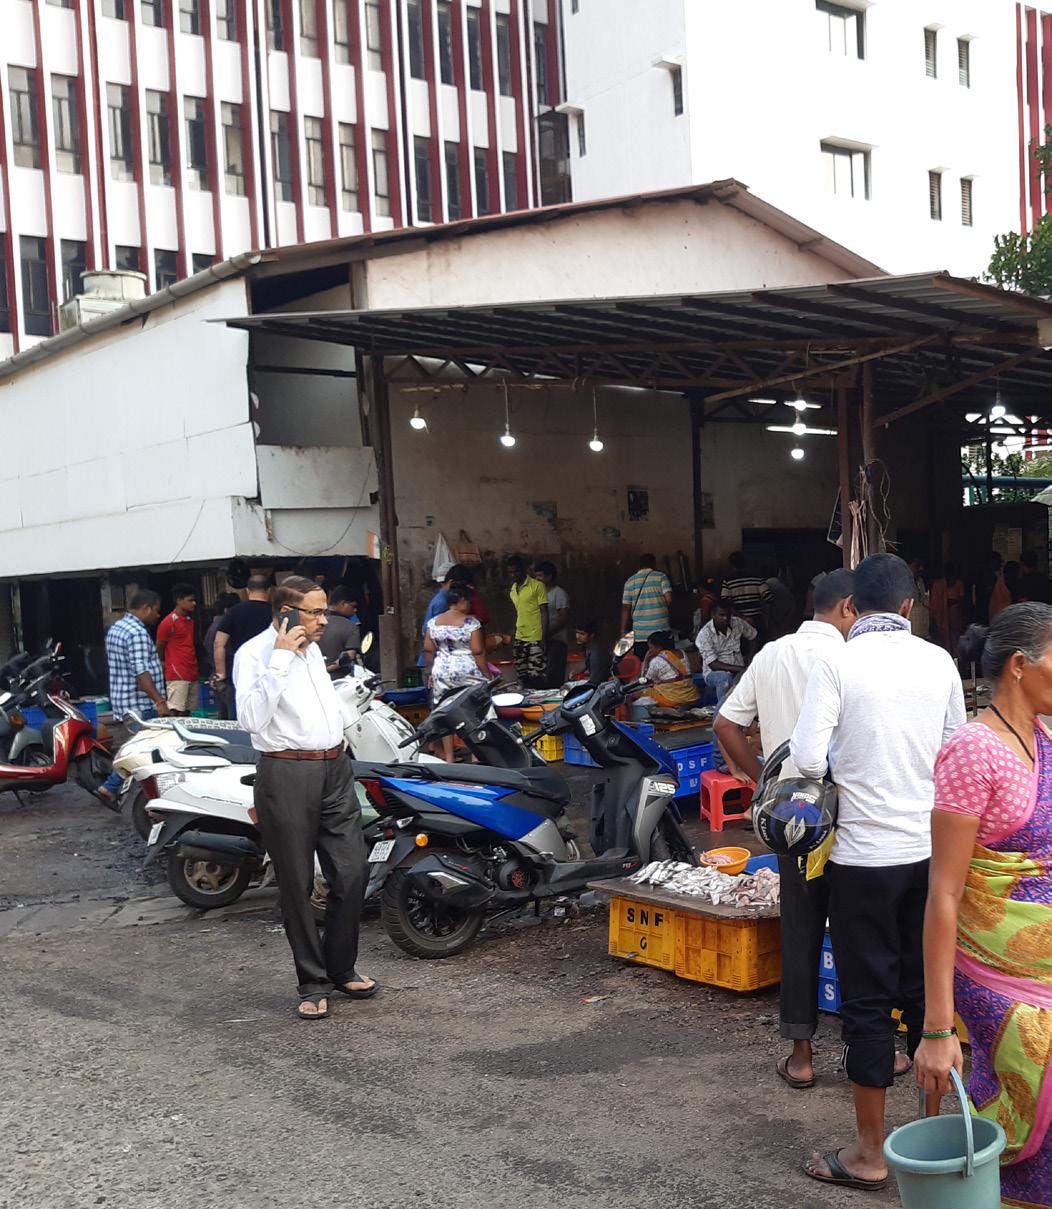
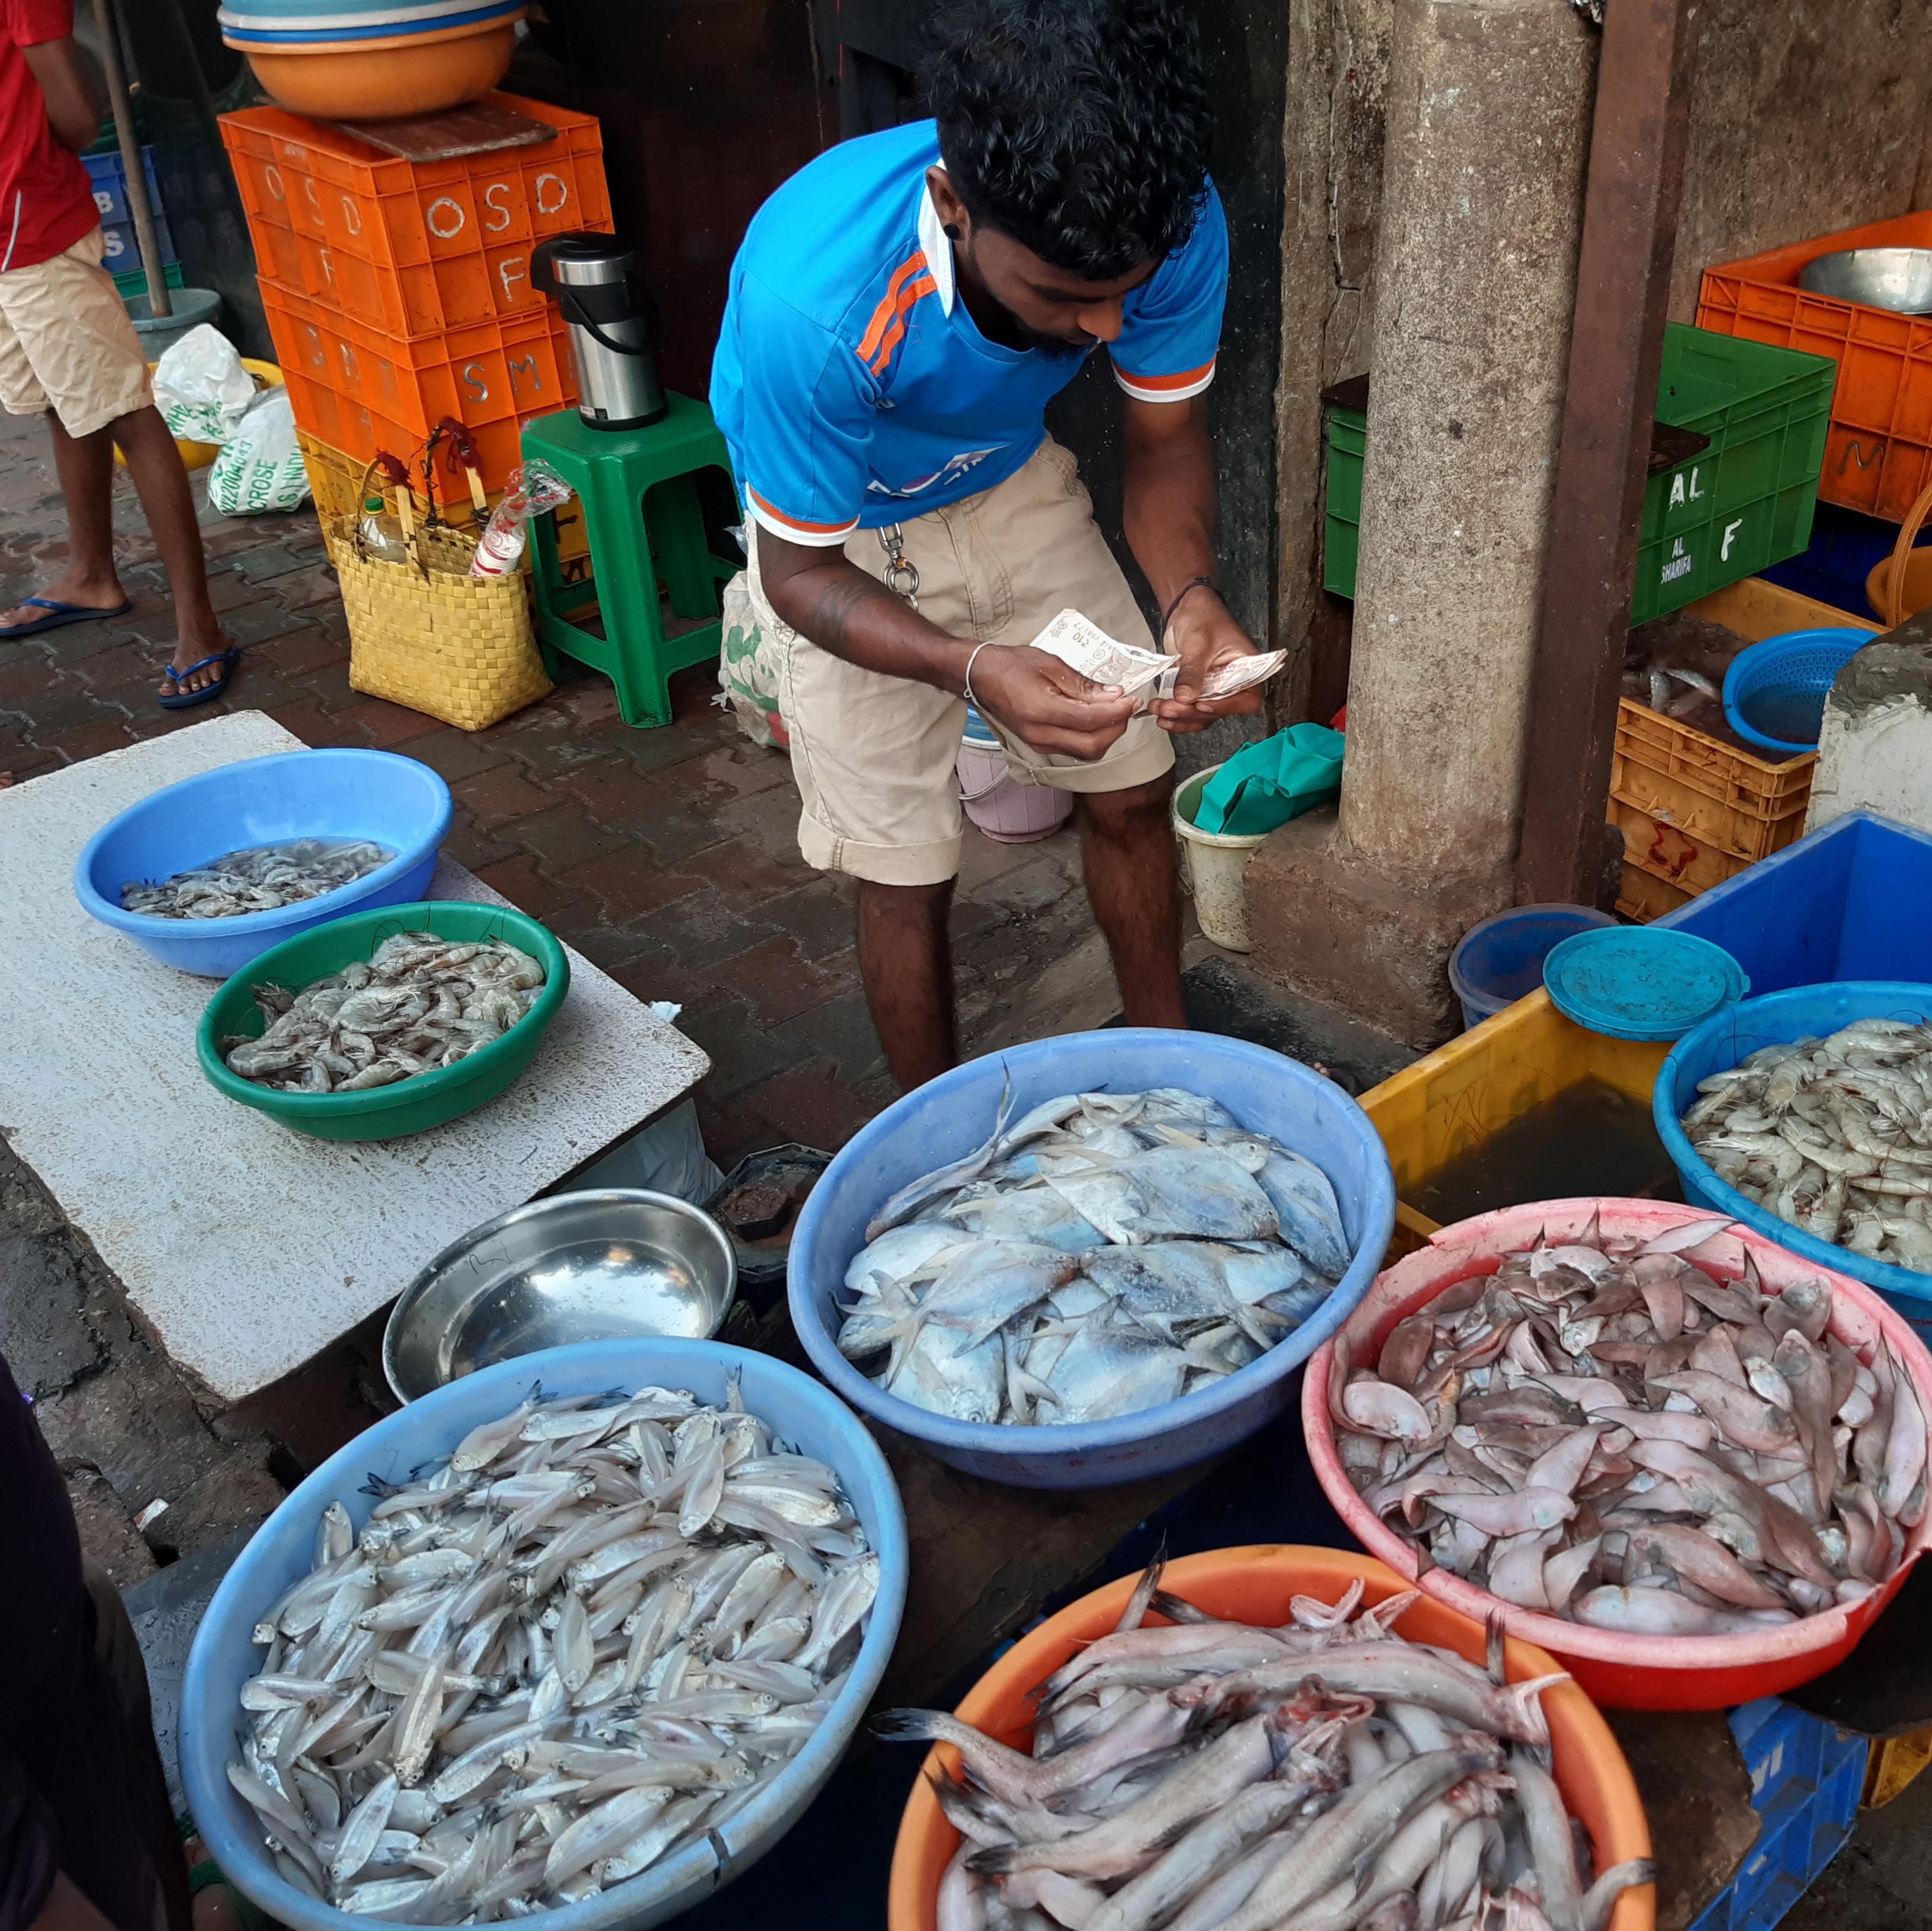
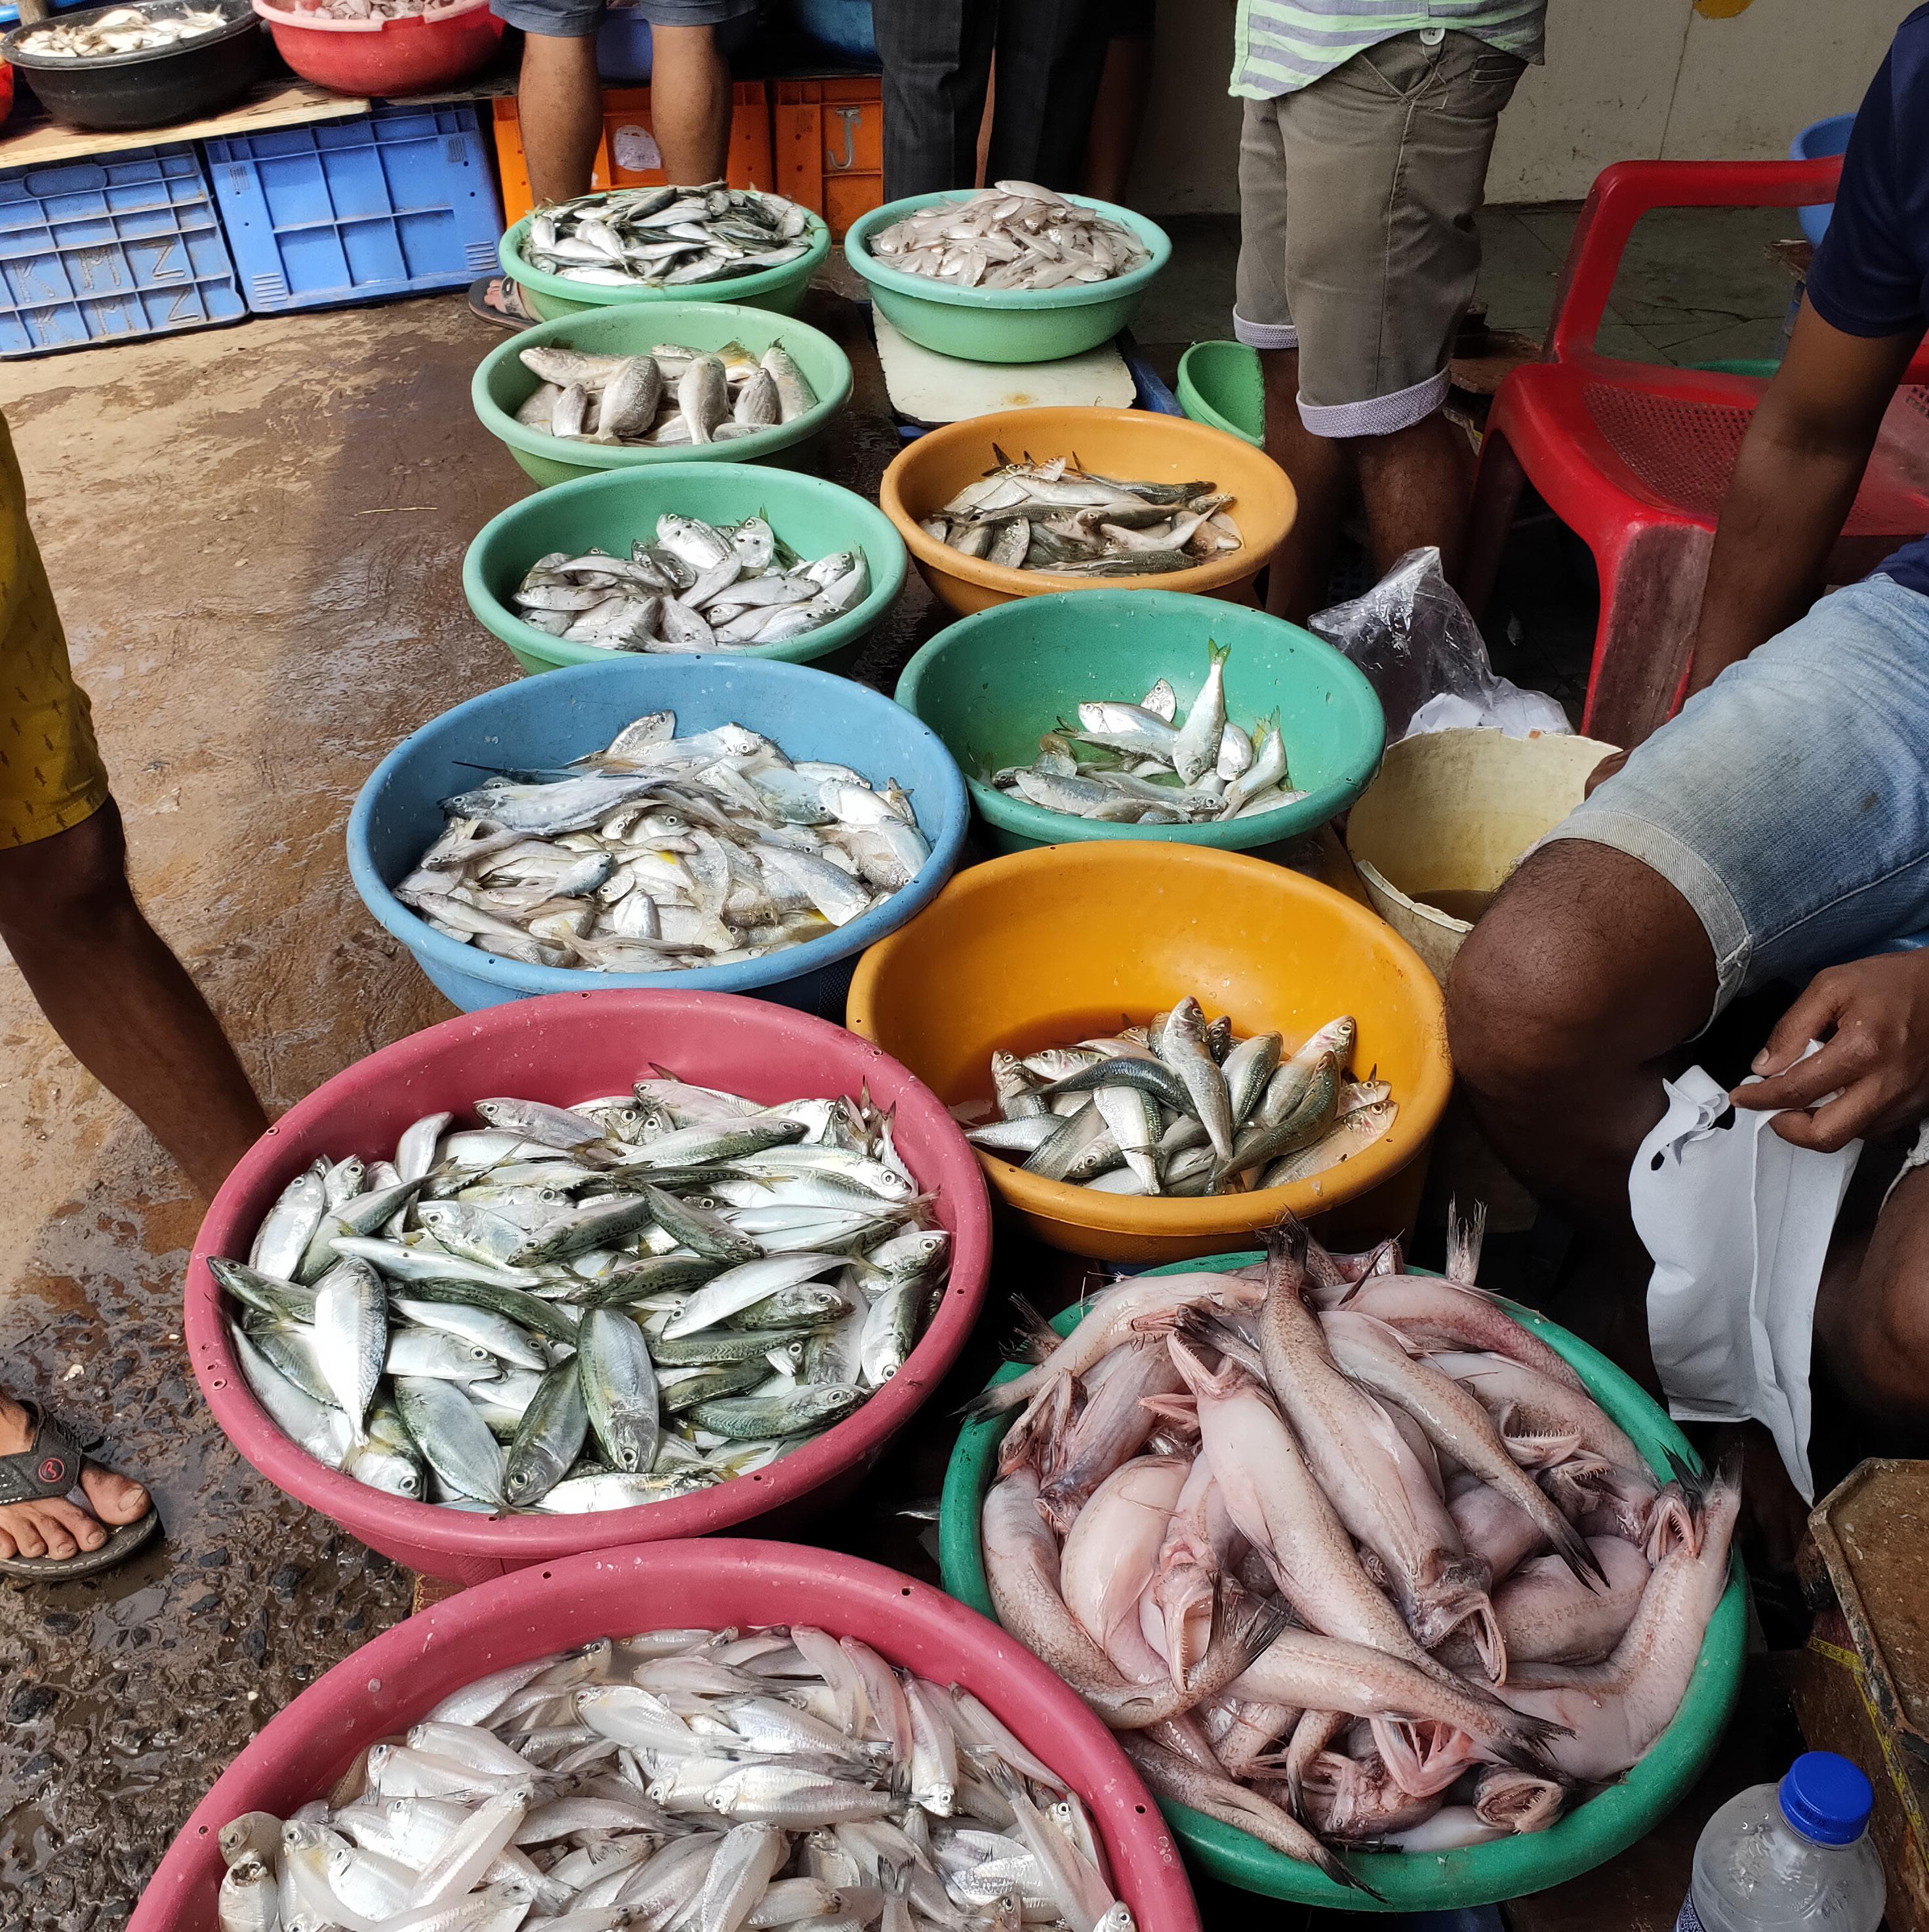
The area of study is composed of three main markets; the fish market, the vegetable market and the old market. The area is supplied daily with fresh produce early in the morning.
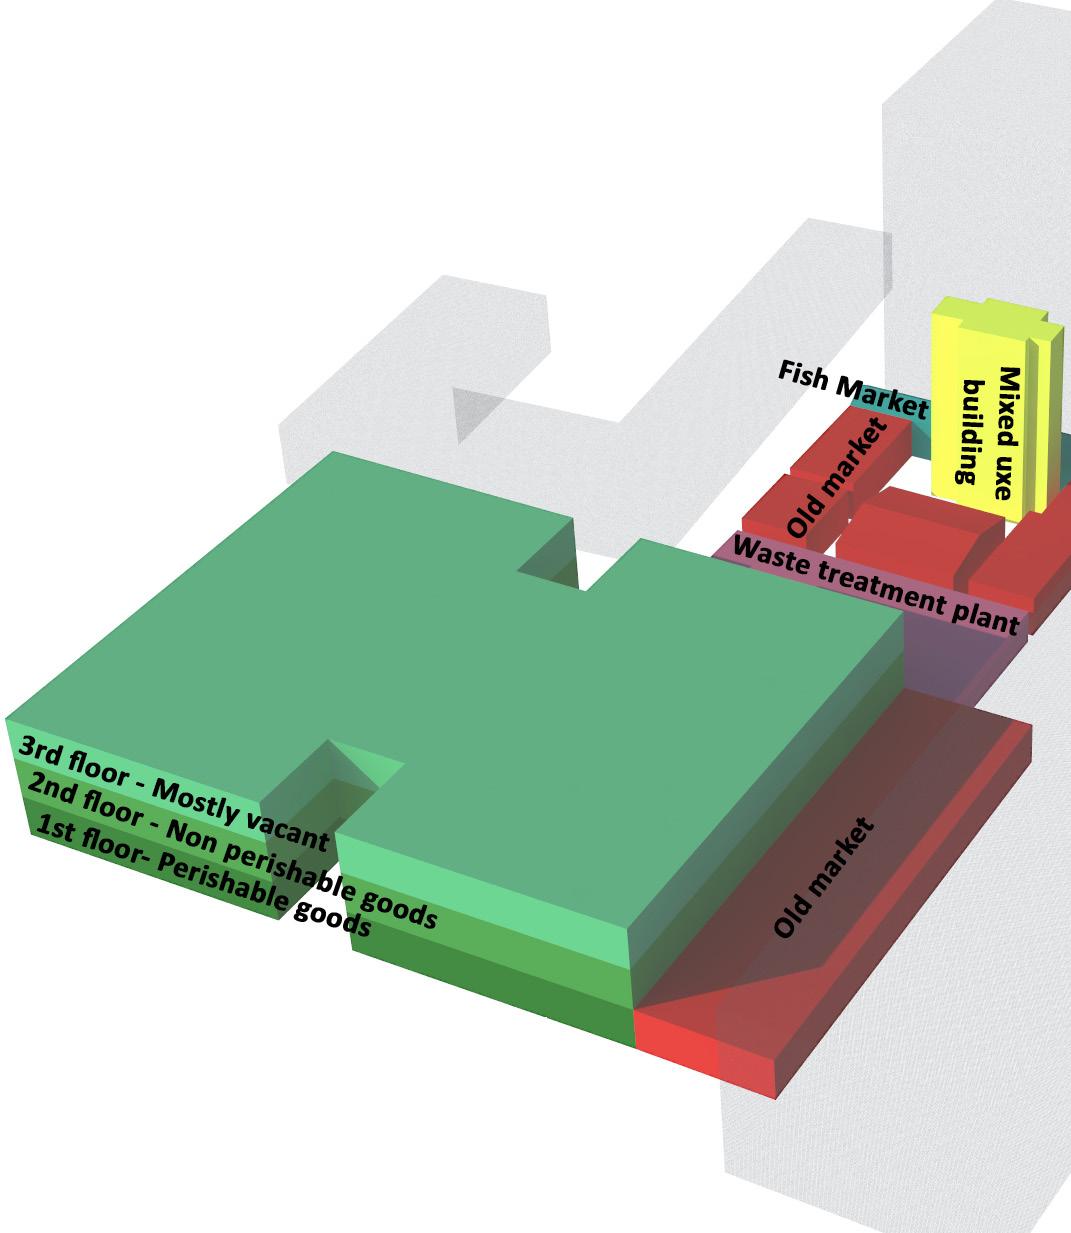
The ground floor of the main market sells perishable goods like vegetables, fruits and flowers. The first floor consists of clothing stalls, local souvenirs, sewing and technology shops. On the east side of this building we have the old market, clothing is the main sold item in this space. Both tourists and locals use this space. On the north is the meat and fish market.
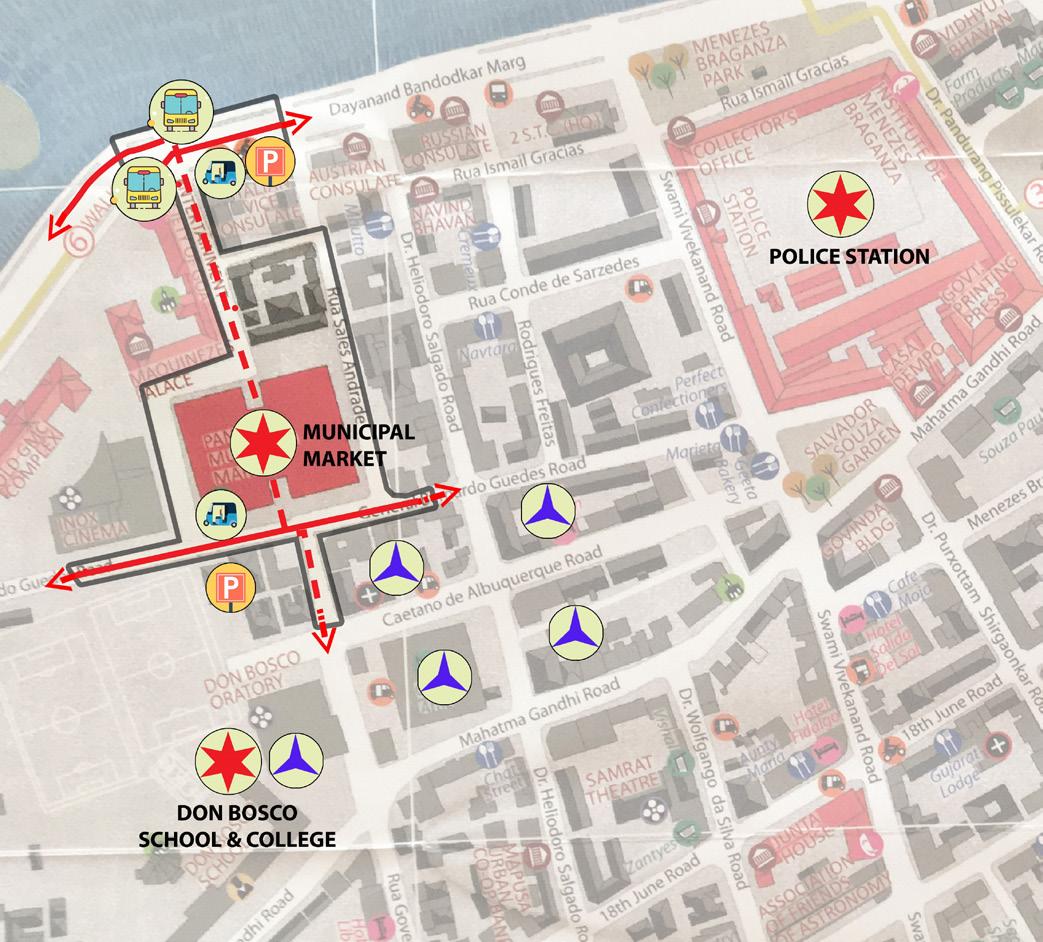
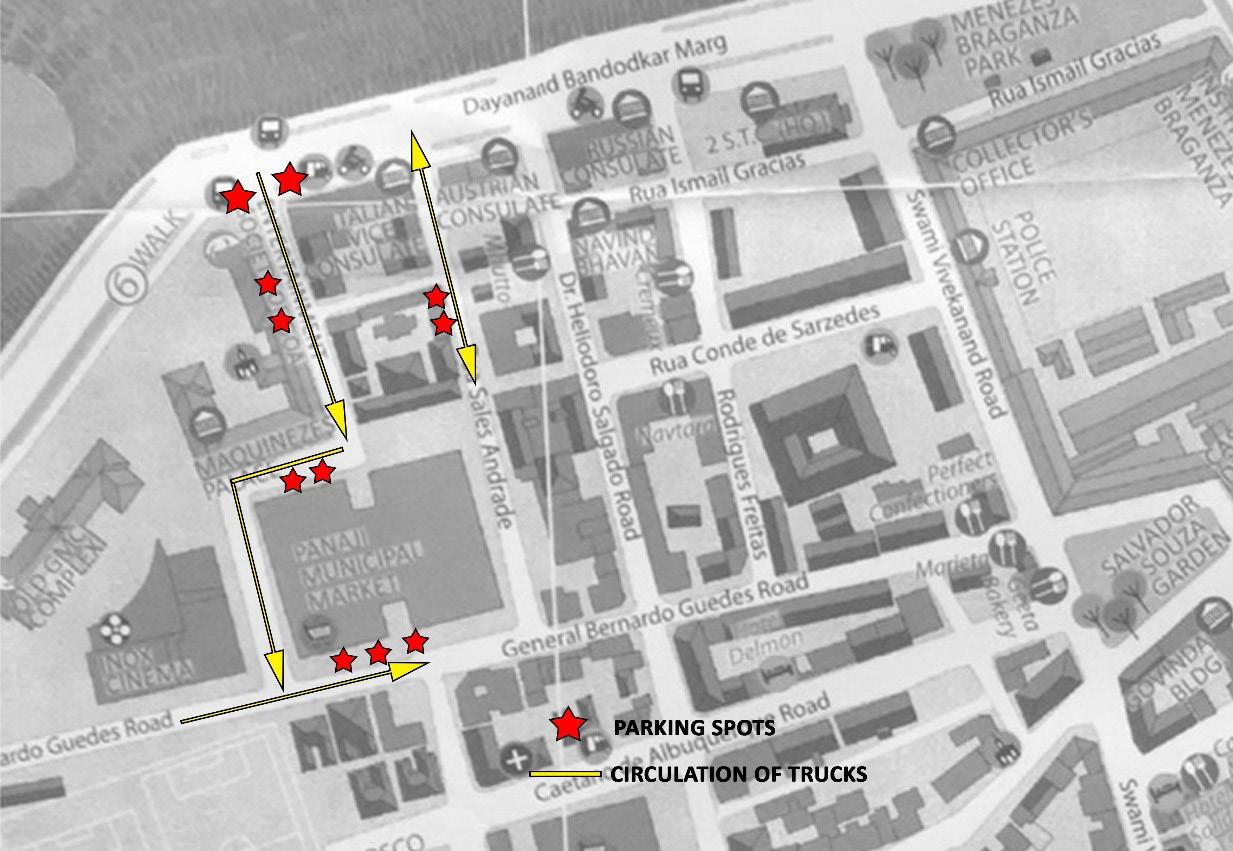
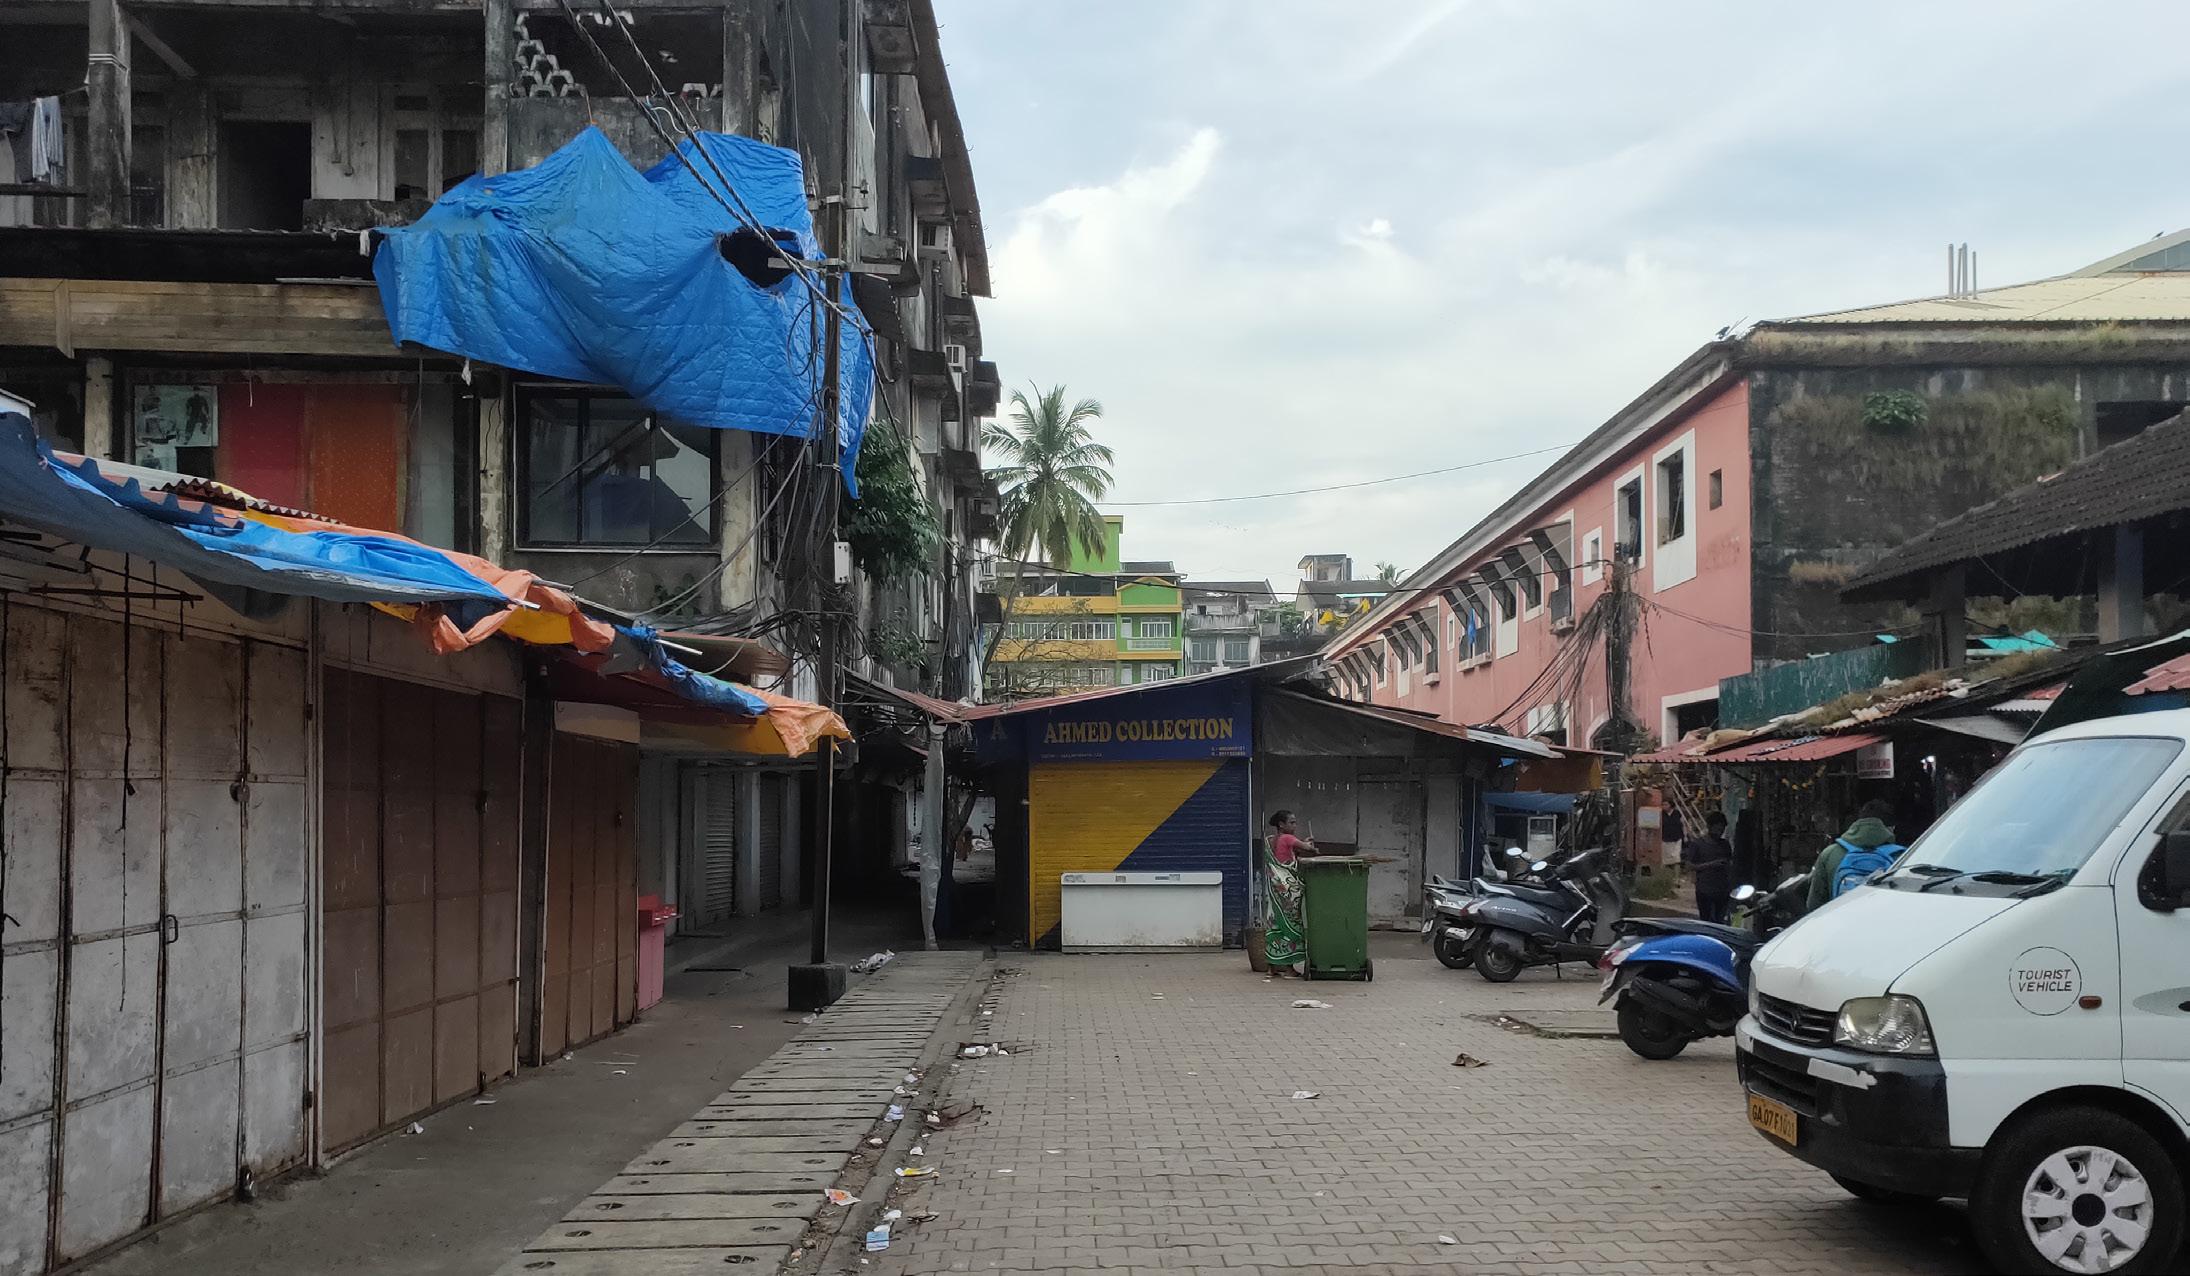
Traffic entering the fish market area mainly consists of vehicles connected to transportation of goods. The majority of these vehicles comes from Dayanand Bandokar Road near the promenade. One road enters from the west side of the fish market and one from the east side. The roads leading to the markets are rather busy in the morning as the fish, meat and vegetable market gets their supplies. Some trucks are parked on the road near the river side as parking spaces are limited closer to the markets. The typical way out after unloading goes on the west side of the municipal market to General Betrnardo Guedes Rd. This road is wider and more accessible from the main road and connected to the CBD.
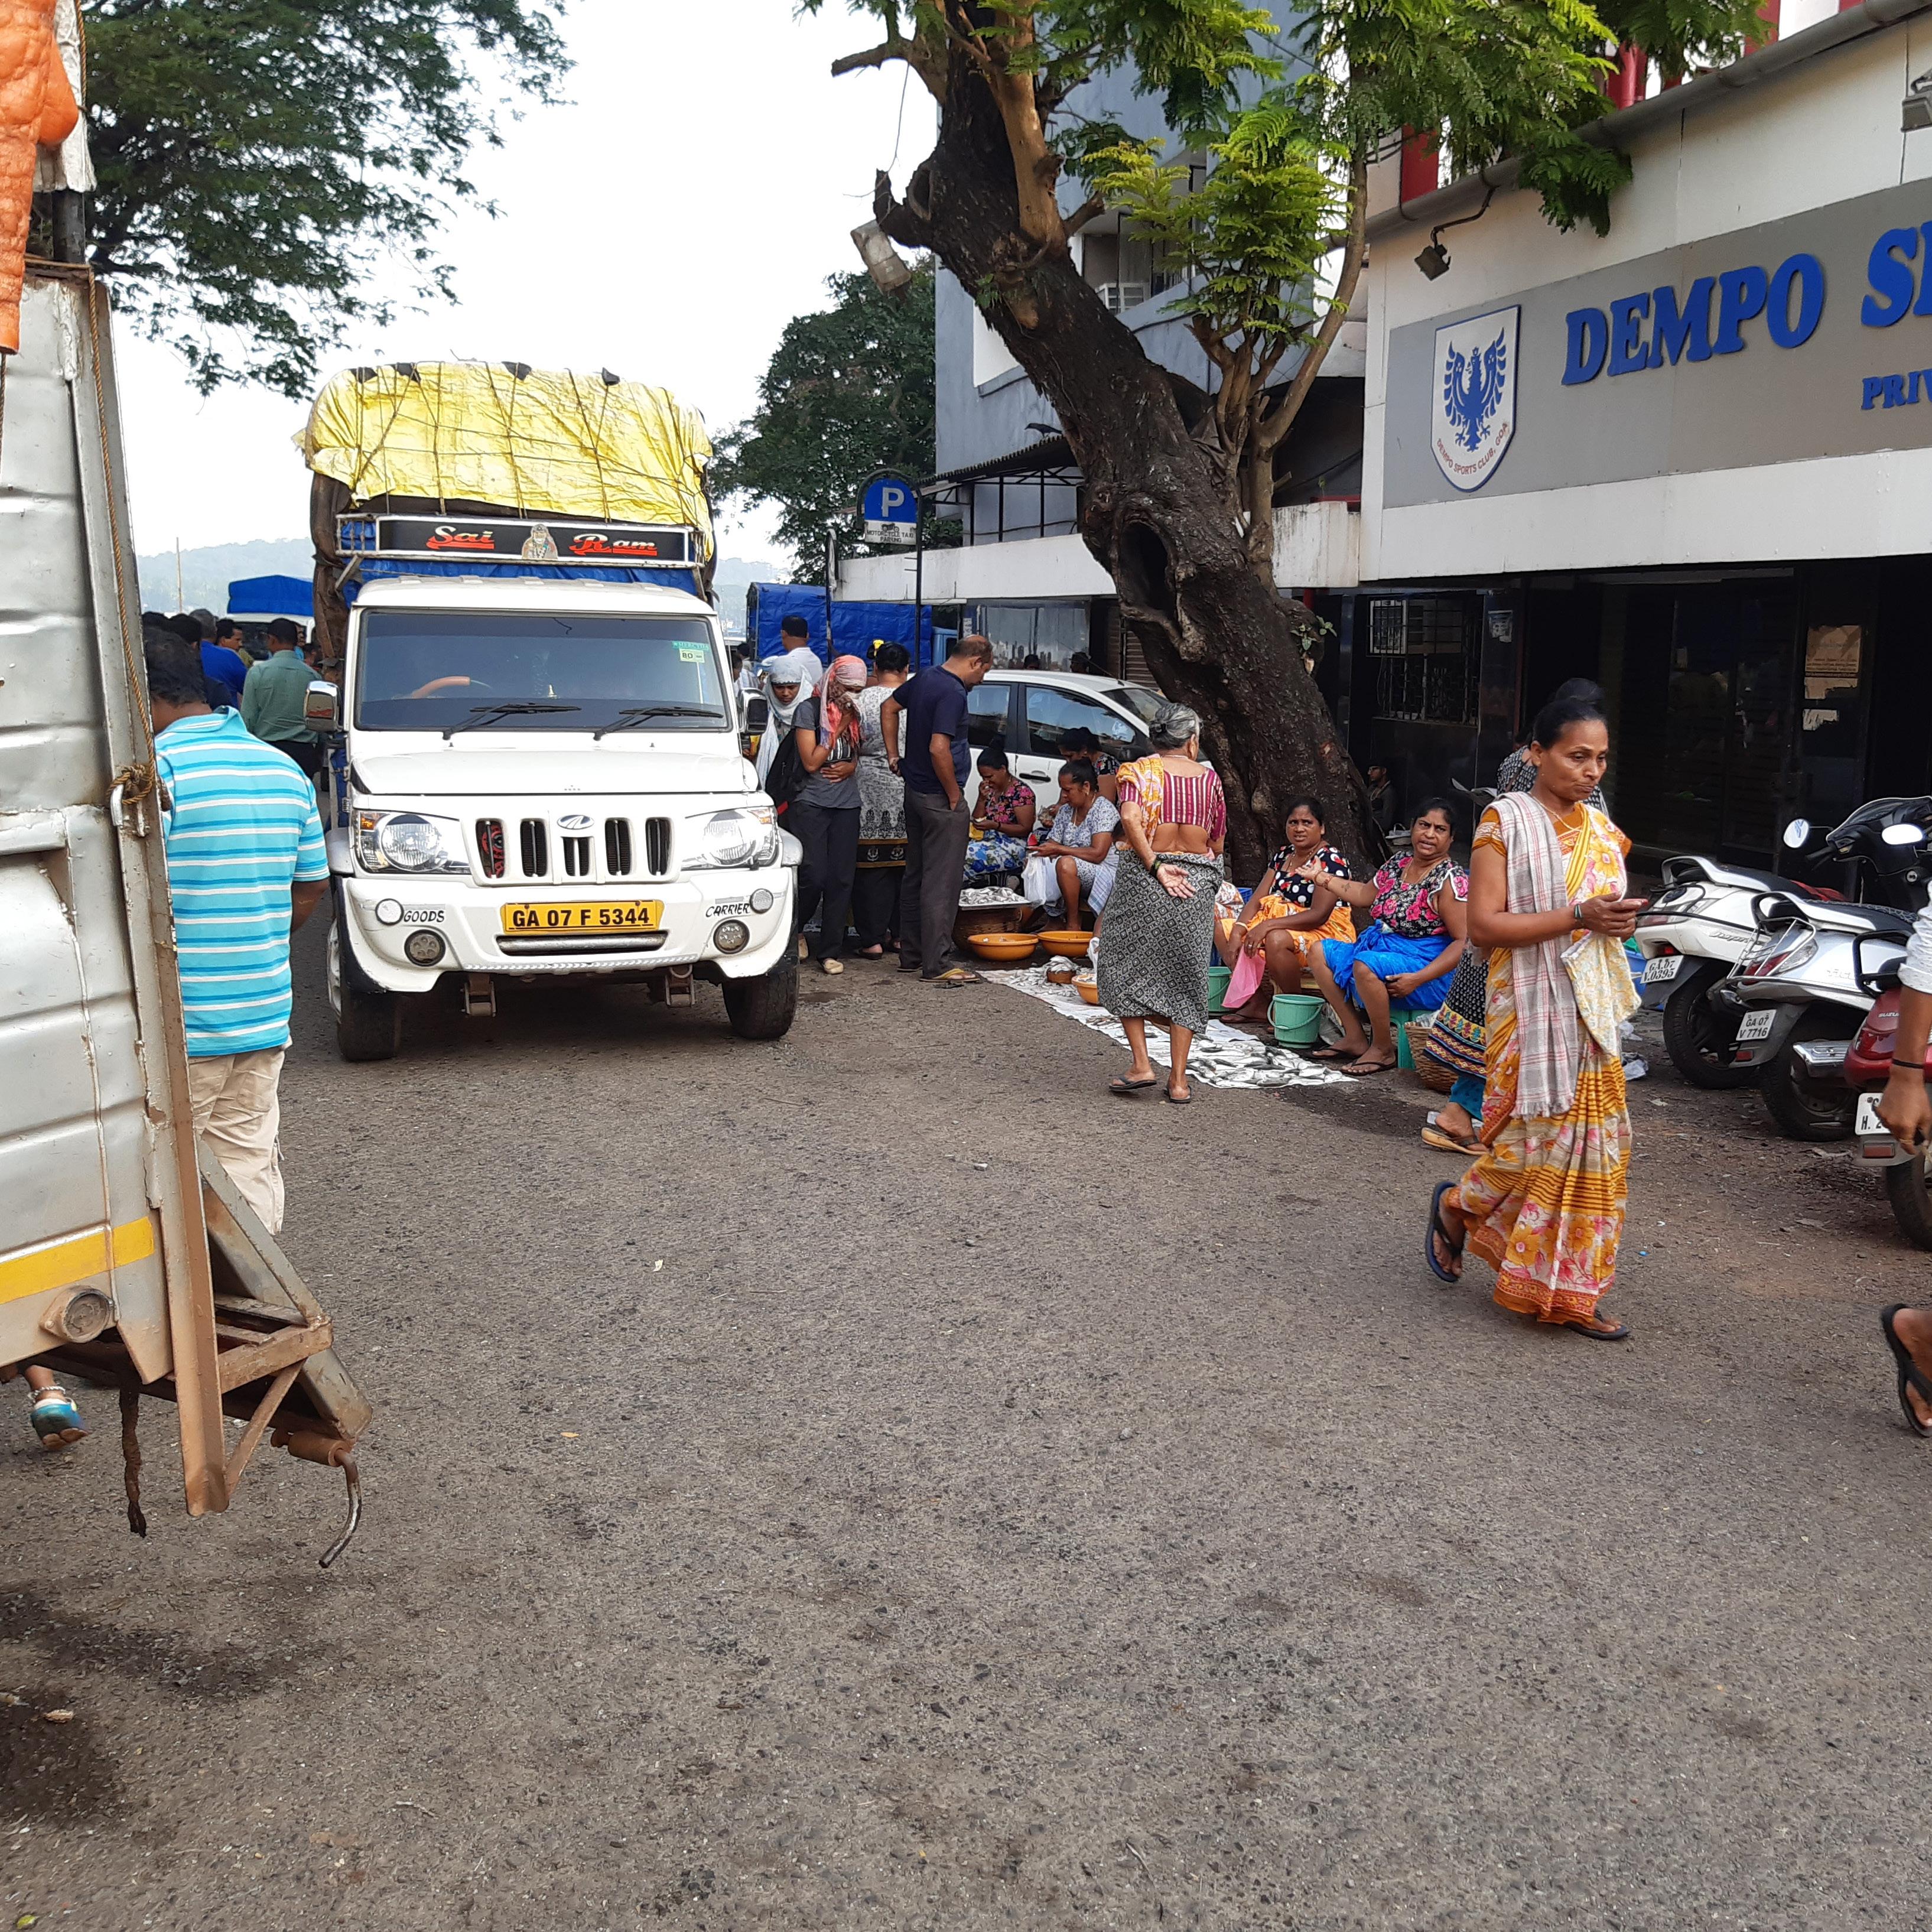


The west road of the fish market is a shared access lane between vehicles and pedestrians. Street vendors occupy the edges of the lane usually in the morning hours selling fishes between parked vehicles. Safety issues has been raised by users as accidents happen due to the high influx of vehicles and pedestrians. The bus stand in the end of the road is one of the main reasons for the high usage of pedestrians. It is convenient for further travel into the CBD. The main road connects the CBD in a straight line as the walkway goes straight through the main municipal market. There are additional options of going around on the periphery of the main market.
The main entrances of the fish market are from west and east connecting the long rectangular space. The old market is in the middle being used by pedestrians and not vehicles. It is a space used substantially less than the mentioned spaces on the sides. It still functions as a connection point between the markets and road network.


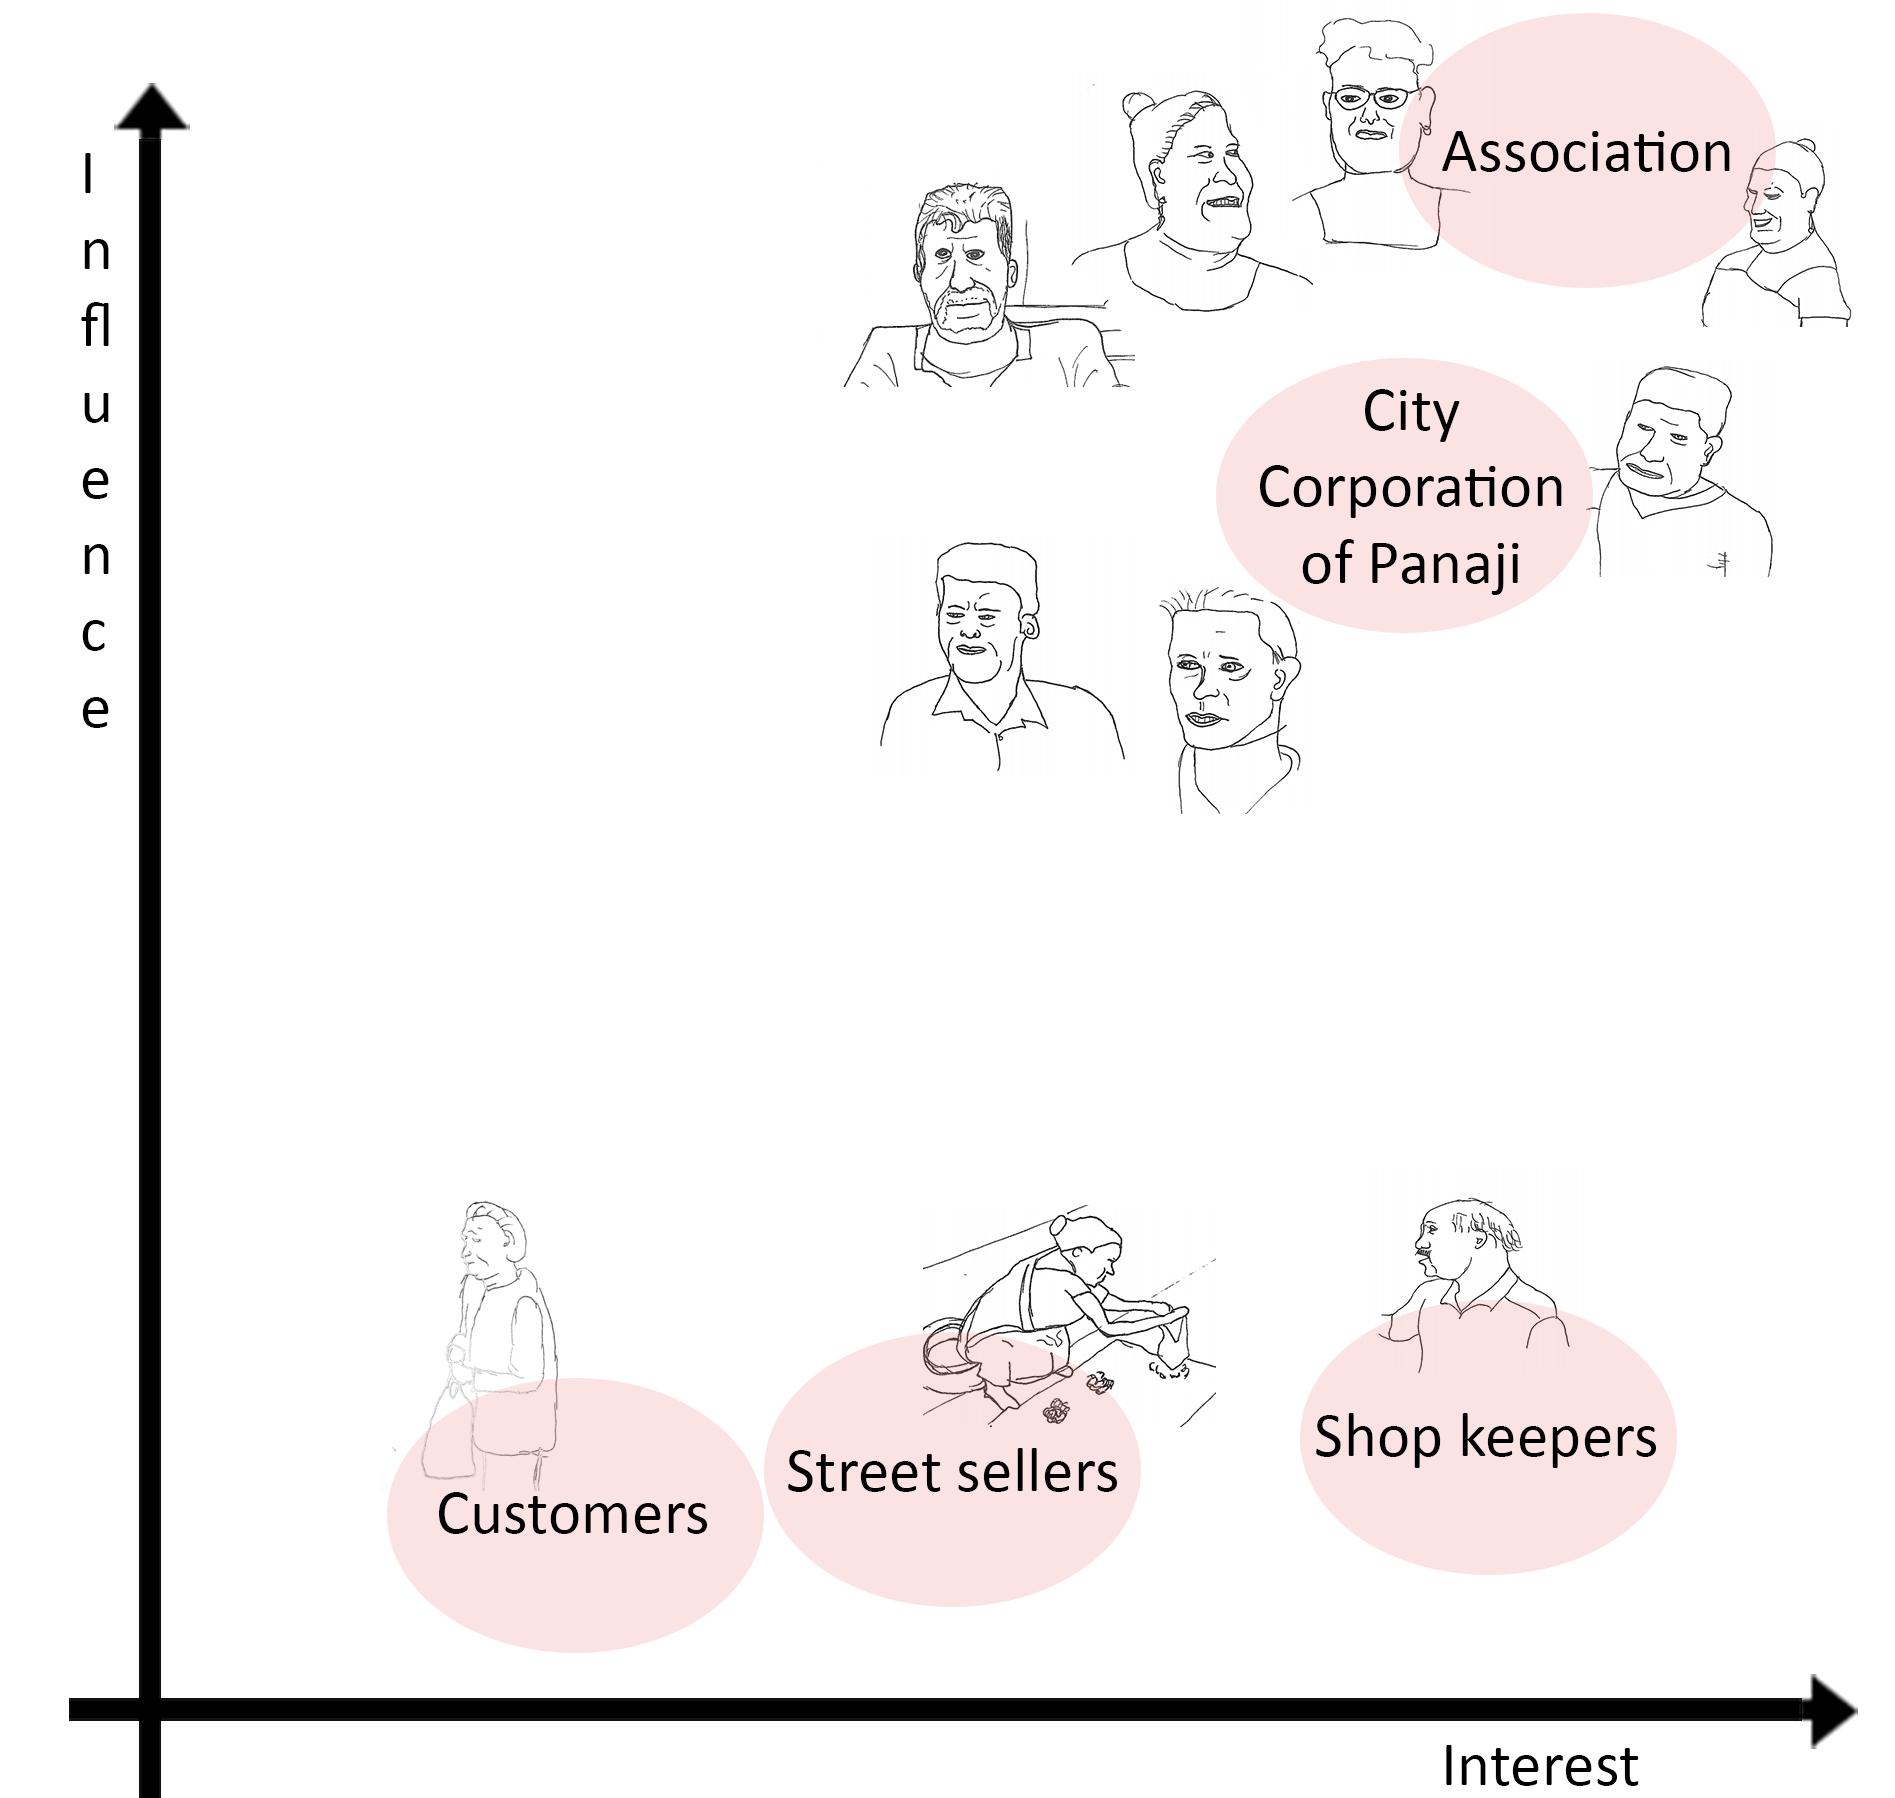
Identification of major stakeholders in the area
Legitimacy
Willingness to engage Influence
Necessity of involvement
- The association consists of 14 members
- We recognize four of them as our main stakeholders.
- They do voluntary work without any salaries.
- They make decisions on the behalf of the shop keepers Rules set by the association is followed by the shop keepers


Legitimacy
Willingness to engage Influence
Necessity of involvement
Includes all the sellers in the fish market and the old market
- They pay rents to CCP.

- The ones in the old market are not directly connected to any association
The ones in the fish market are part of the fish market association.
Legitimacy
Willingness to engage Influence
Quick facts
- The government owns the market and they have a lot of influence on functioning of the market.
- We also recognize the inspectors of the market as stakeholders as they have good connections with the people in the market.
They have daily routines of inspection and cleaning in the market.
Necessity of involvement Attributes Contribution
Legitimacy
Willingness to engage Influence
Necessity of involvement
- They sit out on the road and sell mostly early hours of the morning.
- They also pay rent to CCP and are not part of the fish market association.


and
the

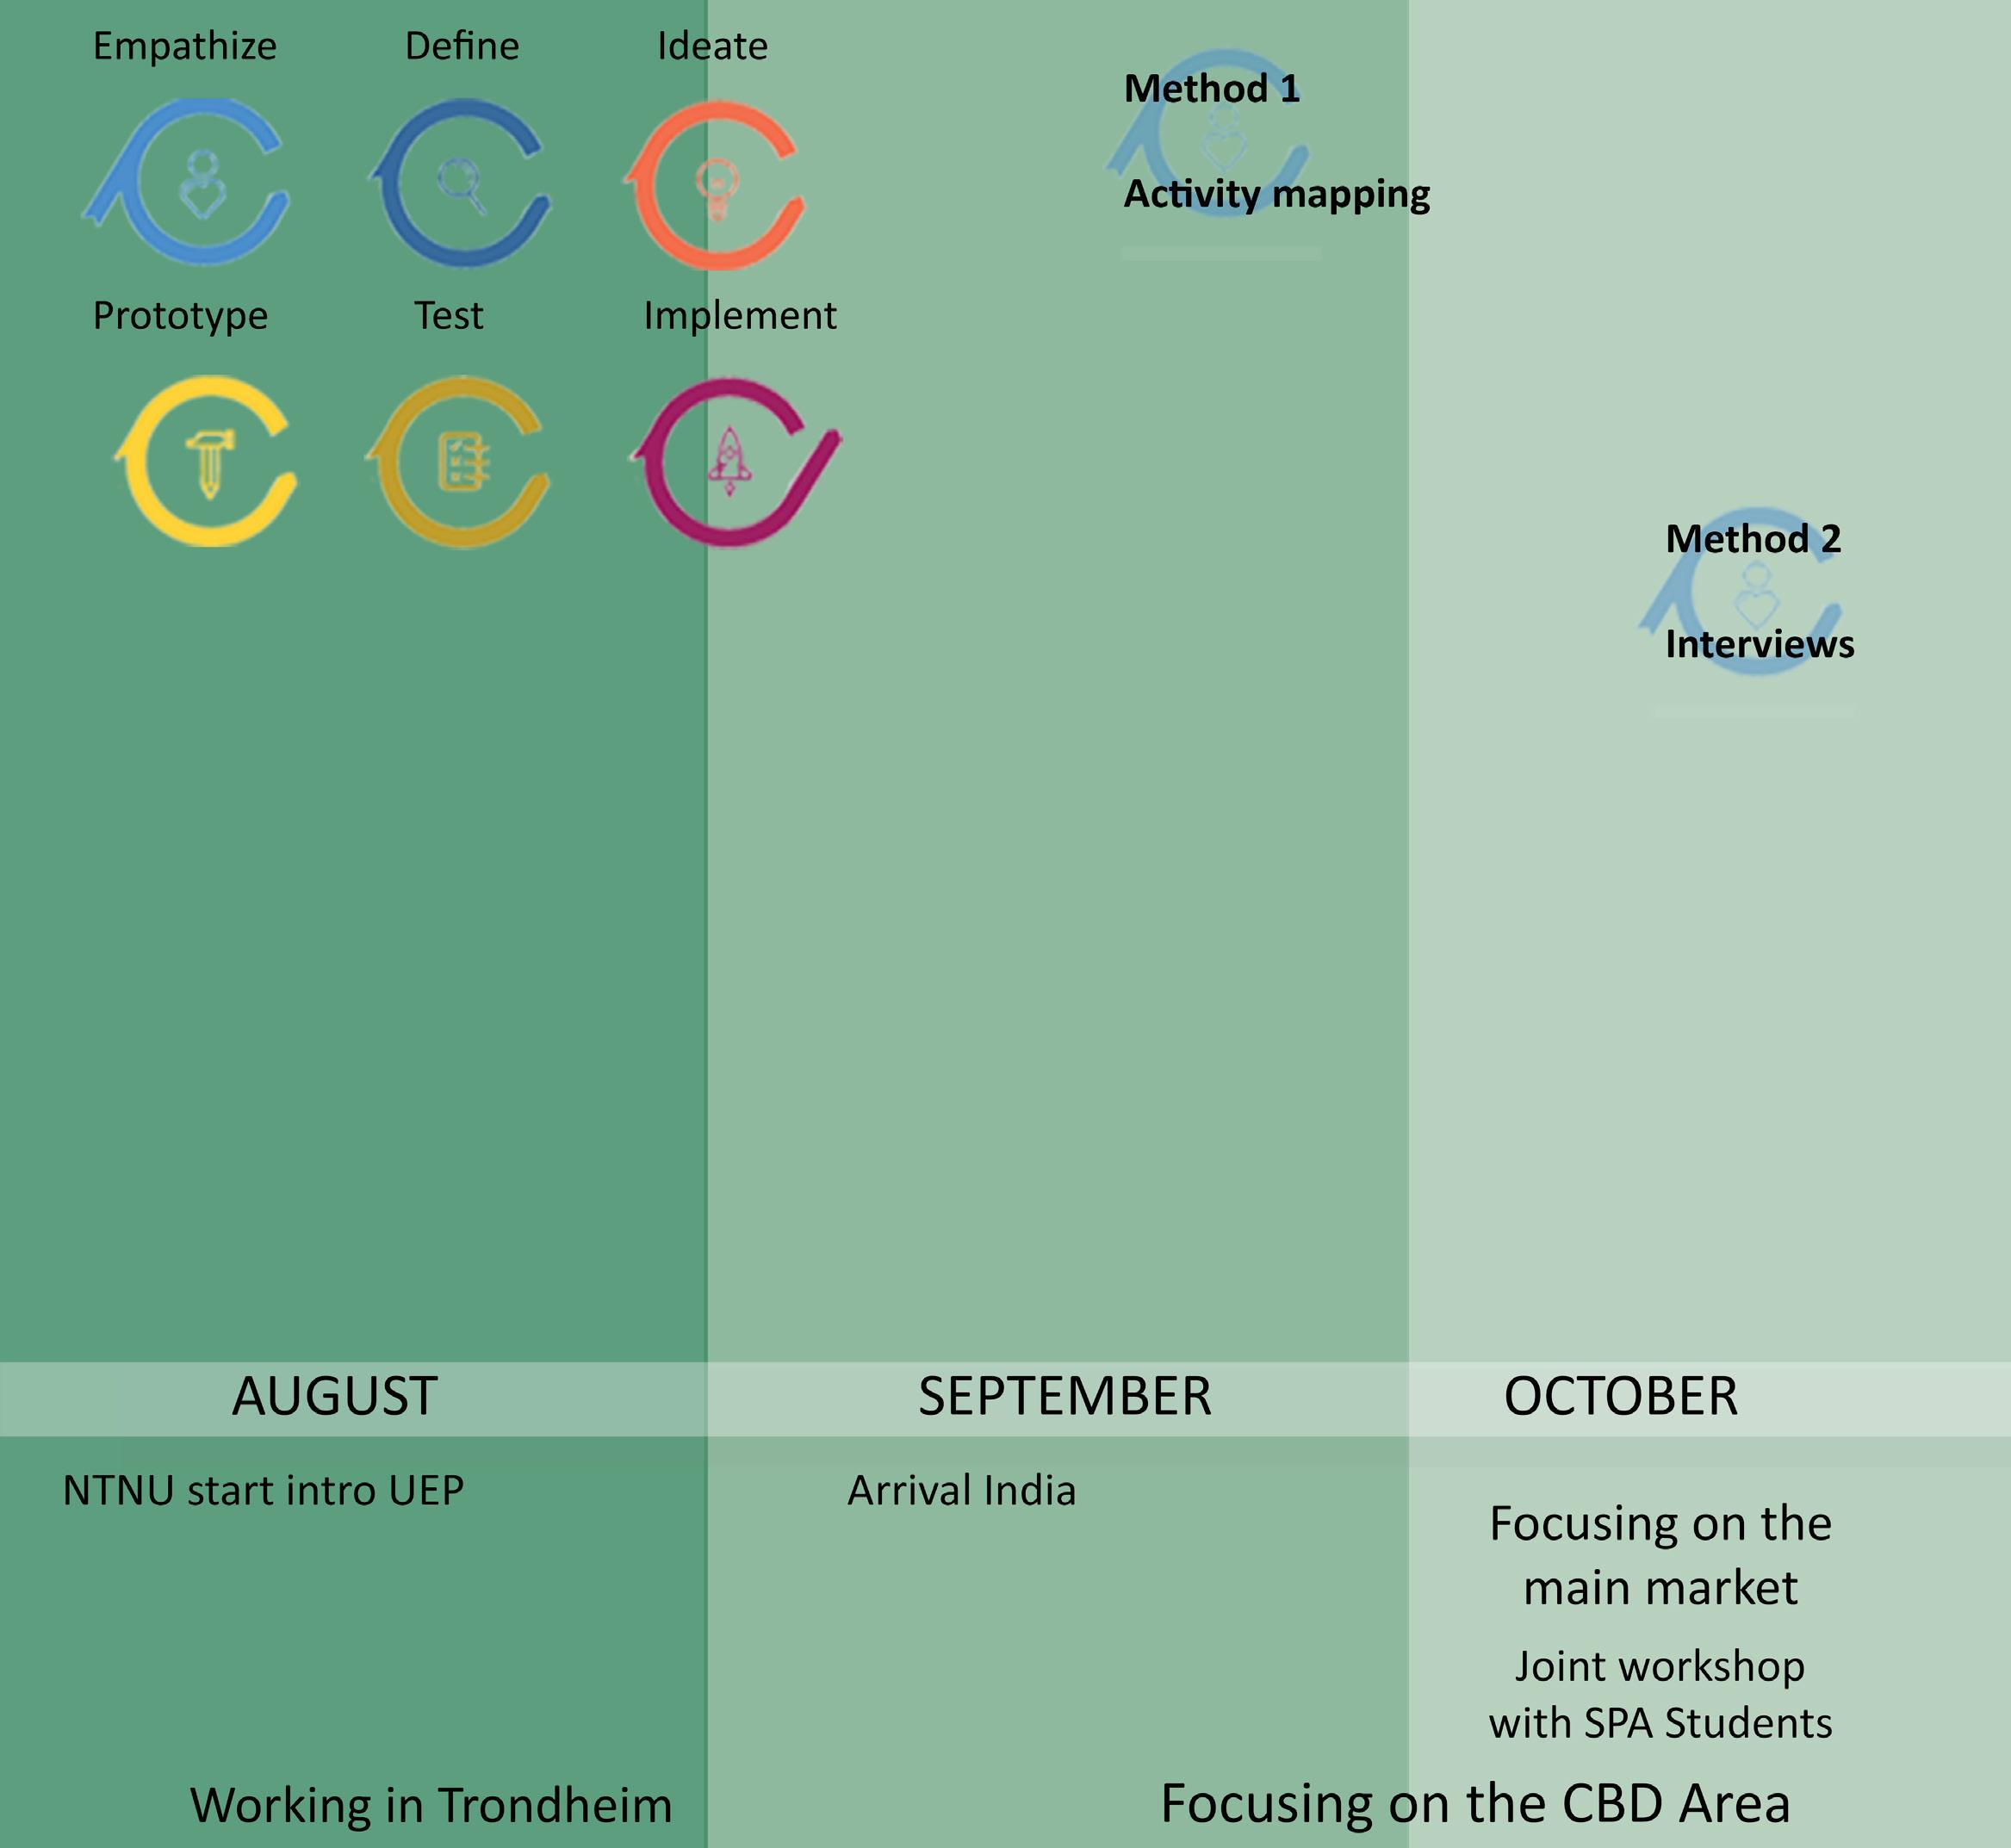
Starting to work within the Central Business District (CBD) area we were overwhelmed by the scale and complexity of stakeholders and their relationships. We started broad by observing and getting information by the inhabitants to shape an image of the area. It was Method 1 Activity Mapping with the inhabitants that led us into studying the market. We saw that it was an area of interest to a majority of the locals, however, their opinions seemed to vary. Many people marked the market as their favorite place, surprisingly, many people also stated that the market was their least favorite space. We needed to figure out why there were so many opinions about this area. When we checked online the market was mentioned in several tourist guides as an attraction. These facts state a potential and importance of the market to the city.
The shift from the new market to the old market
In the beginning of our process we studied all the markets (vegetables, fish, meat, old market) and its connectivity. We started with the vegetable market, the most used building in the market. The market and its land is owned by the municipality and the shopkeepers can lease it, but the vendors pay a daily rent with no leases. They are provided identification card by the municipality that gives them permission to sell in the market. Cleaning and parking were the main issues that needed improvement according to the users.
After talking with shopkeepers we found out that the lease was under consideration. There were conflicts with the lease tenure between the municipality and
the shopkeepers. We tried to contact the municipality for further details but we were told to be cautious with the legal tensions. The fact that our work facility was inside the building of Smart Cities was another political dilemma that could cause more tension. We decided to explore other potentials of the market.
Exploring the old market we found discussions regarding redevelopment. The old market feels like it is left to decay due to lack of maintenance as there are plans to demolish and redevelop this space. The market lies besides a major pedestrian access route of the CBD area and it does not tap into the potential of high pedestrian traffic. During Method 6 Express your experience, we came across an association in the fish market. The fish market association handles legal and social issues concerning the people that work inside the fish market. We went on exploring the relations between social and physical aspects of the old and the fish market.
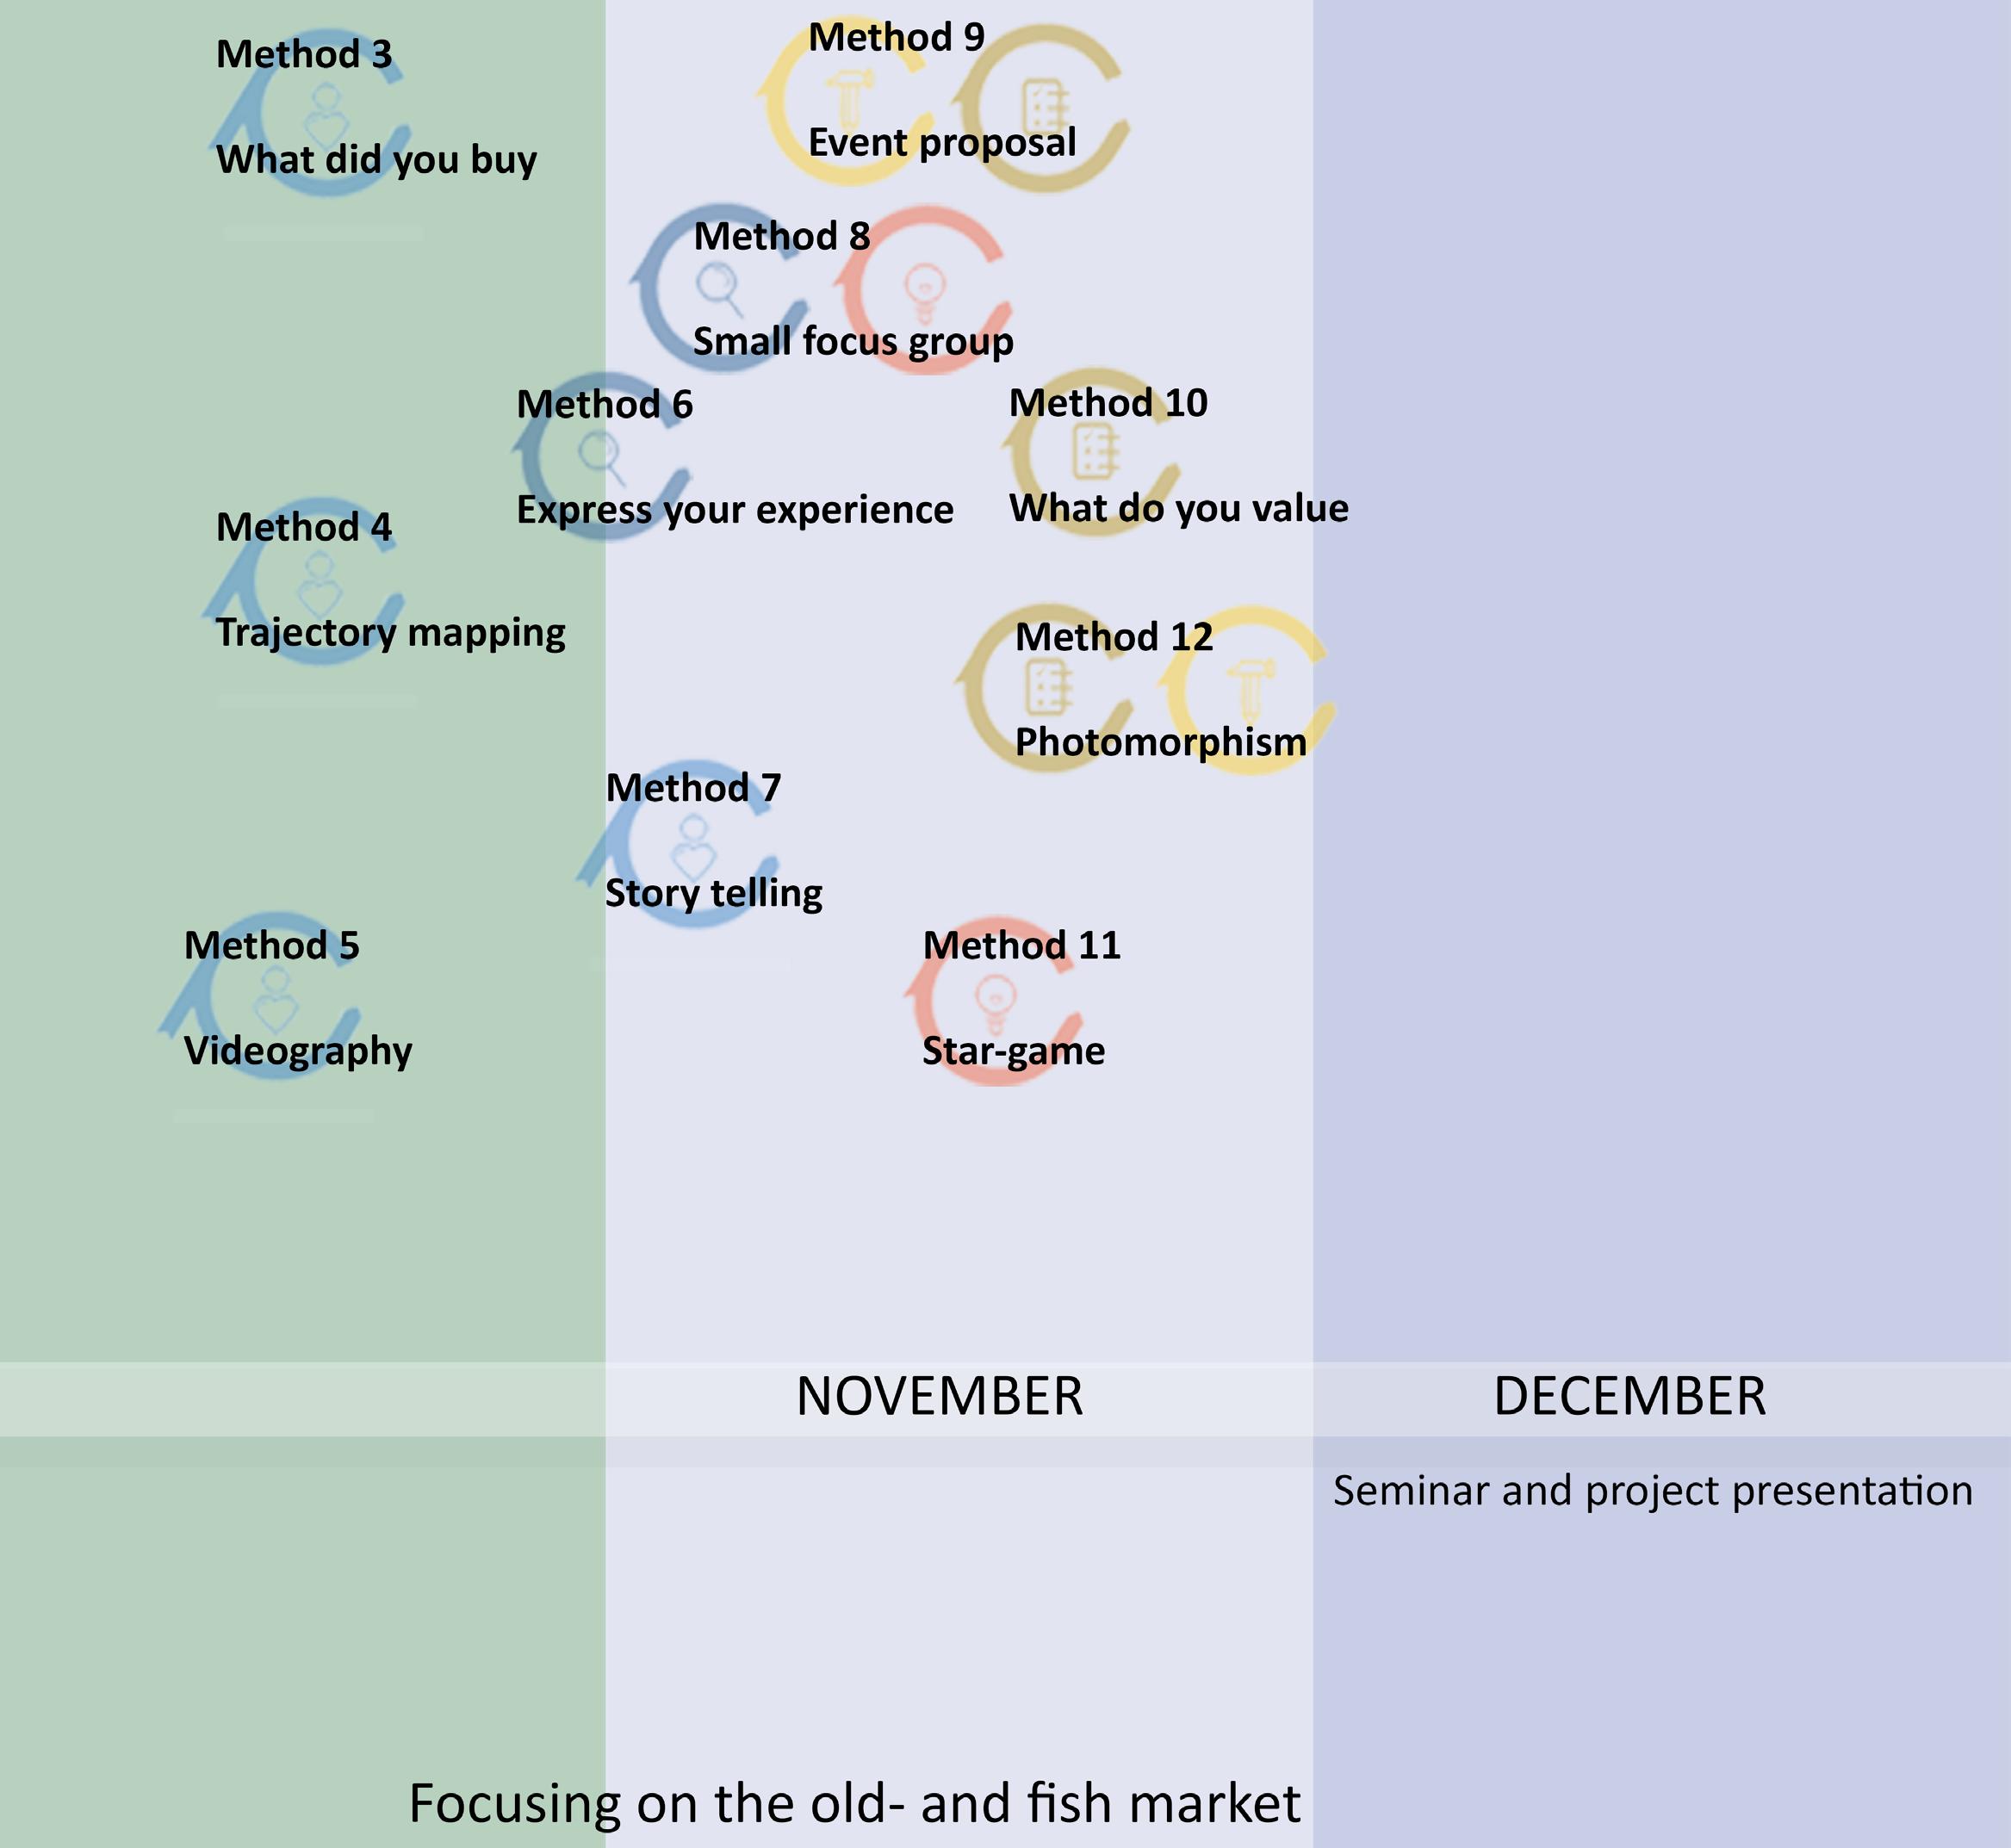
In each and every method we have implemented, we wanted the whole community to be involved. We have used several methods: the classical interviews, an organization of a participatory meeting and implementation of graphical methods. We will them chronologically as one method led us to another in our research process.
For all the methods we have implemented or we plan to implement, we have tried to answer these questions: Why is this particularly relevant? / What results want from it? How will people react to it? Which results did from?
We start with the initial method of trying to find the area of interest.

This method was our first activity which aimed at understanding the CBD area through the initial thoughts of users. We placed a map of the CBD area on a post in a busy street close to the Immaculate Conception Church. We asked people walking by to put post-it notes on the map for the places they liked and disliked the most in the area and tell us reasons for their choices.
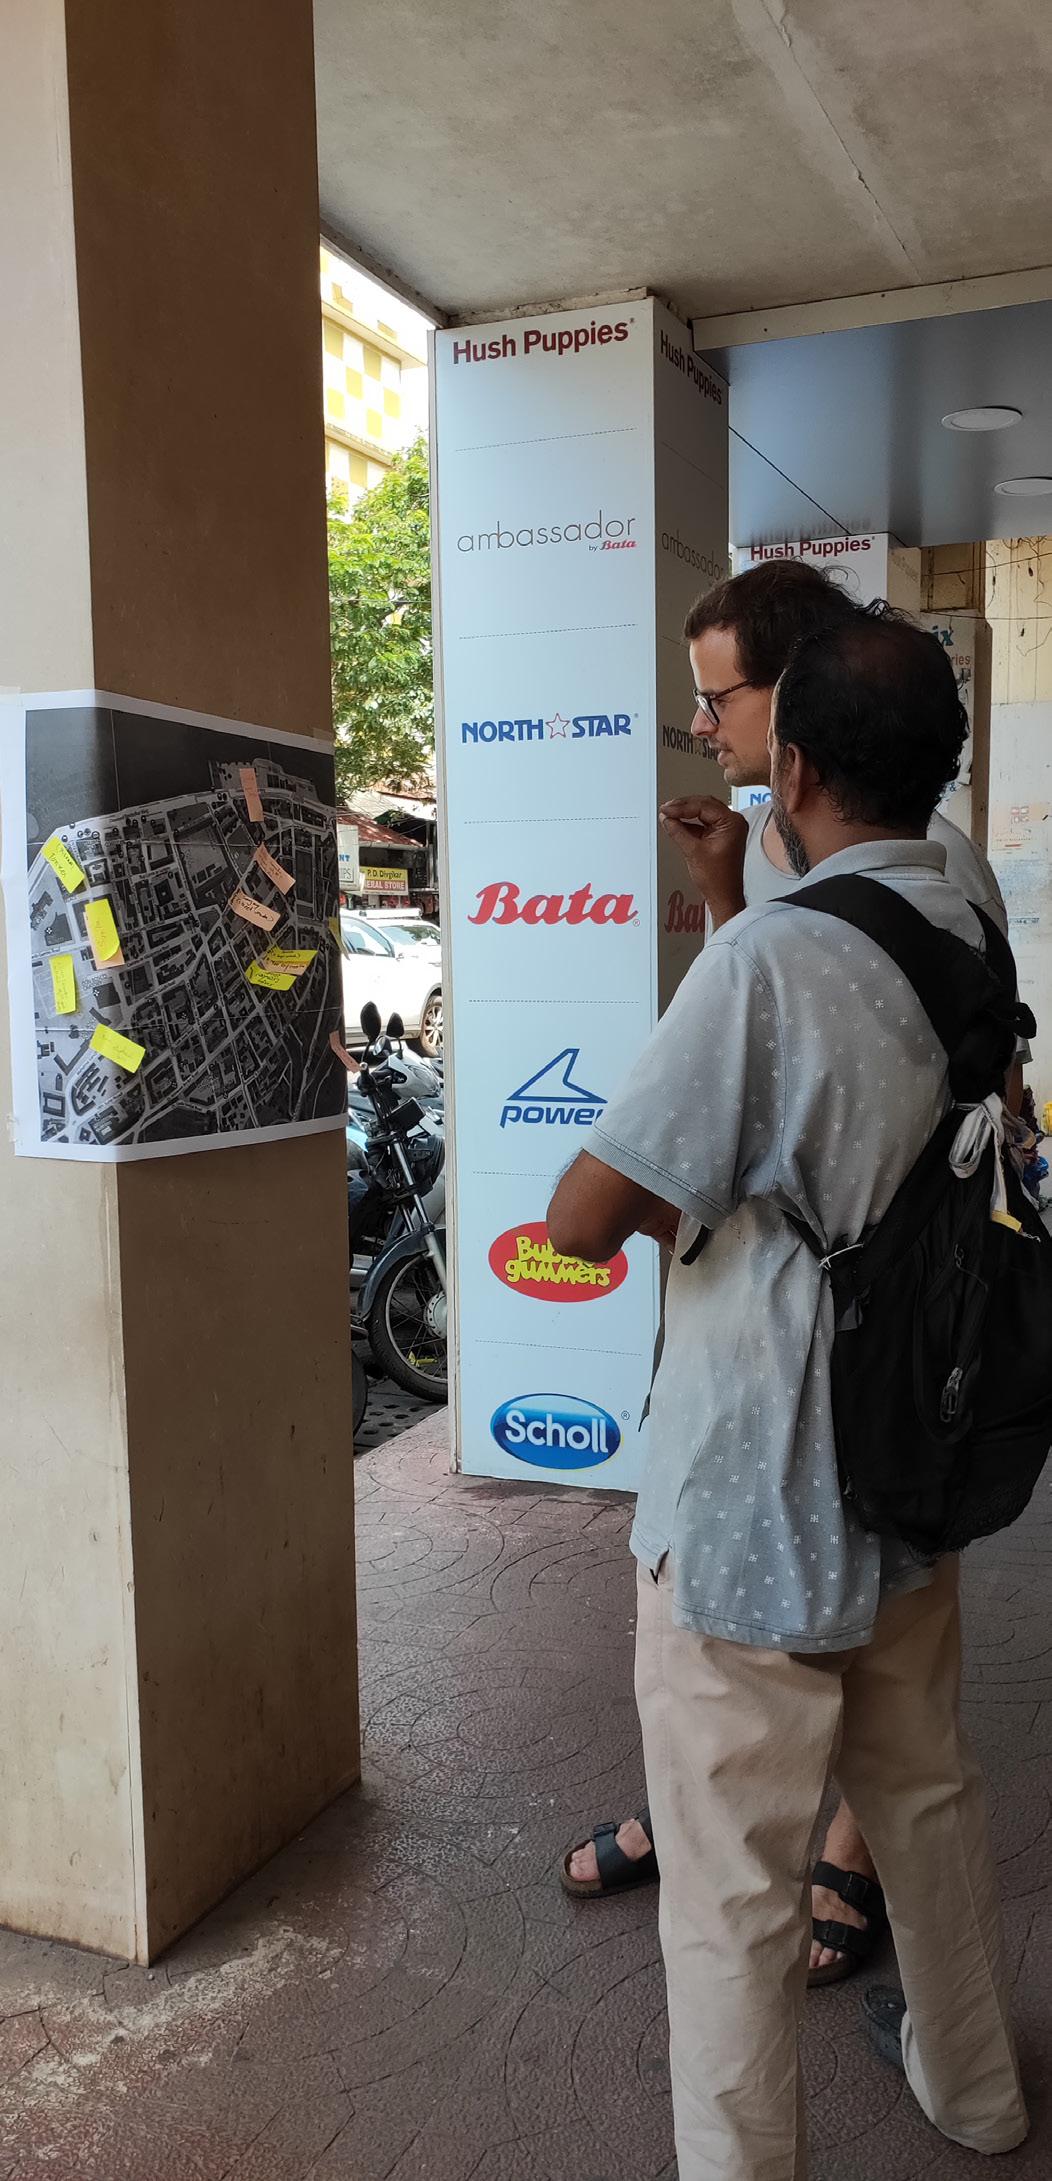
One challenges with this exercise was their ability to read maps. Even though we used a map with limited information and highlights of landmarks in red. We still had to point out the landmarks to explain the geographical area we were studying. We think that pointing out landmarks affected their perception on choosing areas related to those landmarks. People tended to mention spaces close to the location of our exercise.
The market and the church got the most post-it notes during this exercise. Interestingly people had divided opinions about the market. Many people told us that they frequently used the market but that they had issues with it.
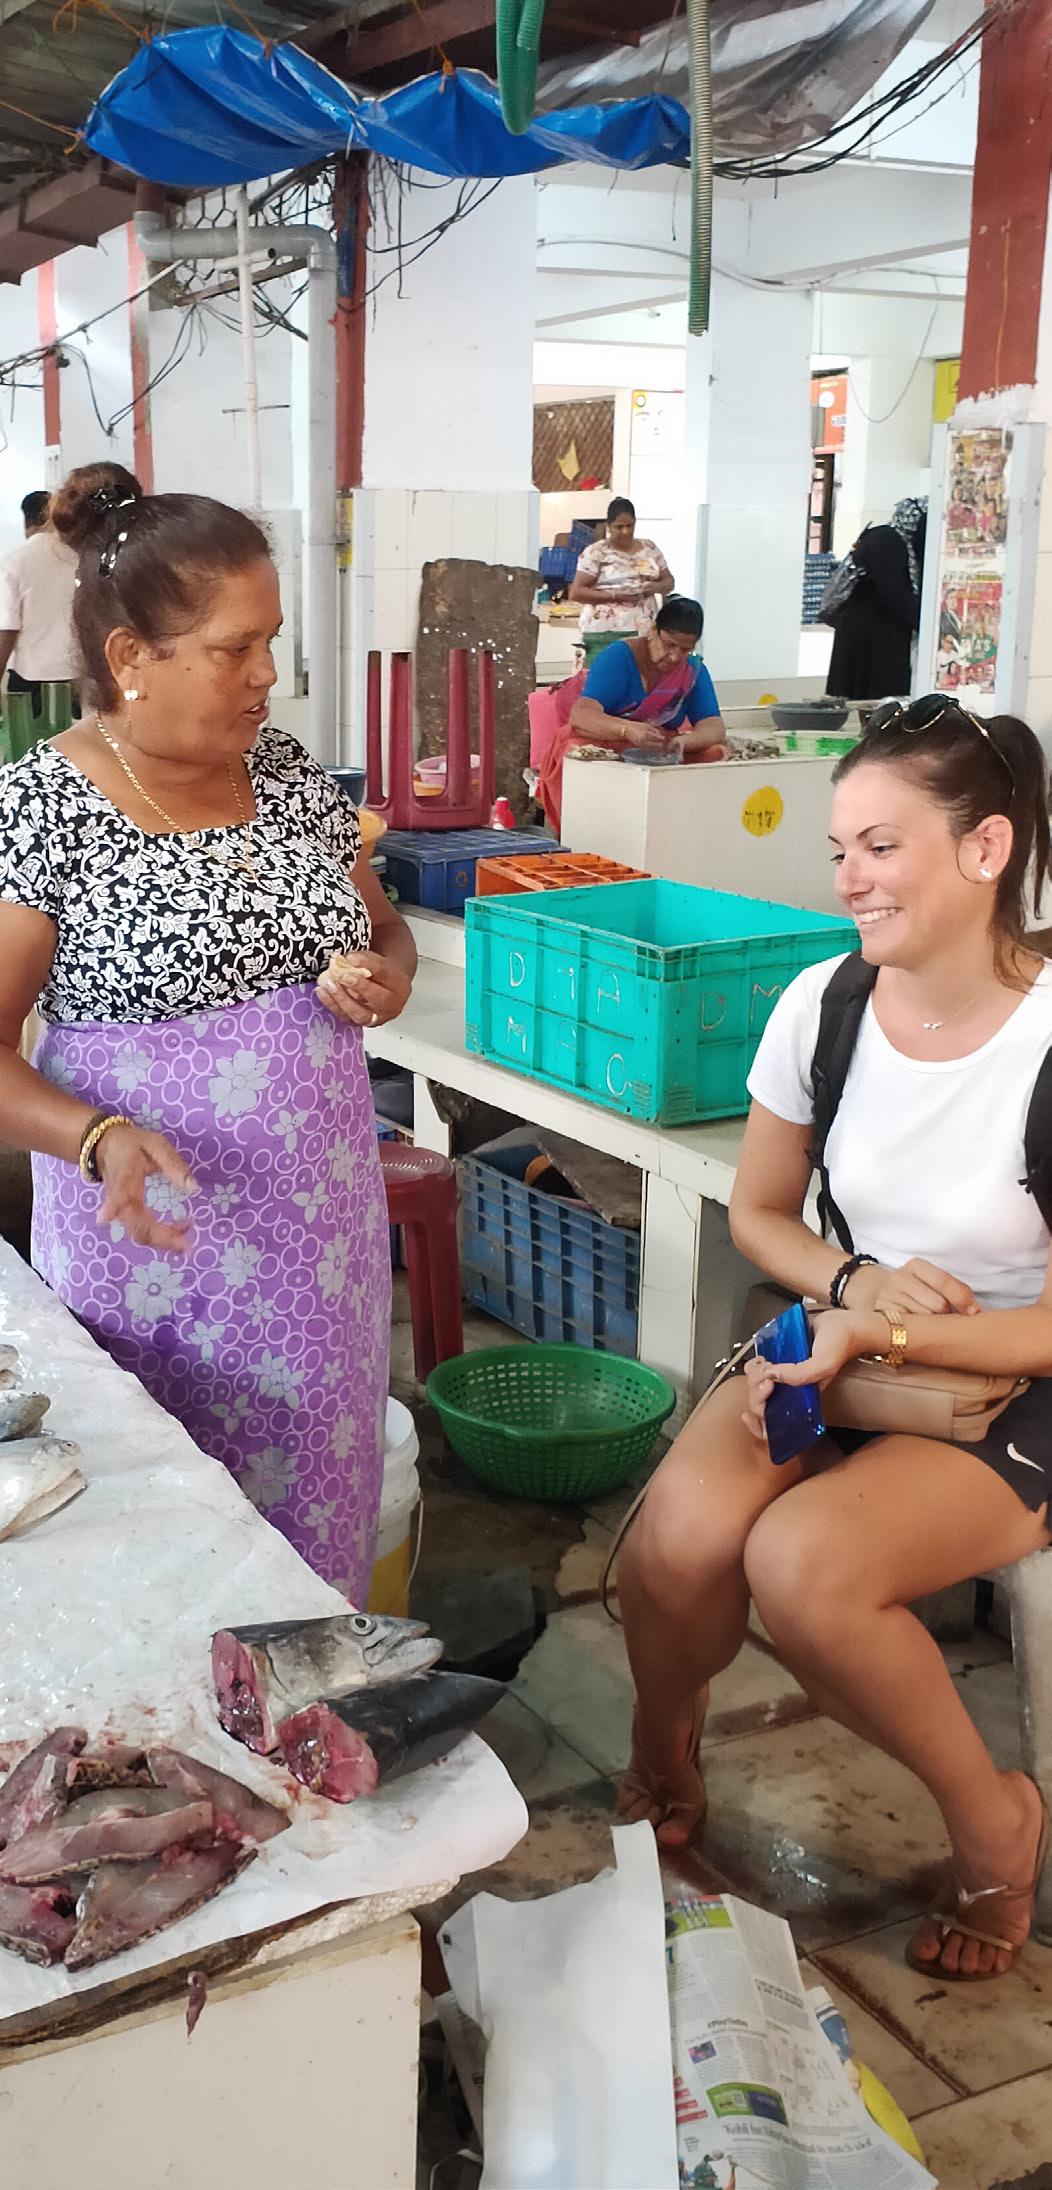
This method aimed at empathizing the community of the market. We used this method at different stages of the process. We interviewed several people and stakeholders in the CBD before moving on to the market area. We started with broad informal interviews with everyone in the market area. We shifted to the sellers on the later stage in the vegetable market and moved on to the customer/users of the space. We also interviewed the municipality as they are a major stakeholder in the market. When we shifted to the old market as an area of interest we repeated the same process.
There were no major challenges interviewing the customer and the sellers. We managed to have one interview with the government. However, due to the tension between the municipality and the sellers, we were told not to go back for further discussions.
We got the general understanding of how the market and people work in the area, what their experiences and issues were with the area.
This method was aimed at understanding the spaces in the market at different times of the day. We stood with video cameras at fixed points in the market at different times of the day.
Covering the whole day is too time consuming.
Spatial understanding and shifts at different times of the day.
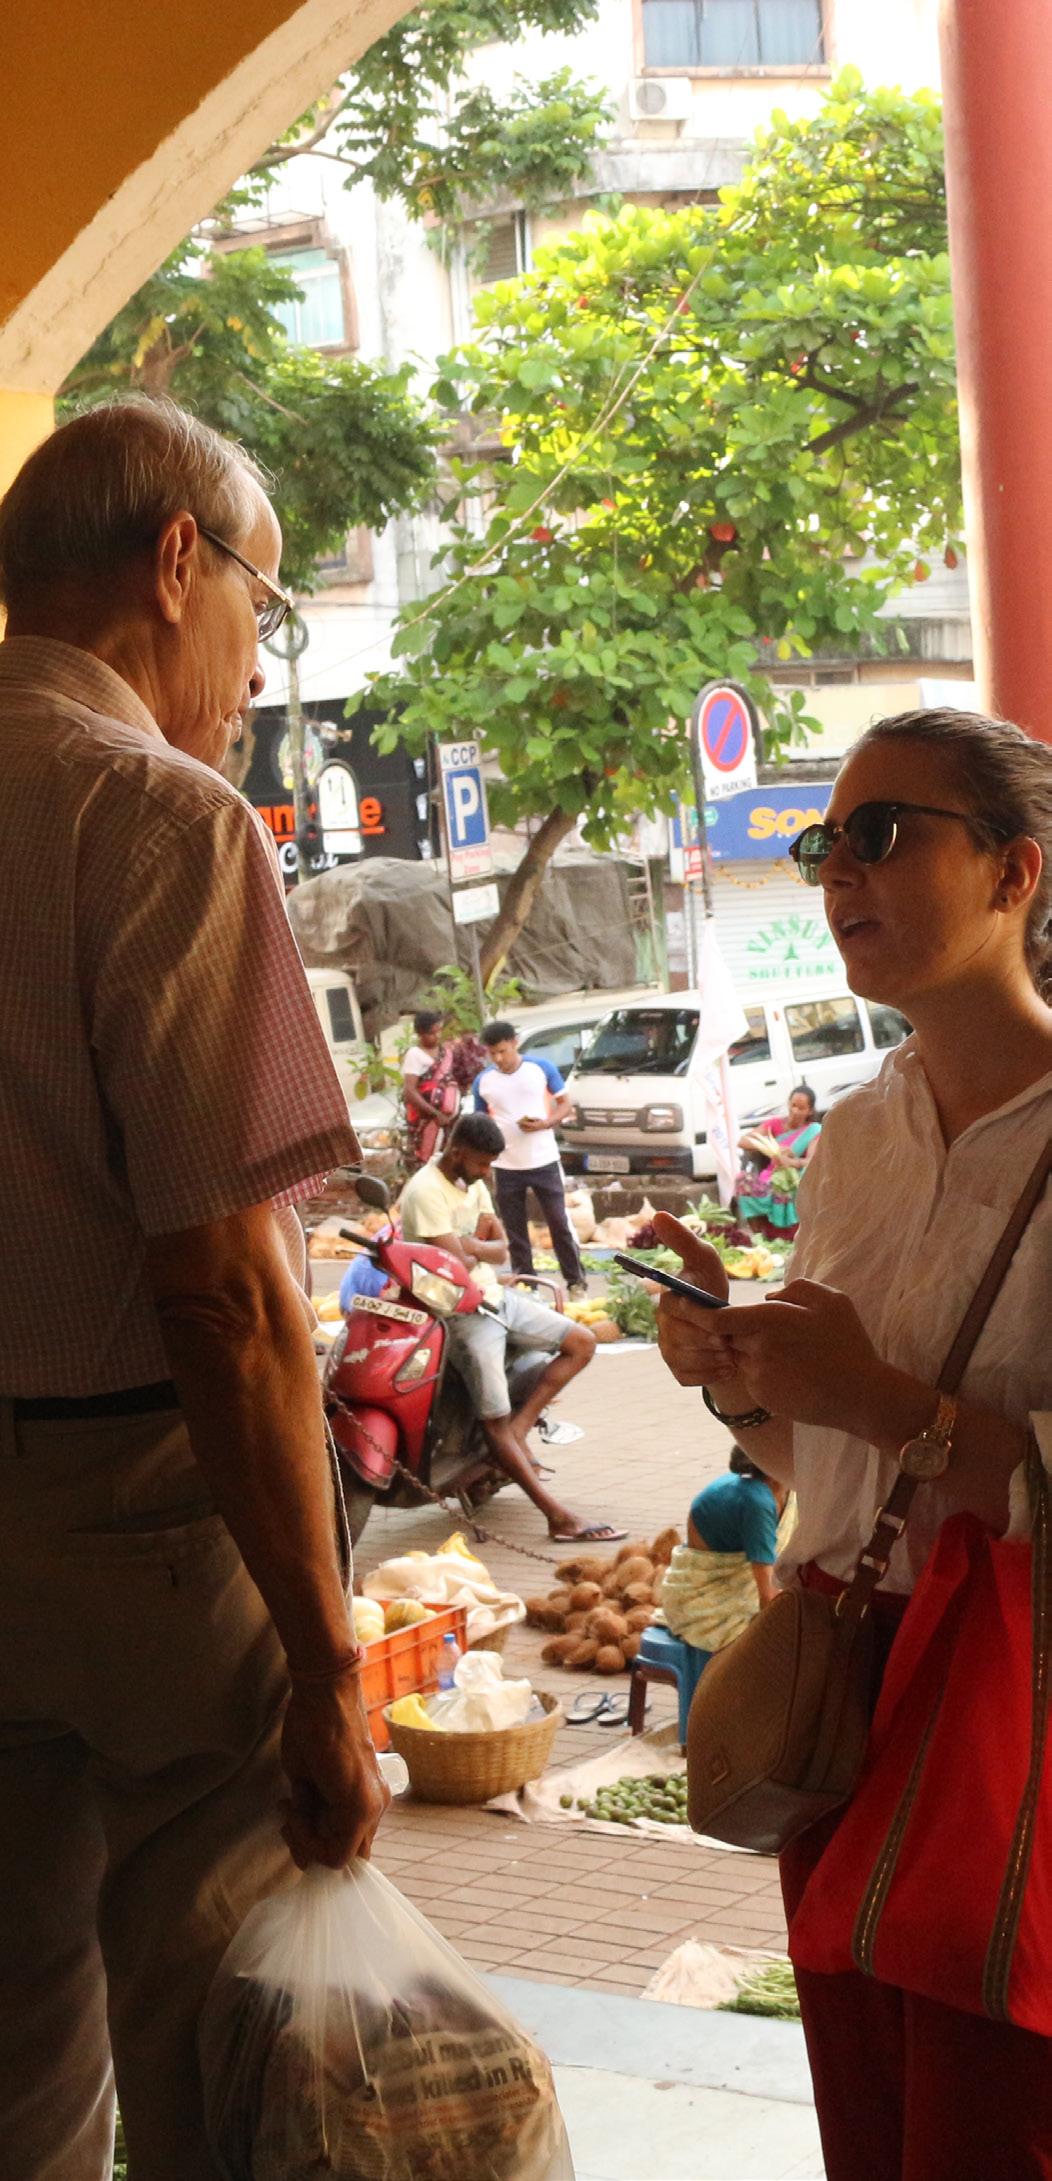
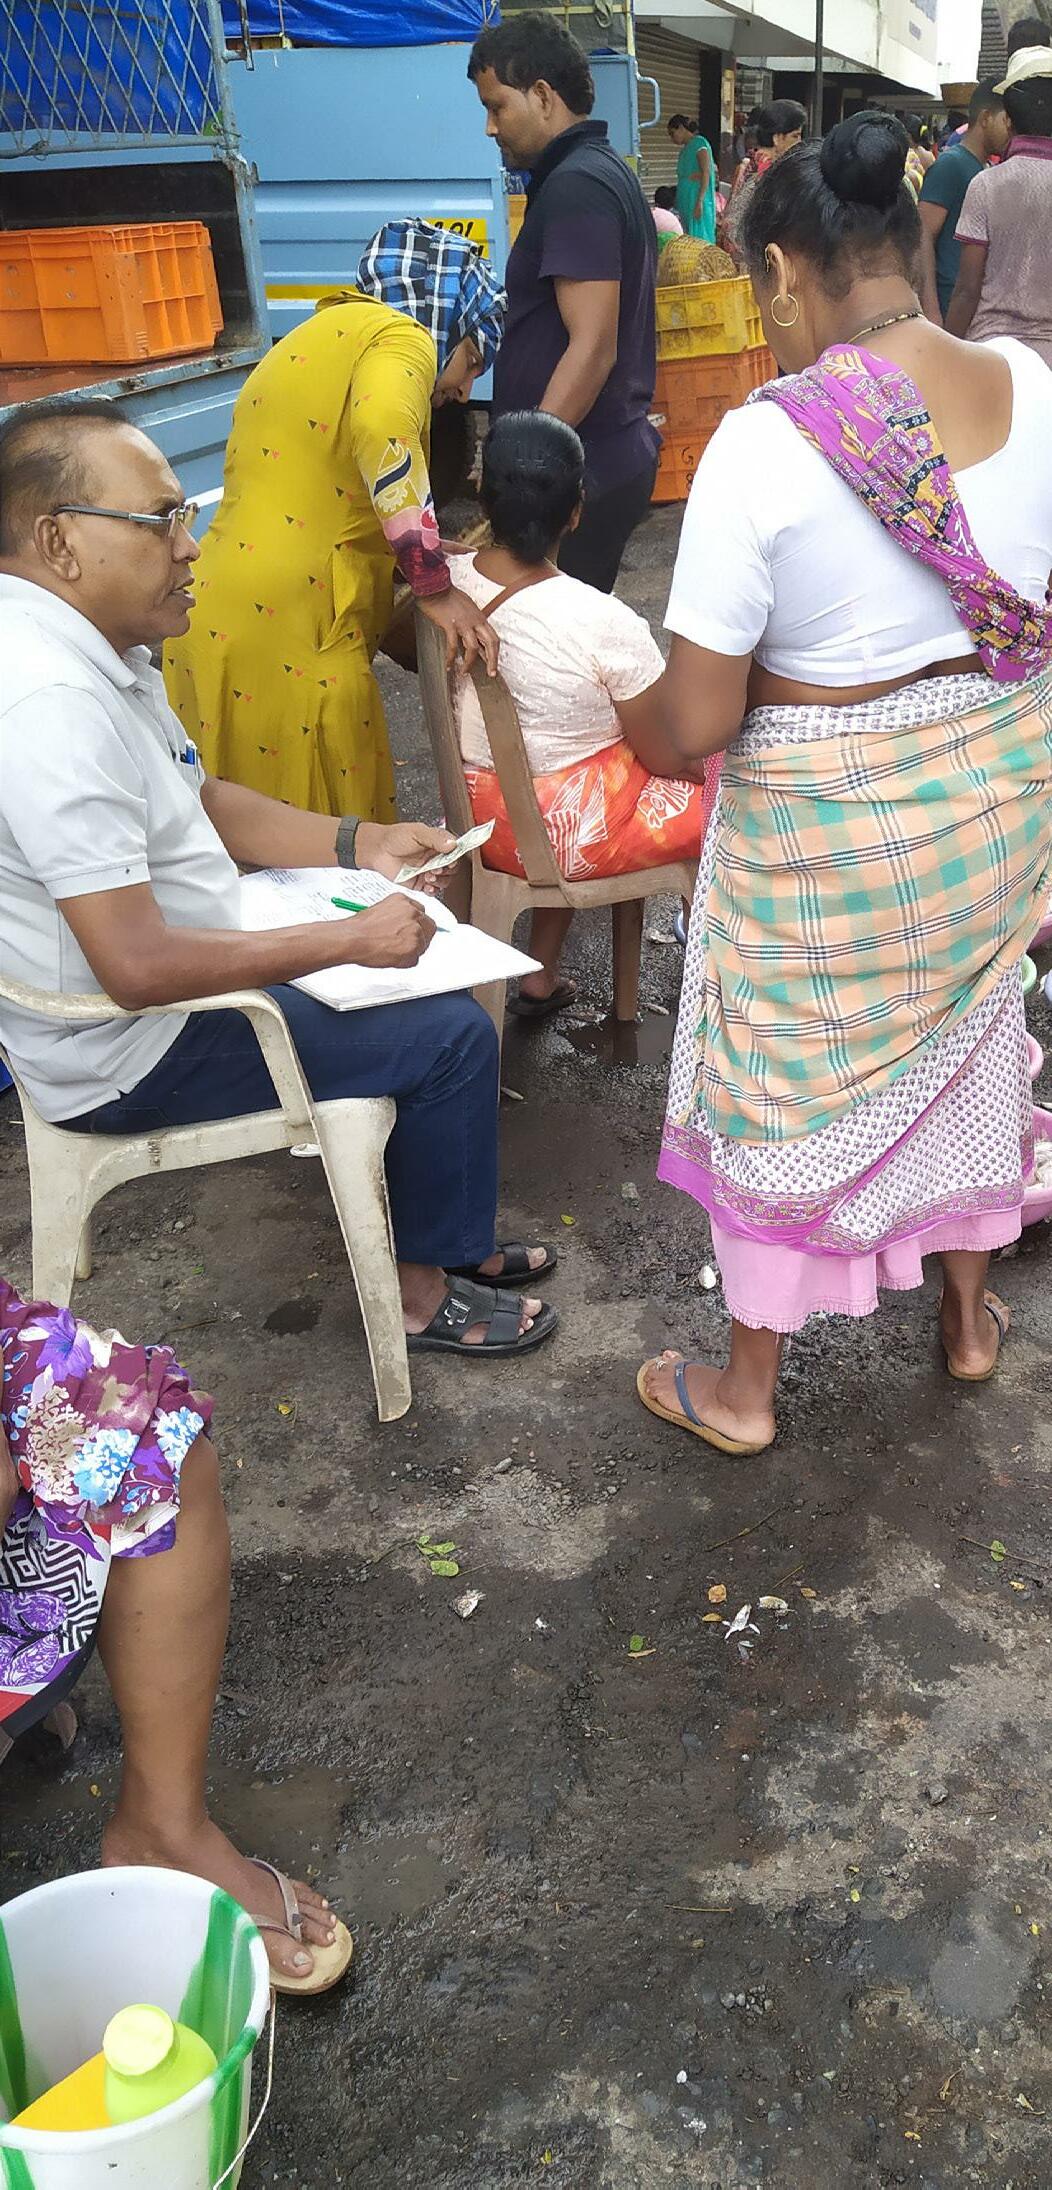
This method aimed analyzing the use of the market and user patterns. As we focused on the main municipal market, we positioned ourselves outside the main entrance with a board. We simply asked people what they bought and marked it on the board. Some people where interested to hear what we were doing and it turned into stories about the market experience.
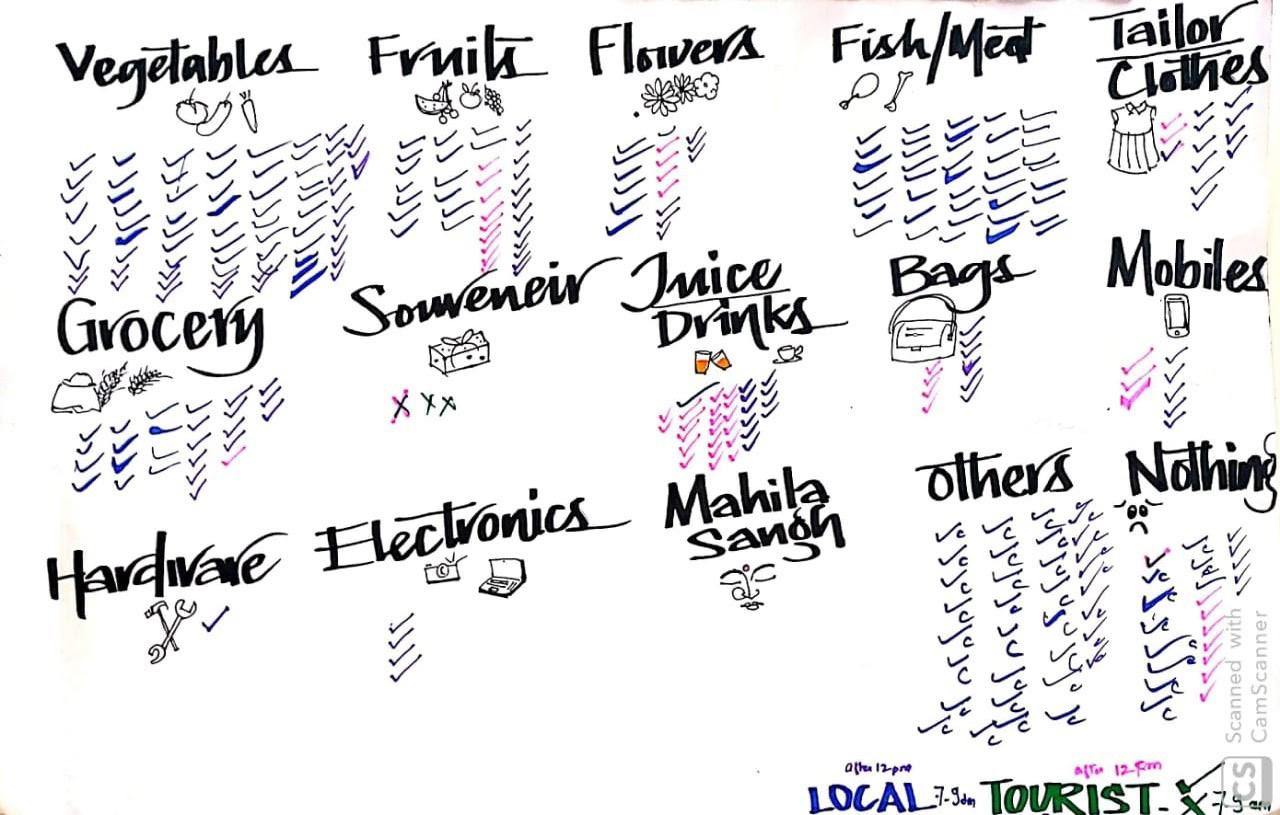
Our position outside the entrance played a major role on people wanting to talk with us. As we positioned ourselves in the center holding the board less people was interested in talking with us. As we changed position and showed only a part of the board people became curious of what we were doing and wanted to talk with us.
An interesting finding from this exercise was that many people did not buy anything at all and they simply used the market as a thoroughfare. We also understood more of what items was bought most frequently and at what time of day.
This method was aimed at understanding the spaces of the market. We followed the routes of people walking inside the main municipal market and marked it on the map.


As people spent limited time in the market, we could not get them to mark it on the map and so we had to follow the routes.
This gave us an overview of which spaces where mostly used and which were not used at all. It was a good addition to our observation of how much these spaces were used. It led us in a direction of neglected spaces.

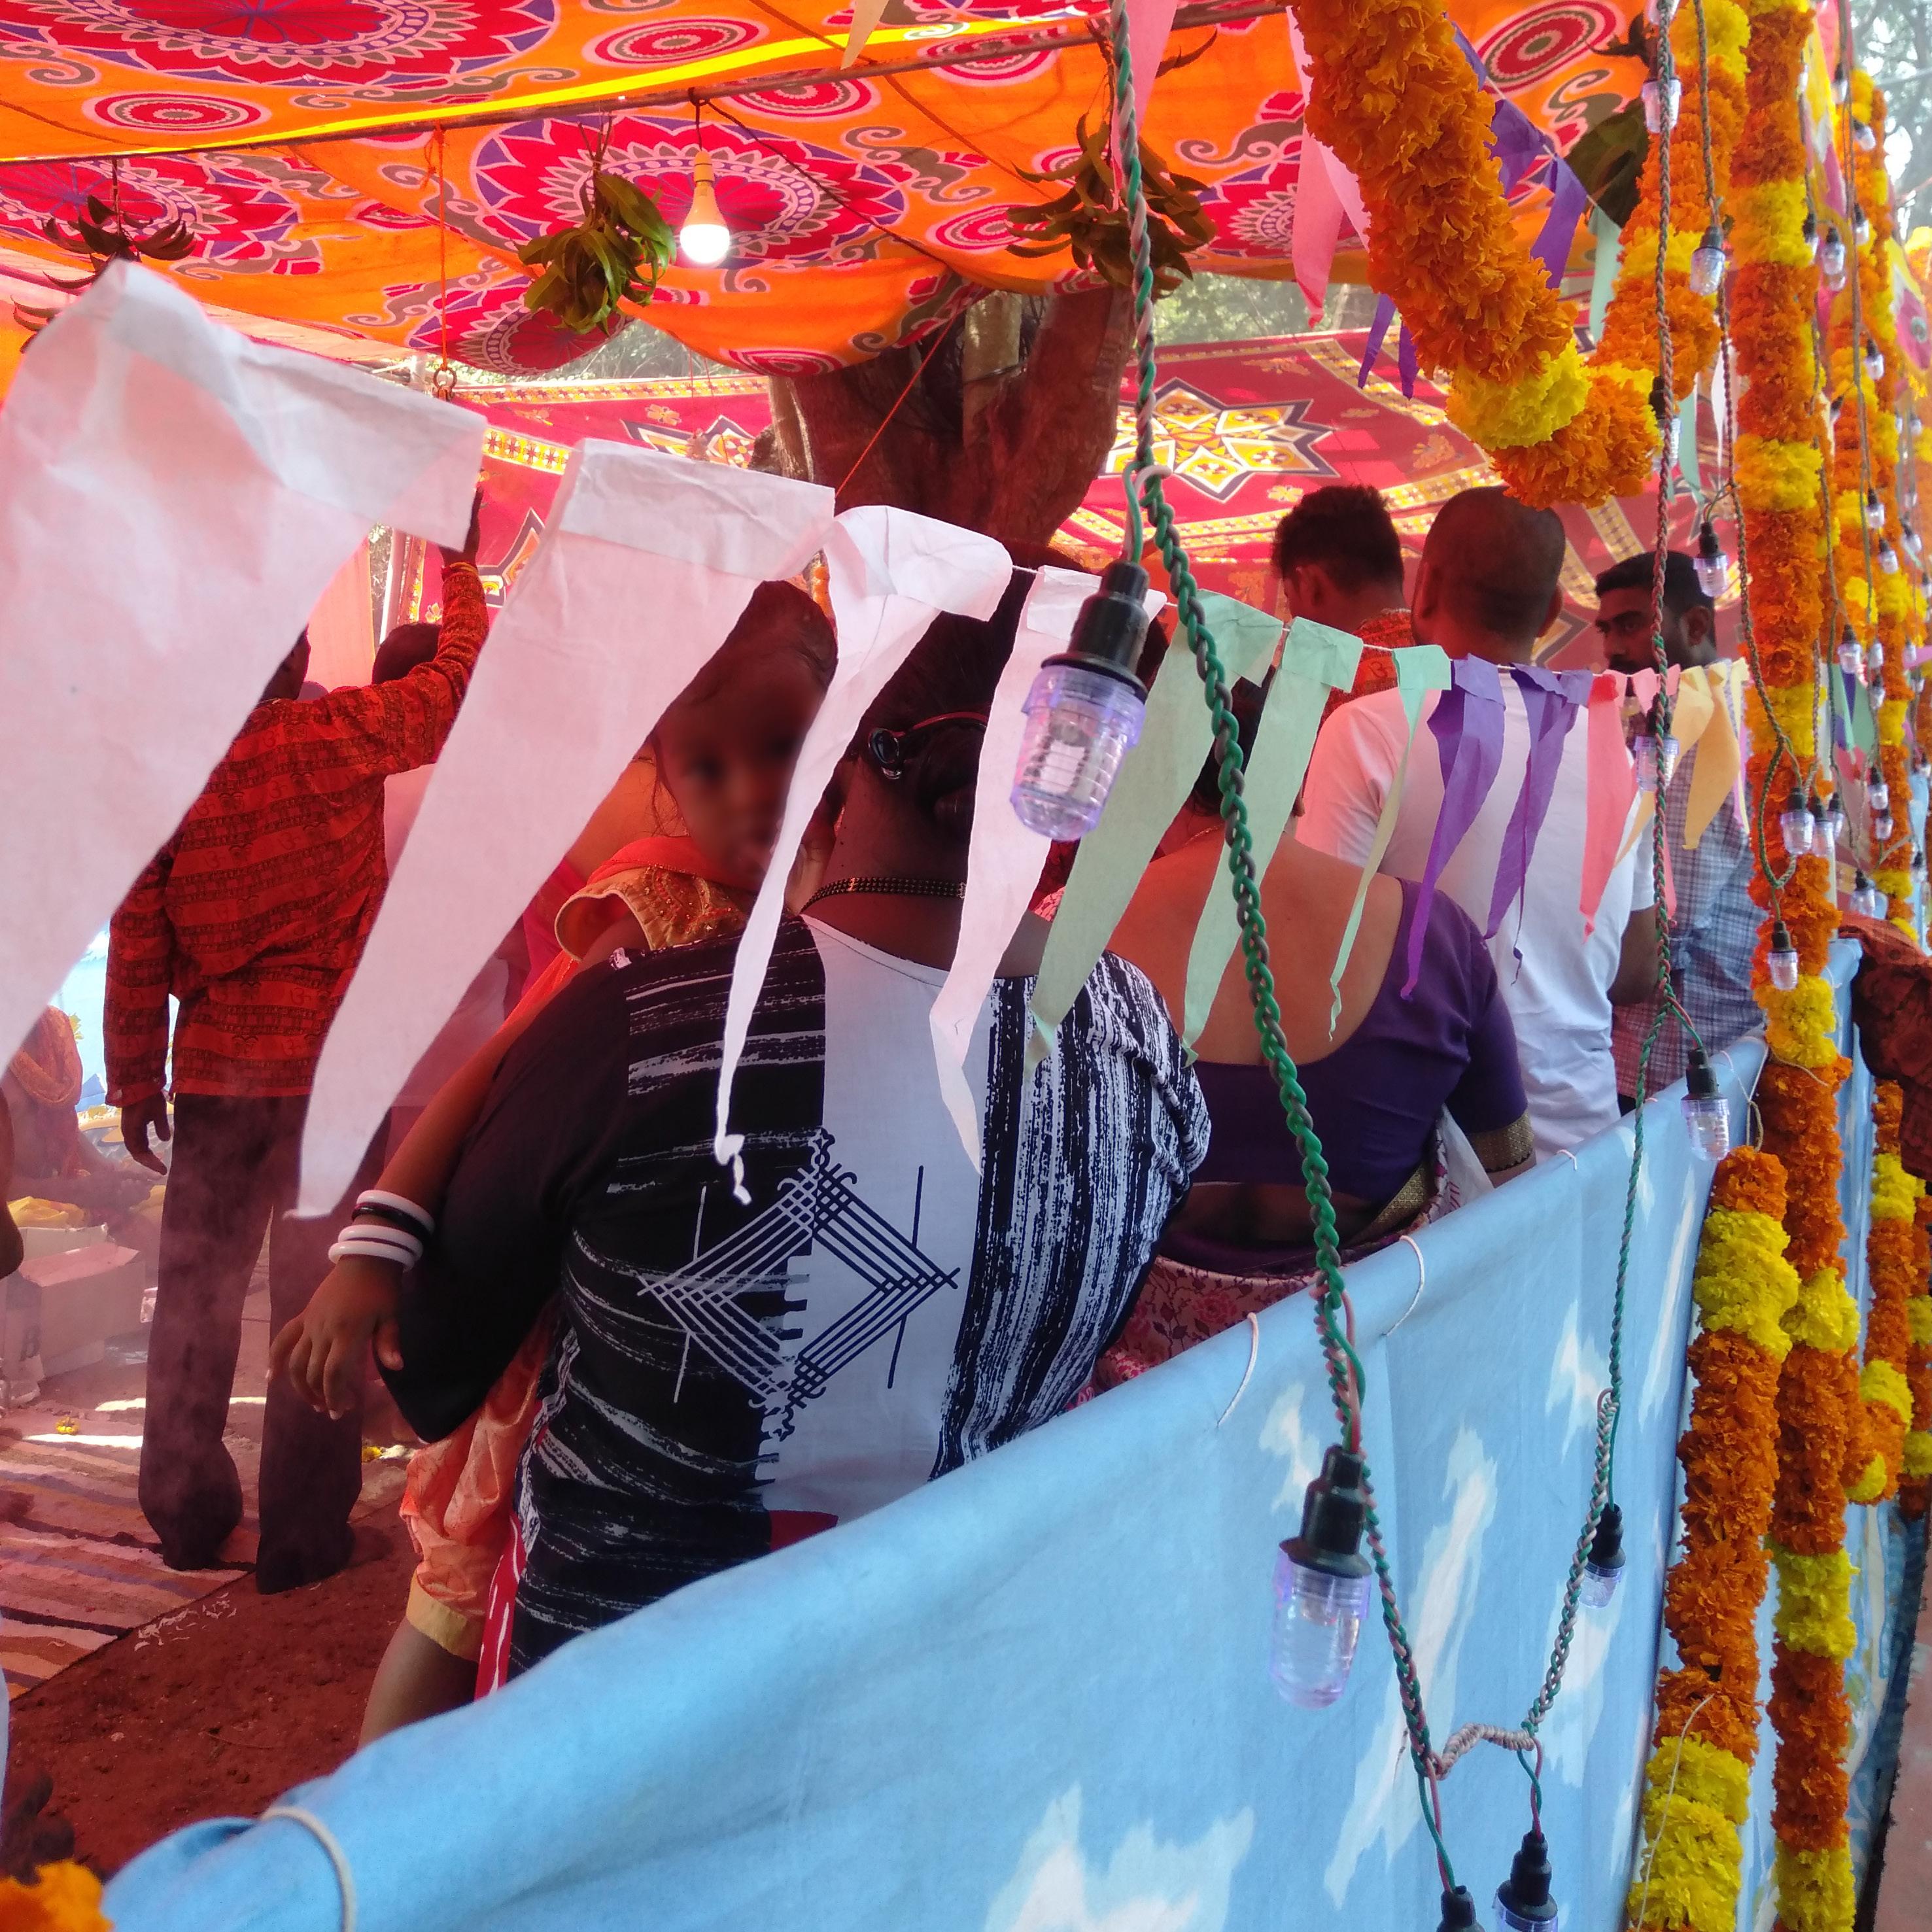
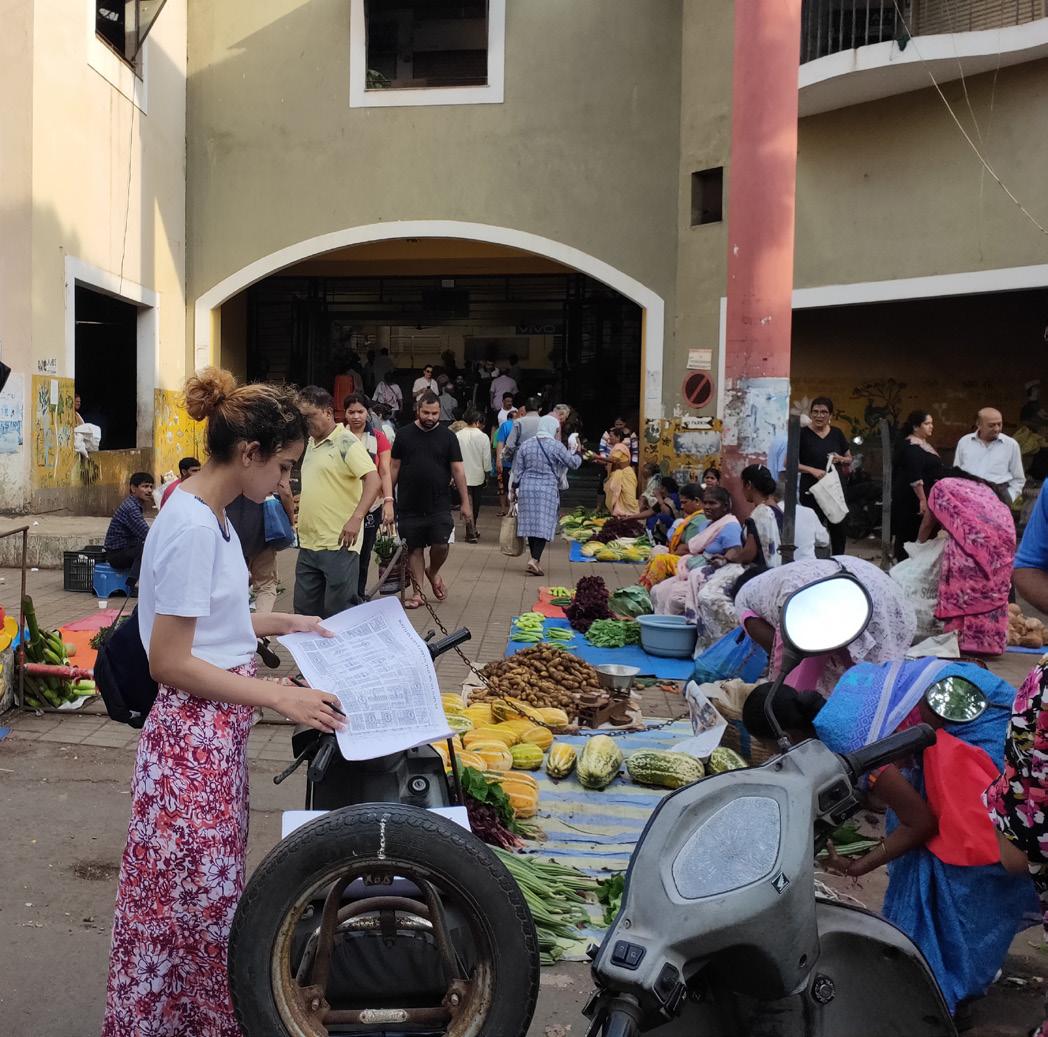
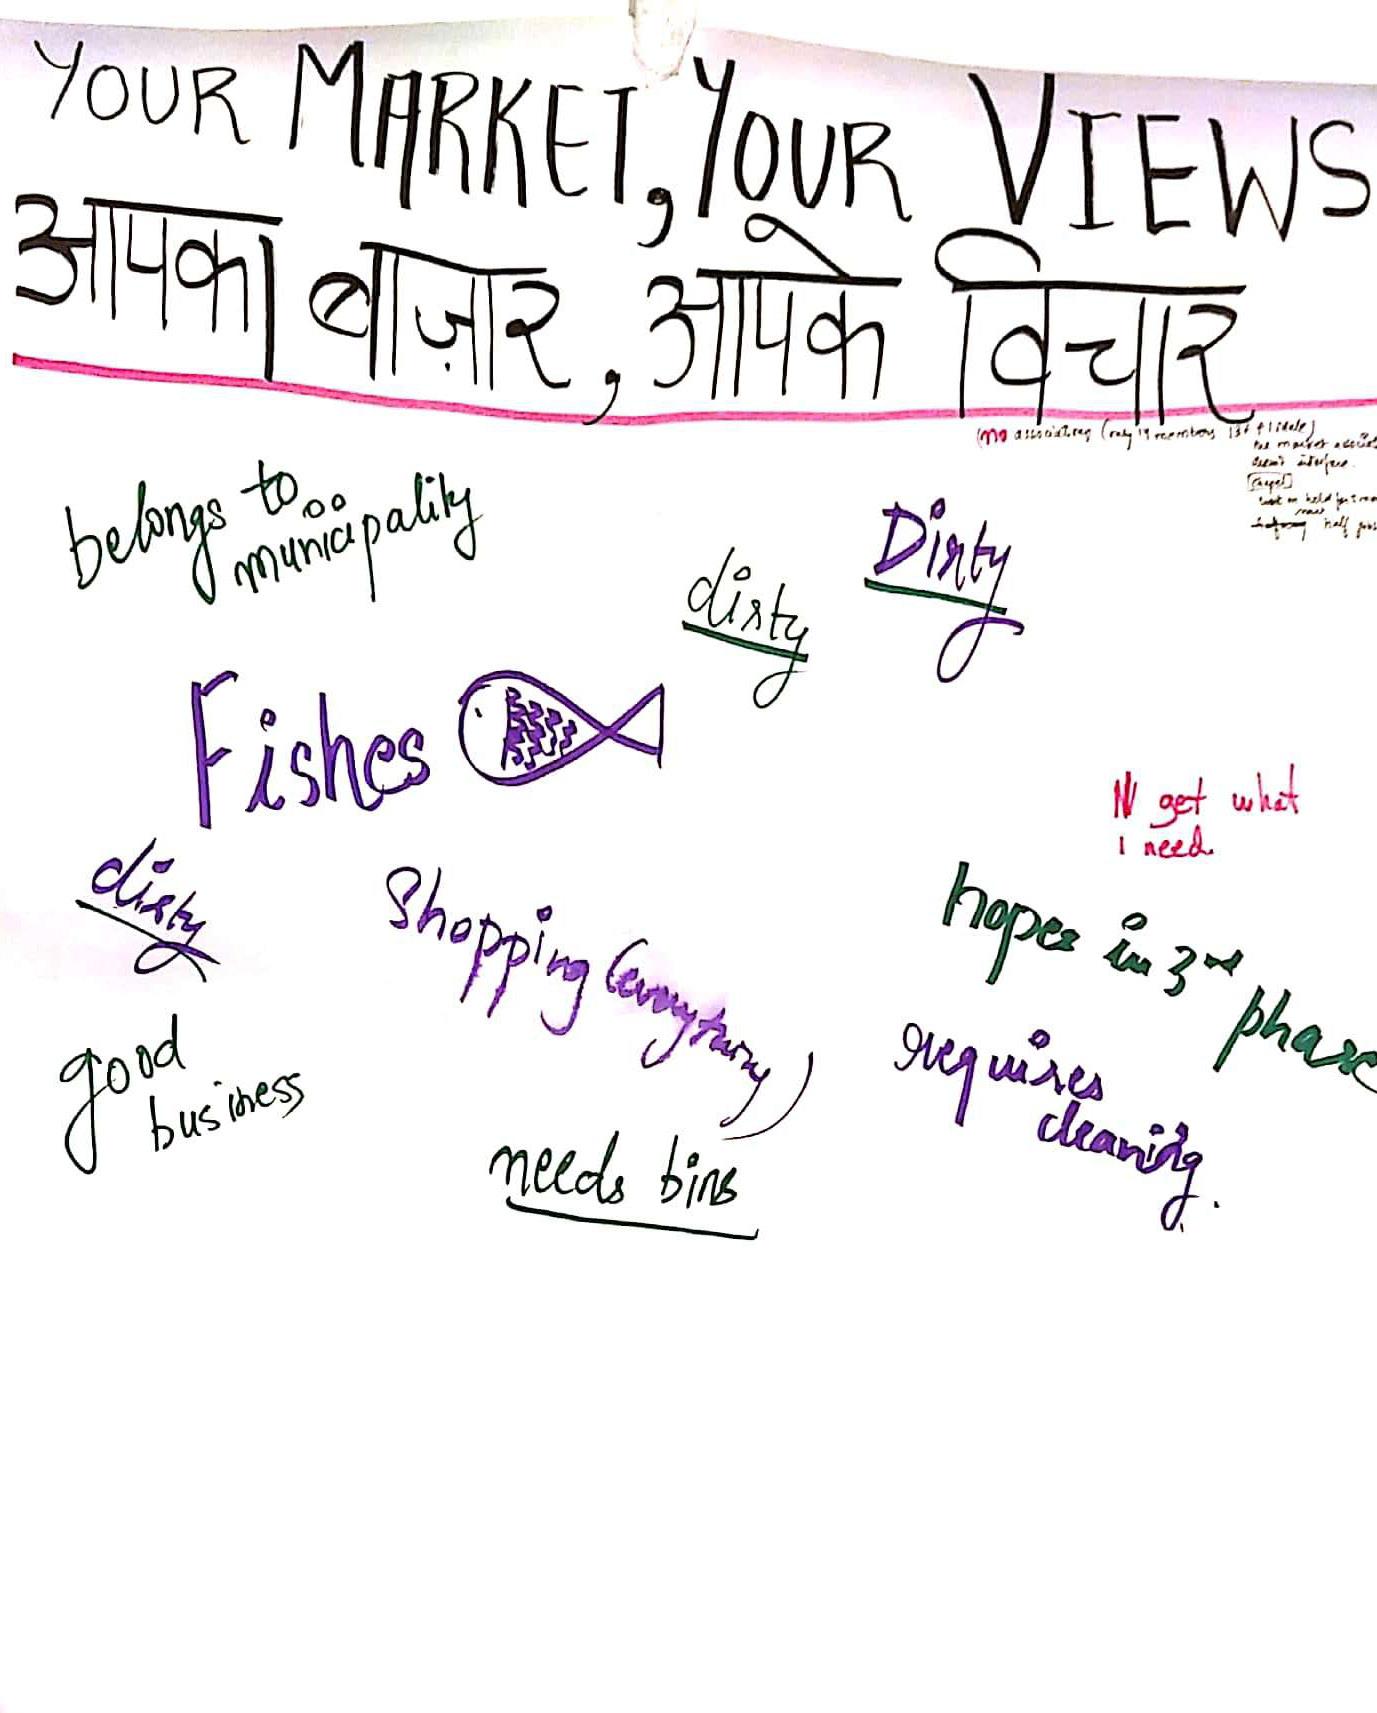
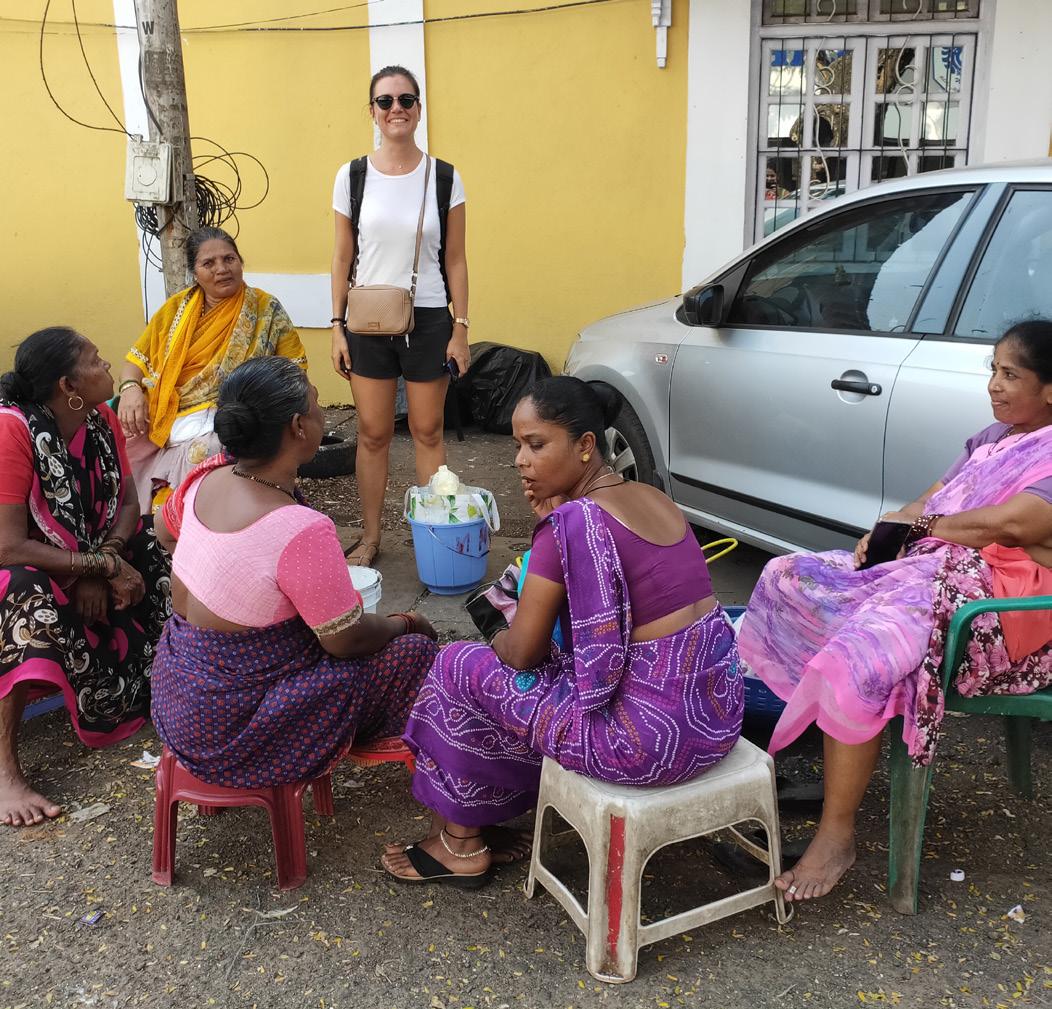
We shifted our focus to old market and this was another attempt at empathizing the community in the old market. We carried a white board and stood in the old market area. We wanted people to share anything that came to their mind. We wanted this to be a free exercise where people could share whatever opinion they had about the market.
People were in general skeptical about writing or drawing on this board. A lot of people could not read or write. However, even if we proposed that we could write their opinions for them they were still skeptical about sharing any opinion. We got a few verbal responses but this number is low compared to the number of people we asked. We thought at this point in time that people were scared to share their opinions because of political tension.
The information gained was limited and less efficient compared to other methods. What we did get from this exercise was a useful stakeholder, a member of the fish market association. He observed us for a while without introducing his position. He later took interest in what we were doing and it led to an interesting conversation.
This method was also aimed at understanding the community and the history of spaces in the market. We asked people about their personal history and how that relates the spaces in the market. This gave us a different perspective the conversation evolved.

We could not talk to a lot of people as not many people spoke English or Hindi.


Stories was a way of gaining trust which again make people more open and freer to discuss their experiences of the space.

This method aimed at defining the ideas. As we got to know the members of the association of the fish market, we arranged smaller meetings with them.
Although we expected everyone to come to the meetings but only a few people showed up in different meetings.
We understood more of the social structure of the market which led to our problem statement.

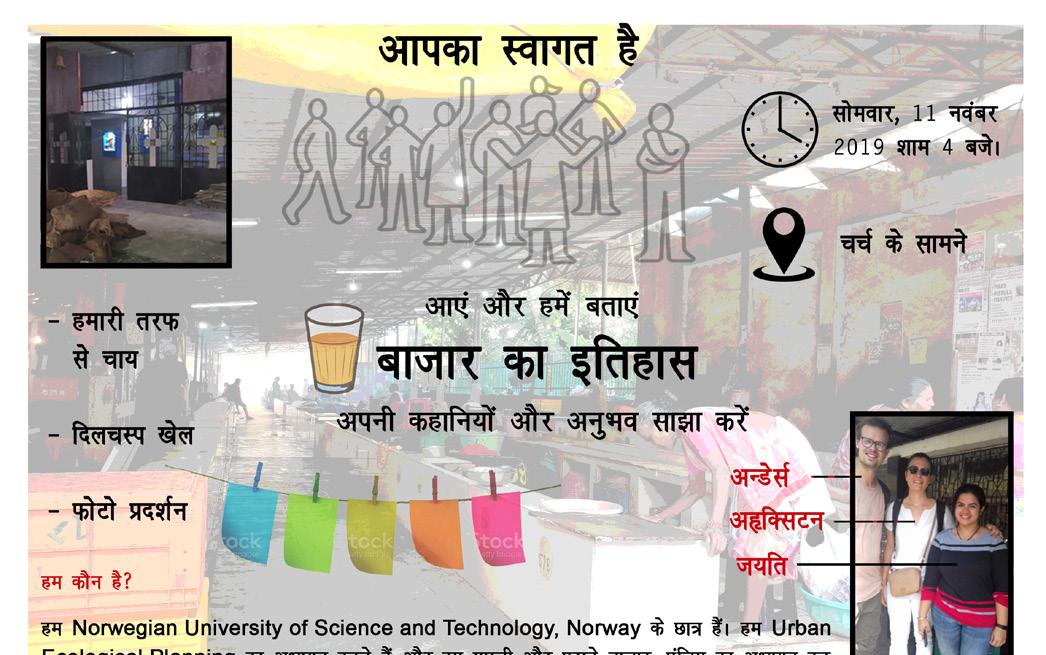
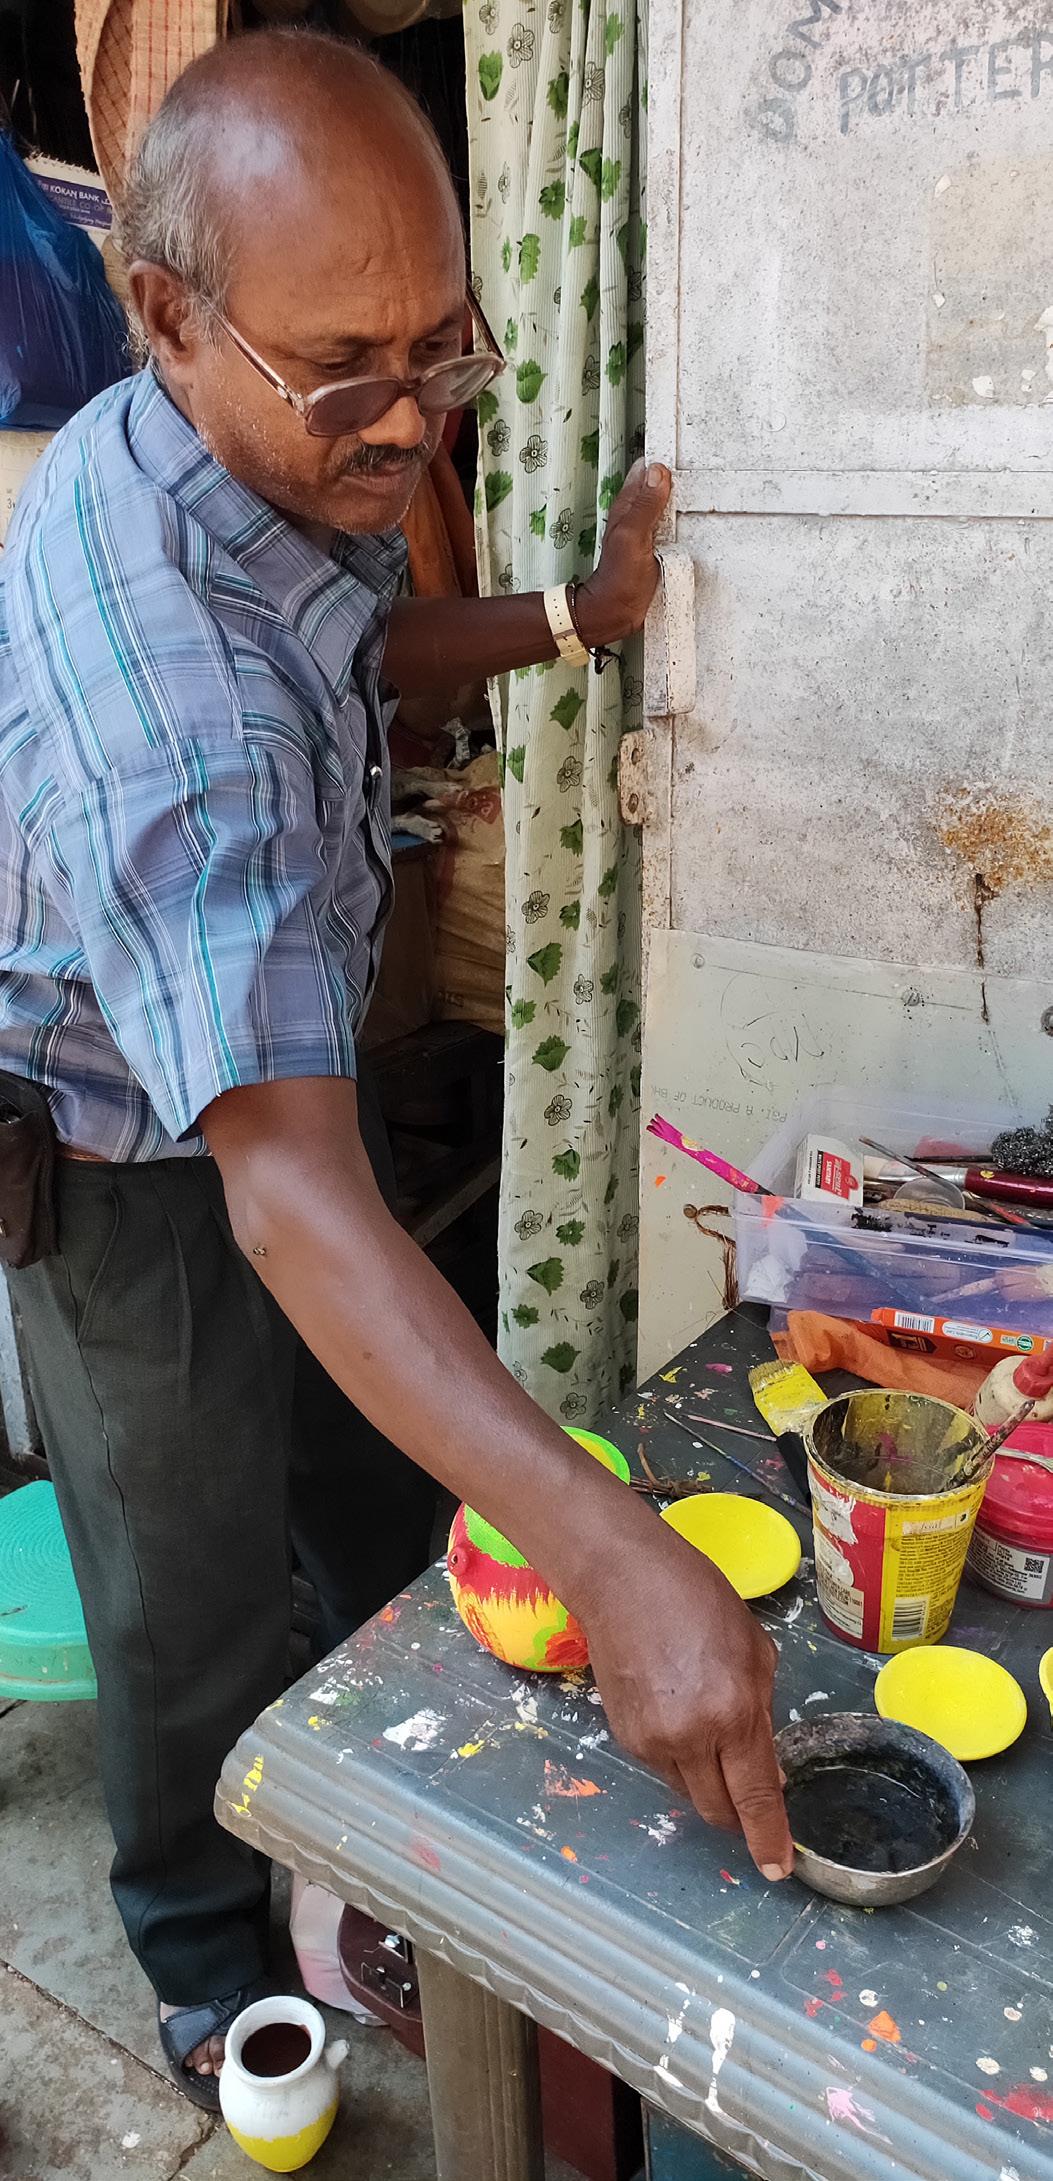
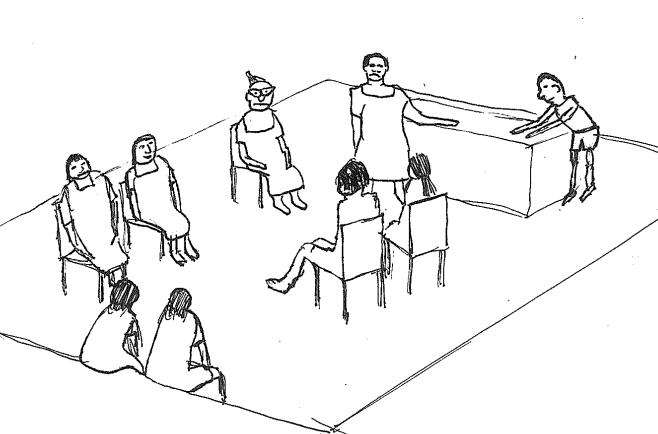
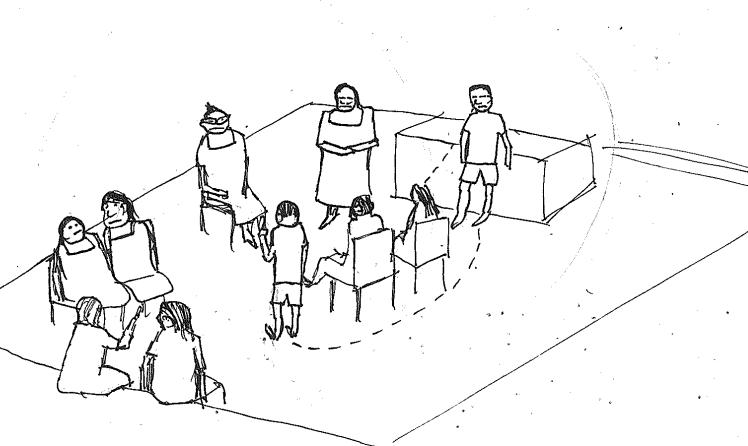
This method was prototyping and testing our interventions in the market. We wanted a discussion amongst the sellers and showing the market a way forward to be inclusive and interactive with each other. The way forward was to convince the main stakeholders of the association and making them take control and responsibility of the discussion. We made flyers for the event so that the association could approve it. One of the members took responsibility to get the space cleared and arrange chairs for the event. We proposed the plaza for the discussion but they shifted the location to the chapel thus showing interest in the event. Some other members wanted to take legal precaution before doing the event and so they went on to take permissions from the municipality. We wanted to paste some pictures around the market and serve people free tea.
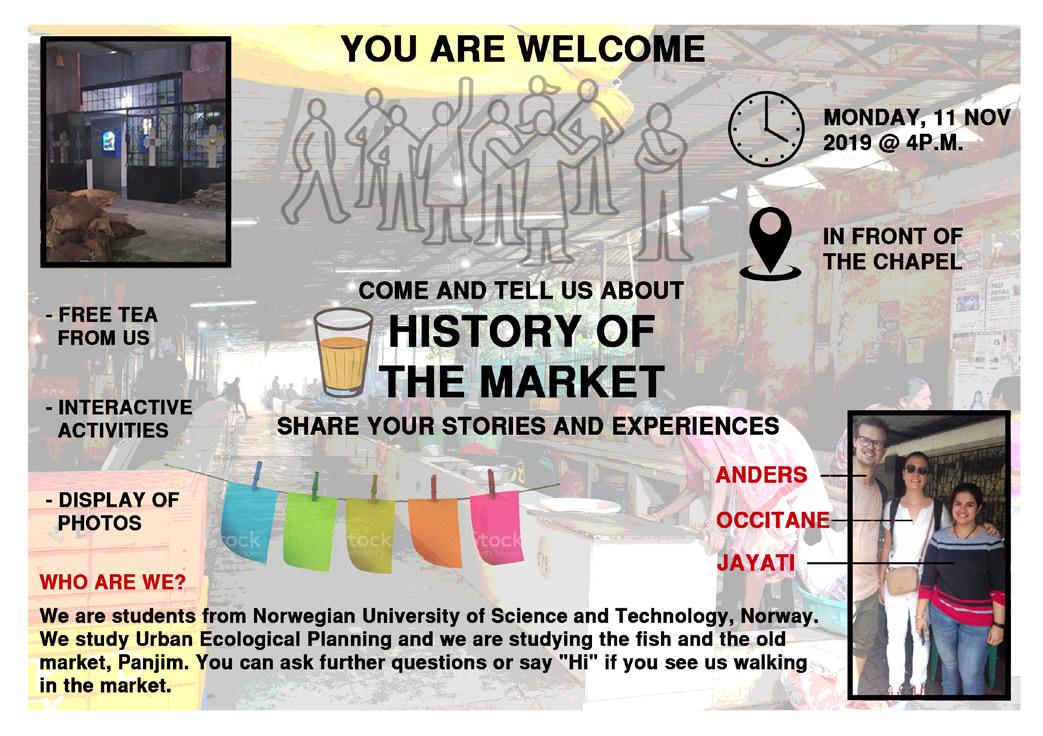
The major challenge was convincing the major stakeholders from the association. They wanted legal validation for the event as they did not want any problems in the future with the municipality. They went on to ask the municipality and we could not get permissions to do the discussion ☹
Although this event failed to happen, we thought of different methods to trigger a discussion amongst the sellers and the association.
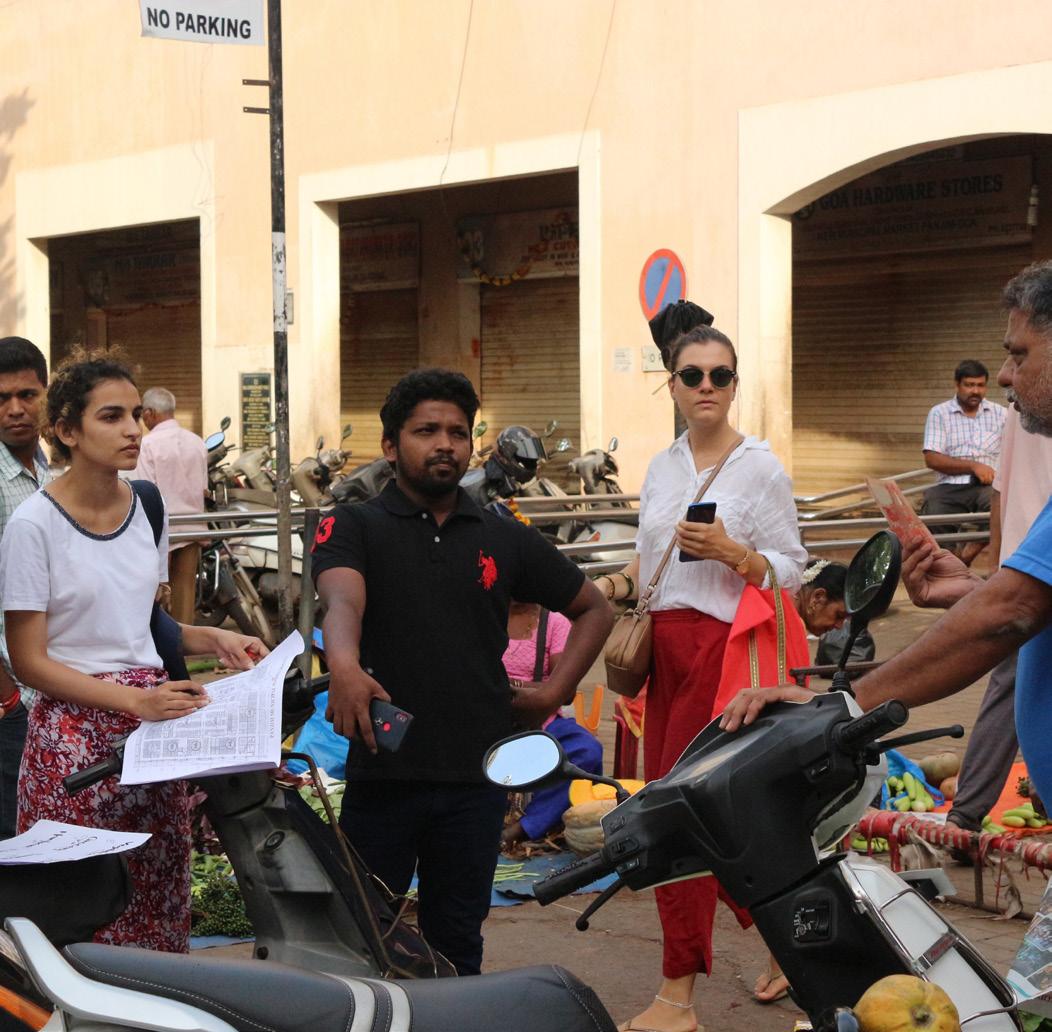
This method was another attempt of testing our ideas. In this game we made drawings we felt represented the market and showed it to people. We asked which image they personally felt most attached to or simply liked the most. We recorded their replies by counting them. We had an empty square on the sheet left open so that they could add something.
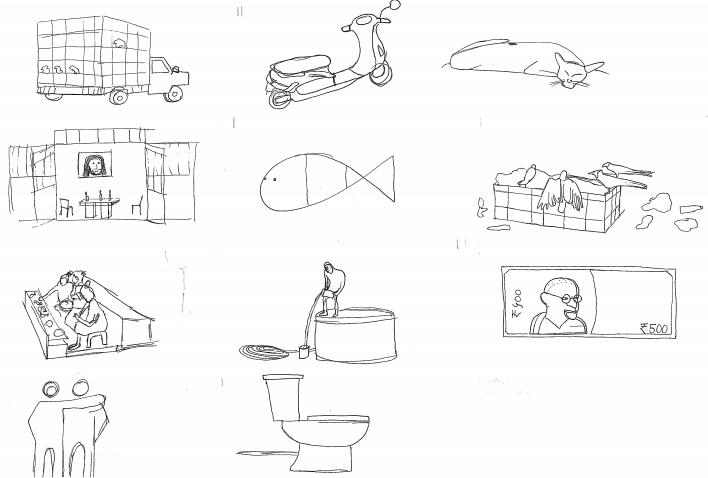
There was a language barrier while introducing the game. We simply learnt a sentence in Hindi to ask the question. We do observe that many people become uncertain when being asked to express their opinions on the spot but people replied more compared to other methods. We do notice that when they see previous suggestion people tend to make suggestions related to the previous. Doing this exercise again with a blank paper would be useful to get more answers.
We triggered some discussions and they started thinking about the space.
This method was aimed at understanding more about the social structure. We bought a pack of stars stickers inventing a game where people would give stars their friends. We were curious if people would want to do this and if it would spread some joy. It is like an appreciation game where you are giving away a symbolic gesture of appreciation to someone. We wanted to observe these interactions and learn about the social connections among the shop keepers.
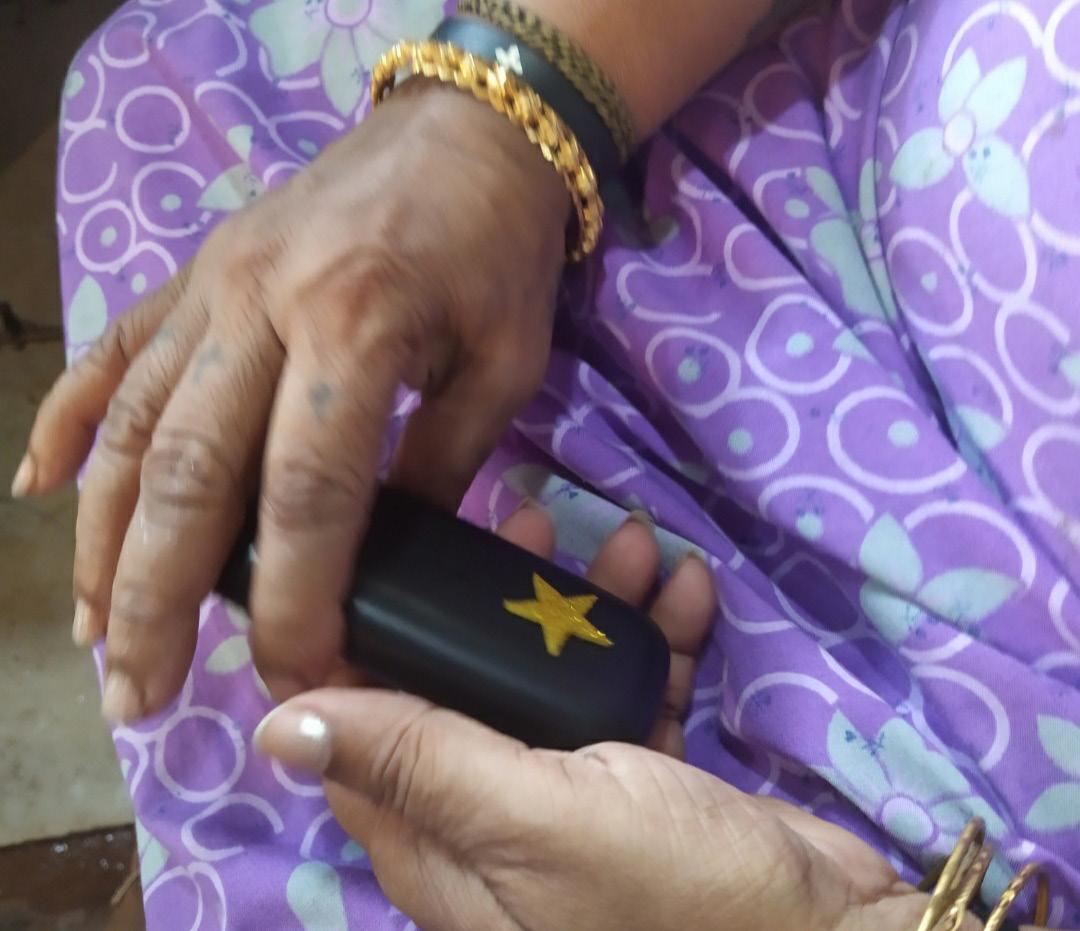

We had to restart the game a few times as the game observed some social groupism.
It turned out people really enjoyed the game. We saw relationships between people we did not predict beforehand.
In this method we went back to the community to show them proposals through imagery for what could be done to improve their space. We went to stakeholders of the association since we had an ongoing discussion with them about the topic.
We have a vision to engage everyone in discussions and we do not know if our proposals will be taken into consideration by other members of the market.
The imagery led to discussions with the stakeholders we spoke to. They came up with suggestions and improvements regarding the topic.
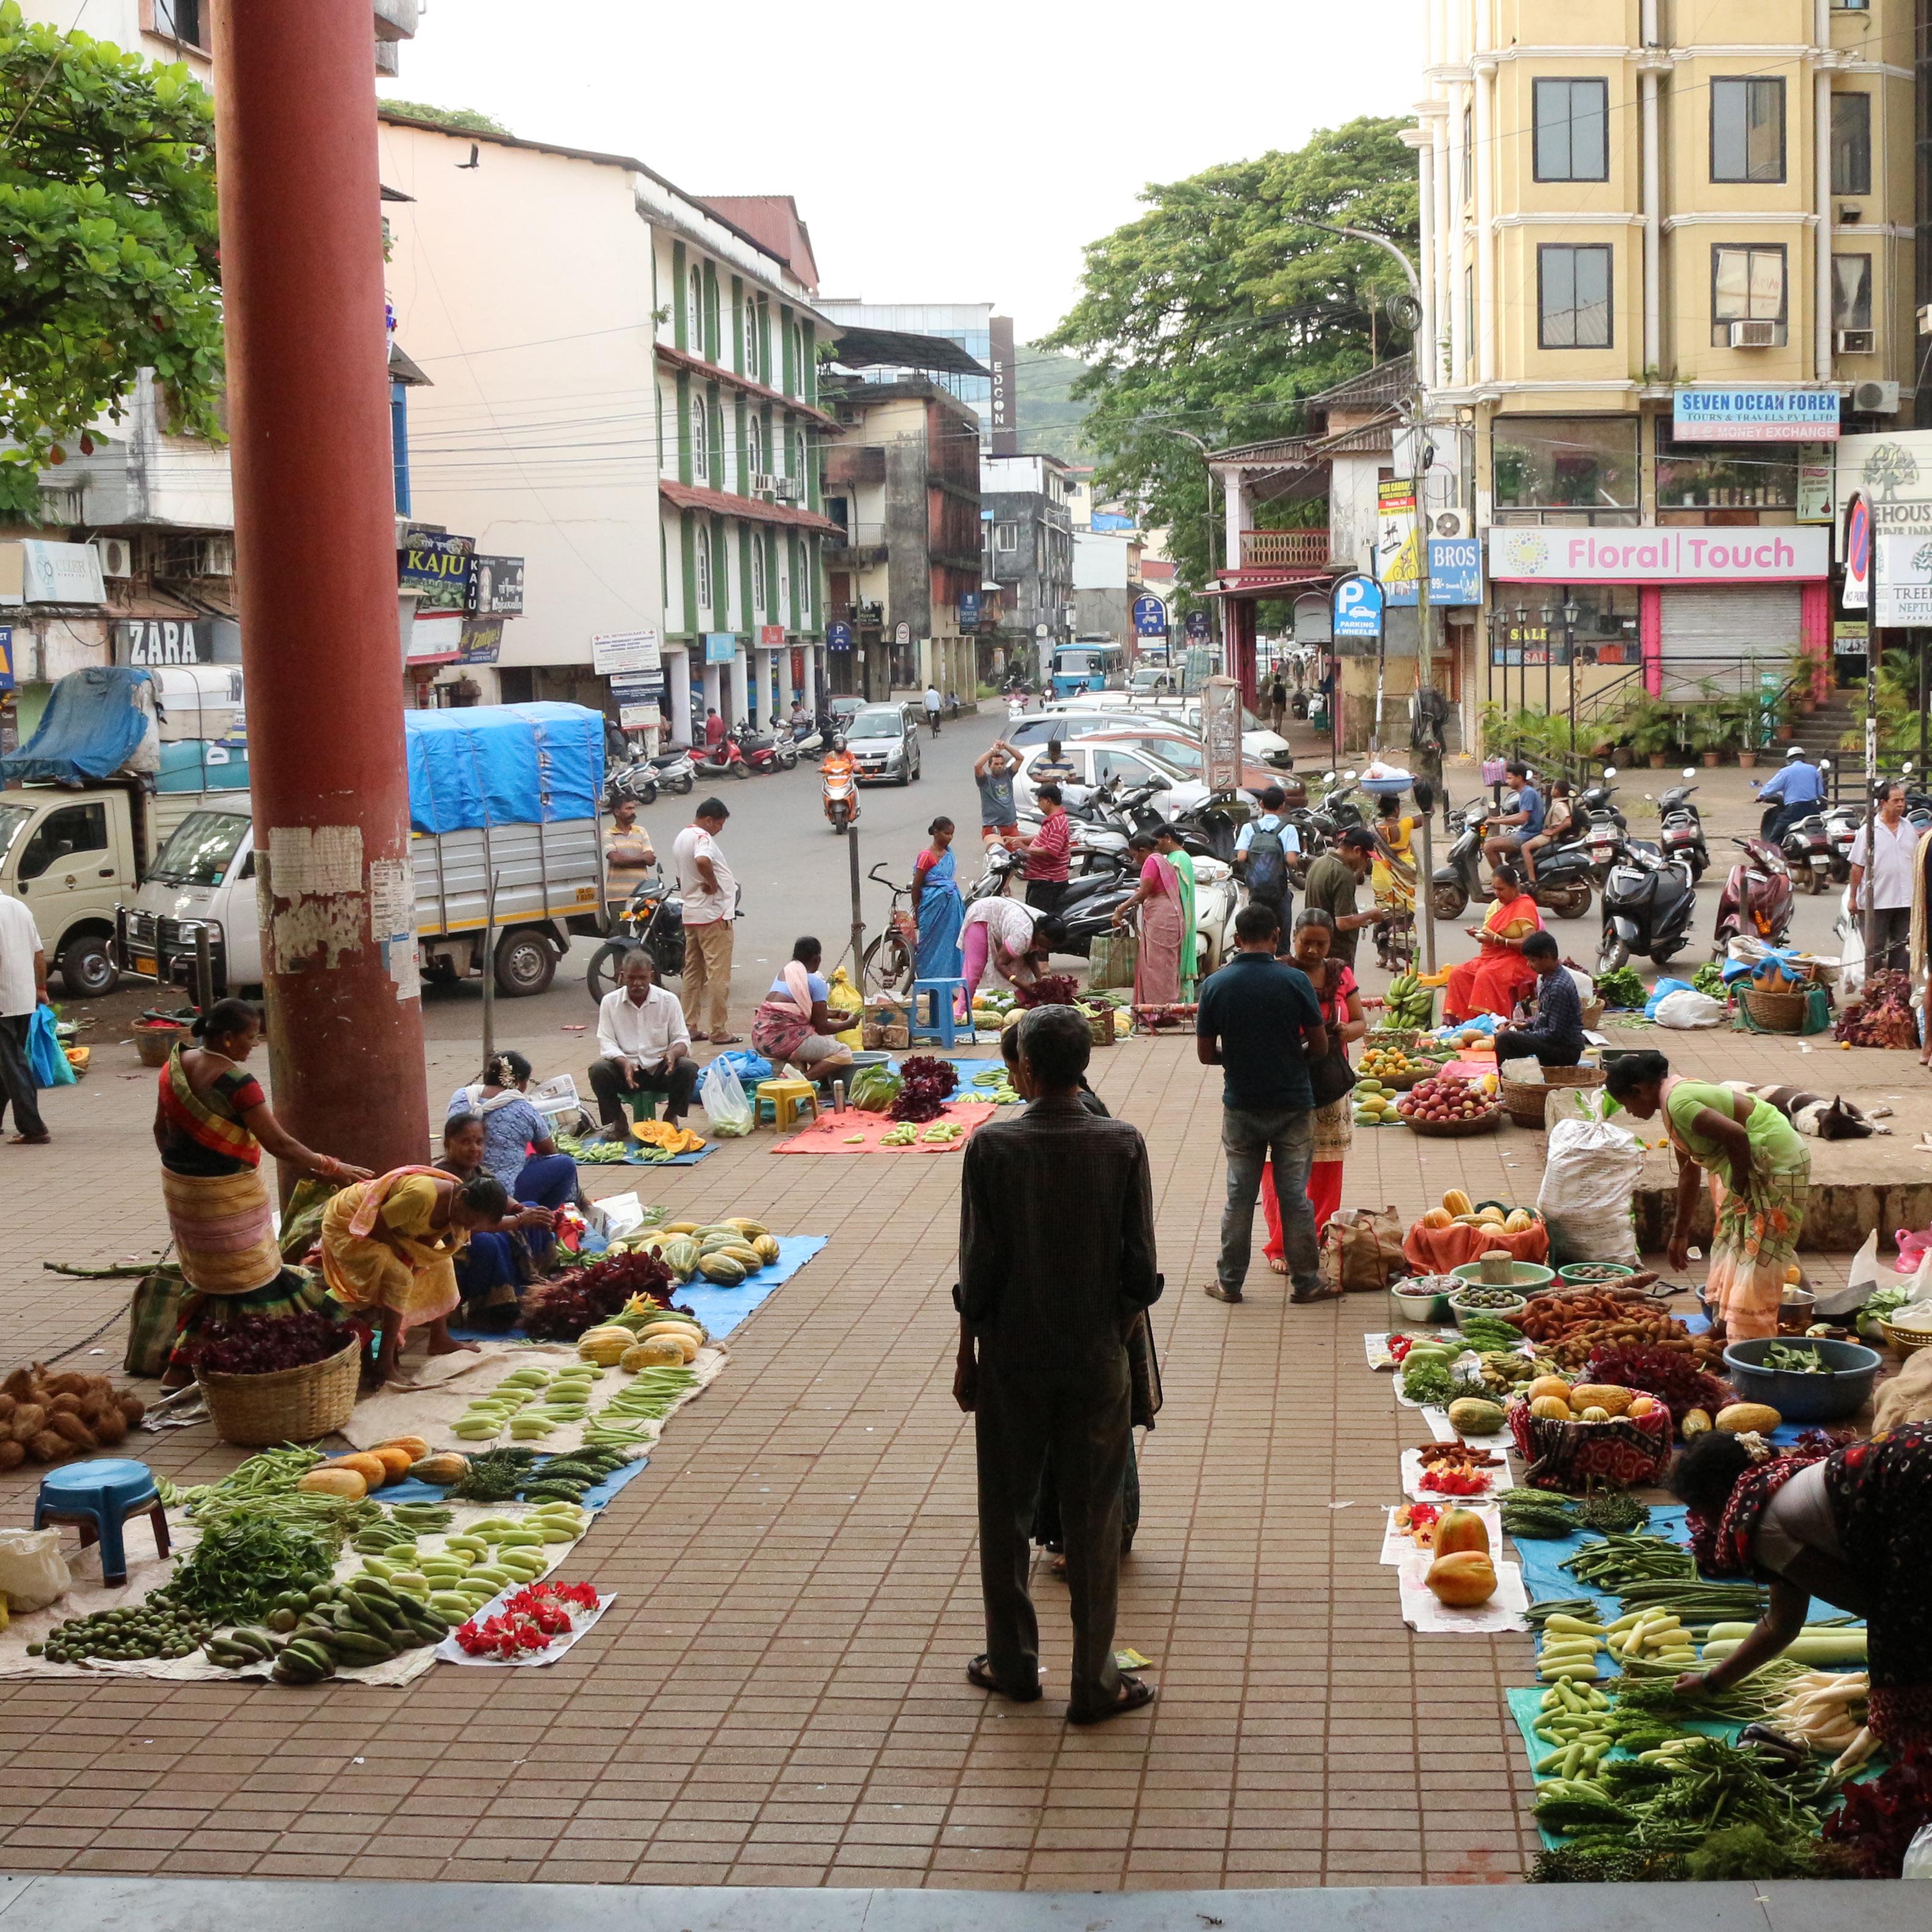
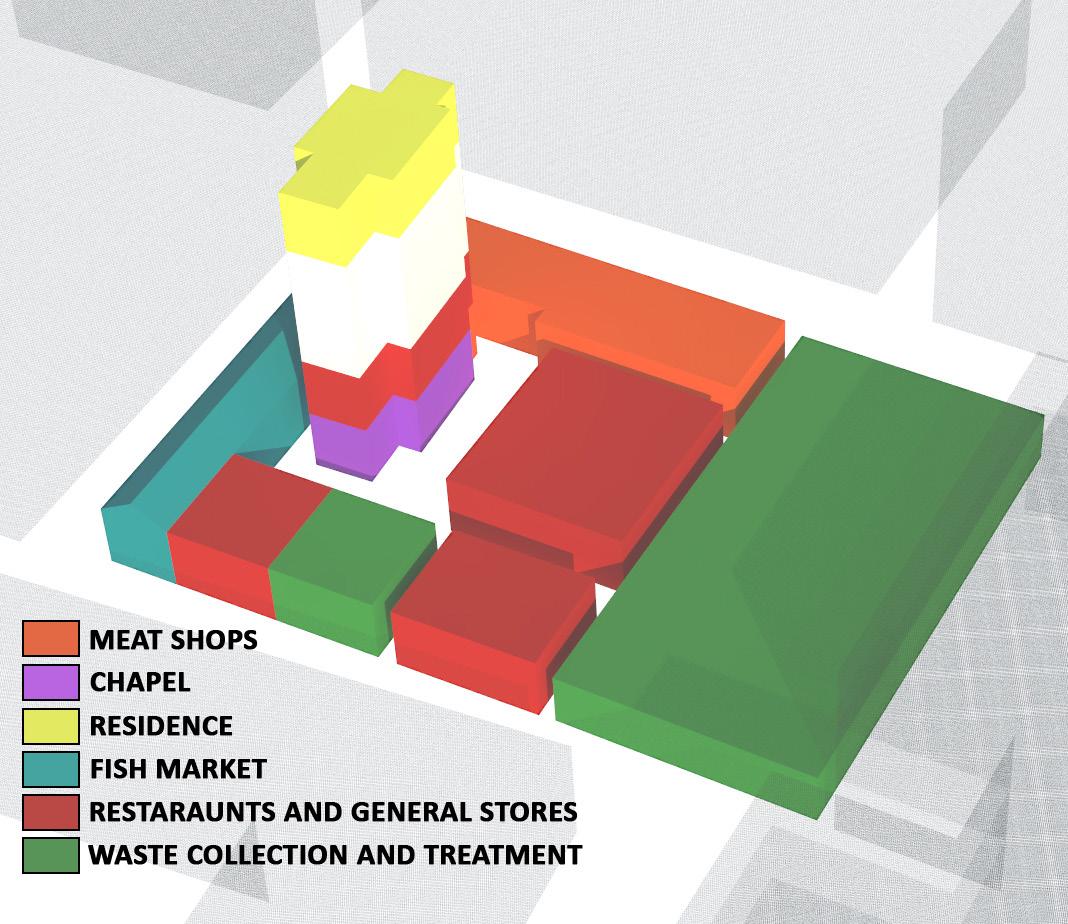
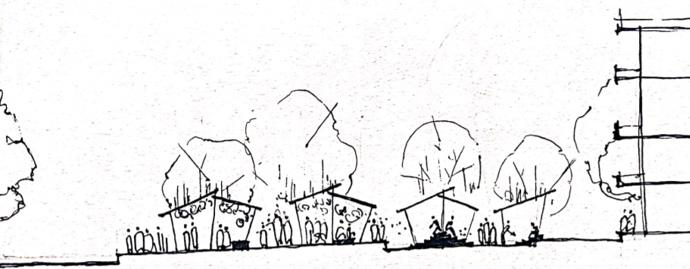
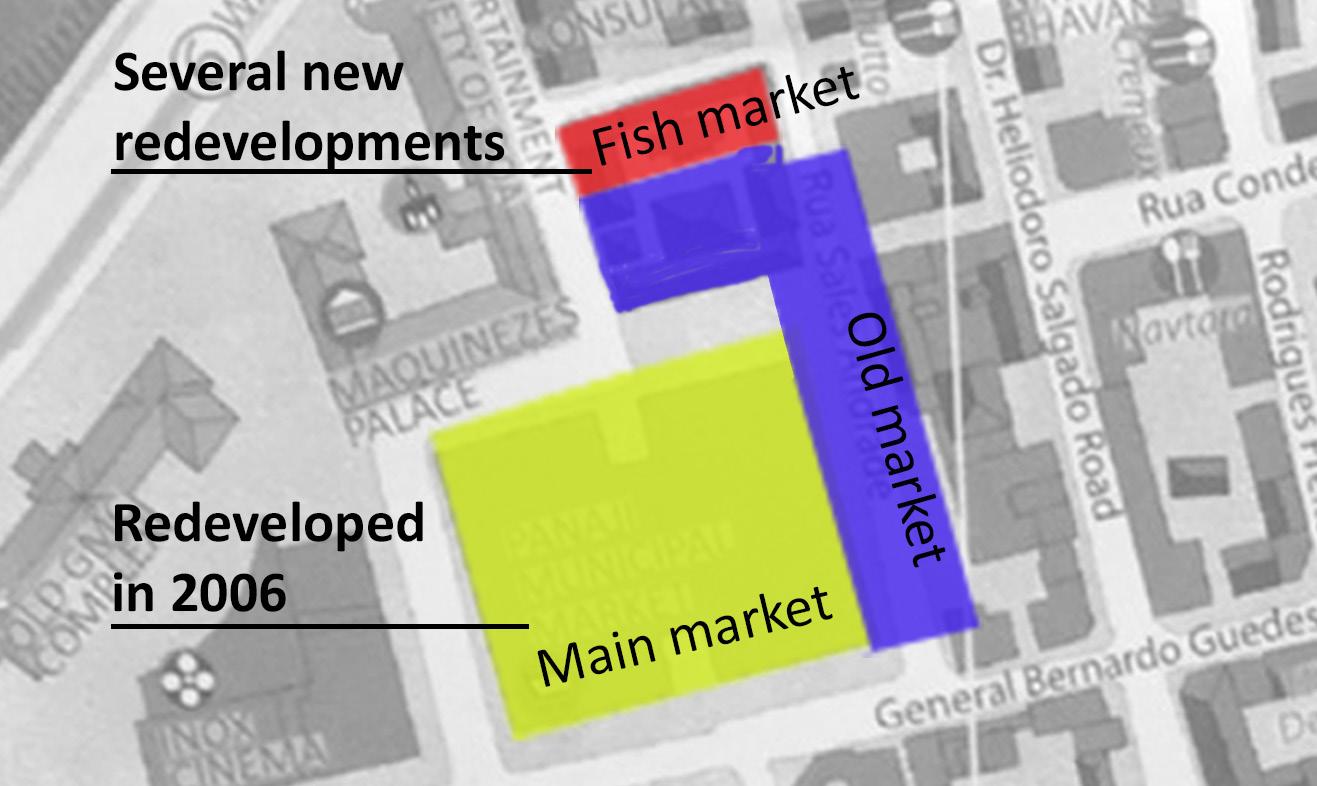
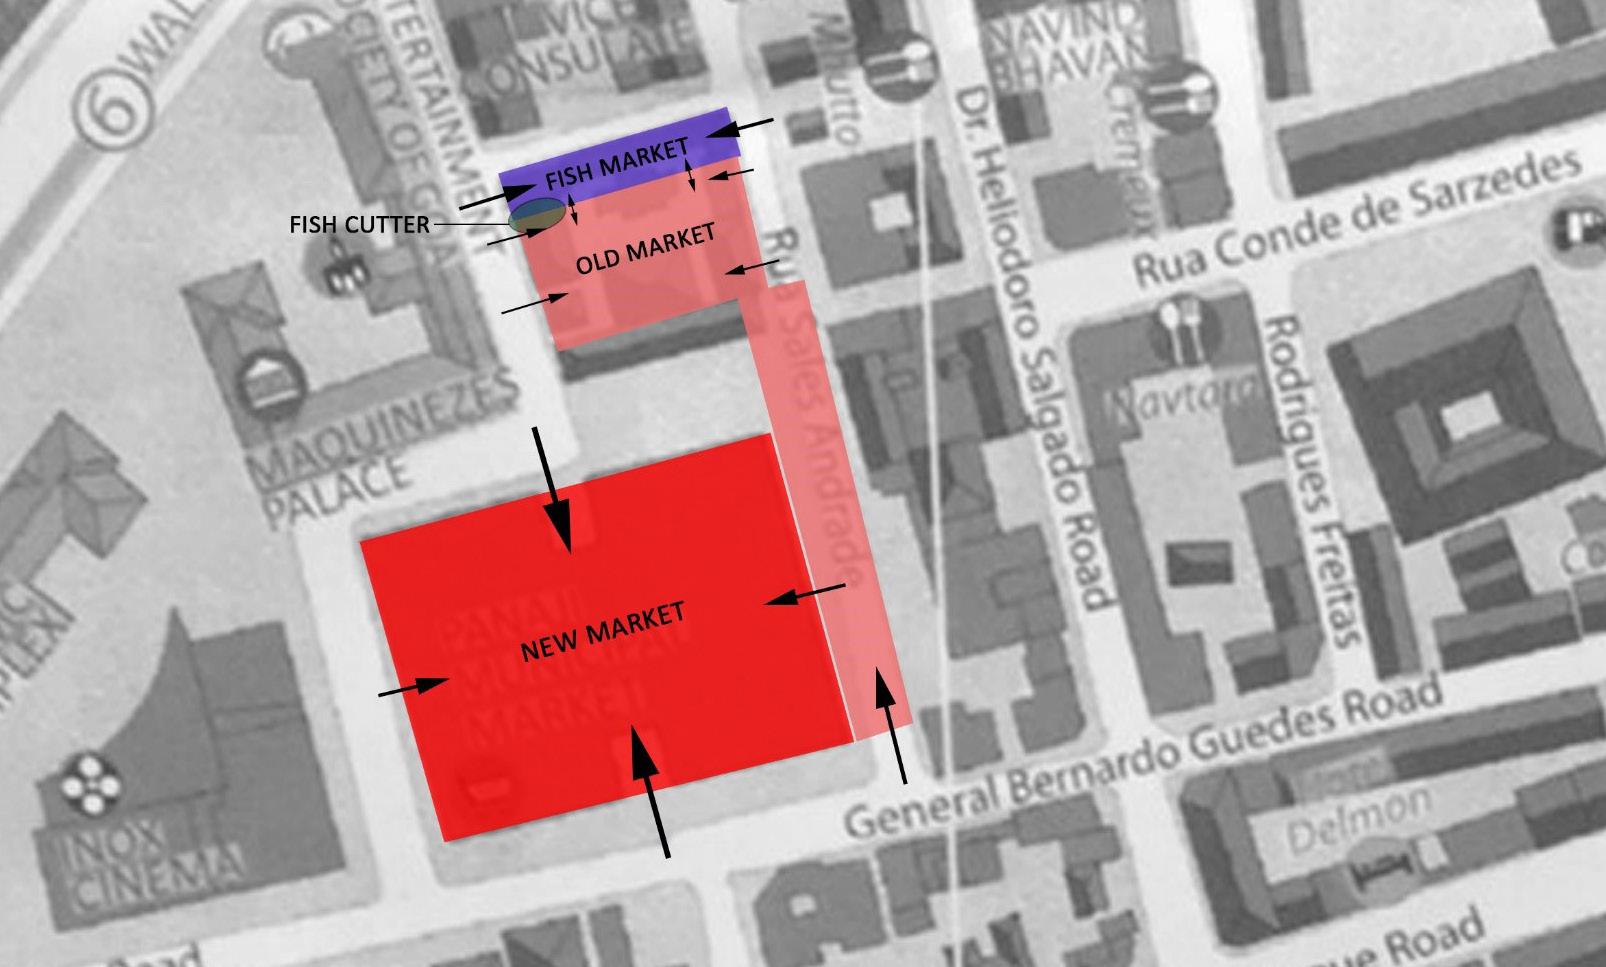
Fig B.11: Phases of the market
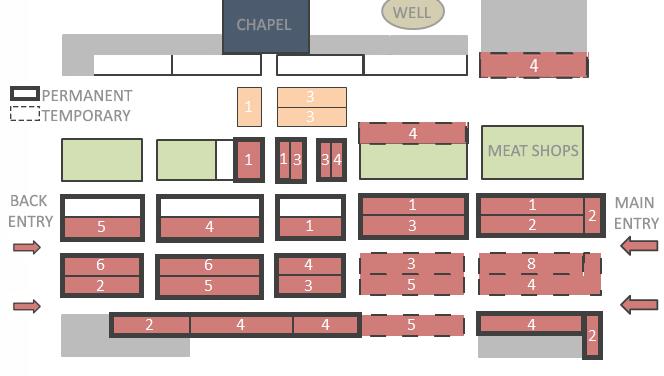
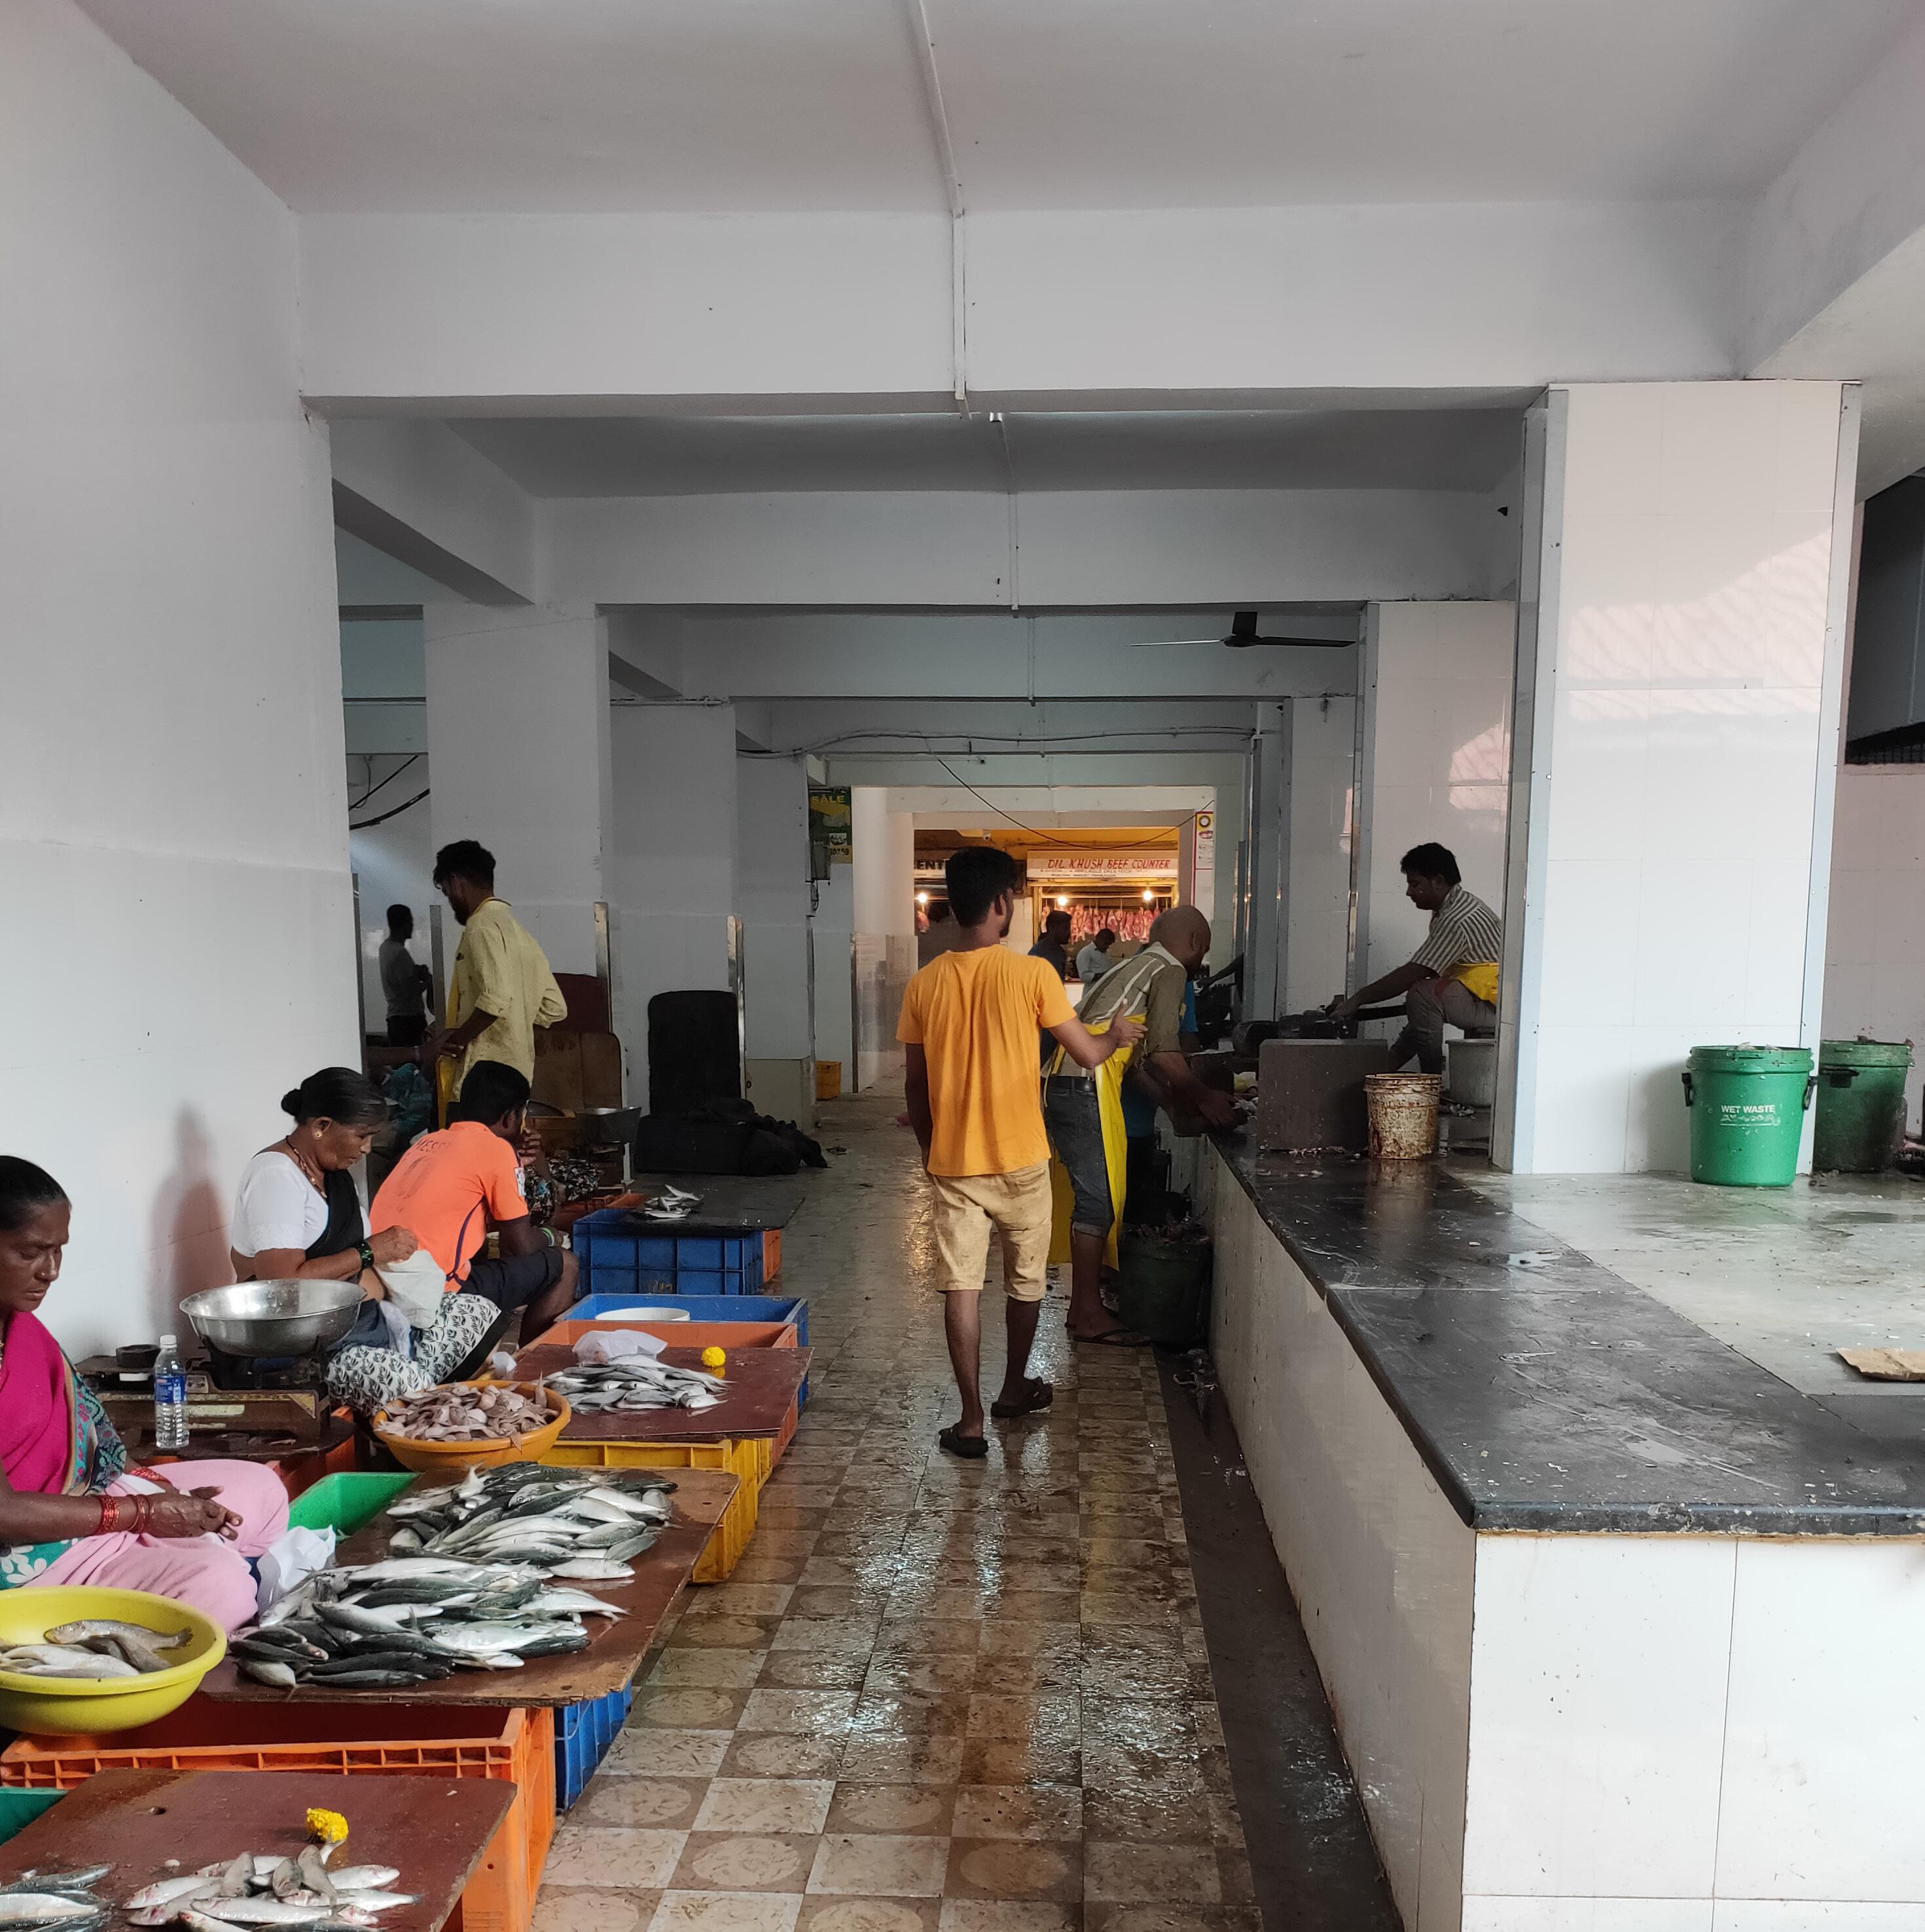
Fig B.12: Functions of the market
The market has existed in this area since the Portuguese regime and has evolved over the decades. When the structure of the old market was considered as falling the government intervened. They made a plan to demolish the old market and build a new market to accommodate everyone in the old market and the streets. The construction of the new market was planned in three phases. The phase 1 and 2 were completed in 2006 by Goa State Infrastructure Development Authority (GSIDC). The third phase has not developed since the planning stages. The people in the old market and fish market work in the to-be phase 3 area which is part of the old market. The market is maintained and owned by CCP (City Corporation of Panaji). Inspectors from the CCP collects rents from the vendors daily, both in the fish and vegetable market.
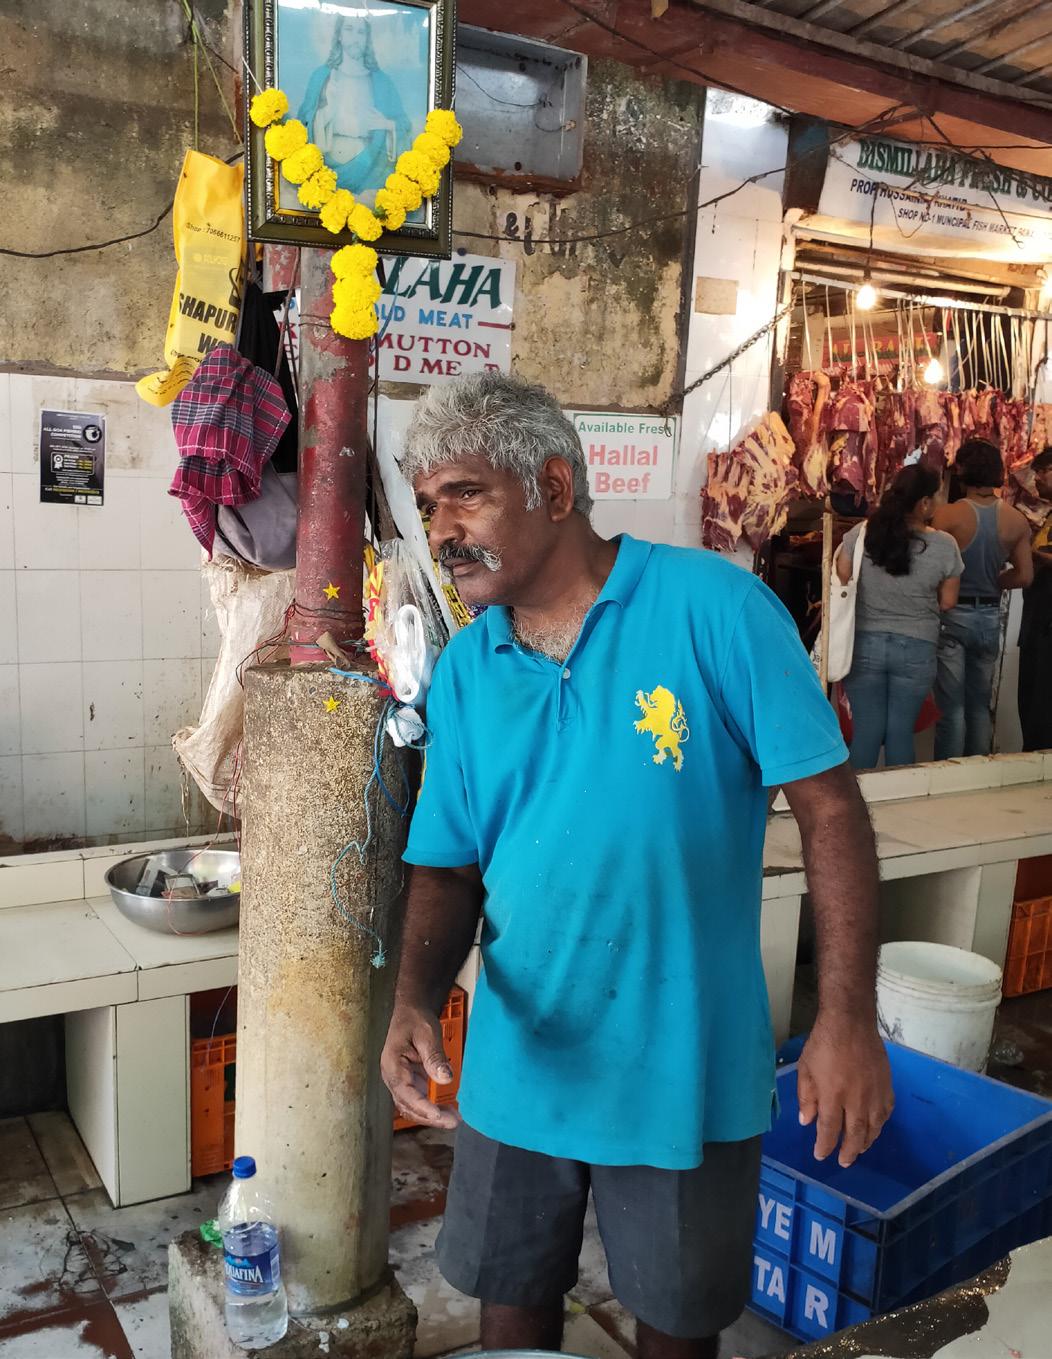
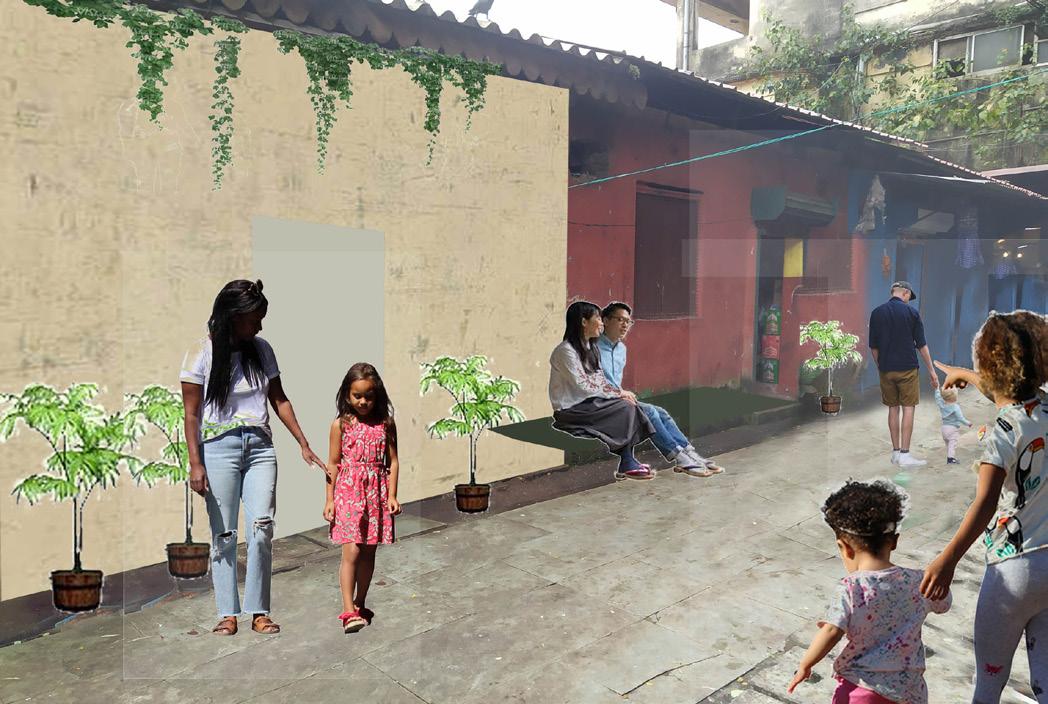
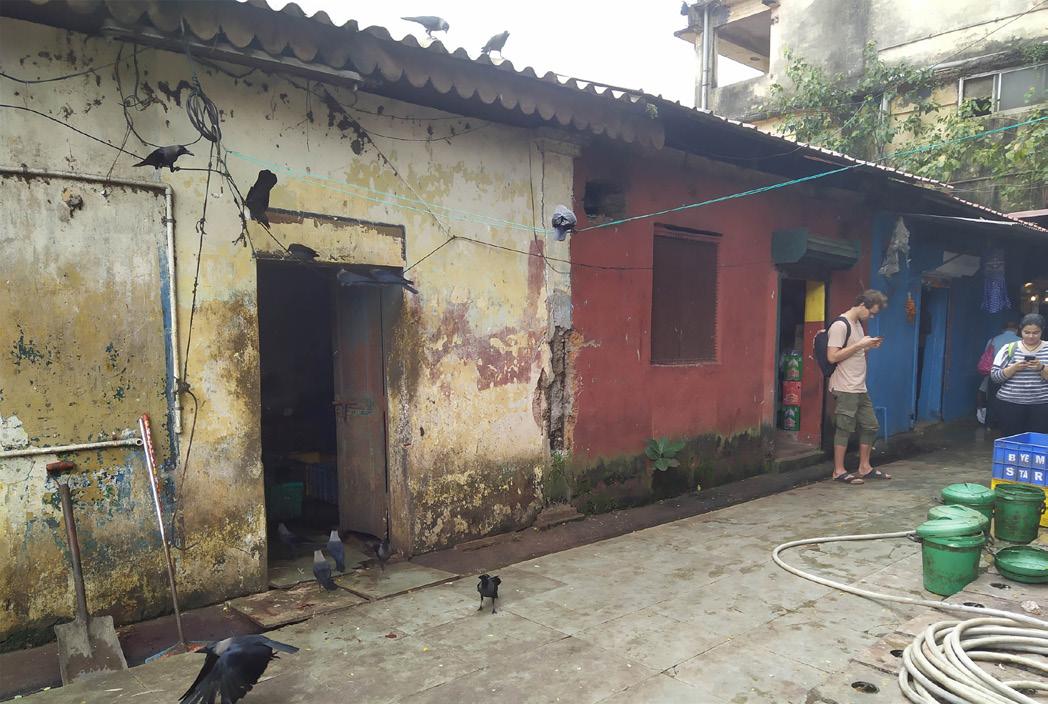
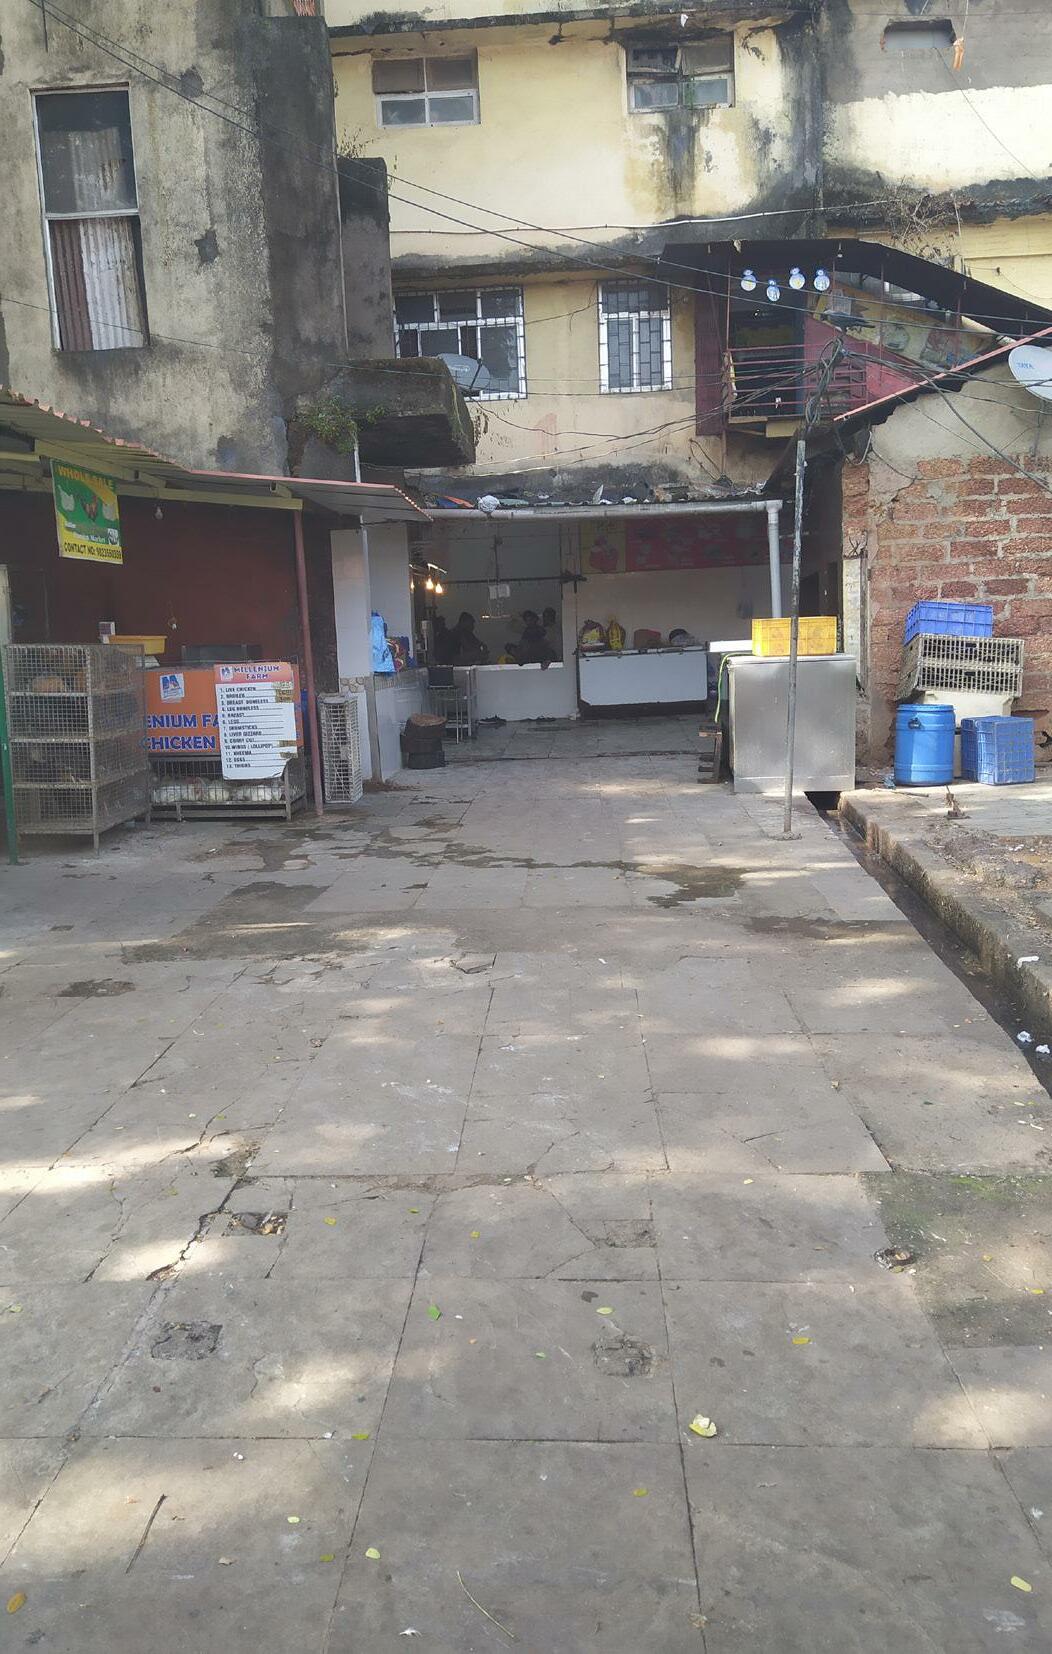
We can see multiple functions randomly spread across the market when studying the site of the old market. The fish market is the only entity who has a separate lane to sell fish. The fish cutters are located in alleyways as people buying fish from the market go to these fish cutters to get their fish descaled, dressed or filleted. The meat shops are spread all around the area with some general stores, so are two bars. The mixed-use building of the fish market has a chapel on the ground floor, a restaurant and a supermarket on the first floor and vacant floors in the middle. The top floor has a few rooms where people live. Some people are using the vacant stairs to socialize. The building is also known for prostitution activities.
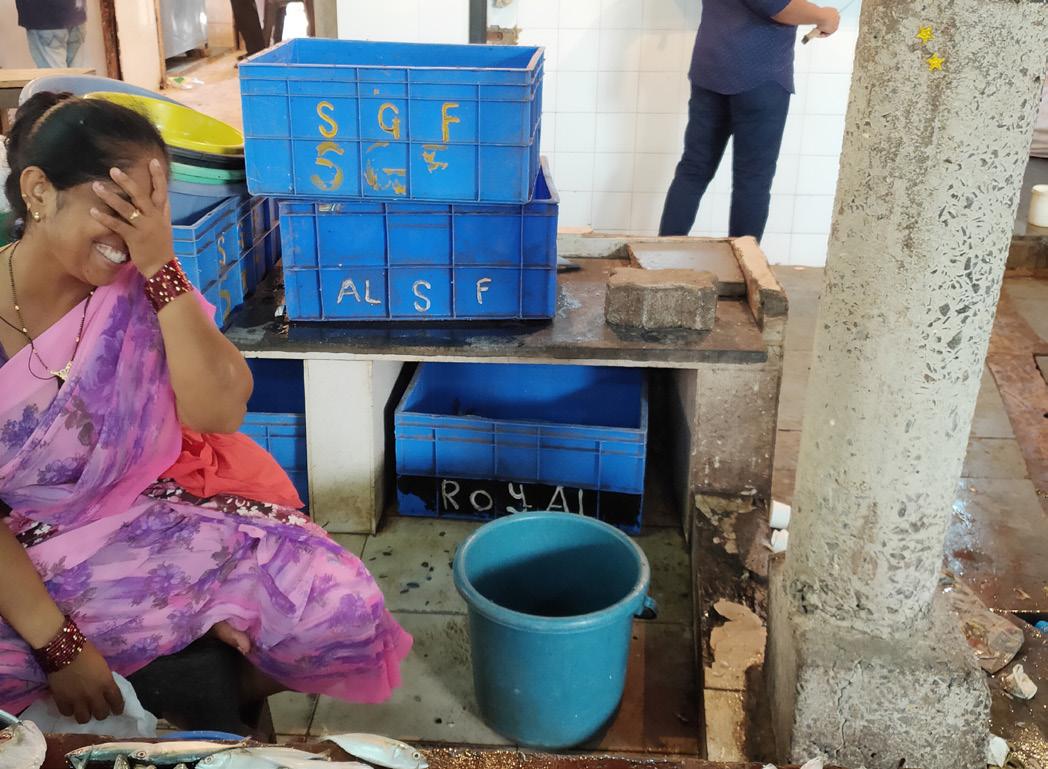
The central space or plaza is used by fish cutters as a changing area and a social place, there is one small roof in the plaza which residents use to dry their clothes. People gather for drinks in the bar sitting inside or outside on chairs in the plaza. No shops around the plaza have a direct sense of ownership to this place. The shops close around 9pm and it is rumored to become a place for illegal activities in the nightly hours. There is a lot of potential in the space considering the size, the central location and the minimal usage during the day. The lack of maintenance and cleaning limits the current willingness to use the space.
There is only one Boali/Well, the only source of water and is used for cleaning their stations and floors. It is located in the central space in the plaza with a drain running along it. Dumping of garbage close to the well is an issue due to the infiltration of this pollution into the water supplies. There is no running tap which is stated as a missing essential by the users.
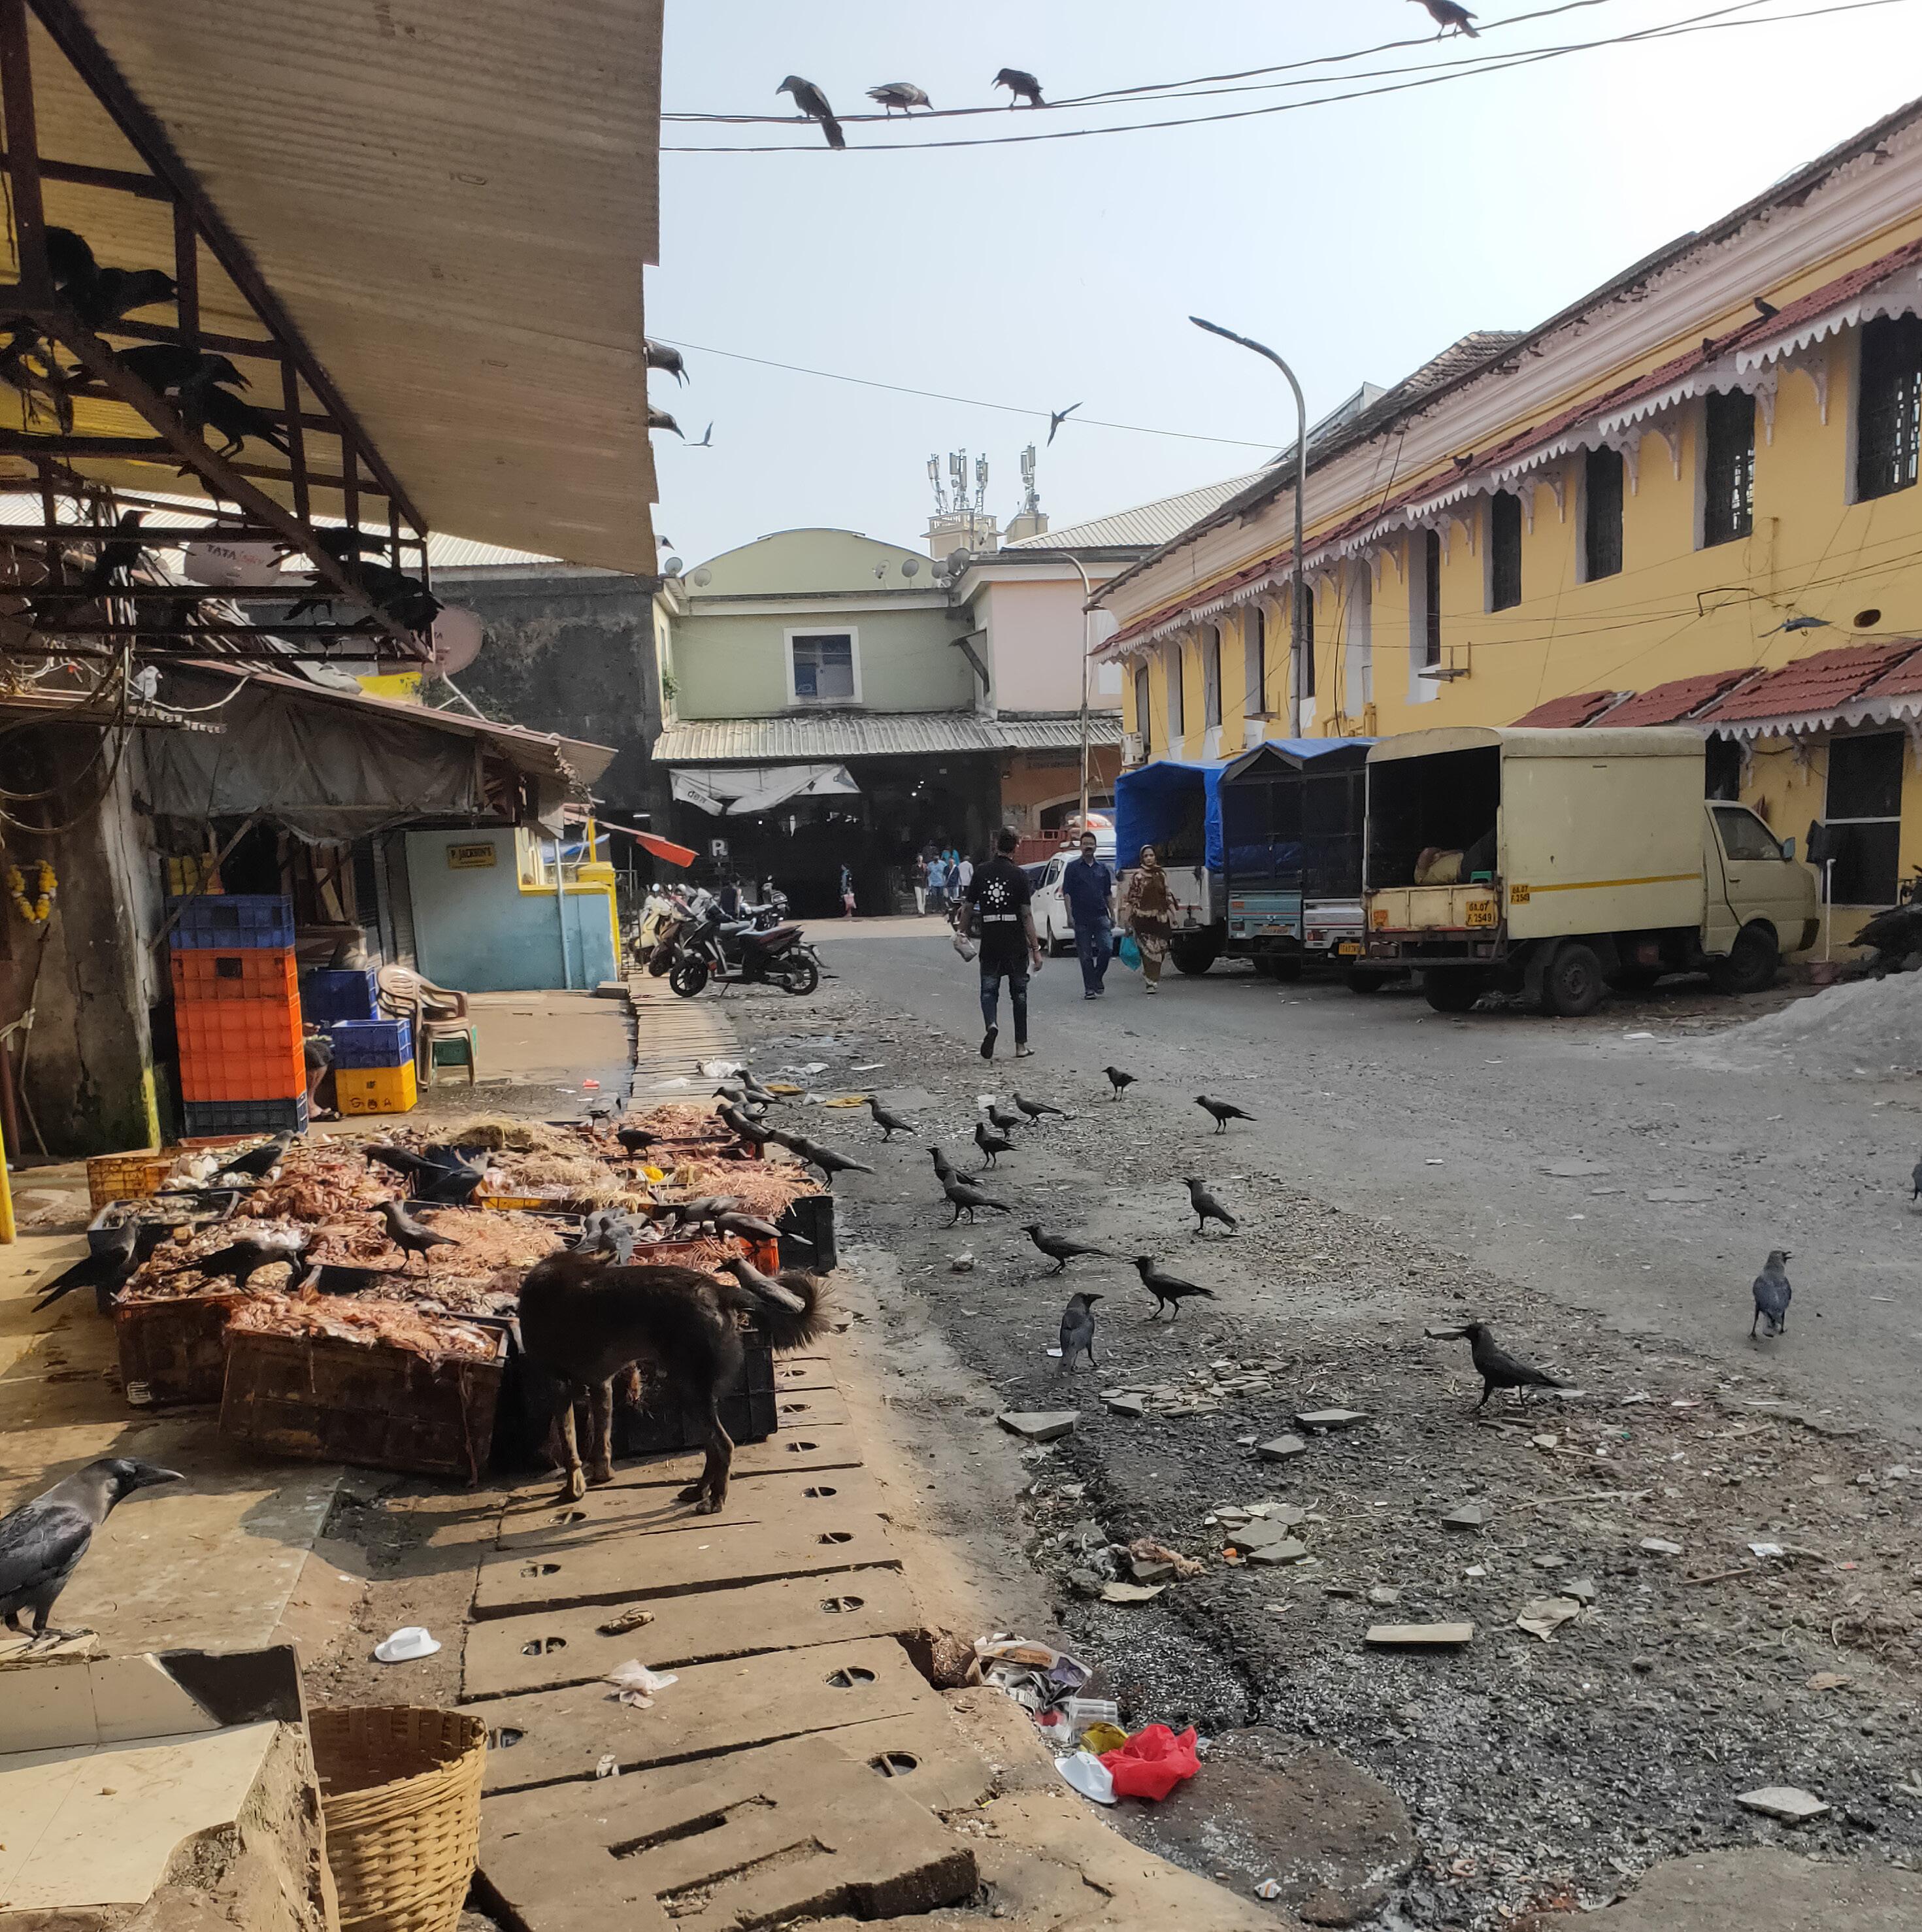
There was an office in the middle of the shops on the west side of the plaza, this is now a garbage collection point. It is located between shops, the fish market, and the well. The room is overflowing with garbage and infested with rats and crows. The entrance itself is small and the density of garbage make people dump garbage in more convenient areas, like the plaza. People have mentioned cleanliness and the uncomfortable fumes several times during our interaction methods. Around 50% of the organic waste from the whole market goes in a bigger waste treatment plant present between the old and the new market. The waste is segregated in different tanks and is cmposted. The CCP collects waste from that plant every three months.
“The beef and meaT shops should be in a separaTe area as a loT of hindu populaTion comes To buy fishes and They worship The cow, so we lose cusTomers because They don’T enTer spaces where They sell beef”
Despite what we consider harsh conditions and no secure tenure people are staying in this area. We have listened to a lot of stories about being in this area to gain an understanding of why people are there. To answer these questions, we have analyzed the assets of a few households in the market. We analyzed their Natural-, Human-, Physical-, Financial-, Social- and Political assets.
“The natural resource stocks from which resource flows useful to livelihoods are derived, including land, water and other environmental resources, especially common pool resources.” (Silwa, 2018)
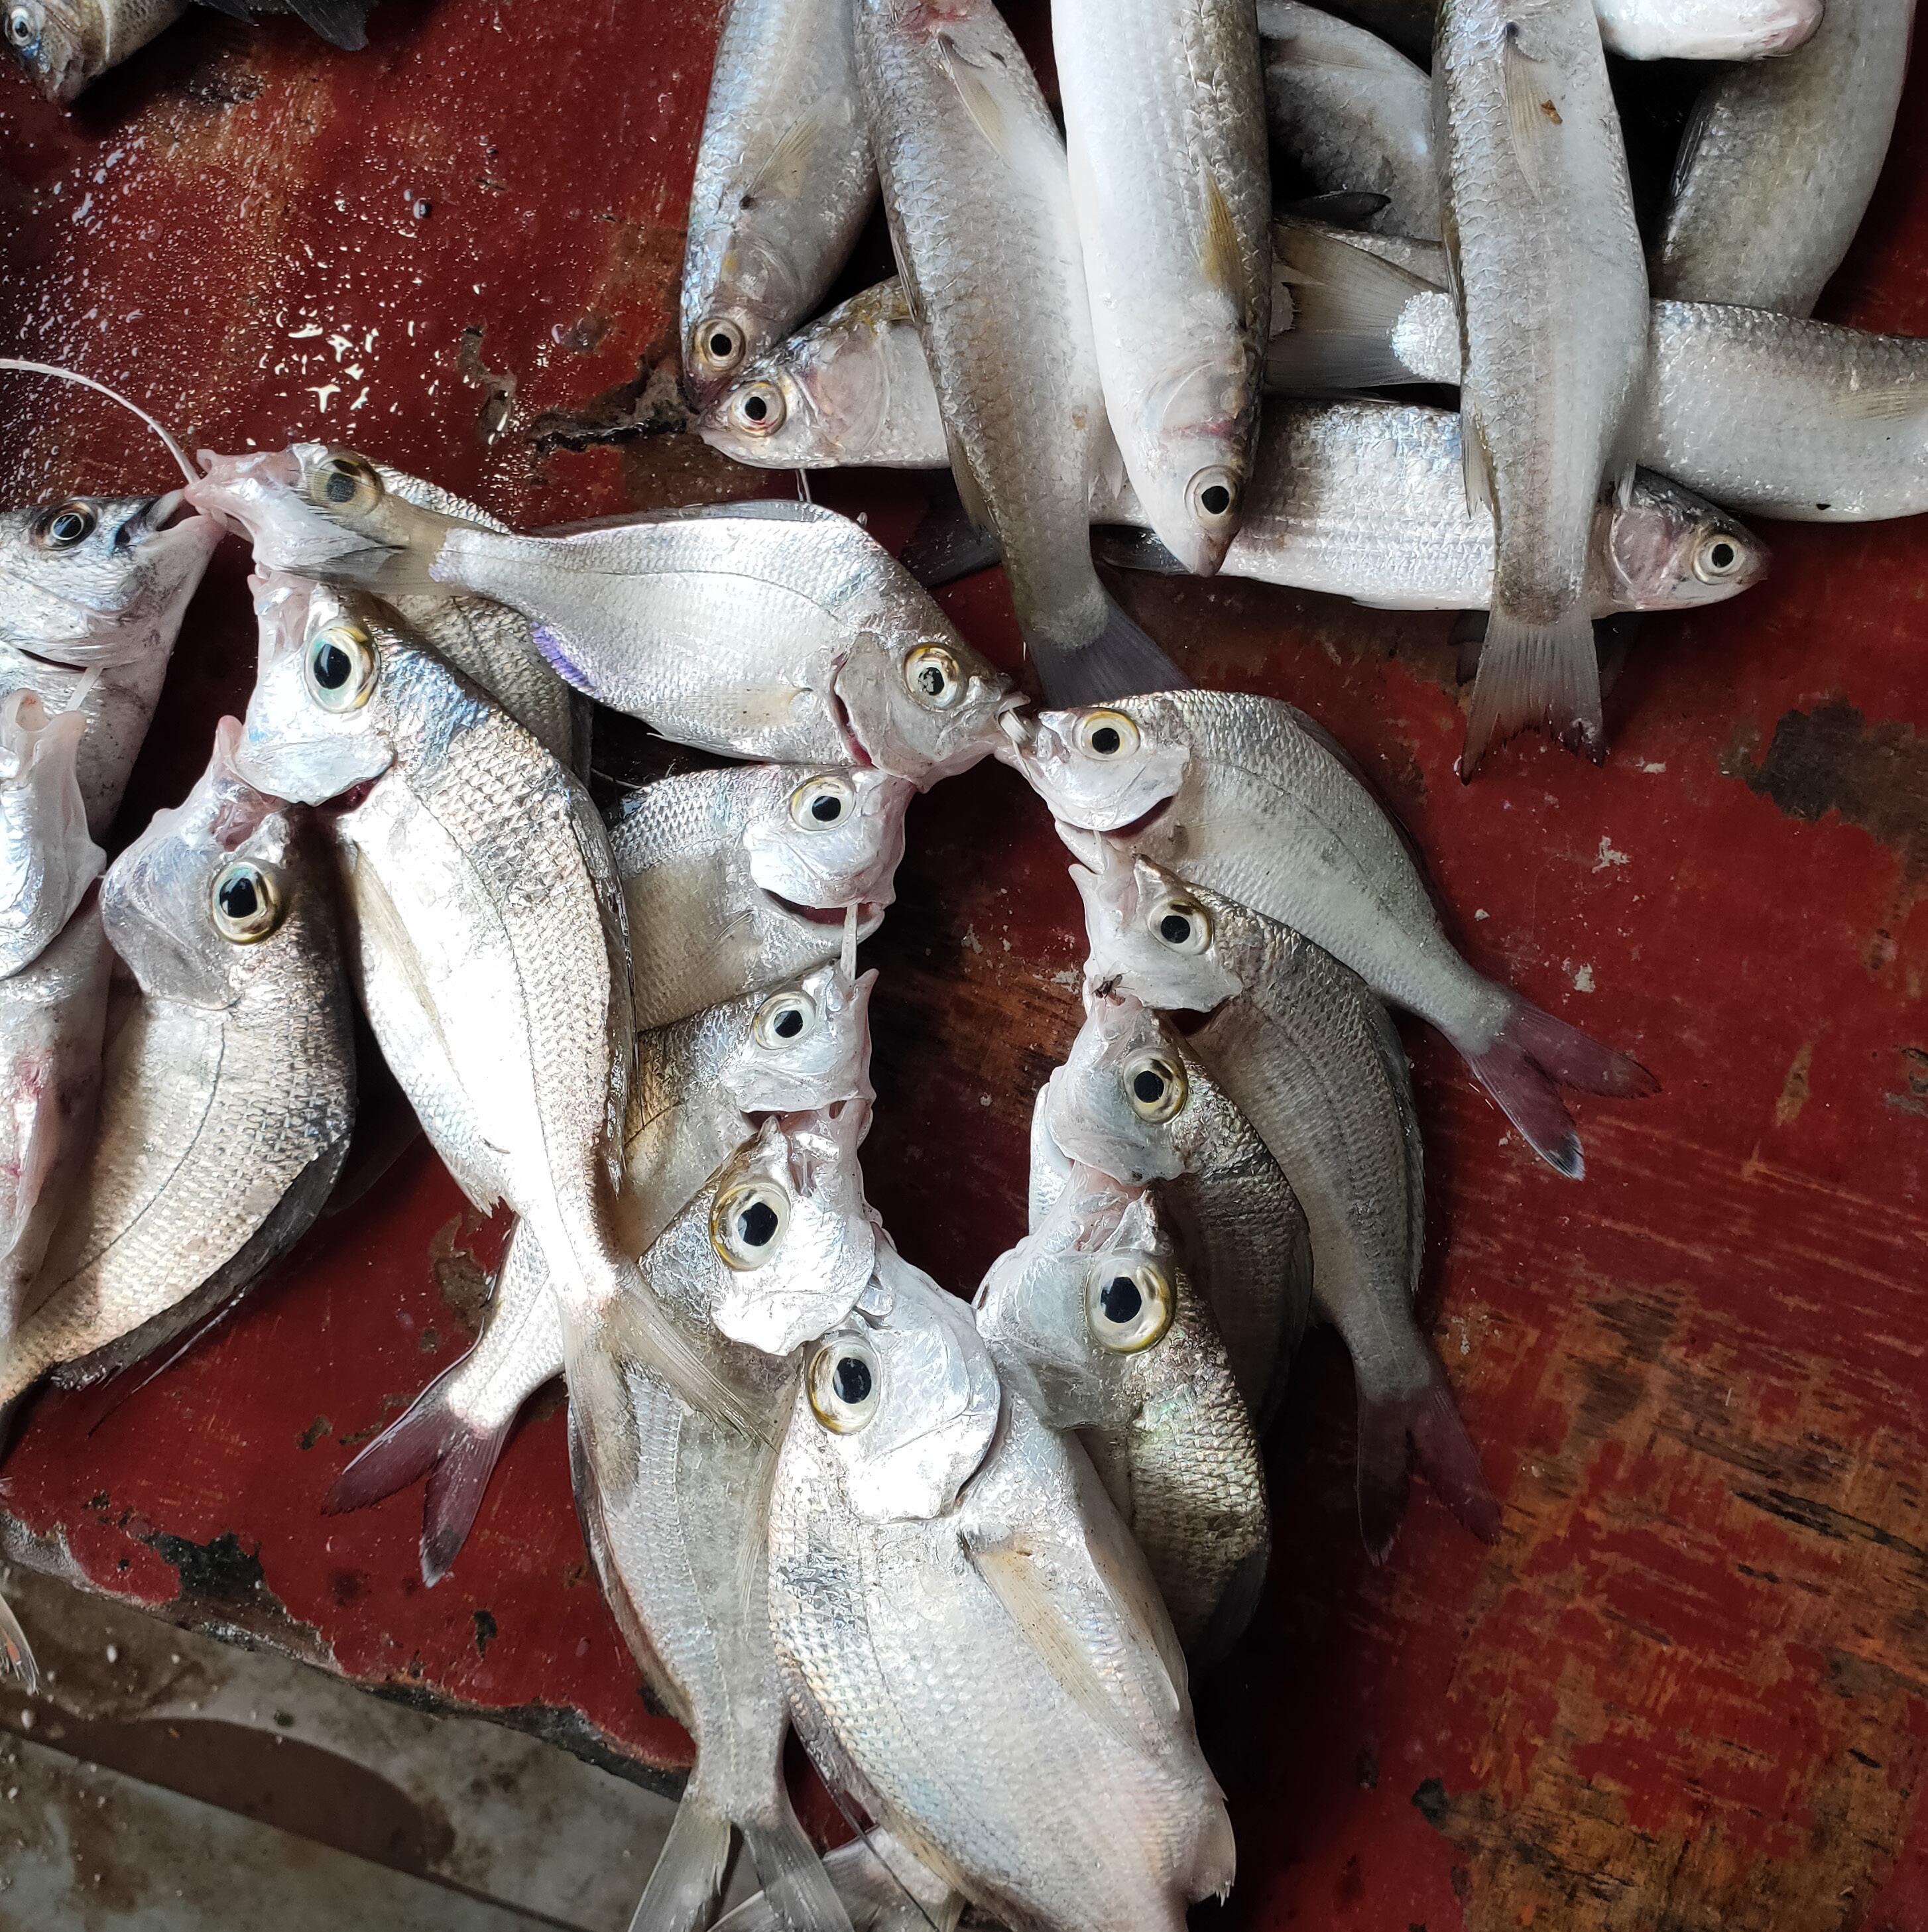
River is their most important natural asset which gives them access to the fish to sell in the market. Selling fish makes their livelihood every day and it has been a family business for a majority of them, a business that has been passed through generation to generation.
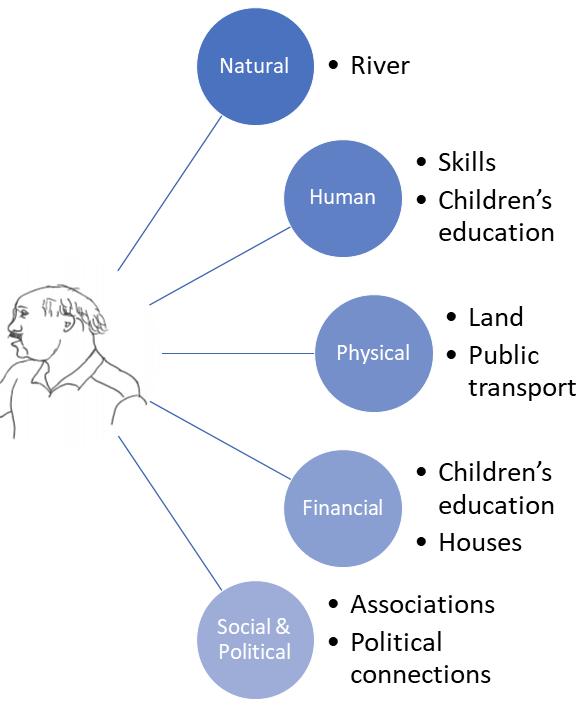
“The labor resources available to households, which have both quantitative and qualitative dimensions.” (Silwa, 2018)
Their main human capital is their skills and experience. Some fish cutters have been assigned to improve the ability of cutting fish to other fish cutters. Experience is shared through social interaction in the market and through family bonds. Most people in the market has taken over the business of previous family members or collaborate with them. These bonds are changing as the next generation has a will to be educated rather than taking over the family business in the market. Most of the shopkeepers cannot read or write. There is a shared
vision that this would be a better life for the next generation. The future of the market is going to be different as the next generation has been working in the service sector in different parts of the world meaning the inherited businesses will come to an end.
Physical or produced capital is the basic infrastructure (transport, shelter, water, energy, communications) and the production equipment and means which enable people to pursue their livelihoods. (Silwa, 2018)
The physical capital of these vendors is the land with a prime location in Panaji located close to the main road and just 100 meters away from the bus stop. The market serves a geographically large area in Panaji giving them a high customer group. However, the land belongs to CCP and not the vendors. The vendors have no secure tenure despite working there for decades. They have been promised a place after phase 3 is implemented and are hoping that this will improve their quality of life.
The financial resources available to people (including savings, credit, remittances and pensions) which provide them with different livelihood options. (Silwa, 2018)
They have invested in the education of their children and that is their financial investment or their backup plan in case their business fails. For some people working for others in the market, they have no secure financial capital except their houses back in their villages
The social resources (networks, membership of groups, relationships of trust and reciprocity, access to wider institutions of society) on which people draw in pursuit
of livelihoods. (Silwa, 2018)
The social bonds are strong with roots back in time as the market consists of family inherited businesses. This is their biggest social capital in the market. There is an association of 14 members that leads the market. It was formed by the vendors in the market nearly 15 years ago when there was a need for leadership and communication with the municipality and other associations present in the market area. The association is based on voluntary work and there is no assigned leader. Not being hired by CCP and being acknowledged by both vendors and CCP gives them influence in decision making in the market. In case of any issues CCP tries to communicate with them. There is an interesting Social structure existing in the market that we will explore in the next section.
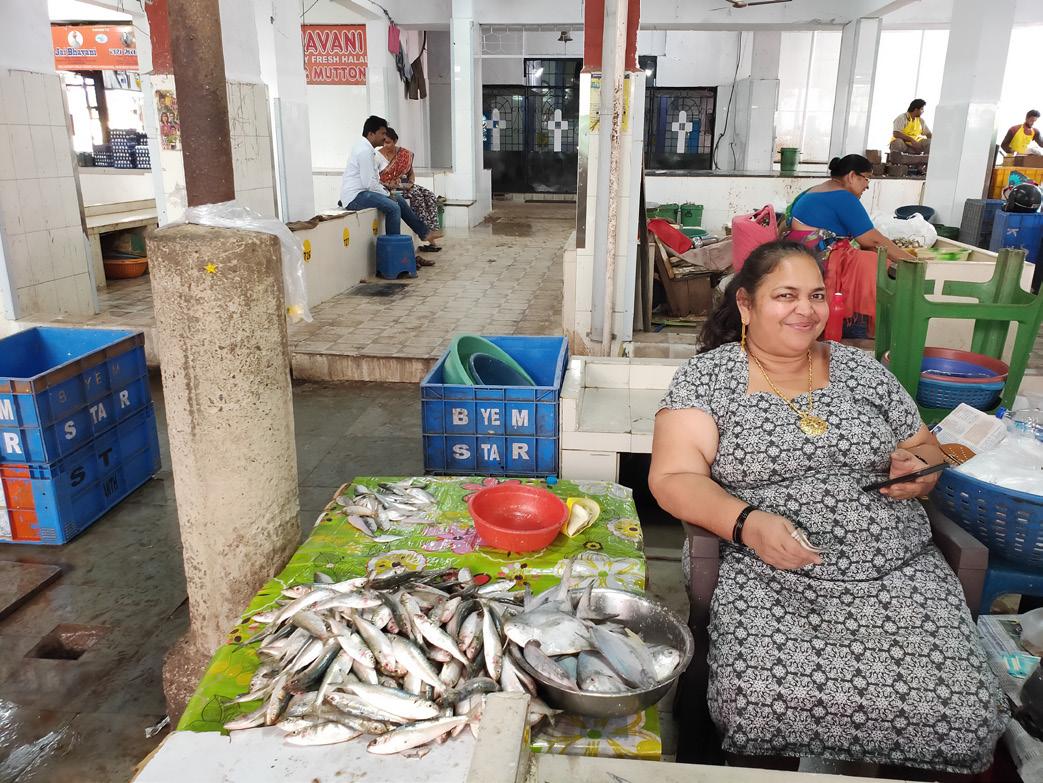
When we identify the most valuable asset in the market, the physical capital is very valuable as it is the prime location and brings business to the market. It is also the most vulnerable asset as the land belongs to CCP and they can revoke the land unless there is a contract. Another important asset are the Natural and Social capitals. The natural capital or the river is a very important source of their livelihood but it is very unpredictable. A recent storm passing from Goan coast in October 2019 led to lack of fishes for over 2 weeks. Everyone knows each other in the market since decades and that builds a strong social capital. Most of the fish cutter were trained by one person to support their livelihood. There social capital helped them build their human capital that helps them survive and make their living. For these Fish cutters, their Skills or Human Capital would be the most important capital. Whereas when we talk about the women in the fish market, they’ve educated their children and they work in corporate sectors now. According to them, this is their most important capital.
We found interesting social structures and analyzed how this affect functions and changes in the market. We will elaborate on that aspect in this section. There is an association in the market. There was no formal election for the creation of the association. It started as a discussion in which some volunteers were accepted as the association by the shopkeepers. The association consists today of 13 women and 1 man without having any appointed leader.
We also noticed hierarchy inside the association, where 3 women named Mary, Monica and Natalia(names changed) came across as the most influential leaders in the association. Anthony(name changed), being the only male in the association seemed really important to the association but he had less decision-making power in the association. He is more like a force that questions every decision for good, made by the association. Although there are a few clashes in between the members of the association but during a social interaction method called Star-game, it was observed that they were friends away from work.
To understand this social structure we played a game called Star-game(mentioned in methods). The goal of this game was to understand the social relations of the seller with the association members. We could identify two groups within the market which was influenced by where they sit or they know each other better because they sit close to each other in the market. There was another group of people in the market which was the workers (who worked for some sellers) and they could be identified as the third group. Also in this game no one went and gave stars to the leading ladies of market but they gave stars to the people who worked for them.
This showed that although the strong leaders of the association had a lot of influence on the market but they had limited social interaction with the sellers in the market.
The association manages the whole market with a parallel governance system. They play a major role in resolving all issues of the market, keeping the market up and running smoothly. They have strong social and political connections that helps them maintain the power position in the market. This power structure has both positive and challenging influences on the social structure of the market. It helps in making sure that the needs of the market are taken
care of but this system also creates a social hierarchical system in the market. They have come up with interesting livelihood strategies which tries its best to make sure there is a harmony in the market like new people wanting to work in the market have to go through the association screening but this sometimes might also lead to decisions that favors some influential people in the market.
The social structure of the market is also partially reflected in the physical arrangement of the market. We see a pattern that follows in who sits where in the market.
In a few focus group meetings that we had with the association members, we could see social and behavioral patterns that we try to explain below by describing three major meetings.
Meeting 1
Location : On the street
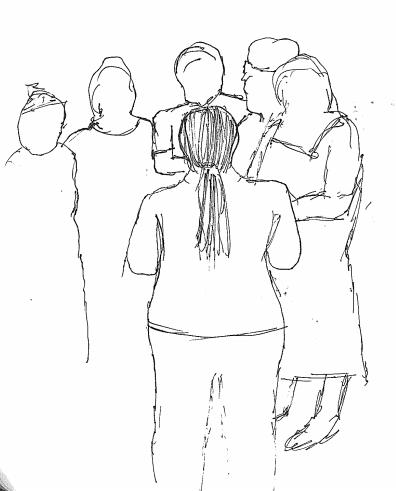
We met Anthony(name changed) during one of the other methods and we got to know that there was an association in the fish market and Anthony(name changed) was also a member. We arranged a meeting with them near the chapel of the market. We met 3-4 women mentioned above, part of the association of market. No one else showed up, we were told that the others were either sick or they went home. We got to know from them that there was no leader in the market and all 14 members worked together for the betterment of the market. We also met a few CCP employees, who supervise the market and they were good friends with these members, ensuring the smooth running of the market. These members and CCP employees had really good communication.
Meeting 2:
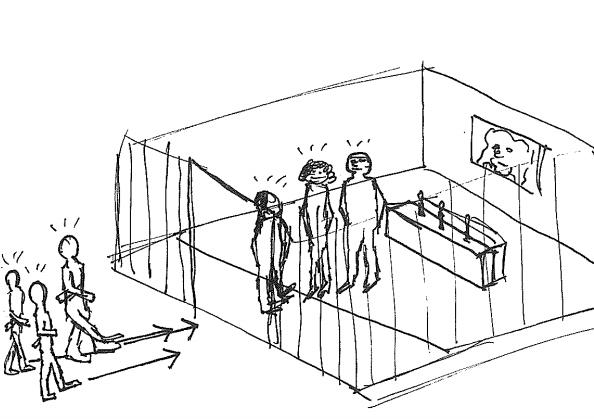
Location: Inside the market Chapel
Anthony(name changed) did not show up in the last meeting, so he called us to ask if we met the other members. While talking to him a lot of vendors from the market came to be part of the discussion. This did not happen in the first meeting. He told us that the association holds meetings in the chapel because no one can lie inside the Chapel. Also Anthony(name changed) told us about some tensions between him and a few members in the association.
As part of the intervention we wanted to arrange a group discussion with all the sellers of the market. We wanted to do this with permission from the association members as they could be the anchors. We were called for a meeting to discuss whether this was possible or not. In this meeting around 7-8 members joined. They talked amongst themselves in Konkani language, seemed like an intense and skeptical conversation and then one of them translated to us that they would talk to CCP and ask for permission for this meeting and inform us about the same.
In these three different focus group meetings, we could observe the relationship between different association member and the vendors in the market. We could also the communication pattern within the association members. These observations helped us understand different roles of the members in the association. This helped us plan our action proposals.
Findings from various analysis
After studying the social structures in the market we could identify its relation with the physical space. The association manages the present market well but had little to share about future visions for the market. Communication between the old market vendors and vendors inside the fish market was minimal. This is a major reason why the spaces in the middle like the plaza are becoming neglected as no one is taking responsibility. The plaza are getting highlighted for criminal and prostitution activities after the market shuts down. We feel like the social spaces inside the market do not have sufficient quality. There is a lack of space to rest in the afternoon when there is less activity. They use the space on the road and pull their plastic chairs outside on the road during their break. Some uses window sills to rest their heads while others sleep on their platform. There is no suitable space which can facilitate for everybody to be included in meetings. Discussions regarding requirements and issues is therefore done in smaller groups. If we take an example from the implementation of Phase 1 & 2 in the main market, we see that lack of discussions amongst the sellers led to a few unsatisfactory designs. The clerk of the official association stated, “Although the government did a good job but only if there was a discussion with the sellers before it was designed, there wouldn’t have been small design issues that now create problems for the sellers.”
Some vendors told us that there used to be a wide corridor in the middle of the new vegetable market for everyone walking through the market. However, it had to be covered by another row of platforms for the vendors because there were more sellers than estimated. There was a lack of platforms and so the walking area now has platforms which has led to a congested walking corridor in the center of the market.
The platform in the vegetable market is high for the ladies to climb. The majority of sellers in the market are older women and have challenges reaching their platform. There was no discussions between the users and the designers according to the shopkeepers. There was neither any discussion amongst users, they were only dependent on the municipality which led to retrofitting in the design after the construction. Now they use a temporary stool to climb up the platform. There are also issues with the depth of the storage below platforms because it is too deep to access.
Looking at learnings from the last phases of development proves that discussing with the sellers would be beneficial for creating their space. Changing the design process this way would create long term benefits for the users. Talking about social structures in the market, we did notice a subconscious hierarchy. The ones with the most influence are heard the most and they make decisions on the behalf of the working community in the market. This is meant to be in favor of the market but it has the tendency of leading to marginalization. This will continue if these groups are not taken into discussions with the people with more power. Consequently, it leads to these groups becoming disinterested in participating in market discussions. Limited power to influence changes in a direction is a major reason for this lack of participation. They lose a sense of ownership to the market which is an important anchor to maintaining the spaces. We tried to see if there were any discussions in which everyone was included but we could not find any for the two months we were here.
“Involvement of an entire group at this scale is understandably challenging. We believe that facing this challenge has the potential of creating an influential movement with stronger social bonds.”
“Areas in the market are left to decay, we work under the hypothesis that these areas could be improved if awareness and empowerment was brought to more people. “
“Any organization consisting of 100 people face social challenges.”
“The association is mentioned by both representatives from the government and the market doing a critical job for the functionality of the market”
There is a lack of communication between the vendors of the market. We believe triggering a discussion would lead to tapping unexplored potentials. If people feel inclusive in a discussion of their space, they would take responsibility and sense of ownership to the space. This would be an added value for the market and the municipality as well. This would be beneficial as the new phase is underway and discussions amongst the users led by the strong leaders could help them design their own space hand in hand with the municipality.
Our interventions and proposals

Our action proposal is Empowering an inclusive urban movement. We wanted to give them some tools that would strengthen the market community and make it more inclusive using the resources at their disposal.
One of the tools proposed was to initiate a get together where everyone could come and socialize and reflect on topics relevant to their lives. The idea was to bring people with different resources and ideas together. We also wanted to see the social connections between the leaders and the rest of the market.
This proposal was building a prototype meeting, with the topic discussing about the history of the market in an interesting and social way. We started this initiative together with the leading members of the market to hear if they had any thoughts or wanting from such an event. Their influence was important to us to for making this event happen so we wanted them on our side early in the process. The proposal took flight initially and people took on responsibilities to suggest space for the meeting and suggested practical arrangements such as chairs. We proposed using the plaza as we looked for new purposes for this space. After discussing this with them we agreed that the chapel would be more suitable as this is the only common area with a certain standard. All of these discussions were still limited to the leaders. One of our visions from a public discussion with everyone was bringing up more ideas and awareness. We wanted to arranged an interactive activity inviting
everybody involved with these spaces. This would lead to discussions and exchanging ideas.
The challenge with this idea was the influence of the municipality. The municipality owns the land and seems to have a strong hold on the things happening in the market. The association wanted to confirm with the government before deciding on doing the event. We were told that the municipality turned down our proposal. This led to mixed reactions by the association members.
After failing to go through with our plan, we went back to ideation stage and played a game called Star-game (as discussed in methods). This game was a simplified version extracting some ideas from the prototype meeting of interaction. We noticed that there was a boundary between the association members and the people working in the market. This strengthens our observation of the association being non-inclusive.
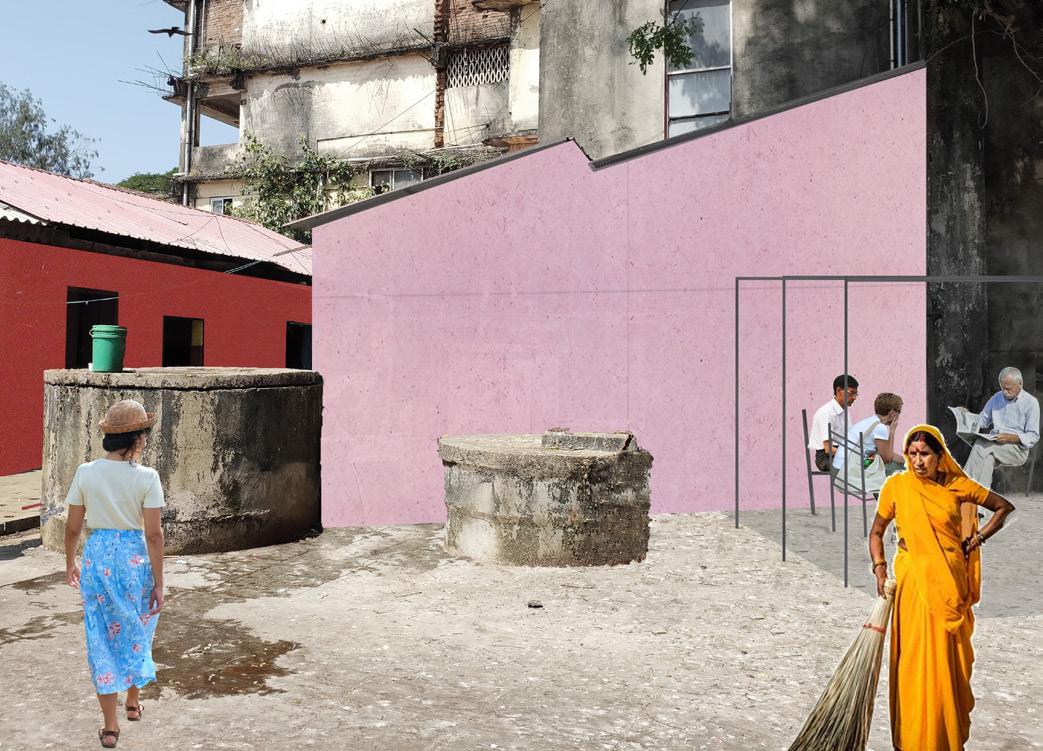
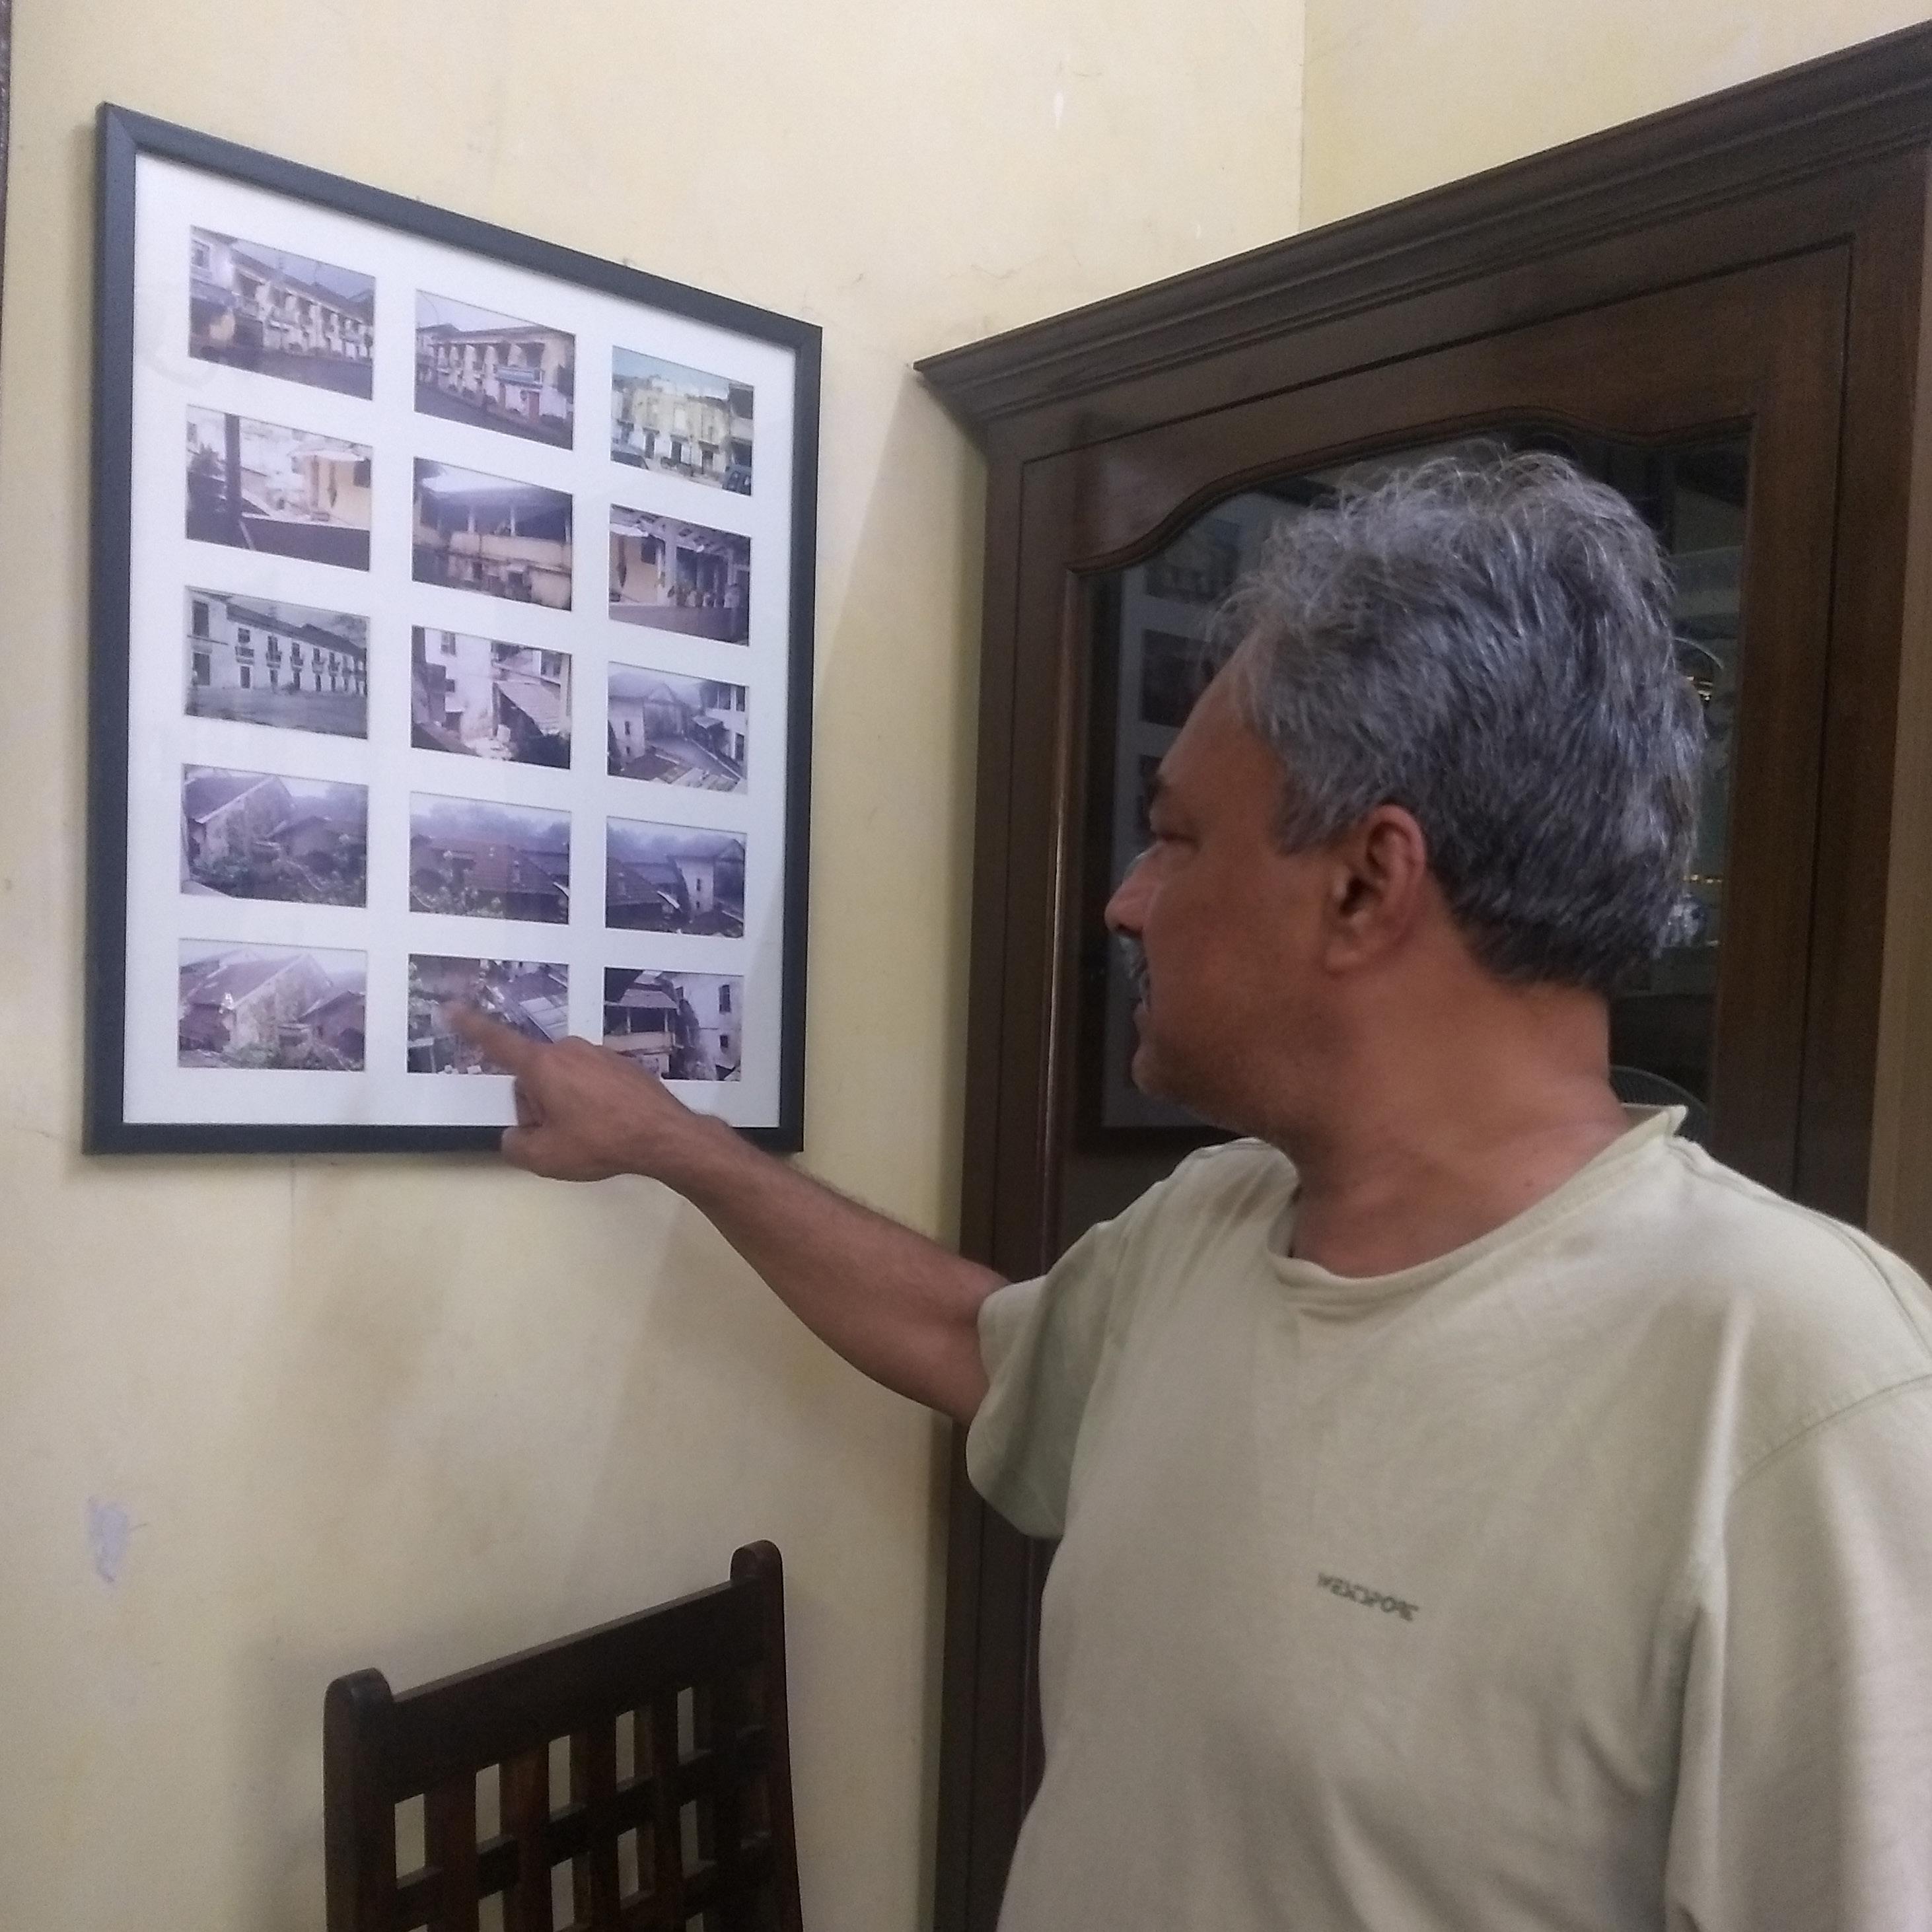
We wanted to leave something behind in the market after finishing our project. We have communicated some ideas with the community that has evoked some new ideas. We gave them pictures and suggestions about the space hoping it would trigger an informal discussion. We made photos showing before-and-after of some areas in the market which already led to some discussions. We hope that these discussions will be forwarded into the community by the people we have talked to.
We want the association to take responsibility and bring everyone together for a discussion about the future of the market. One tool that we wanted to discuss with the association was to give them blocks or Lego to imagine the space they were sitting in. Each piece representing their platform and ask them to arrange in a way they want to sit in the market. Imagining the space along with the basic needs of the market such as water, station for icing etc could help the sellers as well as municipality to make a better design for the market. That would save time and money that could be spent on retrofitting the issues in the market.
“The tiles on the floor are wrong and should be anti-skid”
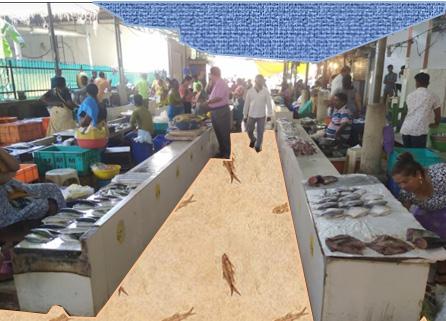
“I want the roof painted blue”
“I like that it is cleaner.”
During the three months spent in Panaji, we gained a lot of insight on the city and its people. Although the city is trying hard to be one of the best livable cities in India, it still has challenges. It is a touristic city with a lot of festivals with a lot of national and international tourists arriving. The city can be both a slow city and a happening city.
In these months we faced different experiences varying from exciting and involving communities to political tensions between the community and municipality. This gave us limitations on observing and empathizing with the community. We shifted our area of focus to the old and the fish market which seemed left out from the phases of development. The old and the fish market is a busy place at the peak selling hours and quiet in the break time. During our research we heard many stories, it was a challenge not to engage in a way that showed our predefined opinions. We strived to observe and listen in a neutral way without using these predefined opinions. We met people with interesting stories that connected their being with the market. These stories did not always link with each other as different perspectives gives different stories. This gave us dilemmas on being neutral, sometimes we decided to take sides to get more information and understand the community better. Different methods helped us. We started with studying the physical areas in the market and came across a really interesting social settings of the market. We went to explore the social structures and we linked them with the physical areas. We understood that people want to be heard but it is sometimes hard to speak because of existing hierarchies and how they are being managed. We could feel that people became skeptical when they were asked about their opinions because they do not feel legitimized. We also observed that the market which looked informal in the beginning was very controlled and formalized. All the vendors and street vendors paid
daily rents according to the areas they occupied. There was a very thin line between formal and informal. The association which was formed very informally, was legitimized as the municipality talks to them about the challenges in the market. Through our action proposals we were cautious about not leaving any negative impact on the community as we were observing the social structures. We tried to work with the limited resources at our disposal as we could not discuss with the municipality because of political limitations. We did trigger a few discussions and we hope that our interventions has spread some seeds to further help the people and the municipality.
An explanation of the scope, objectives, timeline, and process
The dynamics of the Central Business District (CBD) represent many diverse community aspects and informs the relationship between people and place. As in Murphy’s and Vance’s (1954) opinion, the CBD has been “the heart of the city.” With an array of users from full-time residents to business travelers, the CBD is challenged with meeting many diverse needs.
With so many stories to listen to, our original team of six needed to narrow down our scope to two sites where we could conduct area-based initiatives. After several weeks of semi-structured interviews and expert interviews, we conducted a mind-mapping exercise on the street. From this, we identified two more distinct zones/neighborhood from which to spur our more indepth fieldwork, the market, and East CBD.
East CBD is centrally located between tourist hotspots, civil institutions, and local commerce, with sparse residential sprinkled throughout the area. The area is framed by casinos in the north, religious institutions in the East and South, high commercial activity on the West, and Jardim Garcia D’Orta (City Garden) at its core.
The CBD is currently characterized by an accumulation of large commercial areas, government offices, and complex tourist-related activities which form the economy of the community. The dominant businesses in this area are typically small businesses that have been within the family for multiple generations. Of Panaji, 75% of commercial activity occurs within the CBD, which has been growing rapidly in the past two decades due to mass urban densification (Haravi 2010). This has given rise to an increase in the number of residents leaving the CBD. With the conversion of residential and single-story
dwellings into commercial and high-rise buildings, there is evidence of the CBD failing to meet the needs of its residents.
The morphology of CBD is not static but continuously changing in character. While some areas of the CBD reflect the past in their original site conditions, others show evidence of changes over time. The central areas, and in particular of the historical centers, contain an economic potential that is not sufficiently supported. The architectural heritage and the traditional character of the urban fabric can become productive factors, attractive for the installation of tourist, cultural, commercial activities, and even financial linked to globalization.
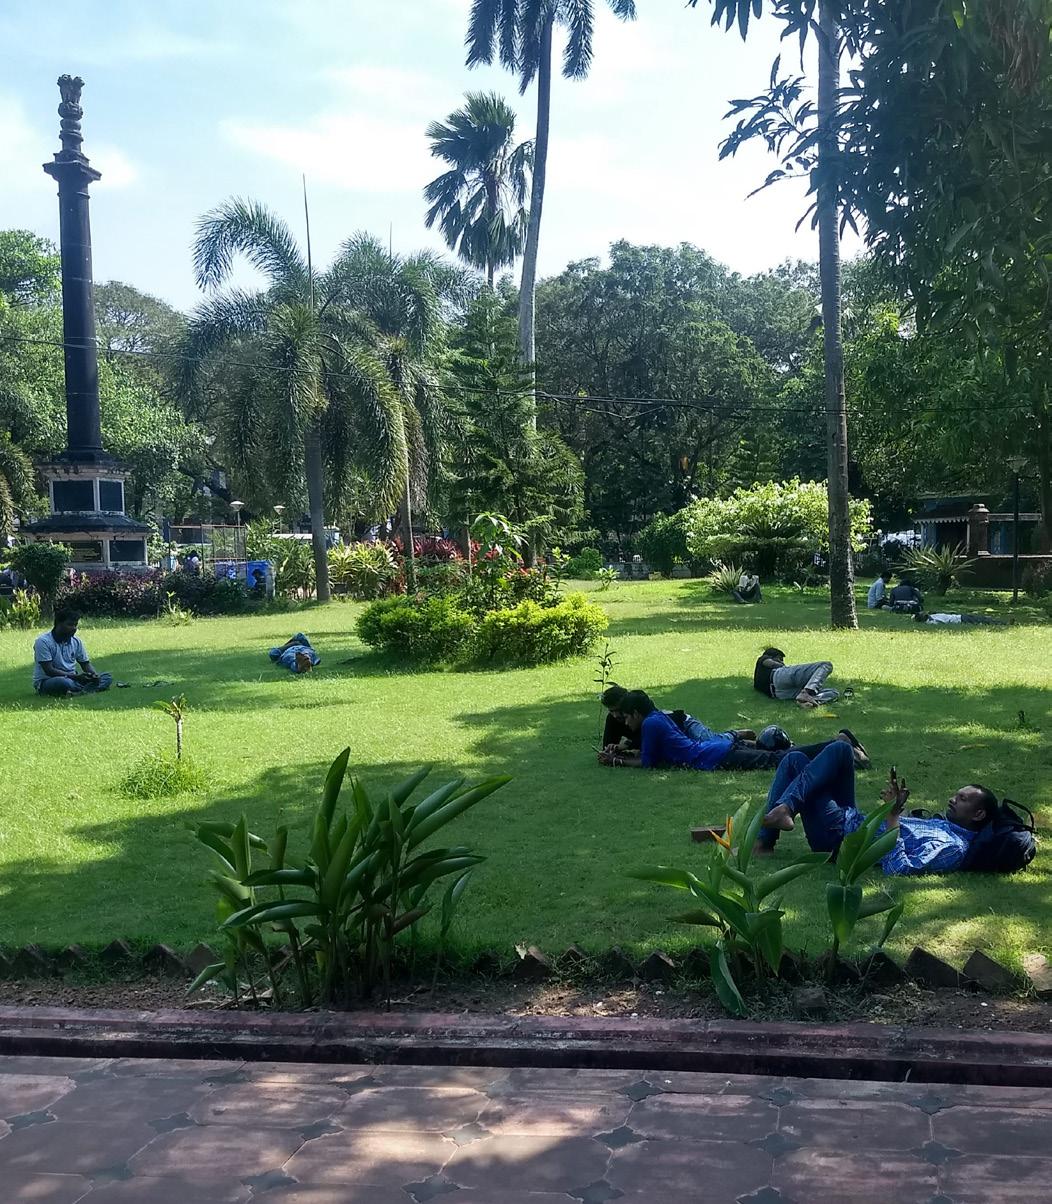
In order to gain a better understanding of the East CBD area, we focused on Jardim Garcia D’Orta and how it interacts with the city. This park provides a good representation of the area as a whole. This section of the built environment and its use tells the story of both those who occupy and those who are restricted from the space. The park is a melting pot of interests, perspectives, and experiences.
By analyzing these three levels, CBD, East CBD, and Jardim Garcia D’Orta, our team gains an understanding of the macro and micro-processes that affect various individuals. We observe the landscape, regime, and niche (Macagno 2019) systems at work. We can better understand the stakeholders and team players, which includes becoming familiar with the strengths, weaknesses, opportunities, and threats to the area and the people. All these must be in our scope in order to achieve our objectives.
During our fieldwork, we used several methods focusing on Jardim Garcia D’Orta and its surroundings due to its importance as one of the main landmarks in the city. This central park tells us the story of life in public spaces as experienced by the inhabitants, businesses, and schools in the area.
Our team approaches the work of UEP, and this fieldwork with humility and compassion. When traveling to Panaji, we do so not as subject experts but rather as practitioners of the built environment who listen carefully to those who live, work, and play in the area. These people are the experts of the city, and we are simply the facilitators with the skills to show them what is possible and how to achieve it.
To frame the fieldwork, we developed two objective statements to guide our work:
1) Use human-centered design thinking to get a holistic understanding of the study area and the many communities within it
2) Co-design strategic actions that would move the community towards their expressed desires, either in whole or through incremental steps
As international students with three months in the area, we faced many limitations. Many of these were logistical challenges such as the language barrier, understanding local history, and detailing the complex civic structure. The more significant challenges were gaining trust within the community, finding the hidden processes, and anchoring the project. The CBD forced us to look deeper for these connections as they were not easily identifiable. It took many weeks to find the gatekeepers who were able to facilitate our work.
Similarly, the park reveals which groups predominantly utilize the public space and gives us insight into the mobility issues that exist in the area. This park is of great importance because it reflects the challenges that Panaji faces in order to make public space accessible to all its citizens.
Fig. C.1: CBD and East CBD
“It Is a great place to watch the goan urban scene.” -resIdent
AUG 12TH arrival in Trondheim orientation week introduction to UEP
SEPT 25TH allocated groupwork site - CBD participation lecture talk from planning authority
OCT 4TH Identifying stakeholders Mental mapping exercise at Mr Baker
OCT 18TH Diwali break
SEPT 16TH arrival in Panaji familiarization with Panaji city
SEPT 30TH semi-structured interviews
OCT 7TH SPA Delhi students collaboration interviews with residents public brainstorming session in the park land use mapping
OCT 29TH semi-structured interviews
visits to school, residents and church communities
NOV 7TH observe program with Sunday school kids
NOV 20TH school workshop card sort game collage activity
NOV 26TH co-design opportunity to return to the community
NOV 3RD attend Sunday school and gather group for observe program attend mass
NOV 14TH analysis of findings and preparring co-design opportunities
NOV 24TH reflections
The process that characterized our fieldwork has been far from linear but instead, mostly cyclical, a rotation from divergent and messy phases to structured and convergent phases.
Throughout this cyclical process, one method would inform the other while issues and solutions were reassessed continuously. Drawing upon numerous different methods from IDEO’s The Fieldwork Guide to Human-Centered Design (2015), we took an explorative and participatory approach to data collection. Feedback from the community along this process was also crucial to our participatory approach for maximum community engagement.
This cyclical process was apparent during our research into such issues as accessibility and mobility, which were recurring themes during our interviews in the first weeks. From these issues, we were able to concentrate on one area, being the park, which we identified as a hotspot for such mobility, accessibility, and parking issues while being able to observe and invite community participation into a public sphere. Here we were able
to carry out ethnographic observations, community brainstorming sessions, and mental mapping. Furthering our understanding with new methods, we observed a lack of women and children accessing and occupying the park bringing up concerns of safety, social inclusion of marginalized, and quality of public space.
Our rationale for the different methods we employed at various stages of our process was informed by first reflecting upon which question we wanted to be answered and then going further in-depth with which issue we wanted to tackle. Reflecting upon the insights these methods provided, we narrowed in on recurring proposed solutions. We then focused on taking these potential solutions back to the community in the form of co-design methods. These co-design methods took the form of a school workshop and engaging in community feedback.
Fig. C.2: Research Process Followed
Fig. C.3: Design Process Followed
PRACTICAL PROBLEM motivates definesfinds
helps to solve RESEARCH QUESTION RESEARCH PROBLEM
RESEARCH ANSWER
Observe, engage and immerse. The goal is to understand the people for whom you are designing, building empathy for who they are and what is important to them.
The area to focus upon explicitly expresses the problem you are striving to address through your efforts.
Insight into the problem. Watching what people do and how they interact with their environment gives you clues about what they think and feel.
Stage of transition from identifying problems into exploring solutions.
A detailing of the participatory methods used and their takeaways
thorughout eldwork
by the
about the use
create
The initial phase of our fieldwork focused on the familiarization of the broader Central Business District (CBD) in collaboration with Group 3. During this phase, both groups focused on attaining a holistic understanding of our community’s dense and diverse context. This entailed splitting into pairs and covering opposite ends of the area with informal interviews, walks through neighborhoods, photos, sitting and observing at busy intersections, and dining at local restaurants. Through this passive and active immersive exploration extending across each corner of the site, we were able to establish our first understanding of the prevailing scenario of the CBD context.
Aimed at empathizing with the community and engaging with diverse stakeholders, this method proved effective at gaining an initial insight into community concerns, demographics, and important moments in history. As we spoke with people, we tried to focus on standard questions for everyone that pertained to socio-economic status, mobility, and challenges. During the SPA workshop, this took the form of a short questionnaire; but due to its rigidity, we quickly stopped using it. Expanding from the standard questions, we used open-ended questions that encouraged a story format response. This flow created an open dialogue and relaxed atmosphere from which more honest expressions of concerns were unveiled.
• People expanded on the topics that were important to them
• Gained a wide array of insights
• Helped community members familiarize themselves with us and build trust
• Our capacity was limited due to the time it takes to talk with many people and the language barrier
• A good number of responses appeared shallow
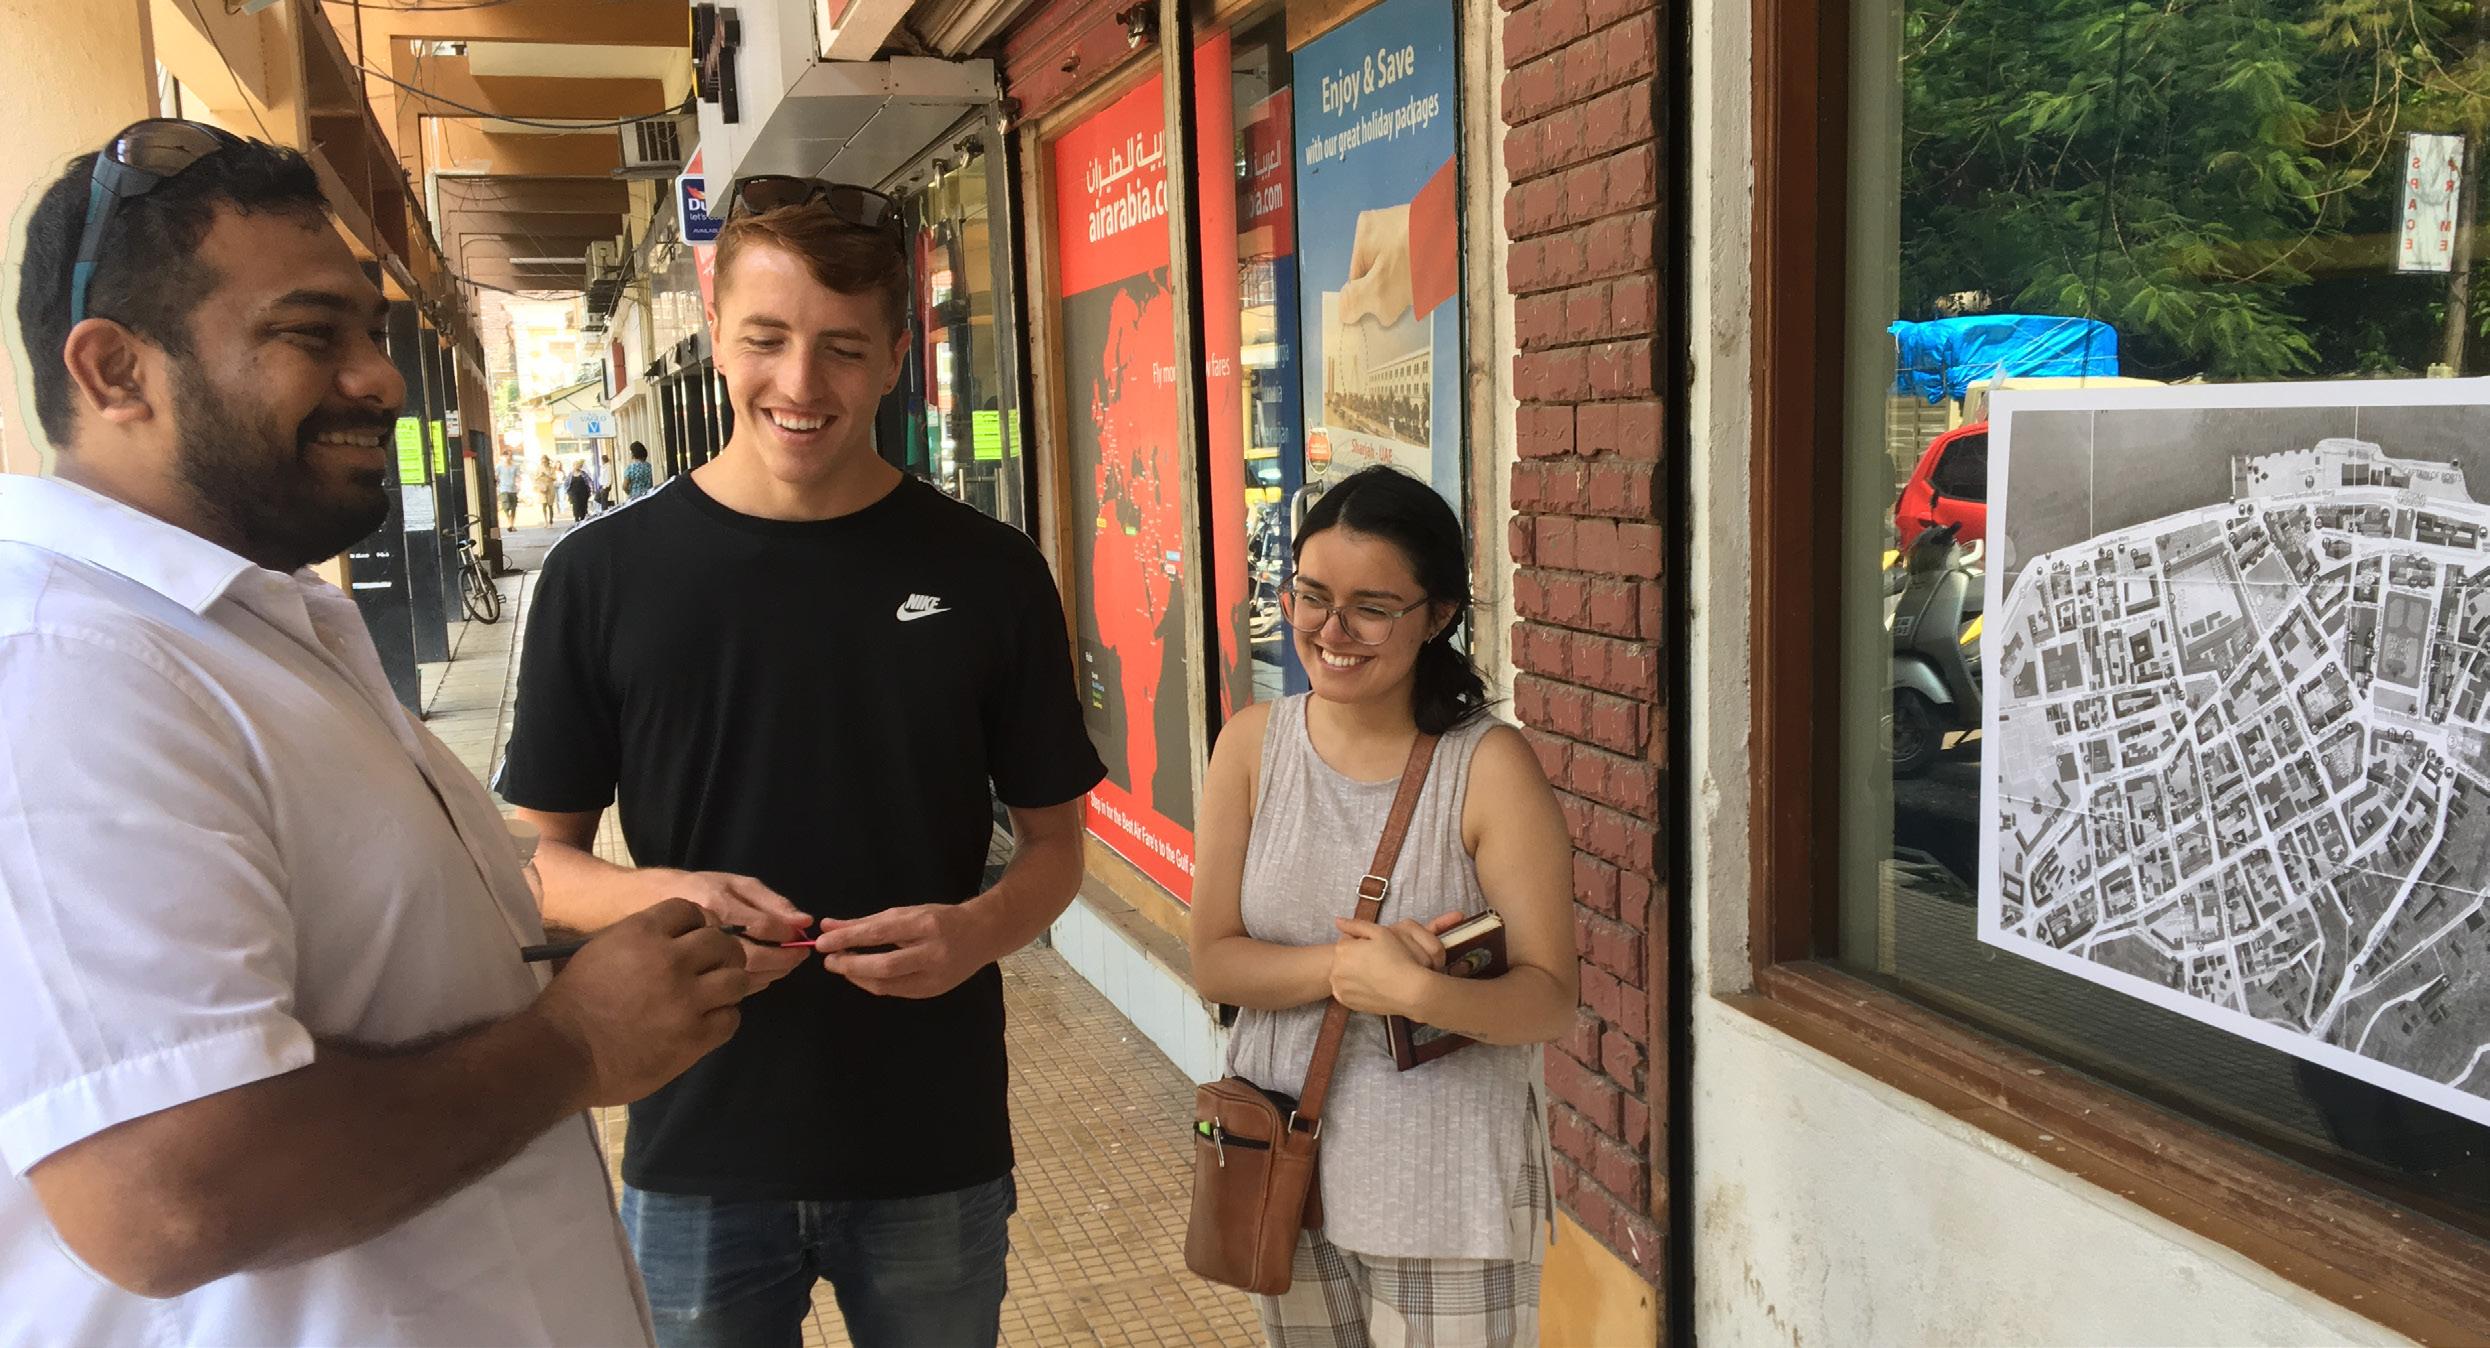
Following familiarization, we needed to converge all the knowledge gained so that our groups could split into two different areas. We printed maps of the entire CBD and asked individuals to mark their most and least favorite spots. Group 4 taped the map outside Mr. Baker. The large map drew attention as people visited the shop and were walking by.
“the market Is the one place I hate vIsItIng yet have to vIsIt weekly for my grocerIes”- resIdent
First asked to mark their most and least favorite spots, pedestrians were then asked to elaborate on their answers. Through this method, the market was labeled with many negatives and Jardim Garcia D’Orta as a significant landmark with varied perceptions.
This tool for data collection was used throughout our fieldwork. Taking on both active and passive forms, observational ethnography was instrumental in understanding what people would not say. We took many opportunities to observe the site under different scenarios, such as during weekdays and weekends, mornings and evenings, regular days, and activated events.
More active forms of observation entailed hand-drawn sketches of entrances, positioning oneself at a critical junction, and taking in nuanced details that are grasped better in sitting, studying and drawing rather than only taking a photo.
As part of observational ethnography, we noted the importance of data collection on the use of the park over the course of a day. Focusing on Jardim Garcia D’Orta, we aimed to understand how people used this public amenity throughout the day. By revisiting the site and its surrounding area each hour from early morning to evening, we mapped the changing activities and the prevailing demographic. It was during this daylong immersion in the space that we observed the first children we had seen interacting with the park.
• Observed things that would not be revealed through conversation
• Allowed us time to analyze the environment from our perspective as subject specialists critically
• Easily influenced by our perceptions and assumptions
This method for participatory data collection allowed us to experience a guided tour of sorts with local residents and a local shopkeeper. This was insightful as it meant that the locations and discussion points were more controlled by the member of the community guiding us. Giving this responsibility to the member of the community-generated more personal points of discussion.
We decided to conduct this method with people from the community who showed interest as well as comfort in engaging with us. These key stakeholders often had the most history and frequented the area the most often. They took us to otherwise overlooked spaces that happened to be where their kids played, such as along the side of the church or along stairs.
• Visualized concepts for us rather than thinking abstractly in some room during an interview
• Established trust as others saw us walking with trusted members of the community
• Some potential participants denied due to the high visibility aspect of the walk
Mainly in the beginning stages of the fieldwork, we conducted expert interviews. Talking with subject experts from government bodies, universities, and an array of community institutions, either as a class or in our group, gave us an in-depth look into critical topics. Approaching a wide variety of experts across our very diverse area gave insight into the heavily bureaucratic and siloed
systems in place. Facing adversity and struggling to make contact with some institutions forced us to approach them more creatively.
• Insights into complex topics
• Talking with people who have been working on the topic for years
• Some individuals were hesitant to be overly honest as they were speaking on behalf of the organization
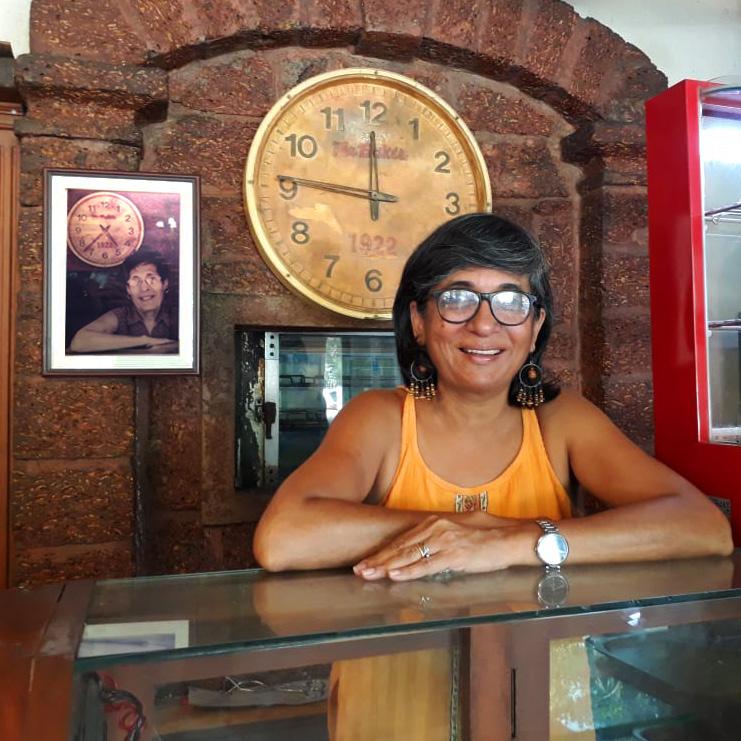
Through many of our methods, we made contact with key members of the community. Ranging from long term residents, business owners, and community heads, these individuals welcomed us into their homes, shared their stories, and gave an insight into current and past conditions. Thanks to these neighborly and responsive individuals, we participated in family prayer nights, played with their kids, and saw their family homes. We also immersed ourselves in local events, celebrations, and activities ranging from community meetings to Sunday mass.
• Provided an in-depth perspective at people’s lives
• Helps reveal people’s motivations for their actions
• Those who are not privileged enough to have the time and resources to let students invade their lives may not be well represented
• Uses a lot of time and energy
This method was also undertaken in collaboration with SPA Delhi students. With Surya, Koyel, and John, we posed the question to users of Jardim Garcia D’Orta, “if this park could be anything, what would you like it to be?” Positioning ourselves in the center of the park, we engaged with many people, including tourists, business people, and residents.
• Gave surprising findings, such as the park is used to sleep after people spend all their money at the casinos
• Having the SPA students present allowed us to get responses from Hindu speakers
• Many answers were superficial and represented the status quo of those already in the park
• Individuals were hesitant to write their responses
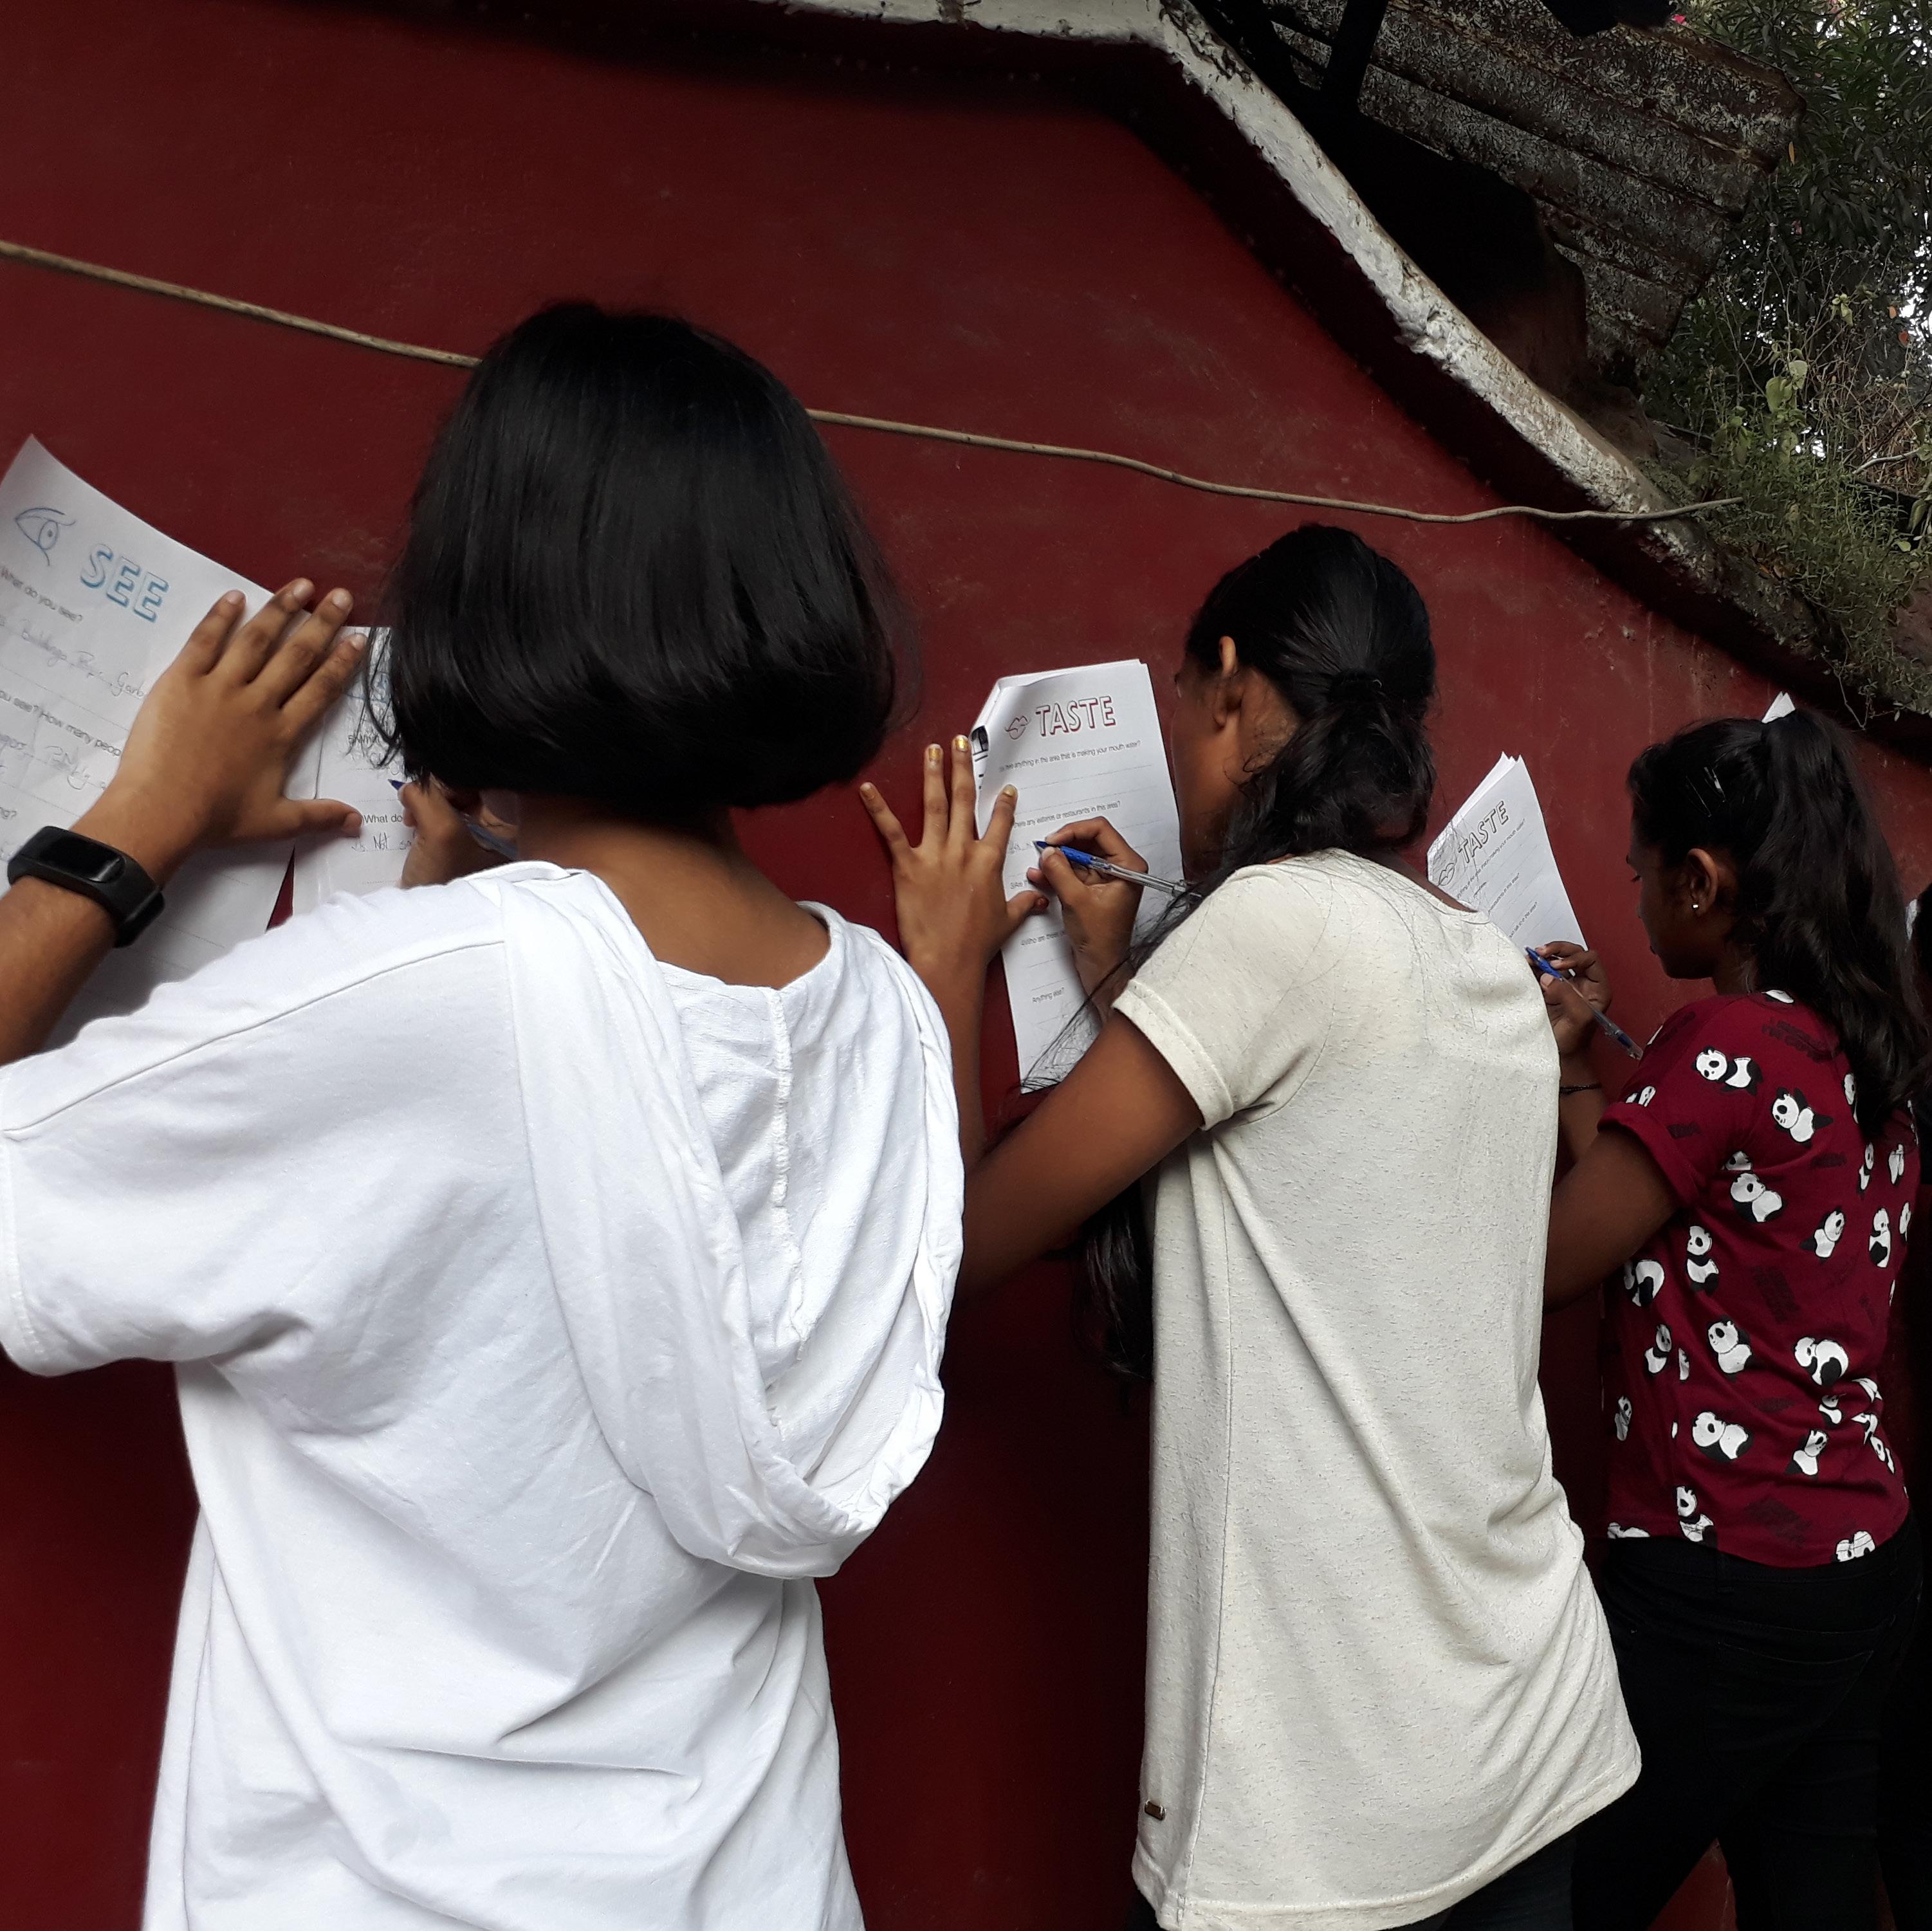
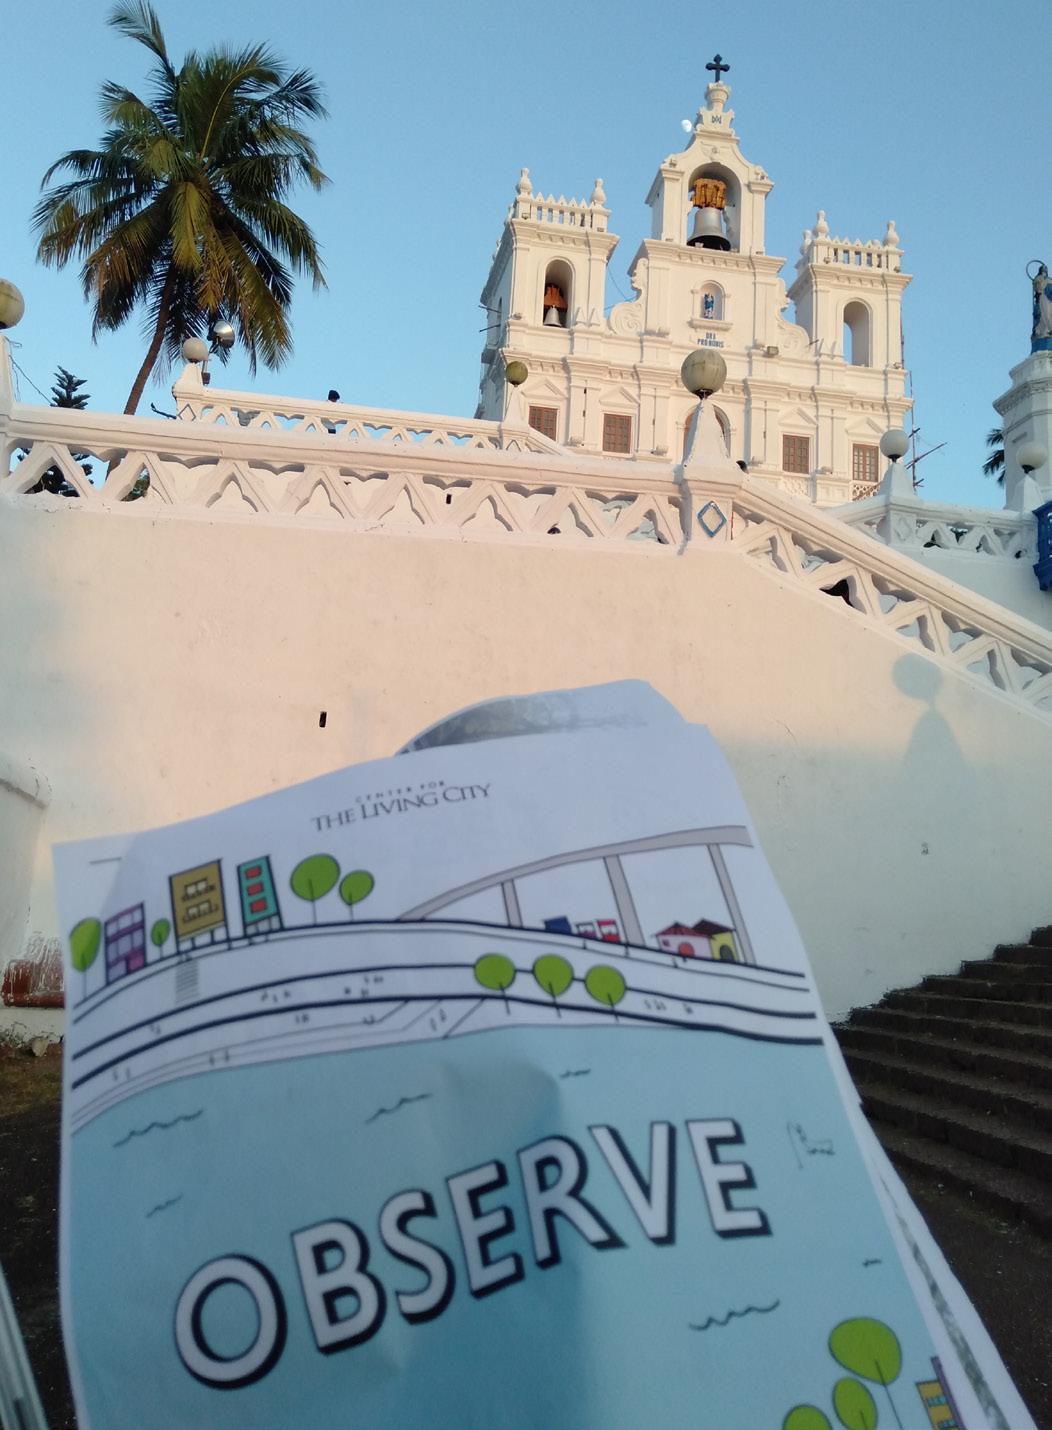
Stemming from our connection with the Immaculate Conception Church, we did a neighborhood walking activity with nine children from ages 12-16. The first half of the activity was using the Observe Five Sense Guide by The Center for the Living City to lead children on a walk around the area. Focusing on sight, hearing, smell, taste, and touch, the walk taught children to analyze their neighborhoods. We hoped to understand how children preceived their environment. The second half of the activity focused more on creative solutions. Going to Jardim Garcia D’Orta and the empty lot just south of the park, students were asked to draw and describe their solutions for the spaces. By pairing these methods we got aspects of divergent and convergent in one session.
• Connected with children in the area
• Taught children to analyze their surroundings critically
• Provided potential solutions for the empty lot
• Group dynamic influenced individual opinions
• The length of the workshop was too short to run both sections
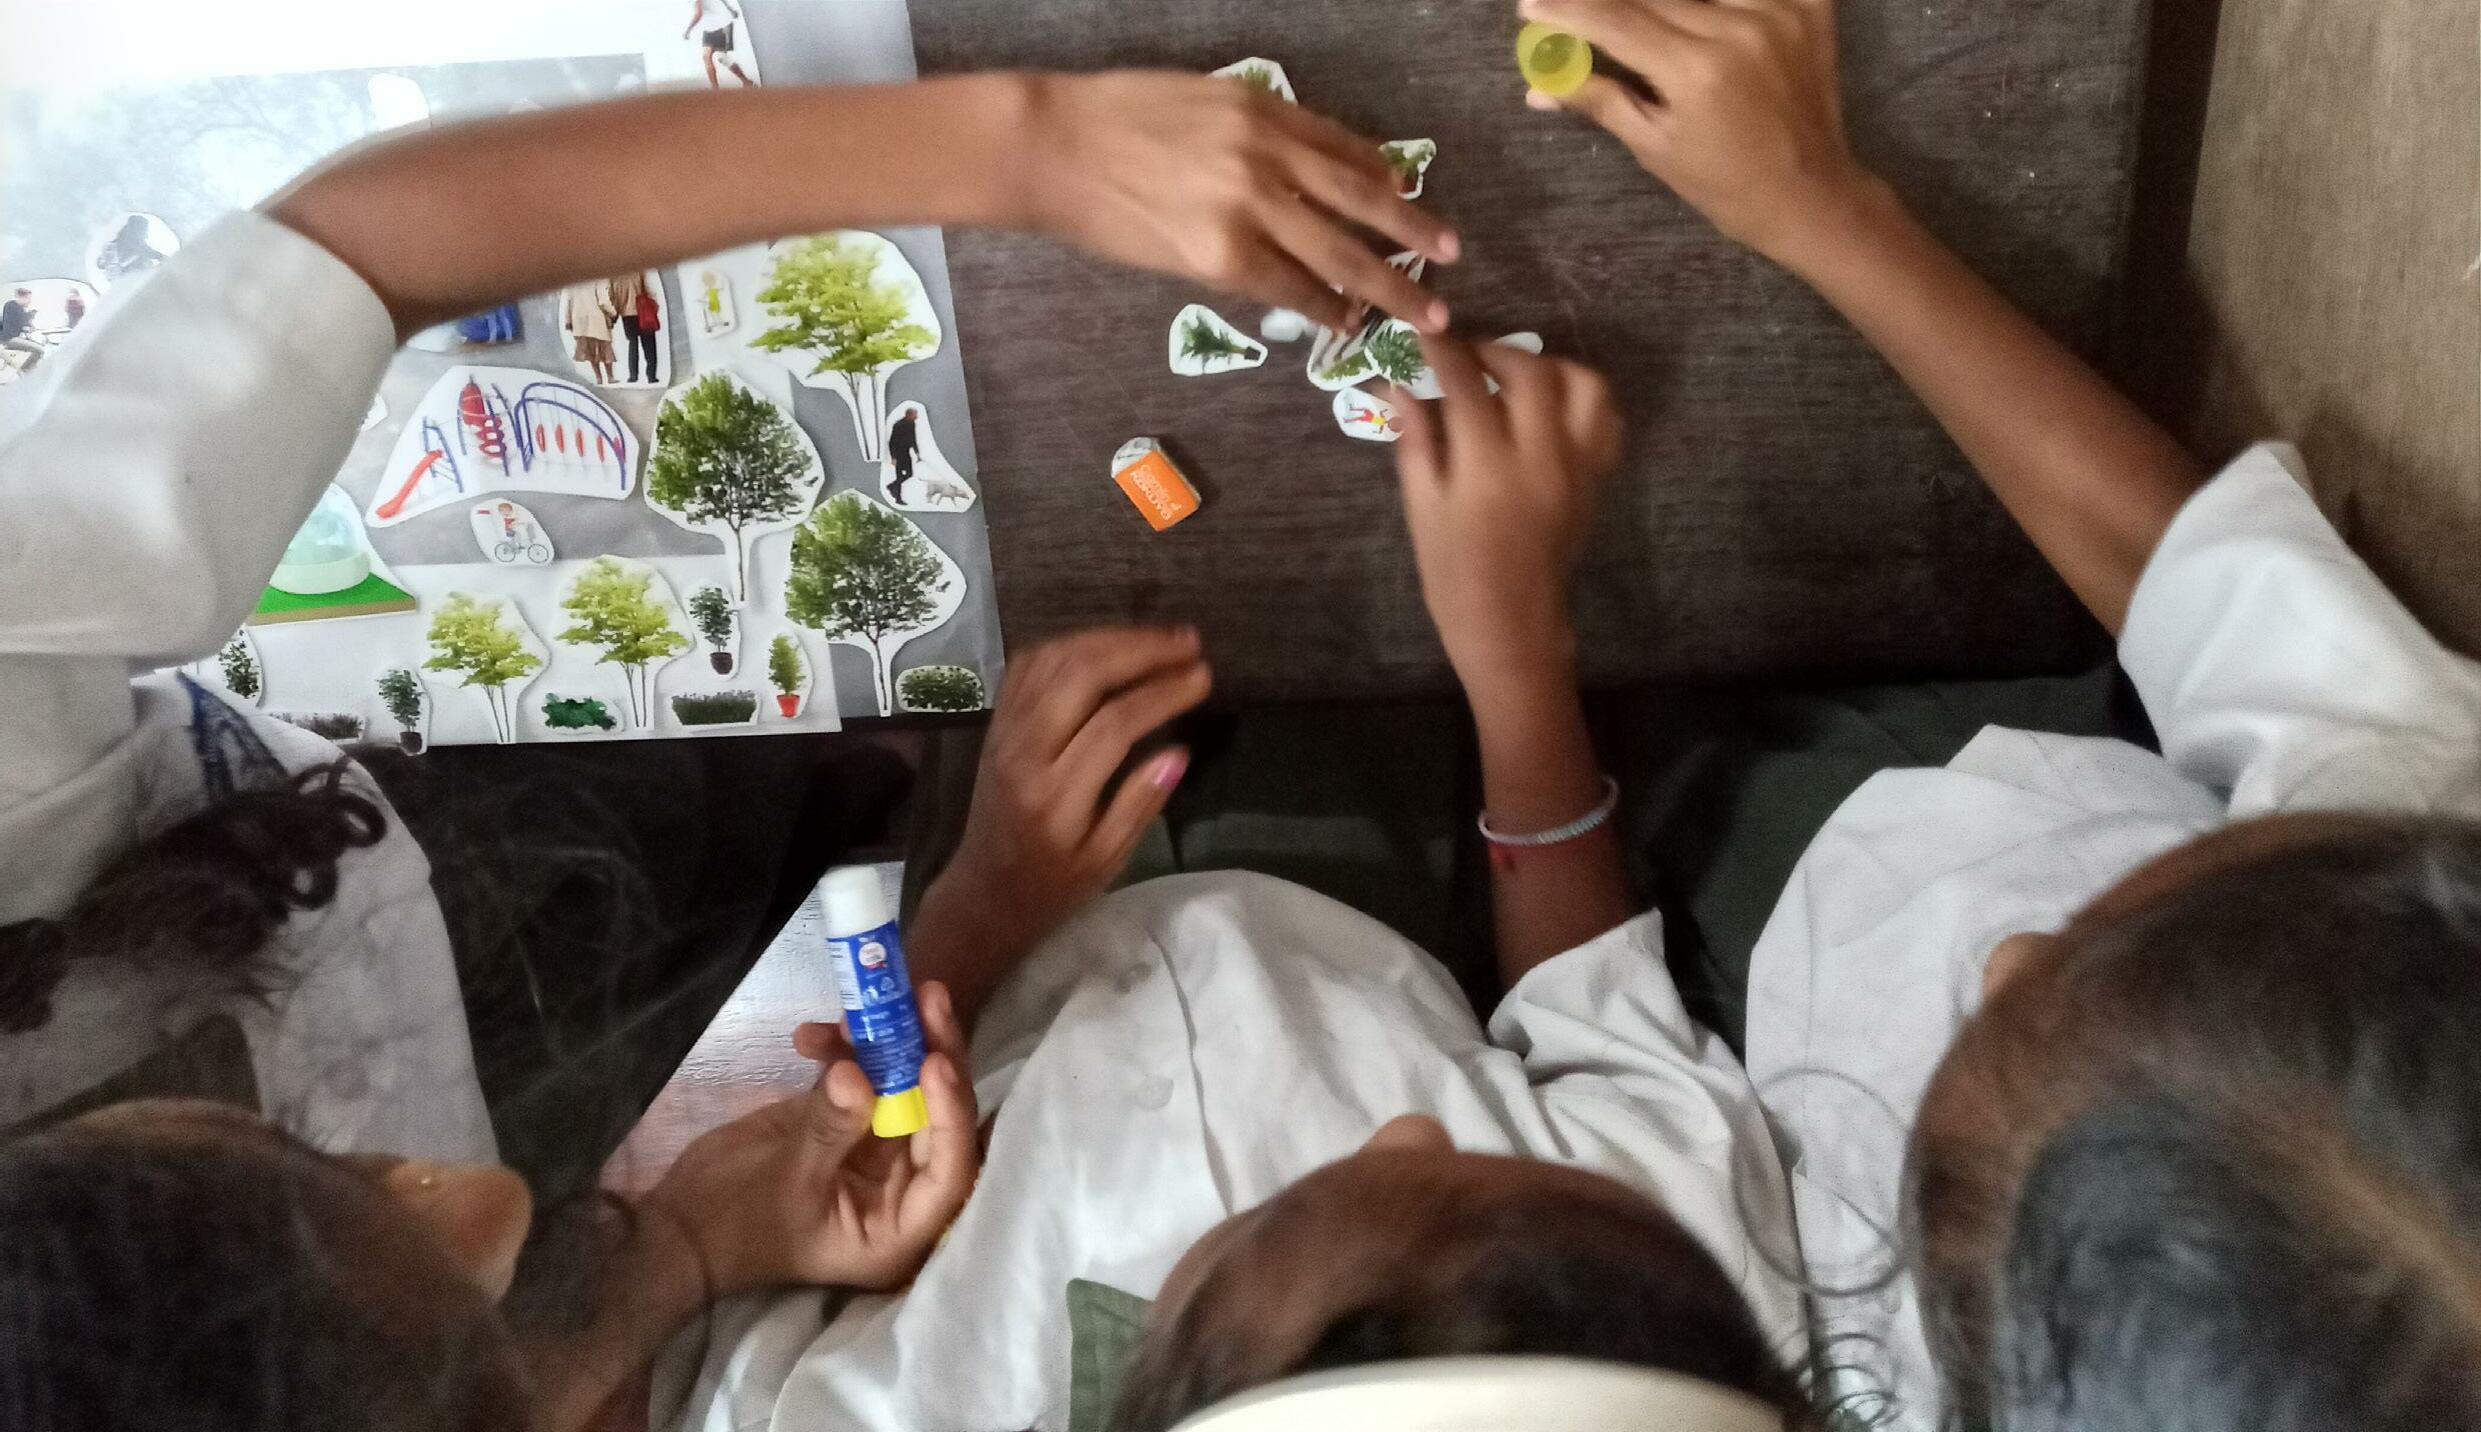
To gain further understanding of childrens’ experience and understanding of the area, we approached numerous schools in the vicinity of Jardim Garcia D’Orta, asking them to partner with us and do a children’s workshop. One school agreed to give us two hours. Therefore, with the understanding that illustrative, visual aids and interactive activities are often the most fruitful with children, we employed a card game and visual ideation. The intent was to get students to think critically about their environment and co-design solutions for the empty lot.
Continuing with the findings from the Observe walk, we created a card game with 12 interventions. With a total of 27 children, ages 10-12, we split the students into groups of three. Each card had a like/dislike voting option, which the children were asked to complete. After the kids oriented to each card in the deck, they prioritized the cards.
For the visual ideation, each group was given a large image of the vacant lot, trace paper, and a set of props. Ranging from plants, people, and equipment, the printed props were intended to spark ideas and creativity. Each group was tasked with drawing their vision for the lot.
• Interactive games helped keep their participation


• The card game gave a clear understanding of their priorities
• Visual aids helped bridge the language barrier
• The visual ideation activity did not give clear results as the, younger than expected, students placed nearly all the props without much drawing
• The children’s age and the language barrier prevented the children from fully comprehending the material and concepts
In an effort to gain feedback about our process and proposals, we took the draft report back to our key partners. These individuals were asked to be critical about what they saw and to ask many questions about the proposal. Each person’s comments were useful as they polished the situation analysis and debated the proposals.
This method also served as a check for protecting the anonymity of our partners. If they saw something revealing about themselves or noticed anything offputting about others, this was the time to correct the document before submission.
• Validated our framing of the city, issues, and proposals
• Pushed us to used balance language when critiquing
• Strengthened our proposals through questioning
• Took a lot of time and attention
• Only got the perspective of those already most involved in the project
An in-depth explanation of the city and its processes
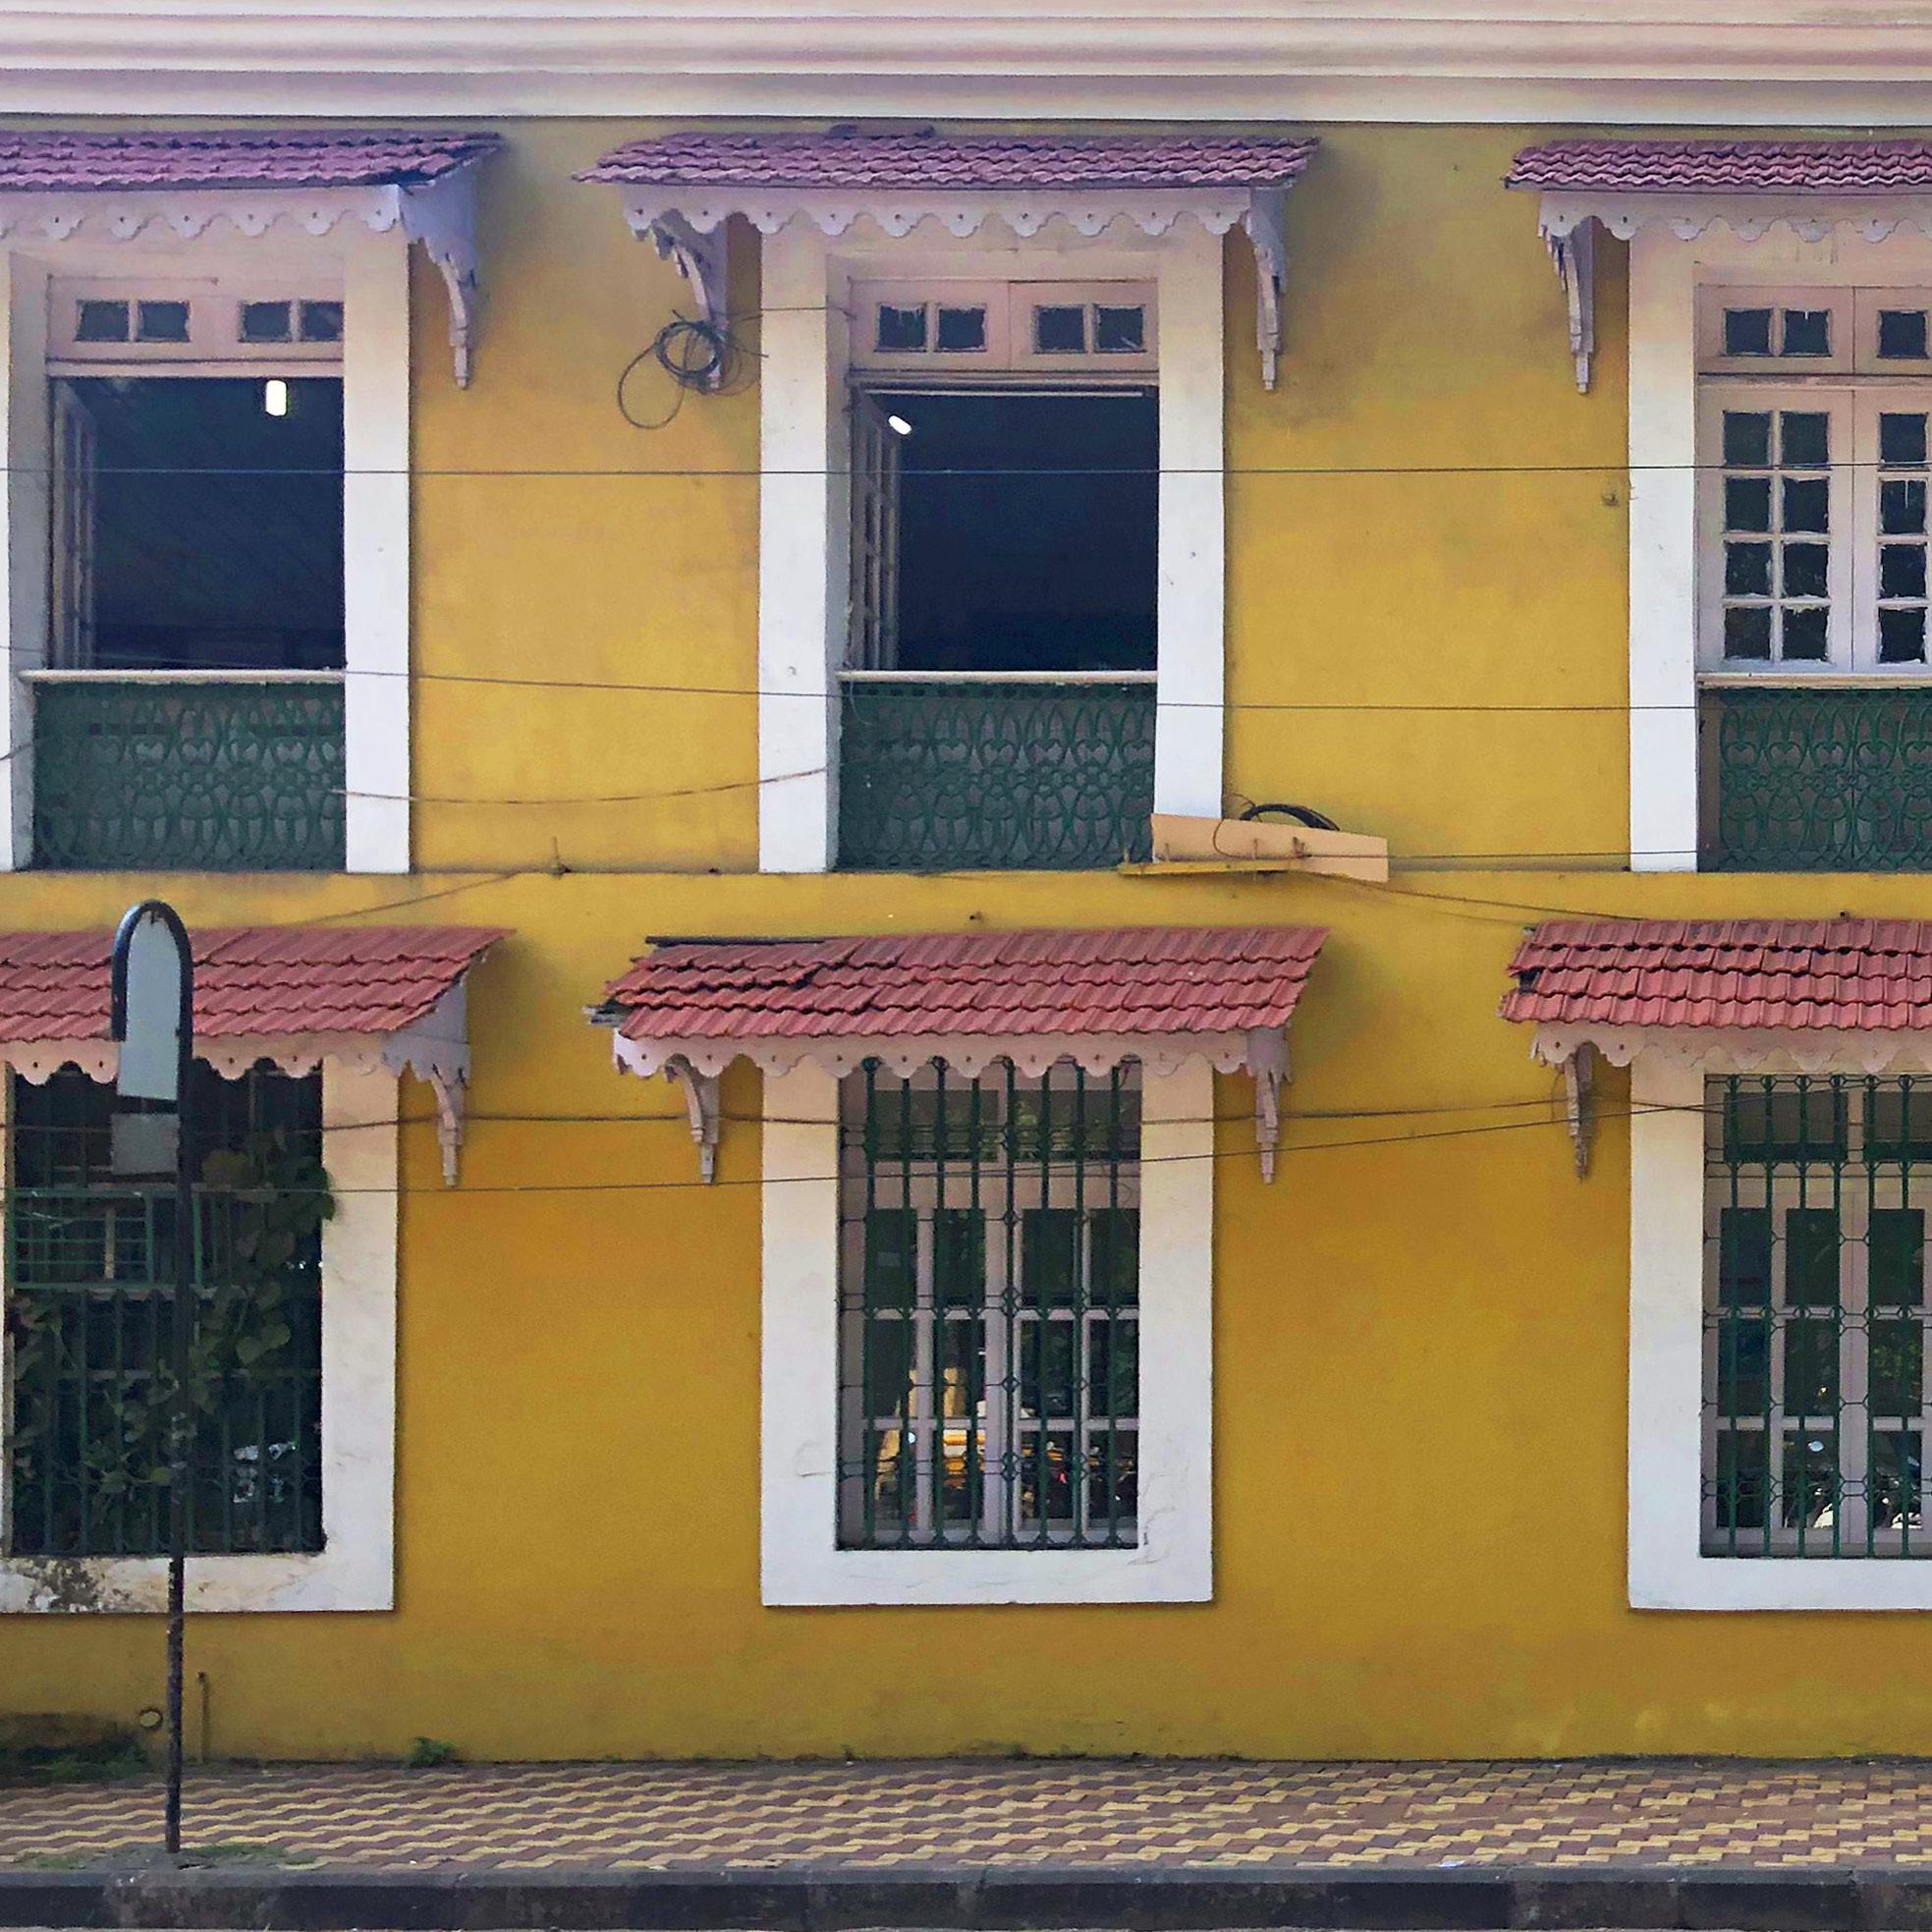
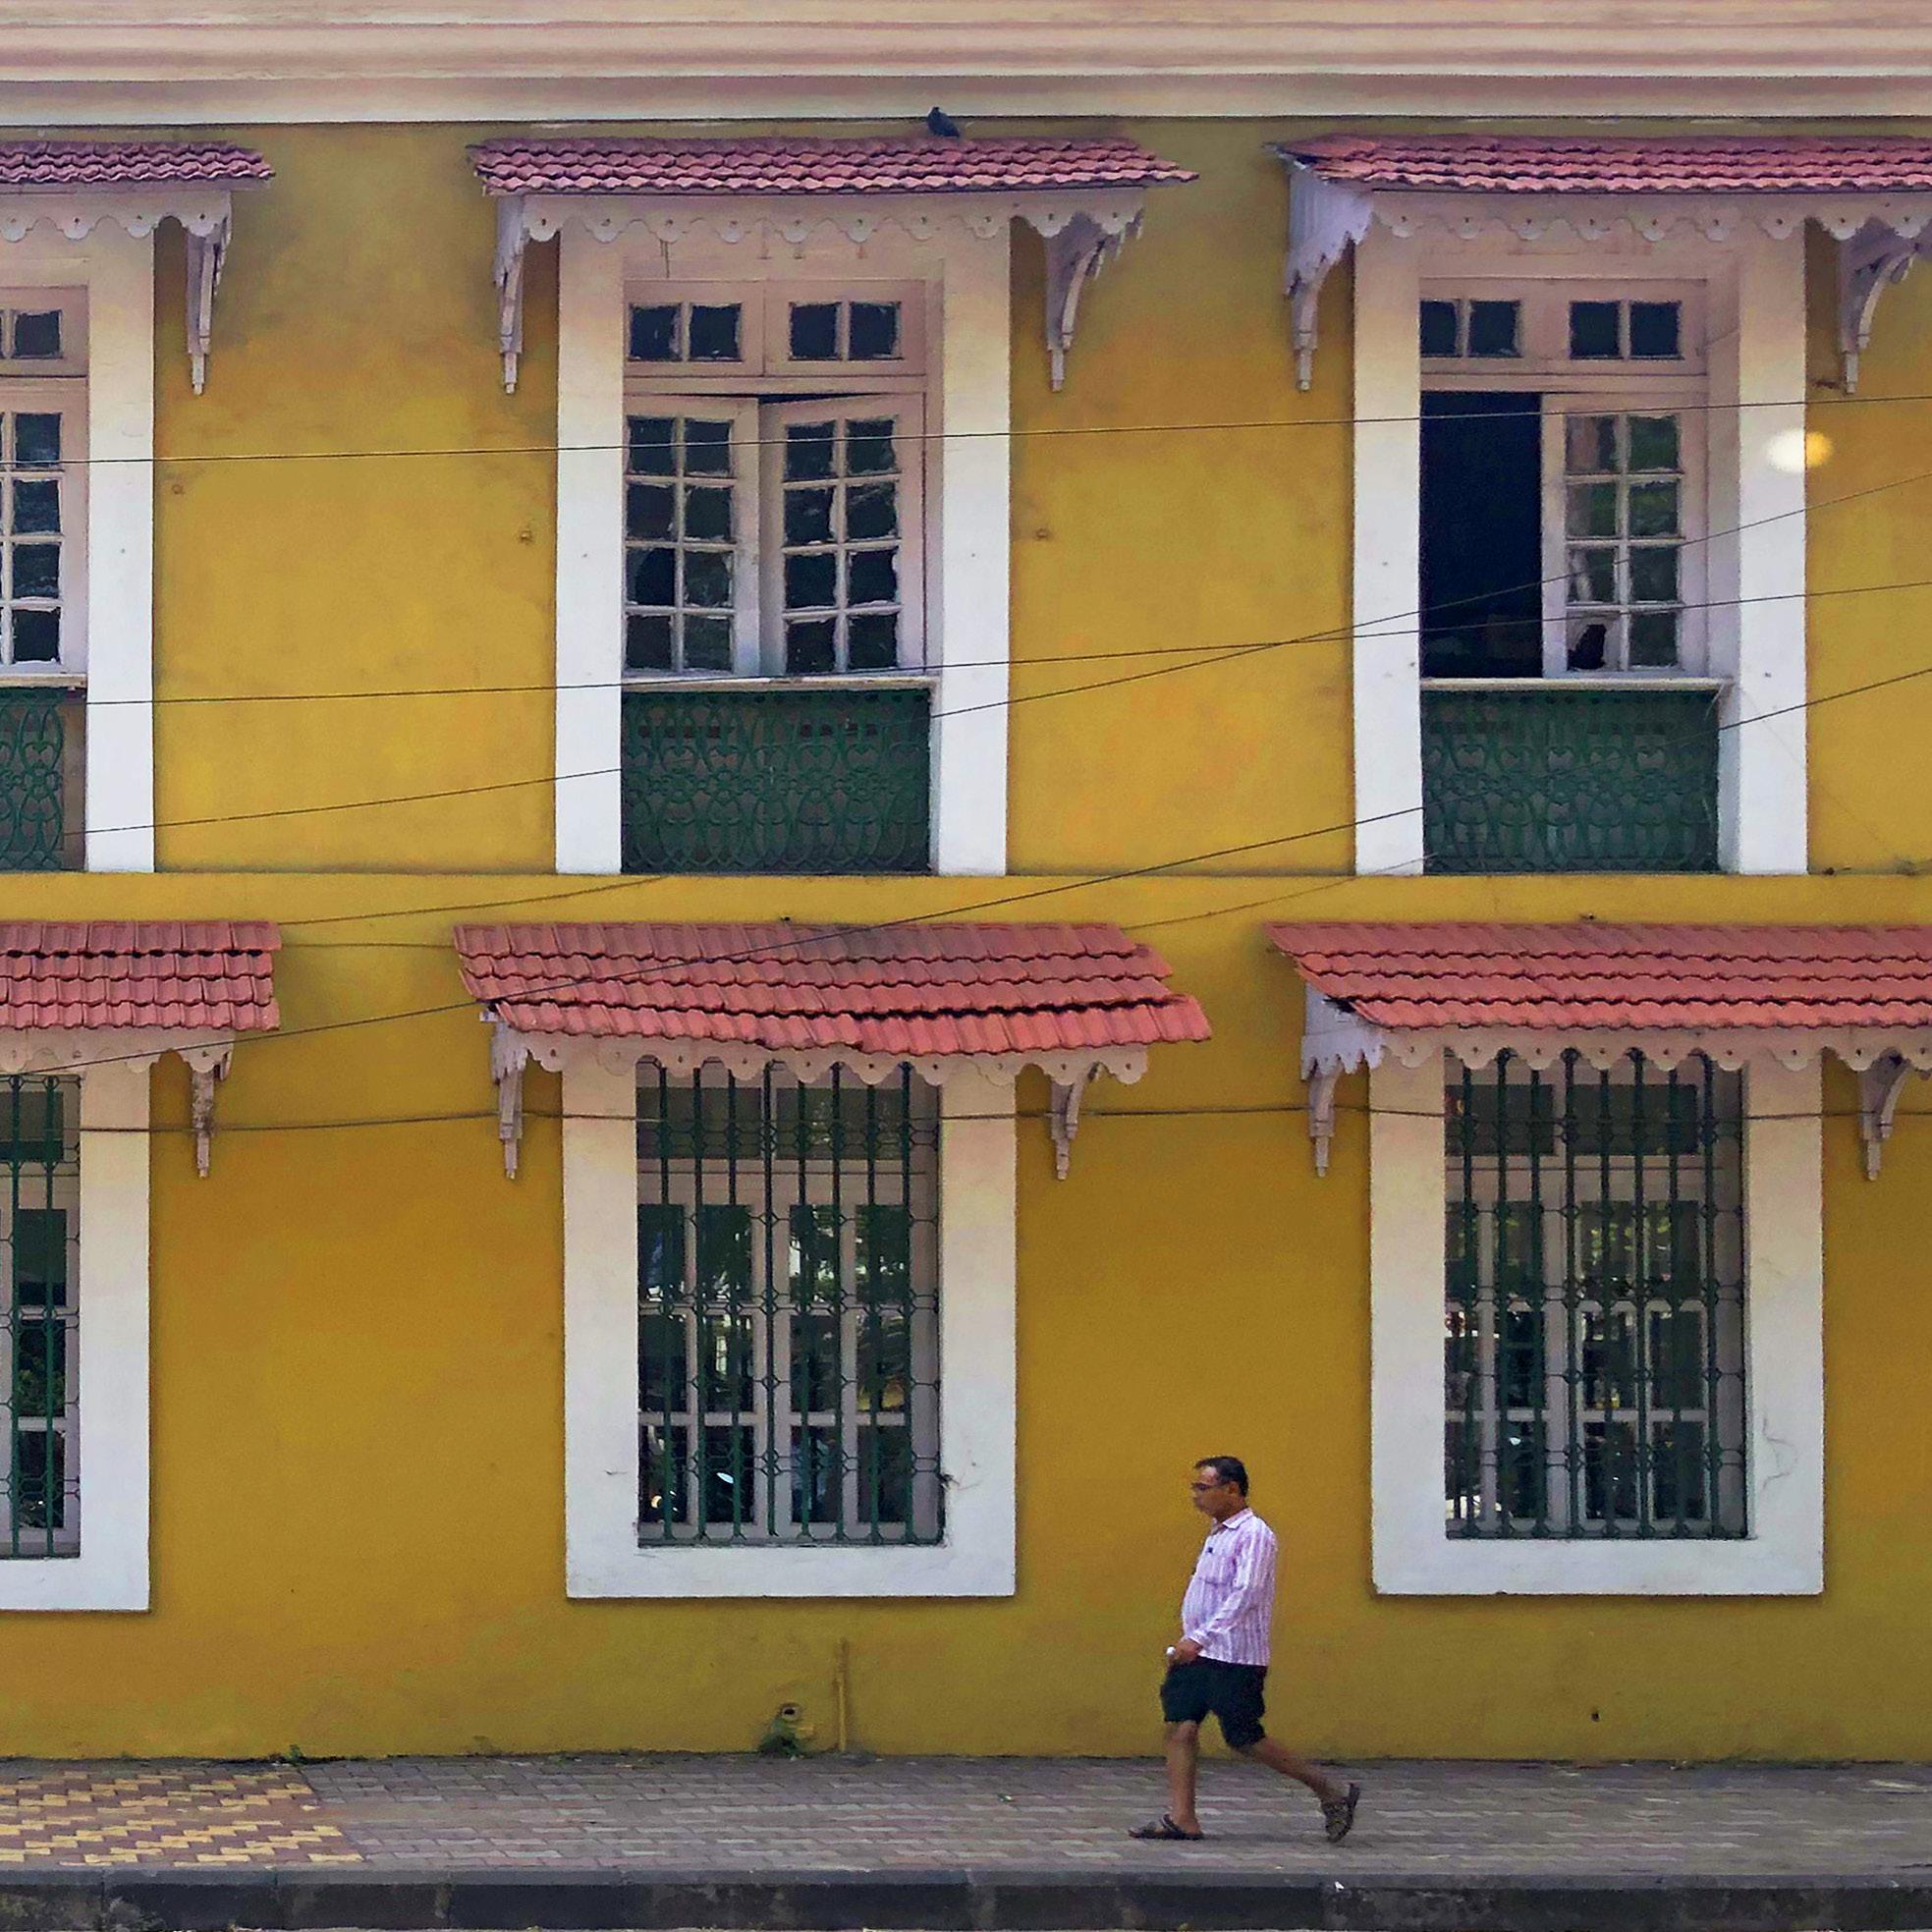
Despite rends to convert residential buildings into commercial use, Panaji is considered the diverse cultural hub of Goa. Those raised in Panaji recall ‘Panjim’ as was previously called as a ‘’place where grand colonial-era buildings and tree-lined boulevards rub shoulders with old-school cafes and backstreet bars… a place where total strangers engage in elaborate exchanges and where tiny crumbly-walled bakeries serve up an astonishing array of cakes, croissants, and snacks” (Pal 2018).
The people of Panaji pride themselves on a vibrant culture of history, religion, and family lineage. Described by a resident as the place, “with the most religious harmony;” Panaji is a community for everyone. Hindu, Christian, and Islamic holidays are celebrated by nearly all residents. Meals are shared between families and faiths. People are safe to worship as they please. A lot of religious events are celebrated in the public space allowing others to participate. Religious groups provide an extended network of contacts for the residents of the area.
Another definite advantage of the CBD is the sense of safety. While no city is crime-free, Panaji stands out as a city where a female shopkeeper is able to “walk freely at night.” A multitude of police checkpoints and community surveillance allows streets to be active as the night falls, providing numerous social and economic benefits.
As Panaji continues to grow and low-density IndioPortuguese architecture is replaced by multi-story mixed-use modern buildings, the CBD community is also changed. Residents fondly recall the times when neighbors knew who lived next to them. While these times are not wholly lost, the thinning out and isolation
of residents from the CBD is in effect. Where commercial activity is growing, families are growing more isolated from their neighbors and each other. Rates of elderly that live on their own are increasing. There are more people leaving to pursue career opportunities. The Immaculate Conception Church has taken note and taken steps. They implemented Family Prayer groups where multiple families are assigned to get together once a month to share in fun activities and prayer.
11:00 am
01:00 pm
06:00 pm
As the CBD continues to modernize, there is an apparent un-learning of ecological thinking. In a country that has excellent climate change awareness rates (Smith 2019), the action of protecting the local ecosystem and the services it provides is lacking. Many people who live and work in the CBD recount more frequent flooding in streets, citing two reasons. The first is the lack of maintenance and cleaning of stormwater infrastructure. The second is the disappearance of permeable surfaces. These two actions combine to create an environmental hazard for any occupant or property owner in the CBD.
On the same note as disappearing permeable surfaces, the urban forest is now a few sparse trees. While there have been some efforts to bring back the shade of trees, many sidewalks can only hope to be shaded by building overhangs and covered colonnades.
While Imagine Panaji is trying to increase the awareness of mangroves, there are continued developments across the city that are covering up wetlands such as the building of the New CBD.
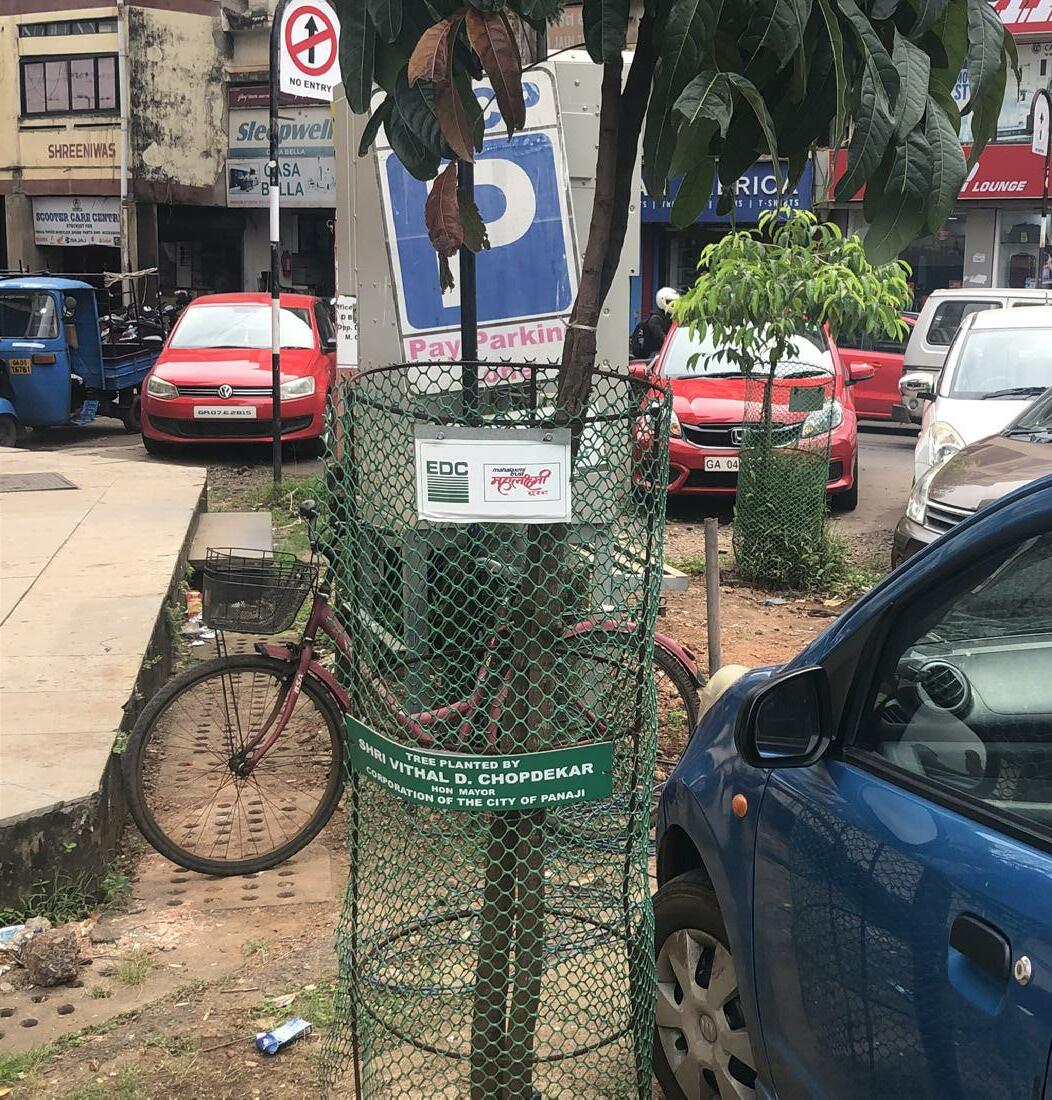
Panaji is historically a city designed by the Portuguese with a planning ethos sympathetic to the specific environmental context. The city’s historic name, Ponji, is said to mean “land that never gets flooded” (Haravi 133). Over time such an approach has been subject to significant degradation. This aligns with Goa’s incorporation as a union territory by the Indian Government when population density dramatically increased. Our research informed us of many areas of the city that were previously wetlands or carefully planned stormwater management channels being disrupted by more recent developments to accommodate the urban densification.
During interviews, residents spoke fondly of a time that they were able to utilize water from their private wells. While private wells are illegal, many homes are said to have deep wells still; however, the harvesting of such water has been severely compromised in the past two decades. Many surrounding water bodies are also reported as increasingly polluted. Recent trends have contributed to the groundwater table drying up despite the lengthy monsoon period that the region experiences in June through August.
“the new generatIon know too lIttle of nature and our relatIonshIp wIth It” - resIdent
“the portuguese buIlt wIth care . we buIld wIth capItal Interests.” - resIdent
Research also informed us of changes in weather behavior that have seen more sporadic rainfall leading to the insecurity of water. Upon the commencement of our fieldwork, there were reports of parts of Panaji requiring water rations for a period of two weeks in August. Some residents informed us that they no longer trust the PWD water supply and have taken to acquiring water tanks to have their own private back up supply.
The CBD, and Panaji as a whole, faces many of the same challenges as cities across the world, including global markets, transitions to second and third-tier economies, and an increasingly mobile population. As long-term families and new residents continue bolstering Panaji’s population count, the CBD finds itself at a crossroads between economic vitality and hollowing itself out.
During an interview with a CCP employee, we touched upon the intricacies of waste management and the reforms within the past decade. These have included the pre-separation of dry and wet waste and discontinuing the dumping solid waste with neighboring villages to transporting this waste to be buried at a mine in Karnataka.
Residents new and old iterate how the real estate prices within the CBD are climbing too high. As land values continue to increase, this gives “greater scope to convert the residential buildings into commercial centers” (Haravi 2010, p. 163). Of the few residents there are still around Jardim Garcia D’Orta, are those who inherited the land and building. There is little chance for a newcomer to find suitable housing in the CBD. Even the commercial spaces that line the streets with shops and restaurants are held in tight hands by those who obtained the real
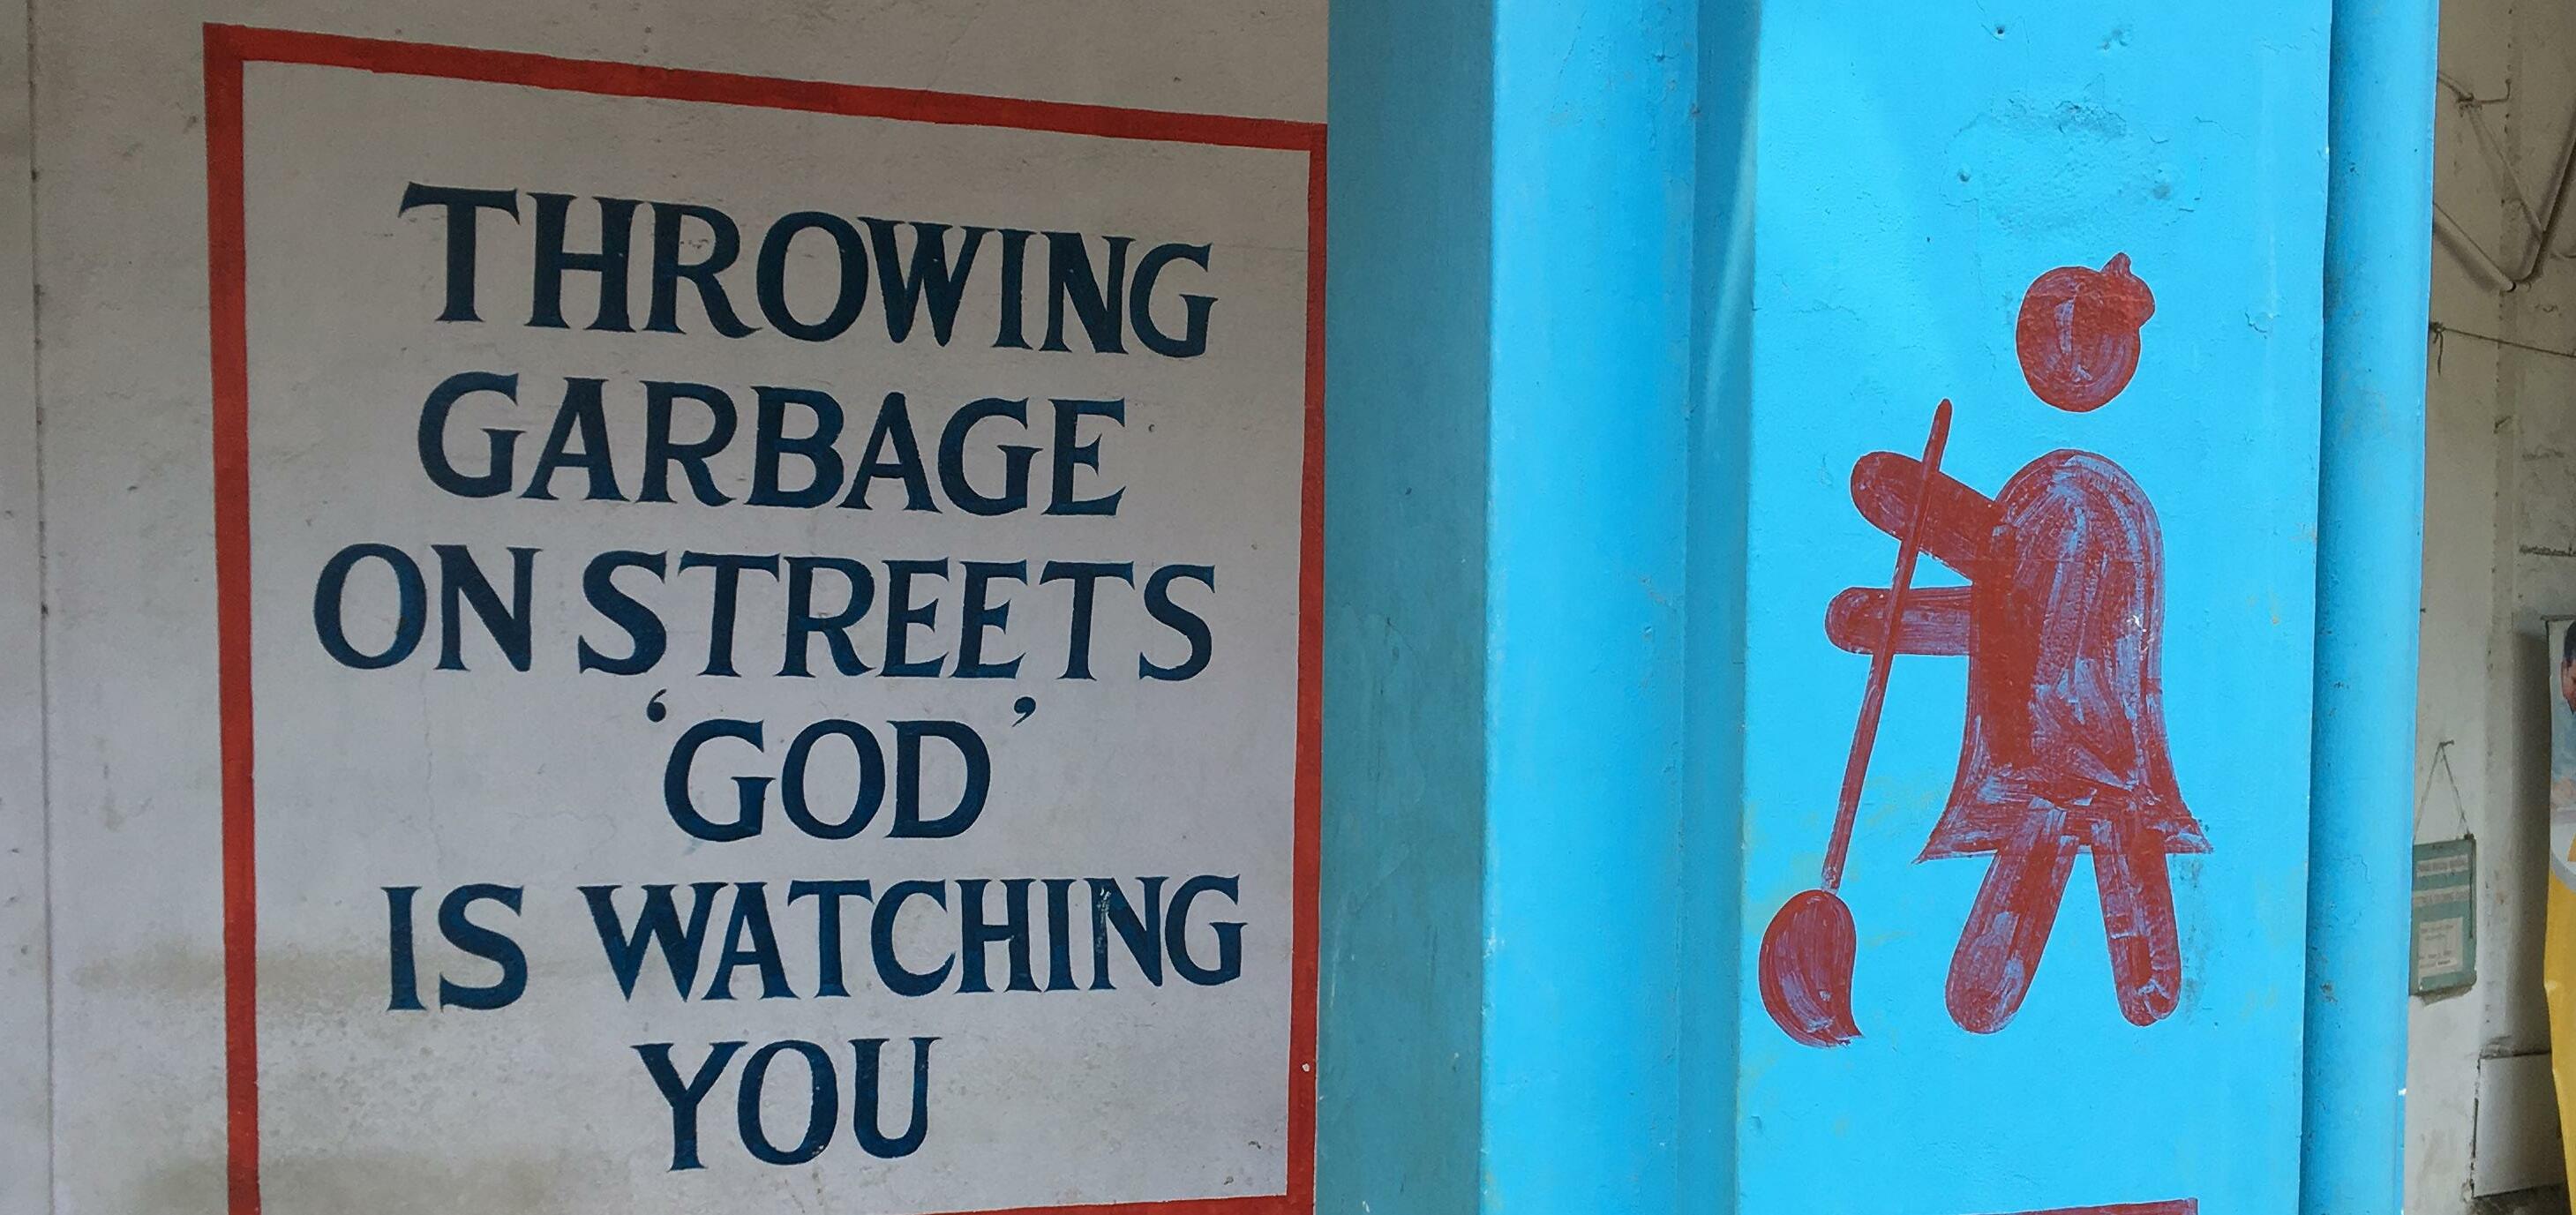
“It Is very hard for small busInesses to start In panajI” - world trade center, goa offIce, staff
estate decades ago. With the CBD saturated with small shops and restaurants and an environment of high real estate prices, new businesses face two massive barriers.
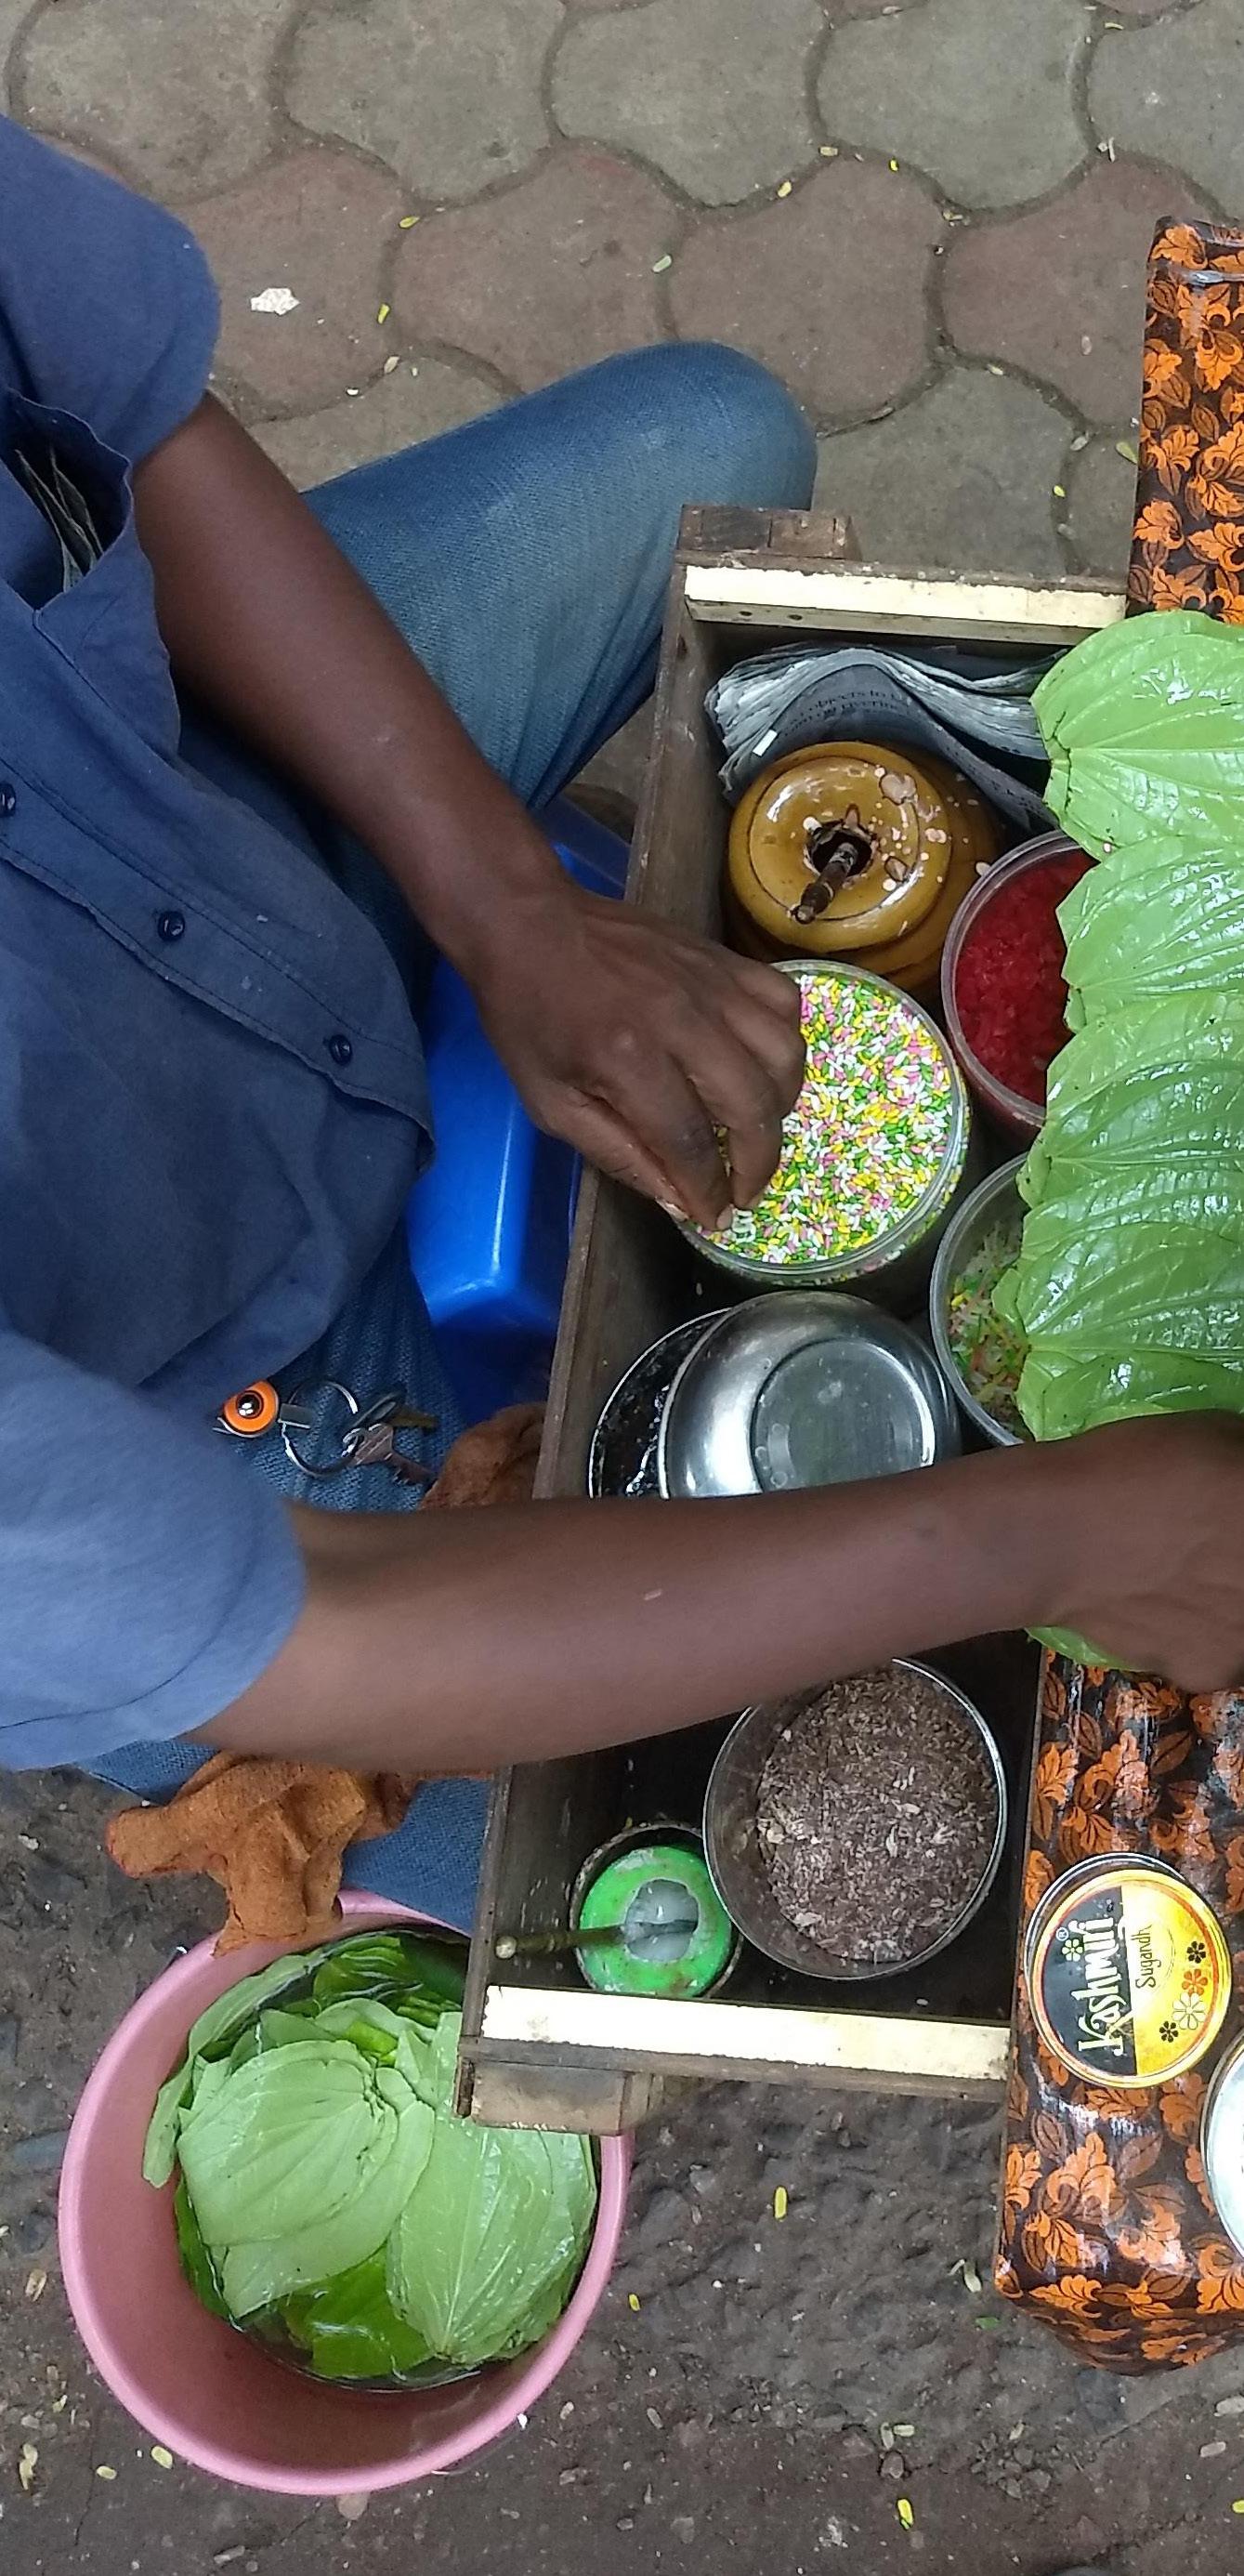
Looking at the street of the CBD, any spectator can see vacancy and dilapidation play a starring role. Predominately found on the first level of heritage buildings, these vacant spaces eat up valuable real estate. As real estate prices soar, these properties are either tied up in the courts with property disputes, or the owner has decided reinvestment doesn’t give a sufficient return.
“panajI has been a mInIng Industry for many years. thIs Industry has stopped 20 years ago, the government has saId It was to protect the InhabItant’s health. “ - resIdent
One cannot look at the economy of the CBD without looking at the casinos. Seen as a necessary evil, some residents of the community believe that the casinos have been forced on Panaji to make up for the lack of GDP from the banning of the mining industries in the state of Goa. However, others believe that the existing culture attracted the casinos. During a speech this year by the Finance Minister of Goa, he stated that his council recommended the State create, “an autonomous Gaming Commission to regulate the Casinos in the state (Kamat p. 57). The State seems open to the notion as Chief Minister Pramod Sawant commented that the “appointment of a Gaming Commission to oversee offshore and onshore casinos is under examination” (Team 2019).
KABAMBA TRANSPORT CORPORATION
IMAGINE PANAJI SMART CITY DEVELOPMENT LIMITED DEVELOPMENT AUTHORITY (GSUDA)
IMAGINE
GOA STATE INFRASTRUCTURE DEVELOPMENT CORP.
COASTAL REGULATION ZONE MANAGEMENT AUTHORITY PUBLIC WORKS DEPARTMENT
TOWN AND COUNTRY PLANNING
The legal and political landscape of the CBD is messy, convoluted, and inefficient. When it comes to planning and development, the multitude of institutions and the resulting patchwork of jurisdictions create so much red tape that implementation is often derailed. Built environment professionals, both public and private, describe the almost impossible burden of executing projects, from improving the sidewalk in front of a business to significant developments. The inability to follow the formal processes results in “complementary informality” (Altrock 2012, p. 176), as residents do things by themselves outside the regulatory process.
One could write books detailing the intricacies that the diagrams represent. For example, the municipal corporation is responsible for nearly all permitting. If they feel like they don’t have the required skill set to analyze a project’s complexity to code accurately, then they may require the applicant to get approval from another regulatory body. Further, if regulation is broken, such as a house built on a lot marked as rice patty, then Town and Country Planning has the police pursue a criminal investigation. However, due to the scope of this project, Imagine Panaji and the CCP will remain the primary agencies in this report.
The land use that characterizes the East CBD is a result of diverse socio-economic activities performed in the city. By analyzing land use, we have gained an understanding of those using the space and identified the prevailing services present in the area. The CBD contains the majority of the city’s government offices and commercial buildings.
the role of town and country planning is developed under that law.
directed to the entire state of Goa
broadly indicates how the land in the planning area is proposed to be used
aims to identify an integrated solution to challenges facing the city
Fig. C.8: Hierarchy of Relevant Planning Laws
The CBD commercial zones are composed of predominantly mixed-use buildings that consist of smaller-scale retail stores on the first floor with upper floors occupied by residential, hotel, education, and larger-scale commercial. Studying the history of the buildings in the CBD informed us that many single-story, historically Portuguese buildings had been replaced in favor of large scale, mixed-use, and multi-story developments.
Our methods and observations demonstrated that casinos have an undeniable impact on the concentration of commercial and tourism-related activities, with many smaller-scale tourism businesses positioning themselves along the periphery of the casino dominated waterfront.
After the land use, we decided that it was also essential to understand how the buildings are working. Most of the buildings in the CBD have diverse uses. One of the most common typologies that we can find is with commercial uses in the first level and residential in the upper levels. In the buildings surrounding the park, we can find more diversity in the uses.
Fig. C.9: Cross Section of Jardim Garcia D’Orta
Fig. C.10: Land Use of East CBD
Commercial
Institutional Mixed use Religious Residential
When investigating the issues faced in the area, mobility emerged as a primary concern. Over the past decades of population growth. Panaji has wrestled with many mobility issues ranging from failed pedestrianization, underutilized parking, heavy traffic, and overburdened public transit. While decision-makers are separated by sector, a hierarchy of government, and jurisdiction, there has been little opportunity for comprehensive mobility planning. Taking the helm, Imagine Panaji released its strategic report title Comprehensive Mobility Plan for Goa (2019). Containing many great topics such as complete streets and transit-oriented development, the report attempts to set the tone for the transit development conversation statewide.
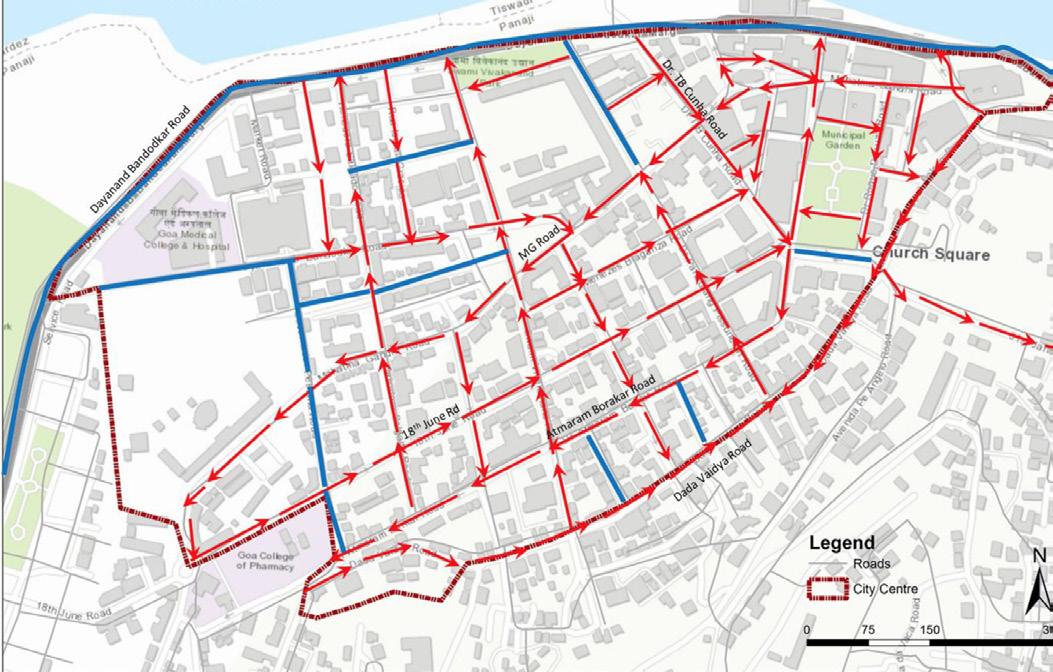
Serving as an access port between North and South Goa, the CBD consists of one main waterfront artery, Dayanand Bandodkar Marg. The subsequent streets of the CBD are an orthogonal grid layout and characterized by bustling commercial activity. The road network of the CBD is made up of numerous small one-way streets where parking is allowed on both sides of the street.
Mirroring the dramatic population and physical growth of the CBD, vehicle ownership has also risen over the years. The average vehicle ownership per household in Goa is 3 for a household size of 4.2. The annual vehicle growth rate in Goa state is almost 10 times that of the population growth rate (2001-2011), and hence the number of vehicles may soon surpass the number of people living in the state. (Master Plan for High Capacity Transit System for Goa, 2019)
Fig. C.13: Number of Private Vehicles Registered in Goa (Comprehensive Mobility Plan for Goa 2019)
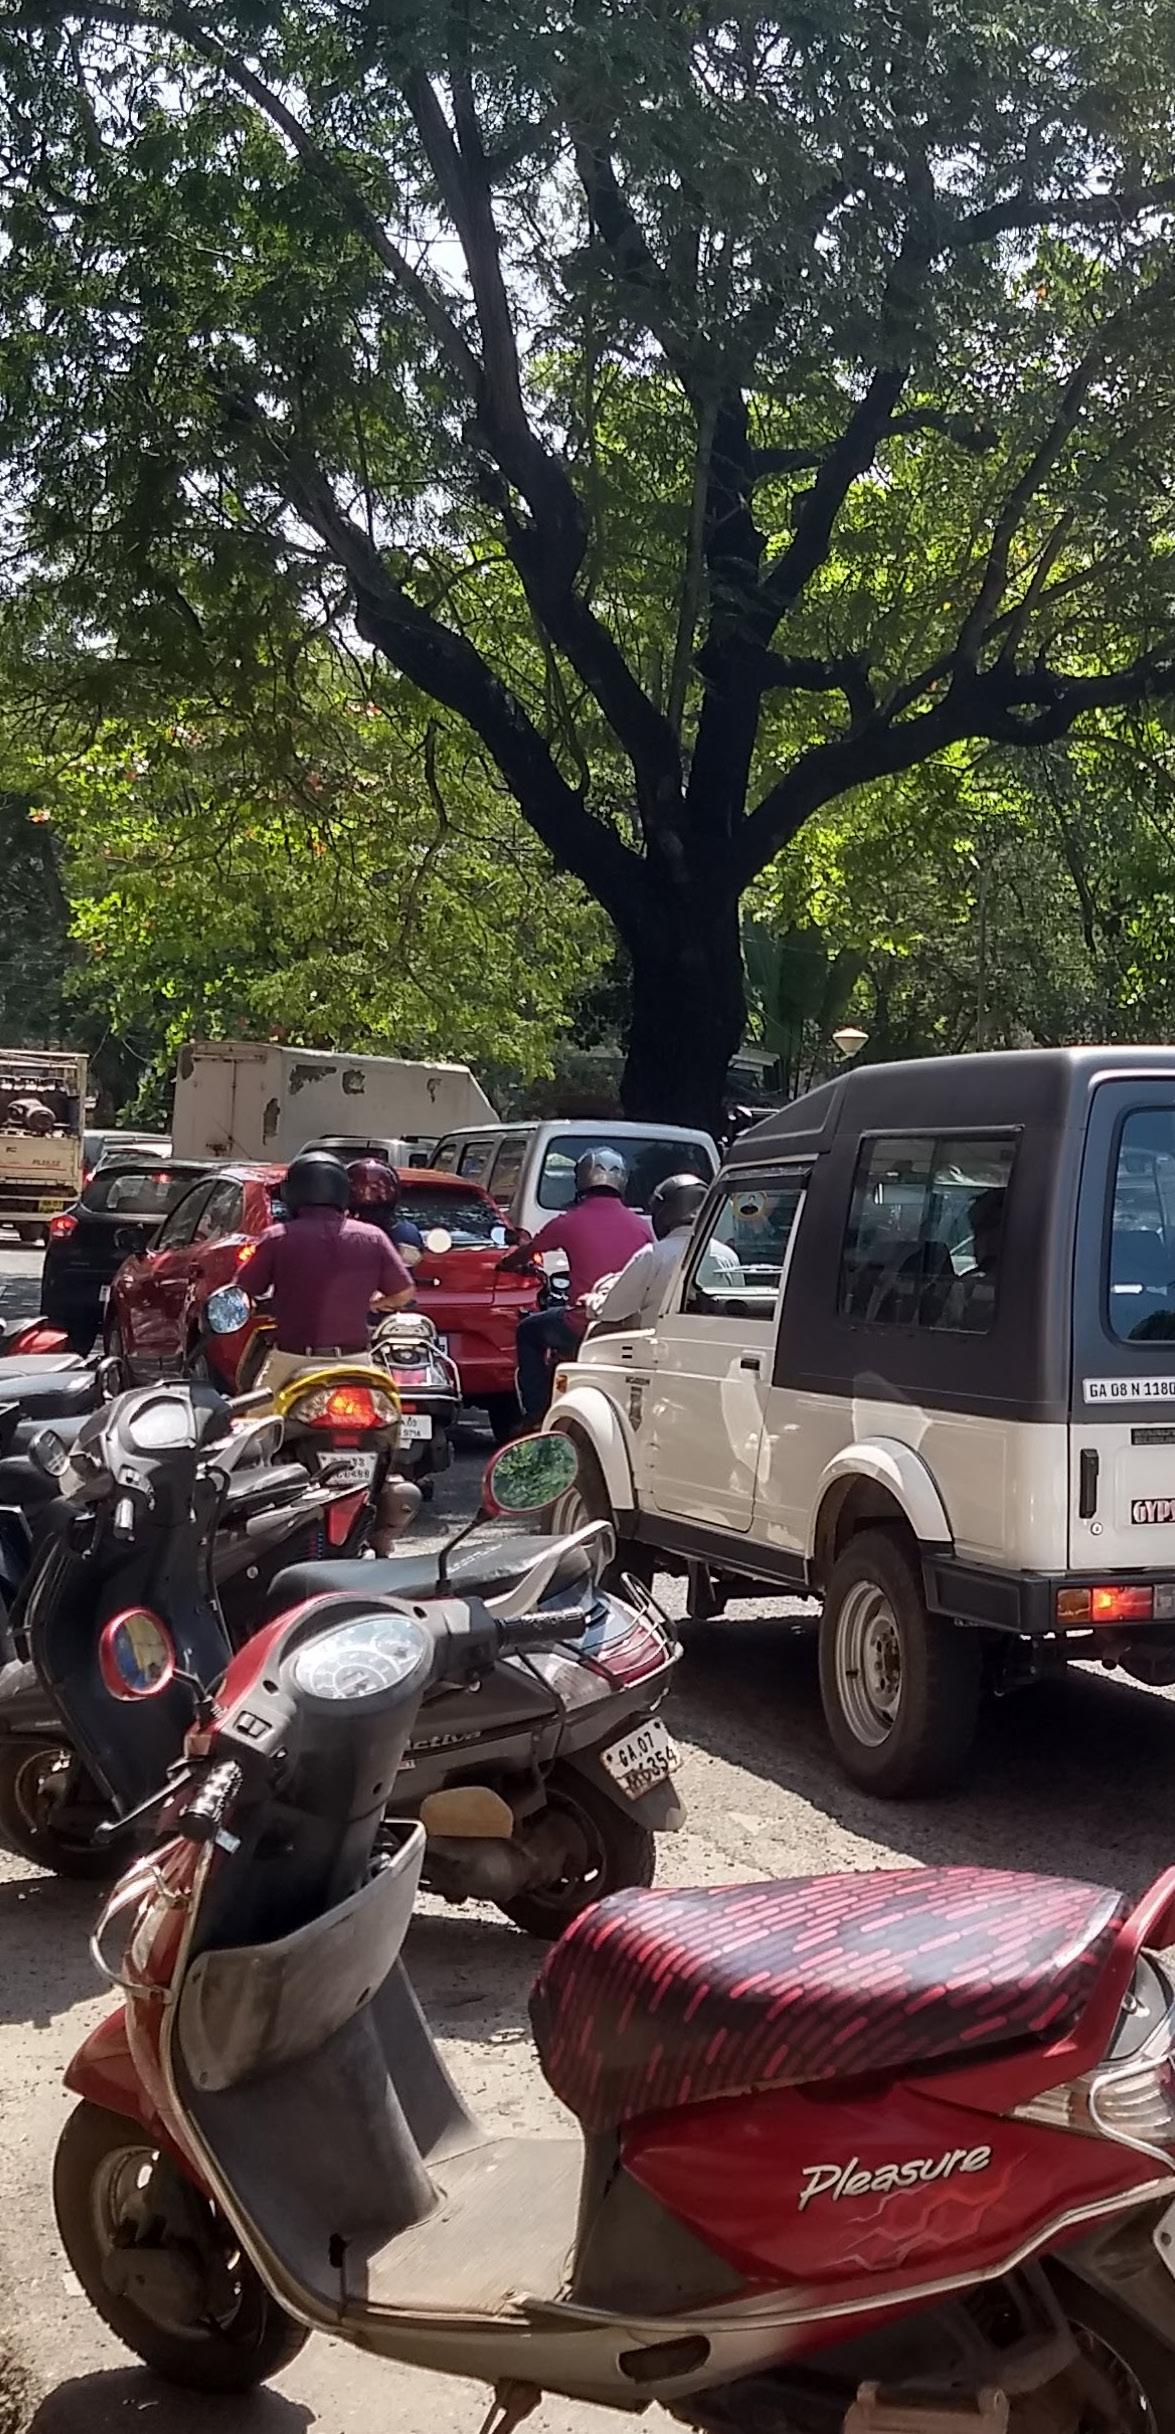
Throughout the CBD, there is evidence of issues with parking. At many intersections and entrances to establishments, metal rails demarcate zones for pedestrians to pass that restrict 2-wheelers from parking in the way and blocking access. In areas where these don’t exist, passageways are left obstructed by densely parked vehicles, leaving pedestrians no choice but to navigate the narrow passage between. Jardim Garcia D’Orta often had its entrances blocked by vehicles parked and double-parked along the congested one-way streets that surrounded it.
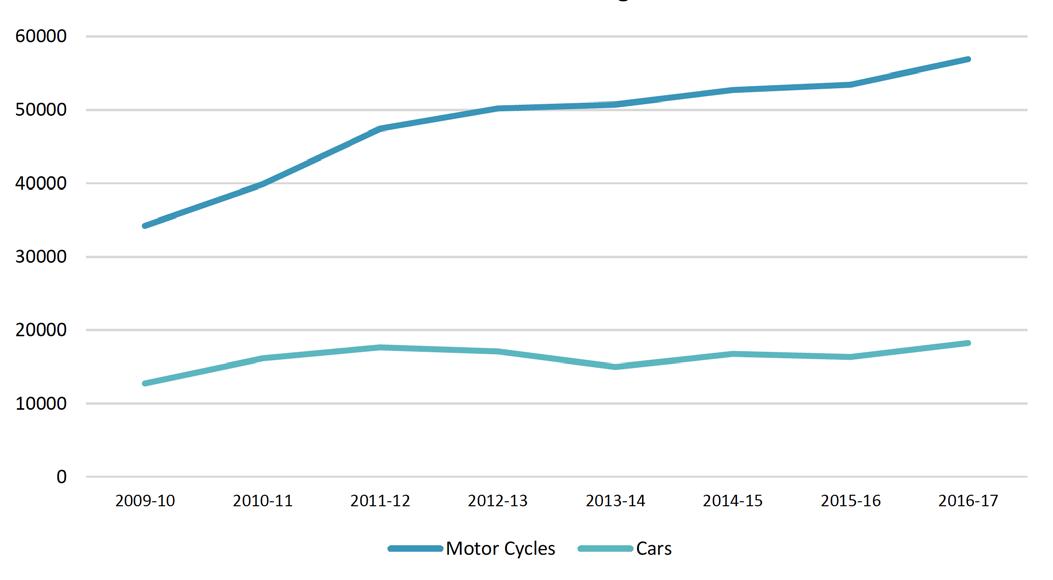
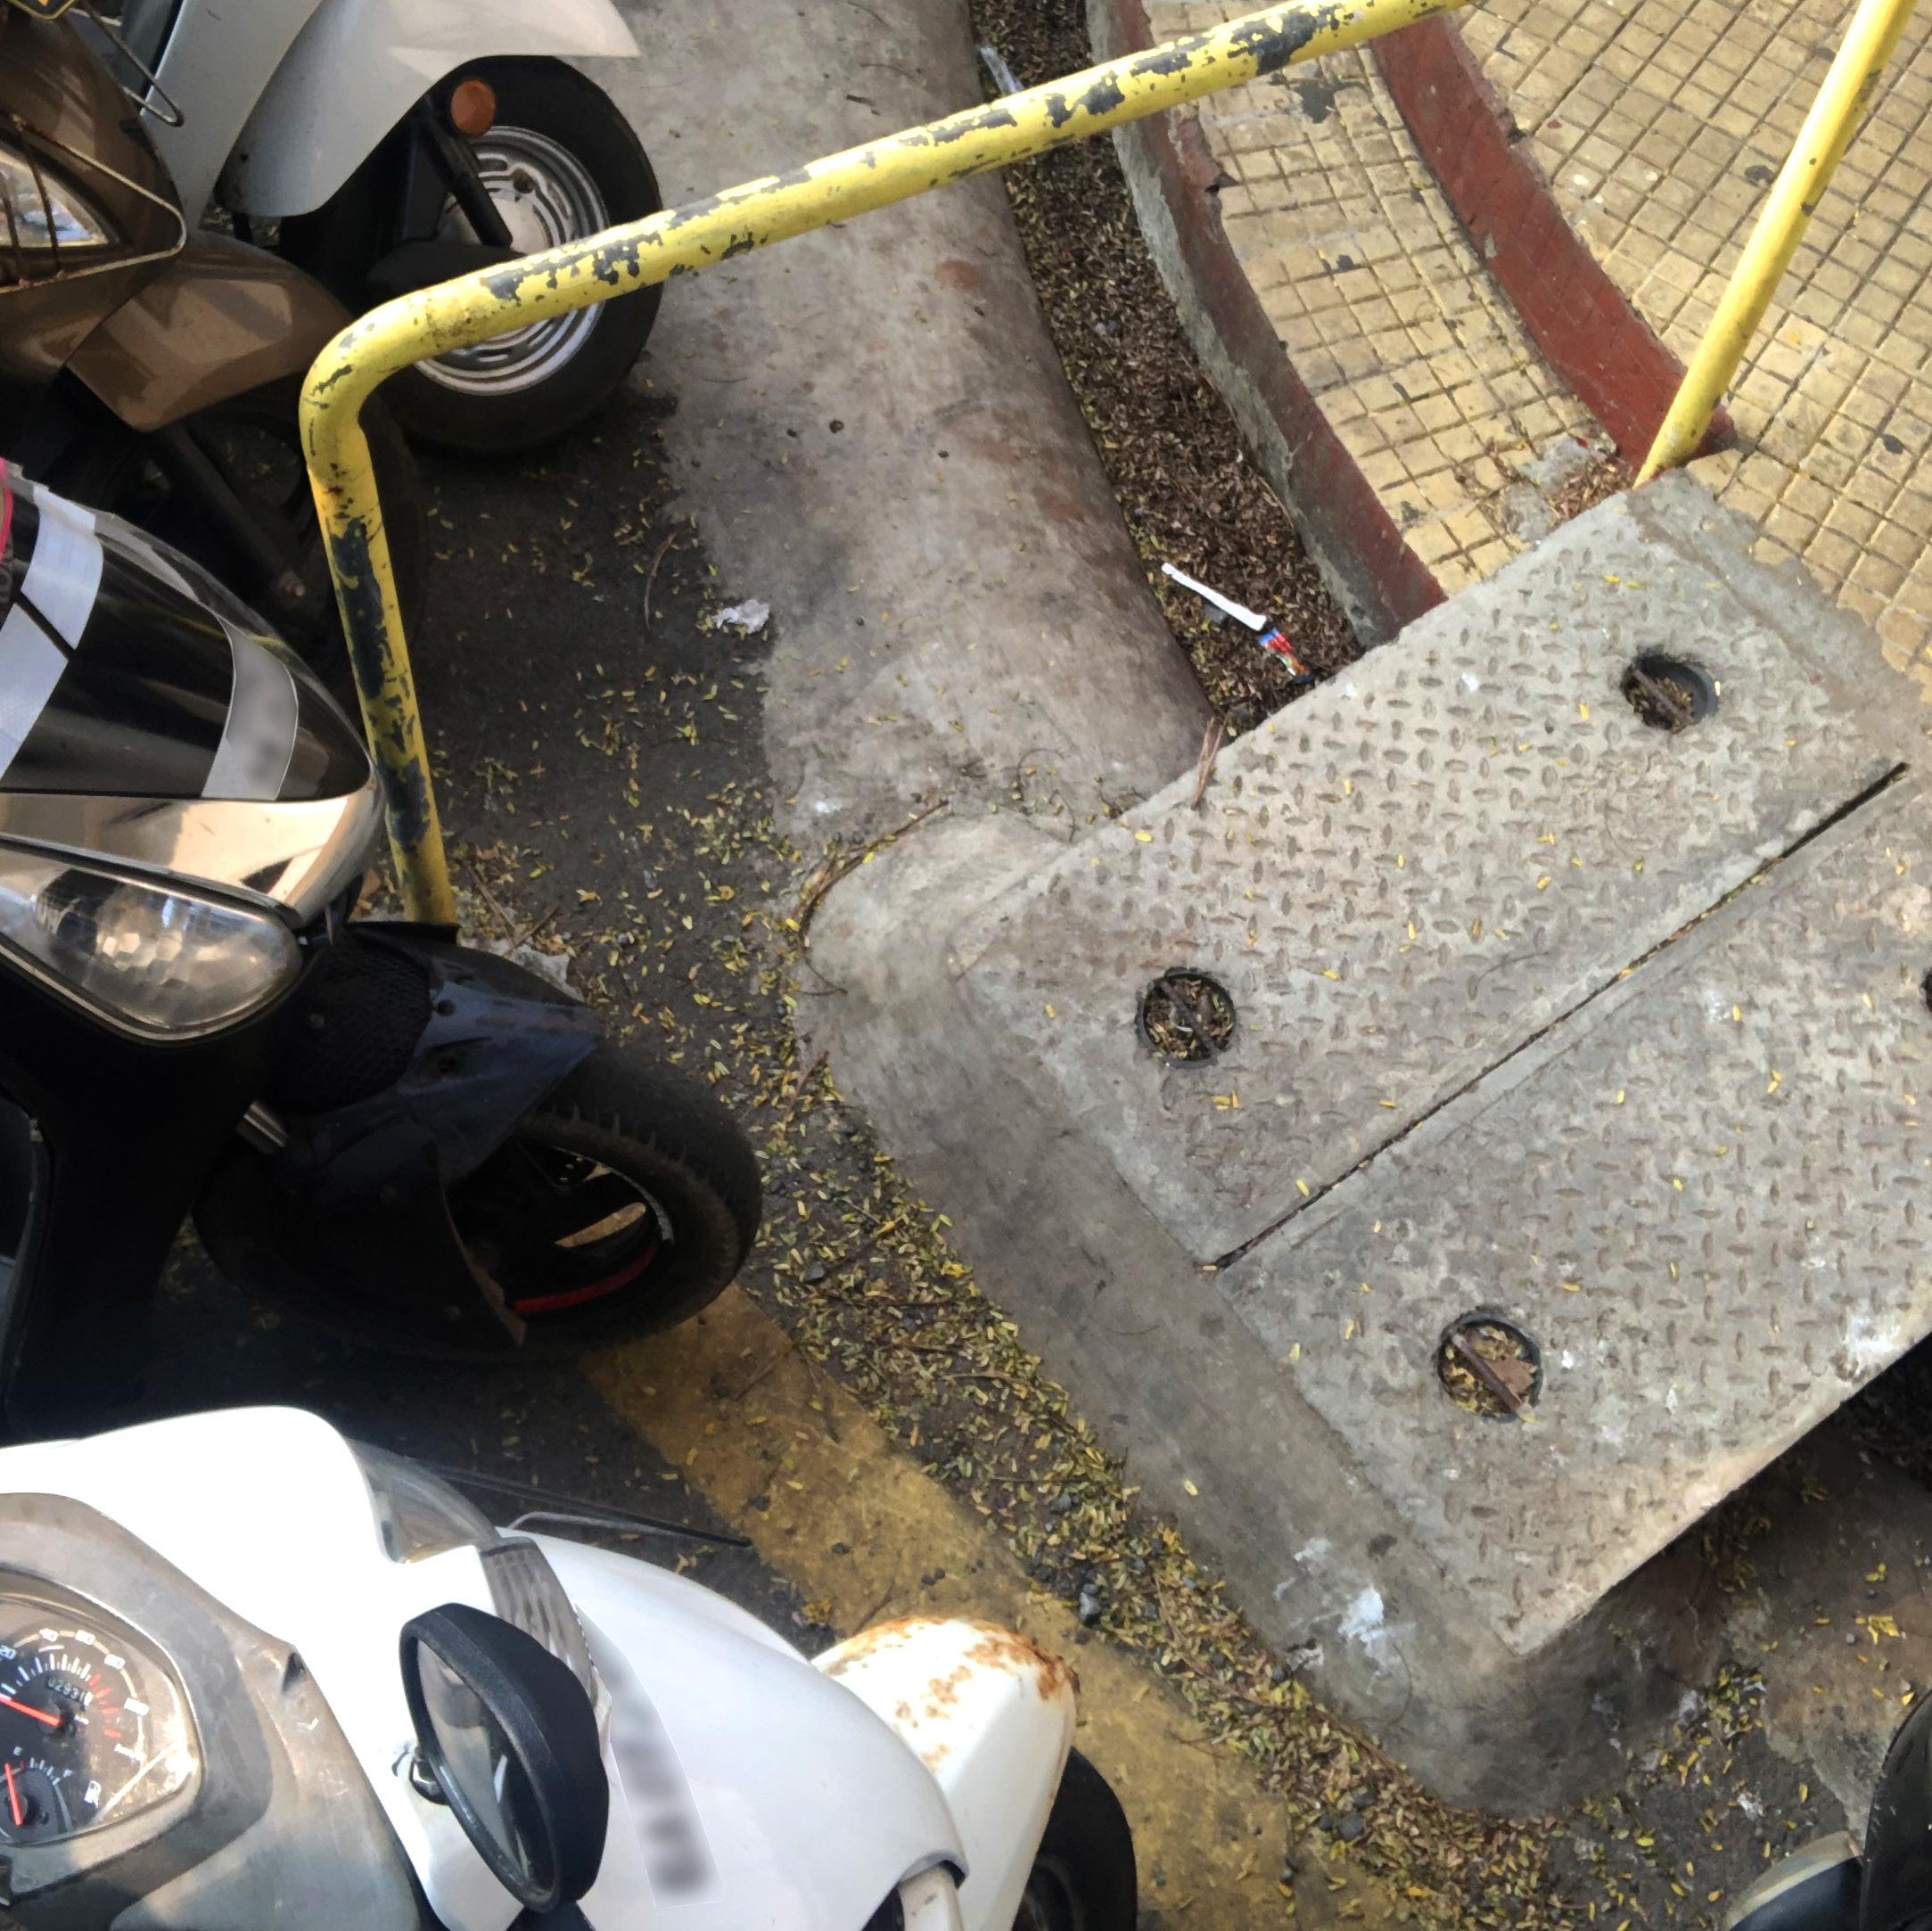
Our research pointed particularly to one issue concerning parking regarding the recent attempt to enforce paid parking and time-restricted zones. Various interviews informed us that within the past few years, the attempts to enforce such parking restrictions barely lasted a year. These efforts were met with many complaints and push back from the community. At present, paid parking signs remain scattered throughout the city, but enforcement has since ceased.
Fig. C.15: Identified Parking Hotspots (Parking Master Plan For Panaji, Goa 2019)
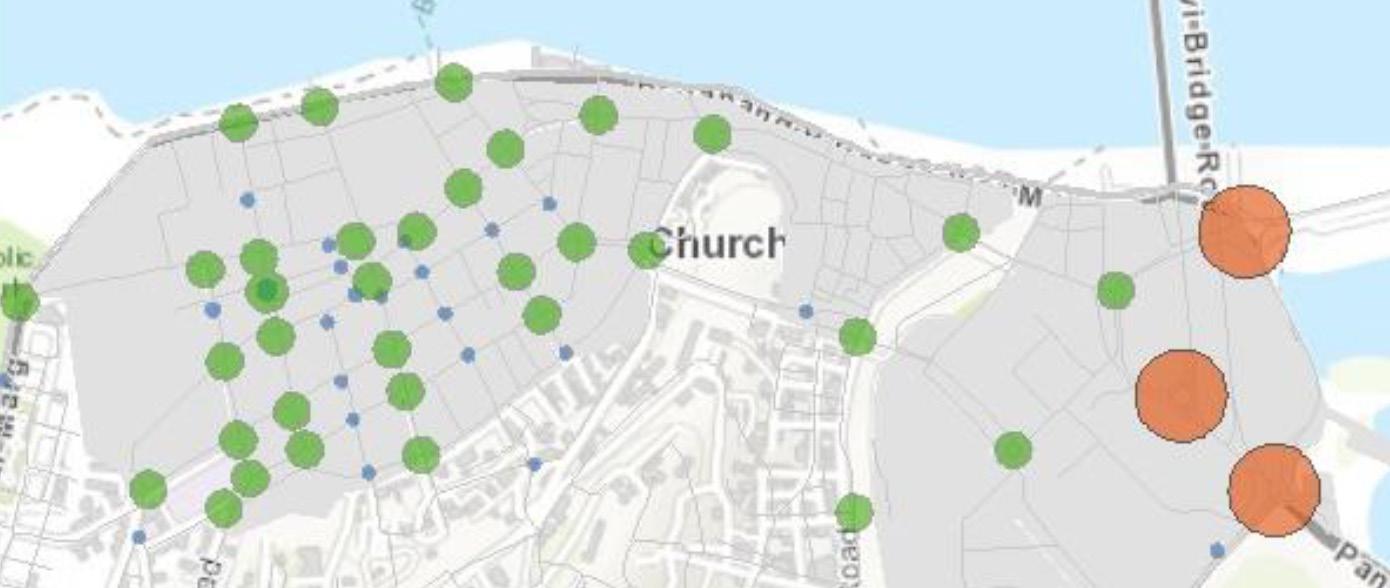
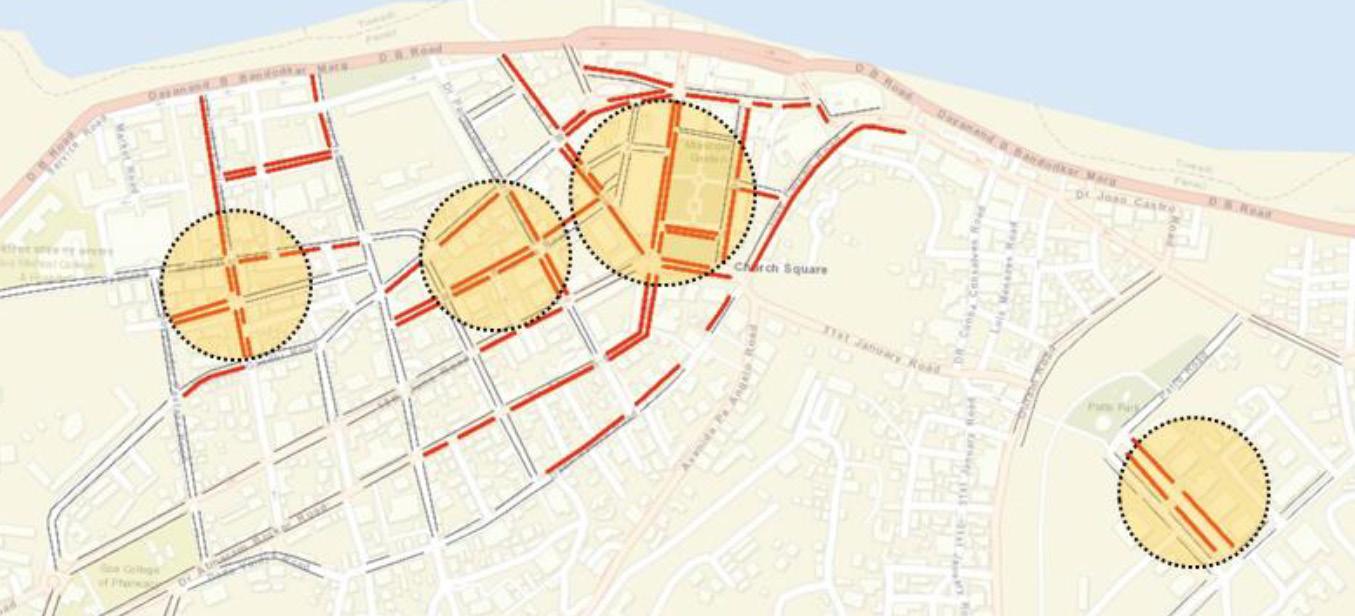
Fig. C.14: Identified Parking Hotspots (Parking Master Plan For Panaji, Goa 2019)
While heavy tourism plays a role in parking issues as tourists take up space for their own vehicles or require on-demand car services, residents point to the casinos specifically as the major source of parking issues. Higherend casinos use on-street parking spaces as valet spots. This has further exasperated parking issues for residents and in some cases, forced them to adapt the ground floor of their residence, breaking through the facade to provide on-site parking for their family.
In addition to parking, we must look at the traffic flow. Many intersections, given the lack of traffic lights, require traffic police who are only sporadically present to control the flow of traffic. This creates congestion at significant intersections and nodes, along with excessive noise from horns beeping to navigate the conflicting flows of travel.
During the Observe walk, nearly every child made a comment about the hazardous walking conditions pointing to no sidewalks, inadequate sidewalks, and dangerous intersections. When asked if a blind or wheelchair-bound individual could navigate the streets, 100% of children responded no. Throughout the CBD pedestrian crossings have been implemented across busy roads and important intersections. However, these crossings are seldom honored by cars, leaving pedestrians to navigate heavy flows of traffic with added stress and apprehension.
“It Is Indeed a great pIty that the school chIldren have to cross thIs hazardous street every day to get to the munIcIpal garden for some open space.’’ -school admInIstrator
As the city turns from green to gray and large buildings block cool breezes, people are walking on increasingly hot and dusty streets. Combined with the smell of garbage piles on street corners, the streets are not a pleasant environment for walking to and from work, taking an evening stroll, or eating lunch.
The Kadamba Transport Corporation (KTC) Limited, operated by the Government of Goa, is a company with the objective of providing safe, reliable, timesaving, efficient, comfortable and affordable public transport service to the commuters. Serving interstate and intercity, the company dominates the conversation when it comes to public transit. Despite being the primary stakeholder for public transit in Panaji, the Corporation is focused at a state level, leaving little room to focus at the local.
From observation, many challenges face the existing system. Busses are hot and overcrowded, often far surpassing the standing maximum posted at the front of the bus. Due to frequent stopping, buses often accelerate while people are still climbing the stairs into the bus leading to hazardous situations. In addition, as the drivers and attendants try for the most fairs, busses will stop for extended periods waiting for new riders. Many interviewees expressed that they felt forced to commute by private vehicle given the inadequate servicing of the public transport system.
‘’people are movIng out of the area due to the cIty becomIng too congested.people would embrace publIc transIt If the roads and routes were better.’’ - resIdent
The following personas represent fictional characters whose details are informed by the takeaways from various methods. These personas are not intended to create defined boxes of who users are; rather, they are meant to be a starting point to understand the many users within the CBD. The goal is to gain better and more personal insights into the clients without jeopardizing their identities and stories. Describing the goals, challenges, and context of these characters also informs what proposals are chosen and how they are formulated.
Fig. C.16: KTC Map of Goa, Zoomed in on Panaji (Master Plan for High Capacity Transit System for Goa 2019)
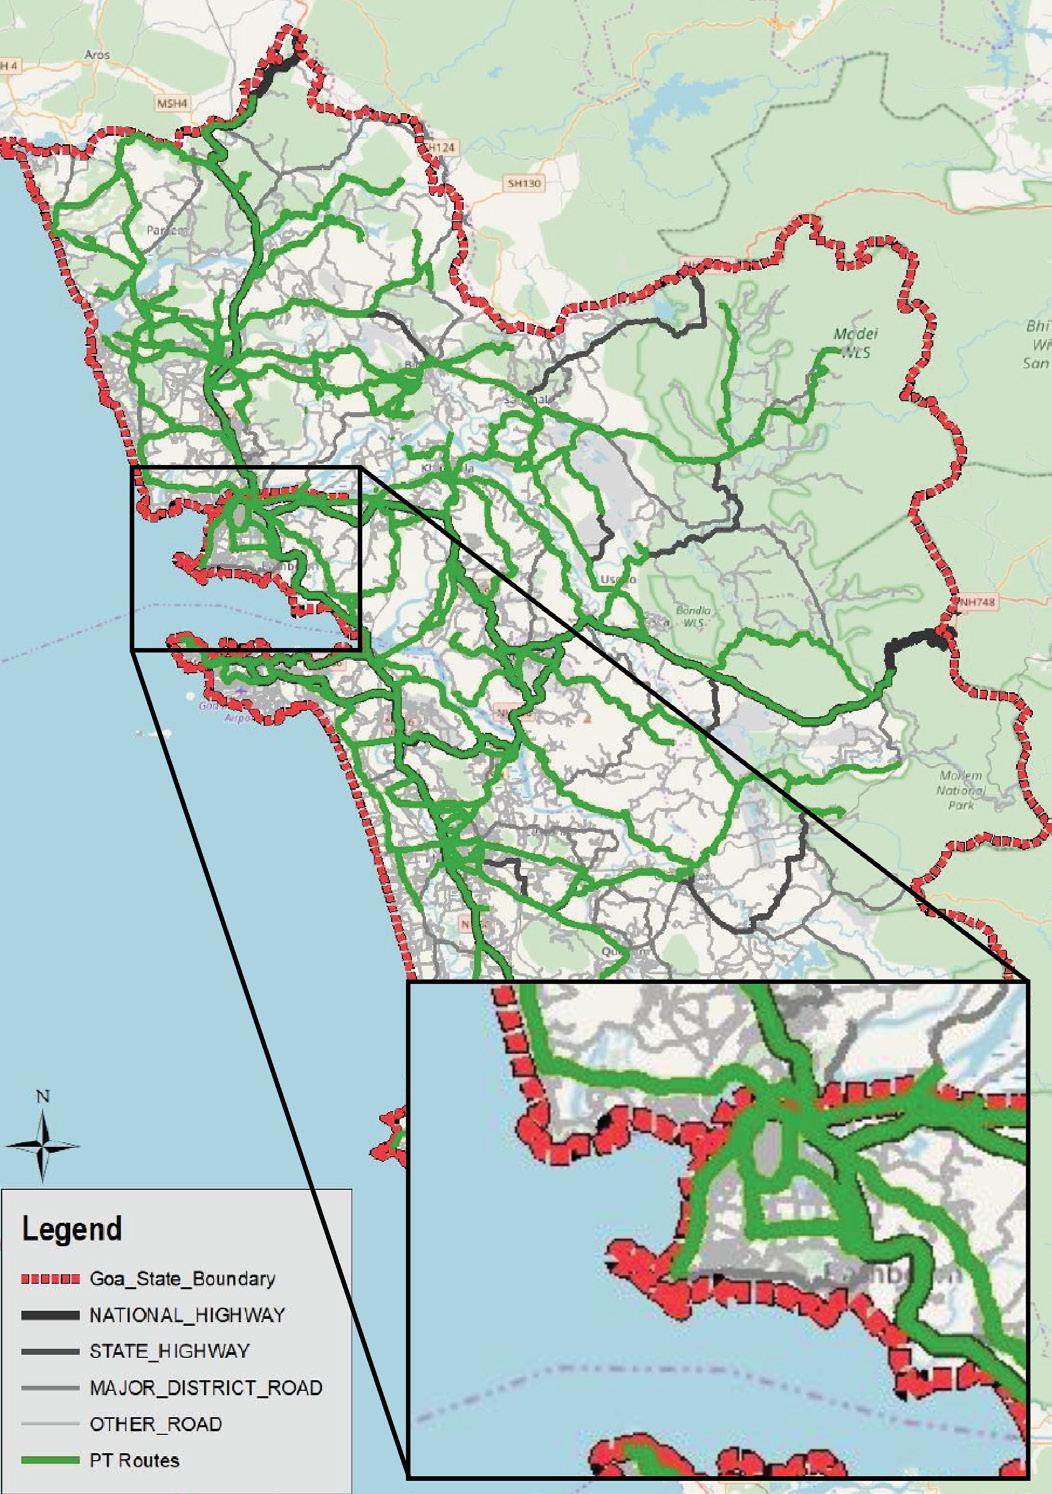


Where the urban planning theory meets the strategic interventions
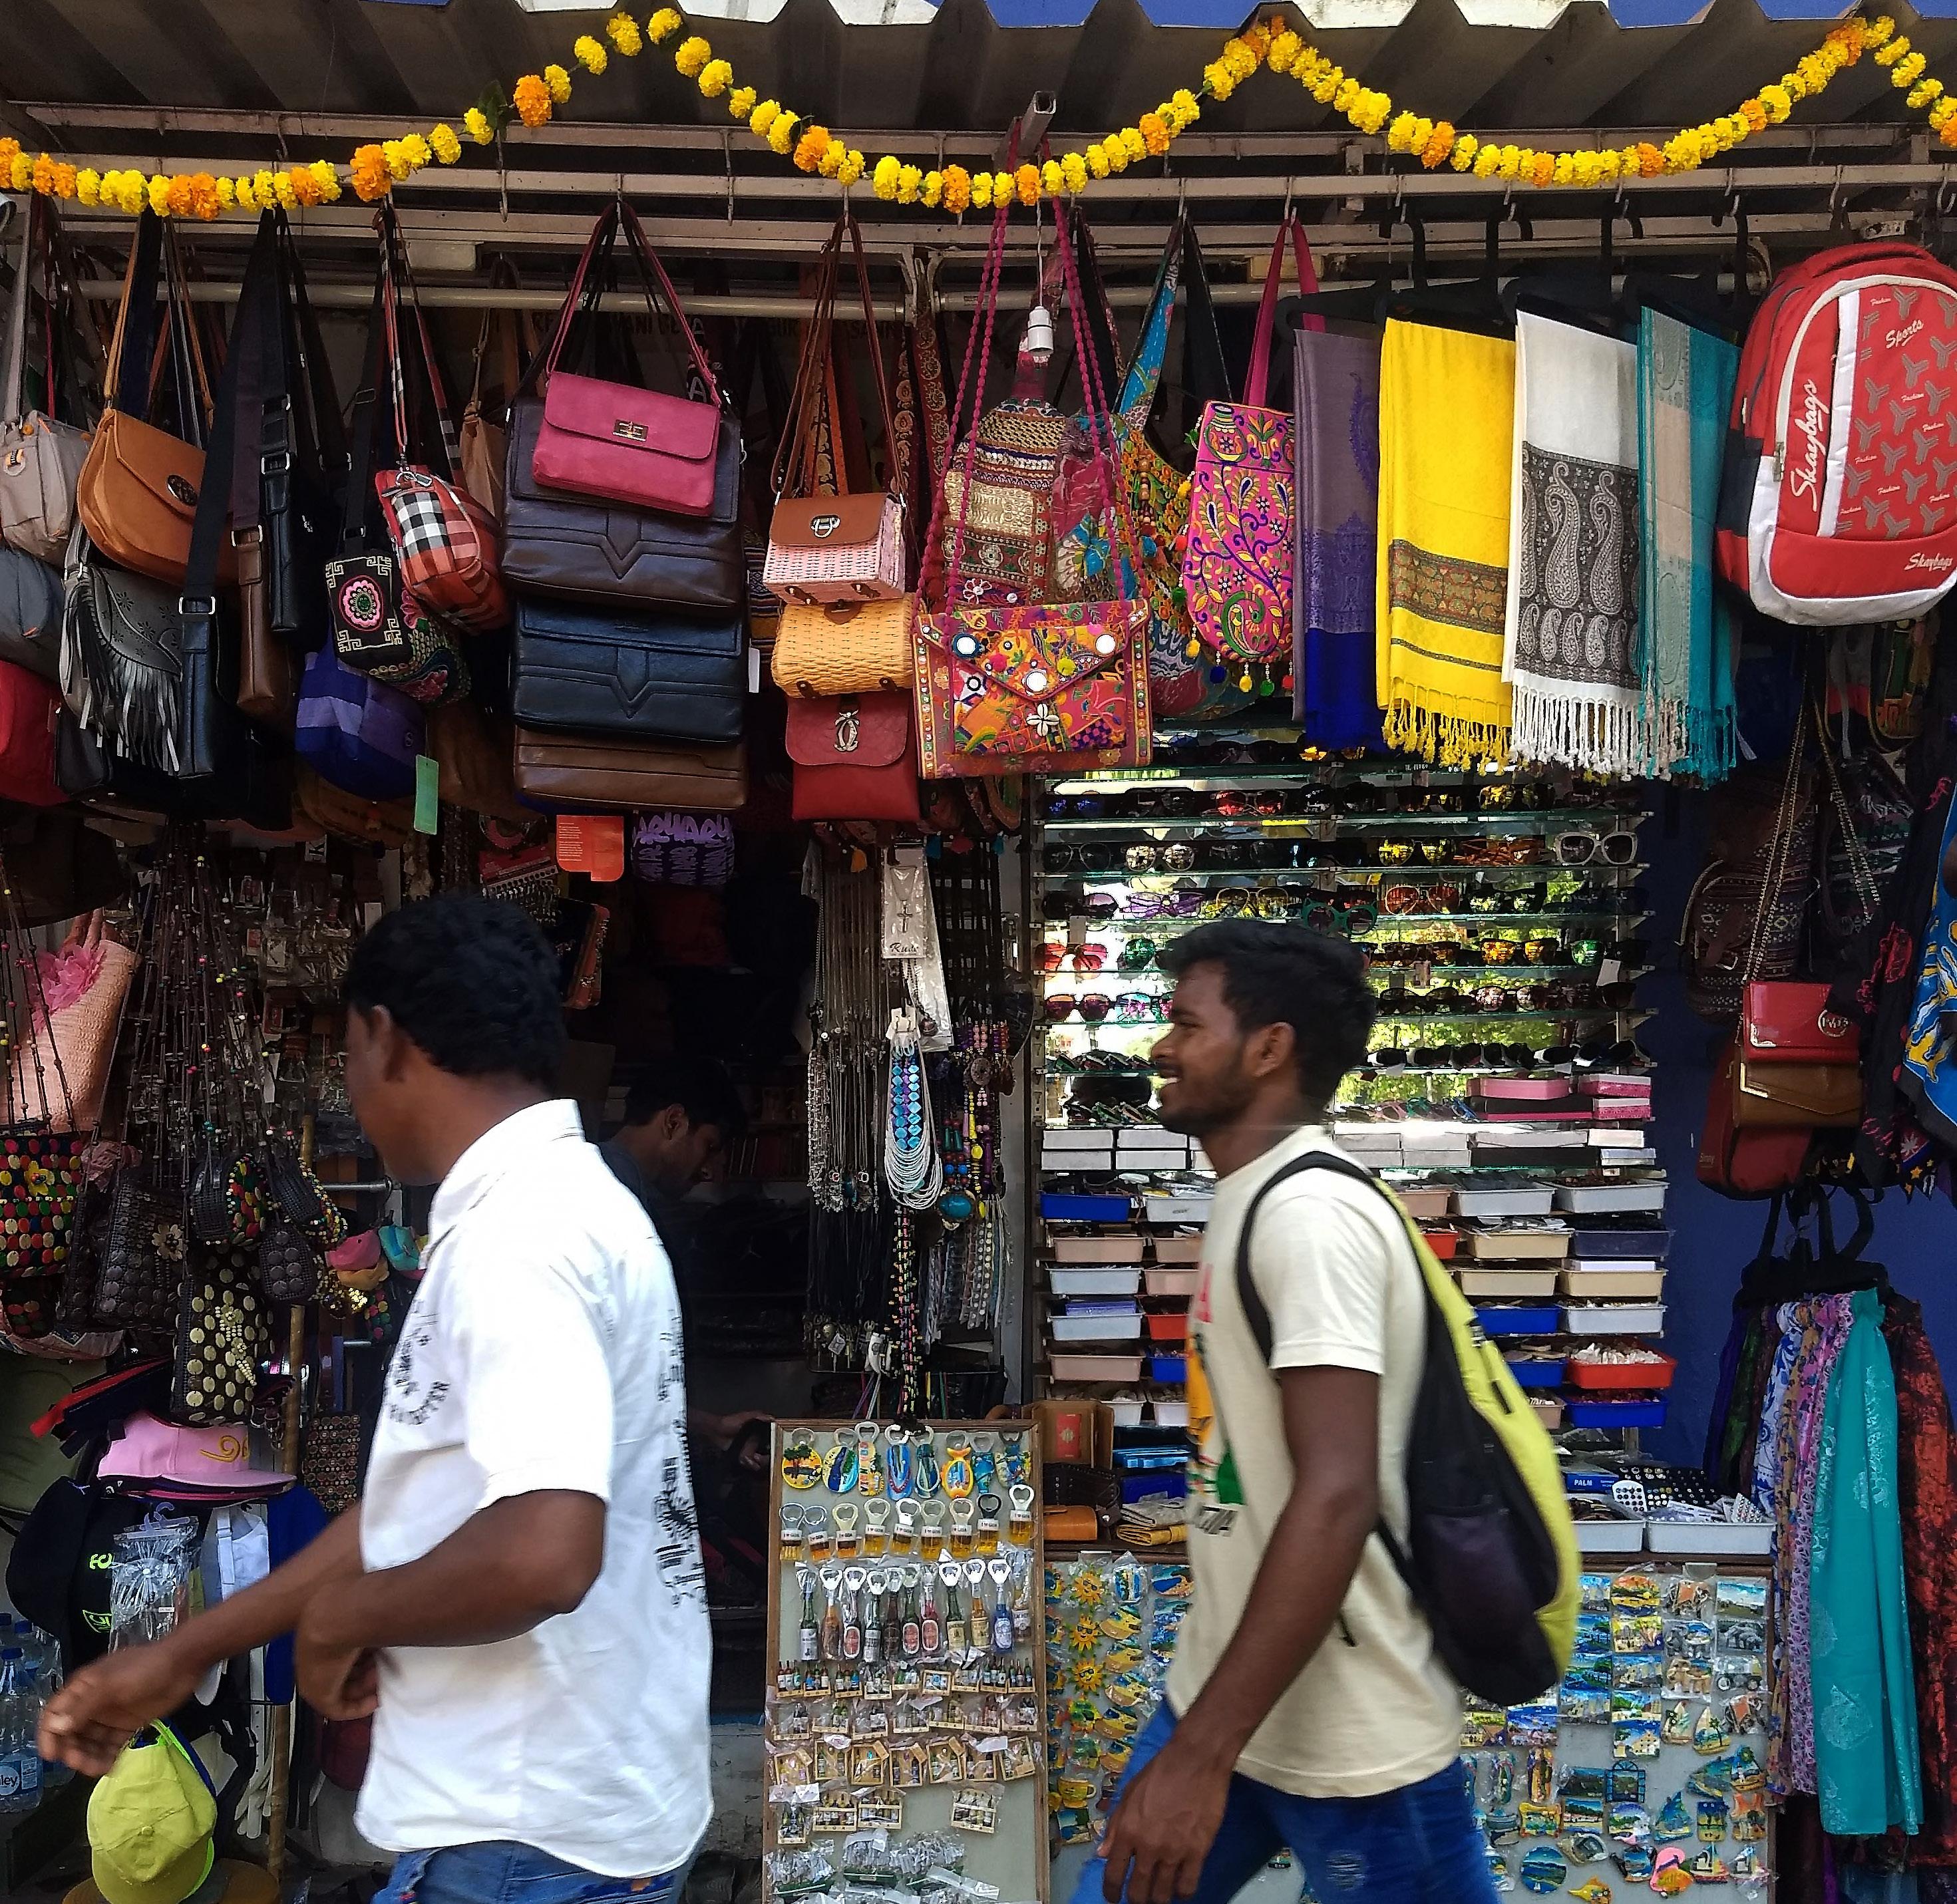
Reflecting on the findings from the methods and situation analysis, there is an apparent disconnect between how the CBD is characterized from the outside and the reality that its inhabitants face. While Panaji is located in the state with the highest GDP per capita, has a growing population, and is viewed as a tourist hotspot, residents claim a perceived decline in livability. Citing water mismanagement, degradation of natural capital, priceexclusive real estate, and increasing social isolation, many residents see no future for themselves in the CBD.
To guide our work, we kept creating concept statements. Being revised nearly every week, this statement evolved as we learned and received feedback from the community. The final statement reads:
“To increase the livability of the CBD for families by ensuring high-quality public space for children and improving mobility within the area.”
In agreement with Herman and Lewis, we define livability as the (in)tangible aspects of the built environment that affect a person’s ability to live, work, and play (2017). Highquality public space for children means urban space that is safe, accessible, and utilized, which allows children of all ages to learn and grow. Lastly, we understand the term mobility as a holistic understanding of how individuals move throughout the city using an array of transportation methods.
The notion that the CBD is becoming unlivable for an array of reasons is the main motivating factor behind this statement. There are many signs that the CBD is in the beginning phases of hollowing out while the periphery areas develop. This is known as the doughnut effect (Sternlieb & Hughes 1980). The warning signs of
unaffordable living costs and institutions relocating to city outskirts must be met with decisive action before the effect takes hold.
- resIdent
The following proposals are based on the participation and empowerment of the public. While this planning phase has focused on participation, this needs to be carried through to implementation.
When all stakeholders are involved throughout the process, there are three clear benefits. The first being that locals are the experts of their place. Therefore, the planning process must facilitate the sharing of knowledge between these experts to design the best proposals. Secondly, when all stakeholders are involved from the beginning, it reduces the contention and friction between stakeholders that could arise during implementation. And thirdly, with regards to maintenance, if all stakeholders were involved from conception through to implementation, the maintenance of such a project is more likely to be driven by those who invested in it along the process.
“there Is no future for us In panajI. here It’s a waste of tIme. I would just lIke to move on wIth my lIfe. here you cant fIght a corrupt system.”
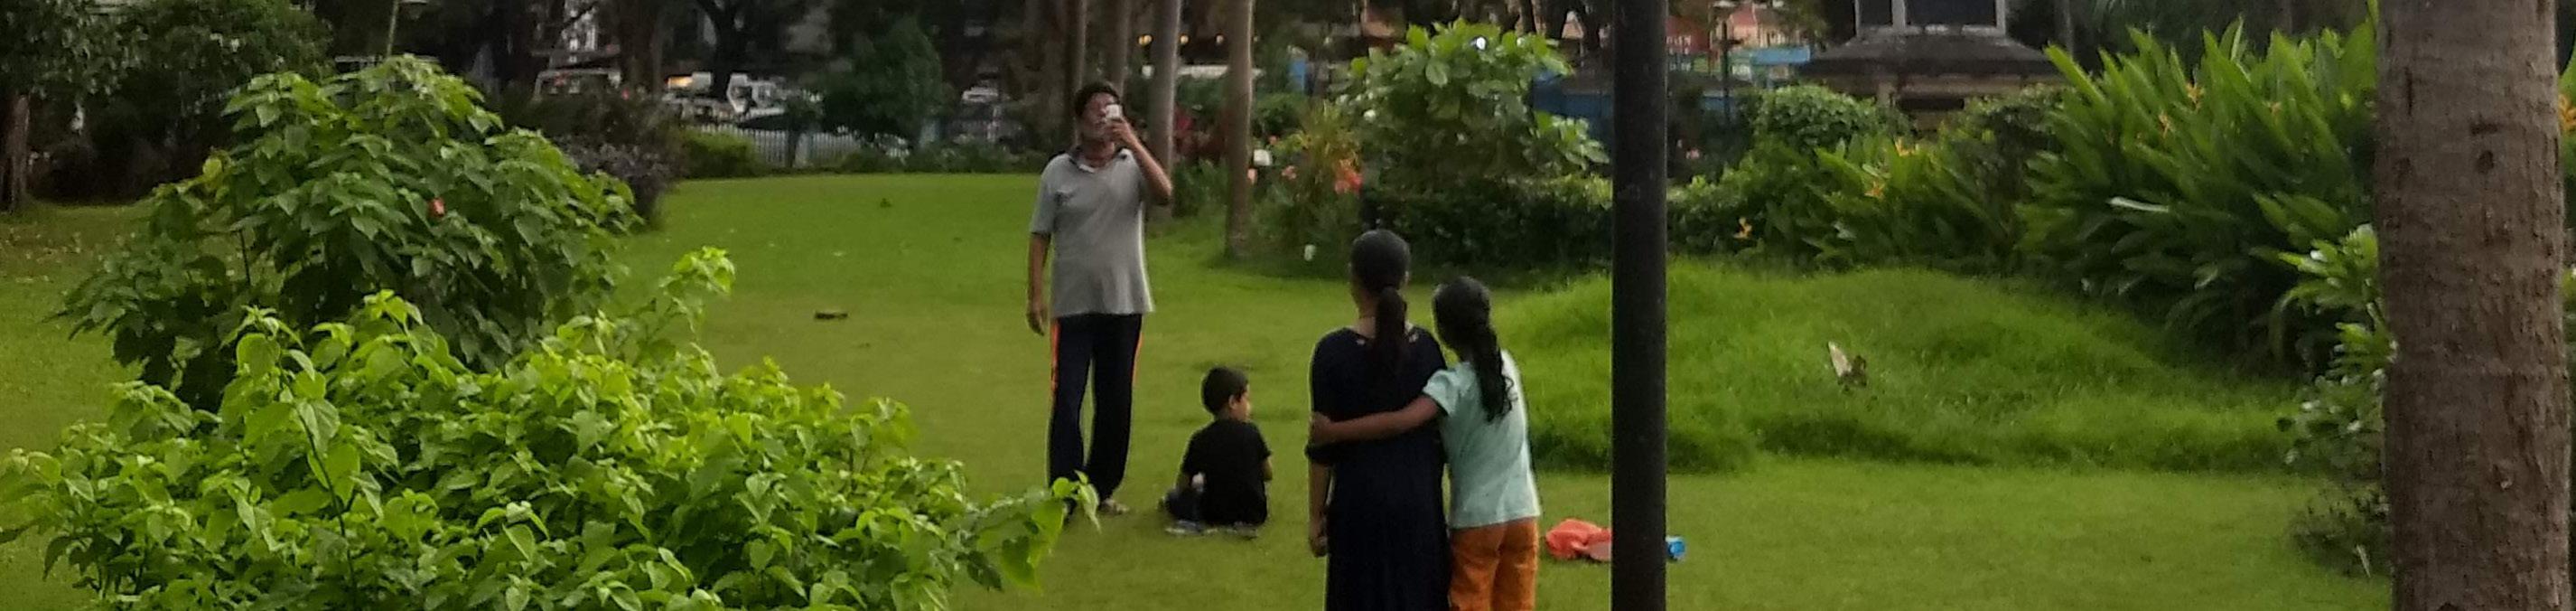
Perhaps the largest consensus among children is the negative sense of safety. During interviews and the Observe walk, the children consistently raised the issue of safety in parks and on the streets. This is reflected in how schools and parents limit children’s time outside their safe walls. Children cite a multitude of factors that influence their decision from perceived dangerous strangers to heavy traffic and poor walkability.
Through our observation, it is clear that children are not considered in the planning and designing of public spaces within the city. Each of the parks within the East CBD area are designed primarily, if not solely, for the leisurely pace of resting adults and gossiping elderly. Children are only seldomly welcomed into the parks when they are activated with events for families. The other 360 days of the year, they are met with signs that say no children.
In large part, children of all ages are overlooked when it comes to the planning and design of the CBD. What little facilities there are for children, is left to deteriate. Small children are unable to cross gutters, teens cannot play sports in the park, and parents must hold their children’s hand tight when crossing the street in fear their child may become another statistic in the second deadliest state for traffic accidents (Gururaj, 2008).
Create a sense of ownership and empowerment amongst the local schools and residents while engaging CCP to create high-quality public space for children. When cities are built to include children, they are better for everyone in terms of accessibility, safety, and utility.
Create a community council under the Imagine Panaji umbrella with representatives of Imagine Panaji, local residents, school officials, and religious institutions, with at least 30% voting representation by children. The pilot project of this council is to address the vacant lot south of Jardim Garcia D’Orta.
Replicate and adapt the prior mentioned school workshop with other schools in the area and any interested institution such as the Immaculate Conception Church and the Head Mosque.
Based on this participation, implement the design using the resource of Imagine Panaji. From the previously mentioned methods, here is one potential scenario:
The park includes prefabricated and atypical play equipment suitable for many ages, a mini-library and reading spot, and a community garden. Each organization represented on the community council would assist Imagine Panaji in building the park. Contactors do the excavation, parents build the planter boxes from wood, and children plant the garden. By having a hand in the execution, the community develops a sense of ownership of the project and the results. The maintenance of the lot will be handed over to CCP. The schools or religious institutions will manage the garden and the mini library. Schools can coordinate recess times throughout the week to improve children’s growth and development. Time spent playing outside and interacting with the natural environment is proven to have a positive impact on motor development in children as well as preventive health effects (Fjørtoft & Sageie, 2000).
The utility of the park will be examined by the council after project completion every three months. At the end of the first year, the council will reconvene to examine any adaptations to the design. Potential future adaptations could range from expanding upon successful elements, reassessing the viability of less successful elements, and proposing new uses.
This framework of the community council focusing on public space will be utilized as a replicable precedent for all public space projects pursued by Imagine Panaji. While this proposal focuses on one lot, every public space must be designed with children in mind for the city to be inviting.
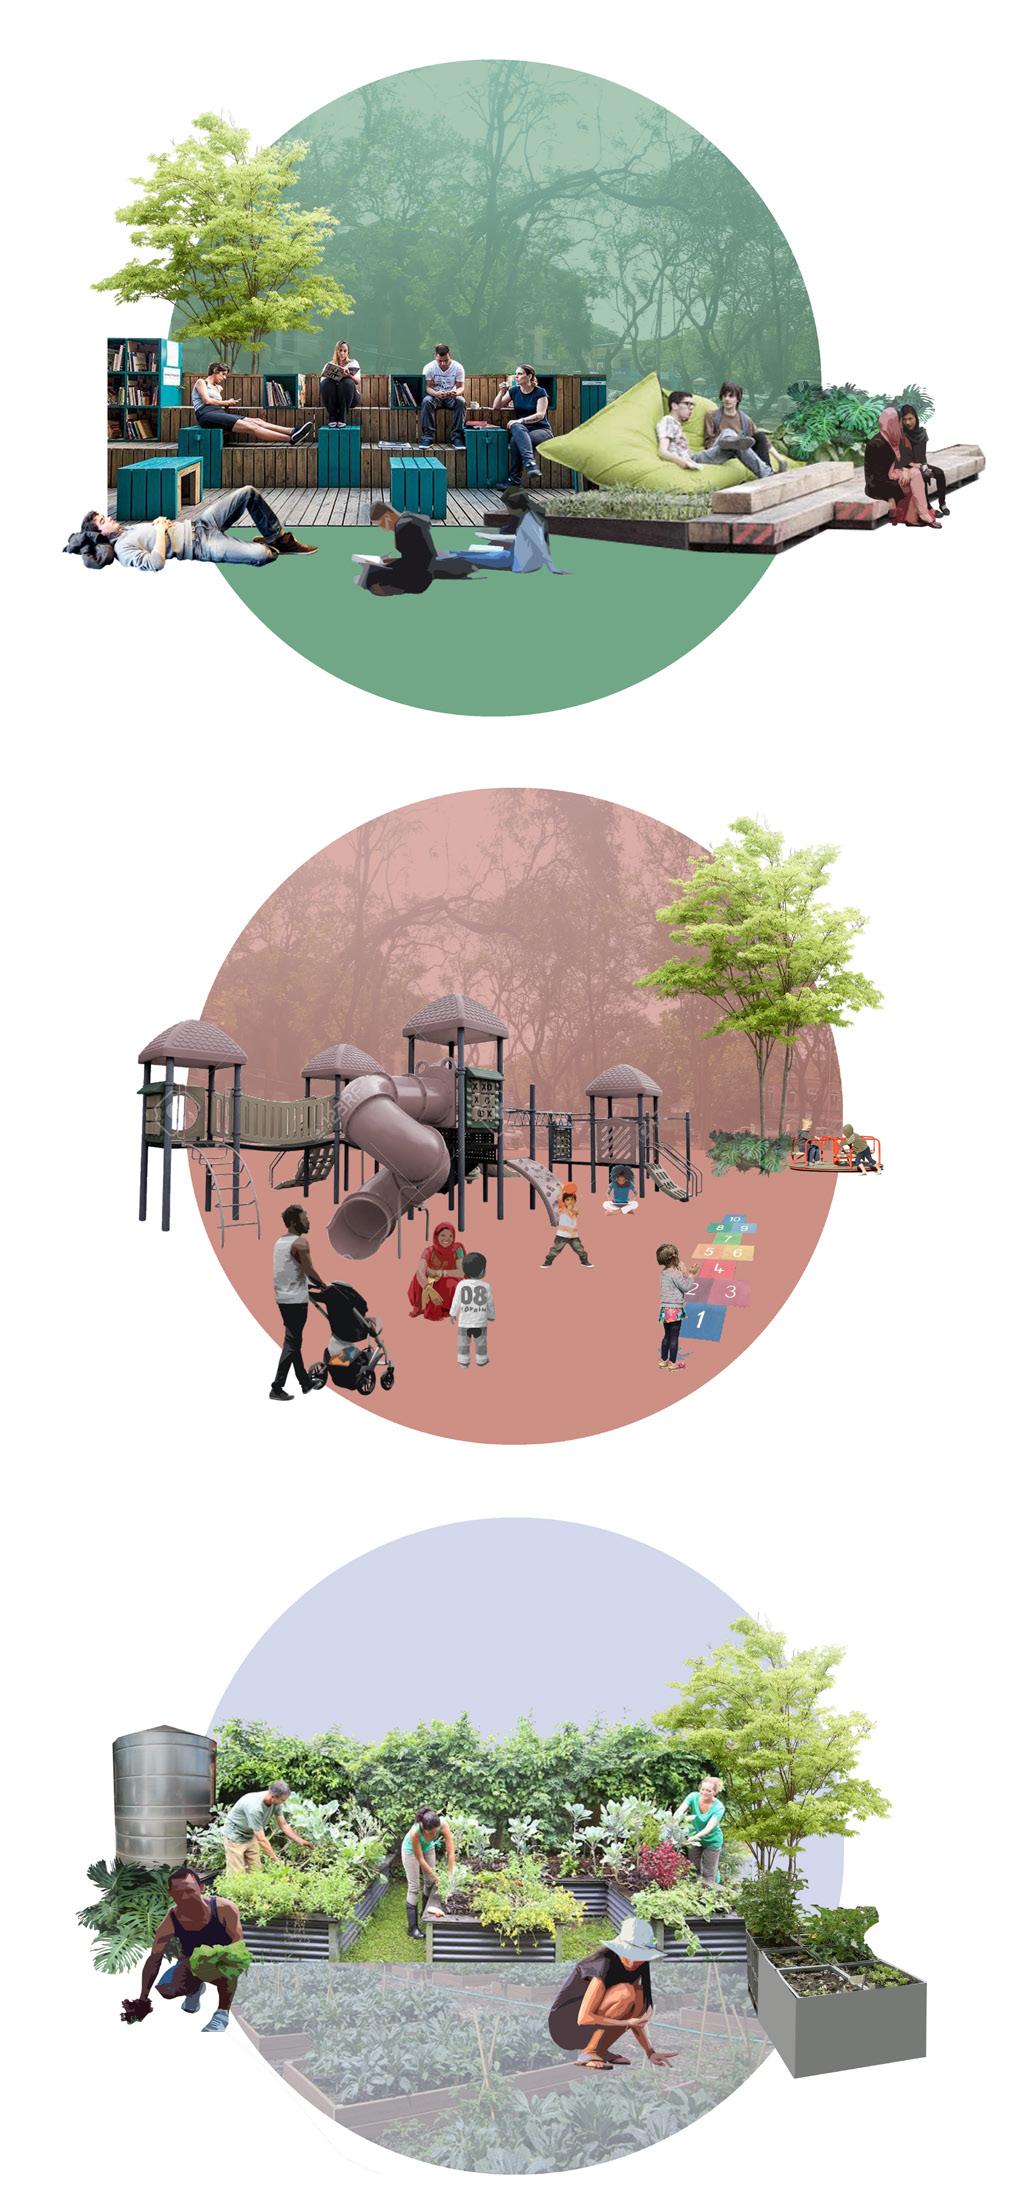
It is undeniable that Panaji has car issues. Within a state that has the highest vehicle ownership (Comprehensive Mobility Plan for Goa 2019), Panaji has steadily deregulated two and four-wheel vehicles. For a city of just over 40,000 people, Panaji suffers excessive mobility issues from parking, pedestrian accessibility, and efficiency. The consequences are not limited to the frustration of drivers but extended to poor air quality for children going to school, a higher opportunity cost for businesses, and an overall decrease of livability for those in the area.
The lack of regulation has led to the streets being underutilized. Casino goers leave their vehicles in front of businesses for many hours without showing a rupee to the stores as they enter the economic island of the casino. Valuable parking spots are taken up by idle tourist vehicles whose drivers are hoping to make a day’s pay in one or two rides. Curbside parking is perhaps one of the most valued pieces of land, yet it is left to be consumed without any checks.
Given Imagine Panaji’s commitment to mobility, the goal is to provide tangible steps to inform the public and work collaboratively to achieve better streets for everyone, especially those who are marginalized and rely on walking and public transportation.
While mobility is a comprehensive topic spanning walking, bicycling, driving, and public transport, it is not treated as such in Panaji. Imagine Panaji started addressing mobility by publishing the Comprehensive Mobility Plan for Goa. Granted this plan takes critical first steps to understand the current situation and moving the conversation forward; it lacks tangible action points. There lacks a detailed plan that takes into account every mode of transportation and how the streets are managed for Panaji. Residents even report inter-agency fighting over whose responsibility it was to resurface a road after utility work.
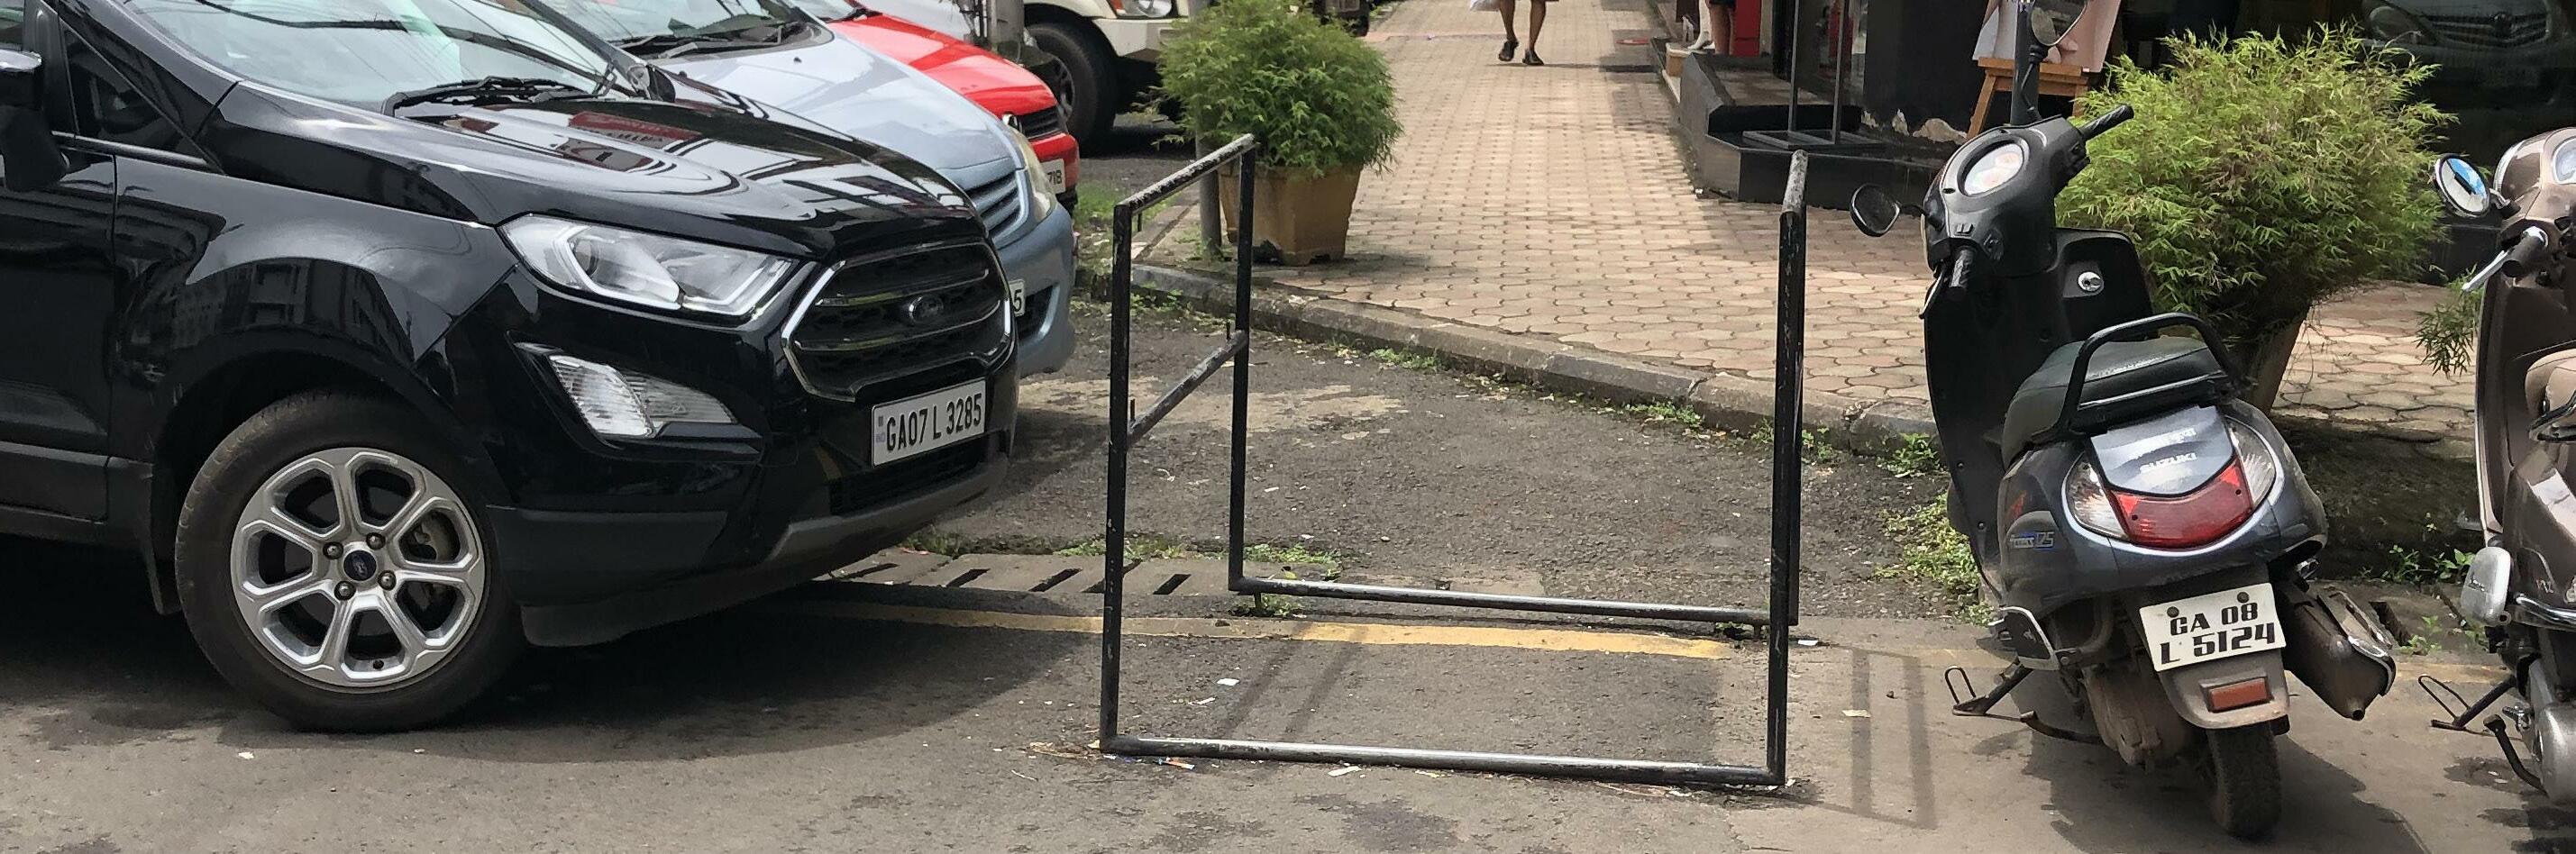
Initiate an information campaign to inform local property and business owners of the benefits of enhancing the walkability of streets. While those in built environment professions know that pedestrianized streets help residents lead healthier lives and boost retail sales, this is often not understood by shop owners who can sharply oppose traffic and parking changes. Therefore, education to get local stakeholders on the same page with the benefits is crucial.
In partnership with businesses, CCP will place metal barricades that prevent vehicles from blocking the pedestrian pathway at intersections, thus enhancing the walkability for everyone, especially those most in need. Businesses have the option of sponsoring a barricade in return for advertising space on that barricade. By creating less hostile streets for disabled persons, Panaji reinforces the equal access rights solidified in the Constitution of India (i.e. Articles 15, 17, and 23) as the street serves as the means by which individuals access job opportunities, places of worship, their property, etc.
Institute a 2-hour parking limit from 08:00 to 19:00 on medium and heavy traffic streets. For residents and property owners, exemption permits may be granted for their respective street. The Traffic Police would be the primary enforcement agency. Imagine Panaji would contribute license plate scanners to assist the enforcement.
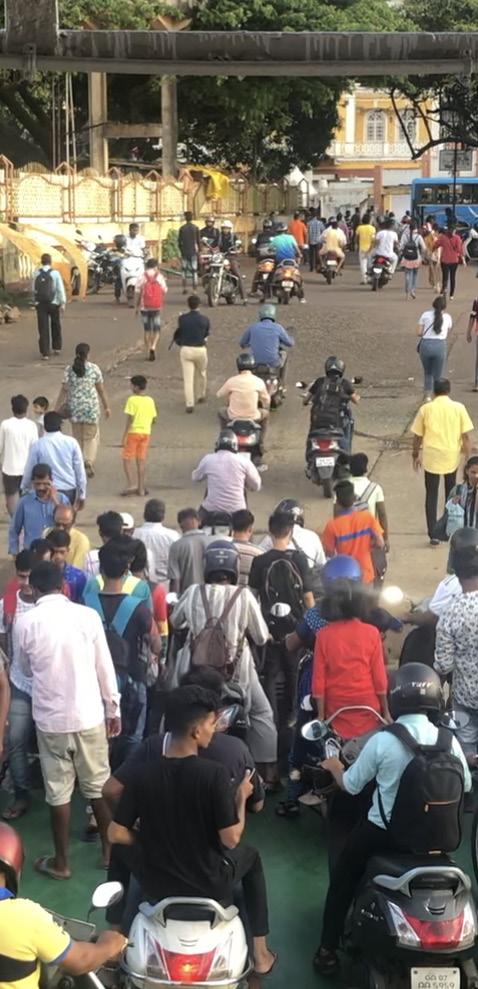
Looking back on the semester, our team fulfilled our objectives of using human-centered design thinking to gain a holistic understanding that leads to co-designed strategic actions that would move the community towards their expressed desires. The many participation methods moved us through empathizing to co-designing. While we wish we could have worked with more schools and co-design the mobility proposals further, we believe the previous three months produced valuable and tangible results.
An area we wish we had time to address is water in the city. From various engagement methods, the topic of permeable surfaces, stormwater infrastructure, and water security kept being brought up. While our team did not have the capacity to address these topics in full, we encourage the appropriate agencies to take interest and address these issues. Engaging with residents and businesses about the benefits of rainwater harvesting and developing systems that allow cities to take action.
For instance, Salt Lake City, Utah, provides education and purchase options: https://www.slc.gov/utilities/ conservation/get-a-rain-barrel. Imagine Panaji should look into low impact development technology such as storm chambers (Clark & Darling 2019). These would be easily adaptable to the basin-style road gutters throughout the city. Imagine Panaji can cover the startup costs such as a soil survey, percolation tests, and developing a final design.
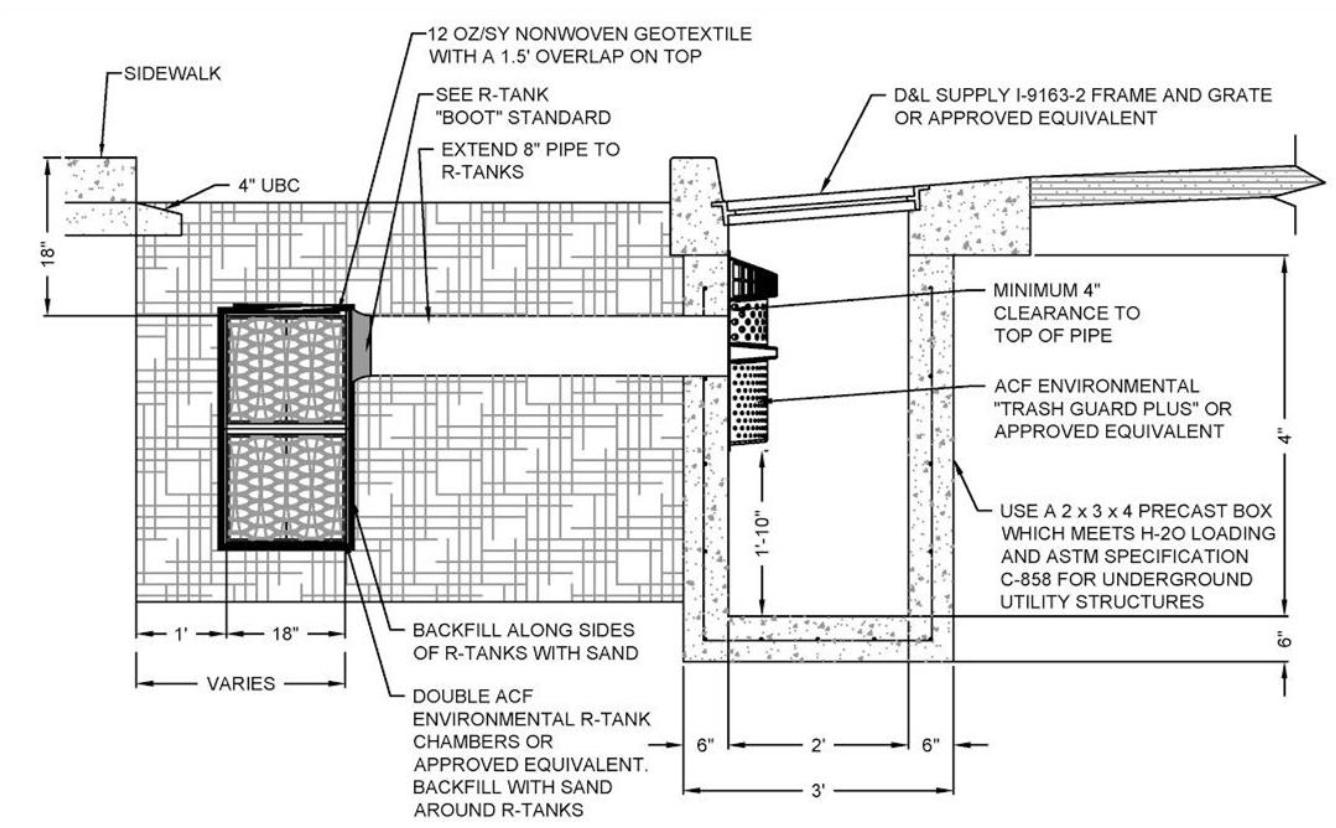
As this semester and report come to a close, this work must not cease. We thank Imagine Panaji for their partnership and hope to see these topics sincerely considered in their work. Within the given inefficient, bureaucratic planning structures, Imagine Panaji holds a privileged position with the potential of shaping the built environment and city processes to help everyone, especially those most marginalized.
Fig. C.18: Storm Chamber Diagram (Clark & Darling 2019)
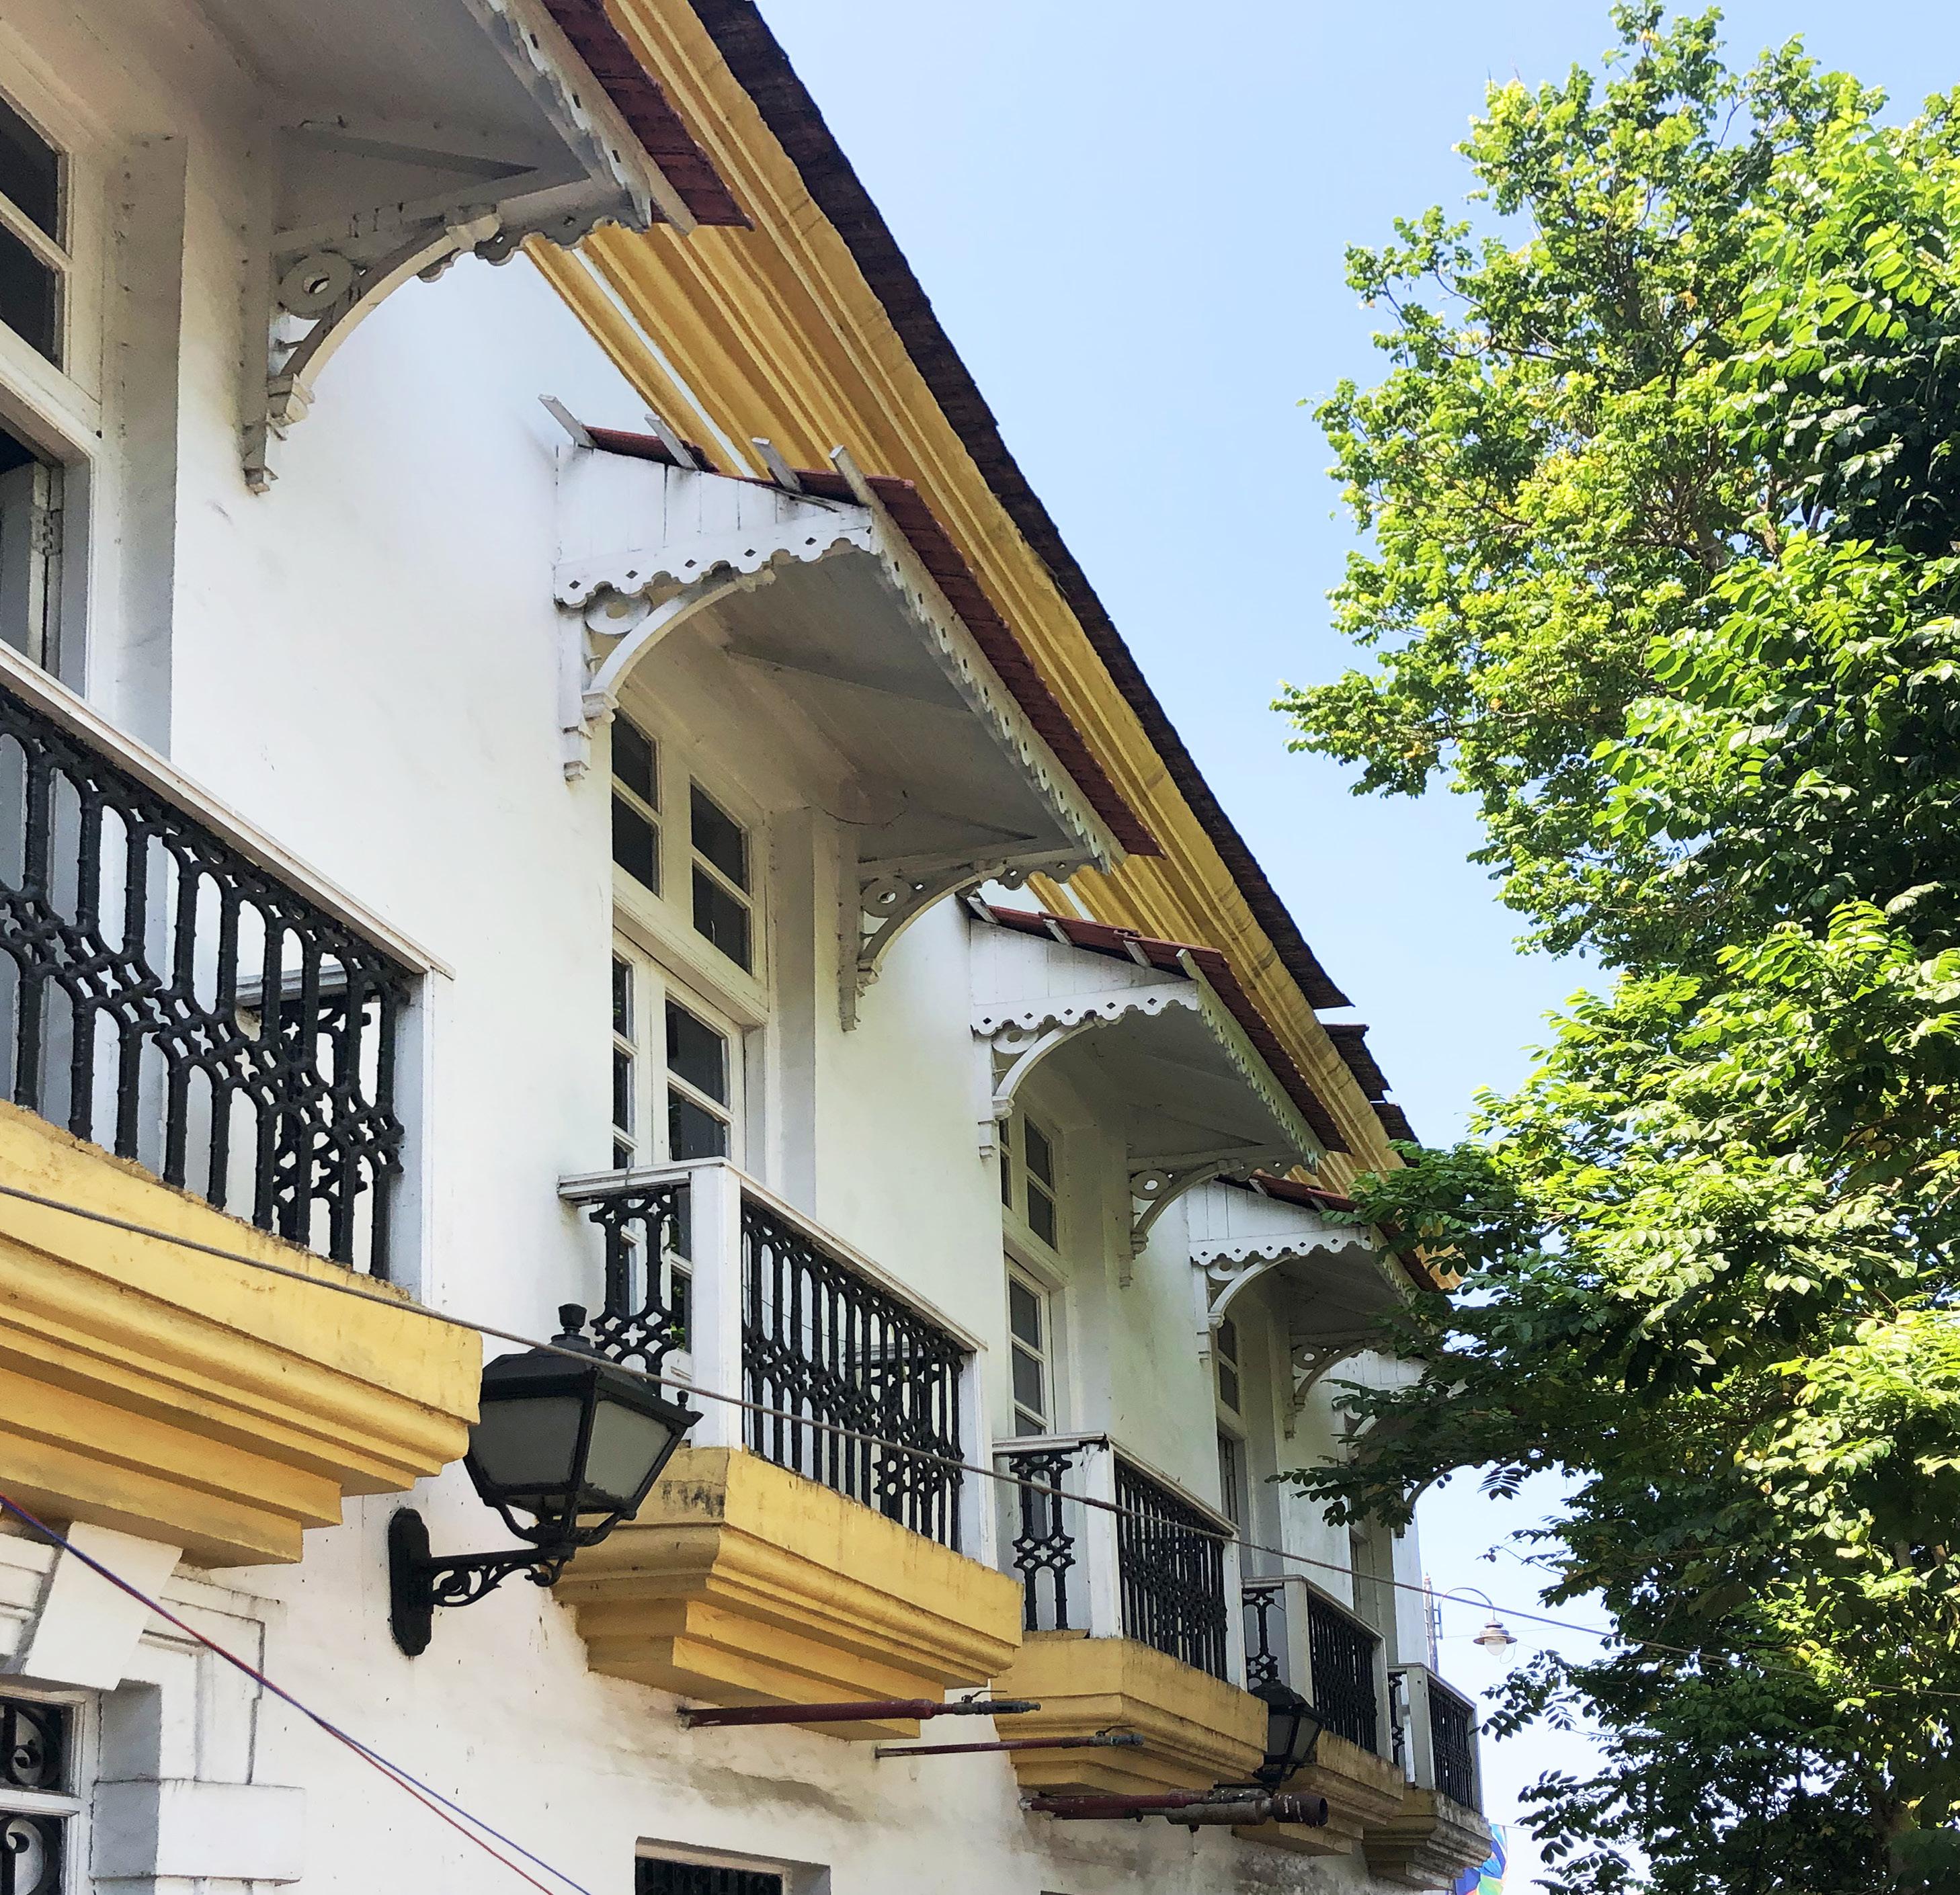
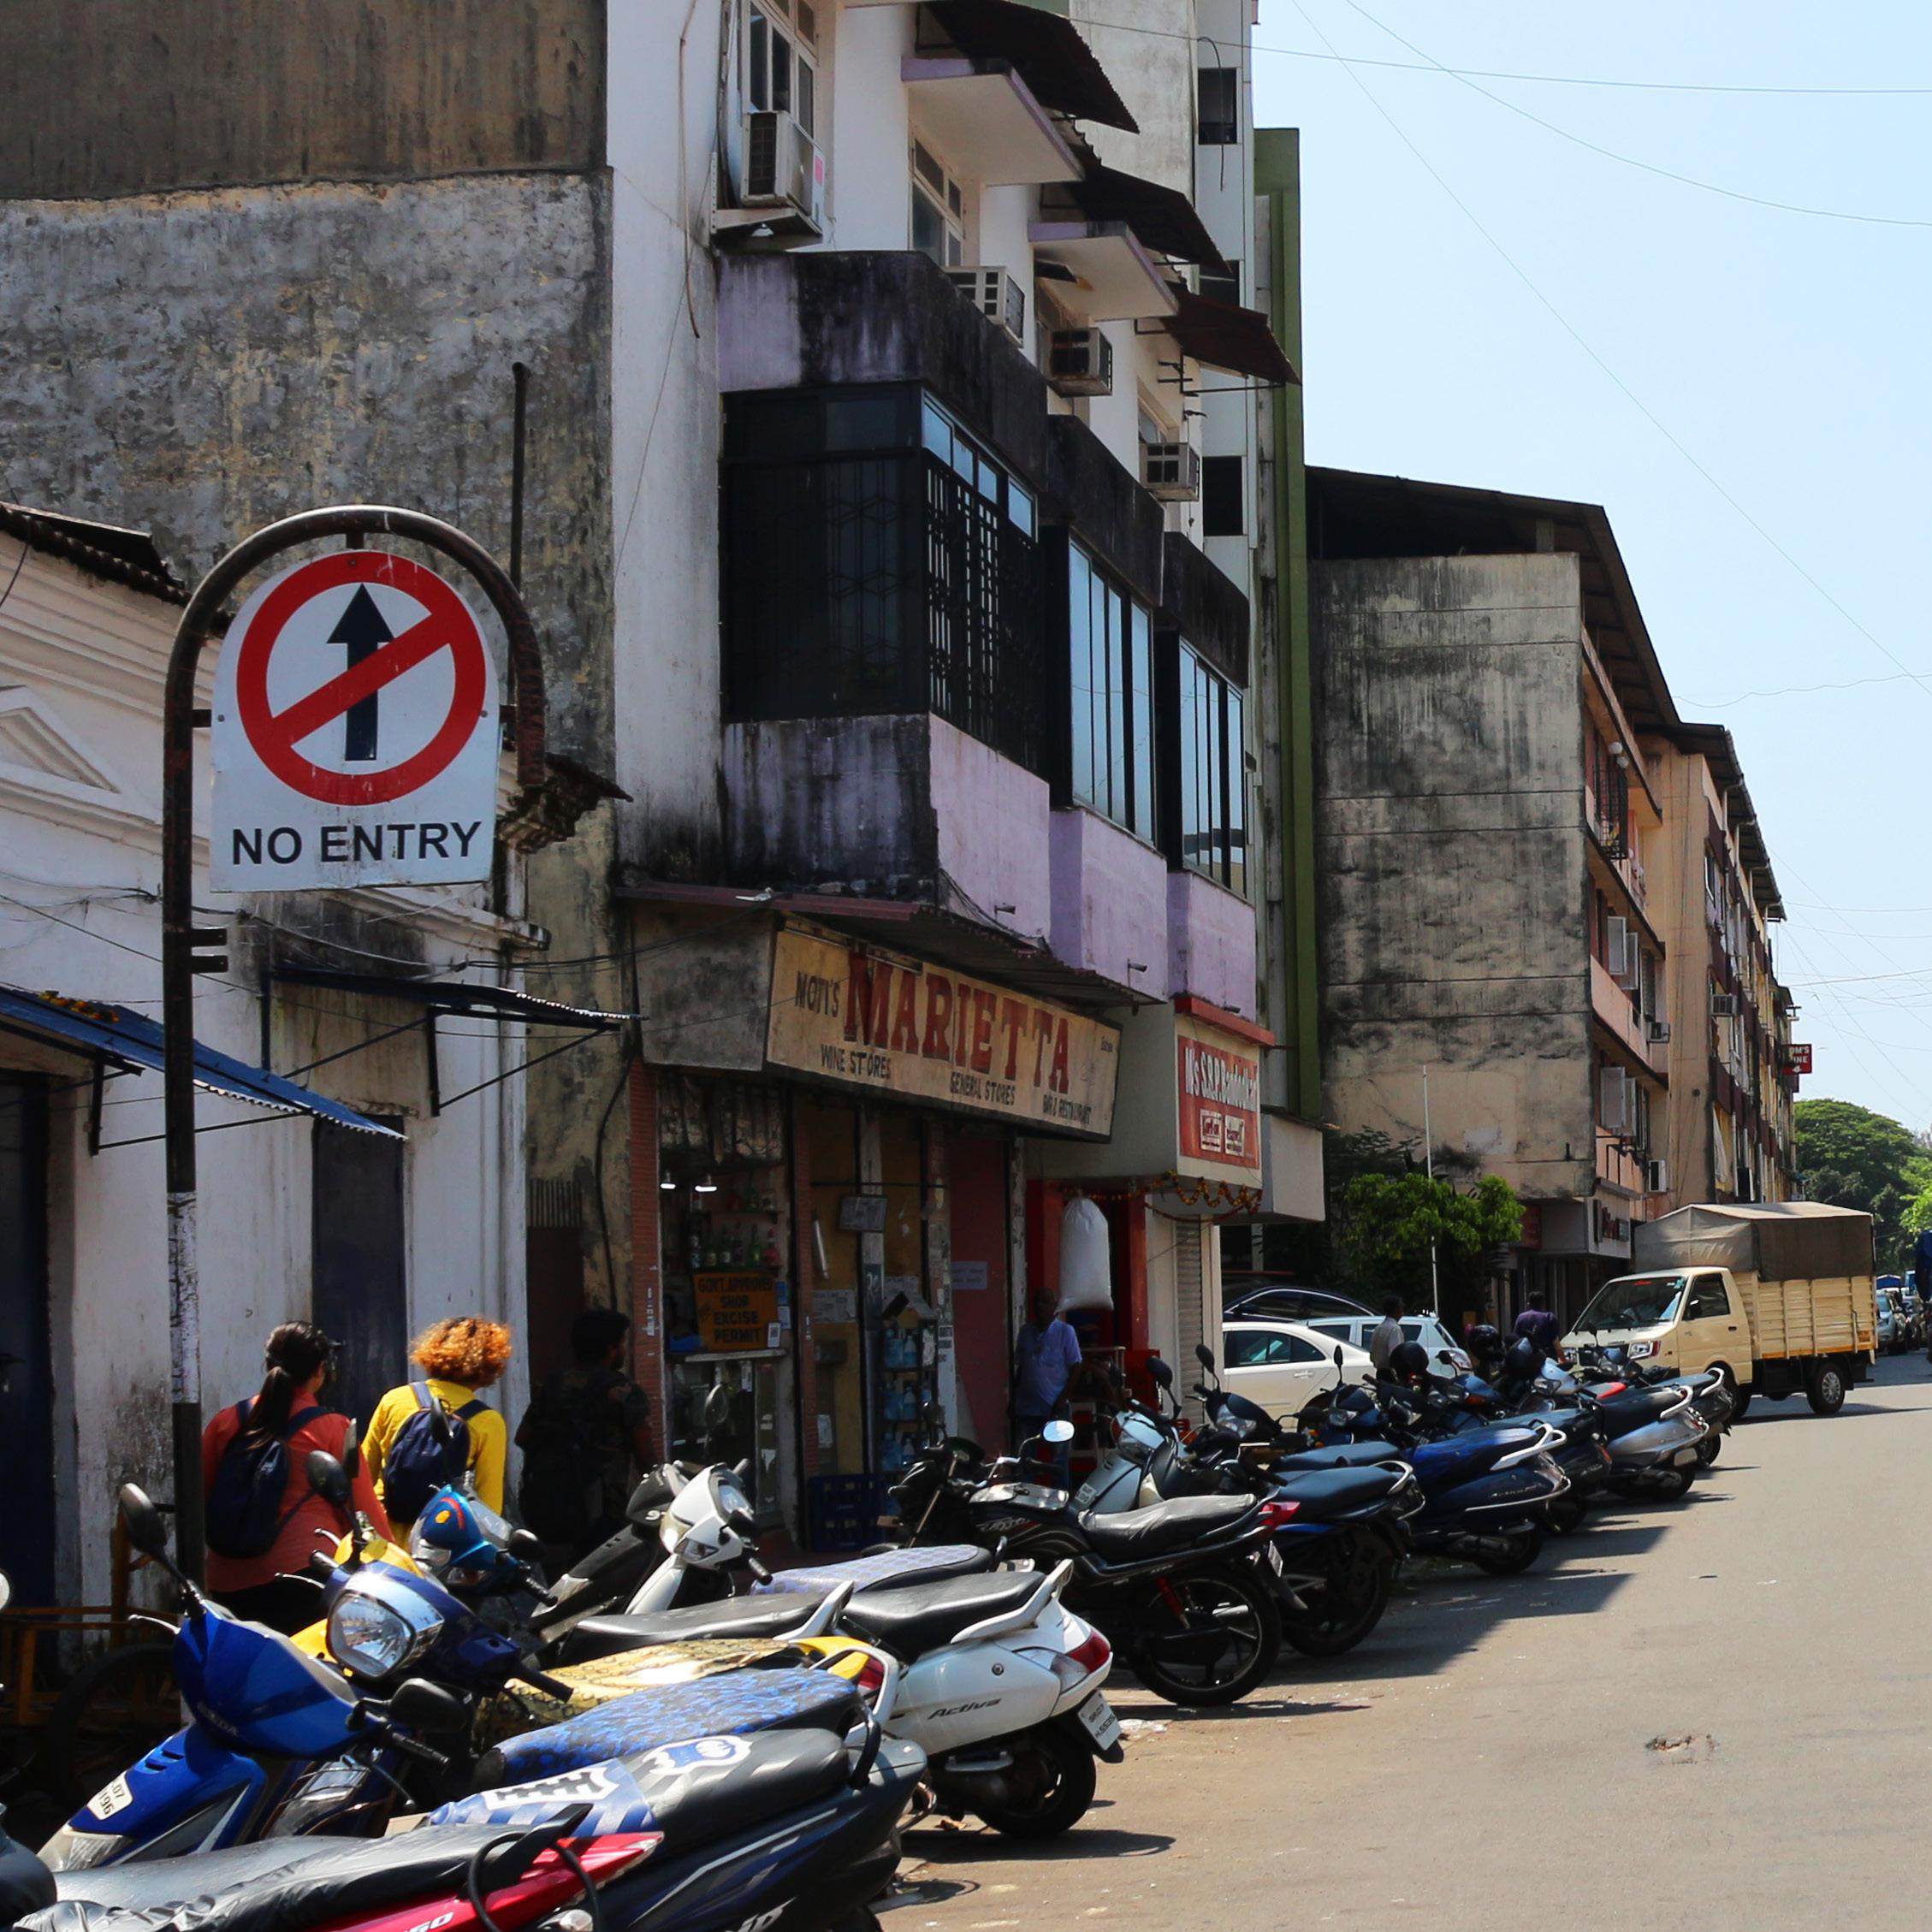
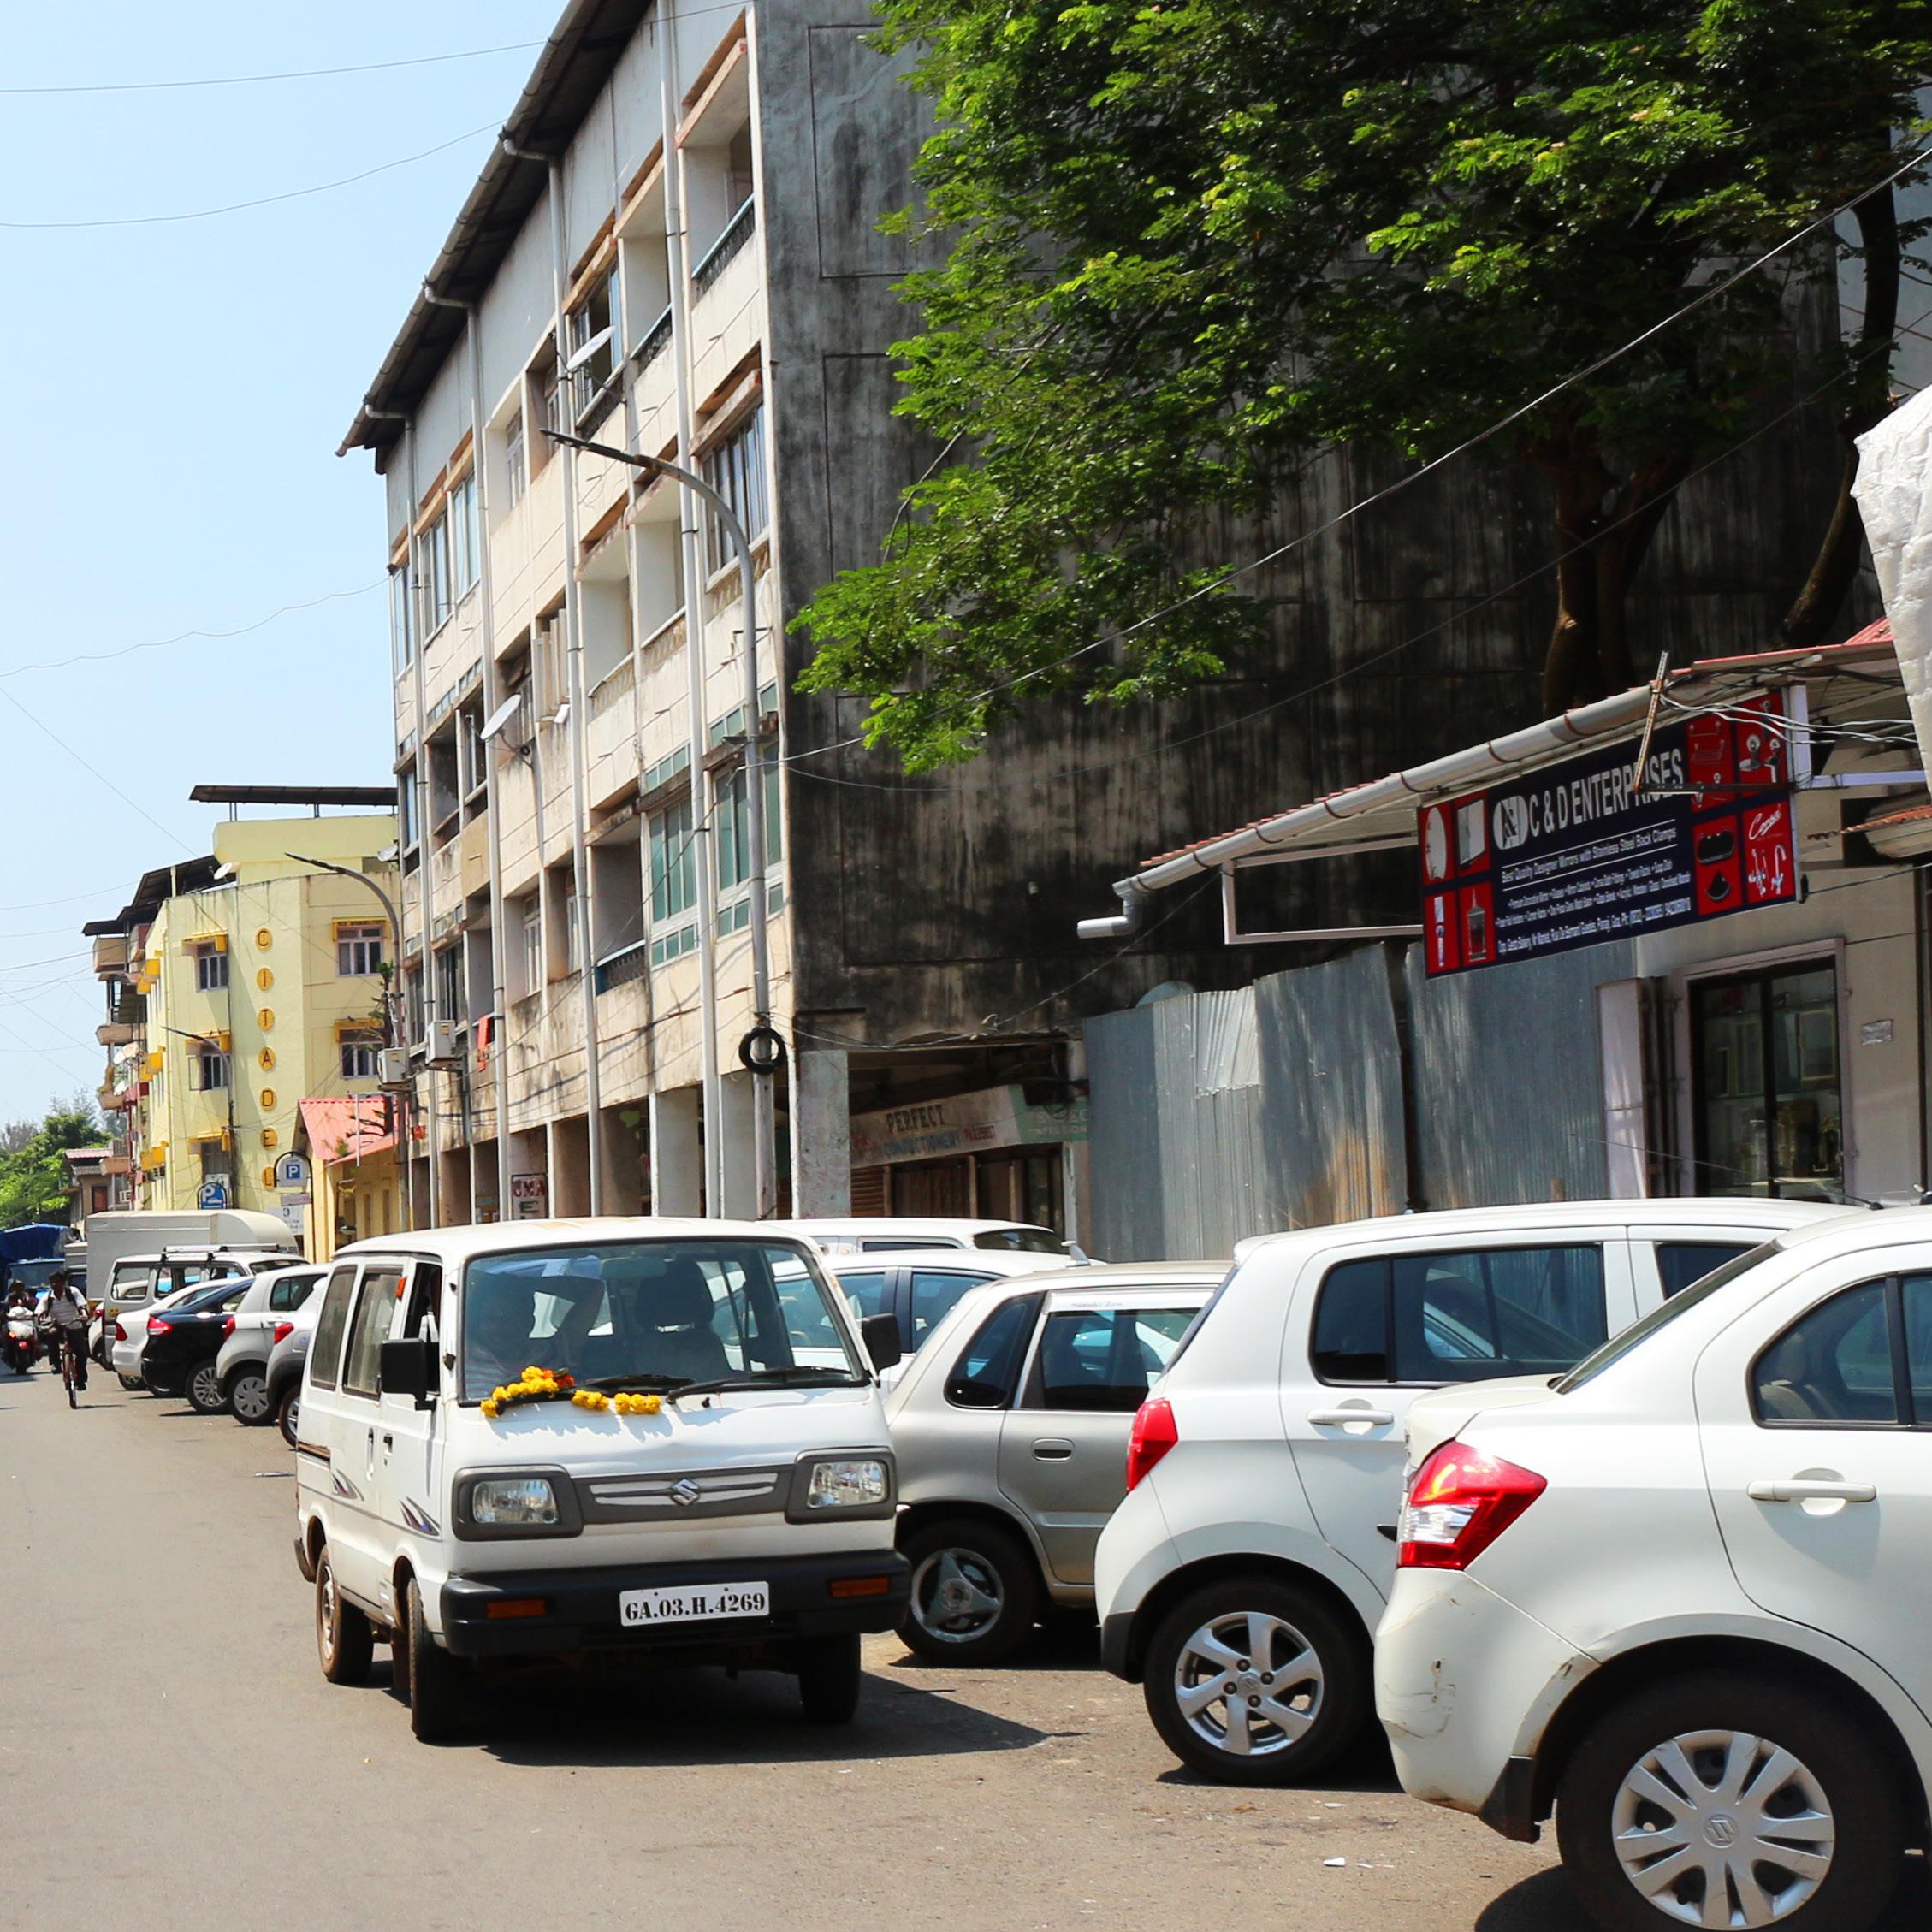
Altrock, U., 2012. Conceptualising informality: Some thoughts on the way towards generalisation. Urban informalities: Reflections on the formal and informal, pp.171-194.
Braganza, Miguel. “Celebrating Biodiversity.” The Navhind Times, 4 June 2019, www.navhindtimes.in/ celebrating-biodiversity/.
Clark, M., & Darling, J. (2019, October). Low Impact Development- Spanish Fork City. Lecture presented at the University of Utah. Retrieved from https:// drive.google.com/file/d/1HLky_9e7AZFRz8h1uxB1vcYDafklPzX/view?usp=sharing
Fjørtoft, I., & Sageie, J. (2000). The natural environment as a playground for children: Landscape description and analyses of a natural playscape. Landscape and Urban Planning, 48(1), 83–97. https://doi.org/https:// doi.org/10.1016/S0169-2046(00)00045-1
Goa Heritage Action Group & Corporation of the City of Panaji, 2005. Walking in and around Panaji Goa. Panaji: Sanjana Publications.
Goa, G. o. (n.d.). goa.gov.in. Retrieved November 25, 2019
Gururaj, G. (2008). Road traffic deaths, injuries and disabilities in India: current scenario. National Medical Journal of India, 21(1), 14–20.
Haravi, B. K. (2010). Evolution of urban ecology of Panaji city a geographical perspective (Karnatak University). Retrieved from http://hdl.handle.net/10603/107951
Herrman, T., & Lewis, R. (2017). What is Livability? University of Oregon.
IDEO.org. (2015). The Field Guide to Human-Centered Design (No. 1)
Imagine Panaji Smart City Development Limited. (2019). Parking Master Plan For Panaji, Goa [Draft Report].
Imagine Panaji Smart City Development Limited. (2019a). Comprehensive Mobility Plan for Goa [Strategic Report].
Imagine Panaji Smart City Development Limited. (2019b). Master Plan for High Capacity Transit System for Goa [Mobility Plan].
Imagine Panaji, Imagine Panaji Smart City Development Limited, 2016, https://imaginepanaji.com/.
Kamat, S. D. V. Retrieved from http://goabudget.gov.in/ assets/speech/2011-12.pdf
Limited, G. (2014). Redevelopment of panaji municipal market. Retrieved from GSIDC Cornerstone of Goa’s Future: https://www.gsidcltd.com/project/ redevelopment-of-panaji-municipal-market/
Pal, S. (2018, February 16). The other goa: why panjim’s unique vibe makes it an indian city unlike any other! Retrieved from The Better India website: https:// www.thebetterindia.com/131124/goa-panjimoffbeat-travel-local/
Reports of the finance commissions of India: First Finance Commission to the Twelfth Finance Commission: the complete report. India. Finance Commission. Academic Foundation. 2005. p. 268
RTO. (2019). https://rtooffice.lipku.com/2019/06/ga-07rto-office-address-panjim-goa.html.
Shodhganga, Karnatak University Department of Geography, 2010, http://hdl.handle. net/10603/107951
Sliwa, Marcin, et al. “Urban Ecological Planning Principles, Value Positions and Application in Practice.” ISOCARP, 54th ISOCARP Congress, 2018.
Smart Cities Mission, Ministry of Housing and Urban Affairs, Government of India, 2015, http://smartcities. gov.in/content/.
Smith, M. (2019, September 15). International poll: most expect to feel impact of climate change, many think it will make us extinct | YouGov. Retrieved from https://yougov.co.uk/topics/science/articlesreports/2019/09/15/international-poll-most-expectfeel-impact-climate
Sternlieb, G. and Hughes, J.W., 1980. The changing demography of the central city. Scientific American, 243(2), pp.48-53.
Team, G. (2019, July 16). Goa CM says casino policy and gaming commission still under examination, no timelines given for notification. Glaws India. Retrieved from https://glaws.in/2019/07/16/goa-cm-sayscasino-policy-and-gaming-commission-still-underexamination-no-timelines-given-for-notification/
Fig. A.1: Map of Goa
Fig. A.2: Map of Panaji
Fig. B.1: Development sketch plan
Fig. B.2: Historical development sections (Chethan Kumar)
Fig. B.3: Location map
Fig. B.4: Connectivity map
Fig. B.5: 3D view of the market
Fig. B.6: Circulation of vehicular traffic
Fig. B.7: 24 hour schedule of the market
Fig. B.8: Circulation of pedestrian traffic
Fig. B.9: Stakeholder mapping
Fig. B.10: Semester timeline
Fig. B.11: Phases of the market
Fig. B.12: Functions of the market
Fig. B.13: Asset analysis
Fig. B.14: Sitting plan of the market
Fig. B.15: Keywords for problem statement (Wordart.com/create)
Fig. B.16: Empowerment (Wordart.com/create)
Fig. C.1: CBD and East CBD
Fig. C.2: Research Process Followed
Fig. C.3: Design Process Followed
Fig. C.4: Methods and Design Process
Fig.C.5: Rankings of Card Game
Fig. C.6: Three Results From Activity Mapping
Fig. C.7: Government Structure
Fig. C.8: Hierarchy of Relevant Planning Laws
Fig. C.9: Cross Section of Jardim Garcia D’Orta
Fig. C.10: Land Use of East CBD
Fig. C.11: Count of Non-Personal Vehicles in Goa (Comprehensive Mobility Plan for Goa 2019)
Fig. C.12: One-way (red) and Two-way (blue) streets
(Parking Master Plan For Panaji, Goa 2019)
Fig. C.13: Number of Private Vehicles Registered in Goa
(Comprehensive Mobility Plan for Goa 2019)
Fig. C.14: Identified Parking Hotspots
(Parking Master Plan For Panaji, Goa 2019)
Fig. C.15: Identified Parking Hotspots
(Parking Master Plan For Panaji, Goa 2019)
Fig. C.16: KTC Map of Goa, Zoomed in on Panaji (Master Plan for High Capacity Transit System for Goa 2019)
Fig. C.17: Concept Diagram for Potential Scenario