PLASTIC PADS FOR THE PAD COOLING
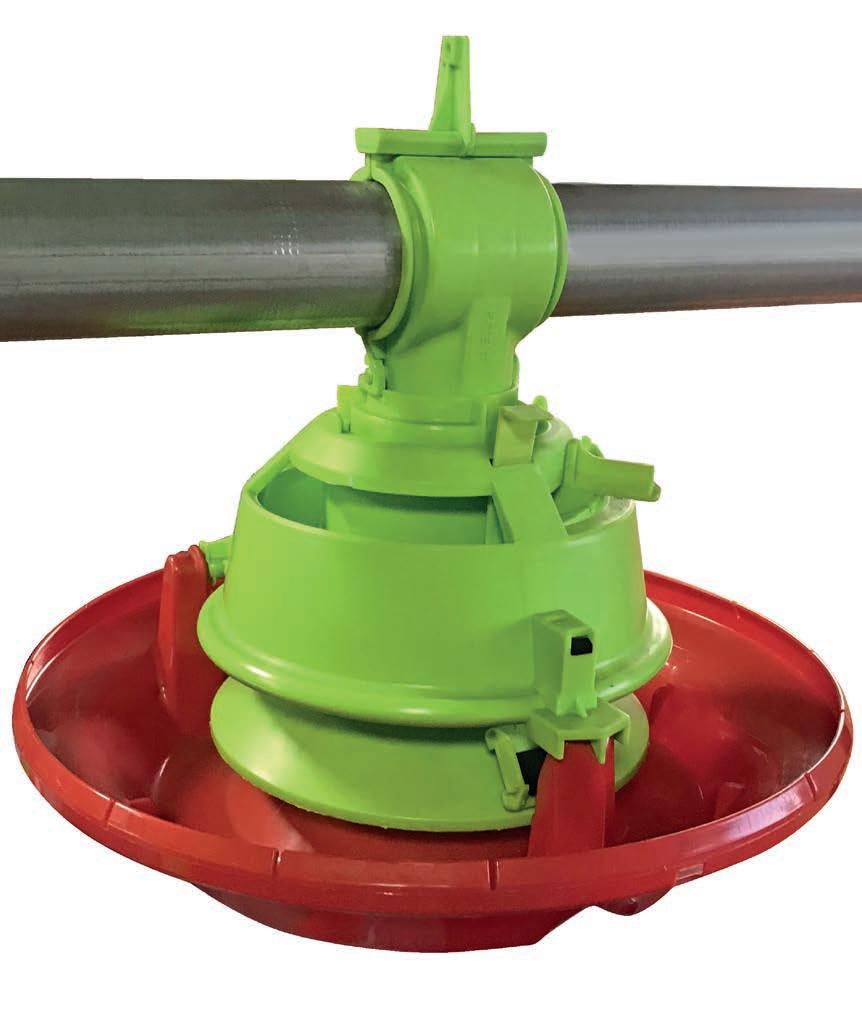
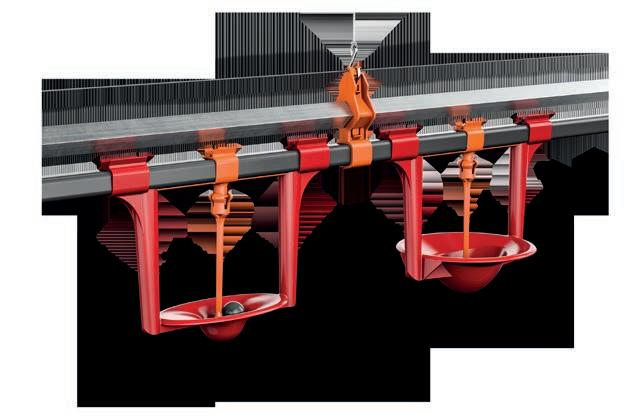
The LUBING Pad Climate system is made entirely of plastic. It is used in systems where highly efficient cooling is required.
•For evaporative cooling of poultry and pig houses.
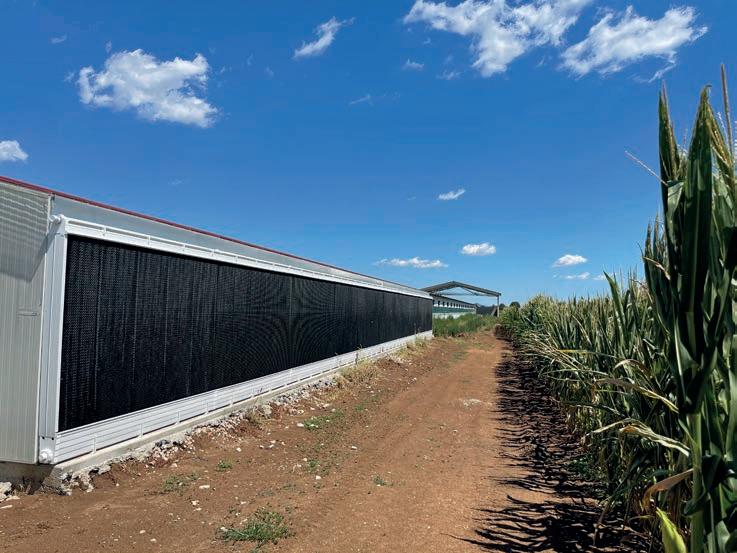
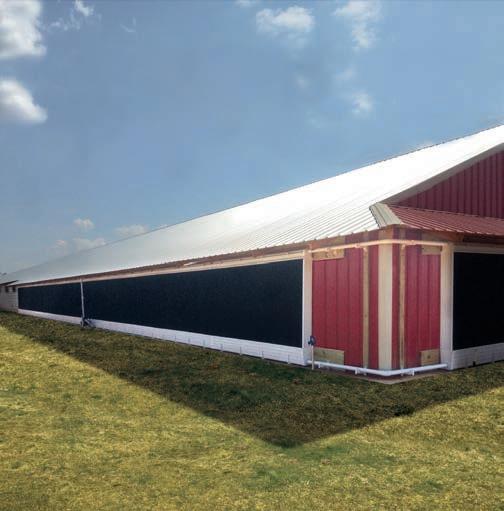
•Excellent cooling capacity - patented design.

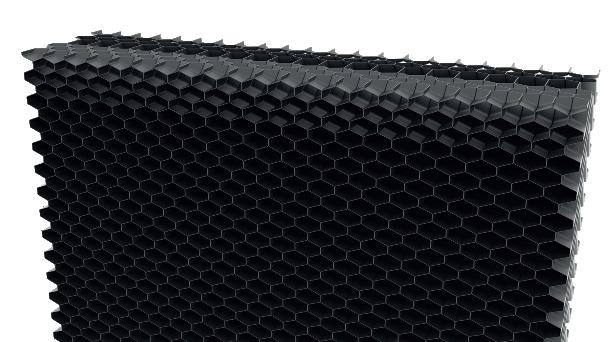
•Easy to clean.
•Long service life.
•Lowest pressure loss.
•High UV resistance.
•Impermeable to light.
•Chemical resistance.
- september 2023FIELD REPORT
!lanigirO
Via Marco Polo, 33 - 35011 - Campodarsego (PD) ITALIA +39 0499202290 - lubingsystem.com - info@lubing.it
employees’ conditions. Try different plans and you will find the best one after a few weeks. Remember even the best schedules need to be modified and reconsidered time to time to improve the efficiency.
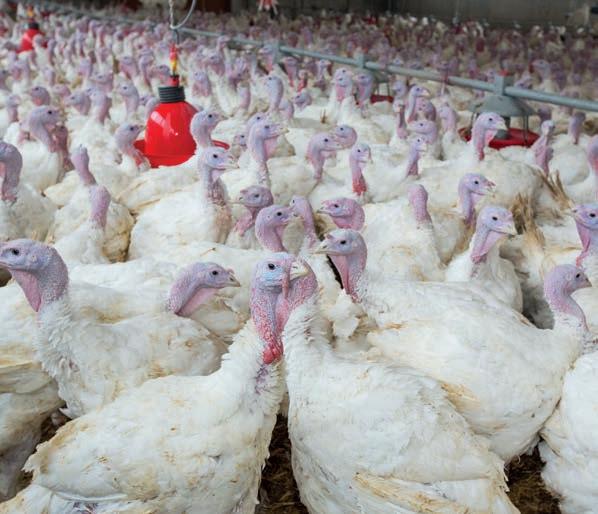
In a turkey breeder farm, it is important to do the things right on time and on schedule. For example, in laying period, it is critical to provide clean and fresh water and feed in the morning and in the evening. Moreover, there are some tasks during the day which raise a lot of dust such as broody management procedures, maintaining litter, dust bathing, etc. Therefore, the house cleaning procedures should be synchronized with such tasks. Some of these cleaning tasks can be scheduled in the morning or in the evening. As an example, cleaning the drinkers twice a day, once at 07:00 and once at 17:00, will significantly improve the health condition and egg production. Cleaning the house water tank can be done once a day
This schedule is only an example for a certain condition and cannot be applied to different conditions.
12 - field reportFIELD REPORT
Time Main Tasks 05:00 Organizing the showers and clothes 06:00 Turning on the house lights Cleaning the house water tank & preparing fresh water Cleaning the nests and the mats 07:00 Starting feeders (if not automatic, filling up the feeders) Cleaning the drinkers Opening the nests 08:00 Collecting eggs Cleaning the farm yard & the exterior 09:00 Collecting eggs Litter maintenance (if needed) 10:00 Collecting eggs Cleaning the lampshades Overall house cleaning and organizing 11:00 Collecting eggs Cleaning the B.S. showers 12:00 Collecting eggs Cleaning the light traps and fans 13:00 Collecting eggs Cleaning the service room 14:00 Collecting eggs Lunch time 15:00 Collecting eggs Closing the nests 16:00 Cleaning the feeders and refilling them Cleaning the nests’ mats (in manual nests) Opening the nests 17:00 Collecting eggs (no eject) Cleaning the drinkers 18:00 Collecting eggs Cleaning the showers and washing the clothes 19:00 Collecting eggs Closing the nests 20:00 Turning off the lights 21:00 Hourly house check 22:00 Hourly house check 23:00 Hourly house check 00:00 Hourly house check 01:00 Hourly house check 02:00 Hourly house check 03:00 Hourly house check 04:00 Hourly house check
Table 1 – Daily tasks in a turkey breeder farm in laying period.
at 06:00 in this schedule. The idea is cleaning and organizing things after they become dirty or dusty or/and before they need to be used. In the presence of a routine cleaning procedure, cleaning will be very simple and fast, and because it is an organized routine, the workers will do it automatically, quickly, skillfully and with minimum energy consumption.
In Table 1 there is an example of daily tasks in a turkey breeder farm in laying period which might help you to prepare your own version of daily schedule.
This schedule belongs to a five-acre farm, with 6,000 laying turkeys and using manual nests. They have eight workers from 08:00 to 16:00 and two workers for the night shifts from 16:00 to 08:00. All the routine tasks including artificial insemination, vaccination, etc. are done by the farm’s workers. As you see, almost everything is sched-

in this schedule, meanwhile cleaning a drinker which has not been cleaned for a week will take at least 5 minutes! Cleaning the light traps would take 10 minutes if done every day. Cleaning all the house’s lampshades by using a simple duster also takes 5-10 minutes if you do it every day, but cleaning the same lampshades which have not been cleaned for a month would need more effort and equipment, and would take at least two hours.
It is self-evident that in clean and orderly places, people consider themselves more bound by the rules than in messy and dirty environments. Therefore, in addition to the peaceful environment and peace of mind that you have provided for your employees which makes them more focused on their daily work, you have substituted all the exhausting tasks of the farm into low-energy-consuming routines that the employees do automatically! Moreover, you can expect more compliance with the farm regulations and procedures from your employees in such conditions and as we all know, that will be very decisive
13 - september 2023FIELD REPORT
Barbieri srl Via Garibaldi, 54 • 26040 Scandolara Ravara (CR) Italy Tel. (+39) 0375 / 95135 • Fax (+39) 0375 / 95169 • Manu re re moval belt s • Manu re belt wi th hole s for dr yi ng system s info@barbieri-belts.com www.barbieribelts.com BELTS and ROP ES for AV ICULTURAL USE BE LT S
Carolyn De Koning South Australian Research and Development Institute
Revealing the secret life of hen on the range using camera traps
The objective of a 10-week pilot study was to assess the frequency of hens visiting the outer range areas (>50 m from the shed) on a free-range layer farm by using camera traps. Additional information collected from the cameras was hen behaviour and wild bird species.
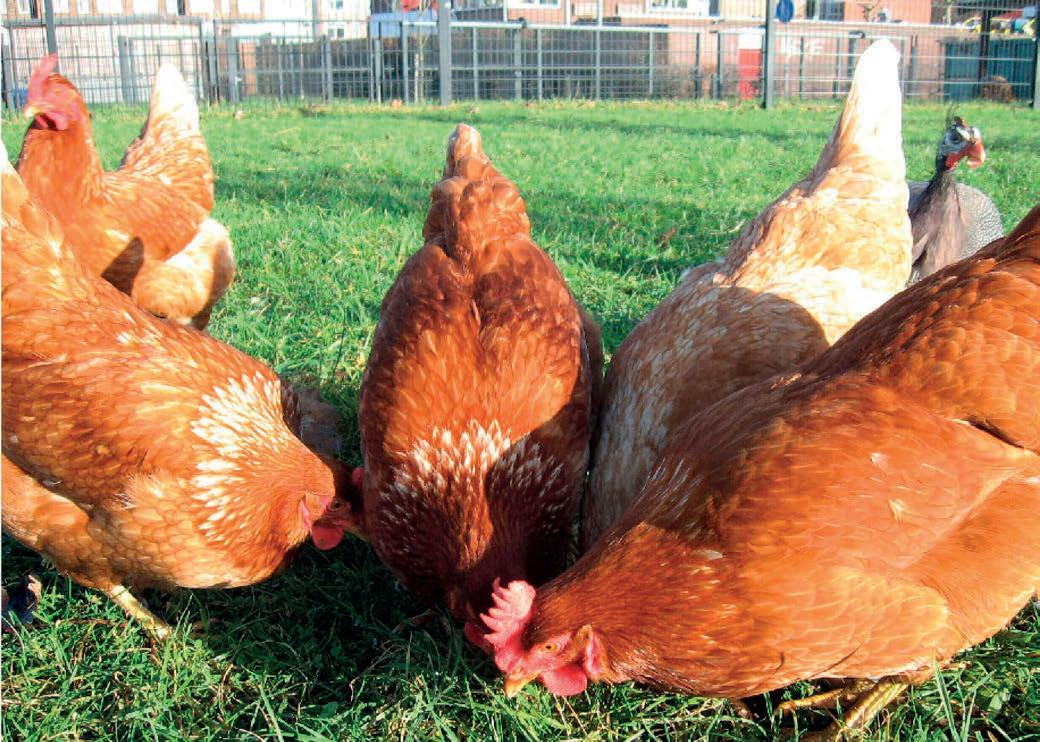
Distance from the shed had a strong influence on the frequency of visits by hens, with a large reduction in the number of visits at 120 m (10 visits) compared to 70 m (26 visits). Whilst on the outer range hens were walking (Frequency=23), foraging in the open (Frequency=33), foraging at saltbush
(Frequency=27); resting behaviour was minimal (Frequency=3, P<0.001). Six species of wild birds were identified on the range with the Australian raven the most common and wedgetail eagles the least frequent (Frequency=36 and 2 respectively, P<0.001). Information gained from camera traps could
14
DOSSIER - dossier -
©BIg Dutchman
be used to design more attractive outer range areas for hens, specifically the need for shelter, and gauging biosecurity risks from wild birds.
Introduction
Determination of range usage by hens can be difficult for researchers and free-range egg farmers, particularly usage on the outer sections of the range (i.e., >50 m from the hen shed). Live counts only give a snapshot of numbers of hens on the range at a defined time point and do not show the frequency of range usage. Camera traps, also referred to as trail cameras and wildlife cameras, are relatively cheap and useful tools that could produce valuable information on the level of range visitation by hens, especially the distant areas on the range. Camera traps have primarily been used for ecological wildlife surveys and more recently for assessing biosecurity risks on poultry farms by identifying/quantifying the types of wild bird species visiting free-range poultry farms.
This paper reports on a pilot study that used camera traps to assess the frequency of hens visiting the range areas greater than 50 m (outer range) from the shed on a free-range layer farm in southern Australia. Camera traps were also used to determine the times of the day hens visited the outer range along with hen behaviour and other bird species seen on the range.
Method
Animal ethics approval for the study was from the Department of Primary Industries and Regions, South Australia (PIRSA 13-17). The free-range layer farm was located within the Mediterranean climatic zone of southern Australia. Two flocks (A and B) were studied with camera traps placed on their range areas. The flocks were not adjacent but separated by two other flocks. The hens were Hyline Brown (beak trimmed at hatchery). At the start of camera placement, flock A was 47 weeks of age and flock B was 57 weeks of age. Individual flock sizes on the farm were 30,000 hens with an outdoor stocking density of 10,000 birds/ha.
Sheds (16.5 x 132 m) were orientated East - West with popholes along both long sides of the shed (north and south facing). The corresponding range area was 4 hectares also orientated East – West in a rectangular shape
“Camera traps, also referred to as trail cameras and wildlife cameras, are relatively cheap and useful tools that could produce valuable information on the level of range visitation by hens, especially the distant areas on the range. Camera traps have primarily been used for ecological wildlife surveys and more recently for assessing biosecurity risks on poultry farms by identifying/quantifying the types of wild bird species visiting freerange poultry farms”
with the shed located centrally at the Eastern end. Each range area for flocks A and B had four twin rows of oldman saltbush (Atriplex nummularia) variety ‘De Kock’ planted on the range in 2017 and 2018. Rows were 16 m apart commencing 50 m from the western end of the sheds and were 250 m long. Saltbush was arranged in twin rows, 4 m apart, and 4 m separation within rows. Saltbush height ranged from 0.5m to 1 m tall at the time of camera placement.
Cameras (SIGNIFY®, Model Number EA1427, Silverwater, NSW, Australia) with PIR (Passive Infrared) sensors were used. Trigger time was 0.5 sec, trigger distance up to 25 m and the lens with a 100-degree angle. Each camera was loaded with 8 batteries (alkaline AA 1.5v) and a 16 GB SanDisc memory card. Placement of cameras was halfway (8 m from saltbush) between the northern most saltbush twin row and the next saltbush twin row. All cameras were positioned to face south to avoid bright sunrise and sunset effects on the camera lenses. Two cameras were placed on the range of each shed (flocks A and B) at 70 m and 120 m from the west end of the sheds (Total 4 cameras). Cameras were mounted on steel droppers 1m high from the ground using cable ties
15 - september 2023DOSSIER
and were set for medium sensitivity. When triggered, they would take three photographs (5 MB each) in rapid succession followed by a 20sec video (1280 x 720p).
Photos and videos from three of the four cameras were used. One camera (flock B, 70 m from the west end of shed) had reached storage capacity within 30 days after placement. This was due to excessive bird activity (117 visits by ravens and hens) following the wedge tailed eagle attacks at that location. Therefore, the data from this camera were not included, nevertheless it was used to observe hen behaviour during and following eagle attacks. Hen behaviour was determined from the videos.
The following definitions were used:
• ‘walking’ - to or from the shed with no ground pecking;
• ‘foraging in open’ - actively pecking and scratching at open ground between saltbush rows;
• ‘foraging at saltbush’ - pecking and scratching the ground under saltbush;
• ‘resting’ - sitting or standing under saltbush without movement.
The frequency of hens visiting the area was determined by counting how many times hens appeared during the period the cameras where on the ranges, but only during the times of the day when popholes were open (10 00 to 18 00 h). Operating time for the cameras was from the 2 August 2019 to 9 October 2019. This covered seasonal weather conditions from late winter to mid spring. A comparison between the number of hens in the photos at 70 m and 120 m was made for flock A using a T-test, unequal variances. Wild bird species were identified from photos and videos. Photos were also used to assess how often hens appeared on the range without wild birds, wild birds without hens, and both hens and wild birds in the same photo. Pearson’s X 2 was used to analyse hen behaviour on the range, species of wild birds, and wild birds on the range with and without hens.
Results
The total number of events while popholes were open was N=102 (based on 3 cameras). False positives represented 11.7% of the total
event numbers. The majority of false positives were on windy days (67%).
At 70 m from the shed, hens from flock A appeared 26 times while at 120 m the hens only appeared 10 times. Yet, there were no significant differences in the average number of hens shown in the photos at 70 m compared to 120 m (3.42 ± 0.81 hens v. 4.37 ± 1.47 hens respectively, P=0.577, two tailed T-test). Hens ranged away from the shed throughout the day with peak numbers between 10 00 to 11 00 h (shortly after popholes were opened) (Figure 1). Hens were actively foraging in the open (Frequency=33), foraging at saltbush (Frequency=27) or walking on the outer range (Frequency = 23), and resting behaviour was minimal (Frequency=3) (Pearson’s X 2=23.58 with 3 d.f., P<0.001). When resting behaviour was removed from the analysis, the difference between walking and foraging was not significant (Pearson’s X 2=1.83 with 2 d.f., P=0.400).
Hens mostly appeared on the range without wild birds (Frequency=49) (Pearson’s X 2=27.93 with 2 d.f., P<0.001), followed by wild birds seen without hens (Frequency=28), and very few occasions where both hens and wild birds were seen in the same photo (Frequency=9) (except following the eagle attack and these data were not included). The most commonplace wild birds found on the range (Figure 2) were Australian ravens (Corvus coronoides), Pearson’s X 2=80.38, with 6 d.f., P<0.001. Unidentified birds were the next biggest category. These were small brown birds, half the size of the common starling, probably European house sparrows (Passer domesticus).
16 DOSSIER - dossier -
0 5 10 15 20 25 30 35 10.08.00 10.28.00 10.46.00 10.51.00 10.53.00 11.03.00 11.16.00 11.23.00 11.38.00 12.05.00 12.14.00 12.20.00 12.47.00 13.34.00 13.54.00 14.09.00 14.18.00 15.16.00 15.40.00 16.11.00 17.52.00 Number hens in ph oto Time
Figure 1 – The number of hens in the photo frame and the time of day hens were on the outer range (50 m < from the shed) on a free-range layer farm in southern Australia during 2 August 2019 to 9 October 2019, while popholes open.
0510152025303540
Discussion
The false positives seen on windy days may have been due to moving vegetation triggering camera traps. Other false positives may have been the result of fast flying wild birds or insects triggering cameras. There is a compromise between camera sensitivity settings; set too high would result in more false positives and set too low may not trigger the camera when birds/animals are present. Another issue with camera traps is that it takes time to interpret the photos and videos. Despite these issues there is much to be gained from camera traps by showing the behaviour of hens and how often they are on the outer range. As such, very little resting behaviour was seen on the outer range, with hens actively foraging and walking. However, hen behaviour performed while on the outer range maybe season dependent. For instance, dust bathing behaviour was observed by the researcher (no cameras were in place at the time) on the outer range during late spring when soil conditions were dry, with most hens dust bathing under saltbush and blue bush (Maireana brevifolia). Therefore, camera traps are needed at different times of the year to capture seasonal effects on visita-
tion levels to the outer range and the variety of hen behaviour. Distance from the shed had a strong influence on the frequency of visits by hens, with a large reduction in the number of visits at 120 m compared to 70 m. More cameras are required beyond 120 m from the shed to determine whether the number of visits reduce even further.
Even though wedge tailed eagles were among the least frequent visitors to the range their impact was great. One camera recorded a pair of wedgetail eagles simultaneously attacking a hen each, with the two hens trying to reach the cover of saltbush. The other hens nearby initially moved toward the eagles and their attacked flock mates, but soon retreated.
Regardless of the eagle attacks, hens returned to the area within 30 minutes and were seen only 3-4 metres from the eagles feeding on the hen carcasses. This is contrary to the perception that hens are frightened by birds of prey. Similar behaviour by hens in response to birds of prey was observed in a Dutch study. Generally, other wild bird species were not seen often in the same photo or video with hens, and maybe avoiding the hens as suggested
by Scott et al. (2018) and Elbers and Gonzales (2020). They were mostly found on the range before popholes opened and after they had closed, also implying that hens deterred wild birds. While hens are on the range there was minimal direct contact with wild birds (except eagle attack), however the biosecurity threat would most likely result from hens contacting wild bird excreta on the range. Nevertheless, photos and videos would be useful to assess biosecurity risks based on the types of wild birds seen, but field observations of wild birds are also needed. As this study was for only 10 weeks, further camera trapping throughout the year is warranted to cover different climatic seasons, thereby potentially revealing more species of wild birds.
In conclusion, camera traps are a simple and cost-effective way of assessing how often hens go to the outer range areas and what they do while out there. This information would assist with the design of outer range areas to make them more attractive for hens, specifically the need for shelter (e.g. trees and shrubs). Photos and videos from camera traps also provide evidence of the wild bird species that visit the range and the implications for biosecurity.
Acnowledgements: Many thanks to Australian Eggs for funding this research and the participation by the farm collaborator.
References are available on request
From the Proceedings of the Australian Poultry Science Symposium 2023
17 - september 2023DOSSIER
Australian raven (Corvus coronoides) Unidentified
Brown falcon (Falco berigora)
Australian magpie (Cracticus tibicen)
Galah (Eolophus roseicapilla)
Common starling (Sturnus vulgaris)
Wedgetail eagle (Aquila audax) Frequency
Figure 2 – The frequency of wild bird species on a free-range layer farm in southern Australia over a 10 week period from 2 August 2019 to 9 October 2019, while popholes were open.
Aitor Arrazola, Research biologist, Ph.D. in Animal Behaviour & Welfare
Using housing enhancements to address feather pecking in laying hens
Regardless of the housing system, improving the home environments of laying hens taking into account their biological needs can benefit their health, well-being, and also their performance. A common approach to reduce stress levels and prevent behavioural problems in pullets and hens is implementing environmental enrichment on-farm.
Proper management and housing of laying hens must consider their physical needs such as adequate nutrition that sustains their laying performance, comfortable environmental conditions for adequate temperature, humidity as well as air and litter quality, and a health program in place to prevent and treat possible health problems. Nonetheless, only addressing these physical needs is not enough for good welfare and optimal performance. Poultry also have behavioural needs that are essential for their proper functioning. Indeed, poultry raised and maintained in environments that do not satisfy their behavioural needs are stressful and
18 FOCUS - focus -
trigger the development of behavioural problems such as feather pecking or severe pecking. Such problems intensify the longer hens stay under these stressful and suboptimal conditions, and they can easily pick up on these behavioural problems spreading quickly across the flock due to social facilitation. To prevent these problems, proper environmental enrichment can support the behavioural needs of birds at the individual level preventing issues from scaling up at the flock level.
Benefits of providing environmental enrichment for laying hens
Hens enjoy performing pecking behaviours even if their nutritional needs are fully covered, and well-designed environmental enrichment aims to boost these poultry-specific behaviours. As a result, providing suitable enrichment in laying hen cages, aviaries, and backyards helps release stress, make their environments interesting and engaging, and gain sense of control and comfort in their home environments. All these enhancements can reduce stress levels over time as hens may perceive their envi-
ronment less threatening and aversive, plausible leading to improved health and productivity outcomes. Also, depending on the environmental enrichment of choice, enriching hens’ environment can reduce restlessness and flock arousal while birds engage in physical activity and pecking behaviours toward safer alternatives rather than pecking other hens, feeders, or equipment. For example, enrichment that support physical activity, like perches and platforms, can help maintain an optimal body condition by promoting bone health and muscle development that are crucial to sustain laying persistency as hens approach to the end of their production cycle. In addition, housing enhancements that support poultry behaviour, particularly in cage systems, have been shown to reduce behavioural and physiological signs of chronic stress and also improve the responsiveness of their immune system. Elevated levels of stress activate the inflammatory response of the immune system that results in an immunosuppression response when high stress levels are maintained over a long period of time such as in the case of conventional cage systems for table-egg laying hens. Under these stressful conditions, housing enhancements that make hens’ environments more engaging, interesting, and comfortable can reduce stress levels and support a resilient immune system against possible threats to their health.
Well-designed environmental enrichment can also prevent the onset and performance of behavioural problems by tackling the source of the problem. Feather pecking is a frequent behavioural problem in table-egg production systems associated with significant economic consequences and welfare concerns. Nonetheless, although beak-trimming is a common on-farm practice to reduce the consequences of this behavioural problem, this management practice does not address the triggering factors behind this multifactorial problem. From a behavioural approach, chickens are motivated to engage in oral behaviours such as ground pecking, exploring, and scratching for a high proportion (around a third or half) of their time during daytime. Due to this internal drive, maintaining chickens in environments that limits their capabilities to display these behaviours for as long as there are naturally adapted to, puts at risk their behavioural health, causes stress, and triggers the onset of behavioural problems. If hens cannot express these natural behaviours, they will redirect pecking activities toward other hens, feeders, drinkers, and other objects as attempts to satisfy their need of behaving according to their nature and coping
- september 2023 - 19 FOCUS
with the stressful conditions in their environments. Thus, hens housed in environments that are not properly designed considering their behavioural needs tend to develop, sooner or later, behavioural problems such as feather pecking, gentle feather pecking or feather licking, feather picking, or severe pecking. All of these behaviours can result in injurious pecking over time which can lead to severe skin lesions and cannibalism if behavioural support practices are not in place. For these reasons, having an environmental enrichment action plan in place for laying hens, or other housing enhancements that support their behavioural needs, brings behavioural opportunities to prevent behavioural problems, support hens’ well-being, and improve production outcomes in commercial production systems.
Examples of environmental enrichment for laying barns
Hens are driven to behave like chickens, yet conventional production systems do not properly satisfy their behavioural needs. To do so, multiple types of environmental enrichment can be implemented in farms depending on the target behaviours of interest. Since feather pecking is a predominant behavioural problem in poultry industry, occupational enrichment that targets ground pecking and exploring behaviours can be the first step to address this behavioural issue. For example, providing scratching areas with wood shavings, straw bales, roughage, or whole grain enables hens to perform foraging, feed-seeking, feed sorting, and other oral behaviours that are meaning-
ful to them. These enrichments can keep hens occupied for hours, redirect pecks toward enrichment rather than feeder content or other birds, and also sustain their nutritional needs for fibre intake. Indeed, scientific-based evidences suggest that feather pecking may sometimes underlie a nutritional imbalance in poultry diets because of lack of essential amino acids or not enough fibre content. Another approach, particularly in production systems that constrain birds’ behaviour like in conventional cages, is to redirect pecking behaviour toward inanimate objects that birds cannot swallow or choke on them. Pecking stones, pecking strings, and grit supplementation are practical on-farm examples of enrichment that can easily redirect pecking activities and facilitate object pecking and object play in different poultry production systems. Pecking stones, or similar enrichment such as cuttlebones, can also act as nutritional enrichment and support requirements for mineral intake, such as calcium which is essential to sustain proper laying rate in table-egg layer hens. Grit intake also has positive effects on poultry gastrointestinal functioning and development
Implementing environmental enrichment in layer barns
Suitable care for poultry requires management practices and housing enhancements that stimulate hens to perform natural behaviours in a way that is safe for them, staff, and biosecurity-friendly (easy to clean and disinfect). When thinking of enrichment solutions for poultry, key considerations are that enrichments should be functional and biologically relevant for hens to boost the desire behaviours, hens will not use it otherwise. Maintaining hens interested in the enrichment is indeed challenging when designing functional enrichments. To do so, farm staff should evaluate whether hens are using enrichments and replace them when no longer facilitate the target behaviours. A successful action plan for environmental enrichment implementation on-site should contemplate different types of enrichments that are replaced or rotated periodically to keep birds engaged in them. Finally, when adding enrichment into birds’ environment, new objects or resources should be introduced gradually at the beginning to avoid a fearful and distressful response and, as hens familiarize with it, provide enough of it so multiple hens can engage in those target behaviours at the same time without fighting over it.
20 FOCUS - focus -
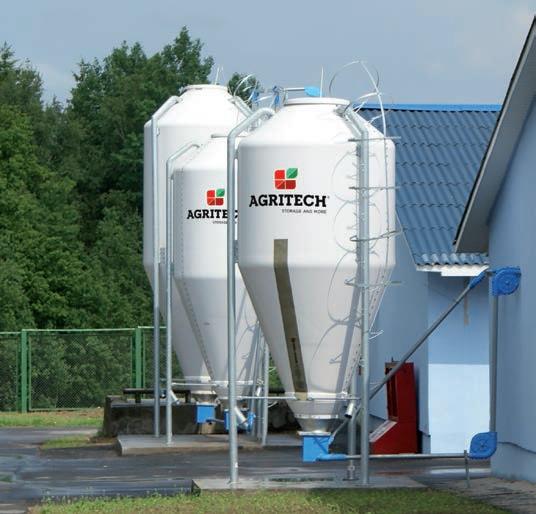
Fiberglass silos: the most practical, effective and durable solution to any bulk storage requirement
Agritech s.r.l. Via Rimembranze, 7 25012 Calvisano (BS) Italy
Tel. + 39 030 9968222 r.a.
Fax + 39 030 9968444
commerce@agritech.it
www.agritech.it
- september 2023 - 21 FOCUS
Till 40 silos in 1x40’ O/T container
Till 23 silos in one complete truckload
Hans-Wilhelm Windhorst
The remarkable dynamics of the global poultry industry: 50 years in retrospective
Part 3 - Global poultry meat trade
In this paper the author will analyse the development of the poultry industry over the past fifty years and he will document the remarkable growth of global poultry meat trade. Because of the only marginal importance of duck and goose meat trade, the paper will focus on chicken and turkey meat.
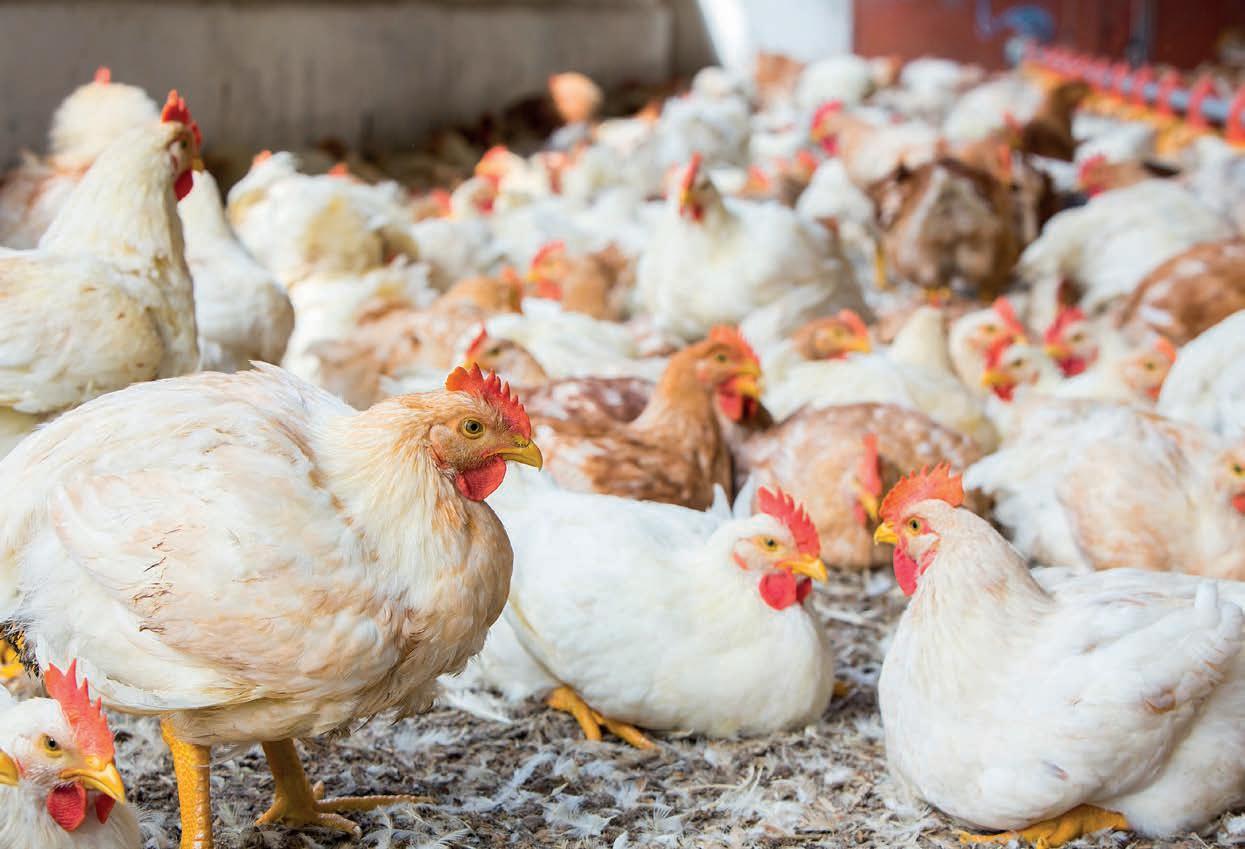
Remarkable growth of poultry meat trade
Parallel to production, global poultry meat trade increased remarkably in the decades under review. In 1970, 502,600 t or 3.3% of the production were traded; until 2020, the trade volume had grown thirtyfold and reached a volume of 15.6 mill. t, respectively 11.0% of production
22 MARKETING - marketing -
The author is Prof. Emeritus of the University of Vechta and visiting Professor at the Hannover Veterinary University, Germany
(Table 1). To the increase of 15.1 mill. t, chicken meat contributed 93.1%, turkey meat 5.7%, duck and goose meat together 1.2%. The following analysis will document the dynamics and resulting changes in the spatial pattern of the trade at continent and country level. Because of the only marginal importance of duck and goose meat trade, the paper will focus on chicken and turkey meat.
volved in global poultry meat trade because of its peripheral location and the small population When breaking down poultry meat trade by species, similarities and differences become obvious. The pattern of chicken meat trade (Table 3) resembles that of poultry meat. Considering the role of this meat species, this is not surprising. Europe and the Americas dominate exports, Asia imports.
Turkey meat showed a different pattern. The trade volume was not only significantly lower, but it was almost exclusively traded in Europe and the Americas (Table 4). Trade increased in Europe from 1990 on, in the Americas one decade later. While North America had a positive trade balance over the entire period, Europe only from 1990 on, and Central and South America until 1990. From 2020 on, this subcontinent and Africa imported considerable amounts of turkey meat. A detailed analysis at country level will explain the development.
Large fluctuations at country level in chicken meat trade
1 Without offal and preparations
Considerable changes at continent level
The volumes of poultry meat exports and imports and the resulting trade balance differed considerably between the continents. Table 2 shows that Africa, Asia and Oceania had a negative trade balance over the five decades under review. In contrast, North America had a constant trade surplus, Europe with the exception of 2010, and Central and South America since 1980. A closer look at the data reveals that poultry meat trade grew much faster between 2000 and 2020 than in the previous decades. Considering the dynamics in production (see Zootecnica International 2023, n. 7/8), this could be expected. In 2020, Europe ranked first in exports with a share of 52.2%, followed by Central and South America and North America. In imports, Asia was in first place with a volume of 7.4 mill. t, which corresponded to a share of 53.6%, followed by Europe, Central and South America and Africa. Worth noting is that North America played only a minor role in poultry meat imports. Oceania was not much in-
In the next step, the fluctuations in the composition and ranking of the leading exporting and importing countries will be analysed.
Figure 1 shows the changes in the composition and ranking of the ten leading countries in chicken meat exports. In 1970, eight of the top ten countries were located in Europe, with the Netherlands in first place. 1990 marked the remarkable rise of the USA and Brazil as the dominating exporting countries, from 2010 on Brazil replaced the USA in rank one. France surpassed the Netherlands in 1980, but the latter could maintain a strong position, ranking as number three in 2020. With the end of COMECON (Council for Mutual Economic Assistance), Hungary, Bulgaria and Poland lost their former role as major
23 - september 2023MARKETING
Meat species 1970 2020 Increase absolute % Chicken Export Import 481.5 435.6 14,508.1 13,258.7 14,026.6 12,823.1 2,913.1 3,402.9 Turkey Export Import 18.2 13.8 871.3 871.6 853.1 857.8 4,687.4 6,215.9 Duck Export Import 2.0 17.4 144.9 147.3 142.9 129.9 7,245.0 746.6 Goose Export Import 0.9 13.2 39.1 40.6 38.2 27.4 4,244.4 207.5 Total Export Import 502.6 480.0 15,563.4 14,318.2 15,060.8 13,838.2 2,896.6 2,883.0
Table 1 – The development of poultry meat1 trade between 1970 and 2020 by meat species; data in 1,000 t (source: FAO database).
Rank 197019801990200020102020 1 Brazil 2 USA 3 Netherl. 4 Poland 5 Turkey 6 Belgium 7 Ukraine 8 Un. Kingd. 9 Thailand 10 Germany HogK CHI H THA ARG DK B F BG
Figure 1 – The changing composition and ranking of the ten leading chicken meat exporting countries between 1970 and 2020 (design: author, based on FAO data).
Table 3 – The development of global chicken meat trade at continent level between 1970 and 2020; data in 1,000 t (source: FAO database)
United Kingdom fluctuated considerably. Turkey, Ukraine and Thailand ranked in the top group in 2020, but Ukraine will have lost its position due to the ongoing war.
The regional concentration in chicken meat exports was very high (Figure 2). In 1970, the ten leading countries shared 96.9% in the global export volume, the Netherlands alone 41.8%. Until 2000, it hovered around 90% and then decreased to 82.4% in 2020. Between 1990 and 2010, Hong Kong was a major exporter.
When the crown colony was returned to China in 1997, exports decreased and it lost its distributing function. From 2000 on, Brazil and the USA dominated chicken meat trade with a contribution of more than 50 % to the global trade volume. The rankings of the six European countries in 2020, here the Ukraine is included, document the great economic importance of this commodity for these countries.
exporting countries. Poland, after years of a dynamical development of its poultry industry as an EU member state, came back again in 2010 and ranked in fourth place in 2020. Denmark had to take a deep fall from third rank in 1970 to tenth in 2000. The positions of Germany, Hong Kong, China and the
Figure 3 shows the composition and ranking of the ten leading chicken meat importing countries over the past 50 years. The fluctuation was higher than in exports as more countries were not able to cover their demand by domestic production. Some countries showed considerable changes in their rankings over the decades under review, in particular, Germany, Hong Kong, Japan and S. Arabia. Several countries appeared only for a short time in the top list or showed up again after an interruption, for example the United Arab Emirates. A comparison of the rankings of Hong Kong and China is of particular interest. Between 2000 and 2010, Hong Kong ranked in first place and then fell to the seventh.
24 MARKETING - marketing -
Continent 1970 1980 1990 2000 2010 2020 AFRICA Export Import Balance 1 5 -4 13 91 -78 4 107 -103 14 355 -321 80 1,199 -1,119 118 2,083 -1,965 ASIA Export Import Balance 16 68 -52 99 622 -523 321 1,021 -700 1,842 3,829 -1,987 2,312 6,030 -3,728 2,828 7,420 -4,602 EUROPE Export Import Balance 438 404 +34 898 636 +272 1,401 1,269 +132 2,995 2,856 +139 5,072 5,132 -60 8,120 5,902 +2,218 N AMERICA Export Import Balance 68 1 +67 352 12 +340 622 60 +562 2,996 147 +2,849 3,923 300 +3,623 4,085 3 65 +3,720 CS AMERICA Export Import Balance < 1 17 -16 175 104 +66 345 168 +177 1,039 645 +394 4,332 1,574 +2,758 4,480 2,333 +2,147 OCEANIA Export Import Balance 2 5 -3 8 14 -6 4 18 -14 22 30 -8 37 64 -27 55 100 -45
Table 2 – The development of global poultry meat trade at continent level between 1970 and 2020; data in 1,000 t (source: FAO database).
Continent 1970 1980 1990 2000 2010 2020 AFRICA Export Import Balance <1 5 -5 13 89 -76 4 85 -81 95 259 -164 61 1,069 -1,008 100 1,732 -1,632 ASIA Export Import Balance 16 67 -51 84 612 -528 288 965 -677 1,432 3,277 -1,845 1,187 5,021 -3,834 1,403 6,012 -4,609 EUROPE Export Import Balance 420 341 +79 775 456 +319 1,046 895 +151 1,805 1,811 -6 3,115 2,880 +235 5,095 3,222 +1,873 N AMERICA Export Import Balance 44 <1 +44 288 10 +276 531 37 +494 2,673 96 +2,577 3,426 193 +3,233 3,638 222 +3,416 CS AMERICA Export Import Balance <1 17 -17 173 103 +70 331 142 +189 954 436 +518 3,834 1,274 +2,560 4,225 1,988 +2,737 OCEANIA Export Import Balance 1 5 -4 7 13 -6 1 16 -15 14 25 -11 29 49 -20 46 82 -36
4002 H
• 360 degrees opening
• Highly strong and durable material
• “SOFT” action
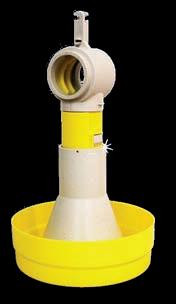
4626

• Suitable for fattening turkeys
• Perfectly dry bedding
• Simultaneous watering of 2 and more animals
INFINITY
• Essential design
• No chicks in the pan!
• Regulation of minimun and maximum feed level


• Available in caged broilers version
for breeding
PP Belts
• Egg collection
• Manure drying system

• Manure belt collection
• PP woven egg belts


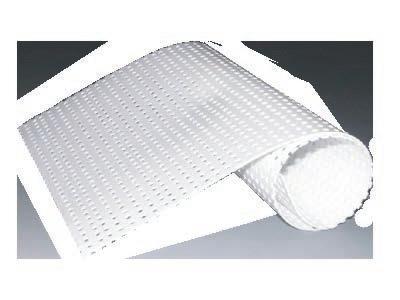
• PP hole egg belts
4006 H
• 360 degrees opening


• Highly strong and durable material

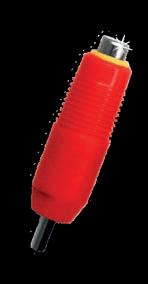
• “EXTRASOFT” action
4901 N
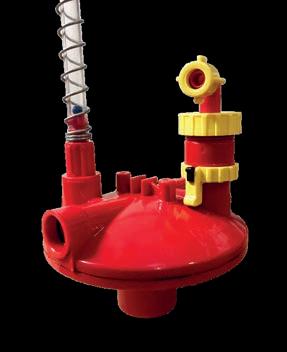
Pressure regulator with bypass

CORTI ZOOTECNICI
ARTICLES ACCESSORIES
Corti Zootecnici Srl | Via Volta, 4 21020 Monvalle (VA) Italy| www.cortizootecnici.it |
Hong Kong re-exported some of its imports to China and other Asian countries. When Hong Kong lost its status as crown colony, imports decreased considerably and China
obviously imported chicken meat no longer via Hong Kong. Mexico climbed from rank seven in 2000 to rank two in 2020. Several outbreaks of the Avian Influenza virus resulted
in a sharp decline in production and in growing imports. The composition of the leading countries in 2020 reflects the sharp increase of Asia’s imports between 2000 and 2020.
Figure 4 documents the constantly decreasing regional concentration of chicken meat imports in the decades under review. While in 1970 the top ten countries shared 88.1% in the global import volume, their share was as low as 46.3% in 2020. In 1970, Germany was in an unchallenged first position with 49.3%; in 2020, the country only contributed 3.6%. The lack of religious barriers regarding consumption, the comparatively low price, the extraordinary role, which it plays in quick-serve restaurants and the wide usability of the meat in the preparation of dishes, explains the global success story. Currently, no country has a dominating position; a more regular distribution has developed.
Strong positions of European countries in turkey meat trade
The timeline of turkey meat exports and imports as well as the composition and ranking of the leading countries differed considerably from those of chicken meat.
Figure 5 confirms the statement that European countries played an important role in the trade of this commodity. In 1970, seven of the top ten exporting countries were located in Europe and two in North America. With the exception of the decade between 1990 and 2000, when France ranked in first position, the USA were in first place. A closer look at the composition of the leading coun-
26 MARKETING - marketing -
Continent 1970 1980 1990 2000 2010 2020 AFRICA Export Import Balance 0 0 0 0 0 0 <1 21 -20 1 61 -60 14 93 -79 3 133 -130 ASIA Export Import Balance 0 <1 0 9 2 +7 4 16 -12 20 122 -102 23 105 -82 18 67 -49 EUROPE Export Import Balance 2 13 -11 32 38 -6 196 157 +39 611 434 +177 513 445 +68 5 46 476 +70 N AMERICA Export Import Balance 16 <1 +15 36 1 +35 32 1 +31 210 4 +206 264 14 +250 239 12 +227 CS AMERICA Export Import Balance 0 0 0 2 0 +2 11 1 +10 56 153 -97 96 186 -90 43 180 -137 OCEANIA Export Import Balance 1 0 0 1 0 +1 <1 <1 0 3 1 +2 3 1 +2 3 3 0
Table 4 – The development of global turkey meat trade at continent level between 1970 and 2020; data in 1,000 t (source: FAO database)
tries shows that several countries only belonged for a short time to the top group, i.e. Israel, Belgium, Australia, Yugoslavia and Sweden. Other countries came back after some years of interruption, such as Canada or Germany. The rankings of the United Kingdom, Brazil and Italy fluctuated considerably. Newcomers among the top ten countries were Poland, Spain and Chile. Worth noting is the remarkable rise of Poland to second place, similar to the dynamical development of the country’s egg trade.
The regional concentration in turkey meat exports was extremely high. Figure 6 shows that from 1970 to 2010 the ten leading countries shared over 90% in the global trade volume, then their contribution fell slightly to 86%. In 1970, the USA dominated the trade with turkey meat. From then on, a result of the growing per capita consumption in several European countries and the increasing production, trade between European countries reached considerable volumes. With almost 287,000 t in 2000, France reached an unsurpassed peak. In the following years, the USA held an unchallenged first place. In 2020, Poland became a serious competitor, the gap between their export-volumes shrunk to 45,000 t. A detailed analysis of the trade flows would reveal that Poland focused on EU member countries while the USA mainly supplied markets in the Americas.
In 1970, nine of the ten leading importing countries were located in Europe, which once again highlights the predominant role of the continent in turkey meat trade (Figure 7 ). Until 1990, Germany ranked as number one before it was replaced
27 - september 2023MARKETING 3.4% 1.2% 2.7% 2.9% 5.4% 5.8% 5.8% 8.9% 10.2% 11.9% 41.8% Netherl. Hungary Denmark USA Belg./ Lux. France Bulgaria Poland China Germany Others Total: 0.481 mill. t 1970 9.7% 1.7% 3.1% 3.1% 3.3% 6.3% 8.8% 11.3% 13.3% 15.4% 24.0% USA France Brazil Netherl. Hungary Thailand Hong Kong Denmark Belg./ Lux. China Others Total: 2.201 mill. t 1990 13.1% 1.8% 2.2% 2.3% 2.5% 3.3% 3.3% 6.0% 7.5% 28.3% 29.7% Brazil USA Netherl. Hong Kong Belgium France Poland Germany Argentina Un. King. Others Total: 11.654 mill. t 2010 10.9% 1.6% 2.1% 3.0% 3.3% 3.7% 10.1% 12.6% 15.3% 16.4% 21.0% USA France Netherl. Brazil Hungary Denmark China Germany Bulgaria Poland Others Total: 1.338 mill. t 1980 7.2% 1.6% 1.6% 3.5% 3.9% 5.4% 6.0% 8.4% 11.3% 13.2% 37.9% USA Brazil Hong Kong Netherl. France China Belgium Thailand Un. Kingd. Denmark Others Total: 6.888 mill. t 2000 17.5% 1.8% 2.4% 2.6% 3.0% 3.2% 3.6% 6.5% 8.1% 24.4% 26.9% Brazil USA Netherl. Poland Turkey Belgium Ukraine Un. King. Thailand Germany Others Total: 14.508 mill. t 2020
Figure 2 – The share of the ten leading chicken meat exporting countries in global exports between 1970 and 2020 (design: A.S. Kauer, based on FAO data)
Rank 197019801990200020102020 1 China 2 Mexico 3 S. Arabia 4 Japan 5 UAE 6 Germany 7 Hong Kong 8 Cuba 9 S. Africa 10 Un. Kingd. KUW JAM USSR EGY VieN CH CSSR A E SING NL UAE YEM F IRQ RUS
Figure 3 – The changing composition and ranking of the ten leading chicken meat importing countries between 1970 and 2020 (design: author, based on FAO data)
by Mexico, which maintained this position in the following decades. Beside Germany, Belgium and Austria were major importers over the whole time under review. In the two decades between 1990 and 2010, the composition of the countries changed considerably. Some countries (S. Africa, the Republic of Korea and Hong Kong) belonged to the top group only for a short time. Between 2000 and 2010, Russia imported large amounts of turkey meat to compensate the sharp decrease of pig meat production. China began importing from 2000 on. Spain, which had belonged to the top ten countries between 1990 and 2000, came back in 2020 and reached rank three. Newcomers in 2020 were Benin and South Africa. Benin re-exported most of its imports to other African countries.
Figure 8 impressively shows the drastic change in the regional concentration of turkey meat imports. In 1970, the ten leading countries shared almost 100% of the import volume, Germany alone 55.1%. Until 1990, the concentration remained very high, then it began to decrease and in 2020, it was as low as 56.1%. This change was on the one hand a result of Mexico’s appearance as the leading importer, on the other, that the number of countries, which imported turkey meat, increased. The degree of the regional concentration was much lower than in exports (see Figure 6), which documents that the number of countries with a surplus over their domestic demand was much lower than the number of countries, which had to import to meet the demand. Some of these countries did not produce turkey meat at all.
28 MARKETING - marketing -
11.6% 1.4% 1.6% 1.6% 2.5% 2.8% 2.8% 5.7% 6.7% 14.0% 49.3% Germany USSR Hong Kong Switzerland Czechosl. Austria Japan S. Arabia Singapore Jamaica Others Total: 0.436 mill. t 1970 29.9% 2.3% 2.7% 3.0% 3.0% 5.2% 7.6% 9.8% 10.0% 12.9% 13.6% Japan USSR Germany S. Arabia Hong Kong Un. King. China U.A.E. Spain Singapore Others Total: 2.140 mill. t 1990 50.5% 2.9% 2.9% 3.3% 4.0% 4.8% 4.9% 5.1% 5.8% 6.2% 9.6% Hong Kong S. Arabia Russia Mexico China Viet Nam Japan Un. King. Netherl. Germany Others Total: 10.486 mill. t 2010 28.1% 2.6% 2.7% 3.4% 4.2% 5.0% 5.5% 7.8% 12.4% 13.2% 15.1% S. Arabia Germany USSR Iraq Japan Hong Kong Egypt U.A.E. Yemen Kuwait Others Total: 1.283 mill. t 1980 30.2% 1.9% 2.1% 3.3% 3.6% 4.4% 4.7% 9.6% 9.8% 13.6% 16.8% Hong Kong China Russia Japan S. Arabia Un. King. Mexico Germany France Netherl. Others Total: 5.904 mill. t 2000 53.7% 2.8% 3.0% 3.1% 3.4% 3.6% 3.6% 4.0% 4.7% 6.6% 11.5% China Mexico S. Arabia Japan U.A.E. Germany Hong Kong Cuba S. Africa Un. King. Others Total: 13.259 mill. t 2020
Rank 197019801990200020102020 1 USA 2 Poland 3 Germany 4 Italy 5 France 6 Spain 7 Brazil 8 Hungary 9 Canada 10 Chile NL AUS S YUGO DK B ISR UK IRE
Figure 4 – The share of the ten leading chicken meat importing countries in global imports between 1970 and 2020 (design: A.S. Kauer, based on FAO data)
Figure 5 – The changing composition and ranking of the ten leading turkey meat exporting countries between 1970 and 2020 (design: author, based on FAO data)

29 - september 2023MARKETING 0.1% 0.3% 0.5% 1.2% 1.4% 1.7% 3.1% 4.2% 87.1% USA Un. Kingd. Belgium France Canada Australia Yugoslavia Italy Germany Sweden Others Total: 18,206 t 1970 0.4% Total: 902,770 t 9.3% 2.6% 3.4% 3.5% 4.0% 4.2% 4.4% 4.7% 10.3% 21.8% 31.8% France USA Netherl. Brazil Un. Kingd. Ireland Italy Germany Belgium Hong Kong Others 2000 Total: 79,173 t 1980 2.4% 2.0% 2.1% 2.2% 3.8% 4.7% 7.9% 11.4% 19.3% 43.0% USA France Israel Netherl. Belgium Denmark Un. Kingd. Canada Brazil Italy Others 1.2% Total: 913,046 t 13.7% 2.6% 3.0% 4.0% 5.0% 6.2% 8.5% 9.8% 10.2% 10.7% 26.3% USA France Germany Poland Brazil Italy Netherl. Hungary Un. Kingd. Canada Others 2010 Total: 243,415 t 4.1% 1.4% 2.4% 3.0% 3.3% 4.4% 6.7% 6.9% 11.7% 12.2% 43.9% 1990 France Un. Kingd. USA Netherl. Italy Brazil Ireland Germany Belgium Canada Others Total: 871,265 t 13.8% 2.8% 2.8% 3.2% 4.4% 5.4% 6.1% 6.7% 11.0% 19.3% 24.5% USA Poland Germany Italy France Spain Brazil Hungary Canada Chile Others 2020
Figure 6 – The share of the ten leading turkey meat exporting countries in global exports between 1970 and 2020 (design: A.S. Kauer, based on FAO data)
Summary and perspectives
Parallel to production, global poultry meat trade increased remarkably in the decades under review. In 1970, only 3.3% of the production was traded; until 2020, the trade had grown thirtyfold and reached a share of 11.0% in the production volume. To the increase of 15.1 mill. t, chicken meat contributed 93.1%, turkey meat 5.7%, duck and goose meat together 1.2%. The share of traded poultry meat species in comparison to production differed between 14.1% for turkey meat and 12.4% for chicken meat. It was much higher than the share of traded shell eggs, which reached only 3.3% in 2020. The possibility to freeze meat permits wide transportation distances and a much longer usability of the commodity.
The contribution of the continents to poultry meat trade differed considerably. In 2020, Europe ranked first in exports with a share of 52.2%, followed by Central and South America and North America. In imports, Asia was in first place with a share of 53.6%, followed by Europe, Central and South America and Africa.
At country level, the composition and ranking of the ten leading countries differed remarkably. The regional concentration in exports was higher than in imports for chicken and turkey meat. This indicates, that the number of countries with a production surplus over demand was small in comparison to the number of countries, which were not able to meet the demand by domestic production and therefore had to import.
The volume of poultry meat trade will further grow in the current decade. While chicken meat will show high
30 MARKETING - marketing0.8% 0.9% 2.5% 3.2% 4.2% 4.3% 6.7% 7.9% 14.4% 55.1% Germany France Un. Kingd. Belgium Austria Japan Italy Greece Sweden Yugoslavia Others Total: 13,813 t 1970 12.9% 2.7% 2.9% 4.6% 5.1% 7.7% 8.3% 10.0% 10.6% 11.0% 24.2% Germany Netherl. Un. Kingd. Belgium S. Africa Spain Italy Austria Hong Kong Korea, Rep. Others Total: 198,844 t 1990 41.3% 3.1% 3.2% 3.4% 3.5% 4.0% 4.3% 4.3% 4.5% 10.5% 17.9% Mexico Germany Benin Belgium Austria Russia Netherl. S. Arabia France China Others Total: 845,113 t 2010 3.2% 1.1% 1.2% 1.8% 2.0% 2.7% 4.3% 10.8% 22.3% 49.4% Germany Belgium Un. Kingd. Austria Canada France Japan Lebanon Netherl. Ireland Others Total: 40,576 t 1980 1.2% 29.2% 3.1% 3.4% 3.4% 4.1% 4.6% 4.8% 5.3% 11.9% 13.1% 17.1% Mexico Russia Germany Belgium China Spain Italy Netherl. Hong Kong S. Arabia Others Total: 774,421 t 2000 43.9% 2.8% 2.9% 2.9% 3.0% 3.3% 4.3% 4.6% 5.0% 12.2% 15.1% Mexico Germany Spain Benin Belgium France China Austria Un. Kingd. S. Africa Others Total: 871,631 t 2020
Rank 197019801990200020102020 1 China 2 Mexico 3 S. Arabia 4 Japan 5 UAE 6 Germany 7 Hong Kong 8 Cuba 9 S. Africa 10 Un. Kingd. KUW JAM USSR EGY VieN CH CSSR A E SING NL UAE YEM F IRQ RUS
Figure 8 – The share of the ten leading turkey meat importing countries in global imports between 1970 and 2020 (design: A.S. Kauer, based on FAO data)
Figure 7 – The changing composition and ranking of the ten leading turkey meat importing countries between 1970 and 2020 (design: author, based on FAO data)
absolute and relative growth rates, turkey meat trade may enter a phase of only limited growth or even decrease because of the higher retail price, which results from a less favourable feed conversion. Of importance is also that turkey meat has no tradition as a meal in most of the populous Asian countries and in comparison to chicken meat has not been able to achieve a noteworthy position in quick-serve restaurants.
Although plant-based meat substitutes have been suc cessful in North America, Europe and several Asian countries and in 2021 reached a sales volume of more than 5 billion US-$, the share in total meat sales is still quite low. The trade volume is negligible in comparison to conventional meat. Some projections regarding the fu ture sales volume are very optimistic, but the dynamics over the past two years have given way to a more realistic assessment. This is even more the case for cell-cultured meat. The high production costs, problems in the scaling up of production and an obvious scepticism against con suming the expensive and high tech products will limit its fast diffusion.
Data source and suggestions for further reading

FAO database: https://www.fao.org/faostat/en
Windhorst, H.-W.: A glimpse into the future. Projection of global meat production and consumption until 2030. In: Fleischwirtschaft international 2021, no. 3, p. 28-31.
Windhorst, H.-W.: Patterns and dynamics of the EU poul try industry: a status report. Part 2: Poultry meat produc tion and egg trade. In: Zootecnica International 44 (2022), no. 1, p. 28-32.
Windhorst, H.-W.: Patterns and dynamics of global egg and poultry meat trade. Part 2: Poultry meat trade. In: Zootecnica International 44 (2022), no. 3, p. 24-27.
Windhorst, H.-W.: Patterns and dynamics of global egg and poultry meat trade. Part 3: Chicken and turkey meat trade. In: Zootecnica International 44 (2022), no. 4, p. 3640.
Windhorst, H.-W.: Patterns and dynamics of global turkey meat production and trade. Part 2: Turkey meat trade. In: Zootecnica International 45 (2023), no. 3, p. 22-26.
Windhorst, H.-W.: The revolution is taking shape. In: Fleischwirtschaft international 2023, no. 1, p. 34-39.

31 - september 2023MARKETING
INNOVATION IN VENTILATION +45 75771922 • mail@dacs.dk • www.dacs.dk Across the entire pressure range, and at any speed, any airflow, and any supply voltage MagFan comes out top of the chart in Bess Lab testing, by a wide margin!
Dr. Michelle Behl, PhD., M.S, Director of Poult Quality, Select Genetics, www.select-genetics.com
Hatchery breakouts for improving turkey hatch and poult quality
Turkey hatcheries provide a highly controlled environment which maximizes the successful hatching of healthy poults. Constant monitoring of hatchability and breakouts of unhatched eggs helps hatchery managers maintain high levels of poult survival, welfare and quality.
Introduction
Egg breakout or hatch residue analysis is a powerful diagnostic tool for hatcheries. Breakouts can be used to aid troubleshooting, establishing trends, or optimize hatch
results. The egg tells a story of the timeline of events from when the egg is formed inside the hen and all the way through the hatching process. Egg breakouts do not substitute looking at the birds, but provide an important insight into breeder nutrition,
32 - technical columnTECHNICAL COLUMN
health, egg handling, incubating, and hatching parameters. For example close attention to egg breakouts can indicate toxin or nutritional deficiencies before clinical signs are seen in the breeder flock.
When used in conjunction with other hatchery tools, detailed breakouts can result in significant improvements. Nevertheless, they are often overlooked due to a lack of understanding of their importance, inability to interpret them, or lack of time and resources.
Establish the norms
Most hatcheries have some sort of hatch residue breakout process but it can be too simplistic. The program may only consist of looking at the “poor hatches”, only look at one tray, or use generic breakout sheets. In order to establish trends, track embryonic changes, or identify potential areas to improve hatch, you must examine the breakouts thoroughly and frequently. In order to understand the “poor hatches”, you must understand what embryonic mortality is in the “good hatches” and have a base understanding as to what is “normal” for specific lines and for specific weeks in lay.
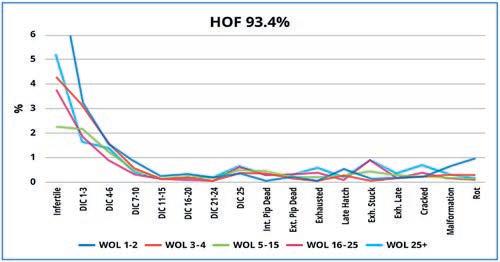
Once “normal” has been established (Figure 1) and expectations are set, slight variations between flocks and hatches can be readily seen. These variations help guide us how to optimize hatch and poult quality in each scenario.
flock. Breakouts will change based on location in the egg store, incubator, and or hatcher. One tray is not a large enough sample size to account for all inherent hatchery variables. For example if you breakout one tray from the same location every hatch, you will miss the bigger picture. It may contain late hatches because this is a cool spot in the incubator. Problems could be overlooked with the rest of the machine exhibiting classic signs of overheating, such as increased late dead and short deformed legs. Breakout profiles change alongside genetic development of breeds.
Over time, genetic progress can affect embryonic development and incubation requirements. These small changes will go unnoticed if routine breakouts are not being analyzed and the opportunities for optimizing embryonic requirements will be missed.
Table 1 – Components to be included in a detailed breakout analysis (source: Aviagen Turkeys Management Guidelines for Turkey hatcheries), DIC = Day in cycle.
Flock Details
Consider the variables
Examination of one tray is insufficient to give an accurate representation of what is happening in a machine or
33 - september 2023TECHNICAL COLUMN
Figure 1 – Embryonic mortality classes for a flock with a good hatch of fertile (HOF) of 93.4% The lines show the results of the hatch breakouts by week of lay (WOL) during the flock lifetime.
Embryonic mortality stage Lesions Tray Culls Date: Infertile Aspergillus Dead Flock DIC 1 to 3 Big Belly Exhausted Week of lay DIC 4 to 6 Blue Legs Late Sample size DIC 7 to 10 Deformed Legs Cull/Legs Breakout HOS DIC 11 to 16 Infected Yolk Breakout HOF DIC 16 to 20 Malpositions Breakout fertility DIC 21 to 24 Mottled Yolk Sample Location/Position DIC 25 Day Dead Pipping Muscle Internally Pipped Dead Residual Albumen Externally Pipped Dead Ruptured Yolk Pipped Alive Exhausted Short Legs Pipped Alive Late Hatch Skin Necrosis Exhausted Stuck to Shell Thick Membrane Exhausted Late Thin Shell Cracked Urates Malformations Cull Egg Rots Transfer Crack
Detailed breakouts, your key diagnostic tool
Many hatcheries use a generic breakout sheet that typically characte -
Observation
rizes week of embryonic death and a few other categories unrelated to incubation, such as cracked or rots. The key to unlocking the potential diagnostic tool of egg breakouts lies
in the detail of the breakout results. Table 1 shows the components that should be included in a detailed breakout form. The more detailed and descriptive the breakouts can
Potential Causes
Infertile Farm problem. Extreme overheating/chilling prior to or at set (early dead is not a true infertile).
DIC 1-3
DIC 4-6
DIC 7-10
DIC 11-15
DIC 16-20
DIC 21-24
DIC 25
Externally Pipped Dead
Pipped Alive Exhausted
Pipped Alive Late
Farm problem with egg handling, cooler conditions, semen quality. Too long pre-warm. Eggs stored for a prolonged period of time.
Same as listed for DIC 1-3 but the insult was less severe.
Pre-incubation. Too high temp during week 1. Lack of turning at set.
Not very common. All previous mentioned hatchery issues but to a lesser degree.
Common if eggs are overheated during the 2nd week of incubation. More common in multi-stage systems.
Inadequate moisture loss. Lack of oxygen. Depends on accompanying lesions.
Common. Key is in accompanying lesions.
Inadequate moisture loss. Hatcher temperature too high. Weak embryo.
Can be similar to externally pipped dead but to a lesser degree. Larger hatch window – later hatching poults are not in sync with the hatcher profile.
Inadequate start time. Too long pre-warm. Too low of a temperature in incubator or hatcher. Humidity spray nozzle issues.
Exhausted Stuck to Shell Moisture loss issues in incubation. Most common for overheating in hatchers. Low relative humidity in hatchers.
Exhausted Late
Short Shanks
Lower than optimal temps in hatchers. Embryo out of sync with hatcher profile. Uneven hatch timing.
Overheating in the second and beginning of third week. Inadequate moisture loss.
Deformed Legs Slight overheating over a long period of time.
Malposition Severe overheating at any stage of incubation. Lack of turning. Eggs stored for prolonged periods of time.
Residual Albumen
No Visible Lesions
Skin Necrosis
Urates
Ruptured Yolk
Malformations
Inadequate moisture loss. Overheating in the second and third week. Lack of turning at set and during the second and third weeks. Egg handling. Eggs did not have enough time to “breathe” prior to set. Eggs packed in paper.
Depends on the level of mortality. Typically indicates a sudden severe problem.
Overheating in hatchers with or without high humidity.
Cooling or overheating during the second half of incubation.
Overheating during the third and beginning of fourth week or too rough at transfer prior to or at set.
Depends on the type of malformation:
Eye abnormalities/ectopic viscera - High temps DIC 1-6.
Brain abnormalities - High temp DIC 0-3.
Parrot beak/Micromelia - Nutritional.
Extra limbs - Rough handling or jarring of the eggs during collection/transport prior to or at set.
34 - technical columnTECHNICAL COLUMN
Table 2 – Hatch residue troubleshooting guide (source: Aviagen Turkeys Management Guidelines for Turkey hatcheries).
be, the more useful the information becomes. For example, simple classification of embryonic mortality as late dead without further details could be attributed to a wide range of causes: incubator or hatcher issue, transfer process problem, poor egg handling, or it may even be “normal” for this particular week of lay. If you take the same set of breakouts, classify them as an internally pipped dead with residual albumen, deformed legs, and short legs, a clearer picture is revealed which can be used to tackle the root of the issue and progress can be made.
Similar to establishing normal patterns of embryonic mortality, patterns of normal embryonic lesions should also be determined. Breakout lesions will also vary based on flock and week of lay. The lesions provide additional information with on how to tackle the individual flock issues.
Causes of abnormal breakouts are diverse, ranging from environmental factors through to breeder flock nutrition, fertility, and health, egg handling, as well as incubator and hatcher conditions. It is not only enough to be able to identify the stage in embryonic mortality, lesions, and abnormal breakouts, you must be able to interpret what the data is telling you (Table 2).
Egg breakout investment return
Egg breakouts take time and resources but are an essential hatchery operation to identify normal and abnormal patterns of development. Whilst the benefit may not be initially obvious, it will pay significant
dividends when problems emerge and they assist in a swift diagnosis and correction. Therefore, a concerted effort must be made to ensure breakouts are being done frequently and thoroughly. The opportunity is in the trends and details. Nowhere else can anyone find a record of events from embryo formation to hatch. Breakouts will tell you all that you need to know, you just need to listen.
Optimal and animal-friendly storage of day-old chicks
Sub-optimal storage conditions - even for relatively short periods - can negatively affect chick quality, post-hatch performance and animal welfare.
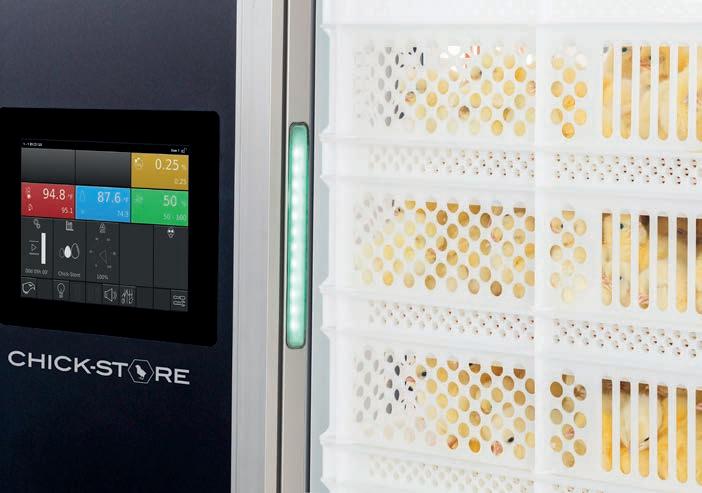
The X-Streamer™ Chick-Store is specifically designed to automatically deliver the perfect chick holding environment, guaranteeing your valuable day-olds will retain outstanding quality and performance, and feel comfortable. Furthermore, the X-Streamer™ Chick-Store will offer you more flexibility in your logistics and full traceability of all important storage parameters.
Let’s keep in touch!
35 - september 2023TECHNICAL COLUMN
X-Streamer™ Chick-Store
www.petersime.com
Scan for more information:
©
-
Precise temperature control Uniform airflow Fully adjusted lighting
Petersime 2021
All rights reserved.
Pramir Maharjan, Department of Agricultural and Environmental Sciences
Tennessee State University
Shawn Hawkins, Department of Biosystems Engineering and Soil Science
Yang Zhao, Department of Animal Science
Jorge Urrutia, Department of Poultry Science
Mississippi State University
Management of nipple drinker watering systems
Nipple drinker systems have become the standard for most of the poultry industry. When managed properly, bird performance and litter quality are excellent with nipple systems, and they save labor by eliminating the chore of cleaning open-type drinker systems of the past.
Although labor is greatly reduced with nipple drinker systems, that does not mean they require less management. If anything, nipple systems require more management and attention to detail than systems of the past. Improper management resulting from mistakes in water line height and regulator pressure can have a detrimental impact on broiler performance and litter quality. Birds consume approximately twice as much water as feed (on a pound for pound basis), and both feed and water consumption steadily increase as a flock ages.

36 MANAGEMENT - management -
Tom Tabler, Department of Animal Science
Water consumption
Water is the most important nutrient consumed by an animal. A bird can survive several weeks without food but only a few days without water. The purpose of the broiler drinker system is to provide sufficient water for optimum performance while maintaining dry litter.
It is important to know how much water broilers consume on a given day. Water is sometimes used to provide medications, vaccines, vitamins and electrolytes to broilers. It is essential to be able to predict consumption to ensure that each bird receives the proper amount of such substances. In addition, growers that monitor daily water consumption can compare current consumption rates with past flocks to identify potential disease or management issues indicated by a drastic change in consumption.
Water consumption continues to be one of the simplest and most effective tools a grower can use to monitor flock performance. It should gradually and continuously increase as the flock ages but don’t be alarmed if usage remains unchanged for a day every now and then.
However, if water usage remains unchanged or decreases for more than a day or two, growers should attempt to identify the culprit because, most likely, something is wrong. A checklist of possible issues include:
• drinker line height is too high or too low;
• pressure at the regulator is incorrect for the age of the birds;
• air locks in the drinker system;
• clogged water filters reducing water flow;
• nipples clogged or not triggering because of scaling or contaminants in the water supply;
• feed changes (grower to finisher or finisher to withdrawal) or birds out of feed;
• water treatments/additives that may have changed the taste of the water;
• dramatic change in light intensity in the house;
• diseased or ill birds;
• too many birds per nipple drinker (resulting from migration or high bird placement numbers).
Bird genetics have changed dramatically over the last few decades. As a result, broilers drink considerably more water today than broilers of 30 years ago. Compare broiler water intake from 30 years ago to broiler water intake today (Figure 1). Water intake of 56-day-old broilers in 1992 was roughly 80 gallons per 1,000 birds. Water intake of 56-dayold broilers today is roughly 100 gallons per 1,000 birds. This puts extra demand on the drinker system to deliver the increased water supply that modern broilers require to meet their genetic potential. And it must be
delivered in a manner that does not waste water or put excess moisture in the litter which can cause footpad dermatitis.
Nipple drinker management
What aspects of drinker management should growers pay close attention to in order to avoid wasting water? The three most common problems are:
• nipple leakage;
• improper drinker line height;
• improper drinker line regulator pressure.
Nipple systems rely on pressure regulators to control the amount of water birds receive when the nipple mechanisms are activated. Pressure on the regulator must be adjusted regularly as the flock ages. Pressure is low when the chicks are small so that water will flow easily from the nipples at the slightest touch. As the birds grow, pressure is gradually increased so that more water will flow upon nipple activation. Adjusting the pressure once per week is usually sufficient. However, pay special attention to line pressure as the birds approach market
37 - september 2023MANAGEMENT
0 20 40 60 80 100 120 Gallons/1,000 bird s 1 3 5 7 9 11 13 15 17 19 21 23 25 27 29 31 33 35 37 39 41 43 45 47 49 51 53 55 57 59 Day of Age Daily broiler water intake 2019-2021 MSU (unpublished) 1992 (AR Annual Report)
Figure 1 – Comparison of broiler water intake today and 30 years ago (1992).
age. Too much pressure often leads to wasted water and leaky nipples and can make it more difficult for the nipple to properly shut off the water flow. On the other hand, too little pressure may limit water consumption by the birds at the far end of the line for water. Carefully monitor sight tubes at each end of the line and be sure the pressure is near equal at each end. If the water column in the tubes is not approximately equal at each end, this could indicate a pressure issue, levelness issue or an obstruction in the water line.
Nipple height must be adjusted as often as needed. At chick placement, the nipple pin should be at eye level. At day two and beyond, adjust the height so that the bird’s head is at a 45-degree angle to the nipple. This may mean a few clicks on the water line winch handle daily. There are a variety of different nipple drinker systems in use in the poultry industry today and nipples from different systems may trigger differently, changing the height the nipples need to be in relation to flock age. Growers should check with their service technician or drinker manufacturer to learn how their drinker system’s nipples operate and how to match that to flock age.
Drinker lines that are too high or too low will impact how much water a bird consumes and how much is wasted in the litter. The most common problem growers make is failing to make proper adjustments to water line height at the appropriate time. Modern-day broilers grow extremely fast and height adjustments must be made daily to maintain optimal conditions. Birds should never be able to drink while sitting down, yet this is often the case. In such a situation, much of the water the bird triggers from the nipple ends up on the floor and contributes to wet litter and poor paw quality. Having drinker lines too low not only results in water wastage into the litter but will impact bird performance as well because wet litter leads to higher ammonia volatilization.
Drinker lines that are too high can also have serious negative effects on bird performance. Reaching too high for water will cause the birds to peck at the nipple instead of activating it as intended, resulting in increased water wastage. Large height adjustments (2-3 inches all at once) instead of a few clicks on the winch handle each day will result in stress on the birds as they attempt to adjust to the large height increase. Monitor water intake each day on the controller. Intake should gradually increase each day. If it plateaus or goes down after lines are raised, the lines may have been raised too much.
Common issues
Air locks can be a serious problem, especially when chicks first arrive and water pressure is set low. Air locks occur in high spots along the drinker line. Adjust the cable drops as needed to maintain a level line. Using a yard stick to assist with leveling may be beneficial. To help reduce air locks, raise the regulator end of the drinker line slightly so that any air in the system can escape
38 MANAGEMENT - management -
“Pressure on the regulator must be adjusted regularly as the flock ages. Pressure is low when the chicks are small so that water will flow easily from the nipples at the slightest touch. As the birds grow, pressure is gradually increased so that more water will flow upon nipple activation. Adjusting the pressure once per week is usually sufficient”
through the riser tube. It may be beneficial to raise the regulator end of the line a foot or so for a few seconds when you walk the chickens to allow locked air to escape. Use the support pipe or bar above the drinker line to raise the system and not the regulator itself. This will lessen the risk of breaking the water line.
Be sure the water supply is filtered at the control room before entering the drinker lines. Check the filters at least weekly for issues such as iron precipitation, sand or sediment build up, mineral deposition, and bacterial contamination. Poor water supply quality may require chlorine treatment, pH adjustment or sand filter installation. Poultry drinking water supplies should be analyzed to determine mineral content, pH and possibly bacterial load, especially if performance issues recur flock after flock.
It is not uncommon to see caked litter accumulate under drinker lines. Often the problem is leaking nipples, improper pressure or improper drinker line height. Better management may fix improper pressure and line height issues but leaking nipples may need to be replaced. Nipples will not last forever and wear on the metering pin and rubber gasket or O-ring will eventually take its toll and the nipples will start to leak. Harsh chemicals used to clean the water lines and remove biofilms may also damage the nipples. Consult your nipple manufacturer as to what cleaning products are safe to use. If certain lines are prone to caking, winch those lines to roughly 4 feet and shut off the water supply to that line. Mark the level of water in the riser tube at each end of the line and wait 30 minutes. Keep the riser
tubes clean so that the level of water in the tube can always be assessed. After 30 minutes, if the level of water in the riser tubes has not changed, the problem is likely associated with improper line height or pressure. Try decreasing the pressure slightly and raising the line slightly more than the others. If the water level in the riser tubes is lower after 30 minutes, the problem is likely related to leaking nipples. Seek out the troublemakers and repair or replace as needed.
Acids, sanitizers and biofilms

A strong acid cleaner capable of dropping the pH of the water to below 6 and that is also safe for nipple drinkers will be needed to cut scale
buildup out of the water lines. However, acids sometimes seem to allow scale buildup in lines to break loose in chunks, partially clogging the system and preventing nipple drinkers from working properly. Check with your drinker manufacturer and local poultry supply store for the best options. But remember that acids are not sanitizers. Acids are only part of a larger, overall sanitation program, not the entire program. For example, if a biofilm problem is suspected, a good sanitizing cleaner that can dissolve the biofilm will need to be run before the acid. The acid will not be able to cut through the biofilm and, therefore, will be unable to remove any scale buildup that may exist. Like acids, there are several sanitizing products available but some of

39 - september 2023MANAGEMENT
PT02, PT03, PT04, PT05
UNIQUE BLEND STRONGER THROUGH INNOVATION
SMART, CHOOSE SAFETY!
in future proof solutions
INTRA HYDROCARE DOES COMPLY WITH THE LATEST REGULATIONS
BE
Pioneers
the best appear to be the concentrated, stabilized hydrogen peroxide products. The stabilizer prevents the hydrogen peroxide from losing its strength as quickly by preventing it from converting to water and oxygen before its work is finished. Stabilizers also allow the product to last longer in stock solutions. Stabilized hydrogen peroxide works well on biofilms because it is a very good oxidizer and can hydrolyze (or dissolve) the biofilm. In addition, it is non-corrosive to the drinker system; quite effective on bacteria, fungi and viruses; and can break down algae to a degree that it passes through nipple drinkers without causing nipple clogging or sticking issues. However, the stabilized hydrogen peroxide products are not as user friendly as some less effective products and are somewhat harder to find at the local grocery store. Local poultry or animal health supply stores will likely be the only place that carries these products.
Biofilms are a difficult problem to address. A biofilm is a complex community of bacteria, fungi and algae encased in an extracellular polysaccharide that often harbors organic contaminants. Put in less complicated terminology, biofilm is slime, a breeding ground for microorganisms that physically protects the microorganisms from antibacterial agents. Biofilm development is rapid in slow-flow-
ing water systems where adequate nutrients are present (such as nipple drinker systems in poultry houses). Also, some hard water supplies contain minerals that can form scale, an attachment point for sediment and biofilms inside of drinker lines. In any case, biofilm growth can be stimulated when poultry growers run organic additives in poultry drinking water lines (Jell-O, Kool-Aid, Gatorade, vitamins, electrolytes, sugar water, stabilizers, antibiotics and so forth).
It must be emphasized that many organic drinking water additives are a biofilm food source. This food supply promotes microbial growth that can decrease the effectiveness of medications and vaccines dispensed through the drinker lines. Consequently, this results in poor feed conversion and increased mortality, carcass downgrades and condemnations. Once established, a biofilm makes the water system much more difficult to clean and keep clean. Even when the biofilm is removed, it can quickly return in as little as two to three days unless an adequate clean water program is in place or if you 1) do a poor initial cleaning job, 2) don’t keep the water supply sanitized, or 3) run an additive through the water system that serves as a biofilm food supply.

40 MANAGEMENT - management -
©BIg Dutchman
Water line sanitation

Household bleach is likely the most used water sanitizer on poultry farms. However, simply using bleach does not mean it is being used effectively or that the water supply is sanitized. You must have the proper concentration of chlorine at the end of the water line farthest from the water source to ensure that bleach is effective. Many growers use chlorine test kits to measure parts per million (ppm) of chlorine at the end of the line. You should have 3 to 5 ppm of free chlorine at the end of the line for your sanitation program to be effective. More than 5 ppm may be too strong and could cause the birds to decrease water intake and possibly damage the drinker system. Less than 3 ppm chlorine is too weak to properly sanitize the water supply.
Chlorine must have time to dissolve and produce hypochlorous acid for it to be most effective. Hypochlorous acid is 80 times more effective as a sanitizer than the hypochlorite ion present in bleach. Free chlorine is not considered effective unless it is 85 percent hypochlorous acid.
Contact time is important; too short an exposure time and chlorine does not work as well. During periods of high water demand, contact time may be minimal which could impact chlorine’s effectiveness. Growers have several alternatives to bleach that are also very good sanitizing agents, including 35 percent hydrogen peroxide, stabilized hydrogen peroxide products and chlorine dioxide.
Don’t overlook the pH of your water supply. In general, birds do not like to drink high pH water. High pH water tends to have a bitter taste that birds are able to recognize and this may reduce consumption. A reduction in water intake will mean a reduction in feed intake! A pH above 8 will impact the ability of most sanitizers to perform at their best. A pH below 5 may affect intestinal health, create a bloom of algae or mold that thrives at low pH levels, and damage metal drinker system components. A pH in the range of 6.2 to 6.8 appears to work well. If the pH of your water is above 7.0, lowering the pH may prove beneficial to overall flock performance.
Routine flushing is one of the simplest ways to help keep the water system clean. In addition to regular routine flushing, the system should also be flushed after any use of the medicator to prevent a food source for bacteria or other organisms from accumulating in the lines. Flush
41 - september 2023MANAGEMENT
CARFED INTERNATIONAL LTD Italian headquarters: Piazza Oberdan 3, 20129 Milano (Italy) Italian warehouse: Via Basilicata 10, 20098 San Giuliano Milanese (Italy) Ph.: +39 02 9881140 – Fax: +39 02 98280274 Email: carfed@carfed.it – Website: www.carfed.it UK headquarters: Ground Floor, One George Yard, London EC3V 9DF, England, UK Ph.: + 44. 20. 7660.0987 – Email: carfed@carfed.co.uk

