Chicopee Connectivity Plan
City of Chicopee

The Conway School | Winter 2024
Meera Connors | Amy Furman |Austin Hammer

The Conway School | Winter 2024
Meera Connors | Amy Furman |Austin HammerWe would like to thank the members of our core team for contributing their time and insights throughout the project. We would also like to express our gratitude to our Conway faculty and staff for the unending support and guidance.
The City of Chicopee, in cooperation with residents, officials, and stakeholders, has designated community connectivity through green and complete streets as a critical component of its first-ever city-wide plan, Envision Our Chicopee: 2040. Chicopee’s transportation infrastructure is car-centric, making it difficult to move throughout the city without a personal, motorized vehicle. Chicopee’s Department of Planning and Development asked The Conway School to propose a network of multi-modal streets, tailored to the communities who need it most, to increase connectivity throughout the city and create a more equitable Chicopee.
Environmental Justice (EJ) communities in Chicopee face challenges in accessing grocery stores, health services, and transportation. Sixty-five percent of Chicopee’s population lives in designated EJ communities, which are mostly concentrated in the south and western parts of the city. The EPA’s EJ Screen tool shows Willimansett and Chicopee Falls as food deserts, where buying fresh, affordable, good-quality food is difficult. Residents of both neighborhoods need cars to access grocery stores on the other side of town or to cross the bridge to Holyoke shops. Willimansett has the lowest percentage of households with vehicles at 85%, five points lower than the state average. Those without a car might depend on public transportation, but the bus routes are not frequent enough for reliable, everyday use. Creating more safe and efficient travel options for people without cars will enhance equity in Chicopee by connecting more people to the resources they need.
To identify the streets that are most favorable for providing green, walkable, and bikeable connections, all streets in Chicopee were evaluated in a multi-step analysis. The first part of the process was a quantitative, spatial analysis using a GIS model to determine which streets met dimensional criteria necessary to implement green and complete streets. The three major variables considered in the GIS model were slope, width of right-of-way, and total length for each street in the city. The GIS model helped to identify which of Chicopee’s streets provided the paths of least resistance (i.e., least cost path) between neighborhood centers and a selected group of destinations.
The selected destinations in this portion of the analysis reflect the city’s goal to generate equitable street-level connectivity both inter-regionally and within Chicopee with green and complete infrastructure. By identifying the least cost paths between each neighborhood center and the destinations, the recommended green and complete street paths will connect vulnerable and Environmental Justice residents of Chicopee with important resource centers and services. By intentionally considering the relationship between destinations and vulnerable populations in Chicopee, this GIS analysis builds equity into the decision-making process for identifying suitable streets for intervention.
The proposed green and complete streets have been prioritized into three tiers based on their ability to increase equitable pedestrian and cycling connections in Chicopee. Layering the prioritized streets from the GIS model with Chicopee’s 2021 tree canopy reveals sparse patches along the proposed street-level connections. Tree canopy data shows Willimansett, Chicopee Center, and Westover as the three neighborhoods where tree canopy falls under 30%. When implemented, the proposed green and complete streets running through these three neighborhoods will not only increase connectivity, but also green infrastructure in neighborhoods that need it most.
The GIS Model determines the most valuable and efficient street connections. Because the model does not have data to accurately represent what is happening at ground level, the next step is identifying the streets to prioritize for intervention by “ground-truthing” first on Google Earth to quickly and efficiently explore routesthen in person to verify obstacles and opportunities.
Converting the streets identified through this multi-part analysis into green and complete streets will equitably enhance connectivity for cyclists and pedestrians in Chicopee, reduce the load on the city’s existing stormwater systems as severe storms become more frequent, and support the city’s goal of reducing reliance on cars.


The City of Chicopee, in cooperation with residents, municipal staff, officials, and stakeholders, has designated community connectivity through green and complete streets as a focus area in its first-ever city-wide plan, Envision Our Chicopee: 2040. As it stands, Chicopee’s transportation infrastructure is car-centric, making it difficult to move throughout the city without a personal, motorized vehicle. Envision Our Chicopee: 2040 aims to build on existing resources like the sidewalk network, cycling and pedestrian paths, and public transit routes to create a network of multi-modal streets within Chicopee.
Chicopee’s neighborhood centers are the heart of Chicopee’s communities; they are the places where people gather, run into one another, and shop at local businesses. Through Envision Our Chicopee’s extensive community input process including surveys, public meetings, and one-on-one conversations, residents expressed their desire for the City to better maintain and repair these neighborhood centers, making them more walkable, bikeable, and attractive to private investment. In addition, residents also wanted to access popular destinations in other parts of the city through safer, greener walking and biking paths. This document explores how a green and complete street network, tailored to the communities who need it most, could increase connectivity throughout the city and create a more climate-resilient, equitable Chicopee.
Green streets are designed to treat and infiltrate stormwater runoff from impervious surfaces within and adjacent to the street rightof-way. This includes streets, roofs, and parking lots. Green infrastructure, the fundamental component of green streets, refers to features such as rain gardens, bioswales, and street trees that intercept and remove pollutants from runoff. In doing so, green infrastructure reduces pressure on the city storm and sewer system by infiltrating stormwater close to its source. Where infiltration is not possible, these systems can temporarily store and slowly release runoff back into the storm drain system, reducing peak flow (EPA, What is Green Infrastructure?). Chicopee can greatly benefit from green infrastructure projects to mitigate pressure on the remaining active combined sewer and stormwater lines.
A complete street is a road designed to accommodate diverse modes of transportation, including walking, cycling, public transit, and motorized vehicles. The term, coined in 2003 by America Bikes, was part of a campaign to ensure that equal rights and access were granted to all street users, regardless of age, ability, or mode of transportation. Studies have shown that streets that attract a diverse range of users are critical to economic revitalization (APA, Complete Streets Come of Age).


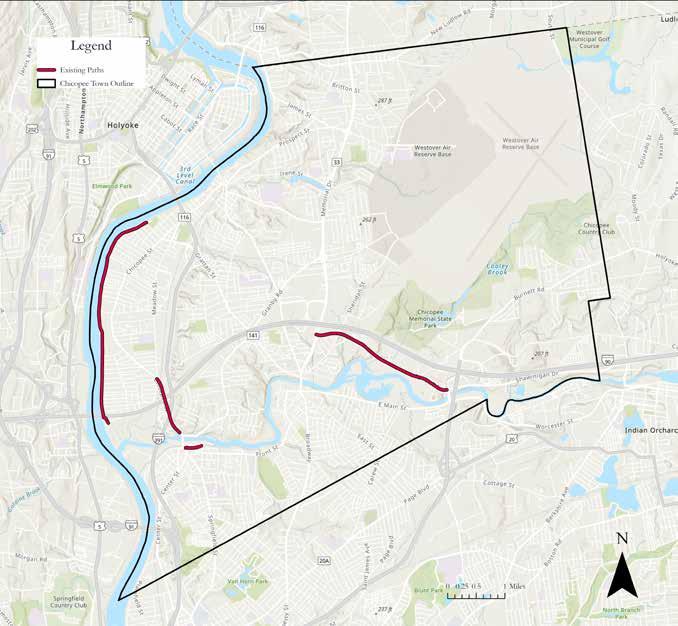
The City of Chicopee is working to expand their existing network of walkable, bikeable paths.The hope is to connect the Connecticut Riverwalk and Bikeway, and the Chicopee Canal and RiverWalk to a green and complete street network extending throughout the city. As it stands, Chicopee’s existing multi-modal paths are fragmented and disconnected; most residents use the Connecticut Riverwalk and Bikeway, and the Chicopee Canal and RiverWalk path for recreation, but not for transportation (Map A1)
Additionally, only 37% of Chicopee’s streets have sidewalks, and residents have expressed safety concerns over lack of buffer between the sidewalk and road (Map C2). One resident shared her preference to walk on less trafficked streets without sidewalks because they felt safer. To better serve the needs of the community, an extensive, accessible street-level network of green and complete streets needs to connect residents to soughtout destinations.


The City of Chicopee has already proposed several street-level and off-street connections that are in various stages of development (Map A2). Some are only planned, some are in the design phase, and some are already under construction. The City-proposed paths create a loop within Chicopee, but also extend outside of city limits, creating interregional connections with Springfield and South Hadley
In this document, the paths proposed by the City but not yet under construction are analyzed using the same criteria the Conway Team uses to identify green and complete street locations. An ArcGIS model scrutinizes all roads in Chicopee based on the right-of-way width, street length, and slope of road. If streets fall within appropriate complete street parameters, the ArcGIS model then uses the viable streets to find the best path between Chicopee’s neighborhood centers and critical destinations throughout the city. Consistent with MassDOT’s Complete Street Program, the proposed streets will improve biking and walking facilities, calm traffic, and provide access to important destinations.

Human history in the Connecticut River Valley dates back thousands of years prior to the arrival of the first European colonists in New England. Storytelling and archeological evidence indicate that indigenous people were living in the Valley since the recession of the Wisconsin Glacier over 11,000 years ago. Chicopee was a significant waypoint for many indigenous groups who were traveling north-south along the Connecticut River and east-west along the Chicopee River (Sinton 2018). Several archaeological sites near the confluence of the Chicopee and Connecticut Rivers suggest that indigenous groups likely used the area of current-day Chicopee as a resting place before crossing the rivers to continue traveling. Some families may have stopped for just a few days as they traveled while others may have stayed near the mouth of the Chicopee River year-round (Jones et al. 2011). By the time Europeans began to colonize the area in the late 1600s, Chicopee had, over the course of several thousands of years, become a significant cultural area for indigenous people of the region. As is the case for all North America, indigenous groups in and around Chicopee have undergone incredible hardship through war, famine, epidemic, genocide, and continued marginalization largely induced by European settlers and the post-colonial society that persists today (National Geographic Society). Despite the hardship they have faced, many indigenous groups in the Connecticut River Valley still exist, carry on traditions, and exchange ancestral knowledge within their communities.
In the 1630s, European colonizers purchased* land from Pequot tribes living in the area and established Springfield as one of the first settlements in the Connecticut River Valley. Colonization quickly spread northward from Springfield, and Cabotville (now Chicopee Center), Chicopee Falls, and Willimansett became the three major villages near the mouth of the Chicopee River. These three villages, separated by geographic features like the terrace escarpment ridgeline, the Chicopee River, and railroad tracks west of Willimansett, increased in area and population and eventually merged to form the town of Chicopee in 1750. This pattern of development resulted in the current layout of Chicopee which, rather than having one central downtown area, has several neighborhoods and commercial centers that are stitched together with roads and bridges but that are still physically disconnected from one another.
*This terminology can be misleading since indigenous people did not conceptualize the purchase as a complete transfer of ownership of the land in the same way that the European colonists did. In this way, indigenous people did not consent to the European colonists’ authority over the landscape that persists today.

With the instatement of the Federal Highway Act in 1956, several major highways were built cutting straight through Chicopee and further separating the several neighborhoods in the city. Interstate-90, built in 1956, and Interstate-391, built in 1967, now serve as the southern and western borders for Willimansett, further isolating this neighborhood from the rest of the city. The addition of these highways and major roadways made it much more challenging for cyclists and pedestrians to safely navigate Chicopee, which was becoming more and more tailored to cars. In the late twentieth-century era of highway construction, several roads, like Memorial Drive, were also expanded to become multi-lane highways crossing through Chicopee. As these local roads became main arteries for travel through Chicopee, retail centers, grocery stores, and other resources began to congregate in the western side of the city. For residents of Chicopee with limited access to cars, especially in neighborhoods like Willimansett that are particularly isolated by the forces described above, it has become quite challenging to access many of Chicopee’s available resources.


In the 1930’s, the Federal Housing Authority (FHA) carried out a large social engineering effort by encouraging mortgage lenders and other investors to withhold investment in certain areas within cities across the United States. The neighborhoods where the FHA discouraged investment were mostly older urban neighborhoods, areas with large immigrant populations, and areas with populations of predominantly AfricanAmerican people and other people of color (Blumgart 2017). Image B1 demonstrates how redlining may have directed patterns of investment in Chicopee. A large section of Willimansett and smaller patches of Chicopee Center, Chicopee Falls and Fairview were identified as neighborhoods in Chicopee where investment would be the riskiest. The legacy of disinvestment from FHA redlining is still visible today, especially in Willimansett and Chicopee Falls. Maps B1, C1, C7, and C8 respectively show how the historically redlined neighborhoods in Chicopee today have the highest concentration of Environmental Justice populations, are the most removed from food sources, are the hottest, and have the lowest tree canopy cover. With this in mind, the Chicopee City Planning Department has made a concerted effort to reverse these patterns through a variety of strategies like Greening the Gateway Cities Program, which has significantly increased the tree canopy cover in Willimansett.


Chicopee’s tree canopy is increasing. As of 2021, 39% of the city was covered by tree canopy, a 5.5% increase from 2016 (MassGIS). This tree canopy, however, is distributed unequally throughout the city, and efforts are underway to rectify the disparities. Besides Westover Air Base where the tree canopy is greatly diminished due to extensive impermeable surfaces, Willimansett, Westover, and Chicopee Center have the lowest percentages of tree canopy cover in Chicopee at 26.8%, 37.1%, and 33.4% respectively (Appendix C). Chicopee’s historical redlining map (Image B3) shows parts of these same neighborhoods as areas of targeted disinvestment, highlighting the legacy of prejudice and racism. An analysis by the non-profit American Forests found majority Black and Brown neighborhoods, especially those with higher poverty rates, have drastically less tree coverage than the wealthiest communities (Yale Climate Connections). American Forests’ tree equity mapping tool displays this information graphically; Chicopee communities with a greater percentage of people of color have a smaller tree canopy (Image B6).The proposed network of green and complete streets that follows in this report is designed to create a more equitable network of multi-modal paths. By concentrating green and complete streets in neighborhoods that are facing social, economic, and environmental disparities, Chicopee residents are more likely to enjoy longer, healthier, and happier lives (Yale Climate Connections).


According to the Commonwealth of Massachusetts, “an Environmental Justice area is a census block that meets one of four criteria:
• Income: the annual median household income is 65 percent or less of the statewide annual median household income.
• Minorities: minorities make up 40 percent or more of the population.
• English Proficiency: 25 percent or more of households identify as speaking English less than ‘very well.’
• Minority/Income: minorities make up 25 percent or more of the population, and the annual median household income of the municipality in which the neighborhood is located does not exceed 150 percent of the statewide annual median household income.”
EJ Communities in Chicopee face disadvantages in accessing grocery stores, health services, and transportation. Sixty-five percent of Chicopee’s population lives in designated EJ Communities (mass. gov). These communities are most concentrated in the south and western parts of the city. Connecting these communities to the services they need creates greater equity across the city

The EPA’s EJ Screen tool shows Willimansett and Chicopee Falls as food deserts, where buying affordable, good-quality, fresh food is difficult. Residents of both neighborhoods need cars to access grocery stores on the other side of town, or to cross the bridge to shop in Holyoke.
Willimansett and Chicopee Falls are designated EJ areas, and access to food is crucial for good health. Food deserts have a higher incidence of obesity, increased prevalence of diabetes, and other food-related conditions, especially in children (EPA, EJ Tool). Envision Our Chicopee: 2040 highlights the importance of budgeting City money towards equitable infrastructure, and easy access to food for all Chicopee residents is an essential part of that goal.

The western section of Chicopee has the lowest percentage of households with vehicles at 85%, which is five points lower than the state average (Census, 2020). Western Chicopee is also the least connected area by road, to other parts of Chicopee.
In a car-centric community that doesn't have a robust bus route system, those without a car need other modes of transportation. Since Chicopee's infrastructure is tailored primarily to cars and since the bus routes are not frequent enough for consistent use, it can be challenging for Chicopee residents without cars to access their necessary resources throughout the city. Creating more safe and efficient travel options for people without cars will enhance equity in Chicopee by connecting more people to the resources they need.

Chicopee’s network of sidewalks is limited; 63% of the city’s streets do not have sidewalks. This lack of sidewalks is especially apparent in neighborhoods like Willimansett and Fairview.
Limited sidewalk infrastructure combined with heavy car usage leaves residents without a safe way to walk to services or to exercise. The lack of safety makes those areas more dependent on cars and limits easy access to services. Additionally, the lack of foot traffic in areas with limited sidewalks may hurt businesses and property values. A 2009 study demonstrated how walkable metropolitan areas are almost always associated with higher house values and increased business revenue; the sidewalk is where city residents most directly interact with businesses and their neighbors. Neighborhood walkability is a “key marker of neighborhood vitality.”
(Cortright, 2009)

Chicopee transportation infrastructure is highly tailored to cars, with the most heavily trafficked roads running north to south. Similarly, most bus routes run north to south, with only one route running east to west in the southern part of the city. This prevents residents with limited car access from getting to and from desirable destinations. Additionally, the bus schedule has long intervals between buses, ranging between 20 and 60 minutes (PVTA), making public transportation unreliable. The incomplete, fragmented off-street bike and walking paths do not provide useful alternatives to the public transportation network. The existing paths are isolated from one another, further limiting city-wide, multi-modal connectivity. Residents might prefer driving to work because of the lack of east/west bus routes and an infrequent bus schedule. Connecting the fragmented bike trails within Chicopee would provide an alternative mode of transportation. Multi-modal streets could run parallel to or along major arteries in the city, allowing residents to access significant locations without waiting for public transport or using a car for shorter excursions.

Chicopee topped the state list of most pedestrian fatal crashes in 2022 (Jochem, masslive.com, 2023). Accidents occur most frequently at intersections, with major roads and congested areas, specifically Chicopee Center, following close behind in accident frequency.
Residents will not feel safe walking and biking through Chicopee until the streets are safer. In a survey shared with visitors to Center Fresh Chicopee in 2024, residents noted certain streets and intersections that were difficult to navigate by car or foot because of congestion, dangerous turns, and dangerous driving. Several survey participants identified Memorial Drive and the intersection of Montgomery Street, McKinstry Avenue, and Granby Road in Aldenville, as dangerous locations for cycling, walking, and driving cars. Complete streets have been shown to slow traffic and increase pedestrian safety when adequate buffers are provided; green infrastructure that acts as a buffer will play a critical role in improving safety throughout Chicopee's streets (Portland State University, 2014).

Chicopee's surface temperatures are high and the highest temperatures coincide with the locations of impervious surfaces in Westover Air Reserve Base, a big box shopping center, and Willimansett's eastern edge. Hot temperatures present a severe risk to older or unhealthy individuals(National Institute of Health).
Climate change will exacerbate the situation over time. Areas with dense tree coverage in Chicopee correspond with cooler temperatures on the surface temperature map. Additional green infrastructure will help reduce street temperatures, especially for those walking and biking on the new complete streets.

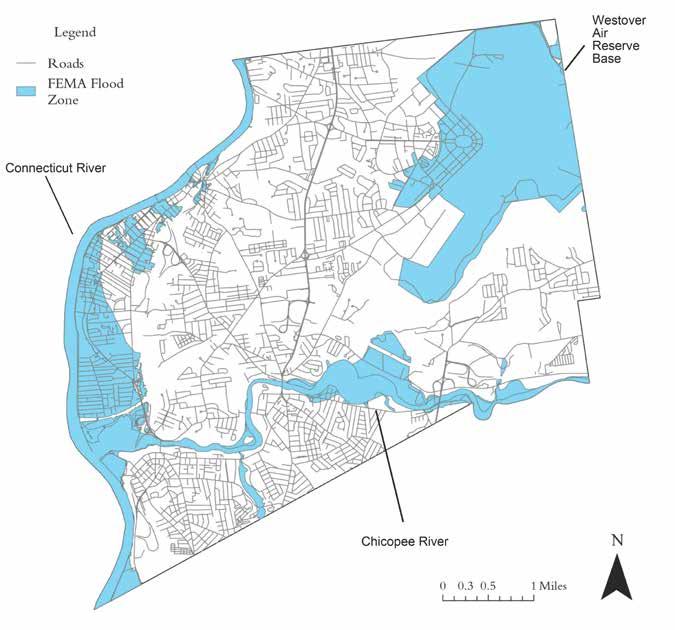
Chicopee's river borders make part of the city susceptible to flooding. The FEMA flood zones show the potential reach of flood waters from the Connecticut River, the Chicopee River, and Westover Air Reserve Base. Extreme weather events are becoming more frequent in the age of climate change. Flooding is hazardous for Chicopee as some of the city sewer and stormwater infrastructure remains combined (Envision Chicopee: 2040); heavy rain events will direct untreated sewage into surrounding waterways. Heavy rain events can also potentially destroy homes and businesses and threaten human safety

Both the Chicopee River and Connecticut River are integral to the city; the waterfronts are where people walk, kayak, and enjoy time outside. The City is working to systematically replace the aging combined sewer and stormwater system that has been polluting the Chicopee River and Connecticut River for decades. As of 2018, 75% of all CSS lines in the city have been separated (Tighe and Bond).
In an effort to reduce pressure on the remaining CSSs and reduce stormwater entering the Connecticut River, the City of Chicopee has invested in green infrastructure projects . Projects like the Upper Granby Road detention basin not only reduce the amount of stormwater entering the Connecticut River, but also recharge groundwater in the drainage area where runoff is generated. Additionally, the City has made a concerted effort to increase the tree canopy. From 2016 to 2021, iTree calculations estimate almost $40,000 were saved annually on Chicopee trees’ carbon storage and sequestration efforts (Appendix F). Continuing to invest in green infrastructure is financially smart, but also leads to a more beautiful, cool, and climate-resilient city


The Natural Heritage & Endangered Species Program (NHESP) documents rare species based on observation. The Connecticut River shoreline is protected for its migratory fish and resident aquatic species. Westover Air Reserve Base’s large contiguous grassland, where wild blue lupine thrives and attracts butterflies, is also protected. The Intact Natural Areas are locally designated areas of continuous forests and wetlands, not included in the state-identified habitats.
The Connecticut RiverWalk and Bike Path runs within the protected Connecticut River area. Continued CSO abatement efforts during Complete Street implementation will improve the health of the Chicopee and Connecticut Rivers and the health of the greater Connecticut River watershed by decreasing pollutants entering these water bodies, bettering the plant and animal communities that thrive across this region.

Chicopee’s neighborhood fragmentation continues today with Interstate 391 and the active railroad corridor dividing the city from south to north, while the Massachusetts Turnpike divides the city from east to west. The gravel pits and terrace escarpments east of the railroad corridor, which are unstable and easily erode, run south to north. The Connecticut River forms Chicopee’s western border, and the Chicopee River runs through the southern part of Chicopee.
The loose, sandy, and gravelly glaciofluvial deposits that make up the steeply sloped terrace escarpments and gravel pits are subject to sudden erosion and massive soil loss. This instability prevents east-to-west connections; best practices avoid building on sites with these geologic conditions. As a result, Willimansett has only two streets that connect to the city beyond these obstacles: McKinstry Avenue and Grattan Street. For Chicopee to be better connected, these obstacles must be navigated through new, multi-modal connections that increase cross-city connectivity while decreasing car dependency

The town center for each neighborhood establishes a starting point for connections across Chicopee. Since Willimansett is long, the analysis includes two locations: North Willimansett and Mid-Willimansett.

The criteria for establishing destinations are based on the needs of the EJ Communities; food and social services. Some destination examples include grocery stores and a food bank, cooling locations, the Boys & Girls Club, ValleyOP, etc. Interregional connections to Holyoke, South Hadley and Springfield are included in support of the broader goal to connect communities across the area.


To identify the streets that are most favorable for providing walkable and bikeable connections throughout the city, all streets in Chicopee were evaluated in a multi-step analysis process. The first part of the process was a quantitative analysis using a GIS model to determine which streets met dimensional criteria necessary to implement green and complete streets. The three major variables considered in the GIS model were slope, width of right-of-way, and total length for each street in the city. These variables were identified as the most significant factors governing the physical viability of a green and complete street that is safe and user friendly. Criteria for each of these variables (Tables 1-3) were then developed to identify which streets most closely resembled favorable, physical conditions for implementation of green and complete streets. Each street was given a score based on how they met each criteria defined in the GIS model. Lower scores represent most favorable conditions; streets with the lowest total score were identified as most favorable to accommodate green and complete street implementation.
Slopes:
For slope criteria (Table D1), lower slopes were much more favorable since hills make it challenging for people to navigate without cars and limit to whom the paths might be accessible. The criteria were drawn from ADA accessibility requirements for pedestrian infrastructure and from American Association of State Highway and Transportation Officials guidelines for development of bicycle facilities (Appendix B) with parameters for bikeable slopes. Slopes of 0 to 5% slopes are accessible for pedestrians without a handrail, 5 to 8.3% slopes are accessible for pedestrians with a handrail, and 0 to 11% slopes are considered bikeable slopes.
Right-of-Way:
For the right-of-way criteria (Table D2), streets wide enough for flexible green and complete street implementation, excluding federal highways, were considered most favorable. The criteria were defined through mock diagramming elements of a green and complete street to determine how wide a right-ofway needs to be to accommodate various possible green and complete street configurations (see Images E1 to E3 for sample green and complete street configurations). Thirty-foot-wide rights-of-way provide very little space to implement green and complete infrastructure, thirty to fifty foot rights-of-way provide space for green and complete infrastructure, fifty- to one-hundred-fifty-foot-wide rights-of-way provide ample space for numerous configurations of green and complete street infrastructure, and greater than one-hundred-fifty-foot-wide rights-of-way are mainly federal highways where green and complete streets are not feasible.
Right-Of-Way (feet) Score <30
Criteria

For street length criteria (Table D3), longer streets were favored to provide the most direct routes with the fewest turns between selected locations around Chicopee and to avoid left-hand turns, which are dangerous for cyclists (Delbert, 2021). As the crow flies, the Connecticut River on the western edge of Willimansett is approximately four miles from the eastern edge of the path loop proposed by the Chicopee Planning Department along Memorial Drive. There are few streets in Chicopee that are four miles long, so streets longer than a mile were considered the most favorable for green and complete street implementation by the GIS model.
20 30 to 50 2
to 150 0
Table D3. Street Length Criteria
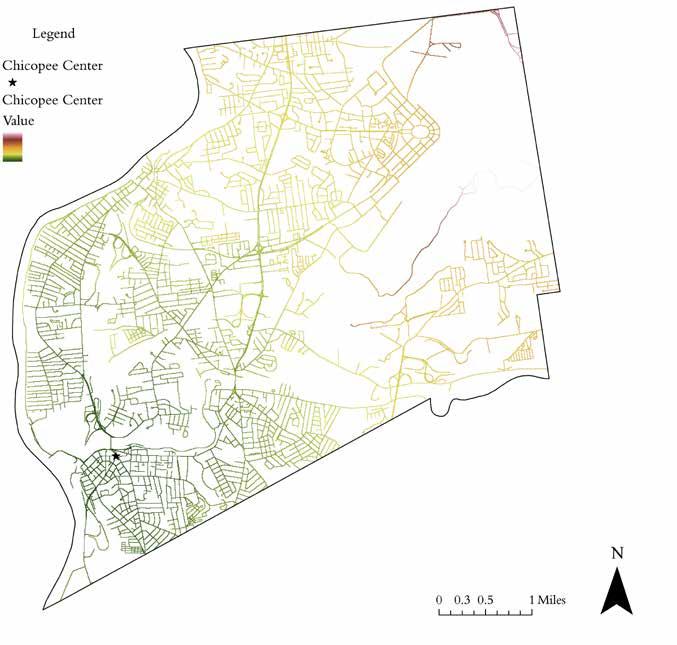
Once Chicopee streets were given a score for each variable, the scores were aggregated using the Weighted Sum tool in GIS. This tool produced a surface cost map (Map D1) in which each point along each street was given a value based on how the defined criteria for green and complete streets were met. In this map, points are represented on a spectrum of colors from green to red to signify where it is most favorable to accommodate green and complete infrastructure. Green is most favorable, and red is least favorable. This surface value maps the existing landscape for potential bike and pedestrian friendly infrastructure in Chicopee.

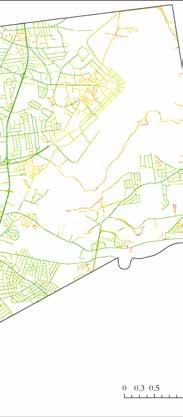

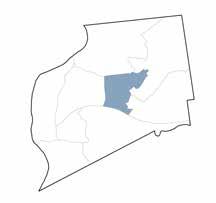
The surface cost map is irrespective of any particular point in Chicopee; the cells on this map are all assigned an innate “friction” value that signifies the level of resistance met at that point based on the above criteria. With the surface value map, separate cost distance maps can then be generated with respect to specific starting points in Chicopee using the Cost Distance tool in GIS. The cost distance maps shown below (Maps D2 to D11) display how much accumulated cost, or resistance, is met when traveling from each neighborhood center to all other cells on the surface value map. In these maps, the color gradient signifies the least accumulated cost, or resistance, in green and the most in red. The cost distance map for North Willimansett, for example, shows streets closest to the neighborhood center in green since there is little accumulated cost to reach these points while the streets across the river on the opposite side of the city in Chicopee Falls are colored red since there is a high accumulated cost to reach these streets from North Willimansett. As paths radiate farther and farther from the neighborhood centers, they accumulate more and more cost. However, the model is still prioritizing longer streets as intended.

Highest Cost
Least Cost




Highest Cost Least Cost


Highest Cost Least Cost




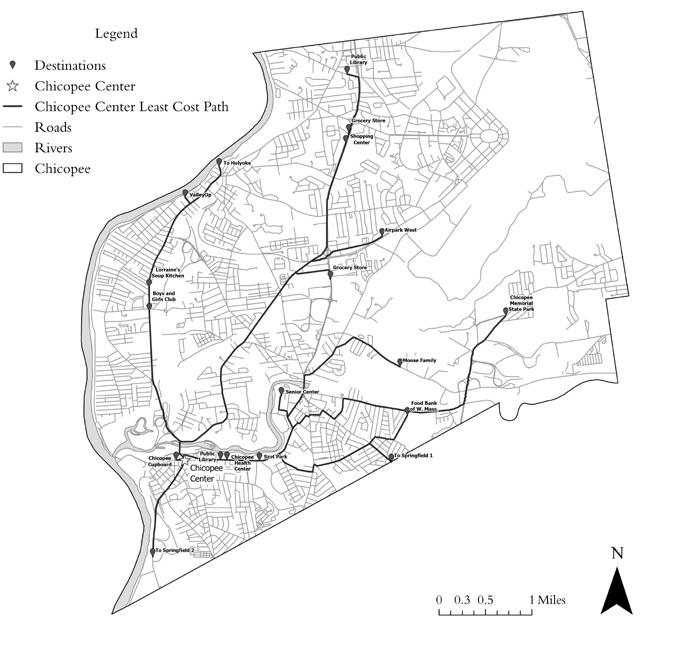
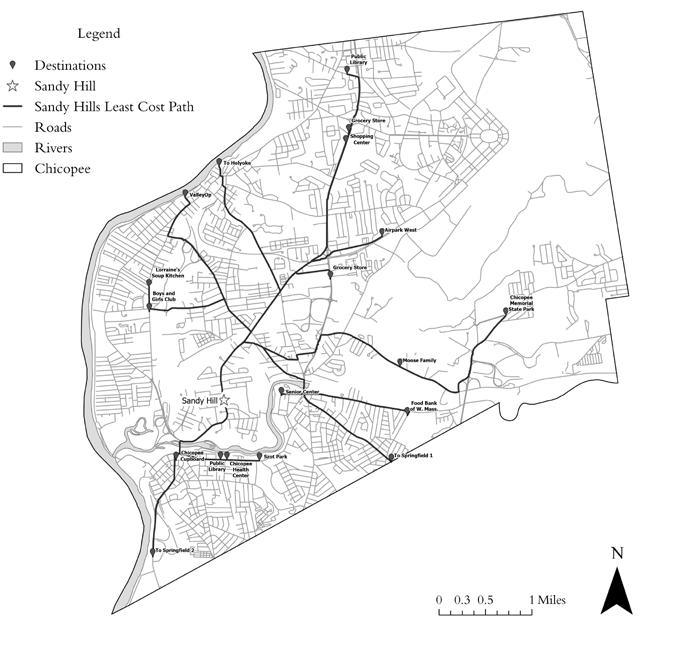
The cost distance maps were then used with the Least Cost Path tool in GIS to identify the paths of least resistance (Maps D12 to D21), or lowest cost, from the neighborhood centers (Map C14) to a selected group of destinations (Map C15) around Chicopee. The selected destinations in this portion of the analysis reflect the city’s goal to generate equitable street-level connectivity both inter-regionally and within Chicopee with green and complete infrastructure. Table 4 outlines the selected destinations and the rationale for including each of them in the model. By identifying the least cost paths between each neighborhood center and the destinations listed below, the recommended green and complete street paths (Map D25) will connect vulnerable and Environmental Justice residents of Chicopee with important resource centers and services. By intentionally considering the relationship between destinations and vulnerable populations in Chicopee, this GIS analysis builds equity into the decision-making process for identifying suitable streets for green and complete street implementation. This aims to provide safer and more efficient travel options for people without consistent access to a car.




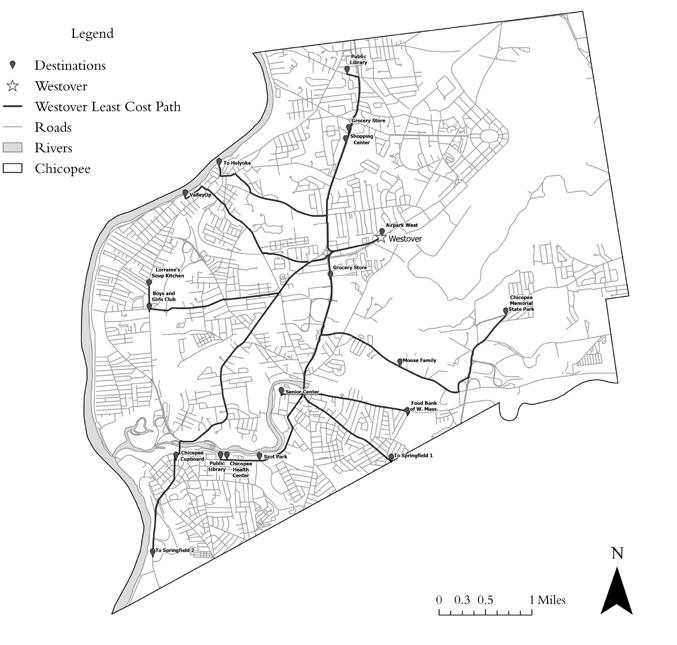

Destinations
Public Library (Chicopee Center)
Public Library (Fairview)
Senior Center @ RiverMills Center
Chicopee Health Center
Boys and Girls Club
Valley Opportunity Council
Food Bank of Western Massachusetts
Chicopee Cupboard
Lorraine’s Soup Kitchen
Moose Family Center
Szot Park
Chicopee Memorial State Park
N. Memorial Drive Shopping Center
S. Memorial Drive Shopping Center
Westover Industrial Park
Willimansett Bridge
Springfield Connections
Rationale
These civic spaces serve as public heating and cooling centers and provide other community resources.
This federally funded non-profit community health center provides healthcare with sliding scale payment options.
This community resource center provides drop-in programs, licensed child care programs, teen programs, summer fun club, youth of the year, and athletic programs to children and families.
This regional resource center provides energy assistance, food and nutrition assistance, early and adult education, citizenship services, employment assistance, youth programs, housing services, and other services to community members of the Pioneer Valley.
These food banks and soup kitchens help food-insecure community members receive nutritional assistance.
These parks are beloved by many residents in Chicopee.
These major resource nodes have large grocery stores, retailers, and other services.
This area has a high concentration of employment options relative to the rest of Chicopee.
This is the only regional connection to Holyoke services like the farmer’s market, Amtrak station, grocery stores, etc. viable for cyclists and pedestrians.
These regional connections are points adjacent to the ends of Springfield bike paths at the Chicopee townline.
Table D4. Rationale for including each Chicopee destination in the GIS analysis.
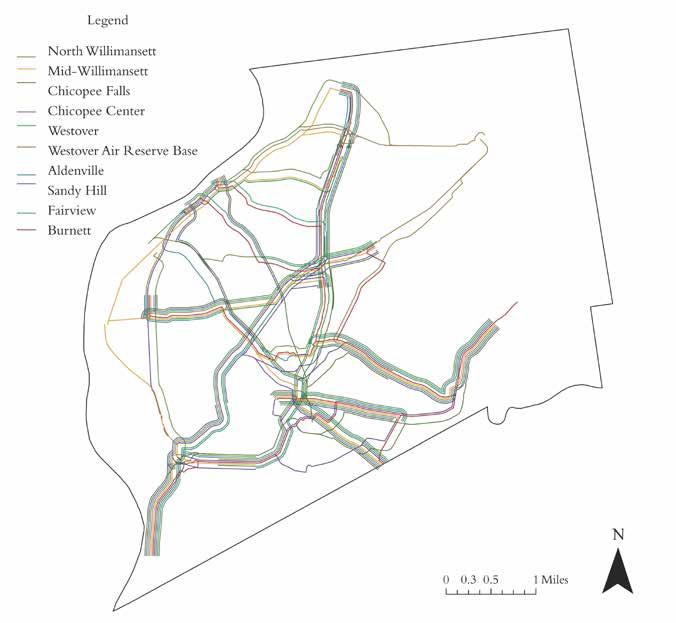
Overlaying all ten least cost paths on top of one another identified the best streets for pedestrians and cyclists to use to travel from neighborhood centers to popular destinations. If a street with multiple least cost paths in Map D22 were converted to a green and complete street, it would create safe and equitable connections for the most people in Chicopee by providing a crucial connection for the most neighborhood centers. To further prioritize streets for green and complete implementation, we examined streets that connect existing bike and pedestrian infrastructure, streets that create connections for neighborhood centers with highest concentration of EJ communities, and streets that connect Chicopee residents with surrounding cities.
Cumulative Least Cost Paths
The proposed green and complete streets have been prioritized into three tiers based on their ability to increase equitable pedestrian and cycling connections in Chicopee. All streets, including the off-road Chicopee proposed paths were run through the same ArcGIS analysis to assess their viability as green and complete streets. Neither the Connecticut RiverWalk and Bikeway, nor the Chicopee Canal and Riverwalk showed up on the model, which highlights one of the model’s shortcomings. Our established criteria prioritizes connections between critical services and destinations, but does not account for scenic beauty along the chosen path. Both Front Street (adjacent to the Chicopee Canal and Riverwalk), and Chicopee Street (which runs parallel to the Connecticut River BikeWay) have more immediate access for residents throughout the city, but are thoroughly less enjoyable to walk along. Our model cannot quantify the joy that comes from walking along the Connecticut River, or reading a book from the public library along the Chicopee Canal and Riverwalk. We acknowledge that our model is designed for street-level connections, and the absence of the Chicopee Canal and Riverwalk, and the Connecticut RiverWalk and BikeWay from our model’s output do not invalidate their importance for Chicopee at large.
Tiers of Implementation Priority
Tier 1
Tier 2
Tier 3
• Path through EJ neighborhood (Willimansett and Chicopee Center)
• Access to critical destinations
• Connection to existing multi-modal path
• Multiple least cost paths along street
• Creating a loop
• Access to critical destinations (Airpark West and the Senior Center)
• Multiple least cost paths along street
• Multiple least-cost paths
• Interregional connections
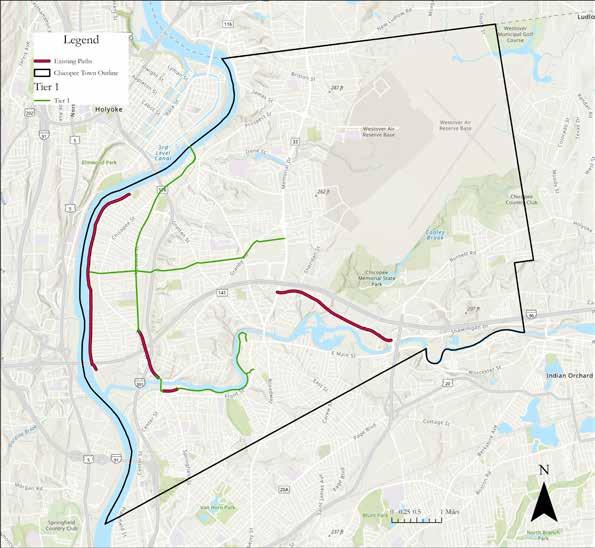
Tier 1 Criteria:
• Path through EJ neighborhood (Willimansett and Chicopee Center)
• Access to critical destinations
• Connection to existing multi-modal path
• Multiple least cost paths along street
The Tier 1 streets span the city east to west through McKinstry Street, and north to south through Meadow Street. These east to west green and complete street connect Willimansett to services on Memorial Drive and better connects Chicopee to the Connecticut Riverwalk. The north to south Meadow Street connection leads to the Willimansett Bridge to
Holyoke, better connecting Chicopee, specifically Willimansett residents, to services in Holyoke. Also in Tier 1 is the fully completed Chicopee Canal and RiverWalk. Front Street, which has many sought-out destinations like the Chicopee Public Library, the Chicopee Cupboard, and PVTA bus stops, has many least-cost paths running through it (Map D22) to connect residents to these services. The already proposed and partially completed Chicopee Canal and RiverWalk, however, runs directly parallel to Front Street and takes advantage of the canal. Prioritizing the completion of the Chicopee Canal and RiverWalk and connecting the Chicopee Canal and Riverwalk to Front Street through street outlets will create easy access to destinations along the route.

Tier 2 Criteria:
• Creating a loop
• Access to critical destinations (Airpark West and the Senior Center)
• Multiple least cost paths along street
The Tier 2 streets take advantage of any gaps in Tier 1 and create walkable and bikeable loops along the proposed green and complete streets. Included in Tier
2 is the Aldenville Rail Trail that crosses the city east to west, ending up at Airpark West, which is an employment hub for the city. The Aldenville Rail Trail is a great opportunity for a multi-modal path as it is off road and offers a respite from car traffic. Grattan Street, the southern portion of Memorial Drive, and Chicopee’s proposed Connector 1 are also designated Tier 2; all of these streets expand the web of green and complete streets in Chicopee.

Tier 3 Criteria:
• Multiple least-cost paths
• Interregional connections
The Tier 3 streets focus on interregional connections, extending the network of trails to Chicopee’s neigh-
bors. Center Street heads south to Springfield, East Main Street heads west to Ludlow, and Granby Road connects to Memorial Drive which extends north to South Hadley. The Connection to Holyoke is already in Tier 1 via Meadow Street in Willimansett.

Layering the prioritized streets from the GIS model with Chicopee’s 2021 tree canopy reveals sparse patches along the proposed street-level connections (Map D26). Tree canopy data extracted through Mass GIS shows Willimansett, Chicopee Center and Westover as the three neighborhoods where tree canopy falls under 30% (Appendix, Exhibit C). When implemented, the proposed green and complete streets running through these three neighborhoods will not only increase connectivity for residents, but also green infrastructure, like trees, in neighborhoods that need it most.
The ARC GIS Network Analysis model determines the most valuable and efficient street connections. However, it has limitations: the model does not have the data to accurately represent what is happening at ground level. The next step in identifying the streets to prioritize for intervention is ground-truthing. Google Earth can be used first to quickly and efficiently explore and document routes for obstacles and opportunities. The list of obstacles and opportunities can then be explored on foot. Using a few outputs of the model as examples (McKinstry Avenue, Grattan Road, and Meadow Street), several areas pose challenges to implementing Complete Streets.

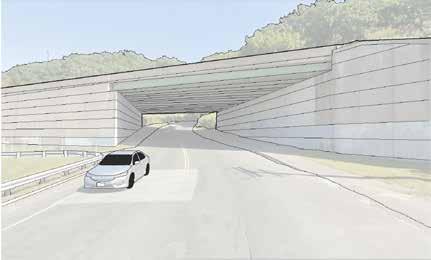


The McKinstry Avenue underpass is dark as you enter (Image D1) and exits into a blind curve with a narrow sidewalk (Image D2). The right of way at this point is technically 50 feet, but the street, sidewalk and retaining wall measure about 35 feet leaving little room to improve visibility and safety in this area.
Business buildings edge the rightof-way on McKinstry Avenue taking up air space not normally accounted for in path width and may necessitate expanding the paths into street surface for elbow room.

On Meadow Street (and many other streets in the area), a business has two driveway entrances that are double wide and close to the intersection. An area like this, with multiple curb cuts for driveways, is a safety risk for pedestrians and bicyclists because there are more points at which they might intersect with cars.
The Grattan Street overpass bridge and center median provide an opportunity to build paths down the street’s center. A center path would require buffers on both sides of the path to protect the walkers and bikers and would provide protection from the car traffic using the entrance and exit ramps for Interstate 391 (and would limit disruption of cars exiting or entering Grattan Street).

Intersections pose a consistent safety risk for pedestrians and bicyclists and can be riskier as the complexity of the intersection increases. Left turn lanes, exit and entrance ramps to highways, and streets that do not align with facing streets, all add to the already risky nature of intersections. Extra traffic control measures, such as pedestrian phases, which allows pedestrians to cross in any direction while all traffic is stopped, will be necessary for safe paths.


The intersection of McKinstry Avenue and Grattan Street creates a triangle along with Dale Street cutting through. If the section of Dale Street between McKinstry Avenue and Grattan Street were one-way (southbound), it would alleviate pressure on the three-street intersection.
Grattan Street’s center median provides a safe location for a path, but the cross-over traffic from Interstate 391 (Image D7) would need to be reconfigured to protect the bikers and walkers.


Urbanization, development, and the continual expansion of impermeable surfaces has exposed our country’s deteriorating stormwater management systems. Chicopee, burdened with an aging combined sewer system, is actively working to update its grey infrastructure through a CSO abatement plan, while also pursuing naturebased stormwater management strategies. Currently, the USDA Forest Service tool iTree estimates that Chicopee’s 2021 tree canopy provides almost $120,000 in ecosystem services (Appendix D). Green infrastructure, the set of tools that help capture, treat, and slow stormwater runoff, can help alleviate the pressure on Chicopee’s municipal infrastructure, while simultaenously improving neighborhood livability and health outcomes (NRDC, 2022).
Bioretention is an umbrella term referring to stormwater management practices that capture and filter water before entering waterways. Examples include green roofs, rain gardens, bioswales, and tree boxes.
Structural Soil is an engineered soil made of soil and stone. The soil remains uncompacted as it fills the voids between angular crushed stones. This is a great tool for heavily trafficked, urban environments (Bassuk et al., 2015).
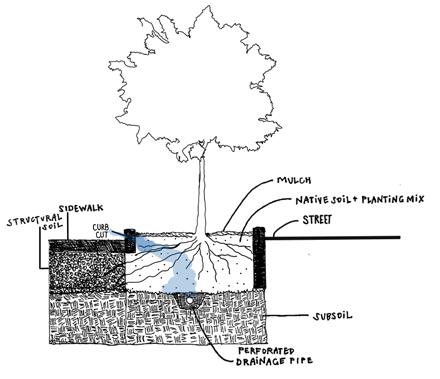
Tree box filters infiltrate and clean water through layers of mulch, soil, and vegetation. Depending on the site conditions, the boxes can have open or closed bottoms. Water on the sidewalk is directed to the tree box through a curb cut, and is absorbed and filtered through the soil and roots. Any overflow is directed towards the storm and sewer system via perforated pipe. They are useful in urban settings where impervious surfaces are abundant and space is limited (PVPC).
Design Considerations: Due to the little space in which trees are given to grow, the most common challenge is that tree roots may disrupt sidewalks, curbs and gutters, and underground utilities. In Image E1, the tree is blocked off from interrupting the road, and structural soil under the sidwalk allows roots to spread.
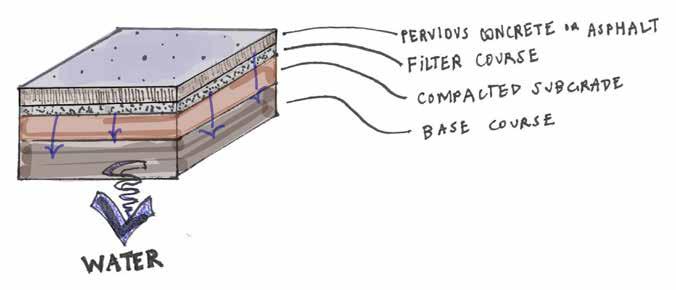
Permeable pavements, made of pervious concrete, porous asphalt, or interlocking permeable pavers, provide durable surfaces that support the weight and forces applied by vehicular traffic. These surfaces do not treat water using vegetation and soils like other green infrastructure methods, but instead infiltrate and store rainfall to avoid overwhelming overflow systems (EPA, 2021).

Bioswales, while often used synonymously with rain gardens, are used to capture, treat and move stormwater along linear, vegetated ditches. Bioswale vegetation, like urban vegetation, must be hardy to salt, snow piles, and high sediment flows. It can withstand periodic inundation and damp soils, but also periods of dry soils or even drought. Guidance varies for bioswale construction, and siting requirements are flexible. Generally, slopes should not exceed 5%, and any swales exceeding 5% could benefit from check dams to further slow water and maximize retention (NACTO).
Rain gardens, also known as bioretention cells, are sunken areas in the ground usually planted with native vegetation to slow and filter both runoff and pollutants. By intercepting and filtering water before it reaches stormwater pipes, peak discharges are reduced, and groundwater recharge is increased (Penn State, 2022).

Chicopee residents can direct runoff from driveways, roofs, and downspouts to rain gardens bursting with life. Per MassGov recommendations, the gardens should be at least 10 feet away from home foundations, and 50 feet away from septic systems or wells. Image E4 shows water being directed from a downspout extension. By redirecting water towards green infrastructure systems that filter runoff, excess water is treated on site, and the burden on storm drains and local waterways is significantly reduced (MassGov).
Rain gardens have the advantage of flexibility; they can vary in size and location, and can be either infiltration or flow-through systems. Rain gardens are not suitable for areas that have heavy clay soils and/ or a high water table, as water will continue to pool instead of filtering through the soil. Given the right site conditions, they are great options for street frontage, residential properties, parking lots, and road medians (MassGov).
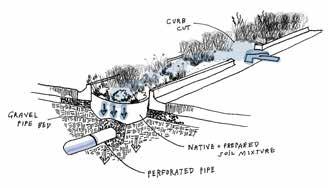
Curb cuts like those shown in image E5 and E7 direct stormwater into green infrastructure facilities like bioswales, rain gardens, and tree boxes. There are a variety of curb cut designs that can be employed, and factors like city budgets and site conditions can inform the right choice for any given area.


Image E6 shows a rain garden, or bioswale if the vegetated trench is sloped, collecting stormwater runoff in a parking lot. This is a really useful way to build habitat in an otherwise inhospitable environment, and divert pollution from cars, like hydrocarbons, from entering storm systems.
Incorporating natural features into the built environment has documented public health benefits; there is a positive relationship between green space and well-being. Constructing a vegetated trench in a sea of impervious surfaces is a gesture of hope, a nod towards a healthier future for all.
Similar to a residential rain garden, rain gardens along the public right-of-way can be an attractive landscape feature. These basins can be planted with a variety of hardy, colorful, pollinator-loving native plants while effectively managing stormwater. However, getting residents to deviate from the societal norms surrounding front lawns and accept something new takes work, and “cues to care” that indicate routine maintenance can be utilized to increase acceptance and recognizability (Nassauer 1995).
Transforming Chicopee’s rightof-way, and linking small pockets of habitat throughout the city is a smart investment for a more climate resilient future.
Green and complete street principles address many of the social and environmental challenges Chicopee currently faces. Stormwater management, heat island mitigation, and air purification are just some of the environmental benefits green infrastructure can provide. Stormwater management, specifically mitigating CSO events, has been an ongoing issue for the City; Chicopee has been under an administrative order from the EPA since 1995 to reduce its CSO discharges. And although Chicopee has drastically reduced the volume of waste entering CSO’s (75% volume reduction as of 2018), roughly a quarter of the combined sewer and stormwater lines are still active. In the era of climate change, where flooding events are more frequent and severe, it is important to slow and absorb as much water as possible to reduce the number of CSO events, and thus reduce the amount of untreated sewage that heads directly into adjacent water bodies.
In 2015, the New York City Department of Environmental Protection (DEP) released a report detailing the performance of three, neighborhoodscale green infrastructure projects in the NYC neighborhoods of Bushwick, East New York, and Edenwald. Within these defined areas, 70 bioswales were built to collect and absorb stormwater in the hopes of mitigating CSO events. The neighborhoods were chosen based on their utility infrastructure: all
three neighborhoods had combined sewer and stormwater pipes. Flow meters were installed to measure the amount of stormwater before and after the construction of the bioswales. It’s important to note that construction of the bioswales did not take up any additional parking; all of the gardens were built into the existing sidewalk.
The findings showed that the bioswales had a significant impact on the sewer infrastructure (NYC.gov).
Post-bioswale construction, stormwater entering the sewers decreased by more than 20%. The report also found that the inclusion of a stone gabion, which hydraulically connects the surface of the bioswale to the storage layer beneath the soil, helped to speed the absorption of stormwater. The use of a stone gabion has now been added to the standard design for all bioswales in New York City. Across all three neighborhoods, the bioswales managed the first inch of stormwater that fell on over 14% of the impervious area, which surpassed the goal of capturing the first inch that fell on 10% of the impervious area (Lloyd 2015).
Expanding Chicopee’s green infrastructure will not only beautify the city, but likely lessen the burden on the sewer and stormwater system.
Portland State University faculty conducted research evaluating U.S. protected bicycle lanes in terms of their use, perception, benefits, and impacts (Monsere et al. 2014). The research studied protected bicycle lanes in five U.S. cities: Austin, TX, Chicago, IL, Portland, OR, San Francisco, CA, and Washington, DC. The researchers used video of car and bicycle behavior to capture actual behavior and surveys of bicyclists and nearby residents to capture perceptions.
For the Chicopee Connectivity project, the width of the street right-of-way determines how much room is available to buffer the bicyclists and walkers from the car lanes. Portland State University’s research focused on a few questions directly concerned with buffers: 1. Do protected lanes improve users’ perceptions of safety?, and 2. How well do the design features of the facilities work?
In short, the research found that buffer designs influence cyclists’ comfort level. The study assessed bicyclists’ experiences of different buffer designs based on actual facilities where they rode, and some hypothetical designs presented in diagrams. One clear takeaway is that designs of protected lanes should seek to provide as much protection as possible to increase cyclists’ comfort.
Designs with more physical separation had the highest scores. Buffers with vertical objects, like trees,
had higher comfort levels than buffers created only with paint.
Flex post buffers received very high ratings even though they provide little actual physical protection.
Any type of buffer shows a considerable increase in self-reported comfort levels over an unprotected striped bike lane.
Data consistently showed that the protected facilities improved the perception of safety for bicyclists but their impacts on driving and walking were more varied.
Nearly all surveyed bicyclists (96%) and 79% of residents stated that the protected lane increased the safety of bicycling on the street. These strong perceptions of improved safety did not vary substantially between the cities, despite the different designs used.
Drivers’ perceptions of their own safety while driving were more varied. Overall, 37% thought the safety of driving had increased; 30% thought there had been no change; 26% thought safety decreased; and 7% had no opinion.
Perceptions of the safety of the walking environment after the installation of the protected lanes were also varied. Overall, 33% thought safety increased; 48% thought there had been no change; 13% thought safety decreased; and 6% had no opinion.
The four sections below demonstrate ways to incorporate green infrastructure into a right-of-way that accommodates multi-modal traffic. Greater road widths allow for more creative, impactful design; more of the road is devoted to non-vehicular traffic, and more stormwater is captured and treated on site. Together, green and complete street principles work together to shade and buffer pedestrians and cyclists from noise and emissions, while creating healthier, safer, more vibrant communities

A multi-modal pedestrian and cycling lane is used in this 30-foot right-of-way, and a narrow 2-foot-wide bioswale captures water while separating cars from walkers and bikers.
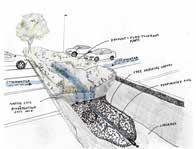


Traffic is buffered using a 3-foot-wide bioswale, and a 4-foot-wide tree box. Water is directed from the road and sidewalk into the green infrastructure structure and is filtered through vegetation and soil. Heavy rain events will saturate the tree box, and some water will filter through to the stormwater system.


A 50-foot right-of-way provides more room for pedestrians and cyclists, and many green infrastructure tools can be implemented on a street this wide. In this design, a spacious path runs down the center of the road, and is buffered from traffic by rain gardens that store excess road run-off, and slowly treat the water before it enters the stormwater system.


This 100-foot right-of-way is flanked by sidewalks to allow pedestrians to access shops and businesses along the road, while four lanes of traffic are buffered by green infrastructure. An expansive median built for walkers and cyclists is shaded by mature trees and built with permeable pavement, capturing and treating any water that falls on its surface.
Blumgart, Jake. “How Redlining Segregated Philadelphia.” WHYY, WHYY, 10 Dec. 2017, whyy.org/seg ments/redlining-segregated-philadelphia/.
Boys & Girls Club Chicopee. Bgcchicopee.Org, bgcchicopee.org/. Accessed 19 Mar. 2024.
CEOs for Cities. “Walking the Walk: How Walkability Raises Home Values In ...” National Association of City Transportation Officials, Aug. 2009, nacto.org/docs/usdg/walking_the_walk_cortright.pdf.
Chaplin, Diana. “Stormwater, Sewage & Water Quality: A Status Update.” Connecticut River Conservancy, 6 Mar. 2024, www.ctriver.org/stormwater-cso/#:~:text=Since%202006%2C%20CSO%20volume%20 has,schedule%20is%20completed%20in%202050.
Delbert, Caroline. “No More Left Turns: Why Science Says We Should Eliminate Them.” Popular Mechanics, 14 June 2021, www.popularmechanics.com/science/a36620755/eliminate-left-turns/.
Denchak, Melissa. “Green Infrastructure: How to Manage Water in a Sustainable Way.” Be a Force for the Future, 25 July 2022, www.nrdc.org/stories/green-infrastructure-how-manage-water-sustainable-way.
EPA. “EPA’s Environmental Justice Screening and Mapping Tool.” EPA, Environmental Protection Agency, ejscreen.epa.gov/mapper/. Accessed 19 Mar. 2024.
Jarrett, Albert. “Rain Gardens (Bioretention Cells) - A Stormwater BMP.” Penn State Extension, 24 Aug. 2022, extension.psu.edu/rain-gardens-bioretention-cells-a-stormwater-bmp.
Jeihani, Mansoureh, et al. Urban Mobility & Equity Center, Baltimore, MD, 2022, Equitable Complete Streets: Data and Methods for Optimal Design Implementation.
Jochem, Greta. “Chicopee Topped State List of Most Pedestrian Fatal Crashes Last Year. What Is It Doing to Fix That?” Masslive, 1 Oct. 2023, www.masslive.com/news/2023/10/chicopee-topped-state-list-of-mostpedestrian-fatal-crashes-last-year-what-is-it-doing-to-fix-that.html.
Jones, Brian, et al. Archeological Services at The University of Massachusetts Amherst, Amherst, MA, 2011, The Indian Crossing Site in Chicopee, Massachusetts.
Massachusetts Office of Coastal Zone Management. Stormwater Solutions for Homeowners Fact Sheet: Rain Gardens, CZM, Boston, MA, 2022.
MassGIS (Bureau of Geographic Information), Commonwealth of Massachusetts EOTSS. MassMapper, maps.massgis.digital.mass.gov/MassMapper/MassMapper.html. Accessed 19 Mar. 2024.
MassGIS (Bureau of Geographic Information). “MassGIS Data: Massgis-Massdot Roads.” Mass.Gov, www. mass.gov/info-details/massgis-data-massgis-massdot-roads. Accessed 19 Mar. 2024.
National Geographic Society. “New England Native American Groups.” National Geographic: Education, 19 Oct. 2023, education.nationalgeographic.org/resource/new-england-native-american-groups/.
Newman, Peter, et al. “Resilient cities: Responding to Peak Oil and Climate Change.” Australian Planner, vol. 46, no. 1, Jan. 2009, pp. 59–59, https://doi.org/10.1080/07293682.2009.9995295.
Nuccitelli, Dana. “The Little-Known Physical and Mental Health Benefits of Urban Trees “ Yale Climate Connections.” Yale Climate Connections, 10 Mar. 2023, yaleclimateconnections.org/2023/02/ the-little-known-physical-and-mental-health-benefits-of-urban-trees.
Pouliot, Lee, et al. Envision Our Chicopee: 2040, envisionourchicopee2040.com/. Accessed 19 Mar. 2024. Strava, www.strava.com/. Accessed 19 Mar. 2024.
Tighe & Bond. “City of Chicopee’s Interactive Geographic Information System.” Chicopee, Ma Web Gis, hosting.tighebond.com/chicopeema_public/. Accessed 19 Jan. 2024.
“Transportation 2040 Plan.” City of Vancouver, 31 Oct. 2012, vancouver.ca/files/cov/transportation2040-plan.pdf.
Urban Horticulture Institute. CU-Structural Soil: A Comprehensive Guide, 2015.
U.S. Fish & Wildlife Service Northeast Region. “Mission Elfin.” Medium, Conserving the Nature of the Northeast, 25 July 2019, medium.com/usfishandwildlifeservicenortheast/mission-elfin-6c7bf5aa6e69.
University of Richmond. “Holyoke Chicopee, MA.” Mapping Inequality: Redlining In New Deal America, 1 Mar. 2024, dsl.richmond.edu/panorama/redlining/data/MA-HolyokeChicopee.
USDA Natural Resources Conservation Service. Web Soil Survey, websoilsurvey.nrcs.usda.gov/app/ WebSoilSurvey.aspx. Accessed 19 Mar. 2024.
USDOT. “Means of Transportation to Work.” Geospatial at the Bureau of Transportation Statistics, geodata. bts.gov/datasets/usdot::means-of-transportation-to-work/about. Accessed 19 Mar. 2024.
ValleyOpp. “About Valley Opportunity Council.” Valley Opportunity Council, www.valleyopp.com/about. Accessed 19 Mar. 2024.
Zehngebot, Corey, and Richard Peiser. “Complete Streets Come of Age.” American Planning Association, May 2014, www.planning.org/planning/2014/may/completestreets.htm.
APPENDIX A: Network Analysis Model Diagram

APPENDIX B: Maximum Grade Lengths for Bicycles

APPENDIX C: Tree Canopy Data

APPENDIX D: Ecosystem Services Provided by Tree Canopy

APPENDIX E: Community Feedback From Farmer’s Market Tabling Event (Feb 29, 2024)
Comments
Fast cars coming off of the highway. Limited crosswalks. Small sidewalks
Too many cars and the roads are too wide.
Locations
391 exit ramps onto Center St.
Poor traffic controls and heavy vehicle congestion Chicopee St and Meadow
Avoid Memorial Drive completely by car, take Sheridan instead. People drive way too fast.
Roots and potholes on sidewalks make it difficult to walk. Memorial Drive has speeders. Red light runners. The timing of lights is out of whack.
Peds wait 5 minutes for x-ing light
Really busy, especially rush hour driving, school, morning.
Granby Rd and Montgomery are busy, BJs and FL Roberts. People don’t stay in their lane. That right turn is very difficult.
Memorial
Memorial
Memorial
Notes
391 exit ramps onto Center St. Near Patrick Bowie Elem.
Intersection Granby and Montgomery
The hill on McKinstry is steep with no room for biking. McKinstry curve
Double rotary planned
Granby Rd sidewalks - there’s no space and no buffers. Would rather walk on side streets with no sidewalks.
Granby Rd. no sidewalks
Granby/Montgomery intersection is too busy. Intersection Granby and Montgomery Double rotary plan
Stretch of Burnett Rd without a bike lane. Short, but it narrows down to nothing.
Crowded with cars, the intersection light is short. Have to walk bikes across bridge
W. Burnett Rd. before New Lombard Rd.
Deady Memorial Bridge No Sidewalks right near the bridge
Feels physically unsafe in this area.
Bad intersection at Chicopee and Meadow. No lights on Chicopee St so people just fly down.
Willimansett Bridge
N. Willimansett on Chicopee St
Chicopee St and Meadow Intersection
Underpass is dark and has no visibility. It’s a dip. Chicopee St
Buckly too narrow and no sidewalks
Buckly Road
Granby Rd has no sidewalks after the bridge. West Granby Road
McKinstry Dale and Grattan is a weird intersection. Small length between stop lights. Traffic has increased so much.
Front St intersection crosswalks are long. Most traffic goes to the left. People take left on the red arrow.
Sidewalks in disrepair. All of Fairview is problematic. Memorial Drive is hard to cross. Traffic is a nightmare.
People walking around Chicopee Center to get to Summer Farmer’s Market almost get hit walking over the bridge to Chicopee St.
Can’t get from Sandy Hill to CT Riverwalk safely because of a big intersection on Chicopee St under highways. Not enough sidewalks.
McKinstry, Dale, Grattan Intersection
Front St and Grove St.
Fairview and James
Springfield St Bridge not safe for walking.
Chicopee St and entrance to I-91
APPENDIX F: Map Data Sources
Source Data/Resources
Map Layer
NOAA.gov LiDAR Elevation
MassDot.gov Road Inventory Row Width
Row Length
Sidewalks
Census.gov Census 2020 EJ Areas
Households with Vehicles
GISGeography.com LandSat Imagery
YouTube.com
Estimating Land Surface Temperature LandSat 8
Surface Temperature
Surface Temperature
Google Earth Map Locations Obstacles
Mass.gov Mass Mapper
Impervious Surfaces
Tree Coverage
FEMA Flood Zones
Priority Habitat
Mass.gov Impact Accidents
iTreetools.org iTree Canopy and Landscape Tree Coverage Benefits and Equity
EPA.gov EJ Screening Tool
Chicopee Planning Department GIS Manager
Food Deserts
Bike Paths
Bus Routes
Town Centers
Important Destination
Neighborhood Boundaries
Combined Sewer Systems
The City of Chicopee, in cooperation with residents, officials, and stakeholders, has designated community connectivity through green complete streets as a critical component of its first ever city-wide plan. In support of this effort, this report analyzes Chicopee streets to help identify which streets would be most suitable for connecting residents to a group of significant destinations around the city. Converting the streets identified through this multi-part analysis into green and complete streets will equitably enhance connectivity for cyclists and pedestrians in Chicopee, reduce the load on the city’s stormwater systems as severe storms become more frequent, and support the city’s longterm goal of reducing reliance on cars.
The Conway School is the only institution of its kind in North America. Its focus is sustainable landscape planning and design and its graduates are awarded a Master of Science in Ecological Design degree. Each year, students from diverse backgrounds are immersed in a range of real-world design and planning projects, ranging from sites to cities to regions.
