15 minute read
Active and passive-source underground seismic data acquisition


T.-J. Hupe2*, D. Draganov3, and D. Orlowsky1 demonstrate that PSI can be used to produce virtual-source underground seismic surveys resembling an active-source seismic survey.
Advertisement
Abstract As part of the European research project Seismic Imaging Techniques for Mineral Exploration (SIT4ME), in-mine seismic active-source and continuous noise measurements were performed within an underground mine gallery of a former radioactive waste repository – the Asse II salt mine (Lower Saxony, Germany) to investigate its geological conditions. Inspired by recent underground active-seismic surveys in the Cote Blanche salt mine and former In-seam seismic surveys in the German hard-coal district of the Ruhr area, we apply conventional exploration and processing methods to an image of the subsurface. Among others, these include data sorting, bandpass filtering, normal moveout correction, static correction and depth (distance) conversion. To process the passive seismic data, we perform an illumination diagnosis for the retrieval of body-wave arrivals and apply passive-source seismic interferometry by cross-correlation (PSICC) on noise data dominated by S-waves. We show that active-source seismic measurements can be used from underground mine galleries for the identification of geological structures. Furthermore, we demonstrate that PSICC can be used to produce virtual-source underground seismic surveys resembling an active-source seismic survey.
Introduction In recent years, a growing demand for resources and the challenges of a global pandemic, supply-chain difficulties, and the accelerated transition to renewable energies require the application of affordable, non-destructive geophysical techniques to allow sustainable mining exploration. However, due to its complexity with respect to staff safety, equipment requirements, timing and planning, the demand for these technologies was, until today, rather low. This is likely to change with altering industry needs and challenges. Therefore, high-resolution underground active- and passive-source seismic surveys may be good alternatives to expensive conventional large-scaled active-source seismic surveys from the surface to enhance geological models of the subsurface or support drilling procedures. While underground reflection seismic imaging in the form of In-Seam Seismic (e.g., Dresen & Rüter, 1994; Schott & Waclawik, 2015), Horizontal Seismic Profiling (HSP) (e.g., Bohlen et al., 2003; Dickmann, 2005), or conventional reflection seismic (e.g., Orlowsky et al., 2018) are common methods for the identification of geological structures from underground mines and tunnels, the utilization of passive-source seismic interferometry (PSI) is rather unknown for use in underground mines. To date only Olivier (2015) approached the application of PSI in an underground mine with respect to microseismic monitoring to improve mine safety. Despite many applications from the surface, such as seismic imaging via cross-correlation (e.g., Draganov & Ruigrok, 2014; Chamarczuk et al., 2018) and auto-correlation (Polychronopoulou et al., 2020), no current study targets seismic imaging of the subsurface from a mine gallery. In this context, we carried out both an active- and passive-source seismic survey in an abandoned gallery of a former German salt mine to investigate the suitability of both methods with respect to underground reflection seismic imaging.
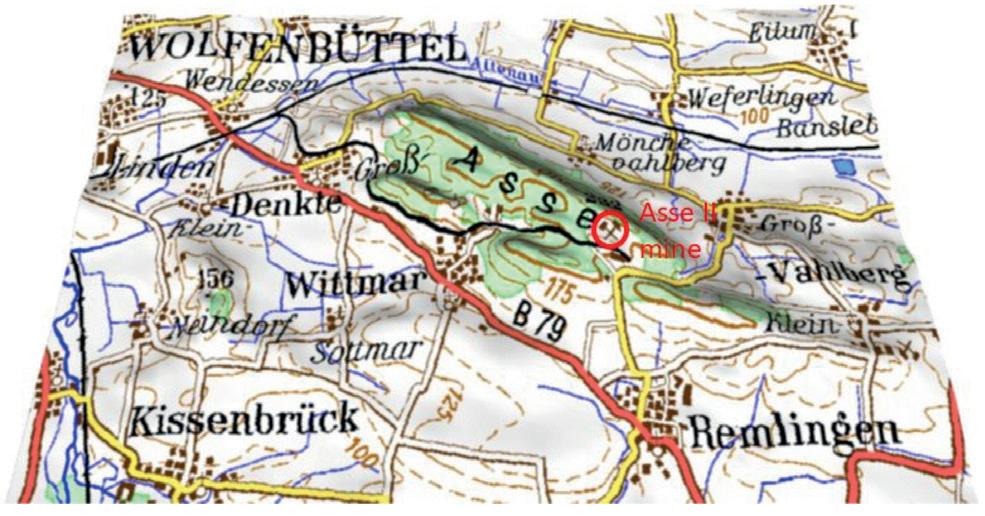
Test site Between October 22 and November 12, 2019, we carried out an active- and passive-source seismic survey in the former salt mine and radioactive waste repository – the Asse II mine. The mine is located between the villages Remlingen, Groß Denkte and Groß Wahlberg approximately 70 km south-east of Hanover (Figure 1).
The mine is part of the western Subhercynian Basin and positioned at the western end of the NW-SE trending Asse-Jerxheim salt structure. The Asse-Jerxheim salt structure is built up by anticlinal-uplifted Late Permian Zechstein evaporites and Triassic sediments which were tectonically deformed to a salt wedge. At the south-western flank of the mine the salt wedge
Figure 1 Location of the Asse II mine site after Szymaniak & Schäfer (2002).
1 DMT GmbH & Co. KG | 2 Ruhr-University of Bochum | 3 Delft University of Technology * Corresponding author, E-mail: tim.hupe@rub.de DOI: 10.3997/1365-2397.fb2022066
is joined to the evaporites of the Triassic Upper Buntsandstein (Pollok, 2018).
Geometrical layout Both seismic measurements were performed in a 140m-long abandoned gallery section of the Asse II mine. The geometrical layout corresponds to a linear distribution of 35 vertical, 2.5-m-deep receiver holes with a spacing of 4 m. For data acquisition, three-component receiver probes, connected to and powered by DMT’s Summit X-one equipment, were assembled inside the drilled holes according to the geometry shown in Figure 2. Both vertical hammer blows at the gallery floor next to every receiver and horizontal hammer blows at the opposing side-wall were carried out to generate seismic signals for the active-source acquisition. The recording time was set to 500 ms with a sample rate of 0.5 ms. The blows were repeated four times at each source position, and their recordings stacked to increase the signal-tonoise ratio. Figure 2 displays schematically a 3D close-up of the measuring layout implemented in the gallery section of the Asse II mine. Receiver positions including the seismic receivers are illustrated by cylinders. The orientation of the receivers in the receiver holes is indicated by colour-coded arrows. Source positions next to, in between, and at the opposing gallery sidewall of the receivers are shown with blue stars.
On completion of the active-source measurement, the three-component receivers remained in the boreholes and recorded a total of 156 h of continuous ambient-noise data. The data were stored in 60 s segments with a sample rate of 1 ms. For further processing and evaluation, we selected 24 h of coherent data including the X-, Y-, and Z-component data of all 35 receivers combined to one noise panel of 105 channels.
Methods After active- and passive-source data acquisition, we process each set differently to obtain optimal seismic imaging.
Active-source seismic data processing We process the active-source seismic data following a hybrid processing flow inspired by the principles of an in-mine reflection seismic survey carried out by Orlowsky (2006) and the principle of Horizontal Seismic Profiling introduced by Dickmann (2014). Both techniques make use of seismic imaging based on the evaluation of elastic body waves propagating through the ground and being reflected at geological interfaces.
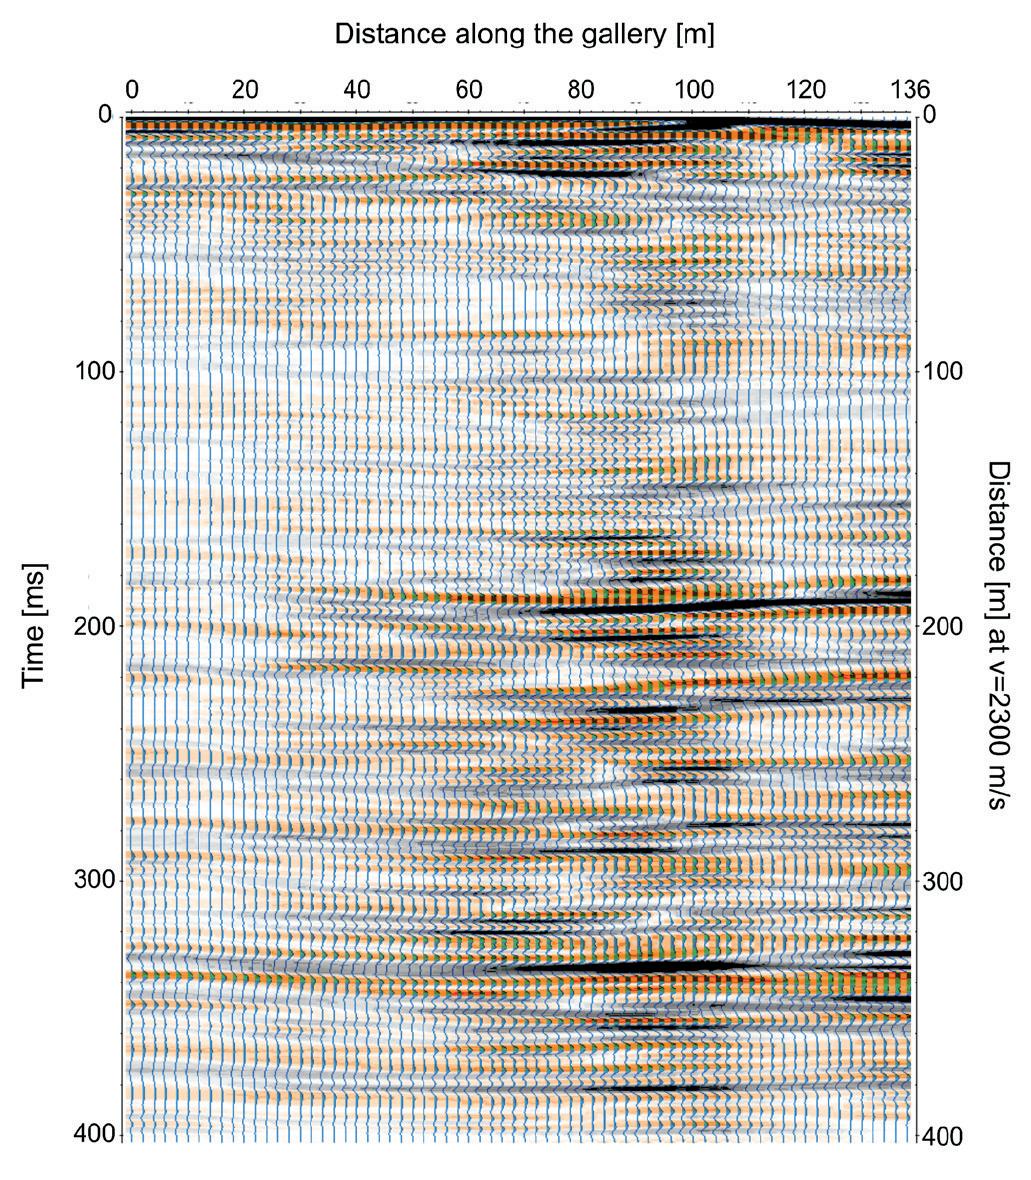
First, we import the data into the processing system ReflexW and separate the recorded data in its three receiver components – X, Y, and Z. Then, we sort the recorded data according to their source orientation (vertical/horizontal hammer blows) and perform an interactive quality control to be able to edit low-quality data. High reflection amplitudes were observed for both the vertical and horizontal hammer blows. We analyse these high amplitudes and relate them to reflected S-waves, because of their propagation velocity of around 2300 to 2500 m/s, which is in accordance with typical S-wave velocities in salt. Due to very low P-wave amplitudes at all three receiver components and strong S-wave amplitudes in the Y-component data, we concentrate further data processing on these S-waves. For both the vertical and horizontal hammer-blow data we apply a bandpass Butterworth filter between 25 to 250 Hz and suppress the seismic traces with interfered signals by muting. In addition, we suppress the direct waves along the gallery side wall (surgical muting) and amplify the signal. Then, we transform the coordinates by sorting the chosen data set into common midpoint gathers to which we subsequently apply normal move out correction followed by stacking. To compensate for spherical divergence, we amplify the signal and use a low-pass filter to average over the X- and Y-component. For a smooth result tailored to the targeted distance of 300 m, we combine neighbouring traces by a running average and shorten the seismogram to a two-way traveltime of 400 ms. Following this step, to compensate for the distance between source and receiver position for the horizontal hammer blows at the tunnel sidewall we statically correct the locations of the sources. Finally, we depth convert the seismograms of the vertical and horizontal hammer-blow data with a velocity of 2300 m/s. The velocity was estimated to be the dominant S-wave velocity after first-break evaluation. Subsequently, we combine the horizontal and the vertical seismic sections to enhance the signal-to-noise ratio and to increase the reflection amplitudes (Figure 3).
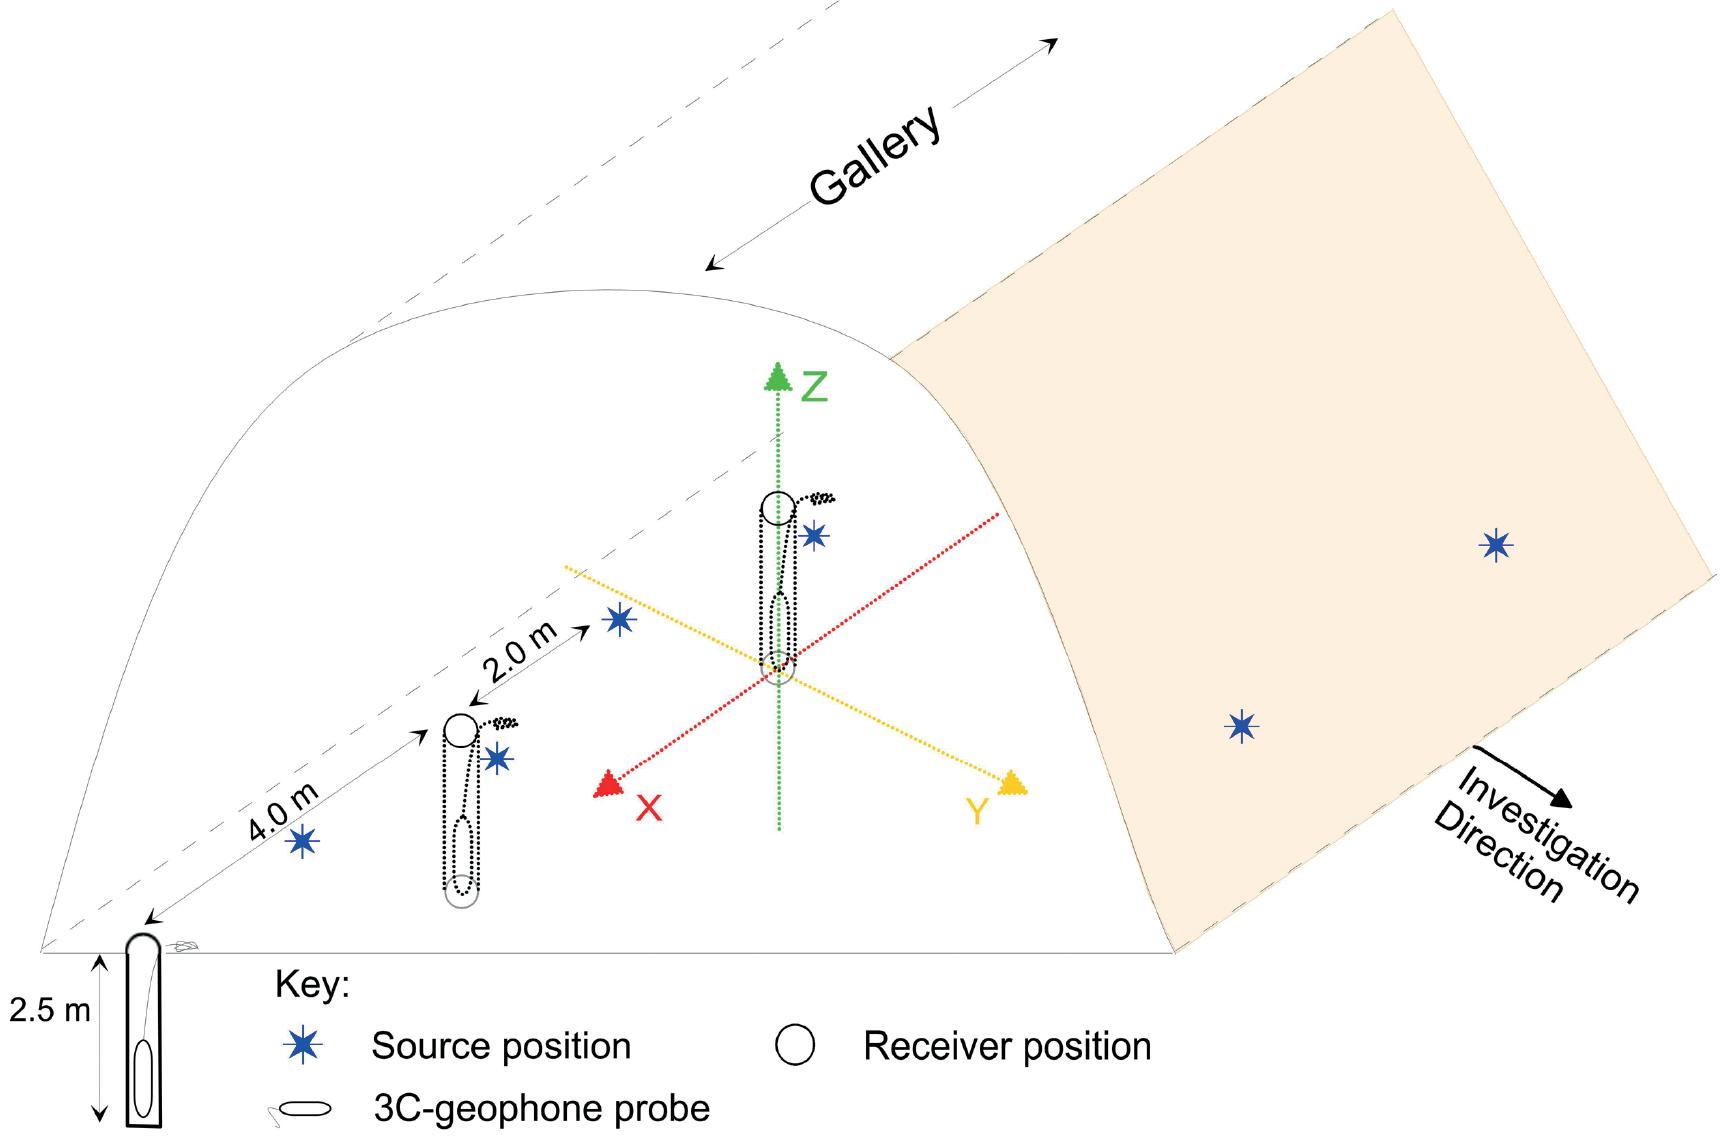
Figure 2 Close up of the geometrical layout implemented in the Asse II mine.
Figure 3 Stacked and depth-converted seismic section consisting of the combined horizontal and vertical seismic section.
Passive Seismic Interferometry After visual inspection, we proceed with using 24 h of 60-s-long noise panels of the continuous ambient-noise recordings, and separate them into their X-, Y-, and Z-components. Subsequently, we perform filter tests on pre-correlated and post-correlated data which identify the main frequency content in a low-frequency band of 15 Hz to 45 Hz. Following these filter tests, we normalize all 60-s-long noise panels and apply cross-correlation for every receiver component individually in correlation-panels of 1 s and sum them to 60-s-long correlation panels. Next, we apply illumination diagnosis according to Vidal et al. (2014) for each correlation panel to determine its dominant wave-type arrival (body or surface wave). The illumination diagnosis shows that X- and Y-direction panels are dominated by S-waves, while body-wave arrivals in the Z-direction panels are diverse and not clearly definable. We further process the pre-sorted S-wave data with PSI by cross-correlation (PSICC) by summing the correlated panels diagnosed to be dominated by S-waves. PSICC is a method to retrieve virtual-source responses from ambient-noise measurements by cross-correlating seismic signals at different receiver locations (Wapenaar & Fokkema 2006). To obtain final virtual common-source gathers (VCSG), we individually sum parts of the causal and acausal parts of the summed correlation panels (Panea et al., 2014). We generate VCSG for virtual sources at each receiver position. Figure 4 illustrates VCSGs 300 ms long with a virtual source at receiver position a) 1, b) 10, c) 20, and d) 30. The data were summed over a window of 10 min.
Then, we resort the VCSG to common midpoint gathers and perform a velocity analysis via semblance. Both the illumination diagnosis as well as the velocity analysis determine the dominant S-wave velocity to be 2500 m/s, thus similar to the S-wave velocity range given by the active-source seismic. Finally, we apply to the VCSGs of the X-component a processing scheme similar to the one used for the active-source data. Figure 5 displays a stacked and distance converted VCSGs of the X-component. However, this processing scheme still has to be refined and performed on the VCSGs of the remaining receiver components.
Results From the stacked and depth-converted seismic section of the active-source data, we identify 24 reflections up to a distance of approximately 350 m from the receiver layout. For the interpretation of these reflections, we plot the seismic section onto the geological floor plan of the mine gallery. Figure 6 shows the imaged reflectors projected on the 2D geological map of the 574-m-gallery of the Asse II mine. Figure 6a represents the final stacked and depth-converted section with black lines in relation to the amplitude of each reflector while Figure 6b illustrates the reflectors obtained from the final stacked and depth-converted section. The reflectors are labelled with RAS1 to RAS24. We relate each reflector in Figure 6 to geological elements of the current geological model of the Asse II mine. Table 1 lists the main reflectors between RAS1 to RAS24 and their geological interpretation. The reflectors are in good agreement with the geological interfaces in the salt structure. However, we identify minor reflectors as internal layering or faulting of the particular geological unit. Minor deviations of the locations for RAS20 and other reflectors from geological interfaces are either due to the particular incidence angle of the seismic signal when impinging on the geological structure or are caused by the incidence angle
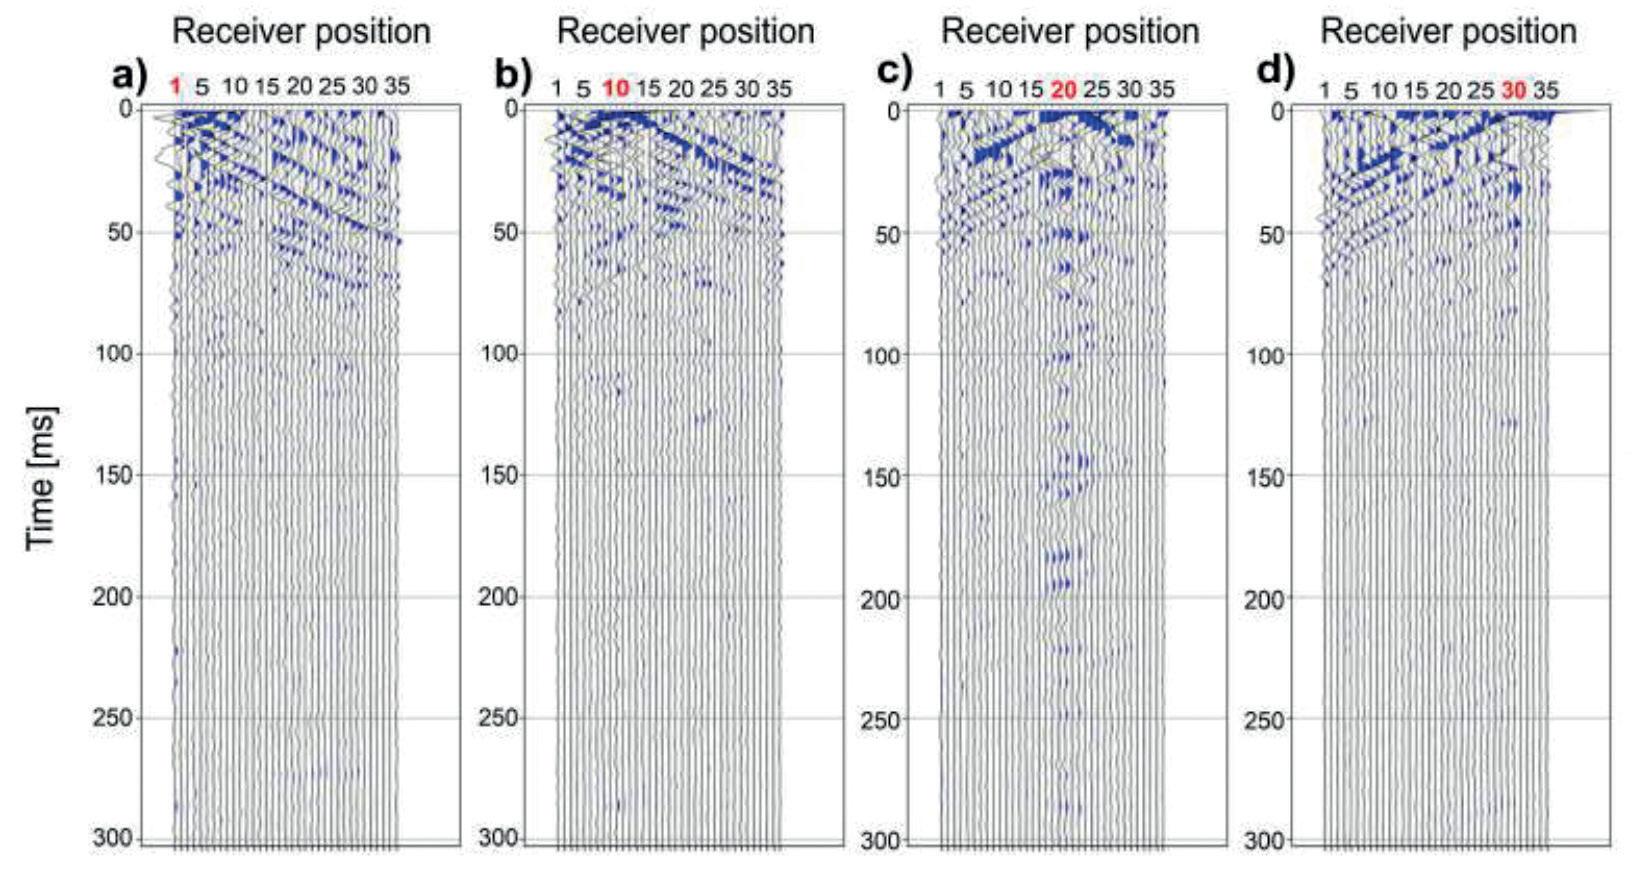
Figure 4 VCSG for a virtual source at receiver position a) 1, b) 10, c) 20, and d) 30 (marked in red) of the X-component obtained from noise panels dominated by S-waves.
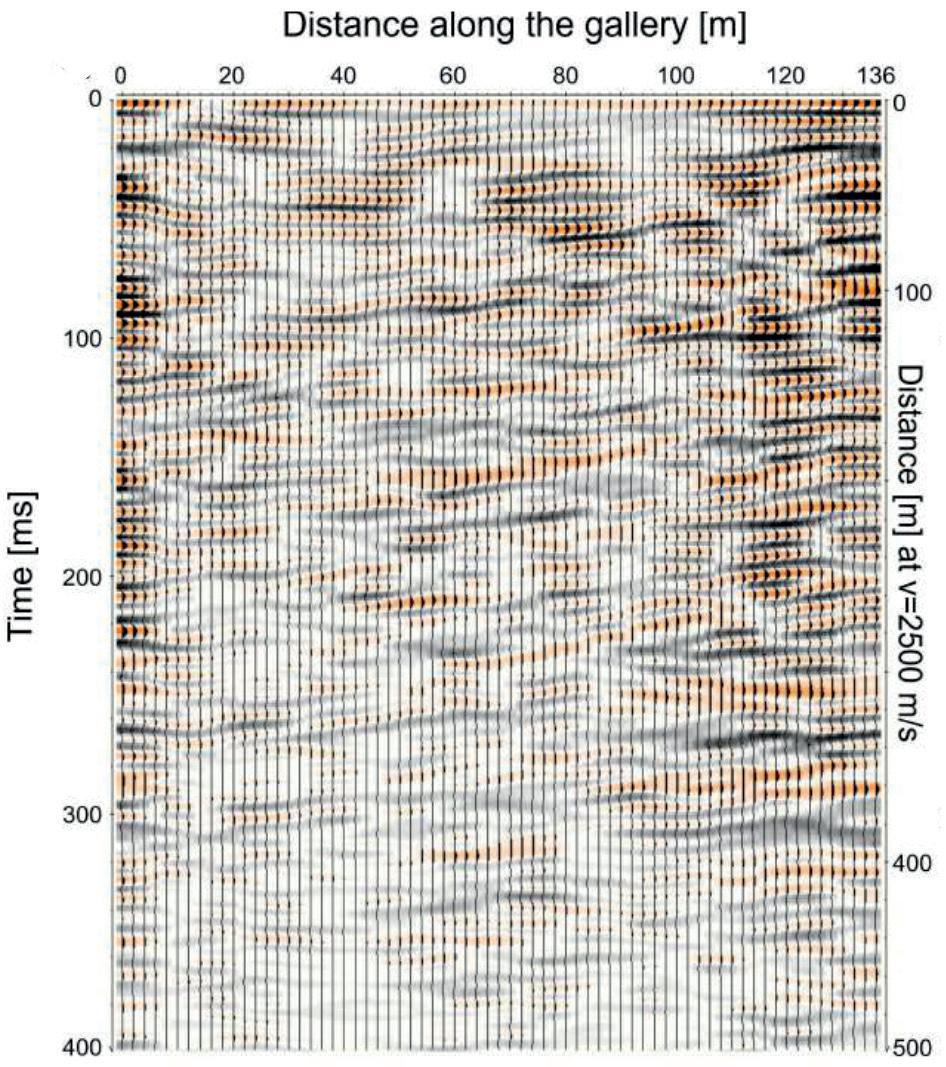
Figure 5 Stacked and depth-converted VCSGs of the X-component.
of the geological strata itself. On the other hand, the geological model needs to be corrected for the results of the active-source measurement. However, due to the fact that within this 2D interpretation the active-source results were compared to a 2D projection of the pre-known geological elements, it must be considered that the assignment of reflectors can be incorrect. Furthermore, Figure 3 and 6a show that the energy distribution is fading close to smaller receiver numbers. This might be based on source strength and different composition of the source medium at the source position. However, we observe a similar phenomenon at the section obtained from the noise data of the X-component, which indicates a certain damping of the propagating seismic waves in that area. Despite that, the active-source section resolves two clear reflectors at around 190 m and 340 m, from which at least the reflector at around 340 m can be distinguished to some extent from the passive-source section. We did not plot the passive-source section on the geological floor plan of the gallery, as the section seems rather raw and undifferentiated. Although it is possible to identify some reflectors between 100 to 136 m distance along the gallery and up to 500 ms in distance to the geometrical layout with constantly strong amplitudes, it still seems difficult to distinguish between minor and major reflections. This might be improved with further processing of the passive-source data.
Conclusion We performed active- and passive-source seismic measurements inside an abandoned mine gallery of a former salt mine and nuclear waste repository in Lower Saxony, Germany. We implemented a measurement geometry including a receiver line following conventional seismic and Horizontal Seismic Profiling geometrical layouts comprising 35 vertically arranged three-component receiver probes. Following the measurements, individual quantitative and qualitative data processing and analysis resulted in stacked depth-converted sections. The active-source section allowed the verification of pre-known geological structures and partly identification of new structures but also indicated the suitability of passive-source seismic interferometry (PSI) for underground exploration. Using PSI, we were able to retrieve virtual common-source gathers resembling the active-source data. The data obtained from them preliminary depth-converted section showed features similar to the active-source section. We refined processing techniques for active- and passive-source measurements in underground mines. Although the preliminary results from PSI are promising, further processing and evaluation is needed to develop a processing flow for applications in underground salt mines. However, it already became clear that PSI has the potential of playing a crucial role in the development of salt mines and their exploration replacing other more expensive and time-consuming geophysical techniques. Further testing in other underground mining environments such as ore or mineral mining are desirable to see if the applicability is transferrable.
Acknowledgments We would like to thank EIT Raw Materials and DMT GmbH & Co. KG for funding this research. Special thanks is directed to
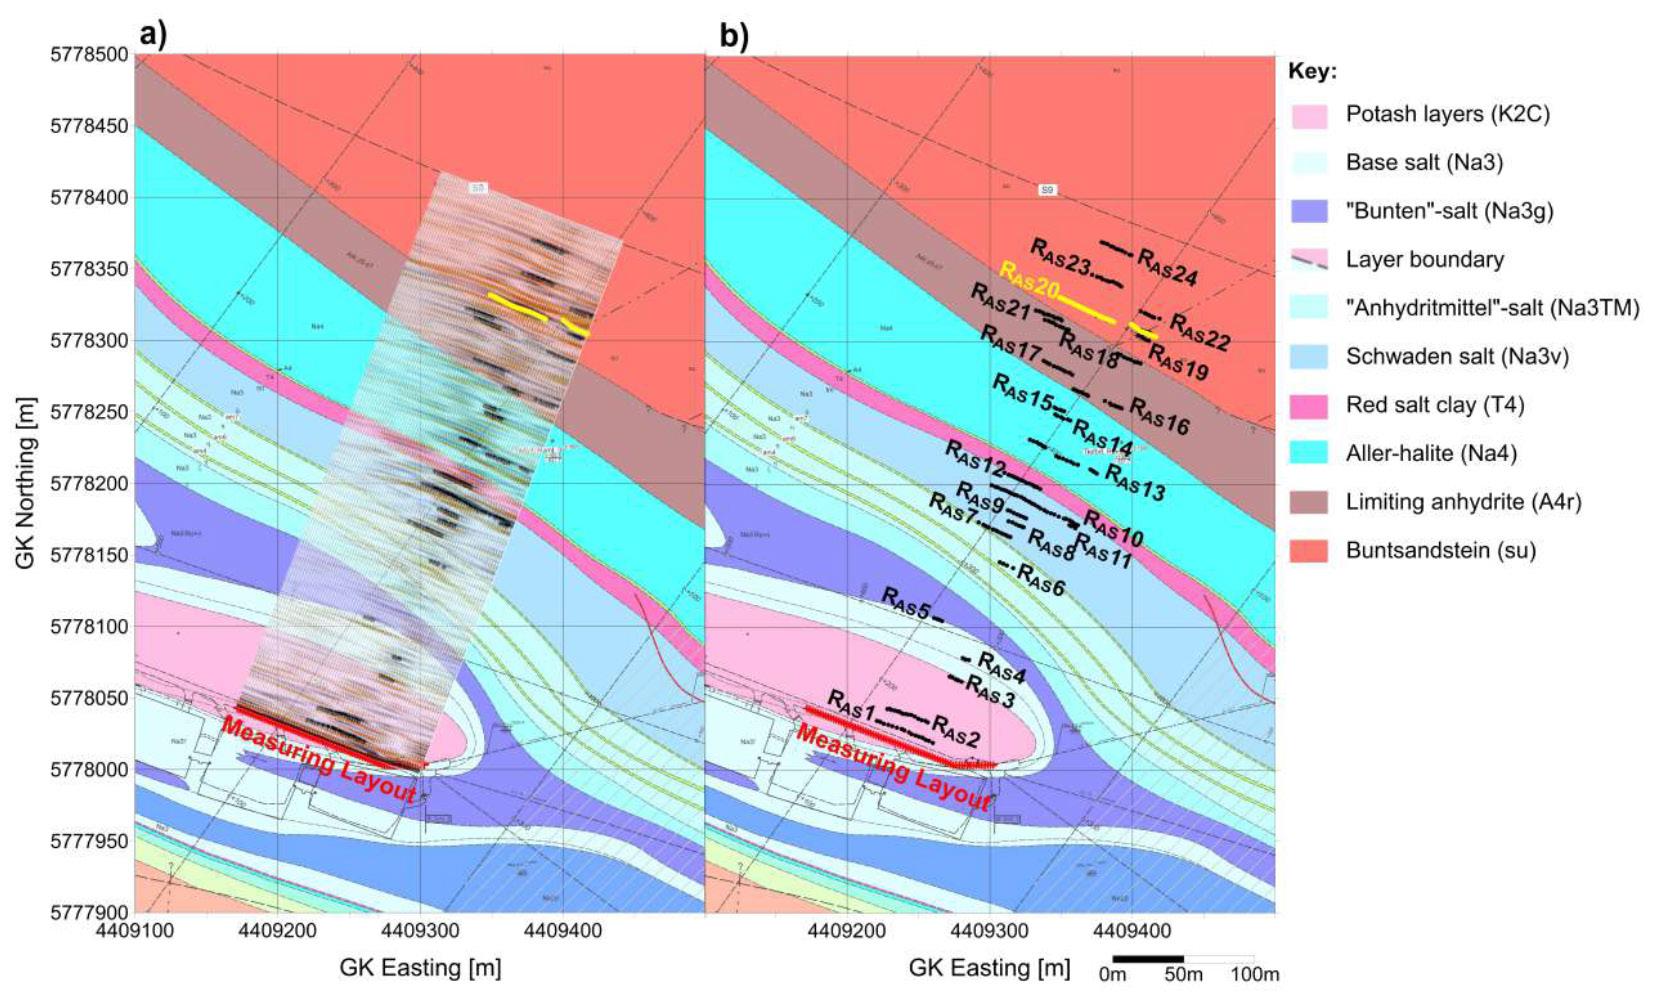
Figure 6 2D geological map of the 574-m-gallery of the Asse II mine with overlayed a) final stacked and depth-converted section of the active-source measurement and b) extracted seismic reflectors (RAS1-RAS24) from the section in a).
Table 1 Interpretation of the main reflectors shown in Figure 6 with respect to the 2 -projection of the geological model in the area of the measurement layout.
Reflector Interpretation
RAS1 and RAS2 Reflector of the gallery below the layout
RAS3 Geological interface between Potash layers and ‘Line’-salt.
RAS4 RAS5 RAS6 RAS7 RAS12 RAS16 RAS20 Internal geological interface between ‘Line’-salt and ‘Orange’-salt.
Geological interface between base salt (‘Bank/Bänder’-salt) and ‘Bunten’-salt. Geological interface between ‘Bunten’-salt and ‘Anhydritmittel’- salt.
Geological interface between ‘Anhydritmittel’- salt and ‘Schwaden’-salt.
Geological interface between ‘Schwaden’-salt and red salt clay.
Geological interface between Aller-Halite and Limiting Anhydrite.
Geological interface between limiting Anhydrite and lower Buntsandstein, Limits of the salt dome.
DMT GmbH & Co. KG for providing the necessary underground seismic equipment and support during implementation of the survey.
We are thankful to the BGE staff for providing the location and for their support during the realisation of the measurements.
We would like to acknowledge the SIT4ME consortium including Alireza Malehmir, Alba Gil de la Iglesia, Ramon Carbonell, Puy Ayarza, Yesenia Martinez, Juan Alcade and Stefan Buske for their contributions during planning and implementation of the measurements.
References
Bohlen, T., Borm, G., Giese, R., Klose, C., Mielitz, S. and Otto, P. [2003].
ISIS – Integrated Seismic Imaging System for the Geological Prediction ahead of Underground Construction. 65th EAGE conference & exhibition. Chamarczuk, M., Malinowski, M., Draganov, D., Koivisto, E., Heinonen,
S. and Juurela, S. [2018]. Seismic interferometry for mineral exploration: Passive seismic experiment over kylylahti mine area, Finland. In (pp. 1–5). European Association of Geoscientists & Engineers. Doi: 10.3997/2214-4609.201802703. Dickmann, T. [2005]. Seismic prediction while tunneling in hard rock. 65th Annual Meeting of the German Geophysical Society, 59-70. Dickmann, T. [2014, 02]. Third tunnel seismic prediction: A next generation tool to characterize rock mass conditions ahead of the tunnel face. Journal of Rock Mechanics & Tunnelling Technology, 20, 35-47. Draganov, D. and Ruigrok, E. [2014]. Passive seismic interferometry for subsurface imaging. In M. Beer, I. A. Kougioumtzoglou, E. Patelli, & I. S.-K. Au (Eds.), Encyclopedia of Earthquake Engineering (Vol. 34, pp. 1-13). Berlin, Heidelberg: Springer Berlin Heidelberg. Doi: 10.1007/978-3-642-36197-5378-1. Dresen, L. and Rüter, H. [1994]. Seismic Coal Exploration. Elsevier
Science. Retrieved from http://gbv.eblib.com/patron/FullRecord. aspx?p=1837724. Olivier, G. [2015]. Seismic Imaging and Monitoring in Mines with
Ambient Seismic Noise Correlations (Doctoral thesis, Université de
Grenoble, Grenoble). Retrieved 06.05.2020, from https://tel.archivesouvertes.fr/tel-01684743/file/55291 OLIVIER 2015 archivage.pdf. Orlowsky, D. (2006). Vertical-seismic-profiling (vsp) untertage zur
Erhöhung der Aussagkraft untertägiger Vertikalbohrungen. Orlowsky, D., Limbrock, K., Lehmann, B. and Peak, A. [2018]. The investigation of the geological situation in the environment of active salt mines applying seismic techniques. EAGE Publications BV
Netherlands. Doi: 10.3997/2214-4609.201801303. Panea, I., Draganov, D., Almagro Vidal, C. and Mocanu, V. [2014].
Retrieval of reflections from ambient noise recorded in the mizil area, romania. Geophysics, 79(3), Q31–Q42. doi: 10.1190/geo20130292.1. Pollok, L., Saßnowski, M., Ku¨hnlenz, T., Gundelach, V., Hammer, J. and
Pritzkow, C. [2018]. Geological Exploration and 3D Model of the
Asse Salt Structure for Expansion of the Asse II Mine. Mechanical
Behavior of Salt , IX, 753-763. Polychronopoulou, K., Lois, A. and Draganov, D. [2020]. Body–wave passive seismic interferometry revisited: mining exploration using the body waves of local microearthquakes. Geophysical Prospecting, 68(1), 232–253. doi: 10.1111/1365-2478.12884. Schott, W. and Waclawik, P. [2015]. On the quantitative determination of coal seam thickness by means of in-seam seismic surveys.
Canadian Geotechnical Journal, 52(10), 1496–1504. doi: 10.1139/ cgj-2014-0466. Szymaniak, T. and Schäfer, M. [2002]. Geologisch-tektonische Kartierung der Salzstruktur Asse im Subhercynen Becken. Vidal, C.A., Draganov, D., van der Neut, J., Drijkoningen, G. and Wapenaar, K. [2014]. Retrieval of reflections from ambient noise using illumination diagnosis. Geophysical Journal International, 198(3), 1572-1584. doi: 10.1093/gji/ggu164. Wapenaar, K. and Fokkema, J. [2006]. Green’s function representations for seismic interferometry. Geophysics, 71(4), SI33–SI46. doi: 10.1190/1.2213955.


