Public Transportation Demand and Supply –Delivering Service?
A White Paper on Public Transportation in Aruba
November 2022
The Faculty of Hospitality and Tourism Management Studies at the University of Aruba in collaboration with the College of Hospitality, Retail & Sports Management at the University of South Carolina
About the Study 4
1 Section One - Current policies, procedures, and regulations 9
1.1 The Department of Public Transport (DTP) .......................................................................................... 9
1.2 Definitions of Permit Categories ........................................................................................................... 9
1.3 Policies and Procedures for TX, B, T, O, V and MFV Permits 11
1.3.1 New Permit 11
1.3.2 Renewal of a Permit ........................................................................................................................ 13
1.3.3 Helper-Driver Permit ....................................................................................................................... 13
1.3.4 Transfer of a Permit 14
1.3.5 Withdrawal of a Permit .................................................................................................................... 14
1.4 Regulations ......................................................................................................................................... 15
2 Section Two – Supply, Demand and Satisfaction 17
2.1 Focus Group Taxi’s 17
2.1.1 Transportation Problems and Solutions .......................................................................................... 18
2.1.2 Quality of Service Problems and Solutions ..................................................................................... 20
2.1.3 Information & Communication 21
2.1.4 Miscellaneous 22
2.1.5 The Permit Processes ..................................................................................................................... 23
2.2 Focus Group Bus Drivers 24
2.3 Summary of Interview/Focus Group Information/ Recommendations 25
3 Section Three - Survey Results 27
3.1 Tourists ............................................................................................................................................... 27
3.1.1 Demographic Results 27 3.1.2 Public Transportation Results 28 3.2 Locals.................................................................................................................................................. 32
3.2.1 Demographic Results 32 3.2.2 Public Transportation Results 33
3.3 Permit Holders Survey Results ........................................................................................................... 36 3.3.1 Demographic Results 36
4 Section Four – Recommendations and Conclusion 37
4.1 Recommendations 37
4.1.1 Tourist Survey Key Findings and Recommendations ..................................................................... 38
4.1.2 Local Survey Key Findings and Recommendations 39 References 40 Research Team .................................................................................................................................................. 41 Acknowledgements ............................................................................................................................................ 41
2
Contents
Appendix
Appendix A 42
B ......................................................................................................................................................... 45
Foreword

Transportation is essential to the Aruban economy and society, and mobility is fundamental not only for the local citizens of the island, but vital to the tourism industry. This study aimed to determine / report on the current state of (public) transportation and assess whether permit numbers meet the demand of both tourists and locals. Having the correct number of permits and access to permits for taxis, rental cars and buses is important to ensure that people can get to where they need to be. Transportation regulation can be an effective tool in stimulating a region’s economy. Aruba’s heavy reliance on tourism requires regulation, determining if the current policies and procedures positively contribute to the right mix of permits, and contribute to overall service quality perceptions for tourists and locals. An understanding of these policies and procedures is critical to help ensure
current policies and procedures are in relation to the demand of permit holders in comparison to needs of tourists and locals for transport.
themes discerned. In addition, a survey was administered to evaluate tourists’ and locals’ demand for public transportation to assess the supply and demand as well as satisfaction with public transportation.
face surveys. Interview and focus group content was assessed using content analysis and thematic coding. Statistical analysis for the survey results was done using SPSS v. 28
3
About the Study
Quality of life depends on transport. Most people travel every day and need an efficient transport system to support a strong and prosperous economy. Tourists needing to get from point A to point B, but also locals getting to work to uphold the economy. Road transport is vital to the economic development and social integration of the country (Oscar Saenz-de-Miera et. al., 2012).
Transportation is one of these factors that contribute significantly to tourism development as it impacts visitor experiences, environmental consequences, and there are financial consequences of poor management of public transportation (Guitierrez et al., 2017). According to Alkheder (2016) transportation parameters are important in developing the tourism industry.
Among these is accessibility that can be represented by good road networks that are accessible to tourism and workplace sites. This should be also supported by a reputable public transport system of taxi, buses, etc. with properly designed terminals and trip schedule plans that ensure comfortable and efficient and accessible trips to these tourism and workplace locations.
The role of transportation was clarified by Prideaux (2000), where the transport system is responsible for: providing services that are safe, comfortable, competitively priced, and timely
Transportation is equivalent to access; it mediates the ability of individuals to physically interface with resources and amenities in their community. Public transportation exists to ensure that all community members can access these resources, regardless of their ability to afford or operate a personal vehicle. Access to housing, employment, education, and healthcare are all dictated by transportation. Considering the average cost per year of owning and operating a vehicle is relatively high, many families depend on public transit. Riders are beholden to public transit, regardless of the quality of the service. This reliance is often portrayed as a reason to minimally fund public transit because dependent riders will ride regardless. Not often enough do we consider how an insufficient public transportation system directly contributes to creating dependent riders 1
There are currently 107,457 (Censo 2020) residents on the island of Aruba and the island receives almost 2 million stayover and cruise visitors (2019) on a yearly basis. As a vital part of the tourism industry, tourists rely heavily on transportation services provided to do sightseeing, get to hotels, restaurants, activities and so on. Quality of transportation in a destination affects tourist satisfaction and repeat intention (Tan & Ismail, 2020). Taxis are the main source of transportation, and it is important to ensure that there are sufficient taxis for the number of tourists to the island and this can be determined by assessing the perceptions of tourists related to effective and efficient transportation satisfaction (Rizal & Asokan, 2013).
1 https://www.instituteforchildsuccess.org/insufficient-public-transportation-decelerates-economic-mobility/
4
Table 1: Total Number of Visitors, 2012-2021
Year Year Year Year Year Year Year Year Year Year
Total 2012 2013 2014 2015 2016 2017 2018 2019 2020 2021 Stayover Visitors 903,934 979,256 1,072,082 1,224,935 1,101,954 1,070,548 1,082,003 1,118,944 368,322 806,534
Cruise Visitors 582,313 688,568 667,095 607,019 656,043 792,403 815,161 832,001 255,384 135,953
Number of Visitors 1,486,247 1,667,824 1,739,177 1,831,954 1,757,997 1,862,951 1,897,164 1,950,945 623,706 942,487
Source: Aruba Tourism Authority & Cruise Tourism Authority N.V. Aruba
Stayover visitor expenditures on Aruba accounts for roughly US$1.45 Billion in 2019 (CBS, 2022)2 . Approximately US$11.3 millions of total visitor expenditure is related to transportation services spending in 2019 which is almost 8 percent of a visitor’s expense when they come to the island. It is important to mention that the spending on taxis for example has almost doubled between 2009 and 2019 (CBS, 2022).
Table 2: Average Daily Expenditure (In US$)
Year Year Year Year Year Year Year Year Year Year Year 2009 2010 2011 2012 2013 2014 2015 2016 2017 2018 2019
Accommodation 45.48 47.58 50.25 50.44 49.67 51.22 54.53 58.11 76.78 84.81 80.61
Food & beverage 35.16 36.64 35.27 37.11 38.60 38.07 33.42 33.18 38.21 36.62 38.3
Groceries / sundries 4.36 4.11 3.39 3.34 3.61 4.35 6.05 4.8 4.56 4.3 4.52
Entertainment / recreation 6.53 7.10 7.29 7.01 6.58 6.76 6.92 7.96 11.04 10.51 9.26 Taxis 2.51 2.85 2.87 2.61 2.79 2.76 3.26 4.05 4.73 4.59 4.49 Car rental 5.65 5.51 5.04 5.58 6.24 6.29 6.07 5.76 6.29 6.18 6.67
Public transportation 0.18 0.18 0.19 0.14 0.11 0.09 0.13 0.14 0.12 0.16 0.19 Tax free shopping 1.52 1.41 1.6 1.89 1.85 1.92 1.35 1.28 1.04 0.88 0.89 Shopping 15.65 14.13 16.71 16.16 19.15 23.07 22.54 21.9 20.61 18.12 15.63 Casinos 7.35 7.56 11.2 11.13 10.21 10.91 10.67 11.89 14.14 13.5 12.98 Internet/Telephone 0.13 0.25 0.16 0.15 0.09 0.08 0.04 0.1 0.02 0.01 0 Other 1.27 1.09 1.2 1.46 1.43 1.52 1.39 1.59 1.78 1.77 1.8
Avg. Daily Expenditure (In US$) 125.8 128.41 135.17 137.02 140.33 147.05 146.36 150.75 179.32 181.45 175.33
Source: Tourist Survey - Central Bureau of Statistics Aruba
The growth in visitor demand for transportation in the tourism industry has impacted the public transportation needs of the local community, along with the market failures in the local system there is an increase in the popularly termed, pirate transportation. Pirate transportation is described as any form of passenger transportation that occurs by receiving payment, without the driver and/or vehicle having a legal permit to do so. The demand is higher than the supply for local workers and the elderly to get to where they need to be.
5
2 https://cbs.aw/wp/index.php/2022/05/19/estimated-total-tourism-expenditure1-in-1000-us-dollars/
It is important to mention that the use of public bus transportation (Arubus) has been steadily decreasing, from 2.1 million passengers in 2010 to 1.8 million in 2019 It can be hypothesized that this places a further strain on other types of transportation types, including auto buses and taxis. The increase in passenger cars (33.2%), irregular transportation cars (9.2%), Tour Buses (247.9%), Taxis (25.5%), rental cars (38.4%) from 2015 versus 2022, is astounding. This creates more strain on the traffic for public transportation workers and passengers, to compare, Curacao (444 km2) has a total of 151,066 inhabitants, and a total number of 538 passenger cars per 1000 inhabitants (2019) and Aruba (180km2) has a total number of 685 passenger cars per 1000 inhabitants.
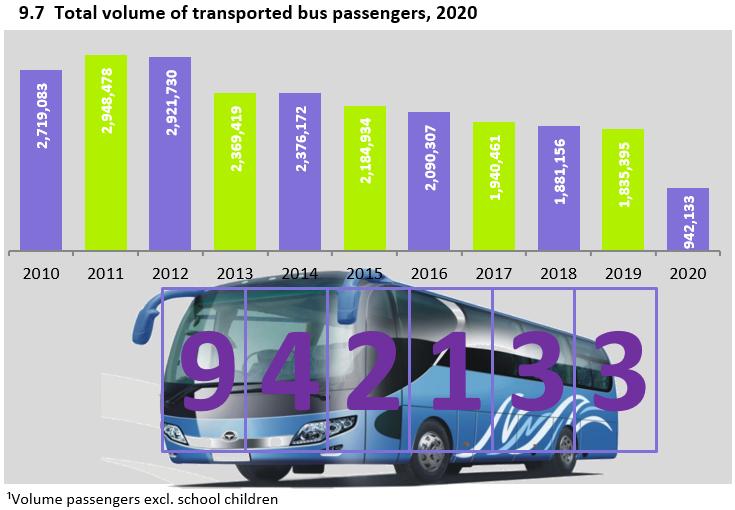
Table 3: Number of motor-vehicles registered, December 31
Types
2015 2016 2017 2018 2019 2020 2021 YTD Oct 2022 Growth '15 vs '22
Passenger cars¹ 58,506 63,871 66,832 76,228 76,806 77,877 77,866 77,901 33.15%
Irregular - transportation cars 314 311 302 299 307 310 326 343 9.24% Trucks 1,110 1,179 1,231 1,297 1,266 1,296 1310 1350 21.62% Buses 129 140 142 148 140 139 140 140 8.53% Tour buses 94 206 248 293 299 303 312 327 247.87% Taxis 372 385 389 450 450 450 465 465 25.54% Rental 3,664 3,876 3,952 4,638 4,766 4,803 4,915 5,072 38.43%
Government cars 482 487 485 540 543 549 558 560 16.18%
Other cars 24 26 25 27 31 32 34 34 41.67%
Motor - cycles, incl. mopeds² 2,042 2,239 2,265 2,555 2,705 2,746 2794 3011 47.45% Special plates 437 459 475 659 573 650 713 748 71.17%
Source:
www.twitter.com/aruba
Also worth mentioning is that according to CBS (2021)1, the excellent rating of service related to local transportation has increased from 43.1% in 2009 to 71.9% in 2018 but dropped again in 2019 to 52.5% Nevertheless, an astonishing 95.5% rated local transportation good and excellent. Thompson and Schofield (2016) state that tourists’ experience with transport service may influence their satisfaction with the destination image.
Table 4: Rating of Service Related To
Year Year Year Year Year Year Year Year Year Year Year 2009 2010 2011 2012 2013 2014 2015 2016 2017 2018 2019
Local Transportation
Excellent 43.10% 46.60% 51.80% 41.40% 31.20% 24.60% 39.10% 42.30% 62.90% 71.90% 52.50% Good 37.30% 44.10% 41.70% 50.90% 62.40% 70.20% 54.20% 50.80% 28.00% 23.50% 43.00%
Average 2.30% 0.90% 0.50% 0.70% 0.40% 0.10% 0.40% 0.20% 0.40% 0.00% 0.00% Poor 0.00% 0.10% 0.00% 0.00% 0.00% 0.00% 0.70% 0.10% 0.00% 0.00% 0.00% Unknown/ n.a. 17.30% 8.20% 6.00% 6.90% 6.00% 5.00% 5.50% 6.60% 8.70% 4.60% 4.50% Total 100% 100% 100% 100% 100% 100% 100% 100% 100% 100% 100%
Quality of Service
Excellent 74.70% 71.70% 68.80% 61.90% 55.00% 46.20% 54.90% 63.10% 73.30% 75.60% 53.60% Good 21.20% 26.10% 30.40% 36.90% 44.20% 53.30% 44.30% 36.30% 25.60% 24.00% 46.00% Average 2.80% 1.60% 0.70% 1.00% 0.70% 0.40% 0.80% 0.60% 1.00% 0.20% 0.20% Poor 0.40% 0.10% 0.00% 0.00% 0.10% 0.00% 0.00% 0.00% 0.00% 0.00% 0.00% Unknown/ n.a. 0.90% 0.40% 0.10% 0.20% 0.10% 0.10% 0.00% 0.00% 0.10% 0.10% 0.20%
Total 100% 100% 100% 100% 100% 100% 100% 100% 100% 100% 100%
Source: Tourist Survey - Central Bureau of Statistics Aruba
Several studies reveal the variables affecting the tourists’ satisfaction when inquiring about transportation related factors such as: Accessibility, Information, Time/Punctuality, Safety, Service Quality, Reasonable Fare, (Bus) Driver’s Quality and Perceived Value are all vital variables to consider. Transport plays an important role in providing mobility for tourists within the destination. Since the tourists’ satisfaction is an important performance measure for the transport service providers and a determinant factor affecting the mode choice analyzing travelers’ behavior in the aspects of transportation mode choice is essential (Tan and Ismail, 2020).
Figure 1: Review of tourist satisfaction variables
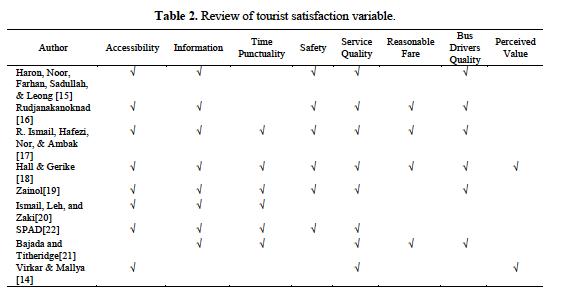
7
While the importance of transportation in the regional economy is evident, putting a dollar value on it is sometimes difficult. The current economic impact of the transportation industry on Aruba has not yet been fully determined. As per CBS 2018 data, transportation and storage accounts for 288 million Aruba florins, approximately US$160 million of the GDP. However, it is not yet possible to segment the transportation only category to accurately portray its contribution with direct and indirect effects on the economy.
Table 5: Gross domestic product in (AFL million)
Industries 2013 2014 2015 2016 2017 2018 2
1. Production approach
Industries
Transportation and storage 214 217 267 258 272 288 Accommodation and food service activities 727 768 859 828 912 991
Total 4,441 4,548 4,859 4,885 5,060 5,211
Total taxes less subsidies on products 442 447 444 456 476 521
Nominal gross domestic product at market prices 4,883 4,996 5,304 5,341 5,535 5,732
2. Expenditure approach
Nominal gross domestic product at market prices 4,883 4,996 5,304 5,341 5,535 5,732
3. Percentage change nominal gross domestic product at market prices 2.30% 6.20% 0.70% 3.60% 3.50%
4. Midyear population (number of persons) 106,383 107,823 109,225 110,354 110,850 111,466
5. Nominal gross domestic product per capita (in AFL) 45,899 46,332 48,557 48,396 49,936 51,423
Source: Central Bureau of Statistics, Aruba
¹) Includes Changes in inventories; 2) Preliminary figures
An increase in traffic due to growth in tourism puts pressure on transportation facilities, and this can have adverse effects. The negative effects are described by Goldner and Ritchie (2021) as follows:
• Congestion – means delays which leads to waste of time and energy. Serious congestions may have a negative effect on transportation modes, especially on airports and roads during peak times.
Source: www.twitter.com/aruba
1Section One - Current policies, procedures, and regulations
Research was conducted on current policies and procedures on permit administration and regulations with regards to public transportation on Aruba. This created the basis for the white paper and determined how effective the current policies and procedures are in relation to the demand of local business owners or entrepreneurs (taxis and small buses) in comparison to needs of tourists and locals for transport. This white paper sets the framework within which policies may be used moving forward based on final recommendations at the end of this report.
The scope of this part of the study focused on providing an overview of the status of allowed permits and registered permits. The report is comprised of the following sections: definitions of transportation categories in Aruba, average number of available permits per category, average number of permits in use per category, policies, and procedures for permits per category, and estimated number of employees per category.
1.1 The Department of Public Transport (DTP)
The Department of Public Transport (DTP) was launched in 2012. It was previously known as “Directie Openbaar Personenvervoer (DOPV) which was established in 1996. The DTP is charged with the development and implementation of policies related to public transportation (openbaar personenvervoer). Duties and tasks include emitting advice / recommendations regarding the permits and general policies, granting of permits, control, and supervision of permits among others. DTP resorts under the Minister of Transportation, Integrity, Nature, and Senior Affairs (TINO), with a staff of 21 employees divided into four (4) departments. In addition, there are two temporary workers. The departments are categorized into main and support departments. The main departments are charged with the core activities of DTP, namely control and supervision of the permits, and granting of the permits. The two departments are: Permit and Inspection.
The support departments are charged with assisting DTP in the implementation of duties and tasks. The two departments are: General Support and Policy
Applicants need to send their application to DTP; the Minister receives the application request with the advice from DTP in order to make a decision. The applicant must adhere to the list of requirements detailed in the “Landsverordening Personenvervoer” (LV). The permit types included in the LV are described hereafter. This process is being digitized according to the above-mentioned procedure.
1.2 Definitions of Permit Categories
Taxi permit (TX) - A taxi is a motor vehicle driven by a person whose job is to take people where they want to go in return for money.
Big and small autobus permits (B) - A motor vehicle which can carry a large group of passengers with the purpose of taking people where they want to go in return for money. Categorized in small and large autobuses, small autobus 12 passengers maximum and large autobus transporting more than 12 passengers.
Rental Vehicle (V) - A motor vehicle that can be hired for a short period of time.
Rental Motor Vehicles (MFV) – motor vehicles on two, three or four wheels not fitted with a closed body. Tour Vehicles (T) – A motor vehicle used to provide tours to tourists, picking them up at point A and transporting them back to point A. Examples include, safari trips, bus tours (small or large).
Irregular Transport (O) – A motor vehicle used for the purpose of school transportation, persons with limitations and illness transportation, transfer of passengers from airport to cruise terminal or vice versa, from airport to hotel or vice versa (private or public), private transportation needs for tourists, including but not limited to pick-up for activities, rental cars, etc.
9
A detailed overview of the number of allowed permits per category and number of registered permits at DTP or SIAD in 2022 is provided in the table below. It can be seen below that some of the vehicles registered at DTP are not registered at the Tax Department.
Table 6: Number of Registered Permits per Category Permit Type / Category Maximum amount permits per type/category
Registered at DTP (Public Transport Department)
Registered at SIAD (Tax department)
Taxi (TX) 465 465 465 Autobus (B) 160 148 140 Tour vehicle (T) 380 374 315
Irregular Transport (O) 380 376 330 Rental motor vehicles (MFV) 400 327 276 Car Rentals (V) 6000 5640 4930
Source: Department of Transport (June 2022)

In addition, the table below illustrates the growth in the types of motor-vehicles registered at the SIAD / Tax Department from the year 2015 to 2022 This table shows growth in every area. A total growth of almost 34% in total vehicles contributing the congestion on the roads.
Table 7: Number of motor-vehicles registered, December 31 Types 2015 2016 2017 2018 2019 2020 2021 YTD Oct 2022 Growth '15 vs '22
Passenger cars¹ 58,506 63,871 66,832 76,228 76,806 77,877 77,866 77,901 33.15%
Irregular - transportation cars 314 311 302 299 307 310 326 343 9.24% Trucks 1,110 1,179 1,231 1,297 1,266 1,296 1310 1350 21.62% Buses 129 140 142 148 140 139 140 140 8.53% Tour buses 94 206 248 293 299 303 312 327 247.87% Taxis 372 385 389 450 450 450 465 465 25.54% Rental 3,664 3,876 3,952 4,638 4,766 4,803 4,915 5,072 38.43% Government cars 482 487 485 540 543 549 558 560 16.18% Other cars 24 26 25 27 31 32 34 34 41.67%
Source: www.twitter.com/aruba
1.3 Policies and Procedures for TX, B, T, O, V and MFV Permits
1.3.1 New Permit
The following procedure exists to apply for a vehicle permit stated in Article 5 AB 1995 no. GT 23:
1. The procedure for requesting a permit needs to occur in writing and addressed to the Minister of Transportation and must include the following information:
a. Last name, first name(s), date of birth, place of birth, address, and nationality of the applicant;
b. In case the applicant is a company: legal form, name, and title of the entity, in addition the last name(s), first name(s), dates of birth, place of birth, addresses and nationality of all board members;
c. Documentation of the motor vehicle the applicant owns or intends to own, including the number of passengers that can be transported in the vehicle;
d. The type of permit needs to be specified, in case a small or large autobus permit is requested, the route and schedule need to be included.
2. Through the decree in accordance with the regulations, additional guidelines can be provided on the form and content of the permit request.
It is important to mention that Article 7 subsection 1 states that small autobus and taxi permits can be granted to persons born in Aruba with the Dutch nationality, living on Aruba (citizens), or persons born outside of Aruba with parents born in Aruba, whom have been living on the island for a minimum of 20 years. This is thus not applicable for O permits. In addition, article 7 subsection 3 states that the permit is only granted if the applicant is the driver of the autobus or taxi and shall provide the service as their primary source of income. Noted here is that the article mentions primary versus sole source of income.
The permit is granted for a period of five years as stated in Article 8 and is granted to an individual who is responsible for complying with the rules and regulations stipulated in the “LV personenvervoer”. The permit holder who does not comply, partially or entirely to the permit, will be stripped to the rights hereof. Granting or transferring of a working permit (exploitative vergunning). A work permit should only occur as follows:
- A decision by the Minister based on recommendation and concept MB from DTP. The Minister receives advice from the director of DTP, this forms the basis for the decision to approve or deny a permit. According to formal procedure, the Minister should not make decisions without receiving this advice. This has not always been the case in the past. The law prescribes that a commission provide advice rather than the director.
The director and acting director currently occupy the role of the head of Permit department and receive the incoming applications from the Minister. All incoming documents are received by the director and acting director and distributed to the permit department employees for processing. The document is then entered into DecosJoin under the name of the employee responsible for further processing. The employees evaluate / check if the applicant adheres to all requirements and demands. All applicant information is entered as per Article 3 of the LV Personenvervoer (AB 1995 GT 23). In addition, the employees use a checklist for compliance of all required documents.
Table 8: DTP Checklist
Permit Type
Medical Examination declaration from Medwork All
Extract from the census department (5 florin) All
Driver’s license copy All
Certificate of Good Conduct All
Insurance and other requirements All
Number plate tax and registration SIAD All
Inspection certificate All
Drug test lab results (standard br. By B.V. attachment 5) All
Vehicle Purchase Receipt copy V, MFV
Extract from the Chamber of Commerce (3 months) V, MFV, T, O
Establishment permit from DEZHI V, MFV, T, O
Digital photos taken at DTP All
4-florin stamp All
8-florin stamp All
Recommended: Training or Certificate, Test of Language Skills (English / Spanish) All
11
After receiving all information and documentation, the concept advice or concept-MB will be drafted by DTP. After all letters and accompanying documents are in place, the concepts are sent to the director for quality control, after eventual corrections, the approved concepts are scanned and registered in DecosJoin along with all other relevant documents. Hereafter, the documents are delivered to the Minister through Bureau Interne Diensten (BID).
In the case of a direct decision by the Minister on an applicant, after all relevant documents are submitted, a concept MB is sent to Algemene Ondersteuning (HAO) to prepare an offer letter. After the offer letter is processed by the department, the concept MB is sent to the director (DTP) for further implementation.
The transportation permit procedure has been identified by several key stakeholders as a political process. Implying that all previous Ministers of Transportation in office would grant the permit to their campaign supporters. As part of the current Minister’s policy, the objective is to depoliticize the process for all permit types. Therefore, a scan of current policies and procedures was conducted through desk research, focus groups and interviews. The results indicate that the existing documentation and laws have room for improvement, these need to be adapted to ensure that the implementation can be integral. The Department of Public Transportation (DTP) identified several issues such as limited number of qualified personnel such as a legal advisor and BOA officers, these are needed to optimally implement the described structures as specified in the available sources e.g., formatieplan DTP
Figure 2: New Permit Request Model
Permit Request (Article 5) The procedure for requesting a permit needs to occur in writing and addressed to the Minister of Transportation and must include the following information:
- Last name, first name(s), date of birth, place of birth, address, and nationality of the applicant;
- In case the applicant is a company: legal form, name, and title of the entity, in addition the last name(s), first name(s), dates of birth, place of birth, addresses and nationality of all board members;
- Documentation of the motor vehicle the applicant owns or intends to own, including the number of passengers that can be transported in the vehicle;
- The type of permit needs to be specified, in case a small or large autobus permit is requested, the route and schedule need to be included.
Intake Permit Request All incoming documents are received by the director and acting director and distributed to the permit department employees for processing. The document is then entered into DecosJoin under the name of the employee responsible for further processing.
Content Related Review Permit Request
Decision Permit Request
The document is then entered into DecosJoin under the name of the employee responsible for further processing. The employees evaluate / check if the applicant adheres to all requirements and demands. All applicant information is entered as per Article 3 of the LV Personenvervoer (AB 1995 GT 23). In addition, the employees use a checklist for compliance of all required documents. See table 8: DTP Checklist
After receiving all information and documentation, the concept advice or concept-MB will be drafted by DTP. After all letters and accompanying documents are in place, the concepts are sent to the director for quality control, after eventual corrections, the approved concepts are scanned and registered in DecosJoin along with all other relevant documents. Hereafter, the documents are delivered to the Minister through Bureau Interne Diensten (BID).
Notification Permit Request
The most complicated type of permit to process is the Taxi permit. There are currently 465 permits of which 465 are registered and being used. The demand for this type of permit is high which causes a backlog of pending applications to be processed. According to DTP there are approximately 10 to 20 new taxi permit requests that come in on a weekly basis. The current rules and procedures for approving or denying a permit needs to be in accordance with the law and more transparent and integral, depoliticizing the entire process. There needs to be regulation and caps of number of permits being distributed for all permit types. For example, in just seven years, there has been a 248% increase in tour bus permits from 2015 up to 2022. Moreover, according to the Maneho DTP document (2022) there are several “open” autobus permits (big and small), either they are approved, but not being used or in process of transfer. These are key data that needs to be readily available to provide a more structured overview for the decision-making purposes. concerning
12
Permit Request Intake Permit Request Content Related Review Permit Request Decision Permit Request Notification Permit Decision
Type Total Share
Irregular - transportation cars 343 5.40%
Buses 140 2.21%
Tour buses 327 5.15%
Taxis 465 7.36%
Rental 5,072 79.89% Total 6,349
There are currently 6,349 permits registered at the tax department, of which 79.89% are rental cars, followed by Tour & Transfer permits (10.5%) and 7.36% are taxis. Buses comprise only 2.21% of the total share. And an estimated total of over
1.3.2 Renewal of a Permit
Registered Drivers Total 2022
T / O Transportation (Incl. Hel per Driver) 240
Buses (small/large) 145
Buses Helper Drivers 10
Taxis 465
Taxi Helper Driver 123
Car Rental Companies (KVK) 162 Total 1,145
A permit is granted for a period of five years (Article 8), two months before the expiration date the permit holder needs to request an extension. In the case of an expired permit, the Minister needs to sign for approval to start the renovation process. In other cases, DTP will allow the permit holders to bring the required documents, but the final decision is that of the Minister’s. Before sending the MB for signing at the Minister, the permit holder’s file is inspected, and external documents are requested to ensure that the permit holder adheres to all requirements.
Table 9: Permit Renewal Checklist DTP
Certificate of Good Conduct
Census document 5fl to ensure permit holder is registered in Aruba Medical test by Medwork Drug test from renowned lab Aptitude test to assess driving (if 65 or older) conducted by DTP employees, stamp is needed.
Figure 3: Permit Renewal
Renewal Request
Intake Permit Renewal Request
Content Related Review Permit Renewal Request
A permit is granted for a period of five years (Article 8), two months before the expiration date the permit holder needs to request an extension. In the case of an expired permit, the Minister needs to sign for approval to start the renovation process.
Registration, request additional information, quality check for all required documents, assign for processing
The permit holder’s
1.3.3 Helper-Driver Permit
There is the possibility to become a helper-driver (“hulpchauffer”) for permit holders to substitute when they are on vacation or for medical reasons Vacation is not stipulated by law, although this does occur in practice. The law stipulates that a driver can apply for a helper driver for medical reasons and exceptional circumstances. The following requirements are stipulated to receive a permit as helper-driver There are a few instances where
13
file is inspected, and external documents are requested to ensure that the permit holder adheres to all requirements.
Decision Permit Renewal Request After receiving all information and documentation, the concept advice or concept-MB will be drafted by DTP. After all letters and accompanying documents are in place, the approved concepts are scanned and registered in DecosJoin along with all other relevant documents. Hereafter, the documents are delivered to the Minister through Bureau Interne Diensten (BID).
Renewal
Renewal Request
Renewal
Notification Renewal
Renewal Request Intake
Request Content Related Review
Decision
Request
Decision
the minister can allow the permit holder additional days of leave due to special circumstances (see Maneho DTP). It is recommended to have a transparent policy on these “irregular” instances. It is important to mention that a helper-driver needs to adhere to all the rules of a permit holder and will be sanctioned in a similar manner.
Table 10: Helper-Driver Permit
Minimum age of 25 and maximum 64 at the moment of first request;
Certificate of Good Conduct (not older than one year)
Knowledge of laws and policies of public transportation, this occurs as a verbal test conducted by DTP employees
Passport photo
A permit holder to cover for A car to carry out the work as per the permit
Additional documents
Medical certificate from Medwork (not older than one year)
Census document 5fl to ensure permit holder is registered in Aruba
Copy of driver’s license
Drug test lab results (valid for one year)
Required documents for vehicle (taxi and small autobus)
Registration and payment receipt from tax office
Keuringsbewijs or proof of appointment with DTI
A valid proof of insurance with the requirements that the passengers are also insured
Recommended: Training or Certificate, Test of Language Skills (English / Spanish)
1.3.4 Transfer of a Permit
The Minister may agree to transfer the permit if the permit holder passes away or cannot continue making use of his permit due to serious medical reasons. The request needs to follow these steps: 1) registration via BID addressed to the Minister or DTP, 2) DTP will draft an advice (or immediately in accordance). Each situation is different, and must be evaluated, there is a “flexible policy” that was introduced by the previous Minister. There are several unique cases that can arise and must consider different scenarios of family members of the deceased or ill permit holders. Up till now the flexible policy is being implemented. (Maneho DTP). It is recommended to steer away from a flexible policy that creates room for subjectivity and political favors. The policy and/or law need to be transparent and valid for all permit holders equally. The flexible policy has been made void as of end of September by the Minister of Transportation, Integrity, Nature, and Senior Affairs (TINO) The current word “gezin” is relatively broad because the bloodline can be interpreted by different persons and different situations.
If the law is clear and states that the permit can only be transferred to the natural born child or adopted child (providing that they meet all criteria / requirements) then is transparent and objective. In addition, if a person has a helper-driver of many years (minimum to be determined) the request can be honored to transfer the permit to the helperdriver. This scenario however creates a loophole for “selling” the permit.
1.3.5 Withdrawal of a Permit
A permit can be withdrawn before the final term or renewal term. In these cases, DTP assesses if there is a valid reason, informs the Minister and sends a concept MB (Ministeriele Beschikking) to revoke. If the Minister agrees with DTP, he signs the MB and the permit holder will be notified of the withdrawal.
As previously mentioned during the focus groups and interviews, some stakeholders associated the permit process with political favors. Ranging from having a person having the paperwork finalized in a few weeks (while other waited for years) to having a friend arrange a signed permit without a name attached to it. As these are incidents that happened decades ago, and the current rules and regulations prohibit such occurrences, however the political taint is still prevalent. As a first step to depoliticize the process this study refers to the “Landsverordening personenvervoer”, article 4 of the AB 1995 no. GT 23 which discusses a commission titled: Passenger Transport Commission, comprising of seven members, where three members represent the permit holders. This structure aims to provide transparency and decrease the political favors as the Minister in charge may only grant the permits based on advice from the commission. Unfortunately, it has never been formally established. Additionally, the Minister can consider implementing a commission that consists of three or five members instead of seven, ensuring a leaner operational structure. This commission was implemented in St.Maarten in 2013. After reviewing both LVs (Aruba and St.Maarten) they are similar on
14
several articles. It is recommended to have a legal advisor review in order to initiate the process. The Minister would like to consider the advice provided by the community regarding granting, changing, transferring, renewing, or withdrawing permits. The permit holder focus groups provided more in-depth information and insights
1.4 Regulations
A quick scan into other countries and cities was conducted to provide a comparison of regulations based on the KiM report titled: International comparison of taxi regulation and Uber, the results are discussed to provide a more general view of the permitting process on a global scale.
In a perfectly functioning market, no regulation is needed, in an ideal situation there is balance between supply and demand. However, the reality is that the world is not perfect, nor are the markets, prone to market failures which vary accordingly. (KiM Netherlands Institute for Transport Policy Analysis – KiM NITPA, 2015). Teulings et al (2003) and OECD (2007) identify the following market failures in the taxi market:
- High fixed costs (economies of scale);
- Insufficient or asymmetric information;
- External effects, both positive (social, economic) and negative (noise, emissions, safety) effects that are not in the interplay of supply and demand. Examples include lack of space (congestion in certain areas), safety of drivers, passengers and other drivers, and the quality of service offered to (foreign) travelers The customer is in an immediately dependent position at the moment they enter a taxi.
As stated by KiM NITPA, the reasons for regulation are to prevent aspects of market failure from occurring. However, this can also result in government failure in terms of bureaucracy, and other undesired effects. It is pertinent that regulation advantages outweigh the disadvantages.
In Aruba, the taxi market is regulated firstly by price, fixed fees from point A to point B, this form of regulation is meant to compensate for the disadvantages of insufficient information for example. Secondly, there is a capacity regulation of permits, capacity regulation aims to prevent traffic congestion. In addition, it provides permit holders to
the opportunity to recoup and make a living from their investments. Additionally, this provides a control mechanism for quality control. There are currently 467 vehicles registered as taxis at the tax department, however, the correct amount is 465 registered taxi permits at DTP. All types of permits have been capped by the moratorium since March 2022 for one year. This is a reason for concern, especially when considering the large increases in vehicles on the island. Lastly, another regulation that needs immediate attention is the quality regulation. This regulation aims to guarantee public safety, to offer passengers satisfactory quality standards, ensuring everyone has access (locals vs. tourists).
Aruba’s public transportation system differs from larger cities and countries, primarily to the fact that there are not taxi companies. However, like the Netherlands, the taxis work with a dispatcher company, of which there are currently three or four established bodies offering their service as a group. These companies differ in membership requirements and monthly fees based on the extent to which they provide services to their members and the passengers. For example, working with a specialized app for phone calls, ensuring there is 24/7 dispatcher service and ensuring that their membership is always scheduled in during holidays and irregular hours. In addition, they have specific criteria (quality) that the members need to adhere to. This provides a more structured approach to delivering quality service.
It is evident that regulations are in place, however practical requirements are unclear and politized. The question remains whether the regulations are strict enough. The KiM report refers to permits such as O, T and others, as hired car with driver (HCD) in order to distinguish them from taxis. In Belgium the two differentiated as follows, for HCD the fare and destination are agreed in advance, and the fares are set higher than those of taxis to ensure they do not compete directly with taxis. In Germany, for example a local knowledge test is required for Taxi and hired car drivers, the hired car with drivers (T & O) must always return to the company base site. In France, a comprehensive training course is required (6-9 months) to become a taxi driver, the hired car with drivers follow 250 course hours.
In addition, the hired car with drivers is only via reservation, after the trip is completed, they are required to return to company site. In the UK taxi drivers have to complete a demanding local test and
15
hired car with driver completes a less demanding knowledge test. In Brazil the fares are regulated and the car hire with drivers are 89% higher than taxi. In almost all of the studies countries, some sort of test is required focusing on suitability, local knowledge, driver approval test (behavior, eyesight and so forth), language test.

In addition, there are also requirements stated for the car. In Belgium it is mandatory that a card listing the fares must be posted in the taxi, and the car cannot be older than 7 years. Another noticeable requirement in the studied countries is that hired cars cannot resemble taxis, this contributes to tourists being able to distinguish between the types of transportation available.
Currently, Aruba’s regulations do not seem rigorous enough to clearly distinguish between a Taxi and a T or an O (except for the license plate), however in terms of the service provided, it is the same. Making it even more difficult to control.
The next section of the paper will review the results of the interviews and focus groups of the permit holders to find themes and common perceptions. Following that, the results of the surveys of locals and tourists will be discussed to shed light on the use
16
Source: www.twitter.com/aruba
Section Two – Supply, Demand and Satisfaction
Based on previous studies of tourist demand and local needs for transportation, interviews were conducted with public transportation permit owners. In addition, a survey was developed to evaluate tourists’ and locals’ demand for public transportation to assess the supply and demand as well as satisfaction with the availability and timeliness of the public transportation and/or rental cars.
This section discusses the results and main findings of the qualitative part of the study. These results were obtained from the interview process and subsequent data analysis. Altogether, the data collection and analysis process had an approximate duration of three to four months. The data collected was obtained from permit holders that went through the process of requesting a permit and are currently actively working as taxi or bus drivers. It must be noted that the presented results were completely provided by the participants and the researchers had no influence on the data provided.
2.1 Focus Group Taxi’s
This section is divided into topics to gather an all-around perspective from the participants. These topics are divided into transportation issues and solutions, permit process, quality of service, control and miscellaneous The following questions were asked during the focus groups and/or interviews:
1. Please describe the permitting process as you know it.
2. Please describe the permitting process as you experienced it. How long ago was that permit granted to you?
3. Please tell us about your business in detail and how often you must deal with renewal or dealing with the Minister of Transportation regarding permitting your vehicles.
4. Do you think that the process is fair and equitable to everyone?
5. Why or why not?
6. What would you change with the process to ensure it is fair and equitable?
7. Are you satisfied with the procedures that you had to go through to get your permit?
8. Why or why not?
9. Is there a better way to determine who gets the permits from the government? Describe.
10. Do you feel that having the permit helps you in your business?
11. Do you feel that there are enough permitted drivers to deal with the number of locals and tourists on the island of Aruba?
12. Discuss supply and demand of permits and people needing transportation from your perspective
13. If you could easily get another permit or multiple permits for transportation, would you? Why or why not?
Focus group size: taxi drivers, gender distribution 3 females, 12 males the participant ranged from 10 – 34 years of work experience, and differed in how the permit was obtained, from receiving from parent, through being a helper-driver, or a political favor.
28 years with permit, father was taxi driver, sent letter to Minister, long procedure, political involvement (application)
34 years with permit, received a permit w/o name 10 years with permit, mother passed down to him 25 years with permit, was previously a “hulpchauffeur”, difficult road to receive permit 12 years with permit, applied and received within Law states w/o income, receive preference for permit
17
2
2.1.1 Transportation Problems and Solutions
P The most discussed item by the participants in transportation issues were the pirate transportation, specifically in the North area, passengers to be transported from North to Oranjestad.
P The main issues mentioned for the permit holders is in the hotel area- between the TX (Taxis), T (Tour Operators) and O (Unregulated Operators).
P The tourists do not know the difference between the three types of transportation options.
P The permit holders do not adhere to the rules stipulated by the permit. In particular, some T & O permit holders are doing the jobs of both taxis and tour operators.
P The participants stated that there is lack of information and that hotels or other hospitality companies do not provide proper explanations regarding different transportation options e.g., Taxis and O transportation.
S Tourists use Facebook to ask where they can find a taxi and inquire about extra luggage charges that they do not know about.
P/S There is some information available at the airport, but participants mentioned that Aruba.com for example, does not have enough information regarding transportation services.
P Another issue that was mentioned is overcharging. The taxi prices in Aruba are set and this still happens, because tourists are unaware of the structure or do not have the pricelist. Moreover, it was
discussed that because the O permit is not regulated, they can ask their own price, with no limit on luggage, while for taxis there is a set price. This creates a disadvantage for the taxi drivers. It appears to the tourists that the Ts and Os are doing the same service. There are over 300 permits for each of these transportation types.
The participants mentioned that at the airport, Taxis have been moved to the 2nd lane, while T and Os have moved to the 1st lane.
P Even though the permit stipulates that the transfers need to be prepaid as part of a packaged deal to pick up and drop off at the hotel/accommodation, there are instances where the O drivers offer incoming passengers the option to board on a bus vs. going outside to hail a taxi. Again, creating an unfair playing field because taxi drivers do not enter the airport arrival hall.
It was mentioned that the T and O permits have the specific conditions and rules described in the permit, however, the drivers of these vehicles do not adhere to them and are performing similar work as taxis. Permits holders have all the correct information on rules, but it needs to be enforced, as tourists do not know the difference between types of transportation options.
P It is difficult for DTP to control which tourists have prepaid the service. This creates a loophole and an environment where certain operators misuse the system. For example, there are people who act like taxis, and they do not follow the rate requirements and then people think that they are taxis, and they are T and O license plates. The permits for the T&O have
requirements of what they can do and what they cannot do. They are not permitted to act like taxis but do so anyway. There are pre-paid arrangements instead of postpaying arrangements.
P Another participant mentioned that it is hard to get around the island as there are more drivers than is needed on the island. Taxi drivers and Bus drivers are earning less because of the Ts and Os.
P The issue of control was brought up by nearly all participants numerous times. According to them, even though DTP is called to report a problem, they cannot do anything. As they do not have any BOA officers in service, and the incompliance is repeated without any consequence. This is a major issue that can affect the quality of service. The participants expressed that the department does not have adequate control.
P/S And if a complaint is made to the department, by the time they arrive, the situation has been changed/modified. There is no clear process for complaints, and it is recommended to work with certain protocols.
S Hotels can help in asking the O drivers which company they are working for. There is a need for more enforcement of the rules. More control and enforcement by the police since the DTP inspectors “cannot do anything”. Rules and regulations are there to be enforced. The department is not functioning the way it should be, the participants are not sure if this is because of lack of funds.
18
S Permits need to be given only to drivers who want to do this as their work, and as with any other job, you

S Enforcing control with the police department (this used to done) is a possible solution. DTP needs to work towards enforcement.
S Transportation solutions proposed by participants, two mentioned optimizing street lighting for more safety around Hilton and Hyatt.
S Also, to include the pricelist in each taxi’s car so that the tourist can see. In addition, have some information displayed at the lobby or waiting area at the hotels and airport. Even though there is some information at the airport, it can be optimized. Also, it is important to keep the taxi drivers informed and involved.
S When there was a booth at the airport things ran smoother and the “abuse” was not evident, or at least controlled. It is recommended to seek funding and / or support from ATA/AHATA/AA booth at the airport and seek funding for BOA officer training. specific comments made by interview/focus group participants are below:
P One call to commission would deliver nothing gets done. Participants suggested to place the control police again, but another mentioned that anymore. Another shared that there is police officer that is now on p who would do random checks and database. There used to be be there. In the evening they control for paperwork even if they have the info, but because they do not have the
P Another participant mentioned that p knowing the inspectors or other DPT employees. The r followed, control is being limited and sanctions are not possible was mentioned to train employees to become BOA so that the control and give fines or other sanctions.
P A participant mentioned that with the O permit anyone can driver with a simple drivers’ license, and there is a substantial increase in O permits (prepaid/outside US 24 hours before arrival), making it more difficult to control. Note: this has been verified by the director, because they do not need a “rijvergunning” (list of requirements) to be able to drive.
P In addition, another participant stated that the the work of a taxi once they receive a permit, because it cannot be easily controlled.
If all is regulated, you are responsible for your actions, for example, a colleague taxi driver transported six tourists in her car, the ins only for 5 passengers, she lost everything. passengers change that occurred back to 7 passengers. group (political), who are because most families are 6 or 7. primarily larger vehicles, they are taking away jobs from the Taxis.
19
P Moreover, it was stated that the bell boys at hotels are calling O. Participants said to change it back to how it was to provide better service.
The topic of Soul beach was discussed, and participants said that one entrance was used for taxis and regular cars.
S Event organizers need to consider about sidelanes (fast lanes for taxis during events) to provide a better service to tourists.
P Moreover, participants stated that the cruise area is closed off to them with no access for taxis, and they are not clear as to why. They are not able to provide the service of dropping off tourists to get back on the ship and are forced to drop them off in the middle of the road. One participant mentions the policy of a free market versus a restricted market. There is a policy regarding this decision.
The difference between other countries, more time spent in taxi equals more money, versus Aruba that has a fixed rate because distances are shorter.
S Again participants suggested to establish the commission to bring back structure and order, taking out the politics of the process, and edit the keyword “kan” (can) versus “moet”(should) in LV
Service Quality Perceptions
1. What is your perceptions of the service quality provided by the government related to transportation permits?
2. How do you believe that tourists and locals feel about the service quality provided by your product/service as it relates to transportation?
2.1.2 Quality of Service Problems and Solutions
The participants mentioned several factors to improve service quality. Including that it is essential to give the right service, it is important to take note that the infrastructure from the hotel area, downtown and airport area is 99% where they work. P Traffic plays an essential role, 45 minutes from downtown (soul beach) to Rui for example, is not due to distance, but rather to traffic.
S The government should not give permits for activities in the hotel area, the accessibility gets obstructed, for example Gianni’s. Because then there are complaints that tourists do not get a taxi right away, and people calling on the radio- saying there are no taxis. There are SO MANY taxis and they are not looking at the traffic chaos it brings to the area. Some of the specific comments made by interview/focus group participants regarding quality of service are below:
It is important to improve service and build on what we are doing right and correct what we are doing wrong.
P Participants stated that the traffic congestion affects waiting times (service delivery)
S The taxi service companies have a structure for holidays/ afterhours. The focus group participants think that specific skills are needed to be a good taxi driver, skills such as knowledge of Aruba (history of Aruba), being hospitable/friendly, knows the routes, and restaurant/ hotel locations. Also important is that they can speak the English language well, dresses appropriately, professional appearance (no shorts, slippers,
etc). They consider this a working environment and need to dress up.
S It was recommended by one participant to include a section in the Landsverordening to tackle dress codes, dirty cars, etc. DTP does not control on these factors. Cars need to be well-maintained to uphold service quality. According to the participants, whistleblowers are not taken seriously and are not appreciated, the response from DTP is often that they cannot do anything.
P Participants mentioned that when they call DTP, the response is that they have no personnel or gasoline, however they are of the opinion that they need to start somewhere. According to one participant, an ex-police officer can give a fine. Note: this was later discussed with the director, who denied this is possible
P A few participants commented that complaints, and behaviors against the law, are not being implemented or considered when renewing permit. E.g., drunk driving, overcharging, speeding. Many agreed that since they took away the control from the police it became a free for all, it was suggested to give the control back to the police.
S Certification for example to get a taxi permit in the first place and repeat after 5 years to show knowledge, and control mechanism on being a professional taxi driver. Participants mentioned that as a taxi driver is like being a tour guide, they are often the first and last point of contact, there is a need to professionalize the industry. There is a difference between those who are supposed to know versus those who know.
20
Another participant mentioned that all taxis and those in public transport should take the program, not only for knowledge but also attitude and providing service. Participants stated that tourists appreciate a talkative taxi driver, versus a driver who only responds with yes or no. A certification provides standardized and correct information, height of Hooiberg, Yamanota, etc. Taxis work at different hours so can provide training to taxis at different hours. Modify training method and hours.
P Another participant stated that there are no rules regarding hours of sleep and driving, or drinking during work, but if you are friends with the minister, you are still driving.
P Additionally, the request to tackle the pirate transportation problem, because as taxi drivers you contribute to the government by paying taxes, they do not.
S The government should introduce an app for all taxis, but available only to locals. Residents can also make use of it by uploading their ID card and get a reduced rate. The tourist will have access to the app, but the locals will get a local rate

Source: aruba-travelguide.com
close road- no participation with the taxi and other stakeholders- and tourists. Another example given was the KLM- Marathon, the area is blocked and creates a bad traffic situation, no communication to taxis and no consequences for organizers, only for tourists and taxis.
S Another participant commented that working together with the variety of the stakeholders to try to find a plan that works will help everyone. It was reiterated to keep improving communication open and increase the communication.
Also, when they develop new hotels, there should be more communication with the taxis. Same with the cruise ships. Participants also mentioned that there is a lack of communication between DTP and taxi drivers. Some of the specific comments made by
an app through Setar and it is used by concierges and hotels. Participants are also using WhatsApp and email.
P About car rentals, a participant commented that companies should provide more explanation and information to the visitors, this will make a big difference. The traffic rules are not the same as in the US.
S Participants mentioned it is important to share what kind of processes there will be moving forward and if there will be any challenges moving forward. All stakeholders such as restaurants, entertainment places, and the airport need to work together to provide the correct information. For example, from AAA N.V. they know how many passengers are coming in and what time, it would be helpful if hotels
21
could provide a similar check restaurants can provide a nightly reservation/seating chart.
st, but was
2.1.4
interview/focus group participants regarding miscellaneous issues are presented below:
The all-inclusive hotels do not provide customers; however, it was mentioned that Barcelo provides “some” business, but RUI (Westin) does not seem to need and/or does not use taxi services.
There is a total of 465 taxi permits that have been issued, there is no need for more taxi permits. According to the participants, it is the traffic situation in Aruba that complicates the flow of taxis, not the number of taxis. Previously, the bus was allowed for the workers, but now the bus is used by the tourists as well.
It was also mentioned that the quality of the tourists is different from 15 to 20 years ago. Participants said that these tourists would rather use cheaper transportation options.
The quality of tourists have changed and how they use transportation is different, catching a bus never used to happen, but they are doing that now. Changing dynamic and type of tourists.

Another point that was brought forward regarding the study is to not look at other locations when assessing this as we are unique in Aruba compared to other locations and countries.

One participant shared that the island is saturated, and it takes longer to get from point A to point B
Another participant mentioned not having a pension after many years of working in the industry. He suggested looking towards the government for supporting a pension plan for permit holders. This could be established through the Tourism Pension Fund.
22
Figure 4: Word cloud Focus Group
2.1.5 The Permit Processes
S Participants mentioned that one way to solve some of the problems is to stop with the old traditions. P It was mentioned that new permitholders who received their permit politically, are ill-mannered, do not have any communication skills and act like they are the king of the road.
P A helper-driver “Hulpchauffeur” can be any nationality and no limitation to number of years living on the island to be helper-driver. The law states that the one without income has preference over others, however in practice it is different is more who you know, having connections. It was also commented that Latin drivers entering as helper-drivers are not providing the service, they do not worry due to “parttime” status as driver. Some of the specific comments made by interview/focus group participants regarding the permitting process are presented below:

All files with complaints (Minister should request from DTP) before renewing permit, all information is available. Note: this was verified with the director and indeed everything is included in the permit holders’ file.
Participants mentioned that they agree with the policy of children (1st line) should get the permit automatically, providing they meet all criteria and are not for example an addict or so. A few agreed that
as a permit holder (owner) they have the “right” to sell (to child or anyone else), like a permit for run a restaurant. Currently anyone with a bar/restaurant can sell. Only one owner (individual) for permit, not that one company can own several permits to establish a taxi company and risk having old cars as taxis. One person one permit vs. one company 50 permits.
The current policy provides 45 vacation days as a gentleman’s agreement, it does not currently have a legal base. Previously one year with helper-driver, in sickness this needs to be unlimited. A participant mentioned that there is someone who lives in New York with helper-driver in Aruba, the permit holder comes back for a few months and goes back. This should be officially reported so that action can be taken.
According to the participants, DTP has information on all taxis (should have versus have) regarding status of taxi drivers Participants mentioned that a central database for all permits may help to view expiring insurances, permits, etc. as random controls affect the service to tourist as DTP has all information regarding permits. The same person was caught speeding, and nothing happened, there are police reports. Note: this was verified with the director and when renewing permits only the Certificate of Good Conduct is required
2.2 Focus Group Bus Drivers
Three focus groups were held with autobus drivers (B), the participants consisted of 6 females and 7 males. Ages ranges from 35 to 63 years old.
Participants shared that in the past DOPV (Currently DTP) would ask passengers to get off the bus in front of hotels, this does not happen anymore. One participant stated that employers encourage the pirate transportation. And that according to them, T and O are being used for rental houses and apartments. There was one participant that mentioned introducing a tip line for pirate transportation incidents. Participants also mentioned that it is more common on specific routes e.g., from the church in Oranjestad to the North area or vice versa. Another statement that was made was that in front of RIU there are many A-vehicles (passenger / privately owned) that drive around and pick-up employees. These are suspected to be pirate drivers. Participants also mentioned that the pirate transportation rates are lower than the taxi rates, but not much different from the autobus rate and they pick you up at home and drop you off in front of your destination. One of the participants suggested putting extra bus stops in the more densely populated neighborhoods.
Participants shared that there are different types of autobus permits, namely big (grote) auto bus and small (kleine) autobus. A participant mentioned that DTP does not have authority to do anything about the pirate transportation, they cannot give them a fine, only the police can do that. Another one mentioned that whistleblowers get reprimanded. One participant suggested to do mystery shopping by calling the pirate transportation numbers and exposing them during the act. It was also mentioned that sometimes the T and O companies drop off cruise passengers at Eagle Beach and leave them stranded, even though they were charged beforehand. All participants agreed that they do not think there should be more buses. The peak hours are from 3-5pm.
The participants also stated that there is an unequal market with Arubus, because the Arubabus services are promoted on the cruise ships at a special rate of $2.50 for tourists. This takes away from the autobuses on that route.
It was also mentioned that their income has decreased, there is a lot of traffic and the flow of passengers. More locals make use of the small autobuses. The participants state that there is no need for more auto bus permits, business is difficult as it is.
Participants also said that DOW took away the bus stops and replaced with taxi stands, this is not optimal for the autobus vehicles. Some participants suggested a central bus station that goes to all districts. In addition, they mentioned that the O permits are affecting the autobus business. They also mentioned that DTP does not have enough personnel or authority to issue control, and they cannot exist to control on the pirate transportation.
Participants also stated that taxi drivers are picking up passengers at the bus stops. While it is not possible for the buses to drive up to the hotel lobby. Everything has increased, insurance, taxes, etc. The particip ants also mentioned that as a large (grote) autobus driver you get a helper-driver for five years. And for the small (kleine) autobus you get for three months.
The focus group participants mentioned that locals are happy with the service, they give them an extra florin sometimes to drop them off closer, some passengers to not like to wait until the bus is full.
24
2.3 Summary of Interview/Focus Group Information/ Recommendations
Problem Solution
1. Pirate Transportation – Locals prefer to pay a lower rate of 10fl versus regulated taxi fares
2. O Transportation
a) The tourists do not know the difference between the three types of transportation options.
b) Permit holders do not adhere to the rules stipulated by the permit
c) O permit holders are doing the jobs of both taxis and tour operators
d) Bell boys call O transportation companies
e) Taxi is limited to 5 passengers, but O is not.
f) Difficult for DTP to control if tourist prepaid for service 24 hours before arrival, it becomes “open game”
g) Technology creates loopholes to cheat the system e.g. sending a WhatsApp to a O transportation company on arrival. How can DTP control?
h) Substantial increase in these types of permits
3. Lack of information:
a) Tourists use social media to inquire about fares
b) Tourists use Aruba.com to find information
c) Missing information at airport and hotels
4. Overcharging
a) O permit is not regulated, they can ask their own price (no limit vs. taxis set price)
5. Airport / Cruise Terminal
a) Taxis moved to 2nd lane and T & O to 1st lane at airport
b) Unfair playing field at airport, O allowed to go inside and solicit passengers
c) O drivers offer incoming passengers the option to board on a bus vs. going outside to hail a taxi
d) Taxis are dropping off tourists in the middle of the road at Cruise terminal, unsafe
6. Lack of Control
a) DTP does not have any BOA officers and cannot act if a violation is identified or reported
i. Tip line when identified
ii. Mystery shoppers’ concept, expose drivers
iii. Substantial fines or sanctions for pirate transportation drivers
i. Enforcing control with the police department (this used to be how it was done) is a possible solution. DTP needs to work towards enforcement.
ii. Rules are to be followed, strict sanctions for those who do not follow
iii. Stricter rules/criteria for granting O permits
Recommendation
- Campaign against pirate transportation e.g., 131
- Consider increasing fines e.g., https://www.ilent.nl/onderwerpen/illegaaltaxivervoer-snorders
- Revise the O permit law in the LV Personenvervoer and change to have better control and implementation, eliminate loopholes
- Introduce similar requirements for all other public transportation permits.
i. To include the pricelist in each taxi’s car so that the tourist can see.
ii. Have some information displayed at the lobby or waiting area at the hotels and airport.
iii. Provide more visible information on Aruba.com
i. Strict rules for breach of regulations
i. Reinstate the dispatcher booth at airport for better control on O permit holders
ii. Re-evaluate the policy on allowing taxi drivers at Cruise Terminal
- New policy all taxis must have pricelist in car or QR-code sticker.
- QR-code or pricelist at hotels or concierge
- Include transportation section on Aruba app
ii. Train BOA officers at DTP
iii. Better procedures and structure for control and implementation -
- Seek collaboration with industry partners such as AAA N.V., AHATA, ATA, TPEF for funding
- Seek KPA collaboration for employees without formal degree, but with years of experience to participate in BOA training
25
b) If a complaint is made to the department, by the time they arrive, the situation has been changed/modified
c) The incompliance is repeated without any consequence, may affect quality of service
d) The department is not functioning the way it should be, the participants are not sure if this is because of lack of funds.
7. Permits and Quality
- Legal adviser specifically for transportation issues and cases
a) Permits need to be given only to iii. Training or Certificate for
- Include a capability test, training and/or Source:
26
www.twitter.com/aruba
Section Three - Survey Results
A
3.1 Tourists
3.1.1 Demographic Results
After data was collected, the data set was cleaned up and there was a total of 195 tourists that completed the survey. The majority of surveys were completed in person during survey collection in July and August with 109 surveys collected in person and 85 surveys collected online using Facebook, QR code, emails, and other forms of social media spreading the word about the survey data collection.
The survey respondents had a slightly skewed distribution related to gender (Female 54.9%, Male 36.4 %), and there was a low percentage of people that did not disclose their gender (2.1%). The age groups were dominated by the ‘over 54’ age group having 53.3% of the respondents while 25-34 had 6.7%, 35-44 had 15.4%, and 45-54 had 13.8% of the respondents, while 10.8% did not complete the item. When asked about the highest level of education completed, the majority had a Bachelor’s degree (29.2%) and Graduate degrees (15.9%) which could be due to the age of the respondents.
Table 11: Demographic Profile of Tourist Respondents to Aruba Transportation Survey Demographics Categories Frequency Percentage
Gender Female 107 54.9 Male 71 36.4 Non-Respondent 17 8.8 Age 25-34 13 6.7 35-44 30 15.4 45-54 27 15.5 Over 54 104 53.3 Non-Respondent 21 10.8
Local/Tourist Local 6 3.1 Tourist 178 91.3 Non-Respondent 11 5.6
Ethnic Group
Caucasian 163 83.6 African-American 4 2.1 Hispanic 3 1.5 Asian 5 2.6 Multi-racial 1 .5 Others Non-respondents 4 15 2.1 7.7
Education
High school degree or lower 25 12.8 Some college or Associate degree 26 13.3
Bachelor's degree 57 29.2 Master/Doctorate degree 31 15.9 Prefer not to mention 56 28.7
Annual income in US dollars
Less than $ 20,000 3 1.5 $20,001-$49,999 5 2.6 $50,000-$79,999 22 11.3 $80,000-$99,999 17 8.7 $100,000 or more 68 34.9 Prefer not to mention 80 41.0
There were 28.7% that did not respond to this question, 13.3% had an Associate’s degree, and 12.8% of the respondents had a high school diploma or less. For ethnicity of the respondents, the vast majority responded white (83.6%), see Table 11 above for more information. The income of the respondents was varied, but the majority of respondents had more than $100,000 in annual income (34.9%). However, 41% of respondents preferred not to disclose their income. See Table 1 below for more details on the demographic responses for the Aruba Transportation survey completed by tourists to Aruba.
The majority of the respondents have been to Aruba before 142 (72.8%) and 34 of respondents stated that it was their first time (17.4%). Of those repeat visitors, the vast majority have been to Aruba more than 10 times.
Table 12: Number of Visits to Aruba 1st time 2-4 times 5-7 times 8-10 times More than 10 times How many times have you been to Aruba? 34 39 17 7 79
27 3
The surveys used to assess tourists’ and locals’ perceptions of transportation on the island of Aruba is shown in Appendix
3.1.2 Public Transportation Results
After data was collected, the data set was cleaned up and there was a total of 195 tourists that completed the survey. See Tables 13-18 below for more details on the responses regarding the use of and perception of transportation in Aruba by tourists to Aruba.
Table 13: How often do you use the following modes of transportation when in Aruba
Modes of Transportation 1-never 2 3 4- daily 5 6 7-multiple times per day
Rental Cars 115 15 4 23 2 3 32 Taxicabs 42 62 32 35 2 7 8 Mini-Buses 150 14 6 5 2 0 11 Autobuses 159 9 5 3 0 0 11 Tour vehicles 141 31 2 3 1 0 9 Other public transportation 166 5 5 2 0 0 10
Other
Some of the other transportation responses were: walking, bicycle, friends’ cars, DePalm transfer, private transportation.
Table 14: How reliable would you rate the following modes of transportation during your use on Aruba
Modes of Transportation 1-not reliable 2 3 4neutral 5 6 7-extremely reliable NA- do not use
Rental Cars 3 7 10 6 45 117 Taxicabs 0 2 2 5 9 27 98 45 Minibuses 2 0 3 3 3 10 14 154 Autobuses 2 1 2 1 4 4 8 166 Tour vehicles 1 1 0 3 4 8 23 147 Other public transportation 1 0 1 1 2 2 1 176 Other 1 0 0 0 1 2 6 145
Some of the other public transportation options written were: Car of friends, DePalm airport transfer, private transportation
Table 15: How timely and efficient are the following modes of transportation in Aruba? Modes of Transportation 1-not timely at all
2 3 4- average timeliness 5 6 7-extremely on time and efficient NA- do not use
Rental Cars 0 0 2 17 7 4 44 117 Taxicabs 0 1 2 14 8 24 95 43 Minibuses 0 0 1 12 3 6 5 158 Autobuses 0 0 0 8 0 3 5 169 Tour vehicles 0 1 1 6 2 6 20 149 Other public transportation 0 0 0 3 0 1 1 178 Other 0 0 0 1 0 1 6 144
Some of the other public transportation options written were: Car of friends, DePalm airport transfer, private transportation
Table 16: How satisfied are you with the following modes of transportation on Aruba Modes of Transportation 1-not at all satisfied 2 3 4- neutral 5 6 7-very satisfied NA- do not use
Rental Cars 2 1 0 11 8 9 41 112 Taxicabs 1 4 3 11 5 32 84 41 Minibuses 2 0 2 4 2 10 8 150 Autobuses 2 0 0 4 1 6 5 161 Tour vehicles 1 1 0 6 3 4 18 144 Other public transportation 1 0 0 4 0 1 0 170 Other 1 0 1 1 0 1 5 142
Some of the other public transportation options written were: Car of friends, DePalm airport transfer, private transportation
28
Table 17: How would you rate the service quality of the following modes of transportation on Aruba Modes of Transportation 1-terrible 2 3 4- average 5 6 7-extremely great service quality NA- do not use
Rental Cars 0 0 1 13 11 12 35 116
Taxicabs 0 0 1 11 11 28 93 40
Minibuses 0 0 0 10 4 5 8 156 Autobuses 0 0 2 7 2 1 6 164
Tour vehicles 0 0 1 5 2 4 21 147 Other public transportation 0 0 0 2 0 1 1 173 Other 0 0 0 1 0 2 5 145
Some of the other public transportation options written were: Car of friends, DePalm airport transfer, private transportation. Overall, the responses from tourists stated that no one perceived the transportation on the island as terrible, for rental cars 49% thought that they had extremely great service quality, the majority of respondents thought that taxicabs were extremely great in service quality (64.6%), and 63.6% of respondents thought tour vehicles were extremely great in service quality.
Table 18: How would you rate the tour operators in Aruba individually?
Source 1-poor 2 3 4-neutral 5 6- 7- very good NA- do not use
DePalm tours 4 0 1 5 3 9 27 133 ABC tours 3 0 1 3 0 4 8 160
Around Aruba tours 2 0 2 2 0 1 1 171
Fofoti tours 2 0 1 3 0 2 2 168 Kini Kini tours 2 0 1 1 0 1 2 171
Pelican Adventures 2 0 0 4 1 5 7 158 Isla Aruba tours 2 0 0 2 0 1 2 170 Other 2 0 1 0 0 0 15 130
Some of the other island tour companies that were noted on the survey were: ATV, Black Pearl, El Tours, HARA, Jolly Pirate, Red Sail, Tranquilo, Walking Tour
The following response relates to the question ‘When you call a taxicab, how long does it normally take to get one?’ (Min 1 Max 7, mean 1.47 SD .919, N 156). This response shows that on average, the taxis are very timely and pick up the guests in 0-5 minutes for 70% of the respondents and 6-10 minutes for 23% of the time. Overall, that means that cabs are available within 10 minutes to over 93% of the respondents of the study. See Table 19.
Table 19: When you call a taxicab, how long does it normally take to get one?’ Min 1 max 7, mean 1.47 SD .919, N 156. 0-5 minutes 6-10 minutes 11-15 minutes 16-20 minutes 21-25 minutes 26-30 minutes More than 30 minutes
When you call a taxicab, how long does it normally take to get one?
106 38 6 3 1 1 1
The following response relates to the question ‘When you use a bus, how often is it on time to pick you up where and when it was supposed to?’ (Min 1 Max 7, mean 3.22, SD 2.439, N=88). This response shows that on average, the buses are not very timely, as only 17% of respondents stated that the buses are always on time, and 52% of respondents stated that buses are never on time. Overall, the mean response was that buses were on time less than half of the time. See Table 20. When it comes to other transportation, the majority stated that it was never on time (58.9%).
Table 20: When you use a bus, how often is it on time to pick you up where and when it was supposed to? Min 1 max 7, mean 3.22, SD 2.439, N=88. 1never 2 3 4- half of the time 5 6 7- always
When you use a bus, how often is it on time? 46 1 0 8 10 8 15
29
Table 21: When you use other transportation, how often is it on time to pick you up where and when it was supposed to? Min 1 max 7, mean 2.77, SD 2.313, N-78. 1never 2 3 4- half of the time 5 6 7-always
When you use other public transportation, how often is it on time to pick you up?
46 2 0 8 5 10 7
Overall transportation as evaluated by tourists was rated as very close to excellent on the average (6.11). In total, 57.4% rated overall transportation as excellent. See Table 22.
Table 22: Overall Transportation on Aruba- min 1 max 7, mean 6.11 SD 1.376, N=129 1-poor 2 3 4- moderate 5 6 7-excellent
How would you rate the overall transportation on the island of Aruba?
3 2 2 7 17 24 74
A small percentage of tourists rent cars (24.7% rent cars at least half the time that they visit Aruba. See Table 23.
Table 23: How often do you rent a car? N=185, Min 1, max 7, 2.62, SD 2.456 1never 2 3 4- half of the time 5 6 7-always How often do you rent a car when you visit Aruba? 116 15 2 6 3 7 36
The various companies used for rental cars are listed below: Avis 2 Budget 6 Hertz 3 Jays 1 More for less 1 Royal 4 Tropic 8 Varies according to price 4 Wheels to go 4
Car Rental Experiences
Table 24: How convenient is the rental car process? N=68, Min 2, max 7 mean 5.91, SD 1.494 1-not convenient 2 3 4moderately convenient
5 6 7- extremely convenient
How convenient is the rental car process? 0 4 2 6 5 6 36
Table 25: How clean is your rental car? N=70, Min 3, max 7, mean 6.17, SD 1.142 1-not clean 2 3 4moderately clean
5 6 7- extremely clean
How clean is your rental car? 0 0 3 5 7 17 38
Table 26: What condition is your rental car in when you get it? N=70, Min 3, max 7, mean 5.87, SD 1.128 1-poor 2 3 4moderate 5 6 7- excellent
What condition is your rental car in when you get it? 0 0 2 8 13 21 26
In the car rental area, tourists perceived the process itself was very convenient. See Table 24. They also felt the car that they rented was more than moderately clean (88.6%) and The car was in very good condition or more in 67.4% of the cases. See Tables 25 and 26.
30
Miscellaneous Comments on Transportation in Aruba
When ranking the most important (8) to least important (1) transportation issue in Aruba, tourists stated that value for money was most important and safety and timeliness rounded out the top 3.
Table 27: Rank Order of Most Important to Least Important regarding Transportation on Aruba Value for money 5.63 Safety 4.39 Timeliness 4.17 Cleanliness 3.93 Price 3.85
The top hours for the use of public transportation on Aruba for tourists were between 6pm-9pm (122) followed by 9am-12pm (47).
Table 28: Top Hours for Transportation Usage on Aruba
6-9am 16 9-12pm 47 12pm-3pm 32 3-6pm 44 6-9pm 122 9pm-12am 9
31
Source: www.twitter.com/aruba
3.2 Locals
The survey for the current study to assess locals’ perceptions of transportation on the island of Aruba is shown in Appendix B.
3.2.1 Demographic Results
After data was collected, the data set was cleaned up and there were a total of 574 locals that completed the survey. The survey respondents had a slightly skewed distribution related to gender (Female 49.3%, Male 40.9%), a low percentage indicated they identify as non-binary/third gender (3.3%) and there was a low percentage of people that did not disclose their gender (6.5%). The age groups were dominated by the 18-24 (41.6%) and 25-34 (24.1%) age groups. When asked about the highest level of education completed, the majority had a high school Diploma (46.5%) and Bachelor’s degrees (19.5%) which could be due to the age of the respondents. There were 3.7% that did not respond to this question, 13.4% had an Associate’s degree, 7.8% had a Graduate degree and 9.1% of the respondents had less than a high school diploma. For ethnicity of the respondents, the vast majority responded Aruban (63.2%), see Table 29 below for more information. The income of the respondents was varied, but the majority of respondents had under Awg. 20,000 in annual income (41.5%). With, 6.6% of respondents preferred not to disclose their income, 26.8% earning between Awg. 20,000 and Awg. 49,999. See Table 29 below for more details on the demographic responses for the Aruba Transportation survey completed by locals.
Table 29: Demographic Profile of Local Respondents to Aruba Transportation Survey Demographics Categories
Frequency Percentage
Gender Female 283 49.3 Male 235 40.9 Non-Binary/Third Gender 19 3.3 Non-Respondent 37 6.5
Age 18-24 230 40.1 25-34 133 23.2 35-44 82 14.3 45-54 67 11.7 55-64 34 5.9 Over 64 7 1.2 Non-Respondent 21 3.7
Ethnic Group
Aruban 363 63.2 African-American 16 2.8 Asian 17 3.0 Hispanic 78 13.6 Multi-racial 42 7.3 Others Non-respondents 36 22 6.3 3.8
Education
Some high school but no diploma 52 9.1 High school diploma 267 46.5 Associate degree 77 13.4 Bachelor's degree 112 19.5 Graduate degree 45 7.8 Prefer not to mention 21 3.7
Annual income
Aruban Florins
Less than Awg. 20,000 238 41.5 Awg. 20,001-49,999 154 26.8 Awg. 50,000-79,999 91 15.9 Awg. 80,000-99,999 28 4.9 Awg. 100,000 or more 25 4.4 Prefer not to mention 38 6.6
32
3.2.2
Public Transportation Results
After data was collected, the data set was cleaned up and there was a total of 574 locals that completed the survey. See Tables 30-34 below for more details on the responses regarding the use of and perception of transportation in Aruba by locals.
Table 30: How often do you use the following modes of transportation when in Aruba Modes of Transportation 1-never 2 3 4- daily 5 6 7-multiple times per day
Rental Cars 401 97 27 20 8 5 14
Taxicabs 448 69 24 10 9 4 4
Buses 343 75 49 65 11 8 17
Mini(Auto) Buses 383 67 46 47 9 8 11 Tour vehicles 416 91 27 14 11 3 6 Other public transportation 455 34 24 22 12 5 15
Some of the other public transportation options written were: Personal car, uber/lyft, pirate taxi
Table 31: How reliable would you rate the following modes of transportation during your use in Aruba Modes of Transportation 1-not reliable 2 3 4- neutral 5 6 7-extremely reliable NA- do not use
Rental Cars 58 20 25 44 56 48 98 207
Taxicabs 57 24 29 52 45 36 81 225 Buses 50 22 46 63 87 50 75 162 Mini(Auto)Buses 44 24 60 71 60 47 48 204 Tour vehicles 56 19 28 46 47 46 64 250 Other public transportation 71 27 21 36 21 25 29 319
Some of the other public transportation options written were: Personal car, uber/lyft, pirate taxi
Table 32: How timely and efficient are the following modes of transportation in Aruba Modes of Transportation 1-not timely at all 2 3 4- average timeliness 5 6 7-extremely on time and efficient NA- do not use
Rental Cars 56 10 23 90 29 47 88 212
Taxicabs 62 16 23 100 28 39 49 234 Buses 58 26 39 152 46 33 42 161
Mini(Auto)Buses 52 29 48 128 50 27 29 196 Tour vehicles 60 14 21 70 30 40 61 254 Other public transportation 63 12 27 67 17 19 16 321
Some of the other public transportation options written were: Personal car, uber/lyft, pirate taxi
Table 33: How satisfied are you with the following modes of transportation on Aruba Modes of Transportation 1-not at all satisfied 2 3 4- neutral 5 6 7-very satisfied NA- do not use
Rental Cars 54 13 17 69 42 49 87 224
Taxicabs 53 21 22 66 38 45 49 253 Buses 39 18 51 100 61 51 52 186 Mini(Auto)Buses 49 18 37 107 51 45 34 214
Tour vehicles 55 10 20 56 51 36 53 265 Other public transportation 60 13 14 65 21 20 24 330
Some of the other public transportation options written were: Personal car, uber/lyft, pirate taxi Overall, the responses from locals on the island of Aruba were very diverse. The most used and rated transportation was buses and then mini(auto) buses. For rental cars, more than 20% were not satisfied (rated 1 or 2) and 41% rated them as satisfied to very satisfied (7 or 8). Taxis were rated as not very satisfied in 25.2% of the cases (rated 1 or 2) and 32% rated them as satisfied to very satisfied (7 or 8). For buses, only 15.3% of respondents were not satisfied (rated 1 or 2) and 27.7% rated them as satisfied to very satisfied (7 or 8). With mini (auto) buses, 19.6% were not satisfied (rated 1 or 2) and 23.2% rated them as satisfied to very satisfied (7 or 8), the majority were neutral with those. For tour vehicles, more than 23% were not satisfied (rated 1 or 2) and 31.7% rated them as satisfied to very satisfied (7 or 8).
33
Table 34: How would you rate the service quality of the following modes of transportation on Aruba Modes of Transportation 1-terrible 2 3 4- average 5 6 7-extremely great service quality NA- do not use
Rental Cars 39 12 20 108 39 57 65 214
Taxicabs 37 8 22 90 45 49 51 247 Buses 28 9 40 154 53 47 43 183 Mini(Auto)Buses 33 14 48 148 43 33 27 209 Tour vehicles 44 4 14 83 48 36 56 267 Other public transportation 45 12 17 80 22 18 17 333
Some of the other public transportation options written were: Personal car, uber/lyft, pirate taxi Overall, the responses from locals showed that most respondents were neutral in their perceptions of the Service quality in transportation. The worst service quality was evaluated as mini(auto) buses (29.5% rated 3 or lower) and the best service quality was evaluated as rental cars (47.3% rated a 5 or higher). See Table 34.
The following response relates to the question ‘When you call a taxicab, how long does it normally take to get one?’ .This response shows that on average, the taxis are usually between 6-20 minutes to pick locals up and are therefore not very timely. Only 12.7% of locals are picked up in 0-6 minutes, while 26.9% of people don’t get a cab until between 11-15 minutes. Overall, that means that cabs are available within 10 minutes to 35% of the respondents of the study. See Table 35.
Table 35: When you call a taxicab, how long does it normally take to get one? Min 1 max 7, mean 3.24 SD 1.58, N 471
Taxi Time 0-5 minutes 6-10 minutes 11-15 minutes 16-20 minutes 21-25 minutes 26-30 minutes More than 30 minutes When you call a taxicab, how long does it normally take to get one?
60 104 127 94 38 23 25
The following response relates to the question ‘When you use a bus, how often is it on time to pick you up where and when it was supposed to?’ This response shows that on average, the buses are less timely than taxis are and that 60% of the responded stated that buses are NOT where and when it is supposed to be there more than half of the time. Overall, the timeliness of buses and mini(auto) buses are not good and consistent for the locals of Aruba See Table 36 for information about buses and Table 37 for the information on ‘other’ modes of transportation.
Table 36: When you use a bus, how often is it on time to pick you up where and when it was supposed to? N=392, mean 2.84 SD 2.41
Bus Time 1never 2 3 4- half of the time 5 6 7- always
When you use a bus, how often is it on time? 62 29 49 95 69 39 49
Table 37: When you use other transportation, how often is it on time to pick you up where and when it was supposed to? N=295, mean 2.02 SD 2.29
Other Transportation Time 1never 2 3 4- half of the time 5 6 7-always
When you use other public transportation, how often is it on time to pick you up?
57 14 48 83 48 17 28
The following response relates to the question ‘How would you rate overall transportation on Aruba?’ where 1=poor and 7=excellent. This response shows that on average, local respondents perceive transportation as less than moderate, or leaning more towards poor. The mean response was 3.54/8 and the majority of respondents rated it as moderate to less than moderate (49.3% rated it 3-4).
Table 38: Overall Transportation on Aruba? N=540, mean 3.54 SD 1.62 1-poor 2 3 4- moderate 5 6 7-excellent
How would you rate the overall transportation on the island of Aruba?
91 43 108 158 85 29 26
34
When ranking the most important (8) to least important (1) transportation issue in Aruba, locals stated that they rated value for money as the most important, safety and cleanliness as the next two. The least important was price. These were only slightly different than tourists who rated service quality as the least important.
Table 39: Rank Order of Most Important to Least Important regarding Transportation on Aruba Value for money 5.29
Safety 4.49 Cleanliness 4.02 Timeliness 4.01 Reliability 3.61
Service Quality 3.46 Price 3.09
Table 40: Top Hours for Transportation Usage on Aruba 6-9am 207 9-12pm 120 12pm-3pm 155 3-6pm 125 6-9pm 109 9pm-12am 67 12am-3am 29 3am-6am 20 Source: www.facebook.com/dowaruba
The top hours for the use of public transportation by locals on Aruba were between 6am-9am (207) followed by 12pm-3pm (155). This response was different for locals (more shift change time) than for tourists (dinner time primarily).
In the survey of the locals, more than 23% of respondents have used pirate transportation before.
3.3 Permit Holders Survey Results
A survey of permit owners was completed during September/October, 2022 and the results are presented below.
3.3.1 Demographic Results
After data was collected, the data set was cleaned up and there were a total of 104 permit owners that completed the survey. The surveys were collected online using Facebook, QR code, emails, and other forms of social media spreading the word about the survey data collection. The survey respondents had a skewed distribution related to gender (Female 28.8%, Male 70.2%). The age groups were slightly higher in 35-44 age group having 27.9% of the respondents while 55-64 had 26%, 25-34 had 11.5%, and 45-54 had 22.1% of the respondents, and Over age 64 had 11.5%. The types of permit holders varied, but the predominant permit holders were Taxi with 86.5% of the respondents. When asked about the highest level of education completed, the majority had a high school degree or lower (55.8%) and some college or Associate’s degree (26.9%). For average hours per day worked, the largest category was in the 7-8 hour per day range (34.6%) and more than 10 hours per day was the next highest category with 26% of respondents. For the number of days per week that the respondents worked, the vast majority worked 6 days per week (48.1%) and 25% worked between 5-6 days per week. See Table 1 below for more details on the demographic responses for the permit holders survey completed in Aruba during Fall 2022.
Table 42. Demographic Profile of Permit Holders Who Responded to Transportation Survey Demographics Categories Frequency Percentage
Gender Female 30 28.8 Male 73 70.2 Non-Respondent 1 1
Age 25-34 12 11.5 35-44 29 15.4 45-54 23 15.5 55-64 27 53.3 Over Age 64 12 10.8
Type of Permit Taxi (TX) 90 86.5 Bus (B) 11 10.6 Tourist (T) 1 .9
Education
High school degree or lower 58 55.8 Some college or Associate degree 28 26.9 Bachelor's degree 6 5.8 Master/Doctorate degree 0 0 Other 11 10.6
Average hours per day worked Less than 7 10 9.6 7-8 36 34.6 9-10 25 24.0 More than 10 hours per day 27 26 It varies 6 5.8
Number of days per week worked Less than 4 5-6 6 7 Varies
1 26 50 22 7
1 25 48.1 21.2 6.7
When asked if they were willing to follow training to provide better service to my passengers, 75% stated yes and 10.6% stated no, while 14.4% did not respond to the question. When asked if they agreed with increasing the number of passengers from 5-7, 50% agreed, 26.9% disagreed, and 23.1% did not respond to the question. When asked if they were a member of a taxi service provider, 57.7% stated yes, 26.9% stated no, and 15.4% did not respond to the question. When asked if they had ever worked as a helper driver, 55.8% stated yes, 39.4% stated no, and 4.8% did not respond. When asked if they felt that the permit ‘belonged to them’, 56.7% stated yes, 35.6% stated no, and 7.7% did not respond.
36
Section Four – Recommendations and Conclusion
This report was produced by using primary and secondary data collected during the month of May-August 2022, including but not limited to interviews, site visits, observations, secondary data, and surveys collected. The focus of this study is on the taxis, car rentals and buses. Interview content was assessed using content analysis and thematic coding. Statistical analysis for the survey results will be done using SPSS v. 28.
4.1 Recommendations
1. Hire and train more people in the office to effectively review permit applications and make the process more efficient
2. When looking at the number of permits allowed, permits registered at DTP, and registered with the tax office (SIAD), the taxicabs are the group that has the highest percentage of following policies (100%), while all of the rest of the groups have permit holders who are not registered with the tax office. If they are not using their vehicle permits, they should be forced to return it to allow it to be issued again.
3. Establish and start the Passenger Transport Commission that was discussed in the pastcreate a 3–5-person commission to streamline the process
4. Have a maximum number of renewals or tighter standards on renewals based on registered tax paying permits being used
5. Increase the communication at the airport and other locations to tourists to ensure that they are aware of the taxis, buses, and other transportation so that the playing field is level and that the tourists are aware of people that are not following the guidelines and rules that were established for them.
6. Increase communication related to more visible communication on rates to different parts of the island, types of permits
7. Taxi drivers are not allowed in the airport arrival hall, and this creates an unfair advantage for tour operators or bus drivers. They also moved cabs to the far lane of the pick-up area at the hotel, this could be changed.
8. Timeliness of complaints related to this unfair practice noted above is not working and there needs to be more done to enforce the restrictions and protocols that are in place. This could be through an online complaint process, more people that are hired to enforce this, revert to having no one allowed in the airport arrivals area, move cabs to a closer lane to the airport, and having a designated, easier process to get a cab.
9. Hire designated police officers for the airport or give DTP inspectors more authority to ticket or to pull permits
10. Establish a tip line to report pirate transportation incidents, mystery shopper project to expose driver and share via social media and introduce substantial fines or sanctions for pirate transportation drivers.
37 4
4.1.1 Tourist Survey Key Findings and Recommendations
1. In general, tourists find the transportation on the island to be very good to great. For rental cars, 49% of tourists thought their service quality was extremely great. The majority of tourists thought that taxicabs were extremely great with regards to service quality (64.6%) and 63.6% of tourists thought that tour vehicles had great quality as well.
2. Tourists perceived cabs to be very timely on the island with more than 70% of respondents stating that cabs took between 0-5 minutes to arrive, more than 93% of respondents stated that their cab arrived within 10 minutes or less of being asked for or called.
3. 52% of tourist respondents stated that buses were never on time and the mean response was half of the time the buses were on time.
4. The majority of respondents (58.9%) stated that other transportation was never on time.
5. Overall, 57.4% of tourists stated that transportation was excellent with the mean response at 6.11 out of 7.0!
6. Only 24.7% of tourists rent cars while in Aruba, but of those that do, they thought the process was convenient and the car was moderately clean and in good condition.
7. The most important issues to tourists regarding transportation were value for money, safety, and timeliness. The least important issues were service quality and reliability. This could be since the tourists were on vacation and were not hard pressed for reliable transportation as many could walk to dining options.
8. The time that tourists use public transportation the most during their time in Aruba is 6-9pm (44.5%), presumably for dining locations, and from 9am-12pm (17.2%).
Source: www.facebook.com/dowaruba
38
4.1.2 Local Survey Key Findings and Recommendations
1. There was a note regarding buses earlier seeing a decline in Arubus users and one of the findings from the local survey was that 60% of respondents found that buses were not where they were supposed to be at the times they were supposed to be there. This shows a lack of consistency in the transportation method.
2. In general, locals have mixed feelings with regards to public transportation. Locals use buses and mini(auto) buses the most for transportation. Satisfaction for buses and mini(auto) buses were predominantly neutral with about 18% not satisfied and 25% satisfied/very satisfied. For tour vehicles, 23% of locals were not satisfied with them. For taxis, 25.2% of locals were not satisfied with them.
3. For service quality, locals rated the worst service quality as mini(auto) buses (29.5% rated 3 or lower out of 7). The best service quality was evaluated as rental cars (47.3% rated a 5 or higher out of 7).
4. Locals perceived cabs to be moderate in timeliness with an average of 6-10 minutes for a cab to get there. Only 12.7% of locals were picked up in 0-5 minutes and more than 26.9% of locals don’t get a cab for 11-15 minutes.
5. More than 60% of locals stated that buses were on time less than ½ of the time. Overall, the timeliness for buses and mini(auto) buses was not good or consistent.
6. The majority of respondents (68.5%) stated that other transportation was on time less than half of the time.
7. Overall, the majority of locals perceived transportation on the island as less than moderate and leaning more towards poor. The mean response was 3.54 out of 7.

8. The most important issues to locals regarding transportation were value for money, safety and cleanliness. The least important issues were service quality and price. The primary difference between locals and tourists are that tourists had timeliness higher than cleanliness.
9. The time that locals use public transportation the most is 6am-9am (29.4% of responses), presumably for transportation to work, and from 12pm-3pm (19.7%) possibly for shift change transportation.
Source: www.facebook.com/dowaruba
39
References
Alkheder, S. A. (2016). Transportation and tourism sustainability in major Jordanian tourism cities. Tourism Planning & Development, 13(3), 253-273.
Bajada, T., & Titheridge, H. (2017). The attitudes of tourists towards a bus service: implications for policy from a Maltese case study. Transportation research procedia, 25, 4110-4129.
CBS (2018)
Censo (2020)
Gutiérrez, M. D., Tørset, T., Skjetne, E., & Odeck, J. (2017). Tourist traffic simulation as a protected area management tool. The case of Serengeti National Park in Tanzania. Tourism management perspectives, 22, 54-63.
Haron, S., Noor, S. M., Sadullah, A. F. M., & Vien, L. L. (2010). The headway patterns and potential parameters of bus transportation in Penang. Proceeding of Malaysian Universities Transportation Research Forum and Conferences, 279-310. https://www.researchgate.net/profile/SuriaHaron/publication/282866749_THE_HEADWAY_PATTERNS_AND_POTENTIAL_PARAMETERS_OF_BUS_T RANSPORTATION_IN_PENANG/links/562090e008aed8dd19404a5e/THE-HEADWAY-PATTERNS-ANDPOTENTIAL-PARAMETERS-OF-BUS-TRANSPORTATION-IN-PENANG.pdf
Ismail, I. K., Leh, O. L. H., & Zaki, Z. A. (2017). An evaluation of urban public transport route. Case study: Hopon hop-off, Kuala Lumpur, Malaysia. PLANNING MALAYSIA: Journal of the Malaysian Institute of Planners, 15(2), 109-122.
Prideaux, B. (2000). The role of the transport system in destination development. Tourism management, 21(1), 53-63.
Rizal, P. R., & Asokan, R. (2013). Role of transportation in tourism industry in Sikkim State, India. International Journal of Innovative Research and Development, 2(6), 336-346.
Saenz-de-Miera, O., & Rosselló, J. (2012). The responsibility of tourism in traffic congestion and hypercongestion: A case study from Mallorca, Spain. Tourism Management, 33(2), 466-479.
Thompson, K., & Schofield, P. (2007). An investigation of the relationship between public transport performance and destination satisfaction. Journal of transport geography, 15(2), 136-144.
Zainol, R. (2018). Big Data in Urban Planning. In Data Science Research Symposium 2018 (p. 38).
40
Research Team
Dr. Robin Di Pietro robin.dipietro@hrsm.sc.edu
University of South Carolina, College of Hospitality, Retail and Sport Management
Jo-Anne Croes jo-anne.croes@ua.aw
University of Aruba, Faculty of Hospitality & Tourism Management Studies
John Wardlaw john.wardlaw@ua.aw
University of Aruba, Faculty of Hospitality & Tourism Management Studies
Acknowledgements
We would like to thank all contributing stakeholders and interviewees for their valuable time.
41
Transportation Survey
I work with the University of Aruba, and we wish to find out about your perception of and satisfaction with the transportation in Aruba. I would like to ask you to respond to the following questions about the various forms of transportation on the island including rental cars, taxicabs, buses, tour vehicles, and other public transportation.
1) How often do you use the following modes of transportation when in Aruba? (1=never, 4=daily, and 7=multiple times per day)
Rental cars 1 2 3 4 5 6 7
Taxicabs 1 2 3 4 5 6 7
Mini-buses 1 2 3 4 5 6 7 Autobuses 1 2 3 4 5 6 7 Tour vehicles 1 2 3 4 5 6 7 Other public transportation 1 2 3 4 5 6 7
Other ____________ 1 2 3 4 5 6 7
2) How reliable would you rate the following modes of transportation during the times that you have used them in Aruba? (1-not reliable to 7-extremely reliable, NA= do not use)
Rental cars 1 2 3 4 5 6 7 NA
Taxicabs 1 2 3 4 5 6 7 NA
Mini-buses 1 2 3 4 5 6 7 NA Autobuses 1 2 3 4 5 6 7 NA
Tour vehicles 1 2 3 4 5 6 7 NA Other public transportation 1 2 3 4 5 6 7 NA
Other ____________ 1 2 3 4 5 6 7 NA
3) How timely and efficient are the following modes of transportation during the times that you have used them in Aruba (1=not timely at all, 4=average timeliness, and 7=extremely on time and efficient, NA=do not use)
Rental cars 1 2 3 4 5 6 7 NA
Taxicabs 1 2 3 4 5 6 7 NA
Mini-buses 1 2 3 4 5 6 7 NA Autobuses 1 2 3 4 5 6 7 NA
Tour vehicles 1 2 3 4 5 6 7 NA Other public transportation 1 2 3 4 5 6 7 NA
Other ____________ 1 2 3 4 5 6 7 NA
4) How satisfied are you with the following modes of transportation that you use when in Aruba? (1=never, 4=daily, and 7=multiple times per day, NA=do not use)
Rental cars 1 2 3 4 5 6 7 NA
Taxicabs 1 2 3 4 5 6 7 NA
Mini-buses 1 2 3 4 5 6 7 NA Autobuses 1 2 3 4 5 6 7 NA
Tour vehicles 1 2 3 4 5 6 7 NA Other public transportation 1 2 3 4 5 6 7 NA
Other ____________ 1 2 3 4 5 6 7 NA
42
Appendix A
5) How would you rate the service quality of the following modes of transportation during the times that you have used them in Aruba (1=terrible, 4=average, and 7=extremely great service quality, NA=do not use)
Rental cars
1 2 3 4 5 6 7 NA
Taxicabs 1 2 3 4 5 6 7 NA
Mini-buses 1 2 3 4 5 6 7 NA
Autobuses 1 2 3 4 5 6 7 NA
Tour vehicles 1 2 3 4 5 6 7 NA
Other public transportation 1 2 3 4 5 6 7 NA
Other ____________ 1 2 3 4 5 6 7 NA
6) How would you rate the tour operators on the island individually? (1-poor to 7-very good, NA= do not use)
DePalm tours 1 2 3 4 5 6 7 NA
ABC tours 1 2 3 4 5 6 7 NA
Around Aruba tours 1 2 3 4 5 6 7 NA
Fofoti tours 1 2 3 4 5 6 7 NA
Kini Kini tours 1 2 3 4 5 6 7 NA
Pelican Adventures 1 2 3 4 5 6 7 NA
Isla Aruba tours 1 2 3 4 5 6 7 NA
Other ____________ 2 2 3 4 5 6 7 NA
7) When you call a taxicab, how long does it normally take to get one (in minutes)? 0-5 6-10 11-15 16-20 21-25 26-30 More than 30 min
8) When you use a bus, how often is it on time in getting to the stop you are at? (1-never to 7-always)
1 2 3 4 5 6 7
9) When you use other public transportation, how often is it on time to pick you up where and when it was supposed to? (1-never to 7-always)
1 2 3 4 5 6 7
10) How would you rate the overall transportation on the island of Aruba? (1-poor to 7-excellent)
1 2 3 4 5 6 7
11) How often do you rent a car when you visit Aruba? (1-never to 7-always)
1 2 3 4 5 6 7
12) How convenient is the rental car process? (1-never to 7-always)
1 2 3 4 5 6 7
13) How clean is your rental car? (1-never to 7-always)
1 2 3 4 5 6 7
14) What condition is your rental car in when you get it? (1-never to 7-always)
1 2 3 4 5 6 7
15) Please provide detailed comments of your experiences with transportation on the island.
43
16) Please rank order the following points regarding transportation from most important (1) to least important (8)
a. Price b. Service quality c. Cleanliness
d. Reliability e. Timeliness f. Value for money
17) Which hours do you tend to use transportation in Aruba? (Circle all that apply)
a. 6-9 am b. 9-12pm c. 12noon-3pm
d. 3-6pm e. 6-9pm f. 9-12am (midnight)
18) What time period do you most often use transportation in Aruba?
Demographic Measurement
19) Your age: o 18-24 years o 25-34 years o 35-44 years
g. Safety h. Other __________
g. 12-3am h. 3-6am
o 45-54 years o More than 54 years 20) Your gender: o Male o Female
21) Your highest level of education completed: o Some high school but no diploma or less o High School diploma
o Associate’s degree o Bachelor’s degree o Graduate degree 22) Your ethnicity: o Caucasian o Asian o African American
o Hispanic o Two or more o Others
23) Your annual income in US dollars: o Less than $20,000 o $20,000 - $49,999 o $50,000 - $79,999
o $80,000 - $99,999 o $100,000 or more 24) Are you a local or tourist? o Local o Tourist 25) If you are a tourist, where are you from? __________________________ 26) What hotel or accommodations are you staying at? __________________________ 27) Is this your first time to Aruba? o Yes o No 28) If no, how many times have you been to Aruba? _________
44
Transportation Survey for Locals
Transportation Study (Locals)
Encuesta
Universidad di Aruba FHTMS ta hasiendo un encuesta pa averigua y hanja sa mas di e demanda y oferta di transporte (publico) na Aruba. Transporte ta un parti integral di nos isla y bo contribucion ta importante Masha danki pa tuma 5-7 minuut pa completa e encuesta aki.
1 Con hopi biaha bo persona ta usa e siguiente methodo di transporte? / How often do you use the following modes of transportation? (1=nunca/never, 4=tur dia/daily, and 7=varios biaha pa dia/multiple times per day)

45
1 Nunca / Never 2 3 4 Tur dia / Daily 5 6 7 Varios biaha pa dia / Multiple times per day Auto di huur /Rental Cars Taxi / Taxi Cabs Bus /Buses Bus chikito / Mini (Auto) Buses Vehiculo di tour / Tour Vehicles
Appendix B
1 Nunca / Never 2 3 4 Tur dia / Daily 5 6
7 Varios biaha pa dia / Multiple times per day
Otro transporte publico / Other Public Transportation
Other (please specify)
2 Con confiabel e siguiente methodonan di transporte nan tawata ora cu bo persona a hasi uso di nan? / How reliable would you rate the following modes of transportation during the times that you have used them? (1-not reliable to 7- extremely reliable, NA= do not use
1 No confiabel / Not Reliable 2 3 4 5 6
Auto di huur / Rental Cars
Taxi / Taxi Cabs
Bus / Buses
Bus chikito / Mini (Auto) Buses
Vehiculo di tour / Tour Vehicles
Otro transporte publico / Other Public Transportation
Other (please specify)
7 Extremadamente confiabel / Extremely Reliable N/A
3 Segun bo: con na ora y eficiente e proximo modo di transporte nan tawata ora bo persona a hasi uso di nan? / How timely and efficient are the following modes of transportation during the
46
times that you have used them in Aruba (1=not timely at all, 4=average timeliness, and 7=extremely on time and efficient, NA=do not use)
1 Nunca na ora / Not Timely at all 2 3
Auto di huur / Rental Cars
Taxi / Taxi Cabs
Bus / Buses
Bus chikito / Mini (Auto) Buses
Vehiculo di tour / Tour Vehicles Otro transporte publico / Other Public Transportation
Other (please specify)
4 Mas o menos na ora / Average timelines 5 6
7 Semper na ora y eficiente / Extremely on time and efficient N/A
4 Con satisfecho bo persona ta cu e siguiente methodo di transporte nan cu bo ta usa na Aruba? / How satisfied are you with the following modes of transportation that you use in Aruba? (1=not at all satisfied, 4=neither satisfied nor dissatisfied, and 7=very satisfied, NA=do not use)
1 No satisfecho en absoluto / Not at all satisfied 2 3
Auto di huur / Rental Cars
Taxi / Taxi Cabs Bus / Buses
4 Ni satisfecho ni No satisfecho / Neither satisfied nor dissatisfied 5 6
7 Hopi satsifecho / Very satisfied
N/A = do not use
47
1 No satisfecho en absoluto / Not at all satisfied 2 3
Bus chikito / Mini (Auto) Buses
Vehiculo di tour / Tour Vehicles
Otro transporte publico / Other Public Transportation
Other (please specify)
4 Ni satisfecho ni No satisfecho / Neither satisfied nor dissatisfied 5 6
7 Hopi satsifecho / Very satisfied
N/A = do not use
5 Con lo bo evalua e calidad di servicio di e proximo methodonan di transporte ora bo persona a hasi uso di nan? / How would you rate the service quality of the following modes of transportation during the times that you have used them? (1=terrible, 4=average, and 7=extremely great service quality, NA=do not use)
1 Terrible 2 3 4 Average 5 6
Auto di huur / Rental Cars
Taxi / Taxi Cabs
Bus / Buses
Bus chikito / Mini (Auto) Buses
Vehiculo di tour / Tour Vehicles
Otro transporte publico / Other Public Transportation
7 Extremely great service
N/A = do not use
48
Other (please specify)
6 Ora cu yama un taxi, cuanto minuut ta dura normalmente prome cu e yega? / When you call a taxicab, how long does it normally take to get one (in minutes)? 0 -5 6-10 11-15 16-20 21-25 26-30 30 and up
7 Ora di usa un bus, con hopi biaha e ta yega na ora na e parada di bus? When you use a bus, how often is it on time in getting to the stop you are at? 1 Nunca / Never 2 3 4 5 6 7 Semper / Always N/A = Do not use
49
8 Ora di usa un otro transporte publico, con hopi biaha e ta yega na ora na e parada? / When you use other public transportation, how often is it on time in getting to the stop you are at?
1 Nunca / Never 2 3 4 5 6 7 Semper / Always N/A = Do not use
9. Con lo bo evalua transporte general na Aruba? / How would you rate the overall transportation on the island of Aruba?
1 Hopi malo / Poor 2 3 4 5 6 7 Exelente / Excellent
10 Please duna un comentario detaya di bo experiencianan cu transporte publico / Please provide detailed comments of your experiences with transportation on the island
50
11 Por fabor duna un cifra di importancia pa cada punto relaciona cu transporte (1) mas importante te cu (8) menos importante / Please rank order the following points regarding transportation from most important (1) to least important (8)
Prijs / Price
Calidad di Servicio / Service Quality
Limpiesa / Cleanliness
Confiabel / Reliability
Na ora / Timeliness
Balor pa placa / Value for Money
Seguridad / Safety
12 Durante ki orario bo persona ta hasi uso di transporte? / Which hours do you tend to use transportation? 6-9AM 9AM-12PM 12-3PM 3- 6PM 6-9PM 9PM-12AM 12-3AM 3- 6AM
13 Durante ki ora nan bo persona ta usa transporte mas? What time period do you most often use transportation?
14 Bo persona a yega di hasi uso di transporte pirata? Have you ever used pirate transportation?
51
ever used pirate transportation?
Yes No Other (please specify)
15 Edad / Age 18-24 25-34 35- 44 45-54 55- 64 65+
16. Kiko ta bo sexo? / What is your gender ?
Female Male Non-binary / third gender Prefer not to say
17 Nivel di educacion mas halto completa / Highest level of education completed
Some high school but no diploma or less
High School Diploma
Associate's Degree
Bachelor's Degree
Graduate Degree
52
18 Rasa / Ethnicity
Arubiano / Aruban
Asiatico / Asian
Afroamericano / African-American Hispano / Hispanic Bi-racial of/or Multi-racial Other (please specify)
19 Entrada annual / Annual income
Bou di / Under Awg 20,000
Entre / Between Awg. 20,000 y/and Awg. 49,999
Entre / Between Awg 50,000 y/and Awg 79,999
Entre / Between Awg 80,000 y/and Awg 99,999
Ariba di / Over Awg 100,000 Done
Powered by See how easy it is to create a survey Privacy & Cookie Notice
53

