GIM International Issue 5, 2021

Page 1

THE GLOBAL MAGAZINE FOR GEOMATICS WWW.GIM-INTERNATIONAL.COM

INTERNATIONAL

SPECIAL EDITION:

PRESTIGIOUS PROJECTS

ISSUE 5 2021 • VOLUME 35

The Versatility of UAVs in a Remote and Rugged Archipelago

The Challenges of Surveying the Faroe Islands

REVEALING CHERNOBYL RADIATION HOTSPOTS WITH LIDAR TECHNOLOGY HIGH-RESOLUTION TOPOGRAPHY OF A WORLD HERITAGE CAVE LARGE-SCALE UAV-LIDAR SURVEY IN THE TROPICS

01_cover.indd 1

13-07-21 13:43


Get it done

NavVis VLX 2nd generation With regular software updates to the SLAM algorithm, NavVis VLX 2nd generation is optimized for outdoor environments and will continue to evolve long into the future. It also boasts IP42 for protection against solid objects larger than 1 mm and vertically dripping water, and a carbon-fiber frame that’s super strong and reduces overall weight.

Dynamic scanning. Capture everything from complex indoor spaces to outdoor environments.

Superb accuracy. NavVis VLX is powered by precision SLAM technology entirely in a class of its own.

All-in-one reality capture. Take high-res scans and images in every direction for complete 360º coverage.

Live mapping feedback. Monitor your scanning progress in real time with a built-in touchscreen interface.

Grip pads Built-in screen Shoulder pads Forwardfacing design Stabilizing belt

Precision meets ergonomics. A wearable device where operators can scan at the speed of walking.

Geo-registration. NavVis VLX can capture control points for precise geo-registration and alignment of datasets.


Survey-grade point clouds NavVis system software contains a unique SLAM algorithm that’s been specially developed to overcome the challenges of capturing high-quality point clouds with a mobile system.

Preserve original details Point cloud surface reconstruction preserves details while removing noise for more efficient use in 2D drawings and 3D models.

Highly realistic texturing Highly detailed point clouds include color and realistic texturing.

Detect and remove dynamic objects Objects that move through the scan are automatically detected and removed from point clouds during post-processing, resulting in less manual work.

Robust SLAM Robust SLAM algorithms can accurately capture the entire building including the facade and surroundings.

Scan me and discover more:


Get it done with NavVis VLX 2nd generation

NavVis VLX is a mobile mapping system designed for laser scanning and AEC professionals that enables high-quality reality capture of complex buildings and construction sites. Discover more: navvis.com/reality-capture


CONTENTS

DIRECTOR STRATEGY & BUSINESS DEVELOPMENT Durk Haarsma FINANCIAL DIRECTOR Meine van der Bijl TECHNICAL EDITOR Huibert-Jan Lekkerkerk CONTRIBUTING EDITORS Dr Rohan Bennett, Frédérique Coumans CONTENT MANAGER Wim van Wegen COPY-EDITOR Lynn Radford, Englishproof.nl MARKETING ADVISOR Feline van Hettema CIRCULATION MANAGER Adrian Holland DESIGN ZeeDesign, Witmarsum, www.zeedesign.nl GIM INTERNATIONAL GIM International, the global magazine for geomatics, is published bimonthly by Geomares. The magazine and related e-newsletter provide topical overviews and accurately presents the latest news in geomatics, all around the world. GIM International is orientated towards a professional and managerial readership, those leading decision making, and has a worldwide circulation. SUBSCRIPTIONS GIM International is available bimonthly on a subscription basis. Geospatial professionals can subscribe at any time via https://www.gim-international.com/subscribe/print. Subscriptions will be automatically renewed upon expiry, unless Geomares receives written notification of cancellation at least 60 days before expiry date.

P. 10 Mapping Radiation in Chernobyl

The use of UAV-Lidar is being tested in the complex terrain of the Chernobyl Exclusion Zone. The aim of the University of Bristol team is to demonstrate that, in the event of a nuclear incident, it could be possible to use a drone instead of manned aircraft to provide real-time situational data about the spread and intensity of the radiation.

P. 15 The Challenges of Surveying the Faroe Islands

Remotely situated in the northern Atlantic Ocean, the Faroe Islands form a rugged and rocky archipelago. The cool and cloudy weather means that this is a challenging survey environment. In its search for the best method to capture this stunning environment, the mapping authority has turned to UAVs. This article tells the story of mapping and surveying a truly breathtaking spot on Earth.

P. 19 Large-scale UAV-Lidar Survey in the Tropics

With a total length of 2,789km, the Trans-Sumatra Toll Road Project is one of Indonesia’s National Strategic Projects and the longest toll road project in Southeast Asia. In order to keep the project on track for the scheduled completion date of 2024, UAV-Lidar was chosen as the topographic data acquisition method, combined with BIM, to optimize the time planning and costs. Read on to learn more about this challenging project, which has included several obstacles.

P. 22 Creating a Digital Twin of the Earth

An unprecedented scientific effort to Lidar-scan the entire surface of the Earth before it’s too late... that’s how Christopher Fisher, the founder of the Earth Archive, describes his initiative. He started the Earth Archive based on his experience of using remote sensing technologies in Mexico and Honduras. His aim is to better understand the causes and consequences of urbanism and environmental change.

ADVERTISEMENTS Information about advertising and deadlines are available in the Media Planner. For more information please contact our marketing advisor: feline.van.hettema@geomares.nl. EDITORIAL CONTRIBUTIONS All material submitted to Geomares and relating to GIM International will be treated as unconditionally assigned for publication under copyright subject to the editor’s unrestricted right to edit and offer editorial comment. Geomares assumes no responsibility for unsolicited material or for the accuracy of information thus received. Geomares assumes, in addition, no obligation to return material if not explicitly requested. Contributions must be sent for the attention of the content manager: wim.van.wegen@geomares.nl.

P. 29 High-resolution Topography of a World Heritage Cave

The Ochtiná Aragonite Cave in Slovakia is a world-famous karst landscape. It represents a combined labyrinth consisting of parallel tectonically controlled halls and passages. The dissected and irregular morphologies of the cave were surveyed using TLS and SfM digital photogrammetry. The new detailed map, sections and 3D model create an innovative platform for a more detailed study of the morphology and genesis of this unusual cave.

P. 36 The Use of Airborne Lidar to Visualize History in 3D

Airborne Lidar and 3D modelling technologies have emerged as the newest – and among the most valuable – geospatial tools available to archaeologists in their efforts to gain insights into key historical sites. Being able to accurately visualize how a fort, battlefield or settlement appeared at critical times creates a narrative revealing the way important events played out. Just as importantly, 3D visualization enables the researchers to plan where to focus additional fieldwork, including excavation and geophysical surveys.

Geomares P.O. Box 112, 8530 AC Lemmer, The Netherlands T: +31 (0) 514-56 18 54 F: +31 (0) 514-56 38 98 gim-international@geomares.nl www.gim-international.com No material may be reproduced in whole or in part without written permission of Geomares. Copyright © 2021, Geomares, The Netherlands All rights reserved. ISSN 1566-9076

P. 5 P. 6 P. 13 P. 27

Editorial Headlines Handheld Cave Mapping Exploring Mars

P. 32 P. 39 P. 41

Five Deeps Expedition FIG ISPRS THE GLOBAL MAGAZINE FOR GEOMATICS WWW.GIM-INTERNATIONAL.COM

To subscribe to GIM International go to www.gim-international.com/subscribe

INTERNATIONAL

SPECIAL EDITION:

PRESTIGIOUS PROJECTS

ISSUE 5 2021 • VOLUME 35

The Versatility of UAVs in a Remote and Rugged Archipelago

The Challenges of Surveying the Faroe Islands

COVER STORY The front cover of this special issue of GIM International – dedicated to prestigious survey projects around the globe (and even high above and beneath the surface!) – shows an enthusiastic hiker enjoying one of the many magnificent views of the landscape of the Faroe Islands archipelago. On page 15, you will find an article about how this remote group of islands is being mapped under demanding circumstances. (Image courtesy: Shutterstock)

REVEALING CHERNOBYL RADIATION HOTSPOTS WITH LIDAR TECHNOLOGY HIGH-RESOLUTION TOPOGRAPHY OF A WORLD HERITAGE CAVE LARGE-SCALE UAV-LIDAR SURVEY IN THE TROPICS

01_cover.indd 1

I SSUE 5 2 0 2 1 |

03_contents.indd 3

13-07-21 13:43

INTERNATIONAL | 3

13-07-21 15:52


04_South_CHC.indd 6

12-07-21 13:19


Editorial

Prestigious Summer is always a special time of the year, especially for children. I can still remember that feeling of excitement and anticipation on the last day of school before the summer holidays, with the prospect of seemingly endless weeks of fun ahead: at the beach, in the sea or exploring the forests or the mountains. As a kid, one of my favourite treats was the ‘Summer Special’ or holiday edition of the magazine I subscribed to, bursting with comic strips, interviews, puzzles and posters. It was usually thicker than the regular edition and always had an upbeat summer vibe. We have tried to recreate that feeling for you with this special ‘Prestigious Projects’ edition. This summer issue features an article about Chernobyl in Ukraine, where Lidar is being used to map radioactive hotspots stemming from the meltdown of the nuclear power plant more than three decades ago. From there, we take you to the Indonesian island of Sumatra; our editor Wim van Wegen provides an insight into the deployment of UAV-Lidar in combination with BIM in a project to construct the 2,700km Trans-Sumatra Toll Road (see page 19). Travelling the world from behind his desk, Wim has also written an article about the much harsher and more remote archipelago of the Faroe Islands in the northern Atlantic to highlight a crewless aerial mapping project (see page 15). Meanwhile, on page 22 of this issue, you will find an interview with Chris Fisher. Besides being an archaeologist, National Geographic Explorer and professor of anthropology at Colorado State University, USA, Fisher is also founder of the Earth Archive. The aim is to build a virtual, open-source digital twin of Earth, both for a better understanding of the world as it is today

and as a lasting model of how it was for future generations. These and all the other projects featured in this issue are prestigious in every sense of the word – but so too are the projects that you work on every day. From the smallest survey to projects that want to model the entire world, every project brings together an impressive and also precious combination of technology and human brilliance. If you are taking a break this summer, allow yourself to wallow in this brilliance for a while before returning to work with a clear head and renewed vision.

Durk Haarsma, director strategy & business development durk.haarsma@geomares.nl

P.S. Needless to say, we are well aware that it is midwinter for our readers in the Southern Hemisphere. Even so, we hope that this special ‘Prestigious Projects’ issue of GIM International will brighten your day by inspiring you with examples of how geospatial technology is being used. We also hope that it will reinforce your sense of pride in the profession you’ve chosen and its contribution to making the world a better place. And hang on in there – summer will be here again before you know it!

Advertisers Advanced Navigation 40 CHCNAV 4 ComNav 44 FOIF 43

Gintec 8 Kolida 23 Leica Geosystems 24 NavVis 2

RIEGL 28 SOUTH 4 3Dsurvey 33

Search and compare

Get insights

I ssue 5 2 0 2 1 |

05_editorial.indd 5

Connect

international | 5

13-07-21 15:58


HEADLINES

Gauging Survey and Digital Twin of Scotland’s Rail Network Fugro has been awarded a contract to survey Scotland’s entire rail network and provide Network Rail with a holistic gauging database that includes clearance data from the track to lineside structures, platforms, objects and the train-to-train passing interface. The routewide Fugro’s RILA technology will provide Scotland’s gauging geodata will support Railway with complete up-to-date asset geodata. the continued safe passage of trains operating on the network and facilitate the introduction of new rolling stock. The project started at the end of April and will survey approximately 2,750 route kilometres, spanning 93 different route sections and 638 station platforms. The use of Fugro’s trainmounted RILA monitoring system will remove the need for surveyors to be on or near the track during data collection and thus deliver a clearly defined health and safety benefit. It will also afford unrivalled speed of survey data acquisition.

YellowScan Joins Forces with Dutch UAV Manufacturer YellowScan has entered into a new product partnership with Acecore Technologies to offer the market a completely integrated Lidar-UAV solution configured to work together. YellowScan is a global leader and Acecore UAV equipped with YellowScan Lidar designer of nexttechnology. generation unmanned aerial vehicles (UAVs or ‘drones’) and Lidar solutions, while Acecore Technologies is a Dutch developer and manufacturer of professional-grade UAVs for data collection and surveillance markets. Unlike other YellowScan solutions, the YellowScan Mapper is a purely aerial Lidar solution that is ideally flown at 70m above ground level. Although it is designed to fit most professional drones and comes with an integrated camera module, the French Lidar technology company has now worked with Acecore to configure Mapper to take full advantage of Acecore’s Zoe platform.

FARO Expands Digital Twin Product Suite FARO Technologies has announced the acquisition of HoloBuilder and its leading photogrammetrybased 3D platform which delivers hardwareThe core components of construction progress agnostic image capture, management. registration and viewing to the fast-growing digital twin market. With an initial focus on construction management, HoloBuilder’s technology platform provides general contractors a solution to efficiently capture and virtually manage construction progress using off-the-shelf 360° cameras. HoloBuilder’s SaaS platform will add fast reality-capture photo documentation and extra remote access capability to FARO’s highly accurate 3D point cloud-based laser scanning to create the industry’s first end-to-end digital twin solution – all without leaving the FARO ecosystem. The combined solution will provide comprehensive scanning and image management capabilities for the digital twin market including robotic assembly 3D simulation, construction management, facilities operations and management, and incident pre-planning.

HERE Geospatial Data Now Accessible within Bentley’s Orbit HERE Technologies has launched a solution that makes it easier for US departments of transportation (DOTs) to conduct fixed asset management activities, plan capital investments and deliver infrastructure performance assessments according to federal regulations. HERE is a leading location data and technology platform. HERE data sources, including HERE map, light detection and ranging (Lidar) data and street-level imagery, are now accessible within Bentley Systems’ Orbit, an on-premises application or cloud service for managing, analysing and sharing reality meshes, extremely large point clouds, imagery and traditional GIS data. Now, state and city DOTs can quickly build digital twins, which are highly accurate 3D representations of their physical realities, without the time and cost required to acquire the Lidar and street-level imagery themselves.

HERE mobile mapping car.

6|

international | issue 5 2021

06-07-09_headlines.indd 6

13-07-21 15:17


gim-international.com

Global Partnership between Schneider Digital and DAT/EM Software producer DAT/EM Systems and 3D hardware specialist Schneider Digital have entered into a global partnership agreement for the distribution of the latest 3D stereoscopic vision technology from Schneider Digital to all DAT/EM customers around the globe. Under this cooperation, Integrated 3D stereo workstation solution. DAT/EM partners worldwide can from now on distribute the 3D PluraView stereo monitors and Schneider Digital Workstations directly to their clients as complete photogrammetric workplace solutions, for example in combination with the Summit Evolution Professional digital stereoplotter. The dualscreen, passive stereo 3D PluraView systems are fully compatible with all DAT/ EM products, including the flagship Summit Evolution Professional digital stereoplotter. DAT/EM software and Schneider Digital photogrammetry hardware products are can be combined into precise, productive and user-friendly stereoscopic data capture environments with premium display quality and impressive response times to work even with terabyte-sized imagery.

Google Contracts Aerometrex for San Francisco 3D Model Aerometrex has been contracted by Google to provide a data licence for its 3D model of downtown San Francisco. The company believes this Aerometrex 3D model of the San Francisco Palace significant purchase of Fine Arts in 2cm pixel resolution. order from an important client validates Aerometrex’s world-leading 3D data capabilities. Since establishing Aerometrex Inc in the USA (headquartered in Denver, Colorado), the company has focused its efforts on capturing key US cities using very high-resolution oblique aerial imagery. As part of its ongoing programme of 3D modelling in the US, the downtown area of San Francisco is being captured at very high resolution of 2cm pixels. Google has placed an order for Aerometrex’s 3D model of San Francisco prior to completion of the work. While the revenue amount from Google’s order is not material, this order demonstrates demand for these products from very large corporations. In addition, there are signs of further demand for the same dataset, the IP of which is retained by Aerometrex, from several organizations with interests in the San Francisco Bay area.

Survey to Create 3D Model of Schiphol Rail Tunnel GeoNext has used Trimble technology to survey the Schiphol Tunnel and provide measurements as the basis for a 3D model to support essential railway maintenance and upgrades. Millions of passengers pass through the Schiphol Tunnel every year; it The Trimble TX8 enables more than one is a vital transportation link track to be scanned at the same time. between central Amsterdam and Schiphol Airport in the Netherlands. The speed and precision of the laser scanners and total stations enabled the surveying team to meet strict accuracy and delivery requirements. The Schiphol Tunnel is part of a 17km passenger train route connecting central Amsterdam and Schiphol Airport, one of Europe’s busiest airports based on passenger volume. A highly accurate model was required to ensure proper alignment of new tracks and adequate clearance for the fast-moving passenger trains. The strict 7mm or better accuracy requirement meant that GeoNext needed to use top-quality equipment and carefully follow workflow processes for efficient data collection.

Septentrio Enters into Partnership with XenomatiX Septentrio and XenomatiX are starting a partnership enabling high-quality Lidar solutions. Septentrio is a leader in advanced GNSS/INS positioning solutions, while XenomatiX is a provider of true-solid-state-Lidar technology for autonomous applications and road management solutions. XenomatiX will be using the compact and robust GNSS/INS receiver from Septentrio, AsteRx SBi3 Pro+, to provide millimetre-accurate analysis of pavement conditions using global positioning coordinates. Septentrio’s GNSS/INS will be a part of XenomatiX’s Road Lidar called XenoTrack, which is the solution of choice for road surveyors and road management companies. Septentrio’s AsteRx SBi3, a high-performance RTK GNSS/INS receiver with a dual-antenna setup, ensures centimetreaccurate geotagging of the XenoTrack point cloud frames for relative and global millimetre accuracy over large distances. Moreover, the inertial GNSS-IMU integration algorithm enables deadreckoning, which means continuous positioning in environments of low satellite visibility where GNSS outages occur.

The AsteRx SBi3 Pro+ provides accurate positioning and orientation to Xinomatix’s Lidar system.

Issue 5 2 0 2 1 |

06-07-09_headlines.indd 7

international | 7

13-07-21 15:17


_08_GIM_5-2021_LIJNTJE.indd 6

13-07-21 08:29


GIM-INTERNATIONAL.COM

NavVis Brings Greater Versatility to Reality Capture Workflows NavVis has announced the launch of NavVis VLX 2nd generation, a new iteration of the flagship mobile mapping system optimized for scanning both indoor and outdoor environments. NavVis is a pioneering leader in mobile mapping and reality capture. With multiple improvements based on customer needs, NavVis VLX 2nd generation will enable more professionals in the surveying and architecture, engineering & construction (AEC) industries to complete a wider variety of reality capture projects with high speed and precision. “Previously, we positioned our devices for indoor scanning,” says Georg Schroth, chief technology officer at NavVis. “But since the launch of the original NavVis VLX, we have become aware of our customers’ need for us to mature the device towards real outdoor readiness.” He continues: “They asked, and we’ve delivered. With NavVis VLX 2nd generation, reality capture specialists can go anywhere the project requires, whether it’s a construction site or a refinery, a factory or an office.”

NavVis VLX 2nd generation is more robust than its predecessor in outdoor environments and demanding locations.

New Tool Makes Almost Any Instrument iOS Compatible Eos Positioning Systems has released the Eos Bridge, which enables almost any instrument to become iOS Bluetooth compatible. Eos is the global manufacturer of Arrow Series GNSS receivers. The Eos Bridge is a small, pocket-sized device that connects to instruments via Bluetooth Classic or serial port, and transmits data from them to any Apple iOS device such as iPhone or iPad, Android device or Windows mobile device. The Eos Bridge offers two connectivity methods to virtually hundreds of instruments. The first method is Bluetooth Classic to Apple iOS Bluetooth. Instruments that are equipped with non-iOS Bluetooth are now able to connect to Apple iOS devices using the Eos Bridge. This includes laser rangefinders and utility-locating instruments, for example. The second method is the serial port to iOS, Android and Windows devices. With the Eos Bridge, instruments whose only connectivity option is a serial port may now be connected to any iOS, Android or Windows device via Bluetooth. This includes any instrument or sensor with an RS-232 serial port, for example.

3D City Models and Their Multitude of Purposes 3D city models can be used in map applications, urban planning, virtual events and as a starting point for various other applications. At Aalto University, Finland, research into the topic has focused on ways to use city models in the capital region and on applying new 3D mapping technologies to the modelling of cities. Vast, three-dimensional (3D) models of urban environments are already a familiar sight – you might explore one in a video game, for example – but they can also be used for cities’ information services, research and commercial purposes. 3D city modelling has become a common task in producing geographic data for cities. The Research Institute of Measuring and Modelling for the Built Environment (MeMo) at Aalto University both studies city models and produces the data used in their creation.

City models have found commercial use, especially among companies that deal with urban environments. (Image courtesy: Aalto University) The pocket-sized Eos Bridge device.

I SSUE 5 2 0 2 1 |

06-07-09_headlines.indd 9

INTERNATIONAL | 9

13-07-21 15:17


Using Lidar to Monitor the Effects of the World’s Worst Nuclear Accident

Mapping Radiation in Chernobyl The use of UAV-Lidar is being tested in the complex terrain of the Chernobyl Exclusion Zone. The aim of the University of Bristol team is to demonstrate that, in the event of a nuclear incident, it could be possible to use a drone instead of manned aircraft to provide real-time situational data about the spread and intensity of the radiation.

The release of radionuclides from the Chernobyl Nuclear Power Plant (ChNPP) in 1986 remains the most significant nuclear accident in the history of civil nuclear power generation. The surrounding area, known as the Chernobyl Exclusion Zone (CEZ), is amongst the most heavily radioactive contaminated areas on the planet. In the aftermath of such a large-scale release of radioactive material into the environment, it is critical to effectively determine the spatial distribution of radioactivity. A considerable inventory of highly radioactive material still remains within the surface environment of the CEZ, plus there is insufficient radiological monitoring and hazard awareness. Since the 2019 television miniseries called Chernobyl, tourist interest in the CEZ has surged, with annual visitors exceeding 124,000 by the end of that year. Despite the subsequent drop in visitation in 2020

and 2021 due to COVID-19, this increased human presence in the region underscored the absence of appropriate radiological protection and knowledge of potentially lethal radioactivity hotspot locations. Monitoring and understanding the impacts of the present and evolving nature of radioactive contamination, both on the ground and airborne, are therefore essential for both human safety and the local ecology.

The project to map Chernobyl The UK’s University of Bristol is undertaking several robotics projects in close partnership with local Ukrainian institutes to address the need for radiation mapping in the CEZ. The ‘Mapping Chernobyl’ project aims to help increase the efficacy of monitoring and mapping, and develop novel, effective methods to almost eliminate direct human risk. Professor Tom Scott, project leader, comments: “This

unique environment also allows us the opportunity to test novel fixed-wing unmanned aircraft systems (UASs) equipped with radiation mapping capability to demonstrate that, in the event of a nuclear incident, it could be possible to use a UAS instead of manned aircraft to provide real-time situational data about the spread and intensity of the radiation.” This project will deliver insights to scientists examining the global environmental hazard presented by the highly mobile contamination present in the CEZ and to those responsible for managing the radiological safety for residents and others accessing the region.

The Bristol team on the ground The team is highly multidisciplinary, covering air, ground and underwater robotics, with members of the robotics group primarily from engineering and physics training and backgrounds. Beyond the current Chernobyl

Lidar in action above the complex terrain of the Chernobyl Exclusion Zone. (Image courtesy: Kieran Wood)

10 |

international | Issue 5 2021

10-11-12_featuregreenland.indd 10

13-07-21 15:18


By Katy Greenland, GIM International

feature

project, the group have been involved in several other types of geophysical surveys using unmanned aerial vehicles (UAVs or ‘drones’), including hyperspectral and thermal imaging. In recent years, however, they have focused on the nuclear industry, mapping both anthropogenic and natural radiation sources. Previous research involved deployed gamma mapping UAVs in diverse locations around the world including the UK, USA, Japan, Romania, Portugal and the UAE. For example, they worked closely with volcanologists to measure and map volcanic gas plumes in remote locations where, similarly to nuclear sites, safety issues preclude physical access. The team dropped sensors into the vent of a volcano to aid the prediction of major eruptions. These deployable sensors, named ‘Dragon Eggs’, will be further developed in future to provide more regular measurements between the less-frequent mapping events. In the decades since the accident at Chernobyl, remote/automated characterization technologies have advanced considerably. In particular, UASs with radiation mapping capabilities have been shown on many occasions to provide excellent results when it comes to mapping radiation in and around post-disaster environments. Throughout these projects, the technology has continued to evolve, becoming more automated, more accurate and more sensitive. For the current project, the team have developed – and are deploying – a range of advanced sensor systems collecting real-time data in the CEZ.

UAV-Lidar: the most suitable approach Lidar was considered the advantageous approach in comparison with traditional manned aircraft methods, which are capable of mapping large areas quickly but have substantial drawbacks in some contexts. These include low spatial resolution due to the operating altitude of the aircraft, and the risk of exposure to potentially harmful ionizing radiation for operators. Routescene’s LidarPod was the ideal system to use since it enables the collection of accurate data with high resolution outputs and is deployable in complex, hazardous settings such as this nuclear site. Dr Kieran Wood, aerial-robotics specialist on the project, recounts: “One of the research targets is to develop a more accurate method to map the radiation pattern in an area. Part of this process requires a high-accuracy 3D model of the physical structure and terrain, and Lidar is an ideal choice for 3D mapping in complex terrain.

M600 with LidarPod being set up for flight. (Image courtesy: Yannick Verbelen, Bristol robotics team)

Since most of the radioactive material is contained in the ground, we also needed to have a bare-earth model only, and postprocessing the Lidar can provide this with high accuracy.” Photogrammetric methods were used in conjunction with the LidarPod system since they can also produce highly accurate 3D models of structures and terrain. Besides mapping with the gamma and Lidar sensors, the UAVs were also equipped with cameras which enabled the team to collect photogrammetric image sets in parallel. It was generally faster to process the photogrammetry data for these flat terrain areas. However, Lidar would be more beneficial in some of the complex CEZ contexts, including near-vertical structures, according to Wood.

The Lidar data the team collects at the CEZ has the potential to be used for other purposes, such as to estimate the volume of vegetation. A large amount of radioactivity has been drawn up into the trees and plants in the environment via their root systems as they have grown over the years. Forest fires are a regular occurrence in the CEZ and surrounding areas. A forest fire in the ‘Red Forest’, a woodland area located closest to the reactor and therefore the most heavily contaminated, could release radioactive particles present in the trees. In this context, the Bristol team’s estimate of the volume of burnt material can be used to forecast the impacts of a fire on the region, thus supporting local safety, planning and management objectives.

Issue 5 2 0 2 1 |

10-11-12_featuregreenland.indd 11

international | 11

13-07-21 15:18


The characteristics of the mapped area The surroundings that the team have mapped to date using aerial Lidar are mostly re-natured areas. They were originally small towns, villages and industrial sites, but many structures and forests were demolished and buried during the post-disaster clean-up activities. The terrain is now a mix of the remnants of these structures, some natural woodlands and some newly planted trees to maintain soil integrity. The terrain is very flat, which is ideal for this exploratory research since it simplifies the flight pattern requirements and allows a single consistent altitude to be used. The primary measurement is gamma radiation intensity, which can pass through tens of metres of air quite easily. Wood explains: “By fitting a gamma detector onto a UAV and flying above the terrain, variations in the measured gamma intensity can be mapped, then post-processing enables interpolation of the measurements into a complete map. The localization then became relatively simple, since the hotspots were clearly indicated by very localized peaks in the measured radiation intensity. The measurements are all geotagged with GNSS receivers, hence the visual interpretation of the gamma map can tell us the longitude and latitude of the radiation hotspots.”

Safety and risk management The entire area surrounding the damaged Reactor Number 4 was contaminated with fallout from the explosion and fire, and the level of gamma radiation remains elevated in many areas. Since 1986, however, the intensity of the radiation has reduced substantially. The primary radiation hazard is the reactor

itself, along with a few limited areas that have anomalously high activity, including the Red Forest immediately to the west of the ChNPP. Areas at the centre of the Red Forest are still too radioactive to access, which makes remote inspection using robotics essential. To overcome these access issues, the team kept strictly to safe areas proven to have acceptably low radiation levels and deployed the drones from these safe zones over the areas in which the radiation was higher. Although the drones were exposed to higher levels of radiation in these areas, this did not make them radioactive themselves. Since contamination would only occur if the vehicles touched the surface, the UAVs remained safe for operators to handle between flights.

Ongoing challenges faced The CEZ is still closed to any commercial developments and the only inhabitants in the region are people working plus soldiers for security. One of the main challenges the team faces is working with limited facilities, including a lack of mobile phone coverage. The team must therefore be self-sufficient and self-contained, running operations using equipment that can be delivered by truck. Despite the best efforts to maintain safety, however, there are still some risks. For example, if anything were to go badly wrong, outside assistance is very difficult to access. This is further complicated by the inability to directly assess the presence or height of any obstacles. The team overcame this by developing a two-stage approach to flight planning: firstly, a multi-rotor UAS was manually flown to assess the minimum acceptable altitude, and secondly, the fixedwing was programmed to perform a wide-area survey. It is important to minimize altitude

since it has a direct impact on the resolution of the resulting maps.

Importance of the project and its outcomes The end product of the survey conducted by the Bristol team was a more accurate gamma map of the target areas, shared with the team’s Ukrainian partners. For the university researchers, the end product of the project was to develop new methods. This was a first demonstration of a fixed-wing radiation mapping drone with a much longer range and area coverage than its multi-rotor counterparts. The team are continuing to refine data post-processing algorithms using the unique data collected. Powerful tools will be developed for the use of those managing and monitoring the zone. Some of the resulting maps were implemented in April 2020 to support the response to extensive forest fires started in the CEZ that ravaged the region and began to move towards the Red Forest. There were concerns of a major radioactive release, so the radiation maps were used by the UK Meteorological Office and later NASA to model the likely release scenarios. Thankfully, the fires were extinguished by rain before they reached the Red Forest.

Next steps and future plans The University of Bristol has a very strong nuclear robotics team. They are continuing to work with the ChNPP to perform mapping as well as innovate new devices, sensors and methods to help with remediation activities. COVID-19 has delayed the field testing of new devices. However, the team plan to return as soon as possible to continue their work on this important project.

About the author

Abandoned bus from the time of the accident. (Image courtesy: Kieran Wood)

12 |

Katy Greenland is working as a freelance writer and researcher. Originally from Melbourne, Australia, she is now based in Amsterdam, the Netherlands. She holds undergraduate degrees in Social Science majoring in Psychology and Social Work with honours, as well as a Master of Information Management with a research specialization.

international | Issue 5 2021

10-11-12_featuregreenland.indd 12

13-07-21 15:18


By Tomas Blaha, GeoSLAM

feature

Putting SLAM Technology to the Test Deep Underground

Handheld Mapping of One of Europe’s Largest Caves The Human Adaption Institute conducted a pioneering isolation experiment called ‘Deep Time’ in one of Europe’s largest cave systems: the 3km Lombrives cave. With low light levels, an ambient temperature of 10oC and 100% humidity levels, the physical and psychological impacts of the environment were monitored closely. The study was supported by geospatial mapping specialists and technology from GeoSLAM.

For the 15 participants in the Deep Time experiment, time really did stand still recently – and not just due to coronavirus lockdowns. They set up camp in the Lombrives cave in Ariege, in the eastern part of the Pyrenees mountain range in southwestern France, to spend 40 days with no clocks, no sunlight and zero contact with the outside world. The study, created to gain insight into the constraints of human adaptability to isolation, tested the limitations of human endurance in a challenging environment.

professional surveyors to accurately set up the devices, the uneven, challenging terrain would have caused many other complications, resulting in a labour-intensive and timeconsuming method of data collection. In contrast, the benefit of the ZEB Horizon handheld SLAM scanner meant that anyone could simply ‘pick up and go’ to create a detailed point cloud of any location.

Challenging circumstances To form a clear picture of their new surroundings, the team conducted a digital

scan of the complex cave system, consisting of both narrow passageways just big enough to crawl through and vast chambers up to 70m in height. With a collection rate of 300,000 points per second, an accuracy of 1-3cm (depending on the scan environment) and the ability to capture intricate measurements with a 100m range capacity, the handheld ZEB Horizon scanner overcame these issues. The easy set-up and ‘walk-andscan’ method of data collection offered the team the flexibility to crouch, crawl and scan the depths and narrow canals of the cave.

Forming a community of ‘Deep Timers’, the participants were each assigned specific roles and responsibilities, carrying out tasks to provide a sense of structure to their days. During the project, each member of the team performed over 50 scientific tests and protocols daily – from cognitive and sensory ability testing to genetics. Their first task was to create an in-depth, complete scan of the location using GeoSLAM’s simultaneous localization and mapping (SLAM) technology. The project posed a number of complex challenges, including unskilled surveyors, a demanding cave environment and time pressure to complete the scan, not to mention the absence of any GPS in the cave. Traditional tripod-based systems for digital mapping would have presented a number of difficulties for such a job. As well as requiring

A participant sets up the ZEB Horizon scanner.

I ssue 5 2 0 2 1 |

13-14_featureblaha.indd 13

international | 13

13-07-21 16:37


Image of the dataset collected and processed by GeoSLAM Hub. A 3D image looking from the outside of the cave, into the workstation of the ‘deep timers’.

The handheld scanner enabled the Deep Time participants to easily scan smaller spaces just big enough to crawl through.

Combined with fully automatic processing, they were able to create accurate and reliable results at speed.

their health and safety while carrying out the survey in what was an almost pitch-black environment.

be manually georeferenced using GeoSLAM’s Adjust to Control feature or automatically georeferenced using the Connect software.

Although primarily a handheld device, the scanner can also be mounted to an unmanned aerial vehicle (UAV or ‘drone’) to carry out aerial surveys. The use of drones with scanners can provide surveyors with significant advantages in cave or mining environments. When faced with areas prone to collapse which would otherwise be unsafe for human surveyors to enter, a UAV offers a quick and safe method of inspection. This approach is therefore often used to enable miners to inspect a mine following a planned detonation to ensure the structure is safe.

Shut off from the outside world

The end result

Many traditional digital mapping device programmes rely heavily on GPS to provide points of origin for accurately calculating distance and scale. However, with parts of the Lombrives cave up to 90m beneath ground level, this method of data collection would have been impossible.

The processing software automatically connected together a series of 3D scan datasets containing more than 39 million points, resulting in the successful mapping one of Europe’s largest caves. The team were subsequently able to reduce scan drift and remove outlying data points in the software to provide a clear visualization of the location, plus they were able prioritize planar surfaces, which is particularly beneficial in these noisy environments.

While these applications offer huge benefits to protecting the safety of participants, the use of UAVs in both caves and mines is reliant on the space and visibility to operate the SLAMequipped drone safely. In the Deep Time experiment, the scanner could be mounted onto a cradle or extendable pole to access the difficult-to-reach and potentially hazardous areas of the cave, both in the cave’s dark depths and in its high cavities. This additional equipment not only granted the team access to all parts of the cave, but also ensured

Thanks to not requiring the aid of satellite positioning, SLAM technology enables scans to be carried out in complex and enclosed spaces, including deep underground. Using statistical and mathematical algorithms, a SLAM device simultaneously locates itself within a scan and map, creating a virtual 3D image of the location, using Lidar sources in combination with basic positional data provided by an inertial measurement unit (IMU). This method allows the device to track its own position, while compiling an accurate and complete 3D point cloud of the surrounding environment. The self-sufficient internal coordinate system of the ZEB Horizon scanner used known control points throughout the cave. It could

Thanks to the versatility of the SLAM-based scanning technology, the participants were able to defy the challenges presented by the demanding environment in the Lombrives cave. The Deep Time project members were able to scan the underground environment quickly and accurately while remaining safe throughout the duration of the experiment.

Further reading Interactive sample data of the Grotte De Lombrives: https://samples.geoslam.com/Potree/Deep_Time_40/ Deep_Time_40.html

About the author Tomas Blaha is a surveying engineer with around 25 years of experience of working in European sales and marketing for international companies, including for leading manufacturers of surveying equipment and software. Today, he is channel manager Northern and Eastern Europe at GeoSLAM. One of the participants ventures into the 90m-deep well.

14 |

international | Issue 5 2021

13-14_featureblaha.indd 14

13-07-21 16:37


By Wim van Wegen, GIM International

feature

The Versatility of UAVs in a Remote and Rugged Archipelago

The Challenges of Surveying the Faroe Islands Remotely situated in the northern Atlantic Ocean, roughly equidistant from Scotland, Iceland and Norway, the Faroe Islands form a rugged and rocky archipelago. The cool and cloudy weather, with strong winds and heavy rain possible all year round, means that this is a challenging survey environment. In its search for the best method to capture this stunning environment, the mapping authority has turned to UAVs. This article tells the story of mapping and surveying a truly breathtaking spot on Earth. The weather is always a factor on and around the 18 islands that make up the Faroe Islands. Too much wind or rain is bad news for surveyors, among others. In the past, Umhvørvisstovan (the Faroese Environment Agency, which is the authority in charge of mapping and monitoring progress across the islands, including coastline mapping) used aeroplanes to capture the imagery needed for mapping and surveying. However, this was not without limitations because the aircraft had to be booked a few days in advance from photogrammetric companies in Denmark or Iceland. That often proved difficult in view of the changeable weather in the region – especially in periods when most of the companies were busy capturing images elsewhere.

Turning to crewless aerial mapping In 2015, Umhvørvisstovan therefore decided to work with unmanned aerial vehicles (UAVs or ‘drones’) instead of aeroplanes. The local survey team researched the strengths of drone photogrammetry and learned that the UAV-captured geospatial data could generate orthophotos with less work and effort than aeroplane-based photogrammetry. The labour-saving benefit was regarded as an important advantage, since there are only six employees to carry out all the mapping responsibilities at Umhvørvisstovan. Three of them work on surveying and mapping on land, whilst the other three work on nautical charts for ships and ferries (see box).

A hiker admiring the Drangarnir rocks – the iconic sea-stack with a hole in it – on the Faroe Islands.

Another benefit is that clear skies are not essential when using drones. In fact, the result

I ssue 5 2 0 2 1 |

15-16-17_featurevanwegen.indd 15

international | 15

13-07-21 15:19


is sometimes better with some cloud cover, as long as the drone can operate under the clouds. Having said that, however, poor weather earlier this year meant that Umhvørvisstovan was unable to collect any data using drones until the second half of May 2021. Even in calmer conditions, fog sometimes posed an issue – especially when it was hanging low at around the flying height of the drone. Fog can trigger the ground sensor, thus setting off the drone’s safety system, not to mention the fact that images collected while flying in fog are unusable. So in 2015, the Danish company COWI, who already had wide experience with drone mapping, sent a drone pilot to the Faroe islands tasked with collecting images of the capital (Tórshavn) and the second largest city (Klaksvík). This project successfully convinced the Faroese of the capabilities of UAVs for mapping applications, and less than a year later the team started looking to acquire drones for themselves. After some research, they ended up buying two FX-61 fixed-wing drones with Pixhawk installed, from the Danish company Nordic Drone. Later, in 2020, an eBee X was purchased to supplement the fleet.

Flexibility and other benefits For Umhvørvisstovan, the key benefit of drones is their flexibility. Another major benefit for the Faroese surveyors is the fact that UAV mapping entails a relatively short workflow, from collecting the data to the finished products. This means that the images are rapidly available, plus the surveyors appreciate

being in control of every step of the process. Now, in the case of any errors or unreliable data, the surveyors can either correct the errors or quickly collect new data themselves, without being dependent on others.

Ease of use and high-quality results In a place as unique as the Faroe Islands, situated in the middle of the Atlantic, aerial mapping of the islands is far from a run-ofthe-mill survey project and it involves a lot of pioneering. In order to complete challenging missions effectively and safely, it is important to know the capabilities and also limitations of the drone and how it will react in different circumstances. Umhvørvisstovan’s use of drones has not been without mistakes, but they have ultimately enabled the team to gain a lot of valuable experience. The main objective is to map all urban areas on the islands, and the maps that are created from the captured images are used mainly for land planning and for the national register. The municipality of Tórshavn even has its own drone to enable it to map the town at a higher rate than the agency is capable of. Since 2017, Umhvørvisstovan has collected 117,130 high-resolution images, which is an average of approximately 30,000 per year. The UAV-based maps have an average ground sampling distance of 3cm, which is considerably higher than before. Both drones in the Umhvørvisstovan fleet – the Phantom FX-61 fixed-wing drone fitted with a Pixhawk camera, and the senseFly

Hydrography of the Faroe Islands As the Faroe Islands are situated in the Atlantic Ocean, coastal and hydrographic mapping is also an important pillar for the authorities. The responsibility for the hydrography and charting was devolved to the Faroese authorities from the Danish authorities in January 2020. The Faroese seabed covers 300,000km2, and can reach depths of up to 3.6km in the north. Being a small country can sometimes be an advantage, however. The Hydrographic Office and the Land and Surveying Office in the Faroe Islands are actually in the same department at Umhvørvisstovan. This means that land and sea are right next door to each other, which presents some great collaborative opportunities. The Hydrographic Office within Umhvørvisstovan comprises just three members of staff who focus on hydrography, charting and administration. The responsibility covers eight nautical paper charts and 21 electronic navigation charts. Furthermore, Havstovan (the Faroese Marine Research Institute) recently launched a new 54m-long research ship, which houses a Kongsberg EM712 multibeam system. Umhvørvisstovan is responsible for the operation of this and gathers medium-to-deep water data. Landsverk (the Faroese Roads Authority) is responsible for gathering both surface data and bathymetry data to monitor changes in the ports and harbours.

16 |

A map showing the location of the Faroe Islands with respect to the rest of Europe.

eBee X with an Aerial X camera – have worked really well for the various projects. There are pros and cons to the two systems, the team noticed; the senseFly ecosystem is very robust and user-friendly, whereas the Pixhawk and Mission Planner set-up has the advantage of quick repairs and maintenance, such as in the case of a hard landing or when changing a servo. Both drones have also demonstrated that they are capable of coping very well with the often windy and turbulent conditions above the Faroe Islands. For processing, the team have used Pix4D ever since they started working with drones. They have found it to be very effective and robust photogrammetry/mapping software which delivers high-quality results combined with ease of use.

Mapping a tiny island Recently, Umhvørvisstovan mapped the tiny island (measuring just 2.34km2) of Svínoy. The data collection mission was split into three flights that gathered a total of 1,997 images based on careful flight planning to save the pilot’s time. The wind was, certainly by Faroese standards, gentle during the flights. Although there was some turbulence and the layout of the terrain was challenging, the eBee X was able to take off and land safely on some flat spaces on Svínoy. The captured data was processed in Pix4Dmatic, which took just over ten hours to crunch the whole dataset. The final map was then edited and annotated to add important details, such as coastlines, housing – including road names and addresses – as well as fields and agricultural plots. The resulting

international | Issue 5 2021

15-16-17_featurevanwegen.indd 16

13-07-21 15:19


feature

A detailed and clear point cloud output of a UAV survey of the Faroe Islands.

map is available for free download as an openaccess resource.

Keeping pace with the latest in mapping One important lesson for Umhvørvisstovan has been that sharing experiences with other drone pilots is an effective way to learn and stay prepared for unforeseen challenges. In this context, the small team of geospatial professionals of the Faroe Islands have close relations with other drone pilots – especially in the Nordic countries. Within this network of drone pilots, they meet up to discuss challenges, help one another with issues and share how their country works in terms of mapping and other matters.

A comprehensive view of Svínoy rendered in Pix4Dmatic software.

The Umhvørvisstovan team are keen to keep pace with the possibilities that new technology brings, and they regard participation at conferences within the mapping and GIS industry as another valuable way of learning about the latest trends and developments. Despite the isolated location, the Faroe Islands’ communication infrastructure is very modern. Therefore, in today’s technological era in which information travels at lightning speed, it is relatively easy for the team to stay up-to-date on the state-of-the art in mapping, and they will no doubt perform many more successful mapping projects in the future.

Acknowledgements It would not have been possible to write

this article without the tremendous help of Andreas Klein Arnbjerg, a drone pilot at Umhvørvisstovan.

Further reading Map of Svínoy and the other islands of the Faroe archipelago: www.foroyakort.fo.

Mobile mapping with... sheep! A couple of years ago, the Faroe Islands archipelago was one of the few places not available in Google Street View. As Google seemed to have no intention of mapping the Faroe Islands for the foreseeable future, an employee of the Visit Faroe Islands tourist board came up with her own solution. Instead of ‘Street View’, she arranged for a local shepherd and his sheep to produce ‘Sheep View 360’ by attaching cameras to the sheep to capture the environment as they moved around. Since the islands are populated by more sheep than people, this mobile mapping solution was brilliant in its simplicity. Upon hearing about the Sheep View project, Google responded enthusiastically and supplied the Faroe Islands with a Street View Trekker and 360-degree cameras. This enabled residents and tourists to assist the sheep in capturing images of the beautiful archipelago. Thanks to those efforts, Google Street View now includes the Faroe Islands. More info: www.62n.fo/travel/en/faroe-islands/ faroe-islands-in-the-media/sheepview-360

About the author

The island of Borðoy as seen from a drone’s perspective. The image shows a sunny view of the town of Klaksvik in the summer.

Wim van Wegen is head of content at GIM International. In his role, he is responsible for the print and online publications of one of the world’s leading geomatics trade media brands. He is also a contributor of columns and feature articles, and often interviews renowned experts in the geospatial industry.

I ssue 5 2 0 2 1 |

15-16-17_featurevanwegen.indd 17

international | 17

13-07-21 15:19


Grow your business!

TECHNICAL B2B MARKETING FOR SMART GEOSPATIAL COMPANIES WWW.GEOMARES-MARKETING.COM

_18_GIM_5-2021_LIJNTJE.indd 6

13-07-21 13:20


By Wim van Wegen, GIM International

feature

Keeping the Trans-Sumatra Toll Road on Track

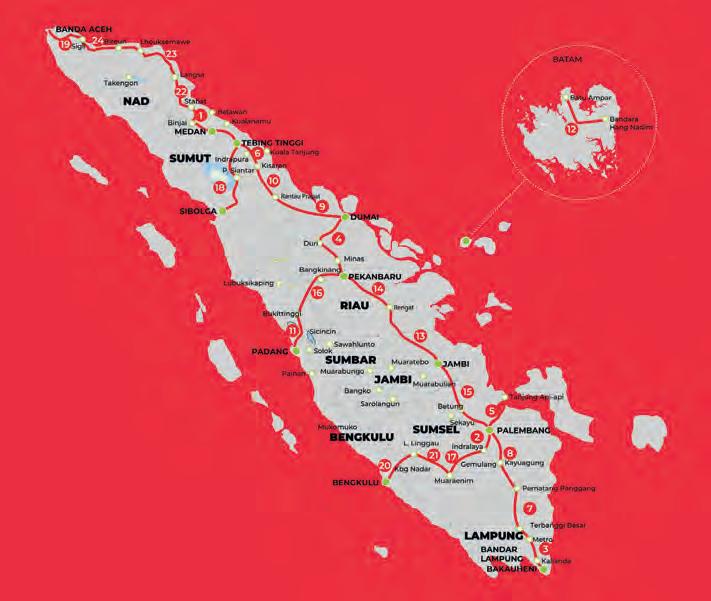
Large-scale UAV-Lidar Survey in the Tropics With a total length of 2,789km, the Trans-Sumatra Toll Road Project is one of Indonesia’s National Strategic Projects and the longest toll road project in Southeast Asia. In order to keep the project on track for the scheduled completion date of 2024, UAV-Lidar was chosen as the topographic data acquisition method, combined with building information modelling (BIM), to optimize the time planning and costs. Read on to learn more about this challenging project, which has included several obstacles. The Trans-Sumatra Toll Road Project will connect cities in the north, south, east and west of Sumatra, the second most populated island of Indonesia. The Indonesian Government assigned this mega project to PT Hutama Karya as a state-owned enterprise company. The company has been tasked with not only constructing the Trans-Sumatra Toll Road, but also with financing, planning the construction work and ultimately operating it.

UAV-Lidar mapping: the right choice

Karya therefore opted for UAV-Lidar mapping

In the search for the right mapping solution to carry out this immense project, Hutama Karya considered various options. Airborne Lidar was rapidly dismissed since the team concluded that the approach would meet neither accuracy expectations nor cost targets. Additionally, the use of aircraft would not allow the small-scale partial data acquisition needed for this project. Hutama

to offer the flexibility to adapt to the project size, dense vegetation and terrain as well as the accuracy, budget and scheduling requirements. From a survey perspective, using UAV-Lidar can reduce the acquisition time by an average of 13-15km/day compared with traditional land survey methods. The work can also be done by a single team. This results in 80-85% time efficiency, and the reduced manpower translates into lower overall survey costs. Additionally, Hutama Karya has used other survey methods based on the map scale requirements and work specifications. For example, land surveys were carried out to capture details for structural calculations and also in areas with a dense tree canopy. During the project, bathymetric surveying was also performed for rivers and dams because of Lidar limitations.

Careful planning

Map of the Trans-Sumatra Toll Road Project. (Image courtesy: Hutama Karya)

The island of Sumatra has a large mountain range. Corridor mapping in these circumstances is challenging because the flight planning has to take the capability of the unmanned aerial vehicle (UAV or ‘drone’) in the terrain into consideration without sacrificing the data quality. The company therefore always conducts a detailed pre-survey and discusses the flight plan with their UAV specialists and also with the UAV manufacturer to ensure a safe and optimal flight plan. In this case, to map the planned toll road, Hutama Karya used the fixed-wing eVTOL Tron UAV from Quantum Systems. It was equipped with the YellowScan Surveyor Ultra UAV Lidar sensor payload.

I ssue 5 2 0 2 1 |

19-20-21_featuresumatra.indd 19

international | 19

13-07-21 15:19


Aerial photo of the Trans-Sumatra toll road under construction. (Image courtesy: Hutama Karya)

Because the toll road project mostly crosses through isolated non-populated areas, another challenge is posed by the condition of the existing roads. Due to poor accessibility, 4x4 cars are essential workhorses for the Lidar survey, and the route options required careful planning. The corridor mapping process was divided into 10km sections. In a best-case scenario this translated into 220 flight missions. The worst-case scenario plan – which took account of realistic threats due to factors such as poor weather conditions, potential damage to the UAV or sensors, and the need for repairs – envisaged 350 flight missions.

Challenges of mapping in the tropics The biggest challenge for the team while on data acquisition duty was the weather; poor conditions significantly hindered the Lidar acquisition process. On one occasion they could not fly for a full week because of bad weather. Additionally, the weather caused disruption on the local roads, such as landslides, falling trees or large holes, forcing the survey team to take time-consuming detours from their originally planned routes.

The corridor-mapping survey team. (Image courtesy: Quantum Systems)

It is standard procedure to closely observe the weather conditions for one or two days to identify the pattern of the local weather behaviour. Based on these observations, the team could plan the flights, taking into account the mission duration, the flight length and the exact time when potentially good weather conditions were forecast. Another project challenge was to meet the required LE90 accuracy of 0.25m for the 1:1,000 map scale (based on The Geospatial Information Agency Standard for Large-scale Maps). On the first three of the Lidar surveys for the sections Muara Enim to Bengkulu, Padang to Pekanbaru and Aceh to Sigli (611km), the team struggled to meet that accuracy tolerance for each of the survey points. To tackle these accuracy challenges, the project team conducted trial-and-error scenarios and practical research in-house, and exchanged knowledge with researchers and also with the YellowScan support team to discuss the acquisition, processing and postprocessing strategy. After much discussion back and forth, the team have now found a successful formula and are continuing to adapt it for the entire project.

A third challenge related to the hilly and forested terrain, especially around the areas of Muara Enim, Padang, Bengkulu and Pekanbaru. To overcome this, the project was flown at an altitude of 150m above ground level (AGL), even though YellowScan recommends a maximum flight altitude of 80m AGL for its Surveyor Ultra. This pushed the boundaries of the Lidar system, but was deemed necessary to avoid the risks of flying at a low altitude over such extreme terrain. In fact, in a local first, the project took advantage of the regulations in Indonesia to conduct beyond-visual-line-of-sight (BVLOS) flights in the area around Muara Enim over each 30km-long survey section. This 30km corridor mapping was performed from three take-off and landing points, using a Leica GPS base station on the ground. Although the dense tropical forest (palm trees) made it difficult to identify the initial ground control point (GCP), the team succeeded in meeting the accuracy requirements.

Recommendations for further improvement Now 18 months into this prestigious project, Hutama Karya has conducted 1,478km of corridor mapping with the UAV-Lidar system. In fact, this Lidar survey has become the

UAV-Lidar survey for the Aceh to Sigli section. (Image courtesy: Hutama Karya)

20 |

international | Issue 5 2021

19-20-21_featuresumatra.indd 20

13-07-21 15:20


feature

Preparing for the UAV-Lidar survey of the Betung to Jambi section. (Image courtesy: Hutama Karya)

fastest topographic survey with detailed engineering design (DED) accuracy in Indonesia. This achievement gives cause to be optimistic about the goal of finishing all corridor surveys by the end of 2021. Nevertheless, there still is some work to be done to achieve the LE90 accuracy tolerance for all sections of the project. The project team are continuously finetuning their skills at operating and using the UAV-Lidar system, but their experiences also form the basis for suggestions for further improvements. Firstly, they would like VTOL fixed-wing UAVs to be made more weatherresistant so that they can be used in a wider variety of conditions. Secondly, the current UAV-Lidar system has a telemetry capability

Lidar point cloud of the existing Pekanbaru to Dumai toll road section. (Image courtesy: Hutama Karya)

of ±5km. Further improvement of the system telemetry range, either with radio or 5G connectivity, would make UAV flights safer for everyone – especially for BVLOS. Moreover, the team members hope to see a better combination of laser, IMU and GNSS in the Lidar system to make it possible to capture more detailed survey data. Lastly, the team is looking forward to even lighter and more resilient Lidar systems in the future, with more endurance so that they can combine more payload. Ideally, it should be possible to combine UAV-Lidar and an RGB camera in a single fixed-wing UAV. All these improvements will produce better data quality when combined with a competent and experienced pilot.

Conclusions Overall, the Trans-Sumatra Toll Road Project is on track for success, and the main obstacles during Lidar data acquisition have largely been overcome. The UAV-Lidar mapping method used by the project team proved to be capable of conducting very large-scale Lidar data acquisition missions for corridor mapping. The chosen mapping solution, YellowScan Surveyor Ultra, has been shown to work well in sometimes harsh conditions, including when operated above the recommended flight altitude, in high humidity and under other tropical constraints. UAV-Lidar systems can therefore optimize the time and cost involved in obtaining accurate topographic data as the basis for better decision-making in the project planning phase. This large-scale project is evidence of how UAV surveying has continued to evolve since becoming a standard tool for professional surveyors and is repeatedly opening up new opportunities.

Acknowledgements Many thanks to PT Hutama Karya for being willing to share extensive details about this project, which can rightfully be described as prestigious. Additional thanks go to YellowScan for facilitating contact with the project leaders in Indonesia.

About the author

DTM of the Betung to Jambi section (top) and BIM in InfraWorks software using the Lidar DTM of the Betung to Jambi section (bottom). (Image courtesy: Hutama Karya)

Wim van Wegen is head of content at GIM International. In his role, he is responsible for the print and online publications of one of the world’s leading geomatics trade media brands. He is also a frequent contributor of columns and feature articles, and often interviews renowned experts in the geospatial industry.

I ssue 5 2 0 2 1 |

19-20-21_featuresumatra.indd 21

international | 21

13-07-21 15:20


Q&A with Chris Fisher, Earth Archive

Creating a Digital Twin of the Earth An unprecedented scientific effort to Lidar-scan the entire surface of the Earth before it’s too late... that’s how Chris Fisher, founder of the Earth Archive, describes his initiative. He started the Earth Archive based on his experience of using remote sensing technologies in Mexico and Honduras. His aim is to better understand the causes and consequences of urbanism and environmental change.

Can you explain more about what the Earth Archive project encompasses? As you know, the Earth is changing rapidly and we have a limited time to document it, as it exists now, before it’s too late. The Earth Archive hopes to promote the 3D scanning of the entire land surface of the planet, but we are starting with the areas that are not going to get done in time. The initial focus is on the Amazon and areas of North America. We hope to help create an open-source digital twin, both to better combat the climate crisis and also to act as a permanent legacy for

future generations. The data is like a Swiss army knife – it can act as an accelerator for both science and industry. We hope to have the same sort of impact that declassifying the GPS signal had, or open-sourcing the Landsat record.

What data acquisition technology is being used to map the Earth and how is all the resulting big data handled? At the moment we are focusing on airborne Lidar – from a helicopter or fixed-wing aircraft. Unmanned aerial vehicles (UAVs or ‘drones’)

that are available to the general public do not have the capacity or range for the currently scanning technology. The amount of data is obviously huge. However, this is similar to other major acquisition programmes globally. At the moment, the Earth Archive mission is to provide the data as .las or .laz files only, which is the current industry standard for Lidar, rather than visualizing the data ourselves. I imagine that the data will ultimately be treated and visualized in a multitude of ways.

What is your response to sceptics who express doubts about the feasibility of the Earth Archive project? The only sceptics so far have been focused on costs. In terms of feasibility, massive ‘scaling up’ will definitely need to happen but we have received surprisingly little opposition. We have had impressive and immediate positive response from industry and have received many donations of time, equipment and other resources.

You plan to map the Earth’s surface in stages. The next stage is to scan the entire Amazon basin. What’s the current status of this?

View of a sunset over the trees of the Brazilian rainforest.

22 |

We have the necessary infrastructure, logistics and corporate buy-in to map the entire Amazon. We have a rudimentary structure in place for all nine countries that encompass the Amazon, and the basic permissions we need. We hope to begin scanning late in the autumn of 2021 or early 2022. As you can imagine, COVID-19 has had a major impact on our planning. This will be an exciting venture, since this part of the planet is one of the

international | Issue 5 2021

22-23_intervieweartharchive.indd 22

13-07-21 15:20


interview

last unexplored places on Earth, so we look forward to discovering and exploring unknown ancient cities and cultures.

In view of your professional background as an archaeologist and professor of anthropology, what are your own expectations of mapping the Amazon in this way? One interesting thing for me as an archaeologist is that we will be able to demonstrate how densely settled the Amazon was at the time of contact and how humanized the landscape was. This is a major question in the prehistory of the region, and it’s something that we can help elucidate. As we all know, the Amazon rainforest plays a crucial role in the Earth’s climate. However, few people are aware it has an incredibly rich indigenous history. On top of this, this region boasts a remarkable level of ecological diversity. Sadly, we see it vanishing before our eyes. Today, we have the ability to digitally preserve landscapes – very high-resolution Lidar enables archaeological, anthropological and conservation studies and provides essential information to help advance sustainable development. I am also sure it will

bring us groundbreaking revelations of the Amazon’s astounding past.

Who stands to benefit from the Amazon map and from the Earth Archive project as a whole? We are hoping to help level the playing field in terms of access to data, to help create equity in

access to high-quality geospatial recourses. The Earth Archive is set to provide a comprehensive baseline database of the Earth’s surface, and everything on it, at a high resolution (equivalent to at least 25cm pixels) that is accessible to as many as possible. In a nutshell, the ultimate goal of the Earth Archive is to create a digital planet as a gift for future generations.

Further reading www.theeartharchive.com

About Chris Fisher

The objective of the Earth Archive is to build a virtual, open-source digital twin of our Earth which is accessible to all, so we can better understand the world as it is today and can also docoument it for future generations.

Chris Fisher is an archaeologist, National Geographic Explorer and professor of anthropology at Colorado State University, USA. He has performed fieldwork throughout Latin America, Europe and North America. His work is featured in the New York Times bestselling book called The Lost City of the Monkey God by Douglas Preston. Fisher founded the Earth Archive to better understand the causes and consequences of urbanism and environmental change.

Issue 5 2 0 2 1 |

22-23_intervieweartharchive.indd 23

international | 23

13-07-21 15:20


Penetrating the Elusive Spaces Where Glacier Meets Land in Patagonia

Laser Scanning Solutions for Glacier Exploration “Look deep into nature, and then you will understand everything better,” Albert Einstein is quoted as saying. And indeed, looking deep into glaciers can help us understand climate change. But glacier exploration is notoriously treacherous. Even where meltwaters and landforms create openings and caverns in the ice, these can be inaccessible due to the risk of collapse and falling blocks of ice. Nonetheless, many fundamental physical and biological processes operate in caves and crevices in glacial ice, making them a challenging but fruitful area of study. A team of scientists and surveyors set out on an expedition to a Patagonian glacier to collect data on ice flow and dynamics. They integrated several 3D laser scanning instruments and techniques: terrestrial laser scanning (TLS), unmanned aerial vehicle (UAV or ‘drone’) photogrammetry surveys and a GNSS smart antenna.

The Leica ScanStation P40 was used to capture 3D data within and near the entrance of a cave at the base of the Perito Moreno glacier, Argentina. (Image courtesy: Alessio Romeo)

24 |

international | Issue 5 2021

24-25-26_articleleica(sponsored).indd 24

13-07-21 15:39


sponsored article

Technological advancements have brought increasingly robust instruments, enabling more rapid data acquisition and powerful processing abilities even in extreme field environments like glaciers, according to Tommaso Santagata, surveyor and speleologist from VIGEA – Virtual Geographic Agency and part of the Patagonia team. “Terrestrial laser scanning can give us a lot of information that we can merge, for example, with satellite data, to better understand the velocity of the movement of the glaciers and changes happening on the surface of the glaciers. The idea is also to better understand how these changes provoke other changes, in the caves and in the environment near the glaciers, because it’s all connected.” The spectacular sight of the Perito Moreno glacier in Argentina’s Los Glaciares National Park attracts nearly 100,000 tourists each year. The Perito Moreno is one of 48 glaciers fed by the South Patagonia icefield, an ice mass covering more than 250km2 and extending more than 30km east. At its front, the Perito Moreno cuts through the Brazo Rico arm of Lake Argentino, forming a natural dam. Unusually in the context of global warming and climate change – and setting this glacier apart from others in the region – the ice mass of the Perito Moreno glacier was relatively stable during the last half century. Scientists have therefore looked to it for insights about how glaciers might respond to future climate change. The expedition In March 2017, a team organized by the Italian La Venta Esplorazioni Geografiche and the French Spélé’Ice, in collaboration with Leica Geosystems – part of Hexagon – and several academic partners, set out to study the Perito Moreno glacier. Expedition members and project researchers sought to learn more about the micro flora and fauna inhabiting the glacier and gain a better understanding of ice dynamics and the speed of glacial melting. The team also wanted to investigate and map at least one glacier cave. For this, an opening at the base of the glacier, carved out by a feeding stream, provided a worthwhile study object. As the cave was too dangerous to explore on foot, laser scanning and UAV photogrammetric surveys were carried out from a safe distance to map a 50-60m segment of the interior of the cave and the area surrounding the cave entrance.

The technologies The Patagonia expedition provides yet another example of how new instruments and technologies, in this case laser scanning and UAV photogrammetry, are revolutionizing geographic surveying. “These techniques are increasingly used in geological studies, such as in caves or for the calculation of ice surfaces and changes in ice volumes,” says Santagata. “3D laser scanning technologies can acquire millions of points represented by 3D coordinates, at very high spatial densities on complex multifaceted surfaces within minutes. The dense point clouds contain a huge amount of data that can be used for representation and analysis.” On the Perito Moreno expedition, the team used a Leica ScanStation P40, which captures high-quality 3D data and high-dynamic range (HDR) imaging at a distance of up to 270m. The laser scanner was controlled using a Leica CS35 tablet computer, which also enabled team members to verify the partially processed data while still in the field. “It’s very easy to process the data immediately,” comments Santagata. “It’s fantastic that in the field you can see right away if you have obtained all the data.” Eight scans in two hours Eight laser scans were performed in an operation that took about two hours, working in the late afternoon to avoid direct sunlight. The camera integrated into the laser scanner was used to produce coloured point

clouds and take 360° panoramic images. Two UAV photogrammetry flights were carried out, at 30-70m altitude. These produced some 120 georeferenced photographs in DNG file format. To get a sense of the daily movement and ablation of the ice, the team used a Leica Viva GS16. This is a ‘self-learning’ GNSS smart antenna, meaning that the instrument is designed to distinguish strong signals from weak or noisy signals and to hone in on only those signals that provide the best performance. The GNSS smart antenna was used both to obtain measurements for ground control points for the UAV photogrammetry survey and to determine velocity and elevation changes along a northsouth strip of the glacier. By pairing the instrument with the CS35 tablet computer, the team could again verify and partially process the data directly in the field. The set-up enabled measurement of the speed of ice flow both at the edges and in the centre of the glacier and observations of changes in glacier surface morphology over the four days of the fieldwork. “The changes are remarkable, even in this short period of time!” one expedition member marvelled. Visualizing the data in an interactive 3D model To align the point clouds and create a 3D model, the survey team used Leica Cyclone point cloud processing software.

Issue 5 2 0 2 1 |

24-25-26_articleleica(sponsored).indd 25

international | 25

13-07-21 15:39


sponsored article

Modern instruments offer extremely fast scan rates and powerful processing abilities, even in extreme field environments like glaciers. (Image courtesy: Alessio Romeo)

The model was then processed further with Leica Cyclone 3DR to obtain several kinds of outputs and elaborations from the laser scanning and photogrammetry data. Cyclone 3DR handles most industry-standard formats, so the team could merge the laser scanning data with images taken by the UAV to create the model. To share the 3D data with colleagues outside the team, they used Leica Geosystems’ free JetStream Viewer. This allows anyone – even those without 3D modelling experience – to easily view and manipulate point clouds. Good science As global warming and climate change progress, key questions for the scientific community are how much and how quickly the glaciers will melt and what that means for life on Earth. One thing we know with certainty is that geomatics will be essential in finding answers. The Perito Moreno expedition marks a new line in a tradition of exploration dating back to prominent 19th-century Argentinian explorer and academic Francisco Moreno, after whom the Perito Moreno glacier is named. Experts who have studied glaciers for decades have witnessed the startling speed of glacier thinning and retreat. The Perito Moreno has been relatively stable in terms of ice mass, which makes it an anomaly.

26 |

But this glacier, too, is thinning. Glaciers here are retreating at an unprecedented rate, with some at low altitudes expected to disappear completely within the next 25 years. This process contributes significantly to sea level rise and raises questions about the sustainability of urban freshwater supplies, agriculture and the future of hydroelectricity in the region, as these often depend on glacial or snow run-off. Extremely fast and powerful data collection instruments and techniques, as well as intuitive data processing solutions that can be accessed in the field, enabled this expedition to bring home an abundance of data and information for analysis – an accurate record from which to measure further changes in the ice and to create 3D models for divulgation purposes. Inspiring and educating The project outputs are already inspiring and educating the next generation of professionals. Following the expedition, 360° photographs from the 3D models and an interactive 3D model were produced. Visitors to the International Speleological Meeting in Sardinia, Italy, in 2019 could explore the model through virtual reality glasses, for a more visceral experience of the glacier’s interior relief. The 3D model is now publicly available online. It is important to note that the 3D

laser scanning of the cave was not a primary objective of this expedition. The opportunity to have these technologies and instruments in the field, in the right place at the right time, allowed their use to obtain this important data collection. The data can now be applied for comparisons, to better understand future changes of this part of the glacier. That is a worthwhile goal for the future. Organizations involved in the project Los Glaciares National Park, La Venta, Spélé’Ice, University of Milan-Bicocca, Natural History Museum of Paris, Paris Diderot University, University of Florence, University of Bologna, VIGEA – Virtual Geographic Agency, and Leica Geosystems – part of Hexagon.

Disciplinary cross-fertilization A primary objective of the Patagonia expedition was to collect microorganism samples from cryoconites, which are grey powdery deposits on glaciers. Due to their darker colour, they form holes on the ice surface, creating spaces where micro ecosystems can develop. Using photogrammetry, VIGEA’s Tommaso Santagata created a 3D model of the main cryoconites sampled by the team’s biologists, demonstrating the value of having multifunctional and manageable instruments in the field.

international | Issue 5 2021

24-25-26_articleleica(sponsored).indd 26

13-07-21 15:39


By Wim van Wegen, GIM International

Report

How Geospatial Technology is Vital for Exploring Mars When NASA’s Perseverance rover landed on Mars in February 2021, it was equipped with some of the most precise maps of Mars ever created, courtesy of the USGS Astrogeology Science Center. Not only were these new maps essential for a safe landing on Mars, but they also serve as the foundation upon which the science activities planned for the Mars mission will be built.

In order to safely land on the rugged Martian landscape, the spacecraft used a new technology called Terrain Relative Navigation. As it descended through the planet’s atmosphere, the spacecraft used its onboard maps to know precisely where it is and to avoid hazards. For the navigation to work, the spacecraft needed the best possible maps of the landing site and surrounding terrain.

Two USGS-developed Mars maps The USGS developed two new maps for the Mars mission. The first is a high-resolution (25cm per pixel) map that researchers have used to accurately map surface hazards at the landing site. This map serves as the base map for mission operations and to plot where the rover will explore after landing. The second map is a lower resolution (6m per pixel) map that spans the landing site and much of the surrounding terrain. This was used onboard the spacecraft, along with the locations of the

hazards from the high-resolution map, to help it land safely. The maps have been aligned with unprecedented precision to each other and to global maps of Mars to ensure that the maps show the hazards exactly where they really are. NASA used remote sensing technology to decide between 30 potential landing sites for the Mars Perseverance Rover Mission. The two maps are based on images collected by the Mars Reconnaissance Orbiter’s Context Camera and the High-Resolution Imaging Science Experiment (HiRISE) camera. After intense scrutiny of the sites, they decided to select Jezero, a 49km crater in the Syrtis Major quadrangle on Mars, as the landing site.

be astrobiologically interesting, with signs of possible ancient life; there should be enough suitable material at the site for collection and caching for possible future pick-up; and the site should contribute new knowledge that will help humans go to Mars.

Explore Mars with GIS

The role of remote sensing data

Esri recently developed the ability to use other planetary coordinate systems with a 3D globe, and the timing could actually not be better as we recently witnessed the successful landing of the Perseverance rover. Digital elevation models (DEMs), precise imagery and spatial data representing previous rover landing sites all display accurately under the Martian coordinate system, and it can all be explored with the Explore Mars app.

The landing site for Perseverance had to fit four main criteria: the site had to be geologically diverse, showing signs of the processes that formed it; the location had to

In anticipation of future missions to Mars, GIS techniques have already been applied to previously collected elevation data from

Oblique view looking toward the northwest shows the western rim and floor of Jezero crater, Mars. (Source: USGS)

DEM of the Martian surface derived from Mars Orbiter Laser Altimeter (MOLA) data that was captured at 463m by 463m resolution during the Mars Global Surveyor mission.

I ssue 5 2 0 2 1 |

27-28_exploringmars.indd 27

international | 27

13-07-21 15:29


TOPO-BATHYMETRIC UAV LASER SCANNER

The Explore Mars app enables users to virtually visit the canyons, mountains and craters of Mars.

Mars to model the terrain to aid rovers and, eventually, humans. The National Aeronautics and Space Administration (NASA) created digital elevation models from data provided by the Mars Orbiter Laser Altimeter (MOLA), an instrument on its Mars Global Surveyor spacecraft (1997 to 2001). Digital terrain models (DTMs) have been produced from the above-mentioned HiRISE camera on board the Mars Reconnaissance Orbiter that has been collecting data since 2006.

simultaneously captured topo-bathymetric LiDAR data above and below the water line (rock formation "Les Deux Frères" Cap Sicié Toulon, France)

EFFICIENT HIGH RESOLUTION UAV COASTLINE OR SHALLOW WATER SURVEYING • ideally suited for integration on UAVs and helicopters • green laser providing more than

2 Secchi depths water penetration

“Our understanding of the planets in our solar system, as well as exoplanets, will begin to increase exponentially. At the same time, we will continue to apply the remote-sensing/GIS processes that we develop for Earth to planetary environments where applicable. Especially for a planet like Mars, where it is likely humans will be taking field measurements within the next 15-20 years, a unique opportunity for planetary image data verification will develop. It will allow us to better interpret the imagery we collect and improve the geospatial models we create for interplanetary study, and I think that’s very exciting,” François Smith, geospatial data scientist at MDA Information Systems LLC in Gaithersburg, Maryland, USA, stated back in 2017.

• measurement rate 50 kHz - 200 kHz • integrated inertial navigation system and digital camera

WATCH OUR VIDEO The RIEGL VQ-840-G Airborne Laser Scanner for Topo-Bathymetric Surveying

Explore the full portfolio of proven RIEGL LiDAR sensors and systems www.riegl.com

read here (https://bit.ly/3xPdHX6) about a project that compared attributes of three of the final contenders for the Perseverance/Mars landing site and shows how the data acquired by the remote sensing equipment aboard the Mro helped make the final decision.

ENRICHED ONLINE VERSION

newsroom.riegl.international

Austria | USA | Japan | China | RIEGL WORLDWIDE | Australia | Canada | United Kingdom

28 |

InternatIonal | Issue 5 2021

27-28_exploringmars.indd 28

13-07-21 15:29


By Karol Bartoš, Katarína Pukanská and Pavel Bella, Slovakia

feature

TLS and SfM survey of the Ochtiná Aragonite Karst Phenomenon in Slovakia

High-resolution Topography of a World Heritage Cave The Ochtiná Aragonite Cave in Slovakia is a world-famous karst landscape of significant geological, geomorphological and mineralogical value. It represents a combined labyrinth consisting of parallel tectonically controlled halls and passages. The dissected and irregular morphologies of the cave were surveyed using terrestrial laser scanning (TLS) and structure-from-motion (SfM) digital photogrammetry. The new detailed map, sections and 3D model create an innovative platform for a more detailed study of the morphology and genesis of this unusual cave, including for its environmental protection and use in tourism.

The Ochtiná Aragonite Cave is located on the north-western slope of Hrádok hill (809m) in the Revúcka vrchovina mountains in southern Slovakia (Figure 1). It was discovered accidentally during an excavation of the exploratory adit in 1954. Since 1995, it has been part of the Caves of Aggtelek Karst and Slovak Karst UNESCO World

Heritage site. It is famous and significant not only for its rich and rare aragonite decoration, but also because of its specific morphologies. However, the complex morphology of this cave, especially of its medium-scale and small-scale morphologies, is not sufficiently visualized on the existing speleological maps.

Classic surveying and mapping of bedrock surfaces with such irregular and rugged morphologies is much more time-consuming and mostly less precise. For this reason, TLS and SfM photogrammetry were used for the new geodetic surveying and 3D mapping of the cave.

High-resolution survey

Figure 1: Location of the Ochtiná Aragonite Cave in Slovakia. (Image courtesy: GKÚ Bratislava, Google Earth)

Figure 2: Laser scanning in the cave with aragonite decoration.

Terrestrial laser scanning and SfM digital photogrammetry can be considered as a suitable technology for non-contact measurement of spatial coordinates, 3D modelling and visualization of complex underground structures. The high speed of surveying, accuracy, higher productivity versus common geodetic methods, significant shortening of fieldwork and automatic data processing into digital models make this technology almost irreplaceable in rapid speleological mapping. Another important advantage is the use of an own-source laser beam, which ensures hassle-free surveying in poorly illuminated or non-illuminated underground spaces. During the TLS survey, a Leica ScanStation C10 scanner (Figure 2) was used to scan cavities, ponds, tourist paths as well as aragonite decoration with high resolution and

I ssue 5 2 0 2 1 |

29-30-31_featurebartos.indd 29

international | 29

13-07-21 15:21


Figure 3: 3D model of the cave based on TLS.

detail. Overall, more than 121 million points were measured using 54 survey stations. The horizontal and vertical resolution on the scanned surface was 20 × 20mm. Additionally, the SfM method of digital close-range photogrammetry (one of the most advanced methods of processing photogrammetric images) was implemented to achieve high-resolution mapping of selected morphologic structures. As conventional photogrammetric methods require a set of identical points present on photographic images with their known spatial position, camera positions and scene geometry in the SfM method are reconstructed simultaneously based on the automatic identification of characteristic matching features. All images were captured by a DSLR Pentax K-5 digital camera with a Pentax SMC DA 15mm lens. The appropriate illumination of

the image surfaces was ensured by spotlights along the tourist path, so no additional lights were needed. However, due to the spotlights, individual camera stations had to be carefully chosen to avoid blocking the source of the light and creating shadows on the surface. In total, 62 images were captured, from which the final point cloud containing 23 million points was generated in Agisoft PhotoScan software.

spongework-like hollows. The whole cave represents a labyrinth with a high degree of connectivity.

3D model of the cave Results Based on the findings from the new TLS survey of the cave, its total surface area is 1,335m2. The cave volume is 4,424m3 and the circumferential surface of the cave body is 7,064m2. The largely irregular and uneven circumferential surface of the cave body relates to numerous medium-scale and smallscale phreatic and epiphreatic morphologies. In terms of gross morphology and ground plan pattern, the cave is composed of parallel

Figure 4: The cave position within the base map from the ZBGIS Map client. (Image courtesy: GKÚ Bratislava)

30 |

tectonically controlled passages and halls that are interconnected by smaller transverse conduits of phreatic and epiphreatic morphology. There are numerous ceiling cupolas and smaller spherical cavities, a flat ceiling, inwardly inclined smooth facets and

Computer graphics and IT advancements are increasingly creating new and better conditions for digital data processing. In this case, the triangulated irregular network (TIN) method was applied. It was not always possible to use all the scanned points with the original point density for the final surface modelling. Therefore, the density of points was reduced to a defined distance of 100mm between points to generate a homogeneously composed and reduced point cloud. This was used to create the final TIN model of the cave (Figure 3). The spatial localization of the survey into the appropriate coordinate system and vertical datum enables the connection of the final 3D model with the surrounding digital terrain model (DTM) and accurate determination of its positional and vertical span (Figures 4 and 5). In addition, such a digital model can then be used to derive spatial relationships with the corresponding DTM (or another nearby underground structure) for further geo-exploration (geophysical surveys, civil engineering works, etc.). The 3D model illustrates that the Ochtiná Aragonite Cave consists of a striking linear passage formed along a steep fault, and a longer irregular spongework labyrinth of passages and halls.

international | Issue 5 2021

29-30-31_featurebartos.indd 30

13-07-21 15:21


feature

Additionally, some of the specific morphologies of the Ochtiná Aragonite Cave were imaged and photogrammetrically processed. A high-resolution 3D model of these different morphologies is necessary for a more detailed study of their origin (Figure 6). The comparison of both technologies confirms that the significantly denser point cloud from photogrammetry provides a more detailed and smoother course of the model surface of the selected cave wall than the laser scan data. Additionally, laser scan data reveals more significant deviations at sharper edges and transitions, which is also the result of the lower density of the scanned data.

as well as medium-scale and small-scale solution forms. Moreover, terrestrial laser scanning made it possible to determine the basic surface and volumetric values of the cave. Both technologies have specific requirements, advantages and disadvantages (in terms of accuracy, financial demands and practical issues when working – especially in narrow cave spaces and when illumination of the surface is necessary). Therefore, the combination of these methods has been shown as the most suitable for detailed mapping of complex cave spaces. It enables all of their specific features to be captured so that comprehensive data on the overall morphology can be created in the most accurate and detailed way.

Conclusions Surveying the Ochtiná Aragonite Cave using terrestrial laser scanning provided the most actual and precise map of this very remarkable cave. This map, in several sectors refined by surveying with digital photogrammetry, is an important tool for a more detailed study of cave morphology – including its structural and tectonic control,

Since the Ochtiná Aragonite Cave has opened to the public, the results of this new survey can now also be used to address some other issues related to human impact on the cave environment, such as microclimatic changes due to the movements of visitors in different parts of the cave and their negative influences on the fragile aragonite formations.

Further reading Pukanská, K.; Bartoš, K.; Bella, P.; Gašinec, J.; Blistan, P.; Kovanič, L’. Surveying and High-Resolution Topography of the Ochtiná Aragonite Cave Based on TLS and Digital Photogrammetry. Appl. Sci. 2020, 10, 4633. https://doi.org/10.3390/app10134633

Multimedia The point cloud from the TLS survey: http://ugkagis. fberg.tuke.sk/potree/ochtinska_aragonitova.html

Acknowledgements This work was supported by the grants No. 1/0146/19 (VEGA) and No. 004TUKE-4/2019 (KEGA) funded by The Ministry of Education, Science, Research and Sport of the Slovak Republic. The authors would like to thank the Slovak Caves Administration for giving permission for 3D laser scanning, digital photogrammetry and geomorphological research in the Ochtiná Aragonite Cave.

About the authors Karol Bartoš is an assistant professor at the Institute of Geodesy, Cartography and GIS, Technical University of Košice, Slovakia. His research fields are digital photogrammetry technologies, terrestrial laser scanning and remote sensing, and their use in the creation of spatial models of underground and surface objects and the mapping of natural and anthropogenic objects and phenomena.

Figure 5: 3D model over the local DTM.

Katarína Pukanská is an associate professor at the Institute of Geodesy, Cartography and GIS, Technical University of Košice, Slovakia. Her research interests cover laser scanning and digital photogrammetry in creating spatial models of surface and underground objects, digital terrain models and mapping, and using these technologies in special industrial applications. Pavel Bella is a geomorphologist and geographer, associate professor at the Department of Geography, Catholic University in Ružomberok, and head of the Cave Protection Department at the Slovak Caves Administration in Liptovský Mikuláš. His research activities cover karst geomorphology, speleology, geochronology and environmental geography.

Figure 6: High-resolution 3D model from the SfM digital close-range photogrammetry.

I ssue 5 2 0 2 1 |

29-30-31_featurebartos.indd 31

international | 31

13-07-21 15:21


Report

Expedition Team Reveals Deepest Points in Indian and Southern Oceans As part of the Five Deeps Expedition (FDE) team, scientists from Caladan Oceanic LLC and the British Geological Survey (BGS) have for the first time surveyed in detail the deepest reaches of the Indian Ocean and the Southern Ocean.

Prior to the FDE, the deepest parts of some oceans were relatively well known, such as Challenger Deep in the Mariana Trench, but others had multiple ‘deeps’ where several contenders challenged for the deepest point in that particular ocean. Data published in Geoscience Data Journal now shows the deepest point of the Indian Ocean at 7,187m within the Java Trench, and the deepest point of the Southern Ocean at 7,432m within the South Sandwich Trench.

Multibeam Sonar Survey of Deep-sea Trenches Located just north of the Antarctic continent, the South Sandwich Trench spans both the Southern and Atlantic oceans. It is the only sub-zero hadal zone (deeper than 6,000m) in the world. The FDE survey produced the most accurate mapping of the South Sandwich Trench to date, using a modern multibeam sonar system. The new survey has shown that the deepest point of the trench is Meteor Deep at 8,265m, located within the waters of the Atlantic Ocean. The recently named Factorian Deep, located at the southern end of the trench, is 7,432m deep. The Java Trench, in the eastern Indian Ocean, is more than 4,000km long. In April 2019, the FDE undertook the first crewed descent to the absolute bottom of the trench (7,187m). This mission also produced the first British person to descend into the hadal zone and the deepest dive by a British citizen: Prof Alan Jamieson. Since then, he and fellow Brit John Ramsay have dived to the deepest points of the Mariana Trench during the FDE, thus beating that record.

32 |

Full-ocean Depth Crewed Submersible The submersible DSV Limiting Factor and the three supporting free-fall lander systems were fitted with specialist sensors that recorded data during both their descent to the sea floor and their return journey to the ship, thus playing a crucial role in mapping the deeps. The data was used to calculate full-ocean depth sound velocity profiles to correct the multibeam bathymetry data. This work was truly unique, since many offshore expeditions do not have the time or technology to send these sensors to the sea floor and therefore rely on sound velocity models rather than direct measurements. “The global Five Deeps Expedition allowed us a unique opportunity to accurately map some of the most remote and deepest places in the world, and to validate these depths with measurements collected by the submersible and support landers,” said Cassandra Bongiovanni, chief hydrographic surveyor for the FDE and lead author of the study. “Access to state-of-the-art full-ocean depth technology allowed us to map an area equivalent to continental France in only ten months. Around 61% of where we went had never been mapped using modern technology,” she added. “Initiatives such as the Five Deeps Expedition allow us to fill in knowledge gaps and reveal for the first time the seascape of large underwater features like subduction trenches. Collecting detailed bathymetry data allows us to further understand past and current processes, and to explore links between geology and the biodiversity of these ultra-

Map showing the locations (red dots) of the deepest points in each of the world’s five oceans (Atlantic, Southern, Indian, Pacific and Arctic). Global bathymetry from Global Multi-Resolution Topography Synthesis (GMRT). (Source: BGS) deep environments,” commented Heather Stewart, BGS marine geologist.

The submersible DSV Limiting Factor played a crucial role in mapping the deeps. (Image courtesy: Triton Submarines)

international | Issue 5 2021

32_fivedeepsexpedition.indd 32

13-07-21 15:21


sponsored article

Benefits of Site Monitoring with a UAV and 3Dsurvey Software Construction sites and, especially, demolition sites are often challenging environments for surveyors. Nevertheless, effective project management and financial control depend on accurate and timely information about the volumes of materials which have been placed, relocated and removed. Conventional surveys to obtain this information are slow, labour-intensive, expose surveyors to danger and can disrupt site operations. Photogrammetry using an unmanned aerial vehicle (UAV or ‘drone’) and the 3Dsurvey software suite offers an efficient, cheaper and safer alternative.

Around a decade ago, three surveyors in Slovenia were building UAVs and developing 3D software to use for their own projects. In 2015 they set up 3Dsurvey to supply their comprehensive software suite for mapping and image processing to other surveyors. As Tomaž Izak, CEO and surveyor, puts it: “I just wanted to spend more time with my wife and kids. Now, my software is helping surveyors all over the world. They love 3Dsurvey because it’s tailormade for them by people who have been in their shoes, in the field, in the mud and dirt, and who know exactly what a modern digital surveyor needs. Our software is also very affordable.” Case study: a demolition site The demolition of a large power station in Germany required effective work progress monitoring, identification of the materials on site, and determination of volumes. The site covered approximately 40 hectares and the buildings had a combined volume

of approximately one million cubic metres. Conventional surveying methods would have been extremely time-consuming, exposed the surveyors to a hazardous environment and would not have provided sufficiently detailed data. The surveying team decided to undertake regular photogrammetric surveys using a UAV (DJI P4RTK), a GNSS receiver (Emlid Reach RS2) and the 3Dsurvey software. The initial survey of the wider area (approx. 2,000 images) was followed by monthly surveys of the demolition area (approx. 1,000 images) to determine progress. For each survey, the positions of several ground control points (GCPs) were determined using the GNSS receiver. Using a UAV with RTK significantly reduced the number of GCPs required. For applications demanding less accuracy, surveys can even be done without any GCPs. Surveyors can use any convenient type of GCP, or dedicated 3Dsurvey GCP targets

which are automatically recognized by the software, to save even more time. The flight was prepared using 3Dsurvey Pilot, the free app for planning flights with DJI UAVs. If another make of UAV had been used, the flight could have been planned using its own flight planning software. Image processing This project used only UAV photographs, but for other applications these can be combined with images from ground-based cameras, Lidar and sonar. After the flight, the photographs were imported into the 3Dsurvey software and linked to the GCPs using the Orientate function. Next, the software generated the point cloud, full 3D mesh, digital surface model (DSM) and true orthophoto. The resolution of the images was high enough for effective identification of the materials to be removed from site.

Figure 1: Camera positions and ground control points (labelled ‘PP’).

I ssue 5 2 0 2 1 |

33-34-35_3dsurvey(sponsoredarticle).indd 33

international | 33

13-07-21 15:39


X-ray function looks through roofs 3Dsurvey has a unique feature: the X-ray function. This uses data from a number of photographs taken at different angles to mark wall positions on an orthophotograph, irrespective of the roof overhang. In this way, the volume of the buildings can be determined accurately and drawn with the built-in CAD function. This avoids the need to survey the positions of building corners using conventional methods. The X-ray function can save a lot of time and effort, especially in complex and challenging settings such as this demolition site.

Figure 2: 3D mesh view.

Figure 3: Orthophotograph with CAD drawing overlaid.

Measurement and analysis Once the mesh had been created, features such as buildings and heaps of material could be defined and named, and their volume or area calculated. This made it particularly easy to report on the progress of the demolition and waste volumes. 3Dsurvey could also have generated contour maps and site profiles at user-specified intervals. The software has basic CAD functions to draw areas and volumes, which can be exported in DXF and other formats. Undertaking both photogrammetric processing and analysis and measurement within the same software package saved time and costs and reduced errors. Data presentation and export The information was presented to the client in a range of formats: a video file with a simulated flight around the site, 2D site plan, 3D model and numerical information to track progress. The 3Dsurvey package

34 |

exports data in a wide range of file types, such as PDF, DXF, JPEG and TIFF, KMZ for Google Earth, various mapping and GIS formats, and TXT. The client could open the original project file using the free 3Dsurvey Viewer, enabling them to choose from a range of views.

Other applications Historic buildings and city centres are documented for conservation and planning reasons. Landslides and other active geological features need to be monitored regularly, with great accuracy and without exposing surveyors to danger. The scene of road traffic accidents must be recorded in detail before the road can be opened to traffic again. This often leads to traffic delays when using conventional methods and important details may be overlooked due to time pressure. In all these cases, software such as 3Dsurvey can use input from a range of sources – such as UAV and conventional photographs, laser scans, etc. – to produce digital surface and terrain models, true orthophotographs and basic CAD drawings. These deliverables support a range of applications and can be processed with standard GIS and CAD software. Such photogrammetric surveys take much less time in the field than conventional surveys and offer the surveyor great flexibility back at the office. If the client requests additional data, beyond the original brief, then the surveyor can respond quickly, often without a further visit to the site.

Figure 4: Progress report based on 3Dsurvey data.

international | I ssue 5 2021

33-34-35_3dsurvey(sponsoredarticle).indd 34

13-07-21 15:39


sponsored article

Figure 5: X-ray view showing the wall positions.

The software has also been used to create 3D models of building interiors and process plants, based on photographs taken with a handheld camera. This makes it possible to acquire the data quickly and at low cost, with a minimum impact on site operations. The models can be marked up with the position of piping and other services to support maintenance planning over the lifetime of the structure.

volumes of material safely and efficiently, without a surveyor walking around the site. This makes them a perfect application for UAV photogrammetry. When surveying a quarry where materials are excavated from a flooded area, 3Dsurvey can combine bathymetric sonar data with UAV photographs. This results in a unified 3D model of the site, showing both above-ground and underwater features.

Open-cast mines, quarries and bulk ore terminals present dangerous environments where there is a need to measure large

Licensing and support The 3Dsurvey software has a relatively low price and is available under a perpetual

licence, monthly subscription, and hourly access through GeoCloud, to cater for the needs of both regular and occasional users and surveying businesses of any size. New users also receive one-to-one support online or by telephone, to help them optimize their projects. The software is supported by extensive tutorial videos and datasets, and dozens of case studies on the developer’s website as well as a recently created user forum. As the package was designed by surveyors for surveyors, the 3Dsurvey workflow feels very natural to most users. Conclusion On a demolition site, the combination of a UAV, GNSS receiver and 3Dsurvey software made it possible to complete the initial map, drawings and photographs of the site quickly and safely. This was followed by regular UAV flights to report on the progress of the project. The software provided a range of accurate and valuable project management information at relatively little effort and cost.

More information www.3dsurvey.si Figure 6: Indoor survey showing electrical conduits.

I ssue 5 2 0 2 1 |

33-34-35_3dsurvey(sponsoredarticle).indd 35

international | 35

13-07-21 15:39


Bringing a Canadian Fort to Life

The Use of Airborne Lidar to Visualize History in 3D Airborne Lidar and 3D modelling technologies have emerged as the newest – and among the most valuable – geospatial tools available to archaeologists in their efforts to gain insights into key historical sites. Being able to accurately visualize how a fort, battlefield or settlement appeared at critical times creates a narrative revealing the way important events played out. Just as importantly, 3D visualization enables the researchers to plan where to focus additional fieldwork, including excavation and geophysical surveys. One such historic site is Fort Anne in Nova Scotia, Canada, located among the oldest and arguably most intriguing European settlements in North America.

In 1605, two years before the English established Jamestown in present-day Virginia, French explorers set up a furtrading post in an area they named Acadia.

The settlement grew, and about a century later France began building a Vaubanstyle, or star-shaped, fort to protect the settlers.

Detail of Pierre-Paul de Labat’s ’Plan du Fort Royal à l’Acadie’ (1706), georeferenced and draped over the Lidar model. (Image courtesy: Archives nationales d’outre-mer).

36 |

international | Issue 5 2021

36-37-38_featurefowler.indd 36

13-07-21 15:22


By Jonathan Fowler and Kevin Corbley

feature

The structure, today called Fort Anne, endured deadly attacks from numerous enemies for several years before finally falling to Britain in 1710. Under British rule, the fort later played a pivotal role in a tragic event known as the Acadian Deportation in which many French settlers were forced from the area. Some eventually made their way to Louisiana where a mispronunciation of the name ‘Acadians’ led them to be known as ‘Cajuns’.

The growing role of geospatial in archaeology Considering its age, Fort Anne is relatively well preserved. Having been designated Canada’s first national historic site in 1921, it serves as a park today. As both a research and instructional project, the Anthropology Department at Saint Mary’s University (SMU) in Halifax decided to bring the fort and nearby town back to life using state-of-the-art visualization techniques. The application of GIS technology for mapping purposes in archaeology and anthropology has increased dramatically in the past decade, but the regular use of advanced remote sensing tools and visualization methodologies has been embraced at a much slower rate. The cost of many datasets and software packages is one hindrance to widespread adoption in academia. However, Saint Mary’s University is actively finding ways to put these vital tools in the hands of its scientists and students. This is crucial because archaeologists hired into privatesector employment are increasingly finding that familiarity with geospatial datasets and software is a job requirement.

Locating primary datasets For the Fort Anne project, the first step was to obtain airborne Lidar data for the area. In Nova Scotia, this task is easier than it sounds thanks to the province’s open data initiative, in which raw data is made freely available via the online Elevation Explorer portal. Open data policies across Canada are giving taxpayers in all walks of life access to numerous government-funded datasets, including Lidar, orthoimages, maps and aerial photos. With regards to airborne Lidar, most of Nova Scotia has been covered and is available. Datasets captured by REIGL VQ1560i and Q780 sensors at a pulse spacing of 0.4m were obtained by SMU researchers for the Fort Anne area. The Lidar data was loaded

Detail of John Hamilton’s ‘A General Plan of Annapolis Royal’ (1753), georeferenced and draped over the Lidar model. (Image courtesy: Library of Congress)

Hillshade model of 2019 Lidar data showing Fort Anne with vegetation and buildings removed.

into Surfer, a surface mapping package from Golden Software in Colorado. Typically relied on for 3D visualization in oil & gas exploration, mineral extraction and environmental consulting, this easy-to-learn product is becoming a favourite of archaeologists for 3D terrain mapping. Its affordability and accessibility have made it a primary geospatial teaching tool at SMU Anthropology. The Lidar point cloud was filtered in Surfer to create a bare Earth digital elevation model (DEM) of the surface by removing buildings and vegetation. Modern features such as these, though interesting in some applications, tend to obscure the archaeological landscape. Researchers used a simple function in the software to exaggerate the Z values in the DEM to enhance the relief and sharpen the fort’s ramparts and other earthworks that have

eroded over time. The other enhancement applied to the DEM was the Hillshade relief function, which allowed the scientists to change the direction and angle of illumination on the fort to give it the most striking appearance in the visualization.

Preparing antique maps as 3D overlays The next phases of the effort can be chalked up to astute research and luck. Fort Anne was so important to France and England in the 1700s that several maps of it were created. Sites of conflict often received more attention from cartographers than other places, and that was certainly the case for this site. Fort Anne and its associated town served variously as a French and British garrison and administrative centre. Military engineers stationed at the fort consequently made this one of the best mapped places in the colony

Issue 5 2 0 2 1 |

36-37-38_featurefowler.indd 37

international | 37

13-07-21 15:22


Google Earth image of Fort Anne and the town of Annapolis Royal, Nova Scotia, taken on 11 July 2018.

– a boon to modern archaeologists who are intent on plotting lost dwellings, gardens, orchards, wharves, mills, churches and cemeteries. Remarkably, a digitized version of a stillexisting 1706 manuscript map was obtained from the French National Archives. As if fate hadn’t been tempted enough, a British map dating from 1753 was located in the U.S. Library of Congress. Both had already been digitized and were available online. Before being merged with the DEM, however, the maps had to be georeferenced. This process was undertaken in another software package using a series of fixed control points the SMU scientists obtained from a 1:10,000-scale basemap – also obtained for free on the provincial data portal. Control points were selected using features in the landscape that were mapped in historic times and had not moved or been erased since. The fort’s bastions provided convenient control points, as did intersections of streets in the neighbouring town of Annapolis Royal.

Revealing an 18th-century star fort Once georeferenced, the old maps were exported as geotiffs and dropped back into Surfer where they were overlaid on the 3D Lidar surface, a simple process that only required the DEM and maps to be in the same projection. These steps could have been performed in a GIS package, but the procedure would have been more complicated. The results were two realistic

38 |

3D maps of Fort Anne, one from 1706 under French rule and other from 1753 under British command. However, the creation of the 3D visualization was really only the beginning of the archaeologist’s work. The next important step was to interpret it. The ability to collate historical mapping with highly resolved elevation data in a vivid visualization is a great asset for archaeologists. It helps to contextualize past engineering decisions by better revealing the dialogue between architecture and environment.

Lidar and 3D visualization process at other important Canadian historical sites.

Further reading www.pc.gc.ca/en/lhn-nhs/ns/fortanne/culture/ histoire-history www.GoldenSoftware.com www.smu.ca/academics/departments/anthropologyfowler.html https://www.facebook.com/archaeologyacadie

About the authors

3D visualization can also reveal subtle signs of past human handiwork in the terrain, like a cartographer’s line correlating to a silted-up ditch, or a flat patch of ground where a house once stood. In today’s jargon, this visualization is revealing patterns of life in Fort Anne and nearby Annapolis Royal that comprise an evolution from fur-trading activities to military outpost to modern historic park.

Jonathan Fowler teaches in the Anthropology Department at Saint Mary’s University in Halifax, Canada, and has operated Northeast Archaeological Research since 1998. A two-time Commonwealth Scholar, Jonathan holds an MA in Landscape Archaeology from the University of Sheffield and a DPhil in Archaeology from the University of Oxford, both in the UK.

What’s next?

Kevin Corbley is a business development consultant at Corbley Communications based in Colorado, USA, who has served the worldwide geospatial industry for 28 years. He has provided consulting services to notable start-up companies in the Earth observation sector, including EOSAT, Space Imaging, Digital Globe, GeoEye and Radarsat. Kevin holds a BSc in Geology with emphasis on satellite remote sensing from the University of Notre Dame in South Bend, Indiana, USA.

At Fort Anne, the visualization not only serves as an aesthetic recreation of history, but scientists are also relying on it to decide where to focus future field activities which will include traditional excavation with spades and trowels. But in addition, ground-penetrating radar and electromagnetic induction devices may be brought to the site in an attempt to see what is still hidden beneath the Nova Scotia soil. Furthermore, the Saint Mary’s team has already begun recreating this

international | Issue 5 2021

36-37-38_featurefowler.indd 38

13-07-21 15:22


organizations

A Different FIG General Assembly From 20-25 June 2021, more than 200 official delegates and others with an interest in FIG met for the FIG General Assembly virtually, as travel activities are still quite limited. This challenged the FIG Council to be creative and to organize a different type of assembly. The aim was to make it inspiring, informative and also lively in order to stimulate the attendees to participate in a different way. These changes were received very well by the attendees who complimented and appreciated the new approach. This positive feedback and the wellreceived changes will clearly be incorporated into the future planning of FIG General Assemblies, whether online or in person. Online voting was introduced which turned out to work very well. There were no difficulties in accessing and using the system, which is a good takeaway for future years. The roll call was replaced by a pre-registration of official delegates. This meant that a total of 73 member associations were included in the roll call, representing 89 votes (larger associations have 2/3 votes). All sessions were open to all with an interest in FIG. Recordings are still available for those who are interested.

This view from the FIG e-Working Week online platform shows FIG President Rudolf Staiger and FIG Director Louise Friis-Hansen in the studio in the Netherlands. The four vice presidents visible on the screens in the background are Diane Dumashie (UK), Jixian Zhang (China), Mikael Lilje (Sweden) and Orhan Ercan (Turkey). Rudolf Staiger thanked Orhan Ercan for his engagement in the council over the past four years.

(Sweden) and Kwame Tenadu (Ghana) and ten new commission chairs were also elected for the term 2023-2026.

The most fundamental change was the format of the general assembly. Rather than focusing on formal reports, these were already submitted in the agenda in both written and video formats. This enabled sessions with a specific focus and more interaction and dialogue, which were broadcast from a studio in the Netherlands.

• F IG Governance. This session presented the results of the Task Force on Governance, the FIG Council’s response to the recommendations, and then three breakout discussions: the FIG brand, the value of FIG membership, and the transitioning and integration of young surveyors into FIG.

Each of the four sessions had a different topic: • Presidents Report and agenda items. This session included the Presidents Report, financial report and general FIG matters. Although this was based on the traditional approach, it was presented in a lively yet informative way. • Get to know your candidates. This session introduced the candidates for the elections. All candidates attended and were questioned live on screen with the aim of giving the audience an impression of them. The new vice-presidents are Mikael Lilje

• T he work of FIG. This session showcased some of the recent projects and activities on a variety of topics. It also showed the possibilities for volunteers to work at an international level on topics they are passionate about. The topics included: LADM, two new publications, FIG Cooperation with UN-Habitat/GLTN incl. the two latest publications, History of Surveying – seven books covering three millennia of measuring the Earth, the Young Surveyors Volunteer Community Surveyor Programme (VCSP), and 20 years of the FIG Foundation.

Future FIG conferences Due to the current travel situations, the FIG Council has decided to make some changes to the locations of future FIG conferences. This has resulted in the following schedule of FIG events for the coming years: • FIG Congress 2022: Warsaw, Poland • FIG Working Week 2023: Orlando, Florida, USA • FIG Working Week 2024: Accra, Ghana • FIG Working Week 2025: Brisbane, Australia • F IG Congress 2026: Cape Town, South Africa Louise Friis-Hansen, FIG director

More information https://www.fig.net/news/news_2021/06_ GA-report.asp

I ssue 5 2 0 2 1 |

39_fig.indd 39

international | 39

13-07-21 15:22


Better Data Accuracy Than Ever Before

Advanced Navigation: Enabling UAV-Lidar to Fly Higher Innovations in Lidar technology continue to change the way we see our world – literally. There’s no denying that the Lidar sector is growing at an exponential rate. Research by Grand View Research indicates that the Lidar market overall will be valued at USD3.7 billion by 2027.

Beyond its applications for autonomous vehicles, Lidar technology is already yielding positive results in the agriculture, archeology and mining sectors. The feeling within the industry is palpable; this is just the beginning. Research institutions and developers around the world continue to engineer the potential of Lidar with exciting progress. One such developer is Nextcore, an Australian-based company who specializes in making Lidar systems mounted on unmanned aerial vehicles (UAVs or ‘drones’). Established in 2012, Nextcore’s solutions have been used in the mining industry by surveyors and environmental specialists all over the world. Nextcore was ready to push the boundaries of UAV-Lidar The team at Nextcore, a company driven by innovation, found themselves asking a simple question: How can we fly UAV-mounted Lidar at greater heights, whilst gaining

Nextcore’s RN100 ready for launch.

40 |

more accurate data than ever before? At first glance it may sound like a lofty ambition. After all, while the capabilities of Lidar are more promising than ever, there

grows, the capabilities of the technology need to be able to keep up with the demand.

is a recognized risk to the quality of data collected when UAV-mounted Lidar is flown at higher altitudes above ground level (AGL).

team, it’s their passion to continually improve the technology of UAV-mounted Lidar in order to make cost-effective, reliable equipment that is easy to use. This led to the RN80 project, a UAV-mounted Lidar payload that could be flown higher in the air and still deliver a survey-grade dataset.

Lidar technologies have expanded rapidly in the last 60 years, with UAV-mounted Lidar making up a large portion of the rapidly growing market. From mapping more complex urban environments, to monitoring air quality, to studying subsurface properties of the ocean, UAV-mounted Lidar is set to deliver substantial dividends for both researchers and businesses. The potential that can be achieved with UAV-mounted Lidar is great, with the technology proving to be safer, more efficient and more accurate for surveying particularly challenging environments. However, as the scope of applications for UAV-mounted Lidar

If there’s one thing that defines the Nextcore

The challenge: UAV-mounted Lidar to fly 80 metres AGL Nextcore’s RN50 UAV-mounted Lidar could previously only fly at 50m AGL, which ran the risk of colliding with vegetation. To avoid this, the team set the goal of increasing the altitude to 80m above the ground. Operation at this altitude not only reduces the risk of collisions with trees, but also enables surveyors to cover larger areas, thus greatly improving the solution’s efficiency. However, this ambition came with increasing risk. “The problem with flying a UAV-Lidar payload higher off the ground is that the higher you fly, the more inaccuracies you build into the Lidar dataset,” says Ashley Cox, COO and co-founder of Nextcore. “The challenge was finding hardware we could put into the system that would allow us to achieve a survey-grade outcome even though we were flying our drones higher.” Tom Simmons, technical officer at Nextcore, adds that there is an added benefit of safety that comes with flying UAV-mounted Lidar higher: “We’ve got many clients navigating very mountainous terrain in Japan and Malaysia, and they need the ability to fly higher with their drone,” he

international | Issue 5 2021

40-41_artikeladvanced(sponsored).indd 40

13-07-21 15:41


sponsored article says. “You’re really relying on your inertial navigation system (INS) accuracy at that point, and any inaccuracy that you’ve got in will be reflected in your Lidar,” he continues. “So any inaccuracies from the INS will be accentuated by flying higher, leading to a decrease in accuracy in your point cloud generation and it won’t be usable data for surveying metrics.” Keeping this in mind, Nextcore needed a top-class GNSS/INS solution that performed reliably in any conditions whilst remaining accurate to the centimetre. The solution: Certus Evo MEMS GNSS/INS After reviewing the different inertial navigation systems available on the market, the Nextcore team selected Advanced Navigation’s Certus Evo to be used in the RN80 payload, for the following reasons: 1. It was a highly accurate MEMS GNSS/INS, reducing any angular errors from flying higher 2. It was easy to integrate into Nextcore’s existing systems 3. It was cost effective, allowing Nextcore to pass the savings onto its customers. The Certus Evo provides accurate position, velocity, acceleration and orientation under the most demanding conditions. It combines ultra-high-accuracy temperature-calibrated MEMS accelerometers, gyroscopes, magnetometers and a pressure sensor with a dual-antenna RTK GNSS receiver. These are coupled with Advanced Navigation’s sophisticated fusion algorithm to deliver accurate navigation and orientation. The Nextcore team had used Advanced Navigation’s Spatial Dual previously for their RN50 project, so they were naturally intrigued by the potential of the Certus Evo when it was released. Tom reflects that the Certus Evo’s specifications made it able to meet their ambitious 80m AGL flight height. “After doing some test flights, it met all of our requirements for the RN80 project,” he says. “This allowed us to leverage off the Spatial Dual integration and apply the Certus Evo as a drop-in replacement for that system. It really cuts down on development time there. It’s also a very cost-effective sensor and it’s very competitively priced in the market, especially for an Australian-made product.” The outcome: soaring above expectations Upon completing the project, the Nextcore team were pleasantly surprised to find that the

The RN100 flying at 100 metres.

Advanced Navigation’s Certus Evo used in the RN100.

RN80 surpassed their expectations. “Based on our calculations, we expected we’d be able to fly 80 metres above ground level,” says Ashley. But in fact, the Certus Evo performed so well it enabled Nexctore to produce a UAV-mounted Lidar that operates at 100 metres above the ground, exceeding their initial goal. This became the RN100 UAV-Lidar, which allows Nextcore’s customers to fly more safely, cover a larger area and still achieve a survey-grade outcome. As the potential for Lidar continues to develop, the outcome of the RN100 is now well suited to meet the demands of the growing market with a high-performance, accurate system. For Nextcore, this development has opened up an exciting window of opportunity. Ruminating on the RN100’s development, Tom attributes the project’s success not only to the highly accurate Certus Evo, but also to the ease of integrating it into their system. “Moving from Advanced Navigation’s Spatial

Dual to the Certus Evo was a very easy integration project for us,” he says. As many manufacturers know, using a shared interface allows the development team to quickly integrate systems. “We’re able to leverage all of our existing development work, and quickly and reliably integrate it into our next full unit for a very quick release to the product,” reflects Tom. “So integrating the Certus Evo from Advanced Navigation allowed us to offer a higher-end product to our clients at an affordable price tag. And this has really opened up new markets for us, internationally and domestically.” The future of UAV-Lidar The potential of flying UAV-mounted Lidar is an exciting one. Using the Certus Evo, Nextcore has shown it is possible to fly at 100m AGL and still deliver the highest grade of survey data. To learn more about the Certus Evo, visit Advanced Navigation’s website and get in touch with the company’s expert team.

Issue 5 2 0 2 1 |

40-41_artikeladvanced(sponsored).indd 41

international | 41

13-07-21 15:41


organizations

ISPRS Keynote Speaker Series

Science is the Way to a Better World COVID-19, and the world’s reaction to it, has significantly changed our lives over a considerable period of time. However, it has not stopped us working, although we have had to continue under different conditions. Last year, ISPRS adapted its planned in-person congress and organized it as a virtual 2020 Edition of the XXIV ISPRS Congress instead. Since the present restrictions still do not allow us to meet in person on a global scale this year, ISPRS recently organized another virtual congress: the 2021 Edition of the XXIV ISPRS Congress (5-9 July 2021). As with the events of other societies and institutions, most other ISPRS events went the same way. ISPRS has opened a new path to maintain contact with its members – and establish new contact with interested students, experts and practitioners – by sharing details of excellent achievements of ISPRS scientists from all our branches: photogrammetry, remote sensing and geospatial sciences. This virtual Keynote Speaker Series is a free-of-charge webinar series for all registered participants. The first keynote, in April, was on ‘Deep learning for global vegetation analysis’ given by Prof Jan-Dirk Wegner from the Institute of Geodesy and Photogrammetry, ETH Zurich, and vice-president of Technical Commission II (2021-2022). In May, this was followed by a keynote on ‘New network design processes to support 3D reality capture with terrestrial laser scanners’ presented by Prof Derek Lichti from the University of Calgary’s Department of Geomatics Engineering and long-term editor-in-chief of the ISPRS Journal of Photogrammetry and Remote Sensing. In June, Prof Monika Sester, executive director of the Institute of Cartography and Geoinformatics at Leibnitz University,

42 |

Hanover, spoke on ‘Capture and Interpretation of Mobility Data’. Please see the announcements on the ISPRS website to register for upcoming keynotes. The next one – on ‘Human cognition and visuo-spatial information: Experiments in visualization and virtual reality’ – will be given by Prof Arzu Cöltekin from the University of Applied Sciences and Arts Northwestern Switzerland’s Institute for Interactive Technologies on 30 September at 14:00h CEST. All speeches will be available in the ISPRS Media Library where you can already find streamed sessions of the 2020 Edition of the ISPRS XXIV Congress. This library is currently being enhanced with the streamed sessions of the 2021 Edition of the XXIV Congress.

ISPRS covers disciplines which collect data about the Earth and its objects as the basis for modelling and visualization, not only to document them but also to analyse their development and create models of their future behaviour in order to prevent hazards, risks and disasters. Individual parts of our sciences represent individual pieces of the mosaic of geospatial knowledge. The speeches in the Keynote Speaker Series are some of those mosaic stones. Lena Halounová

More information www.isprs.org www.isprs2020-nice.com

international | Issue 5 2021

42_isprs.indd 42

13-07-21 15:22


__FOIF_GIM_5-2021.indd 6

01-07-21 14:05


_GIM_ComNavTech_GIM_5-2021.indd 6

13-07-21 08:08


Turn static files into dynamic content formats.

Create a flipbook
Issuu converts static files into: digital portfolios, online yearbooks, online catalogs, digital photo albums and more. Sign up and create your flipbook.