Feature |
Bo Krogh (Denmark) and Peter Wadhams (UK)
Underneath the Top of the Iceberg
Measuring and 3D Mapping of Sea Ice in the Arctic Sea ice is one of the most important parameters when it comes to ice-albedo feedback; in other words, the fraction of incoming solar radiation that is reflected directly back into space. Because of the grave importance of the decrease in the amount of sea ice due to the climate crisis, gaining a full understanding of its complex structure is more important than ever. Both large and small Autonomous Underwater Vehicles (AUVs) have been used successfully to map the 3D structure of the underside of sea ice, but always in an experimental context. The challenge is to determine the best way forward to improve the quantity and quality of data gathering, and to turn the under-ice AUV into a reliable vehicle for routine use. This, as well as a wish to understand the full scope of sea-ice variability and not just the ‘top of the iceberg’, is what is driving us, Bo Krogh and Peter Wadhams, forward in our research and through trial and error. Our goal for this article is to share our experiences, difficulties and suggestions for future solutions.
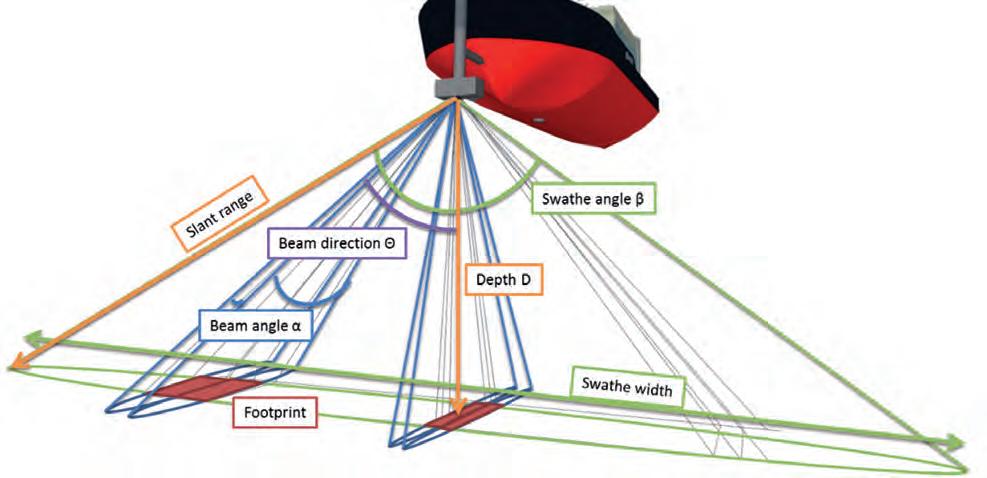
with a fan-shaped beam in which the backscattered signal strength from each pulse is plotted against time, being interpreted as slant range. This constructs a map as the vessel proceeds along its track, with strong reflectors showing echoes and shadow zones. The ultimate solution, however, is the multibeam sonar, which gives a proper 3D picture of a swath of ice underside. The first use of upward-looking multibeam sonar from a submarine was by Wadhams in 2007 from HMS Tireless (Wadhams, 2008) using a Kongsberg EM2000 system.
A new development within this field is the stand-alone Ultra-Short BaseLine (USBL) positioning buoy, a method of underwater acoustic positioning which enables the more rapid and secure insertion, tracking and retrieval of AUVs, as well as in-mission low bandwidth communication. It consists of a USBL transducer with an integrated Attitude and Heading Reference System (AHRS) – a compact unit that provides 3D positioning of the AUV with high accuracy. Above-water, it has a Global Navigation Satellite System receiver (GNSS), which also includes a compass and a long-range Wi-Fi data
Historic Overview Mapping sea ice has been done by drilling samples since Fridjof Nansen’s ‘Fram’ expedition in 1893-1896. However, such drilled samples give a very limited view of the variability of sea ice. They are statistically weak and exclude the option to consider the shape of the underside of the sea ice, the distribution of pressure ridge depths, or the difference between the roughness levels of ridged and level ice, or between first-year and multi-year ice. All of these aspects are important to understand the multifaceted concept of sea ice and its effect on the surrounding climate. Before the invention of the AUV, the ice mapping field was driven by military submarines and the upward sonar with which they were equipped, and this set the basis for our understanding of sea-ice thickness distributions. First came single-beam upward sonar, yielding a linear profile. Then came the side-scan sonar,
Gavia AUV study in Beaufort Sea (2007): sonar data gathered around the deployment hole, showing a refrozen lead, a young pressure ridge (eight days old), FY level ice, a rubble field, and an MY pressure ridge at the top of the image. The contrasting roughness and shapes of FY and MY ridging are clearly shown. Running depth of the vehicle was 20m. (Image Courtesy: Wadhams, 2012).
Hydro i n t e r n at i on a l
27-28-29_featurekrogh.indd 27
| s e p t e m b e r / o c t o b er 2 0 2 0 | 27
08-10-20 12:29


