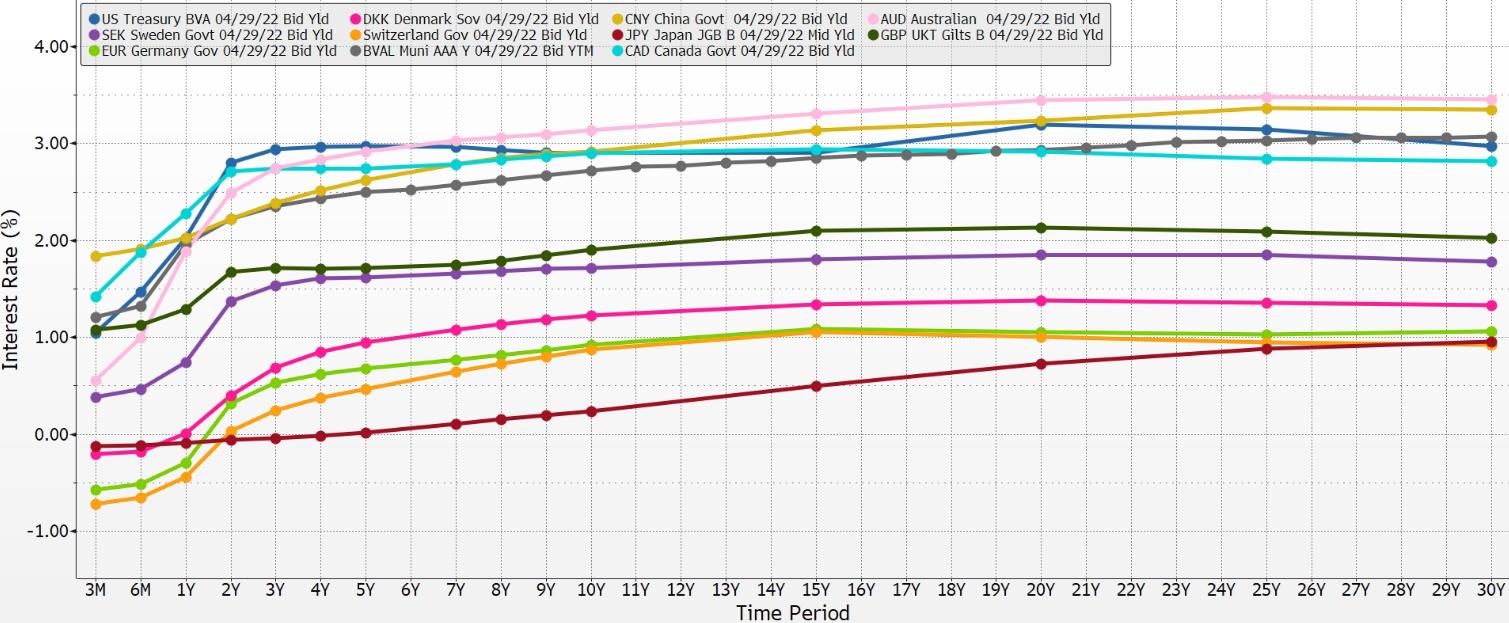
2 minute read
Draghi Gets Desperate “Whatever it takes”


This two-slide set is titled “Draghi Gets Desperate” for a reason. We are quoting his famous utterance which moved market prices worldwide at the time. Mario Draghi was the head of the European Central Bank when he offered this comment. The movement didn’t last long, and market forces quickly resumed the global adjustment processes using the mechanism we have described in this pamphlet.
Advertisement
Note how four of the shorter interest rates are bunched around zero. In the case of the euro-denominated benchmark German government notes, the interest rates out to three year’s maturity are below zero on this date.
Also note how all the longer-term interest rates are below 4%. Excluding China’s, all of the longer-term rates shown are at 3% or lower. Comparing the package of data on the Draghi series with the Sweden series, we can easily see how dramatically lower all interest rates have become and how the term structures have changed over the three years. The development of alignment is visible, as is the parallelism of the term structures’ slopes.
Please note that the upward slopes of all the term structures on both dates are still intact, with one exception: Switzerland’s. The term structures are all flatter except for Switzerland’s.
Switzerland was now reacting to inflows of money into the Swiss franc and was changing its monetary policy by forcing negative interest rates lower and lower. Switzerland was trying to avoid floating the currency while the euro was changing price due to the ECB’s negative interest rate policy. Note how the Swiss rate is negative out to five years in the term structure. This policy created the remarkably inconsistent spread comparison that we see in the graphic. Market agents could and did seize this opportunity with a “one-way” trading bet that Switzerland would have to change policy. As we will see, they did.
Day After Brexit Vote (06/24/2016)
The history-making outcome of the Brexit referendum in the United Kingdom shocked the world. Markets reacted violently to Britain’s withdrawal from the European Union. Notice that the yield curve parallel structures hold when we examine these curves using the method of two spreads.
Further notice how Switzerland is back in alignment as market-based forces force a change in the Swiss central bank’s policy. Four currencies have short-term policy rates below zero. The 30-year Swiss government bond is now at a zero interest rate. Even China’s longest-term bond is now below 4%.
Brexit shocked the markets, and market agents were quick to seize this trading opportunity. Thus alignment was restored very quickly back into the form we have described. The two-spread comparison shows how tightly the intermediate spread is bunched. The longer spread is continuing to tighten into a bunch as market forces pressure these yield curves into parallel alignment.
Day After Brexit Vote (06/24/2016)