1 minute read
Kentucky Loss Ratios
1-Year and 5-Year Loss Ratios by Line of Business
Source: © A.M. Best Company — Used by Permission. (International not shown as less than five years is available.)
Advertisement
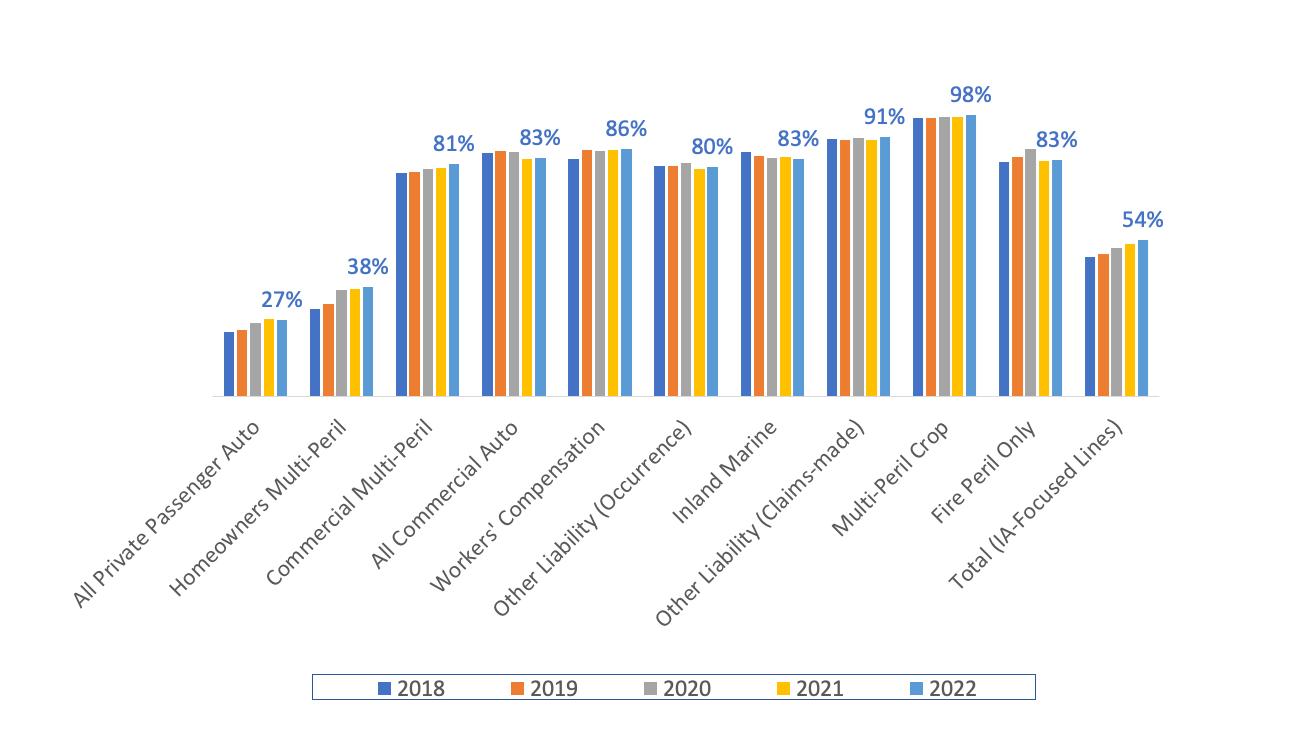
The above bar chart shows loss ratios for the 26 P&C lines of business mainly focused on by independent agents. These lines of business were indicated with an asterisk on Page 3 of this Summary. The 1-year loss ratio is for 2022. The 5-year is the average loss ratio for 2018 to 2022.
Loss ratios are calculated as “adjusted calendar year loss ratios” as shown in the formula below the loss ratio bar chart. For each line of business, the losses used in the ratio of losses to earned premiums equals the paid losses that year, plus any estimates of future losses that will be paid from claims that year (new reserves), plus any changes in reserves from previous years made that year (prior reserves). The “adjusted” part is if dividends are paid out under a line of business, then the loss ratio is adjusted for that cost. When dividends paid out is a minor factor, the adjusted loss ratio and the unadjusted loss ratio are nearly the same. Where dividends are a factor, it is important to include them in the calculation whenever loss ratios of different lines of business are compared.


