1 minute read
Average Commission Comparisons
The first table below gives comparative data to provide perspective on Kentucky’s 1-year commission rates. Provided is the overall average commission for all lines of business in Kentucky, compared with the United States. For additional perspective, the state with the highest, and the lowest 1-year commission rate is shown.
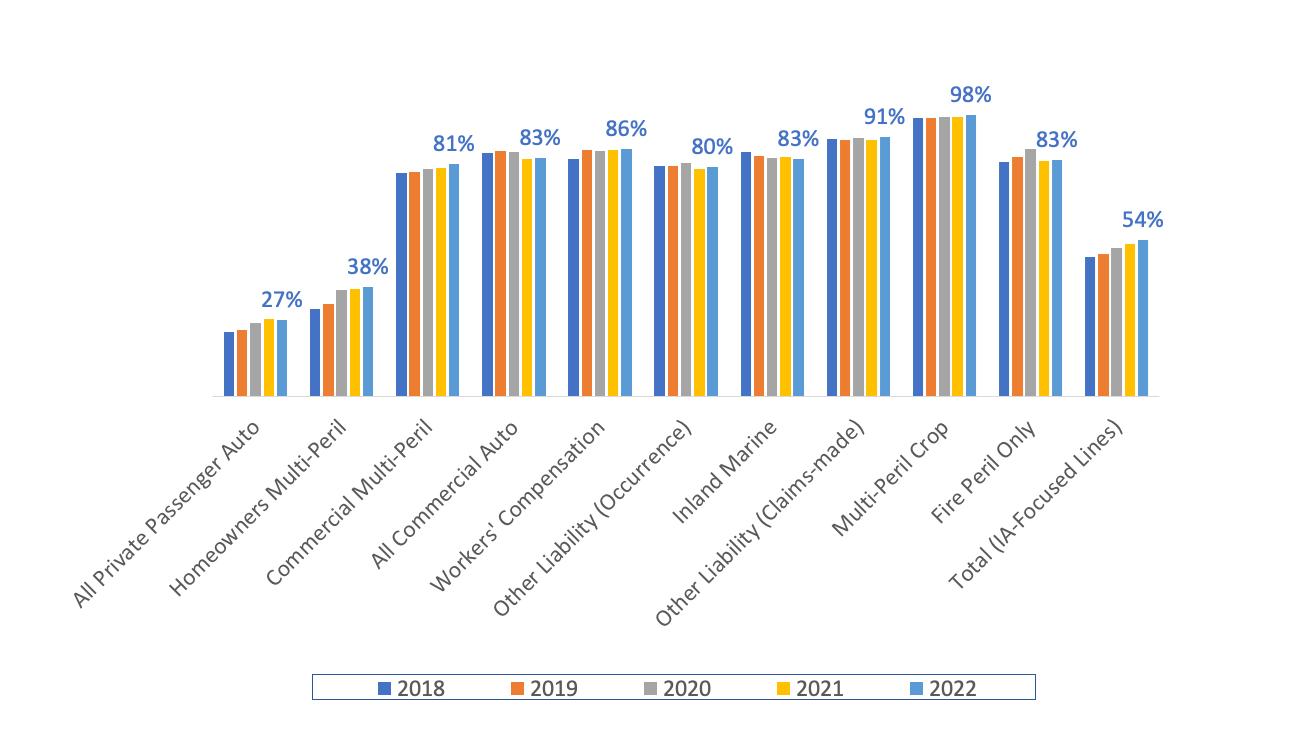
The second table gives 1-year commission data for the 26 P&C lines of business focused on by independent agents in Kentucky, as compared to the United States.
Advertisement
Source: © A.M. Best Company — Used by Permission.
Surplus Lines: Top 10 Lines of Business Total Premiums & Percentages of all Premiums

Source: © A.M. Best Company — Used by Permission
Above is information on surplus lines in Kentucky. The pie chart shows the Top 10 lines of business by percentage of all surplus lines premiums in Kentucky for 2022.
Next is the total surplus lines premiums in Kentucky for 2018 to 2022, with the corresponding percentage provided of those surplus lines premiums to all P&C premiums in Kentucky.
Readers should note the above data does not include alien insurers (insurers not domiciled in one of the 51 states). If alien premiums were included, it would increase the amount of surplus lines premiums by about 1 percentage point. An example of an alien surplus lines insurer is Lloyds of London. Alien insurer data is not included, as it is not tracked as consistently across states nor in the same time-frame.


